UNITED STATES
SECURITIES AND EXCHANGE COMMISSION
Washington, D.C. 20549
FORM N-CSR
CERTIFIED SHAREHOLDER REPORT
OF
REGISTERED MANAGEMENT INVESTMENT COMPANIES
Investment Company Act file number: 811-3916
Name of Registrant: Vanguard Specialized Funds
Address of Registrant:
P.O. Box 2600
Valley Forge, PA 19482
Name and address of agent for service:
Heidi Stam, Esquire
P.O. Box 876
Valley Forge, PA 19482
Registrant’s telephone number, including area code: (610) 669-1000
Date of fiscal year end: January 31
Date of reporting period: February 1, 2010 – January 31, 2011
Item 1: Reports to Shareholders
 |
|
| Vanguard Energy Fund |
| Annual Report |
|
| January 31, 2011 |
 |
> Helped by rising energy prices, Vanguard Energy Fund returned about 27% for the fiscal year ended January 31, 2011.
> The Energy Fund’s return slightly lagged that of its benchmark index but was ahead of the average return of peer-group funds that invest in energy and other natural resources.
> Oil and gas equipment and services providers posted exceptionally strong results, while giant integrated oil and gas companies were responsible for nearly half of the fund’s total return.
| |
| Contents | |
| Your Fund’s Total Returns. | 1 |
| Chairman’s Letter. | 2 |
| Advisors’ Report. | 7 |
| Fund Profile. | 10 |
| Performance Summary. | 12 |
| Financial Statements. | 14 |
| Your Fund’s After-Tax Returns. | 28 |
| About Your Fund’s Expenses. | 29 |
| Glossary. | 31 |
Please note: The opinions expressed in this report are just that—informed opinions. They should not be considered promises or advice. Also, please keep in mind that the information and opinions cover the period through the date on the front of this report. Of course, the risks of investing in your fund are spelled out in the prospectus.
See the Glossary for definitions of investment terms used in this report.
Cover photograph: Jean Maher.
Your Fund’s Total Returns
Fiscal Year Ended January 31, 2011
| |
| | Total |
| | Returns |
| Vanguard Energy Fund | |
| Investor Shares | 27.17% |
| Admiral™ Shares | 27.24 |
| Spliced Energy Index | 28.11 |
| Global Natural Resources Funds Average | 23.33 |
Spliced Energy Index: S&P 500 Index through November 30, 2000; S&P Energy Sector Index through May 31, 2010; MSCI All Country World Energy Index thereafter.
Global Natural Resources Funds Average: Derived from data provided by Lipper Inc.
Admiral Shares carry lower expenses and are available to investors who meet certain account-balance requirements.
Your Fund’s Performance at a Glance
January 31, 2010 , Through January 31, 2011
| | | | |
| | | | Distributions Per Share |
| | Starting | Ending | Income | Capital |
| | Share Price | Share Price | Dividends | Gains |
| Vanguard Energy Fund | | | | |
| Investor Shares | $57.17 | $69.20 | $0.977 | $2.149 |
| Admiral Shares | 107.34 | 129.93 | 1.899 | 4.035 |
1

Chairman’s Letter
Dear Shareholder,
Despite the huge oil spill involving British oil giant BP, energy was one of the stock market’s better-performing sectors for the fiscal year ended January 31, 2011. Vanguard Energy Fund returned about 27% for the period, trailing its benchmark index but ahead of its broader natural resources peer group.
The oil spill did hinder performance, especially during the fiscal year’s first half, but a rally in oil prices led to solid gains over the final months. Stock selection among oil and gas equipment and services providers boosted the fund’s returns. However, selection among integrated oil and gas companies didn’t measure up as well against the spliced benchmark index. Benchmark comparisons may be distorted by the fund’s change from an all-U.S. to a more global benchmark on June 1.
If you invest in the Energy Fund through a taxable account, you may wish to review information about the fund’s after-tax performance provided later in this report.
Also, please note that on October 6 Vanguard broadened the availability of our lower-cost Admiral Shares. We reduced the Admiral minimums on most of our actively managed funds, including the Energy Fund, to $50,000 from $100,000, as part of our ongoing efforts to lower the cost of investing for our clients.
2
Stocks rallied as economy ground into gear
Global stock markets produced excellent returns in the year ended January 31, 2011, with much of the strength materializing in the second half of the year. Europe’s sovereign debt challenges and concerns that the economic recovery in the United States might not reach escape velocity seemed to recede from investors’ minds, displaced by strong corporate earnings and a powerful rebound in consumer spending and in the manufacturing sector.
The U.S. stock market returned about 24%. Small- and mid-capitalization stocks, often the first to respond to changes in the economic outlook, did even better. As a group, non-U.S. stock markets returned more than 18%. Emerging markets were the best performers. Despite high-profile dramas in Europe’s government bond markets, European stocks produced double-digit gains. Asia’s developed markets turned in mixed results on local exchanges, but the strength of the yen, the Australian dollar, and other regional currencies bolstered returns for U.S.-based investors.
A strong start, a faltering finish for bonds
In January 2010, the bond market’s near-term prospects looked dubious, in large part because yields hovered near generational lows. Over the following 12 months, however, yields dipped lower still. The taxable bond market returned about 5% for the year. As investors searched for yield, corporate bonds produced the best returns, with the riskiest credits leading the market.
Market Barometer
| | | |
| | | Average Annual Total Returns |
| | | Periods Ended January 31, 2011 |
| | One | Three | Five |
| | Year | Years | Years |
| Stocks | | | |
| Russell 1000 Index (Large-caps) | 23.33% | 0.45% | 2.51% |
| Russell 2000 Index (Small-caps) | 31.36 | 4.57 | 2.64 |
| Dow Jones U.S. Total Stock Market Index | 24.31 | 1.22 | 2.86 |
| MSCI All Country World Index ex USA (International) | 18.50 | -0.96 | 4.08 |
| |
| Bonds | | | |
| Barclays Capital U.S. Aggregate Bond Index (Broad | | | |
| taxable market) | 5.06% | 5.36% | 5.82% |
| Barclays Capital Municipal Bond Index (Broad | | | |
| tax-exempt market) | 1.10 | 3.39 | 3.88 |
| Citigroup Three-Month U.S. Treasury Bill Index | 0.14 | 0.59 | 2.23 |
| |
| CPI | | | |
| Consumer Price Index | 1.63% | 1.42% | 2.12% |
3
Toward the end of the fiscal year, an improving economic outlook nudged interest rates higher, putting pressure on bond prices. This dynamic was evident in the municipal bond market, where rising rates and a confluence of other factors weighed on prices. The expiration of the Build America Bonds program, for example, raised the prospect of a spike in new tax-exempt issuance, while the extension of federal tax rate cuts that were set to expire made munis’ tax exemption somewhat less attractive. For the full year, the muni market returned about 1%.
As it has since December 2008, the Federal Reserve held its target for short-term interest rates near 0%, keeping the returns available from money market instruments such as the 3-month Treasury bill in the same neighborhood.
Rising oil, commodity prices helped offset BP’s problems
Vanguard Energy Fund soared 20% over the final three months of the fiscal year, overcoming a rocky stretch related in large part to the BP oil disaster and the effect it had on the industry. The fund benefited from a rise in crude oil prices and from firming demand for oil and most other energy sources.
Oil and gas equipment and services providers were among the companies that received a lift from rising oil prices. Though drilling was curtailed in the Gulf of Mexico after the BP oil disaster, deepwater drilling continued unabated in other locations around the world. Standouts included Halliburton and Baker Hughes, both of which had larger weightings in the fund than in the index.
Expense Ratios
Your Fund Compared With Its Peer Group
| | | |
| | Investor | Admiral | Peer Group |
| | Shares | Shares | Average |
| Energy Fund | 0.38% | 0.31% | 1.50% |
The fund expense ratios shown are from the prospectus dated September 30, 2010, and represent estimated costs for the current fiscal year.
For the fiscal year ended January 31, 2011, the fund’s expense ratios were 0.34% for Investor Shares and 0.28% for Admiral Shares. The peer-group expense ratio is derived from data provided by Lipper Inc. and captures information through year-end 2010.
Peer group: Global Natural Resources Funds.
4
But oil wasn’t the only energy source driving returns. Favorable stock selection among other commodity-oriented companies also proved to be a tailwind for the fund. Increased demand for coal sparked coal behemoth Peabody Energy, while rising uranium prices helped Cameco Corporation, the huge uranium miner.
While commodity prices were generally higher, natural gas was an exception. The available supply of natural gas increased significantly as horizontal drilling and hydraulic fracturing (“fracking”) was used more to extract natural gas from shale formations. Demand hasn’t kept up with this increased supply. For example, EOG Resources, a horizontal driller that had a larger weighting in the fund than in the index, returned more than 18%—but was outpaced by some other companies in better-performing areas.
Of course, a review of the Energy Fund wouldn’t be complete without considering BP, which dominated the headlines over the past year. The stock remained one of the fund’s top ten holdings and ultimately shaved more than a percentage point from its return. Although BP returned about –14% for the fiscal year, it rebounded from more dramatic lows once the spill was contained.
The fund’s long-term record shines brightly against peers
The Energy Fund’s long-term numbers are impressive, whether measured against the fund’s comparative standards or against the
Total Returns
Ten Years Ended January 31, 2011
| |
| | Average |
| | Annual Return |
| Energy Fund Investor Shares | 15.39% |
| Spliced Energy Index | 10.44 |
| Global Natural Resources Funds Average | 12.72 |
Spliced Energy Index: S&P 500 Index through November 30, 2000; S&P Energy Sector Index through May 31, 2010; MSCI All Country World Energy Index thereafter.
Global Natural Resources Funds Average: Derived from data provided by Lipper Inc.
The figures shown represent past performance, which is not a guarantee of future results. (Current performance may be lower or higher than the performance data cited. For performance data current to the most recent month-end, visit our website at vanguard.com/performance.) Note, too, that both investment returns and principal value can fluctuate widely, so an investor’s shares, when sold, could be worth more or less than their original cost.
5
broad U.S. stock market. Over the last decade, the fund’s Investor Shares had an average annual return of 15.39%, handily surpassing both its benchmark index and its peer group. The broad U.S. stock market (as measured by the Dow Jones Total Stock Market Index), which encountered two difficult bear markets during this decade, posted an average annual return of 2.47% for the ten years.
Please be aware that a notable rise in energy prices over the decade powered the fund’s ascent. Such favorable conditions won’t always be present, but the fund’s advisors, Wellington Management Company, llp, and Vanguard Quantitative Equity Group, also deserve a nod for the fund’s performance. Both firms employ disciplined, value-conscious investment strategies, but in different ways. Wellington conducts rigorous bottom-up research to find stocks it deems undervalued, while the Quantitative Equity Group relies on a computer-based approach to evaluate and rank stocks. The fund’s low costs are also a valuable advantage, allowing investors to keep more of the returns.
For more details on the advisors’ strategies and the fund’s positioning during the year, see the Advisors’ Report that follows this letter.
Sector funds can round out a well-balanced portfolio
While energy stocks finished the fiscal year with healthy gains, the course they followed was bumpy at times. With any single sector or market niche, the chance for turbulence is high. In this case, the fallout from the BP oil spill spread throughout the sector and limited returns before more positive industry developments interceded.
There’s no crystal ball to reveal where the stock market and the energy sector are headed. That’s why Vanguard encourages investors to maintain a balanced allocation of assets among stock, bond, and money market funds, diversified within each of these asset classes. Such a portfolio should be consistent with your investment objectives, risk tolerance, and time horizon.
Vanguard Energy Fund, with its low-cost exposure to a major segment of the global economy, can serve as an important element in a diversified portfolio as you strive to meet your financial goals.
As always, thank you for entrusting your assets to Vanguard.
Sincerely,

F. William McNabb III
Chairman and Chief Executive Officer
February 9, 2011
6
Advisors’ Report
The Investor Shares of Vanguard Energy Fund returned 27.17% (Admiral Shares, 27.24%) for the fiscal year ended January 31, 2011. Your fund is managed by two advisors, a strategy that enhances the fund’s diversification by providing exposure to distinct, yet complementary, investment approaches. It’s not uncommon for different advisors to have different views about individual securities or the broader investment environment.
The advisors, the amount and percentage of fund assets each manages, and brief descriptions of their investment strategies are presented in the table below. The advisors have also provided a discussion of the investment environment that existed during the year and of how their portfolio positioning reflects this assessment. These reports were prepared on February 16, 2011.
Wellington Management Company, LLP
Portfolio Manager:
Karl E. Bandtel, Senior Vice President
Investment environment
Global equities continued their ascent, driven by investors’ enthusiasm for additional government debt purchases by the U.S. Federal Reserve, the extension of tax cuts in the United States, strong earnings growth, and generally improving economic data. In the energy sector, a
Vanguard Energy Fund Investment Advisors
| | | |
| | Fund Assets Managed | |
| Investment Advisor | % | $ Million | Investment Strategy |
| Wellington Management | 94 | 12,845 | Emphasizes long-term total-return opportunities from |
| Company, LLP | | | the various energy subsectors: international oils, |
| | | | foreign integrated oils and foreign producers, North |
| | | | American producers, oil services and equipment, |
| | | | transportation and distribution, and refining and |
| | | | marketing. |
| Vanguard Quantitative Equity | 3 | 370 | Employs a quantitative fundamental management |
| Group | | | approach, using models that assess valuation, market |
| | | | sentiment, earnings quality and growth, and |
| | | | management decisions of companies relative to their |
| | | | peers. |
| Cash Investments | 3 | 387 | These short-term reserves are invested by Vanguard in |
| | | | equity index products to simulate investments in stock. |
| | | | Each advisor may also maintain a modest cash |
| | | | position. |
7
substantial portion of the period was dominated by the Deepwater Horizon disaster in the Gulf of Mexico.
Crude oil prices remained range-bound for much of the fiscal year as strong demand from emerging markets was tempered by large stockpiles in the developed world. Near the end of the period, rebounding manufacturing demand chipped away at inventories; this, along with concerns about possible disruptions to supply amid uncertainty in Egypt and other areas of the Middle East, sent oil prices to two-year highs. West Texas Intermediate crude oil closed the fiscal year at $92 per barrel.
The natural gas markets were weak throughout the fiscal year, with prices holding at relatively low levels, mainly because of burgeoning North American shale production. Natural gas (Henry Hub) closed the period near $4.40 per million BTUs.
Our position in Chevron, a leading integrated oil and gas company, contributed to the portfolio’s performance during the period. Chevron is well-positioned relative to its peers, given its leverage to oil and its strong recent track record of production growth and upstream profitability. The recently announced acquisition of Atlas Energy gives the firm acreage in one of the best shale plays at a reasonable cost.
During the latter part of the period, higher oil prices and expanding offshore rig fleets led energy equipment and services holdings higher, some of which we trimmed. Baker Hughes, an oilfield services company, was among the top absolute contributors to our portfolio’s performance as earnings exceeded expectations on the back of revenue improvement, cost-cutting, and gains in market share.
Our position in BP, which skidded lower in the aftermath of April’s oil spill, was an absolute detractor during the period. We added to our position during the months following the spill as the market continued to punish the stock further. While the disaster has been costly for BP, it will, in our view, ultimately prove manageable for the company.
Even though our long-term outlook is positive, we would urge some degree of caution regarding the near-term direction of commodity prices.
We have replaced some of our energy equipment and services positions with holdings more closely tied to oil production, particularly those of the integrated oil companies. We initiated a new position in INPEX, a Japan-based company engaged in the exploration and development of natural resources. The firm has a solid production outlook and potential upside from a large, undeveloped offshore liquefied natural gas project near Western Australia.
The portfolio remains focused upstream and skewed in favor of low-cost producers with compelling valuations based on our
8
assessment of their respective long-term resource bases. We believe many of these companies have the ability to create value absent generally rising commodity prices.
Our investment process remains steady, with an emphasis on high-quality management and long-lived resources at reasonable valuations. Maintaining a large-cap, low-turnover bias, this global portfolio continues to be diversified across energy subsectors and to focus on big integrated oil companies.
Vanguard Quantitative Equity Group
Portfolio Manager:
James D. Troyer, CFA, Principal
In a year when volatility continued to contribute to market uncertainty, global energy stocks generally finished with a strong second half after underperforming the broad global market during the first six months. North American and Asian energy stocks led the pack, while emerging market firms started the year strong but then declined, and European stocks never fully recovered from the declines associated with the BP oil spill in April.
Despite the turbulence in the energy sector over the period, our model held up well. A key characteristic of our strategy is that we do not maintain a view on the overall market for energy shares. Nor do we attempt to make calls on relative country performance. Rather, our investment process seeks to identify stocks that we believe are undervalued or whose prices have responded favorably to recent earnings announcements, relative to their peers in the sector. Our risk-control process then helps us neutralize our exposure to market-capitalization, volatility, and industry risks relative to our spliced energy benchmark. In our view, such risk exposures are not justified by the rewards available.
For the period, our most successful holdings were spread throughout the globe—including ConocoPhillips (+55%), National-Oilwell (+82%), and Cimarex Energy (+112%) in the United States; Royal Dutch Shell (+38%) in Europe; and CNOOC Limited (+60%) in Asia. Equally important was our ability to limit our exposure to underperforming stocks such as Brazil’s Petroleo Brasileiro (–9%) and U.S.-based Patterson-UTI Energy (–17%).
In addition to the negative effect seen from holdings in BP, our portfolio’s results were dampened by overweight holdings in Encana and Trican Well Service, two Canadian energy stocks that under-performed the benchmark as a whole.
Looking forward, we believe our approach to constructing a portfolio with stocks that exhibit lower valuations than peers, with similar expected growth prospects, is an attractive strategy, one that the market will reward in the long term. We thank you for your investment and look forward to the upcoming year.
9
Energy Fund
Fund Profile
As of January 31, 2011
| | | |
| Share-Class Characteristics | | |
| | Investor | | Admiral |
| | Shares | | Shares |
| Ticker Symbol | VGENX | | VGELX |
| Expense Ratio1 | 0.38% | | 0.31% |
| 30-Day SEC Yield | 1.42% | | 1.48% |
| |
| Portfolio Characteristics | | |
| | | | DJ |
| | | MSCI | U.S. Total |
| | | ACWI | Market |
| | Fund | Energy | Index |
| Number of Stocks | 122 | 163 | 3,858 |
| Median Market Cap $48.6B | $78.5B | $30.9B |
| Price/Earnings Ratio | 14.3x | 16.2x | 17.7x |
| Price/Book Ratio | 2.0x | 2.0x | 2.3x |
| Return on Equity | 23.2% | 23.1% | 19.0% |
| Earnings Growth Rate | -2.5% | 4.1% | 6.0% |
| Dividend Yield | 1.6% | 2.2% | 1.7% |
| Foreign Holdings | 37.5% | 55.2% | 0.0% |
| Turnover Rate | 31% | — | — |
| Short-Term Reserves | 2.8% | — | — |
| | |
| Volatility Measures | | |
| | | DJ |
| | Spliced | U.S. Total |
| | Energy | Market |
| | Index | Index |
| R-Squared | 0.91 | 0.63 |
| Beta | 1.14 | 1.05 |
| These measures show the degree and timing of the fund’s fluctuations compared with the indexes over 36 months. |
| |
| |
| Ten Largest Holdings (% of total net assets) |
| |
| Exxon Mobil Corp. | Integrated Oil & | |
| | Gas | 7.8% |
| Occidental Petroleum | Integrated Oil & | |
| Corp. | Gas | 4.8 |
| Chevron Corp. | Integrated Oil & | |
| | Gas | 4.2 |
| EOG Resources Inc. | Oil & Gas | |
| | Exploration & | |
| | Production | 3.5 |
| Royal Dutch Shell plc | Integrated Oil & | |
| | Gas | 3.5 |
| BP plc | Integrated Oil & | |
| | Gas | 3.4 |
| Baker Hughes Inc. | Oil & Gas | |
| | Equipment & | |
| | Services | 2.9 |
| Total SA | Integrated Oil & | |
| | Gas | 2.8 |
| Schlumberger Ltd. | Oil & Gas | |
| | Equipment & | |
| | Services | 2.7 |
| Halliburton Co. | Oil & Gas | |
| | Equipment & | |
| | Services | 2.3 |
| Top Ten | | 37.9% |
| The holdings listed exclude any temporary cash investments and equity index products. |
1 The expense ratios shown are from the prospectus dated September 30, 2010, and represent estimated costs for the current fiscal year. For the fiscal year ended January 31, 2011, the expense ratios were 0.34% for Investor Shares and 0.28% for Admiral Shares.
10
Energy Fund
| | |
| Subindustry Diversification (% of equity exposure) | |
| | |
| | | MSCI |
| | | ACWI |
| | Fund | Energy |
| Coal & Consumable Fuels | 4.6% | 3.2% |
| Industrials | 0.3 | 0.0 |
| Integrated Oil & Gas | 51.8 | 59.1 |
| Materials | 1.1 | 0.0 |
| Oil & Gas Drilling | 1.8 | 2.2 |
| Oil & Gas Equipment & | | |
| Services | 10.8 | 10.1 |
| Oil & Gas Exploration & | | |
| Production | 25.0 | 19.0 |
| Oil & Gas Refining & | | |
| Marketing | 2.1 | 3.4 |
| Oil & Gas Storage & | | |
| Transportation | 0.4 | 3.0 |
| Utilities | 0.5 | 0.0 |
| Other | 1.6 | 0.0 |
| |
| Market Diversification (% of equity exposure) |
| |
| Europe | |
| United Kingdom | 10.5% |
| France | 2.9 |
| Italy | 1.6 |
| Norway | 1.4 |
| Spain | 1.2 |
| Other | 0.5 |
| Subtotal | 18.1% |
| Pacific | |
| Japan | 1.6% |
| Australia | 1.0 |
| Subtotal | 2.6% |
| Emerging Markets | |
| Russia | 2.6% |
| Brazil | 2.0 |
| China | 1.9 |
| Other | 0.8 |
| Subtotal | 7.3% |
| North America | |
| United States | 61.7% |
| Canada | 10.3 |
| Subtotal | 72.0% |
11
Energy Fund
Performance Summary
All of the returns in this report represent past performance, which is not a guarantee of future results that may be achieved by the fund. (Current performance may be lower or higher than the performance data cited. For performance data current to the most recent month-end, visit our website at vanguard.com/performance.) Note, too, that both investment returns and principal value can fluctuate widely, so an investor’s shares, when sold, could be worth more or less than their original cost. The returns shown do not reflect taxes that a shareholder would pay on fund distributions or on the sale of fund shares.
Cumulative Performance: January 31, 2001, Through January 31, 2011
Initial Investment of $25,000
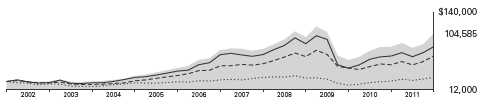
| | | | |
| | Average Annual Total Returns | |
| | Periods Ended January 31, 2011 | |
| | | | | Final Value |
| | One | Five | Ten | of a $25,000 |
| | Year | Years | Years | Investment |
| Energy Fund Investor Shares | 27.17% | 6.38% | 15.39% | $104,585 |
| Dow Jones U.S. Total Stock Market | | | | |
| Index | 24.31 | 2.86 | 2.47 | 31,898 |
| Spliced Energy Index | 28.11 | 5.86 | 10.44 | 67,505 |
| Global Natural Resources Funds | | | | |
| Average | 23.33 | 3.63 | 12.72 | 82,802 |
Spliced Energy Index: S&P 500 Index through November 30, 2000; S&P Energy Sector Index through May 31, 2010; MSCI All Country World Energy Index thereafter.
Global Natural Resources Funds Average: Derived from data provided by Lipper Inc.
Vanguard fund returns do not reflect the 1% fee on redemptions of shares held for less than one year.
See Financial Highlights for dividend and capital gains information.
12
Energy Fund
| | | | |
| | | Average Annual Total Returns | |
| | | Periods Ended January 31, 2011 | |
| | | | Since | Final Value |
| | One | Five | Inception | of a $50,000 |
| | Year | Years | (11/12/2001) | Investment |
| Energy Fund Admiral Shares | 27.24% | 6.45% | 17.01% | $212,764 |
| Dow Jones U.S. Total Stock Market | | | | |
| Index | 24.31 | 2.86 | 4.88 | 77,584 |
| Spliced Energy Index | 28.11 | 5.86 | 12.42 | 147,089 |
| "Since Inception" performance is calculated from the Admiral Shares’ inception date for both the fund and its comparative standards. |
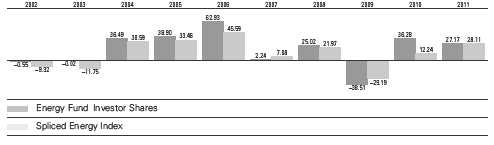
Fiscal-Year Total Returns (%): January 31, 2001, Through January 31, 2011
Average Annual Total Returns: Periods Ended December 31, 2010
This table presents average annual total returns through the latest calendar quarter—rather than through the end of the fiscal period. Securities and Exchange Commission rules require that we provide this information.
| | | | |
| | Inception | One | Five | Ten |
| | Date | Year | Years | Years |
| Investor Shares | 5/23/1984 | 13.43% | 8.01% | 14.17% |
| Admiral Shares | 11/12/2001 | 13.49 | 8.08 | 16.361 |
| 1 Return since inception. |
Vanguard fund returns do not reflect the 1% fee on redemptions of shares held for less than one year.
13
Energy Fund
Financial Statements
Statement of Net Assets
As of January 31, 2011
The fund reports a complete list of its holdings in regulatory filings four times in each fiscal year, at the quarter-ends. For the second and fourth fiscal quarters, the lists appear in the fund’s semiannual and annual reports to shareholders. For the first and third fiscal quarters, the fund files the lists with the Securities and Exchange Commission on Form N-Q. Shareholders can look up the fund’s Forms N-Q on the SEC’s website at sec.gov. Forms N-Q may also be reviewed and copied at the SEC’s Public Reference Room (see the back cover of this report for further information).
| | | |
| | | | Market |
| | | | Value |
| | | Shares | ($000) |
| Common Stocks (94.8%)1 | | |
| United States (57.3%) | | |
| Electric Utilities (0.4%) | | |
| | Exelon Corp. | 1,244,200 | 52,891 |
| |
| Energy Equipment & Services (10.8%) | | |
| | Baker Hughes Inc. | 5,840,650 | 400,143 |
| | Schlumberger Ltd. | 4,081,964 | 363,254 |
| | Halliburton Co. | 7,047,562 | 317,140 |
| * | Weatherford | | |
| | International Ltd. | 5,457,200 | 129,445 |
| | SEACOR Holdings Inc. | 923,908 | 97,648 |
| | National Oilwell Varco Inc. | 1,167,876 | 86,306 |
| | Noble Corp. | 1,696,825 | 64,903 |
| * | Transocean Ltd. | 43,208 | 3,454 |
| * | Nabors Industries Ltd. | 105,000 | 2,562 |
| * | Rowan Cos. Inc. | 66,900 | 2,293 |
| | | | 1,467,148 |
| Exchange-Traded Fund (0.5%) | |
| ^,2 | Vanguard Energy ETF | 663,000 | 70,729 |
| |
| Oil, Gas & Consumable Fuels (45.6%) | |
| | Coal & Consumable Fuels (3.8%) | |
| | Consol Energy Inc. | 6,158,500 | 306,077 |
| | Peabody Energy Corp. | 3,019,900 | 191,522 |
| * | Cloud Peak Energy Inc. | 685,400 | 15,607 |
| | Arch Coal Inc. | 72,800 | 2,493 |
| |
| | Integrated Oil & Gas (22.2%) | |
| | Exxon Mobil Corp. | 13,112,019 | 1,057,878 |
| | Occidental | | |
| | Petroleum Corp. | 6,693,601 | 647,137 |
| | Chevron Corp. | 6,084,535 | 577,605 |
| | ConocoPhillips | 4,283,309 | 306,085 |
| | Marathon Oil Corp. | 5,944,291 | 271,654 |
| | Hess Corp. | 1,800,889 | 151,491 |
| | Murphy Oil Corp. | 43,600 | 2,891 |
| | | |
| | | | Market |
| | | | Value |
| | | Shares | ($000) |
| | Oil & Gas Exploration & Production (18.2%) |
| | EOG Resources Inc. | 4,533,636 | 482,334 |
| | Devon Energy Corp. | 3,145,907 | 279,011 |
| 3 | Cabot Oil & Gas Corp. | 6,409,231 | 266,816 |
| | Noble Energy Inc. | 2,887,300 | 263,033 |
| | Anadarko Petroleum Corp. 2,507,530 | 193,280 |
| * | Denbury Resources Inc. | 8,691,044 | 176,863 |
| | EQT Corp. | 3,572,800 | 172,173 |
| | Chesapeake Energy Corp. | 4,277,237 | 126,307 |
| * | Ultra Petroleum Corp. | 2,646,036 | 126,295 |
| | Range Resources Corp. | 2,004,500 | 99,964 |
| * | Newfield Exploration Co. | 1,139,703 | 83,392 |
| | Apache Corp. | 620,800 | 74,099 |
| | QEP Resources Inc. | 1,650,918 | 67,093 |
| * | Southwestern Energy Co. | 1,618,700 | 63,939 |
| | Cimarex Energy Co. | 30,400 | 3,166 |
| |
| | Oil & Gas Refining & Marketing (1.1%) |
| | Valero Energy Corp. | 6,068,442 | 153,896 |
| |
| | Oil & Gas Storage & Transportation (0.3%) |
| | El Paso Corp. | 2,578,300 | 40,943 |
| | Spectra Energy Corp. | 2,100 | 55 |
| | | | 6,203,099 |
| Total United States | | 7,793,867 |
| International (37.5%) | | |
| Australia (1.0%) | | |
| | BHP Billiton Ltd. ADR | 1,514,200 | 134,809 |
| | Caltex Australia Ltd. | 136,558 | 1,837 |
| | Woodside Petroleum Ltd. | 22,817 | 952 |
| | | | 137,598 |
| Austria (0.5%) | | |
| | OMV AG | 1,455,123 | 64,492 |
| |
| Brazil (1.9%) | | |
| | Petroleo Brasileiro | | |
| | SA ADR | 6,863,355 | 252,091 |
14
Energy Fund
| | | |
| | | | Market |
| | | | Value |
| | | Shares | ($000) |
| | Petroleo Brasileiro | | |
| | SA Prior Pfd. | 314,504 | 5,111 |
| | Petroleo Brasileiro SA | 222,022 | 4,002 |
| | Petroleo Brasileiro | | |
| | SA ADR Type A | 41,320 | 1,374 |
| | | | 262,578 |
| Canada (10.0%) | | |
| | Suncor Energy Inc. | 7,428,712 | 308,366 |
| | Canadian Natural | | |
| | Resources Ltd. | | |
| | (New York Shares) | 6,891,018 | 306,788 |
| | Cenovus Energy Inc. | | |
| | (New York Shares) | 5,232,900 | 181,111 |
| | Husky Energy Inc. | 5,006,800 | 135,001 |
| | Encana Corp. | | |
| | (New York Shares) | 3,002,700 | 96,897 |
| | Cameco Corp. | 1,898,700 | 78,739 |
| | Imperial Oil Ltd. | 1,704,777 | 76,050 |
| * | Penn West | | |
| | Petroleum Ltd. | 2,455,421 | 67,500 |
| | Nexen Inc. | 2,206,300 | 55,488 |
| | Progress Energy | | |
| | Resources Corp. | 2,352,900 | 32,003 |
| * | MEG Energy Corp. | 287,117 | 12,777 |
| | Suncor Energy Inc. | 124,084 | 5,138 |
| | Canadian Natural | | |
| | Resources Ltd. | 77,178 | 3,441 |
| | TransCanada Corp. | 29,496 | 1,077 |
| ^ | Crescent Point Energy | | |
| | Corp. | 21,600 | 954 |
| | Cenovus Energy Inc. | 26,539 | 917 |
| | Encana Corp. | 20,539 | 662 |
| | Talisman Energy Inc. | 25,273 | 579 |
| | Enbridge Inc. | 9,000 | 522 |
| | | | 1,364,010 |
| China (1.9%) | | |
| | PetroChina Co. Ltd. ADR | 1,701,100 | 236,912 |
| | CNOOC Ltd. | 2,777,717 | 6,183 |
| | PetroChina Co. Ltd. | 3,630,000 | 5,059 |
| | China Petroleum | | |
| | & Chemical Corp. | 3,534,000 | 3,892 |
| | Yanzhou Coal | | |
| | Mining Co. Ltd. | 792,000 | 2,305 |
| | China Oilfield | | |
| | Services Ltd. | 1,056,000 | 2,036 |
| | | | 256,387 |
| France (2.9%) | | |
| | Total SA ADR | 6,324,500 | 371,691 |
| | Total SA | 264,373 | 15,472 |
| | | | 387,163 |
| Hungary (0.0%) | | |
| * | MOL Hungarian | | |
| | Oil and Gas plc | 20,710 | 2,331 |
| | | |
| | | | Market |
| | | | Value |
| | | Shares | ($000) |
| India (0.7%) | | |
| | Reliance Industries Ltd. | 4,662,008 | 94,215 |
| | Oil & Natural Gas | | |
| | Corp. Ltd. | 84,380 | 2,165 |
| | | | 96,380 |
| Indonesia (0.0%) | | |
| | Indo Tambangraya | | |
| | Megah PT | 106,000 | 543 |
| |
| Italy (1.6%) | | |
| | ENI SPA ADR | 4,326,350 | 205,502 |
| | ENI SPA | 366,464 | 8,675 |
| | Saipem SPA | 68,494 | 3,434 |
| | | | 217,611 |
| Japan (1.6%) | | |
| | Inpex Corp. | 31,770 | 207,179 |
| | JX Holdings Inc. | 517,500 | 3,546 |
| | Idemitsu Kosan Co. Ltd. | 20,200 | 2,121 |
| | Cosmo Oil Co. Ltd. | 600,000 | 1,934 |
| | | | 214,780 |
| Malaysia (0.0%) | | |
| | Petronas Dagangan Bhd. | 363,200 | 1,433 |
| |
| Netherlands (0.0%) | | |
| | SBM Offshore NV | 97,422 | 2,321 |
| | Fugro NV | 18,450 | 1,486 |
| | | | 3,807 |
| Norway (1.3%) | | |
| | Statoil ASA ADR | 7,137,800 | 174,305 |
| | Seadrill Ltd. | 85,508 | 2,810 |
| | Statoil ASA | 44,241 | 1,073 |
| | | | 178,188 |
| Poland (0.0%) | | |
| * | Polski Koncern | | |
| | Naftowy Orlen SA | 151,875 | 2,521 |
| * | Grupa Lotos SA | 86,249 | 1,238 |
| | | | 3,759 |
| Russia (2.5%) | | |
| | Gazprom OAO ADR | 9,193,301 | 244,196 |
| | Rosneft Oil Co. GDR | 10,521,436 | 90,286 |
| | Tatneft ADR | 76,488 | 2,721 |
| | Lukoil OAO ADR | 36,874 | 2,264 |
| | Surgutneftegas | | |
| | OJSC ADR | 126,700 | 1,407 |
| | Surgutneftegas | | |
| | OJSC Prior Pfd. | 1,654,136 | 955 |
| | Gazprom OAO | 124,674 | 824 |
| | AK Transneft | | |
| | OAO Prior Pfd. | 587 | 762 |
| | | | 343,415 |
| South Africa (0.0%) | | |
| | Sasol Ltd. | 97,623 | 4,711 |
15
Energy Fund
| | |
| | | Market |
| | | Value |
| | Shares | ($000) |
| South Korea (0.1%) | | |
| SK Innovation Co. Ltd. | 18,088 | 3,353 |
| GS Holdings | 35,358 | 2,640 |
| | | 5,993 |
| Spain (1.2%) | | |
| Repsol YPF SA ADR | 4,867,200 | 154,485 |
| Repsol YPF SA | 142,727 | 4,502 |
| | | 158,987 |
| Thailand (0.1%) | | |
| PTT PCL (Foreign) | 264,000 | 2,863 |
| PTT Exploration | | |
| & Production PCL | | |
| (Foreign) | 443,800 | 2,327 |
| Banpu PCL | 86,700 | 2,060 |
| | | 7,250 |
| Turkey (0.0%) | | |
| Tupras Turkiye Petrol | | |
| Rafinerileri AS | 81,875 | 2,122 |
| |
| United Kingdom (10.2%) | | |
| BP plc ADR | 9,470,200 | 449,551 |
| Royal Dutch | | |
| Shell plc ADR | 6,309,200 | 447,890 |
| BG Group plc | 12,109,248 | 272,570 |
| Ensco plc ADR | 2,965,606 | 161,151 |
| BP plc | 2,266,380 | 17,617 |
| Royal Dutch Shell plc | | |
| Class A | 325,010 | 11,475 |
| Royal Dutch Shell plc | | |
| Class B | 324,886 | 11,291 |
| * Hansen Transmissions | | |
| International NV | 6,645,381 | 5,957 |
| Royal Dutch Shell plc | | |
| Class A (Amsterdam | | |
| Shares) | 93,391 | 3,296 |
| Petrofac Ltd. | 98,374 | 2,471 |
| Tullow Oil plc | 11,947 | 254 |
| | | 1,383,523 |
| Total International | | 5,097,061 |
| Total Common Stocks | | |
| (Cost $7,409,945) | | 12,890,928 |
| Temporary Cash Investments (5.1%)1 | |
| Money Market Fund (2.1%) | | |
| 4,5 Vanguard Market | | |
| Liquidity Fund, | | |
| 0.207% | 293,662,458 | 293,662 |
| | | |
| | | Face | Market |
| | | Amount | Value |
| | | ($000) | ($000) |
| Repurchase Agreement (2.8%) | | |
| | Deutsche Bank | | |
| | Securities, Inc. | | |
| | 0.220%, 2/1/11 | | |
| | (Dated 1/31/11, | | |
| | Repurchase Value | | |
| | $377,002,000, | | |
| | collateralized by | | |
| | Government National | | |
| | Mortgage Assn. | | |
| | 3.500%–6.000%, | | |
| | 1/20/26–1/15/41) | 377,000 | 377,000 |
| |
| U.S. Government and Agency Obligations (0.2%) |
| 6,7 | Fannie Mae Discount | | |
| | Notes, 0.190%, 4/25/11 | 5,000 | 4,998 |
| 6,7 | Federal Home Loan Bank | | |
| | Discount Notes, | | |
| | 0.200%, 3/11/11 | 1,500 | 1,500 |
| 6,7 | Federal Home Loan Bank | | |
| | Discount Notes, | | |
| | 0.260%, 3/23/11 | 100 | 100 |
| 6,7 | Freddie Mac Discount | | |
| | Notes, 0.195%–0.240%, | | |
| | 3/14/11 | 3,200 | 3,199 |
| 6,7 | Freddie Mac Discount | | |
| | Notes, 0.270%, 6/7/11 | 2,000 | 1,998 |
| 6,7 | Freddie Mac Discount | | |
| | Notes, 0.200%, 6/13/11 | 2,000 | 1,998 |
| 6,7 | Freddie Mac Discount | | |
| | Notes, 0.230%, 6/20/11 | 1,500 | 1,499 |
| 6,7 | Freddie Mac Discount | | |
| | Notes, 0.280%, 6/21/11 | 7,000 | 6,993 |
| 6 | Freddie Mac Discount | | |
| | Notes, 0.250%, 6/22/11 | 400 | 400 |
| | | | 22,685 |
| Total Temporary Cash Investments | |
| (Cost $693,347) | | 693,347 |
| Total Investments (99.9%) | | |
| (Cost $8,103,292) | | 13,584,275 |
| Other Assets and Liabilities (0.1%) | |
| Other Assets | | 133,187 |
| Liabilities5 | | (115,068) |
| | | | 18,119 |
| Net Assets (100%) | | 13,602,394 |
16
Energy Fund
| |
| At January 31, 2011, net assets consisted of: |
| | Amount |
| | ($000) |
| Paid-in Capital | 8,038,538 |
| Overdistributed Net Investment Income | (16,406) |
| Accumulated Net Realized Gains | 94,133 |
| Unrealized Appreciation (Depreciation) | |
| Investment Securities | 5,480,983 |
| Futures Contracts | 5,117 |
| Foreign Currencies | 29 |
| Net Assets | 13,602,394 |
| |
| |
| Investor Shares—Net Assets | |
| Applicable to 97,279,179 outstanding | |
| $.001 par value shares of beneficial | |
| interest (unlimited authorization) | 6,731,378 |
| Net Asset Value Per Share— | |
| Investor Shares | $69.20 |
| |
| |
| Admiral Shares—Net Assets | |
| Applicable to 52,881,610 outstanding | |
| $.001 par value shares of beneficial | |
| interest (unlimited authorization) | 6,871,016 |
| Net Asset Value Per Share— | |
| Admiral Shares | $129.93 |
See Note A in Notes to Financial Statements.
* Non-income-producing security.
^ Part of security position is on loan to broker-dealers. The total value of securities on loan is $13,643,000.
1 The fund invests a portion of its cash reserves in equity markets through the use of index futures contracts. After giving effect to futures Investments, the fund’s effective common stock and temporary cash investment positions represent 97.0% and 2.9%, respectively, of net assets.
2 Considered an affiliated company of the fund as the issuer is another member of The Vanguard Group.
3 Considered an affiliated company of the fund as the fund owns more than 5% of the outstanding voting securities of such company.
4 Affiliated money market fund available only to Vanguard funds and certain trusts and accounts managed by Vanguard. Rate shown is the 7-day yield.
5 Includes $13,958,000 of collateral received for securities on loan.
6 The issuer operates under a congressional charter; its securities are not backed by the full faith and credit of the U.S. government.
7 Securities with a value of $20,285,000 have been segregated as initial margin for open futures contracts.
ADR—American Depositary Receipt.
GDR—Global Depositary Receipt.
See accompanying Notes, which are an integral part of the Financial Statements.
17
Energy Fund
Statement of Operations
| |
| | Year Ended |
| | January 31, 2011 |
| | ($000) |
| Investment Income | |
| Income | |
| Dividends1,2 | 227,878 |
| Interest2 | 922 |
| Security Lending | 6,397 |
| Total Income | 235,197 |
| Expenses | |
| Investment Advisory Fees—Note B | |
| Basic Fee | 16,115 |
| Performance Adjustment | 180 |
| The Vanguard Group—Note C | |
| Management and Administrative—Investor Shares | 10,584 |
| Management and Administrative—Admiral Shares | 5,346 |
| Marketing and Distribution—Investor Shares | 1,545 |
| Marketing and Distribution—Admiral Shares | 1,065 |
| Custodian Fees | 504 |
| Auditing Fees | 28 |
| Shareholders’ Reports—Investor Shares | 94 |
| Shareholders’ Reports—Admiral Shares | 21 |
| Trustees’ Fees and Expenses | 16 |
| Total Expenses | 35,498 |
| Expenses Paid Indirectly | (119) |
| Net Expenses | 35,379 |
| Net Investment Income | 199,818 |
| Realized Net Gain (Loss) | |
| Investment Securities Sold2 | 441,774 |
| Futures Contracts | 15,714 |
| Foreign Currencies | (320) |
| Realized Net Gain (Loss) | 457,168 |
| Change in Unrealized Appreciation (Depreciation) | |
| Investment Securities | 2,188,072 |
| Futures Contracts | 16,269 |
| Foreign Currencies | 11 |
| Change in Unrealized Appreciation (Depreciation) | 2,204,352 |
| Net Increase (Decrease) in Net Assets Resulting from Operations | 2,861,338 |
1 Dividends are net of foreign withholding taxes of $14,628,000.
2 Dividend income, interest income, and realized net gain (loss) from affiliated companies of the fund were $1,769,000, $298,000, and ($1,581,000), respectively.
See accompanying Notes, which are an integral part of the Financial Statements.
18
Energy Fund
Statement of Changes in Net Assets
| | |
| | Year Ended January 31, |
| | 2011 | 2010 |
| | ($000) | ($000) |
| Increase (Decrease) in Net Assets | | |
| Operations | | |
| Net Investment Income | 199,818 | 171,663 |
| Realized Net Gain (Loss) | 457,168 | 222,696 |
| Change in Unrealized Appreciation (Depreciation) | 2,204,352 | 2,364,619 |
| Net Increase (Decrease) in Net Assets Resulting from Operations | 2,861,338 | 2,758,978 |
| Distributions | | |
| Net Investment Income | | |
| Investor Shares | (90,181) | (105,714) |
| Admiral Shares | (94,977) | (74,777) |
| Realized Capital Gain1 | | |
| Investor Shares | (207,111) | — |
| Admiral Shares | (195,797) | — |
| Total Distributions | (588,066) | (180,491) |
| Capital Share Transactions | | |
| Investor Shares | (1,004,028) | 565,224 |
| Admiral Shares | 1,358,485 | 508,755 |
| Net Increase (Decrease) from Capital Share Transactions | 354,457 | 1,073,979 |
| Total Increase (Decrease) | 2,627,729 | 3,652,466 |
| Net Assets | | |
| Beginning of Period | 10,974,665 | 7,322,199 |
| End of Period2 | 13,602,394 | 10,974,665 |
1 Includes fiscal 2011 short-term gain distributions totaling $62,911,000. Short-term gain distributions are treated as ordinary income dividends for tax purposes.
2 Net Assets—End of Period includes undistributed (overdistributed) net investment income of ($16,406,000) and ($18,896,000).
See accompanying Notes, which are an integral part of the Financial Statements.
19
Energy Fund
Financial Highlights
Investor Shares
| | | | | |
| For a Share Outstanding | | | Year Ended January 31, |
| Throughout Each Period | 2011 | 2010 | 2009 | 2008 | 2007 |
| Net Asset Value, Beginning of Period | $57.17 | $42.62 | $73.93 | $63.55 | $64.50 |
| Investment Operations | | | | | |
| Net Investment Income | 1.053 | .910 | 1.2761 | 1.226 | 1.112 |
| Net Realized and Unrealized Gain (Loss) | | | | | |
| on Investments | 14.103 | 14.591 | (28.853) | 14.639 | .405 |
| Total from Investment Operations | 15.156 | 15.501 | (27.577) | 15.865 | 1.517 |
| Distributions | | | | | |
| Dividends from Net Investment Income | (.977) | (.951) | (1.264) | (1.177) | (1.020) |
| Distributions from Realized Capital Gains | (2.149) | — | (2.469) | (4.308) | (1.447) |
| Total Distributions | (3.126) | (.951) | (3.733) | (5.485) | (2.467) |
| Net Asset Value, End of Period | $69.20 | $57.17 | $42.62 | $73.93 | $63.55 |
| |
| Total Return2 | 27.17% | 36.28% | -38.51% | 25.02% | 2.24% |
| |
| Ratios/Supplemental Data | | | | | |
| Net Assets, End of Period (Millions) | $6,731 | $6,536 | $4,434 | $7,919 | $6,479 |
| Ratio of Total Expenses to | | | | | |
| Average Net Assets | 0.34%3 | 0.38%3 | 0.28%3 | 0.25% | 0.25% |
| Ratio of Net Investment Income to | | | | | |
| Average Net Assets | 1.74% | 1.73% | 1.84% | 1.67% | 1.71% |
| Portfolio Turnover Rate | 31% | 27% | 21% | 22% | 22% |
1 Calculated based on average shares outstanding.
2 Total returns do not include transaction or account service fees that may have applied in the periods shown. Fund prospectuses provide information about any applicable transaction and account service fees.
3 Includes performance-based investment advisory fee increases (decreases) of 0.00% for fiscal 2011, 0.03% for fiscal 2010, and 0.01% for fiscal 2009.
See accompanying Notes, which are an integral part of the Financial Statements.
20
Energy Fund
Financial Highlights
Admiral Shares
| | | | | |
| For a Share Outstanding | | | Year Ended January 31, |
| Throughout Each Period | 2011 | 2010 | 2009 | 2008 | 2007 |
| Net Asset Value, Beginning of Period | $107.34 | $80.02 | $138.86 | $119.35 | $121.13 |
| Investment Operations | | | | | |
| Net Investment Income | 2.045 | 1.780 | 2.4801 | 2.418 | 2.180 |
| Net Realized and Unrealized Gain (Loss) | | | | | |
| on Investments | 26.479 | 27.395 | (54.203) | 27.505 | .757 |
| Total from Investment Operations | 28.524 | 29.175 | (51.723) | 29.923 | 2.937 |
| Distributions | | | | | |
| Dividends from Net Investment Income | (1.899) | (1.855) | (2.480) | (2.322) | (2.000) |
| Distributions from Realized Capital Gains | (4.035) | — | (4.637) | (8.091) | (2.717) |
| Total Distributions | (5.934) | (1.855) | (7.117) | (10.413) | (4.717) |
| Net Asset Value, End of Period | $129.93 | $107.34 | $80.02 | $138.86 | $119.35 |
| |
| Total Return2 | 27.24% | 36.37% | -38.46% | 25.13% | 2.32% |
| |
| Ratios/Supplemental Data | | | | | |
| Net Assets, End of Period (Millions) | $6,871 | $4,439 | $2,889 | $5,214 | $3,612 |
| Ratio of Total Expenses to | | | | | |
| Average Net Assets | 0.28%3 | 0.31%3 | 0.21%3 | 0.17% | 0.18% |
| Ratio of Net Investment Income to | | | | | |
| Average Net Assets | 1.80% | 1.80% | 1.91% | 1.75% | 1.78% |
| Portfolio Turnover Rate | 31% | 27% | 21% | 22% | 22% |
1 Calculated based on average shares outstanding.
2 Total returns do not include transaction fees that may have applied in the periods shown. Fund prospectuses provide information about any applicable transaction fees.
3 Includes performance-based investment advisory fee increases (decreases) of 0.00% for fiscal 2011, 0.03% for fiscal 2010, and 0.01% for fiscal 2009.
See accompanying Notes, which are an integral part of the Financial Statements.
21
Energy Fund
Notes to Financial Statements
Vanguard Energy Fund is registered under the Investment Company Act of 1940 as an open-end investment company, or mutual fund. The fund invests in securities of foreign issuers, which may subject it to investment risks not normally associated with investing in securities of U.S. corporations. The fund offers two classes of shares: Investor Shares and Admiral Shares. Investor Shares are available to any investor who meets the fund’s minimum purchase requirements. Admiral Shares are designed for investors who meet certain administrative, service, and account-size criteria.
A. The following significant accounting policies conform to generally accepted accounting principles for U.S. mutual funds. The fund consistently follows such policies in preparing its financial statements.
1. Security Valuation: Securities are valued as of the close of trading on the New York Stock Exchange (generally 4 p.m., Eastern time) on the valuation date. Equity securities are valued at the latest quoted sales prices or official closing prices taken from the primary market in which each security trades; such securities not traded on the valuation date are valued at the mean of the latest quoted bid and asked prices. Securities for which market quotations are not readily available, or whose values have been affected by events occurring before the fund’s pricing time but after the close of the securities’ primary markets, are valued at their fair values calculated according to procedures adopted by the board of trustees. These procedures include obtaining quotations from an independent pricing service, monitoring news to identify significant market- or security-specific events, and evaluating changes in the values of foreign market proxies (for example, ADRs, futures contracts, or exchange-traded funds), between the time the foreign markets close and the fund’s pricing time. When fair-value pricing is employed, the prices of securities used by a fund to calculate its net asset value may differ from quoted or published prices for the same securities. Investments in Vanguard Market Liquidity Fund are valued at that fund’s net asset value. Temporary cash investments acquired over 60 days to maturity are valued using the latest bid prices or using valuations based on a matrix system (which considers such factors as security prices, yields, maturities, and ratings), both as furnished by independent pricing services. Other temporary cash investments are valued at amortized cost, which approximates market value.
2. Foreign Currency: Securities and other assets and liabilities denominated in foreign currencies are translated into U.S. dollars using exchange rates obtained from an independent third party as of the fund’s pricing time on the valuation date. Realized gains (losses) and unrealized appreciation (depreciation) on investment securities include the effects of changes in exchange rates since the securities were purchased, combined with the effects of changes in security prices. Fluctuations in the value of other assets and liabilities resulting from changes in exchange rates are recorded as unrealized foreign currency gains (losses) until the assets or liabilities are settled in cash, at which time they are recorded as realized foreign currency gains (losses).
3. Futures Contracts: The fund uses index futures contracts to a limited extent, with the objective of maintaining full exposure to the stock market while maintaining liquidity. The fund may purchase or sell futures contracts to achieve a desired level of investment, whether to accommodate portfolio turnover or cash flows from capital share transactions. The primary risks associated with the use of futures contracts are imperfect correlation between changes in market values of stocks held by the fund and the prices of futures contracts, and the possibility of an illiquid market.
22
Energy Fund
Futures contracts are valued at their quoted daily settlement prices. The aggregate principal amounts of the contracts are not recorded in the Statement of Net Assets. Fluctuations in the value of the contracts are recorded in the Statement of Net Assets as an asset (liability) and in the Statement of Operations as unrealized appreciation (depreciation) until the contracts are closed, when they are recorded as realized futures gains (losses).
4. Repurchase Agreements: The fund invests in repurchase agreements. Securities pledged as collateral for repurchase agreements are held by a custodian bank until the agreements mature. Each agreement requires that the market value of the collateral be sufficient to cover payments of interest and principal; however, in the event of default or bankruptcy by the other party to the agreement, retention of the collateral may be subject to legal proceedings.
5. Federal Income Taxes: The fund intends to continue to qualify as a regulated investment company and distribute all of its taxable income. Management has analyzed the fund’s tax positions taken for all open federal income tax years (January 31, 2008–2011), and has concluded that no provision for federal income tax is required in the fund’s financial statements.
6. Distributions: Distributions to shareholders are recorded on the ex-dividend date.
7. Security Lending: The fund may lend its securities to qualified institutional borrowers to earn additional income. Security loans are required to be secured at all times by collateral at least equal to the market value of securities loaned. The fund invests cash collateral received in Vanguard Market Liquidity Fund, and records a liability for the return of the collateral, during the period the securities are on loan. Security lending income represents fees charged to borrowers plus income earned on investing cash collateral, less expenses associated with the loan.
8. Other: Dividend income is recorded on the ex-dividend date. Interest income includes income distributions received from Vanguard Market Liquidity Fund and is accrued daily. Security transactions are accounted for on the date securities are bought or sold. Costs used to determine realized gains (losses) on the sale of investment securities are those of the specific securities sold. Fees assessed on redemptions of capital shares are credited to paid-in capital.
Each class of shares has equal rights as to assets and earnings, except that each class separately bears certain class-specific expenses related to maintenance of shareholder accounts (included in Management and Administrative expenses) and shareholder reporting. Marketing and distribution expenses are allocated to each class of shares based on a method approved by the board of trustees. Income, other non-class-specific expenses, and gains and losses on investments are allocated to each class of shares based on its relative net assets.
B. Wellington Management Company, LLP, provides investment advisory services to a portion of the fund for a fee calculated at an annual percentage rate of average net assets managed by the advisor. The basic fee is subject to quarterly adjustments based on the fund’s performance for the preceding three years relative to a combined index composed of the S&P Citigroup BMI World Energy Index and the S&P 500 Energy Equal Weighted Blend Index through July 31, 2010, and the MSCI ACWI Energy Index thereafter. The benchmark change will be fully phased in by July 31, 2013.
23
Energy Fund
The Vanguard Group provides investment advisory services to a portion of the fund on an at-cost basis; the fund paid Vanguard advisory fees of $349,000 for the year ended January 31, 2011.
For the year ended January 31, 2011, the aggregate investment advisory fee represented an effective annual basic rate of 0.14% of the fund’s average net assets, before an increase of $180,000 (0.00%) based on performance.
C. The Vanguard Group furnishes at cost corporate management, administrative, marketing, and distribution services. The costs of such services are allocated to the fund under methods approved by the board of trustees. The fund has committed to provide up to 0.40% of its net assets in capital contributions to Vanguard. At January 31, 2011, the fund had contributed capital of $2,134,000 to Vanguard (included in Other Assets), representing 0.02% of the fund’s net assets and 0.85% of Vanguard’s capitalization. The fund’s trustees and officers are also directors and officers of Vanguard.
D. The fund has asked its investment advisors to direct certain security trades, subject to obtaining the best price and execution, to brokers who have agreed to rebate to the fund part of the commissions generated. Such rebates are used solely to reduce the fund’s management and administrative expenses. For the year ended January 31, 2011, these arrangements reduced the fund’s expenses by $119,000 (an annual rate of 0.00% of average net assets).
E. Various inputs may be used to determine the value of the fund’s investments. These inputs are summarized in three broad levels for financial statement purposes. The inputs or methodologies used to value securities are not necessarily an indication of the risk associated with investing in those securities.
Level 1—Quoted prices in active markets for identical securities.
Level 2—Other significant observable inputs (including quoted prices for similar securities, interest rates, prepayment speeds, credit risk, etc.).
Level 3—Significant unobservable inputs (including the fund’s own assumptions used to determine the fair value of investments).
The following table summarizes the fund’s investments as of January 31, 2011, based on the inputs used to value them:
| | | |
| | Level 1 | Level 2 | Level 3 |
| Investments | ($000) | ($000) | ($000) |
| Common Stocks—United States | 7,793,867 | — | — |
| Common Stocks—International | 3,962,884 | 1,134,177 | — |
| Temporary Cash Investments | 293,662 | 399,685 | — |
| Futures Contracts—Assets1 | 2,461 | — | — |
| Total | 12,052,874 | 1,533,862 | — |
| 1 Represents variation margin on the last day of the reporting period. |
24
Energy Fund
F. At January 31, 2011, the aggregate settlement value of open futures contracts and the related unrealized appreciation (depreciation) were:
| | | | |
| | | | | ($000) |
| | | | Aggregate | |
| | | Number of | Settlement | Unrealized |
| | | Long (Short) | Value | Appreciation |
| Futures Contracts | Expiration | Contracts | Long (Short) | (Depreciation) |
| E-mini S&P 500 Index | March 2011 | 2,801 | 179,600 | 749 |
| S&P 500 Index | March 2011 | 384 | 123,110 | 4,368 |
Unrealized appreciation (depreciation) on open futures contracts is required to be treated as realized gain (loss) for tax purposes.
G. Distributions are determined on a tax basis and may differ from net investment income and realized capital gains for financial reporting purposes. Differences may be permanent or temporary. Permanent differences are reclassified among capital accounts in the financial statements to reflect their tax character. Temporary differences arise when certain items of income, expense, gain, or loss are recognized in different periods for financial statement and tax purposes; these differences will reverse at some time in the future. Differences in classification may also result from the treatment of short-term gains as ordinary income for tax purposes.
During the year ended January 31, 2011, the fund realized net foreign currency losses of $320,000, which decreased distributable net income for tax purposes; accordingly, such losses have been reclassified from accumulated net realized gains to overdistributed net investment income.
The fund’s realized gains for the year ended January 31, 2011, include $52,000 of capital gain tax paid on sales of Indian securities. This tax is treated as a decrease in taxable income; accordingly, this amount has been reclassified from accumulated net realized gains to overdistributed net investment income.
The fund used a tax accounting practice to treat a portion of the price of capital shares redeemed during the year as distributions from net investment income and realized capital gains. Accordingly, the fund has reclassified $11,798,000 from overdistributed net investment income, and $26,531,000 from accumulated net realized gains, to paid-in capital.
For tax purposes, at January 31, 2011, the fund had $26,005,000 of ordinary income and $77,255,000 of long-term capital gains available for distribution.
At January 31, 2011, the cost of investment securities for tax purposes was $8,103,474,000. Net unrealized appreciation of investment securities for tax purposes was $5,480,801,000, consisting of unrealized gains of $5,588,942,000 on securities that had risen in value since their purchase and $108,141,000 in unrealized losses on securities that had fallen in value since their purchase.
25
Energy Fund
H. During the year ended January 31, 2011, the fund purchased $3,341,218,000 of investment securities and sold $3,435,279,000 of investment securities, other than temporary cash investments.
I. Capital share transactions for each class of shares were:
| | | | |
| | | | Year Ended January 31, |
| | | 2011 | | 2010 |
| | Amount | Shares | Amount | Shares |
| | ($000) | (000) | ($000) | (000) |
| Investor Shares | | | | |
| Issued | 993,363 | 16,506 | 1,489,177 | 28,171 |
| Issued in Lieu of Cash Distributions | 286,379 | 4,616 | 101,349 | 1,698 |
| Redeemed1 | (2,283,770) | (38,167) | (1,025,302) | (19,560) |
| Net Increase (Decrease)—Investor Shares | (1,004,028) | (17,045) | 565,224 | 10,309 |
| Admiral Shares | | | | |
| Issued | 1,900,020 | 16,578 | 1,126,454 | 11,663 |
| Issued in Lieu of Cash Distributions | 261,084 | 2,235 | 65,102 | 582 |
| Redeemed1 | (802,619) | (7,281) | (682,801) | (6,994) |
| Net Increase (Decrease)—Admiral Shares | 1,358,485 | 11,532 | 508,755 | 5,251 |
| 1 Net of redemption fees for fiscal 2011 and 2010 of $2,317,000 and $3,460,000, respectively (fund totals). |
J. The fund has invested in a company that is considered to be an affiliated company of the fund because the fund owns more than 5% of the outstanding voting securities of the company. Transactions during the period in securities of this company were as follows:
| | | | | |
| | | | Current Period Transactions | |
| | Jan. 31, 2010 | | Proceeds from | | Jan. 31, 2011 |
| | Market | Purchases | Securities | Dividend | Market |
| | Value | at Cost | Sold | Income | Value |
| | ($000) | ($000) | ($000) | ($000) | ($000) |
| Cabot Oil & Gas Corp. | N/A1 | 72,636 | 17,071 | 942 | 266,816 |
| 1 Not applicable—At January 31, 2010, the issuer was not an affiliated company of the fund. |
K. In preparing the financial statements as of January 31, 2011, management considered the impact of subsequent events for potential recognition or disclosure in these financial statements.
26
Report of Independent Registered
Public Accounting Firm
To the Trustees of Vanguard Specialized Funds and the Shareholders of Vanguard Energy Fund:
In our opinion, the accompanying statement of net assets and the related statements of operations and of changes in net assets and the financial highlights present fairly, in all material respects, the financial position of Vanguard Energy Fund (constituting a separate portfolio of Vanguard Specialized Funds, hereafter referred to as the “Fund”) at January 31, 2011, the results of its operations for the year then ended, the changes in its net assets for each of the two years in the period then ended and the financial highlights for each of the five years in the period then ended, in conformity with accounting principles generally accepted in the United States of America. These financial statements and financial highlights (hereafter referred to as “financial statements”) are the responsibility of the Fund’s management; our responsibility is to express an opinion on these financial statements based on our audits. We conducted our audits of these financial statements in accordance with the standards of the Public Company Accounting Oversight Board (United States). Those standards require that we plan and perform the audit to obtain reasonable assurance about whether the financial statements are free of material misstatement. An audit includes examining, on a test basis, evidence supporting the amounts and disclosures in the financial statements, assessing the accounting principles used and significant estimates made by management, and evaluating the overall financial statement presentation. We believe that our audits, which included confirmation of securities at January 31, 2011 by correspondence with the custodians and brokers and by agreement to the underlying ownership records of Vanguard Market Liquidity Fund, provide a reasonable basis for our opinion.
PricewaterhouseCoopers LLP
Philadelphia, Pennsylvania
March 11, 2011
|
| Special 2010 tax information (unaudited) for Vanguard Energy Fund |
This information for the fiscal year ended January 31, 2011, is included pursuant to provisions of the Internal Revenue Code.
The fund distributed $362,151,000 as capital gain dividends (from net long-term capital gains) to shareholders during the fiscal year.
The fund distributed $148,606,000 of qualified dividend income to shareholders during the fiscal year.
For corporate shareholders, 42.2% of investment income (dividend income plus short-term gains, if any) qualifies for the dividends-received deduction.
27
Your Fund’s After-Tax Returns
This table presents returns for your fund both before and after taxes. The after-tax returns are shown in two ways: (1) assuming that an investor owned the fund during the entire period and paid taxes on the fund’s distributions, and (2) assuming that an investor paid taxes on the fund’s distributions and sold all shares at the end of each period.
Calculations are based on the highest individual federal income tax and capital gains tax rates in effect at the times of the distributions and the hypothetical sales. State and local taxes were not considered. After-tax returns reflect any qualified dividend income , using actual prior-year figures and estimates for 2011. (In the example, returns after the sale of fund shares may be higher than those assuming no sale. This occurs when the sale would have produced a capital loss. The calculation assumes that the investor received a tax deduction for the loss.) The table shows returns for Investor Shares only; returns for other share classes will differ. Please note that your actual after-tax returns will depend on your tax situation and may differ from those shown. Also note that if you own the fund in a tax-deferred account, such as an individual retirement account or a 401(k) plan, this information does not apply to you. Such accounts are not subject to current taxes.
Finally, keep in mind that a fund’s performance—whether before or after taxes—does not guarantee future results.
Average Annual Total Returns: Energy Fund Investor Shares
Periods Ended January 31, 2011
| | | |
| | One | Five | Ten |
| | Year | Years | Years |
| Returns Before Taxes | 27.17% | 6.38% | 15.39% |
| Returns After Taxes on Distributions | 26.04 | 5.52 | 14.39 |
| Returns After Taxes on Distributions and Sale of Fund Shares | 18.49 | 5.29 | 13.48 |
Returns do not reflect the 1% fee on redemptions of shares held for less than one year.
28
About Your Fund’s Expenses
As a shareholder of the fund, you incur ongoing costs, which include costs for portfolio management, administrative services, and shareholder reports (like this one), among others. Operating expenses, which are deducted from a fund’s gross income, directly reduce the investment return of the fund.
A fund’s expenses are expressed as a percentage of its average net assets. This figure is known as the expense ratio. The following examples are intended to help you understand the ongoing costs (in dollars) of investing in your fund and to compare these costs with those of other mutual funds. The examples are based on an investment of $1,000 made at the beginning of the period shown and held for the entire period.
The accompanying table illustrates your fund’s costs in two ways:
• Based on actual fund return. This section helps you to estimate the actual expenses that you paid over the period. The ”Ending Account Value“ shown is derived from the fund‘s actual return, and the third column shows the dollar amount that would have been paid by an investor who started with $1,000 in the fund. You may use the information here, together with the amount you invested, to estimate the expenses that you paid over the period.
To do so, simply divide your account value by $1,000 (for example, an $8,600 account value divided by $1,000 = 8.6), then multiply the result by the number given for your fund under the heading ”Expenses Paid During Period.“
• Based on hypothetical 5% yearly return. This section is intended to help you compare your fund‘s costs with those of other mutual funds. It assumes that the fund had a yearly return of 5% before expenses, but that the expense ratio is unchanged. In this case—because the return used is not the fund’s actual return—the results do not apply to your investment. The example is useful in making comparisons because the Securities and Exchange Commission requires all mutual funds to calculate expenses based on a 5% return. You can assess your fund’s costs by comparing this hypothetical example with the hypothetical examples that appear in shareholder reports of other funds.
Note that the expenses shown in the table are meant to highlight and help you compare ongoing costs only and do not reflect transaction costs incurred by the fund for buying and selling securities. Further, the expenses do not include the 1% fee on redemptions of shares held for less than one year, nor do they include the account service fee described in the prospectus. If such fees were applied to your account, your costs would be higher. Your fund does not carry a “sales load.” The calculations assume no shares were bought or sold during the period. Your actual costs may have been higher or lower, depending on the amount of your investment and the timing of any purchases or redemptions.
You can find more information about the fund’s expenses, including annual expense ratios, in the Financial Statements section of this report. For additional information on operating expenses and other shareholder costs, please refer to your fund’s current prospectus.
29
Six Months Ended January 31, 2011
| | | |
| | Beginning | Ending | Expenses |
| | Account Value | Account Value | Paid During |
| Energy Fund | 7/31/2010 | 1/31/2011 | Period |
| Based on Actual Fund Return | | | |
| Investor Shares | $1,000.00 | $1,298.03 | $1.91 |
| Admiral Shares | 1,000.00 | 1,298.24 | 1.56 |
| Based on Hypothetical 5% Yearly Return | | | |
| Investor Shares | $1,000.00 | $1,023.54 | $1.68 |
| Admiral Shares | 1,000.00 | 1,023.84 | 1.38 |
The calculations are based on expenses incurred in the most recent six-month period. The fund’s annualized six-month expense ratios for that period are 0.33% for Investor Shares and 0.27% for Admiral Shares. The dollar amounts shown as “Expenses Paid” are equal to the annualized expense ratio multiplied by the average account value over the period, multiplied by the number of days in the most recent six-month period, then divided by the number of days in the most recent 12-month period.
30
Glossary
30-Day SEC Yield. A fund’s 30-day SEC yield is derived using a formula specified by the U.S. Securities and Exchange Commission. Under the formula, data related to the fund’s security holdings in the previous 30 days are used to calculate the fund’s hypothetical net income for that period, which is then annualized and divided by the fund’s estimated average net assets over the calculation period. For the purposes of this calculation, a security’s income is based on its current market yield to maturity (in the case of bonds) or its projected dividend yield (for stocks). Because the SEC yield represents hypothetical annualized income, it will differ—at times significantly—from the fund’s actual experience. As a result, the fund’s income distributions may be higher or lower than implied by the SEC yield.
Beta. A measure of the magnitude of a fund’s past share-price fluctuations in relation to the ups and downs of a given market index. The index is assigned a beta of 1.00. Compared with a given index, a fund with a beta of 1.20 typically would have seen its share price rise or fall by 12% when the index rose or fell by 10%. For this report, beta is based on returns over the past 36 months for both the fund and the index. Note that a fund’s beta should be reviewed in conjunction with its R-squared (see definition). The lower the R-squared, the less correlation there is between the fund and the index, and the less reliable beta is as an indicator of volatility.
Dividend Yield. Dividend income earned by stocks, expressed as a percentage of the aggregate market value (or of net asset value, for a fund). The yield is determined by dividing the amount of the annual dividends by the aggregate value (or net asset value) at the end of the period. For a fund, the dividend yield is based solely on stock holdings and does not include any income produced by other investments.
Earnings Growth Rate. The average annual rate of growth in earnings over the past five years for the stocks now in a fund.
Equity Exposure. A measure that reflects a fund’s investments in stocks and stock futures. Any holdings in short-term reserves are excluded.
Expense Ratio. The percentage of a fund’s average net assets used to pay its annual administrative and advisory expenses. These expenses directly reduce returns to investors.
Foreign Holdings. The percentage of a fund represented by stocks or depositary receipts of companies based outside the United States.
Inception Date. The date on which the assets of a fund (or one of its share classes) are first invested in accordance with the fund’s investment objective. For funds with a subscription period, the inception date is the day after that period ends. Investment performance is measured from the inception date.
Median Market Cap. An indicator of the size of companies in which a fund invests; the midpoint of market capitalization (market price x shares outstanding) of a fund’s stocks, weighted by the proportion of the fund’s assets invested in each stock. Stocks representing half of the fund’s assets have market capitalizations above the median, and the rest are below it.
Price/Book Ratio. The share price of a stock divided by its net worth, or book value, per share. For a fund, the weighted average price/book ratio of the stocks it holds.
31
Price/Earnings Ratio. The ratio of a stock’s current price to its per-share earnings over the past year. For a fund, the weighted average P/E of the stocks it holds. P/E is an indicator of market expectations about corporate prospects; the higher the P/E, the greater the expectations for a company’s future growth.
R-Squared. A measure of how much of a fund’s past returns can be explained by the returns from the market in general, as measured by a given index. If a fund’s total returns were precisely synchronized with an index’s returns, its R-squared would be 1.00. If the fund’s returns bore no relationship to the index’s returns, its R-squared would be 0. For this report, R-squared is based on returns over the past 36 months for both the fund and the index.
Return on Equity. The annual average rate of return generated by a company during the past five years for each dollar of shareholder’s equity (net income divided by shareholder’s equity). For a fund, the weighted average return on equity for the companies whose stocks it holds.
Short-Term Reserves. The percentage of a fund invested in highly liquid, short-term securities that can be readily converted to cash.
Turnover Rate. An indication of the fund’s trading activity. Funds with high turnover rates incur higher transaction costs and may be more likely to distribute capital gains (which may be taxable to investors). The turnover rate excludes in-kind transactions, which have minimal impact on costs.
32
This page intentionally left blank.
This page intentionally left blank.
This page intentionally left blank.
The People Who Govern Your Fund
The trustees of your mutual fund are there to see that the fund is operated and managed in your best interests since, as a shareholder, you are a part owner of the fund. Your fund’s trustees also serve on the board of directors of The Vanguard Group, Inc., which is owned by the Vanguard funds and provides services to them on an at-cost basis.
A majority of Vanguard’s board members are independent, meaning that they have no affiliation with Vanguard or the funds they oversee, apart from the sizable personal investments they have made as private individuals. The independent board members have distinguished backgrounds in business, academia, and public service. Each of the trustees and executive officers oversees 179 Vanguard funds.
The following table provides information for each trustee and executive officer of the fund. More information about the trustees is in the Statement of Additional Information, which can be obtained, without charge, by contacting Vanguard at 800-662-7447, or online at vanguard.com.
| |
| Interested Trustee1 | and President (2006–2008) of Rohm and Haas Co. |
| | (chemicals); Director of Tyco International, Ltd. |
| F. William McNabb III | (diversified manufacturing and services) and Hewlett- |
| Born 1957. Trustee Since July 2009. Chairman of the | Packard Co. (electronic computer manufacturing); |
| Board. Principal Occupation(s) During the Past Five | Senior Advisor at New Mountain Capital; Trustee |
| Years: Chairman of the Board of The Vanguard Group, | of The Conference Board; Member of the Board of |
| Inc., and of each of the investment companies served | Managers of Delphi Automotive LLP (automotive |
| by The Vanguard Group, since January 2010; Director | components). |
| of The Vanguard Group since 2008; Chief Executive | |
| Officer and President of The Vanguard Group and of | Amy Gutmann |
| each of the investment companies served by The | Born 1949. Trustee Since June 2006. Principal |
| Vanguard Group since 2008; Director of Vanguard | Occupation(s) During the Past Five Years: President |
| Marketing Corporation; Managing Director of The | of the University of Pennsylvania; Christopher H. |
| Vanguard Group (1995–2008). | Browne Distinguished Professor of Political Science |
| | in the School of Arts and Sciences with secondary |
| | appointments at the Annenberg School for Commu- |
| Independent Trustees | nication and the Graduate School of Education |
| | of the University of Pennsylvania; Director of |
| Emerson U. Fullwood | Carnegie Corporation of New York, Schuylkill River |
| Born 1948. Trustee Since January 2008. Principal | Development Corporation, and Greater Philadelphia |
| Occupation(s) During the Past Five Years: Executive | Chamber of Commerce; Trustee of the National |
| Chief Staff and Marketing Officer for North America | Constitution Center; Chair of the Presidential |
| and Corporate Vice President (retired 2008) of Xerox | Commission for the Study of Bioethical Issues. |
| Corporation (document management products and | |
| services); Executive in Residence and 2010 | JoAnn Heffernan Heisen |
| Distinguished Minett Professor at the Rochester | Born 1950. Trustee Since July 1998. Principal |
| Institute of Technology; Director of SPX Corporation | Occupation(s) During the Past Five Years: Corporate |
| (multi-industry manufacturing), the United Way of | Vice President and Chief Global Diversity Officer |
| Rochester, Amerigroup Corporation (managed health | (retired 2008) and Member of the Executive |
| care), the University of Rochester Medical Center, | Committee (1997–2008) of Johnson & Johnson |
| Monroe Community College Foundation, and North | (pharmaceuticals/consumer products); Director of |
| Carolina A&T University. | Skytop Lodge Corporation (hotels), the University |
| | Medical Center at Princeton, the Robert Wood |
| Rajiv L. Gupta | Johnson Foundation, and the Center for Work Life |
| Born 1945. Trustee Since December 2001.2 | Policy; Member of the Advisory Board of the |
| Principal Occupation(s) During the Past Five Years: | Maxwell School of Citizenship and Public Affairs |
| Chairman and Chief Executive Officer (retired 2009) | at Syracuse University. |
| | |
| F. Joseph Loughrey | Thomas J. Higgins | |
| Born 1949. Trustee Since October 2009. Principal | Born 1957. Chief Financial Officer Since September |
| Occupation(s) During the Past Five Years: President | 2008. Principal Occupation(s) During the Past Five |
| and Chief Operating Officer (retired 2009) and Vice | Years: Principal of The Vanguard Group, Inc.; Chief |
| Chairman of the Board (2008–2009) of Cummins Inc. | Financial Officer of each of the investment companies |
| (industrial machinery); Director of SKF AB (industrial | served by The Vanguard Group since 2008; Treasurer |
| machinery), Hillenbrand, Inc. (specialized consumer | of each of the investment companies served by The |
| services), the Lumina Foundation for Education, and | Vanguard Group (1998–2008) . |
| Oxfam America; Chairman of the Advisory Council | | |
| for the College of Arts and Letters and Member | Kathryn J. Hyatt | |
| of the Advisory Board to the Kellogg Institute for | Born 1955. Treasurer Since November 2008. Principal |
| International Studies at the University of Notre Dame. | Occupation(s) During the Past Five Years: Principal |
| | of The Vanguard Group, Inc.; Treasurer of each of |
| André F. Perold | the investment companies served by The Vanguard |
| Born 1952. Trustee Since December 2004. Principal | Group since 2008; Assistant Treasurer of each of the |
| Occupation(s) During the Past Five Years: George | investment companies served by The Vanguard Group |
| Gund Professor of Finance and Banking at the Harvard | (1988–2008). | |
| Business School; Chair of the Investment Committee | | |
| of HighVista Strategies LLC (private investment firm). | Heidi Stam | |
| | Born 1956. Secretary Since July 2005. Principal |
| Alfred M. Rankin, Jr. | Occupation(s) During the Past Five Years: Managing |
| Born 1941. Trustee Since January 1993. Principal | Director of The Vanguard Group, Inc., since 2006; |
| Occupation(s) During the Past Five Years: Chairman, | General Counsel of The Vanguard Group since 2005; |
| President, and Chief Executive Officer of NACCO | Secretary of The Vanguard Group and of each of the |
| Industries, Inc. (forklift trucks/housewares/lignite); | investment companies served by The Vanguard Group |
| Director of Goodrich Corporation (industrial products/ | since 2005; Director and Senior Vice President of |
| aircraft systems and services) and the National | Vanguard Marketing Corporation since 2005; |
| Association of Manufacturers; Chairman of the Federal | Principal of The Vanguard Group (1997–2006). |
| Reserve Bank of Cleveland; Trustee of University | | |
| Hospitals of Cleveland; President of the Board of The | | |
| Cleveland Museum of Art. | Vanguard Senior Management Team |
| |
| Peter F. Volanakis | R. Gregory Barton | Michael S. Miller |
| Born 1955. Trustee Since July 2009. Principal | Mortimer J. Buckley | James M. Norris |
| Occupation(s) During the Past Five Years: President | Kathleen C. Gubanich | Glenn W. Reed |
| and Chief Operating Officer (retired 2010) of Corning | Paul A. Heller | George U. Sauter |
| Incorporated (communications equipment); Director of | | |
| Corning Incorporated (2000–2010) and Dow Corning | | |
| (2001–2010); Trustee of the Corning Incorporated | Chairman Emeritus and Senior Advisor |
| Foundation and the Corning Museum of Glass; | | |
| Overseer of the Amos Tuck School of Business | John J. Brennan | |
| Administration at Dartmouth College. | Chairman, 1996–2009 | |
| | Chief Executive Officer and President, 1996–2008 |
| |
| Executive Officers | | |
| | Founder | |
| Glenn Booraem | | |
| Born 1967. Controller Since July 2010. Principal | John C. Bogle | |
| Occupation(s) During the Past Five Years: Principal | Chairman and Chief Executive Officer, 1974–1996 |
| of The Vanguard Group, Inc.; Controller of each of | | |
| the investment companies served by The Vanguard | | |
| Group since 2010; Assistant Controller of each of | | |
| the investment companies served by The Vanguard | | |
| Group (2001–2010). | | |
1 Mr. McNabb is considered an “interested person,” as defined in the Investment Company Act of 1940, because he is an officer of the Vanguard funds.
2 December 2002 for Vanguard Equity Income Fund, Vanguard Growth Equity Fund, the Vanguard Municipal Bond Funds, and the Vanguard State Tax-Exempt Funds.
|  |
| P.O. Box 2600 |
| Valley Forge, PA 19482-2600 |
Connect with Vanguard® > vanguard.com
| |
| Fund Information > 800-662-7447 | CFA® is a trademark owned by CFA Institute. |
| Direct Investor Account Services > 800-662-2739 | |
| Institutional Investor Services > 800-523-1036 | |
| Text Telephone for People | |
| With Hearing Impairment > 800-749-7273 | |
| |
| This material may be used in conjunction | |
| with the offering of shares of any Vanguard | |
| fund only if preceded or accompanied by | |
| the fund’s current prospectus. | |
| |
| All comparative mutual fund data are from Lipper Inc. or | |
| Morningstar, Inc., unless otherwise noted. | |
| |
| You can obtain a free copy of Vanguard’s proxy voting | |
| guidelines by visiting vanguard.com/proxyreporting or by | |
| calling Vanguard at 800-662-2739. The guidelines are | |
| also available from the SEC’s website, sec.gov. In | |
| addition, you may obtain a free report on how your fund | |
| voted the proxies for securities it owned during the 12 | |
| months ended June 30. To get the report, visit either | |
| vanguard.com/proxyreporting or sec.gov. | |
| |
| You can review and copy information about your fund at | |
| the SEC’s Public Reference Room in Washington, D.C. To | |
| find out more about this public service, call the SEC at | |
| 202-551-8090. Information about your fund is also | |
| available on the SEC’s website, and you can receive | |
| copies of this information, for a fee, by sending a | |
| request in either of two ways: via e-mail addressed to | |
| publicinfo@sec.gov or via regular mail addressed to the | |
| Public Reference Section, Securities and Exchange | |
| Commission, Washington, DC 20549-1520. | |
| |
| |
| | © 2011 The Vanguard Group, Inc. |
| | All rights reserved. |
| | Vanguard Marketing Corporation, Distributor. |
| |
| | Q510 032011 |
 |
|
| Vanguard Precious Metals |
| and Mining Fund Annual Report |
|
| January 31, 2011 |
 |
> For the fiscal year ended January 31, 2011, Vanguard Precious Metals and Mining Fund returned about 35%.
> The fund’s return lagged that of its benchmark for the period, as well as the average return of its peer-group funds. Poor selection in nongold stocks held back results.
> Gold stocks were the most significant contributors to returns, while platinum companies were the biggest drags on performance.
| |
| Contents | |
| Your Fund’s Total Returns. | 1 |
| Chairman’s Letter. | 2 |
| Advisor’s Report. | 8 |
| Fund Profile. | 11 |
| Performance Summary. | 12 |
| Financial Statements. | 14 |
| Your Fund’s After-Tax Returns. | 25 |
| About Your Fund’s Expenses. | 26 |
| Glossary. | 28 |
Please note: The opinions expressed in this report are just that—informed opinions. They should not be considered promises or advice.
Also, please keep in mind that the information and opinions cover the period through the date on the front of this report. Of course, the risks of investing in your fund are spelled out in the prospectus.
See the Glossary for definitions of investment terms used in this report.
Cover photograph: Jean Maher.
Your Fund’s Total Returns
Fiscal Year Ended January 31, 2011
| |
| | Total |
| | Returns |
| Vanguard Precious Metals and Mining Fund | 35.35% |
| S&P Custom Precious Metals and Mining Index | 43.00 |
| Precious Metal Funds Average | 41.56 |
| Precious Metal Funds Average: Derived from data provided by Lipper Inc. |
Your Fund’s Performance at a Glance
January 31, 2010 , Through January 31, 2011
| | | | |
| | | | Distributions Per Share |
| | Starting | Ending | Income | Capital |
| | Share Price | Share Price | Dividends | Gains |
| Vanguard Precious Metals and Mining Fund | $18.74 | $24.15 | $1.101 | $0.191 |
1

Chairman’s Letter
Dear Shareholder,
After a long and bumpy ride, U.S. and international stocks posted robust returns for the fiscal year ended January 31, 2011. Most commodities prices, including silver, gold, and platinum, notched significant double-digit gains for the period, helping the precious metals and mining industry outperform the broad stock market.
Vanguard Precious Metals and Mining Fund returned 35.35% for the period. Despite that impressive return, the fund lagged both its target index (+43.00%) and its peer-group average (+41.56%). The fund’s sizable exposure to platinum mining companies, along with a limited exposure to gold stocks, played a role in this lag in performance.
If you hold the fund in a taxable account, you may wish to review information on after-tax performance provided later in this report.
Stocks rallied as economy ground into gear
Global stock markets produced excellent returns in the year ended January 31, 2011, with much of the strength materializing in the second half of the year. Europe’s sovereign debt challenges and concerns that the economic recovery in the United States might not reach escape velocity
2
seemed to recede from investors’ minds, displaced by strong corporate earnings and a powerful rebound in consumer spending and in the manufacturing sector.
The U.S. stock market returned about 24%. Small- and mid-capitalization stocks, often the first to respond to changes in the economic outlook, did even better. As a group, non-U.S. stock markets returned more than 18%. Emerging markets were the best performers. Despite high-profile dramas in Europe’s government bond markets, European stocks produced double-digit gains. Asia’s developed markets turned in mixed results on local exchanges, but the strength of the yen, the Australian dollar, and other regional currencies bolstered returns for U.S.-based investors.
A strong start, a faltering finish for bonds
In January 2010, the bond market’s near-term prospects looked dubious, in large part because yields hovered near generational lows. Over the following 12 months, however, yields dipped lower still. The taxable bond market returned about 5% for the year. As investors searched for yield, corporate bonds produced the best returns, with the riskiest credits leading the market.
Toward the end of the fiscal year, an improving economic outlook nudged interest rates higher, putting pressure on bond prices. This dynamic was evident in the municipal bond market, where rising rates and a confluence of other factors weighed on prices. The expiration of the
Market Barometer
| | | |
| | | Average Annual Total Returns |
| | | Periods Ended January 31, 2011 |
| | One | Three | Five |
| | Year | Years | Years |
| Stocks | | | |
| Russell 1000 Index (Large-caps) | 23.33% | 0.45% | 2.51% |
| Russell 2000 Index (Small-caps) | 31.36 | 4.57 | 2.64 |
| Dow Jones U.S. Total Stock Market Index | 24.31 | 1.22 | 2.86 |
| MSCI All Country World Index ex USA (International) | 18.50 | -0.96 | 4.08 |
| |
| Bonds | | | |
| Barclays Capital U.S. Aggregate Bond Index (Broad | | | |
| taxable market) | 5.06% | 5.36% | 5.82% |
| Barclays Capital Municipal Bond Index (Broad | | | |
| tax-exempt market) | 1.10 | 3.39 | 3.88 |
| Citigroup Three-Month U.S. Treasury Bill Index | 0.14 | 0.59 | 2.23 |
| |
| CPI | | | |
| Consumer Price Index | 1.63% | 1.42% | 2.12% |
3
Build America Bonds program, for example, raised the prospect of a spike in new tax-exempt issuance, while the extension of federal tax rate cuts that were set to expire made munis’ tax exemption somewhat less attractive. For the full year, the muni market returned about 1%.
As it has since December 2008, the Federal Reserve held its target for short-term interest rates near 0%, keeping the returns available from money market instruments such as the 3-month Treasury bill in the same neighborhood.
Heavy exposure to platinum muted fund performance
Vanguard Precious Metals and Mining Fund focuses on a small sector of the global stock market: companies that are involved in the mining of or exploration for precious and rare metals and minerals. Although the fund holds only about 40–50 stocks, they are diversified among the subsectors of the broad metals and mining industry. While diversification can help moderate some of the swings common in this notoriously volatile sector, investors should still expect the fund’s returns to vary widely from year to year.
Prices for silver (+73%), gold (+23%), and platinum (+19%) rose notably in the year ended January 31. In this investment environment, Vanguard Precious Metals and Mining Fund’s return—while impressive—lagged those of its comparative standards, which typically have more exposure to gold-oriented stocks and less to stocks related to other metals.
Expense Ratios
Your Fund Compared With Its Peer Group
| | |
| | | Peer Group |
| | Fund | Average |
| Precious Metals and Mining Fund | 0.27% | 1.37% |
The fund expense ratio shown is from the prospectus dated May 28, 2010, and represents estimated costs for the current fiscal year. For the fiscal year ended January 31, 2011, the fund’s expense ratio was 0.27%. The peer-group expense ratio is derived from data provided by Lipper Inc. and captures information through year-end 2010.
Peer group: Precious Metal Funds.
4
Although gold prices didn’t spike as high (in percentage terms) as those of some other metals during the period, gold set a new record and the majority of gold stocks performed exceptionally well. Gold is often considered a form of “insurance” against financial turmoil and global unrest, and events such as Europe’s sovereign debt crisis and extraordinary monetary initiatives in the United States added to its luster in the past year.
The fund’s relatively light exposure to gold-mining companies notwithstanding, such stocks were by far the most significant contributor to performance. Gold-oriented companies, including Centerra Gold (+59%) and Nevsun Resources (+211%), added more than 16 percentage points to the fund’s overall returns.
In an environment where some gold stocks produce triple-digit returns, clearly, more exposure is better; so the fund paid a price for its heavy allocation to other metals and minerals stocks. Platinum stocks, in particular, hurt results. Even though prices for the scarce metal rose almost as much as gold prices, in percentage terms, platinum mining companies—including Lonmin and Anglo Platinum, two of the world’s largest producers—suffered as strikes and other issues in their South African mines disrupted production.
In recent years, the fund has maintained heavy exposure to platinum stocks relative to the benchmark. However, during the period, the fund’s advisor, M&G Investment Management Ltd., began to slowly decrease the portfolio’s exposure to the
Total Returns
Ten Years Ended January 31, 2011
| |
| | Average |
| | Annual Return |
| Precious Metals and Mining Fund | 21.39% |
| Spliced Precious Metals and Mining Index | 21.37 |
| Precious Metal Funds Average | 23.16 |
Spliced Precious Metals and Mining Index: S&P/Citigroup World Equity Gold Index through June 30, 2005; S&P Custom Precious Metals and Mining Index thereafter.
Precious Metal Funds Average: Derived from data provided by Lipper Inc.
The figures shown represent past performance, which is not a guarantee of future results. (Current performance may be lower or higher than the performance data cited. For performance data current to the most recent month-end, visit our website at vanguard.com/performance.) Note, too, that both investment returns and principal value can fluctuate widely, so an investor’s shares, when sold, could be worth more or less than their original cost.
5
metal, bringing it more in line with the benchmark’s weighting, while at the same time increasing the portfolio’s allocation to gold stocks.
Fund returns benefited from strong stock selection in diversified metals and mining. Together, mineral sands miner Iluka Resources, Australian copper miner OZ Minerals, and diversified natural resource producer Sherritt International added more than 9 percentage points to the fund’s return.
Long-term performance remains impressive despite recent volatility
For the ten-year period ended January 31, the fund posted an average annual return of 21.39%. The fund’s returns were in line with those of its benchmark (+21.37%), and slightly less than the peer-group average (+23.16%). The fund significantly outperformed the broad U.S. stock market, which produced an average return of 2.47% a year over the past decade. These striking returns should be treated with extreme caution: In this highly volatile segment of the market, performance can turn quickly. For fiscal 2009, for example, the fund returned –60.16%, a result that was more than 20 percentage points worse than the –38.69% return of the overall U.S. stock market for the same period.
The fund’s advisor, London-based M&G Investment Management, has ably steered the fund through the inevitable ups and downs associated with this market segment. The advisor uses a bottom-up stock selection process that focuses on well-managed and returns-focused companies across the universe of precious metals and mining stocks. Thanks to its investment mandate, the fund is allowed to be more diversified than most of its peers; this helps temper some of the volatility that comes with this sector. And the fund’s exceptionally low expenses help investors keep more of the fund’s return.
A broadly diversified portfolio is always a good option
In recent years, investors have been involuntary passengers on the market’s wild ride. And while returns have been much brighter lately, we still can’t know what the future holds. However, one thing that we do know is that trying to predict when the market will rise or fall is a losing game.
The best way to deal with the market’s unpredictability is to create a long-term investment plan—one that includes a mix of stocks, bonds, and short-term investments that is appropriate for your goals and risk tolerance—and then stick with that plan, regardless of market conditions.
6
Vanguard Precious Metals and Mining Fund can play a minor role in such a well-balanced portfolio, providing exposure to precious metals and mining stocks in regions around the world. The fund’s highly concentrated focus on a narrow segment of the market can mean big risks and volatility, but the potential ups and downs loom much less large when the fund is used as a small component in a well-diversified portfolio.
As always, thank you for entrusting your assets to Vanguard.
Sincerely,

F. William McNabb III
Chairman and Chief Executive Officer
February 9, 2011
7
Advisor’s Report
Vanguard Precious Metals and Mining Fund produced a strong absolute return of 35.35% for the 12 months ended January 31, 2011. However, this result lagged that of the fund’s customized benchmark index, which gained 43.00%, and the 41.56% average return of its precious metals fund peers.
The markets
The price of gold continued its long-term strength during the period under review. The price per ounce rose from $1,100 at the start of February 2010, breaking $1,400 for the first time ever in November 2010 before finishing the period at $1,337 per ounce. A number of factors contributed to this performance. Initially, as concerns mounted regarding the impact of the sovereign debt crisis in Europe, investors were drawn to the metal’s “safehaven” qualities. As these fears gave way to greater optimism about the health of the global economy, gold prices were buoyed by investors’ perception that the metal would act as a hedge against rising inflation. Increased gold investment activity from China and a rebound in jewelry consumption in India, the world’s largest jewelry market, also played a role. Rising costs of extraction and declining ore grades around the world added support from the supply side.
Outside of gold, healthy global economic growth, supply-side constraints, and robust demand—especially from emerging markets—for natural resources resulted in a strong period for metals and minerals with broader industrial uses, as well as for the companies that produce them. Silver, copper, and iron ore all approached or reached record highs during the period, while platinum and nickel also registered strong gains.
The fund’s performance
In terms of contributors to fund performance, our preference for mid- capitalization gold producers with significant exploration potential, rather than the large North American producers (where valuations are, in our view, less attractive), proved beneficial. Canadian- listed producers Centerra Gold (which owns high-quality gold assets in Central Asia and the former Soviet Union) and Nevsun Resources (attractively valued gold assets in Eritrea), and U.K.-listed Hochschild Mining (silver and gold assets across Latin America) were among the holdings that added the most value.
The fund’s gold weighting remains focused on value-creating businesses that are improving their operating efficiency and long-term profitability. Some, such as Centerra, have recently initiated a dividend, an encouraging development that reflects improving attitudes toward capital allocation in the gold industry.
8
Elsewhere, well-managed, high-quality Australian mineral sands producer Iluka Resources was a noteworthy positive contributor, boosted by extremely robust demand for zircon, which is used in a broad range of industrial and consumer-oriented applications. Long-term prices for the mineral should be supported by the paucity of new sources of supply.
Turning to detractors, one of the central factors in the fund’s underperformance relative to the benchmark was its exposure to platinum. The fund’s holdings in U.K.-listed platinum producer Lonmin and South African producer Impala Platinum were hurt by a number of political and operational challenges, the most prominent being rising production costs at Lonmin as a result of ongoing problems with one of its key furnaces. A number of the fund’s other holdings, including Australian metal recycler Sims Metal Management, French kaolin producer Imerys, and Singapore-listed commodities logistics business Noble Group, failed to keep up with the broader mining rally.
Purchases and sales
We reduced the fund’s significant exposure to South African-based producers of platinum by selling out of Anglo Platinum and Impala Platinum. We did this partly in light of increased uncertainty regarding the political and operational environment in South Africa. Elsewhere, we decided to take profits from some of those stocks that have performed particularly well for the portfolio, but where the investment rationale was no longer as compelling as it had been. With this in mind, we closed the fund’s positions in U.K.-listed platinum processor Johnson Matthey, U.S. specialty minerals producer Minerals Technologies, and U.S. coal producer Peabody Energy.
By contrast, we made significant investments in gold producers during the past year, with a focus on firms that are generating high returns and cash flows from producing assets and that also have developmental possibilities. To that end, we initiated and built up substantial positions in Canada-listed gold miners Semafo and Anatolia Minerals Development and added to existing holdings in the aforementioned Centerra Gold and Nevsun Resources.
We also added to our holdings in Australian iron ore producer Aquila Resources, a well-managed business with valuable iron ore assets that are well positioned to supply growing Asian demand, and German potash producer K+S, a strong beneficiary of rising global demand for fertilizer products that improve crop yields. Finally, we built up a large position in returns-focused Australian copper and gold producer OZ Minerals, a highly cash-generative business with a capable management team and significant—and underappreciated—development potential.
9
Looking ahead
We continue to believe that appetite for a broad range of commodities will be supported over many years by infrastructure expenditure worldwide, as well as by industrialization and rising urbanization in developing markets. We remain convinced of the merits of sticking to long-term principles and focusing on both structural supply/demand imbalances and company fundamentals. In light of ongoing uncertainty about the global economic outlook, we shall continue to invest in financially sound, well-managed companies with strategically important assets whose value, we believe, is not properly appreciated by investors. It is of great importance to us that a company’s long-term growth prospects are supported by its recognition of the value of a returns- focused approach.
Portfolio Managers:
Graham E. French
Matthew Vaight, UKSIP
M&G Investment Management Ltd.
February 23, 2011
10
Precious Metals and Mining Fund
Fund Profile
As of January 31, 2011
| | | |
| Portfolio Characteristics | | |
| | | S&P | |
| | | Precious | DJ |
| | | Metals and | U.S. Total |
| | | Mining | Market |
| | Fund | Index | Index |
| Number of Stocks | 48 | 336 | 3,858 |
| Median Market Cap | $3.5B | $28.2B | $30.9B |
| Price/Earnings Ratio | 39.1x | 22.7x | 17.7x |
| Price/Book Ratio | 2.6x | 2.7x | 2.3x |
| Return on Equity | 10.3% | 17.6% | 19.0% |
| Earnings Growth Rate | -5.7% | 8.2% | 6.0% |
| Dividend Yield | 0.8% | 1.0% | 1.7% |
| Foreign Holdings | 89.6% | 90.0% | 0.0% |
| Turnover Rate | 34% | — | — |
| Ticker Symbol | VGPMX | — | — |
| Expense Ratio1 | 0.27% | — | — |
| Short-Term Reserves | 1.3% | — | — |
| |
| |
| Market Diversification (% of equity exposure) |
| |
| Europe | | | |
| United Kingdom | | | 14.3% |
| France | | | 9.9 |
| Germany | | | 4.7 |
| Other | | | 0.5 |
| Subtotal | | | 29.4% |
| Pacific | | | |
| Australia | | | 27.3% |
| Singapore | | | 4.3 |
| Subtotal | | | 31.6% |
| Emerging Markets | | | |
| South Africa | | | 1.3% |
| Peru | | | 1.0 |
| Other | | | 0.8 |
| Subtotal | | | 3.1% |
| North America | | | |
| Canada | | | 26.9% |
| United States | | | 9.0 |
| Subtotal | | | 35.9% |
| | |
| Volatility Measures | | |
| | S&P | |
| | Precious | DJ |
| | Metals and | U.S. Total |
| | Mining | Market |
| | Index | Index |
| R-Squared | 0.92 | 0.61 |
| Beta | 1.05 | 1.48 |
| These measures show the degree and timing of the fund’s fluctuations compared with the indexes over 36 months. |
|
| |
| Ten Largest Holdings (% of total net assets) |
| Iluka Resources Ltd. | Diversified Metals | |
| | & Mining | 7.1% |
| Newmont Mining Corp. | Gold | 7.0 |
| Hochschild Mining plc | Precious Metals & |
| | Minerals | 6.3 |
| Centerra Gold Inc. | Gold | 5.7 |
| OZ Minerals Ltd. | Diversified Metals | |
| | & Mining | 5.5 |
| Imerys SA | Construction | |
| | Materials | 5.1 |
| Aquila Resources Ltd. | Coal & Consumable |
| | Fuels | 4.8 |
| Lonmin plc | Precious Metals & |
| | Minerals | 4.8 |
| Eramet | Diversified Metals | |
| | & Mining | 4.7 |
| K+S AG | Fertilizers & | |
| | Agricultural | |
| | Chemicals | 4.6 |
| Top Ten | | 55.6% |
| The holdings listed exclude any temporary cash investments and equity index products. |
Allocation by Region (% of equity exposure)
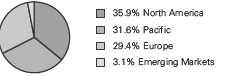
1 The expense ratio shown is from the prospectus dated May 28, 2010, and represents estimated costs for the current fiscal year. For the fiscal year ended January 31, 2011, the expense ratio was 0.27%.
11
Precious Metals and Mining Fund
Performance Summary
All of the returns in this report represent past performance, which is not a guarantee of future results that may be achieved by the fund. (Current performance may be lower or higher than the performance data cited. For performance data current to the most recent month-end, visit our website at vanguard.com/performance.) Note, too, that both investment returns and principal value can fluctuate widely, so an investor’s shares, when sold, could be worth more or less than their original cost. The returns shown do not reflect taxes that a shareholder would pay on fund distributions or on the sale of fund shares.
Cumulative Performance: January 31, 2001, Through January 31, 2011
Initial Investment of $10,000
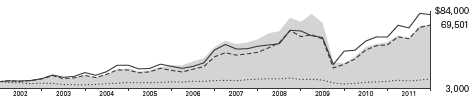
| | | | |
| | Average Annual Total Returns | |
| | Periods Ended January 31, 2011 | |
| | | | | Final Value |
| | One | Five | Ten | of a $10,000 |
| | Year | Years | Years | Investment |
| Precious Metals and Mining Fund | 35.35% | 8.57% | 21.39% | $69,501 |
| Dow Jones U.S. Total Stock Market | | | | |
| Index | 24.31 | 2.86 | 2.47 | 12,759 |
| Spliced Precious Metals and Mining | | | | |
| Index | 43.00 | 13.99 | 21.37 | 69,334 |
| Precious Metal Funds Average | 41.56 | 13.22 | 23.16 | 80,266 |
Spliced Precious Metals and Mining Index: S&P/Citigroup World Equity Gold Index through June 30, 2005; S&P Custom Precious Metals an Mining Index thereafter.
Precious Metal Funds Average: Derived from data provided by Lipper Inc.
Vanguard fund returns do not reflect the 1% fee on redemptions of shares held for less than one year.
See Financial Highlights for dividend and capital gains information.
12
Precious Metals and Mining Fund
Fiscal-Year Total Returns (%): January 31, 2001, Through January 31, 2011

Average Annual Total Returns: Periods Ended December 31, 2010
This table presents average annual total returns through the latest calendar quarter—rather than through the end of the fiscal period. Securities and Exchange Commission rules require that we provide this information.
| | | | |
| | Inception | One | Five | Ten |
| | Date | Year | Years | Years |
| Precious Metals and Mining Fund | 5/23/1984 | 37.45% | 14.29% | 22.53% |
Vanguard fund returns do not reflect the 1% fee on redemptions of shares held for less than one year.
13
Precious Metals and Mining Fund
Financial Statements
Statement of Net Assets
As of January 31, 2011
The fund reports a complete list of its holdings in regulatory filings four times in each fiscal year, at the quarter-ends. For the second and fourth fiscal quarters, the lists appear in the fund’s semiannual and annual reports to shareholders. For the first and third fiscal quarters, the fund files the lists with the Securities and Exchange Commission on Form N-Q. Shareholders can look up the fund’s Forms N-Q on the SEC’s website at sec.gov. Forms N-Q may also be reviewed and copied at the SEC’s Public Reference Room (see the back cover of this report for further information).
| | | |
| | | | Market |
| | | | Value• |
| | | Shares | ($000) |
| Common Stocks (98.4%) | | |
| Australia (26.9%) | | |
| *,1 | Iluka Resources Ltd. | 41,783,827 | 358,880 |
| 1 | OZ Minerals Ltd. | 166,000,000 | 275,736 |
| *,1 | Aquila Resources Ltd. | 26,302,267 | 241,802 |
| *,1 | St. Barbara Ltd. | 51,000,000 | 97,094 |
| 1 | Medusa Mining Ltd. | 13,550,000 | 92,107 |
| *,1 | Resolute Mining Ltd. | 51,965,029 | 69,127 |
| | Sims Metal | | |
| | Management Ltd. | 2,451,502 | 47,131 |
| 1 | Panoramic | | |
| | Resources Ltd. | 19,700,000 | 46,214 |
| *,1 | Cudeco Ltd. | 13,000,000 | 45,365 |
| * | Giralia Resources NL | 5,900,000 | 27,809 |
| | BHP Billiton Ltd. | 400,000 | 17,777 |
| *,1 | Equatorial | | |
| | Resources Ltd. | 5,000,000 | 16,927 |
| *,1 | Apex Minerals NL | 385,000,000 | 8,648 |
| * | Gindalbie Metals Ltd. | 4,000,000 | 5,359 |
| *,1 | Drummond Gold Ltd. | 25,000,000 | 2,002 |
| *,^ | Zambezi Resources Ltd. | 4,895,833 | 106 |
| * | MIL Resources Ltd. | 1,678,671 | 50 |
| | | | 1,352,134 |
| Belgium (0.4%) | | |
| | Umicore SA | 400,000 | 20,565 |
| |
| Canada (26.5%) | | |
| 1 | Centerra Gold Inc. | 18,000,000 | 288,870 |
| *,1 | Nevsun Resources Ltd. | 38,500,000 | 229,920 |
| *,1 | SEMAFO Inc. | 19,450,000 | 198,122 |
| 1 | Sherritt | | |
| | International Corp. | 19,475,000 | 169,982 |
| | Eldorado Gold Corp. | 8,350,000 | 134,170 |
| *,1 | Anatolia Minerals | | |
| | Development Ltd. | 19,300,000 | 127,401 |
| *,1 | Harry Winston | | |
| | Diamond Corp. | 9,750,000 | 105,450 |
| | | |
| | | | Market |
| | | | Value• |
| | | Shares | ($000) |
| *,^,1Minefinders Corp. | 5,800,000 | 56,202 |
| | Franco-Nevada Corp. | 250,000 | 6,948 |
| * | Bear Creek Mining Corp. | 750,000 | 6,217 |
| * | Claude Resources Inc. | 2,400,000 | 4,536 |
| * | Lake Shore Gold Corp. | 1,000,000 | 3,695 |
| | | | 1,331,513 |
| France (9.8%) | | |
| 1 | Imerys SA | 3,900,000 | 257,069 |
| | Eramet | 660,000 | 234,312 |
| | | | 491,381 |
| Germany (4.6%) | | |
| | K+S AG | 3,150,000 | 232,648 |
| |
| Indonesia (0.2%) | | |
| | International Nickel | | |
| | Indonesia Tbk PT | 17,500,000 | 8,900 |
| |
| Ireland (0.1%) | | |
| * | Kenmare Resources plc | 13,627,035 | 7,757 |
| |
| Papua New Guinea (0.1%) | | |
| * | Bougainville Copper Ltd. | 2,000,000 | 2,997 |
| |
| Peru (1.0%) | | |
| | Cia de Minas | | |
| | Buenaventura SA ADR | 1,200,000 | 49,200 |
| |
| Russia (0.5%) | | |
| * | Uralkali GDR | 650,000 | 24,636 |
| |
| Singapore (4.2%) | | |
| | Noble Group Ltd. | 124,180,353 | 213,044 |
| |
| South Africa (1.3%) | | |
| | Northam Platinum Ltd. | 11,000,000 | 65,809 |
14
Precious Metals and Mining Fund
| | | |
| | | | Market |
| | | | Value |
| | | Shares | ($000) |
| United Kingdom (14.0%) | | |
| 1 | Hochschild Mining plc | 40,500,000 | 315,318 |
| | Lonmin plc | 9,012,213 | 239,644 |
| | Petropavlovsk plc | 8,800,000 | 144,366 |
| | Vedanta Resources plc | 100,000 | 3,645 |
| * | Mwana Africa plc | 9,880,219 | 1,741 |
| * | Gemfields plc | 3,333,333 | 831 |
| | | | 705,545 |
| United States (8.8%) | | |
| | Newmont Mining Corp. | 6,400,000 | 352,448 |
| 1 | AMCOL | | |
| | International Corp. | 3,080,000 | 92,154 |
| | | | 444,602 |
| Total Common Stocks | | |
| (Cost $3,739,520) | | 4,950,731 |
| Precious Metals (0.1%) | | |
| * | Platinum Bullion | | |
| | (In Troy Ounces) | 2,009 | 3,594 |
| Total Precious Metals | | |
| (Cost $1,213) | | 3,594 |
| Temporary Cash Investment (1.4%) | |
| Money Market Fund (1.4%) | | |
| 2,3 | Vanguard Market | | |
| | Liquidity Fund, 0.207% | | |
| | (Cost $69,867) | 69,866,815 | 69,867 |
| Total Investments (99.9%) | | |
| (Cost $3,810,600) | | 5,024,192 |
| Other Assets and Liabilities (0.1%) | |
| Other Assets | | 39,512 |
| Liabilities3 | | (33,620) |
| | | | 5,892 |
| Net Assets (100%) | | |
| Applicable to 208,266,640 outstanding | |
| $.001 par value shares of beneficial | |
| interest (unlimited authorization) | 5,030,084 |
| Net Asset Value Per Share | | $24.15 |
| |
| | Market |
| | Value |
| | ($000) |
| Statement of Assets and Liabilities | |
| Assets | |
| Investments in Securities, at Value | 5,024,192 |
| Receivables for Investment | |
| Securities Sold | 30,578 |
| Receivables for Capital Shares Issued | 6,195 |
| Other Assets | 2,739 |
| Total Assets | 5,063,704 |
| Liabilities | |
| Payables for Capital Shares Redeemed | 17,323 |
| Security Lending Collateral Payable | |
| to Brokers | 4,022 |
| Other Liabilities | 12,275 |
| Total Liabilities | 33,620 |
| Net Assets | 5,030,084 |
| |
| |
| At January 31, 2011, net assets consisted of: |
| | Amount |
| | ($000) |
| Paid-in Capital | 4,072,704 |
| Overdistributed Net Investment Income | (227,207) |
| Accumulated Net Realized Losses | (29,139) |
| Unrealized Appreciation (Depreciation) | |
| Investment Securities | 1,213,592 |
| Foreign Currencies | 134 |
| Net Assets | 5,030,084 |
See Note A in Notes to Financial Statements.
* Non-income-producing security.
^ Part of security position is on loan to broker-dealers. The total value of securities on loan is $1,243,000.
1 Considered an affiliated company of the fund as the fund owns more than 5% of the outstanding voting securities of such company.
2 Affiliated money market fund available only to Vanguard funds and certain trusts and accounts managed by Vanguard. Rate shown is the 7-day yield.
3 Includes $4,022,000 of collateral received for securities on loan.
ADR—American Depositary Receipt.
GDR—Global Depositary Receipt.
See accompanying Notes, which are an integral part of the Financial Statements.
15
Precious Metals and Mining Fund
Statement of Operations
| |
| | Year Ended |
| | January 31, 2011 |
| | ($000) |
| Investment Income | |
| Income | |
| Dividends1,2 | 37,135 |
| Interest2 | 309 |
| Security Lending | 1,190 |
| Total Income | 38,634 |
| Expenses | |
| Investment Advisory Fees—Note B | |
| Basic Fee | 5,341 |
| Performance Adjustment | (2,306) |
| The Vanguard Group—Note C | |
| Management and Administrative | 7,380 |
| Marketing and Distribution | 940 |
| Custodian Fees | 366 |
| Auditing Fees | 24 |
| Shareholders’ Reports | 63 |
| Trustees’ Fees and Expenses | 6 |
| Total Expenses | 11,814 |
| Net Investment Income | 26,820 |
| Realized Net Gain (Loss) | |
| Investment Securities Sold2 | 138,035 |
| Foreign Currencies | 52 |
| Realized Net Gain (Loss) | 138,087 |
| Change in Unrealized Appreciation (Depreciation) | |
| Investment Securities | 1,088,614 |
| Foreign Currencies | 669 |
| Change in Unrealized Appreciation (Depreciation) | 1,089,283 |
| Net Increase (Decrease) in Net Assets Resulting from Operations | 1,254,190 |
1 Dividends are net of foreign withholding taxes of $709,000.
2 Dividend income, interest income, and realized net gain (loss) from affiliated companies of the fund were $22,989,000, $309,000, and ($146,110,000), respectively.
See accompanying Notes, which are an integral part of the Financial Statements.
16
Precious Metals and Mining Fund
Statement of Changes in Net Assets
| | |
| | Year Ended January 31, |
| | 2011 | 2010 |
| | ($000) | ($000) |
| Increase (Decrease) in Net Assets | | |
| Operations | | |
| Net Investment Income | 26,820 | 17,349 |
| Realized Net Gain (Loss) | 138,087 | (61,858) |
| Change in Unrealized Appreciation (Depreciation) | 1,089,283 | 1,391,219 |
| Net Increase (Decrease) in Net Assets Resulting from Operations | 1,254,190 | 1,346,710 |
| Distributions | | |
| Net Investment Income | (221,507) | (53,316) |
| Realized Capital Gain | (38,436) | — |
| Total Distributions | (259,943) | (53,316) |
| Capital Share Transactions | | |
| Issued | 1,200,221 | 1,369,003 |
| Issued in Lieu of Cash Distributions | 239,830 | 48,944 |
| Redeemed1 | (1,088,329) | (671,175) |
| Net Increase (Decrease) from Capital Share Transactions | 351,722 | 746,772 |
| Total Increase (Decrease) | 1,345,969 | 2,040,166 |
| Net Assets | | |
| Beginning of Period | 3,684,115 | 1,643,949 |
| End of Period2 | 5,030,084 | 3,684,115 |
1 Net of redemption fees for fiscal 2011 and 2010 of $2,999,000 and $2,627,000, respectively.
2 Net Assets—End of Period includes undistributed (overdistributed) net investment income of ($227,207,000) and ($53,960,000).
See accompanying Notes, which are an integral part of the Financial Statements.
17
Precious Metals and Mining Fund
Financial Highlights
| | | | | |
| For a Share Outstanding | | | Year Ended January 31, |
| Throughout Each Period | 2011 | 2010 | 2009 | 2008 | 2007 |
| Net Asset Value, Beginning of Period | $18.74 | $10.74 | $33.45 | $28.64 | $27.08 |
| Investment Operations | | | | | |
| Net Investment Income | .181 | .0931 | .653 | .9001 | .560 |
| Net Realized and Unrealized Gain (Loss) | | | | | |
| on Investments2 | 6.521 | 8.207 | (19.849) | 8.362 | 4.027 |
| Total from Investment Operations | 6.702 | 8.300 | (19.196) | 9.262 | 4.587 |
| Distributions | | | | | |
| Dividends from Net Investment Income | (1.101) | (.300) | (.763) | (.670) | (.490) |
| Distributions from Realized Capital Gains | (.191) | — | (2.751) | (3.782) | (2.537) |
| Total Distributions | (1.292) | (.300) | (3.514) | (4.452) | (3.027) |
| Net Asset Value, End of Period | $24.15 | $18.74 | $10.74 | $33.45 | $28.64 |
| |
| Total Return3 | 35.35% | 77.75% | -60.16% | 33.97% | 17.48% |
| |
| Ratios/Supplemental Data | | | | | |
| Net Assets, End of Period (Millions) | $5,030 | $3,684 | $1,644 | $4,635 | $3,444 |
| Ratio of Total Expenses to | | | | | |
| Average Net Assets4 | 0.27% | 0.27% | 0.30% | 0.28% | 0.35% |
| Ratio of Net Investment Income to | | | | | |
| Average Net Assets | 0.61% | 0.59%1 | 2.17% | 2.70%1 | 1.88% |
| Portfolio Turnover Rate | 34% | 17% | 22% | 29% | 24% |
1 Net investment income per share and the ratio of net investment income to average net assets for the year ended January 31, 2008, include $.190 and 0.65%, respectively, resulting from a special dividend from Centennial Coal Co. Ltd. in January 2008. Based on additional information reported by the company in 2009, a portion of the special dividend was reallocated to return of capital. The reallocation reduced net investment income per share and the ratio of net investment income to average net assets for the year ended January 31, 2010, by $.134 and 0.90% respectively. The reallocation has no impact on net assets, net asset values per share, or total returns.
2 Includes increases from redemption fees of $.01, $.01, $.01, $.01, and $.03.
3 Total returns do not include transaction or account service fees that may have applied in the periods shown. Fund prospectuses provide information about any applicable transaction and account service fees.
4 Includes performance-based investment advisory fee increases (decreases) of (0.05%), (0.08%), 0.00%, (0.01%), and 0.01%.
See accompanying Notes, which are an integral part of the Financial Statements.
18
Precious Metals and Mining Fund
Notes to Financial Statements
Vanguard Precious Metals and Mining Fund is registered under the Investment Company Act of 1940 as an open-end investment company, or mutual fund. The fund invests in securities of foreign issuers, which may subject it to investment risks not normally associated with investing in securities of United States corporations.
A. The following significant accounting policies conform to generally accepted accounting principles for U.S. mutual funds. The fund consistently follows such policies in preparing its financial statements.
1. Security Valuation: Securities are valued as of the close of trading on the New York Stock Exchange (generally 4 p.m., Eastern time) on the valuation date. Equity securities are valued at the latest quoted sales prices or official closing prices taken from the primary market in which each security trades; such securities not traded on the valuation date are valued at the mean of the latest quoted bid and asked prices. Securities for which market quotations are not readily available, or whose values have been affected by events occurring before the fund’s pricing time but after the close of the securities’ primary markets, are valued at their fair values calculated according to procedures adopted by the board of trustees. These procedures include obtaining quotations from an independent pricing service, monitoring news to identify significant market- or security-specific events, and evaluating changes in the values of foreign market proxies (for example, ADRs, futures contracts, or exchange-traded funds), between the time the foreign markets close and the fund’s pricing time. When fair-value pricing is employed, the prices of securities used by a fund to calculate its net asset value may differ from quoted or published prices for the same securities. Precious metals are valued at the mean of the latest quoted bid and asked prices. Investments in Vanguard Market Liquidity Fund are valued at that fund’s net asset value.
2. Foreign Currency: Securities and other assets and liabilities denominated in foreign currencies are translated into U.S. dollars using exchange rates obtained from an independent third party as of the fund’s pricing time on the valuation date. Realized gains (losses) and unrealized appreciation (depreciation) on investment securities include the effects of changes in exchange rates since the securities were purchased, combined with the effects of changes in security prices. Fluctuations in the value of other assets and liabilities resulting from changes in exchange rates are recorded as unrealized foreign currency gains (losses) until the assets or liabilities are settled in cash, at which time they are recorded as realized foreign currency gains (losses).
3. Federal Income Taxes: The fund intends to continue to qualify as a regulated investment company and distribute all of its taxable income. Management has analyzed the fund’s tax positions taken for all open federal income tax years (January 31, 2008–2011), and has concluded that no provision for federal income tax is required in the fund’s financial statements.
4. Distributions: Distributions to shareholders are recorded on the ex-dividend date.
5. Security Lending: The fund may lend its securities to qualified institutional borrowers to earn additional income. Security loans are required to be secured at all times by collateral at least equal to the market value of securities loaned. The fund invests cash collateral received in Vanguard Market Liquidity Fund, and records a liability for the return of the collateral, during the period the securities are on loan. Security lending income represents fees charged to borrowers plus income earned on investing cash collateral, less expenses associated with the loan.
19
Precious Metals and Mining Fund
6. Other: Dividend income is recorded on the ex-dividend date. Interest income includes income distributions received from Vanguard Market Liquidity Fund and is accrued daily. Security transactions are accounted for on the date securities are bought or sold. Costs used to determine realized gains (losses) on the sale of investment securities are those of the specific securities sold. Fees assessed on redemptions of capital shares are credited to paid-in capital.
B. M&G Investment Management Ltd. provides investment advisory services to the fund for a fee calculated at an annual percentage rate of average net assets. The basic fee is subject to quarterly adjustments based on the fund’s performance for the preceding three years relative to the S&P Custom Precious Metals and Mining Index. For the year ended January 31, 2011, the investment advisory fee represented an effective annual basic rate of 0.12% of the fund’s average net assets before a decrease of $2,306,000 (0.05%) based on performance.
C. The Vanguard Group furnishes at cost corporate management, administrative, marketing, and distribution services. The costs of such services are allocated to the fund under methods approved by the board of trustees. The fund has committed to provide up to 0.40% of its net assets in capital contributions to Vanguard. At January 31, 2011, the fund had contributed capital of $961,000 to Vanguard (included in Other Assets), representing 0.02% of the fund’s net assets and 0.38% of Vanguard’s capitalization. The fund’s trustees and officers are also directors and officers of Vanguard.
D. Various inputs may be used to determine the value of the fund’s investments. These inputs are summarized in three broad levels for financial statement purposes. The inputs or methodologies used to value securities are not necessarily an indication of the risk associated with investing in those securities.
Level 1—Quoted prices in active markets for identical securities.
Level 2—Other significant observable inputs (including quoted prices for similar securities, interest rates, prepayment speeds, credit risk, etc.).
Level 3—Significant unobservable inputs (including the fund’s own assumptions used to determine the fair value of investments).
The following table summarizes the fund’s investments as of January 31, 2011, based on the inputs used to value them:
| | | |
| | Level 1 | Level 2 | Level 3 |
| Investments | ($000) | ($000) | ($000) |
| Common Stocks—North America | 1,776,115 | — | — |
| Common Stocks—Other | 49,200 | 3,125,416 | — |
| Precious Metals | 3,594 | — | — |
| Temporary Cash Investments | 69,867 | — | — |
| Total | 1,898,776 | 3,125,416 | — |
20
Precious Metals and Mining Fund
The following table summarizes changes in investments valued based on Level 3 inputs during the year ended January 31, 2011:
| |
| | Investments in |
| | Common Stocks |
| Amount Valued Based on Level 3 Inputs | ($000) |
| Balance as of January 31, 2010 | 98 |
| Total Purchases | 54,978 |
| Transfers out of Level 3 | (92,687) |
| Change in Unrealized Appreciation (Depreciation) | 37,611 |
| Balance as of January 31, 2011 | — |
E. Distributions are determined on a tax basis and may differ from net investment income and realized capital gains for financial reporting purposes. Differences may be permanent or temporary. Permanent differences are reclassified among capital accounts in the financial statements to reflect their tax character. Temporary differences arise when certain items of income, expense, gain, or loss are recognized in different periods for financial statement and tax purposes; these differences will reverse at some time in the future. Differences in classification may also result from the treatment of short-term gains as ordinary income for tax purposes.
During the year ended January 31, 2011, the fund realized net foreign currency gains of $52,000, which increased distributable net income for tax purposes; accordingly, such gains have been reclassified from accumulated net realized losses to overdistributed net investment income.
Certain of the fund’s investments are in securities considered to be “passive foreign investment companies,” for which any unrealized appreciation and/or realized gains are required to be included in distributable net income for tax purposes. During the year ended January 31, 2011, the fund realized gains on the sale of passive foreign investment companies of $22,937,000, which have been included in current and prior periods’ taxable income; accordingly, such gains have been reclassified from accumulated net realized losses to overdistributed net investment income. Unrealized appreciation of $244,271,000 on the fund’s passive foreign investment company holdings through October 31, 2010 (the most recent previous mark-to-market date for tax purposes), has been distributed and is reflected in the balance of overdistributed net investment income. Since October 31, 2010, unrealized appreciation on passive foreign investment company holdings decreased by $13,190,000, decreasing the amount of taxable income available for distribution as of January 31, 2011. Unrealized appreciation on the fund’s passive foreign investment company holdings at January 31, 2011, was $231,081,000.
The fund used a tax accounting practice to treat a portion of the price of capital shares redeemed during the year as distributions from net investment income and realized capital gains. Accordingly, the fund has reclassified $1,549,000 from overdistributed net investment income, and $322,000 from accumulated net realized losses, to paid-in capital.
21
Precious Metals and Mining Fund
During 2001, the fund elected to use a provision of the Taxpayer Relief Act of 1997 to mark-to-market certain appreciated securities held on January 1, 2001; such securities were treated as sold and repurchased, with unrealized gains of $46,006,000 becoming realized, for tax purposes. The mark-to-market created a difference between the cost of investments for financial statement and tax purposes, which will reverse when the securities are sold. Through January 31, 2010, the fund realized gains on the sale of these securities of $20,516,000 for financial statement purposes, which were included in prior year mark-to-market gains for tax purposes. During the year ended January 31, 2011, the remaining marked-to-market securities were sold; as a result the remaining $25,490,000 difference between financial statement and tax-basis realized and unrealized gains and losses reversed during the current year.
For tax purposes, at January 31, 2011, the fund had $11,019,000 of ordinary income available for distribution. The fund used a capital loss carryforward of $52,818,000 to offset taxable capital gains realized during the year ended January 31, 2011, reducing the amount of capital gains that would otherwise be available to distribute to shareholders. Capital gains required to be distributed in December 2010 included net gains realized through October 31, 2010. The fund realized losses of $29,139,000 during the period from November 1, 2010, through January 31, 2011, which are deferred and will be treated as realized for tax purposes in fiscal 2012.
At January 31, 2011, the cost of investment securities for tax purposes was $4,041,681,000.
Net unrealized appreciation of investment securities for tax purposes was $982,511,000, consisting of unrealized gains of $1,236,760,000 on securities that had risen in value since their purchase and $254,249,000 in unrealized losses on securities that had fallen in value since their purchase or since being marked to market for tax purposes.
F. During the year ended January 31, 2011, the fund purchased $1,640,151,000 of investment securities and sold $1,411,016,000 of investment securities, other than temporary cash investments.
G. Capital shares issued and redeemed were:
| | |
| | Year Ended January 31, |
| | 2011 | 2010 |
| | Shares | Shares |
| | (000) | (000) |
| Issued | 51,798 | 81,521 |
| Issued in Lieu of Cash Distributions | 9,325 | 2,952 |
| Redeemed | (49,471) | (40,946) |
| Net Increase (Decrease) in Shares Outstanding | 11,652 | 43,527 |
22
Precious Metals and Mining Fund
H. Certain of the fund’s investments are in companies that are considered to be affiliated companies of the fund because the fund owns more than 5% of the outstanding voting securities of the company. Transactions during the period in securities of these companies were as follows:
| | | | | |
| | | | Current Period Transactions | |
| Jan. 31, 2010 | | Proceeds from | | Jan. 31, 2011 |
| | Market | Purchases | Securities | Dividend | Market |
| | Value | at Cost | Sold | Income | Value |
| | ($000) | ($000) | ($000) | ($000) | ($000) |
| AMCOL International Corp. | 76,144 | 1,485 | — | 2,182 | 92,154 |
| Anatolia Minerals Development Ltd. | NA1 | 98,336 | — | — | 127,401 |
| Apex Minerals NL | 7,085 | 2,288 | — | — | 8,648 |
| Aquila Resources Ltd. | NA1 | 137,355 | — | — | 241,802 |
| Centerra Gold Inc. | 162,058 | 24,220 | — | 885 | 288,870 |
| Cudeco Ltd. | NA1 | 35,811 | — | — | 45,365 |
| Drummond Gold Ltd | NA1 | 2,835 | — | — | 2,002 |
| Equatorial Resources Ltd. | NA1 | 9,242 | — | — | 16,927 |
| Harry Winston Diamond Corp. | 83,200 | 7,015 | — | — | 105,450 |
| Hochschild Mining plc | 135,378 | 42,231 | — | 1,430 | 315,318 |
| Iluka Resources Ltd. | 121,198 | — | — | — | 358,880 |
| Imerys SA | 224,312 | — | 9,560 | 4,373 | 257,069 |
| Johnson Matthey plc | 262,966 | — | 273,075 | 2,741 | — |
| Lonmin PLC | 297,263 | — | 33,229 | 1,566 | NA2 |
| Medusa Mining Ltd. | NA1 | 76,511 | — | 172 | 92,107 |
| Minefinders Corp. | NA1 | 46,308 | — | — | 56,202 |
| Nevsun Resources Ltd. | 24,924 | 54,978 | — | — | 229,920 |
| OZ Minerals Ltd. | NA1 | 203,511 | — | 3,175 | 275,736 |
| Panoramic Resources Ltd. | 31,730 | — | — | 3,010 | 46,214 |
| Petropavlovsk plc | 131,813 | 61,010 | 54,598 | 1,026 | NA2 |
| Resolute Mining Ltd. | 32,015 | 15,510 | — | — | 69,127 |
| SEMAFO Inc. | NA1 | 139,683 | — | — | 198,122 |
| Sherritt International Corp. | 98,625 | 18,150 | — | 2,429 | 169,982 |
| St. Barbara Ltd. | 39,500 | 35,955 | — | — | 97,094 |
| | 1,728,211 | | | 22,989 | 3,094,390 |
1 Not applicable—At January 31, 2010, the issuer was not an affiliated company of the fund.
2 Not applicable—At January 31, 2011, the security was still held, but the issuer was no longer an affiliated company of the fund.
I. In preparing the financial statements as of January 31, 2011, management considered the impact of subsequent events for potential recognition or disclosure in these financial statements.
23
Report of Independent Registered
Public Accounting Firm
To the Trustees of Vanguard Specialized Funds and the Shareholders of Vanguard Precious Metals and Mining Fund: In our opinion, the accompanying statement of net assets and of assets and liabilities and the related statements of operations and of changes in net assets and the financial highlights present fairly, in all material respects, the financial position of Vanguard Precious Metals and Mining Fund (constituting a separate portfolio of Vanguard Specialized Funds, hereafter referred to as the “Fund”) at January 31, 2011, the results of its operations for the year then ended, the changes in its net assets for each of the two years in the period then ended and the financial highlights for each of five years in the period then ended, in conformity with accounting principles generally accepted in the United States of America. These financial statements and financial highlights (hereafter referred to as “financial statements”) are the responsibility of the Fund’s management; our responsibility is to express an opinion on these financial statements based on our audits. We conducted our audits of these financial statements in accordance with the standards of the Public Company Accounting Oversight Board (United States). Those standards require that we plan and perform the audit to obtain reasonable assurance about whether the financial statements are free of material misstatement. An audit includes examining, on a test basis, evidence supporting the amounts and disclosures in the financial statements, assessing the accounting principles used and significant estimates made by management, and evaluating the overall financial statement presentation. We believe that our audits, which included confirmation of securities at January 31, 2011 by correspondence with the custodian and by agreement to the underlying ownership records of Vanguard Market Liquidity Fund, provide a reasonable basis for our opinion.
PricewaterhouseCoopers LLP
Philadelphia, Pennsylvania
March 11, 2011
|
| Special 2010 tax information (unaudited) for Vanguard Precious Metals and Mining Fund |
This information for the fiscal year ended January 31, 2011, is included pursuant to provisions of the Internal Revenue Code.
The fund distributed $38,773,000 as capital gain dividends (from net long-term capital gains) to shareholders during the fiscal year.
The fund distributed $26,160,000 of qualified dividend income to shareholders during the fiscal year.
For corporate shareholders, 2.3% of investment income (dividend income plus short-term gains, if any) qualifies for the dividends-received deduction.
The fund designates to shareholders foreign source income of $26,296,000 and foreign taxes paid of $709,000. Shareholders received more detailed information with their Form 1099-DIV in January 2011 to determine the calendar-year amounts to be included on their 2010 tax returns.
24
Your Fund’s After-Tax Returns
This table presents returns for your fund both before and after taxes. The after-tax returns are shown in two ways: (1) assuming that an investor owned the fund during the entire period and paid taxes on the fund’s distributions, and (2) assuming that an investor paid taxes on the fund’s distributions and sold all shares at the end of each period.
Calculations are based on the highest individual federal income tax and capital gains tax rates in effect at the times of the distributions and the hypothetical sales. State and local taxes were not considered. After-tax returns reflect any qualified dividend income , using actual prior-year figures and estimates for 2011. (In the example, returns after the sale of fund shares may be higher than those assuming no sale. This occurs when the sale would have produced a capital loss. The calculation assumes that the investor received a tax deduction for the loss.) Please note that your actual after-tax returns will depend on your tax situation and may differ from those shown. Also note that if you own the fund in a tax-deferred account, such as an individual retirement account or a 401(k) plan, this information does not apply to you. Such accounts are not subject to current taxes.
Finally, keep in mind that a fund’s performance—whether before or after taxes—does not guarantee future results.
Average Annual Total Returns: Precious Metals and Mining Fund
Periods Ended January 31, 2011
| | | |
| | One | Five | Ten |
| | Year | Years | Years |
| Returns Before Taxes | 35.35% | 8.57% | 21.39% |
| Returns After Taxes on Distributions | 33.43 | 6.59 | 19.46 |
| Returns After Taxes on Distributions and Sale of Fund Shares | 23.43 | 6.74 | 18.64 |
Returns do not reflect the 1% fee on redemptions of shares held for less than one year.
25
About Your Fund’s Expenses
As a shareholder of the fund, you incur ongoing costs, which include costs for portfolio management, administrative services, and shareholder reports (like this one), among others. Operating expenses, which are deducted from a fund’s gross income, directly reduce the investment return of the fund.
A fund’s expenses are expressed as a percentage of its average net assets. This figure is known as the expense ratio. The following examples are intended to help you understand the ongoing costs (in dollars) of investing in your fund and to compare these costs with those of other mutual funds. The examples are based on an investment of $1,000 made at the beginning of the period shown and held for the entire period.
The accompanying table illustrates your fund’s costs in two ways:
• Based on actual fund return. This section helps you to estimate the actual expenses that you paid over the period. The ”Ending Account Value“ shown is derived from the fund‘s actual return, and the third column shows the dollar amount that would have been paid by an investor who started with $1,000 in the fund. You may use the information here, together with the amount you invested, to estimate the expenses that you paid over the period.
To do so, simply divide your account value by $1,000 (for example, an $8,600 account value divided by $1,000 = 8.6), then multiply the result by the number given for your fund under the heading ”Expenses Paid During Period.“
• Based on hypothetical 5% yearly return. This section is intended to help you compare your fund‘s costs with those of other mutual funds. It assumes that the fund had a yearly return of 5% before expenses, but that the expense ratio is unchanged. In this case—because the return used is not the fund’s actual return—the results do not apply to your investment. The example is useful in making comparisons because the Securities and Exchange Commission requires all mutual funds to calculate expenses based on a 5% return. You can assess your fund’s costs by comparing this hypothetical example with the hypothetical examples that appear in shareholder reports of other funds.
Note that the expenses shown in the table are meant to highlight and help you compare ongoing costs only and do not reflect transaction costs incurred by the fund for buying and selling securities. Further, the expenses do not include the 1% fee on redemptions of shares held for less than one year, nor do they include the account service fee described in the prospectus. If such fees were applied to your account, your costs would be higher. Your fund does not carry a “sales load.” The calculations assume no shares were bought or sold during the period. Your actual costs may have been higher or lower, depending on the amount of your investment and the timing of any purchases or redemptions.
You can find more information about the fund’s expenses, including annual expense ratios, in the Financial Statements section of this report. For additional information on operating expenses and other shareholder costs, please refer to your fund’s current prospectus.
26
Six Months Ended January 31, 2011
| | | |
| | Beginning | Ending | Expenses |
| | Account Value | Account Value | Paid During |
| Precious Metals and Mining Fund | 7/31/2010 | 1/31/2011 | Period |
| Based on Actual Fund Return | $1,000.00 | $1,263.73 | $1.54 |
| Based on Hypothetical 5% Yearly Return | 1,000.00 | 1,023.84 | 1.38 |
The calculations are based on expenses incurred in the most recent six-month period. The fund’s annualized six-month expense ratio for that period is 0.27%. The dollar amounts shown as “Expenses Paid” are equal to the annualized expense ratio multiplied by the average account value over the period, multiplied by the number of days in the most recent six-month period, then divided by the number of days in the most recent 12-month period.
27
Glossary
Beta. A measure of the magnitude of a fund’s past share-price fluctuations in relation to the ups and downs of a given market index. The index is assigned a beta of 1.00. Compared with a given index, a fund with a beta of 1.20 typically would have seen its share price rise or fall by 12% when the index rose or fell by 10%. For this report, beta is based on returns over the past 36 months for both the fund and the index. Note that a fund’s beta should be reviewed in conjunction with its R-squared (see definition). The lower the R-squared, the less correlation there is between the fund and the index, and the less reliable beta is as an indicator of volatility.
Dividend Yield. Dividend income earned by stocks, expressed as a percentage of the aggregate market value (or of net asset value, for a fund). The yield is determined by dividing the amount of the annual dividends by the aggregate value (or net asset value) at the end of the period. For a fund, the dividend yield is based solely on stock holdings and does not include any income produced by other investments.
Earnings Growth Rate. The average annual rate of growth in earnings over the past five years for the stocks now in a fund.
Equity Exposure. A measure that reflects a fund’s investments in stocks and stock futures. Any holdings in short-term reserves are excluded.
Expense Ratio. The percentage of a fund’s average net assets used to pay its annual administrative and advisory expenses. These expenses directly reduce returns to investors.
Foreign Holdings. The percentage of a fund represented by stocks or depositary receipts of companies based outside the United States.
Inception Date. The date on which the assets of a fund (or one of its share classes) are first invested in accordance with the fund’s investment objective. For funds with a subscription period, the inception date is the day after that period ends. Investment performance is measured from the inception date.
Median Market Cap. An indicator of the size of companies in which a fund invests; the midpoint of market capitalization (market price x shares outstanding) of a fund’s stocks, weighted by the proportion of the fund’s assets invested in each stock. Stocks representing half of the fund’s assets have market capitalizations above the median, and the rest are below it.
Price/Book Ratio. The share price of a stock divided by its net worth, or book value, per share. For a fund, the weighted average price/book ratio of the stocks it holds.
R-Squared. A measure of how much of a fund’s past returns can be explained by the returns from the market in general, as measured by a given index. If a fund’s total returns were precisely synchronized with an index’s returns, its R-squared would be 1.00. If the fund’s returns bore no relationship to the index’s returns, its R-squared would be 0. For this report, R-squared is based on returns over the past 36 months for both the fund and the index.
Return on Equity. The annual average rate of return generated by a company during the past five years for each dollar of shareholder’s equity (net income divided by shareholder’s equity). For a fund, the weighted average return on equity for the companies whose stocks it holds.
28
Short-Term Reserves. The percentage of a fund invested in highly liquid, short-term securities that can be readily converted to cash.
Turnover Rate. An indication of the fund’s trading activity. Funds with high turnover rates incur higher transaction costs and may be more likely to distribute capital gains (which may be taxable to investors). The turnover rate excludes in-kind transactions, which have minimal impact on costs.
29
This page intentionally left blank.
This page intentionally left blank.
The People Who Govern Your Fund
The trustees of your mutual fund are there to see that the fund is operated and managed in your best interests since, as a shareholder, you are a part owner of the fund. Your fund’s trustees also serve on the board of directors of The Vanguard Group, Inc., which is owned by the Vanguard funds and provides services to them on an at-cost basis.
A majority of Vanguard’s board members are independent, meaning that they have no affiliation with Vanguard or the funds they oversee, apart from the sizable personal investments they have made as private individuals. The independent board members have distinguished backgrounds in business, academia, and public service. Each of the trustees and executive officers oversees 179 Vanguard funds.
The following table provides information for each trustee and executive officer of the fund. More information about the trustees is in the Statement of Additional Information, which can be obtained, without charge, by contacting Vanguard at 800-662-7447, or online at vanguard.com.
| |
| Interested Trustee1 | and President (2006–2008) of Rohm and Haas Co. |
| | (chemicals); Director of Tyco International, Ltd. |
| F. William McNabb III | (diversified manufacturing and services) and Hewlett- |
| Born 1957. Trustee Since July 2009. Chairman of the | Packard Co. (electronic computer manufacturing); |
| Board. Principal Occupation(s) During the Past Five | Senior Advisor at New Mountain Capital; Trustee |
| Years: Chairman of the Board of The Vanguard Group, | of The Conference Board; Member of the Board of |
| Inc., and of each of the investment companies served | Managers of Delphi Automotive LLP (automotive |
| by The Vanguard Group, since January 2010; Director | components). |
| of The Vanguard Group since 2008; Chief Executive | |
| Officer and President of The Vanguard Group and of | Amy Gutmann |
| each of the investment companies served by The | Born 1949. Trustee Since June 2006. Principal |
| Vanguard Group since 2008; Director of Vanguard | Occupation(s) During the Past Five Years: President |
| Marketing Corporation; Managing Director of The | of the University of Pennsylvania; Christopher H. |
| Vanguard Group (1995–2008). | Browne Distinguished Professor of Political Science |
| | in the School of Arts and Sciences with secondary |
| | appointments at the Annenberg School for Commu- |
| Independent Trustees | nication and the Graduate School of Education |
| | of the University of Pennsylvania; Director of |
| Emerson U. Fullwood | Carnegie Corporation of New York, Schuylkill River |
| Born 1948. Trustee Since January 2008. Principal | Development Corporation, and Greater Philadelphia |
| Occupation(s) During the Past Five Years: Executive | Chamber of Commerce; Trustee of the National |
| Chief Staff and Marketing Officer for North America | Constitution Center; Chair of the Presidential |
| and Corporate Vice President (retired 2008) of Xerox | Commission for the Study of Bioethical Issues. |
| Corporation (document management products and | |
| services); Executive in Residence and 2010 | JoAnn Heffernan Heisen |
| Distinguished Minett Professor at the Rochester | Born 1950. Trustee Since July 1998. Principal |
| Institute of Technology; Director of SPX Corporation | Occupation(s) During the Past Five Years: Corporate |
| (multi-industry manufacturing), the United Way of | Vice President and Chief Global Diversity Officer |
| Rochester, Amerigroup Corporation (managed health | (retired 2008) and Member of the Executive |
| care), the University of Rochester Medical Center, | Committee (1997–2008) of Johnson & Johnson |
| Monroe Community College Foundation, and North | (pharmaceuticals/consumer products); Director of |
| Carolina A&T University. | Skytop Lodge Corporation (hotels), the University |
| | Medical Center at Princeton, the Robert Wood |
| Rajiv L. Gupta | Johnson Foundation, and the Center for Work Life |
| Born 1945. Trustee Since December 2001.2 | Policy; Member of the Advisory Board of the |
| Principal Occupation(s) During the Past Five Years: | Maxwell School of Citizenship and Public Affairs |
| Chairman and Chief Executive Officer (retired 2009) | at Syracuse University. |
| | |
| F. Joseph Loughrey | Thomas J. Higgins | |
| Born 1949. Trustee Since October 2009. Principal | Born 1957. Chief Financial Officer Since September |
| Occupation(s) During the Past Five Years: President | 2008. Principal Occupation(s) During the Past Five |
| and Chief Operating Officer (retired 2009) and Vice | Years: Principal of The Vanguard Group, Inc.; Chief |
| Chairman of the Board (2008–2009) of Cummins Inc. | Financial Officer of each of the investment companies |
| (industrial machinery); Director of SKF AB (industrial | served by The Vanguard Group since 2008; Treasurer |
| machinery), Hillenbrand, Inc. (specialized consumer | of each of the investment companies served by The |
| services), the Lumina Foundation for Education, and | Vanguard Group (1998–2008) . |
| Oxfam America; Chairman of the Advisory Council | | |
| for the College of Arts and Letters and Member | Kathryn J. Hyatt | |
| of the Advisory Board to the Kellogg Institute for | Born 1955. Treasurer Since November 2008. Principal |
| International Studies at the University of Notre Dame. | Occupation(s) During the Past Five Years: Principal |
| | of The Vanguard Group, Inc.; Treasurer of each of |
| André F. Perold | the investment companies served by The Vanguard |
| Born 1952. Trustee Since December 2004. Principal | Group since 2008; Assistant Treasurer of each of the |
| Occupation(s) During the Past Five Years: George | investment companies served by The Vanguard Group |
| Gund Professor of Finance and Banking at the Harvard | (1988–2008). | |
| Business School; Chair of the Investment Committee | | |
| of HighVista Strategies LLC (private investment firm). | Heidi Stam | |
| | Born 1956. Secretary Since July 2005. Principal |
| Alfred M. Rankin, Jr. | Occupation(s) During the Past Five Years: Managing |
| Born 1941. Trustee Since January 1993. Principal | Director of The Vanguard Group, Inc., since 2006; |
| Occupation(s) During the Past Five Years: Chairman, | General Counsel of The Vanguard Group since 2005; |
| President, and Chief Executive Officer of NACCO | Secretary of The Vanguard Group and of each of the |
| Industries, Inc. (forklift trucks/housewares/lignite); | investment companies served by The Vanguard Group |
| Director of Goodrich Corporation (industrial products/ | since 2005; Director and Senior Vice President of |
| aircraft systems and services) and the National | Vanguard Marketing Corporation since 2005; |
| Association of Manufacturers; Chairman of the Federal | Principal of The Vanguard Group (1997–2006). |
| Reserve Bank of Cleveland; Trustee of University | | |
| Hospitals of Cleveland; President of the Board of The | | |
| Cleveland Museum of Art. | Vanguard Senior Management Team |
| |
| Peter F. Volanakis | R. Gregory Barton | Michael S. Miller |
| Born 1955. Trustee Since July 2009. Principal | Mortimer J. Buckley | James M. Norris |
| Occupation(s) During the Past Five Years: President | Kathleen C. Gubanich | Glenn W. Reed |
| and Chief Operating Officer (retired 2010) of Corning | Paul A. Heller | George U. Sauter |
| Incorporated (communications equipment); Director of | | |
| Corning Incorporated (2000–2010) and Dow Corning | | |
| (2001–2010); Trustee of the Corning Incorporated | Chairman Emeritus and Senior Advisor |
| Foundation and the Corning Museum of Glass; | | |
| Overseer of the Amos Tuck School of Business | John J. Brennan | |
| Administration at Dartmouth College. | Chairman, 1996–2009 | |
| | Chief Executive Officer and President, 1996–2008 |
| |
| Executive Officers | | |
| | Founder | |
| Glenn Booraem | | |
| Born 1967. Controller Since July 2010. Principal | John C. Bogle | |
| Occupation(s) During the Past Five Years: Principal | Chairman and Chief Executive Officer, 1974–1996 |
| of The Vanguard Group, Inc.; Controller of each of | | |
| the investment companies served by The Vanguard | | |
| Group since 2010; Assistant Controller of each of | | |
| the investment companies served by The Vanguard | | |
| Group (2001–2010). | | |
1 Mr. McNabb is considered an “interested person,” as defined in the Investment Company Act of 1940, because he is an officer of the Vanguard funds.
2 December 2002 for Vanguard Equity Income Fund, Vanguard Growth Equity Fund, the Vanguard Municipal Bond Funds, and the Vanguard State Tax-Exempt Funds.
|  |
| P.O. Box 2600 |
| Valley Forge, PA 19482-2600 |
Connect with Vanguard® > vanguard.com
| |
| Fund Information > 800-662-7447 | |
| Direct Investor Account Services > 800-662-2739 | |
| Institutional Investor Services > 800-523-1036 | |
| Text Telephone for People | |
| With Hearing Impairment > 800-749-7273 | |
| |
| This material may be used in conjunction | |
| with the offering of shares of any Vanguard | |
| fund only if preceded or accompanied by | |
| the fund’s current prospectus. | |
| |
| All comparative mutual fund data are from Lipper Inc. or | |
| Morningstar, Inc., unless otherwise noted. | |
| |
| You can obtain a free copy of Vanguard’s proxy voting | |
| guidelines by visiting vanguard.com/proxyreporting or by | |
| calling Vanguard at 800-662-2739. The guidelines are | |
| also available from the SEC’s website, sec.gov. In | |
| addition, you may obtain a free report on how your fund | |
| voted the proxies for securities it owned during the 12 | |
| months ended June 30. To get the report, visit either | |
| vanguard.com/proxyreporting or sec.gov. | |
| |
| You can review and copy information about your fund at | |
| the SEC’s Public Reference Room in Washington, D.C. To | |
| find out more about this public service, call the SEC at | |
| 202-551-8090. Information about your fund is also | |
| available on the SEC’s website, and you can receive | |
| copies of this information, for a fee, by sending a | |
| request in either of two ways: via e-mail addressed to | |
| publicinfo@sec.gov or via regular mail addressed to the | |
| Public Reference Section, Securities and Exchange | |
| Commission, Washington, DC 20549-1520. | |
| |
| |
| | © 2011 The Vanguard Group, Inc. |
| | All rights reserved. |
| | Vanguard Marketing Corporation, Distributor. |
| |
| | Q530 032011 |
 |
|
| Vanguard Health Care Fund |
| Annual Report |
|
| January 31, 2011 |
 |
> For the fiscal year ended January 31, 2011, Vanguard Health Care Fund returned about 8%.
> The fund’s results were better than those of its benchmark index and its peer group.
> A number of product setbacks and uncertainty over health care reform hurt the sector’s performance compared with that of the broad U.S. stock market.
| |
| Contents | |
| Your Fund’s Total Returns. | 1 |
| Chairman’s Letter. | 2 |
| Advisor’s Report. | 7 |
| Fund Profile. | 9 |
| Performance Summary. | 11 |
| Financial Statements. | 13 |
| Your Fund’s After-Tax Returns. | 26 |
| About Your Fund’s Expenses. | 27 |
| Glossary. | 29 |
Please note: The opinions expressed in this report are just that—informed opinions. They should not be considered promises or advice.
Also, please keep in mind that the information and opinions cover the period through the date on the front of this report. Of course, the risks of investing in your fund are spelled out in the prospectus.
See the Glossary for definitions of investment terms used in this report.
Cover photograph: Jean Maher.
Your Fund’s Total Returns
Fiscal Year Ended January 31, 2011
| |
| | Total |
| | Returns |
| Vanguard Health Care Fund | |
| Investor Shares | 7.95% |
| Admiral™ Shares | 7.99 |
| Spliced Health Care Index | 5.41 |
| Global Health/Biotechnology Funds Average | 5.87 |
Spliced Health Care Index: S&P 500 Index through December 31, 2001; S&P Health Care Index through May 31, 2010; MSCI All Country World Health Care Index thereafter.
Global Health/Biotechnology Funds Average: Derived from data provided by Lipper Inc.
Admiral Shares carry lower expenses and are available to investors who meet certain account-balance requirements.
Your Fund’s Performance at a Glance
January 31, 2010 , Through January 31, 2011
| | | | |
| | | | Distributions Per Share |
| | Starting | Ending | Income | Capital |
| | Share Price | Share Price | Dividends | Gains |
| Vanguard Health Care Fund | | | | |
| Investor Shares | $120.06 | $124.30 | $2.007 | $3.203 |
| Admiral Shares | 50.67 | 52.45 | 0.874 | 1.352 |
1

Chairman’s Letter
Dear Shareholder,
The global financial markets have experienced their share of ups and downs over the past year. Still, despite the bumpy ride, U.S. stocks ended the period with strong double-digit gains. Stocks in the health care sector fell short of the broad market, as uncertainty surrounding health care reform weighed on returns across the industry.
For the 12 months ended January 31, 2011, Vanguard Health Care Fund returned about 8%, outperforming its benchmark, the Spliced Health Care Index, which returned about 5%. Benchmark comparisons may be distorted by the fund’s change from an all-U.S. benchmark to a more global one on June 1, 2010. The fund also bested the average return of about 6% for global health and biotechnology funds for the period.
If you own shares of the fund in a taxable account, you may wish to review the fund’s after-tax returns later in this report.
Also, please note that on October 6 Vanguard broadened the availability of our lower-cost Admiral Shares. We reduced the Admiral minimums on most of our actively managed funds, including the Health Care Fund, to $50,000 from $100,000, as part of our ongoing efforts to lower the cost of investing for our clients.
2
Stocks rallied as economy ground into gear
Global stock markets produced excellent returns in the year ended January 31, 2011, with much of the strength materializing in the second half of the year. Europe’s sovereign debt challenges and concerns that the economic recovery in the United States might not reach escape velocity seemed to recede from investors’ minds, displaced by strong corporate earnings and a powerful rebound in consumer spending and in the manufacturing sector.
The U.S. stock market returned about 24%. Small- and mid-capitalization stocks, often the first to respond to changes in the economic outlook, did even better. As a group, non-U.S. stock markets returned more than 18%. Emerging markets were the best performers. Despite high-profile dramas in Europe’s government bond markets, European stocks produced double-digit gains. Asia’s developed markets turned in mixed results on local exchanges, but the strength of the yen, the Australian dollar, and other regional currencies bolstered returns for U.S.-based investors.
A strong start, a faltering finish for bonds
In January 2010, the bond market’s near-term prospects looked dubious, in large part because yields hovered near generational lows. Over the following 12 months, however, yields dipped lower still. The taxable bond market returned about
Market Barometer
| | | |
| | | Average Annual Total Returns |
| | | Periods Ended January 31, 2011 |
| | One | Three | Five |
| | Year | Years | Years |
| Stocks | | | |
| Russell 1000 Index (Large-caps) | 23.33% | 0.45% | 2.51% |
| Russell 2000 Index (Small-caps) | 31.36 | 4.57 | 2.64 |
| Dow Jones U.S. Total Stock Market Index | 24.31 | 1.22 | 2.86 |
| MSCI All Country World Index ex USA (International) | 18.50 | -0.96 | 4.08 |
| |
| Bonds | | | |
| Barclays Capital U.S. Aggregate Bond Index (Broad | | | |
| taxable market) | 5.06% | 5.36% | 5.82% |
| Barclays Capital Municipal Bond Index (Broad | | | |
| tax-exempt market) | 1.10 | 3.39 | 3.88 |
| Citigroup Three-Month U.S. Treasury Bill Index | 0.14 | 0.59 | 2.23 |
| |
| CPI | | | |
| Consumer Price Index | 1.63% | 1.42% | 2.12% |
3
5% for the year. As investors searched for yield, corporate bonds produced the best returns, with the riskiest credits leading the market.
Toward the end of the fiscal year, an improving economic outlook nudged interest rates higher, putting pressure on bond prices. This dynamic was evident in the municipal bond market, where rising rates and a confluence of other factors weighed on prices. The expiration of the Build America Bonds program, for example, raised the prospect of a spike in new tax-exempt issuance, while the extension of federal tax rate cuts that were set to expire made munis’ tax exemption somewhat less attractive. For the full year, the muni market returned about 1%.
As it has since December 2008, the Federal Reserve held its target for short-term interest rates near 0%, keeping the returns available from money market instruments such as the 3-month Treasury bill in the same neighborhood.
A period of product problems and regulatory uncertainty
For more than 25 years, Vanguard Health Care Fund has offered investors low-cost exposure to domestic and foreign companies involved in various aspects of the health care industry, including pharmaceutical firms, medical supply companies, and biotechnology firms.
Although the fund tends to be more geographically diverse and to exhibit lower turnover than other health care
Expense Ratios
Your Fund Compared With Its Peer Group
| | | |
| | Investor | Admiral | Peer Group |
| | Shares | Shares | Average |
| Health Care Fund | 0.36% | 0.29% | 1.39% |
The fund expense ratios shown are from the prospectus dated May 28, 2010, and represent estimated costs for the current fiscal year. For the fiscal year ended January 31, 2011, the fund’s expense ratios were 0.35% for Investor Shares and 0.30% for Admiral Shares. The peer-group expense ratio is derived from data provided by Lipper Inc. and captures information through year-end 2010.
Peer group: Global Health/Biotechnology Funds.
4
funds, its performance still hinges on the fortunes of a single stock market sector. When health care stocks lead the market, the fund tends to follow along, and when they trail, fund returns tend to be below those of the broad market.
The fiscal year ended January 31 is a good example of these tendencies: The health care sector significantly lagged the broad U.S. stock market amid setbacks in the pharmaceutical and medical equipment industries, as well as general uncertainty surrounding health care reform legislation.
The pharmaceutical industry—which accounted for more than 50% of the fund and almost 60% of its benchmark, on average, during the period—had to contend with expiring patents on several blockbuster drugs. In addition, the U.S. Food and Drug Administration has tightened regulations over the past few years, slowing the approval process for new drugs and making it harder for some pharmaceutical companies to replace drugs whose patents are expiring.
Despite the ongoing struggles within the industry, the fund’s pharmaceutical holdings contributed almost two percentage points to its overall return. Still, the fund’s performance in this area lagged the benchmark’s performance, mostly because the fund did not hold some of the industry’s stronger performers.
Total Returns
Ten Years Ended January 31, 2011
| |
| | Average |
| | Annual Return |
| Health Care Fund Investor Shares | 5.78% |
| Spliced Health Care Index | -0.30 |
| Global Health/Biotechnology Funds Average | 2.10 |
Spliced Health Care Index: S&P 500 Index through December 31, 2001; S&P Health Care Index through May 31, 2010; MSCI All Country World Health Care Index thereafter.
Global Health/Biotechnology Funds Average: Derived from data provided by Lipper Inc.
The figures shown represent past performance, which is not a guarantee of future results. (Current performance may be lower or higher than the performance data cited. For performance data current to the most recent month-end, visit our website at vanguard.com/performance.) Note, too, that both investment returns and principal value can fluctuate widely, so an investor’s shares, when sold, could be worth more or less than their original cost.
5
Overall, your fund’s advisor, Wellington Management Company, llp, made strong stock choices in several areas, including managed health care, health care distribution, and biotechnology, to help the fund outperform both its benchmark index and its peers among global health and biotechnology funds.
Fund’s long-term results trump competitors’ average
Vanguard Health Care Fund’s long-term results remain exemplary, despite the extremely volatile investment environment of the last few years. For the ten-year period ended January 31, the fund’s Investor Shares had an average annual return of 5.78%, significantly better than that of the fund’s benchmark (–0.30%), which previously did not include companies based abroad, and peer group (+2.10%). The fund also outperformed the broad U.S. stock market for the ten-year period—the Dow Jones U.S. Total Stock Market Index had an average annual return of 2.47%.
The fund’s performance reflects a decade that included both the collapse of the tech-stock bubble early on and the trauma of the recent financial crisis. The credit goes to Wellington, your fund’s experienced advisor, whose superior portfolio management and stock-picking skills, coupled with the fund’s exceptionally low costs, have produced notable results for long-term shareholders. (For a comparison of your fund’s costs with the average for competitors, see the table on page 4.)
Stay focused on future goals and long-term performance
In recent years, investors have been swept along on the market’s wild ride. And while returns have been much brighter lately, we still can’t be sure what the future holds, only that the market will continue to experience its share of ups and downs.
We counsel investors that the best way to deal with the market’s unpredictability is to block out the short-term noise. Instead, focus on creating a long-term investment plan—one that includes a mix of stock, bond, and money market funds that is appropriate for your goals and risk tolerance—and do your best to stick with that plan.
As part of such a well-balanced portfolio, Vanguard Health Care Fund offers investors the opportunity to obtain broad exposure to one of the economy’s most innovative segments, at a very low cost.
As always, thank you for entrusting your assets to Vanguard.
Sincerely,

F. William McNabb III
Chairman and Chief Executive Officer
February 9, 2011
6
Advisor’s Report
Vanguard Health Care Fund gained about 8% for the 12 months ended January 31, 2011, outperforming its spliced health care benchmark, which returned about 5%. The broadly diversified S&P 500 Index returned about 22%, significantly outpacing health care stocks over the course of the period.
The investment environment
Health care industry stocks struggled relative to the broader market as a number of factors led to lower health care pricing and utilization. Austerity measures undertaken by European governments reduced volumes and prices across many medical categories. In the United States, the much anticipated impact of drug patent expirations began to be felt in earnest around year-end. In addition, with its defensive qualities, it is not unexpected for the health care sector to lag the market in an environment where risk aversion subsides.
Our successes
UnitedHealth Group was one of the largest contributors to fund performance during the year. It led a strong managed care group that performed well across the board. Managed care companies benefited from lower medical costs and utilization as a result of the weak economy. McKesson contributed strongly to the portfolio’s performance as drug distributors’ stock prices rose during the year in response to favorable earnings. The fund also benefited from acquisition activity; OSI
Major Portfolio Changes
Fiscal Year Ended January 31, 2011
| |
| Additions | Comments |
| Gilead Sciences | Increased our position because of the weakness of the stock |
| | price; fundamentals and outlook remain strong. |
| Vertex Pharmaceuticals | Purchased on weakness before the launch of an important hepatitis C drug. |
| NuVasive | Took advantage of weakness resulting from slower revenue |
| | growth to initiate a position. |
| Reductions | Comments |
| Sanofi-Aventis | Trimmed our position as the company pursued a large acquisition. |
| OSI Pharmaceuticals | Eliminated our position following the announcement of an |
| | acquisition offer by Astellas Pharma. |
| Genzyme | Pared back our position following an acquisition offer by Sanofi-Aventis. |
|
7
Pharmaceuticals was acquired mid-year by Astellas, and Genzyme received a tender offer from Sanofi-Aventis.
Our shortfalls
The stock price of Abbott Laboratories declined as the market focused on the company’s increasing reliance on Humira, its largest product for autoimmune diseases. Merck shares fell during the period owing to a setback involving Vorapaxar, an important cardiovascular pipeline drug. Roche underperformed as its important cancer drug, Avastin, showed a less-than-expected benefit in breast cancer and the market generally became more concerned about the impact of “biosimilar” drugs on blockbuster protein therapies.
The fund’s positioning
The health care industry continues to face risks, but it also has opportunities. While we are more comfortable with the potential impact of health care reform on the industry, significant uncertainty remains, as the legislation is likely to be modified over the coming years. Also, the U.S. Food and Drug Administration remains in a conservative posture, and we are hoping for signs of more predictability from the agency. On the positive side, emerging markets represent a new growth frontier for the global therapeutic and device companies.
We will continue to strive to identify as early as possible the drugs and devices with the best chances of changing medicine, as well as the service companies that are best positioned to capture opportunities along the health care chain. We will continue to stay diversified, focused on the long haul, and positioned in the most attractive health care stocks.
Edward P. Owens, CFA
Senior Vice President and Portfolio Manager
Jean M. Hynes, CFA
Senior Vice President and Associate Portfolio Manager
Wellington Management Company, LLP
February 11, 2011
8
Health Care Fund
Fund Profile
As of January 31, 2011
| | | |
| Share-Class Characteristics | | |
| | Investor | | Admiral |
| | Shares | | Shares |
| Ticker Symbol | VGHCX | | VGHAX |
| Expense Ratio1 | 0.36% | | 0.29% |
| 30-Day SEC Yield | 1.40% | | 1.45% |
| |
| Portfolio Characteristics | | |
| | | MSCI | DJ |
| | | ACWI | U.S. Total |
| | | Health | Market |
| | Fund | Care | Index |
| Number of Stocks | 78 | 138 | 3,858 |
| Median Market Cap | $23.8B | $48.5B | $30.9B |
| Price/Earnings Ratio | 13.4x | 14.8x | 17.7x |
| Price/Book Ratio | 2.2x | 2.5x | 2.3x |
| Return on Equity | 19.3% | 20.9% | 19.0% |
| Earnings Growth Rate | 9.9% | 9.9% | 6.0% |
| Dividend Yield | 2.1% | 2.6% | 1.7% |
| Foreign Holdings | 21.0% | 42.3% | 0.0% |
| Turnover Rate | 9% | — | — |
| Short-Term Reserves | 7.2% | — | — |
| | |
| Volatility Measures | | |
| | Spliced | DJ |
| | Health | U.S. Total |
| | Care | Market |
| | Index | Index |
| R-Squared | 0.96 | 0.66 |
| Beta | 0.98 | 0.64 |
| These measures show the degree and timing of the fund’s fluctuations compared with the indexes over 36 months. |
|
| |
| Ten Largest Holdings (% of total net assets) |
| Merck & Co. Inc. | Pharmaceuticals | 5.5% |
| Forest Laboratories Inc. | Pharmaceuticals | 4.6 |
| Pfizer Inc. | Pharmaceuticals | 4.0 |
| McKesson Corp. | Health Care | |
| | Distributors | 3.9 |
| UnitedHealth Group Inc. | Managed Health | |
| | Care | 3.9 |
| Roche Holding AG | Pharmaceuticals | 3.7 |
| AstraZeneca plc | Pharmaceuticals | 3.6 |
| Abbott Laboratories | Pharmaceuticals | 3.2 |
| Eli Lilly & Co. | Pharmaceuticals | 3.0 |
| Amgen Inc. | Biotechnology | 2.9 |
| Top Ten | | 38.3% |
| The holdings listed exclude any temporary cash investments and equity index products. |
| | |
| |
| Market Diversification (% of equity exposure) |
| |
| Europe | | |
| Switzerland | | 5.4% |
| United Kingdom | | 4.3 |
| France | | 1.8 |
| Other | | 1.7 |
| Subtotal | | 13.2% |
| Pacific | | |
| Japan | | 9.4% |
| North America | | |
| United States | | 77.4% |
1 The expense ratios shown are from the prospectus dated May 28, 2010, and represent estimated costs for the current fiscal year. For the fiscal year ended January 31, 2011, the expense ratios were 0.35% for Investor Shares and 0.30% for Admiral Shares.
9
Health Care Fund
| | |
| Subindustry Diversification (% of equity exposure) | |
| | | |
| | | MSCI |
| | | ACWI |
| | | Health |
| | Fund | Care |
| Biotechnology | 10.2% | 8.5% |
| Consumer Staples | 2.2 | 0.0 |
| Health Care Distributors | 6.0 | 2.7 |
| Health Care Equipment | 9.7 | 12.0 |
| Health Care Facilities | 1.6 | 0.2 |
| Health Care Services | 3.5 | 5.0 |
| Health Care Supplies | 0.9 | 1.0 |
| Health Care Technology | 1.6 | 0.3 |
| Industrials | 0.4 | 0.0 |
| Life Sciences Tools & | | |
| Services | 0.3 | 3.4 |
| Managed Health Care | 13.1 | 4.9 |
| Materials | 1.2 | 0.0 |
| Pharmaceuticals | 49.3 | 62.0 |
10
Health Care Fund
Performance Summary
All of the returns in this report represent past performance, which is not a guarantee of future results that may be achieved by the fund. (Current performance may be lower or higher than the performance data cited. For performance data current to the most recent month-end, visit our website at vanguard.com/performance.) Note, too, that both investment returns and principal value can fluctuate widely, so an investor’s shares, when sold, could be worth more or less than their original cost. The returns shown do not reflect taxes that a shareholder would pay on fund distributions or on the sale of fund shares.
Cumulative Performance: January 31, 2001, Through January 31, 2011
Initial Investment of $25,000
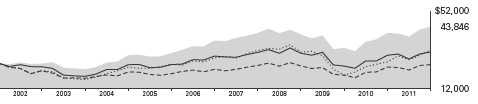
| | | | |
| | Average Annual Total Returns | |
| | Periods Ended January 31, 2011 | |
| | | | | Final Value |
| | One | Five | Ten | of a $25,000 |
| | Year | Years | Years | Investment |
| Health Care Fund Investor Shares | 7.95% | 3.67% | 5.78% | $43,846 |
| Dow Jones U.S. Total Stock Market | | | | |
| Index | 24.31 | 2.86 | 2.47 | 31,898 |
| Spliced Health Care Index | 5.41 | 2.13 | -0.30 | 24,255 |
| Global Health/Biotechnology Funds | | | | |
| Average | 5.87 | 1.42 | 2.10 | 30,787 |
Spliced Health Care Index: S&P 500 Index through December 31, 2001; S&P Health Care Index through May 31, 2010; MSCI All Country World Health Care Index thereafter.
Global Health/Biotechnology Funds Average: Derived from data provided by Lipper Inc.
Vanguard fund returns do not reflect the 1% fee on redemptions of shares held for less than one year.
See Financial Highlights for dividend and capital gains information.
11
Health Care Fund
| | | | |
| | | Average Annual Total Returns | |
| | | Periods Ended January 31, 2011 | |
| | | | Since | Final Value |
| | One | Five | Inception | of a $50,000 |
| | Year | Years | (11/12/2001) | Investment |
| Health Care Fund Admiral Shares | 7.99% | 3.74% | 6.63% | $90,393 |
| Dow Jones U.S. Total Stock Market | | | | |
| Index | 24.31 | 2.86 | 4.88 | 77,584 |
| Spliced Health Care Index | 5.41 | 2.13 | 1.74 | 58,643 |
| "Since Inception" performance is calculated from the Admiral Shares’ inception date for both the fund and its comparative standards. |
Fiscal-Year Total Returns (%): January 31, 2001, Through January 31, 2011

Average Annual Total Returns: Periods Ended December 31, 2010
This table presents average annual total returns through the latest calendar quarter—rather than through the end of the fiscal period. Securities and Exchange Commission rules require that we provide this information.
| | | | |
| | Inception | One | Five | Ten |
| | Date | Year | Years | Years |
| Investor Shares | 5/23/1984 | 6.16% | 3.93% | 4.82% |
| Admiral Shares | 11/12/2001 | 6.21 | 4.00 | 6.521 |
| 1 Return since inception. |
Vanguard fund returns do not reflect the 1% fee on redemptions of shares held for less than one year.
12
Health Care Fund
Financial Statements
Statement of Net Assets
As of January 31, 2011
The fund reports a complete list of its holdings in regulatory filings four times in each fiscal year, at the quarter-ends. For the second and fourth fiscal quarters, the lists appear in the fund’s semiannual and annual reports to shareholders. For the first and third fiscal quarters, the fund files the lists with the Securities and Exchange Commission on Form N-Q. Shareholders can look up the fund’s Forms N-Q on the SEC’s website at sec.gov. Forms N-Q may also be reviewed and copied at the SEC’s Public Reference Room (see the back cover of this report for further information).
| | | |
| | | | Market |
| | | | Value |
| | | Shares | ($000) |
| Common Stocks (93.1%) | | |
| United States (72.1%) | | |
| Biotechnology (9.4%) | | |
| * | Amgen Inc. | 10,638,455 | 585,966 |
| *,1 | Cephalon Inc. | 5,711,230 | 337,419 |
| * | Gilead Sciences Inc. | 7,307,100 | 280,446 |
| * | Genzyme Corp. | 3,069,340 | 225,136 |
| * | Vertex Pharmaceuticals | | |
| | Inc. | 3,893,200 | 151,407 |
| * | Biogen Idec Inc. | 2,270,000 | 148,617 |
| * | Onyx Pharmaceuticals | | |
| | Inc. | 1,307,200 | 46,125 |
| * | United Therapeutics Corp. | 354,500 | 24,099 |
| * | Amylin Pharmaceuticals | | |
| | Inc. | 1,357,200 | 21,959 |
| * | Ironwood | | |
| | Pharmaceuticals Inc. | 2,000,000 | 21,580 |
| * | Regeneron | | |
| | Pharmaceuticals Inc. | 600,000 | 20,208 |
| * | Cubist Pharmaceuticals | | |
| | Inc. | 886,542 | 19,451 |
| | | | 1,882,413 |
| Chemicals (1.1%) | | |
| | Sigma-Aldrich Corp. | 3,380,000 | 215,137 |
| |
| Food & Staples Retailing (2.0%) | |
| | Walgreen Co. | 9,744,700 | 394,076 |
| |
| Food Products (0.0%) | | |
| * | Dean Foods Co. | 700,000 | 7,105 |
| |
| Health Care Equipment & Supplies (9.9%) |
| * | St. Jude Medical Inc. | 8,810,900 | 356,841 |
| | Medtronic Inc. | 7,201,100 | 275,946 |
| | Becton Dickinson and Co. | 3,202,500 | 265,647 |
| | Beckman Coulter Inc. | 2,861,784 | 206,077 |
| | Baxter International Inc. | 3,700,000 | 179,413 |
| * | Boston Scientific Corp. | 21,300,000 | 148,674 |
| | Covidien plc | 1,950,000 | 92,567 |
| | | |
| | | | Market |
| | | | Value |
| | | Shares | ($000) |
| * | CareFusion Corp. | 3,568,354 | 91,814 |
| * | Zimmer Holdings Inc. | 1,500,000 | 88,740 |
| | DENTSPLY International | | |
| | Inc. | 2,485,400 | 88,182 |
| | Alcon Inc. | 500,000 | 81,430 |
| *,1 | NuVasive Inc. | 2,130,103 | 59,526 |
| | STERIS Corp. | 803,083 | 27,963 |
| | | | 1,962,820 |
| Health Care Providers & Services (22.4%) | |
| | McKesson Corp. | 10,289,900 | 773,492 |
| | UnitedHealth Group Inc. | 18,685,100 | 767,023 |
| * | WellPoint Inc. | 7,602,400 | 472,261 |
| * | Humana Inc. | 6,560,094 | 380,289 |
| | Quest Diagnostics Inc. | 6,085,400 | 346,564 |
| | CIGNA Corp. | 7,710,600 | 323,999 |
| | Cardinal Health Inc. | 6,236,708 | 258,886 |
| *,1 | Coventry Health Care Inc. | 8,627,500 | 258,566 |
| * | Laboratory Corp. | | |
| | of America Holdings | 2,681,360 | 241,081 |
| | Universal Health | | |
| | Services Inc. Class B | 4,020,800 | 169,276 |
| * | Health Net Inc. | 4,663,458 | 133,048 |
| *,1 | Health Management | | |
| | Associates Inc. Class A | 14,456,900 | 131,558 |
| | Owens & Minor Inc. | 3,000,000 | 88,590 |
| | Aetna Inc. | 2,250,000 | 74,115 |
| * | DaVita Inc. | 304,600 | 22,495 |
| * | WellCare Health Plans | | |
| | Inc. | 449,000 | 13,425 |
| | | | 4,454,668 |
| Health Care Technology (1.5%) | |
| * | Cerner Corp. | 2,950,000 | 291,607 |
| |
| Life Sciences Tools & Services (0.3%) | |
| * | Parexel International Corp. | 2,740,400 | 63,605 |
| |
| Machinery (0.4%) | | |
| | Pall Corp. | 1,504,600 | 83,370 |
13
Health Care Fund
| | | |
| | | | Market |
| | | | Value |
| | | Shares | ($000) |
| Pharmaceuticals (25.1%) | | |
| | Merck & Co. Inc. | 32,730,248 | 1,085,662 |
| *,1 | Forest Laboratories Inc. | 28,353,000 | 914,668 |
| | Pfizer Inc. | 43,559,788 | 793,659 |
| | Abbott Laboratories | 14,100,000 | 636,756 |
| | Eli Lilly & Co. | 17,029,900 | 592,130 |
| | Johnson & Johnson | 5,200,000 | 310,804 |
| | Bristol-Myers Squibb Co. | 9,078,361 | 228,593 |
| | Perrigo Co. | 3,109,100 | 226,156 |
| * | Watson Pharmaceuticals | | |
| | Inc. | 1,750,000 | 95,410 |
| * | Hospira Inc. | 1,095,070 | 60,481 |
| * | Salix Pharmaceuticals | | |
| | Ltd. | 1,000,000 | 40,970 |
| | Warner Chilcott plc | | |
| | Class A | 232,200 | 5,570 |
| | | | 4,990,859 |
| Total United States | | 14,345,660 |
| International (21.0%) | | |
| Belgium (0.4%) | | |
| | UCB SA | 2,350,678 | 84,181 |
| |
| France (1.7%) | | |
| | Sanofi-Aventis SA | 4,184,974 | 285,510 |
| | Ipsen SA | 1,400,000 | 48,897 |
| | | | 334,407 |
| Germany (0.8%) | | |
| | Bayer AG | 1,694,656 | 124,975 |
| | Fresenius Medical Care | | |
| | AG & Co. KGaA | 611,950 | 35,812 |
| | | | 160,787 |
| Ireland (0.3%) | | |
| * | Elan Corp. plc ADR | 8,462,700 | 57,123 |
| |
| Japan (8.7%) | | |
| | Astellas Pharma Inc. | 14,065,700 | 536,385 |
| | Takeda Pharmaceutical | | |
| | Co. Ltd. | 5,949,900 | 286,084 |
| | Daiichi Sankyo Co. Ltd. | 12,251,500 | 265,711 |
| ^ | Eisai Co. Ltd. | 5,993,700 | 207,388 |
| | Shionogi & Co. Ltd. | 10,586,534 | 194,202 |
| | Mitsubishi Tanabe | | |
| | Pharma Corp. | 7,100,000 | 113,502 |
| | Chugai Pharmaceutical | | |
| | Co. Ltd. | 4,651,800 | 85,517 |
| | Ono Pharmaceutical | | |
| | Co. Ltd. | 960,000 | 46,638 |
| | | | 1,735,427 |
| Switzerland (5.0%) | | |
| | Roche Holding AG | 4,263,977 | 648,375 |
| | Novartis AG | 4,869,880 | 271,552 |
| | Roche Holding AG | | |
| | (Bearer) | 514,320 | 80,950 |
| | | | 1,000,877 |
| | |
| | | Market |
| | | Value |
| | Shares | ($000) |
| United Kingdom (4.1%) | | |
| AstraZeneca plc | 14,681,500 | 713,040 |
| GlaxoSmithKline plc ADR | 2,542,381 | 92,365 |
| | | 805,405 |
| Total International | | 4,178,207 |
| Total Common Stocks | | |
| (Cost $12,587,892) | | 18,523,867 |
| Temporary Cash Investments (8.3%) | |
| Money Market Fund (0.1%) | | |
| 2,3 Vanguard Market | | |
| Liquidity Fund, 0.207% | 25,550,000 | 25,550 |
| |
| | Face | |
| | Amount | |
| | ($000) | |
| Repurchase Agreements (6.2%) | |
| Barclays Capital Inc. | | |
| 0.220%, 2/1/11 (Dated | | |
| 1/31/11, Repurchase | | |
| Value $1,044,406,000, | | |
| collateralized by Federal | | |
| Home Loan Mortgage | | |
| Corp. 3.500%–5.000%, | | |
| 11/1/25–8/1/40, Federal | | |
| National Mortgage Assn. | | |
| 2.826%–5.000%, | | |
| 9/1/25–1/1/41, and | | |
| Government National | | |
| Mortgage Assn. | | |
| 3.500%–5.500%, | | |
| 7/15/39–1/20/41) | 1,044,400 | 1,044,400 |
| Morgan Stanley 0.220%, | | |
| 2/1/11 (Dated 1/31/11, | | |
| Repurchase Value | | |
| $188,001,000, | | |
| collateralized by Federal | | |
| Home Loan Mortgage | | |
| Corp. 3.500%–5.000%, | | |
| 5/1/21–12/1/40) | 188,000 | 188,000 |
| | | 1,232,400 |
| Commercial Paper (2.0%) | | |
| General Electric | | |
| Capital Services Inc., | | |
| 0.250%, 5/2/11 | 200,000 | 199,884 |
| General Electric | | |
| Capital Services Inc., | | |
| 0.321%, 6/14/11 | 200,000 | 199,810 |
| | | 399,694 |
| Total Temporary Cash Investments | |
| (Cost $1,657,588) | | 1,657,644 |
| Total Investments (101.4%) | | |
| (Cost $14,245,480) | | 20,181,511 |
14
Health Care Fund
| |
| | Market |
| | Value |
| | ($000) |
| Other Assets and Liabilities (-1.4%) | |
| Other Assets | 93,478 |
| Liabilities3 | (369,753) |
| | (276,275) |
| Net Assets (100%) | 19,905,236 |
| |
| |
| Statement of Assets and Liabilities | |
| Assets | |
| Investments in Securities, at Value | 20,181,511 |
| Receivables for Investment | |
| Securities Sold | 56,909 |
| Other Assets | 36,569 |
| Total Assets | 20,274,989 |
| Liabilities | |
| Payables for Investment | |
| Securities Purchased | 253,612 |
| Other Liabilities | 116,141 |
| Total Liabilities | 369,753 |
| Net Assets | 19,905,236 |
| |
| At January 31, 2011, net assets consisted of: |
| | Amount |
| | ($000) |
| Paid-in Capital | 13,872,668 |
| Overdistributed Net Investment Income | (36,363) |
| Accumulated Net Realized Gains | 135,286 |
| Unrealized Appreciation (Depreciation) | |
| Investment Securities | 5,936,031 |
| Foreign Currencies and | |
| Forward Currency Contracts | (2,386) |
| Net Assets | 19,905,236 |
| |
| |
| Investor Shares—Net Assets | |
| Applicable to 67,955,756 outstanding | |
| $.001 par value shares of beneficial | |
| interest (unlimited authorization) | 8,446,721 |
| Net Asset Value Per Share— | |
| Investor Shares | $124.30 |
| |
| |
| Admiral Shares—Net Assets | |
| Applicable to 218,453,556 outstanding | |
| $.001 par value shares of beneficial | |
| interest (unlimited authorization) | 11,458,515 |
| Net Asset Value Per Share— | |
| Admiral Shares | $52.45 |
See Note A in Notes to Financial Statements.
* Non-income-producing security.
^ Part of security position is on loan to broker-dealers. The total value of securities on loan is $24,246,000.
1 Considered an affiliated company of the fund as the fund owns more than 5% of the outstanding voting securities of such company.
2 Affiliated money market fund available only to Vanguard funds and certain trusts and accounts managed by Vanguard. Rate shown is the 7-day yield.
3 Includes $25,550,000 of collateral received for securities on loan.
ADR—American Depositary Receipt.
See accompanying Notes, which are an integral part of the Financial Statements.
15
Health Care Fund
Statement of Operations
| |
| | Year Ended |
| | January 31, 2011 |
| | ($000) |
| Investment Income | |
| Income | |
| Dividends1,2 | 388,660 |
| Interest | 3,855 |
| Security Lending | 3,699 |
| Total Income | 396,214 |
| Expenses | |
| Investment Advisory Fees—Note B | 29,398 |
| The Vanguard Group—Note C | |
| Management and Administrative—Investor Shares | 18,346 |
| Management and Administrative—Admiral Shares | 11,770 |
| Marketing and Distribution—Investor Shares | 2,129 |
| Marketing and Distribution—Admiral Shares | 1,574 |
| Custodian Fees | 467 |
| Auditing Fees | 27 |
| Shareholders’ Reports—Investor Shares | 173 |
| Shareholders’ Reports—Admiral Shares | 32 |
| Trustees’ Fees and Expenses | 30 |
| Total Expenses | 63,946 |
| Net Investment Income | 332,268 |
| Realized Net Gain (Loss) | |
| Investment Securities Sold2 | 494,277 |
| Foreign Currencies and Forward Currency Contracts | 1,569 |
| Realized Net Gain (Loss) | 495,846 |
| Change in Unrealized Appreciation (Depreciation) | |
| Investment Securities | 667,348 |
| Foreign Currencies and Forward Currency Contracts | (3,155) |
| Change in Unrealized Appreciation (Depreciation) | 664,193 |
| Net Increase (Decrease) in Net Assets Resulting from Operations | 1,492,307 |
1 Dividends are net of foreign withholding taxes of $14,900,000.
2 Dividend income and realized net gain (loss) from affiliated companies of the fund were $0 and $31,823,000, respectively.
See accompanying Notes, which are an integral part of the Financial Statements.
16
Health Care Fund
Statement of Changes in Net Assets
| | |
| | Year Ended January 31, |
| | 2011 | 2010 |
| | ($000) | ($000) |
| Increase (Decrease) in Net Assets | | |
| Operations | | |
| Net Investment Income | 332,268 | 325,728 |
| Realized Net Gain (Loss) | 495,846 | 346,877 |
| Change in Unrealized Appreciation (Depreciation) | 664,193 | 3,255,909 |
| Net Increase (Decrease) in Net Assets Resulting from Operations | 1,492,307 | 3,928,514 |
| Distributions | | |
| Net Investment Income | | |
| Investor Shares | (137,642) | (169,451) |
| Admiral Shares | (186,814) | (130,015) |
| Realized Capital Gain1 | | |
| Investor Shares | (249,625) | (70,199) |
| Admiral Shares | (269,464) | (51,618) |
| Total Distributions | (843,545) | (421,283) |
| Capital Share Transactions | | |
| Investor Shares | (3,590,779) | (827,665) |
| Admiral Shares | 2,535,574 | (422,405) |
| Net Increase (Decrease) from Capital Share Transactions | (1,055,205) | (1,250,070) |
| Total Increase (Decrease) | (406,443) | 2,257,161 |
| Net Assets | | |
| Beginning of Period | 20,311,679 | 18,054,518 |
| End of Period2 | 19,905,236 | 20,311,679 |
1 Includes fiscal 2011 and 2010 short-term gain distributions totaling $15,575,000 and $32,329,000, respectively. Short-term gain distribution are treated as ordinary income dividends for tax purposes.
2 Net Assets—End of Period includes undistributed (overdistributed) net investment income of ($36,363,000) and ($25,007,000).
See accompanying Notes, which are an integral part of the Financial Statements.
17
Health Care Fund
Financial Highlights
Investor Shares
| | | | | |
| For a Share Outstanding | | | Year Ended January 31, |
| Throughout Each Period | 2011 | 2010 | 2009 | 2008 | 2007 |
| Net Asset Value, Beginning of Period | $120.06 | $99.12 | $133.80 | $149.69 | $143.39 |
| Investment Operations | | | | | |
| Net Investment Income | 2.046 | 1.902 | 1.998 | 2.7661 | 1.953 |
| Net Realized and Unrealized Gain (Loss) | | | | | |
| on Investments | 7.404 | 21.530 | (25.229) | (5.317) | 13.107 |
| Total from Investment Operations | 9.450 | 23.432 | (23.231) | (2.551) | 15.060 |
| Distributions | | | | | |
| Dividends from Net Investment Income | (2.007) | (1.761) | (1.925) | (2.747) | (2.100) |
| Distributions from Realized Capital Gains | (3.203) | (.731) | (9.524) | (10.592) | (6.660) |
| Total Distributions | (5.210) | (2.492) | (11.449) | (13.339) | (8.760) |
| Net Asset Value, End of Period | $124.30 | $120.06 | $99.12 | $133.80 | $149.69 |
| |
| Total Return2 | 7.95% | 23.63% | -17.44% | -1.97% | 10.85% |
| |
| Ratios/Supplemental Data | | | | | |
| Net Assets, End of Period (Millions) | $8,447 | $11,692 | $10,478 | $14,314 | $16,662 |
| Ratio of Total Expenses to | | | | | |
| Average Net Assets | 0.35% | 0.36% | 0.29% | 0.26% | 0.25% |
| Ratio of Net Investment Income to | | | | | |
| Average Net Assets | 1.67% | 1.73% | 1.64% | 1.78%1 | 1.33% |
| Portfolio Turnover Rate | 9% | 6% | 12% | 9% | 8% |
1 Net investment income per share and the ratio of net investment income to average net assets include $0.585 and 0.40%, respectively, resulting from a special dividend from Health Management Associates Class A in March 2007.
2 Total returns do not include transaction or account service fees that may have applied in the periods shown. Fund prospectuses provide information about any applicable transaction or account service fees.
See accompanying Notes, which are an integral part of the Financial Statements.
18
Health Care Fund
Financial Highlights
Admiral Shares
| | | | | |
| For a Share Outstanding | | | Year Ended January 31, |
| Throughout Each Period | 2011 | 2010 | 2009 | 2008 | 2007 |
| Net Asset Value, Beginning of Period | $50.67 | $41.83 | $56.47 | $63.19 | $60.52 |
| Investment Operations | | | | | |
| Net Investment Income | .891 | .835 | .879 | 1.2201 | .877 |
| Net Realized and Unrealized Gain (Loss) | | | | | |
| on Investments | 3.115 | 9.091 | (10.648) | (2.257) | 5.542 |
| Total from Investment Operations | 4.006 | 9.926 | (9.769) | (1.037) | 6.419 |
| Distributions | | | | | |
| Dividends from Net Investment Income | (.874) | (.777) | (.852) | (1.212) | (.938) |
| Distributions from Realized Capital Gains | (1.352) | (.309) | (4.019) | (4.471) | (2.811) |
| Total Distributions | (2.226) | (1.086) | (4.871) | (5.683) | (3.749) |
| Net Asset Value, End of Period | $52.45 | $50.67 | $41.83 | $56.47 | $63.19 |
| |
| Total Return2 | 7.99% | 23.72% | -17.38% | -1.90% | 10.96% |
| |
| Ratios/Supplemental Data | | | | | |
| Net Assets, End of Period (Millions) | $11,459 | $8,619 | $7,576 | $10,513 | $10,819 |
| Ratio of Total Expenses to | | | | | |
| Average Net Assets | 0.30% | 0.29% | 0.22% | 0.18% | 0.17% |
| Ratio of Net Investment Income to | | | | | |
| Average Net Assets | 1.72% | 1.80% | 1.71% | 1.86%1 | 1.41% |
| Portfolio Turnover Rate | 9% | 6% | 12% | 9% | 8% |
1 Net investment income per share and the ratio of net investment income to average net assets include $0.247 and 0.40%, respectively, resulting from a special dividend from Health Management Associates Class A in March 2007.
2 Total returns do not include transaction fees that may have applied in the periods shown. Fund prospectuses provide information about any applicable transaction fees.
See accompanying Notes, which are an integral part of the Financial Statements.
19
Health Care Fund
Notes to Financial Statements
Vanguard Health Care Fund is registered under the Investment Company Act of 1940 as an open-end investment company, or mutual fund. The fund invests in securities of foreign issuers, which may subject it to investment risks not normally associated with investing in securities of U.S. corporations. The fund offers two classes of shares: Investor Shares and Admiral Shares. Investor Shares are available to any investor who meets the fund’s minimum purchase requirements. Admiral Shares are designed for investors who meet certain administrative, service, and account-size criteria.
A. The following significant accounting policies conform to generally accepted accounting principles for U.S. mutual funds. The fund consistently follows such policies in preparing its financial statements.
1. Security Valuation: Securities are valued as of the close of trading on the New York Stock Exchange (generally 4 p.m., Eastern time) on the valuation date. Equity securities are valued at the latest quoted sales prices or official closing prices taken from the primary market in which each security trades; such securities not traded on the valuation date are valued at the mean of the latest quoted bid and asked prices. Securities for which market quotations are not readily available, or whose values have been affected by events occurring before the fund’s pricing time but after the close of the securities’ primary markets, are valued at their fair values calculated according to procedures adopted by the board of trustees. These procedures include obtaining quotations from an independent pricing service, monitoring news to identify significant market- or security-specific events, and evaluating changes in the values of foreign market proxies (for example, ADRs, futures contracts, or exchange-traded funds), between the time the foreign markets close and the fund’s pricing time. When fair-value pricing is employed, the prices of securities used by a fund to calculate its net asset value may differ from quoted or published prices for the same securities. Investments in Vanguard Market Liquidity Fund are valued at that fund’s net asset value. Temporary cash investments acquired over 60 days to maturity are valued using the latest bid prices or using valuations based on a matrix system (which considers such factors as security prices, yields, maturities, and ratings), both as furnished by independent pricing services. Other temporary cash investments are valued at amortized cost, which approximates market value.
2. Foreign Currency: Securities and other assets and liabilities denominated in foreign currencies are translated into U.S. dollars using exchange rates obtained from an independent third party as of the fund’s pricing time on the valuation date. Realized gains (losses) and unrealized appreciation (depreciation) on investment securities include the effects of changes in exchange rates since the securities were purchased, combined with the effects of changes in security prices. Fluctuations in the value of other assets and liabilities resulting from changes in exchange rates are recorded as unrealized foreign currency gains (losses) until the assets or liabilities are settled in cash, at which time they are recorded as realized foreign currency gains (losses).
3. Forward Currency Contracts: The fund enters into forward currency contracts to protect the value of securities and related receivables and payables against changes in future foreign exchange rates. The fund’s risks in using these contracts include movement in the values of the foreign currencies relative to the U.S. dollar and the ability of the counterparties to fulfill their obligations under the contracts.
Forward currency contracts are valued at their quoted daily prices obtained from an independent third party, adjusted for currency risk based on the expiration date of each contract. The aggregate principal amounts of the contracts are not recorded in the Statement of Net Assets. Fluctuations in the value of the contracts are recorded in the Statement of Net Assets as an asset (liability) and in the Statement of Operations as unrealized appreciation (depreciation) until the contracts are closed, when they are recorded as realized forward currency contract gains (losses).
20
Health Care Fund
4. Repurchase Agreements: The fund invests in repurchase agreements. Securities pledged as collateral for repurchase agreements are held by a custodian bank until the agreements mature. Each agreement requires that the market value of the collateral be sufficient to cover payments of interest and principal; however, in the event of default or bankruptcy by the other party to the agreement, retention of the collateral may be subject to legal proceedings.
5. Federal Income Taxes: The fund intends to continue to qualify as a regulated investment company and distribute all of its taxable income. Management has analyzed the fund’s tax positions taken for all open federal income tax years (January 31, 2008–2011), and has concluded that no provision for federal income tax is required in the fund’s financial statements.
6. Distributions: Distributions to shareholders are recorded on the ex-dividend date.
7. Security Lending: The fund may lend its securities to qualified institutional borrowers to earn additional income. Security loans are required to be secured at all times by collateral at least equal to the market value of securities loaned. The fund invests cash collateral received in Vanguard Market Liquidity Fund, and records a liability for the return of the collateral, during the period the securities are on loan. Security lending income represents fees charged to borrowers plus income earned on investing cash collateral, less expenses associated with the loan.
8. Other: Dividend income is recorded on the ex-dividend date. Interest income is accrued daily. Premiums and discounts on debt securities purchased are amortized and accreted, respectively, to interest income over the lives of the respective securities. Security transactions are accounted for on the date securities are bought or sold. Costs used to determine realized gains (losses) on the sale of investment securities are those of the specific securities sold. Fees assessed on redemptions of capital shares are credited to paid-in capital.
Each class of shares has equal rights as to assets and earnings, except that each class separately bears certain class-specific expenses related to maintenance of shareholder accounts (included in Management and Administrative expenses) and shareholder reporting. Marketing and distribution expenses are allocated to each class of shares based on a method approved by the board of trustees. Income, other non-class-specific expenses, and gains and losses on investments are allocated to each class of shares based on its relative net assets.
B. Wellington Management Company, LLP, provides investment advisory services to the fund for a fee calculated at an annual percentage rate of average net assets. For the year ended January 31, 2011, the investment advisory fee represented an effective annual rate of 0.15% of the fund’s average net assets.
C. The Vanguard Group furnishes at cost corporate management, administrative, marketing, and distribution services. The costs of such services are allocated to the fund under methods approved by the board of trustees. The fund has committed to provide up to 0.40% of its net assets in capital contributions to Vanguard. At January 31, 2011, the fund had contributed capital of $3,362,000 to Vanguard (included in Other Assets), representing 0.02% of the fund’s net assets and 1.34% of Vanguard’s capitalization. The fund’s trustees and officers are also directors and officers of Vanguard.
D. Various inputs may be used to determine the value of the fund’s investments. These inputs are summarized in three broad levels for financial statement purposes. The inputs or methodologies used to value securities are not necessarily an indication of the risk associated with investing in those securities.
21
Health Care Fund
Level 1—Quoted prices in active markets for identical securities.
Level 2—Other significant observable inputs (including quoted prices for similar securities, interest rates, prepayment speeds, credit risk, etc.).
Level 3—Significant unobservable inputs (including the fund’s own assumptions used to determine the fair value of investments).
The following table summarizes the fund’s investments as of January 31, 2011, based on the inputs used to value them:
| | | |
| | Level 1 | Level 2 | Level 3 |
| Investments | ($000) | ($000) | ($000) |
| Common Stocks—U.S. | 14,345,660 | — | — |
| Common Stocks—International | 149,488 | 4,028,719 | — |
| Temporary Cash Investments | 25,550 | 1,632,094 | — |
| Forward Currency Contracts—Liabilities | — | (5,303) | — |
| Total | 14,520,698 | 5,655,510 | — |
At January 31, 2011, the fund had open forward currency contracts to receive and deliver currencies as follows. Unrealized appreciation (depreciation) on open forward currency contracts is treated as realized gain (loss) for tax purposes.
| | | | | | |
| | | | | | | Unrealized |
| | Contract | | | | | Appreciation |
| | Settlement | | | Contract Amount (000) | (Depreciation) |
| Counterparty | Date | | Receive | | Deliver | ($000) |
| Bank of America NA | 2/24/11 | USD | 65,169 | JPY | 5,451,218 | (1,351) |
| UBS AG | 2/24/11 | USD | 65,130 | JPY | 5,451,218 | (1,390) |
| Barclays Bank plc | 3/24/11 | USD | 97,074 | JPY | 8,160,000 | (2,562) |
| JPY—Japanese yen. |
| USD—U.S. dollar. |
The fund had net unrealized foreign currency gains of $2,917,000 resulting from the translation of other assets and liabilities at January 31, 2011.
F. Distributions are determined on a tax basis and may differ from net investment income and realized capital gains for financial reporting purposes. Differences may be permanent or temporary. Permanent differences are reclassified among capital accounts in the financial statements to reflect their tax character. Temporary differences arise when certain items of income, expense, gain, or loss are recognized in different periods for financial statement and tax purposes; these differences will reverse at some time in the future. Differences in classification may also result from the treatment of short-term gains as ordinary income for tax purposes.
During the year ended January 31, 2011, the fund realized net foreign currency losses of $1,567,000, which decreased distributable net income for tax purposes; accordingly, such losses have been reclassified from accumulated net realized gains to overdistributed net investment income. Certain of the fund’s investments are in securities considered to be “passive foreign investment companies,” for which any unrealized appreciation and/or realized gains are required to be included in distributable net income for tax purposes. Unrealized appreciation of $10,049,000 on the fund’s passive foreign investment company holdings through October 31, 2010 (the most recent previous mark-to-market
22
Health Care Fund
date for tax purposes), has been distributed and is reflected in the balance of overdistributed net investment income. Since October 31, 2010, the fund’s passive foreign investment company holdings have appreciated in value by $5,846,000, increasing the amount of taxable income available for distribution as of January 31, 2011. Unrealized appreciation on the fund’s passive foreign investment company holdings at January 31, 2011, was $15,895,000.
The fund used a tax accounting practice to treat a portion of the price of capital shares redeemed during the year as distributions from net investment income and realized capital gains. Accordingly, the fund has reclassified $17,601,000 from overdistributed net investment income, and $23,893,000 from accumulated net realized gains, to paid-in capital.
For tax purposes, at January 31, 2011, the fund had $33,661,000 of ordinary income and $117,098,000 of long-term capital gains available for distribution.
At January 31, 2011, the cost of investment securities for tax purposes was $14,261,375,000. Net unrealized appreciation of investment securities for tax purposes was $5,920,136,000, consisting of unrealized gains of $6,579,846,000 on securities that had risen in value since their purchase and $659,710,000 in unrealized losses on securities that had fallen in value since their purchase.
G. During the year ended January 31, 2011, the fund purchased $1,567,454,000 of investment securities and sold $2,338,270,000 of investment securities, other than temporary cash investments.
H. Capital share transactions for each class of shares were:
| | | | |
| | | | Year Ended January 31, |
| | | 2011 | | 2010 |
| | Amount | Shares | Amount | Shares |
| | ($000) | (000) | ($000) | (000) |
| Investor Shares | | | | |
| Issued | 498,477 | 4,155 | 682,184 | 6,337 |
| Issued in Lieu of Cash Distributions | 369,784 | 3,003 | 228,626 | 1,898 |
| Redeemed1 | (4,459,040) | (36,589) | (1,738,475) | (16,563) |
| Net Increase (Decrease)—Investor Shares | (3,590,779) | (29,431) | (827,665) | (8,328) |
| Admiral Shares | | | | |
| Issued | 3,306,725 | 63,748 | 545,366 | 11,748 |
| Issued in Lieu of Cash Distributions | 414,764 | 7,993 | 162,555 | 3,200 |
| Redeemed1 | (1,185,915) | (23,405) | (1,130,326) | (25,942) |
| Net Increase (Decrease)—Admiral Shares | 2,535,574 | 48,336 | (422,405) | (10,994) |
| 1 Net of redemption fees for fiscal 2011 and 2010 of $727,000 and $790,000, respectively (fund totals). |
23
Health Care Fund
I. Certain of the fund’s investments are in companies that are considered to be affiliated companies of the fund because the fund owns more than 5% of the outstanding voting securities of the company. Transactions during the period in securities of these companies were as follows:
| | | | | |
| | | | Current Period Transactions | |
| | Jan. 31, 2010 | | Proceeds from | | Jan. 31, 2011 |
| | Market | Purchases | Securities | Dividend | Market |
| | Value | at Cost | Sold | Income | Value |
| | ($000) | ($000) | ($000) | ($000) | ($000) |
| Cephalon Inc. | 348,854 | 20,365 | 5,924 | — | 337,419 |
| Coventry Health Care Inc. | 204,948 | — | 8,556 | — | 258,566 |
| Forest Laboratories Inc. | 893,142 | — | 50,628 | — | 914,668 |
| Health Management Associates Inc. | | | | |
| Class A | 104,626 | — | 12,020 | — | 131,558 |
| NuVasive Inc. | — | 50,073 | — | — | 59,526 |
| OSI Pharmaceuticals Inc. | 131,435 | — | 220,866 | — | — |
| Parexel International Corp. | 60,735 | — | 9,371 | — | NA1 |
| | 1,743,740 | | | | 1,701,737 |
| 1 Not applicable—At January 31, 2011, the security was still held, but the issuer was no longer an affiliated company of the fund. |
J. In preparing the financial statements as of January 31, 2011, management considered the impact of subsequent events for potential recognition or disclosure in these financial statements.
24
Report of Independent Registered
Public Accounting Firm
To the Trustees of Vanguard Specialized Funds and the Shareholders of Vanguard Health Care Fund: In our opinion, the accompanying statement of net assets and statement of assets and liabilities and the related statements of operations and of changes in net assets and the financial highlights present fairly, in all material respects, the financial position of Vanguard Health Care Fund (constituting a separate portfolio of Vanguard Specialized Funds, hereafter referred to as the “Fund”) at January 31, 2011, the results of its operations for the year then ended, the changes in its net assets for each of the two years in the period then ended and the financial highlights for each of the five years in the period then ended, in conformity with accounting principles generally accepted in the United States of America. These financial statements and financial highlights (hereafter referred to as “financial statements”) are the responsibility of the Fund’s management; our responsibility is to express an opinion on these financial statements based on our audits. We conducted our audits of these financial statements in accordance with the standards of the Public Company Accounting Oversight Board (United States). Those standards require that we plan and perform the audit to obtain reasonable assurance about whether the financial statements are free of material misstatement. An audit includes examining, on a test basis, evidence supporting the amounts and disclosures in the financial statements, assessing the accounting principles used and significant estimates made by management, and evaluating the overall financial statement presentation. We believe that our audits, which included confirmation of securities at January 31, 2011 by correspondence with the custodians and brokers, provide a reasonable basis for our opinion.
PricewaterhouseCoopers LLP
Philadelphia, Pennsylvania
March 11, 2011
|
| Special 2010 tax information (unaudited) for Vanguard Health Care Fund |
This information for the fiscal year ended January 31, 2011, is included pursuant to provisions of the Internal Revenue Code.
The fund distributed $525,936,000 as capital gain dividends (from net long-term capital gains) to shareholders during the fiscal year.
The fund distributed $340,031,000 of qualified dividend income to shareholders during the fiscal year.
For corporate shareholders, 59.2% of investment income (dividend income plus short-term gains, if any) qualifies for the dividends-received deduction.
25
Your Fund’s After-Tax Returns
This table presents returns for your fund both before and after taxes. The after-tax returns are shown in two ways: (1) assuming that an investor owned the fund during the entire period and paid taxes on the fund’s distributions, and (2) assuming that an investor paid taxes on the fund’s distributions and sold all shares at the end of each period.
Calculations are based on the highest individual federal income tax and capital gains tax rates in effect at the times of the distributions and the hypothetical sales. State and local taxes were not considered. After-tax returns reflect any qualified dividend income , using actual prior-year figures and estimates for 2011. (In the example, returns after the sale of fund shares may be higher than those assuming no sale. This occurs when the sale would have produced a capital loss. The calculation assumes that the investor received a tax deduction for the loss.) The table shows returns for Investor Shares only; returns for other share classes will differ. Please note that your actual after-tax returns will depend on your tax situation and may differ from those shown. Also note that if you own the fund in a tax-deferred account, such as an individual retirement account or a 401(k) plan, this information does not apply to you. Such accounts are not subject to current taxes.
Finally, keep in mind that a fund’s performance—whether before or after taxes—does not guarantee future results.
Average Annual Total Returns: Health Care Fund Investor Shares
Periods Ended January 31, 2011
| | | |
| | One | Five | Ten |
| | Year | Years | Years |
| Returns Before Taxes | 7.95% | 3.67% | 5.78% |
| Returns After Taxes on Distributions | 7.28 | 2.64 | 4.79 |
| Returns After Taxes on Distributions and Sale of Fund Shares | 6.03 | 2.99 | 4.76 |
Returns do not reflect the 1% fee on redemptions of shares held for less than one year.
26
About Your Fund’s Expenses
As a shareholder of the fund, you incur ongoing costs, which include costs for portfolio management, administrative services, and shareholder reports (like this one), among others. Operating expenses, which are deducted from a fund’s gross income, directly reduce the investment return of the fund.
A fund’s expenses are expressed as a percentage of its average net assets. This figure is known as the expense ratio. The following examples are intended to help you understand the ongoing costs (in dollars) of investing in your fund and to compare these costs with those of other mutual funds. The examples are based on an investment of $1,000 made at the beginning of the period shown and held for the entire period.
The accompanying table illustrates your fund’s costs in two ways:
• Based on actual fund return. This section helps you to estimate the actual expenses that you paid over the period. The ”Ending Account Value“ shown is derived from the fund‘s actual return, and the third column shows the dollar amount that would have been paid by an investor who started with $1,000 in the fund. You may use the information here, together with the amount you invested, to estimate the expenses that you paid over the period.
To do so, simply divide your account value by $1,000 (for example, an $8,600 account value divided by $1,000 = 8.6), then multiply the result by the number given for your fund under the heading ”Expenses Paid During Period.“
• Based on hypothetical 5% yearly return. This section is intended to help you compare your fund‘s costs with those of other mutual funds. It assumes that the fund had a yearly return of 5% before expenses, but that the expense ratio is unchanged. In this case—because the return used is not the fund’s actual return—the results do not apply to your investment. The example is useful in making comparisons because the Securities and Exchange Commission requires all mutual funds to calculate expenses based on a 5% return. You can assess your fund’s costs by comparing this hypothetical example with the hypothetical examples that appear in shareholder reports of other funds.
Note that the expenses shown in the table are meant to highlight and help you compare ongoing costs only and do not reflect transaction costs incurred by the fund for buying and selling securities. Further, the expenses do not include the 1% fee on redemptions of shares held for less than one year, nor do they include the account service fee described in the prospectus. If such fees were applied to your account, your costs would be higher. Your fund does not carry a “sales load.” The calculations assume no shares were bought or sold during the period. Your actual costs may have been higher or lower, depending on the amount of your investment and the timing of any purchases or redemptions.
You can find more information about the fund’s expenses, including annual expense ratios, in the Financial Statements section of this report. For additional information on operating expenses and other shareholder costs, please refer to your fund’s current prospectus.
27
Six Months Ended January 31, 2011
| | | |
| | Beginning | Ending | Expenses |
| | Account Value | Account Value | Paid During |
| Health Care Fund | 7/31/2010 | 1/31/2011 | Period |
| Based on Actual Fund Return | | | |
| Investor Shares | $1,000.00 | $1,133.81 | $1.88 |
| Admiral Shares | 1,000.00 | 1,133.96 | 1.61 |
| Based on Hypothetical 5% Yearly Return | | | |
| Investor Shares | $1,000.00 | $1,023.44 | $1.79 |
| Admiral Shares | 1,000.00 | 1,023.69 | 1.53 |
The calculations are based on expenses incurred in the most recent six-month period. The fund’s annualized six-month expense ratios for that period are 0.35% for Investor Shares and 0.30% for Admiral Shares. The dollar amounts shown as “Expenses Paid” are equal to the annualized expense ratio multiplied by the average account value over the period, multiplied by the number of days in the most recent six-month period, then divided by the number of days in the most recent 12-month period.
28
Glossary
30-Day SEC Yield. A fund’s 30-day SEC yield is derived using a formula specified by the U.S. Securities and Exchange Commission. Under the formula, data related to the fund’s security holdings in the previous 30 days are used to calculate the fund’s hypothetical net income for that period, which is then annualized and divided by the fund’s estimated average net assets over the calculation period. For the purposes of this calculation, a security’s income is based on its current market yield to maturity (in the case of bonds) or its projected dividend yield (for stocks). Because the SEC yield represents hypothetical annualized income, it will differ—at times significantly—from the fund’s actual experience. As a result, the fund’s income distributions may be higher or lower than implied by the SEC yield.
Beta. A measure of the magnitude of a fund’s past share-price fluctuations in relation to the ups and downs of a given market index. The index is assigned a beta of 1.00. Compared with a given index, a fund with a beta of 1.20 typically would have seen its share price rise or fall by 12% when the index rose or fell by 10%. For this report, beta is based on returns over the past 36 months for both the fund and the index. Note that a fund’s beta should be reviewed in conjunction with its R-squared (see definition). The lower the R-squared, the less correlation there is between the fund and the index, and the less reliable beta is as an indicator of volatility.
Dividend Yield. Dividend income earned by stocks, expressed as a percentage of the aggregate market value (or of net asset value, for a fund). The yield is determined by dividing the amount of the annual dividends by the aggregate value (or net asset value) at the end of the period. For a fund, the dividend yield is based solely on stock holdings and does not include any income produced by other investments.
Earnings Growth Rate. The average annual rate of growth in earnings over the past five years for the stocks now in a fund.
Equity Exposure. A measure that reflects a fund’s investments in stocks and stock futures. Any holdings in short-term reserves are excluded.
Expense Ratio. The percentage of a fund’s average net assets used to pay its annual administrative and advisory expenses. These expenses directly reduce returns to investors.
Foreign Holdings. The percentage of a fund represented by stocks or depositary receipts of companies based outside the United States.
Inception Date. The date on which the assets of a fund (or one of its share classes) are first invested in accordance with the fund’s investment objective. For funds with a subscription period, the inception date is the day after that period ends. Investment performance is measured from the inception date.
Median Market Cap. An indicator of the size of companies in which a fund invests; the midpoint of market capitalization (market price x shares outstanding) of a fund’s stocks, weighted by the proportion of the fund’s assets invested in each stock. Stocks representing half of the fund’s assets have market capitalizations above the median, and the rest are below it.
Price/Book Ratio. The share price of a stock divided by its net worth, or book value, per share. For a fund, the weighted average price/book ratio of the stocks it holds.
29
Price/Earnings Ratio. The ratio of a stock’s current price to its per-share earnings over the past year. For a fund, the weighted average P/E of the stocks it holds. P/E is an indicator of market expectations about corporate prospects; the higher the P/E, the greater the expectations for a company’s future growth.
R-Squared. A measure of how much of a fund’s past returns can be explained by the returns from the market in general, as measured by a given index. If a fund’s total returns were precisely synchronized with an index’s returns, its R-squared would be 1.00. If the fund’s returns bore no relationship to the index’s returns, its R-squared would be 0. For this report, R-squared is based on returns over the past 36 months for both the fund and the index.
Return on Equity. The annual average rate of return generated by a company during the past five years for each dollar of shareholder’s equity (net income divided by shareholder’s equity). For a fund, the weighted average return on equity for the companies whose stocks it holds.
Short-Term Reserves. The percentage of a fund invested in highly liquid, short-term securities that can be readily converted to cash.
Turnover Rate. An indication of the fund’s trading activity. Funds with high turnover rates incur higher transaction costs and may be more likely to distribute capital gains (which may be taxable to investors). The turnover rate excludes in-kind transactions, which have minimal impact on costs.
30
This page intentionally left blank.
The People Who Govern Your Fund
The trustees of your mutual fund are there to see that the fund is operated and managed in your best interests since, as a shareholder, you are a part owner of the fund. Your fund’s trustees also serve on the board of directors of The Vanguard Group, Inc., which is owned by the Vanguard funds and provides services to them on an at-cost basis.
A majority of Vanguard’s board members are independent, meaning that they have no affiliation with Vanguard or the funds they oversee, apart from the sizable personal investments they have made as private individuals. The independent board members have distinguished backgrounds in business, academia, and public service. Each of the trustees and executive officers oversees 179 Vanguard funds.
The following table provides information for each trustee and executive officer of the fund. More information about the trustees is in the Statement of Additional Information, which can be obtained, without charge, by contacting Vanguard at 800-662-7447, or online at vanguard.com.
| |
| Interested Trustee1 | and President (2006–2008) of Rohm and Haas Co. |
| | (chemicals); Director of Tyco International, Ltd. |
| F. William McNabb III | (diversified manufacturing and services) and Hewlett- |
| Born 1957. Trustee Since July 2009. Chairman of the | Packard Co. (electronic computer manufacturing); |
| Board. Principal Occupation(s) During the Past Five | Senior Advisor at New Mountain Capital; Trustee |
| Years: Chairman of the Board of The Vanguard Group, | of The Conference Board; Member of the Board of |
| Inc., and of each of the investment companies served | Managers of Delphi Automotive LLP (automotive |
| by The Vanguard Group, since January 2010; Director | components). |
| of The Vanguard Group since 2008; Chief Executive | |
| Officer and President of The Vanguard Group and of | Amy Gutmann |
| each of the investment companies served by The | Born 1949. Trustee Since June 2006. Principal |
| Vanguard Group since 2008; Director of Vanguard | Occupation(s) During the Past Five Years: President |
| Marketing Corporation; Managing Director of The | of the University of Pennsylvania; Christopher H. |
| Vanguard Group (1995–2008). | Browne Distinguished Professor of Political Science |
| | in the School of Arts and Sciences with secondary |
| | appointments at the Annenberg School for Commu- |
| Independent Trustees | nication and the Graduate School of Education |
| | of the University of Pennsylvania; Director of |
| Emerson U. Fullwood | Carnegie Corporation of New York, Schuylkill River |
| Born 1948. Trustee Since January 2008. Principal | Development Corporation, and Greater Philadelphia |
| Occupation(s) During the Past Five Years: Executive | Chamber of Commerce; Trustee of the National |
| Chief Staff and Marketing Officer for North America | Constitution Center; Chair of the Presidential |
| and Corporate Vice President (retired 2008) of Xerox | Commission for the Study of Bioethical Issues. |
| Corporation (document management products and | |
| services); Executive in Residence and 2010 | JoAnn Heffernan Heisen |
| Distinguished Minett Professor at the Rochester | Born 1950. Trustee Since July 1998. Principal |
| Institute of Technology; Director of SPX Corporation | Occupation(s) During the Past Five Years: Corporate |
| (multi-industry manufacturing), the United Way of | Vice President and Chief Global Diversity Officer |
| Rochester, Amerigroup Corporation (managed health | (retired 2008) and Member of the Executive |
| care), the University of Rochester Medical Center, | Committee (1997–2008) of Johnson & Johnson |
| Monroe Community College Foundation, and North | (pharmaceuticals/consumer products); Director of |
| Carolina A&T University. | Skytop Lodge Corporation (hotels), the University |
| | Medical Center at Princeton, the Robert Wood |
| Rajiv L. Gupta | Johnson Foundation, and the Center for Work Life |
| Born 1945. Trustee Since December 2001.2 | Policy; Member of the Advisory Board of the |
| Principal Occupation(s) During the Past Five Years: | Maxwell School of Citizenship and Public Affairs |
| Chairman and Chief Executive Officer (retired 2009) | at Syracuse University. |
| | |
| F. Joseph Loughrey | Thomas J. Higgins | |
| Born 1949. Trustee Since October 2009. Principal | Born 1957. Chief Financial Officer Since September |
| Occupation(s) During the Past Five Years: President | 2008. Principal Occupation(s) During the Past Five |
| and Chief Operating Officer (retired 2009) and Vice | Years: Principal of The Vanguard Group, Inc.; Chief |
| Chairman of the Board (2008–2009) of Cummins Inc. | Financial Officer of each of the investment companies |
| (industrial machinery); Director of SKF AB (industrial | served by The Vanguard Group since 2008; Treasurer |
| machinery), Hillenbrand, Inc. (specialized consumer | of each of the investment companies served by The |
| services), the Lumina Foundation for Education, and | Vanguard Group (1998–2008) . |
| Oxfam America; Chairman of the Advisory Council | | |
| for the College of Arts and Letters and Member | Kathryn J. Hyatt | |
| of the Advisory Board to the Kellogg Institute for | Born 1955. Treasurer Since November 2008. Principal |
| International Studies at the University of Notre Dame. | Occupation(s) During the Past Five Years: Principal |
| | of The Vanguard Group, Inc.; Treasurer of each of |
| André F. Perold | the investment companies served by The Vanguard |
| Born 1952. Trustee Since December 2004. Principal | Group since 2008; Assistant Treasurer of each of the |
| Occupation(s) During the Past Five Years: George | investment companies served by The Vanguard Group |
| Gund Professor of Finance and Banking at the Harvard | (1988–2008). | |
| Business School; Chair of the Investment Committee | | |
| of HighVista Strategies LLC (private investment firm). | Heidi Stam | |
| | Born 1956. Secretary Since July 2005. Principal |
| Alfred M. Rankin, Jr. | Occupation(s) During the Past Five Years: Managing |
| Born 1941. Trustee Since January 1993. Principal | Director of The Vanguard Group, Inc., since 2006; |
| Occupation(s) During the Past Five Years: Chairman, | General Counsel of The Vanguard Group since 2005; |
| President, and Chief Executive Officer of NACCO | Secretary of The Vanguard Group and of each of the |
| Industries, Inc. (forklift trucks/housewares/lignite); | investment companies served by The Vanguard Group |
| Director of Goodrich Corporation (industrial products/ | since 2005; Director and Senior Vice President of |
| aircraft systems and services) and the National | Vanguard Marketing Corporation since 2005; |
| Association of Manufacturers; Chairman of the Federal | Principal of The Vanguard Group (1997–2006). |
| Reserve Bank of Cleveland; Trustee of University | | |
| Hospitals of Cleveland; President of the Board of The | | |
| Cleveland Museum of Art. | Vanguard Senior Management Team |
| |
| Peter F. Volanakis | R. Gregory Barton | Michael S. Miller |
| Born 1955. Trustee Since July 2009. Principal | Mortimer J. Buckley | James M. Norris |
| Occupation(s) During the Past Five Years: President | Kathleen C. Gubanich | Glenn W. Reed |
| and Chief Operating Officer (retired 2010) of Corning | Paul A. Heller | George U. Sauter |
| Incorporated (communications equipment); Director of | | |
| Corning Incorporated (2000–2010) and Dow Corning | | |
| (2001–2010); Trustee of the Corning Incorporated | Chairman Emeritus and Senior Advisor |
| Foundation and the Corning Museum of Glass; | | |
| Overseer of the Amos Tuck School of Business | John J. Brennan | |
| Administration at Dartmouth College. | Chairman, 1996–2009 | |
| | Chief Executive Officer and President, 1996–2008 |
| |
| Executive Officers | | |
| | Founder | |
| Glenn Booraem | | |
| Born 1967. Controller Since July 2010. Principal | John C. Bogle | |
| Occupation(s) During the Past Five Years: Principal | Chairman and Chief Executive Officer, 1974–1996 |
| of The Vanguard Group, Inc.; Controller of each of | | |
| the investment companies served by The Vanguard | | |
| Group since 2010; Assistant Controller of each of | | |
| the investment companies served by The Vanguard | | |
| Group (2001–2010). | | |
1 Mr. McNabb is considered an “interested person,” as defined in the Investment Company Act of 1940, because he is an officer of the Vanguard funds.
2 December 2002 for Vanguard Equity Income Fund, Vanguard Growth Equity Fund, the Vanguard Municipal Bond Funds, and the Vanguard State Tax-Exempt Funds.
|  |
| P.O. Box 2600 |
| Valley Forge, PA 19482-2600 |
Connect with Vanguard® > vanguard.com
| |
| Fund Information > 800-662-7447 | CFA® is a trademark owned by CFA Institute. |
| Direct Investor Account Services > 800-662-2739 | |
| Institutional Investor Services > 800-523-1036 | |
| Text Telephone for People | |
| With Hearing Impairment > 800-749-7273 | |
| |
| This material may be used in conjunction | |
| with the offering of shares of any Vanguard | |
| fund only if preceded or accompanied by | |
| the fund’s current prospectus. | |
| |
| All comparative mutual fund data are from Lipper Inc. or | |
| Morningstar, Inc., unless otherwise noted. | |
| |
| You can obtain a free copy of Vanguard’s proxy voting | |
| guidelines by visiting vanguard.com/proxyreporting or by | |
| calling Vanguard at 800-662-2739. The guidelines are | |
| also available from the SEC’s website, sec.gov. In | |
| addition, you may obtain a free report on how your fund | |
| voted the proxies for securities it owned during the 12 | |
| months ended June 30. To get the report, visit either | |
| vanguard.com/proxyreporting or sec.gov. | |
| |
| You can review and copy information about your fund at | |
| the SEC’s Public Reference Room in Washington, D.C. To | |
| find out more about this public service, call the SEC at | |
| 202-551-8090. Information about your fund is also | |
| available on the SEC’s website, and you can receive | |
| copies of this information, for a fee, by sending a | |
| request in either of two ways: via e-mail addressed to | |
| publicinfo@sec.gov or via regular mail addressed to the | |
| Public Reference Section, Securities and Exchange | |
| Commission, Washington, DC 20549-1520. | |
| © 2011 The Vanguard Group, Inc. All rights reserved. |
| Vanguard Marketing Corporation, Distributor. |
| Q520 032011 |
 |
|
| Vanguard REIT Index Fund |
| Annual Report |
|
| January 31, 2011 |
 |
> Vanguard REIT Index Fund returned about 40% for the fiscal year ended January 31, 2011.
> The fund closely tracked its benchmark index and surpassed the average return of its peer group.
> All real estate investment trust (REIT) segments delivered impressive returns, with residential REITs posting the strongest results.
| |
| Contents | |
| Your Fund’s Total Returns. | 1 |
| Chairman’s Letter. | 2 |
| Fund Profile. | 7 |
| Performance Summary. | 8 |
| Financial Statements. | 11 |
| Your Fund’s After-Tax Returns. | 30 |
| About Your Fund’s Expenses. | 31 |
| Glossary. | 33 |
 REIT Index Fund
Please note: The opinions expressed in this report are just that—informed opinions. They should not be considered promises or advice.
Also, please keep in mind that the information and opinions cover the period through the date on the front of this report. Of course, the risks of investing in your fund are spelled out in the prospectus.
See the Glossary for definitions of investment terms used in this report.
Cover photograph: Jean Maher.
Your Fund’s Total Returns
Fiscal Year Ended January 31, 2011
| |
| | Total |
| | Returns |
| Vanguard REIT Index Fund | |
| Investor Shares | 40.02% |
| Admiral™ Shares | 40.21 |
| Signal® Shares | 40.25 |
| Institutional Shares | 40.24 |
| ETF Shares | |
| Market Price | 40.27 |
| Net Asset Value | 40.19 |
| MSCI US REIT Index | 40.23 |
| Real Estate Funds Average | 38.56 |
| Real Estate Funds Average: Derived from data provided by Lipper Inc. |
Admiral Shares carry lower expenses and are available to investors who meet certain account-balance requirements. Signal Shares and Institutional Shares are available to certain institutional investors who meet specific administrative, service, and account-size criteria. The Vanguard ETF® Shares shown are traded on the NYSE Arca exchange and are available only through brokers. The table provides ETF returns based on both the NYSE Arca market price and the net asset value for a share. U.S. Pat. No. 6,879,964 B2; 7,337,138.
For the ETF Shares, the market price is determined by the midpoint of the bid-offer spread as of the closing time of the New York Stock Exchange (generally 4 p.m., Eastern time). The net asset value is also determined as of the NYSE closing time. For more information about how the ETF Shares' market prices have compared with their net asset value, visit vanguard.com, select your ETF, and then select the Price and Performance tab. The ETF premium/discount analysis there shows the percentages of days on which the ETF Shares' market price was above or below the NAV.
Your Fund’s Performance at a Glance
January 31, 2010 , Through January 31, 2011
| | | | | |
| | | | Distributions Per Share | |
| | Starting | Ending | Income | Capital | Return of |
| | Share Price | Share Price | Dividends | Gains | Capital |
| Vanguard REIT Index Fund | | | | | |
| Investor Shares | $14.05 | $18.99 | $0.603 | $0.000 | $0.000 |
| Admiral Shares | 59.95 | 81.03 | 2.674 | 0.000 | 0.000 |
| Signal Shares | 16.00 | 21.63 | 0.715 | 0.000 | 0.000 |
| Institutional Shares | 9.28 | 12.54 | 0.419 | 0.000 | 0.000 |
| ETF Shares | 42.30 | 57.17 | 1.891 | 0.000 | 0.000 |
1

Chairman’s Letter
Dear Shareholder,
The REIT sector was one of the brightest areas in a stock market that continued its steady climb. Vanguard REIT Index Fund returned about 40% for the fiscal year ended January 31, 2011, in line with the result for its target index and a bit better than its peer-group average return. It was the second straight year the fund posted returns of 40% or more and outperformed the broad U.S. stock market.
REITs, which took a harsh beating during the financial crisis of 2008 and 2009, continued to strengthen their balance sheets and reduce debt. All six subsectors of the REIT market benefited from the improved economic environment and finished the fiscal year with returns of at least 30%. Residential REITs recorded the best returns for the fund, retail REITs performed well, and specialized REITs also contributed greatly to the fund’s return.
Please note: As part of our ongoing efforts to lower the cost of investing for all of our clients, we have broadened the availability of our lower-cost Admiral Shares, reducing the Admiral minimums for most of our broad-market index funds, including the REIT Index Fund, from $100,000 to $10,000.
If you own the fund in a taxable account, you may wish to review information about its after-tax returns provided later in this report.
2
Stocks rallied as economy ground into gear
Global stock markets produced excellent returns in the year ended January 31, 2011, with much of the strength materializing in the second half of the year. Europe’s sovereign debt challenges and concerns that the economic recovery in the United States might not reach escape velocity seemed to recede from investors’ minds, displaced by strong corporate earnings and a powerful rebound in consumer spending and in the manufacturing sector.
The U.S. stock market returned about 24%. Small- and mid-capitalization stocks, often the first to respond to changes in the economic outlook, did even better. As a group, non-U.S. stock markets returned more than 18%. Emerging markets were the best performers. Despite high-profile dramas in Europe’s government bond markets, European stocks produced double-digit gains. Asia’s developed markets turned in mixed results on local exchanges, but the strength of the yen, the Australian dollar, and other regional currencies bolstered returns for U.S.-based investors.
A strong start and a faltering finish for bonds
In January 2010, the bond market’s near-term prospects looked dubious, in large part because yields hovered near generational lows. Over the following 12 months, however, yields dipped lower still. The taxable bond market returned about 5% for the year. As investors searched for
Market Barometer
| | | |
| | | Average Annual Total Returns |
| | | Periods Ended January 31, 2011 |
| | One | Three | Five |
| | Year | Years | Years |
| Stocks | | | |
| Russell 1000 Index (Large-caps) | 23.33% | 0.45% | 2.51% |
| Russell 2000 Index (Small-caps) | 31.36 | 4.57 | 2.64 |
| Dow Jones U.S. Total Stock Market Index | 24.31 | 1.22 | 2.86 |
| MSCI All Country World Index ex USA (International) | 18.50 | -0.96 | 4.08 |
| |
| Bonds | | | |
| Barclays Capital U.S. Aggregate Bond Index (Broad | | | |
| taxable market) | 5.06% | 5.36% | 5.82% |
| Barclays Capital Municipal Bond Index (Broad | | | |
| tax-exempt market) | 1.10 | 3.39 | 3.88 |
| Citigroup Three-Month U.S. Treasury Bill Index | 0.14 | 0.59 | 2.23 |
| |
| CPI | | | |
| Consumer Price Index | 1.63% | 1.42% | 2.12% |
3
yield, corporate bonds produced the best returns, with the riskiest credits leading the market.
Toward the end of the fiscal year, an improving economic outlook nudged interest rates higher, putting pressure on bond prices. This dynamic was evident in the municipal bond market, where rising rates and a confluence of other factors weighed on prices. The expiration of the Build America Bonds program, for example, raised the prospect of a spike in new tax-exempt issuance, while the extension of federal tax rate cuts that were set to expire made munis’ tax exemption somewhat less attractive. For the full year, the muni market returned about 1%.
As it has since December 2008, the Federal Reserve held its target for short-term interest rates near 0%, keeping the returns available from money market instruments such as the 3-month Treasury bill in the same neighborhood.
Every subsector contributed to the fund’s strong performance
While the broader stock market has experienced pockets of volatility during an impressive recovery that is now approaching the two-year mark, the REIT market has enjoyed a largely tremor-free rally. Of course, REITs fell even further than the broader market during the financial crisis, but they’ve regained their footing as the economy has fought back. There is often a connection to
Expense Ratios
Your Fund Compared With Its Peer Group
| | | | | | |
| | | | | | | Peer |
| | Investor | Admiral | Signal | Institutional | ETF | Group |
| | Shares | Shares | Shares | Shares | Shares | Average |
| REIT Index Fund | 0.26% | 0.13% | 0.14% | 0.09% | 0.13% | 1.44% |
The fund expense ratios shown are from the prospectus dated May 28, 2010, and represent estimated costs for the current fiscal year. For the fiscal year ended January 31, 2011, the fund’s expense ratios were 0.26% for Investor Shares, 0.12% for Admiral Shares, 0.12% for Signal Shares, 0.08% for Institutional Shares, and 0.12% for ETF Shares. The peer-group expense ratio is derived from data provided by Lipper Inc. and captures information through year-end 2010.
Peer group: Real Estate Funds.
4
the economy and the health of REITs, because rental rates and demand are sensitive to a range of economic forces.
The recent strong performance of REITs can also be linked to yields. REITs, which are required to distribute at least 90% of their taxable income to their shareholders, seem to be drawing the attention of income-seeking investors pinched by historically low interest rates. The strong demand helped lift share prices for REITs.
Residential REITs returned almost 60% for the fiscal year. Most residential REITs own apartment buildings, which have benefited from the moribund home buyers’ market. Rental demand has been relatively strong because it remains difficult for many people to obtain the credit necessary to buy a home, while others simply aren’t willing to make the financial commitment in the still-skittish economy.
For different reasons, economic conditions also buoyed retail REITs. The economy has settled enough to draw retailers to the desirable properties usually owned by REITs, such as malls and other prime locations. Rental rates, which had bottomed out during the financial crisis, began trending up again because of increased demand.
The improved economy also has helped specialized REITs, the largest REIT subsector, which includes hotels, hospitality properties, and self-storage companies. Office, diversified, and industrial REITs didn’t perform quite as
Total Returns
Ten Years Ended January 31, 2011
| |
| | Average |
| | Annual Return |
| REIT Index Fund Investor Shares | 10.89% |
| REIT Spliced Index | 10.92 |
| Real Estate Funds Average | 9.96 |
REIT Spliced Index: MSCI US REIT Index adjusted to include a 2% cash position (Lipper Money Market Average) through April 30, 2009; MSCI US REIT Index thereafter.
Real Estate Funds Average: Derived from data provided by Lipper Inc.
The figures shown represent past performance, which is not a guarantee of future results. (Current performance may be lower or higher than the performance data cited. For performance data current to the most recent month-end, visit our website at vanguard.com/performance.) Note, too, that both investment returns and principal value can fluctuate widely, so an investor’s shares, when sold, could be worth more or less than their original cost.
5
well as their brethren in the other REIT subsectors, but they all registered returns of more than 30% for the fiscal year.
Fund achieved solid returns over recent decade
The REIT Index Fund fared much better than the broader stock market over the past decade. Despite experiencing a severe downturn during its 2008 and 2009 fiscal years as the financial crisis deepened, the fund managed an average annual return of 10.89% for the decade, tightly tracking its benchmark index and eclipsing the average annual return of its real estate fund peers by about 1 percentage point. By comparison, the broader U.S. stock market, as measured by the Dow Jones U.S. Total Stock Market Index, posted an average annual return of 2.47% for the same period.
The fund’s tight tracking is a tribute to Vanguard Quantitative Equity Group, the portfolio’s advisor. Quantitative Equity Group has about 35 years of experience developing and implementing sophisticated indexing techniques and trading methodologies. The fund is also helped by its extremely low costs, which help ensure more of its returns are retained by you, our shareholders.
REIT funds offer opportunity for further diversification
While the REIT Fund’s annualized returns over the past decade indicate a solid performance, the road leading to those results wasn’t smooth: It was paved with volatility and risk. Before the recent two-year rally in the REIT market, the fund suffered through fiscal-year returns of about –48% for 2009 and –23% for 2008. Of course, investors who sold their shares when times were bleakest didn’t share in the recovery.
The REIT Index Fund, which offers exposure to a narrow but meaningful slice of the stock market, is suited for investors who are looking to further diversify or fill a potential gap in their portfolios. REITs frequently behave independently from the broad stock market, and the dramatic movements––both up and down––they’ve experienced the past few years are not unusual.
Vanguard counsels every client to maintain a long-term approach and build a portfolio that includes a diversified mix of stocks, bonds, and cash that is consistent with his or her goals, time horizon, and risk tolerance. The REIT Index Fund, with its low costs and broad exposure to the commercial real estate market, can help add diversification to an already well-rounded portfolio.
As always, thank you for entrusting your assets to Vanguard.
Sincerely,

F. William McNabb III
Chairman and Chief Executive Officer
February 10, 2011
6
REIT Index Fund
Fund Profile
As of January 31, 2011
| | | | | |
| Share-Class Characteristics | | | | | |
| | Investor | Admiral | Signal | Institutional | ETF |
| | Shares | Shares | Shares | Shares | Shares |
| Ticker Symbol | VGSIX | VGSLX | VGRSX | VGSNX | VNQ |
| Expense Ratio1 | 0.26% | 0.13% | 0.14% | 0.09% | 0.13% |
| | | |
| Portfolio Characteristics | | |
| | | | DJ |
| | | | U.S. Total |
| | | MSCI US | Market |
| | Fund | REIT Index | Index |
| Number of Stocks | 104 | 103 | 3,858 |
| Median Market Cap | $6.3B | $6.3B | $30.9B |
| Price/Earnings Ratio | 206.5x | 206.5x | 17.7x |
| Price/Book Ratio | 2.2x | 2.2x | 2.3x |
| Return on Equity | 5.9% | 5.9% | 19.0% |
| Earnings Growth Rate | -7.8% | -7.8% | 6.0% |
| Dividend Yield | 3.6% | 3.6% | 1.7% |
| Turnover Rate | 12% | — | — |
| Short-Term Reserves | 0.6% | — | — |
Dividend Yield: This yield may include some payments that represent a return of capital, capital gains distributions, or both by the underlying REITs. These amounts are determined by each REIT at the end of its fiscal year.
| Subindustry Diversification (% of equity exposure) | | |
| | | MSCI US |
| | Fund | REIT Index |
| Diversified REITs | 7.7% | 7.7% |
| Industrial REITs | 5.8 | 5.8 |
| Office REITs | 16.4 | 16.4 |
| Residential REITs | 16.5 | 16.5 |
| Retail REITs | 26.0 | 26.0 |
| Specialized REITs | 27.6 | 27.6 |
| | |
| Volatility Measures | | |
| | | DJ |
| | REIT | U.S. Total |
| | Spliced | Market |
| | Index | Index |
| R-Squared | 1.00 | 0.70 |
| Beta | 1.00 | 1.49 |
| These measures show the degree and timing of the fund’s fluctuations compared with the indexes over 36 months. |
|
| |
| Ten Largest Holdings (% of total net assets) |
| Simon Property Group | Retail REITs | |
| Inc. | | 9.0% |
| Public Storage | Specialized REITs | 4.8 |
| Equity Residential | Residential REITs | 4.7 |
| Vornado Realty Trust | Diversified REITs | 4.4 |
| HCP Inc. | Specialized REITs | 4.1 |
| Boston Properties Inc. | Office REITs | 4.0 |
| Host Hotels & Resorts | Specialized REITs | |
| Inc. | | 3.7 |
| AvalonBay Communities | Residential REITs | |
| Inc. | | 3.0 |
| Ventas Inc. | Specialized REITs | 2.6 |
| ProLogis | Industrial REITs | 2.5 |
| Top Ten | | 42.8% |
| The holdings listed exclude any temporary cash investments and equity index products. |
1 The expense ratios shown are from the prospectus dated May 28, 2010, and represent estimated costs for the current fiscal year. For the fiscal year ended January 31, 2011, the expense ratios were 0.26% for Investor Shares, 0.12% for Admiral Shares, 0.12% for Signal Shares, 0.08% for Institutional Shares, and 0.12% for ETF Shares.
7
REIT Index Fund
Performance Summary
All of the returns in this report represent past performance, which is not a guarantee of future results that may be achieved by the fund. (Current performance may be lower or higher than the performance data cited. For performance data current to the most recent month-end, visit our website at vanguard.com/performance.) Note, too, that both investment returns and principal value can fluctuate widely, so an investor’s shares, when sold, could be worth more or less than their original cost. The returns shown do not reflect taxes that a shareholder would pay on fund distributions or on the sale of fund shares.
Cumulative Performance: January 31, 2001, Through January 31, 2011
Initial Investment of $10,000
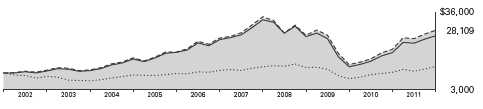
| | | | |
| | Average Annual Total Returns | |
| | Periods Ended January 31, 2011 | |
| | | | | Final Value |
| | One | Five | Ten | of a $10,000 |
| | Year | Years | Years | Investment |
| REIT Index Fund Investor Shares | 40.02% | 2.56% | 10.89% | $28,109 |
| Dow Jones U.S. Total Stock Market | | | | |
| Index | 24.31 | 2.86 | 2.47 | 12,759 |
| REIT Spliced Index | 40.23 | 2.52 | 10.92 | 28,178 |
| Real Estate Funds Average | 38.56 | 1.32 | 9.96 | 25,837 |
REIT Spliced Index: MSCI US REIT Index adjusted to include a 2% cash position (Lipper Money Market Average) through April 30, 2009; MSCI US REIT Index thereafter.
Real Estate Funds Average: Derived from data provided by Lipper Inc.
Vanguard fund returns do not reflect the 1% fee on redemptions of shares held for less than one year. The fee does not apply to the ETF Shares.
See Financial Highlights for dividend and capital gains information.
8
REIT Index Fund
| | | | |
| | | Average Annual Total Returns | |
| | | Periods Ended January 31, 2011 | |
| | | | Since | Final Value |
| | One | Five | Inception | of a $10,000 |
| | Year | Years | (11/12/2001) | Investment |
| REIT Index Fund Admiral Shares | 40.21% | 2.67% | 11.30% | $26,839 |
| Dow Jones U.S. Total Stock Market | | | | |
| Index | 24.31 | 2.86 | 4.88 | 15,517 |
| REIT Spliced Index | 40.23 | 2.52 | 11.22 | 26,647 |
| "Since Inception" performance is calculated from the Admiral Shares’ inception date for both the fund and its comparative standards. |
| | | |
| | | Since | Final Value |
| | One | Inception | of a $10,000 |
| | Year | (6/4/2007) | Investment |
| REIT Index Fund Signal Shares | 40.25% | -3.59% | $8,747 |
| Dow Jones U.S. Total Stock Market | | | |
| Index | 24.31 | -1.79 | 9,361 |
| REIT Spliced Index | 40.23 | -3.79 | 8,682 |
| "Since Inception" performance is calculated from the Signal Shares’ inception date for both the fund and its comparative standards. |
| | | | |
| | | | Since | Final Value |
| | One | Five | Inception | of a $5,000,000 |
| | Year | Years | (12/2/2003) | Investment |
| REIT Index Fund Institutional Shares | 40.24% | 2.70% | 8.86% | $9,187,761 |
| Dow Jones U.S. Total Stock Market | | | | |
| Index | 24.31 | 2.86 | 5.62 | 7,397,993 |
| REIT Spliced Index | 40.23 | 2.52 | 8.72 | 9,098,737 |
| "Since Inception" performance is calculated from the Institutional Shares’ inception date for both the fund and its comparative standards. |
| | | | |
| | | | Since | Final Value |
| | One | Five | Inception | of a $10,000 |
| | Year | Years | (9/23/2004) | Investment |
| REIT Index Fund | | | | |
| ETF Shares Net Asset Value | 40.19% | 2.67% | 7.76% | $16,077 |
| Dow Jones U.S. Total Stock Market Index | 24.31 | 2.86 | 5.55 | 14,094 |
| REIT Spliced Index | 40.23 | 2.52 | 7.63 | 15,956 |
| "Since Inception" performance is calculated from the ETF Shares’ inception date for both the fund and its comparative standards. |
Vanguard fund returns do not reflect the 1% fee on redemptions of shares held for less than one year. The fee does not apply to the ETF Shares.
9
REIT Index Fund
Cumulative Returns of ETF Shares: September 23, 2004, Through January 31, 2011
| | | |
| | | | Since |
| | One | Five | Inception |
| | Year | Years | (9/23/2004) |
| REIT Index Fund | �� | | |
| ETF Shares Market Price | 40.27% | 14.04% | 60.75% |
| REIT Index Fund | | | |
| ETF Shares Net Asset Value | 40.19 | 14.09 | 60.77 |
| REIT Spliced Index | 40.23 | 13.25 | 59.56 |
| "Since Inception" performance is calculated from the ETF Shares’ inception date for both the fund and its comparative standards. |
Fiscal-Year Total Returns (%): January 31, 2001, Through January 31, 2011
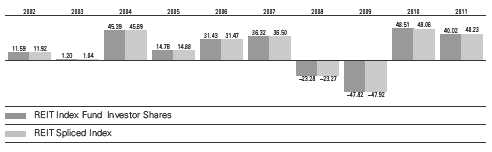
Average Annual Total Returns: Periods Ended December 31, 2010
This table presents average annual total returns through the latest calendar quarter—rather than through the end of the fiscal period. Securities and Exchange Commission rules require that we provide this information.
| | | | |
| | Inception | One | Five | Ten |
| | Date | Year | Years | Years |
| Investor Shares | 5/13/1996 | 28.30% | 3.38% | 10.57% |
| Admiral Shares | 11/12/2001 | 28.49 | 3.49 | 11.021 |
| Signal Shares | 6/4/2007 | 28.47 | — | -4.541 |
| Institutional Shares | 12/2/2003 | 28.56 | 3.52 | 8.481 |
| ETF Shares | 9/23/2004 | | | |
| Market Price | | 28.37 | 3.51 | 7.311 |
| Net Asset Value | | 28.47 | 3.50 | 7.311 |
| 1 Return since inception. |
Vanguard fund returns do not reflect the 1% fee on redemptions of shares held for less than one year. The fee does not apply to the ETF Shares.
10
REIT Index Fund
Financial Statements
Statement of Net Assets
As of January 31, 2011
The fund reports a complete list of its holdings in regulatory filings four times in each fiscal year, at the quarter-ends. For the second and fourth fiscal quarters, the lists appear in the fund’s semiannual and annual reports to shareholders. For the first and third fiscal quarters, the fund files the lists with the Securities and Exchange Commission on Form N-Q. Shareholders can look up the fund’s Forms N-Q on the SEC’s website at sec.gov. Forms N-Q may also be reviewed and copied at the SEC’s Public Reference Room (see the back cover of this report for further information).
| | | |
| | | | Market |
| | | | Value |
| | | Shares | ($000) |
| Real Estate Investment Trusts (99.5%)1 | |
| Diversified REITs (7.7%) | | |
| | Vornado Realty Trust | 8,915,229 | 785,343 |
| 2 | Liberty Property Trust | 6,181,253 | 214,922 |
| 2 | Washington Real Estate | | |
| | Investment Trust | 3,394,964 | 104,158 |
| | Colonial Properties Trust | 3,677,764 | 70,576 |
| | PS Business Parks Inc. | 1,069,467 | 62,254 |
| | Cousins Properties Inc. | 5,057,915 | 43,093 |
| 2 | Investors Real Estate | | |
| | Trust | 4,219,922 | 37,726 |
| 2 | Retail Opportunity | | |
| | Investments Corp. | 2,271,448 | 22,249 |
| *,2 | CapLease Inc. | 3,107,515 | 17,153 |
| | Winthrop Realty Trust | 1,282,957 | 15,780 |
| | | | 1,373,254 |
| Industrial REITs (5.8%) | | |
| *,2 | ProLogis | 30,268,169 | 451,601 |
| 2 | AMB Property Corp. | 9,144,495 | 306,798 |
| 2 | DuPont Fabros | | |
| | Technology Inc. | 3,220,165 | 73,806 |
| 2 | EastGroup Properties Inc. | 1,465,624 | 63,886 |
| 2 | DCT Industrial Trust Inc. | 11,483,156 | 63,617 |
| 2 | First Potomac Realty | | |
| | Trust | 2,631,595 | 42,369 |
| * | First Industrial Realty | | |
| | Trust Inc. | 3,118,540 | 31,871 |
| | | | 1,033,948 |
| Office REITs (16.3%) | | |
| 2 | Boston Properties Inc. | 7,571,327 | 714,506 |
| 2 | SL Green Realty Corp. | 4,250,346 | 309,255 |
| ^,2 | Digital Realty Trust Inc. | 4,744,175 | 258,083 |
| 2 | Alexandria Real Estate | | |
| | Equities Inc. | 2,941,710 | 226,629 |
| 2 | Duke Realty Corp. | 13,668,615 | 187,260 |
| 2 | Mack-Cali Realty Corp. | 4,314,715 | 151,101 |
| 2 | Corporate Office | | |
| | Properties Trust | 3,582,118 | 130,927 |
| | | |
| | | | Market |
| | | | Value |
| | | Shares | ($000) |
| 2 | Highwoods Properties Inc. | 3,891,607 | 127,528 |
| 2 | BioMed Realty Trust Inc. | 6,987,113 | 124,720 |
| | Douglas Emmett Inc. | 6,001,915 | 110,615 |
| 2 | Kilroy Realty Corp. | 2,844,800 | 108,501 |
| 2 | CommonWealth REIT | 3,917,740 | 104,486 |
| | Piedmont Office Realty | | |
| | Trust Inc. Class A | 5,067,493 | 100,235 |
| 2 | Brandywine Realty Trust | 7,173,007 | 83,207 |
| | Lexington Realty Trust | 7,074,572 | 59,922 |
| | Franklin Street | | |
| | Properties Corp. | 3,896,940 | 58,415 |
| | Government Properties | | |
| | Income Trust | 1,600,228 | 41,446 |
| 2 | Parkway Properties Inc. | 1,191,151 | 20,131 |
| | | | 2,916,967 |
| Residential REITs (16.4%) | | |
| 2 | Equity Residential | 15,403,130 | 834,696 |
| 2 | AvalonBay | | |
| | Communities Inc. | 4,627,825 | 536,504 |
| 2 | UDR Inc. | 9,747,925 | 228,881 |
| 2 | Camden Property Trust | 3,639,882 | 201,759 |
| 2 | Essex Property Trust Inc. | 1,648,208 | 191,192 |
| 2 | Apartment Investment | | |
| | & Management Co. | 6,358,887 | 162,533 |
| 2 | BRE Properties Inc. | 3,478,981 | 155,336 |
| 2 | American Campus | | |
| | Communities Inc. | 3,528,937 | 114,126 |
| 2 | Mid-America Apartment | | |
| | Communities Inc. | 1,782,296 | 113,621 |
| 2 | Home Properties Inc. | 2,036,851 | 113,412 |
| 2 | Post Properties Inc. | 2,644,778 | 97,936 |
| 2 | Equity Lifestyle | | |
| | Properties Inc. | 1,586,433 | 90,236 |
| 2 | Associated Estates | | |
| | Realty Corp. | 2,180,051 | 32,287 |
| | Sun Communities Inc. | 946,561 | 31,350 |
| 2 | Education Realty | | |
| | Trust Inc. | 3,827,519 | 29,855 |
| | | | 2,933,724 |
11
REIT Index Fund
| | | |
| | | | Market |
| | | | Value |
| | | Shares | ($000) |
| Retail REITs (25.9%) | | |
| 2 | Simon Property | | |
| | Group Inc. | 15,912,025 | 1,614,275 |
| 2 | Kimco Realty Corp. | 22,053,156 | 398,942 |
| | General Growth | | |
| | Properties Inc. | 23,463,190 | 347,490 |
| 2 | Macerich Co. | 7,069,956 | 344,024 |
| 2 | Federal Realty | | |
| | Investment Trust | 3,337,585 | 268,442 |
| ^,2 | Realty Income Corp. | 6,359,755 | 222,337 |
| 2 | Regency Centers Corp. | 4,448,311 | 191,767 |
| | Developers Diversified | | |
| | Realty Corp. | 11,553,072 | 157,122 |
| 2 | Taubman Centers Inc. | 2,971,349 | 155,550 |
| 2 | Weingarten Realty | | |
| | Investors | 6,214,924 | 152,390 |
| 2 | CBL & Associates | | |
| | Properties Inc. | 7,128,035 | 121,604 |
| 2 | Tanger Factory | | |
| | Outlet Centers | 4,399,064 | 114,860 |
| 2 | National Retail | | |
| | Properties Inc. | 4,530,804 | 112,590 |
| | Equity One Inc. | 2,783,661 | 51,915 |
| | Alexander’s Inc. | 124,807 | 50,508 |
| 2 | Glimcher Realty Trust | 5,327,540 | 46,936 |
| | Getty Realty Corp. | 1,432,161 | 41,590 |
| 2 | Acadia Realty Trust | 2,181,353 | 40,311 |
| 2 | Pennsylvania Real Estate | | |
| | Investment Trust | 2,855,327 | 39,004 |
| | Inland Real Estate Corp. | 4,185,118 | 38,838 |
| | Saul Centers Inc. | 747,747 | 35,406 |
| 2 | Ramco-Gershenson | | |
| | Properties Trust | 1,959,017 | 25,193 |
| | Urstadt Biddle | | |
| | Properties Inc. Class A | 1,061,863 | 20,611 |
| | Cedar Shopping | | |
| | Centers Inc. | 3,214,603 | 19,448 |
| 2 | Kite Realty Group Trust | 3,435,496 | 18,139 |
| | Urstadt Biddle | | |
| | Properties Inc. | 69,255 | 1,124 |
| | | | 4,630,416 |
| Specialized REITs (27.4%) | | |
| | Public Storage | 7,853,261 | 855,848 |
| 2 | HCP Inc. | 19,828,591 | 735,442 |
| 2 | Host Hotels & | | |
| | Resorts Inc. | 36,015,984 | 666,656 |
| 2 | Ventas Inc. | 8,535,912 | 473,402 |
| 2 | Health Care REIT Inc. | 7,879,925 | 386,747 |
| 2 | Nationwide Health | | |
| | Properties Inc. | 6,721,614 | 252,397 |
| 2 | Senior Housing | | |
| | Properties Trust | 7,606,590 | 170,540 |
| | | |
| | | | Market |
| | | | Value |
| | | Shares | ($000) |
| 2 | Hospitality | | |
| | Properties Trust | 6,705,111 | 166,756 |
| 2 | Entertainment | | |
| | Properties Trust | 2,525,421 | 116,245 |
| 2 | Omega Healthcare | | |
| | Investors Inc. | 5,150,105 | 114,744 |
| *,2 | DiamondRock | | |
| | Hospitality Co. | 8,997,267 | 109,137 |
| 2 | LaSalle Hotel Properties | 3,792,474 | 105,317 |
| 2 | Extra Space Storage Inc. | 4,514,508 | 86,814 |
| 2 | Healthcare Realty | | |
| | Trust Inc. | 3,458,313 | 72,625 |
| 2 | Medical Properties | | |
| | Trust Inc. | 6,043,443 | 66,357 |
| *,2 | Sunstone Hotel | | |
| | Investors Inc. | 6,412,825 | 65,475 |
| | National Health | | |
| | Investors Inc. | 1,353,071 | 61,876 |
| 2 | Sovran Self Storage Inc. | 1,499,373 | 57,636 |
| | Hersha Hospitality | | |
| | Trust Class A | 8,030,749 | 52,923 |
| *,2 | Strategic Hotels & | | |
| | Resorts Inc. | 8,219,628 | 45,290 |
| | U-Store-It Trust | 4,579,098 | 44,234 |
| 2 | Pebblebrook Hotel Trust | 2,059,167 | 42,336 |
| *,2 | FelCor Lodging Trust Inc. | 5,273,755 | 37,074 |
| | LTC Properties Inc. | 1,261,640 | 34,493 |
| * | Ashford Hospitality | | |
| | Trust Inc. | 2,548,029 | 24,843 |
| 2,† | Sabra Healthcare REIT Inc. | 1,281,081 | 23,841 |
| 2 | Universal Health | | |
| | Realty Income Trust | 632,845 | 23,004 |
| 2 | Chesapeake Lodging Trust | 937,406 | 17,155 |
| | | | 4,909,207 |
| Total Real Estate Investment Trusts | |
| (Cost $16,063,168) | | 17,797,516 |
12
REIT Index Fund
| | |
| | | Market |
| | | Value |
| | Shares | ($000) |
| Temporary Cash Investments (0.9%)1 | |
| Money Market Fund (0.9%) | |
| 3,4 Vanguard Market Liquidity | |
| Fund, 0.207% | 159,299,579 | 159,300 |
| |
| | Face | |
| | Amount | |
| | ($000) | |
| U.S. Government and Agency Obligations (0.0%) |
| 5 Freddie Mac | | |
| Discount Notes, | | |
| 0.331%, 3/28/11 | 6,000 | 5,998 |
| Total Temporary Cash Investments | |
| (Cost $165,297) | | 165,298 |
| Total Investments (100.4%) | |
| (Cost $16,228,465) | | 17,962,814 |
| Other Assets and Liabilities (-0.4%) | |
| Other Assets | | 77,662 |
| Liabilities4 | | (143,259) |
| | | (65,597) |
| Net Assets (100%) | | 17,897,217 |
| |
| |
| Statement of Assets and Liabilities | |
| Assets | | |
| Investments in Securities, at Value | 17,962,814 |
| Accrued Income Receivable | 41,924 |
| Other Assets | | 35,738 |
| Total Assets | | 18,040,476 |
| Liabilities | | |
| Security Lending Collateral Payable | |
| to Brokers | | 66,813 |
| Payables for Capital Shares Redeemed | 27,568 |
| Other Liabilities | | 48,878 |
| Total Liabilities | | 143,259 |
| Net Assets | | 17,897,217 |
| |
| At January 31, 2011, net assets consisted of: |
| | Amount |
| | ($000) |
| Paid-in Capital | 16,410,542 |
| Overdistributed Net Investment Income | (4,689) |
| Accumulated Net Realized Losses | (262,776) |
| Unrealized Appreciation (Depreciation) | |
| Investment Securities | 1,734,349 |
| Swap Contracts | 19,791 |
| Net Assets | 17,897,217 |
| |
| |
| Investor Shares—Net Assets | |
| Applicable to 139,987,601 outstanding | |
| $.001 par value shares of beneficial | |
| interest (unlimited authorization) | 2,657,991 |
| Net Asset Value Per Share— | |
| Investor Shares | $18.99 |
| |
| Admiral Shares—Net Assets | |
| Applicable to 58,188,119 outstanding | |
| $.001 par value shares of beneficial | |
| interest (unlimited authorization) | 4,715,006 |
| Net Asset Value Per Share— | |
| Admiral Shares | $81.03 |
| |
| |
| Signal Shares—Net Assets | |
| Applicable to 38,623,300 outstanding | |
| $.001 par value shares of beneficial | |
| interest (unlimited authorization) | 835,432 |
| Net Asset Value Per Share— | |
| Signal Shares | $21.63 |
13
REIT Index Fund
| |
| | Amount |
| | ($000) |
| Institutional Shares—Net Assets | |
| Applicable to 128,645,638 outstanding | |
| $.001 par value shares of beneficial | |
| interest (unlimited authorization) | 1,613,504 |
| Net Asset Value Per Share— | |
| Institutional Shares | $12.54 |
| |
| |
| ETF Shares—Net Assets | |
| Applicable to 141,253,776 outstanding | |
| $.001 par value shares of beneficial | |
| interest (unlimited authorization) | 8,075,284 |
| Net Asset Value Per Share— | |
| ETF Shares | $57.17 |
See Note A in Notes to Financial Statements.
* Non-income-producing security.
† Non-income-producing security. New issue that has not paid a dividend as of January 31, 2011.
^ Part of security position is on loan to broker-dealers. The total value of securities on loan is $65,760,000.
1 The fund invests a portion of its assets in Real Estate Investment Trusts through the use of swap contracts. After giving effect to swap investments, the fund’s effective Real Estate Investment Trust and temporary cash investment positions represent 99.9% and 0.5%, respectively, of net assets.
2 Considered an affiliated company of the fund as the fund owns more than 5% of the outstanding voting securities of such company.
3 Affiliated money market fund available only to Vanguard funds and certain trusts and accounts managed by Vanguard. Rate shown is the 7-day yield.
4 Includes $66,813,000 of collateral received for securities on loan.
5 The issuer operates under a congressional charter; its securities are not backed by the full faith and credit of the U.S. government.
REIT—Real Estate Investment Trust.
See accompanying Notes, which are an integral part of the Financial Statements.
14
REIT Index Fund
Statement of Operations
| |
| | Year Ended |
| | January 31, 2011 |
| | ($000) |
| Investment Income | |
| Income | |
| Dividends1 | 350,766 |
| Interest1 | 173 |
| Security Lending | 1,731 |
| Total Income | 352,670 |
| Expenses | |
| The Vanguard Group—Note B | |
| Investment Advisory Services | 828 |
| Management and Administrative—Investor Shares | 8,869 |
| Management and Administrative—Admiral Shares | 2,211 |
| Management and Administrative—Signal Shares | 524 |
| Management and Administrative—Institutional Shares | 571 |
| Management and Administrative—ETF Shares | 4,919 |
| Marketing and Distribution—Investor Shares | 1,076 |
| Marketing and Distribution—Admiral Shares | 314 |
| Marketing and Distribution—Signal Shares | 176 |
| Marketing and Distribution—Institutional Shares | 348 |
| Marketing and Distribution—ETF Shares | 1,674 |
| Custodian Fees | 111 |
| Auditing Fees | 32 |
| Shareholders’ Reports—Investor Shares | 40 |
| Shareholders’ Reports—Admiral Shares | 16 |
| Shareholders’ Reports—Signal Shares | 6 |
| Shareholders’ Reports—Institutional Shares | 12 |
| Shareholders’ Reports—ETF Shares | 290 |
| Trustees’ Fees and Expenses | 21 |
| Total Expenses | 22,038 |
| Net Investment Income | 330,632 |
| Realized Net Gain (Loss) | |
| Capital Gain Distributions Received | 74,138 |
| Investment Securities Sold | 607,132 |
| Swap Contracts | 26,538 |
| Realized Net Gain (Loss)1 | 707,808 |
| Change in Unrealized Appreciation (Depreciation) | |
| Investment Securities | 3,579,337 |
| Swap Contracts | 2,088 |
| Change in Unrealized Appreciation (Depreciation) | 3,581,425 |
| Net Increase (Decrease) in Net Assets Resulting from Operations | 4,619,865 |
1 Dividend income, interest income, and realized net gain (loss) from affiliated companies of the fund were $272,958,000, $161,000, and $602,399,000, respectively.
See accompanying Notes, which are an integral part of the Financial Statements.
15
REIT Index Fund
Statement of Changes in Net Assets
| | |
| | Year Ended January 31, |
| | 2011 | 2010 |
| | ($000) | ($000) |
| Increase (Decrease) in Net Assets | | |
| Operations | | |
| Net Investment Income | 330,632 | 318,714 |
| Realized Net Gain (Loss) | 707,808 | (279,343) |
| Change in Unrealized Appreciation (Depreciation) | 3,581,425 | 3,082,398 |
| Net Increase (Decrease) in Net Assets Resulting from Operations | 4,619,865 | 3,121,769 |
| Distributions | | |
| Net Investment Income | | |
| Investor Shares | (135,406) | (116,521) |
| Admiral Shares | (88,776) | (43,685) |
| Signal Shares | (23,109) | (17,371) |
| Institutional Shares | (48,372) | (28,920) |
| ETF Shares | (227,850) | (115,870) |
| Realized Capital Gain | | |
| Investor Shares | — | — |
| Admiral Shares | — | — |
| Signal Shares | — | — |
| Institutional Shares | — | — |
| ETF Shares | — | — |
| Return of Capital | | |
| Investor Shares | — | (38,280) |
| Admiral Shares | — | (14,352) |
| Signal Shares | — | (5,707) |
| Institutional Shares | — | (9,501) |
| ETF Shares | — | (38,066) |
| Total Distributions | (523,513) | (428,273) |
| Capital Share Transactions | | |
| Investor Shares | (2,088,856) | 297,943 |
| Admiral Shares | 2,816,862 | 64,315 |
| Signal Shares | 165,550 | (9,662) |
| Institutional Shares | 345,514 | 151,229 |
| ETF Shares | 1,620,012 | 2,329,044 |
| Net Increase (Decrease) from Capital Share Transactions | 2,859,082 | 2,832,869 |
| Total Increase (Decrease) | 6,955,434 | 5,526,365 |
| Net Assets | | |
| Beginning of Period | 10,941,783 | 5,415,418 |
| End of Period1 | 17,897,217 | 10,941,783 |
1 Net Assets—End of Period includes undistributed (overdistributed) net investment income of ($4,689,000) and ($7,474,000).
See accompanying Notes, which are an integral part of the Financial Statements.
16
REIT Index Fund
Financial Highlights
Investor Shares
| | | | | |
| For a Share Outstanding | | | Year Ended January 31, |
| Throughout Each Period | 2011 | 2010 | 2009 | 2008 | 2007 |
| Net Asset Value, Beginning of Period | $14.05 | $10.02 | $20.38 | $27.76 | $21.29 |
| Investment Operations | | | | | |
| Net Investment Income | .399 | .477 | .593 | .615 | .530 |
| Net Realized and Unrealized Gain (Loss) | | | | | |
| on Investments1 | 5.144 | 4.192 | (9.975) | (6.985) | 7.000 |
| Total from Investment Operations | 5.543 | 4.669 | (9.382) | (6.370) | 7.530 |
| Distributions | | | | | |
| Dividends from Net Investment Income | (.603) | (.481) | (.571) | (.622) | (.534) |
| Distributions from Realized Capital Gains | — | — | (.125) | (.199) | (.413) |
| Return of Capital | — | (.158) | (.282) | (.189) | (.113) |
| Total Distributions | (.603) | (.639) | (.978) | (1.010) | (1.060) |
| Net Asset Value, End of Period | $18.99 | $14.05 | $10.02 | $20.38 | $27.76 |
| |
| Total Return2 | 40.02% | 48.51% | -47.82% | -23.28% | 36.32% |
| |
| Ratios/Supplemental Data | | | | | |
| Net Assets, End of Period (Millions) | $2,658 | $3,572 | $2,274 | $4,046 | $6,827 |
| Ratio of Total Expenses to Average Net Assets | 0.26% | 0.26% | 0.21% | 0.20% | 0.21% |
| Ratio of Net Investment Income to | | | | | |
| Average Net Assets | 2.22% | 3.94% | 3.36% | 2.52% | 2.27% |
| Portfolio Turnover Rate3 | 12% | 16% | 10% | 13% | 11% |
1 Includes increases from redemption fees of $0.00, $0.00, $0.00, $0.02, and $0.00.
2 Total returns do not include transaction or account service fees that may have applied in the periods shown. Fund prospectuses provide information about any applicable transaction and account service fees.
3 Excludes the value of portfolio securities received or delivered as a result of in-kind purchases or redemptions of the fund’s capital shares, including ETF Creation Units.
See accompanying Notes, which are an integral part of the Financial Statements.
17
REIT Index Fund
Financial Highlights
Admiral Shares
| | | | | |
| For a Share Outstanding | | | Year Ended January 31, |
| Throughout Each Period | 2011 | 2010 | 2009 | 2008 | 2007 |
| Net Asset Value, Beginning of Period | $59.95 | $42.74 | $86.94 | $118.46 | $90.82 |
| Investment Operations | | | | | |
| Net Investment Income | 1.806 | 2.083 | 2.581 | 2.707 | 2.328 |
| Net Realized and Unrealized Gain (Loss) | | | | | |
| on Investments1 | 21.948 | 17.909 | (42.527) | (29.817) | 29.903 |
| Total from Investment Operations | 23.754 | 19.992 | (39.946) | (27.110) | 32.231 |
| Distributions | | | | | |
| Dividends from Net Investment Income | (2.674) | (2.094) | (2.491) | (2.735) | (2.341) |
| Distributions from Realized Capital Gains | — | — | (.535) | (.849) | (1.761) |
| Return of Capital | — | (.688) | (1.228) | (.826) | (.489) |
| Total Distributions | (2.674) | (2.782) | (4.254) | (4.410) | (4.591) |
| Net Asset Value, End of Period | $81.03 | $59.95 | $42.74 | $86.94 | $118.46 |
| |
| Total Return2 | 40.21% | 48.73% | -47.77% | -23.23% | 36.46% |
| |
| Ratios/Supplemental Data | | | | | |
| Net Assets, End of Period (Millions) | $4,715 | $1,296 | $873 | $1,706 | $3,392 |
| Ratio of Total Expenses to Average Net Assets | 0.12% | 0.13% | 0.11% | 0.10% | 0.14% |
| Ratio of Net Investment Income to | | | | | |
| Average Net Assets | 2.36% | 4.07% | 3.46% | 2.62% | 2.34% |
| Portfolio Turnover Rate3 | 12% | 16% | 10% | 13% | 11% |
1 Includes increases from redemption fees of $0.00, $0.01, $0.02, $0.10, and $0.02.
2 Total returns do not include transaction fees that may have applied in the periods shown. Fund prospectuses provide information about any applicable transaction fees.
3 Excludes the value of portfolio securities received or delivered as a result of in-kind purchases or redemptions of the fund’s capital shares, including ETF Creation Units.
See accompanying Notes, which are an integral part of the Financial Statements.
18
REIT Index Fund
Financial Highlights
Signal Shares
| | | | |
| | | | | June 4, |
| | | | | 20071 to |
| | Year Ended January 31, | Jan. 31, |
| For a Share Outstanding Throughout Each Period | 2011 | 2010 | 2009 | 2008 |
| Net Asset Value, Beginning of Period | $16.00 | $11.41 | $23.21 | $30.05 |
| Investment Operations | | | | |
| Net Investment Income | .483 | .557 | .688 | .470 |
| Net Realized and Unrealized Gain (Loss) on Investments | 5.862 | 4.775 | (11.353) | (6.311) |
| Total from Investment Operations | 6.345 | 5.332 | (10.665) | (5.841) |
| Distributions | | | | |
| Dividends from Net Investment Income | (.715) | (.559) | (.664) | (.620) |
| Distributions from Realized Capital Gains | — | — | (.143) | (.192) |
| Return of Capital | — | (.183) | (.328) | (.187) |
| Total Distributions | (.715) | (.742) | (1.135) | (.999) |
| Net Asset Value, End of Period | $21.63 | $16.00 | $11.41 | $23.21 |
| |
| Total Return2 | 40.25% | 48.68% | -47.77% | -19.68% |
| |
| Ratios/Supplemental Data | | | | |
| Net Assets, End of Period (Millions) | $835 | $489 | $350 | $538 |
| Ratio of Total Expenses to Average Net Assets | 0.12% | 0.14% | 0.11% | 0.10%3 |
| Ratio of Net Investment Income to Average Net Assets | 2.36% | 4.06% | 3.46% | 2.62%3 |
| Portfolio Turnover Rate4 | 12% | 16% | 10% | 13% |
1 Inception.
2 Total returns do not include transaction fees that may have applied in the periods shown. Fund prospectuses provide information about any applicable transaction fees.
3 Annualized.
4 Excludes the value of portfolio securities received or delivered as a result of in-kind purchases or redemptions of the fund’s capital shares, including ETF Creation Units.
See accompanying Notes, which are an integral part of the Financial Statements.
19
REIT Index Fund
Financial Highlights
Institutional Shares
| | | | | |
| For a Share Outstanding | | | Year Ended January 31, |
| Throughout Each Period | 2011 | 2010 | 2009 | 2008 | 2007 |
| Net Asset Value, Beginning of Period | $9.28 | $6.61 | $13.46 | $18.33 | $14.06 |
| Investment Operations | | | | | |
| Net Investment Income | .284 | .326 | .401 | .420 | .366 |
| Net Realized and Unrealized Gain (Loss) | | | | | |
| on Investments1 | 3.395 | 2.777 | (6.591) | (4.605) | 4.621 |
| Total from Investment Operations | 3.679 | 3.103 | (6.190) | (4.185) | 4.987 |
| Distributions | | | | | |
| Dividends from Net Investment Income | (.419) | (.326) | (.386) | (.426) | (.368) |
| Distributions from Realized Capital Gains | — | — | (.083) | (.131) | (.273) |
| Return of Capital | — | (.107) | (.191) | (.128) | (.076) |
| Total Distributions | (.419) | (.433) | (.660) | (.685) | (.717) |
| Net Asset Value, End of Period | $12.54 | $9.28 | $6.61 | $13.46 | $18.33 |
| |
| Total Return2 | 40.24% | 48.90% | -47.82% | -23.18% | 36.45% |
| |
| Ratios/Supplemental Data | | | | | |
| Net Assets, End of Period (Millions) | $1,614 | $907 | $504 | $722 | $960 |
| Ratio of Total Expenses to Average Net Assets | 0.08% | 0.09% | 0.09% | 0.09% | 0.10% |
| Ratio of Net Investment Income to | | | | | |
| Average Net Assets | 2.40% | 4.11% | 3.48% | 2.63% | 2.38% |
| Portfolio Turnover Rate3 | 12% | 16% | 10% | 13% | 11% |
1 Includes increases from redemption fees of $0.00, $0.00, $0.00, $0.01, and $0.00.
2 Total returns do not include transaction fees that may have applied in the periods shown. Fund prospectuses provide information about any applicable transaction fees.
3 Excludes the value of portfolio securities received or delivered as a result of in-kind purchases or redemptions of the fund’s capital shares, including ETF Creation Units.
See accompanying Notes, which are an integral part of the Financial Statements.
20
REIT Index Fund
Financial Highlights
ETF Shares
| | | | | |
| For a Share Outstanding | | | Year Ended January 31, |
| Throughout Each Period | 2011 | 2010 | 2009 | 2008 | 2007 |
| Net Asset Value, Beginning of Period | $42.30 | $30.14 | $61.31 | $83.55 | $64.07 |
| Investment Operations | | | | | |
| Net Investment Income | 1.278 | 1.473 | 1.820 | 1.908 | 1.654 |
| Net Realized and Unrealized Gain (Loss) | | | | | |
| on Investments1 | 15.483 | 12.651 | (29.990) | (21.037) | 21.080 |
| Total from Investment Operations | 16.761 | 14.124 | (28.170) | (19.129) | 22.734 |
| Distributions | | | | | |
| Dividends from Net Investment Income | (1.891) | (1.478) | (1.757) | (1.931) | (1.665) |
| Distributions from Realized Capital Gains | — | — | (.377) | (.598) | (1.242) |
| Return of Capital | — | (.486) | (.866) | (.582) | (.347) |
| Total Distributions | (1.891) | (1.964) | (3.000) | (3.111) | (3.254) |
| Net Asset Value, End of Period | $57.17 | $42.30 | $30.14 | $61.31 | $83.55 |
| |
| Total Return | 40.19% | 48.74% | -47.77% | -23.23% | 36.48% |
| |
| Ratios/Supplemental Data | | | | | |
| Net Assets, End of Period (Millions) | $8,075 | $4,678 | $1,414 | $2,082 | $1,713 |
| Ratio of Total Expenses to Average Net Assets | 0.12% | 0.13% | 0.11% | 0.10% | 0.12% |
| Ratio of Net Investment Income to | | | | | |
| Average Net Assets | 2.36% | 4.07% | 3.46% | 2.62% | 2.36% |
| Portfolio Turnover Rate2 | 12% | 16% | 10% | 13% | 11% |
1 Includes increases from redemption fees of $0.01, $0.01, $0.01, $0.04, and $0.01.
2 Excludes the value of portfolio securities received or delivered as a result of in-kind purchases or redemptions of the fund’s capital shares, including ETF Creation Units.
See accompanying Notes, which are an integral part of the Financial Statements.
21
REIT Index Fund
Notes to Financial Statements
Vanguard REIT Index Fund is registered under the Investment Company Act of 1940 as an open-end investment company, or mutual fund. The fund offers five classes of shares: Investor Shares, Admiral Shares, Signal Shares, Institutional Shares, and ETF Shares. Investor Shares are available to any investor who meets the fund’s minimum purchase requirements. Admiral Shares, Signal Shares, and Institutional Shares are designed for investors who meet certain administrative, service, and account-size criteria. ETF Shares are listed for trading on the NYSE Arca, Inc.; they can be purchased and sold through a broker.
A. The following significant accounting policies conform to generally accepted accounting principles for U.S. mutual funds. The fund consistently follows such policies in preparing its financial statements.
1. Security Valuation: Securities are valued as of the close of trading on the New York Stock Exchange (generally 4 p.m., Eastern time) on the valuation date. Equity securities are valued at the latest quoted sales prices or official closing prices taken from the primary market in which each security trades; such securities not traded on the valuation date are valued at the mean of the latest quoted bid and asked prices. Securities for which market quotations are not readily available, or whose values have been materially affected by events occurring before the fund’s pricing time but after the close of the securities’ primary markets, are valued by methods deemed by the board of trustees to represent fair value. Investments in Vanguard Market Liquidity Fund are valued at that fund’s net asset value. Temporary cash investments acquired over 60 days to maturity are valued using the latest bid prices or using valuations based on a matrix system (which considers such factors as security prices, yields, maturities, and ratings), both as furnished by independent pricing services. Other temporary cash investments are valued at amortized cost, which approximates market value.
2. Swap Contracts: The fund enters into swap transactions to earn the total return on a specified REIT index. Under the terms of the swaps, the fund receives the total return (either receiving the increase or paying the decrease) on a reference index, applied to a notional principal amount. In return, the fund agrees to pay the counterparty a floating rate, which is reset periodically based on short-term interest rates, applied to the same notional amount. At the same time, the fund invests an amount approximating the notional amount of the swap in high-quality temporary cash investments.
The notional amounts of swap contracts are not recorded in the Statement of Net Assets. Swaps are valued daily and the change in value is recorded as unrealized appreciation (depreciation) until periodic payments are made, or the swap terminates, at which time realized gain (loss) is recorded. The primary risk associated with the swaps is that a counterparty will default on its obligation to pay net amounts due to the fund. The fund’s maximum risk of loss from counterparty credit risk is the amount of unrealized appreciation on the swap contract. This risk is mitigated by entering into swaps only with highly rated counterparties, by a master netting arrangement between the fund and the counterparty, and by the posting of collateral by the counterparty. The swap contracts contain provisions whereby a counterparty may terminate open contracts if the fund’s net assets decline below a certain level, triggering a payment by the fund if the fund is in a net liability position at the time of the termination. The payment amount would be reduced by any collateral the fund has posted. Any securities posted as collateral for open contracts are noted in the Statement of Net Assets.
3. Federal Income Taxes: The fund intends to continue to qualify as a regulated investment company and distribute all of its taxable income. Management has analyzed the fund’s tax positions taken for all open federal income tax years (January 31, 2008--2011), and has concluded that no provision for federal income tax is required in the fund’s financial statements.
22
REIT Index Fund
4. Distributions: Distributions to shareholders are recorded on the ex-dividend date.
5. Security Lending: The fund may lend its securities to qualified institutional borrowers to earn additional income. Security loans are required to be secured at all times by collateral at least equal to the market value of securities loaned. The fund invests cash collateral received in Vanguard Market Liquidity Fund, and records a liability for the return of the collateral, during the period the securities are on loan. Security lending income represents fees charged to borrowers plus income earned on investing cash collateral, less expenses associated with the loan.
6. Other: Distributions received from REITs are recorded on the ex-dividend date. Each REIT reports annually the tax character of its distributions. Dividend income, capital gain distributions received, and unrealized appreciation (depreciation) reflect the amounts of taxable income, capital gain, and return of capital reported by the REITs, and management’s estimates of such amounts for REIT distributions for which actual information has not been reported. Interest income includes income distributions received from Vanguard Market Liquidity Fund and is accrued daily. Security transactions are accounted for on the date securities are bought or sold. Costs used to determine realized gains (losses) on the sale of investment securities are those of the specific securities sold. Fees assessed on redemptions of capital shares are credited to paid-in capital.
Each class of shares has equal rights as to assets and earnings, except that each class separately bears certain class-specific expenses related to maintenance of shareholder accounts (included in Management and Administrative expenses) and shareholder reporting. Marketing and distribution expenses are allocated to each class of shares based on a method approved by the board of trustees. Income, other non-class-specific expenses, and gains and losses on investments are allocated to each class of shares based on its relative net assets.
B. The Vanguard Group furnishes at cost investment advisory, corporate management, administrative, marketing, and distribution services. The costs of such services are allocated to the fund under methods approved by the board of trustees. The fund has committed to provide up to 0.40% of its net assets in capital contributions to Vanguard. At January 31, 2011, the fund had contributed capital of $2,862,000 to Vanguard (included in Other Assets), representing 0.02% of the fund’s net assets and 1.14% of Vanguard’s capitalization. The fund’s trustees and officers are also directors and officers of Vanguard.
C. Various inputs may be used to determine the value of the fund’s investments. These inputs are summarized in three broad levels for financial statement purposes. The inputs or methodologies used to value securities are not necessarily an indication of the risk associated with investing in those securities.
Level 1—Quoted prices in active markets for identical securities.
Level 2—Other significant observable inputs (including quoted prices for similar securities, interest rates, prepayment speeds, credit risk, etc.).
Level 3—Significant unobservable inputs (including the fund’s own assumptions used to determine the fair value of investments).
23
REIT Index Fund
The following table summarizes the fund’s investments as of January 31, 2011, based on the inputs used to value them:
| | | |
| | Level 1 | Level 2 | Level 3 |
| Investments | ($000) | ($000) | ($000) |
| Real Estate Investment Trusts | 17,797,516 | — | — |
| Temporary Cash Investments | 159,300 | 5,998 | — |
| Swap Contracts—Assets | — | 19,791 | — |
| Total | 17,956,816 | 25,789 | — |
D. At January 31, 2011, the fund had the following open total return swap contract:
| | | | | |
| | | | | Floating | Unrealized |
| | | | Notional | Interest Rate | Appreciation |
| | Termination | | Amount | Received | (Depreciation) |
| Reference Entity | Date | Counterparty1 | ($000) | (Paid)2 | ($000) |
| MSCI US REIT Total Return | | | | | |
| Swap Gross Index | 8/4/11 | GSI | 76,981 | (0.111%) | 19,791 |
| 1 GSI—Goldman Sachs International. |
| 2 Based on one-month London Interbank Offered Rate (LIBOR) as of the most recent payment date. |
At January 31, 2011, the counterparty had deposited in segregated accounts securities with a value sufficient to cover substantially all amounts due to the fund in connection with open swap contracts.
E. Distributions are determined on a tax basis and may differ from net investment income and realized capital gains for financial reporting purposes. Differences may be permanent or temporary. Permanent differences are reclassified among capital accounts in the financial statements to reflect their tax character. Temporary differences arise when certain items of income, expense, gain, or loss are recognized in different periods for financial statement and tax purposes; these differences will reverse at some time in the future. Differences in classification may also result from the treatment of short-term gains as ordinary income for tax purposes.
During the year ended January 31, 2011, the fund realized $573,990,000 of net capital gains resulting from in-kind redemptions—in which shareholders exchanged fund shares for securities held by the fund rather than for cash. Because such gains are not taxable to the fund, and are not distributed to shareholders, they have been reclassified from accumulated net realized losses to paid-in capital.
The fund reclassified $195,666,000 from paid-in capital to overdistributed net investment income, representing utilized capital loss carryforwards that are required to be included in distributable net income for tax purposes. For tax purposes, at January 31, 2011, the fund had no ordinary income available for distribution. The fund had available capital loss carryforwards totaling $73,864,000 to offset future net capital gains through January 31, 2018. In addition, the fund realized losses of $178,176,000 during the period from November 1, 2010, through January 31, 2011, which are deferred and will be treated as realized for tax purposes in fiscal 2012.
24
REIT Index Fund
At January 31, 2011, the cost of investment securities for tax purposes was $16,239,201,000. Net unrealized appreciation of investment securities for tax purposes was $1,723,613,000, consisting of unrealized gains of $2,559,889,000 on securities that had risen in value since their purchase and $836,276,000 in unrealized losses on securities that had fallen in value since their purchase.
F. During the year ended January 31, 2011, the fund purchased $5,839,221,000 of investment securities and sold $2,978,080,000 of investment securities, other than temporary cash investments.
G. Capital share transactions for each class of shares were:
| | | | |
| | | | Year Ended January 31, |
| | | 2011 | | 2010 |
| | Amount | Shares | Amount | Shares |
| | ($000) | (000) | ($000) | (000) |
| Investor Shares | | | | |
| Issued | 1,119,064 | 66,009 | 805,386 | 70,148 |
| Issued in Lieu of Cash Distributions | 127,317 | 7,559 | 144,818 | 12,990 |
| Redeemed1 | (3,335,237) | (187,837) | (652,261) | (55,891) |
| Net Increase (Decrease)—Investor Shares | (2,088,856) | (114,269) | 297,943 | 27,247 |
| Admiral Shares | | | | |
| Issued | 3,046,641 | 39,695 | 227,091 | 4,473 |
| Issued in Lieu of Cash Distributions | 76,303 | 1,031 | 47,522 | 1,002 |
| Redeemed1 | (306,082) | (4,162) | (210,298) | (4,289) |
| Net Increase (Decrease)—Admiral Shares | 2,816,862 | 36,564 | 64,315 | 1,186 |
| Signal Shares | | | | |
| Issued | 321,123 | 16,049 | 148,001 | 11,605 |
| Issued in Lieu of Cash Distributions | 19,720 | 1,017 | 20,008 | 1,595 |
| Redeemed1 | (175,293) | (8,979) | (177,671) | (13,365) |
| Net Increase (Decrease)—Signal Shares | 165,550 | 8,087 | (9,662) | (165) |
| Institutional Shares | | | | |
| Issued | 520,734 | 46,474 | 272,886 | 36,428 |
| Issued in Lieu of Cash Distributions | 43,165 | 3,829 | 34,721 | 4,703 |
| Redeemed1 | (218,385) | (19,340) | (156,378) | (19,585) |
| Net Increase (Decrease)—Institutional Shares | 345,514 | 30,963 | 151,229 | 21,546 |
| ETF Shares | | | | |
| Issued | 2,900,778 | 55,854 | 2,512,381 | 68,773 |
| Issued in Lieu of Cash Distributions | — | — | — | — |
| Redeemed1 | (1,280,766) | (25,200) | (183,337) | (5,100) |
| Net Increase (Decrease)—ETF Shares | 1,620,012 | 30,654 | 2,329,044 | 63,673 |
| 1 Net of redemption fees for fiscal 2011 and 2010 of $1,715,000 and $1,733,000, respectively (fund totals). |
25
REIT Index Fund
H. Certain of the fund’s investments are in companies that are considered to be affiliated companies of the fund because the fund owns more than 5% of the outstanding voting securities of the company. Transactions during the period in securities of these companies were as follows:
| | | | | |
| | | | Current Period Transactions | |
| Jan. 31, 2010 | | Proceeds from | | Jan. 31, 2011 |
| | Market | Purchases | Securities | Dividend | Market |
| | Value | at Cost | Sold | Income | Value |
| | ($000) | ($000) | ($000) | ($000) | ($000) |
| Acadia Realty Trust | NA1 | 11,919 | 7,210 | 1,463 | 40,311 |
| Alexandria Real Estate Equities Inc. | 132,690 | 88,536 | 36,982 | 3,081 | 226,629 |
| AMB Property Corp. | 179,533 | 98,621 | 51,993 | 6,697 | 306,798 |
| American Campus Communities Inc. | 68,501 | 44,771 | 19,816 | 560 | 114,126 |
| Apartment Investment & | | | | | |
| Management Co. | 91,957 | 38,767 | 30,596 | 272 | 162,533 |
| Associated Estates Realty Corp. | — | 33,206 | 723 | 364 | 32,287 |
| AvalonBay Communities Inc. | 313,232 | 137,372 | 82,287 | 11,266 | 536,504 |
| BioMed Realty Trust Inc. | 73,122 | 58,717 | 23,173 | 2,643 | 124,720 |
| Boston Properties Inc. | 459,827 | 172,586 | 130,572 | 8,503 | 714,506 |
| Brandywine Realty Trust | 73,859 | 24,345 | 17,392 | 4,043 | 83,207 |
| BRE Properties Inc. | NA1 | 57,380 | 28,195 | 2,303 | 155,336 |
| Camden Property Trust | 127,160 | 49,559 | 32,174 | 2,988 | 201,759 |
| CapLease Inc. | NA1 | 5,498 | 2,249 | — | 17,153 |
| CBL & Associates Properties Inc. | NA1 | 29,077 | 22,699 | 5,395 | 121,604 |
| Chesapeake Lodging Trust | — | 18,461 | 303 | 182 | 17,155 |
| CommonWealth REIT2 | 76,322 | 46,619 | 6,064 | 254 | 104,486 |
| Corporate Office Properties Trust | 105,911 | 48,002 | 25,699 | 3,000 | 130,927 |
| DCT Industrial Trust Inc. | 51,735 | 16,049 | 10,814 | 1,474 | 63,617 |
| DiamondRock Hospitality Co. | NA1 | 45,219 | 13,035 | — | 109,137 |
| Digital Realty Trust Inc. | NA1 | 101,011 | 41,294 | 8,538 | 258,083 |
| Duke Realty Corp. | 129,680 | 58,634 | 31,737 | 2,064 | 187,260 |
| DuPont Fabros Technology Inc. | 35,475 | 37,830 | 11,910 | 1,244 | 73,806 |
| EastGroup Properties Inc. | 50,807 | 15,920 | 10,547 | 2,025 | 63,886 |
| Education Realty Trust Inc. | NA1 | 11,721 | 3,820 | 55 | 29,855 |
| Entertainment Properties Trust | 75,027 | 39,312 | 23,135 | 2,486 | 116,245 |
| Equity Lifestyle Properties Inc. | NA1 | 23,908 | 17,474 | 1,713 | 90,236 |
| Equity Residential | 449,138 | 198,755 | 135,347 | 8,766 | 834,696 |
26
REIT Index Fund
| | | | | |
| | | | Current Period Transactions | |
| | Jan. 31, 2010 | | Proceeds from | | Jan. 31, 2011 |
| | Market | Purchases | Securities | Dividend | Market |
| | Value | at Cost | Sold | Income | Value |
| | ($000) | ($000) | ($000) | ($000) | ($000) |
| Essex Property Trust Inc. | NA1 | 52,482 | 31,753 | 5,270 | 191,192 |
| Extra Space Storage Inc. | NA1 | 19,296 | 14,139 | 1,426 | 86,814 |
| Federal Realty Investment Trust | 200,594 | 72,020 | 53,947 | 8,076 | 268,442 |
| FelCor Lodging Trust Inc. | 12,494 | 16,065 | 5,367 | — | 37,074 |
| First Potomac Realty Trust | NA1 | 24,296 | 6,387 | 1,014 | 42,369 |
| Glimcher Realty Trust | NA1 | 19,811 | 5,638 | 152 | 46,936 |
| HCP Inc. | 421,644 | 285,029 | 110,140 | 17,441 | 735,442 |
| Health Care REIT Inc. | NA1 | 143,833 | 62,195 | 4,919 | 386,747 |
| Healthcare Realty Trust Inc. | 63,667 | 22,839 | 13,235 | 1,274 | 72,625 |
| Highwoods Properties Inc. | 109,497 | 34,427 | 25,378 | 1,524 | 127,528 |
| Home Properties Inc. | 74,927 | 33,004 | 15,204 | 2,221 | 113,412 |
| Hospitality Properties Trust | 138,178 | 43,218 | 32,822 | 11,700 | 166,756 |
| Host Hotels & Resorts Inc. | 336,781 | 161,629 | 94,918 | 1,317 | 666,656 |
| Investors Real Estate Trust | NA1 | 10,357 | 5,552 | 816 | 37,726 |
| Kilroy Realty Corp. | 63,764 | 41,130 | 19,371 | 228 | 108,501 |
| Kimco Realty Corp. | 259,331 | 98,141 | 71,856 | 9,868 | 398,942 |
| Kite Realty Group Trust | 12,207 | 4,137 | 3,064 | 11 | 18,139 |
| LaSalle Hotel Properties | 65,505 | 30,759 | 18,835 | 868 | 105,317 |
| Liberty Property Trust | 173,612 | 55,318 | 39,749 | 9,036 | 214,922 |
| Macerich Co. | 149,163 | 151,237 | 58,547 | 3,502 | 344,024 |
| Mack-Cali Realty Corp. | 130,706 | 39,887 | 29,406 | 5,583 | 151,101 |
| Medical Properties Trust Inc. | 41,046 | 31,570 | 12,008 | 2,226 | 66,357 |
| Mid-America Apartment | | | | | |
| Communities Inc. | 67,739 | 35,151 | 15,157 | 2,681 | 113,621 |
| National Retail Properties Inc. | 83,398 | 31,485 | 21,388 | 5,104 | 112,590 |
| Nationwide Health Properties Inc. | NA1 | 82,513 | 37,455 | 9,041 | 252,397 |
| Omega Healthcare Investors Inc. | 79,686 | 38,884 | 19,899 | 4,098 | 114,744 |
| Parkway Properties Inc. | 23,028 | 4,969 | 3,591 | 255 | 20,131 |
| Pebblebrook Hotel Trust | — | 41,650 | 2,474 | 240 | 42,336 |
| Pennsylvania Real Estate | | | | | |
| Investment Trust | NA1 | 17,631 | 6,727 | 1,508 | 39,004 |
27
REIT Index Fund
| | | | | |
| | | | Current Period Transactions | |
| | Jan. 31, 2010 | | Proceeds from | | Jan. 31, 2011 |
| | Market | Purchases | Securities | Dividend | Market |
| | Value | at Cost | Sold | Income | Value |
| | ($000) | ($000) | ($000) | ($000) | ($000) |
| Post Properties Inc. | 43,719 | 20,500 | 15,171 | 42 | 97,936 |
| ProLogis | NA1 | 168,866 | 68,347 | — | 451,601 |
| Ramco-Gershenson | | | | | |
| Properties Trust | NA1 | 8,767 | 3,443 | 855 | 25,193 |
| Realty Income Corp. | 148,978 | 74,666 | 39,753 | 7,662 | 222,337 |
| Regency Centers Corp. | 151,287 | 50,269 | 51,001 | 3,324 | 191,767 |
| Retail Opportunity | | | | | |
| Investments Corp. | — | 24,410 | 2,193 | 182 | 22,249 |
| Sabra Healthcare REIT Inc. | — | 24,608 | 1,187 | — | 23,841 |
| Senior Housing | | | | | |
| Properties Trust | 135,404 | 57,748 | 33,070 | 6,955 | 170,540 |
| Simon Property Group Inc. | 1,049,446 | 407,576 | 282,188 | 20,944 | 1,614,275 |
| SL Green Realty Corp. | 178,778 | 73,620 | 53,517 | 1,604 | 309,255 |
| Sovran Self Storage Inc. | 46,761 | 15,400 | 10,900 | 1,880 | 57,636 |
| Strategic Hotels & Resorts Inc. | 8,823 | 25,884 | 5,168 | — | 45,290 |
| Sunstone Hotel Investors Inc. | NA1 | 27,501 | 12,232 | — | 65,475 |
| Tanger Factory Outlet Centers | 77,998 | 28,488 | 20,251 | 2,310 | 114,860 |
| Taubman Centers Inc. | 86,027 | 36,695 | 25,082 | 3,546 | 155,550 |
| UDR Inc. | 119,826 | 78,023 | 36,018 | 6,107 | 228,881 |
| Universal Health Realty | | | | | |
| Income Trust | NA1 | 5,645 | 3,635 | 950 | 23,004 |
| Ventas Inc. | 337,888 | 119,991 | 90,409 | 16,050 | 473,402 |
| Washington Real Estate | | | | | |
| Investment Trust | NA1 | 30,411 | 17,610 | 2,984 | 104,158 |
| Weingarten Realty Investors | NA1 | 38,814 | 29,760 | 4,785 | 152,390 |
| | 7,385,878 | | | 272,958 | 14,548,347 |
| 1 Not applicable—At January 31, 2010, the issuer was not an affiliated company of the fund. |
| 2 In July 2010, HRPT Properties Trust changed its name to CommonWealth REIT. |
I. In preparing the financial statements as of January 31, 2011, management considered the impact of subsequent events for potential recognition or disclosure in these financial statements.
28
Report of Independent Registered
Public Accounting Firm
To the Trustees of Vanguard Specialized Funds and the Shareholders of Vanguard REIT Index Fund: In our opinion, the accompanying statement of net assets and statement of assets and liabilities and the related statements of operations and of changes in net assets and the financial highlights present fairly, in all material respects, the financial position of Vanguard REIT Index Fund (constituting a separate portfolio of Vanguard Specialized Funds, hereafter referred to as the “Fund”) at January 31, 2011, the results of its operations for the year then ended, the changes in its net assets for each of the two years in the period then ended and the financial highlights for each of the periods indicated, in conformity with accounting principles generally accepted in the United States of America. These financial statements and financial highlights (hereafter referred to as “financial statements”) are the responsibility of the Fund’s management; our responsibility is to express an opinion on these financial statements based on our audits. We conducted our audits of these financial statements in accordance with the standards of the Public Company Accounting Oversight Board (United States). Those standards require that we plan and perform the audit to obtain reasonable assurance about whether the financial statements are free of material misstatement. An audit includes examining, on a test basis, evidence supporting the amounts and disclosures in the financial statements, assessing the accounting principles used and significant estimates made by management, and evaluating the overall financial statement presentation. We believe that our audits, which included confirmation of securities at January 31, 2011 by correspondence with the custodian and broker and by agreement to the underlying ownership records of Vanguard Market Liquidity Fund, provide a reasonable basis for our opinion.
PricewaterhouseCoopers LLP
Philadelphia, Pennsylvania
March 11, 2011
|
| Special 2010 tax information (unaudited) for Vanguard REIT Index Fund |
This information for the fiscal year ended January 31, 2011, is included pursuant to provisions of the Internal Revenue Code.
The fund distributed $8,568,000 of qualified dividend income to shareholders during the fiscal year.
29
Your Fund’s After-Tax Returns
This table presents returns for your fund both before and after taxes. The after-tax returns are shown in two ways: (1) assuming that an investor owned the fund during the entire period and paid taxes on the fund’s distributions, and (2) assuming that an investor paid taxes on the fund’s distributions and sold all shares at the end of each period.
Calculations are based on the highest individual federal income tax and capital gains tax rates in effect at the times of the distributions and the hypothetical sales. State and local taxes were not considered. After-tax returns reflect any qualified dividend income , using actual prior-year figures and estimates for 2011. (In the example, returns after the sale of fund shares may be higher than those assuming no sale. This occurs when the sale would have produced a capital loss. The calculation assumes that the investor received a tax deduction for the loss.) The table shows returns for Investor Shares only; returns for other share classes will differ. Please note that your actual after-tax returns will depend on your tax situation and may differ from those shown. Also note that if you own the fund in a tax-deferred account, such as an individual retirement account or a 401(k) plan, this information does not apply to you. Such accounts are not subject to current taxes.
Finally, keep in mind that a fund’s performance—whether before or after taxes—does not guarantee future results.
Average Annual Total Returns: REIT Index Fund Investor Shares
Periods Ended January 31, 2011
| | | |
| | One | Five | Ten |
| | Year | Years | Years |
| Returns Before Taxes | 40.02% | 2.56% | 10.89% |
| Returns After Taxes on Distributions | 38.32 | 1.30 | 9.24 |
| Returns After Taxes on Distributions and Sale of Fund Shares | 25.90 | 1.46 | 8.63 |
Returns do not reflect the 1% fee on redemptions of shares held for less than one year.
30
About Your Fund’s Expenses
As a shareholder of the fund, you incur ongoing costs, which include costs for portfolio management, administrative services, and shareholder reports (like this one), among others. Operating expenses, which are deducted from a fund’s gross income, directly reduce the investment return of the fund.
A fund’s expenses are expressed as a percentage of its average net assets. This figure is known as the expense ratio. The following examples are intended to help you understand the ongoing costs (in dollars) of investing in your fund and to compare these costs with those of other mutual funds. The examples are based on an investment of $1,000 made at the beginning of the period shown and held for the entire period.
The accompanying table illustrates your fund’s costs in two ways:
• Based on actual fund return. This section helps you to estimate the actual expenses that you paid over the period. The ”Ending Account Value“ shown is derived from the fund‘s actual return, and the third column shows the dollar amount that would have been paid by an investor who started with $1,000 in the fund. You may use the information here, together with the amount you invested, to estimate the expenses that you paid over the period.
To do so, simply divide your account value by $1,000 (for example, an $8,600 account value divided by $1,000 = 8.6), then multiply the result by the number given for your fund under the heading ”Expenses Paid During Period.“
• Based on hypothetical 5% yearly return. This section is intended to help you compare your fund‘s costs with those of other mutual funds. It assumes that the fund had a yearly return of 5% before expenses, but that the expense ratio is unchanged. In this case—because the return used is not the fund’s actual return—the results do not apply to your investment. The example is useful in making comparisons because the Securities and Exchange Commission requires all mutual funds to calculate expenses based on a 5% return. You can assess your fund’s costs by comparing this hypothetical example with the hypothetical examples that appear in shareholder reports of other funds.
Note that the expenses shown in the table are meant to highlight and help you compare ongoing costs only and do not reflect transaction costs incurred by the fund for buying and selling securities. Further, the expenses do not include the 1% fee on redemptions of shares held for less than one year, nor do they include the account service fee described in the prospectus. If such fees were applied to your account, your costs would be higher. Your fund does not carry a “sales load.” The calculations assume no shares were bought or sold during the period. Your actual costs may have been higher or lower, depending on the amount of your investment and the timing of any purchases or redemptions.
You can find more information about the fund’s expenses, including annual expense ratios, in the Financial Statements section of this report. For additional information on operating expenses and other shareholder costs, please refer to your fund’s current prospectus.
31
Six Months Ended January 31, 2011
| | | |
| | Beginning | Ending | Expenses |
| | Account Value | Account Value | Paid During |
| REIT Index Fund | 7/31/2010 | 1/31/2011 | Period |
| Based on Actual Fund Return | | | |
| Investor Shares | $1,000.00 | $1,143.97 | $1.41 |
| Admiral Shares | 1,000.00 | 1,144.87 | 0.65 |
| Signal Shares | 1,000.00 | 1,145.01 | 0.65 |
| Institutional Shares | 1,000.00 | 1,144.38 | 0.43 |
| ETF Shares | 1,000.00 | 1,144.59 | 0.65 |
| Based on Hypothetical 5% Yearly Return | | | |
| Investor Shares | $1,000.00 | $1,023.89 | $1.33 |
| Admiral Shares | 1,000.00 | 1,024.60 | 0.61 |
| Signal Shares | 1,000.00 | 1,024.60 | 0.61 |
| Institutional Shares | 1,000.00 | 1,024.80 | 0.41 |
| ETF Shares | 1,000.00 | 1,024.60 | 0.61 |
The calculations are based on expenses incurred in the most recent six-month period. The fund’s annualized six-month expense ratios for that period are 0.26% for Investor Shares, 0.12% for Admiral Shares, 0.12% for Signal Shares, 0.08% for Institutional Shares, and 0.12% for ETF Shares. The dollar amounts shown as “Expenses Paid” are equal to the annualized expense ratio multiplied by the average account value over the period, multiplied by the number of days in the most recent six-month period, then divided by the number of days in the most recent 12-month period.
32
Glossary
Beta. A measure of the magnitude of a fund’s past share-price fluctuations in relation to the ups and downs of a given market index. The index is assigned a beta of 1.00. Compared with a given index, a fund with a beta of 1.20 typically would have seen its share price rise or fall by 12% when the index rose or fell by 10%. For this report, beta is based on returns over the past 36 months for both the fund and the index. Note that a fund’s beta should be reviewed in conjunction with its R-squared (see definition). The lower the R-squared, the less correlation there is between the fund and the index, and the less reliable beta is as an indicator of volatility.
Dividend Yield. Dividend income earned by stocks, expressed as a percentage of the aggregate market value (or of net asset value, for a fund). The yield is determined by dividing the amount of the annual dividends by the aggregate value (or net asset value) at the end of the period. For a fund, the dividend yield is based solely on stock holdings and does not include any income produced by other investments. This yield may include some payments that represent a return of capital, capital gains distributions, or both by the underlying stocks.
Earnings Growth Rate. The average annual rate of growth in earnings over the past five years for the stocks now in a fund.
Expense Ratio. The percentage of a fund’s average net assets used to pay its annual administrative and advisory expenses. These expenses directly reduce returns to investors.
Foreign Holdings. The percentage of a fund represented by stocks or depositary receipts of companies based outside the United States.
Inception Date. The date on which the assets of a fund (or one of its share classes) are first invested in accordance with the fund’s investment objective. For funds with a subscription period, the inception date is the day after that period ends. Investment performance is measured from the inception date.
Median Market Cap. An indicator of the size of companies in which a fund invests; the midpoint of market capitalization (market price x shares outstanding) of a fund’s stocks, weighted by the proportion of the fund’s assets invested in each stock. Stocks representing half of the fund’s assets have market capitalizations above the median, and the rest are below it.
Price/Book Ratio. The share price of a stock divided by its net worth, or book value, per share. For a fund, the weighted average price/book ratio of the stocks it holds.
Price/Earnings Ratio. The ratio of a stock’s current price to its per-share earnings over the past year. For a fund, the weighted average P/E of the stocks it holds. P/E is an indicator of market expectations about corporate prospects; the higher the P/E, the greater the expectations for a company’s future growth.
R-Squared. A measure of how much of a fund’s past returns can be explained by the returns from the market in general, as measured by a given index. If a fund’s total returns were precisely synchronized with an index’s returns, its R-squared would be 1.00. If the fund’s returns bore no relationship to the index’s returns, its R-squared would be 0. For this report, R-squared is based on returns over the past 36 months for both the fund and the index.
33
Return on Equity. The annual average rate of return generated by a company during the past five years for each dollar of shareholder’s equity (net income divided by shareholder’s equity). For a fund, the weighted average return on equity for the companies whose stocks it holds.
Short-Term Reserves. The percentage of a fund invested in highly liquid, short-term securities that can be readily converted to cash.
Turnover Rate. An indication of the fund’s trading activity. Funds with high turnover rates incur higher transaction costs and may be more likely to distribute capital gains (which may be taxable to investors). The turnover rate excludes in-kind transactions, which have minimal impact on costs.
34
This page intentionally left blank.
The People Who Govern Your Fund
The trustees of your mutual fund are there to see that the fund is operated and managed in your best interests since, as a shareholder, you are a part owner of the fund. Your fund’s trustees also serve on the board of directors of The Vanguard Group, Inc., which is owned by the Vanguard funds and provides services to them on an at-cost basis.
A majority of Vanguard’s board members are independent, meaning that they have no affiliation with Vanguard or the funds they oversee, apart from the sizable personal investments they have made as private individuals. The independent board members have distinguished backgrounds in business, academia, and public service. Each of the trustees and executive officers oversees 179 Vanguard funds.
The following table provides information for each trustee and executive officer of the fund. More information about the trustees is in the Statement of Additional Information, which can be obtained, without charge, by contacting Vanguard at 800-662-7447, or online at vanguard.com.
| |
| Interested Trustee1 | and President (2006–2008) of Rohm and Haas Co. |
| | (chemicals); Director of Tyco International, Ltd. |
| F. William McNabb III | (diversified manufacturing and services) and Hewlett- |
| Born 1957. Trustee Since July 2009. Chairman of the | Packard Co. (electronic computer manufacturing); |
| Board. Principal Occupation(s) During the Past Five | Senior Advisor at New Mountain Capital; Trustee |
| Years: Chairman of the Board of The Vanguard Group, | of The Conference Board; Member of the Board of |
| Inc., and of each of the investment companies served | Managers of Delphi Automotive LLP (automotive |
| by The Vanguard Group, since January 2010; Director | components). |
| of The Vanguard Group since 2008; Chief Executive | |
| Officer and President of The Vanguard Group and of | Amy Gutmann |
| each of the investment companies served by The | Born 1949. Trustee Since June 2006. Principal |
| Vanguard Group since 2008; Director of Vanguard | Occupation(s) During the Past Five Years: President |
| Marketing Corporation; Managing Director of The | of the University of Pennsylvania; Christopher H. |
| Vanguard Group (1995–2008). | Browne Distinguished Professor of Political Science |
| | in the School of Arts and Sciences with secondary |
| | appointments at the Annenberg School for Commu- |
| Independent Trustees | nication and the Graduate School of Education |
| | of the University of Pennsylvania; Director of |
| Emerson U. Fullwood | Carnegie Corporation of New York, Schuylkill River |
| Born 1948. Trustee Since January 2008. Principal | Development Corporation, and Greater Philadelphia |
| Occupation(s) During the Past Five Years: Executive | Chamber of Commerce; Trustee of the National |
| Chief Staff and Marketing Officer for North America | Constitution Center; Chair of the Presidential |
| and Corporate Vice President (retired 2008) of Xerox | Commission for the Study of Bioethical Issues. |
| Corporation (document management products and | |
| services); Executive in Residence and 2010 | JoAnn Heffernan Heisen |
| Distinguished Minett Professor at the Rochester | Born 1950. Trustee Since July 1998. Principal |
| Institute of Technology; Director of SPX Corporation | Occupation(s) During the Past Five Years: Corporate |
| (multi-industry manufacturing), the United Way of | Vice President and Chief Global Diversity Officer |
| Rochester, Amerigroup Corporation (managed health | (retired 2008) and Member of the Executive |
| care), the University of Rochester Medical Center, | Committee (1997–2008) of Johnson & Johnson |
| Monroe Community College Foundation, and North | (pharmaceuticals/consumer products); Director of |
| Carolina A&T University. | Skytop Lodge Corporation (hotels), the University |
| | Medical Center at Princeton, the Robert Wood |
| Rajiv L. Gupta | Johnson Foundation, and the Center for Work Life |
| Born 1945. Trustee Since December 2001.2 | Policy; Member of the Advisory Board of the |
| Principal Occupation(s) During the Past Five Years: | Maxwell School of Citizenship and Public Affairs |
| Chairman and Chief Executive Officer (retired 2009) | at Syracuse University. |
| | |
| F. Joseph Loughrey | Thomas J. Higgins | |
| Born 1949. Trustee Since October 2009. Principal | Born 1957. Chief Financial Officer Since September |
| Occupation(s) During the Past Five Years: President | 2008. Principal Occupation(s) During the Past Five |
| and Chief Operating Officer (retired 2009) and Vice | Years: Principal of The Vanguard Group, Inc.; Chief |
| Chairman of the Board (2008–2009) of Cummins Inc. | Financial Officer of each of the investment companies |
| (industrial machinery); Director of SKF AB (industrial | served by The Vanguard Group since 2008; Treasurer |
| machinery), Hillenbrand, Inc. (specialized consumer | of each of the investment companies served by The |
| services), the Lumina Foundation for Education, and | Vanguard Group (1998–2008) . |
| Oxfam America; Chairman of the Advisory Council | | |
| for the College of Arts and Letters and Member | Kathryn J. Hyatt | |
| of the Advisory Board to the Kellogg Institute for | Born 1955. Treasurer Since November 2008. Principal |
| International Studies at the University of Notre Dame. | Occupation(s) During the Past Five Years: Principal |
| | of The Vanguard Group, Inc.; Treasurer of each of |
| André F. Perold | the investment companies served by The Vanguard |
| Born 1952. Trustee Since December 2004. Principal | Group since 2008; Assistant Treasurer of each of the |
| Occupation(s) During the Past Five Years: George | investment companies served by The Vanguard Group |
| Gund Professor of Finance and Banking at the Harvard | (1988–2008). | |
| Business School; Chair of the Investment Committee | | |
| of HighVista Strategies LLC (private investment firm). | Heidi Stam | |
| | Born 1956. Secretary Since July 2005. Principal |
| Alfred M. Rankin, Jr. | Occupation(s) During the Past Five Years: Managing |
| Born 1941. Trustee Since January 1993. Principal | Director of The Vanguard Group, Inc., since 2006; |
| Occupation(s) During the Past Five Years: Chairman, | General Counsel of The Vanguard Group since 2005; |
| President, and Chief Executive Officer of NACCO | Secretary of The Vanguard Group and of each of the |
| Industries, Inc. (forklift trucks/housewares/lignite); | investment companies served by The Vanguard Group |
| Director of Goodrich Corporation (industrial products/ | since 2005; Director and Senior Vice President of |
| aircraft systems and services) and the National | Vanguard Marketing Corporation since 2005; |
| Association of Manufacturers; Chairman of the Federal | Principal of The Vanguard Group (1997–2006). |
| Reserve Bank of Cleveland; Trustee of University | | |
| Hospitals of Cleveland; President of the Board of The | | |
| Cleveland Museum of Art. | Vanguard Senior Management Team |
| |
| Peter F. Volanakis | R. Gregory Barton | Michael S. Miller |
| Born 1955. Trustee Since July 2009. Principal | Mortimer J. Buckley | James M. Norris |
| Occupation(s) During the Past Five Years: President | Kathleen C. Gubanich | Glenn W. Reed |
| and Chief Operating Officer (retired 2010) of Corning | Paul A. Heller | George U. Sauter |
| Incorporated (communications equipment); Director of | | |
| Corning Incorporated (2000–2010) and Dow Corning | | |
| (2001–2010); Trustee of the Corning Incorporated | Chairman Emeritus and Senior Advisor |
| Foundation and the Corning Museum of Glass; | | |
| Overseer of the Amos Tuck School of Business | John J. Brennan | |
| Administration at Dartmouth College. | Chairman, 1996–2009 | |
| | Chief Executive Officer and President, 1996–2008 |
| |
| Executive Officers | | |
| | Founder | |
| Glenn Booraem | | |
| Born 1967. Controller Since July 2010. Principal | John C. Bogle | |
| Occupation(s) During the Past Five Years: Principal | Chairman and Chief Executive Officer, 1974–1996 |
| of The Vanguard Group, Inc.; Controller of each of | | |
| the investment companies served by The Vanguard | | |
| Group since 2010; Assistant Controller of each of | | |
| the investment companies served by The Vanguard | | |
| Group (2001–2010). | | |
1 Mr. McNabb is considered an “interested person,” as defined in the Investment Company Act of 1940, because he is an officer of the Vanguard funds.
2 December 2002 for Vanguard Equity Income Fund, Vanguard Growth Equity Fund, the Vanguard Municipal Bond Funds, and the Vanguard State Tax-Exempt Funds.
|  |
| P.O. Box 2600 |
| Valley Forge, PA 19482-2600 |
Connect with Vanguard® > vanguard.com
| |
| Fund Information > 800-662-7447 | The funds or securities referred to herein are not |
| Direct Investor Account Services > 800-662-2739 | sponsored, endorsed, or promoted by MSCI, and MSCI |
| | bears no liability with respect to any such funds or |
| Institutional Investor Services > 800-523-1036 | securities. For any such funds or securities, the |
| Text Telephone for People | prospectus or the Statement of Additional Information |
| With Hearing Impairment > 800-749-7273 | contains a more detailed description of the limited |
| | relationship MSCI has with The Vanguard Group and |
| This material may be used in conjunction | any related funds. |
| with the offering of shares of any Vanguard | |
| fund only if preceded or accompanied by | |
| the fund’s current prospectus. | |
| |
| All comparative mutual fund data are from Lipper Inc. or | |
| Morningstar, Inc., unless otherwise noted. | |
| |
| You can obtain a free copy of Vanguard’s proxy voting | |
| guidelines by visiting vanguard.com/proxyreporting or by | |
| calling Vanguard at 800-662-2739. The guidelines are | |
| also available from the SEC’s website, sec.gov. In | |
| addition, you may obtain a free report on how your fund | |
| voted the proxies for securities it owned during the 12 | |
| months ended June 30. To get the report, visit either | |
| vanguard.com/proxyreporting or sec.gov. | |
| |
| You can review and copy information about your fund at | |
| the SEC’s Public Reference Room in Washington, D.C. To | |
| find out more about this public service, call the SEC at | |
| 202-551-8090. Information about your fund is also | |
| available on the SEC’s website, and you can receive | |
| copies of this information, for a fee, by sending a | |
| request in either of two ways: via e-mail addressed to | |
| publicinfo@sec.gov or via regular mail addressed to the | |
| Public Reference Section, Securities and Exchange | |
| Commission, Washington, DC 20549-1520. | |
| |
| |
| | © 2011 The Vanguard Group, Inc. |
| | All rights reserved. |
| | Vanguard Marketing Corporation, Distributor. |
| |
| | Q1230 032011 |
 |
|
| Vanguard Dividend Growth Fund |
| Annual Report |
|
| January 31, 2011 |
 |
> For the 12 months ended January 31, 2011, Vanguard Dividend Growth Fund returned about 17%.
> The fund’s return trailed that of its target benchmark and the average return of its large-capitalization core fund peers.
> The fund’s industrials, energy, and information technology sector holdings detracted most from its performance relative to the benchmark index.
| |
| Contents | |
| Your Fund’s Total Returns. | 1 |
| Chairman’s Letter. | 2 |
| Advisor’s Report. | 8 |
| Fund Profile. | 10 |
| Performance Summary. | 11 |
| Financial Statements. | 13 |
| Your Fund’s After-Tax Returns. | 22 |
| About Your Fund’s Expenses. | 23 |
| Trustees Approve Advisory Agreement. | 25 |
| Glossary. | 26 |
Please note: The opinions expressed in this report are just that—informed opinions. They should not be considered promises or advice.
Also, please keep in mind that the information and opinions cover the period through the date on the front of this report. Of course, the risks of investing in your fund are spelled out in the prospectus.
See the Glossary for definitions of investment terms used in this report.
Cover photograph: Jean Maher.
Your Fund’s Total Returns
Fiscal Year Ended January 31, 2011
| |
| | Total |
| | Returns |
| Vanguard Dividend Growth Fund | 16.85% |
| Dividend Achievers Select Index | 18.86 |
| Large-Cap Core Fund Average | 19.55 |
| Large-Cap Core Funds Average: Derived from data provided by Lipper Inc. |
Your Fund’s Performance at a Glance
January 31, 2010 , Through January 31, 2011
| | | | |
| | | | Distributions Per Share |
| | Starting | Ending | Income | Capital |
| | Share Price | Share Price | Dividends | Gains |
| Vanguard Dividend Growth Fund | $12.82 | $14.68 | $0.273 | $0.000 |
1

Chairman’s Letter
Dear Shareholder,
The strengthening of the U.S. economy over the past year helped lift corporate earnings and improved prospects for dividend payouts. The stock market’s resurgence, particularly in the second half of 2010, benefited Vanguard Dividend Growth Fund, which returned about 17% for the fiscal year ended January 31, 2011.
The fund’s return fell slightly behind that of its benchmark, the Dividend Achievers Select Index, which tracks companies that have paid dividends in each of the past ten years, and the average return of large-cap core funds.
The fund lagged its benchmark largely because its advisor didn’t hold some strong performers within the industrials and information technology sectors. The fund also held some of the weakest stocks in the energy sector.
If you own the Dividend Growth Fund in a taxable account, you may wish to review the information about its after-tax returns later in this report.
Stocks rallied as economy ground into gear
Global stock markets produced excellent returns in the year ended January 31, 2011, with much of the strength materializing in the second half. Europe’s sovereign debt challenges and concerns that the economic recovery in the United States might not reach escape velocity seemed to recede from investors’ minds, displaced by strong
2
corporate earnings and a powerful rebound in consumer spending and in the manufacturing sector.
The U.S. stock market returned about 24%. Small- and mid-capitalization stocks, often the first to respond to changes in the economic outlook, did even better. As a group, non-U.S. stock markets returned more than 18%. Emerging markets were the best performers. Despite high-profile dramas in Europe’s government bond markets, European stocks produced double-digit gains. Asia’s developed markets turned in mixed results on local exchanges, but the strength of the yen, the Australian dollar, and other regional currencies bolstered returns for U.S.-based investors.
A strong start, a faltering finish for bonds
In January 2010, the bond market’s near-term prospects looked dubious, in large part because yields hovered near generational lows. Over the following 12 months, however, yields dipped lower still. The taxable bond market returned about 5% for the year. As investors searched for yield, corporate bonds produced the best returns, with the riskiest credits leading the market.
Toward the end of the fiscal year, an improving economic outlook nudged interest rates higher, putting pressure on bond prices. This dynamic was evident in the municipal bond market, where rising
Market Barometer
| | | |
| | | Average Annual Total Returns |
| | | Periods Ended January 31, 2011 |
| | One | Three | Five |
| | Year | Years | Years |
| Stocks | | | |
| Russell 1000 Index (Large-caps) | 23.33% | 0.45% | 2.51% |
| Russell 2000 Index (Small-caps) | 31.36 | 4.57 | 2.64 |
| Dow Jones U.S. Total Stock Market Index | 24.31 | 1.22 | 2.86 |
| MSCI All Country World Index ex USA (International) | 18.50 | -0.96 | 4.08 |
| |
| Bonds | | | |
| Barclays Capital U.S. Aggregate Bond Index (Broad | | | |
| taxable market) | 5.06% | 5.36% | 5.82% |
| Barclays Capital Municipal Bond Index (Broad | | | |
| tax-exempt market) | 1.10 | 3.39 | 3.88 |
| Citigroup Three-Month U.S. Treasury Bill Index | 0.14 | 0.59 | 2.23 |
| |
| CPI | | | |
| Consumer Price Index | 1.63% | 1.42% | 2.12% |
3
rates and a confluence of other factors weighed on prices. The expiration of the Build America Bonds program, for example, raised the prospect of a spike in new tax-exempt issuance, while the extension of federal tax rate cuts that were set to expire made munis’ tax exemption somewhat less attractive. For the full year, the muni market returned about 1%.
As it has since December 2008, the Federal Reserve held its target for short-term interest rates near 0%, keeping the returns available from money market instruments such as the 3-month Treasury bill in the same neighborhood.
Fund’s performance was strong but market’s was stronger
After cutting or even halting dividends during the financial crisis, many U.S. companies resumed dividend payments over the past year. This environment boded well for the Dividend Growth Fund, which invests in large, high-quality companies with strong potential for steady earnings and dividend growth.
Wellington Management Company, llp, the fund’s advisor, invests in a relatively small group of stocks—about 50—compared with the approximately 140 stocks held by the benchmark. The advisor seeks attractively priced companies with long-term prospects for increasing dividends rather than those with a long history of dividend payments.
Expense Ratios
Your Fund Compared With Its Peer Group
| | |
| | | Peer Group |
| | Fund | Average |
| Dividend Growth Fund | 0.38% | 1.26% |
The fund expense ratio shown is from the prospectus dated May 28, 2010, and represents estimated costs for the current fiscal year. For the fiscal year ended January 31, 2011, the fund’s expense ratio was 0.34%. The peer-group expense ratio is derived from data provided by Lipper Inc. and captures information through year-end 2010.
Peer group: Large-Cap Core Funds.
4
This forward-looking approach sometimes leads the fund to purchase stocks with unexceptional current yields, a contrast with equity income strategies, which tend to emphasize current income.
The Dividend Growth Fund’s ten sectors all advanced during the 12 months. Although the fund’s holdings in industrials, energy, and information technology were among its best performers and made significant contributions to total return, they didn’t keep pace with their counterparts in the benchmark.
Industrials, the third-largest weighting in the fund, representing roughly 16 percent of its assets on average, contributed most to results during the fiscal year. Keenly sensitive to improvements in the economy, industrial stocks in aerospace and defense helped boost returns. However, the fund missed out on the sector’s best performer: Caterpillar (+90%). The farm equipment and machinery manufacturer represented more than 2% of the benchmark’s capitalization on average and contributed nearly 2 percentage points to its return. The advisor’s decision not to hold Caterpillar, which it considered overvalued, was key to the fund’s underperformance relative to the benchmark.
In the energy sector, the fund’s second-strongest contributor to return, integrated oil and gas companies, including ConocoPhillips and the BG Group, stood out. The biggest laggard was British oil
Total Returns
Ten Years Ended January 31, 2011
| |
| | Average |
| | Annual Return |
| Dividend Growth Fund | 2.65% |
| Dividend Growth Spliced Index | -1.19 |
| Dividend Growth Spliced Average | -1.15 |
Dividend Growth Spliced Index: Prior to December 6, 2002, the comparative benchmark was known as the Utilities Composite Index. The index weightings were: 40% S&P Utilities Index, 40% S&P Telephone Index, and 20% Lehman Brothers Utility Bond Index through April 30, 1999; 63.75% S&P Utilities Index, 21.25% S&P Telephone Index, and 15% Lehman Brothers Utility Bond Index through March 31, 2000; 75% S&P Utilities Index and 25% S&P Telephone Index through December 31, 2001; and 75% S&P Utilities Index and 25% S&P Integrated Telecommunication Services Index through December 6, 2002. The fund’s benchmark was the Russell 1000 Index through January 31, 2010, after which it was changed to the Dividend Achievers Select Index. The Dividend Achievers Select Index is administered exclusively for Vanguard by Mergent, Inc.
Dividend Growth Spliced Average: Based on the Utility Funds Average through December 6, 2002, and the Large-Cap Core Funds Average thereafter. Derived from data provided by Lipper Inc.
The figures shown represent past performance, which is not a guarantee of future results. (Current performance may be lower or higher than the performance data cited. For performance data current to the most recent month-end, visit our website at vanguard.com/performance.) Note, too, that both investment returns and principal value can fluctuate widely, so an investor’s shares, when sold, could be worth more or less than their original cost.
5
giant BP, which continues to struggle after its disastrous oil spill in the Gulf of Mexico last year. The benchmark did not include BP.
Within the IT arena, the third-largest contributor to the fund’s return, consulting and data-processing companies did best. But a sizable holding in Microsoft, which earned less than 1% for the period, and an underweighting of IBM (+35%) hurt relative performance.
The fund’s holdings in traditionally dividend-rich sectors of the market including financials, health care, and consumer staples also contributed to its absolute returns.
The fund beat its standards over the past decade
The Dividend Growth Fund has undergone significant changes in its mandate and strategy over the past decade. Launched in 1992 as Vanguard Utilities Income Fund, the fund changed its name in 2002. At the same time, it diversified its investments and began to focus on companies with long-term potential for dividend growth.
More recently, at the start of the year, the fund changed its benchmark to the Dividend Achievers Select Index, a standard more consistent with its mandate of investing in companies with a history of increasing their dividends. The Dividend Growth Spliced Index, combines the old and new benchmarks for performance comparison purposes.
For the ten years ended January 31, 2011, the Dividend Growth Fund’s annual return averaged 2.65%, significantly ahead of the returns of its spliced comparative standards. While the outperformance is gratifying, the fund’s 2002 change in strategy renders this information less meaningful than it is for other funds.
Stay balanced and diversified even in strong market conditions
U.S. equities ended the fiscal year with a double-digit return—the second consecutive year of growth since the depths of the financial crisis. While the market’s direction appears promising, it’s impossible to predict its near-term outlook.
Nonetheless, Vanguard’s investing counsel remains the same: Build a well-balanced, diversified portfolio that includes an asset mix of stocks, bonds, and short-term investments appropriate for your long-term goals, financial objectives, and risk tolerance.
6
Dividend Growth Fund can play an important role in such a portfolio.
The advisor’s consistent and disciplined approach of investing in companies with the potential and willingness to raise their dividends is a particularly important consideration for income-oriented investors as the fund seeks to produce a steadily rising stream of distributions. And the fund’s low costs can help you keep more of those returns in your pocket.
Thank you for investing your assets at Vanguard.
Sincerely,

F. William McNabb III
Chairman and Chief Executive Officer
February 9, 2011
7
Advisor’s Report
Vanguard Dividend Growth Fund returned 16.85% for the 12 months ended January 31, 2011, lagging the 18.86% return of the Dividend Growth Achievers Select Index and the 19.55% average return of the fund’s large-cap core fund peers.
The investment environment
As evidence of a broad economic recovery mounts, we continue to focus on identifying companies where we see a high likelihood of sustainable dividend growth. Improving global economic conditions, however, present a subtle challenge as many companies have indicated a higher degree of confidence in their business prospects. Managements typically express this confidence through more aggressive capital allocation initiatives such as increased merger and acquisition activity, stock repurchase programs, and dividend increases. It is important for us to separate the companies merely “catching up” after a dividend cut or period of modest growth from those that will sustainably grow their dividend through time. We continue to pay attention to the sustainability and history of dividends when selecting companies for the fund’s portfolio.
The fund’s successes
On an absolute basis, all ten sectors contributed positive performances for the fiscal year. The fund’s holdings in the industrials and energy sectors helped most. Among the portfolio’s top absolute contributors were ConocoPhillips, Honeywell, ADP, and Cardinal Health.
The current portfolio is expected to produce solid dividend growth for 2011. Several companies have yet to make dividend plan announcements for 2011. The most notable announcements to date include UPS, Nike, Enbridge, and Sysco.
The fund’s shortfalls
Although every sector produced a positive return during the period, a number of individual stocks detracted from performance. Among the more noteworthy laggards were Abbott Labs, Microsoft, and Medtronic. While we would prefer all the stocks in the fund to do well at all times, it’s inevitable that some will detract from performance over a given period. We assess a stock’s contribution over a longer time frame and with a consistent focus on dividend action. We expect the aforementioned three companies to raise their dividends significantly over the next five years.
The fund’s positioning and investment strategy
Our primary objective is to identify companies that we believe will steadily and reliably increase their dividend payments. We seek to fulfill this objective by carefully building the portfolio one stock at a time, giving central consideration to each company’s
8
dividend growth prospects. Our industry weightings are a result of this process. The fund has significant positions in health care, energy, and information technology and less exposure to the utilities, telecommunication services, and financial sectors.
While we still remain highly attuned to the looming threats of inflation, financial instability, and geopolitical strife, global economic conditions have undeniably improved. Our investment approach is designed to capture much of the upside such improvement will drive, while the high-quality business models that typify dividend-growing companies should help mitigate some of the risks. This balance will be increasingly important in the future.
Donald J. Kilbride
Senior Vice President and Equity Portfolio Manager
Wellington Management Company, LLP
February 16, 2011
9
Dividend Growth Fund
Fund Profile
As of January 31, 2011
| | | |
| Portfolio Characteristics | | |
| | | Dividend | DJ |
| | | Achievers | U.S. Total |
| | | Select | Market |
| | Fund | Index | Index |
| Number of Stocks | 47 | 142 | 3,858 |
| Median Market Cap | $42.9B | $42.9B | $30.9B |
| Price/Earnings Ratio | 14.9x | 15.7x | 17.7x |
| Price/Book Ratio | 2.9x | 3.1x | 2.3x |
| Return on Equity | 25.1% | 26.1% | 19.0% |
| Earnings Growth Rate | 8.6% | 3.3% | 6.0% |
| Dividend Yield | 2.6% | 2.1% | 1.7% |
| Foreign Holdings | 6.4% | 0.0% | 0.0% |
| Turnover Rate | 17% | — | — |
| Ticker Symbol | VDIGX | — | — |
| Expense Ratio1 | 0.38% | — | — |
| 30-Day SEC Yield | 2.16% | — | — |
| Short-Term Reserves | 4.0% | — | — |
| |
| Sector Diversification (% of equity exposure) |
| | | Dividend | DJ |
| | | Achievers | U.S. Total |
| | | Select | Market |
| | Fund | Index | Index |
| Consumer | | | |
| Discretionary | 10.6% | 12.2% | 11.6% |
| Consumer Staples | 16.2 | 23.8 | 9.2 |
| Energy | 13.1 | 15.0 | 11.2 |
| Financials | 6.8 | 7.2 | 16.6 |
| Health Care | 15.0 | 6.2 | 10.5 |
| Industrials | 15.8 | 21.4 | 11.5 |
| Information | | | |
| Technology | 15.5 | 6.2 | 19.1 |
| Materials | 3.8 | 5.9 | 4.5 |
| Telecommunication | | | |
| Services | 1.5 | 0.2 | 2.6 |
| Utilities | 1.7 | 1.9 | 3.2 |
| | |
| Volatility Measures | | |
| | | DJ |
| | Dividend | U.S. Total |
| | Growth | Market |
| Spliced Index | Index |
| R-Squared | 0.95 | 0.95 |
| Beta | 0.80 | 0.77 |
| These measures show the degree and timing of the fund’s fluctuations compared with the indexes over 36 months. | |
| |
| |
| Ten Largest Holdings (% of total net assets) |
| Exxon Mobil Corp. | Integrated Oil & | |
| | Gas | 3.4% |
| Automatic Data | Data Processing & | |
| Processing Inc. | Outsourced | |
| | Services | 3.3 |
| PepsiCo Inc. | Soft Drinks | 3.0 |
| BG Group plc | Integrated Oil & | |
| | Gas | 3.0 |
| Western Union Co. | Data Processing & | |
| | Outsourced | |
| | Services | 2.9 |
| Target Corp. | General | |
| | Merchandise Stores | 2.9 |
| International Business | IT Consulting & | |
| Machines Corp. | Other Services | 2.8 |
| Cardinal Health Inc. | Health Care | |
| | Distributors | 2.8 |
| Medtronic Inc. | Health Care | |
| | Equipment | 2.8 |
| General Dynamics Corp. | Aerospace & | |
| | Defense | 2.8 |
| Top Ten | | 29.7% |
| The holdings listed exclude any temporary cash investments and equity index products. |
Investment Focus
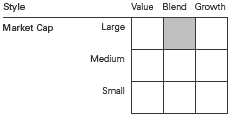
1 The expense ratio shown is from the prospectus dated May 28, 2010, and represents estimated costs for the current fiscal year. For the fiscal year ended January 31, 2011, the expense ratio was 0.34%.
10
Dividend Growth Fund
Performance Summary
All of the returns in this report represent past performance, which is not a guarantee of future results that may be achieved by the fund. (Current performance may be lower or higher than the performance data cited. For performance data current to the most recent month-end, visit our website at vanguard.com/performance.) Note, too, that both investment returns and principal value can fluctuate widely, so an investor’s shares, when sold, could be worth more or less than their original cost. The returns shown do not reflect taxes that a shareholder would pay on fund distributions or on the sale of fund shares.
Cumulative Performance: January 31, 2001, Through January 31, 2011
Initial Investment of $10,000
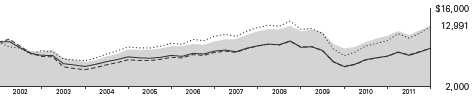
| | | | |
| | Average Annual Total Returns | |
| | Periods Ended January 31, 2011 | |
| | | | | Final Value |
| | One | Five | Ten | of a $10,000 |
| | Year | Years | Years | Investment |
| Dividend Growth Fund | 16.85% | 5.14% | 2.65% | $12,991 |
| Dow Jones U.S. Total Stock Market | | | | |
| Index | 24.31 | 2.86 | 2.47 | 12,759 |
| Dividend Growth Spliced Index | 18.86 | 1.76 | -1.19 | 8,869 |
| Dividend Growth Spliced Average | 19.55 | 1.24 | -1.15 | 8,910 |
Note: Prior to December 6, 2002, the fund was known as the Utilities Income Fund.
Dividend Growth Spliced Index: Prior to December 6, 2002, the comparative benchmark was known as the Utilities Composite Index. The index weightings were: 40% S&P Utilities Index, 40% S&P Telephone Index, and 20% Lehman Brothers Utility Bond Index through April 30, 1999; 63.75% S&P Utilities Index, 21.25% S&P Telephone Index, and 15% Lehman Brothers Utility Bond Index through March 31, 2000; 75% S&P Utilities Index and 25% S&P Telephone Index through December 31, 2001; and 75% S&P Utilities Index and 25% S&P Integrated Telecommunication Services Index through December 6, 2002. The fund’s benchmark was the Russell 1000 Index through January 31, 2010, after which it was changed to the Dividend Achievers Select Index. The Dividend Achievers Select Index is administered exclusively for Vanguard by Mergent, Inc.
Dividend Growth Spliced Average: Based on the Utility Funds Average through December 6, 2002, and the Large-Cap Core Funds Average thereafter. Derived from data provided by Lipper Inc.
See Financial Highlights for dividend and capital gains information.
11
Dividend Growth Fund
Fiscal-Year Total Returns (%): January 31, 2001, Through January 31, 2011
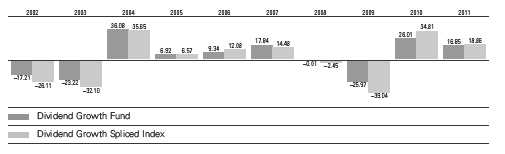
Average Annual Total Returns: Periods Ended December 31, 2010
This table presents average annual total returns through the latest calendar quarter—rather than through the end of the fiscal period. Securities and Exchange Commission rules require that we provide this information.
| | | | |
| | Inception | One | Five | Ten |
| | Date | Year | Years | Years |
| Dividend Growth Fund | 5/15/1992 | 11.42% | 5.25% | 1.80% |
12
Dividend Growth Fund
Financial Statements
Statement of Net Assets
As of January 31, 2011
The fund reports a complete list of its holdings in regulatory filings four times in each fiscal year, at the quarter-ends. For the second and fourth fiscal quarters, the lists appear in the fund’s semiannual and annual reports to shareholders. For the first and third fiscal quarters, the fund files the lists with the Securities and Exchange Commission on Form N-Q. Shareholders can look up the fund’s Forms N-Q on the SEC’s website at sec.gov. Forms N-Q may also be reviewed and copied at the SEC’s Public Reference Room (see the back cover of this report for further information).
| | |
| | | Market |
| | | Value |
| | Shares | ($000) |
| Common Stocks (96.3%) | | |
| Consumer Discretionary (10.3%) | |
| Target Corp. | 2,645,997 | 145,080 |
| Staples Inc. | 5,179,006 | 115,544 |
| Lowe’s Cos. Inc. | 4,365,798 | 108,272 |
| McDonald’s Corp. | 1,037,880 | 76,460 |
| NIKE Inc. Class B | 805,927 | 66,473 |
| | | 511,829 |
| Consumer Staples (15.6%) | | |
| PepsiCo Inc. | 2,366,748 | 152,206 |
| Sysco Corp. | 3,988,809 | 116,234 |
| Procter & Gamble Co. | 1,617,108 | 102,088 |
| CVS Caremark Corp. | 2,878,242 | 98,436 |
| Wal-Mart Stores Inc. | 1,630,217 | 91,406 |
| Colgate-Palmolive Co. | 1,175,401 | 90,235 |
| Coca-Cola Co. | 1,063,750 | 66,857 |
| Kimberly-Clark Corp. | 945,007 | 61,170 |
| | | 778,632 |
| Energy (12.6%) | | |
| Exxon Mobil Corp. | 2,114,603 | 170,606 |
| BG Group plc | 6,722,982 | 151,317 |
| Chevron Corp. | 1,236,289 | 117,361 |
| ConocoPhillips | 1,548,364 | 110,646 |
| Enbridge Inc. | 1,396,259 | 80,900 |
| | | 630,830 |
| Financials (6.6%) | | |
| ACE Ltd. | 1,844,891 | 113,627 |
| Wells Fargo & Co. | 2,707,585 | 87,780 |
| Marsh & McLennan | | |
| Cos. Inc. | 2,296,120 | 64,016 |
| Chubb Corp. | 1,070,900 | 62,037 |
| | | 327,460 |
| Health Care (14.4%) | | |
| Cardinal Health Inc. | 3,421,654 | 142,033 |
| Medtronic Inc. | 3,683,887 | 141,166 |
| Johnson & Johnson | 2,264,572 | 135,353 |
| Pfizer Inc. | 6,763,221 | 123,226 |
| | |
| | | Market |
| | | Value |
| | Shares | ($000) |
| ^ AstraZeneca plc ADR | 1,769,972 | 86,552 |
| Abbott Laboratories | 1,901,620 | 85,877 |
| UnitedHealth Group Inc. | 166,300 | 6,827 |
| | | 721,034 |
| Industrials (15.2%) | | |
| General Dynamics Corp. | 1,855,036 | 139,870 |
| Lockheed Martin Corp. | 1,592,263 | 126,744 |
| United Parcel Service Inc. | | |
| Class B | 1,553,049 | 111,229 |
| Honeywell | | |
| International Inc. | 1,873,239 | 104,920 |
| Waste Management Inc. | 2,609,933 | 98,838 |
| Emerson Electric Co. | 1,188,263 | 69,965 |
| United Technologies Corp. | 751,917 | 61,131 |
| Illinois Tool Works Inc. | 881,230 | 47,137 |
| | | 759,834 |
| Information Technology (14.9%) | |
| Automatic Data | | |
| Processing Inc. | 3,451,578 | 165,331 |
| Western Union Co. | 7,191,517 | 145,844 |
| International Business | | |
| Machines Corp. | 878,544 | 142,324 |
| Microsoft Corp. | 3,891,395 | 107,889 |
| Oracle Corp. | 2,868,884 | 91,890 |
| Accenture plc Class A | 1,766,232 | 90,908 |
| | | 744,186 |
| Materials (3.7%) | | |
| Praxair Inc. | 996,320 | 92,697 |
| Ecolab Inc. | 1,863,571 | 92,601 |
| | | 185,298 |
| Telecommunication Services (1.4%) | |
| AT&T Inc. | 2,549,755 | 70,169 |
| |
| Utilities (1.6%) | | |
| Dominion Resources Inc. | 1,858,190 | 80,906 |
| Total Common Stocks | | |
| (Cost $4,098,410) | | 4,810,178 |
13
Dividend Growth Fund
| | |
| | | Market |
| | | Value |
| | Shares | ($000) |
| Temporary Cash Investments (4.3%) | |
| Money Market Fund (0.3%) | |
| 1,2 Vanguard Market Liquidity | |
| Fund, 0.207% | 13,750,000 | 13,750 |
| |
| | Face | |
| | Amount | |
| | ($000) | |
| Repurchase Agreement (4.0%) | |
| Morgan Stanley 0.220%, | |
| 2/1/11 (Dated 1/31/11, | |
| Repurchase Value | | |
| $200,501,000, collateralized | |
| by Federal Home Loan | |
| Mortgage Corp. | | |
| 3.500%–7.000%, | | |
| 4/1/20–1/1/41) | 200,500 | 200,500 |
| Total Temporary Cash Investments | |
| (Cost $214,250) | | 214,250 |
| Total Investments (100.6%) | |
| (Cost $4,312,660) | | 5,024,428 |
| Other Assets and Liabilities (-0.6%) | |
| Other Assets | | 32,157 |
| Liabilities1 | | (61,448) |
| | | (29,291) |
| Net Assets (100%) | | |
| Applicable to 340,340,378 outstanding | |
| $.001 par value shares of beneficial | |
| interest (unlimited authorization) | 4,995,137 |
| Net Asset Value Per Share | $14.68 |
| |
| At January 31, 2011, net assets consisted of: |
| | Amount |
| | ($000) |
| Paid-in Capital | 4,390,578 |
| Undistributed Net | |
| Investment Income | 2,593 |
| Accumulated Net | |
| Realized Losses | (109,802) |
| Unrealized Appreciation | |
| (Depreciation) | 711,768 |
| Net Assets | 4,995,137 |
See Note A in Notes to Financial Statements.
^ Part of security position is on loan to broker-dealers. The total value of securities on loan is $13,448,000.
1 Includes $13,750,000 of collateral received for securities on loan.
2 Affiliated money market fund available only to Vanguard funds and certain trusts and accounts managed by Vanguard. Rate shown is the 7-day yield.
ADR—American Depositary Receipt.
See accompanying Notes, which are an integral part of the Financial Statements.
14
Dividend Growth Fund
Statement of Operations
| |
| | Year Ended |
| | January 31, 2011 |
| | ($000) |
| Investment Income | |
| Income | |
| Dividends1 | 95,153 |
| Interest | 327 |
| Security Lending | 54 |
| Total Income | 95,534 |
| Expenses | |
| Investment Advisory Fees—Note B | |
| Basic Fee | 3,926 |
| Performance Adjustment | 1,216 |
| The Vanguard Group—Note C | |
| Management and Administrative | 6,157 |
| Marketing and Distribution | 971 |
| Custodian Fees | 57 |
| Auditing Fees | 25 |
| Shareholders’ Reports | 74 |
| Trustees’ Fees and Expenses | 6 |
| Total Expenses | 12,432 |
| Net Investment Income | 83,102 |
| Realized Net Gain (Loss) | |
| Investment Securities Sold | 20,278 |
| Foreign Currencies | (61) |
| Realized Net Gain (Loss) | 20,217 |
| Change in Unrealized Appreciation (Depreciation) of Investment Securities | 504,924 |
| Net Increase (Decrease) in Net Assets Resulting from Operations | 608,243 |
| 1 Dividends are net of foreign withholding taxes of $141,000. |
See accompanying Notes, which are an integral part of the Financial Statements.
15
Dividend Growth Fund
Statement of Changes in Net Assets
| | |
| | Year Ended January 31, |
| | 2011 | 2010 |
| | ($000) | ($000) |
| Increase (Decrease) in Net Assets | | |
| Operations | | |
| Net Investment Income | 83,102 | 56,033 |
| Realized Net Gain (Loss) | 20,217 | (43,008) |
| Change in Unrealized Appreciation (Depreciation) | 504,924 | 461,001 |
| Net Increase (Decrease) in Net Assets Resulting from Operations | 608,243 | 474,026 |
| Distributions | | |
| Net Investment Income | (80,042) | (56,342) |
| Realized Capital Gain | — | — |
| Total Distributions | (80,042) | (56,342) |
| Capital Share Transactions | | |
| Issued | 2,215,256 | 1,162,613 |
| Issued in Lieu of Cash Distributions | 67,883 | 47,849 |
| Redeemed | (630,529) | (558,468) |
| Net Increase (Decrease) from Capital Share Transactions | 1,652,610 | 651,994 |
| Total Increase (Decrease) | 2,180,811 | 1,069,678 |
| Net Assets | | |
| Beginning of Period | 2,814,326 | 1,744,648 |
| End of Period1 | 4,995,137 | 2,814,326 |
| 1 Net Assets—End of Period includes undistributed (overdistributed) net investment income of $2,593,000 and ($406,000). |
See accompanying Notes, which are an integral part of the Financial Statements.
16
Dividend Growth Fund
Financial Highlights
| | | | | |
| For a Share Outstanding | | | Year Ended January 31, |
| Throughout Each Period | 2011 | 2010 | 2009 | 2008 | 2007 |
| Net Asset Value, Beginning of Period | $12.82 | $10.42 | $14.38 | $14.74 | $12.75 |
| Investment Operations | | | | | |
| Net Investment Income | .283 | .291 | .264 | .290 | .260 |
| Net Realized and Unrealized Gain (Loss) | | | | | |
| on Investments | 1.850 | 2.401 | (3.960) | (.270) | 1.990 |
| Total from Investment Operations | 2.133 | 2.692 | (3.696) | .020 | 2.250 |
| Distributions | | | | | |
| Dividends from Net Investment Income | (.273) | (.292) | (.264) | (.280) | (.260) |
| Distributions from Realized Capital Gains | — | — | — | (.100) | — |
| Total Distributions | (.273) | (.292) | (.264) | (.380) | (.260) |
| Net Asset Value, End of Period | $14.68 | $12.82 | $10.42 | $14.38 | $14.74 |
| |
| Total Return1 | 16.85% | 26.01% | -25.97% | -0.01% | 17.84% |
| |
| Ratios/Supplemental Data | | | | | |
| Net Assets, End of Period (Millions) | $4,995 | $2,814 | $1,745 | $1,326 | $1,243 |
| Ratio of Total Expenses to | | | | | |
| Average Net Assets2 | 0.34% | 0.38% | 0.36% | 0.32% | 0.38% |
| Ratio of Net Investment Income to | | | | | |
| Average Net Assets | 2.25% | 2.59% | 2.25% | 1.91% | 1.93% |
| Portfolio Turnover Rate | 17% | 24% | 28% | 36% | 41% |
1 Total returns do not include account service fees that may have applied in the periods shown. Fund prospectuses provide information about any applicable account service fees.
2 Includes performance-based investment advisory fee increases (decreases) of 0.03%, 0.03%, 0.03%, 0.00%, and 0.01%.
See accompanying Notes, which are an integral part of the Financial Statements.
17
Dividend Growth Fund
Notes to Financial Statements
Vanguard Dividend Growth Fund is registered under the Investment Company Act of 1940 as an open-end investment company, or mutual fund.
A. The following significant accounting policies conform to generally accepted accounting principles for U.S. mutual funds. The fund consistently follows such policies in preparing its financial statements.
1. Security Valuation: Securities are valued as of the close of trading on the New York Stock Exchange (generally 4 p.m., Eastern time) on the valuation date. Equity securities are valued at the latest quoted sales prices or official closing prices taken from the primary market in which each security trades; such securities not traded on the valuation date are valued at the mean of the latest quoted bid and asked prices. Securities for which market quotations are not readily available, or whose values have been affected by events occurring before the fund’s pricing time but after the close of the securities’ primary markets, are valued at their fair values calculated according to procedures adopted by the board of trustees. These procedures include obtaining quotations from an independent pricing service, monitoring news to identify significant market- or security-specific events, and evaluating changes in the values of foreign market proxies (for example, ADRs, futures contracts, or exchange-traded funds), between the time the foreign markets close and the fund’s pricing time. When fair-value pricing is employed, the prices of securities used by a fund to calculate its net asset value may differ from quoted or published prices for the same securities. Investments in Vanguard Market Liquidity Fund are valued at that fund’s net asset value. Temporary cash investments acquired over 60 days to maturity are valued using the latest bid prices or using valuations based on a matrix system (which considers such factors as security prices, yields, maturities, and ratings), both as furnished by independent pricing services. Other temporary cash investments are valued at amortized cost, which approximates market value.
2. Foreign Currency: Securities and other assets and liabilities denominated in foreign currencies are translated into U.S. dollars using exchange rates obtained from an independent third party as of the fund’s pricing time on the valuation date. Realized gains (losses) and unrealized appreciation (depreciation) on investment securities include the effects of changes in exchange rates since the securities were purchased, combined with the effects of changes in security prices. Fluctuations in the value of other assets and liabilities resulting from changes in exchange rates are recorded as unrealized foreign currency gains (losses) until the assets or liabilities are settled in cash, at which time they are recorded as realized foreign currency gains (losses).
3. Repurchase Agreements: The fund invests in repurchase agreements. Securities pledged as collateral for repurchase agreements are held by a custodian bank until the agreements mature. Each agreement requires that the market value of the collateral be sufficient to cover payments of interest and principal; however, in the event of default or bankruptcy by the other party to the agreement, retention of the collateral may be subject to legal proceedings.
4. Federal Income Taxes: The fund intends to continue to qualify as a regulated investment company and distribute all of its taxable income. Management has analyzed the fund’s tax positions taken for all open federal income tax years (January 31, 2008--2011), and has concluded that no provision for federal income tax is required in the fund’s financial statements.
18
Dividend Growth Fund
5. Distributions: Distributions to shareholders are recorded on the ex-dividend date.
6. Security Lending: The fund may lend its securities to qualified institutional borrowers to earn additional income. Security loans are required to be secured at all times by collateral at least equal to the market value of securities loaned. The fund invests cash collateral received in Vanguard Market Liquidity Fund, and records a liability for the return of the collateral, during the period the securities are on loan. Security lending income represents fees charged to borrowers plus income earned on investing cash collateral, less expenses associated with the loan.
7. Other: Dividend income is recorded on the ex-dividend date. Interest income is accrued daily. Security transactions are accounted for on the date securities are bought or sold. Costs used to determine realized gains (losses) on the sale of investment securities are those of the specific securities sold.
B. Wellington Management Company, LLP, provides investment advisory services to the fund for a fee calculated at an annual percentage rate of average net assets. The basic fee is subject to quarterly adjustments based on the fund’s performance for the preceding three years relative to the Russell 1000 Index for periods prior to February 1, 2010, and the current benchmark, the Dividend Achievers Select Index, beginning February 1, 2010. The benchmark change will be fully phased in by January 2013. For the year ended January 31, 2011, the investment advisory fee represented an effective annual basic rate of 0.11% of the fund’s average net assets before an increase of $1,216,000 (0.03%) based on performance.
C. The Vanguard Group furnishes at cost corporate management, administrative, marketing, and distribution services. The costs of such services are allocated to the fund under methods approved by the board of trustees. The fund has committed to provide up to 0.40% of its net assets in capital contributions to Vanguard. At January 31, 2011, the fund had contributed capital of $793,000 to Vanguard (included in Other Assets), representing 0.02% of the fund’s net assets and 0.32% of Vanguard’s capitalization. The fund’s trustees and officers are also directors and officers of Vanguard.
D. Various inputs may be used to determine the value of the fund’s investments. These inputs are summarized in three broad levels for financial statement purposes. The inputs or methodologies used to value securities are not necessarily an indication of the risk associated with investing in those securities.
Level 1—Quoted prices in active markets for identical securities.
Level 2—Other significant observable inputs (including quoted prices for similar securities, interest rates, prepayment speeds, credit risk, etc.).
Level 3—Significant unobservable inputs (including the fund’s own assumptions used to determine the fair value of investments).
The following table summarizes the fund’s investments as of January 31, 2011, based on the inputs used to value them:
| | | |
| | Level 1 | Level 2 | Level 3 |
| Investments | ($000) | ($000) | ($000) |
| Common Stocks | 4,658,861 | 151,317 | — |
| Temporary Cash Investments | 13,750 | 200,500 | — |
| Total | 4,672,611 | 351,817 | — |
19
Dividend Growth Fund
E. Distributions are determined on a tax basis and may differ from net investment income and realized capital gains for financial reporting purposes. Differences may be permanent or temporary. Permanent differences are reclassified among capital accounts in the financial statements to reflect their tax character. Temporary differences arise when certain items of income, expense, gain, or loss are recognized in different periods for financial statement and tax purposes; these differences will reverse at some time in the future. Differences in classification may also result from the treatment of short-term gains as ordinary income for tax purposes.
During the year ended January 31, 2011, the fund realized net foreign currency losses of $61,000, which decreased distributable net income for tax purposes; accordingly, such losses have been reclassified from accumulated net realized losses to undistributed net investment income.
For tax purposes, at January 31, 2011, the fund had $6,572,000 of ordinary income available for distribution. The fund had available capital loss carryforwards totaling $107,793,000 to offset future net capital gains through January 31, 2018. In addition, the fund realized losses of $133,000 during the period from November 1, 2010, through January 31, 2011, which are deferred and will be treated as realized for tax purposes in fiscal 2012.
At January 31, 2011, the cost of investment securities for tax purposes was $4,314,120,000. Net unrealized appreciation of investment securities for tax purposes was $710,308,000, consisting of unrealized gains of $729,094,000 on securities that had risen in value since their purchase and $18,786,000 in unrealized losses on securities that had fallen in value since their purchase.
F. During the year ended January 31, 2011, the fund purchased $2,203,533,000 of investment securities and sold $607,681,000 of investment securities, other than temporary cash investments.
G. Capital shares issued and redeemed were:
| | |
| | Year Ended January 31, |
| | 2011 | 2010 |
| | Shares | Shares |
| | (000) | (000) |
| Issued | 162,602 | 97,395 |
| Issued in Lieu of Cash Distributions | 5,031 | 3,923 |
| Redeemed | (46,786) | (49,252) |
| Net Increase (Decrease) in Shares Outstanding | 120,847 | 52,066 |
H. In preparing the financial statements as of January 31, 2011, management considered the impact of subsequent events for potential recognition or disclosure in these financial statements.
20
Report of Independent Registered
Public Accounting Firm
To the Trustees of Vanguard Specialized Funds and the Shareholders of Vanguard Dividend Growth Fund:
In our opinion, the accompanying statement of net assets and the related statements of operations and of changes in net assets and the financial highlights present fairly, in all material respects, the financial position of Vanguard Dividend Growth Fund (constituting a separate portfolio of Vanguard Specialized Funds, hereafter referred to as the “Fund”) at January 31, 2011, the results of its operations for the year then ended, the changes in its net assets for each of the two years in the period then ended and the financial highlights for each of the five years in the period then ended, in conformity with accounting principles generally accepted in the United States of America. These financial statements and financial highlights (hereafter referred to as “financial statements”) are the responsibility of the Fund’s management; our responsibility is to express an opinion on these financial statements based on our audits. We conducted our audits of these financial statements in accordance with the standards of the Public Company Accounting Oversight Board (United States). Those standards require that we plan and perform the audit to obtain reasonable assurance about whether the financial statements are free of material misstatement. An audit includes examining, on a test basis, evidence supporting the amounts and disclosures in the financial statements, assessing the accounting principles used and significant estimates made by management, and evaluating the overall financial statement presentation. We believe that our audits, which included confirmation of securities at January 31, 2011 by correspondence with the custodians and broker and by agreement to the underlying ownership records of Vanguard Market Liquidity Fund, provide a reasonable basis for our opinion.
PricewaterhouseCoopers LLP
Philadelphia, Pennsylvania
March 11, 2011
|
| Special 2010 tax information (unaudited) for Vanguard Dividend Growth Fund |
This information for the fiscal year ended January 31, 2011, is included pursuant to provisions of the Internal Revenue Code.
The fund distributed $80,042,000 of qualified dividend income to shareholders during the fiscal year.
For corporate shareholders, 100% of investment income (dividend income plus short-term gains, if any) qualifies for the dividends-received deduction.
21
Your Fund’s After-Tax Returns
This table presents returns for your fund both before and after taxes. The after-tax returns are shown in two ways: (1) assuming that an investor owned the fund during the entire period and paid taxes on the fund’s distributions, and (2) assuming that an investor paid taxes on the fund’s distributions and sold all shares at the end of each period.
Calculations are based on the highest individual federal income tax and capital gains tax rates in effect at the times of the distributions and the hypothetical sales. State and local taxes were not considered. After-tax returns reflect any qualified dividend income , using actual prior-year figures and estimates for 2011. (In the example, returns after the sale of fund shares may be higher than those assuming no sale. This occurs when the sale would have produced a capital loss. The calculation assumes that the investor received a tax deduction for the loss.) Please note that your actual after-tax returns will depend on your tax situation and may differ from those shown. Also note that if you own the fund in a tax-deferred account, such as an individual retirement account or a 401(k) plan, this information does not apply to you. Such accounts are not subject to current taxes.
Finally, keep in mind that a fund’s performance—whether before or after taxes—does not guarantee future results.
Average Annual Total Returns: Dividend Growth Fund
Periods Ended January 31, 2011
| | | |
| | One | Five | Ten |
| | Year | Years | Years |
| Returns Before Taxes | 16.85% | 5.14% | 2.65% |
| Returns After Taxes on Distributions | 16.50 | 4.79 | 2.07 |
| Returns After Taxes on Distributions and Sale of Fund Shares | 11.36 | 4.38 | 2.03 |
22
About Your Fund’s Expenses
As a shareholder of the fund, you incur ongoing costs, which include costs for portfolio management, administrative services, and shareholder reports (like this one), among others. Operating expenses, which are deducted from a fund’s gross income, directly reduce the investment return of the fund.
A fund’s expenses are expressed as a percentage of its average net assets. This figure is known as the expense ratio. The following examples are intended to help you understand the ongoing costs (in dollars) of investing in your fund and to compare these costs with those of other mutual funds. The examples are based on an investment of $1,000 made at the beginning of the period shown and held for the entire period.
The accompanying table illustrates your fund’s costs in two ways:
• Based on actual fund return. This section helps you to estimate the actual expenses that you paid over the period. The ”Ending Account Value“ shown is derived from the fund‘s actual return, and the third column shows the dollar amount that would have been paid by an investor who started with $1,000 in the fund. You may use the information here, together with the amount you invested, to estimate the expenses that you paid over the period.
To do so, simply divide your account value by $1,000 (for example, an $8,600 account value divided by $1,000 = 8.6), then multiply the result by the number given for your fund under the heading ”Expenses Paid During Period.“
• Based on hypothetical 5% yearly return. This section is intended to help you compare your fund‘s costs with those of other mutual funds. It assumes that the fund had a yearly return of 5% before expenses, but that the expense ratio is unchanged. In this case—because the return used is not the fund’s actual return—the results do not apply to your investment. The example is useful in making comparisons because the Securities and Exchange Commission requires all mutual funds to calculate expenses based on a 5% return. You can assess your fund’s costs by comparing this hypothetical example with the hypothetical examples that appear in shareholder reports of other funds.
Note that the expenses shown in the table are meant to highlight and help you compare ongoing costs only and do not reflect transaction costs incurred by the fund for buying and selling securities. Further, the expenses do not include the account service fee described in the prospectus. If such a fee were applied to your account, your costs would be higher. Your fund does not charge transaction fees, such as purchase or redemption fees, nor does it carry a “sales load.” The calculations assume no shares were bought or sold during the period. Your actual costs may have been higher or lower, depending on the amount of your investment and the timing of any purchases or redemptions.
You can find more information about the fund’s expenses, including annual expense ratios, in the Financial Statements section of this report. For additional information on operating expenses and other shareholder costs, please refer to your fund’s current prospectus.
23
Six Months Ended January 31, 2011
| | | |
| | Beginning | Ending | Expenses |
| | Account Value | Account Value | Paid During |
| Dividend Growth Fund | 7/31/2010 | 1/31/2011 | Period |
| Based on Actual Fund Return | $1,000.00 | $1,151.90 | $1.74 |
| Based on Hypothetical 5% Yearly Return | 1,000.00 | 1,023.59 | 1.63 |
The calculations are based on expenses incurred in the most recent six-month period. The fund’s annualized six-month expense ratio for that period is 0.32%. The dollar amounts shown as “Expenses Paid” are equal to the annualized expense ratio multiplied by the average account value over the period, multiplied by the number of days in the most recent six-month period, then divided by the number of days in the most recent 12-month period.
24
Trustees Approve Advisory Agreement
The board of trustees of Vanguard Dividend Growth Fund has renewed the fund’s investment advisory agreement with Wellington Management Company, LLP. The board determined that the retention of the advisor was in the best interests of the fund and its shareholders.
The board based its decision upon an evaluation of the advisor’s investment staff, portfolio management process, and performance. The trustees considered the factors discussed below, among others. However, no single factor determined whether the board approved the agreement. Rather, it was the totality of the circumstances that drove the board’s decision.
Nature, extent, and quality of services
The board considered the quality of the fund’s investment management over both the short and long term, and took into account the organizational depth and stability of the advisor. The board noted that Wellington Management, founded in 1928, is among the nation’s oldest and most respected institutional managers. The firm has advised the fund since its inception in 1992. The portfolio manager is backed by a well-tenured team of research analysts who conduct detailed fundamental analysis of their respective industries and companies. Wellington Management has provided high-quality advisory services to the fund.
The board concluded that Wellington Management’s experience, stability, depth, and performance, among other factors, warranted continuation of the advisory agreement.
Investment performance
The board considered the short- and long-term performance of the fund, including any periods of outperformance or underperformance of a relevant benchmark and peer group. The board noted that since the fund’s reconstituted dividend growth mandate, which began in 2002, short- and long-term performance has been mixed relative to the Dividend Growth Spliced Index. Although the fund has lagged its benchmark over the last 12 months, the fund outperformed its benchmark over the last three- and five-year periods. Information about the fund’s most recent performance can be found in the Performance Summary section of this report.
Cost
The board concluded that the fund’s expense ratio was well below the average expense ratio charged by funds in its peer group and that the fund’s advisory fee rate was also well below its peer-group average. Information about the fund’s expense ratio appears in the About Your Fund’s Expenses section of this report as well as in the Financial Statements section, which also includes information about the advisory fee rate.
The board did not consider profitability of Wellington Management in determining whether to approve the advisory fee, because Wellington Management is independent of Vanguard, and the advisory fee is the result of arm’s-length negotiations.
The benefit of economies of scale
The board concluded that the fund’s shareholders benefit from economies of scale because of breakpoints in the fund’s advisory fee schedule. The breakpoints reduce the effective rate of the fee as the fund’s assets increase.
The board will consider whether to renew the advisory agreement again after a one-year period.
25
Glossary
30-Day SEC Yield. A fund’s 30-day SEC yield is derived using a formula specified by the U.S. Securities and Exchange Commission. Under the formula, data related to the fund’s security holdings in the previous 30 days are used to calculate the fund’s hypothetical net income for that period, which is then annualized and divided by the fund’s estimated average net assets over the calculation period. For the purposes of this calculation, a security’s income is based on its current market yield to maturity (in the case of bonds) or its projected dividend yield (for stocks). Because the SEC yield represents hypothetical annualized income, it will differ—at times significantly—from the fund’s actual experience. As a result, the fund’s income distributions may be higher or lower than implied by the SEC yield.
Beta. A measure of the magnitude of a fund’s past share-price fluctuations in relation to the ups and downs of a given market index. The index is assigned a beta of 1.00. Compared with a given index, a fund with a beta of 1.20 typically would have seen its share price rise or fall by 12% when the index rose or fell by 10%. For this report, beta is based on returns over the past 36 months for both the fund and the index. Note that a fund’s beta should be reviewed in conjunction with its R-squared (see definition). The lower the R-squared, the less correlation there is between the fund and the index, and the less reliable beta is as an indicator of volatility.
Dividend Yield. Dividend income earned by stocks, expressed as a percentage of the aggregate market value (or of net asset value, for a fund). The yield is determined by dividing the amount of the annual dividends by the aggregate value (or net asset value) at the end of the period. For a fund, the dividend yield is based solely on stock holdings and does not include any income produced by other investments.
Earnings Growth Rate. The average annual rate of growth in earnings over the past five years for the stocks now in a fund.
Equity Exposure. A measure that reflects a fund’s investments in stocks and stock futures. Any holdings in short-term reserves are excluded.
Expense Ratio. The percentage of a fund’s average net assets used to pay its annual administrative and advisory expenses. These expenses directly reduce returns to investors.
Foreign Holdings. The percentage of a fund represented by stocks or depositary receipts of companies based outside the United States.
Inception Date. The date on which the assets of a fund (or one of its share classes) are first invested in accordance with the fund’s investment objective. For funds with a subscription period, the inception date is the day after that period ends. Investment performance is measured from the inception date.
Median Market Cap. An indicator of the size of companies in which a fund invests; the midpoint of market capitalization (market price x shares outstanding) of a fund’s stocks, weighted by the proportion of the fund’s assets invested in each stock. Stocks representing half of the fund’s assets have market capitalizations above the median, and the rest are below it.
Price/Book Ratio. The share price of a stock divided by its net worth, or book value, per share. For a fund, the weighted average price/book ratio of the stocks it holds.
26
Price/Earnings Ratio. The ratio of a stock’s current price to its per-share earnings over the past year. For a fund, the weighted average P/E of the stocks it holds. P/E is an indicator of market expectations about corporate prospects; the higher the P/E, the greater the expectations for a company’s future growth.
R-Squared. A measure of how much of a fund’s past returns can be explained by the returns from the market in general, as measured by a given index. If a fund’s total returns were precisely synchronized with an index’s returns, its R-squared would be 1.00. If the fund’s returns bore no relationship to the index’s returns, its R-squared would be 0. For this report, R-squared is based on returns over the past 36 months for both the fund and the index.
Return on Equity. The annual average rate of return generated by a company during the past five years for each dollar of shareholder’s equity (net income divided by shareholder’s equity). For a fund, the weighted average return on equity for the companies whose stocks it holds.
Short-Term Reserves. The percentage of a fund invested in highly liquid, short-term securities that can be readily converted to cash.
Turnover Rate. An indication of the fund’s trading activity. Funds with high turnover rates incur higher transaction costs and may be more likely to distribute capital gains (which may be taxable to investors). The turnover rate excludes in-kind transactions, which have minimal impact on costs.
27
The People Who Govern Your Fund
The trustees of your mutual fund are there to see that the fund is operated and managed in your best interests since, as a shareholder, you are a part owner of the fund. Your fund’s trustees also serve on the board of directors of The Vanguard Group, Inc., which is owned by the Vanguard funds and provides services to them on an at-cost basis.
A majority of Vanguard’s board members are independent, meaning that they have no affiliation with Vanguard or the funds they oversee, apart from the sizable personal investments they have made as private individuals. The independent board members have distinguished backgrounds in business, academia, and public service. Each of the trustees and executive officers oversees 179 Vanguard funds.
The following table provides information for each trustee and executive officer of the fund. More information about the trustees is in the Statement of Additional Information, which can be obtained, without charge, by contacting Vanguard at 800-662-7447, or online at vanguard.com.
| |
| Interested Trustee1 | and President (2006–2008) of Rohm and Haas Co. |
| | (chemicals); Director of Tyco International, Ltd. |
| F. William McNabb III | (diversified manufacturing and services) and Hewlett- |
| Born 1957. Trustee Since July 2009. Chairman of the | Packard Co. (electronic computer manufacturing); |
| Board. Principal Occupation(s) During the Past Five | Senior Advisor at New Mountain Capital; Trustee |
| Years: Chairman of the Board of The Vanguard Group, | of The Conference Board; Member of the Board of |
| Inc., and of each of the investment companies served | Managers of Delphi Automotive LLP (automotive |
| by The Vanguard Group, since January 2010; Director | components). |
| of The Vanguard Group since 2008; Chief Executive | |
| Officer and President of The Vanguard Group and of | Amy Gutmann |
| each of the investment companies served by The | Born 1949. Trustee Since June 2006. Principal |
| Vanguard Group since 2008; Director of Vanguard | Occupation(s) During the Past Five Years: President |
| Marketing Corporation; Managing Director of The | of the University of Pennsylvania; Christopher H. |
| Vanguard Group (1995–2008). | Browne Distinguished Professor of Political Science |
| | in the School of Arts and Sciences with secondary |
| | appointments at the Annenberg School for Commu- |
| Independent Trustees | nication and the Graduate School of Education |
| | of the University of Pennsylvania; Director of |
| Emerson U. Fullwood | Carnegie Corporation of New York, Schuylkill River |
| Born 1948. Trustee Since January 2008. Principal | Development Corporation, and Greater Philadelphia |
| Occupation(s) During the Past Five Years: Executive | Chamber of Commerce; Trustee of the National |
| Chief Staff and Marketing Officer for North America | Constitution Center; Chair of the Presidential |
| and Corporate Vice President (retired 2008) of Xerox | Commission for the Study of Bioethical Issues. |
| Corporation (document management products and | |
| services); Executive in Residence and 2010 | JoAnn Heffernan Heisen |
| Distinguished Minett Professor at the Rochester | Born 1950. Trustee Since July 1998. Principal |
| Institute of Technology; Director of SPX Corporation | Occupation(s) During the Past Five Years: Corporate |
| (multi-industry manufacturing), the United Way of | Vice President and Chief Global Diversity Officer |
| Rochester, Amerigroup Corporation (managed health | (retired 2008) and Member of the Executive |
| care), the University of Rochester Medical Center, | Committee (1997–2008) of Johnson & Johnson |
| Monroe Community College Foundation, and North | (pharmaceuticals/consumer products); Director of |
| Carolina A&T University. | Skytop Lodge Corporation (hotels), the University |
| | Medical Center at Princeton, the Robert Wood |
| Rajiv L. Gupta | Johnson Foundation, and the Center for Work Life |
| Born 1945. Trustee Since December 2001.2 | Policy; Member of the Advisory Board of the |
| Principal Occupation(s) During the Past Five Years: | Maxwell School of Citizenship and Public Affairs |
| Chairman and Chief Executive Officer (retired 2009) | at Syracuse University. |
| | |
| F. Joseph Loughrey | Thomas J. Higgins | |
| Born 1949. Trustee Since October 2009. Principal | Born 1957. Chief Financial Officer Since September |
| Occupation(s) During the Past Five Years: President | 2008. Principal Occupation(s) During the Past Five |
| and Chief Operating Officer (retired 2009) and Vice | Years: Principal of The Vanguard Group, Inc.; Chief |
| Chairman of the Board (2008–2009) of Cummins Inc. | Financial Officer of each of the investment companies |
| (industrial machinery); Director of SKF AB (industrial | served by The Vanguard Group since 2008; Treasurer |
| machinery), Hillenbrand, Inc. (specialized consumer | of each of the investment companies served by The |
| services), the Lumina Foundation for Education, and | Vanguard Group (1998–2008) . |
| Oxfam America; Chairman of the Advisory Council | | |
| for the College of Arts and Letters and Member | Kathryn J. Hyatt | |
| of the Advisory Board to the Kellogg Institute for | Born 1955. Treasurer Since November 2008. Principal |
| International Studies at the University of Notre Dame. | Occupation(s) During the Past Five Years: Principal |
| | of The Vanguard Group, Inc.; Treasurer of each of |
| André F. Perold | the investment companies served by The Vanguard |
| Born 1952. Trustee Since December 2004. Principal | Group since 2008; Assistant Treasurer of each of the |
| Occupation(s) During the Past Five Years: George | investment companies served by The Vanguard Group |
| Gund Professor of Finance and Banking at the Harvard | (1988–2008). | |
| Business School; Chair of the Investment Committee | | |
| of HighVista Strategies LLC (private investment firm). | Heidi Stam | |
| | Born 1956. Secretary Since July 2005. Principal |
| Alfred M. Rankin, Jr. | Occupation(s) During the Past Five Years: Managing |
| Born 1941. Trustee Since January 1993. Principal | Director of The Vanguard Group, Inc., since 2006; |
| Occupation(s) During the Past Five Years: Chairman, | General Counsel of The Vanguard Group since 2005; |
| President, and Chief Executive Officer of NACCO | Secretary of The Vanguard Group and of each of the |
| Industries, Inc. (forklift trucks/housewares/lignite); | investment companies served by The Vanguard Group |
| Director of Goodrich Corporation (industrial products/ | since 2005; Director and Senior Vice President of |
| aircraft systems and services) and the National | Vanguard Marketing Corporation since 2005; |
| Association of Manufacturers; Chairman of the Federal | Principal of The Vanguard Group (1997–2006). |
| Reserve Bank of Cleveland; Trustee of University | | |
| Hospitals of Cleveland; President of the Board of The | | |
| Cleveland Museum of Art. | Vanguard Senior Management Team |
| |
| Peter F. Volanakis | R. Gregory Barton | Michael S. Miller |
| Born 1955. Trustee Since July 2009. Principal | Mortimer J. Buckley | James M. Norris |
| Occupation(s) During the Past Five Years: President | Kathleen C. Gubanich | Glenn W. Reed |
| and Chief Operating Officer (retired 2010) of Corning | Paul A. Heller | George U. Sauter |
| Incorporated (communications equipment); Director of | | |
| Corning Incorporated (2000–2010) and Dow Corning | | |
| (2001–2010); Trustee of the Corning Incorporated | Chairman Emeritus and Senior Advisor |
| Foundation and the Corning Museum of Glass; | | |
| Overseer of the Amos Tuck School of Business | John J. Brennan | |
| Administration at Dartmouth College. | Chairman, 1996–2009 | |
| | Chief Executive Officer and President, 1996–2008 |
| |
| Executive Officers | | |
| | Founder | |
| Glenn Booraem | | |
| Born 1967. Controller Since July 2010. Principal | John C. Bogle | |
| Occupation(s) During the Past Five Years: Principal | Chairman and Chief Executive Officer, 1974–1996 |
| of The Vanguard Group, Inc.; Controller of each of | | |
| the investment companies served by The Vanguard | | |
| Group since 2010; Assistant Controller of each of | | |
| the investment companies served by The Vanguard | | |
| Group (2001–2010). | | |
1 Mr. McNabb is considered an “interested person,” as defined in the Investment Company Act of 1940, because he is an officer of the Vanguard funds.
2 December 2002 for Vanguard Equity Income Fund, Vanguard Growth Equity Fund, the Vanguard Municipal Bond Funds, and the Vanguard State Tax-Exempt Funds.
|  |
| P.O. Box 2600 |
| Valley Forge, PA 19482-2600 |
Connect with Vanguard® > vanguard.com
| |
| Fund Information > 800-662-7447 | |
| Direct Investor Account Services > 800-662-2739 | |
| Institutional Investor Services > 800-523-1036 | |
| Text Telephone for People | |
| With Hearing Impairment > 800-749-7273 | |
| |
| This material may be used in conjunction | |
| with the offering of shares of any Vanguard | |
| fund only if preceded or accompanied by | |
| the fund’s current prospectus. | |
| |
| All comparative mutual fund data are from Lipper Inc. or | |
| Morningstar, Inc., unless otherwise noted. | |
| |
| You can obtain a free copy of Vanguard’s proxy voting | |
| guidelines by visiting vanguard.com/proxyreporting or by | |
| calling Vanguard at 800-662-2739. The guidelines are | |
| also available from the SEC’s website, sec.gov. In | |
| addition, you may obtain a free report on how your fund | |
| voted the proxies for securities it owned during the 12 | |
| months ended June 30. To get the report, visit either | |
| vanguard.com/proxyreporting or sec.gov. | |
| |
| You can review and copy information about your fund at | |
| the SEC’s Public Reference Room in Washington, D.C. To | |
| find out more about this public service, call the SEC at | |
| 202-551-8090. Information about your fund is also | |
| available on the SEC’s website, and you can receive | |
| copies of this information, for a fee, by sending a | |
| request in either of two ways: via e-mail addressed to | |
| publicinfo@sec.gov or via regular mail addressed to the | |
| Public Reference Section, Securities and Exchange | |
| Commission, Washington, DC 20549-1520. | |
| |
| |
| | © 2011 The Vanguard Group, Inc. |
| | All rights reserved. |
| | Vanguard Marketing Corporation, Distributor. |
| |
| | Q570 032011 |
 |
|
| Vanguard Dividend Appreciation |
| Index Fund Annual Report |
|
| January 31, 2011 |
 |
> For the fiscal year ended January 31, 2011, Vanguard Dividend Appreciation Index Fund returned about 19%.
> The fund closely tracked the return of its target index, the Dividend Achievers Select Index, but slightly trailed the average return of large-cap core funds.
> Nine of the index’s ten market sectors advanced, with industrials, energy, and consumer staples contributing most to the index’s return.
| |
| Contents | |
| Your Fund’s Total Returns. | 1 |
| Chairman’s Letter. | 2 |
| Fund Profile. | 7 |
| Performance Summary. | 8 |
| Financial Statements. | 10 |
| Your Fund’s After-Tax Returns. | 21 |
| About Your Fund’s Expenses. | 22 |
| Glossary. | 24 |
Please note: The opinions expressed in this report are just that—informed opinions. They should not be considered promises or advice. Also, please keep in mind that the information and opinions cover the period through the date on the front of this report. Of course, the risks of investing in your fund are spelled out in the prospectus.
See the Glossary for definitions of investment terms used in this report.
Cover photograph: Jean Maher.
Your Fund’s Total Returns
Fiscal Year Ended January 31, 2011
| |
| | Total |
| | Returns |
| Vanguard Dividend Appreciation Index Fund | |
| Investor Shares | 18.75% |
| ETF Shares | |
| Market Price | 19.07 |
| Net Asset Value | 18.91 |
| Dividend Achievers Select Index | 18.86 |
| Large-Cap Core Funds Average | 19.55 |
| Large-Cap Core Funds Average: Derived from data provided by Lipper Inc. |
The Vanguard ETF® Shares shown are traded on the NYSE Arca exchange and are available only through brokers. The table provides ETF returns based on both the NYSE Arca market price and the net asset value for a share. U.S. Pat. No. 6,879,964 B2; 7,337,138.
For the ETF Shares, the market price is determined by the midpoint of the bid-offer spread as of the closing time of the New York Stock Exchange (generally 4 p.m., Eastern time). The net asset value is also determined as of the NYSE closing time. For more information about how the ETF Shares' market prices have compared with their net asset value, visit vanguard.com, select your ETF, and then select the Price and Performance tab. The ETF premium/discount analysis there shows the percentages of days on which the ETF Shares' market price was above or below the NAV.
Your Fund’s Performance at a Glance
January 31, 2010 , Through January 31, 2011
| | | | |
| | | | Distributions Per Share |
| | Starting | Ending | Income | Capital |
| | Share Price | Share Price | Dividends | Gains |
| Vanguard Dividend Appreciation Index Fund | | | | |
| Investor Shares | $18.33 | $21.33 | $0.398 | $0.000 |
| ETF Shares | 45.81 | 53.32 | 1.048 | 0.000 |
1

Chairman’s Letter
Dear Shareholder,
Vanguard Dividend Appreciation Index Fund returned about 19% for the 12 months ended January 31, 2011, in line with the return of its benchmark, the Dividend Achievers Select Index, but slightly behind the average return of large-company core funds.
During the fiscal year, the U.S. stock market’s best performers tended to be small- and mid-capitalization companies. The Dividend Appreciation Index Fund focuses on large, profitable companies with a history of increasing dividends, and so the prices of its underlying securities did not rise as sharply as those of the smaller companies that fueled the recent broad market rally.
If you own the Dividend Appreciation Index Fund in a taxable account, you may wish to review the information about its after-tax returns later in this report.
Stocks rallied as economy ground into gear
Global stock markets produced excellent returns for the year, with much of the strength materializing in the second half. Europe’s sovereign-debt challenges and concerns that the economic recovery in the United States might not reach escape velocity seemed to recede from investors’ minds, displaced by strong corporate earnings and a powerful rebound in consumer spending and in the manufacturing sector.
2
The U.S. stock market returned about 24%. Small- and mid-capitalization stocks, often the first to respond to changes in the economic outlook, did even better. As a group, non-U.S. stock markets returned more than 18%. Emerging markets were the best performers. Despite high-profile dramas in Europe’s government bond markets, European stocks produced double-digit gains. Asia’s developed markets turned in mixed results on local exchanges, but the strength of the yen, the Australian dollar, and other regional currencies bolstered returns for U.S.-based investors.
A strong start, a faltering finish for bonds
In January 2010, the bond market’s near-term prospects looked dubious, in large part because yields hovered near generational lows. Over the following 12 months, however, yields dipped lower still. The taxable bond market returned about 5% for the year. As investors searched for yield, corporate bonds produced the best returns, with the riskiest credits leading the market.
Toward the end of the fiscal year, an improving economic outlook nudged interest rates higher, putting pressure on bond prices. This dynamic was evident in the municipal bond market, where rising rates and a confluence of other factors weighed on prices. The expiration of the Build America Bonds program, for example, raised the prospect of a spike in new tax-exempt issuance, while the extension of federal tax rate cuts that were set to expire
Market Barometer
| | | |
| | | Average Annual Total Returns |
| | | Periods Ended January 31, 2011 |
| | One | Three | Five |
| | Year | Years | Years |
| Stocks | | | |
| Russell 1000 Index (Large-caps) | 23.33% | 0.45% | 2.51% |
| Russell 2000 Index (Small-caps) | 31.36 | 4.57 | 2.64 |
| Dow Jones U.S. Total Stock Market Index | 24.31 | 1.22 | 2.86 |
| MSCI All Country World Index ex USA (International) | 18.50 | -0.96 | 4.08 |
| |
| Bonds | | | |
| Barclays Capital U.S. Aggregate Bond Index (Broad | | | |
| taxable market) | 5.06% | 5.36% | 5.82% |
| Barclays Capital Municipal Bond Index (Broad | | | |
| tax-exempt market) | 1.10 | 3.39 | 3.88 |
| Citigroup Three-Month U.S. Treasury Bill Index | 0.14 | 0.59 | 2.23 |
| |
| CPI | | | |
| Consumer Price Index | 1.63% | 1.42% | 2.12% |
3
made munis’ tax exemption somewhat less attractive. For the full year, the muni market returned about 1%.
As it has since December 2008, the Federal Reserve held its target for short-term interest rates near 0%, keeping the returns available from money market instruments such as the 3-month Treasury bill in the same neighborhood.
Industrial stocks boosted the index’s fiscal-year return
After many U.S. companies chopped— or even halted—dividend payments amid the financial crisis, rising earnings led to an improved dividend outlook during the year. This boded well for the Dividend Appreciation Index Fund, which invests in blue-chip companies with a ten-year track record of increasing dividends.
Nine of the index’s ten sectors posted positive returns for the fiscal year. The industrial, energy, and consumer staples sectors did particularly well. Industrials, the index’s second-largest sector weighting, on average, during the period, contributed almost a third of its overall return. Among the sector’s outstanding performers were industry bellwethers that have benefited from the recent growing demand for heavy machinery among mining, transportation infrastructure, and energy companies in emerging markets.
Expense Ratios
Your Fund Compared With Its Peer Group
| | | |
| | Investor | ETF | Peer Group |
| | Shares | Shares | Average |
| Dividend Appreciation Index Fund | 0.35% | 0.23% | 1.26% |
The fund expense ratios shown are from the prospectus dated May 28, 2010, and represent estimated costs for the current fiscal year. For the fiscal year ended January 31, 2011, the fund’s expense ratios were 0.30% for Investor Shares and 0.18% for ETF Shares. The peer-group expense ratio is derived from data provided by Lipper Inc. and captures information through year-end 2010.
Peer group: Large-Cap Core Funds.
4
In the energy sector, the index had a sizable allocation to large integrated oil and gas companies, many of which have surged recently on the growing demand for and rising prices of crude oil. Energy stocks contributed about 3 percentage points to the index’s return.
The consumer staples sector, the largest weighting in the index, also contributed about 3 percentage points to the index’s return. Giant food, beverage, and drug retailers were some of the top performers in this sector.
The index’s weakest result, and its only negative return, came from a traditionally dividend-rich segment of the market: health care. Pharmaceutical and medical equipment manufacturers, which faced product and regulatory challenges, accounted for much of the losses in this sector.
A healthy record over the longer term
Since the fund’s inception in 2006, Vanguard Dividend Appreciation Index Fund’s Investor Shares have had an average annual return of 3.19%, in line with the fund’s benchmark (+3.37%) but significantly ahead of its peers in the large-cap core funds category (+0.81%). This isn’t too surprising, since higher-quality, dividend-paying stocks tend to be better able to weather sharp declines in the stock market such as those we experienced during the recent financial crisis.
Total Returns
Inception Through January 31, 2011
| |
| | Average |
| | Annual Return |
| Dividend Appreciation Index Fund Investor Shares (Returns since inception: 4/27/2006) | 3.19% |
| Dividend Achievers Select Index | 3.37 |
| Large-Cap Core Funds Average | 0.81 |
| Large-Cap Core Funds Average: Derived from data provided by Lipper Inc. |
The figures shown represent past performance, which is not a guarantee of future results. (Current performance may be lower or higher than the performance data cited. For performance data current to the most recent month-end, visit our website at vanguard.com/performance.) Note, too, that both investment returns and principal value can fluctuate widely, so an investor’s shares, when sold, could be worth more or less than their original cost.
5
Since its inception, the Dividend Appreciation Index Fund has consistently met its investment objective of closely tracking its unmanaged benchmark, which has no costs or operating expenses. This tracking success is a testament to the skills of the fund’s investment advisor, Vanguard Quantitative Equity Group. Over the course of more than three decades, the group has developed sophisticated portfolio construction and trading methodologies to help Vanguard deliver sound index-fund management in a variety of different marketplaces and market environments. The group’s efforts are made easier, of course, by your fund’s low operating expenses.
Market conditions shouldn’t affect your investment strategy
The broad U.S. equity market ended the fiscal year with a double-digit return— marking the second consecutive year of growth since the depths of the financial crisis. While the market’s direction appears promising, it’s impossible to predict where it’s headed.
Vanguard’s approach to investing remains the same in any type of market: Build a well-balanced and diversified portfolio that includes an asset mix of stocks, bonds, and short-term investments appropriate for your long-term goals, financial objectives, and risk tolerance. Vanguard Dividend Appreciation Index Fund can play an important role in such a balanced, diversified portfolio by providing you with a cost-efficient way to invest in companies with strong prospects for dividends over the long term.
Thank you for investing your assets at Vanguard.
Sincerely,

F. William McNabb III
Chairman and Chief Executive Officer
February 9, 2011
6
Dividend Appreciation Index Fund
Fund Profile
As of January 31, 2011
| | | |
| Share-Class Characteristics | | |
| |
| | Investor | | ETF |
| | Shares | | Shares |
| Ticker Symbol | VDAIX | | VIG |
| Expense Ratio1 | 0.35% | | 0.23% |
| 30-Day SEC Yield | 2.02% | | 2.13% |
| |
| Portfolio Characteristics | | |
| | Dividend | DJ |
| | Achievers | U.S. Total |
| | | Select | Market |
| | Fund | Index | Index |
| Number of Stocks | 138 | 142 | 3,858 |
| Median Market Cap $42.9B | $42.9B | $30.9B |
| Price/Earnings Ratio | 15.7x | 15.7x | 17.7x |
| Price/Book Ratio | 3.1x | 3.1x | 2.3x |
| Return on Equity | 26.1% | 26.1% | 19.0% |
| Earnings Growth Rate | 3.3% | 3.3% | 6.0% |
| Dividend Yield | 2.1% | 2.1% | 1.7% |
| Foreign Holdings | 0.0% | 0.0% | 0.0% |
| Turnover Rate | 15% | — | — |
| Short-Term Reserves | 0.5% | — | — |
| |
| Sector Diversification (% of equity exposure) |
| | Dividend | DJ |
| | Achievers | U.S. Total |
| | | Select | Market |
| | Fund | Index | Index |
| Consumer | | | |
| Discretionary | 12.3% | 12.2% | 11.6% |
| Consumer Staples | 23.8 | 23.8 | 9.2 |
| Energy | 14.9 | 15.0 | 11.2 |
| Financials | 7.1 | 7.2 | 16.6 |
| Health Care | 6.3 | 6.2 | 10.5 |
| Industrials | 21.5 | 21.4 | 11.5 |
| Information | | | |
| Technology | 6.2 | 6.2 | 19.1 |
| Materials | 5.8 | 5.9 | 4.5 |
| Telecommunication | | | |
| Services | 0.2 | 0.2 | 2.6 |
| Utilities | 1.9 | 1.9 | 3.2 |
| | |
| Volatility Measures | | |
| | Dividend | DJ |
| | Achievers | U.S. Total |
| | Select | Market |
| | Index | Index |
| R-Squared | 1.00 | 0.94 |
| Beta | 1.00 | 0.80 |
| These measures show the degree and timing of the fund’s fluctuations compared with the indexes over 36 months. |
|
| |
| Ten Largest Holdings (% of total net assets) |
| Exxon Mobil Corp. | Integrated Oil & | |
| | Gas | 4.1% |
| International Business | IT Consulting & | |
| Machines Corp. | Other Services | 4.1 |
| Chevron Corp. | Integrated Oil & | |
| | Gas | 4.0 |
| Coca-Cola Co. | Soft Drinks | 4.0 |
| ConocoPhillips | Integrated Oil & | |
| | Gas | 4.0 |
| McDonald's Corp. | Restaurants | 4.0 |
| United Technologies | Aerospace & | |
| Corp. | Defense | 4.0 |
| Procter & Gamble Co. | Household | |
| | Products | 4.0 |
| PepsiCo Inc. | Soft Drinks | 4.0 |
| Wal-Mart Stores Inc. | Hypermarkets & | |
| | Super Centers | 3.9 |
| Top Ten | | 40.1% |
| The holdings listed exclude any temporary cash investments and equity index products. |
Investment Focus
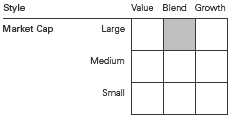
1 The expense ratios shown are from the prospectus dated May 28, 2010, and represent estimated costs for the current fiscal year. For the fiscal year ended January 31, 2011, the expense ratios were 0.30% for Investor Shares and 0.18% for ETF Shares.
7
Dividend Appreciation Index Fund
Performance Summary
All of the returns in this report represent past performance, which is not a guarantee of future results that may be achieved by the fund. (Current performance may be lower or higher than the performance data cited. For performance data current to the most recent month-end, visit our website at vanguard.com/performance.) Note, too, that both investment returns and principal value can fluctuate widely, so an investor’s shares, when sold, could be worth more or less than their original cost. The returns shown do not reflect taxes that a shareholder would pay on fund distributions or on the sale of fund shares.
Cumulative Performance: April 27, 2006, Through January 31, 2011
Initial Investment of $10,000
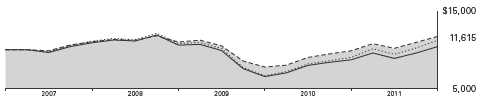
| | | |
| | Average Annual Total Returns | |
| | Periods Ended January 31, 2011 | |
| | | Since | Final Value |
| | One | Inception | of a $10,000 |
| | Year | (4/27/2006) | Investment |
| Dividend Appreciation Index Fund | | | |
| Investor Shares | 18.75% | 3.19% | $11,615 |
| Dow Jones U.S. Total Stock Market | | | |
| Index | 24.31 | 2.40 | 11,195 |
| Dividend Achievers Select Index | 18.86 | 3.37 | 11,710 |
| Large-Cap Core Funds Average | 19.55 | 0.81 | 10,391 |
Large-Cap Core Funds Average: Derived from data provided by Lipper Inc.
"Since Inception" performance is calculated from the Investor Shares’ inception date for both the fund and its comparative standards.
| | | |
| | | Since | Final Value |
| | One | Inception | of a $10,000 |
| | Year | (4/21/2006) | Investment |
| Dividend Appreciation Index Fund | | | |
| ETF Shares Net Asset Value | 18.91% | 3.37% | $11,714 |
| Dow Jones U.S. Total Stock Market Index | 24.31 | 2.33 | 11,164 |
| Dividend Achievers Select Index | 18.86 | 3.42 | 11,744 |
| "Since Inception" performance is calculated from the ETF Shares’ inception date for both the fund and its comparative standards. |
See Financial Highlights for dividend and capital gains information.
8
Dividend Appreciation Index Fund
Cumulative Returns of ETF Shares: April 21, 2006, Through January 31, 2011
| | |
| | | Since |
| | One | Inception |
| | Year | (4/21/2006) |
| Dividend Appreciation Index Fund | | |
| ETF Shares Market Price | 19.07% | 17.25% |
| Dividend Appreciation Index Fund | | |
| ETF Shares Net Asset Value | 18.91 | 17.14 |
| Dividend Achievers Select Index | 18.86 | 17.44 |
| "Since Inception" performance is calculated from the ETF Shares’ inception date for both the fund and its comparative standards. |
Fiscal-Year Total Returns (%): April 27, 2006, Through January 31, 2011
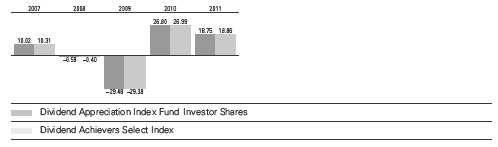
Average Annual Total Returns: Periods Ended December 31, 2010
This table presents average annual total returns through the latest calendar quarter—rather than through the end of the fiscal period. Securities and Exchange Commission rules require that we provide this information.
| | | |
| | Inception | One | Since |
| | Date | Year | Inception |
| Investor Shares | 4/27/2006 | 14.57% | 2.96% |
| ETF Shares | 4/21/2006 | | |
| Market Price | | 14.69 | 3.14 |
| Net Asset Value | | 14.67 | 3.13 |
9
Dividend Appreciation Index Fund
Financial Statements
Statement of Net Assets
As of January 31, 2011
The fund reports a complete list of its holdings in regulatory filings four times in each fiscal year, at the quarter-ends. For the second and fourth fiscal quarters, the lists appear in the fund’s semiannual and annual reports to shareholders. For the first and third fiscal quarters, the fund files the lists with the Securities and Exchange Commission on Form N-Q. Shareholders can look up the fund’s Forms N-Q on the SEC’s website at sec.gov. Forms N-Q may also be reviewed and copied at the SEC’s Public Reference Room (see the back cover of this report for further information).
| | |
| | | Market |
| | | Value |
| | Shares | ($000) |
| Common Stocks (99.9%) | | |
| Consumer Discretionary (12.3%) | |
| McDonald’s Corp. | 3,475,031 | 256,006 |
| Target Corp. | 2,547,302 | 139,669 |
| Lowe’s Cos. Inc. | 4,677,678 | 116,006 |
| TJX Cos. Inc. | 1,372,555 | 65,045 |
| McGraw-Hill Cos. Inc. | 1,075,429 | 41,920 |
| Stanley Black & | | |
| Decker Inc. | 535,394 | 38,912 |
| VF Corp. | 384,128 | 31,775 |
| Genuine Parts Co. | 534,360 | 27,653 |
| Ross Stores Inc. | 412,874 | 26,919 |
| Family Dollar Stores Inc. | 453,214 | 19,253 |
| Polaris Industries Inc. | 114,713 | 8,824 |
| John Wiley & Sons Inc. | | |
| Class A | 176,013 | 8,088 |
| Meredith Corp. | 124,146 | 4,184 |
| Matthews | | |
| International Corp. | | |
| Class A | 100,705 | 3,569 |
| H&R Block Inc. | 6,433 | 81 |
| | | 787,904 |
| Consumer Staples (23.8%) | | |
| Coca-Cola Co. | 4,121,634 | 259,045 |
| Procter & Gamble Co. | 4,020,237 | 253,798 |
| PepsiCo Inc. | 3,941,338 | 253,467 |
| Wal-Mart Stores Inc. | 4,484,022 | 251,419 |
| Colgate-Palmolive Co. | 1,763,060 | 135,350 |
| Walgreen Co. | 3,304,091 | 133,617 |
| Archer-Daniels- | | |
| Midland Co. | 2,258,447 | 73,783 |
| Avon Products Inc. | 1,549,756 | 43,874 |
| JM Smucker Co. | 435,808 | 27,090 |
| Hormel Foods Corp. | 474,887 | 23,459 |
| Brown-Forman Corp. | | |
| Class B | 314,855 | 20,891 |
| McCormick & Co. Inc. | 434,489 | 19,204 |
| Church & Dwight Co. Inc. | 256,428 | 17,645 |
| | |
| | | Market |
| | | Value |
| | Shares | ($000) |
| Casey’s General Stores Inc. | 131,285 | 5,578 |
| Lancaster Colony Corp. | 92,271 | 5,128 |
| Tootsie Roll Industries Inc. | 126,757 | 3,506 |
| | | 1,526,854 |
| Energy (14.8%) | | |
| Exxon Mobil Corp. | 3,237,488 | 261,201 |
| Chevron Corp. | 2,729,138 | 259,077 |
| ConocoPhillips | 3,623,082 | 258,905 |
| EOG Resources Inc. | 887,358 | 94,406 |
| Murphy Oil Corp. | 745,072 | 49,398 |
| Helmerich & Payne Inc. | 334,776 | 19,661 |
| CARBO Ceramics Inc. | 73,199 | 8,430 |
| | | 951,078 |
| Financials (7.1%) | | |
| Aflac Inc. | 1,667,804 | 96,032 |
| Franklin Resources Inc. | 774,399 | 93,431 |
| Chubb Corp. | 1,061,365 | 61,485 |
| T Rowe Price Group Inc. | 887,449 | 58,501 |
| SEI Investments Co. | 694,419 | 16,076 |
| Cullen/Frost Bankers Inc. | 225,992 | 13,058 |
| Eaton Vance Corp. | 424,911 | 12,875 |
| Commerce | | |
| Bancshares Inc. | 308,737 | 12,698 |
| Brown & Brown Inc. | 483,998 | 11,984 |
| HCC Insurance | | |
| Holdings Inc. | 393,114 | 11,903 |
| Transatlantic Holdings Inc. | 223,593 | 11,504 |
| Erie Indemnity Co. Class A | 171,072 | 11,363 |
| Wesco Financial Corp. | 25,255 | 9,491 |
| StanCorp Financial | | |
| Group Inc. | 157,806 | 7,040 |
| Prosperity Bancshares Inc. | 159,445 | 6,450 |
| UMB Financial Corp. | 138,053 | 5,612 |
| Westamerica | | |
| Bancorporation | 97,510 | 4,875 |
| RLI Corp. | 69,634 | 3,751 |
| Bank of the Ozarks Inc. | 56,201 | 2,424 |
| Bancfirst Corp. | 50,565 | 2,051 |
10
Dividend Appreciation Index Fund
| | |
| | | Market |
| | | Value |
| | Shares | ($000) |
| First Financial Corp. | 46,732 | 1,473 |
| Southside Bancshares Inc. | 55,824 | 1,196 |
| First Financial | | |
| Bankshares Inc. | 392 | 19 |
| Tompkins Financial Corp. | 203 | 8 |
| Republic Bancorp Inc. | | |
| Class A | 420 | 8 |
| SY Bancorp Inc. | 259 | 6 |
| | | 455,314 |
| Health Care (6.3%) | | |
| Medtronic Inc. | 3,764,643 | 144,261 |
| Stryker Corp. | 1,389,852 | 80,000 |
| Becton Dickinson and Co. | 803,364 | 66,639 |
| Cardinal Health Inc. | 1,222,388 | 50,741 |
| CR Bard Inc. | 323,599 | 30,532 |
| Beckman Coulter Inc. | 242,992 | 17,498 |
| Owens & Minor Inc. | 220,790 | 6,520 |
| West Pharmaceutical | | |
| Services Inc. | 114,033 | 4,560 |
| Meridian Bioscience Inc. | 812 | 18 |
| Abbott Laboratories | 5 | — |
| | | 400,769 |
| Industrials (21.5%) | | |
| United Technologies Corp. | 3,128,226 | 254,325 |
| 3M Co. | 2,560,655 | 225,133 |
| Caterpillar Inc. | 2,199,416 | 213,365 |
| Emerson Electric Co. | 2,643,151 | 155,629 |
| General Dynamics Corp. | 1,274,153 | 96,071 |
| Illinois Tool Works Inc. | 1,765,015 | 94,411 |
| Parker Hannifin Corp. | 560,178 | 50,085 |
| CH Robinson | | |
| Worldwide Inc. | 588,644 | 45,379 |
| Dover Corp. | 634,081 | 40,645 |
| WW Grainger Inc. | 254,221 | 33,422 |
| Fastenal Co. | 522,524 | 30,338 |
| Roper Industries Inc. | 322,414 | 25,048 |
| Donaldson Co. Inc. | 271,838 | 15,930 |
| Pentair Inc. | 343,075 | 12,409 |
| Nordson Corp. | 118,366 | 10,926 |
| Harsco Corp. | 273,145 | 8,814 |
| Graco Inc. | 203,437 | 8,642 |
| Carlisle Cos. Inc. | 223,360 | 8,423 |
| CLARCOR Inc. | 169,823 | 7,333 |
| AO Smith Corp. | 148,233 | 6,346 |
| Brady Corp. Class A | 173,407 | 5,679 |
| ABM Industries Inc. | 182,761 | 4,697 |
| Mine Safety | | |
| Appliances Co. | 121,392 | 3,785 |
| Franklin Electric Co. Inc. | 83,236 | 3,419 |
| Raven Industries Inc. | 64,561 | 3,050 |
| NACCO Industries Inc. | | |
| Class A | 28,613 | 2,868 |
| Tennant Co. | 64,461 | 2,600 |
| | |
| | | Market |
| | | Value |
| | Shares | ($000) |
| Universal Forest | | |
| Products Inc. | 66,991 | 2,459 |
| Badger Meter Inc. | 52,958 | 2,171 |
| Gorman-Rupp Co. | 58,751 | 1,867 |
| | | 1,375,269 |
| Information Technology (6.2%) | |
| International Business | | |
| Machines Corp. | 1,605,404 | 260,075 |
| Automatic Data | | |
| Processing Inc. | 1,779,510 | 85,239 |
| Linear Technology Corp. | 792,167 | 27,560 |
| Factset Research | | |
| Systems Inc. | 159,662 | 16,094 |
| Jack Henry & | | |
| Associates Inc. | 297,340 | 8,789 |
| | | 397,757 |
| Materials (5.8%) | | |
| Praxair Inc. | 1,080,531 | 100,533 |
| Air Products & | | |
| Chemicals Inc. | 760,353 | 66,341 |
| PPG Industries Inc. | 556,413 | 46,894 |
| Ecolab Inc. | 829,819 | 41,234 |
| Sherwin-Williams Co. | 370,582 | 31,399 |
| Sigma-Aldrich Corp. | 423,723 | 26,970 |
| Albemarle Corp. | 329,287 | 18,493 |
| Valspar Corp. | 331,570 | 12,391 |
| Bemis Co. Inc. | 376,424 | 12,253 |
| Aptargroup Inc. | 229,642 | 11,037 |
| HB Fuller Co. | 173,850 | 3,962 |
| Stepan Co. | 34,535 | 2,504 |
| Martin Marietta | | |
| Materials Inc. | 903 | 75 |
| | | 374,086 |
| Telecommunication Services (0.2%) | |
| Telephone & | | |
| Data Systems Inc. | 200,562 | 7,170 |
| Atlantic Tele-Network Inc. | 56,761 | 2,120 |
| Shenandoah | | |
| Telecommunications Co. | 83,509 | 1,397 |
| | | 10,687 |
| Utilities (1.9%) | | |
| National Fuel Gas Co. | 292,567 | 19,994 |
| Northeast Utilities | 605,049 | 19,918 |
| Energen Corp. | 250,638 | 14,011 |
| MDU Resources | | |
| Group Inc. | 651,372 | 13,829 |
| UGI Corp. | 391,814 | 12,283 |
| Questar Corp. | 636,612 | 11,096 |
| Aqua America Inc. | 474,382 | 10,968 |
| New Jersey | | |
| Resources Corp. | 143,479 | 6,020 |
| South Jersey | | |
| Industries Inc. | 100,977 | 5,275 |
11
Dividend Appreciation Index Fund
| | |
| | | Market |
| | | Value |
| | Shares | ($000) |
| California Water | | |
| Service Group | 71,611 | 2,614 |
| American States | | |
| Water Co. | 65,407 | 2,224 |
| SJW Corp. | 63,050 | 1,541 |
| Northwest Natural Gas Co. | 504 | 22 |
| | | 119,795 |
| Total Common Stocks | | |
| (Cost $5,657,851) | | 6,399,513 |
| Temporary Cash Investment (0.0%) | |
| Money Market Fund (0.0%) | | |
| 1 Vanguard Market | | |
| Liquidity Fund, 0.207% | | |
| (Cost $2,124) | 2,123,706 | 2,124 |
| Total Investments (99.9%) | | |
| (Cost $5,659,975) | | 6,401,637 |
| Other Assets and Liabilities (0.1%) | |
| Other Assets | | 574,509 |
| Liabilities | | (570,604) |
| | | 3,905 |
| Net Assets (100%) | | 6,405,542 |
| |
| |
| Statement of Assets and Liabilities | |
| Assets | | |
| Investments in Securities, at Value | 6,401,637 |
| Receivables for Investment | | |
| Securities Sold | | 561,218 |
| Receivables for Capital Shares Issued | 4,577 |
| Other Assets | | 8,714 |
| Total Assets | | 6,976,146 |
| Liabilities | | |
| Payables for Investment | | |
| Securities Purchased | | 535,906 |
| Other Liabilities | | 34,698 |
| Total Liabilities | | 570,604 |
| Net Assets | | 6,405,542 |
| |
| At January 31, 2011, net assets consisted of: |
| | Amount |
| | ($000) |
| Paid-in Capital | 5,896,396 |
| Undistributed Net Investment Income | 4,242 |
| Accumulated Net Realized Losses | (236,758) |
| Unrealized Appreciation (Depreciation) | 741,662 |
| Net Assets | 6,405,542 |
| |
| |
| Investor Shares—Net Assets | |
| Applicable to 66,611,269 outstanding | |
| $.001 par value shares of beneficial | |
| interest (unlimited authorization) | 1,420,979 |
| Net Asset Value Per Share— | |
| Investor Shares | $21.33 |
| |
| |
| ETF Shares—Net Assets | |
| Applicable to 93,483,137 outstanding | |
| $.001 par value shares of beneficial | |
| interest (unlimited authorization) | 4,984,563 |
| Net Asset Value Per Share— | |
| ETF Shares | $53.32 |
See Note A in Notes to Financial Statements.
1 Affiliated money market fund available only to Vanguard funds and certain trusts and accounts managed by Vanguard. Rate shown is the 7-day yield.
See accompanying Notes, which are an integral part of the Financial Statements.
12
Dividend Appreciation Index Fund
Statement of Operations
| |
| | Year Ended |
| | January 31, 2011 |
| | ($000) |
| Investment Income | |
| Income | |
| Dividends | 104,281 |
| Interest1 | 10 |
| Security Lending | 23 |
| Total Income | 104,314 |
| Expenses | |
| The Vanguard Group—Note B | |
| Investment Advisory Services | 289 |
| Management and Administrative—Investor Shares | 2,476 |
| Management and Administrative—ETF Shares | 4,723 |
| Marketing and Distribution—Investor Shares | 241 |
| Marketing and Distribution—ETF Shares | 857 |
| Custodian Fees | 107 |
| Auditing Fees | 25 |
| Shareholders’ Reports—Investor Shares | 14 |
| Shareholders’ Reports—ETF Shares | 91 |
| Trustees’ Fees and Expenses | 5 |
| Total Expenses | 8,828 |
| Net Investment Income | 95,486 |
| Realized Net Gain (Loss) on Investment Securities Sold | 62,018 |
| Change in Unrealized Appreciation (Depreciation) of Investment Securities | 607,952 |
| Net Increase (Decrease) in Net Assets Resulting from Operations | 765,456 |
| 1 Interest income from an affiliated company of the fund was $10,000. |
See accompanying Notes, which are an integral part of the Financial Statements.
13
Dividend Appreciation Index Fund
Statement of Changes in Net Assets
| | |
| | Year Ended January 31, |
| | 2011 | 2010 |
| | ($000) | ($000) |
| Increase (Decrease) in Net Assets | | |
| Operations | | |
| Net Investment Income | 95,486 | 39,729 |
| Realized Net Gain (Loss) | 62,018 | 31,626 |
| Change in Unrealized Appreciation (Depreciation) | 607,952 | 294,047 |
| Net Increase (Decrease) in Net Assets Resulting from Operations | 765,456 | 365,402 |
| Distributions | | |
| Net Investment Income | | |
| Investor Shares | (19,694) | (10,294) |
| ETF Shares | (74,247) | (28,500) |
| Realized Capital Gain | | |
| Investor Shares | — | — |
| ETF Shares | — | — |
| Total Distributions | (93,941) | (38,794) |
| Capital Share Transactions | | |
| Investor Shares | 655,145 | 133,342 |
| ETF Shares | 2,547,856 | 880,312 |
| Net Increase (Decrease) from Capital Share Transactions | 3,203,001 | 1,013,654 |
| Total Increase (Decrease) | 3,874,516 | 1,340,262 |
| Net Assets | | |
| Beginning of Period | 2,531,026 | 1,190,764 |
| End of Period1 | 6,405,542 | 2,531,026 |
| 1 Net Assets—End of Period includes undistributed net investment income of $4,242,000 and $2,697,000. |
See accompanying Notes, which are an integral part of the Financial Statements.
14
Dividend Appreciation Index Fund
Financial Highlights
Investor Shares
| | | | | |
| | | | | | |
| | | | | | April 27, |
| | | | 20061 to |
| For a Share Outstanding | | | Year Ended January 31, | Jan. 31, |
| Throughout Each Period | 2011 | 2010 | 2009 | 2008 | 2007 |
| Net Asset Value, Beginning of Period | $18.33 | $14.79 | $21.40 | $21.84 | $20.05 |
| Investment Operations | | | | | |
| Net Investment Income | .392 | .369 | .387 | .325 | .214 |
| Net Realized and Unrealized Gain (Loss) | | | | | |
| on Investments | 3.006 | 3.543 | (6.614) | (.438) | 1.782 |
| Total from Investment Operations | 3.398 | 3.912 | (6.227) | (.113) | 1.996 |
| Distributions | | | | | |
| Dividends from Net Investment Income | (.398) | (.372) | (.383) | (.327) | (.206) |
| Distributions from Realized Capital Gains | — | — | — | — | — |
| Total Distributions | (.398) | (.372) | (.383) | (.327) | (.206) |
| Net Asset Value, End of Period | $21.33 | $18.33 | $14.79 | $21.40 | $21.84 |
| |
| Total Return2 | 18.75% | 26.80% | -29.48% | -0.58% | 10.02% |
| |
| Ratios/Supplemental Data | | | | | |
| Net Assets, End of Period (Millions) | $1,421 | $613 | $386 | $357 | $163 |
| Ratio of Total Expenses to | | | | | |
| Average Net Assets | 0.30% | 0.35% | 0.36% | 0.40% | 0.40%3 |
| Ratio of Net Investment Income to | | | | | |
| Average Net Assets | 2.13% | 2.24% | 2.25% | 1.56% | 1.53%3 |
| Portfolio Turnover Rate4 | 15% | 20% | 34% | 17% | 21% |
1 Inception.
2 Total returns do not include account service fees that may have applied in the periods shown. Fund prospectuses provide information about any applicable account service fees.
3 Annualized.
4 Excludes the value of portfolio securities received or delivered as a result of in-kind purchases or redemptions of the fund’s capital shares, including ETF Creation Units.
See accompanying Notes, which are an integral part of the Financial Statements.
15
Dividend Appreciation Index Fund
Financial Highlights
ETF Shares
| | | | | |
| | | | | | |
| | | | | | April 21, |
| | | | 20061 to |
| For a Share Outstanding | | | Year Ended January 31, | Jan. 31, |
| Throughout Each Period | 2011 | 2010 | 2009 | 2008 | 2007 |
| Net Asset Value, Beginning of Period | $45.81 | $36.96 | $53.48 | $54.60 | $49.94 |
| Investment Operations | | | | | |
| Net Investment Income | 1.034 | .973 | 1.032 | .873 | .555 |
| Net Realized and Unrealized Gain (Loss) | | | | | |
| on Investments | 7.524 | 8.856 | (16.526) | (1.120) | 4.631 |
| Total from Investment Operations | 8.558 | 9.829 | (15.494) | (.247) | 5.186 |
| Distributions | | | | | |
| Dividends from Net Investment Income | (1.048) | (.979) | (1.026) | (.873) | (.526) |
| Distributions from Realized Capital Gains | — | — | — | — | — |
| Total Distributions | (1.048) | (.979) | (1.026) | (.873) | (.526) |
| Net Asset Value, End of Period | $53.32 | $45.81 | $36.96 | $53.48 | $54.60 |
| |
| Total Return | 18.91% | 26.95% | -29.38% | -0.51% | 10.45% |
| |
| Ratios/Supplemental Data | | | | | |
| Net Assets, End of Period (Millions) | $4,985 | $1,918 | $805 | $302 | $111 |
| Ratio of Total Expenses to | | | | | |
| Average Net Assets | 0.18% | 0.23% | 0.24% | 0.28% | 0.28%2 |
| Ratio of Net Investment Income to | | | | | |
| Average Net Assets | 2.25% | 2.36% | 2.37% | 1.68% | 1.65%2 |
| Portfolio Turnover Rate3 | 15% | 20% | 34% | 17% | 21% |
1 Inception.
2 Annualized.
3 Excludes the value of portfolio securities received or delivered as a result of in-kind purchases or redemptions of the fund’s capital shares, including ETF Creation Units.
See accompanying Notes, which are an integral part of the Financial Statements.
16
Dividend Appreciation Index Fund
Notes to Financial Statements
Vanguard Dividend Appreciation Index Fund is registered under the Investment Company Act of 1940 as an open-end investment company, or mutual fund. The fund offers two classes of shares: Investor Shares and ETF Shares. Investor Shares are available to any investor who meets the fund’s minimum purchase requirements. ETF Shares are listed for trading on the NYSE Arca, Inc.; they can be purchased and sold through a broker.
A. The following significant accounting policies conform to generally accepted accounting principles for U.S. mutual funds. The fund consistently follows such policies in preparing its financial statements.
1. Security Valuation: Securities are valued as of the close of trading on the New York Stock Exchange (generally 4 p.m., Eastern time) on the valuation date. Equity securities are valued at the latest quoted sales prices or official closing prices taken from the primary market in which each security trades; such securities not traded on the valuation date are valued at the mean of the latest quoted bid and asked prices. Securities for which market quotations are not readily available, or whose values have been materially affected by events occurring before the fund’s pricing time but after the close of the securities’ primary markets, are valued by methods deemed by the board of trustees to represent fair value. Investments in Vanguard Market Liquidity Fund are valued at that fund’s net asset value.
2. Federal Income Taxes: The fund intends to continue to qualify as a regulated investment company and distribute all of its taxable income. Management has analyzed the fund’s tax positions taken for all open federal income tax years (January 31, 2008–2011), and has concluded that no provision for federal income tax is required in the fund’s financial statements.
3. Distributions: Distributions to shareholders are recorded on the ex-dividend date.
4. Security Lending: The fund may lend its securities to qualified institutional borrowers to earn additional income. Security loans are required to be secured at all times by collateral at least equal to the market value of securities loaned. The fund invests cash collateral received in Vanguard Market Liquidity Fund, and records a liability for the return of the collateral, during the period the securities are on loan. Security lending income represents fees charged to borrowers plus income earned on investing cash collateral, less expenses associated with the loan.
5. Other: Dividend income is recorded on the ex-dividend date. Interest income includes income distributions received from Vanguard Market Liquidity Fund and is accrued daily. Security transactions are accounted for on the date securities are bought or sold. Costs used to determine realized gains (losses) on the sale of investment securities are those of the specific securities sold.
Each class of shares has equal rights as to assets and earnings, except that each class separately bears certain class-specific expenses related to maintenance of shareholder accounts (included in Management and Administrative expenses) and shareholder reporting. Marketing and distribution expenses are allocated to each class of shares based on a method approved by the board of trustees. Income, other non-class-specific expenses, and gains and losses on investments are allocated to each class of shares based on its relative net assets.
17
Dividend Appreciation Index Fund
B. The Vanguard Group furnishes at cost investment advisory, corporate management, administrative, marketing, and distribution services. The costs of such services are allocated to the fund under methods approved by the board of trustees. The fund has committed to provide up to 0.40% of its net assets in capital contributions to Vanguard. At January 31, 2011, the fund had contributed capital of $1,005,000 to Vanguard (included in Other Assets), representing 0.02% of the fund’s net assets and 0.40% of Vanguard’s capitalization. The fund’s trustees and officers are also directors and officers of Vanguard.
C. Various inputs may be used to determine the value of the fund’s investments. These inputs are summarized in three broad levels for financial statement purposes. The inputs or methodologies used to value securities are not necessarily an indication of the risk associated with investing in those securities.
Level 1—Quoted prices in active markets for identical securities.
Level 2—Other significant observable inputs (including quoted prices for similar securities, interest rates, prepayment speeds, credit risk, etc.).
Level 3—Significant unobservable inputs (including the fund’s own assumptions used to determine the fair value of investments).
At January 31, 2011, 100% of the fund’s investments were valued based on Level 1 inputs.
D. Distributions are determined on a tax basis and may differ from net investment income and realized capital gains for financial reporting purposes. Differences may be permanent or temporary. Permanent differences are reclassified among capital accounts in the financial statements to reflect their tax character. Temporary differences arise when certain items of income, expense, gain, or loss are recognized in different periods for financial statement and tax purposes; these differences will reverse at some time in the future. Differences in classification may also result from the treatment of short-term gains as ordinary income for tax purposes.
During the year ended January 31, 2011, the fund realized $101,828,000 of net capital gains resulting from in-kind redemptions—in which shareholders exchanged fund shares for securities held by the fund rather than for cash. Because such gains are not taxable to the fund, and are not distributed to shareholders, they have been reclassified from accumulated net realized losses to paid-in capital.
For tax purposes, at January 31, 2011, the fund had $7,555,000 of ordinary income available for distribution. The fund had available capital loss carryforwards totaling $191,649,000 to offset future net capital gains of $609,000 through January 31, 2016, $22,242,000 through January 31, 2017, $146,149,000 through January 31, 2018, and $22,649,000 through January 31, 2019. In addition, the fund realized losses of $42,826,000 during the period from November 1, 2010, through January 31, 2011, which are deferred and will be treated as realized for tax purposes in fiscal 2012.
At January 31, 2011, the cost of investment securities for tax purposes was $5,662,259,000. Net unrealized appreciation of investment securities for tax purposes was $739,378,000, consisting of unrealized gains of $752,191,000 on securities that had risen in value since their purchase and $12,813,000 in unrealized losses on securities that had fallen in value since their purchase.
18
Dividend Appreciation Index Fund
E. During the year ended January 31, 2011, the fund purchased $4,480,930,000 of investment securities and sold $1,285,161,000 of investment securities, other than temporary cash investments.
F. Capital share transactions for each class of shares were:
| | | | |
| | | | Year Ended January 31, |
| | | 2011 | | 2010 |
| | Amount | Shares | Amount | Shares |
| | ($000) | (000) | ($000) | (000) |
| Investor Shares | | | | |
| Issued | 764,953 | 38,773 | 227,145 | 13,195 |
| Issued in Lieu of Cash Distributions | 18,250 | 928 | 9,119 | 557 |
| Redeemed | (128,058) | (6,510) | (102,922) | (6,443) |
| Net Increase (Decrease)—Investor Shares | 655,145 | 33,191 | 133,342 | 7,309 |
| ETF Shares | | | | |
| Issued | 3,186,243 | 64,200 | 1,178,556 | 26,816 |
| Issued in Lieu of Cash Distributions | — | — | — | — |
| Redeemed | (638,387) | (12,600) | (298,244) | (6,700) |
| Net Increase (Decrease)—ETF Shares | 2,547,856 | 51,600 | 880,312 | 20,116 |
G. In preparing the financial statements as of January 31, 2011, management considered the impact of subsequent events for potential recognition or disclosure in these financial statements.
19
Report of Independent Registered
Public Accounting Firm
To the Trustees of Vanguard Specialized Funds and the Shareholders of Vanguard Dividend Appreciation Index Fund:
In our opinion, the accompanying statement of net assets and statement of assets and liabilities and the related statements of operations and of changes in net assets and the financial highlights present fairly, in all material respects, the financial position of Vanguard Dividend Appreciation Index Fund (constituting a separate portfolio of Vanguard Specialized Funds, hereafter referred to as the “Fund”) at January 31, 2011, the results of its operations for the year then ended, the changes in its net assets for each of the two years in the period then ended and the financial highlights for each of the periods indicated, in conformity with accounting principles generally accepted in the United States of America. These financial statements and financial highlights (hereafter referred to as “financial statements”) are the responsibility of the Fund’s management; our responsibility is to express an opinion on these financial statements based on our audits. We conducted our audits of these financial statements in accordance with the standards of the Public Company Accounting Oversight Board (United States). Those standards require that we plan and perform the audit to obtain reasonable assurance about whether the financial statements are free of material misstatement. An audit includes examining, on a test basis, evidence supporting the amounts and disclosures in the financial statements, assessing the accounting principles used and significant estimates made by management, and evaluating the overall financial statement presentation. We believe that our audits, which included confirmation of securities at January 31, 2011 by correspondence with the custodian and by agreement to the underlying ownership records of Vanguard Market Liquidity Fund, provide a reasonable basis for our opinion.
PricewaterhouseCoopers LLP
Philadelphia, Pennsylvania
March 11, 2011
|
| Special 2010 tax information (unaudited) for Vanguard Dividend Appreciation Index Fund |
This information for the fiscal year ended January 31, 2011, is included pursuant to provisions of the Internal Revenue Code.
The fund distributed $93,941,000 of qualified dividend income to shareholders during the fiscal year.
For corporate shareholders, 100% of investment income (dividend income plus short-term gains, if any) qualifies for the dividends-received deduction.
20
Your Fund’s After-Tax Returns
This table presents returns for your fund both before and after taxes. The after-tax returns are shown in two ways: (1) assuming that an investor owned the fund during the entire period and paid taxes on the fund’s distributions, and (2) assuming that an investor paid taxes on the fund’s distributions and sold all shares at the end of each period.
Calculations are based on the highest individual federal income tax and capital gains tax rates in effect at the times of the distributions and the hypothetical sales. State and local taxes were not considered. After-tax returns reflect any qualified dividend income , using actual prior-year figures and estimates for 2011. (In the example, returns after the sale of fund shares may be higher than those assuming no sale. This occurs when the sale would have produced a capital loss. The calculation assumes that the investor received a tax deduction for the loss.) The table shows returns for Investor Shares only; returns for other share classes will differ. Please note that your actual after-tax returns will depend on your tax situation and may differ from those shown. Also note that if you own the fund in a tax-deferred account, such as an individual retirement account or a 401(k) plan, this information does not apply to you. Such accounts are not subject to current taxes.
Finally, keep in mind that a fund’s performance—whether before or after taxes—does not guarantee future results.
Average Annual Total Returns: Dividend Appreciation Index Fund Investor Shares
Periods Ended January 31, 2011
| | |
| | | Since |
| | One | Inception |
| | Year | (4/27/2006) |
| Returns Before Taxes | 18.75% | 3.19% |
| Returns After Taxes on Distributions | 18.39 | 2.91 |
| Returns After Taxes on Distributions and Sale of Fund Shares | 12.61 | 2.70 |
21
About Your Fund’s Expenses
As a shareholder of the fund, you incur ongoing costs, which include costs for portfolio management, administrative services, and shareholder reports (like this one), among others. Operating expenses, which are deducted from a fund’s gross income, directly reduce the investment return of the fund.
A fund’s expenses are expressed as a percentage of its average net assets. This figure is known as the expense ratio. The following examples are intended to help you understand the ongoing costs (in dollars) of investing in your fund and to compare these costs with those of other mutual funds. The examples are based on an investment of $1,000 made at the beginning of the period shown and held for the entire period.
The accompanying table illustrates your fund’s costs in two ways:
• Based on actual fund return. This section helps you to estimate the actual expenses that you paid over the period. The ”Ending Account Value“ shown is derived from the fund‘s actual return, and the third column shows the dollar amount that would have been paid by an investor who started with $1,000 in the fund. You may use the information here, together with the amount you invested, to estimate the expenses that you paid over the period.
To do so, simply divide your account value by $1,000 (for example, an $8,600 account value divided by $1,000 = 8.6), then multiply the result by the number given for your fund under the heading ”Expenses Paid During Period.“
• Based on hypothetical 5% yearly return. This section is intended to help you compare your fund‘s costs with those of other mutual funds. It assumes that the fund had a yearly return of 5% before expenses, but that the expense ratio is unchanged. In this case—because the return used is not the fund’s actual return—the results do not apply to your investment. The example is useful in making comparisons because the Securities and Exchange Commission requires all mutual funds to calculate expenses based on a 5% return. You can assess your fund’s costs by comparing this hypothetical example with the hypothetical examples that appear in shareholder reports of other funds.
Note that the expenses shown in the table are meant to highlight and help you compare ongoing costs only and do not reflect transaction costs incurred by the fund for buying and selling securities. Further, the expenses do not include the account service fee described in the prospectus. If such a fee were applied to your account, your costs would be higher. Your fund does not charge transaction fees, such as purchase or redemption fees, nor does it carry a “sales load.” The calculations assume no shares were bought or sold during the period. Your actual costs may have been higher or lower, depending on the amount of your investment and the timing of any purchases or redemptions.
You can find more information about the fund’s expenses, including annual expense ratios, in the Financial Statements section of this report. For additional information on operating expenses and other shareholder costs, please refer to your fund’s current prospectus.
22
Six Months Ended January 31, 2011
| | | |
| | Beginning | Ending | Expenses |
| | Account Value | Account Value | Paid During |
| Dividend Appreciation Index Fund | 7/31/2010 | 1/31/2011 | Period |
| Based on Actual Fund Return | | | |
| Investor Shares | $1,000.00 | $1,150.06 | $1.57 |
| ETF Shares | 1,000.00 | 1,151.21 | 0.92 |
| Based on Hypothetical 5% Yearly Return | | | |
| Investor Shares | $1,000.00 | $1,023.74 | $1.48 |
| ETF Shares | 1,000.00 | 1,024.35 | 0.87 |
The calculations are based on expenses incurred in the most recent six-month period. The fund’s annualized six-month expense ratios for that period are 0.29% for Investor Shares and 0.17% for ETF Shares. The dollar amounts shown as “Expenses Paid” are equal to the annualized expense ratio multiplied by the average account value over the period, multiplied by the number of days in the most recent six-month period, then divided by the number of days in the most recent 12-month period.
23
Glossary
30-Day SEC Yield. A fund’s 30-day SEC yield is derived using a formula specified by the U.S. Securities and Exchange Commission. Under the formula, data related to the fund’s security holdings in the previous 30 days are used to calculate the fund’s hypothetical net income for that period, which is then annualized and divided by the fund’s estimated average net assets over the calculation period. For the purposes of this calculation, a security’s income is based on its current market yield to maturity (in the case of bonds) or its projected dividend yield (for stocks). Because the SEC yield represents hypothetical annualized income, it will differ—at times significantly—from the fund’s actual experience. As a result, the fund’s income distributions may be higher or lower than implied by the SEC yield.
Beta. A measure of the magnitude of a fund’s past share-price fluctuations in relation to the ups and downs of a given market index. The index is assigned a beta of 1.00. Compared with a given index, a fund with a beta of 1.20 typically would have seen its share price rise or fall by 12% when the index rose or fell by 10%. For this report, beta is based on returns over the past 36 months for both the fund and the index. Note that a fund’s beta should be reviewed in conjunction with its R-squared (see definition). The lower the R-squared, the less correlation there is between the fund and the index, and the less reliable beta is as an indicator of volatility.
Dividend Yield. Dividend income earned by stocks, expressed as a percentage of the aggregate market value (or of net asset value, for a fund). The yield is determined by dividing the amount of the annual dividends by the aggregate value (or net asset value) at the end of the period. For a fund, the dividend yield is based solely on stock holdings and does not include any income produced by other investments.
Earnings Growth Rate. The average annual rate of growth in earnings over the past five years for the stocks now in a fund.
Equity Exposure. A measure that reflects a fund’s investments in stocks and stock futures. Any holdings in short-term reserves are excluded.
Expense Ratio. The percentage of a fund’s average net assets used to pay its annual administrative and advisory expenses. These expenses directly reduce returns to investors.
Foreign Holdings. The percentage of a fund represented by stocks or depositary receipts of companies based outside the United States.
Inception Date. The date on which the assets of a fund (or one of its share classes) are first invested in accordance with the fund’s investment objective. For funds with a subscription period, the inception date is the day after that period ends. Investment performance is measured from the inception date.
Median Market Cap. An indicator of the size of companies in which a fund invests; the midpoint of market capitalization (market price x shares outstanding) of a fund’s stocks, weighted by the proportion of the fund’s assets invested in each stock. Stocks representing half of the fund’s assets have market capitalizations above the median, and the rest are below it.
Price/Book Ratio. The share price of a stock divided by its net worth, or book value, per share. For a fund, the weighted average price/book ratio of the stocks it holds.
24
Price/Earnings Ratio. The ratio of a stock’s current price to its per-share earnings over the past year. For a fund, the weighted average P/E of the stocks it holds. P/E is an indicator of market expectations about corporate prospects; the higher the P/E, the greater the expectations for a company’s future growth.
R-Squared. A measure of how much of a fund’s past returns can be explained by the returns from the market in general, as measured by a given index. If a fund’s total returns were precisely synchronized with an index’s returns, its R-squared would be 1.00. If the fund’s returns bore no relationship to the index’s returns, its R-squared would be 0. For this report, R-squared is based on returns over the past 36 months for both the fund and the index.
Return on Equity. The annual average rate of return generated by a company during the past five years for each dollar of shareholder’s equity (net income divided by shareholder’s equity). For a fund, the weighted average return on equity for the companies whose stocks it holds.
Short-Term Reserves. The percentage of a fund invested in highly liquid, short-term securities that can be readily converted to cash.
Turnover Rate. An indication of the fund’s trading activity. Funds with high turnover rates incur higher transaction costs and may be more likely to distribute capital gains (which may be taxable to investors). The turnover rate excludes in-kind transactions, which have minimal impact on costs.
25
This page intentionally left blank.
This page intentionally left blank.
The People Who Govern Your Fund
The trustees of your mutual fund are there to see that the fund is operated and managed in your best interests since, as a shareholder, you are a part owner of the fund. Your fund’s trustees also serve on the board of directors of The Vanguard Group, Inc., which is owned by the Vanguard funds and provides services to them on an at-cost basis.
A majority of Vanguard’s board members are independent, meaning that they have no affiliation with Vanguard or the funds they oversee, apart from the sizable personal investments they have made as private individuals. The independent board members have distinguished backgrounds in business, academia, and public service. Each of the trustees and executive officers oversees 179 Vanguard funds.
The following table provides information for each trustee and executive officer of the fund. More information about the trustees is in the Statement of Additional Information, which can be obtained, without charge, by contacting Vanguard at 800-662-7447, or online at vanguard.com.
| |
| Interested Trustee1 | and President (2006–2008) of Rohm and Haas Co. |
| | (chemicals); Director of Tyco International, Ltd. |
| F. William McNabb III | (diversified manufacturing and services) and Hewlett- |
| Born 1957. Trustee Since July 2009. Chairman of the | Packard Co. (electronic computer manufacturing); |
| Board. Principal Occupation(s) During the Past Five | Senior Advisor at New Mountain Capital; Trustee |
| Years: Chairman of the Board of The Vanguard Group, | of The Conference Board; Member of the Board of |
| Inc., and of each of the investment companies served | Managers of Delphi Automotive LLP (automotive |
| by The Vanguard Group, since January 2010; Director | components). |
| of The Vanguard Group since 2008; Chief Executive | |
| Officer and President of The Vanguard Group and of | Amy Gutmann |
| each of the investment companies served by The | Born 1949. Trustee Since June 2006. Principal |
| Vanguard Group since 2008; Director of Vanguard | Occupation(s) During the Past Five Years: President |
| Marketing Corporation; Managing Director of The | of the University of Pennsylvania; Christopher H. |
| Vanguard Group (1995–2008). | Browne Distinguished Professor of Political Science |
| | in the School of Arts and Sciences with secondary |
| | appointments at the Annenberg School for Commu- |
| Independent Trustees | nication and the Graduate School of Education |
| | of the University of Pennsylvania; Director of |
| Emerson U. Fullwood | Carnegie Corporation of New York, Schuylkill River |
| Born 1948. Trustee Since January 2008. Principal | Development Corporation, and Greater Philadelphia |
| Occupation(s) During the Past Five Years: Executive | Chamber of Commerce; Trustee of the National |
| Chief Staff and Marketing Officer for North America | Constitution Center; Chair of the Presidential |
| and Corporate Vice President (retired 2008) of Xerox | Commission for the Study of Bioethical Issues. |
| Corporation (document management products and | |
| services); Executive in Residence and 2010 | JoAnn Heffernan Heisen |
| Distinguished Minett Professor at the Rochester | Born 1950. Trustee Since July 1998. Principal |
| Institute of Technology; Director of SPX Corporation | Occupation(s) During the Past Five Years: Corporate |
| (multi-industry manufacturing), the United Way of | Vice President and Chief Global Diversity Officer |
| Rochester, Amerigroup Corporation (managed health | (retired 2008) and Member of the Executive |
| care), the University of Rochester Medical Center, | Committee (1997–2008) of Johnson & Johnson |
| Monroe Community College Foundation, and North | (pharmaceuticals/consumer products); Director of |
| Carolina A&T University. | Skytop Lodge Corporation (hotels), the University |
| | Medical Center at Princeton, the Robert Wood |
| Rajiv L. Gupta | Johnson Foundation, and the Center for Work Life |
| Born 1945. Trustee Since December 2001.2 | Policy; Member of the Advisory Board of the |
| Principal Occupation(s) During the Past Five Years: | Maxwell School of Citizenship and Public Affairs |
| Chairman and Chief Executive Officer (retired 2009) | at Syracuse University. |
| | |
| F. Joseph Loughrey | Thomas J. Higgins | |
| Born 1949. Trustee Since October 2009. Principal | Born 1957. Chief Financial Officer Since September |
| Occupation(s) During the Past Five Years: President | 2008. Principal Occupation(s) During the Past Five |
| and Chief Operating Officer (retired 2009) and Vice | Years: Principal of The Vanguard Group, Inc.; Chief |
| Chairman of the Board (2008–2009) of Cummins Inc. | Financial Officer of each of the investment companies |
| (industrial machinery); Director of SKF AB (industrial | served by The Vanguard Group since 2008; Treasurer |
| machinery), Hillenbrand, Inc. (specialized consumer | of each of the investment companies served by The |
| services), the Lumina Foundation for Education, and | Vanguard Group (1998–2008) . |
| Oxfam America; Chairman of the Advisory Council | | |
| for the College of Arts and Letters and Member | Kathryn J. Hyatt | |
| of the Advisory Board to the Kellogg Institute for | Born 1955. Treasurer Since November 2008. Principal |
| International Studies at the University of Notre Dame. | Occupation(s) During the Past Five Years: Principal |
| | of The Vanguard Group, Inc.; Treasurer of each of |
| André F. Perold | the investment companies served by The Vanguard |
| Born 1952. Trustee Since December 2004. Principal | Group since 2008; Assistant Treasurer of each of the |
| Occupation(s) During the Past Five Years: George | investment companies served by The Vanguard Group |
| Gund Professor of Finance and Banking at the Harvard | (1988–2008). | |
| Business School; Chair of the Investment Committee | | |
| of HighVista Strategies LLC (private investment firm). | Heidi Stam | |
| | Born 1956. Secretary Since July 2005. Principal |
| Alfred M. Rankin, Jr. | Occupation(s) During the Past Five Years: Managing |
| Born 1941. Trustee Since January 1993. Principal | Director of The Vanguard Group, Inc., since 2006; |
| Occupation(s) During the Past Five Years: Chairman, | General Counsel of The Vanguard Group since 2005; |
| President, and Chief Executive Officer of NACCO | Secretary of The Vanguard Group and of each of the |
| Industries, Inc. (forklift trucks/housewares/lignite); | investment companies served by The Vanguard Group |
| Director of Goodrich Corporation (industrial products/ | since 2005; Director and Senior Vice President of |
| aircraft systems and services) and the National | Vanguard Marketing Corporation since 2005; |
| Association of Manufacturers; Chairman of the Federal | Principal of The Vanguard Group (1997–2006). |
| Reserve Bank of Cleveland; Trustee of University | | |
| Hospitals of Cleveland; President of the Board of The | | |
| Cleveland Museum of Art. | Vanguard Senior Management Team |
| |
| Peter F. Volanakis | R. Gregory Barton | Michael S. Miller |
| Born 1955. Trustee Since July 2009. Principal | Mortimer J. Buckley | James M. Norris |
| Occupation(s) During the Past Five Years: President | Kathleen C. Gubanich | Glenn W. Reed |
| and Chief Operating Officer (retired 2010) of Corning | Paul A. Heller | George U. Sauter |
| Incorporated (communications equipment); Director of | | |
| Corning Incorporated (2000–2010) and Dow Corning | | |
| (2001–2010); Trustee of the Corning Incorporated | Chairman Emeritus and Senior Advisor |
| Foundation and the Corning Museum of Glass; | | |
| Overseer of the Amos Tuck School of Business | John J. Brennan | |
| Administration at Dartmouth College. | Chairman, 1996–2009 | |
| | Chief Executive Officer and President, 1996–2008 |
| |
| Executive Officers | | |
| | Founder | |
| Glenn Booraem | | |
| Born 1967. Controller Since July 2010. Principal | John C. Bogle | |
| Occupation(s) During the Past Five Years: Principal | Chairman and Chief Executive Officer, 1974–1996 |
| of The Vanguard Group, Inc.; Controller of each of | | |
| the investment companies served by The Vanguard | | |
| Group since 2010; Assistant Controller of each of | | |
| the investment companies served by The Vanguard | | |
| Group (2001–2010). | | |
1 Mr. McNabb is considered an “interested person,” as defined in the Investment Company Act of 1940, because he is an officer of the Vanguard funds.
2 December 2002 for Vanguard Equity Income Fund, Vanguard Growth Equity Fund, the Vanguard Municipal Bond Funds, and the Vanguard State Tax-Exempt Funds.
|  |
| P.O. Box 2600 |
| Valley Forge, PA 19482-2600 |
Connect with Vanguard® > vanguard.com
| “Dividend Achievers” is a trademark of Mergent, Inc., |
| Fund Information > 800-662-7447 | and has been licensed for use by The Vanguard Group, |
| Direct Investor Account Services > 800-662-2739 | Inc. Vanguard mutual funds are not sponsored, |
| Institutional Investor Services > 800-523-1036 | endorsed, sold, or promoted by Mergent, and Mergent |
| Text Telephone for People | makes no representation regarding the advisability of |
| With Hearing Impairment > 800-749-7273 | investing in the funds. |
| |
| This material may be used in conjunction | |
| with the offering of shares of any Vanguard | |
| fund only if preceded or accompanied by | |
| the fund’s current prospectus. | |
| |
| All comparative mutual fund data are from Lipper Inc. or | |
| Morningstar, Inc., unless otherwise noted. | |
| |
| You can obtain a free copy of Vanguard’s proxy voting | |
| guidelines by visiting vanguard.com/proxyreporting or by | |
| calling Vanguard at 800-662-2739. The guidelines are | |
| also available from the SEC’s website, sec.gov. In | |
| addition, you may obtain a free report on how your fund | |
| voted the proxies for securities it owned during the 12 | |
| months ended June 30. To get the report, visit either | |
| vanguard.com/proxyreporting or sec.gov. | |
| |
| You can review and copy information about your fund at | |
| the SEC’s Public Reference Room in Washington, D.C. To | |
| find out more about this public service, call the SEC at | |
| 202-551-8090. Information about your fund is also | |
| available on the SEC’s website, and you can receive | |
| copies of this information, for a fee, by sending a | |
| request in either of two ways: via e-mail addressed to | |
| publicinfo@sec.gov or via regular mail addressed to the | |
| Public Reference Section, Securities and Exchange | |
| Commission, Washington, DC 20549-1520. | |
| |
| |
| | © 2011 The Vanguard Group, Inc. |
| | All rights reserved. |
| | Vanguard Marketing Corporation, Distributor. |
| |
| | Q6020 032011 |
Item 2: Code of Ethics. The Registrant has adopted a code of ethics that applies to the Registrant’s principal executive officer, principal financial officer, principal accounting officer or controller or persons performing similar functions. The Code of Ethics was amended during the reporting period covered by this report to make certain technical, non-material changes.
Item 3: Audit Committee Financial Expert. The following members of the Audit Committee have been determined by the Registrant’s Board of Trustees to be Audit Committee Financial Experts serving on its Audit Committee, and to be independent: Charles D. Ellis, Rajiv L. Gupta, JoAnn Heffernan Heisen, André F. Perold, and Alfred M. Rankin, Jr.
Item 4: Principal Accountant Fees and Services.
(a) Audit Fees.
Audit Fees of the Registrant
Fiscal Year Ended January 31, 2011: $161,000
Fiscal Year Ended January 31, 2010: $161,000
Aggregate Audit Fees of Registered Investment Companies in the Vanguard Group.
Fiscal Year Ended January 31, 2011: $3,607,060
Fiscal Year Ended January 31, 2010: $3,354,640
(b) Audit-Related Fees.
Fiscal Year Ended January 31, 2011: $791,350
Fiscal Year Ended January 31, 2010: $876,210
Includes fees billed in connection with assurance and related services provided to the Registrant, The Vanguard Group, Inc., Vanguard Marketing Corporation, and other registered investment companies in the Vanguard Group.
(c) Tax Fees.
Fiscal Year Ended January 31, 2011: $336,090
Fiscal Year Ended January 31, 2010: $423,070
Includes fees billed in connection with tax compliance, planning and advice services provided to the Registrant, The Vanguard Group, Inc., Vanguard Marketing Corporation, and other registered investment companies in the Vanguard Group and related to income and excise taxes.
(d) All Other Fees.
Fiscal Year Ended January 31, 2011: $16,000
Fiscal Year Ended January 31, 2010: $0
Includes fees billed for services related to risk management and privacy matters. Services were provided to the Registrant, The Vanguard Group, Inc., Vanguard Marketing Corporation, and other registered investment companies in the Vanguard Group.
(e) (1) Pre-Approval Policies. The policy of the Registrant’s Audit Committee is to consider and, if appropriate, approve before the principal accountant is engaged for such services, all specific audit and non-audit services provided to: (1) the Registrant; (2) The Vanguard Group, Inc.; (3) other entities controlled by The Vanguard Group, Inc. that provide ongoing services to the Registrant; and (4) other registered investment
companies in the Vanguard Group. In making a determination, the Audit Committee considers whether the services are consistent with maintaining the principal accountant’s independence.
In the event of a contingency situation in which the principal accountant is needed to provide services in between scheduled Audit Committee meetings, the Chairman of the Audit Committee would be called on to consider and, if appropriate, pre-approve audit or permitted non-audit services in an amount sufficient to complete services through the next Audit Committee meeting, and to determine if such services would be consistent with maintaining the accountant’s independence. At the next scheduled Audit Committee meeting, services and fees would be presented to the Audit Committee for formal consideration, and, if appropriate, approval by the entire Audit Committee. The Audit Committee would again consider whether such services and fees are consistent with maintaining the principal accountant’s independence.
The Registrant’s Audit Committee is informed at least annually of all audit and non-audit services provided by the principal accountant to the Vanguard complex, whether such services are provided to: (1) the Registrant; (2) The Vanguard Group, Inc.; (3) other entities controlled by The Vanguard Group, Inc. that provide ongoing services to the Registrant; or (4) other registered investment companies in the Vanguard Group.
(2) No percentage of the principal accountant’s fees or services were approved pursuant to the waiver provision of paragraph (c)(7)(i)(C) of Rule 2-01 of Regulation S-X.
(f) For the most recent fiscal year, over 50% of the hours worked under the principal accountant’s engagement were not performed by persons other than full-time, permanent employees of the principal accountant.
(g) Aggregate Non-Audit Fees.
Fiscal Year Ended January 31, 2011: $352,090
Fiscal Year Ended January 31, 2010: $423,070
Includes fees billed for non-audit services provided to the Registrant, The Vanguard Group, Inc., Vanguard Marketing Corporation, and other registered investment companies in the Vanguard Group.
(h) For the most recent fiscal year, the Audit Committee has determined that the provision of all non-audit services was consistent with maintaining the principal accountant’s independence.
Item 5: Audit Committee of Listed Registrants.
The Registrant is a listed issuer as defined in Rule 10A-3 under the Securities Exchange Act of 1934 (“Exchange Act”). The Registrant has a separately-designated standing audit committee established in accordance with Section 3(a)(58)(A) of the Exchange Act. The Registrant’s audit committee members are: Emerson U. Fullwood, Rajiv L. Gupta, Amy Gutmann, JoAnn Heffernan Heisen, F. Joseph Loughrey, André F. Perold, Alfred M. Rankin, Jr., and Peter F. Volanakis.
Item 6: Investments.
Not Applicable.
Item 7: Disclosure of Proxy Voting Policies and Procedures for Closed-End Management Investment Companies.
Not Applicable.
Item 8: Portfolio Managers of Closed-End Management Investment Companies.
Not Applicable.
Item 9: Purchase of Equity Securities by Closed-End Management Investment Company and Affiliated Purchasers.
Not Applicable.
Item 10: Submission of Matters to a Vote of Security Holders.
Not Applicable.
Item 11: Controls and Procedures.
(a) Disclosure Controls and Procedures. The Principal Executive and Financial Officers concluded that the Registrant's Disclosure Controls and Procedures are effective based on their evaluation of the Disclosure Controls and Procedures as of a date within 90 days of the filing date of this report.
(b) Internal Control Over Financial Reporting. There were no significant changes in Registrant’s Internal Control Over Financial Reporting or in other factors that could significantly affect this control subsequent to the date of the evaluation, including any corrective actions with regard to significant deficiencies and material weaknesses.
Item 12: Exhibits.
(a) Code of Ethics.
(b) Certifications.
Pursuant to the requirements of the Securities Exchange Act of 1934 and the Investment Company Act of 1940, the registrant has duly caused this report to be signed on its behalf by the undersigned, thereunto duly authorized.
| |
| | VANGUARD SPECIALIZED FUNDS |
| |
| By: | /s/ F. WILLIAM MCNABB III* |
| | F. WILLIAM MCNABB III |
| | CHIEF EXECUTIVE OFFICER |
| |
| Date: March 21, 2011 |
Pursuant to the requirements of the Securities Exchange Act of 1934 and the Investment Company Act of 1940, this report has been signed below by the following persons on behalf of the registrant and in the capacities and on the dates indicated.
| |
| | VANGUARD SPECIALIZED FUNDS |
| |
| By: | /s/ F. WILLIAM MCNABB III* |
| | F. WILLIAM MCNABB III |
| | CHIEF EXECUTIVE OFFICER |
| |
| Date: March 21, 2011 |
| |
| | VANGUARD SPECIALIZED FUNDS |
| |
| By: | /s/ THOMAS J. HIGGINS* |
| | THOMAS J. HIGGINS |
| | CHIEF FINANCIAL OFFICER |
| |
| Date: March 21, 2011 |
* By: /s/ Heidi Stam
Heidi Stam, pursuant to a Power of Attorney filed on April 26, 2010, see file Number 33-53683, Incorporated by Reference.