UNITED STATES
SECURITIES AND EXCHANGE COMMISSION
Washington, D.C. 20549
FORM N-CSR
CERTIFIED SHAREHOLDER REPORT
OF
REGISTERED MANAGEMENT INVESTMENT COMPANIES
Investment Company Act file number: 811-3916
Name of Registrant: Vanguard Specialized Funds
Address of Registrant: | P.O. Box 2600 |
| Valley Forge, PA 19482 |
| |
Name and address of agent for service: | Heidi Stam, Esquire |
| P.O. Box 876 |
| Valley Forge, PA 19482 |
| |
Registrant’s telephone number, including area code: (610) 669-1000
Date of fiscal year end: January 31
Date of reporting period: February 1, 2008– January 31, 2009
Item 1: Reports to Shareholders |

> | After a rollercoaster ride for oil prices, Vanguard Energy Fund returned –38.51% for Investor Shares in the fiscal year ended January 31, 2009, in an almost uniformly dismal stock market. |
> | The fund’s return was ahead of the average return of its peer funds, but several steps behind the return of its highly concentrated all-U.S. benchmark. |
> | For the ten years ended January 31, the Energy Fund’s average annual return of about 15% placed it well ahead of the results for its comparative standards and the broad stock market. |
Contents | |
| |
Your Fund’s Total Returns | 1 |
President’s Letter | 2 |
Advisors’ Report | 7 |
Fund Profile | 10 |
Performance Summary | 12 |
Financial Statements | 14 |
Your Fund’s After-Tax Returns | 27 |
About Your Fund’s Expenses | 28 |
Glossary | 30 |
Past performance is not a guarantee of future results. (Current performance may be lower or higher than the performance data cited. For performance data current to the most recent month-end, visit our website at www.vanguard.com/performance.) Note, too, that both investment returns and principal value can fluctuate widely, so an investor’s shares, when sold, could be worth more or less than their original cost.
Please note: The opinions expressed in this report are just that—informed opinions. They should not be considered promises or advice. Also, please keep in mind that the information and opinions cover the period through the date on the front of this report. Of course, the risks of investing in your fund are spelled out in the prospectus.
Your Fund’s Total Returns
Fiscal Year Ended January 31, 2009 | | |
| Ticker | Total |
| Symbol | Returns |
Vanguard Energy Fund | | |
Investor Shares | VGENX | –38.51% |
Admiral™ Shares1 | VGELX | –38.46 |
S&P Energy Sector Index | | –29.19 |
Average Natural Resources Fund2 | | –43.53 |
Your Fund’s Performance at a Glance | | | |
January 31, 2008–January 31, 2009 | | | |
| | | Distributions Per Share |
| Starting | Ending | Income | Capital |
| Share Price | Share Price | Dividends | Gains |
Vanguard Energy Fund | | | | |
Investor Shares | $73.93 | $42.62 | $1.264 | $2.469 |
Admiral Shares | 138.86 | 80.02 | 2.480 | 4.637 |
1 A lower-cost class of shares available to many longtime shareholders and to those with significant investments in the fund.
2 Derived from data provided by Lipper Inc.
1

President’s Letter
Dear Shareholder,
The energy sector, a leading performer in calendar 2007 and well into 2008, finished our fiscal year near the middle of the pack in the bear market. When oil prices did an abrupt about-face last July, energy stock prices followed a similarly steep downward spiral.
For the fiscal year ended January 31, Vanguard Energy Fund returned a disappointing –38.51% for Investor Shares and –38.46% for Admiral Shares. This was about 5 percentage points ahead of the average result for competing natural resources funds, which had the lead in the fiscal first half.
But the fund’s return lagged about 9 percentage points behind the –29.19% return of the benchmark Standard & Poor’s Energy Sector Index. Keep in mind that, although this index provides a useful comparison, it includes only United States-based companies and is dominated by a few large holdings.
If you invest in the Energy Fund through a taxable account, you may wish to review information about the fund’s after-tax performance provided later in this report.
Stocks fell worldwide as the credit crisis deepened
The 12 months ended January 31 was one of the worst ever one-year spans for stocks. The broad U.S. stock market declined steeply, returning about –39%; international stocks returned –45%. The
2
trouble stemmed from the financial sector, where some of the world’s largest institutions imploded largely because of their exposure to low-quality mortgages in the United States. The effects of the credit crisis were wide and deep, with virtually no country or industry sector spared.
The stock market struggled through the first part of the fiscal year, then declined sharply in September, October, and November. December offered a brief reprieve before the market fell again in January.
In a flight to safety, investors chose low-yield Treasuries
As economic uncertainty and market volatility grew more pronounced in the second half of the year, investors sought the relative safety of short-term government issues. This drove prices for Treasuries higher, and their yields lower. In some cases, investors were willing to accept very low—or even slightly negative—yields for the short-term safekeeping of their assets.
At the same time, the Federal Reserve Board steered short-term interest rates lower in its ongoing campaign to encourage lending. During your fund’s fiscal year, the target for the federal funds rate dropped from 3.00% to a range of 0%–0.25%.
For the full 12-month period, the broad taxable bond market returned 2.59%, and tax-exempt bonds returned –0.16%—somewhat pedestrian (if disappointing) returns that masked a year of uncommon volatility for bonds.
Market Barometer | | | |
| | Average Annual Total Returns |
| | Periods Ended January 31, 2009 |
| One Year | Three Years | Five Years |
Stocks | | | |
Russell 1000 Index (Large-caps) | –39.04% | –12.03% | –4.05% |
Russell 2000 Index (Small-caps) | –36.84 | –14.31 | –4.06 |
Dow Jones Wilshire 5000 Index (Entire market) | –38.69 | –12.03 | –3.75 |
MSCI All Country World Index ex USA (International) | –44.72 | –11.41 | 0.79 |
| | | |
Bonds | | | |
Barclays Capital U.S. Aggregate Bond Index | | | |
(Broad taxable market) | 2.59% | 5.19% | 4.30% |
Barclays Capital Municipal Bond Index | –0.16 | 3.00 | 3.33 |
Citigroup 3-Month Treasury Bill Index | 1.52 | 3.65 | 3.08 |
| | | |
CPI | | | |
Consumer Price Index | 0.03% | 2.11% | 2.66% |
3
It was a rollercoaster ride for oil prices and energy stocks
After climbing from about $90 per barrel in January 2008 to a record of more than $145 per barrel in mid-July, the spot price of West Texas Intermediate crude oil (an industry benchmark) dropped sharply to about $40–$45 per barrel in January 2009. Natural gas prices traced a similar path.
As economies around the globe skidded into recession, energy demand slackened. Production cutbacks announced by the Organization of Petroleum Exporting Countries to put the brakes on the free-fall in oil prices had little apparent impact. Just as soaring energy prices boosted exploration, production, and related activities, the dramatic pullback in prices had a chilling effect across the oil patch.
When energy prices fall, the major integrated oil and gas producers—with complex operations that range from exploring in the remote corners of the world to refining crude oil along the Gulf Coast of the United States—are often better-positioned than smaller, less-diversified companies. Although the majors’ producing operations can be hurt by lower prices, their refineries can benefit from improved profit margins.
But in the past fiscal year, refining was squeezed as consumers reacted to gasoline pump prices above $4 per gallon and airlines cut flights in response to soaring jet fuel costs. This segment of the portfolio, which represented more than 50% of assets, on average, returned about –33% and trimmed more than 15 percentage points from the fund’s return.
Among the hardest hit of the integrated producers were companies based overseas, including some that had enjoyed eye-popping returns a year earlier when they announced potentially significant discoveries. Disappointments included Russia’s Gazprom (–73%) and LUKOIL
Expense Ratios1 | | | |
Your Fund Compared With Its Peer Group | | | |
| | | Average |
| | | Natural |
| Investor | Admiral | Resources |
| Shares | Shares | Fund |
Energy Fund | 0.25% | 0.17% | 1.18% |
1 The fund expense ratios shown are from the prospectus dated May 29, 2008. For the fiscal year ended January 31, 2009, the Energy Fund’s expense ratios were 0.28% for Investor Shares and 0.21% for Admiral Shares. The peer-group expense ratio is derived from data provided by Lipper Inc. and captures information through year-end 2008.
4
(–51%), Canada’s Suncor Energy (–59%), Petróleo Brasileiro (–51%), and BG Group (British Gas, –37%).
Your fund’s advisors—Wellington Management Company, LLP, and Vanguard Quantitative Equity Group—invest in some foreign stocks to help prudently diversify the portfolio, placing it in contrast with the benchmark index. For example, one U.S.-based company (ExxonMobil) represented almost one-third of the index during the fiscal year, but less than one-tenth of your portfolio.
This more diversified strategy has served shareholders well over the long term. During the past 12 months, however, the inclusion of foreign holdings and the resulting relatively light exposure to some of the better-performing U.S. integrated behemoths—such as ExxonMobil (–10%) and Chevron (–13%)—helped keep the fund’s return behind that of the benchmark index.
Among smaller slices of the portfolio—including gas utilities, drilling companies, and oil and gas storage and transportation companies—the advisors’ allocation decisions helped the funds’ performance relative to the benchmark index.
Over ten years, the fund achieved a track record to be proud of
Over a decade that now spans two recessions, equity performance in general has been disappointing. Average annual returns for the broad U.S. and international stock markets were –1.83% and 1.34%, respectively. Your fund stands out in sharp contrast, with a 15.16% average annual return over the ten years ended January 31—well ahead of the result for its benchmark index and the average return of peer funds. Keep in mind that this period coincided with a spectacular boom in energy prices, which is not something to count on, as we have witnessed in the last several months.
Total Returns | |
Ten Years Ended January 31, 2009 | |
| Average |
| Annual Return |
Energy Fund Investor Shares | 15.16% |
S&P Energy Sector Index | 10.80 |
Average Natural Resources Fund1 | 11.54 |
The figures shown represent past performance, which is not a guarantee of future results. (Current performance may be lower or higher than the performance data cited. For performance data current to the most recent month-end, visit our website at www.vanguard.com/performance.) Note, too, that both investment returns and principal value can fluctuate widely, so an investor’s shares, when sold, could be worth more or less than their original cost.
1 Derived from data provided by Lipper Inc.
5
The fund’s performance is a tribute to the disciplined and complementary investment strategies of your fund’s advisors, which help provide diversification even within a sector-specific fund holding only about 100–105 stocks. Wellington Management Company focuses on the bottom-up selection of stocks it considers to be undervalued, while Vanguard Quantitative Equity Group uses a risk-controlled, computer-based approach to evaluate and rank stocks. And your fund’s low expenses help investors keep more of the fund’s return, an advantage that compounds over time.
For more about the advisors’ strategies and the fund’s positioning during the year, see the Advisors’ Report, which begins on page 7.
Diversification and balance are still the way to go
For more than a year, global financial markets have been reeling from an unnerving confluence of events—including record-high oil prices, credit market gridlock, and major economies falling into deep recession. Portfolios that were balanced and diversified have suffered too, of course. But our experience suggests that these time-tested fundamentals—plus low costs—can help put investors in a better position to benefit from the eventual recovery in financial markets.
As your fund’s outstanding long-term record reveals, focusing on one market segment can be rewarding. But we encourage investors not to narrow their investment horizons, no matter how tempting this may be. The Energy Fund, which marks its 25th anniversary later this year, can provide you with low-cost exposure to an important slice of the overall market as part of a balanced, diversified portfolio consistent with your long-term goals and risk tolerance.
Thank you for entrusting your assets to Vanguard.
Sincerely,

F. William McNabb III
President and Chief Executive Officer
February 12, 2009
6
Advisors’ Report
For the fiscal year ended January 31, 2009, the Investor Shares of Vanguard Energy Fund returned –38.51% and the Admiral Shares –38.46%. Your fund is managed by two advisors, a strategy that enhances the fund’s diversification by providing exposure to distinct, yet complementary, investment approaches.
The advisors, the amount and percentage of fund assets each manages, and brief descriptions of their investment strategies are presented in the table below. The advisors have also provided a discussion of the investment environment that existed during the year and of how their portfolio positioning reflects this assessment. These reports were prepared on February 17, 2009.
Wellington Management Company, LLP
Portfolio Managers:
Karl E. Bandtel, Senior Vice President
James A. Bevilacqua, Senior Vice President
After crude oil reached record highs above $140 per barrel in mid-July, demand for energy-related commodities weakened as the financial crisis widened and the world economy slipped into recession. Oil prices then spiraled lower, closing the fiscal year near $40. Although the difficult credit markets may continue to dampen demand for energy in the coming year, a contraction of supply—evidenced by the wave of cuts in production and capital expenditures announced by oil-producing countries and U.S. natural gas producers—will likely help create a floor for energy prices.
Vanguard Energy Fund Investment Advisors | |
| | | |
| Fund Assets Managed | |
Investment Advisor | % | $ Million | Investment Strategy |
Wellington Management | 94 | 6,883 | Emphasizes long-term total-return opportunities from |
Company, LLP | | | the various energy subsectors: international oils, |
| | | foreign integrated oils and foreign producers, North |
| | | American producers, oil services and equipment, |
| | | transportation and distribution, and refining |
| | | and marketing. |
Vanguard Quantitative Equity | 3 | 229 | Conducts quantitative portfolio management using |
Group | | | models that assess valuation, marketplace sentiment, |
| | | and earnings quality of companies compared with |
| | | their peers. |
Cash Investments | 3 | 210 | These short-term reserves are invested by Vanguard |
| | | in equity index products to simulate investments in |
| | | stocks. Each advisor may also maintain a modest |
| | | cash position. |
| | | | |
7
Natural gas prices, which started the period near $8 per thousand cubic feet, fell during the second half of the fiscal year as producers continued to invest for an environment of growth, which increased supplies. As the period closed, economic weakness intensified, keeping gas prices low.
Top contributors to the performance of our portion of the Energy Fund included ExxonMobil and Nabors Industries; detractors included Weatherford International, Gazprom, and Schlumberger. We established new positions in Chesapeake Energy and India’s Reliance Industries, and added to our existing positions in ExxonMobil and Baker Hughes. We eliminated holdings in Repsol (Spain) and LUKOIL (Russia), and reduced our position in ConocoPhillips as we found better opportunities in which to invest.
Vanguard Quantitative Equity Group
Portfolio Manager:
James D. Troyer, CFA, Principal
Even though the stock market’s volatility over the past year has set a high level for comparison, the swings in the energy sector may have been more intense. After several years of price increases, oil began fiscal 2009 near $90 per barrel. It rose more than 50% to above $140 per barrel but had fallen to about $40 per barrel at the end of January, providing a stark example of the difficulty in forecasting price movements. Global energy stocks followed suit, rising in the first half of the period only to decline sharply in the second half of the fiscal year.
These large overall movements in the market, which investment jargon calls “beta,” are generally more important to a portfolio’s total return than an advisor’s stock-picking ability, or “alpha.” Our strategy focuses on the “alpha” component and tries to match the “beta” of the market, since we don’t believe that we are able to add value by forecasting broad market movements. Thus, we are always fully invested, and we hold numerous stocks in an attempt to keep our portfolio similar to the overall characteristics of our benchmark. The resulting portfolio includes many small positions in individual equities as we seek to capture the market’s tendency to over-or underreact to new information.
Our positions in National Oilwell Varco, Halliburton, and Chesapeake Energy were particularly successful. Detracting from our relative performance were our holdings of Plains Exploration & Production, Addax Petroleum, and Arch Coal. The largest contribution to the relative return of our portfolio by any individual stock was slightly more than half of 1 percentage point, which underscores our earlier comment about many small holdings.
We believe the markets are reasonably efficiently priced, so we do not take large stakes in individual stocks. Instead, we
8
focus on our objective, which is to make many small systematic investments, rigorously tested and applied in an effort to catch relatively small mispricings across large numbers of stocks. The success or failure of a few holdings is not as important as the average return we earn over our entire portfolio.
Over the long run, our quantitative process has demonstrated the ability to add value, and we continue to believe that a portfolio with a lower price/earnings ratio and a higher return on equity than the benchmark index offers an attractive choice as part of a diversified investment plan. We thank you for your investment and trust.
9
Energy Fund
Fund Profile
As of January 31, 2009
Portfolio Characteristics | | |
| | Comparative | Broad |
| Fund | Index1 | Index2 |
Number of Stocks | 100 | 39 | 4,554 |
Median Market Cap | $44.8B | $145.9B | $24.3B |
Price/Earnings Ratio | 6.2x | 7.1x | 11.7x |
Price/Book Ratio | 1.5x | 1.6x | 1.6x |
Yield3 | | 2.3% | 2.9% |
Investor Shares | 2.7% | | |
Admiral Shares | 2.8% | | |
Return on Equity | 30.0% | 30.7% | 21.1% |
Earnings Growth Rate | 36.1% | 33.1% | 18.3% |
Foreign Holdings | 40.1% | 0.0% | 0.0% |
Turnover Rate | 21% | — | — |
Expense Ratio | | | |
(1/31/2008)4 | | — | — |
Investor Shares | 0.25% | | |
Admiral Shares | 0.17% | | |
Short-Term Reserves | 2.3% | — | — |
Sector Diversification5 (% of equity exposure) |
| |
Coal & Consumable Fuels | 2.7% |
Industrials | 0.2 |
Integrated Oil & Gas | 51.2 |
Materials | 3.1 |
Oil & Gas Drilling | 2.4 |
Oil & Gas Equipment & Services | 11.0 |
Oil & Gas Exploration & Production | 21.1 |
Oil & Gas Refining and Marketing | 2.7 |
Utilities | 3.1 |
Other Energy | 2.5 |
Volatility Measures6 | |
| Fund Versus | Fund Versus |
| Comparative Index1 | Broad Index2 |
R-Squared | 0.93 | 0.49 |
Beta | 1.10 | 1.11 |
Ten Largest Holdings7 (% of total net assets) |
| |
ExxonMobil Corp. | 9.1% |
Chevron Corp. | 4.5 |
Total SA | 4.3 |
EOG Resources, Inc. | 4.1 |
Occidental Petroleum Corp. | 3.9 |
BG Group PLC | 3.3 |
Schlumberger Ltd. | 3.0 |
Royal Dutch Shell PLC | 3.0 |
BHP Billiton Ltd. ADR | 3.0 |
Baker Hughes Inc. | 2.8 |
Top Ten | 41.0% |
Investment Focus
1 S&P Energy Sector Index.
2 Dow Jones Wilshire 5000 Index.
3 30-day SEC yield for the fund; annualized dividend yield for the indexes. See the Glossary.
4 The expense ratios shown are from the prospectus dated May 29, 2008. For the fiscal year ended January 31, 2009, the expense ratios were 0.28% for Investor Shares and 0.21% for Admiral Shares.
5 Sector percentages combine U.S. and international holdings.
6 For an explanation of R-squared, beta, and other terms used here, see the Glossary.
7 The holdings listed exclude any temporary cash investments and equity index products.
10
Energy Fund
Market Diversification (% of equity exposure) |
| |
United States | 59.3% |
Canada | 11.2 |
United Kingdom | 9.3 |
France | 4.4 |
Australia | 4.1 |
Brazil | 2.6 |
Italy | 2.2 |
Norway | 2.0 |
India | 1.9 |
Russia | 1.5 |
Other Markets | 1.5 |
11
Energy Fund
Performance Summary
All of the returns in this report represent past performance, which is not a guarantee of future results that may be achieved by the fund. (Current performance may be lower or higher than the performance data cited. For performance data current to the most recent month-end, visit our website at www.vanguard.com/performance.) Note, too, that both investment returns and principal value can fluctuate widely, so an investor’s shares, when sold, could be worth more or less than their original cost. The returns shown do not reflect taxes that a shareholder would pay on fund distributions or on the sale of fund shares.
Cumulative Performance: January 31, 1999–January 31, 2009
Initial Investment of $25,000
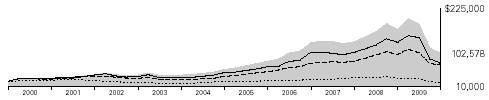
| Average Annual Total Returns | Final Value |
| Periods Ended January 31, 2009 | of a $25,000 |
| One Year | Five Years | Ten Years | Investment |
Energy Fund Investor Shares1 | –38.51% | 12.21% | 15.16% | $102,578 |
Dow Jones Wilshire 5000 Index | –38.69 | –3.75 | –1.83 | 20,794 |
S&P Energy Sector Index | –29.19 | 12.44 | 10.80 | 69,722 |
Average Natural Resources Fund2 | –43.53 | 8.50 | 11.54 | 74,490 |
| | | | Final Value |
| | | Since | of a $100,000 |
| One Year | Five Years | Inception3 | Investment |
Energy Fund Admiral Shares1 | –38.46% | 12.29% | 13.23% | $245,246 |
Dow Jones Wilshire 5000 Index | –38.69 | –3.75 | –1.19 | 91,738 |
S&P Energy Sector Index | –29.19 | 12.44 | 10.42 | 204,588 |
1 Total returns do not reflect the 1% fee assessed on redemptions of shares held less than one year, nor for the Investor Shares do they include the account service fee that may be applicable to certain accounts with balances below $10,000.
2 Derived from data provided by Lipper Inc.
3 Performance for the fund’s Admiral Shares and the comparative standards is calculated since the Admiral Shares’ inception: November 12, 2001.
12
Energy Fund
Fiscal-Year Total Returns (%): January 31, 1999–January 31, 2009

Average Annual Total Returns: Periods Ended December 31, 2008
This table presents average annual total returns through the latest calendar quarter—rather than through the end of the fiscal period. Securities and Exchange Commission rules require that we provide this information.
| Inception Date | One Year | Five Years | Ten Years |
Investor Shares1 | 5/23/1984 | –42.87% | 13.10% | 14.75% |
Admiral Shares1 | 11/12/2001 | –42.83 | 13.17 | 13.952 |
1 Total returns do not reflect the 1% fee assessed on redemptions of shares held less than one year, nor for the Investor Shares do they include the account service fee that may be applicable to certain accounts with balances below $10,000.
2 Return since inception.
Note: See Financial Highlights tables for dividend and capital gains information.
13
Energy Fund
Financial Statements
Statement of Net Assets
As of January 31, 2009
The fund provides a complete list of its holdings four times in each fiscal year, at the quarter-ends. For the second and fourth fiscal quarters, the lists appear in the fund’s semiannual and annual reports to shareholders. For the first and third fiscal quarters, the fund files the lists with the Securities and Exchange Commission on Form N-Q. Shareholders can look up the fund’s Forms N-Q on the SEC’s website at www.sec.gov. Forms N-Q may also be reviewed and copied at the SEC’s Public Reference Room (see the back cover of this report for further information).
| | | Market |
| | | Value• |
| | Shares | ($000) |
Common Stocks (95.6%)1 | | |
United States (55.5%) | | |
Energy Equipment & Services (11.6%) | | |
| Schlumberger Ltd. | 5,401,164 | 220,422 |
| Baker Hughes Inc. | 6,240,900 | 207,947 |
* | Weatherford | | |
| International Ltd. | 14,099,600 | 155,519 |
| Halliburton Co. | 8,974,332 | 154,807 |
* | Transocean Ltd. | 1,972,164 | 107,720 |
| ENSCO International, Inc. | 54,914 | 1,503 |
| Patterson-UTI Energy, Inc. | 124,200 | 1,187 |
* | Nabors Industries, Inc. | 81,400 | 891 |
| Noble Corp. | 24,872 | 675 |
| | | 850,671 |
Gas Utilities (3.0%) | | |
| Equitable Resources, Inc. | 3,640,900 | 124,628 |
| Questar Corp. | 2,832,600 | 96,252 |
| | | 220,880 |
Oil, Gas & Consumable Fuels (40.3%) | | |
| Coal & Consumable Fuels (2.6%) | | |
| CONSOL Energy, Inc. | 4,367,800 | 119,066 |
| Peabody Energy Corp. | 2,713,100 | 67,828 |
* | Alpha Natural | | |
| Resources, Inc. | 57,100 | 932 |
| | | |
| Integrated Oil & Gas (23.7%) | | |
| ExxonMobil Corp. | 8,670,231 | 663,099 |
| Chevron Corp. | 4,666,035 | 329,049 |
| Occidental Petroleum Corp. | 5,265,401 | 287,228 |
| ConocoPhillips Co. | 4,043,509 | 192,188 |
| Marathon Oil Corp. | 4,982,891 | 135,684 |
| Hess Corp. | 2,281,589 | 126,879 |
| Murphy Oil Corp. | 46,800 | 2,068 |
| | | |
| Oil & Gas Exploration & Production (12.0%) | |
| EOG Resources, Inc. | 4,442,436 | 301,064 |
| Noble Energy, Inc. | 2,960,800 | 144,872 |
| Cabot Oil & Gas Corp. | 4,640,100 | 127,556 |
| | | Market |
| | | Value• |
| | Shares | ($000) |
| Devon Energy Corp. | 1,735,276 | 106,893 |
| Chesapeake Energy Corp. | 4,628,037 | 73,169 |
| XTO Energy, Inc. | 1,937,477 | 71,861 |
* | Newfield Exploration Co. | 2,384,700 | 45,762 |
* | Southwestern Energy Co. | 75,300 | 2,383 |
| Apache Corp. | 19,670 | 1,475 |
* | Plains Exploration & | | |
| Production Co. | 64,000 | 1,352 |
| Anadarko Petroleum Corp. | 20,260 | 744 |
| | | |
| Oil & Gas Refining & Marketing (1.2%) | | |
| Valero Energy Corp. | 3,662,342 | 88,336 |
| | | |
| Oil & Gas Storage & Transportation (0.8%) | | |
| Williams Cos., Inc. | 4,187,600 | 59,255 |
| | | 2,948,743 |
Exchange-Traded Fund (0.6%) | | |
2 | Vanguard Energy ETF | 663,000 | 43,811 |
Total United States | | 4,064,105 |
International (40.1%) | | |
Argentina (0.0%) | | |
| Petrobras Energia | | |
| Participaciones SA ADR | 196,608 | 1,337 |
| | | |
Australia (4.0%) | | |
| BHP Billiton Ltd. ADR | 5,800,000 | 217,732 |
| Woodside | | |
| Petroleum Ltd. ADR | 3,331,600 | 73,462 |
| Caltex Australia Ltd. | 107,803 | 591 |
| | | 291,785 |
Austria (0.9%) | | |
| OMV AG | 2,332,765 | 66,477 |
| | | |
Brazil (2.5%) | | |
| Petroleo Brasileiro SA ADR | 6,773,400 | 177,463 |
| Petroleo Brasileiro SA Pfd. | 273,820 | 2,954 |
| Petroleo Brasileiro SA | 191,242 | 2,503 |
| | | 182,920 |
14
Energy Fund
| | | Market |
| | | Value• |
| | Shares | ($000) |
Canada (11.0%) | | |
| Canadian Natural | | |
| Resources Ltd. | | |
| (New York Shares) | 5,092,859 | 181,051 |
| EnCana Corp. | | |
| (New York Shares) | 3,432,300 | 152,188 |
| Suncor Energy, Inc. | | |
| (New York Shares) | 7,875,800 | 151,609 |
| Talisman Energy, Inc. | 8,296,131 | 78,547 |
| Husky Energy Inc. | 3,079,900 | 76,454 |
| Petro-Canada | | |
| (New York Shares) | 3,337,000 | 72,046 |
| Canadian Oil Sands Trust | 4,221,175 | 64,372 |
| Canadian Oil Sands Trust | | |
| (New York Shares) | 1,172,300 | 17,877 |
| EnCana Corp. | 108,539 | 4,830 |
| Canadian Natural | | |
| Resources Ltd. | 95,439 | 3,416 |
| Suncor Energy, Inc. | 40,852 | 783 |
| TransCanada Corp. | 16,796 | 452 |
| | | 803,625 |
China (0.0%) | | |
| China Oilfield Services Ltd. | 2,024,000 | 1,589 |
| Yanzhou Coal Mining Co. | | |
| Ltd. H Shares | 1,366,000 | 887 |
| PetroChina Co. Ltd. | 744,000 | 549 |
| CNOOC Ltd. | 266,717 | 230 |
| China Petroleum & | | |
| Chemical Corp. | 74,000 | 40 |
| | | 3,295 |
Finland (0.0%) | | |
| Neste Oil Oyj | 95,300 | 1,380 |
| | | |
France (4.3%) | | |
| Total SA ADR | 6,098,100 | 303,563 |
| Total SA | 256,446 | 12,780 |
| | | 316,343 |
Greece (0.0%) | | |
| Hellenic Petroleum SA | 175,000 | 1,259 |
| | | |
Hungary (0.0%) | | |
| MOL Hungarian Oil | | |
| and Gas Nyrt. | 30,700 | 1,190 |
| | | |
India (1.9%) | | |
| Reliance Industries Ltd. | 3,143,368 | 83,846 |
| Oil and Natural | | |
| Gas Corp. Ltd. | 3,322,724 | 44,137 |
3 | Oil and Natural | | |
| Gas Corp., Ltd. | | |
| Warrants Exp. 7/14/10 | 351,450 | 4,709 |
| | | 132,692 |
| | | | Market |
| | | | Value• |
| | | Shares | ($000) |
Israel (0.0%) | | |
| | Oil Refineries Ltd. | 2,576,400 | 612 |
| | | | |
Italy (2.2%) | | |
| | Eni SpA ADR | 3,551,850 | 150,563 |
| | Eni SpA | 339,875 | 7,189 |
| | Saipem SpA | 41,917 | 639 |
| | Saras SpA Raffinerie Sarde | 132,435 | 436 |
| | | | 158,827 |
Japan (0.0%) | | |
| | Idemitsu Kosan Co. Ltd. | 22,100 | 1,442 |
| | | | |
Luxembourg (0.0%) | | |
* | | Tenaris S.A. | 173,200 | 1,709 |
| | | | |
Malaysia (0.0%) | | |
| | Petronas Dagangan Bhd. | 635,800 | 1,292 |
| | | | |
Netherlands (0.6%) | | |
| | Fugro NV | 1,539,827 | 41,608 |
| | SBM Offshore NV | 102,864 | 1,240 |
| | | | 42,848 |
Norway (2.0%) | | |
| | Statoil ASA ADR | 6,577,900 | 113,337 |
| | Seadrill Ltd. | 2,714,040 | 22,492 |
| | StatoilHydro ASA | 207,860 | 3,581 |
| ^ | Frontline Ltd. | 43,250 | 1,243 |
| | | | 140,653 |
Poland (0.0%) | | |
| | Polski Koncern | | |
| | Naftowy SA | 154,100 | 984 |
| | | | |
Russia (1.5%) | | |
| | OAO Gazprom- | | |
| | Sponsored ADR | 7,959,022 | 102,735 |
| | OAO Gazprom- | | |
| | Sponsored GDR | 273,651 | 3,532 |
| | LUKOIL Sponsored ADR | 48,900 | 1,595 |
| | Rosneft Oil Co. GDR | 388,600 | 1,204 |
| | | | 109,066 |
South Africa (0.0%) | | |
| | Sasol Ltd. | 109,374 | 2,912 |
| | | | |
South Korea (0.0%) | | |
| | S-Oil Corp. | 31,360 | 1,320 |
| | | | |
Spain (0.0%) | | |
| | Repsol YPF SA | 128,140 | 2,289 |
15
Energy Fund
| | | Market |
| | | Value• |
| | Shares | ($000) |
Thailand (0.0%) | | |
| Banpu Public Co. Ltd. | | |
| (Foreign) | 108,200 | 679 |
| | | |
Turkey (0.0%) | | |
| Tupras-Turkiye Petrol | | |
| Rafinerileri A.S. | 155,035 | 1,469 |
| | | |
United Kingdom (9.2%) | | |
| BG Group PLC | 17,682,200 | 242,434 |
| BP PLC ADR | 4,455,800 | 189,238 |
^ | Royal Dutch Shell | | |
| PLC ADR Class A | 2,768,500 | 136,293 |
| Royal Dutch Shell | | |
| PLC ADR Class B | 1,372,726 | 65,657 |
| BP PLC | 2,207,838 | 15,636 |
| Royal Dutch Shell | | |
| PLC Class A | 316,697 | 7,893 |
| Royal Dutch Shell | | |
| PLC Class B | 299,045 | 7,099 |
| Royal Dutch Shell | | |
| PLC Class A | | |
| (Amsterdam Shares) | 117,600 | 2,898 |
| Amec PLC | 57,888 | 471 |
| | | 667,619 |
Total International | | 2,936,024 |
Total Common Stocks | | |
(Cost $6,070,349) | | 7,000,129 |
Temporary Cash Investments (4.9%)1 | | |
Money Market Fund (2.2%) | | |
4,5 | Vanguard Market | | |
| Liquidity Fund, 0.780% | 162,659,748 | 162,660 |
| | Face | Market |
| | Amount | Value• |
| | ($000) | ($000) |
Repurchase Agreement (2.3%) | | |
| Deutsche Bank | | |
| Securities, Inc. 0.290%, | | |
| 2/2/09 (Dated 1/30/09, | | |
| Repurchase Value $166,304,000, | | |
| collateralized by Federal Home | | |
| Loan Mortgage Corp. | | |
| 6.500%–7.000%, | | |
| 11/1/37–7/1/38 and | | |
| Federal National | | |
| Mortgage Assn. | | |
| 5.500%–7.000%, | | |
| 3/1/37–12/1/38) | 166,300 | 166,300 |
| | | |
U.S. Agency Obligations (0.4%) | | |
6 | Federal Home Loan | | |
| Mortgage Corp. | | |
7 | 1.204%, 2/23/09 | 6,500 | 6,499 |
7 | 0.954%, 4/24/09 | 5,000 | 4,996 |
7 | 0.320%, 4/27/09 | 2,000 | 1,998 |
7 | 0.320%, 5/26/09 | 3,000 | 2,996 |
7 | 0.280%, 5/27/09 | 8,000 | 7,989 |
6 | Federal National | | |
| Mortgage Assn. | | |
7 | 2.625%, 2/17/09 | 2,000 | 2,000 |
| | | 26,478 |
Total Temporary Cash Investments | | |
(Cost $355,430) | | 355,438 |
Total Investments (100.5%) | | |
(Cost $6,425,779) | | 7,355,567 |
Other Assets and Liabilities (–0.5%) | | |
Other Assets | | 15,510 |
Liabilities5 | | (48,878) |
| | | (33,368) |
Net Assets (100%) | | 7,322,199 |
16
Energy Fund
At January 31, 2009, net assets consisted of: |
| Amount |
| ($000) |
Paid-in Capital | 6,568,702 |
Overdistributed Net Investment Income | (9,611) |
Accumulated Net Realized Losses | (154,050) |
Unrealized Appreciation (Depreciation) | |
Investment Securities | 929,788 |
Futures Contracts | (12,612) |
Foreign Currencies | (18) |
Net Assets | 7,322,199 |
| |
Investor Shares—Net Assets | |
Applicable to 104,015,433 outstanding | |
$.001 par value shares of beneficial | |
interest (unlimited authorization) | 4,433,519 |
Net Asset Value Per Share— | |
Investor Shares | $42.62 |
| |
Admiral Shares—Net Assets | |
Applicable to 36,098,537 outstanding | |
$.001 par value shares of beneficial | |
interest (unlimited authorization) | 2,888,680 |
Net Asset Value Per Share— | |
Admiral Shares | $80.02 |
• | See Note A in Notes to Financial Statements. |
* | Non-income-producing security. |
^ | Part of security position is on loan to broker-dealers. The total value of securities on loan is $17,401,000. |
1 The fund invests a portion of its cash reserves in equity markets through the use of index futures contracts. After giving effect to futures investments, the fund’s effective common stock and temporary cash investment positions represent 98.0% and 2.5%, respectively, of net assets.
2 Considered an affiliated company of the fund as the issuer is another member of The Vanguard Group.
3 Security exempt from registration under Rule 144A of the Securities Act of 1933. Such securities may be sold in transactions exempt from registration, normally to qualified institutional buyers. At January 31, 2009, the value of this security represented 0.06% of net assets.
4 Affiliated money market fund available only to Vanguard funds and certain trusts and accounts managed by Vanguard. Rate shown is the 7-day yield.
5 Includes $18,690,000 of collateral received for securities on loan.
6 The issuer operates under a congressional charter; its securities are neither issued nor guaranteed by the U.S. government.
7 Securities with a value of $26,478,000 have been segregated as initial margin for open futures contracts.
ADR—American Depositary Receipt.
GDR—Global Depositary Receipt.
See accompanying Notes, which are an integral part of the Financial Statements.
17
Energy Fund
Statement of Operations
| Year Ended |
| January 31, 2009 |
| ($000) |
Investment Income | |
Income | |
Dividends1,2 | 242,214 |
Interest2 | 13,164 |
Security Lending | 4,510 |
Total Income | 259,888 |
Expenses | |
Investment Advisory Fees—Note B | |
Basic Fee | 11,715 |
Performance Adjustment | 1,392 |
The Vanguard Group—Note C | |
Management and Administrative—Investor Shares | 10,750 |
Management and Administrative—Admiral Shares | 4,004 |
Marketing and Distribution—Investor Shares | 1,881 |
Marketing and Distribution—Admiral Shares | 1,082 |
Custodian Fees | 222 |
Auditing Fees | 25 |
Shareholders’ Reports—Investor Shares | 135 |
Shareholders’ Reports—Admiral Shares | 16 |
Trustees’ Fees and Expenses | 17 |
Total Expenses | 31,239 |
Net Investment Income | 228,649 |
Realized Net Gain (Loss) | |
Investment Securities Sold2 | 59,856 |
Futures Contracts | (65,575) |
Foreign Currencies | 473 |
Realized Net Gain (Loss) | (5,246) |
Change in Unrealized Appreciation (Depreciation) | |
Investment Securities | (5,094,070) |
Futures Contracts | (2,665) |
Foreign Currencies | (216) |
Change in Unrealized Appreciation (Depreciation) | (5,096,951) |
Net Increase (Decrease) in Net Assets Resulting from Operations | (4,873,548) |
1 Dividends are net of foreign withholding taxes of $17,128,000.
2 Dividend income, interest income, and realized net gain (loss) from affiliated companies of the fund were $784,000, $4,104,000, and $0, respectively.
See accompanying Notes, which are an integral part of the Financial Statements.
18
Energy Fund
Statement of Changes in Net Assets
| Year Ended January 31, |
| 2009 | 2008 |
| ($000) | ($000) |
Increase (Decrease) in Net Assets | | |
Operations | | |
Net Investment Income | 228,649 | 210,661 |
Realized Net Gain (Loss) | (5,246) | 915,449 |
Change in Unrealized Appreciation (Depreciation) | (5,096,951) | 1,363,542 |
Net Increase (Decrease) in Net Assets Resulting from Operations | (4,873,548) | 2,489,652 |
Distributions | | |
Net Investment Income | | |
Investor Shares | (125,121) | (119,127) |
Admiral Shares | (86,895) | (83,384) |
Realized Capital Gain1 | | |
Investor Shares | (259,700) | (435,495) |
Admiral Shares | (171,115) | (280,073) |
Total Distributions | (642,831) | (918,079) |
Capital Share Transactions | | |
Investor Shares | (236,479) | 422,009 |
Admiral Shares | (57,478) | 1,048,332 |
Net Increase (Decrease) from Capital Share Transactions | (293,957) | 1,470,341 |
Total Increase (Decrease) | (5,810,336) | 3,041,914 |
Net Assets | | |
Beginning of Period | 13,132,535 | 10,090,621 |
End of Period2 | 7,322,199 | 13,132,535 |
1 Includes fiscal 2009 and 2008 short-term gain distributions totaling $0 and $64,462,000, respectively. Short-term gain distributions are treated as ordinary income dividends for tax purposes.
2 Net Assets—End of Period includes undistributed (overdistributed) net investment income of ($9,611,000) and ($7,458,000).
See accompanying Notes, which are an integral part of the Financial Statements.
19
Energy Fund
Financial Highlights
Investor Shares | | | | | |
| | | | | |
For a Share Outstanding | Year Ended January 31, |
Throughout Each Period | 2009 | 2008 | 2007 | 2006 | 2005 |
Net Asset Value, Beginning of Period | $73.93 | $63.55 | $64.50 | $40.85 | $29.99 |
Investment Operations | | | | | |
Net Investment Income | 1.2761 | 1.226 | 1.112 | .813 | .529 |
Net Realized and Unrealized Gain (Loss) | | | | | |
on Investments2 | (28.853) | 14.639 | .405 | 24.606 | 11.052 |
Total from Investment Operations | (27.577) | 15.865 | 1.517 | 25.419 | 11.581 |
Distributions | | | | | |
Dividends from Net Investment Income | (1.264) | (1.177) | (1.020) | (.740) | (.524) |
Distributions from Realized Capital Gains | (2.469) | (4.308) | (1.447) | (1.029) | (.197) |
Total Distributions | (3.733) | (5.485) | (2.467) | (1.769) | (.721) |
Net Asset Value, End of Period | $42.62 | $73.93 | $63.55 | $64.50 | $40.85 |
| | | | | |
Total Return3 | –38.51% | 25.02% | 2.24% | 62.93% | 38.90% |
| | | | | |
Ratios/Supplemental Data | | | | | |
Net Assets, End of Period (Millions) | $4,434 | $7,919 | $6,479 | $6,733 | $4,822 |
Ratio of Total Expenses to | | | | | |
Average Net Assets | 0.28%4 | 0.25% | 0.25% | 0.28% | 0.32% |
Ratio of Net Investment Income to | | | | | |
Average Net Assets | 1.84% | 1.67% | 1.71% | 1.57% | 1.67% |
Portfolio Turnover Rate5 | 21% | 22% | 22% | 10% | 1% |
1 Calculated based on average shares outstanding.
2 Includes increases from redemption fees of $.03, $.02, $.03, $.03, and $.02.
3 Total returns do not reflect the 1% fee assessed on redemptions of shares held less than one year, nor do they include the account service fee that may be applicable to certain accounts with balances below $10,000.
4 Includes a performance-based investment advisory fee increase of 0.01%.
5 Excludes the value of portfolio securities received or delivered as a result of in-kind purchases or redemptions of the fund’s capital shares. See accompanying Notes, which are an integral part of the Financial Statements.
20
Energy Fund
Financial Highlights
Admiral Shares | | | | | |
| | | | | |
For a Share Outstanding | Year Ended January 31, |
Throughout Each Period | 2009 | 2008 | 2007 | 2006 | 2005 |
Net Asset Value, Beginning of Period | $138.86 | $119.35 | $121.13 | $76.71 | $56.30 |
Investment Operations | | | | | |
Net Investment Income | 2.4801 | 2.418 | 2.180 | 1.561 | 1.034 |
Net Realized and Unrealized Gain (Loss) | | | | | |
on Investments2 | (54.203) | 27.505 | .757 | 46.217 | 20.770 |
Total from Investment Operations | (51.723) | 29.923 | 2.937 | 47.778 | 21.804 |
Distributions | | | | | |
Dividends from Net Investment Income | (2.480) | (2.322) | (2.000) | (1.425) | (1.024) |
Distributions from Realized Capital Gains | (4.637) | (8.091) | (2.717) | (1.933) | (.370) |
Total Distributions | (7.117) | (10.413) | (4.717) | (3.358) | (1.394) |
Net Asset Value, End of Period | $80.02 | $138.86 | $119.35 | $121.13 | $76.71 |
| | | | | |
Total Return3 | –38.46% | 25.13% | 2.32% | 63.00% | 39.02% |
| | | | | |
Ratios/Supplemental Data | | | | | |
Net Assets, End of Period (Millions) | $2,889 | $5,214 | $3,612 | $3,088 | $549 |
Ratio of Total Expenses to | | | | | |
Average Net Assets | 0.21%4 | 0.17% | 0.18% | 0.22% | 0.26% |
Ratio of Net Investment Income to | | | | | |
Average Net Assets | 1.91% | 1.75% | 1.78% | 1.63% | 1.70% |
Portfolio Turnover Rate5 | 21% | 22% | 22% | 10% | 1% |
1 Calculated based on average shares outstanding.
2 Includes increases from redemption fees of $.06, $.03, $.05, $.03, and $.03.
3 Total returns do not reflect the 1% fee assessed on redemptions of shares held less than one year.
4 Includes a performance-based investment advisory fee increase of 0.01%.
5 Excludes the value of portfolio securities received or delivered as a result of in-kind purchases or redemptions of the fund’s capital shares.
See accompanying Notes, which are an integral part of the Financial Statements.
21
Energy Fund
Notes to Financial Statements
Vanguard Energy Fund is registered under the Investment Company Act of 1940 as an open-end investment company, or mutual fund. The fund may invest in securities of foreign issuers, which may subject it to investment risks not normally associated with investing in securities of United States corporations. The fund offers two classes of shares, Investor Shares and Admiral Shares. Investor Shares are available to any investor who meets the fund’s minimum purchase requirements. Admiral Shares are designed for investors who meet certain administrative, service, tenure, and account-size criteria.
A. The following significant accounting policies conform to generally accepted accounting principles for U.S. mutual funds. The fund consistently follows such policies in preparing its financial statements.
1. Security Valuation: Securities are valued as of the close of trading on the New York Stock Exchange (generally 4 p.m., Eastern time) on the valuation date. Equity securities are valued at the latest quoted sales prices or official closing prices taken from the primary market in which each security trades; such securities not traded on the valuation date are valued at the mean of the latest quoted bid and asked prices. Securities for which market quotations are not readily available, or whose values have been affected by events occurring before the fund’s pricing time but after the close of the securities’ primary markets, are valued at their fair values calculated according to procedures adopted by the board of trustees. These procedures include obtaining quotations from an independent pricing service, monitoring news to identify significant market- or security-specific events, and evaluating changes in the values of foreign market proxies (for example, ADRs, futures contracts, or exchange-traded funds), between the time the foreign markets close and the fund’s pricing time. When fair-value pricing is employed, the prices of securities used by a fund to calculate its net asset value may differ from quoted or published prices for the same securities. Investments in Vanguard Market Liquidity Fund are valued at that fund’s net asset value. Temporary cash investments acquired over 60 days to maturity are valued using the latest bid prices or using valuations based on a matrix system (which considers such factors as security prices, yields, maturities, and ratings), both as furnished by independent pricing services. Other temporary cash investments are valued at amortized cost, which approximates market value.
2. Foreign Currency: Securities and other assets and liabilities denominated in foreign currencies are translated into U.S. dollars using exchange rates obtained from an independent third party as of the fund’s pricing time on the valuation date. Realized gains (losses) and unrealized appreciation (depreciation) on investment securities include the effects of changes in exchange rates since the securities were purchased, combined with the effects of changes in security prices. Fluctuations in the value of other assets and liabilities resulting from changes in exchange rates are recorded as unrealized foreign currency gains (losses) until the assets or liabilities are settled in cash, at which time they are recorded as realized foreign currency gains (losses).
3. Futures Contracts: The fund uses index futures contracts to a limited extent, with the objective of maintaining full exposure to the stock market while maintaining liquidity. The fund may purchase or sell futures contracts to achieve a desired level of investment, whether to accommodate portfolio turnover or cash flows from capital share transactions. The primary risks associated with the use of futures contracts are imperfect correlation between changes in market values of stocks held by the fund and the prices of futures contracts, and the possibility of an illiquid market.
Futures contracts are valued based upon their quoted daily settlement prices. The aggregate principal amounts of the contracts are not recorded in the Statement of Net Assets. Fluctuations in the value of the contracts are recorded in the Statement of Net Assets as an asset (liability) and in the Statement of Operations as unrealized appreciation (depreciation) until the contracts are closed, when they are recorded as realized futures gains (losses).
22
Energy Fund
4. Repurchase Agreements: The fund may invest in repurchase agreements. Securities pledged as collateral for repurchase agreements are held by a custodian bank until the agreements mature. Each agreement requires that the market value of the collateral be sufficient to cover payments of interest and principal; however, in the event of default or bankruptcy by the other party to the agreement, retention of the collateral may be subject to legal proceedings.
5. Federal Income Taxes: The fund intends to continue to qualify as a regulated investment company and distribute all of its taxable income. Management has analyzed the fund’s tax positions taken on federal income tax returns for all open tax years (tax years ended January 31, 2006–2009), and has concluded that no provision for federal income tax is required in the fund’s financial statements.
6. Distributions: Distributions to shareholders are recorded on the ex-dividend date.
7. Security Lending: The fund may lend its securities to qualified institutional borrowers to earn additional income. Security loans are required to be secured at all times by collateral at least equal to the market value of securities loaned. The fund invests cash collateral received in Vanguard Market Liquidity Fund, and records a liability for the return of the collateral, during the period the securities are on loan. Security lending income represents the income earned on investing cash collateral, less expenses associated with the loan.
8. Other: Dividend income is recorded on the ex-dividend date. Interest income includes income distributions received from Vanguard Market Liquidity Fund and is accrued daily. Security transactions are accounted for on the date securities are bought or sold. Costs used to determine realized gains (losses) on the sale of investment securities are those of the specific securities sold. Fees assessed on redemptions of capital shares are credited to paid-in capital.
Each class of shares has equal rights as to assets and earnings, except that each class separately bears certain class-specific expenses related to maintenance of shareholder accounts (included in Management and Administrative expenses) and shareholder reporting. Marketing and distribution expenses are allocated to each class of shares based on a method approved by the board of trustees. Income, other non-class-specific expenses, and gains and losses on investments are allocated to each class of shares based on its relative net assets.
B. Wellington Management Company, LLP, provides investment advisory services to a portion of the fund for a fee calculated at an annual percentage rate of average net assets managed by the advisor. The basic fee is subject to quarterly adjustments based on performance since May 1, 2007, relative to a combined index composed of the S&P Citigroup BMI World Energy Index and the S&P 500 Energy Equal Weighted Blend Index.
The Vanguard Group provides investment advisory services to a portion of the fund on an at-cost basis; the fund paid Vanguard advisory fees of $117,000 for the year ended January 31, 2009.
For the year ended January 31, 2009, the aggregate investment advisory fee represented an effective annual basic rate of 0.10% of the fund’s average net assets before an increase of $1,392,000 (0.01%) based on performance.
C. The Vanguard Group furnishes at cost corporate management, administrative, marketing, and distribution services. The costs of such services are allocated to the fund under methods approved by the board of trustees. The fund has committed to provide up to 0.40% of its net assets in capital
23
Energy Fund
contributions to Vanguard. At January 31, 2009, the fund had contributed capital of $1,943,000 to Vanguard (included in Other Assets), representing 0.03% of the fund’s net assets and 0.78% of Vanguard’s capitalization. The fund’s trustees and officers are also directors and officers of Vanguard.
D. Distributions are determined on a tax basis and may differ from net investment income and realized capital gains for financial reporting purposes. Differences may be permanent or temporary. Permanent differences are reclassified among capital accounts in the financial statements to reflect their tax character. Temporary differences arise when certain items of income, expense, gain, or loss are recognized in different periods for financial statement and tax purposes; these differences will reverse at some time in the future. Differences in classification may also result from the treatment of short-term gains as ordinary income for tax purposes.
During the year ended January 31, 2009, the fund realized net foreign currency gains of $473,000, which increased distributable net income for tax purposes; accordingly, such gains have been reclassified from accumulated net realized losses to overdistributed net investment income. The fund’s realized losses for the year ended January 31, 2009, include taxes paid on realized capital gains on Indian securities of $12,000, which are treated as decreases to taxable income; accordingly these amounts have been reclassified from accumulated net realized losses to overdistributed net investment income.
The fund used a tax accounting practice to treat a portion of the price of capital shares redeemed during the year as distributions from net investment income and realized capital gains. Accordingly, the fund has reclassified $19,247,000 from undistributed net investment income, and $50,634,000 from accumulated net realized gains, to paid-in capital.
For tax purposes, at January 31, 2009, the fund had $5,877,000 of ordinary income available for distribution. Tax-basis capital gains required to be distributed in December 2008 included net capital gains realized through October 31, 2008. Subsequently, the fund realized capital losses of $166,517,000, which are available to offset future net capital gains.
At January 31, 2009, the cost of investment securities for tax purposes was $6,425,779,000. Net unrealized appreciation of investment securities for tax purposes was $929,788,000, consisting of unrealized gains of $1,958,475,000 on securities that had risen in value since their purchase and $1,028,687,000 in unrealized losses on securities that had fallen in value since their purchase.
At January 31, 2009, the aggregate settlement value of open futures contracts expiring in March 2009 and the related unrealized appreciation (depreciation) were:
| | | ($000) |
| Number of | Aggregate | Unrealized |
| Long (Short) | Settlement | Appreciation |
Futures Contracts | Contracts | Value | (Depreciation) |
E-mini S&P 500 Index | 3,516 | 144,595 | (11,365) |
S&P 500 Index | 100 | 20,563 | (1,247) |
Unrealized appreciation (depreciation) on open futures contracts is required to be treated as realized gain (loss) for tax purposes.
E. During the year ended January 31, 2009, the fund purchased $2,485,299,000 of investment securities and sold $2,903,035,000 of investment securities other than temporary cash investments.
24
Energy Fund
F. Capital share transactions for each class of shares were:
| | | Year Ended January 31, |
| | 2009 | | 2008 |
| Amount | Shares | Amount | Shares |
| ($000) | (000) | ($000) | (000) |
Investor Shares | | | | |
Issued | 1,651,475 | 23,673 | 1,916,427 | 25,320 |
Issued in Lieu of Cash Distributions | 370,438 | 6,442 | 534,104 | 7,173 |
Redeemed1 | (2,258,392) | (33,208) | (2,028,522) | (27,338) |
Net Increase (Decrease)—Investor Shares | (236,479) | (3,093) | 422,009 | 5,155 |
Admiral Shares | | | | |
Issued | 1,123,526 | 7,996 | 1,557,799 | 10,982 |
Issued in Lieu of Cash Distributions | 235,956 | 2,191 | 334,798 | 2,381 |
Redeemed1 | (1,416,960) | (11,637) | (844,265) | (6,076) |
Net Increase (Decrease)—Admiral Shares | (57,478) | (1,450) | 1,048,332 | 7,287 |
G. In September 2006, the Financial Accounting Standards Board issued Statement of Financial Accounting Standards No. 157 (“FAS 157”), “Fair Value Measurements.” FAS 157 establishes a framework for measuring fair value and expands disclosures about fair value measurements in financial statements, effective for the fund’s current fiscal period.
The various inputs that may be used to determine the value of the fund’s investments are summarized in three broad levels. The inputs or methodologies used for valuing securities are not necessarily an indication of the risk associated with investing in those securities.
Level 1—Quoted prices in active markets for identical securities.
Level 2—Other significant observable inputs (including quoted prices for similar securities, interest rates, prepayment speeds, credit risk, etc.).
Level 3—Significant unobservable inputs (including the fund’s own assumptions used to determine the fair value of investments).
The following table summarizes the fund’s investments as of January 31, 2009, based on the inputs used to value them:
| Investments | Futures |
| in Securities | Contracts |
Valuation Inputs | ($000) | ($000) |
Level 1—Quoted prices | 6,446,615 | (12,612) |
Level 2—Other significant observable inputs | 908,952 | — |
Level 3—Significant unobservable inputs | — | — |
Total | 7,355,567 | (12,612) |
1 Net of redemption fees of $5,850,000 and $3,474,000 (fund totals).
25
Report of Independent Registered Public Accounting Firm
To the Trustees of Vanguard Specialized Funds and the Shareholders of Vanguard Energy Fund:
In our opinion, the accompanying statement of net assets and the related statements of operations and of changes in net assets and the financial highlights present fairly, in all material respects, the financial position of Vanguard Energy Fund (constituting a separate portfolio of Vanguard Specialized Funds, hereafter referred to as the “Fund”) at January 31, 2009, the results of its operations for the year then ended, the changes in its net assets for each of the two years in the period then ended and the financial highlights for each of the five years in the period then ended, in conformity with accounting principles generally accepted in the United States of America. These financial statements and financial highlights (hereafter referred to as “financial statements”) are the responsibility of the Fund’s management; our responsibility is to express an opinion on these financial statements based on our audits. We conducted our audits of these financial statements in accordance with the standards of the Public Company Accounting Oversight Board (United States). Those standards require that we plan and perform the audit to obtain reasonable assurance about whether the financial statements are free of material misstatement. An audit includes examining, on a test basis, evidence supporting the amounts and disclosures in the financial statements, assessing the accounting principles used and significant estimates made by management, and evaluating the overall financial statement presentation. We believe that our audits, which included confirmation of securities at January 31, 2009 by correspondence with the custodians and brokers, and by agreement to the underlying ownership records for Vanguard Market Liquidity Fund, provide a reasonable basis for our opinion.
PricewaterhouseCoopers LLP
Philadelphia, Pennsylvania
March 20, 2009
Special 2008 tax information (unaudited) for Vanguard Energy Fund |
This information for the fiscal year ended January 31, 2009, is included pursuant to provisions of the Internal Revenue Code.
The fund distributed $481,524,000 as capital gain dividends (from net long-term capital gains) to shareholders during the fiscal year.
The fund distributed $172,326,000 of qualified dividend income to shareholders during the fiscal year.
For corporate shareholders, 33.2% of investment income (dividend income plus short-term gains, if any) qualifies for the dividends-received deduction.
26
Your Fund’s After-Tax Returns
This table presents returns for your fund both before and after taxes. The after-tax returns are shown in two ways: (1) assuming that an investor owned the fund during the entire period and paid taxes on the fund’s distributions, and (2) assuming that an investor paid taxes on the fund’s distributions and sold all shares at the end of each period.
Calculations are based on the highest individual federal income tax and capital gains tax rates in effect at the times of the distributions and the hypothetical sales. State and local taxes were not considered. After-tax returns reflect any qualified dividend income, using actual prior-year figures and estimates for 2009. (In the example, returns after the sale of fund shares may be higher than those assuming no sale. This occurs when the sale would have produced a capital loss. The calculation assumes that the investor received a tax deduction for the loss.)
The table shows returns for Investor Shares only; returns for other share classes will differ. Please note that your actual after-tax returns will depend on your tax situation and may differ from those shown. Also note that if you own the fund in a tax-deferred account, such as an individual retirement account or a 401(k) plan, this information does not apply to you. Such accounts are not subject to current taxes.
Finally, keep in mind that a fund’s performance—whether before or after taxes—does not guarantee future results.
Average Annual Total Returns: Energy Fund Investor Shares1 | | | |
Periods Ended January 31, 2009 | | | |
| One | Five | Ten |
| Year | Years | Years |
Returns Before Taxes | –38.51% | 12.21% | 15.16% |
Returns After Taxes on Distributions | –39.15 | 11.35 | 14.05 |
Returns After Taxes on Distributions and Sale of Fund Shares | –23.95 | 10.78 | 13.37 |
1 Total returns do not reflect the 1% fee assessed on redemptions of shares held less than one year, nor do they include the account service fee that may be applicable to certain accounts with balances below $10,000.
27
About Your Fund’s Expenses
As a shareholder of the fund, you incur ongoing costs, which include costs for portfolio management, administrative services, and shareholder reports (like this one), among others. Operating expenses, which are deducted from a fund’s gross income, directly reduce the investment return of the fund.
A fund’s expenses are expressed as a percentage of its average net assets. This figure is known as the expense ratio. The following examples are intended to help you understand the ongoing costs (in dollars) of investing in your fund and to compare these costs with those of other mutual funds. The examples are based on an investment of $1,000 made at the beginning of the period shown and held for the entire period.
The accompanying table illustrates your fund’s costs in two ways:
• Based on actual fund return. This section helps you to estimate the actual expenses that you paid over the period. The “Ending Account Value” shown is derived from the fund’s actual return, and the third column shows the dollar amount that would have been paid by an investor who started with $1,000 in the fund. You may use the information here, together with the amount you invested, to estimate the expenses that you paid over the period.
To do so, simply divide your account value by $1,000 (for example, an $8,600 account value divided by $1,000 = 8.6), then multiply the result by the number given for your fund under the heading “Expenses Paid During Period.”
• Based on hypothetical 5% yearly return. This section is intended to help you compare your fund’s costs with those of other mutual funds. It assumes that the fund had a yearly return of 5% before expenses, but that the expense ratio is unchanged. In this case—because the return used is not the fund’s actual return—the results do not apply to your investment. The example is useful in making comparisons because the Securities and Exchange Commission requires all mutual funds to calculate expenses based on a 5% return. You can assess your fund’s costs by comparing this hypothetical example with the hypothetical examples that appear in shareholder reports of other funds.
Six Months Ended January 31, 2009 | | | |
| Beginning | Ending | Expenses |
| Account Value | Account Value | Paid During |
Energy Fund | 7/31/2008 | 1/31/2009 | Period1 |
Based on Actual Fund Return | | | |
Investor Shares | $1,000.00 | $565.64 | $1.30 |
Admiral Shares | 1,000.00 | 565.86 | 1.03 |
Based on Hypothetical 5% Yearly Return | | | |
Investor Shares | $1,000.00 | $1,023.54 | $1.68 |
Admiral Shares | 1,000.00 | 1,023.89 | 1.33 |
1 The calculations are based on expenses incurred in the most recent six-month period. The fund’s annualized six-month expense ratios for that period are 0.33% for Investor Shares and 0.26% for Admiral Shares. The dollar amounts shown as “Expenses Paid” are equal to the annualized expense ratio multiplied by the average account value over the period, multiplied by the number of days in the most recent six-month period, then divided by the number of days in the most recent 12-month period.
28
Note that the expenses shown in the table are meant to highlight and help you compare ongoing costs only and do not reflect transaction costs incurred by the fund for buying and selling securities. Further, the expenses do not include the 1% fee on redemptions of shares held for less than one year, nor do they include the account service fee described in the prospectus. If such fees were applied to your account, your costs would be higher. Your fund does not carry a “sales load.”
The calculations assume no shares were bought or sold during the period. Your actual costs may have been higher or lower, depending on the amount of your investment and the timing of any purchases or redemptions.
You can find more information about the fund’s expenses, including annual expense ratios, in the Financial Statements section of this report. For additional information on operating expenses and other shareholder costs, please refer to your fund’s current prospectus.
29
Glossary
Beta. A measure of the magnitude of a fund’s past share-price fluctuations in relation to the ups and downs of a given market index. The index is assigned a beta of 1.00. Compared with a given index, a fund with a beta of 1.20 typically would have seen its share price rise or fall by 12% when the index rose or fell by 10%. For this report, beta is based on returns over the past 36 months for both the fund and the index. Note that a fund’s beta should be reviewed in conjunction with its R-squared (see definition). The lower the R-squared, the less correlation there is between the fund and the index, and the less reliable beta is as an indicator of volatility.
Earnings Growth Rate. The average annual rate of growth in earnings over the past five years for the stocks now in a fund.
Equity Exposure. A measure that reflects a fund’s investments in stocks and stock futures. Any holdings in short-term reserves are excluded.
Expense Ratio. The percentage of a fund’s average net assets used to pay its annual administrative and advisory expenses. These expenses directly reduce returns to investors.
Foreign Holdings. The percentage of a fund represented by stocks or depositary receipts of companies based outside the United States.
Inception Date. The date on which the assets of a fund (or one of its share classes) are first invested in accordance with the fund’s investment objective. For funds with a subscription period, the inception date is the day after that period ends. Investment performance is measured from the inception date.
Median Market Cap. An indicator of the size of companies in which a fund invests; the midpoint of market capitalization (market price x shares outstanding) of a fund’s stocks, weighted by the proportion of the fund’s assets invested in each stock. Stocks representing half of the fund’s assets have market capitalizations above the median, and the rest are below it.
Price/Book Ratio. The share price of a stock divided by its net worth, or book value, per share. For a fund, the weighted average price/book ratio of the stocks it holds.
Price/Earnings Ratio. The ratio of a stock’s current price to its per-share earnings over the past year. For a fund, the weighted average P/E of the stocks it holds. P/E is an indicator of market expectations about corporate prospects; the higher the P/E, the greater the expectations for a company’s future growth.
R-Squared. A measure of how much of a fund’s past returns can be explained by the returns from the market in general, as measured by a given index. If a fund’s total returns were precisely synchronized with an index’s returns, its R-squared would be 1.00. If the fund’s returns bore no relationship to the index’s returns, its R-squared would be 0. For this report, R-squared is based on returns over the past 36 months for both the fund and the index.
Return on Equity. The annual average rate of return generated by a company during the past five years for each dollar of shareholder’s equity (net income divided by shareholder’s equity). For a fund, the weighted average return on equity for the companies whose stocks it holds.
Short-Term Reserves. The percentage of a fund invested in highly liquid, short-term securities that can be readily converted to cash.
30
Turnover Rate. An indication of the fund’s trading activity. Funds with high turnover rates incur higher transaction costs and may be more likely to distribute capital gains (which may be taxable to investors). The turnover rate excludes in-kind transactions, which have minimal impact on costs.
Yield. A fund’s 30-day SEC yield is derived using a formula specified by the U.S. Securities and Exchange Commission. Under the formula, data related to the fund’s security holdings in the previous 30 days are used to calculate the fund’s hypothetical net income for that period, which is then annualized and divided by the fund’s estimated average net assets over the calculation period. For the purposes of this calculation, a security’s income is based on its current market yield to maturity (in the case of bonds) or its projected dividend yield (for stocks). Because the SEC yield represents hypothetical annualized income, it will differ—at times significantly—from the fund’s actual experience. As a result, the fund’s income distributions may be higher or lower than implied by the SEC yield.
31
The People Who Govern Your Fund
The trustees of your mutual fund are there to see that the fund is operated and managed in your best interests since, as a shareholder, you are a part owner of the fund. Your fund’s trustees also serve on the board of directors of The Vanguard Group, Inc., which is owned by the Vanguard funds and provides services to them on an at-cost basis.
A majority of Vanguard’s board members are independent, meaning that they have no affiliation with Vanguard or the funds they oversee, apart from the sizable personal investments they have made as private individuals. The independent board members have distinguished backgrounds in business, academia, and public service. Each of the trustees and executive officers oversees 156 Vanguard funds.
The following table provides information for each trustee and executive officer of the fund. More information about the trustees is in the Statement of Additional Information, which can be obtained, without charge, by contacting Vanguard at 800-662-7447, or online at www.vanguard.com.
Chairman of the Board and Interested Trustee | Rajiv L. Gupta |
| Born 1945. Trustee Since December 2001.2 Principal |
John J. Brennan1 | Occupation(s) During the Past Five Years: Chairman, |
Born 1954. Trustee Since May 1987. Chairman of | President, and Chief Executive Officer of Rohm and |
the Board. Principal Occupation(s) During the Past Five | Haas Co. (chemicals); Board Member of the American |
Years: Chairman of the Board and Director/Trustee of | Chemistry Council; Director of Tyco International, Ltd. |
The Vanguard Group, Inc., and of each of the investment | (diversified manufacturing and services), since 2005. |
companies served by The Vanguard Group; Chief | |
Executive Officer and President of The Vanguard Group | |
and of each of the investment companies served by The | Amy Gutmann |
Vanguard Group (1996–2008). | Born 1949. Trustee Since June 2006. Principal |
| Occupation(s) During the Past Five Years: President of |
| the University of Pennsylvania since 2004; Professor in |
Independent Trustees | the School of Arts and Sciences, Annenberg School for |
| Communication, and Graduate School of Education of |
| the University of Pennsylvania since 2004; Provost |
Charles D. Ellis | (2001–2004) and Laurance S. Rockefeller Professor of |
Born 1937. Trustee Since January 2001. Principal | Politics and the University Center for Human Values |
Occupation(s) During the Past Five Years: Applecore | (1990–2004), Princeton University; Director of Carnegie |
Partners (pro bono ventures in education); Senior | Corporation of New York since 2005 and of Schuylkill |
Advisor to Greenwich Associates (international business | River Development Corporation and Greater Philadelphia |
strategy consulting); Successor Trustee of Yale University; | Chamber of Commerce since 2004; Trustee of the |
Overseer of the Stern School of Business at New York | National Constitution Center since 2007. |
University; Trustee of the Whitehead Institute for | |
Biomedical Research. | |
| JoAnn Heffernan Heisen |
| Born 1950. Trustee Since July 1998. Principal |
Emerson U. Fullwood | Occupation(s) During the Past Five Years: Retired |
Born 1948. Trustee Since January 2008. Principal | Corporate Vice President, Chief Global Diversity Officer, |
Occupation(s) During the Past Five Years: Retired | and Member of the Executive Committee of Johnson & |
Executive Chief Staff and Marketing Officer for | Johnson (pharmaceuticals/consumer products); Vice |
North America and Corporate Vice President of | President and Chief Information Officer (1997–2005) |
Xerox Corporation (photocopiers and printers); | of Johnson & Johnson; Director of the University |
Director of SPX Corporation (multi-industry | Medical Center at Princeton and Women’s Research |
manufacturing), of the United Way of Rochester, | and Education Institute. |
and of the Boy Scouts of America. | |
André F. Perold | F. William McNabb III1 | |
Born 1952. Trustee Since December 2004. Principal | Born 1957. Chief Executive Officer Since August 2008. |
Occupation(s) During the Past Five Years: George Gund | President Since March 2008. Principal Occupation(s) |
Professor of Finance and Banking, Senior Associate | During the Past Five Years: Chief Executive Officer, |
Dean, and Director of Faculty Recruiting, Harvard | Director, and President of The Vanguard Group, Inc., |
Business School; Director and Chairman of UNX, Inc. | since 2008; Chief Executive Officer and President of |
(equities trading firm); Chair of the Investment | each of the investment companies served by The |
Committee of HighVista Strategies LLC (private | Vanguard Group since 2008; Director of Vanguard |
investment firm) since 2005. | Marketing Corporation; Managing Director of The |
| Vanguard Group (1995–2008). |
| | |
Alfred M. Rankin, Jr. | | |
Born 1941. Trustee Since January 1993. Principal | Heidi Stam1 | |
Occupation(s) During the Past Five Years: Chairman, | Born 1956. Secretary Since July 2005. Principal |
President, Chief Executive Officer, and Director of | Occupation(s) During the Past Five Years: Managing |
NACCO Industries, Inc. (forklift trucks/housewares/ | Director of The Vanguard Group, Inc., since 2006; |
lignite); Director of Goodrich Corporation (industrial | General Counsel of The Vanguard Group since 2005; |
products/aircraft systems and services). | Secretary of The Vanguard Group and of each of the |
| investment companies served by The Vanguard Group |
| since 2005; Director and Senior Vice President of |
J. Lawrence Wilson | Vanguard Marketing Corporation since 2005; Principal |
Born 1936. Trustee Since April 1985. Principal | of The Vanguard Group (1997–2006). |
Occupation(s) During the Past Five Years: Retired | | |
Chairman and Chief Executive Officer of Rohm and | | |
Haas Co. (chemicals); Director of Cummins Inc. (diesel | Vanguard Senior Management Team |
engines) and AmerisourceBergen Corp. (pharmaceutical | | |
distribution); Trustee of Vanderbilt University and of | | |
Culver Educational Foundation. | R. Gregory Barton | Michael S. Miller |
| Mortimer J. Buckley | James M. Norris |
| Kathleen C. Gubanich | Glenn W. Reed |
Executive Officers | Paul A. Heller | George U. Sauter |
| | |
| | |
Thomas J. Higgins1 | Founder | |
Born 1957. Chief Financial Officer Since September | | |
2008. Principal Occupation(s) During the Past Five | | |
Years: Principal of The Vanguard Group, Inc.; Chief | John C. Bogle | |
Financial Officer of each of the investment companies | Chairman and Chief Executive Officer, 1974–1996 |
served by The Vanguard Group since 2008; Treasurer | | |
of each of the investment companies served by The | | |
Vanguard Group (1998–2008). | | |
| | |
| | |
Kathryn J. Hyatt1 | | |
Born 1955. Treasurer Since November 2008. Principal | | |
Occupation(s) During the Past Five Years: Principal of | | |
The Vanguard Group, Inc.; Treasurer of each of the | | |
investment companies served by The Vanguard | | |
Group since 2008; Assistant Treasurer of each of the | | |
investment companies served by The Vanguard Group | | |
(1988–2008). | | |
1 These individuals are “interested persons” as defined in the Investment Company Act of 1940.
2 December 2002 for Vanguard Equity Income Fund, Vanguard Growth Equity Fund, the Vanguard Municipal Bond Funds, and the Vanguard State Tax-Exempt Funds.
| 
|
| P.O. Box 2600 |
| Valley Forge, PA 19482-2600 |
Connect with Vanguard® > www.vanguard.com
Fund Information > 800-662-7447 | All comparative mutual fund data are from Lipper Inc. |
| or Morningstar, Inc., unless otherwise noted. |
Direct Investor Account Services > 800-662-2739 | |
| |
Institutional Investor Services > 800-523-1036 | You can obtain a free copy of Vanguard’s proxy voting |
| guidelines by visiting our website, www.vanguard.com, |
Text Telephone for People | and searching for “proxy voting guidelines,” or by |
With Hearing Impairment > 800-952-3335 | calling Vanguard at 800-662-2739. The guidelines are |
| also available from the SEC’s website, www.sec.gov. |
| In addition, you may obtain a free report on how your |
| fund voted the proxies for securities it owned during |
This material may be used in conjunction | the 12 months ended June 30. To get the report, visit |
with the offering of shares of any Vanguard | either www.vanguard.com or www.sec.gov. |
fund only if preceded or accompanied by | |
the fund’s current prospectus. | |
| You can review and copy information about your fund |
| at the SEC’s Public Reference Room in Washington, D.C. |
CFA® is a trademark owned by CFA Institute. | To find out more about this public service, call the SEC |
The funds or securities referred to herein are not | at 202-551-8090. Information about your fund is also |
bears no liability with respect to any such funds or | available on the SEC’s website, and you can receive |
securities. For any such funds or securities, the | copies of this information, for a fee, by sending a |
prospectus or the Statement of Additional Information | request in either of two ways: via e-mail addressed to |
contains a more detailed description of the limited | publicinfo@sec.gov or via regular mail addressed to the |
relationship MSCI has with The Vanguard Group and | |
any related funds. | |
| Public Reference Section, Securities and Exchange |
| Commission, Washington, DC 20549-0102. |
Russell is a trademark of The Frank Russell Company. | |
| |
| |
| |
| |
| |
| |
| |
| |
| |
| |
| |
| © 2009 The Vanguard Group, Inc. |
| All rights reserved. |
| Vanguard Marketing Corporation, Distributor. |
| |
| Q510 032009 |

> | For the fiscal year ended January 31, 2009, Vanguard Precious Metals and Mining Fund returned about –60%, trailing the –51% return of its benchmark index. |
> | The fund’s returns suffered primarily because of the bursting of a worldwide bubble in commodity prices and the spreading of a global economic slump and credit crunch. |
> | About one-third of the fund’s negative return was attributable to adverse developments in two metals and mining producers: France’s Eramet and the United Kingdom’s Lonmin. |
Contents | |
| |
Your Fund’s Total Returns | 1 |
President’s Letter | 2 |
Advisor’s Report | 7 |
Fund Profile | 10 |
Performance Summary | 11 |
Financial Statements | 13 |
Your Fund’s After-Tax Returns | 24 |
About Your Fund’s Expenses | 25 |
Glossary | 27 |
Please note: The opinions expressed in this report are just that—informed opinions. They should not be considered promises or advice. Also, please keep in mind that the information and opinions cover the period through the date on the front of this report. Of course, the risks of investing in your fund are spelled out in the prospectus.
Your Fund’s Total Returns
Fiscal Year Ended January 31, 2009 | | |
| Ticker | Total |
| Symbol | Returns |
Vanguard Precious Metals and Mining Fund | VGPMX | –60.16% |
S&P/Citigroup Custom Precious Metals and Mining Index | | –50.69 |
Average Gold-Oriented Fund1 | | –33.07 |
Your Fund’s Performance at a Glance | | | | |
January 31, 2008–January 31, 2009 | | | | |
| | | Distributions Per Share |
| Starting | Ending | Income | Capital |
| Share Price | Share Price | Dividends | Gains |
Vanguard Precious Metals and Mining Fund | $33.45 | $10.74 | $0.763 | $2.751 |
1 Derived from data provided by Lipper Inc.
1

President’s Letter
Dear Shareholder,
The just-ended fiscal year was unprecedented for Vanguard Precious Metals and Mining Fund. The fund returned –60.16% for the 12 months ended January 31, 2009, lagging its benchmark’s –50.69%. Obviously, the Precious Metals and Mining Fund’s performance was a disappointment, especially since it followed nine straight years of positive and, in all but one year, double-digit, returns.
The fund’s results largely reflected a hostile economic and financial environment to an extent unprecedented since the Depression. For the 12 months, the U.S. and international stock markets fell precipitously, the credit markets seized up, a commodities bubble collapsed, and an economic slump spread worldwide.
The Precious Metals and Mining Fund holds a relatively small number of stocks (36 as of fiscal year-end), a concentration that can result in great volatility—positive and negative—from year to year. Recall that for fiscal-year 2006, just three years ago, the fund rose 70.19%. Indeed, the fund’s strong performance that year attracted a groundswell of new cash from investors. A continued infusion of cash would have made it difficult for the fund’s advisor—M&G Investment
2
Management—to carry out its strategy, so we closed the fund shortly after it posted that near-record return. (This was the second closure since the fund’s inception.) The fund reopened to investors on October 31, 2008, with a 1% redemption fee for shares held less than a year. The minimum initial investment for all accounts remained at $10,000.
Note: If you hold the fund in a taxable account, you may wish to refer to our report on after-tax performance later in this report.
Stocks fell worldwide as the credit crisis deepened
The 12 months ended January 31, 2009, was one of the worst ever one-year spans for stocks. The broad U.S. stock market tumbled, returning –39%; international stocks registered –45%. The trouble stemmed from the financial sector, where some of the world’s largest institutions imploded, largely because of their exposure to low-quality mortgages in the United States. The effects of the credit crisis were wide and deep, with virtually no country or industry sector spared.
Market Barometer | |
| Average Annual Total Returns |
| Periods Ended January 31, 2009 |
| One Year | Three Years | Five Years |
Stocks | | | |
Russell 1000 Index (Large-caps) | –39.04% | –12.03% | –4.05% |
Russell 2000 Index (Small-caps) | –36.84 | –14.31 | –4.06 |
Dow Jones Wilshire 5000 Index (Entire market) | –38.69 | –12.03 | –3.75 |
MSCI All Country World Index ex USA (International) | –44.72 | –11.41 | 0.79 |
| | | |
Bonds | | | |
Barclays Capital U.S. Aggregate Bond Index (Broad taxable market) | 2.59% | 5.19% | 4.30% |
Barclays Capital Municipal Bond Index | –0.16 | 3.00 | 3.33 |
Citigroup 3-Month Treasury Bill Index | 1.52 | 3.65 | 3.08 |
| | | |
CPI | | | |
Consumer Price Index | 0.03% | 2.11% | 2.66% |
3
The stock market struggled through the first part of the fiscal year, then declined sharply in September, October, and November. December offered a brief reprieve before the market fell again in January.
In a flight to safety, investors chose low-yield Treasuries
As economic uncertainty and market volatility grew more pronounced in the second half of the year, investors sought the relative safety of short-term government issues. This drove prices for Treasuries higher, and their yields lower. In some cases, investors were willing to accept very low—or even slightly negative—yields for the short-term safekeeping of their assets.
At the same time, the Federal Reserve Board steered short-term interest rates lower in its ongoing campaign to encourage lending. During your fund’s fiscal year, the target for the federal funds rate dropped from 3.00% to a range of 0%–0.25%.
For the full 12-month period, the broad taxable bond market returned 2.59%, and tax-exempt bonds returned –0.16%—somewhat pedestrian (if disappointing) returns that masked a year of uncommon volatility for bonds.
The fund’s second half weighed down the full year
When we last reported to you, the Precious Metals and Mining Fund had returned close to –2% for the fiscal half-
Expense Ratios1 | | |
Your Fund Compared With Its Peer Group | | |
| | Average |
| | Gold-Oriented |
| Fund | Fund |
Precious Metals and Mining Fund | 0.28% | 1.40% |
1 The fund expense ratio shown is from the prospectus dated May 29, 2008. For the fiscal year ended January 31, 2009, the fund’s expense ratio was 0.30%. The peer-group expense ratio is derived from data provided by Lipper Inc. and captures information through year-end 2008.
4
year ended July 31, 2008. That was about the time that a bubble in commodity prices—including those of base and precious metals—was beginning to burst, aggravated by the worsening global economic downturn and credit crunch. In this environment, companies in the fund’s portfolio faced decelerating demand and pressure on profit margins, leading to a second six months for the fund that was wildly different from the first six: For the second half of the fiscal year, the fund returned about –60%.
Two of the fund’s top-ten holdings—Eramet (returning –68%) and Lonmin (–78%)—accounted for about one-third of its negative return. Eramet, a French producer of nickel, manganese, and alloy products that has mines in New Caledonia and Gabon, suffered from squeezed profit margins as prices for nickel and stainless steel plummeted during the commodities meltdown. Lonmin, a U.K. company that produces platinum in South Africa, had to halt expansion and reduce its workforce as a result of a sharp decline in the price of platinum.
Lesser contributors to the fund’s negative return were Johnson Matthey, a U.K.-based company whose operations include platinum processing for use in catalytic converters for the automotive industry; Harry Winston Diamond, a Canadian diamond miner and retailer; and Sims Metal Management, an Australian steel recycler.
Total Returns | |
Ten Years Ended January 31, 2009 | |
| Average |
| Annual Return |
Precious Metals and Mining Fund | 13.07% |
Spliced Precious Metals and Mining Index1 | 12.45 |
Average Gold-Oriented Fund2 | 14.20 |
The figures shown represent past performance, which is not a guarantee of future results. (Current performance may be lower or higher than the performance data cited. For performance data current to the most recent month-end, visit our website at www.vanguard.com/performance.) Note, too, that both investment returns and principal value can fluctuate widely, so an investor’s shares, when sold, could be worth more or less than their original cost.
1 S&P/Citigroup World Equity Gold Index through June 30, 2005; S&P/Citigroup Custom Precious Metals and Mining Index thereafter.
2 Derived from data provided by Lipper Inc.
5
Gold prices escaped the commodity price tailspin. The fund’s gold-industry companies accounted for about 26% of its assets, on average, during the fiscal year. They produced a small positive contribution to return, largely on the strength of Franco-Nevada, a Canadian royalty company that focuses on gold properties. Note that the fund’s benchmark index is much more heavily weighted toward gold, which explains, in part, why the index’s decline was less severe.
Don’t lose sight of the long term during short-term ups and downs
The latest fiscal year has been an exceedingly tough one for shareholders of the Precious Metals and Mining Fund. (For more perspective, see the table on page 5 highlighting the fund’s performance for the past decade.) Clearly, the fund is volatile, with results that can greatly surpass or fall below the returns generated by stocks in general. This is a consequence of the fund’s concentrated holdings in companies that do business in the volatile metals markets. As shown in the table, for the ten years ended January 31, 2009, the fund had an average annual return of 13.07%, ahead of the benchmark’s 12.45%.
These returns stem from a carefully selected set of stocks. The portfolio manager searches the globe for stocks of returns-focused companies that have unrecognized value. The advisor employs a “bottom-up” approach, which involves analyzing the nuts and bolts of a company’s operations without regard to its weighting in the fund’s benchmark, an approach the fund has followed since its 1984 founding, 25 years ago this May.
Diversification and balance still the way to go
Despite fiscal 2009’s disappointing results, your fund’s long-term record reveals that focusing on one market segment can be highly rewarding. However, we encourage investors not to narrow their investment horizons, no matter how tempting this may be. A fund like the Precious Metals and Mining Fund that provides you with low-cost exposure to a distinctive, yet volatile, slice of the overall market, should only play a supporting, but not a foundational, role in a balanced, diversified portfolio consistent with your long-term goals and risk tolerance.
Of course, for more than a year the global financial markets have been reeling from an unnerving confluence of events, and portfolios that were balanced and diversified suffered along with almost everything else. But our experience suggests that these time-tested fundamentals—plus low costs—can help put investors in a better position to benefit from the eventual recovery in financial markets.
Thank you for entrusting your assets to Vanguard.
Sincerely,

F. William McNabb III
President and Chief Executive Officer
February 13, 2009
6
Advisor’s Report
Vanguard Precious Metals and Mining Fund returned a disappointing –60% during the 12 months ended January 31, 2009, a record decline for the fund. The fund lagged its customized benchmark index, which returned about –51%, and the average gold-oriented fund, which returned less than –33%.
Contributions, negative and positive
In spite of high levels of volatility, the price of gold ultimately changed very little over our fiscal year. During the period, the price fluctuated from a peak above $1,000 per ounce in March to a low of $712 in November. But, having started the year at $925, the price ended at $928 on January 31. The key factor in this resilience was demand from investors seeking a safe haven from the turmoil affecting almost every other asset class. They kept the price up despite falling jewelry demand, deteriorating supply-side dynamics, and a breakdown in the normal inverse relationship between the price of the metal and the U.S. dollar.
By contrast, the prices of many other metals and minerals, which had remained robust until the summer, fell sharply because of slowing demand from major consumers of commodities, a decline that was compounded by outflows of speculative money from the sector. In tandem with these trends, mining-group stocks performed well during the first half of the year, but then suffered sharp share-price declines. Gold equities, however, remained relatively resilient.
Against this backdrop, the fund’s performance was hurt notably by its significant exposure to platinum producers at the expense of gold producers. This position, which has been successful over the longer term, proved particularly costly during the October–November period, when gold stocks held up while platinum stocks declined sharply. Investors withdrew from platinum largely because of concerns over reduced demand for the metal from the automotive industry. As a result, the fund’s holdings in U.K.-listed platinum producer Lonmin and South African producers Impala Platinum and Anglo Platinum detracted from performance.
Although these declines were painful, we continue to have a preference for platinum producers over gold producers, based on factors such as quality of assets, management ability, focus on returns, and valuations. Unfortunately, in recent months these fundamental factors have been subordinated to other considerations in investors’ minds, an imbalance that we believe will correct itself over time.
French nickel producer Eramet reversed its strong performance of recent years, declining sharply as a result of falling demand for both nickel and stainless steel. For Harry Winston Diamond, a recession-induced slowdown in discretionary consumer spending overshadowed the value of its Canadian diamond mine and the compelling long-term fundamentals for the diamond industry.
7
A number of other metal and mining holdings suffered because of their exposure to the economic cycle, including Canadian nickel and coal producer Sherritt International and Australian producer BlueScope Steel. We believe that these companies’ assets have become increasingly undervalued and that all are well-positioned to capitalize on current conditions as their industries undergo consolidation. Finally, currency movements hurt our performance during the period, with the fund suffering from its significant exposures to the Australian dollar, South African rand, and U.K. pound, all of which weakened against the U.S. dollar.
On the positive side, Canadian gold-royalty company Franco-Nevada strongly aided performance thanks to its well-diversified, long-term royalty streams, strong balance sheet, and positive leverage to gold prices. Our recently established holding in Newmont Mining, a large North American gold producer, helped returns because of its new management’s focus on turning the business around.
Australian mineral-sands producer Iluka Resources was one of the few mining companies to experience growth in its markets over the year, boosted by strengthening Chinese demand for mineral sands with numerous industrial uses. Our formerly substantial holdings in coal producers overall proved beneficial, with U.S. producers Arch Coal and Patriot Coal and Australian miner Centennial Coal all helping our returns before exiting the portfolio.
Purchases and sales
We continued to focus on building up exposure to metals and minerals companies with returns-focused management and exposure to strategically important materials. We made significant additions to our stakes in selected gold producers, such as Newmont Mining and Franco-Nevada, although we remain concerned about expensive valuations and poor quality management in much of the gold sector.
We also added to existing positions in cases where negative sentiment had, in our view, pushed share prices below fair valuation levels. Examples included U.K.-listed platinum groups Lonmin and Johnson Matthey, French industrial minerals group Imerys, and Australian producer BlueScope Steel.
Our most significant sales were from the fund’s coal holdings, notably the elimination of U.S. producers CONSOL Energy, Patriot Coal, and Arch Coal and a substantial reduction in Peabody Energy. In addition, we lessened the fund’s exposure to a number of holdings where we believe profitability will face increasing pressure. For example, we closed our positions in U.S. chemicals producer FMC (following strong gains) and Norwegian aluminium producer Norsk Hydro, and we substantially reduced the fund’s holdings in Eramet.
8
A look ahead
The past year was an unparalleled period for investors in metals and minerals companies. Short-term demand has fallen sharply and volatility has risen dramatically, partly because of the considerable speculative interest leaving the sector. It is encouraging, however, to see that the mining industry has reacted to the slowdown in demand by cutting excess capacity, while the industry’s ongoing consolidation has led to more rational actions and a greater focus on maintaining profitability. We continue to believe that demand for commodities will be supported over the long term by infrastructure expenditure worldwide and rising urbanization in emerging markets.
As a consequence, our long-term outlook for commodities in general remains positive, although the shorter-term picture is opaque. Turbulent developments in the metals and mining sectors have created a broad range of compelling long-term valuation opportunities, such that Vanguard and M&G Investment Management decided it was appropriate to reopen the fund to new investors.
We remain convinced of the importance of sticking to long-term investment principles and focusing on industry and company fundamentals. We shall continue to invest in well-capitalized, trustworthy companies with strategically important assets that are not properly appreciated by investors. It follows that we are avoiding companies in disadvantaged industries, those with unsound balance sheets, and those whose managements do not run their businesses in the interest of shareholders.
Portfolio Managers:
Graham E. French,
Matthew Vaight, UKSIP
M&G Investment Management Ltd.
February 23, 2009
9
Precious Metals and Mining Fund
Fund Profile
As of January 31, 2009
Portfolio Characteristics | | |
| | Comparative | Broad |
| Fund | Index1 | Index2 |
Number of Stocks | 36 | 342 | 4,554 |
Median Market Cap | $2.0B | $9.9B | $24.3B |
Price/Earnings Ratio | 10.0x | 9.8x | 11.7x |
Price/Book Ratio | 1.3x | 1.7x | 1.6x |
Return on Equity | 15.5% | 3.0% | 2.9% |
Earnings Growth Rate | 14.0% | 20.8% | 21.1% |
Foreign Holdings | 83.0% | 36.2% | 18.3% |
Turnover Rate | 22% | — | — |
Expense Ratio | | | |
(1/31/2008)3 | 0.28% | — | — |
Short-Term Reserves | 1.0% | — | — |
Market Diversification (% of equity exposure) |
| |
United Kingdom | 20.8% |
Canada | 19.7 |
United States | 16.2 |
Australia | 16.0 |
France | 15.2 |
South Africa | 10.8 |
Peru | 0.9 |
Indonesia | 0.3 |
Papua New Guinea | 0.1 |
Volatility Measures4 | |
| Fund Versus | Fund Versus |
| Comparative Index1 | Broad Index2 |
R-Squared | 0.87 | 0.56 |
Beta | 0.98 | 1.70 |
Ten Largest Holdings5 (% of total net assets) |
| |
Franco-Nevada Corp. | 10.4% |
Johnson Matthey PLC | 9.8 |
Imerys SA | 8.2 |
Eramet SLN | 6.9 |
Impala Platinum Holdings Ltd. ADR | 6.5 |
Lonmin PLC | 6.2 |
Iluka Resources Ltd. | 6.0 |
Newmont Mining Corp. (Holding Co.) | 5.7 |
Sims Metal Management Ltd. | 5.1 |
Schnitzer Steel Industries, Inc. Class A | 4.4 |
Top Ten | 69.2% |
1 S&P/Citigroup Custom Precious Metals and Mining Index.
2 Dow Jones Wilshire 5000 Index.
3 The expense ratio shown is from the prospectus dated May 29, 2008. For the fiscal year ended January 31, 2009, the expense ratio was 0.30%.
4 For an explanation of R-squared, beta, and other terms used here, see the Glossary.
5 The holdings listed exclude any temporary cash investments and equity index products.
10
Precious Metals and Mining Fund
Performance Summary
All of the returns in this report represent past performance, which is not a guarantee of future results that may be achieved by the fund. (Current performance may be lower or higher than the performance data cited. For performance data current to the most recent month-end, visit our website at www.vanguard.com/performance.) Note, too, that both investment returns and principal value can fluctuate widely, so an investor’s shares, when sold, could be worth more or less than their original cost. The returns shown do not reflect taxes that a shareholder would pay on fund distributions or on the sale of fund shares.
Cumulative Performance: January 31, 1999–January 31, 2009
Initial Investment of $10,000
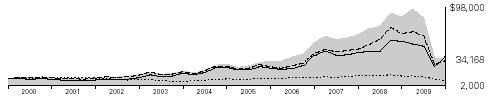
| | Average Annual Total Returns | Final Value |
| Periods Ended January 31, 2009 | of a $10,000 |
| One Year | Five Years | Ten Years | Investment |
Precious Metals and Mining Fund1 | –60.16% | 4.03% | 13.07% | $34,168 |
Dow Jones Wilshire 5000 Index | –38.69 | –3.75 | –1.83 | 8,317 |
Spliced Precious Metals and Mining Index2 | –50.69 | 4.82 | 12.45 | 32,340 |
Average Gold-Oriented Fund3 | –33.07 | 9.21 | 14.20 | 37,738 |
1 Total return figures do not reflect the 1% fee assessed on redemptions of shares held for less than one year, nor do they include the account service fee that may be applicable to certain accounts with balances below $10,000.
2 S&P/Citigroup World Equity Gold Index through June 30, 2005; S&P/Citigroup Custom Precious Metals and Mining Index thereafter.
3 Derived from data provided by Lipper Inc.
11
Precious Metals and Mining Fund
Fiscal-Year Total Returns (%): January 31, 1999–January 31, 2009
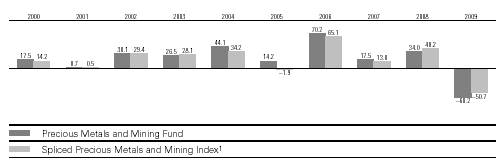
Average Annual Total Returns: Periods Ended December 31, 2008
This table presents average annual total returns through the latest calendar quarter—rather than through the end of the fiscal period. Securities and Exchange Commission rules require that we provide this information.
| Inception Date | One Year | Five Years | Ten Years |
Precious Metals and Mining Fund2 | 5/23/1984 | –56.02% | 4.56% | 14.14% |
1 S&P/Citigroup World Equity Gold Index through June 30, 2005; S&P/Citigroup Custom Precious Metals and Mining Index thereafter.
2 Total return figures do not reflect the 1% fee assessed on redemptions of shares held for less than one year, nor do they include the account service fee that may be applicable to certain accounts with balances below $10,000.
Note: See Financial Highlights table for dividend and capital gains information.
12
Precious Metals and Mining Fund
Financial Statements
Statement of Net Assets
As of January 31, 2009
The fund provides a complete list of its holdings four times in each fiscal year, at the quarter-ends. For the second and fourth fiscal quarters, the lists appear in the fund’s semiannual and annual reports to shareholders. For the first and third fiscal quarters, the fund files the lists with the Securities and Exchange Commission on Form N-Q. Shareholders can look up the fund’s Forms N-Q on the SEC’s website at www.sec.gov. Forms N-Q may also be reviewed and copied at the SEC’s Public Reference Room (see the back cover of this report for further information).
| | | Market |
| | | Value• |
| | Shares | ($000) |
Common Stocks (99.1%) | | |
Australia (15.9%) | | |
*,1 | Iluka Resources Ltd. | 37,325,000 | 98,933 |
| Sims Metal | | |
| Management Ltd. | 7,900,000 | 83,328 |
| BlueScope Steel Ltd. | 18,608,217 | 40,903 |
*,^,1 | St. Barbara Ltd. | 119,665,600 | 23,056 |
| BHP Billiton Ltd. | 800,000 | 14,835 |
* | MIL Resources, Ltd. | 1,678,671 | 20 |
| | | 261,075 |
Canada (19.5%) | | |
1 | Franco-Nevada Corp. | 8,250,000 | 171,223 |
*,1 | Centerra Gold Inc. | 14,365,000 | 61,150 |
1 | Harry Winston | | |
| Diamond Corp. | 7,700,000 | 30,643 |
| Sherritt | | |
| International Corp. | 10,825,000 | 23,570 |
| Barrick Gold Corp. | 450,000 | 16,932 |
* | First Quantum | | |
| Minerals Ltd. | 675,000 | 12,006 |
1,2 | Harry Winston | | |
| Diamond Corp. | | |
| Private Placement | 700,000 | 2,646 |
*,1 | Claude Resources, Inc. | 5,150,000 | 2,524 |
| | | 320,694 |
France (15.0%) | | |
1 | Imerys SA | 3,380,000 | 134,204 |
| Eramet SLN | 716,626 | 113,141 |
| | | 247,345 |
Indonesia (0.3%) | | |
| PT International | | |
| Nickel Indonesia Tbk | 22,500,000 | 4,782 |
| | | |
Papua New Guinea (0.1%) | | |
* | Bougainville Copper Ltd. | 2,000,000 | 878 |
| | | Market |
| | | Value• |
| | Shares | ($000) |
Peru (0.9%) | | |
| Compania de | | |
| Minas Buenaventura | | |
| SA ADR | 800,000 | 15,072 |
| | | |
South Africa (10.6%) | | |
| Impala Platinum | | |
| Holdings Ltd. ADR | 9,350,000 | 107,017 |
| Anglo Platinum Ltd. ADR | 1,200,000 | 49,133 |
| Northam Platinum Ltd. | 11,200,000 | 18,918 |
| | | 175,068 |
United Kingdom (20.7%) | | |
1 | Johnson Matthey PLC | 11,450,000 | 160,598 |
1 | Lonmin PLC | 8,175,000 | 101,515 |
1 | Peter Hambro Mining | | |
| PLC | 6,900,000 | 55,203 |
* | Hochschild Mining PLC | 7,150,000 | 15,346 |
* | Gem Diamonds Ltd. | 1,800,000 | 5,755 |
* | Kenmare Resources PLC | 4,550,000 | 611 |
* | Gemfields PLC | 3,333,333 | 254 |
* | Mwana Africa PLC | 3,180,219 | 174 |
* | Zambezi Resources Ltd. | 4,895,833 | 89 |
| | | 339,545 |
United States (16.1%) | | |
| Newmont Mining Corp. | | |
| (Holding Co.) | 2,349,815 | 93,476 |
| Schnitzer Steel | | |
| Industries, Inc. Class A | 1,850,000 | 72,649 |
1 | Minerals | | |
| Technologies, Inc. | 1,336,514 | 50,534 |
1 | AMCOL | | |
| International Corp. | 3,100,000 | 44,919 |
| Peabody Energy Corp. | 100,000 | 2,500 |
| | | 264,078 |
Total Common Stocks | | |
(Cost $2,896,089) | | 1,628,537 |
13
Precious Metals and Mining Fund
| | Market |
| | Value• |
| Shares | ($000) |
Precious Metals (0.1%) | | |
* Platinum Bullion | | |
(In Troy Ounces) | 2,009 | 1,983 |
Total Precious Metals | | |
(Cost $1,212) | | 1,983 |
Temporary Cash Investment (2.0%) | | |
3,4 Vanguard Market | | |
Liquidity Fund, 0.780% | | |
(Cost $32,716) | 32,716,042 | 32,716 |
Total Investments (101.2%) | | |
(Cost $2,930,017) | | 1,663,236 |
Other Assets and Liabilities—Net (–1.2%) | | (19,287) |
Net Assets (100%) | | |
Applicable to 153,087,331 outstanding | | |
$.001 par value shares of beneficial | | |
interest (unlimited authorization) | | 1,643,949 |
Net Asset Value Per Share | | $10.74 |
| | |
Statement of Assets and Liabilities | | |
Assets | | |
Investments in Securities, at Value | | 1,663,236 |
Receivables for Capital Shares Issued | | 3,233 |
Other Assets | | 7,872 |
Total Assets | | 1,674,341 |
Liabilities | | |
Payables for Investment | | |
Securities Purchased | | 15,375 |
Payables for Capital Shares Redeemed | | 2,539 |
Security Lending Collateral | | |
Payable to Brokers | | 2,146 |
Other Liabilities | | 10,332 |
Total Liabilities | | 30,392 |
Net Assets | | 1,643,949 |
At January 31, 2009, net assists consisted of: |
| Amount |
| ($000) |
Paid-in Capital | 2,972,339 |
Overdistributed Net Investment Income | (36,107) |
Overdistributed Net Realized Gains | (25,507) |
Unrealized Appreciation (Depreciation) | |
Investment Securities | (1,266,781) |
Foreign Currencies | 5 |
Net Assets | 1,643,949 |
• | See Note A in Notes to Financial Statements. |
* | Non-income-producing security. |
^ | Part of security position is on loan to broker-dealers. The total value of securities on loan is $1,691,000. |
1 Considered an affiliated company of the fund as the fund owns more than 5% of the outstanding voting securities of such company.
2 Restricted security represents 0.2% of net assets.
3 Affiliated money market fund available only to Vanguard funds and certain trusts and accounts managed by Vanguard. Rate shown is the 7-day yield.
4 Includes $2,146,000 of collateral received for securities on loan.
ADR—American Depositary Receipt.
See accompanying Notes, which are an integral part of the Financial Statements.
14
Precious Metals and Mining Fund
Statement of Operations
| Year Ended |
| January 31, 2009 |
| ($000) |
Investment Income | |
Income | |
Dividends1,2 | 90,882 |
Interest2 | 1,034 |
Security Lending | 2,122 |
Total Income | 94,038 |
Expenses | |
Investment Advisory Fees—Note B | |
Basic Fee | 4,759 |
Performance Adjustment | 76 |
The Vanguard Group—Note C | |
Management and Administrative | 5,305 |
Marketing and Distribution | 821 |
Custodian Fees | 553 |
Auditing Fees | 21 |
Shareholders’ Reports | 54 |
Trustees’ Fees and Expenses | 6 |
Total Expenses | 11,595 |
Net Investment Income | 82,443 |
Realized Net Gain (Loss) | |
Investment Securities Sold2 | 287,005 |
Foreign Currencies | (2,740) |
Realized Net Gain (Loss) | 284,265 |
Change in Unrealized Appreciation (Depreciation) | |
Investment Securities | (3,024,201) |
Foreign Currencies | (75) |
Change in Unrealized Appreciation (Depreciation) | (3,024,276) |
Net Increase (Decrease) in Net Assets Resulting from Operations | (2,657,568) |
1 Dividends are net of foreign withholding taxes of $2,957,000.
2 Dividend income, interest income, and realized net gain (loss) from affiliated companies of the fund were $33,533,000, $996,000, and $23,433,000, respectively.
See accompanying Notes, which are an integral part of the Financial Statements.
15
Precious Metals and Mining Fund
Statement of Changes in Net Assets
| Year Ended January 31, |
| 2009 | 2008 |
| ($000) | ($000) |
Increase (Decrease) in Net Assets | | |
Operations | | |
Net Investment Income | 82,443 | 110,391 |
Realized Net Gain (Loss) | 284,265 | 573,391 |
Change in Unrealized Appreciation (Depreciation) | (3,024,276) | 449,410 |
Net Increase (Decrease) in Net Assets Resulting from Operations | (2,657,568) | 1,133,192 |
Distributions | | |
Net Investment Income | (99,293) | (83,075) |
Realized Capital Gain1 | (361,426) | (466,982) |
Total Distributions | (460,719) | (550,057) |
Capital Share Transactions | | |
Issued | 841,029 | 783,925 |
Issued in Lieu of Cash Distributions | 423,318 | 507,139 |
Redeemed2 | (1,137,039) | (682,805) |
Net Increase (Decrease) from Capital Share Transactions | 127,308 | 608,259 |
Total Increase (Decrease) | (2,990,979) | 1,191,394 |
Net Assets | | |
Beginning of Period | 4,634,928 | 3,443,534 |
End of Period3 | 1,643,949 | 4,634,928 |
1 Includes fiscal 2009 and 2008 short-term gain distributions totaling $2,529,000 and $41,392,000, respectively. Short-term gain distributions are treated as ordinary income dividends for tax purposes.
2 Net of redemption fees for fiscal 2009 and 2008 of $2,019,000 and $739,000, respectively.
3 Net Assets—End of Period includes undistributed (overdistributed) net investment income of ($36,107,000) and ($7,025,000).
See accompanying Notes, which are an integral part of the Financial Statements.
16
Precious Metals and Mining Fund
Financial Highlights
For a Share Outstanding | Year Ended January 31, |
Throughout Each Period | 2009 | 2008 | 2007 | 2006 | 2005 |
Net Asset Value, Beginning of Period | $33.45 | $28.64 | $27.08 | $16.46 | $15.29 |
Investment Operations | | | | | |
Net Investment Income | .653 | .9001 | .560 | .3372 | .1852 |
Net Realized and Unrealized Gain (Loss) | | | | | |
on Investments3 | (19.849) | 8.362 | 4.027 | 11.080 | 1.988 |
Total from Investment Operations | (19.196) | 9.262 | 4.587 | 11.417 | 2.173 |
Distributions | | | | | |
Dividends from Net Investment Income | (.763) | (.670) | (.490) | (.240) | (.144) |
Distributions from Realized Capital Gains | (2.751) | (3.782) | (2.537) | (.557) | (.859) |
Total Distributions | (3.514) | (4.452) | (3.027) | (.797) | (1.003) |
Net Asset Value, End of Period | $10.74 | $33.45 | $28.64 | $27.08 | $16.46 |
| | | | | |
Total Return4 | –60.16% | 33.97% | 17.48% | 70.19% | 14.20% |
| | | | | |
Ratios/Supplemental Data | | | | | |
Net Assets, End of Period (Millions) | $1,644 | $4,635 | $3,444 | $3,297 | $921 |
Ratio of Total Expenses to | | | | | |
Average Net Assets | 0.30%5 | 0.28%5 | 0.35%5 | 0.40% | 0.48% |
Ratio of Net Investment Income to | | | | | |
Average Net Assets | 2.17% | 2.70%1 | 1.88% | 1.68% | 1.32% |
Portfolio Turnover Rate | 22% | 29% | 24% | 20% | 36% |
1 Net investment income per share and the ratio of net investment income to average net assets include $0.190 and 0.65%, respectively, resulting from a special dividend from Centennial Coal Co., Ltd., in January 2008.
2 Calculated based on average shares outstanding.
3 Includes increases from redemption fees of $.01, $.00, $.03, $.01, and $.01.
4 Total returns do not reflect the 1% fee assessed on redemptions of shares held for less than one year, nor do they include the account service fee that may be applicable to certain accounts with balances below $10,000.
5 Includes performance-based investment advisory fee increases (decreases) of 0.00%, (0.01%), and 0.01%.
See accompanying Notes, which are an integral part of the Financial Statements.
17
Precious Metals and Mining Fund
Notes to Financial Statements
Vanguard Precious Metals and Mining Fund is registered under the Investment Company Act of 1940 as an open-end investment company, or mutual fund. The fund invests in securities of foreign issuers, which may subject it to investment risks not normally associated with investing in securities of United States corporations.
A. The following significant accounting policies conform to generally accepted accounting principles for U.S. mutual funds. The fund consistently follows such policies in preparing its financial statements.
1. Security Valuation: Securities are valued as of the close of trading on the New York Stock Exchange (generally 4 p.m., Eastern time) on the valuation date. Equity securities are valued at the latest quoted sales prices or official closing prices taken from the primary market in which each security trades; such securities not traded on the valuation date are valued at the mean of the latest quoted bid and asked prices. Securities for which market quotations are not readily available, or whose values have been affected by events occurring before the fund’s pricing time but after the close of the securities’ primary markets, are valued at their fair values calculated according to procedures adopted by the board of trustees. These procedures include obtaining quotations from an independent pricing service, monitoring news to identify significant market- or security-specific events, and evaluating changes in the values of foreign market proxies (for example, ADRs, futures contracts, or exchange-traded funds), between the time the foreign markets close and the fund’s pricing time. When fair-value pricing is employed, the prices of securities used by a fund to calculate its net asset value may differ from quoted or published prices for the same securities. Precious metals are valued at the mean of the latest quoted bid and asked prices. Investments in Vanguard Market Liquidity Fund are valued at that fund’s net asset value.
2. Foreign Currency: Securities and other assets and liabilities denominated in foreign currencies are translated into U.S. dollars using exchange rates obtained from an independent third party as of the fund’s pricing time on the valuation date. Realized gains (losses) and unrealized appreciation (depreciation) on investment securities include the effects of changes in exchange rates since the securities were purchased, combined with the effects of changes in security prices. Fluctuations in the value of other assets and liabilities resulting from changes in exchange rates are recorded as unrealized foreign currency gains (losses) until the assets or liabilities are settled in cash, at which time they are recorded as realized foreign currency gains (losses).
3. Federal Income Taxes: The fund intends to continue to qualify as a regulated investment company and distribute all of its taxable income. Management has analyzed the fund’s tax positions taken on federal income tax returns for all open tax years (tax years ended January 31, 2006–2009), and has concluded that no provision for federal income tax is required in the fund’s financial statements.
4. Distributions: Distributions to shareholders are recorded on the ex-dividend date.
5. Security Lending: The fund may lend its securities to qualified institutional borrowers to earn additional
income. Security loans are required to be secured at all times by collateral at least equal to the market value of securities loaned. The fund invests cash collateral received in Vanguard Market Liquidity Fund, and records a liability for the return of the collateral, during the period the securities are on loan. Security lending income represents the income earned on investing cash collateral, less expenses associated with the loan.
18
Precious Metals and Mining Fund
6. Other: Dividend income is recorded on the ex-dividend date. Interest income includes income distributions received from Vanguard Market Liquidity Fund and is accrued daily. Security transactions are accounted for on the date securities are bought or sold. Costs used to determine realized gains (losses) on the sale of investment securities are those of the specific securities sold. Fees assessed on redemptions of capital shares are credited to paid-in capital.
B. M&G Investment Management Ltd. provides investment advisory services to the fund for a fee calculated at an annual percentage rate of average net assets. The basic fee is subject to quarterly adjustments based on the fund’s performance for the preceding three years relative to the S&P/ Citigroup Custom Precious Metals and Mining Index. For the year ended January 31, 2009, the investment advisory fee represented an effective annual basic rate of 0.13% of the fund’s average net assets before an increase of $76,000 (0.00%) based on performance.
C. The Vanguard Group furnishes at cost corporate management, administrative, marketing, and distribution services. The costs of such services are allocated to the fund under methods approved by the board of trustees. The fund has committed to provide up to 0.40% of its net assets in capital contributions to Vanguard. At January 31, 2009, the fund had contributed capital of $454,000 to Vanguard (included in Other Assets), representing 0.03% of the fund’s net assets and 0.18% of Vanguard’s capitalization. The fund’s trustees and officers are also directors and officers of Vanguard.
D. Distributions are determined on a tax basis and may differ from net investment income and realized capital gains for financial reporting purposes. Differences may be permanent or temporary. Permanent differences are reclassified among capital accounts in the financial statements to reflect their tax character. Temporary differences arise when certain items of income, expense, gain, or loss are recognized in different periods for financial statement and tax purposes; these differences will reverse at some time in the future. Differences in classification may also result from the treatment of short-term gains as ordinary income for tax purposes.
During the year ended January 31, 2009, the fund realized net foreign currency losses of $2,740,000, which decreased distributable net income for tax purposes; accordingly, such losses have been reclassified from overdistributed net realized gains to overdistributed net investment income.
Certain of the fund’s investments are in securities considered to be “passive foreign investment companies,” for which any unrealized appreciation and/or realized gains are required to be included in distributable net income for tax purposes. During the year ended January 31, 2009, the fund did not realize any gains on the sale of passive foreign investment companies. Unrealized appreciation of $29,563,000 on the fund’s passive foreign investment company holdings through October 31, 2008, (the most recent previous mark-to-market date for tax purposes), has been distributed and is reflected in the balance of overdistributed net investment income. Since October 31, 2008, the fund’s passive foreign investment company holdings have appreciated in value by $17,594,000, increasing the amount of taxable income available for distribution as of January 31, 2009. Unrealized appreciation on the fund’s passive foreign investment company holdings at January 31, 2009, was $47,157,000.
The fund used a tax accounting practice to treat a portion of the price of capital shares redeemed during the year as distributions from net investment income and realized capital gains. Accordingly, the fund has reclassified $9,492,000 from overdistributed net investment income, and $67,578,000 from overdistributed net realized gains, to paid-in capital.
19
Precious Metals and Mining Fund
During 2001, the fund elected to use a provision of the Taxpayer Relief Act of 1997 to mark to market certain appreciated securities held on January 1, 2001; such securities were treated as sold and repurchased, with unrealized gains of $46,006,000 becoming realized, for tax purposes. The mark-to-market created a difference between the cost of investments for financial statement and tax purposes, which will reverse when the securities are sold. Through January 31, 2009, the fund realized gains on the sale of these securities of $20,516,000 for financial statement purposes, which were included in prior year mark-to-market gains for tax purposes. The remaining difference of $25,490,000 is reflected in the balance of overdistributed net realized gains; the corresponding difference between the securities’ cost for financial statement and tax purposes in reflected in unrealized appreciation.
For tax purposes, at January 31, 2009, the fund had $16,040,000 of ordinary income and no long-term capital gains available for distribution.
At January 31, 2009, the cost of investment securities for tax purposes was $3,002,664,000. Net unrealized depreciation of investment securities for tax purposes was $1,339,428,000, consisting of unrealized gains of $75,829,000 on securities that had risen in value since their purchase and $1,415,257,000 in unrealized losses on securities that had fallen in value since their purchase or since being marked to market for tax purposes.
E. During the year ended January 31, 2009, the fund purchased $840,386,000 of investment securities and sold $1,031,272,000 of investment securities other than temporary cash investments.
F. Capital shares issued and redeemed were:
| Year Ended January 31, |
| 2009 | 2008 |
| Shares | Shares |
| (000) | (000) |
Issued | 37,881 | 22,924 |
Issued in Lieu of Cash Distributions | 27,485 | 16,414 |
Redeemed | (50,837) | (21,016) |
Net Increase (Decrease) in Shares Outstanding | 14,529 | 18,322 |
20
Precious Metals and Mining Fund
G. Certain of the fund’s investments are in companies that are considered to be affiliated companies of the fund because the fund owns more than 5% of the outstanding voting securities of the company. Transactions during the period in securities of these companies were as follows:
| | | Current Period Transactions | |
| Jan. 31, 2008 | | Proceeds from | | Jan. 31, 2009 |
| Market | Purchases | Securities | Dividend | Market |
| Value | at Cost | Sold | Income | Value |
| ($000) | ($000) | ($000) | ($000) | ($000) |
AMCOL International Corp. | 63,752 | 14,196 | — | 2,060 | 44,919 |
Centennial Coal Co., Ltd. | 49,955 | — | 74,803 | 220 | — |
Centerra Gold Inc. | 214,439 | 743 | — | — | 61,150 |
Claude Resources, Inc. | 6,746 | — | — | — | 2,524 |
Franco-Nevada Corp. | NA1 | 114,264 | — | 1,373 | 171,223 |
Harry Winston Diamond Corp. | 178,714 | 12,173 | — | 1,244 | 30,643 |
Harry Winston Diamond Corp. | | | | | |
Private Placement | — | 17,729 | — | 120 | 2,646 |
Iluka Resources Ltd. | 70,228 | 59,809 | — | — | 98,933 |
Imerys SA | NA1 | 54,632 | 831 | 7,037 | 134,204 |
Johnson Matthey PLC | NA1 | 94,426 | — | 6,828 | 160,598 |
Lonmin PLC | NA1 | 83,140 | — | 4,741 | 101,515 |
Minerals Technologies, Inc. | 72,706 | — | — | 267 | 50,534 |
Peter Hambro Mining PLC | 123,928 | 51,308 | — | 1,775 | 55,203 |
Sims Metal Management Ltd.2 | 182,990 | 15,880 | — | 7,868 | NA3 |
St. Barbara Ltd. | 53,465 | 25,935 | — | — | 23,056 |
| 1,016,923 | | | 33,533 | 937,148 |
1 | At January 31, 2008, the issuer was not an affiliated company of the fund. |
2 Sims Group Ltd. underwent a name change to Sims Metal Management Ltd. in November 2008.
3 At January 31, 2009, the security is still held, but the issuer is no longer an affiliated company of the fund.
21
Precious Metals and Mining Fund
H. In September 2006, the Financial Accounting Standards Board issued Statement of Financial Accounting Standards No. 157 (“FAS 157”), “Fair Value Measurements.” FAS 157 establishes a framework for measuring fair value and expands disclosures about fair value measurements in financial statements.
The various inputs that may be used to determine the value of the fund’s investments are summarized in three broad levels. The inputs or methodologies used for valuing securities are not necessarily an indication of the risk associated with investing in those securities.
Level 1—Quoted prices in active markets for identical securities.
Level 2—Other significant observable inputs (including quoted prices for similar securities, interest rates, prepayment speeds, credit risk, etc.).
Level 3—Significant unobservable inputs (including the fund’s own assumptions used to determine the fair value of investments).
The following table summarizes the fund’s investments as of January 31, 2009, based on the inputs used to value them:
| Investments |
| in Securities |
Valuation Inputs | ($000) |
Level 1—Quoted prices | 631,897 |
Level 2—Other significant observable inputs | 1,028,693 |
Level 3—Significant unobservable inputs | 2,646 |
Total | 1,663,236 |
The following table summarizes changes in investments valued based on Level 3 inputs during the year ended January 31, 2009.
| Investments |
| in Securities |
Amount Valued Based on Level 3 Inputs | ($000) |
Balance as of January 31, 2008 | — |
Net Purchases (Sales) | 17,729 |
Change in Unrealized Appreciation (Depreciation) | (15,083) |
Balance as of January 31, 2009 | 2,646 |
22
Report of Independent Registered Public Accounting Firm
To the Trustees of Vanguard Specialized Funds and the Shareholders of Vanguard Precious Metals and Mining Fund:
In our opinion, the accompanying statements of net assets and of assets and liabilities and the related statements of operations and of changes in net assets and the financial highlights present fairly, in all material respects, the financial position of Vanguard Precious Metals and Mining Fund (constituting a separate portfolio of Vanguard Specialized Funds, hereafter referred to as the “Fund”) at January 31, 2009, the results of its operations for the year then ended, the changes in its net assets for each of the two years in the period then ended and the financial highlights for each of five years in the period then ended, in conformity with accounting principles generally accepted in the United States of America. These financial statements and financial highlights (hereafter referred to as “financial statements”) are the responsibility of the Fund’s management; our responsibility is to express an opinion on these financial statements based on our audits. We conducted our audits of these financial statements in accordance with the standards of the Public Company Accounting Oversight Board (United States). Those standards require that we plan and perform the audit to obtain reasonable assurance about whether the financial statements are free of material misstatement. An audit includes examining, on a test basis, evidence supporting the amounts and disclosures in the financial statements, assessing the accounting principles used and significant estimates made by management, and evaluating the overall financial statement presentation. We believe that our audits, which included confirmation of securities at January 31, 2009 by correspondence with the custodian, and by agreement to the underlying ownership records for Vanguard Market Liquidity Fund, provide a reasonable basis for our opinion.
PricewaterhouseCoopers LLP
Philadelphia, Pennsylvania
March 20, 2009
Special 2008 tax information (unaudited) for Vanguard Precious Metals and Mining Fund |
This information for the fiscal year ended January 31, 2009, is included pursuant to provisions of the Internal Revenue Code.
The fund distributed $426,475,000 as capital gain dividends (from net long-term capital gains) to shareholders during the fiscal year.
For nonresident alien shareholders, 100% of short-term capital gain dividends distributed by the fund are qualified short-term capital gains.
The fund distributed $101,466,000 of qualified dividend income to shareholders during the fiscal year.
For corporate shareholders, 4.8% of investment income (dividend income plus short-term gains, if any) qualifies for the dividends-received deduction.
The fund passed through to shareholders foreign source income of $89,097,000 and foreign taxes paid of $2,951,000. The pass-through of foreign taxes paid affects only shareholders on the dividend record date in December 2008. Shareholders received more detailed information along with their Form 1099-DIV in January 2009.
23
Your Fund’s After-Tax Returns
This table presents returns for your fund both before and after taxes. The after-tax returns are shown in two ways: (1) assuming that an investor owned the fund during the entire period and paid taxes on the fund’s distributions, and (2) assuming that an investor paid taxes on the fund’s distributions and sold all shares at the end of each period.
Calculations are based on the highest individual federal income tax and capital gains tax rates in effect at the times of the distributions and the hypothetical sales. State and local taxes were not considered. After-tax returns reflect any qualified dividend income, using actual prior-year figures and estimates for 2009. (In the example, returns after the sale of fund shares may be higher than those assuming no sale. This occurs when the sale would have produced a capital loss. The calculation assumes that the investor received a tax deduction for the loss.)
Please note that your actual after-tax returns will depend on your tax situation and may differ from those shown. Also note that if you own the fund in a tax-deferred account, such as an individual retirement account or a 401(k) plan, this information does not apply to you. Such accounts are not subject to current taxes.
Finally, keep in mind that a fund’s performance—whether before or after taxes—does not guarantee future results.
Average Annual Total Returns: Precious Metals and Mining Fund1 | | | |
Periods Ended January 31, 2009 | | | |
| One | Five | Ten |
| Year | Years | Years |
Returns Before Taxes | –60.16% | 4.03% | 13.07% |
Returns After Taxes on Distributions | –61.31 | 2.21 | 11.31 |
Returns After Taxes on Distributions and Sale of Fund Shares | –36.65 | 4.34 | 11.72 |
1 Total return figures do not reflect the 1% fee assessed on redemptions of shares held for less than one year, nor do they include the account service fee that may be applicable to certain accounts with balances below $10,000.
24
About Your Fund’s Expenses
As a shareholder of the fund, you incur ongoing costs, which include costs for portfolio management, administrative services, and shareholder reports (like this one), among others. Operating expenses, which are deducted from a fund’s gross income, directly reduce the investment return of the fund.
A fund’s expenses are expressed as a percentage of its average net assets. This figure is known as the expense ratio. The following examples are intended to help you understand the ongoing costs (in dollars) of investing in your fund and to compare these costs with those of other mutual funds. The examples are based on an investment of $1,000 made at the beginning of the period shown and held for the entire period.
The accompanying table illustrates your fund’s costs in two ways:
• Based on actual fund return. This section helps you to estimate the actual expenses that you paid over the period. The “Ending Account Value” shown is derived from the fund’s actual return, and the third column shows the dollar amount that would have been paid by an investor who started with $1,000 in the fund. You may use the information here, together with the amount you invested, to estimate the expenses that you paid over the period.
To do so, simply divide your account value by $1,000 (for example, an $8,600 account value divided by $1,000 = 8.6), then multiply the result by the number given for your fund under the heading “Expenses Paid During Period.”
• Based on hypothetical 5% yearly return. This section is intended to help you compare your fund’s costs with those of other mutual funds. It assumes that the fund had a yearly return of 5% before expenses, but that the expense ratio is unchanged. In this case—because the return used is not the fund’s actual return—the results do not apply to your investment. The example is useful in making comparisons because the Securities and Exchange Commission requires all mutual funds to calculate expenses based on a 5% return. You can assess your fund’s costs by comparing this hypothetical example with the hypothetical examples that appear in shareholder reports of other funds.
Six Months Ended January 31, 2009 | | | |
| Beginning | Ending | Expenses |
| Account Value | Account Value | Paid During |
Precious Metals and Mining Fund | 7/31/2008 | 1/31/2009 | Period1 |
Based on Actual Fund Return | $1,000.00 | $404.76 | $0.96 |
Based on Hypothetical 5% Return | 1,000.00 | 1,023.84 | 1.38 |
Note that the expenses shown in the table are meant to highlight and help you compare ongoing costs only and do not reflect transaction costs incurred by the fund for buying and selling securities. Further, the expenses do not include the 1% fee on redemptions of shares held for less than one year, nor do they include the account service fee described in the prospectus. If such fees were applied to your account, your costs would be higher. Your fund does not carry a “sales load.”
1 These calculations are based on expenses incurred in the most recent six-month period. The fund’s annualized six-month expense ratio for that period is 0.27%. The dollar amounts shown as “Expenses Paid” are equal to the annualized expense ratio multiplied by the average account value over the period, multiplied by the number of days in the most recent six-month period, then divided by the number of days in the most recent 12-month period.
25
The calculations assume no shares were bought or sold during the period. Your actual costs may have been higher or lower, depending on the amount of your investment and the timing of any purchases or redemptions.
You can find more information about the fund’s expenses, including annual expense ratios, in the Financial Statements section of this report. For additional information on operating expenses and other shareholder costs, please refer to your fund’s current prospectus.
26
Glossary
Beta. A measure of the magnitude of a fund’s past share-price fluctuations in relation to the ups and downs of a given market index. The index is assigned a beta of 1.00. Compared with a given index, a fund with a beta of 1.20 typically would have seen its share price rise or fall by 12% when the index rose or fell by 10%. For this report, beta is based on returns over the past 36 months for both the fund and the index. Note that a fund’s beta should be reviewed in conjunction with its R-squared (see definition). The lower the R-squared, the less correlation there is between the fund and the index, and the less reliable beta is as an indicator of volatility.
Earnings Growth Rate. The average annual rate of growth in earnings over the past five years for the stocks now in a fund.
Equity Exposure. A measure that reflects a fund’s investments in stocks and stock futures. Any holdings in short-term reserves are excluded.
Expense Ratio. The percentage of a fund’s average net assets used to pay its annual administrative and advisory expenses. These expenses directly reduce returns to investors.
Foreign Holdings. The percentage of a fund represented by stocks or depositary receipts of companies based outside the United States.
Inception Date. The date on which the assets of a fund (or one of its share classes) are first invested in accordance with the fund’s investment objective. For funds with a subscription period, the inception date is the day after that period ends. Investment performance is measured from the inception date.
Median Market Cap. An indicator of the size of companies in which a fund invests; the midpoint of market capitalization (market price x shares outstanding) of a fund’s stocks, weighted by the proportion of the fund’s assets invested in each stock. Stocks representing half of the fund’s assets have market capitalizations above the median, and the rest are below it.
Price/Book Ratio. The share price of a stock divided by its net worth, or book value, per share. For a fund, the weighted average price/book ratio of the stocks it holds.
Price/Earnings Ratio. The ratio of a stock’s current price to its per-share earnings over the past year. For a fund, the weighted average P/E of the stocks it holds. P/E is an indicator of market expectations about corporate prospects; the higher the P/E, the greater the expectations for a company’s future growth.
R-Squared. A measure of how much of a fund’s past returns can be explained by the returns from the market in general, as measured by a given index. If a fund’s total returns were precisely synchronized with an index’s returns, its R-squared would be 1.00. If the fund’s returns bore no relationship to the index’s returns, its R-squared would be 0. For this report, R-squared is based on returns over the past 36 months for both the fund and the index.
Return on Equity. The annual average rate of return generated by a company during the past five years for each dollar of shareholder’s equity (net income divided by shareholder’s equity). For a fund, the weighted average return on equity for the companies whose stocks it holds.
Short-Term Reserves. The percentage of a fund invested in highly liquid, short-term securities that can be readily converted to cash.
Turnover Rate. An indication of the fund’s trading activity. Funds with high turnover rates incur higher transaction costs and may be more likely to distribute capital gains (which may be taxable to investors). The turnover rate excludes in-kind transactions, which have minimal impact on costs.
27
The People Who Govern Your Fund
The trustees of your mutual fund are there to see that the fund is operated and managed in your best interests since, as a shareholder, you are a part owner of the fund. Your fund’s trustees also serve on the board of directors of The Vanguard Group, Inc., which is owned by the Vanguard funds and provides services to them on an at-cost basis.
A majority of Vanguard’s board members are independent, meaning that they have no affiliation with Vanguard or the funds they oversee, apart from the sizable personal investments they have made as private individuals. The independent board members have distinguished backgrounds in business, academia, and public service. Each of the trustees and executive officers oversees 156 Vanguard funds.
The following table provides information for each trustee and executive officer of the fund. More information about the trustees is in the Statement of Additional Information, which can be obtained, without charge, by contacting Vanguard at 800-662-7447, or online at www.vanguard.com.
Chairman of the Board and Interested Trustee | Rajiv L. Gupta |
| Born 1945. Trustee Since December 2001.2 Principal |
John J. Brennan1 | Occupation(s) During the Past Five Years: Chairman, |
Born 1954. Trustee Since May 1987. Chairman of | President, and Chief Executive Officer of Rohm and |
the Board. Principal Occupation(s) During the Past Five | Haas Co. (chemicals); Board Member of the American |
Years: Chairman of the Board and Director/Trustee of | Chemistry Council; Director of Tyco International, Ltd. |
The Vanguard Group, Inc., and of each of the investment | (diversified manufacturing and services), since 2005. |
companies served by The Vanguard Group; Chief | |
Executive Officer and President of The Vanguard Group | |
and of each of the investment companies served by The | Amy Gutmann |
Vanguard Group (1996–2008). | Born 1949. Trustee Since June 2006. Principal |
| Occupation(s) During the Past Five Years: President of |
| the University of Pennsylvania since 2004; Professor in |
Independent Trustees | the School of Arts and Sciences, Annenberg School for |
| Communication, and Graduate School of Education of |
| the University of Pennsylvania since 2004; Provost |
Charles D. Ellis | (2001–2004) and Laurance S. Rockefeller Professor of |
Born 1937. Trustee Since January 2001. Principal | Politics and the University Center for Human Values |
Occupation(s) During the Past Five Years: Applecore | (1990–2004), Princeton University; Director of Carnegie |
Partners (pro bono ventures in education); Senior | Corporation of New York since 2005 and of Schuylkill |
Advisor to Greenwich Associates (international business | River Development Corporation and Greater Philadelphia |
strategy consulting); Successor Trustee of Yale University; | Chamber of Commerce since 2004; Trustee of the |
Overseer of the Stern School of Business at New York | National Constitution Center since 2007. |
University; Trustee of the Whitehead Institute for | |
Biomedical Research. | |
| JoAnn Heffernan Heisen |
| Born 1950. Trustee Since July 1998. Principal |
Emerson U. Fullwood | Occupation(s) During the Past Five Years: Retired |
Born 1948. Trustee Since January 2008. Principal | Corporate Vice President, Chief Global Diversity Officer, |
Occupation(s) During the Past Five Years: Retired | and Member of the Executive Committee of Johnson & |
Executive Chief Staff and Marketing Officer for | Johnson (pharmaceuticals/consumer products); Vice |
North America and Corporate Vice President of | President and Chief Information Officer (1997–2005) |
Xerox Corporation (photocopiers and printers); | of Johnson & Johnson; Director of the University |
Director of SPX Corporation (multi-industry | Medical Center at Princeton and Women’s Research |
manufacturing), of the United Way of Rochester, | and Education Institute. |
and of the Boy Scouts of America. | |
André F. Perold | F. William McNabb III1 | |
Born 1952. Trustee Since December 2004. Principal | Born 1957. Chief Executive Officer Since August 2008. |
Occupation(s) During the Past Five Years: George Gund | President Since March 2008. Principal Occupation(s) |
Professor of Finance and Banking, Senior Associate | During the Past Five Years: Chief Executive Officer, |
Dean, and Director of Faculty Recruiting, Harvard | Director, and President of The Vanguard Group, Inc., |
Business School; Director and Chairman of UNX, Inc. | since 2008; Chief Executive Officer and President of |
(equities trading firm); Chair of the Investment | each of the investment companies served by The |
Committee of HighVista Strategies LLC (private | Vanguard Group since 2008; Director of Vanguard |
investment firm) since 2005. | Marketing Corporation; Managing Director of The |
| Vanguard Group (1995–2008). |
| | |
Alfred M. Rankin, Jr. | | |
Born 1941. Trustee Since January 1993. Principal | Heidi Stam1 | |
Occupation(s) During the Past Five Years: Chairman, | Born 1956. Secretary Since July 2005. Principal |
President, Chief Executive Officer, and Director of | Occupation(s) During the Past Five Years: Managing |
NACCO Industries, Inc. (forklift trucks/housewares/ | Director of The Vanguard Group, Inc., since 2006; |
lignite); Director of Goodrich Corporation (industrial | General Counsel of The Vanguard Group since 2005; |
products/aircraft systems and services). | Secretary of The Vanguard Group and of each of the |
| investment companies served by The Vanguard Group |
| since 2005; Director and Senior Vice President of |
J. Lawrence Wilson | Vanguard Marketing Corporation since 2005; Principal |
Born 1936. Trustee Since April 1985. Principal | of The Vanguard Group (1997–2006). |
Occupation(s) During the Past Five Years: Retired | | |
Chairman and Chief Executive Officer of Rohm and | | |
Haas Co. (chemicals); Director of Cummins Inc. (diesel | Vanguard Senior Management Team |
engines) and AmerisourceBergen Corp. (pharmaceutical | | |
distribution); Trustee of Vanderbilt University and of | | |
Culver Educational Foundation. | R. Gregory Barton | Michael S. Miller |
| Mortimer J. Buckley | James M. Norris |
| Kathleen C. Gubanich | Glenn W. Reed |
Executive Officers | Paul A. Heller | George U. Sauter |
| | |
| | |
Thomas J. Higgins1 | Founder | |
Born 1957. Chief Financial Officer Since September | | |
2008. Principal Occupation(s) During the Past Five | | |
Years: Principal of The Vanguard Group, Inc.; Chief | John C. Bogle | |
Financial Officer of each of the investment companies | Chairman and Chief Executive Officer, 1974–1996 |
served by The Vanguard Group since 2008; Treasurer | | |
of each of the investment companies served by The | | |
Vanguard Group (1998–2008). | | |
| | |
| | |
Kathryn J. Hyatt1 | | |
Born 1955. Treasurer Since November 2008. Principal | | |
Occupation(s) During the Past Five Years: Principal of | | |
The Vanguard Group, Inc.; Treasurer of each of the | | |
investment companies served by The Vanguard | | |
Group since 2008; Assistant Treasurer of each of the | | |
investment companies served by The Vanguard Group | | |
(1988–2008). | | |
1 These individuals are “interested persons” as defined in the Investment Company Act of 1940.
2 December 2002 for Vanguard Equity Income Fund, Vanguard Growth Equity Fund, the Vanguard Municipal Bond Funds, and the Vanguard State Tax-Exempt Funds.
| 
|
| P.O. Box 2600 |
| Valley Forge, PA 19482-2600 |
Connect with Vanguard® > www.vanguard.com
Fund Information > 800-662-7447 | All comparative mutual fund data are from Lipper Inc. |
| or Morningstar, Inc., unless otherwise noted. |
Direct Investor Account Services > 800-662-2739 | |
| |
Institutional Investor Services > 800-523-1036 | You can obtain a free copy of Vanguard’s proxy voting |
| guidelines by visiting our website, www.vanguard.com, |
Text Telephone for People | and searching for “proxy voting guidelines,” or by |
With Hearing Impairment > 800-952-3335 | calling Vanguard at 800-662-2739. The guidelines are |
| also available from the SEC’s website, www.sec.gov. |
| In addition, you may obtain a free report on how your |
This material may be used in conjunction | fund voted the proxies for securities it owned during |
with the offering of shares of any Vanguard | the 12 months ended June 30. To get the report, visit |
fund only if preceded or accompanied by | either www.vanguard.com or www.sec.gov. |
the fund’s current prospectus. | |
| |
| You can review and copy information about your fund |
| at the SEC’s Public Reference Room in Washington, D.C. |
The funds or securities referred to herein are not | To find out more about this public service, call the SEC |
sponsored, endorsed, or promoted by MSCI, and MSCI | at 202-551-8090. Information about your fund is also |
bears no liability with respect to any such funds or | available on the SEC’s website, and you can receive |
securities. For any such funds or securities, the | copies of this information, for a fee, by sending a |
prospectus or the Statement of Additional Information | request in either of two ways: via e-mail addressed to |
contains a more detailed description of the limited | publicinfo@sec.gov or via regular mail addressed to the |
relationship MSCI has with The Vanguard Group and | Public Reference Section, Securities and Exchange |
any related funds. | Commission, Washington, DC 20549-0102. |
| |
| |
Russell is a trademark of The Frank Russell Company. | |
| |
| |
| |
| |
| |
| |
| |
| |
| © 2009 The Vanguard Group, Inc. |
| All rights reserved. |
| Vanguard Marketing Corporation, Distributor. |
| |
| Q530 032009 |
��

> | For the fiscal year ended January 31, 2009, Investor Shares of Vanguard Health Care Fund returned –17.44% and Admiral Shares returned –17.38%. Although these results were certainly disappointing, the fund was a bit ahead of both its benchmark index and its peer-group average. |
> | The global financial crisis hampered every sector of the broader U.S. economy, and health care was no exception. |
> | Pharmaceutical companies and health care providers weighed most heavily on the fund’s performance. |
Contents | |
| |
Your Fund’s Total Returns | 1 |
President’s Letter | 2 |
Advisor’s Report | 7 |
Fund Profile | 9 |
Performance Summary | 10 |
Financial Statements | 12 |
Your Fund’s After-Tax Returns | 25 |
About Your Fund’s Expenses | 26 |
Glossary | 28 |
Please note: The opinions expressed in this report are just that—informed opinions. They should not be considered promises or advice. Also, please keep in mind that the information and opinions cover the period through the date on the front of this report. Of course, the risks of investing in your fund are spelled out in the prospectus.
Your Fund’s Total Returns
Fiscal Year Ended January 31, 2009 | | |
| Ticker | Total |
| Symbol | Returns |
Vanguard Health Care Fund | | |
Investor Shares | VGHCX | –17.44% |
Admiral™ Shares1 | VGHAX | –17.38 |
S&P Health Sector Index | | –19.91 |
Average Health/Biotechnology Fund2 | | –19.59 |
Your Fund’s Performance at a Glance | | | |
January 31, 2008–January 31, 2009 | | | | |
| | | Distributions Per Share |
| Starting | Ending | Income | Capital |
| Share Price | Share Price | Dividends | Gains |
Vanguard Health Care Fund | | | | |
Investor Shares | $133.80 | $99.12 | $1.925 | $9.524 |
Admiral Shares | 56.47 | 41.83 | 0.852 | 4.019 |
1 A lower-cost class of shares available to many longtime shareholders and to those with significant investments in the fund.
2 Derived from data provided by Lipper Inc.
1

President’s Letter
Dear Shareholder,
As global financial markets slid sharply over the past 12 months, health care stocks were not immune to the problems plaguing the broader U.S. economy. For the fiscal year ended January 31, 2009, Vanguard Health Care Fund returned –17.44% for Investor Shares and –17.38% for the lower-cost Admiral Shares. Nevertheless, the fund outpaced its benchmark—the less diversified S&P Health Sector Index—which returned –19.91% for the year, as well as the average return for health/biotechnology funds, at –19.59%.
Pharmaceutical stocks were responsible for much of the fund’s weakness, simply because they accounted for almost 60% of the fund’s holdings. Compared with some other sectors of the health care industry, however, their declines were relatively modest. Health care providers, which accounted for nearly 17% of the holdings, were also a significant drag on the fund’s performance.
The fund’s subpar showing was its worst fiscal-year return since its inception in 1984, a fact that highlights both the fund’s durability over the long haul and the unusual severity of the market’s turmoil over the past 12 months.
If you own shares of the fund in a taxable account, you may wish to review our report on the fund’s after-tax returns on page 25.
2
Stocks fell worldwide as the credit crisis deepened
The 12 months ended January 31, 2009, was one of the worst ever one-year spans for stocks. The broad U.S. stock market returned nearly –39%; international stocks registered –45%. The trouble stemmed from the financial sector, where some of the world’s largest institutions imploded, largely because of their exposure to low-quality mortgages in the United States. The effects of the credit crisis were wide and deep, with virtually no country or industry sector spared.
The stock market struggled through the first part of the fiscal year, then declined sharply in September, October, and November. December offered a brief reprieve before the market fell again in January.
In a flight to safety, investors chose low-yield Treasuries
As economic uncertainty and market volatility grew more pronounced in the second half of the year, investors sought the relative safety of short-term government issues. This drove prices for Treasuries higher, and their yields lower. In some cases, investors were willing to accept very low—or even slightly negative—yields for the short-term safekeeping of their assets.
At the same time, the Federal Reserve Board steered short-term interest rates lower in its ongoing campaign to
Market Barometer | | | |
| Average Annual Total Returns |
| Periods Ended January 31, 2009 |
| One Year | Three Years | Five Years |
Stocks | | | |
Russell 1000 Index (Large-caps) | –39.04% | –12.03% | –4.05% |
Russell 2000 Index (Small-caps) | –36.84 | –14.31 | –4.06 |
Dow Jones Wilshire 5000 Index (Entire market) | –38.69 | –12.03 | –3.75 |
MSCI All Country World Index ex USA (International) | –44.72 | –11.41 | 0.79 |
| | | |
Bonds | | | |
Barclays Capital U.S. Aggregate Bond Index (Broad taxable market) | 2.59% | 5.19% | 4.30% |
Barclays Capital Municipal Bond Index | –0.16 | 3.00 | 3.33 |
Citigroup 3-Month Treasury Bill Index | 1.52 | 3.65 | 3.08 |
| | | |
CPI | | | |
Consumer Price Index | 0.03% | 2.11% | 2.66% |
3
encourage lending. During your fund’s fiscal year, the target for the federal funds rate dropped from 3.00% to a range of 0%–0.25%.
For the full 12-month period, the broad taxable bond market returned 2.59%, and tax-exempt bonds returned –0.16%—somewhat pedestrian (if disappointing) returns that masked a year of uncommon volatility for bonds.
Pharmaceutical companies offered no prescription for relief
Vanguard Health Care Fund’s return was far ahead of that of the broad U.S. stock market, but this relative “success” during an unusually punishing 12-month period was of small comfort.
Although select pharmaceutical companies enjoyed positive returns, the Health Care Fund’s pharmaceutical holdings returned about –17% as a group, ahead of the returns of most sectors of the broad health care industry. Because the fund kept more than half of its assets in pharmaceuticals, however, these stocks did the most damage to the portfolio’s 12-month performance. Patent expiration, drug-effectiveness concerns, increased competition, and a declining pipeline all contributed to firms’ poor overall performance. At the end of the fiscal year, for example, Pfizer’s shares returned –16% in one week after the company announced it would buy Wyeth.
Expense Ratios1 | | | |
Your Fund Compared With Its Peer Group | | | |
| | | Average |
| | | Health/ |
| Investor | Admiral | Biotechnology |
| Shares | Shares | Fund1 |
Health Care Fund | 0.26% | 0.18% | 1.58% |
1 The fund expense ratios shown are from the prospectus dated May 29, 2008. For the fiscal year ended January 31, 2009, the Health Care Fund’s expense ratios were 0.29% for Investor Shares and 0.22% for Admiral Shares. The peer-group expense ratio is derived from data provided by Lipper Inc. and captures information through year-end 2008.
4
Health care providers also suffered because of the difficult economy as corporate layoffs led to a decrease in medical-plan membership. Investment losses stemming from the financial crisis further added to the weakness. Meanwhile, health care equipment companies struggled as cost-conscious hospitals trimmed inventories and tightened budgets.
Only the biotechnology subsector delivered a positive return during the fiscal year as a result of solid sales and the potential for company mergers. The fund’s biotech holdings produced higher gains than those in the index.
Fund’s long-term record has benefited investors
Vanguard Health Care Fund has returned an average of 7.62% annually over the past ten years, considerably ahead of its benchmark index, as well as its peer-group average and the broad U.S. stock market. The table below shows the fund’s average annual return for the decade ended January 31, 2009, along with the returns of its comparative measures.
Although the fund’s past fiscal year was a clear disappointment and the fund has now posted negative returns for two straight years, the fund’s long-term record is still strong. This divergence between the results of the past two years and that of the past decade highlights why Vanguard continually suggests to investors
Total Returns | |
Ten Years Ended January 31, 2009 | |
| Average |
| Annual Return |
Health Care Fund Investor Shares | 7.62% |
S&P Health Sector Index | –0.33 |
Average Health/Biotechnology Fund1 | 4.17 |
Past performance is not a guarantee of future results. (Current performance may be lower or higher than the performance data cited. For performance data current to the most recent month-end, visit our website at www.vanguard.com/performance.) Note, too, that both investment returns and principal value can fluctuate widely, so an investor’s shares, when sold, could be worth more or less than their original cost.
1 Derived from data provided by Lipper Inc.
5
that long-term results are a more reliable indicator of a fund’s performance than short-term results.
The fund’s solid long-term performance is based on the portfolio-management and stock-picking skills of Wellington Management Company, LLP, your fund’s advisor since its inception 25 years ago this May. Vanguard’s commitment to quality and to low costs also helped produce respectable, long-term returns for shareholders. For a comparison of your fund’s cost with the average cost of its competitor funds, see the table on page 4.
Diversification is important for investing success
Investors experienced difficult times during the past fiscal year as the global financial crisis intensified and the broad U.S. economy sank into a potentially prolonged recession. Unfortunately, Vanguard Health Care Fund also experienced the market’s upheaval, leading to a sizable negative return for the portfolio. The financial volatility of the last 12 months offers a resounding lesson for investors about the importance of avoiding making emotional decisions based on short-term movements in the markets. An emotional response can rob shareholders of the opportunity to benefit when the markets recover. Of course, no one can say with certainty when that will happen.
Vanguard suggests, instead, that you build a well-balanced investment plan—one that includes stocks, bonds, and short-term reserves—in line with your objectives and tolerance for risk, and then keep a long-term perspective. Such a diversified portfolio can offer a cushion against the stock market’s sometimes steep drops, while also allowing you to participate in its upswings. Remember that any sector-specific fund can have a place in––but should not be the base of––a balanced portfolio. Vanguard Health Care Fund, through its low-cost exposure to the overall health care industry, can play an important role in such a portfolio, potentially helping you to reach your investment goals.
Thank you for your confidence in Vanguard.
Sincerely,

F. William McNabb III
President and Chief Executive Officer
March 1, 2009
6
Advisor’s Report
Vanguard Health Care Fund returned –17.44% for the 12 months ended January 31, 2009. This result compared with the S&P 500 Index’s return of –38.63%, the S&P 500 Health Care Index’s return of –19.91%, and the average health/biotechnology fund’s return of –19.59%.
The investment environment
Health care stocks dramatically outperformed the overall U.S. stock market, with the better relative returns concentrated in the second half of the fiscal year. The sector’s results illustrate its defensive characteristics, as demand for health care products has only been slightly affected by the economic troubles to this point. Within health care, the larger biotechnology companies stood out as the strongest subsector, while managed care companies were universally weak. Global companies that had benefited from a weak U.S. dollar suffered when the dollar strengthened in the second half.
Our successes
Biotechnology companies Genentech, Millennium Pharmaceuticals, and Amgen were the strongest contributors to performance during the period. We reduced our position in Genentech when it was trading well above Roche’s original acquisition offer price. Millennium was acquired by Takeda Pharmaceuticals at a significant premium. Amgen rebounded nicely from a weak 2007, after data on its new drug for osteoporosis proved very promising.
Portfolio Changes: | |
Year Ended January 31, 2009 | |
| |
Additions | Comments |
Merck | Added on weakness. |
UnitedHealth | Added on weakness. |
Pfizer | Added on weakness after the Wyeth tender. |
| |
Reductions | Comments |
Genentech | Reduced position at a price above Roche tender offer. |
Medtronic | Reduced into strength. |
Cardinal Health | Reduced on declining fundamentals. |
7
Our shortfalls
Forest Laboratories was our biggest detractor during the fiscal year, as the stock market appeared unimpressed with the strength of the company’s pipeline. The managed care group was a difficult one for us this year, as investors seemed concerned that health care reform may hurt the subsector’s sustained profitability. Nevertheless, we believe that the fund’s detractors over the past 12 months will rebound and become future winners.
The fund’s positioning
The Health Care Fund’s sizable outperformance compared with the broader market over the 2009 fiscal year is unlikely to continue unless the current economic environment deteriorates into something worse than a recession. Regardless of the economy’s direction, our strategy will remain the same. We aim to provide a portfolio diversified across health care and invested in the companies most likely to prosper in the coming years.
Edward P. Owens
Senior Vice President and Portfolio Manager
Wellington Management Company, LLP
March 1, 2009
8
Health Care Fund
Fund Profile
As of January 31, 2009
Portfolio Characteristics | | |
| | Comparative | Broad |
| Fund | Index1 | Index2 |
Number of Stocks | 78 | 54 | 4,554 |
Median Market Cap | $28.5B | $42.4B | $24.3B |
Price/Earnings Ratio | 17.1x | 15.3x | 11.7x |
Price/Book Ratio | 2.2x | 2.6x | 1.6x |
Yield3 | | 2.5% | 2.9% |
Investor Shares | 1.2% | | |
Admiral Shares | 1.3% | | |
Return on Equity | 17.9% | 21.8% | 21.1% |
Earnings Growth Rate | 11.9% | 11.8% | 18.3% |
Foreign Holdings | 26.5% | | |
Turnover Rate | 12% | | |
Expense Ratio | | | |
(1/31/2008)4 | | — | — |
Investor Shares | 0.26% | | |
Admiral Shares | 0.18% | | |
Short-Term Reserves | 5.4% | — | — |
Sector Diversification5 (% of equity exposure) |
| |
Biotechnology | 8.4% |
Drug Retail | 1.9 |
Health Care Distributors | 5.0 |
Health Care Equipment | 7.8 |
Health Care Services | 2.9 |
Health Care Technology | 1.5 |
Industrials | 0.3 |
Managed Health Care | 9.1 |
Pharmaceuticals | 61.1 |
Other Health Care | 2.0 |
Volatility Measures6 | |
| Fund Versus | Fund Versus |
| Comparative Index1 | Broad Index2 |
R-Squared | 0.91 | 0.59 |
Beta | 0.92 | 0.63 |
Ten Largest Holdings7 (% of total net assets) |
| |
Schering-Plough Corp. | 5.5% |
Eli Lilly & Co. | 4.6 |
Forest Laboratories, Inc. | 4.2 |
Abbott Laboratories | 4.1 |
Merck & Co., Inc. | 3.6 |
Roche Holdings AG | 3.5 |
Sanofi-Aventis | 3.3 |
AstraZeneca Group PLC | 3.3 |
Wyeth | 3.2 |
McKesson Corp. | 3.2 |
Top Ten | 38.5% |
Market Diversification (% of equity exposure) |
| |
United States | 72.1% |
Japan | 12.2 |
Switzerland | 6.4 |
United Kingdom | 3.8 |
France | 3.8 |
Other Markets | 1.7 |
Investment Focus
1 S&P Health Sector Index.
2 Dow Jones Wilshire 5000 Index.
3 30-day SEC yield for the fund; annualized dividend yield for the index.
4 The expense ratios shown are from the prospectus dated May 29, 2008. For the fiscal year ended January 31, 2009, the expense ratios were 0.29% for Investor Shares and 0.22% for Admiral Shares.
5 Sector percentages combine U.S. and international holdings.
6 For an explanation of R-squared, beta, and other terms used here, see the Glossary.
7 The holdings listed exclude any temporary cash investments and equity index products.
9
Health Care Fund
Performance Summary
All of the returns in this report represent past performance, which is not a guarantee of future results that may be achieved by the fund. (Current performance may be lower or higher than the performance data cited. For performance data current to the most recent month-end, visit our website at www.vanguard.com/performance.) Note, too, that both investment returns and principal value can fluctuate widely, so an investor’s shares, when sold, could be worth more or less than their original cost. The returns shown do not reflect taxes that a shareholder would pay on fund distributions or on the sale of fund shares.
Cumulative Performance: January 31, 1999–January 31, 2009
Initial Investment of $25,000
| | Average Annual Total Returns | Final Value |
| Periods Ended January 31, 2009 | of a $25,000 |
| One Year | Five Years | Ten Years | Investment |
Health Care Fund Investor Shares1 | –17.44% | 2.49% | 7.62% | $52,082 |
Dow Jones Wilshire 5000 Index | –38.69 | –3.75 | –1.83 | 20,794 |
S&P Health Sector Index | –19.91 | –1.54 | –0.33 | 24,194 |
Average Health/Biotechnology Fund2 | –19.59 | –0.27 | 4.17 | 37,623 |
| | | | Final Value |
| | | Since | of a $100,000 |
| One Year | Five Years | Inception3 | Investment |
Health Care Fund Admiral Shares1 | –17.38% | 2.58% | 4.28% | $135,314 |
Dow Jones Wilshire 5000 Index | –38.69 | –3.75 | –1.19 | 91,738 |
S&P Health Sector Index | –19.91 | –1.54 | –1.62 | 88,872 |
1 Total returns do not reflect the 1% fee assessed on redemptions of shares held less than one year, nor for the Investor Shares do they include the account service fee that may be applicable to certain accounts with balances below $10,000.
2 Derived from data provided by Lipper Inc.
3 Performance for the fund’s Admiral Shares and its comparative standards is calculated since the Admiral Shares’ inception: November 12, 2001.
10
Health Care Fund
Fiscal-Year Total Returns (%): January 31, 1999–January 31, 2009
Average Annual Total Returns: Periods Ended December 31, 2008
This table presents average annual total returns through the latest calendar quarter—rather than through the end of the fiscal period. Securities and Exchange Commission rules require that we provide this information.
| Inception Date | One Year | Five Years | Ten Years |
Investor Shares1 | 5/23/1984 | –18.45% | 3.59% | 7.92% |
Admiral Shares1 | 11/12/2001 | –18.39 | 3.68 | 4.672 |
1 Total returns do not reflect the 1% fee assessed on redemptions of shares held less than one year, nor for the Investor Shares do they include the account service fee that may be applicable to certain accounts with balances below $10,000.
2 Return since inception.
Note: See Financial Highlights for dividend and capital gains information.
11
Health Care Fund
Financial Statements
Statement of Net Assets
As of January 31, 2009
The fund provides a complete list of its holdings four times in each fiscal year, at the quarter-ends. For the second and fourth fiscal quarters, the lists appear in the fund’s semiannual and annual reports to shareholders. For the first and third fiscal quarters, the fund files the lists with the Securities and Exchange Commission on Form N-Q. Shareholders can look up the fund’s Forms N-Q on the SEC’s website at www.sec.gov. Forms N-Q may also be reviewed and copied at the SEC’s Public Reference Room (see the back cover of this report for further information).
| | | Market |
| | | Value• |
| | Shares | ($000) |
Common Stocks (94.8%) | | |
United States (68.3%) | | |
Biotechnology (8.0%) | | |
* | Amgen Inc. | 9,138,455 | 501,244 |
* | Genzyme Corp. | 5,569,340 | 383,839 |
*,1 | OSI Pharmaceuticals, Inc. | 3,480,000 | 123,888 |
*,^ | Cephalon, Inc. | 1,602,000 | 123,642 |
* | Gilead Sciences, Inc. | 1,899,696 | 96,448 |
* | Biogen Idec Inc. | 1,770,000 | 86,111 |
* | Vertex | | |
| Pharmaceuticals, Inc. | 2,093,800 | 69,200 |
* | Amylin | | |
| Pharmaceuticals, Inc. | 2,007,200 | 23,203 |
* | Onyx P | | |
| harmaceuticals, Inc. | 607,200 | 18,477 |
* | Genentech, Inc. | 100,000 | 8,124 |
* | United Therapeutics Corp. | 111,000 | 7,542 |
* | Human Genome | | |
| Sciences, Inc. | 938,500 | 1,699 |
| | | 1,443,417 |
Chemicals (0.7%) | | |
| Sigma-Aldrich Corp. | 3,630,000 | 130,970 |
| | | |
Food & Staples Retailing (1.8%) | | |
| Walgreen Co. | 11,650,000 | 319,327 |
| | | |
Health Care Equipment & Supplies (7.7%) | |
| Becton, Dickinson & Co. | 4,750,000 | 345,183 |
* | St. Jude Medical, Inc. | 9,010,900 | 327,726 |
| Medtronic, Inc. | 7,514,900 | 251,674 |
| Baxter International, Inc. | 2,900,000 | 170,085 |
| Beckman Coulter, Inc. | 2,761,784 | 137,316 |
| DENTSPLY | | |
| International Inc. | 2,485,400 | 66,882 |
* | Hospira, Inc. | 1,695,070 | 42,207 |
| Covidien Ltd. | 600,000 | 23,004 |
| STERIS Corp. | 803,083 | 21,362 |
* | Zimmer Holdings, Inc. | 200,000 | 7,280 |
| | | 1,392,719 |
| | | Market |
| | | Value• |
| | Shares | ($000) |
Health Care Providers & Services (16.6%) | | |
| McKesson Corp. | 13,039,900 | 576,364 |
| UnitedHealth Group Inc. | 19,285,100 | 546,347 |
* | Humana Inc. | 8,067,800 | 306,012 |
* | WellPoint Inc. | 7,102,400 | 294,394 |
| Quest Diagnostics, Inc. | 5,785,400 | 285,509 |
| Cardinal Health, Inc. | 5,136,708 | 193,397 |
* | Laboratory Corp. of | | |
| America Holdings | 2,731,360 | 161,697 |
*,1 | Coventry Health Care Inc. | 9,386,300 | 142,015 |
| CIGNA Corp. | 8,110,600 | 140,800 |
| Universal Health | | |
| Services Class B | 2,260,400 | 85,556 |
| Owens & Minor, Inc. | 2,000,000 | 79,540 |
* | Health Net Inc. | 4,545,402 | 66,499 |
| Aetna Inc. | 1,950,000 | 60,450 |
*,1 | Health Management | | |
| Associates Class A | 15,756,900 | 25,053 |
* | DaVita, Inc. | 304,600 | 14,316 |
* | WellCare Health Plans Inc. | 500,000 | 7,390 |
| | | 2,985,339 |
Health Care Technology (1.4%) | | |
*,^ | Cerner Corp. | 3,900,000 | 131,508 |
| IMS Health, Inc. | 8,547,400 | 124,108 |
| | | 255,616 |
Life Sciences Tools & Services (0.2%) | | |
*,1 | PAREXEL | | |
| International Corp. | 3,140,400 | 31,059 |
| | | |
Machinery (0.3%) | | |
| Pall Corp. | 2,104,600 | 54,867 |
| | | |
Pharmaceuticals (31.6%) | | |
| Schering-Plough Corp. | 56,041,700 | 984,092 |
| Eli Lilly & Co. | 22,479,900 | 827,710 |
*,1 | Forest Laboratories, Inc. | 30,133,000 | 754,530 |
| Abbott Laboratories | 13,200,000 | 731,808 |
| Merck & Co., Inc. | 22,871,200 | 652,973 |
| Wyeth | 13,638,800 | 586,059 |
| Pfizer Inc. | 29,213,570 | 425,934 |
12
Health Care Fund
| | | Market |
| | | Value• |
| | Shares | ($000) |
| Bristol-Myers Squibb Co. | 15,290,000 | 327,359 |
| Perrigo Co. | 4,450,000 | 130,608 |
| Allergan, Inc. | 3,100,000 | 118,172 |
* | Sepracor Inc. | 4,857,900 | 73,840 |
* | Watson | | |
| Pharmaceuticals, Inc. | 2,100,000 | 57,288 |
| Johnson & Johnson | 700,000 | 40,383 |
| | | 5,710,756 |
Total United States | | 12,324,070 |
International (26.5%) | | |
Belgium (0.4%) | | |
| UCB SA | 2,244,146 | 69,719 |
| | | |
Denmark (0.2%) | | |
| Novo Nordisk A/S | | |
| B Shares | 800,000 | 42,619 |
| | | |
France (3.6%) | | |
| Sanofi-Aventis | 10,507,991 | 591,001 |
| Ipsen Promesses | 1,400,000 | 54,702 |
| | | 645,703 |
Germany (0.7%) | | |
| Bayer AG | 1,994,656 | 105,883 |
| Fresenius Medical Care AG | 611,950 | 27,382 |
| | | 133,265 |
Ireland (0.3%) | | |
* | Elan Corp. PLC ADR | 7,721,600 | 55,827 |
| | | |
Japan (11.6%) | | |
| Astellas Pharma Inc. | 14,265,700 | 540,133 |
| Takeda | | |
| Pharmaceutical Co. Ltd. | 10,149,900 | 475,607 |
| Eisai Co., Ltd. | 9,693,700 | 354,085 |
| Daiichi Sankyo Co., Ltd. | 12,251,500 | 275,093 |
| Shionogi & Co., Ltd. | 9,776,000 | 209,469 |
| Tanabe Seiyaku Co., Ltd. | 6,850,000 | 101,343 |
| Chugai | | |
| Pharmaceutical Co., Ltd. | 4,101,800 | 79,121 |
| Ono | | |
| Pharmaceutical Co., Ltd. | 960,000 | 50,623 |
| Terumo Corp. | 200,000 | 6,791 |
| | | 2,092,265 |
Switzerland (6.0%) | | |
| Roche Holdings AG | 4,518,977 | 634,395 |
| Novartis AG (Registered) | 9,519,880 | 391,177 |
| Roche Holdings AG (Bearer) | 429,320 | 63,561 |
| | | 1,089,133 |
United Kingdom (3.7%) | | |
| AstraZeneca Group PLC | 15,281,500 | 588,861 |
| GlaxoSmithKline PLC ADR | 1,942,381 | 68,488 |
| | | 657,349 |
Total International | | 4,785,880 |
Total Common Stocks | | |
(Cost $15,096,285) | | 17,109,950 |
| | | Market |
| | | Value• |
| | Shares | ($000) |
Temporary Cash Investments (5.6%) | | |
Money Market Fund (0.2%) | | |
2,3 | Vanguard Market | | |
| Liquidity Fund, 0.780% | 36,111,200 | 36,111 |
| | | |
| | Face | |
| | Amount | |
| | ($000) | |
Commercial Paper (1.1%) | | |
| General Electric | | |
| Capital Corp., | | |
| 0.200%, 2/27/09 | 200,000 | 199,971 |
| | | |
Repurchase Agreement (3.5%) | | |
| Banc of America | | |
| Securities, LLC 0.280%, | | |
| 2/2/09 (Dated 1/30/09, | | |
| Repurchase Value | | |
| $623,215,000, collateralized | | |
| by Government National | | |
| Mortgage Assn. 6.000%, | | |
| 9/20/38) | 623,200 | 623,200 |
| | | |
U.S. Agency Obligations (0.8%) | | |
4 | Federal Home | | |
| Loan Bank, 0.150%, | | |
| 4/6/09 | 75,000 | 74,950 |
4 | Federal Home | | |
| Loan Mortgage Corp., | | |
| 0.140%, 4/6/09 | 75,000 | 74,951 |
| | | 149,901 |
Total Temporary Cash Investments | | |
(Cost $1,009,243) | | 1,009,183 |
Total Investments (100.4%) | | |
(Cost $16,105,528) | | 18,119,133 |
Other Assets and Liabilities—Net (–0.4%) | (64,615) |
Net Assets (100%) | | 18,054,518 |
13
Health Care Fund
| Market |
| Value• |
| ($000) |
Statement of Assets and Liabilities | |
Assets | |
Investments in Securities, at Value | 18,119,133 |
Receivables for Investment | |
Securities Sold | 124,859 |
Receivables for Capital Shares Issued | 4,514 |
Other Assets | 15,570 |
Total Assets | 18,264,076 |
Liabilities | |
Payables for Investment | |
Securities Purchased | 99,772 |
Security Lending Collateral | |
Payable to Brokers | 36,111 |
Payables for Capital Shares Redeemed | 20,349 |
Other Liabilities | 53,326 |
Total Liabilities | 209,558 |
Net Assets | 18,054,518 |
At January 31, 2009, net assets consisted of: |
| Amount |
| ($000) |
Paid-in Capital | 16,106,954 |
Overdistributed Net Investment Income | (36,939) |
Overdistributed Net Realized Gains | (29,040) |
Unrealized Appreciation (Depreciation) | |
Investment Securities | 2,013,605 |
Foreign Currencies | (62) |
Net Assets | 18,054,518 |
| |
Investor Shares—Net Assets | |
Applicable to 105,715,037 outstanding | |
$.001 par value shares of beneficial | |
interest (unlimited authorization) | 10,478,491 |
Net Asset Value Per Share— | |
Investor Shares | $99.12 |
| |
Admiral Shares—Net Assets | |
Applicable to 181,111,191 outstanding | |
$.001 par value shares of beneficial | |
interest (unlimited authorization) | 7,576,027 |
Net Asset Value Per Share— | |
Admiral Shares | $41.83 |
• | See Note A in Notes to Financial Statements. |
* | Non-income-producing security. |
^ | Part of security position is on loan to broker-dealers. The total value of securities on loan is $34,120,000. |
1 Considered an affiliated company of the fund as the fund owns more than 5% of the outstanding voting securities of such company.
2 Includes $36,111,000 of collateral received for securities on loan.
3 Affiliated money market fund available only to Vanguard funds and certain trusts and accounts managed by Vanguard. Rate shown is the 7-day yield.
4 The issuer operates under a congressional charter; its securities are neither issued nor guaranteed by the U.S. government.
ADR—American Depositary Receipt.
See accompanying Notes, which are an integral part of the Financial Statements.
14
Health Care Fund
Statement of Operations
| Year Ended |
| January 31, 2009 |
| ($000) |
Investment Income | |
Income | |
Dividends1,2 | 378,018 |
Interest | 31,778 |
Security Lending | 4,145 |
Total Income | 413,941 |
Expenses | |
Investment Advisory Fees—Note B | 23,765 |
The Vanguard Group—Note C | |
Management and Administrative—Investor Shares | 18,610 |
Management and Administrative—Admiral Shares | 7,556 |
Marketing and Distribution—Investor Shares | 2,353 |
Marketing and Distribution—Admiral Shares | 1,648 |
Custodian Fees | 1,376 |
Auditing Fees | 24 |
Shareholders’ Reports—Investor Shares | 238 |
Shareholders’ Reports—Admiral Shares | 22 |
Trustees’ Fees and Expenses | 29 |
Total Expenses | 55,621 |
Expenses Paid Indirectly | (249) |
Net Expenses | 55,372 |
Net Investment Income | 358,569 |
Realized Net Gain (Loss) | |
Investment Securities Sold2 | 1,394,811 |
Foreign Currencies and Forward Currency Contracts | 66,023 |
Realized Net Gain (Loss) | 1,460,834 |
Change in Unrealized Appreciation (Depreciation) | |
Investment Securities | (5,974,721) |
Foreign Currencies and Forward Currency Contracts | (1,032) |
Change in Unrealized Appreciation (Depreciation) | (5,975,753) |
Net Increase (Decrease) in Net Assets Resulting from Operations | (4,156,350) |
1 Dividends are net of foreign withholding taxes of $18,259,000.
2 Dividend income and realized net gain (loss) from affiliated companies of the fund were $2,555,000 and $18,483,000, respectively.
See accompanying Notes, which are an integral part of the Financial Statements.
15
Health Care Fund
Statement of Changes in Net Assets
| Year Ended January 31, |
| 2009 | 2008 |
| ($000) | ($000) |
Increase (Decrease) in Net Assets | | |
Operations | | |
Net Investment Income | 358,569 | 493,984 |
Realized Net Gain (Loss) | 1,460,834 | 1,822,275 |
Change in Unrealized Appreciation (Depreciation) | (5,975,753) | (2,755,175) |
Net Increase (Decrease) in Net Assets Resulting from Operations | (4,156,350) | (438,916) |
Distributions | | |
Net Investment Income | | |
Investor Shares | (187,362) | (277,864) |
Admiral Shares | (143,549) | (212,406) |
Realized Capital Gain1 | | |
Investor Shares | (936,594) | (1,084,200) |
Admiral Shares | (684,776) | (782,841) |
Total Distributions | (1,952,281) | (2,357,311) |
Capital Share Transactions | | |
Investor Shares | (324,652) | (757,827) |
Admiral Shares | (339,252) | 900,247 |
Net Increase (Decrease) from Capital Share Transactions | (663,904) | 142,420 |
Total Increase (Decrease) | (6,772,535) | (2,653,807) |
Net Assets | | |
Beginning of Period | 24,827,053 | 27,480,860 |
End of Period2 | 18,054,518 | 24,827,053 |
1 Includes fiscal 2009 and 2008 short-term gain distributions totaling $47,615,000 and $40,898,000, respectively. Short-term gain distributions are treated as ordinary income dividends for tax purposes.
2 Net Assets—End of Period includes undistributed (overdistributed) net investment income of ($36,939,000) and ($35,789,000).
See accompanying Notes, which are an integral part of the Financial Statements.
16
Health Care Fund
Financial Highlights
Investor Shares | | | | | |
| | | | | |
For a Share Outstanding | Year Ended January 31, |
Throughout Each Period | 2009 | 2008 | 2007 | 2006 | 2005 |
Net Asset Value, Beginning of Period | $133.80 | $149.69 | $143.39 | $123.84 | $124.29 |
Investment Operations | | | | | |
Net Investment Income | 1.998 | 2.7661 | 1.953 | 1.753 | 1.272 |
Net Realized and Unrealized Gain (Loss) | | | | | |
on Investments | (25.229) | (5.317) | 13.107 | 24.424 | 3.385 |
Total from Investment Operations | (23.231) | (2.551) | 15.060 | 26.177 | 4.657 |
Distributions | | | | | |
Dividends from Net Investment Income | (1.925) | (2.747) | (2.100) | (1.542) | (1.112) |
Distributions from Realized Capital Gains | (9.524) | (10.592) | (6.660) | (5.085) | (3.995) |
Total Distributions | (11.449) | (13.339) | (8.760) | (6.627) | (5.107) |
Net Asset Value, End of Period | $99.12 | $133.80 | $149.69 | $143.39 | $123.84 |
| | | | | |
Total Return2 | –17.44% | –1.97% | 10.85% | 21.49% | 3.76% |
| | | | | |
Ratios/Supplemental Data | | | | | |
Net Assets, End of Period (Millions) | $10,478 | $14,314 | $16,662 | $17,198 | $19,087 |
Ratio of Total Expenses to | | | | | |
Average Net Assets | 0.29% | 0.26% | 0.25% | 0.25% | 0.22% |
Ratio of Net Investment Income to | | | | | |
Average Net Assets | 1.64% | 1.78%1 | 1.33% | 1.29% | 1.02% |
Portfolio Turnover Rate | 12% | 9% | 8% | 14% | 13% |
1 Net investment income per share and the ratio of net investment income to average net assets include $0.585 and 0.40%, respectively, resulting from a special dividend from Health Management Associates Class A in March 2007.
2 Total returns do not reflect the 1% fee assessed on redemptions after March 23, 2005, of shares held for less than one year, or the 1% fee assessed until March 23, 2005, on shares purchased on or after April 19, 1999, and held for less than five years. Total returns do not include the account service fee that may be applicable to certain accounts with balances below $10,000.
See accompanying Notes, which are an integral part of the Financial Statements.
17
Health Care Fund
Financial Highlights
Admiral Shares | | | | | |
| | | | | |
For a Share Outstanding | Year Ended January 31, |
Throughout Each Period | 2009 | 2008 | 2007 | 2006 | 2005 |
Net Asset Value, Beginning of Period | $56.47 | $63.19 | $60.52 | $52.25 | $52.44 |
Investment Operations | | | | | |
Net Investment Income | .879 | 1.2201 | .877 | .779 | .576 |
Net Realized and Unrealized Gain (Loss) | | | | | |
on Investments | (10.648) | (2.257) | 5.542 | 10.328 | 1.431 |
Total from Investment Operations | (9.769) | (1.037) | 6.419 | 11.107 | 2.007 |
Distributions | | | | | |
Dividends from Net Investment Income | (.852) | (1.212) | (.938) | (.690) | (.511) |
Distributions from Realized Capital Gains | (4.019) | (4.471) | (2.811) | (2.147) | (1.686) |
Total Distributions | (4.871) | (5.683) | (3.749) | (2.837) | (2.197) |
Net Asset Value, End of Period | $41.83 | $56.47 | $63.19 | $60.52 | $52.25 |
| | | | | |
Total Return2 | –17.38% | –1.90% | 10.96% | 21.62% | 3.84% |
| | | | | |
Ratios/Supplemental Data | | | | | |
Net Assets, End of Period (Millions) | $7,576 | $10,513 | $10,819 | $9,123 | $2,819 |
Ratio of Total Expenses to | | | | | |
Average Net Assets | 0.22% | 0.18% | 0.17% | 0.14% | 0.15% |
Ratio of Net Investment Income to | | | | | |
Average Net Assets | 1.71% | 1.86%1 | 1.41% | 1.40% | 1.10% |
Portfolio Turnover Rate | 12% | 9% | 8% | 14% | 13% |
1 Net investment income per share and the ratio of net investment income to average net assets include $0.247 and 0.40%, respectively, resulting from a special dividend from Health Management Associates Class A in March 2007.
2 Total returns do not reflect the 1% fee assessed on redemptions after March 23, 2005, of shares held for less than one year, or the 1% fee previously assessed on shares held for less than five years.
See accompanying Notes, which are an integral part of the Financial Statements.
18
Health Care Fund
Notes to Financial Statements
Vanguard Health Care Fund is registered under the Investment Company Act of 1940 as an open-end investment company, or mutual fund. The fund invests in securities of foreign issuers, which may subject it to investment risks not normally associated with investing in securities of U.S. corporations. The fund offers two classes of shares, Investor Shares and Admiral Shares. Investor Shares are available to any investor who meets the fund’s minimum purchase requirements. Admiral Shares are designed for investors who meet certain administrative, service, tenure, and account-size criteria.
A. The following significant accounting policies conform to generally accepted accounting principles for U.S. mutual funds. The fund consistently follows such policies in preparing its financial statements.
1. Security Valuation: Securities are valued as of the close of trading on the New York Stock Exchange (generally 4 p.m., Eastern time) on the valuation date. Equity securities are valued at the latest quoted sales prices or official closing prices taken from the primary market in which each security trades; such securities not traded on the valuation date are valued at the mean of the latest quoted bid and asked prices. Securities for which market quotations are not readily available, or whose values have been affected by events occurring before the fund’s pricing time but after the close of the securities’ primary markets, are valued at their fair values calculated according to procedures adopted by the board of trustees. These procedures include obtaining quotations from an independent pricing service, monitoring news to identify significant market- or security-specific events, and evaluating changes in the values of foreign market proxies (for example, ADRs, futures contracts, or exchange-traded funds), between the time the foreign markets close and the fund’s pricing time. When fair-value pricing is employed, the prices of securities used by a fund to calculate its net asset value may differ from quoted or published prices for the same securities. Investments in Vanguard Market Liquidity Fund are valued at that fund’s net asset value. Temporary cash investments acquired over 60 days to maturity are valued using the latest bid prices or using valuations based on a matrix system (which considers such factors as security prices, yields, maturities, and ratings), both as furnished by independent pricing services. Other temporary cash investments are valued at amortized cost, which approximates market value.
2. Foreign Currency: Securities and other assets and liabilities denominated in foreign currencies are translated into U.S. dollars using exchange rates obtained from an independent third party as of the fund’s pricing time on the valuation date. Realized gains (losses) and unrealized appreciation (depreciation) on investment securities include the effects of changes in exchange rates since the securities were purchased, combined with the effects of changes in security prices. Fluctuations in the value of other assets and liabilities resulting from changes in exchange rates are recorded as unrealized foreign currency gains (losses) until the assets or liabilities are settled in cash, at which time they are recorded as realized foreign currency gains (losses).
3. Forward Currency Contracts: The fund enters into forward currency contracts to protect the value of securities and related receivables and payables against changes in future foreign exchange rates. The fund’s risks in using these contracts include movement in the values of the foreign currencies relative to the U.S. dollar and the ability of the counterparties to fulfill their obligations under the contracts.
19
Health Care Fund
Forward currency contracts are valued at their quoted daily settlement prices. The aggregate principal amounts of the contracts are not recorded in the Statement of Net Assets. Fluctuations in the value of the contracts are recorded in the Statement of Net Assets as an asset (liability) and in the Statement of Operations as unrealized appreciation (depreciation) until the contracts are closed, when they are recorded as realized forward currency contract gains (losses).
4. Repurchase Agreements: The fund may invest in repurchase agreements. Securities pledged as collateral for repurchase agreements are held by a custodian bank until the agreements mature. Each agreement requires that the market value of the collateral be sufficient to cover payments of interest and principal; however, in the event of default or bankruptcy by the other party to the agreement, retention of the collateral may be subject to legal proceedings.
5. Federal Income Taxes: The fund intends to continue to qualify as a regulated investment company and distribute all of its taxable income. Management has analyzed the fund’s tax positions taken on federal income tax returns for all open tax years (tax years ended January 31, 2006–2009), and has concluded that no provision for federal income tax is required in the fund’s financial statements.
6. Distributions: Distributions to shareholders are recorded on the ex-dividend date.
7. Security Lending: The fund may lend its securities to qualified institutional borrowers to earn additional income. Security loans are required to be secured at all times by collateral at least equal to the market value of securities loaned. The fund invests cash collateral received in Vanguard Market Liquidity Fund, and records a liability for the return of the collateral, during the period the securities are on loan. Security lending income represents the income earned on investing cash collateral, less expenses associated with the loan.
8. Other: Dividend income is recorded on the ex-dividend date. Interest income is accrued daily. Premiums and discounts on debt securities purchased are amortized and accreted, respectively, to interest income over the lives of the respective securities. Security transactions are accounted for on the date securities are bought or sold. Costs used to determine realized gains (losses) on the sale of investment securities are those of the specific securities sold. Fees assessed on redemptions of capital shares are credited to paid-in capital.
Each class of shares has equal rights as to assets and earnings, except that each class separately bears certain class-specific expenses related to maintenance of shareholder accounts (included in Management and Administrative expenses) and shareholder reporting. Marketing and distribution expenses are allocated to each class of shares based on a method approved by the board of trustees. Income, other non-class-specific expenses, and gains and losses on investments are allocated to each class of shares based on its relative net assets.
B. Wellington Management Company, LLP, provides investment advisory services to the fund for a fee calculated at an annual percentage rate of average net assets. For the year ended January 31, 2009, the investment advisory fee represented an effective annual rate of 0.11% of the fund’s average net assets.
20
Health Care Fund
C. The Vanguard Group furnishes at cost corporate management, administrative, marketing, and distribution services. The costs of such services are allocated to the fund under methods approved by the board of trustees. The fund has committed to provide up to 0.40% of its net assets in capital contributions to Vanguard. At January 31, 2009, the fund had contributed capital of $4,789,000 to Vanguard (included in Other Assets), representing 0.03% of the fund’s net assets and 1.92% of Vanguard’s capitalization. The fund’s trustees and officers are also directors and officers of Vanguard.
D. The fund has asked its investment advisor to direct certain security trades, subject to obtaining the best price and execution, to brokers who have agreed to rebate to the fund part of the commissions generated. Such rebates are used solely to reduce the fund’s management and administrative expenses. The fund’s custodian bank has also agreed to reduce its fees when the fund maintains cash on deposit in the non-interest-bearing custody account. For the year ended January 31, 2009, these arrangements reduced the fund’s management and administrative expenses by $222,000 and custodian fees by $27,000. The total expense reduction represented an effective annual rate of 0.00% of the fund’s average net assets.
E. Distributions are determined on a tax basis and may differ from net investment income and realized capital gains for financial reporting purposes. Differences may be permanent or temporary. Permanent differences are reclassified among capital accounts in the financial statements to reflect their tax character. Temporary differences arise when certain items of income, expense, gain, or loss are recognized in different periods for financial statement and tax purposes; these differences will reverse at some time in the future. Differences in classification may also result from the treatment of short-term gains as ordinary income for tax purposes.
During the year ended January 31, 2009, the fund realized net foreign currency gains of $617,000, which increased distributable net income for tax purposes; accordingly, such gains have been reclassified from overdistributed net realized gains to overdistributed net investment income.
The fund used a tax accounting practice to treat a portion of the price of capital shares redeemed during the year as distributions from net investment income and realized capital gains. Accordingly, the fund has reclassified $29,425,000 from overdistributed net investment income, and $114,835,000 from overdistributed net realized gains, to paid-in capital.
For tax purposes, at January 31, 2009, the fund had $9,048,000 of ordinary income and no long-term capital gains available for distribution.
At January 31, 2009, the cost of investment securities for tax purposes was $16,134,568,000. Net unrealized appreciation of investment securities for tax purposes was $1,984,565,000, consisting of unrealized gains of $4,340,959,000 on securities that had risen in value since their purchase and $2,356,394,000 in unrealized losses on securities that had fallen in value since their purchase.
F. During the year ended January 31, 2009, the fund purchased $2,473,757,000 of investment securities and sold $3,806,308,000 of investment securities, other than temporary cash investments.
21
Health Care Fund
G. Capital shares transactions for each class of shares were:
| | | Year Ended January 31, |
| | 2009 | | 2008 |
| Amount | Shares | Amount | Shares |
| ($000) | (000) | ($000) | (000) |
Investor Shares | | | | |
Issued | 683,036 | 5,807 | 677,166 | 4,534 |
Issued in Lieu of Cash Distributions | 1,073,783 | 10,605 | 1,302,730 | 9,323 |
Redeemed1 | (2,081,471) | (17,676) | (2,737,723) | (18,187) |
Net Increase (Decrease)—Investor Shares | (324,652) | (1,264) | (757,827) | (4,330) |
Admiral Shares | | | | |
Issued | 478,417 | 9,423 | 1,267,202 | 19,746 |
Issued in Lieu of Cash Distributions | 738,966 | 17,282 | 895,071 | 15,187 |
Redeemed1 | (1,556,635) | (31,749) | (1,262,026) | (19,999) |
Net Increase (Decrease)—Admiral Shares | (339,252) | (5,044) | 900,247 | 14,934 |
H. Certain of the fund’s investments are in companies that are considered to be affiliated companies of the fund because the fund owns more than 5% of the outstanding voting securities of the company. Transactions during the period in securities of these companies were as follows:
| | | Current Period Transactions | |
| Jan. 31, 2008 | | Proceeds from | | Jan. 31, 2009 |
| Market | Purchases | Securities | Dividend | Market |
| Value | at Cost | Sold | Income | Value |
| ($000) | ($000) | ($000) | ($000) | ($000) |
Cerner Corp. | 209,600 | 9,543 | 12,151 | — | NA2 |
Coventry Health Care Inc. | NA3 | 146,839 | — | — | 142,015 |
Forest Laboratories, Inc. | 1,163,921 | 36,210 | 5,343 | — | 754,530 |
Health Management | | | | | |
Associates Class A | 84,930 | — | — | — | 25,053 |
OSI Pharmaceuticals, Inc. | 138,782 | — | — | — | 123,888 |
Owens & Minor, Inc. | 86,772 | — | 4,533 | 1,620 | NA2 |
PAREXEL International Corp. | NA3 | 3,705 | 2,604 | — | 31,059 |
Perrigo Co. | 151,116 | — | 17,817 | 935 | NA2 |
| 1,835,121 | | | 2,555 | 1,076,545 |
1 Net of redemption fees for fiscal 2009 and 2008 of $1,038,000 and $607,000, respectively (fund totals).
2 At January 31, 2009, the security was still held, but the issuer is no longer an affiliated company of the fund.
3 At January 31, 2008, the issuer was not an affiliated company of the fund.
22
Health Care Fund
I. In September 2006, the Financial Accounting Standards Board issued Statement of Financial Accounting Standards No. 157 (“FAS 157”), “Fair Value Measurements.” FAS 157 establishes a framework for measuring fair value and expands disclosures about fair value measurements in financial statements.
The various inputs that may be used to determine the value of the fund’s investments are summarized in three broad levels. The inputs or methodologies used for valuing securities are not necessarily an indication of the risk associated with investing in those securities.
Level 1—Quoted prices in active markets for identical securities.
Level 2—Other significant observable inputs (including quoted prices for similar securities, interest rates, prepayment speeds, credit risk, etc.).
Level 3—Significant unobservable inputs (including the fund’s own assumptions used to determine the fair value of investments).
The following table summarizes the fund’s investments as of January 31, 2009, based on the inputs used to value them:
| Investments |
| in Securities |
Valuation Inputs | ($000) |
Level 1—Quoted prices | 12,484,497 |
Level 2—Other significant observable inputs | 5,634,636 |
Level 3—Significant unobservable inputs | — |
Total | 18,119,133 |
23
Report of Independent Registered Public Accounting Firm
To the Trustees of Vanguard Specialized Funds and the Shareholders of Vanguard Health Care Fund:
In our opinion, the accompanying statements of net assets and of assets and liabilities and the related statements of operations and of changes in net assets and the financial highlights present fairly, in all material respects, the financial position of Vanguard Health Care Fund (constituting a separate portfolio of Vanguard Specialized Funds, hereafter referred to as the “Fund”) at January 31, 2009, the results of its operations for the year then ended, the changes in its net assets for each of the two years in the period then ended and the financial highlights for each of the five years in the period then ended, in conformity with accounting principles generally accepted in the United States of America. These financial statements and financial highlights (hereafter referred to as “financial statements”) are the responsibility of the Fund’s management; our responsibility is to express an opinion on these financial statements based on our audits. We conducted our audits of these financial statements in accordance with the standards of the Public Company Accounting Oversight Board (United States). Those standards require that we plan and perform the audit to obtain reasonable assurance about whether the financial statements are free of material misstatement. An audit includes examining, on a test basis, evidence supporting the amounts and disclosures in the financial statements, assessing the accounting principles used and significant estimates made by management, and evaluating the overall financial statement presentation. We believe that our audits, which included confirmation of securities at January 31, 2009 by correspondence with the custodians and brokers, and by agreement to the underlying ownership records for Vanguard Market Liquidity Fund, provide a reasonable basis for our opinion.
PricewaterhouseCoopers LLP
Philadelphia, Pennsylvania
March 20, 2009
Special 2008 tax information (unaudited) for Vanguard Health Care Fund |
This information for the fiscal year ended January 31, 2009, is included pursuant to provisions of the Internal Revenue Code.
The fund distributed $1,684,696,000 as capital gain dividends (from net long-term capital gains) to shareholders during the fiscal year.
The fund distributed $323,300,000 of qualified dividend income to shareholders during the fiscal year.
For corporate shareholders, 49.7% of investment income (dividend income plus short-term gains, if any) qualifies for the dividends-received deduction.
24
Your Fund’s After-Tax Returns
This table presents returns for your fund both before and after taxes. The after-tax returns are shown in two ways: (1) assuming that an investor owned the fund during the entire period and paid taxes on the fund’s distributions, and (2) assuming that an investor paid taxes on the fund’s distributions and sold all shares at the end of each period.
Calculations are based on the highest individual federal income tax and capital gains tax rates in effect at the times of the distributions and the hypothetical sales. State and local taxes were not considered. After-tax returns reflect any qualified dividend income, using actual prior-year figures and estimates for 2009. (In the example, returns after the sale of fund shares may be higher than those assuming no sale. This occurs when the sale would have produced a capital loss. The calculation assumes that the investor received a tax deduction for the loss.)
The table shows returns for Investor Shares only; returns for other share classes will differ. Please note that your actual after-tax returns will depend on your tax situation and may differ from those shown. Also note that if you own the fund in a tax-deferred account, such as an individual retirement account or a 401(k) plan, this information does not apply to you. Such accounts are not subject to current taxes.
Finally, keep in mind that a fund’s performance—whether before or after taxes—does not guarantee future results.
Average Annual Total Returns: Health Care Fund Investor Shares1 |
Periods Ended January 31, 2009 | | | |
| One | Five | Ten |
| Year | Years | Years |
Returns Before Taxes | –17.44% | 2.49% | 7.62% |
Returns After Taxes on Distributions | –18.77 | 1.37 | 6.15 |
Returns After Taxes on Distributions and Sale of Fund Shares | –9.65 | 2.14 | 6.26 |
1 Total returns do not reflect the 1% fee assessed on redemptions of shares held less than one year, nor do they include the account service fee that may be applicable to certain accounts with balances below $10,000.
25
About Your Fund’s Expenses
As a shareholder of the fund, you incur ongoing costs, which include costs for portfolio management, administrative services, and shareholder reports (like this one), among others. Operating expenses, which are deducted from a fund’s gross income, directly reduce the investment return of the fund.
A fund’s expenses are expressed as a percentage of its average net assets. This figure is known as the expense ratio. The following examples are intended to help you understand the ongoing costs (in dollars) of investing in your fund and to compare these costs with those of other mutual funds. The examples are based on an investment of $1,000 made at the beginning of the period shown and held for the entire period.
The accompanying table illustrates your fund’s costs in two ways:
• Based on actual fund return. This section helps you to estimate the actual expenses that you paid over the period. The “Ending Account Value” shown is derived from the fund’s actual return, and the third column shows the dollar amount that would have been paid by an investor who started with $1,000 in the fund. You may use the information here, together with the amount you invested, to estimate the expenses that you paid over the period.
To do so, simply divide your account value by $1,000 (for example, an $8,600 account value divided by $1,000 = 8.6), then multiply the result by the number given for your fund under the heading “Expenses Paid During Period.”
• Based on hypothetical 5% yearly return. This section is intended to help you compare your fund’s costs with those of other mutual funds. It assumes that the fund had a yearly return of 5% before expenses, but that the expense ratio is unchanged. In this case—because the return used is not the fund’s actual return—the results do not apply to your investment. The example is useful in making comparisons because the Securities and Exchange Commission requires all mutual funds to calculate expenses based on a 5% return. You can assess your fund’s costs by comparing this hypothetical example with the hypothetical examples that appear in shareholder reports of other funds.
Six Months Ended January 31, 2009 | | | |
| Beginning | Ending | Expenses |
| Account Value | Account Value | Paid During |
Health Care Fund | 7/31/2008 | 1/31/2009 | Period1 |
Based on Actual Fund Return | | | |
Investor Shares | $1,000.00 | $836.68 | $1.48 |
Admiral Shares | 1,000.00 | 836.91 | 1.16 |
Based on Hypothetical 5% Yearly Return | | | |
Investor Shares | $1,000.00 | $1,023.59 | $1.63 |
Admiral Shares | 1,000.00 | 1,023.95 | 1.28 |
1 The calculations are based on expenses incurred in the most recent six-month period. The fund’s annualized six-month expense ratios for that period are 0.32% for Investor Shares and 0.25% for Admiral Shares. The dollar amounts shown as “Expenses Paid” are equal to the annualized expense ratio multiplied by the average account value over the period, multiplied by the number of days in the most recent six-month period, then divided by the number of days in the most recent 12-month period.
26
Note that the expenses shown in the table are meant to highlight and help you compare ongoing costs only and do not reflect transaction costs incurred by the fund for buying and selling securities. Further, the expenses do not include the 1% fee on redemptions of shares held for less than one year, nor do they include the account service fee described in the prospectus. If such fees were applied to your account, your costs would be higher. Your fund does not carry a “sales load.”
The calculations assume no shares were bought or sold during the period. Your actual costs may have been higher or lower, depending on the amount of your investment and the timing of any purchases or redemptions.
You can find more information about the fund’s expenses, including annual expense ratios, in the Financial Statements section of this report. For additional information on operating expenses and other shareholder costs, please refer to your fund’s current prospectus.
27
Glossary
Beta. A measure of the magnitude of a fund’s past share-price fluctuations in relation to the ups and downs of a given market index. The index is assigned a beta of 1.00. Compared with a given index, a fund with a beta of 1.20 typically would have seen its share price rise or fall by 12% when the index rose or fell by 10%. For this report, beta is based on returns over the past 36 months for both the fund and the index. Note that a fund’s beta should be reviewed in conjunction with its R-squared (see definition). The lower the R-squared, the less correlation there is between the fund and the index, and the less reliable beta is as an indicator of volatility.
Earnings Growth Rate. The average annual rate of growth in earnings over the past five years for the stocks now in a fund.
Equity Exposure. A measure that reflects a fund’s investments in stocks and stock futures. Any holdings in short-term reserves are excluded.
Expense Ratio. The percentage of a fund’s average net assets used to pay its annual administrative and advisory expenses. These expenses directly reduce returns to investors.
Foreign Holdings. The percentage of a fund represented by stocks or depositary receipts of companies based outside the United States.
Inception Date. The date on which the assets of a fund (or one of its share classes) are first invested in accordance with the fund’s investment objective. For funds with a subscription period, the inception date is the day after that period ends. Investment performance is measured from the inception date.
Median Market Cap. An indicator of the size of companies in which a fund invests; the midpoint of market capitalization (market price x shares outstanding) of a fund’s stocks, weighted by the proportion of the fund’s assets invested in each stock. Stocks representing half of the fund’s assets have market capitalizations above the median, and the rest are below it.
Price/Book Ratio. The share price of a stock divided by its net worth, or book value, per share. For a fund, the weighted average price/book ratio of the stocks it holds.
Price/Earnings Ratio. The ratio of a stock’s current price to its per-share earnings over the past year. For a fund, the weighted average P/E of the stocks it holds. P/E is an indicator of market expectations about corporate prospects; the higher the P/E, the greater the expectations for a company’s future growth.
R-Squared. A measure of how much of a fund’s past returns can be explained by the returns from the market in general, as measured by a given index. If a fund’s total returns were precisely synchronized with an index’s returns, its R-squared would be 1.00. If the fund’s returns bore no relationship to the index’s returns, its R-squared would be 0. For this report, R-squared is based on returns over the past 36 months for both the fund and the index.
Return on Equity. The annual average rate of return generated by a company during the past five years for each dollar of shareholder’s equity (net income divided by shareholder’s equity). For a fund, the weighted average return on equity for the companies whose stocks it holds.
Short-Term Reserves. The percentage of a fund invested in highly liquid, short-term securities that can be readily converted to cash.
28
Turnover Rate. An indication of the fund’s trading activity. Funds with high turnover rates incur higher transaction costs and may be more likely to distribute capital gains (which may be taxable to investors). The turnover rate excludes in-kind transactions, which have minimal impact on costs.
Yield. A fund’s 30-day SEC yield is derived using a formula specified by the U.S. Securities and Exchange Commission. Under the formula, data related to the fund’s security holdings in the previous 30 days are used to calculate the fund’s hypothetical net income for that period, which is then annualized and divided by the fund’s estimated average net assets over the calculation period. For the purposes of this calculation, a security’s income is based on its current market yield to maturity (in the case of bonds) or its projected dividend yield (for stocks). Because the SEC yield represents hypothetical annualized income, it will differ—at times significantly—from the fund’s actual experience. As a result, the fund’s income distributions may be higher or lower than implied by the SEC yield.
29
This page intentionally left blank.
This page intentionally left blank.
The People Who Govern Your Fund
The trustees of your mutual fund are there to see that the fund is operated and managed in your best interests since, as a shareholder, you are a part owner of the fund. Your fund’s trustees also serve on the board of directors of The Vanguard Group, Inc., which is owned by the Vanguard funds and provides services to them on an at-cost basis.
A majority of Vanguard’s board members are independent, meaning that they have no affiliation with Vanguard or the funds they oversee, apart from the sizable personal investments they have made as private individuals. The independent board members have distinguished backgrounds in business, academia, and public service. Each of the trustees and executive officers oversees 156 Vanguard funds.
The following table provides information for each trustee and executive officer of the fund. More information about the trustees is in the Statement of Additional Information, which can be obtained, without charge, by contacting Vanguard at 800-662-7447, or online at www.vanguard.com.
Chairman of the Board and Interested Trustee | Rajiv L. Gupta |
| Born 1945. Trustee Since December 2001.2 Principal |
John J. Brennan1 | Occupation(s) During the Past Five Years: Chairman, |
Born 1954. Trustee Since May 1987. Chairman of | President, and Chief Executive Officer of Rohm and |
the Board. Principal Occupation(s) During the Past Five | Haas Co. (chemicals); Board Member of the American |
Years: Chairman of the Board and Director/Trustee of | Chemistry Council; Director of Tyco International, Ltd. |
The Vanguard Group, Inc., and of each of the investment | (diversified manufacturing and services), since 2005. |
companies served by The Vanguard Group; Chief | |
Executive Officer and President of The Vanguard Group | |
and of each of the investment companies served by The | Amy Gutmann |
Vanguard Group (1996–2008). | Born 1949. Trustee Since June 2006. Principal |
| Occupation(s) During the Past Five Years: President of |
| the University of Pennsylvania since 2004; Professor in |
Independent Trustees | the School of Arts and Sciences, Annenberg School for |
| Communication, and Graduate School of Education of |
| the University of Pennsylvania since 2004; Provost |
Charles D. Ellis | (2001–2004) and Laurance S. Rockefeller Professor of |
Born 1937. Trustee Since January 2001. Principal | Politics and the University Center for Human Values |
Occupation(s) During the Past Five Years: Applecore | (1990–2004), Princeton University; Director of Carnegie |
Partners (pro bono ventures in education); Senior | Corporation of New York since 2005 and of Schuylkill |
Advisor to Greenwich Associates (international business | River Development Corporation and Greater Philadelphia |
strategy consulting); Successor Trustee of Yale University; | Chamber of Commerce since 2004; Trustee of the |
Overseer of the Stern School of Business at New York | National Constitution Center since 2007. |
University; Trustee of the Whitehead Institute for | |
Biomedical Research. | |
| JoAnn Heffernan Heisen |
| Born 1950. Trustee Since July 1998. Principal |
Emerson U. Fullwood | Occupation(s) During the Past Five Years: Retired |
Born 1948. Trustee Since January 2008. Principal | Corporate Vice President, Chief Global Diversity Officer, |
Occupation(s) During the Past Five Years: Retired | and Member of the Executive Committee of Johnson & |
Executive Chief Staff and Marketing Officer for | Johnson (pharmaceuticals/consumer products); Vice |
North America and Corporate Vice President of | President and Chief Information Officer (1997–2005) |
Xerox Corporation (photocopiers and printers); | of Johnson & Johnson; Director of the University |
Director of SPX Corporation (multi-industry | Medical Center at Princeton and Women’s Research |
manufacturing), of the United Way of Rochester, | and Education Institute. |
and of the Boy Scouts of America. | |
André F. Perold | F. William McNabb III1 | |
Born 1952. Trustee Since December 2004. Principal | Born 1957. Chief Executive Officer Since August 2008. |
Occupation(s) During the Past Five Years: George Gund | President Since March 2008. Principal Occupation(s) |
Professor of Finance and Banking, Senior Associate | During the Past Five Years: Chief Executive Officer, |
Dean, and Director of Faculty Recruiting, Harvard | Director, and President of The Vanguard Group, Inc., |
Business School; Director and Chairman of UNX, Inc. | since 2008; Chief Executive Officer and President of |
(equities trading firm); Chair of the Investment | each of the investment companies served by The |
Committee of HighVista Strategies LLC (private | Vanguard Group since 2008; Director of Vanguard |
investment firm) since 2005. | Marketing Corporation; Managing Director of The |
| Vanguard Group (1995–2008). |
| | |
Alfred M. Rankin, Jr. | | |
Born 1941. Trustee Since January 1993. Principal | Heidi Stam1 | |
Occupation(s) During the Past Five Years: Chairman, | Born 1956. Secretary Since July 2005. Principal |
President, Chief Executive Officer, and Director of | Occupation(s) During the Past Five Years: Managing |
NACCO Industries, Inc. (forklift trucks/housewares/ | Director of The Vanguard Group, Inc., since 2006; |
lignite); Director of Goodrich Corporation (industrial | General Counsel of The Vanguard Group since 2005; |
products/aircraft systems and services). | Secretary of The Vanguard Group and of each of the |
| investment companies served by The Vanguard Group |
| since 2005; Director and Senior Vice President of |
J. Lawrence Wilson | Vanguard Marketing Corporation since 2005; Principal |
Born 1936. Trustee Since April 1985. Principal | of The Vanguard Group (1997–2006). |
Occupation(s) During the Past Five Years: Retired | | |
Chairman and Chief Executive Officer of Rohm and | | |
Haas Co. (chemicals); Director of Cummins Inc. (diesel | Vanguard Senior Management Team |
engines) and AmerisourceBergen Corp. (pharmaceutical | | |
distribution); Trustee of Vanderbilt University and of | | |
Culver Educational Foundation. | R. Gregory Barton | Michael S. Miller |
| Mortimer J. Buckley | James M. Norris |
| Kathleen C. Gubanich | Glenn W. Reed |
Executive Officers | Paul A. Heller | George U. Sauter |
| | |
| | |
Thomas J. Higgins1 | Founder | |
Born 1957. Chief Financial Officer Since September | | |
2008. Principal Occupation(s) During the Past Five | | |
Years: Principal of The Vanguard Group, Inc.; Chief | John C. Bogle | |
Financial Officer of each of the investment companies | Chairman and Chief Executive Officer, 1974–1996 |
served by The Vanguard Group since 2008; Treasurer | | |
of each of the investment companies served by The | | |
Vanguard Group (1998–2008). | | |
| | |
| | |
Kathryn J. Hyatt1 | | |
Born 1955. Treasurer Since November 2008. Principal | | |
Occupation(s) During the Past Five Years: Principal of | | |
The Vanguard Group, Inc.; Treasurer of each of the | | |
investment companies served by The Vanguard | | |
Group since 2008; Assistant Treasurer of each of the | | |
investment companies served by The Vanguard Group | | |
(1988–2008). | | |
1 These individuals are “interested persons” as defined in the Investment Company Act of 1940.
2 December 2002 for Vanguard Equity Income Fund, Vanguard Growth Equity Fund, the Vanguard Municipal Bond Funds, and the Vanguard State Tax-Exempt Funds.
| 
|
| P.O. Box 2600 |
| Valley Forge, PA 19482-2600 |
Connect with Vanguard® > www.vanguard.com
Fund Information > 800-662-7447 | All comparative mutual fund data are from Lipper Inc. |
| or Morningstar, Inc., unless otherwise noted. |
Direct Investor Account Services > 800-662-2739 | |
| |
Institutional Investor Services > 800-523-1036 | You can obtain a free copy of Vanguard’s proxy voting |
| guidelines by visiting our website, www.vanguard.com, |
Text Telephone for People | and searching for “proxy voting guidelines,” or by |
With Hearing Impairment > 800-952-3335 | calling Vanguard at 800-662-2739. The guidelines are |
| also available from the SEC’s website, www.sec.gov. |
| In addition, you may obtain a free report on how your |
This material may be used in conjunction | fund voted the proxies for securities it owned during |
with the offering of shares of any Vanguard | the 12 months ended June 30. To get the report, visit |
fund only if preceded or accompanied by | either www.vanguard.com or www.sec.gov. |
the fund’s current prospectus. | |
| |
| You can review and copy information about your fund |
| at the SEC’s Public Reference Room in Washington, D.C. |
The funds or securities referred to herein are not | To find out more about this public service, call the SEC |
sponsored, endorsed, or promoted by MSCI, and MSCI | at 202-551-8090. Information about your fund is also |
bears no liability with respect to any such funds or | available on the SEC’s website, and you can receive |
securities. For any such funds or securities, the | copies of this information, for a fee, by sending a |
prospectus or the Statement of Additional Information | request in either of two ways: via e-mail addressed to |
contains a more detailed description of the limited | publicinfo@sec.gov or via regular mail addressed to the |
relationship MSCI has with The Vanguard Group and | Public Reference Section, Securities and Exchange |
any related funds. | Commission, Washington, DC 20549-0102. |
| |
| |
Russell is a trademark of The Frank Russell Company. | |
| |
| |
| |
| |
| |
| |
| |
| |
| © 2009 The Vanguard Group, Inc. |
| All rights reserved. |
| Vanguard Marketing Corporation, Distributor. |
| |
| Q520 032009 |
> | Vanguard REIT Index Fund’s Investor Shares returned –47.82% for the year ended January 31, 2009. |
> | In one of the worst 12-month periods on record for U.S. stocks, the broad market returned –38.69%. |
> | Overall, REITs weathered an unusually difficult year, as fallout from the subprime-mortgage crisis continued to rock the real estate market. |
Contents | |
| |
Your Fund’s Total Returns | 1 |
President’s Letter | 2 |
Fund Profile | 7 |
Performance Summary | 8 |
Financial Statements | 11 |
Your Fund’s After-Tax Returns | 26 |
About Your Fund’s Expenses | 27 |
Glossary | 29 |
Please note: The opinions expressed in this report are just that—informed opinions. They should not be considered promises or advice. Also, please keep in mind that the information and opinions cover the period through the date on the front of this report. Of course, the risks of investing in your fund are spelled out in the prospectus.
Your Fund’s Total Returns
Fiscal Year Ended January 31, 2009 | | |
| Ticker | Total |
| Symbol | Returns |
Vanguard REIT Index Fund | | |
Investor Shares | VGSIX | –47.82% |
Admiral™ Shares1 | VGSLX | –47.77 |
Signal® Shares2 | VGRSX | –47.77 |
Institutional Shares3 | VGSNX | –47.82 |
ETF Shares4 | VNQ | |
Market Price | | –47.39 |
Net Asset Value | | –47.77 |
Target REIT Composite5 | | –47.92 |
MSCI® US REIT Index | | –48.80 |
Average Real Estate Fund6 | | –49.47 |
Your Fund’s Performance at a Glance |
January 31, 2008–January 31, 2009 |
| | | | | |
| Starting | Ending | Distributions Per Share | |
| Share | Share | Income | Capital | Return of |
| Price | Price | Dividends | Gains | Capital |
Vanguard REIT Index Fund | | | | | |
Investor Shares | $20.38 | $10.02 | $0.571 | $0.125 | $0.282 |
Admiral Shares | 86.94 | 42.74 | 2.491 | 0.535 | 1.228 |
Signal Shares | 23.21 | 11.41 | 0.664 | 0.143 | 0.328 |
Institutional Shares | 13.46 | 6.61 | 0.386 | 0.083 | 0.191 |
ETF Shares | 61.31 | 30.14 | 1.757 | 0.377 | 0.866 |
1 A lower-cost class of shares available to many longtime shareholders and to those with significant investments in the fund.
2 Signal Shares also carry lower costs and are available to institutional shareholders who meet certain administrative, service, and account-size criteria.
3 This class of shares also carries low expenses and is available for a minimum investment of $5 million.
4 Vanguard ETFTM shares are traded on the NYSE Arca exchange and are available only through brokers. The table shows ETF returns based on both the NYSE Arca market price and the net asset value for a share. U.S. Pat. No. 6,879,964 B2; 7,337,138.
5 The Target REIT Composite consists of the MSCI US REIT Index adjusted to include a 2% cash position (Lipper Money Market Average).
6 Derived from data provided by Lipper Inc.
1

President’s Letter
Dear Shareholder,
Amid one of the worst periods on record for U.S. markets, stocks were down across the board. Unfortunately, real estate investments did not escape the market’s wrath. Investor Shares of the REIT Index Fund returned –47.82% for the fiscal year ended January 31, 2009. The fund closely tracked its target composite index, which returned –47.92% for the 12 months. The average return for competing real estate funds was –49.47%.
As of January 31, the various share classes of the REIT Index Fund yielded 8.5% to 8.6%. Please note that this yield figure is not comparable to the dividends paid by other stock funds, because REITs must distribute at least 90% of their taxable income, minus expenses, to shareholders. These distributions typically include some payments that represent capital gains and return of capital by the underlying REITs; each REIT determines these amounts at the end of its fiscal year.
If you own the fund in a taxable account, you may wish to review information about its after-tax returns provided later in this report.
Stocks fell worldwide as the credit crisis deepened
The 12 months ended January 31, 2009, represented one of the worst-ever one-year spans for stocks. The broad U.S. stock market collapsed, returning –39%; international stocks returned –45%. The
2
trouble stemmed from the financial sector, where some of the world’s largest institutions imploded, largely because of their exposure to low-quality mortgages in the United States. The effects of the credit crisis were wide and deep, with virtually no country or industry sector spared.
The stock market struggled through the first part of the fiscal year, then declined sharply in September, October, and November. December offered a brief reprieve before the market fell again in January.
In a flight to safety, investors chose low-yield Treasuries
As economic uncertainty and market volatility grew more pronounced in the second half of the year, investors sought
the relative safety of short-term government issues. This drove prices for Treasuries higher, and their yields lower. In some cases, investors were willing to accept very low—or even slightly negative—yields for the short-term safekeeping of their assets.
At the same time, the Federal Reserve Board steered short-term interest rates lower in its ongoing campaign to encourage lending. During your fund’s fiscal year, the target for the federal funds rate dropped from 3.00% to a range of 0%–0.25%.
For the full 12-month period, the broad taxable bond market returned 2.59%, and tax-exempt bonds returned –0.16%—
Market Barometer | | | |
| | Average Annual Total Returns |
| | Periods Ended January 31, 2009 |
| One Year | Three Years | Five Years |
Stocks | | | |
Russell 1000 Index (Large-caps) | –39.04% | –12.03% | –4.05% |
Russell 2000 Index (Small-caps) | –36.84 | –14.31 | –4.06 |
Dow Jones Wilshire 5000 Index (Entire market) | –38.69 | –12.03 | –3.75 |
MSCI All Country World Index ex USA (International) | –44.72 | –11.41 | 0.79 |
| | | |
Bonds | | | |
Barclays Capital U.S. Aggregate Bond Index | | | |
(Broad taxable market) | 2.59% | 5.19% | 4.30% |
Barclays Capital Municipal Bond Index | –0.16 | 3.00 | 3.33 |
Citigroup 3-Month Treasury Bill Index | 1.52 | 3.65 | 3.08 |
| | | |
CPI | | | |
Consumer Price Index | 0.03% | 2.11% | 2.66% |
3
somewhat pedestrian (if disappointing) returns that masked a year of uncommon volatility for bonds.
REITs got slammed as the mortgage crisis continued
The year that ended January 31 was a period of extreme distress for the U.S. stock market, and real estate investments were no exception. In the early 2000s, REITs began a hot streak that continued for several years. However, when the subprime-mortgage crisis started to unfold in the latter half of 2007, REITs began to decline. This trend continued throughout 2008, as real estate investment trusts experienced one of their worst years on record.
The Investor Shares of the REIT Index Fund returned –47.82% for the period, very close to the results for its benchmark, the Target REIT Composite Index (which, like the portfolio, includes a small cash position).
All areas of the REIT market suffered during the period—in fact, only a small handful of real estate stocks ended the fiscal year on a positive note. The hardest-hit REITs included firms that manage hotels, office complexes, retail spaces, and warehouses. Within the REIT market, these areas are usually the most susceptible to weakness in the broader economy.
Among residential REITs, firms that manage apartment complexes held up fairly well at first, but they started to slip
Total Returns | |
Ten Years Ended January 31, 2009 | |
| Average |
| Annual Return |
REIT Index Fund Investor Shares | 5.37% |
Target REIT Composite | 5.39 |
MSCI US REIT Index | 5.39 |
Average Real Estate Fund1 | 5.02 |
The figures shown represent past performance, which is not a guarantee of future results. (Current performance may be lower or higher than the performance data cited. For performance data current to the most recent month-end, visit our website at www.vanguard.com/performance.) Note, too, that both investment returns and principal value can fluctuate widely, so an investor’s shares, when sold, could be worth more or less than their original cost.
1 Derived from data provided by Lipper Inc.
4
during the last few months of the period, as the economic downturn put pressure on the rental market.
The portfolio’s long-term record is strong despite difficult year
This year’s returns for the REIT Index Fund may be extremely discouraging for investors; however, taking a look at the fund’s long-term results can help to ease the pain a bit. Over the last decade, the fund’s Investor Shares have returned an average of 5.37% per year. The portfolio’s returns have been in line with those of both the Target REIT Composite Index and the MSCI US REIT Index. In comparison, the average annual return for the broad stock market (as measured by the Dow Jones Wilshire 5000 Index) over the past ten years was –1.83%.
The fund’s relatively strong ten-year return reflects the generally buoyant period for real estate that preceded the current troubles. The fund’s success in capturing most of its benchmark’s return is a tribute to the indexing skills of the fund’s advisor, Vanguard Quantitative Equity Group. The advisor’s job is aided by the fund’s low operating costs, which make it easier to stay on course with the fund’s comparative standards—even in extreme investment environments.
The fund can be a good supplement to a balanced portfolio
The final months of the fiscal year ended January 31, were some of the worst months in the history of the U.S. stock market. Given its narrow focus, the REIT Index Fund typically can be expected
Expense Ratios1 |
Your Fund Compared With Its Peer Group |
| | | | | | Average |
| Investor | Admiral | Signal | Institutional | ETF | Real Estate |
| Shares | Shares | Shares | Shares | Shares | Fund |
REIT Index Fund | 0.20% | 0.10% | 0.10%2 | 0.09% | 0.10% | 1.42% |
1 The fund expense ratios shown are from the prospectuses dated May 29, 2008. For the fiscal year ended January 31, 2009, the fund’s expense ratios were 0.21% for Investor Shares, 0.11% for Admiral Shares, 0.11% for Signal Shares, 0.09% for Institutional Shares, and 0.11% for ETF Shares. The peer-group expense ratio is derived from data provided by Lipper Inc. and captures information through year-end 2008.
2 Annualized since the share-class inception on June 4, 2007. to produce returns that are more volatile than those of the broad market, but this was a period of extremes even for REITs.
5
In chaotic times like these, the temptation to react impulsively to market developments has no doubt been strong. However, we counsel shareholders to avoid making portfolio changes based solely on current market conditions. We encourage you to carefully build a portfolio that contains a mix of stock, bond, and money market funds appropriate for your long-term goals. A well-balanced portfolio can provide you with some protection from the market’s extreme ups and downs, while also giving you the opportunity for long-term growth.
Its extremely low costs, proven history of closely tracking its index, and broad diversification among real estate investments can make the REIT Index Fund a valuable addition to such a balanced portfolio, provided that you can tolerate the dramatic ups and downs that may accompany an investment in the fund.
Thank you for entrusting your assets to Vanguard.
Sincerely,

F. William McNabb III
President and Chief Executive Officer
February 13, 2009
Vanguard REIT ETF |
Premium/Discount: September 23, 20041–January 31, 2009 |
| | | | |
| Market Price Above or | Market Price Below |
| Equal to Net Asset Value | | Net Asset Value |
| Number | Percentage | Number | Percentage |
Basis Point Differential2 | of Days | of Total Days | of Days | of Total Days |
0–24.9 | 475 | 43.27% | 551 | 50.19% |
25–49.9 | 24 | 2.19 | 23 | 2.09 |
50–74.9 | 11 | 1.00 | 2 | 0.18 |
75–100.0 | 3 | 0.27 | 2 | 0.18 |
>100.0 | 4 | 0.36 | 3 | 0.27 |
Total | 517 | 47.09% | 581 | 52.91% |
| | | | | |
1 Inception.
2 One basis point equals 1/100 of a percentage point.
6
REIT Index Fund
Fund Profile
As of January 31, 2009
Portfolio Characteristics | | |
| | Comparative | Broad |
| Fund | Index1 | Index2 |
Number of Stocks | 99 | 99 | 4,554 |
Median Market Cap | $2.6B | $2.6B | $24.3B |
Price/Earnings Ratio | 18.7x | 18.7x | 11.7x |
Price/Book Ratio | 1.1x | 1.1x | 1.6x |
Yield3 | — | 8.5% | 2.9% |
Investor Shares | 8.5% | | |
Admiral Shares | 8.6% | | |
Signal Shares | 8.6% | | |
Institutional Shares | 8.6% | | |
ETF Shares | 8.6% | | |
Return on Equity | 8.3% | 8.3% | 21.1% |
Earnings Growth Rate | 2.0% | 2.0% | 18.3% |
Foreign Holdings | 0.0% | 0.0% | 0.0% |
Turnover Rate | 10% | — | — |
Expense Ratio | | | |
(1/31/2008)4 | | — | — |
Investor Shares | 0.20% | | |
Admiral Shares | 0.10% | | |
Signal Shares | 0.10%5 | | |
Institutional Shares | 0.09% | | |
ETF Shares | 0.10% | | |
Short-Term Reserves | 1.8% | — | — |
Fund Allocation by REIT Type | |
(% of equity exposure) | |
| |
Specialized | 28.8% |
Retail | 23.6 |
Residential | 17.2 |
Office | 16.0 |
Diversified | 9.6 |
Industrial | 4.8 |
Volatility Measures6 | |
| Fund Versus | Fund Versus |
| Target Index7 | Broad Index2 |
R-Squared | 1.00 | 0.63 |
Beta | 1.00 | 1.52 |
Ten Largest Holdings8 (% of total net assets) |
| |
Simon Property Group, Inc. REIT | 7.3% |
Public Storage, Inc. REIT | 6.0 |
Vornado Realty Trust REIT | 5.3 |
Equity Residential REIT | 4.9 |
HCP, Inc. REIT | 4.4 |
Boston Properties, Inc. REIT | 3.9 |
Avalonbay Communities, Inc. REIT | 3.1 |
Health Care Inc. REIT | 3.1 |
Ventas, Inc. REIT | 3.0 |
Kimco Realty Corp. REIT | 2.5 |
Top Ten | 43.5% |
Investment Focus
1 MSCI US REIT Index.
2 Dow Jones Wilshire 5000 Index.
3 This yield may include some payments that represent a return of capital, capital gains distributions, or both by the underlying REITs. These amounts are determined by each REIT at the end of its fiscal year.
4 The expense ratios shown are from the prospectuses dated May 29, 2008. For the fiscal year ended January 31, 2009, the expense ratios were 0.21% for Investor Shares, 0.11% for Admiral Shares, 0.11% for Signal Shares, 0.09% for Institutional Shares, and 0.11% for ETF Shares.
5 Annualized since the share class inception on June 4, 2007.
6 For an explanation of R-squared, beta, and other terms used here, see the Glossary.
7 The Target REIT Composite consists of the MSCI US REIT Index adjusted to include a 2% cash position (Lipper Money Market Average).
8 The holdings listed exclude any temporary cash investments and equity index products.
7
REIT Index Fund
Performance Summary
All of the returns in this report represent past performance, which is not a guarantee of future results that may be achieved by the fund. (Current performance may be lower or higher than the performance data cited. For performance data current to the most recent month-end, visit our website at www.vanguard.com/performance.) Note, too, that both investment returns and principal value can fluctuate widely, so an investor’s shares, when sold, could be worth more or less than their original cost. The returns shown do not reflect taxes that a shareholder would pay on fund distributions or on the sale of fund shares.
Cumulative Performance: January 31, 1999–January 31, 2009
Initial Investment of $10,000
| | Average Annual Total Returns | Final Value |
| Periods Ended January 31, 2009 | of a $10,000 |
| One Year | Five Years | Ten Years | Investment |
REIT Index Fund Investor Shares1 | –47.82% | –3.82% | 5.37% | $16,871 |
Dow Jones Wilshire 5000 Index | –38.69 | –3.75 | –1.83 | 8,317 |
Target REIT Composite2 | –47.92 | –3.80 | 5.39 | 16,908 |
MSCI US REIT Index | –48.80 | –4.02 | 5.39 | 16,909 |
Average Real Estate Fund3 | –49.47 | –3.97 | 5.02 | 16,326 |
| | | | Final Value |
| | | Since | of a $100,000 |
| One Year | Five Years | Inception4 | Investment |
REIT Index Fund Admiral Shares1 | –47.77% | –3.75% | 3.56% | $128,704 |
Dow Jones Wilshire 5000 Index | –38.69 | –3.75 | –1.19 | 91,738 |
Target REIT Composite2 | –47.92 | –3.80 | 3.52 | 128,349 |
1 Total returns do not reflect the 1% fee assessed on redemptions of shares held less than one year, nor for the Investor Shares do they include the account service fee that may be applicable to certain accounts with balances below $10,000.
2 The Target REIT Composite consists of the MSCI US REIT Index adjusted to include a 2% cash position (Lipper Money Market Average).
3 Derived from data provided by Lipper Inc.
4 Performance for the fund’s Admiral Shares and comparative standards is calculated since the Admiral Shares’ inception: November 12, 2001.
8
REIT Index Fund
| | | Final Value of |
| | Since | a $1,000,000 |
| One Year | Inception1 | Investment |
REIT Index Fund Signal Shares2 | –47.77% | –40.74% | $419,509 |
Dow Jones Wilshire 5000 Index | –38.69 | –29.98 | 553,424 |
Target REIT Composite3 | –47.92 | –40.85 | 418,165 |
| | | | Final Value of |
| | | Since | a $5,000,000 |
| One Year | Five Years | Inception1 | Investment |
REIT Index Fund Institutional Shares2 | –47.82% | –3.74% | –2.45% | $4,399,917 |
Dow Jones Wilshire 5000 Index | –38.69 | –3.75 | –2.56 | 4,373,814 |
Target REIT Composite3 | –47.92 | –3.80 | –2.52 | 4,382,462 |
| | | Final Value |
| | Since | of a $10,000 |
| One Year | Inception1 | Investment |
REIT Index Fund ETF Shares Net Asset Value | –47.77% | –5.80% | $7,710 |
Dow Jones Wilshire 5000 Index | –38.69 | –4.10 | 8,333 |
Target REIT Composite3 | –47.92 | –5.87 | 7,685 |
Cumulative Returns ETF Shares: September 23, 2004–January 31, 2009 | |
| | |
| | Cumulative |
| | Since |
| One Year | Inception1 |
REIT Index Fund ETF Shares Market Price | –47.39% | –22.48% |
REIT Index Fund ETF Shares Net Asset Value | –47.77 | –22.90 |
Target REIT Composite3 | –47.92 | –23.15 |
1 Performance for the fund and its comparative standards is calculated since the following inception dates: June 4, 2007 for Signal Shares; December 2, 2003, for Institutional Shares; September 23, 2004, for ETF Shares.
2 Total returns do not reflect the 1% fee assessed on redemptions of shares held less than one year.
3 The Target REIT Composite consists of the MSCI US REIT Index adjusted to include a 2% cash position (Lipper Money Market Average).
9
REIT Index Fund
Fiscal-Year Total Returns (%): January 31, 1999–January 31, 2009
Average Annual Total Returns: Periods Ended December 31, 2008
This table presents average annual total returns through the latest calendar quarter—rather than through the end of the fiscal period. Securities and Exchange Commission rules require that we provide this information.
| Inception Date | One Year | Five Years | Ten Years |
Investor Shares2 | 5/13/1996 | –37.05% | 0.77% | 7.14% |
Admiral Shares2 | 11/12/2001 | –36.98 | 0.85 | 6.423 |
Signal Shares2 | 6/4/2007 | –37.00 | –34.963 | — |
Institutional Shares2 | 12/2/2003 | –36.95 | 0.89 | 1.273 |
ETF Shares | 9/23/2004 | | | |
Market Price | | –37.06 | –1.643 | — |
Net Asset Value | | –36.98 | –1.593 | — |
1 The Target REIT Composite consists of the MSCI US REIT Index adjusted to include a 2% cash position (Lipper Money Market Average).
2 Total returns do not reflect the 1% fee assessed on redemptions of shares held less than one year, nor for the Investor Shares do they include the account service fee that may be applicable to certain accounts with balances below $10,000.
3 Return since inception.
Note: See Financial Highlights for dividend and capital gains information.
10
REIT Index Fund
Financial Statements
Statement of Net Assets
As of January 31, 2009
The fund provides a complete list of its holdings four times in each fiscal year, at the quarter-ends. For the second and fourth fiscal quarters, the lists appear in the fund’s semiannual and annual reports to shareholders. For the first and third fiscal quarters, the fund files the lists with the Securities and Exchange Commission on Form N-Q. Shareholders can look up the fund’s Forms N-Q on the SEC’s website at www.sec.gov. Forms N-Q may also be reviewed and copied at the SEC’s Public Reference Room (see the back cover of this report for further information).
| | | Market |
| | | Value• |
| | Shares | ($000) |
Real Estate Investment Trusts (98.3%) | | |
Diversified REITs (9.4%) | | |
| Vornado Realty Trust REIT | 5,686,963 | 288,955 |
| Liberty Property Trust REIT | 4,026,909 | 80,538 |
| Washington REIT | 2,031,107 | 48,361 |
| PS Business | | |
| Parks, Inc. REIT | 629,999 | 27,027 |
| Investors Real Estate | | |
| Trust REIT | 2,389,614 | 23,777 |
^ | Cousins | | |
| Properties, Inc. REIT | 1,688,767 | 16,229 |
| Colonial Properties | | |
| Trust REIT | 1,870,490 | 13,748 |
| Winthrop Realty | | |
| Trust REIT | 549,260 | 5,559 |
| CapLease, Inc. REIT | 1,752,470 | 2,804 |
| Gramercy | | |
| Capital Corp. REIT | 1,787,683 | 2,127 |
| | | 509,125 |
Industrial REITs (4.7%) | | |
| ProLogis REIT | 10,777,407 | 107,882 |
| AMB Property Corp. REIT | 4,024,542 | 64,876 |
| EastGroup | | |
| Properties, Inc. REIT | 1,029,959 | 31,290 |
| DCT Industrial | | |
| Trust Inc. REIT | 7,098,651 | 25,910 |
^ | First Industrial Realty | | |
| Trust REIT | 1,820,544 | 9,904 |
| First Potomac REIT | 1,108,404 | 9,178 |
| DuPont Fabros | | |
| Technology Inc. REIT | 1,457,432 | 5,436 |
| | | 254,476 |
Office REITs (15.7%) | | |
| Boston | | |
| Properties, Inc. REIT | 4,919,603 | 213,019 |
| Digital Realty | | |
| Trust, Inc. REIT | 2,805,583 | 89,498 |
| Alexandria Real Estate | | |
| Equities, Inc. REIT | 1,318,608 | 78,246 |
| | | Market |
| | | Value• |
| | Shares | ($000) |
| Highwood | | |
| Properties, Inc. REIT | 2,608,275 | 58,843 |
| Duke Realty Corp. REIT | 6,033,556 | 55,569 |
| Corporate Office | | |
| Properties Trust, Inc. REIT | 2,092,224 | 55,193 |
| Mack-Cali Realty Corp. REIT | 2,699,957 | 54,863 |
| SL Green Realty Corp. REIT | 2,387,604 | 37,509 |
| Douglas Emmett, Inc. REIT | 3,989,629 | 37,104 |
| BioMed Realty | | |
| Trust, Inc. REIT | 3,256,330 | 35,950 |
| Kilroy Realty Corp. REIT | 1,340,628 | 30,647 |
| HRPT Properties | | |
| Trust REIT | 9,354,058 | 29,746 |
| Franklin Street | | |
| Properties Corp. REIT | 2,459,885 | 28,092 |
| Brandywine Realty | | |
| Trust REIT | 3,643,526 | 21,752 |
| Lexington Realty | | |
| Trust REIT | 2,656,169 | 11,767 |
| Parkway | | |
| Properties Inc. REIT | 628,163 | 9,372 |
*,^ | Maguire | | |
| Properties, Inc. REIT | 1,575,465 | 3,277 |
| | | 850,447 |
Residential REITs (16.9%) | | |
| Equity Residential REIT | 11,124,626 | 266,212 |
| Avalonbay | | |
| Communities, Inc. REIT | 3,263,403 | 169,077 |
| UDR, Inc. REIT | 6,042,784 | 70,882 |
| Essex Property | | |
| Trust, Inc. REIT | 1,049,739 | 69,335 |
| Camden Property | | |
| Trust REIT | 2,183,435 | 57,555 |
| BRE Properties Inc. | | |
| Class A REIT | 2,095,935 | 53,216 |
| Home | | |
| Properties, Inc. REIT | 1,310,621 | 47,038 |
| American Campus | | |
| Communities, Inc. REIT | 1,736,986 | 37,119 |
11
REIT Index Fund
| | | Market |
| | | Value• |
| | Shares | ($000) |
| Apartment Investment & | | |
| Management Co. | | |
| Class A REIT | 4,156,076 | 36,948 |
| Equity Lifestyle | | |
| Properties, Inc. REIT | 961,489 | 36,277 |
| Mid-America Apartment | | |
| Communities, Inc. REIT | 1,129,038 | 33,352 |
| Post Properties, Inc. REIT | 1,811,766 | 23,716 |
| Sun Communities, Inc. REIT | 680,477 | 8,166 |
| Education Realty | | |
| Trust, Inc. REIT | 1,171,472 | 5,447 |
| | | 914,340 |
Retail REITs (23.2%) | | |
| Simon Property | | |
| Group, Inc. REIT | 9,239,997 | 397,135 |
| Kimco Realty Corp. REIT | 9,388,165 | 135,002 |
| Federal Realty Investment | | |
| Trust REIT | 2,419,009 | 122,474 |
| Regency | | |
| Centers Corp. REIT | 2,873,040 | 101,418 |
^ | Realty Income Corp. REIT | 4,161,090 | 80,184 |
^ | Weingarten Realty | | |
| Investors REIT | 3,103,491 | 50,246 |
^ | The Macerich Co. REIT | 3,064,807 | 45,175 |
| National Retail | | |
| Properties REIT | 3,037,477 | 43,831 |
| Taubman Co. REIT | 2,171,751 | 43,109 |
| Tanger Factory | | |
| Outlet Centers, Inc. REIT | 1,298,309 | 39,339 |
| Inland Real | | |
| Estate Corp. REIT | 2,443,807 | 24,120 |
^ | Equity One, Inc. REIT | 1,671,845 | 23,824 |
| Developers Diversified | | |
| Realty Corp. REIT | 4,941,733 | 23,720 |
| Saul Centers, Inc. REIT | 586,956 | 19,193 |
| Alexander’s, Inc. REIT | 83,358 | 16,041 |
| Getty Realty | | |
| Holding Corp. REIT | 763,831 | 15,842 |
| Acadia Realty Trust REIT | 1,312,492 | 15,317 |
| Urstadt Biddle Properties | | |
| Class A REIT | 782,572 | 11,574 |
| Cedar Shopping | | |
| Centers, Inc. REIT | 1,827,794 | 11,204 |
^ | CBL & Associates | | |
| Properties, Inc. REIT | 2,591,166 | 10,546 |
^ | Pennsylvania REIT | 1,633,823 | 7,238 |
^ | General Growth | | |
| Properties Inc. REIT | 9,895,235 | 6,432 |
| Kite Realty Group | | |
| Trust REIT | 1,323,332 | 6,127 |
| Ramco-Gershenson Properties Trust REIT | 760,062 | 3,740 |
| Glimcher Realty Trust REIT | 1,554,855 | 2,876 |
| Urstadt Biddle Properties REIT | 34,818 | 463 |
| | | 1,256,170 |
| | | Market |
| | | Value• |
| | Shares | ($000) |
Specialized REITs (28.4%) | | |
| Public Storage, Inc. REIT | 5,211,621 | 322,443 |
| HCP, Inc. REIT | 10,252,940 | 239,304 |
| Health Care Inc. REIT | 4,456,559 | 168,502 |
| Ventas, Inc. REIT | 5,866,721 | 163,506 |
| Host Hotels & | | |
| Resorts Inc. REIT | 20,263,545 | 109,018 |
| Nationwide Health | | |
| Properties, Inc. REIT | 3,973,942 | 101,455 |
| Senior Housing Properties | | |
| Trust REIT | 4,700,976 | 76,062 |
| Hospitality Properties | | |
| Trust REIT | 3,857,695 | 51,770 |
| Omega Healthcare | | |
| Investors, Inc. REIT | 3,362,903 | 49,199 |
| Healthcare Realty | | |
| Trust Inc. REIT | 2,371,784 | 39,158 |
| Entertainment Properties | | |
| Trust REIT | 1,349,263 | 30,561 |
| National Health | | |
| Investors REIT | 1,026,310 | 26,735 |
| Extra Space | | |
| Storage Inc. REIT | 3,198,671 | 25,941 |
| Sovran Self | | |
| Storage, Inc. REIT | 901,264 | 23,433 |
| LTC Properties, Inc. REIT | 807,253 | 16,702 |
| DiamondRock | | |
| Hospitality Co. REIT | 3,790,150 | 15,540 |
| Medical Properties | | |
| Trust Inc. REIT | 3,221,249 | 14,657 |
| Universal Health Realty | | |
| Income REIT | 463,123 | 14,172 |
| LaSalle Hotel | | |
| Properties REIT | 1,663,281 | 13,855 |
| Sunstone Hotel | | |
| Investors, Inc. REIT | 2,116,956 | 9,124 |
| U-Store-It Trust REIT | 2,019,302 | 7,572 |
1 | Ashford Hospitality | | |
| Trust REIT | 4,671,278 | 6,633 |
| Hersha Hospitality | | |
| Trust REIT | 1,976,735 | 4,803 |
| Strategic Hotels and | | |
| Resorts, Inc. REIT | 3,054,285 | 4,184 |
| FelCor Lodging | | |
| Trust, Inc. REIT | 2,598,567 | 3,768 |
| | | 1,538,097 |
Total Real Estate Investment Trusts | | |
(Cost $10,232,338) | | 5,322,655 |
12
REIT Index Fund
| | | Market |
| | | Value• |
| | Shares | ($000) |
Temporary Cash Investment (3.0%) | | |
2,3 | Vanguard Market | | |
| Liquidity Fund, 0.780% | | |
| (Cost $164,845) | 164,845,489 | 164,845 |
Total Investments (101.3%) | | |
(Cost $10,397,183) | | 5,487,500 |
Other Assets and Liabilities (–1.3%) | | |
Other Assets | | 43,362 |
Liabilities3 | | (115,444) |
| | | (72,082) |
Net Assets (100%) | | 5,415,418 |
At January 31, 2009, net assets consisted of: |
| Amount |
| ($000) |
Paid-in Capital | 10,369,841 |
Overdistributed Net Investment Income | (3,821) |
Accumulated Net Realized Losses | (40,919) |
Unrealized Appreciation (Depreciation) | (4,909,683) |
Net Assets | 5,415,418 |
| |
Investor Shares—Net Assets | |
Applicable to 227,010,455 outstanding | |
$.001 par value shares of beneficial | |
interest (unlimited authorization) | 2,273,738 |
Net Asset Value Per Share— | |
Investor Shares | $10.02 |
| |
Admiral Shares—Net Assets | |
Applicable to 20,438,448 outstanding | |
$.001 par value shares of beneficial | |
interest (unlimited authorization) | 873,488 |
Net Asset Value Per Share— | |
Admiral Shares | $42.74 |
| |
Signal Shares—Net Assets | |
Applicable to 30,701,720 outstanding | |
$.001 par value shares of beneficial | |
interest (unlimited authorization) | 350,259 |
Net Asset Value Per Share— | |
Signal Shares | $11.41 |
| |
Institutional Shares—Net Assets | |
Applicable to 76,136,496 outstanding | |
$.001 par value shares of beneficial | |
interest (unlimited authorization) | 503,572 |
Net Asset Value Per Share— | |
Institutional Shares | $6.61 |
| |
ETF Shares—Net Assets | |
Applicable to 46,926,794 outstanding | |
$.001 par value shares of beneficial | |
interest (unlimited authorization) | 1,414,361 |
Net Asset Value Per Share— | |
ETF Shares | $30.14 |
• | See Note A in Notes to Financial Statements. |
* | Non-income-producing security. |
^ | Part of security position is on loan to broker-dealers. The total value of securities on loan is $62,832,000. |
1 Considered an affiliated company of the fund as the fund owns more than 5% of the outstanding voting securities of such company.
2 Affiliated money market fund available only to Vanguard funds and certain trusts and accounts managed by Vanguard. Rate shown is the 7-day yield.
3 Includes $69,171,000 of collateral received for securities on loan.
See accompanying Notes, which are an integral part of the Financial Statements.
13
REIT Index Fund
Statement of Operations
| Year Ended |
| January 31, 2009 |
| ($000) |
Investment Income | |
Income | |
Dividends1 | 306,421 |
Interest1 | 4,303 |
Security Lending | 1,886 |
Total Income | 312,610 |
Expenses | |
The Vanguard Group—Note B | |
Investment Advisory Services | 304 |
Management and Administrative | |
Investor Shares | 6,317 |
Admiral Shares | 1,138 |
Signal Shares | 396 |
Institutional Shares | 399 |
ETF Shares | 1,521 |
Marketing and Distribution | |
Investor Shares | 1,104 |
Admiral Shares | 408 |
Signal Shares | 146 |
Institutional Shares | 213 |
ETF Shares | 610 |
Custodian Fees | 169 |
Auditing Fees | 27 |
Shareholders’ Reports | |
Investor Shares | 164 |
Admiral Shares | 4 |
Signal Shares | 7 |
Institutional Shares | 5 |
ETF Shares | 74 |
Trustees’ Fees and Expenses | 13 |
Total Expenses | 13,019 |
Net Investment Income | 299,591 |
Realized Net Gain (Loss) | |
Investment Securities Sold1 | 704,477 |
Capital Gain Distributions Received | 140,329 |
Realized Net Gain (Loss) | 844,806 |
Change in Unrealized Appreciation (Depreciation) of Investment Securities | (6,024,890) |
Net Increase (Decrease) in Net Assets Resulting from Operations | (4,880,493) |
1 Dividend income, interest income, and realized net gain (loss) from affiliated companies of the fund were $1,646,000, $4,239,000, and ($289,000), respectively.
See accompanying Notes, which are an integral part of the Financial Statements.
14
REIT Index Fund
Statement of Changes in Net Assets
| Year Ended January 31, |
| 2009 | 2008 |
| ($000) | ($000) |
Increase (Decrease) in Net Assets | | |
Operations | | |
Net Investment Income | 299,591 | 277,469 |
Realized Net Gain (Loss) | 844,806 | 764,385 |
Change in Unrealized Appreciation (Depreciation) | (6,024,890) | (3,956,300) |
Net Increase (Decrease) in Net Assets Resulting from Operations | (4,880,493) | (2,914,446) |
Distributions | | |
Net Investment Income | | |
Investor Shares | (122,164) | (135,972) |
Admiral Shares | (50,605) | (69,231) |
Signal Shares | (18,431) | (5,931) |
Institutional Shares | (25,391) | (22,421) |
ETF Shares | (73,889) | (46,805) |
Realized Capital Gain | | |
Investor Shares | (26,879) | (43,507) |
Admiral Shares | (10,877) | (21,491) |
Signal Shares | (3,962) | (1,833) |
Institutional Shares | (5,438) | (6,913) |
ETF Shares | (15,867) | (14,497) |
Return of Capital | | |
Investor Shares | (60,479) | (41,347) |
Admiral Shares | (24,948) | (20,900) |
Signal Shares | (9,087) | (1,789) |
Institutional Shares | (12,510) | (6,758) |
ETF Shares | (36,421) | (14,122) |
Total Distributions | (496,948) | (453,517) |
Capital Share Transactions | | |
Investor Shares | 525,377 | (1,091,585) |
Admiral Shares | 96,330 | (903,826) |
Signal Shares | 160,016 | 657,624 |
Institutional Shares | 258,367 | 18,915 |
ETF Shares | 659,295 | 888,417 |
Net Increase (Decrease) from Capital Share Transactions | 1,699,385 | (430,455) |
Total Increase (Decrease) | (3,678,056) | (3,798,418) |
Net Assets | | |
Beginning of Period | 9,093,474 | 12,891,892 |
End of Period1 | 5,415,418 | 9,093,474 |
1 Net Assets—End of Period includes undistributed (overdistributed) net investment income of ($3,821,000) and ($12,932,000).
See accompanying Notes, which are an integral part of the Financial Statements.
15
REIT Index Fund
Financial Highlights
Investor Shares | | | | | |
| | | | | |
For a Share Outstanding | Year Ended January 31, |
Throughout Each Period | 2009 | 2008 | 2007 | 2006 | 2005 |
Net Asset Value, Beginning of Period | $20.38 | $27.76 | $21.29 | $17.20 | $15.83 |
Investment Operations | | | | | |
Net Investment Income | .593 | .615 | .530 | .562 | .563 |
Net Realized and Unrealized Gain (Loss) | | | | | |
on Investments1 | (9.975) | (6.985) | 7.000 | 4.692 | 1.759 |
Total from Investment Operations | (9.382) | (6.370) | 7.530 | 5.254 | 2.322 |
Distributions | | | | | |
Dividends from Net Investment Income | (.571) | (.622) | (.534) | (.568) | (.565) |
Distributions from Realized Capital Gains | (.125) | (.199) | (.413) | (.530) | (.387) |
Return of Capital | (.282) | (.189) | (.113) | (.066) | — |
Total Distributions | (.978) | (1.010) | (1.060) | (1.164) | (.952) |
Net Asset Value, End of Period | $10.02 | $20.38 | $27.76 | $21.29 | $17.20 |
| | | | | |
Total Return2 | –47.82% | –23.28% | 36.32% | 31.43% | 14.78% |
| | | | | |
Ratios/Supplemental Data | | | | | |
Net Assets, End of Period (Millions) | $2,274 | $4,046 | $6,827 | $4,727 | $4,311 |
Ratio of Total Expenses to | | | | | |
Average Net Assets | 0.21% | 0.20% | 0.21% | 0.21% | 0.21% |
Ratio of Net Investment Income to | | | | | |
Average Net Assets | 3.36% | 2.52% | 2.27% | 2.91% | 3.44% |
Portfolio Turnover Rate3 | 10% | 13% | 11% | 17% | 13% |
1 Includes increases from redemption fees of $0.00, $0.02, $0.00, $0.01, and $0.01.
2 Total returns do not reflect the 1% fee assessed on redemptions of shares held for less than one year, nor do they include the account service fee that may be applicable to certain accounts with balances below $10,000.
3 Excludes the value of portfolio securities received or delivered as a result of in-kind purchases or redemptions of the fund’s capital shares, including ETF Creation Units.
See accompanying Notes, which are an integral part of the Financial Statements.
16
REIT Index Fund
Financial Highlights
Admiral Shares | | | | | |
| | | | | |
For a Share Outstanding | Year Ended January 31, |
Throughout Each Period | 2009 | 2008 | 2007 | 2006 | 2005 |
Net Asset Value, Beginning of Period | $86.94 | $118.46 | $90.82 | $73.40 | $67.56 |
Investment Operations | | | | | |
Net Investment Income | 2.581 | 2.707 | 2.328 | 2.460 | 2.437 |
Net Realized and Unrealized Gain (Loss) | | | | | |
on Investments1 | (42.527) | (29.817) | 29.903 | 19.993 | 7.494 |
Total from Investment Operations | (39.946) | (27.110) | 32.231 | 22.453 | 9.931 |
Distributions | | | | | |
Dividends from Net Investment Income | (2.491) | (2.735) | (2.341) | (2.488) | (2.439) |
Distributions from Realized Capital Gains | (.535) | (.849) | (1.761) | (2.258) | (1.652) |
Return of Capital | (1.228) | (.826) | (.489) | (.287) | — |
Total Distributions | (4.254) | (4.410) | (4.591) | (5.033) | (4.091) |
Net Asset Value, End of Period | $42.74 | $86.94 | $118.46 | $90.82 | $73.40 |
| | | | | |
Total Return2 | –47.77% | –23.23% | 36.46% | 31.49% | 14.82% |
| | | | | |
Ratios/Supplemental Data | | | | | |
Net Assets, End of Period (Millions) | $873 | $1,706 | $3,392 | $2,025 | $938 |
Ratio of Total Expenses to | | | | | |
Average Net Assets | 0.11% | 0.10% | 0.14% | 0.14% | 0.16% |
Ratio of Net Investment Income to | | | | | |
Average Net Assets | 3.46% | 2.62% | 2.34% | 2.98% | 3.49% |
Portfolio Turnover Rate3 | 10% | 13% | 11% | 17% | 13% |
1 Includes increases from redemption fees of $0.02, $0.10, $0.02, $0.02, and $0.04.
2 Total returns do not reflect the 1% fee assessed on redemptions of shares held for less than one year.
3 Excludes the value of portfolio securities received or delivered as a result of in-kind purchases or redemptions of the fund’s capital shares, including ETF Creation Units.
See accompanying Notes, which are an integral part of the Financial Statements.
17
REIT Index Fund
Financial Highlights
Signal Shares | | |
| Year | June 4, |
| Ended | 20071 to |
| Jan. 31, | Jan. 31, |
For a Share Outstanding Throughout Each Period | 2009 | 2008 |
Net Asset Value, Beginning of Period | $23.21 | $30.05 |
Investment Operations | | |
Net Investment Income | .688 | .470 |
Net Realized and Unrealized Gain (Loss) on Investments2 | (11.353) | (6.311) |
Total from Investment Operations | (10.665) | (5.841) |
Distributions | | |
Dividends from Net Investment Income | (.664) | (.620) |
Distributions from Realized Capital Gains | (.143) | (.192) |
Return of Capital | (.328) | (.187) |
Total Distributions | (1.135) | (.999) |
Net Asset Value, End of Period | $11.41 | $23.21 |
| | |
Total Return3 | –47.77% | –19.68% |
| | |
Ratios/Supplemental Data | | |
Net Assets, End of Period (Millions) | $350 | $538 |
Ratio of Total Expenses to Average Net Assets | 0.11% | 0.10%4 |
Ratio of Net Investment Income to Average Net Assets | 3.46% | 2.62%4 |
Portfolio Turnover Rate5 | 10% | 13% |
1 Inception.
2 Includes increases from redemption fees of $0.00 and $0.01.
3 Total returns do not reflect the 1% fee assessed on redemptions of shares held for less than one year.
4 Annualized.
5 Excludes the value of portfolio securities received or delivered as a result of in-kind purchases or redemptions of the fund’s capital shares, including ETF Creation Units.
See accompanying Notes, which are an integral part of the Financial Statements.
18
REIT Index Fund
Financial Highlights
Institutional Shares | | | | | |
| | | | | |
For a Share Outstanding | Year Ended January 31, |
Throughout Each Period | 2009 | 2008 | 2007 | 2006 | 2005 |
Net Asset Value, Beginning of Period | $13.46 | $18.33 | $14.06 | $11.36 | $10.46 |
Investment Operations | | | | | |
Net Investment Income | .401 | .420 | .366 | .385 | .381 |
Net Realized and Unrealized Gain (Loss) | | | | | |
on Investments1 | (6.591) | (4.605) | 4.621 | 3.099 | 1.156 |
Total from Investment Operations | (6.190) | (4.185) | 4.987 | 3.484 | 1.537 |
Distributions | | | | | |
Dividends from Net Investment Income | (.386) | (.426) | (.368) | (.389) | (.381) |
Distributions from Realized Capital Gains | (.083) | (.131) | (.273) | (.350) | (.256) |
Return of Capital | (.191) | (.128) | (.076) | (.045) | — |
Total Distributions | (.660) | (.685) | (.717) | (.784) | (.637) |
Net Asset Value, End of Period | $6.61 | $13.46 | $18.33 | $14.06 | $11.36 |
| | | | | |
Total Return2 | –47.82% | –23.18% | 36.45% | 31.58% | 14.81% |
| | | | | |
Ratios/Supplemental Data | | | | | |
Net Assets, End of Period (Millions) | $504 | $722 | $960 | $571 | $297 |
Ratio of Total Expenses to | | | | | |
Average Net Assets | 0.09% | 0.09% | 0.10% | 0.10% | 0.13% |
Ratio of Net Investment Income | | | | | |
to Average Net Assets | 3.48% | 2.63% | 2.38% | 3.02% | 3.52% |
Portfolio Turnover Rate3 | 10% | 13% | 11% | 17% | 13% |
1 Includes increases from redemption fees of $0.00, $0.01, $0.00, $0.00, and $0.00.
2 Total returns do not reflect the 1% fee assessed on redemptions of shares held for less than one year.
3 Excludes the value of portfolio securities received or delivered as a result of in-kind purchases or redemptions of the fund’s capital shares, including ETF Creation Units.
See accompanying Notes, which are an integral part of the Financial Statements.
19
REIT Index Fund
Financial Highlights
ETF Shares | | | | | |
| | | | | Sept. 23, |
| | | | | 20041, to |
For a Share Outstanding | Year Ended January 31, | Jan. 31, |
Throughout Each Period | 2009 | 2008 | 2007 | 2006 | 2005 |
Net Asset Value, Beginning of Period | $61.31 | $83.55 | $64.07 | $51.77 | $49.41 |
Investment Operations | | | | | |
Net Investment Income | 1.820 | 1.908 | 1.654 | 1.745 | .665 |
Net Realized and Unrealized Gain (Loss) | | | | | |
on Investments2 | (29.990) | (21.037) | 21.080 | 14.116 | 2.965 |
Total from Investment Operations | (28.170) | (19.129) | 22.734 | 15.861 | 3.630 |
Distributions | | | | | |
Dividends from Net Investment Income | (1.757) | (1.931) | (1.665) | (1.764) | (.682) |
Distributions from Realized Capital Gains | (.377) | (.598) | (1.242) | (1.594) | (.588) |
Return of Capital | (.866) | (.582) | (.347) | (.203) | — |
Total Distributions | (3.000) | (3.111) | (3.254) | (3.561) | (1.270) |
Net Asset Value, End of Period | $30.14 | $61.31 | $83.55 | $64.07 | $51.77 |
| | | | | |
Total Return | –47.77% | –23.23% | 36.48% | 31.54% | 7.13% |
| | | | | |
Ratios/Supplemental Data | | | | | |
Net Assets, End of Period (Millions) | $1,414 | $2,082 | $1,713 | $871 | $198 |
Ratio of Total Expenses to | | | | | |
Average Net Assets | 0.11% | 0.10% | 0.12% | 0.12% | 0.18%3 |
Ratio of Net Investment Income to | | | | | |
Average Net Assets | 3.46% | 2.62% | 2.36% | 3.00% | 3.47%3 |
Portfolio Turnover Rate4 | 10% | 13% | 11% | 17% | 13% |
1 Inception.
2 Includes increases from redemption fees of $0.01, $0.04, $0.01, $0.01, and $0.00.
3 Annualized.
4 Excludes the value of portfolio securities received or delivered as a result of in-kind purchases or redemptions of the fund’s capital shares, including ETF Creation Units.
See accompanying Notes, which are an integral part of the Financial Statements.
20
REIT Index Fund
Notes to Financial Statements
Vanguard REIT Index Fund is registered under the Investment Company Act of 1940 as an open-end investment company, or mutual fund. The fund offers five classes of shares: Investor Shares, Admiral Shares, Signal Shares, Institutional Shares, and ETF Shares. Investor Shares are available to any investor who meets the fund’s minimum purchase requirements. Admiral Shares are designed for investors who meet certain administrative, service, tenure, and account-size criteria. Signal Shares are designed for institutional investors who meet certain administrative, service, and account-size criteria. Institutional Shares are designed for investors who meet certain administrative and service criteria and invest a minimum of $5 million. ETF Shares are listed for trading on the NYSE Arca, Inc.; they can be purchased and sold through a broker.
A. The following significant accounting policies conform to generally accepted accounting principles for U.S. mutual funds. The fund consistently follows such policies in preparing its financial statements.
1. Security Valuation: Securities are valued as of the close of trading on the New York Stock Exchange (generally 4 p.m., Eastern time) on the valuation date. Equity securities are valued at the latest quoted sales prices or official closing prices taken from the primary market in which each security trades; such securities not traded on the valuation date are valued at the mean of the latest quoted bid and asked prices. Securities for which market quotations are not readily available, or whose values have been materially affected by events occurring before the fund’s pricing time but after the close of the securities’ primary markets, are valued by methods deemed by the board of trustees to represent fair value. Investments in Vanguard Market Liquidity Fund are valued at that fund’s net asset value.
2. Federal Income Taxes: The fund intends to continue to qualify as a regulated investment company and distribute all of its taxable income. Management has analyzed the fund’s tax positions taken on federal income tax returns for all open tax years (tax years ended January 31, 2006–2009), and has concluded that no provision for federal income tax is required in the fund’s financial statements.
3. Distributions: Distributions to shareholders are recorded on the ex-dividend date. Quarterly income dividends declared by the fund are reallocated at fiscal year-end to ordinary income, capital gain, and return of capital to reflect their tax character.
4. Security Lending: The fund may lend its securities to qualified institutional borrowers to earn additional income. Security loans are required to be secured at all times by collateral at least equal to the market value of securities loaned. The fund invests cash collateral received in Vanguard Market Liquidity Fund, and records a liability for the return of the collateral, during the period the securities are on loan. Security lending income represents the income earned on investing cash collateral, less expenses associated with the loan.
5. Other: Distributions received from REITs are recorded on the ex-dividend date. Each REIT reports annually the tax character of its distributions. Dividend income, capital gain distributions received, and unrealized appreciation (depreciation) reflect the amounts of taxable income, capital gain, and return of capital reported by the REITs, and management’s estimates of such amounts for REIT distributions for which actual information has not been reported. Interest income includes income distributions received from Vanguard Market Liquidity Fund and is accrued daily. Security transactions are accounted for on
21
REIT Index Fund
the date securities are bought or sold. Costs used to determine realized gains (losses) on the sale of investment securities are those of the specific securities sold. Fees assessed on redemptions of capital shares are credited to paid-in capital.
Each class of shares has equal rights as to assets and earnings, except that each class separately bears certain class-specific expenses related to maintenance of shareholder accounts (included in Management and Administrative expenses) and shareholder reporting. Marketing and distribution expenses are allocated to each class of shares based on a method approved by the board of trustees. Income, other non-class-specific expenses, and gains and losses on investments are allocated to each class of shares based on its relative net assets.
B. The Vanguard Group furnishes at cost investment advisory, corporate management, administrative, marketing, and distribution services. The costs of such services are allocated to the fund under methods approved by the board of trustees. The fund has committed to provide up to 0.40% of its net assets in capital contributions to Vanguard. At January 31, 2009, the fund had contributed capital of $1,711,000 to Vanguard (included in Other Assets), representing 0.03% of the fund’s net assets and 0.68% of Vanguard’s capitalization. The fund’s trustees and officers are also directors and officers of Vanguard.
C. Distributions are determined on a tax basis and may differ from net investment income and realized capital gains for financial reporting purposes. Differences may be permanent or temporary. Permanent differences are reclassified among capital accounts in the financial statements to reflect their tax character. Temporary differences arise when certain items of income, expense, gain, or loss are recognized in different periods for financial statement and tax purposes; these differences are primarily attributed to tax deferral of losses on wash sales and will reverse at some time in the future. Differences in classification may also result from the treatment of short-term gains as ordinary income for tax purposes.
During the year ended January 31, 2009, the fund realized $822,495,000 of net capital gains resulting from in-kind redemptions—in which shareholders exchanged fund shares for securities held by the fund rather than for cash. Because such gains are not taxable to the fund, and are not distributed to shareholders, they have been reclassified from accumulated net realized losses to paid-in capital.
For tax purposes, at January 31, 2009, the fund had no ordinary income and no long-term capital gains available for distribution.
At January 31, 2009, the cost of investment securities for tax purposes was $10,436,485,000. Net unrealized depreciation of investment securities for tax purposes was $4,948,985,000, consisting of unrealized gains of $57,038,000 on securities that had risen in value since their purchase and $5,006,023,000 in unrealized losses on securities that had fallen in value since their purchase.
D. During the year ended January 31, 2009, the fund purchased $4,508,163,000 of investment securities and sold $2,708,215,000 of investment securities other than temporary cash investments.
22
REIT Index Fund
E. Capital share transactions for each class of shares were:
| | | Year Ended January 31, |
| | 2009 | | 2008 |
| Amount | Shares | Amount | Shares |
| ($000) | (000) | ($000) | (000) |
Investor Shares | | | | |
Issued | 1,134,996 | 65,608 | 1,399,642 | 56,790 |
Issued in Lieu of Cash Distributions | 196,216 | 12,122 | 206,766 | 8,999 |
Redeemed1 | (805,835) | (49,310) | (2,697,993) | (113,122) |
Net Increase (Decrease)—Investor Shares | 525,377 | 28,420 | (1,091,585) | (47,333) |
Admiral Shares | | | | |
Issued | 316,602 | 4,056 | 767,550 | 7,020 |
Issued in Lieu of Cash Distributions | 71,754 | 1,029 | 93,775 | 948 |
Redeemed1 | (292,026) | (4,268) | (1,765,151) | (16,977) |
Net Increase (Decrease)—Admiral Shares | 96,330 | 817 | (903,826) | (9,009) |
Signal Shares | | | | |
Issued | 292,068 | 14,603 | 744,428 | 26,756 |
Issued in Lieu of Cash Distributions | 27,716 | 1,507 | 8,094 | 346 |
Redeemed1 | (159,768) | (8,585) | (94,898) | (3,926) |
Net Increase (Decrease)—Signal Shares | 160,016 | 7,525 | 657,624 | 23,176 |
Institutional Shares | | | | |
Issued | 378,908 | 33,267 | 353,251 | 22,005 |
Issued in Lieu of Cash Distributions | 40,717 | 3,869 | 33,538 | 2,226 |
Redeemed1 | (161,258) | (14,629) | (367,874) | (22,969) |
Net Increase (Decrease)—Institutional Shares | 258,367 | 22,507 | 18,915 | 1,262 |
ETF Shares | | | | |
Issued | 2,522,879 | 48,375 | 2,480,141 | 33,552 |
Issued in Lieu of Cash Distributions | — | — | — | — |
Redeemed1 | (1,863,584) | (35,400) | (1,591,724) | (20,100) |
Net Increase (Decrease)—ETF Shares | 659,295 | 12,975 | 888,417 | 13,452 |
1 Net of redemption fees of $1,996,000 and $7,614,000 (fund totals).
23
REIT Index Fund
F. The fund has invested in a company that is considered to be an affiliated company of the fund because the fund owns more than 5% of the outstanding voting securities of the company. Transactions during the period in securities of this company were as follows:
| | | Current Period Transactions | |
| Jan. 31, 2008 | | Proceeds from | | Jan. 31, 2009 |
| Market | Purchases | Securities | Dividend | Market |
| Value | at Cost | Sold | Income | Value |
| ($000) | ($000) | ($000) | ($000) | ($000) |
Ashford Hospitality Trust REIT | NA1 | 7,484 | 4,778 | 1,646 | 6,633 |
G. In September 2006, the Financial Accounting Standards Board issued Statement of Financial Accounting Standards No. 157 (“FAS 157”), “Fair Value Measurements.” FAS 157 establishes a framework for measuring fair value and expands disclosures about fair value measurements in financial statements.
The various inputs that may be used to determine the value of the fund’s investments are summarized in three broad levels. The inputs or methodologies used for valuing securities are not necessarily an indication of the risk associated with investing in those securities.
Level 1—Quoted prices in active markets for identical securities.
Level 2—Other significant observable inputs (including quoted prices for similar securities, interest rates, prepayment speeds, credit risk, etc.).
Level 3—Significant unobservable inputs (including the fund’s own assumptions used to determine the fair value of investments).
At January 31, 2009, 100% of the fund’s investments were valued based on Level 1 inputs.
1 At January 31, 2008, the issuer was not an affiliated company of the fund.
24
Report of Independent Registered Public Accounting Firm
To the Trustees of Vanguard Specialized Funds and the Shareholders of Vanguard REIT Index Fund:
In our opinion, the accompanying statement of net assets and the related statements of operations
and of changes in net assets and the financial highlights present fairly, in all material respects, the
financial position of Vanguard REIT Index Fund (constituting a separate portfolio of Vanguard Specialized
Funds, hereafter referred to as the “Fund”) at January 31, 2009, the results of its operations for the
year then ended, the changes in its net assets for each of the two years in the period then ended and
the financial highlights for each of the periods indicated, in conformity with accounting principles
generally accepted in the United States of America. These financial statements and financial highlights
(hereafter referred to as “financial statements”) are the responsibility of the Fund’s management; our
responsibility is to express an opinion on these financial statements based on our audits. We
conducted our audits of these financial statements in accordance with the standards of the Public
Company Accounting Oversight Board (United States). Those standards require that we plan and
perform the audit to obtain reasonable assurance about whether the financial statements are free of
material misstatement. An audit includes examining, on a test basis, evidence supporting the amounts
and disclosures in the financial statements, assessing the accounting principles used and significant
estimates made by management, and evaluating the overall financial statement presentation.
We believe that our audits, which included confirmation of securities at January 31, 2009 by
correspondence with the custodian, and by agreement to the underlying ownership records for
Vanguard Market Liquidity Fund, provide a reasonable basis for our opinion.
PricewaterhouseCoopers LLP
Philadelphia, Pennsylvania
March 20, 2009
Special 2008 tax information (unaudited) for Vanguard REIT Index Fund |
This information for the fiscal year ended January 31, 2009, is included pursuant to provisions of the Internal Revenue Code.
The fund distributed $63,024,000 as capital gain dividends (from net long-term capital gains) to shareholders during the fiscal year. The fund designates $35,152,000 of its capital gain dividends as a 15% rate gain distribution and $27,872,000 as a 25% rate gain distribution.
The fund distributed $4,230,000 of qualified dividend income to shareholders during the fiscal year.
25
Your Fund’s After-Tax Returns
This table presents returns for your fund both before and after taxes. The after-tax returns are shown in two ways: (1) assuming that an investor owned the fund during the entire period and paid taxes on the fund’s distributions, and (2) assuming that an investor paid taxes on the fund’s distributions and sold all shares at the end of each period.
Calculations are based on the highest individual federal income tax and capital gains tax rates in effect at the times of the distributions and the hypothetical sales. State and local taxes were not considered. After-tax returns reflect any qualified dividend income, using actual prior-year figures and estimates for 2009. (In the example, returns after the sale of fund shares may be higher than those assuming no sale. This occurs when the sale would have produced a capital loss. The calculation assumes that the investor received a tax deduction for the loss.)
The table shows returns for Investor Shares only; returns for other share classes will differ. Please note that your actual after-tax returns will depend on your tax situation and may differ from those shown. Also note that if you own the fund in a tax-deferred account, such as an individual retirement account or a 401(k) plan, this information does not apply to you. Such accounts are not subject to current taxes.
Finally, keep in mind that a fund’s performance—whether before or after taxes—does not guarantee future results.
Average Annual Total Returns: REIT Index Fund Investor Shares1 |
Periods Ended January 31, 2009 | | | |
| One | Five | Ten |
| Year | Years | Years |
Returns Before Taxes | –47.82% | –3.82% | 5.37% |
Returns After Taxes on Distributions | –48.52 | –5.11 | 3.55 |
Returns After Taxes on Distributions and Sale of Fund Shares | –30.71 | –3.41 | 3.82 |
1 Total returns do not reflect the 1% fee assessed on redemptions of shares held less than one year, nor do they include the account service fee that may be applicable to certain accounts with balances below $10,000.
26
About Your Fund’s Expenses
As a shareholder of the fund, you incur ongoing costs, which include costs for portfolio management, administrative services, and shareholder reports (like this one), among others. Operating expenses, which are deducted from a fund’s gross income, directly reduce the investment return of the fund.
A fund’s expenses are expressed as a percentage of its average net assets. This figure is known as the expense ratio. The following examples are intended to help you understand the ongoing costs (in dollars) of investing in your fund and to compare these costs with those of other mutual funds. The examples are based on an investment of $1,000 made at the beginning of the period shown and held for the entire period.
The accompanying table illustrates your fund’s costs in two ways:
• Based on actual fund return. This section helps you to estimate the actual expenses that you paid over the period. The “Ending Account Value” shown is derived from the fund’s actual return, and the third column shows the dollar amount that would have been paid by an investor who started with $1,000 in the fund. You may use the information here, together with the amount you invested, to estimate the expenses that you paid over the period.
To do so, simply divide your account value by $1,000 (for example, an $8,600 account value divided by $1,000 = 8.6), then multiply the result by the number given for your fund under the heading “Expenses Paid During Period.”
• Based on hypothetical 5% yearly return. This section is intended to help you compare your fund’s costs with those of other mutual funds. It assumes that the fund had a yearly return of 5% before expenses, but that the expense ratio is unchanged. In this case—because the return used is not the fund’s actual return—the results do not apply to your investment. The example is useful in making comparisons because the Securities and Exchange Commission requires all mutual funds to calculate expenses based on a 5% return. You can assess your fund’s costs by comparing this hypothetical example with the hypothetical examples that appear in shareholder reports of other funds.
Note that the expenses shown in the table are meant to highlight and help you compare ongoing costs only and do not reflect transaction costs incurred by the fund for buying and selling securities. Further, the expenses do not include the 1% fee on redemptions of shares held for less than one year, nor do they include the account service fee described in the prospectus. If such fees were applied to your account, your costs would be higher. Your fund does not carry a “sales load.”
The calculations assume no shares were bought or sold during the period. Your actual costs may have been higher or lower, depending on the amount of your investment and the timing of any purchases or redemptions.
You can find more information about the fund’s expenses, including annual expense ratios, in the Financial Statements section of this report. For additional information on operating expenses and
27
Six Months Ended January 31, 2009 | | | |
| Beginning | Ending | Expenses |
| Account Value | Account Value | Paid During |
REIT Index Fund | 7/31/2008 | 1/31/2009 | Period1 |
Based on Actual Fund Return | | | |
Investor Shares | $1,000.00 | $521.76 | $0.84 |
Admiral Shares | 1,000.00 | 521.99 | 0.46 |
Signal Shares | 1,000.00 | 522.06 | 0.46 |
Institutional Shares | 1,000.00 | 521.86 | 0.35 |
ETF Shares | 1,000.00 | 521.96 | 0.46 |
Based on Hypothetical 5% Yearly Return | | | |
Investor Shares | $1,000.00 | $1,024.10 | $1.12 |
Admiral Shares | 1,000.00 | 1,024.60 | 0.61 |
Signal Shares | 1,000.00 | 1,024.60 | 0.61 |
Institutional Shares | 1,000.00 | 1,024.75 | 0.46 |
ETF Shares | 1,000.00 | 1,024.60 | 0.61 |
1 The calculations are based on expenses incurred in the most recent six-month period. The fund’s annualized six-month expense ratios for that period are 0.22% for Investor Shares, 0.12% for Admiral Shares, 0.12% for Signal Shares, 0.09% for Institutional Shares, and 0.12% for ETF Shares. The dollar amounts shown as “Expenses Paid” are equal to the annualized expense ratio multiplied by the average account value over the period, multiplied by the number of days in the most recent six-month period, then divided by the number of days in the most recent 12-month period.
28
Glossary
Beta. A measure of the magnitude of a fund’s past share-price fluctuations in relation to the ups and downs of a given market index. The index is assigned a beta of 1.00. Compared with a given index, a fund with a beta of 1.20 typically would have seen its share price rise or fall by 12% when the index rose or fell by 10%. For this report, beta is based on returns over the past 36 months for both the fund and the index. Note that a fund’s beta should be reviewed in conjunction with its R-squared (see definition). The lower the R-squared, the less correlation there is between the fund and the index, and the less reliable beta is as an indicator of volatility.
Earnings Growth Rate. The average annual rate of growth in earnings over the past five years for the stocks now in a fund.
Expense Ratio. The percentage of a fund’s average net assets used to pay its annual administrative and advisory expenses. These expenses directly reduce returns to investors.
Foreign Holdings. The percentage of a fund represented by stocks or depositary receipts of companies based outside the United States.
Inception Date. The date on which the assets of a fund (or one of its share classes) are first invested in accordance with the fund’s investment objective. For funds with a subscription period, the inception date is the day after that period ends. Investment performance is measured from the inception date.
Median Market Cap. An indicator of the size of companies in which a fund invests; the midpoint of market capitalization (market price x shares outstanding) of a fund’s stocks, weighted by the proportion of the fund’s assets invested in each stock. Stocks representing half of the fund’s assets have market capitalizations above the median, and the rest are below it.
Price/Book Ratio. The share price of a stock divided by its net worth, or book value, per share. For a fund, the weighted average price/book ratio of the stocks it holds.
Price/Earnings Ratio. The ratio of a stock’s current price to its per-share earnings over the past year. For a fund, the weighted average P/E of the stocks it holds. P/E is an indicator of market expectations about corporate prospects; the higher the P/E, the greater the expectations for a company’s future growth.
R-Squared. A measure of how much of a fund’s past returns can be explained by the returns from the market in general, as measured by a given index. If a fund’s total returns were precisely synchronized with an index’s returns, its R-squared would be 1.00. If the fund’s returns bore no relationship to the index’s returns, its R-squared would be 0. For this report, R-squared is based on returns over the past 36 months for both the fund and the index.
Return on Equity. The annual average rate of return generated by a company during the past five years for each dollar of shareholder’s equity (net income divided by shareholder’s equity). For a fund, the weighted average return on equity for the companies whose stocks it holds.
Short-Term Reserves. The percentage of a fund invested in highly liquid, short-term securities that can be readily converted to cash.
29
Turnover Rate. An indication of the fund’s trading activity. Funds with high turnover rates incur higher transaction costs and may be more likely to distribute capital gains (which may be taxable to investors). The turnover rate excludes in-kind transactions, which have minimal impact on costs.
Yield. A snapshot of the level of dividends, interest, capital gains distributions, and return-of-capital distributions received by the fund. The index yield is based on the current annualized rate of dividends and other distributions provided by securities in the index.
30
This page intentionally left blank.
The People Who Govern Your Fund
The trustees of your mutual fund are there to see that the fund is operated and managed in your best interests since, as a shareholder, you are a part owner of the fund. Your fund’s trustees also serve on the board of directors of The Vanguard Group, Inc., which is owned by the Vanguard funds and provides services to them on an at-cost basis.
A majority of Vanguard’s board members are independent, meaning that they have no affiliation with Vanguard or the funds they oversee, apart from the sizable personal investments they have made as private individuals. The independent board members have distinguished backgrounds in business, academia, and public service. Each of the trustees and executive officers oversees 156 Vanguard funds.
The following table provides information for each trustee and executive officer of the fund. More information about the trustees is in the Statement of Additional Information, which can be obtained, without charge, by contacting Vanguard at 800-662-7447, or online at www.vanguard.com.
Chairman of the Board and Interested Trustee | Rajiv L. Gupta |
| Born 1945. Trustee Since December 2001.2 Principal |
John J. Brennan1 | Occupation(s) During the Past Five Years: Chairman, |
Born 1954. Trustee Since May 1987. Chairman of | President, and Chief Executive Officer of Rohm and |
the Board. Principal Occupation(s) During the Past Five | Haas Co. (chemicals); Board Member of the American |
Years: Chairman of the Board and Director/Trustee of | Chemistry Council; Director of Tyco International, Ltd. |
The Vanguard Group, Inc., and of each of the investment | (diversified manufacturing and services), since 2005. |
companies served by The Vanguard Group; Chief | |
Executive Officer and President of The Vanguard Group | |
and of each of the investment companies served by The | Amy Gutmann |
Vanguard Group (1996–2008). | Born 1949. Trustee Since June 2006. Principal |
| Occupation(s) During the Past Five Years: President of |
| the University of Pennsylvania since 2004; Professor in |
Independent Trustees | the School of Arts and Sciences, Annenberg School for |
| Communication, and Graduate School of Education of |
| the University of Pennsylvania since 2004; Provost |
Charles D. Ellis | (2001–2004) and Laurance S. Rockefeller Professor of |
Born 1937. Trustee Since January 2001. Principal | Politics and the University Center for Human Values |
Occupation(s) During the Past Five Years: Applecore | (1990–2004), Princeton University; Director of Carnegie |
Partners (pro bono ventures in education); Senior | Corporation of New York since 2005 and of Schuylkill |
Advisor to Greenwich Associates (international business | River Development Corporation and Greater Philadelphia |
strategy consulting); Successor Trustee of Yale University; | Chamber of Commerce since 2004; Trustee of the |
Overseer of the Stern School of Business at New York | National Constitution Center since 2007. |
University; Trustee of the Whitehead Institute for | |
Biomedical Research. | |
| JoAnn Heffernan Heisen |
| Born 1950. Trustee Since July 1998. Principal |
Emerson U. Fullwood | Occupation(s) During the Past Five Years: Retired |
Born 1948. Trustee Since January 2008. Principal | Corporate Vice President, Chief Global Diversity Officer, |
Occupation(s) During the Past Five Years: Retired | and Member of the Executive Committee of Johnson & |
Executive Chief Staff and Marketing Officer for | Johnson (pharmaceuticals/consumer products); Vice |
North America and Corporate Vice President of | President and Chief Information Officer (1997–2005) |
Xerox Corporation (photocopiers and printers); | of Johnson & Johnson; Director of the University |
Director of SPX Corporation (multi-industry | Medical Center at Princeton and Women’s Research |
manufacturing), of the United Way of Rochester, | and Education Institute. |
and of the Boy Scouts of America. | |
André F. Perold | F. William McNabb III1 | |
Born 1952. Trustee Since December 2004. Principal | Born 1957. Chief Executive Officer Since August 2008. |
Occupation(s) During the Past Five Years: George Gund | President Since March 2008. Principal Occupation(s) |
Professor of Finance and Banking, Senior Associate | During the Past Five Years: Chief Executive Officer, |
Dean, and Director of Faculty Recruiting, Harvard | Director, and President of The Vanguard Group, Inc., |
Business School; Director and Chairman of UNX, Inc. | since 2008; Chief Executive Officer and President of |
(equities trading firm); Chair of the Investment | each of the investment companies served by The |
Committee of HighVista Strategies LLC (private | Vanguard Group since 2008; Director of Vanguard |
investment firm) since 2005. | Marketing Corporation; Managing Director of The |
| Vanguard Group (1995–2008). |
| | |
Alfred M. Rankin, Jr. | | |
Born 1941. Trustee Since January 1993. Principal | Heidi Stam1 | |
Occupation(s) During the Past Five Years: Chairman, | Born 1956. Secretary Since July 2005. Principal |
President, Chief Executive Officer, and Director of | Occupation(s) During the Past Five Years: Managing |
NACCO Industries, Inc. (forklift trucks/housewares/ | Director of The Vanguard Group, Inc., since 2006; |
lignite); Director of Goodrich Corporation (industrial | General Counsel of The Vanguard Group since 2005; |
products/aircraft systems and services). | Secretary of The Vanguard Group and of each of the |
| investment companies served by The Vanguard Group |
| since 2005; Director and Senior Vice President of |
J. Lawrence Wilson | Vanguard Marketing Corporation since 2005; Principal |
Born 1936. Trustee Since April 1985. Principal | of The Vanguard Group (1997–2006). |
Occupation(s) During the Past Five Years: Retired | | |
Chairman and Chief Executive Officer of Rohm and | | |
Haas Co. (chemicals); Director of Cummins Inc. (diesel | Vanguard Senior Management Team |
engines) and AmerisourceBergen Corp. (pharmaceutical | | |
distribution); Trustee of Vanderbilt University and of | | |
Culver Educational Foundation. | R. Gregory Barton | Michael S. Miller |
| Mortimer J. Buckley | James M. Norris |
| Kathleen C. Gubanich | Glenn W. Reed |
Executive Officers | Paul A. Heller | George U. Sauter |
| | |
| | |
Thomas J. Higgins1 | Founder | |
Born 1957. Chief Financial Officer Since September | | |
2008. Principal Occupation(s) During the Past Five | | |
Years: Principal of The Vanguard Group, Inc.; Chief | John C. Bogle | |
Financial Officer of each of the investment companies | Chairman and Chief Executive Officer, 1974–1996 |
served by The Vanguard Group since 2008; Treasurer | | |
of each of the investment companies served by The | | |
Vanguard Group (1998–2008). | | |
| | |
| | |
Kathryn J. Hyatt1 | | |
Born 1955. Treasurer Since November 2008. Principal | | |
Occupation(s) During the Past Five Years: Principal of | | |
The Vanguard Group, Inc.; Treasurer of each of the | | |
investment companies served by The Vanguard | | |
Group since 2008; Assistant Treasurer of each of the | | |
investment companies served by The Vanguard Group | | |
(1988–2008). | | |
1 These individuals are “interested persons” as defined in the Investment Company Act of 1940.
2 December 2002 for Vanguard Equity Income Fund, Vanguard Growth Equity Fund, the Vanguard Municipal Bond Funds, and the Vanguard State Tax-Exempt Funds.
| 
|
| P.O. Box 2600 |
| Valley Forge, PA 19482-2600 |
Connect with Vanguard® > www.vanguard.com
Fund Information > 800-662-7447 | All comparative mutual fund data are from Lipper Inc. |
| or Morningstar, Inc., unless otherwise noted. |
Direct Investor Account Services > 800-662-2739 | |
| |
Institutional Investor Services > 800-523-1036 | You can obtain a free copy of Vanguard’s proxy voting |
| guidelines by visiting our website, www.vanguard.com, |
Text Telephone for People | and searching for “proxy voting guidelines,” or by |
With Hearing Impairment > 800-952-3335 | calling Vanguard at 800-662-2739. The guidelines are |
| also available from the SEC’s website, www.sec.gov. |
| In addition, you may obtain a free report on how your |
This material may be used in conjunction | fund voted the proxies for securities it owned during |
with the offering of shares of any Vanguard | the 12 months ended June 30. To get the report, visit |
fund only if preceded or accompanied by | either www.vanguard.com or www.sec.gov. |
the fund’s current prospectus. | |
| |
| You can review and copy information about your fund |
The funds or securities referred to herein are not | at the SEC’s Public Reference Room in Washington, D.C. |
sponsored, endorsed, or promoted by MSCI, and MSCI | To find out more about this public service, call the SEC |
bears no liability with respect to any such funds or | at 202-551-8090. Information about your fund is also |
securities. For any such funds or securities, the | available on the SEC’s website, and you can receive |
prospectus or the Statement of Additional Information | copies of this information, for a fee, by sending a |
contains a more detailed description of the limited | request in either of two ways: via e-mail addressed to |
relationship MSCI has with The Vanguard Group and | publicinfo@sec.gov or via regular mail addressed to the |
any related funds. | Public Reference Section, Securities and Exchange |
| Commission, Washington, DC 20549-0102. |
| |
Russell is a trademark of The Frank Russell Company. | |
| |
| |
| |
| |
| |
| |
| |
| |
| |
| © 2009 The Vanguard Group, Inc. |
| All rights reserved. |
| Vanguard Marketing Corporation, Distributor. |
| |
| Q1230 032009 |
> | Vanguard Dividend Growth Fund returned about –26% for the fiscal year ended January 31, 2009. |
> | The fund’s benchmark, the Russell 1000 Index, returned –39% for the 12 months, while the average large-cap core fund returned –38%. |
> | During one of the worst periods on record for U.S. markets, stocks were down across the board. |
Contents | |
| |
Your Fund’s Total Returns | 1 |
President’s Letter | 2 |
Advisor’s Report | 8 |
Fund Profile | 10 |
Performance Summary | 11 |
Financial Statements | 13 |
Your Fund’s After-Tax Returns | 22 |
About Your Fund’s Expenses | 23 |
Glossary | 25 |
Please note: The opinions expressed in this report are just that—informed opinions. They should not be considered promises or advice. Also, please keep in mind that the information and opinions cover the period through the date on the front of this report. Of course, the risks of investing in your fund are spelled out in the prospectus.
See the Glossary for definitions of investment terms used in this report.
Your Fund’s Total Returns
Fiscal Year Ended January 31, 2009 | |
| Total |
| Return |
Vanguard Dividend Growth Fund | -25.97% |
Russell 1000 Index | -39.04 |
Average Large-Cap Core Fund | -38.14 |
Average Large-Cap Core Fund: Derived from data provided by Lipper Inc. | |
Your Fund’s Performance at a Glance | | | |
January 31, 2008, Through January 31, 2009 | | | |
| | | Distributions Per Share |
| Starting | Ending | Income | Capital |
| Share Price | Share Price | Dividends | Gains |
Vanguard Dividend Growth Fund | $14.38 | $10.42 | $0.264 | $0.000 |
1

President’s Letter
Dear Shareholder,
Vanguard Dividend Growth Fund returned –25.97% for the fiscal year ended January 31, 2009. Despite this dismal return, the fund fared better than both its target benchmark, the Russell 1000 Index, which returned –39.04%, and the broad stock market, which returned –38.69%. The average return for competing large-cap core funds was –38.14% for the 12-month period.
The fund’s relative success was due to the quality of the companies in its portfolio. As you know, the Dividend Growth Fund seeks to invest in firms with strong balance sheets and solid business prospects that should enable them to increase their dividends over time. In the difficult economic environment of the past year, stocks of such well-grounded companies held up better than many others.
During the period, rising financial pressures caused some of the companies in the Dividend Growth portfolio to reduce their dividend payments. By January 31, however, the portfolio held only companies that had either maintained or increased their dividends during the fiscal year. The fund’s per-share income distribution was nevertheless 5.7% below its 2008 level. The fund experienced strong cash flows in the second half of the year, and dividends paid by the portfolio’s holdings were distributed over a larger number of fund shares. Over time, we don’t expect cash flows to have a significant impact on per-share distributions.
2
If you own the Dividend Growth Fund in a taxable account, you may wish to review information about its after-tax returns provided later in this report.
Stocks fell worldwide as the credit crisis deepened
The 12 months ended January 31 represented one of the worst ever one-year spans for stocks, both in the United States and abroad. The trouble stemmed from the financial sector, where some of the world’s largest institutions imploded, largely because of their exposure to low-quality mortgages in the United States. The effects of the credit crisis were wide and deep, with virtually no country or industry sector spared.
The stock market struggled through the first part of the fiscal year, then declined sharply in September, October, and November as the crisis intensified. December offered a brief reprieve before the market fell again in January.
In a flight to safety, investors chose low-yield Treasuries
As economic uncertainty and market volatility grew more pronounced in the second half of the year, investors sought the relative safety of short-term government issues. This drove prices for Treasuries higher, and their yields lower. In some cases, investors were willing to accept very low—or even slightly negative—yields for the short-term safekeeping of their assets.
Market Barometer | | | |
| | Average Annual Total Returns |
| | Periods Ended January 31, 2009 |
| One | Three | Five |
| Year | Years | Years |
Stocks | | | |
Russell 1000 Index (Large-caps) | -39.04% | -12.03% | -4.05% |
Russell 2000 Index (Small-caps) | -36.84 | -14.31 | -4.06 |
Dow Jones Wilshire 5000 Index (Entire market) | -38.69 | -12.03 | -3.75 |
MSCI All Country World Index ex USA (International) | -44.72 | -11.41 | 0.79 |
| | | |
Bonds | | | |
Barclays Capital U.S. Aggregate Bond Index (Broad | | | |
taxable market) | 2.59% | 5.19% | 4.30% |
Barclays Capital Municipal Bond Index | -0.16 | 3.00 | 3.33 |
Citigroup 3-Month U.S. Treasury Bill Index | 1.52 | 3.65 | 3.08 |
| | | |
CPI | | | |
Consumer Price Index | 0.03% | 2.11% | 2.66% |
3
At the same time, the Federal Reserve Board steered short-term interest rates lower in its ongoing campaign to encourage lending. During your fund’s fiscal year, the target for the federal funds rate dropped from 3.00% to a range of 0%–0.25%.
For the full 12-month period, the broad taxable bond market returned 2.59%, and tax-exempt bonds returned –0.16%—somewhat pedestrian (if disappointing) returns that masked a year of uncommon volatility for bonds.
Many firms maintained or raised dividends despite the tough times
The Dividend Growth Fund invests in large, high-quality companies that the fund’s advisor, Wellington Management
Company, believes will increase their cash flow and earnings over time. It is expected that, eventually, these companies will also increase their dividend payouts to shareholders.
As noted, all of the stocks that the fund owned as of January 31 had either maintained or raised their dividends during the fiscal year, with increases averaging about 5%. Earlier in the period the fund held stocks of some companies that wound up cutting their dividends, prompting the advisor to sell these stocks.
All ten of the portfolio’s sectors posted negative returns for the period. As was true in the broad market, some of the weakest results came from the industrial, financial, and energy groups.
Expense Ratios | | |
Your Fund Compared With Its Peer Group | | |
| Fund | Average Large-Cap Core Fund |
Dividend Growth Fund | 0.32% | 1.26% |
4
The fund expense ratio shown is from the prospectus dated May 29, 2008. For the fiscal year ended January 31, 2009, the fund’s expense ratio was 0.36%. The peer-group expense ratio is derived from data provided by Lipper Inc. and captures information through year-end 2008.
The portfolio’s exposure to hard-hit financial companies was relatively modest, which helped to minimize their negative impact. The fund’s strict mandate—which directs it to focus on companies whose financial strength and business prospects could support rising dividends—helped it to avoid significant holdings in the big banks and financial services companies that were brought down by the ongoing credit crisis.
Although there were no real positive areas for the fund during the period, holdings in consumer staples and materials performed relatively well. One of the fund’s top performers was McDonald’s, a consumer discretionary stock that returned 11% for the period.
Twelve months of turmoil affected the fund’s long-term record
During the decade ended January 31, 2009, the fund changed both its strategy and its name. It was founded as Vanguard Utilities Income Fund in 1992. In 2002, the fund became the Dividend Growth Fund, reflecting a new investment objective. Since then, the fund’s strategy has been to select well-positioned companies that have the potential to increase their dividends over time.
The Dividend Growth Fund returned an average of –0.29% annually over the past ten years. While this result is far from impressive, the fund did perform better than its comparative standards over the
Total Returns | |
Ten Years Ended January 31, 2009 | |
| Average |
| Annual Return |
Dividend Growth Fund | -0.29% |
Dividend Growth Spliced Index | -3.41 |
Dividend Growth Spliced Average | -3.67 |
Dividend Growth Spliced Index: Prior to December 6, 2002, the comparative benchmark was known as the Utilities Composite Index. The index weightings have been: 40% S&P Utilities Index, 40% S&P Telephone Index, and 20% Lehman Utility Bond Index through April 30, 1999; 63.75% S&P Utilities Index, 21.25% S&P Telephone Index, and 15% Lehman Utility Bond Index through March 31, 2000; 75% S&P Utilities Index and 25% S&P Telephone Index through December 31, 2001; 75% S&P Utilities Index and 25% S&P Integrated Telecommunication Services Index through December 6, 2002; and Russell 1000 Index thereafter.
Dividend Growth Spliced Average: Based on the average utility fund through December 6, 2002, and the average large-cap core fund thereafter. Derived from data provided by Lipper Inc.
The figures shown represent past performance, which is not a guarantee of future results. (Current performance may be lower or higher than the performance data cited. For performance data current to the most recent month-end, visit our website at www.vanguard.com/performance.) Note, too, that both investment returns and principal value can fluctuate widely, so an investor’s shares, when sold, could be worth more or less than their original cost.
5
Investment insight
Dividend growth and yield: Similar but different
Dividends are central to dividend growth and equity income strategies. Equity income strategies emphasize stocks with high current yields. The focus of dividend growth strategies is companies that can increase dividends over time.
The difference? Consider two hypothetical companies, “3% Growth,” which has limited potential to boost its dividend, and “10% Growth,” which can increase its dividend by 10% a year. At first, the higher-yielding 3% Growth may look like a better income vehicle.
A lower yield means less income at first |
| Stock Price | Dividend | Yield |
3% Growth | $20 | $0.80 | 4% |
10% Growth | 20 | 0.40 | 2 |
If 10% Growth can sustain its growth rate, however, it will eventually pay more income, even though it was initially purchased at a modest yield.
Over time, greater growth can lead to larger dividends
| Year 1 | Year 10 | Year 15 |
3% Growth | $0.80 | $1.04 | $1.21 |
10% Growth | 0.40 | 0.94 | 1.52 |
period, as you can see in the table on page 5. (The benchmarks in the table are “spliced” because the change of objective in 2002 made it necessary to change the fund’s market and industry benchmarks as well. For this reason, the long-term comparison is less meaningful than it is for other funds.)
The Dividend Growth Fund’s disappointing long-term results have been strongly influenced by the extreme market conditions of the past 12 months. However, over time, we expect that the fund, along with the rest of the financial marketplace, will recover. The fund’s low expenses, along with its commitment to investing in high-quality companies with attractive dividend prospects, can help put your investment program in a position to benefit when that recovery happens.
The skill of the advisor, Wellington Management Company, has helped the fund meet its objective, as most of the fund’s holdings continue to maintain or raise their dividends.
Try to hold your course despite stormy conditions
The final months of the fiscal year ended January 31 were some of the worst in the history of the U.S. stock market. As fallout from the financial crisis spread to all sectors, it seemed as if there was no place to hide. The Dividend Growth Fund, like most stock funds, was unable to avoid the market’s upheaval.
6
In chaotic times like these, the temptation to react impulsively to market developments has no doubt been strong.
However, we counsel shareholders to avoid making hasty changes to their portfolios based solely on current market conditions. Instead, we encourage you to build a carefully constructed portfolio that contains a mix of stock, bond, and money market funds that is appropriate for your long-term goals. Such a well-balanced portfolio can provide you with some protection from the market’s extreme ups and downs, while also giving you the opportunity for long-term growth.
With its low-cost advantage and its focus on stable companies with the potential to increase dividends, the Dividend Growth Fund can play an important role in a balanced, well-diversified portfolio.
Thank you for entrusting your assets to Vanguard.
Sincerely,

F. William McNabb III
President and Chief Executive Officer
February 12, 2009
7
Advisor’s Report
Vanguard Dividend Growth Fund returned –25.97% for the 12 months ended January 31, 2009. This performance compared favorably with the –39.04% return of the Russell 1000 Index and the –38.14% average return of large-cap core funds.
The investment environment
Strongly depressed markets and weak economic conditions typically bring a wealth of opportunities to patient investors. However, the combination of a global recession and a severely broken financial system has created an environment that defies most rules of thumb.
It is in times like these that consistency in approach ought to be every investor’s principal focus. In our view, it is both dangerous and unproductive to “guess” likely outcomes in this environment. The government’s involvement in dealing with the current challenges is so vast that it makes our future path highly unpredictable. We plan to follow our own advice and stay focused on our strategy of investing in well-positioned companies that generate long-term dividend growth. We expect such an approach will produce positive long-term results and obviate the need to anticipate volatile swings in market sentiment.
The fund’s successes
While no sectors contributed positive absolute performance during the period, the fund’s holdings in the consumer staples, health care, and materials sectors did relatively well. Among the portfolio’s top absolute contributors were Anheuser-Busch, Wyeth, McDonald’s, and Monsanto.
We estimate that all but two companies held in the portfolio at the end of calendar year 2008 increased their dividends. Those two companies opted instead to maintain their current dividends. Some of the more notable dividend increases occurred at Monsanto, Medtronic, and BP. The outlook for dividend increases in the 2009 calendar year appears much more modest. Based on current announcements, the increase across the portfolio is expected to be slightly below 5%. It is important to note, however, that many companies held in the portfolio have yet to make announcements for 2009, and we expect the actual dividend growth rate to exceed the current estimate.
The fund’s shortfalls
We had a number of individual stocks that detracted from the fund’s performance during the fiscal year. The most noteworthy was State Street. Like many financial companies, State Street has been beset with questions concerning
8
the health of its balance sheet and the potential need to raise capital. The company recently decided to move some assets on its balance sheet from the “available for sale” category to the “hold to maturity” category. Although this move was expected to eliminate the need in the future to mark these assets to market, it instead resulted immediately in negative valuation adjustments, which generated large and unexpected write-downs. In turn, the subsequent questions surrounding the firm’s capital adequacy threw our dividend growth assumptions into question, and we decided to sell the stock.
The fund’s positioning and strategy
Our primary objective is to identify companies that we believe will steadily and reliably increase their dividend payments. We seek to accomplish this by carefully building the portfolio one stock at a time, giving central consideration to each company’s dividend growth prospects. Our industry weightings are a result of this process. The fund continues to have significant positions in the health care, industrial, energy, and consumer staples sectors, while having less exposure to the utilities, telecommunication services, and financial sectors.
During periods when financial markets are weak, many find their investment universes expanding. For example, stocks that were once considered too large or too expensive for certain investors suddenly become more compelling. Our approach, though, has very well-defined requirements, and dividend growth is becoming a far rarer characteristic among companies eager to preserve capital. We praise companies for prudently assessing their capital needs and making the difficult choice to cut their dividends when appropriate. However, this only makes our task harder.
We have responded by eliminating stocks for which we believe the likelihood of a dividend cut is high. We have concentrated the portfolio into fewer holdings and have increased our positions where we are highly confident that dividend growth will continue. And finally, we have exercised caution by further reducing turnover and carrying a higher-than-normal level of cash. We are confident these actions are warranted in this environment and will allow the portfolio to weather the storm, while we remain optimistic that our universe will begin to grow again.
Donald J. Kilbride
Senior Vice President and Equity Portfolio Manager
Wellington Management Company, LLP
February 10, 2009
9
Dividend Growth Fund
Fund Profile
As of January 31, 2009
Portfolio Characteristics | | |
| | Russell | Dow |
| | 1000 | Wilshire |
| Fund | Index | 5000 Index |
Number of Stocks | 49 | 983 | 4,554 |
Median Market Cap | $37.6B | $31.8B | $24.3B |
Price/Earnings Ratio | 10.7x | 11.2x | 11.7x |
Price/Book Ratio | 2.3x | 1.7x | 1.6x |
Return on Equity | 25.1% | 22.0% | 21.1% |
Earnings Growth Rate | 17.0% | 18.7% | 18.3% |
Dividend Yield | 3.4% | 3.0% | 2.9% |
Foreign Holdings | 12.2% | 0.0% | 0.0% |
Turnover Rate | 28% | — | — |
Ticker Symbol | VDIGX | — | — |
Expense Ratio1 | | | |
(1/31/2008) | 0.32% | — | — |
30-Day SEC Yield | 2.70% | — | — |
Short-Term Reserves | 6.3% | — | — |
Sector Diversification (% of equity exposure) |
| | Russell | Dow |
| | 1000 | Wilshire |
| Fund | Index | 5000 Index |
Consumer | | | |
Discretionary | 6.5% | 8.8% | 8.7% |
Consumer Staples | 15.4 | 12.0 | 11.2 |
Energy | 18.7 | 13.6 | 13.2 |
Financials | 4.9 | 11.3 | 13.1 |
Health Care | 18.8 | 15.6 | 15.6 |
Industrials | 16.9 | 10.8 | 10.7 |
Information | | | |
Technology | 13.1 | 16.1 | 16.0 |
Materials | 3.0 | 3.4 | 3.3 |
Telecommunication | | | |
Services | 1.5 | 3.6 | 3.4 |
Utilities | 1.2 | 4.8 | 4.8 |
Volatility Measures | |
| Russell 1000 | Dow Wilshire |
| Index | 5000 Index |
R-Squared | 0.95 | 0.94 |
Beta | 0.79 | 0.77 |
These measures show the degree and timing of the fund’s fluctuations compared with the index over 36 months.
Ten Largest Holdings (% of total net assets) |
| | |
Total SA ADR | integrated oil & gas | 3.6% |
ExxonMobil Corp. | integrated oil & gas | 3.4 |
Marathon Oil Corp. | integrated oil & gas | 3.3 |
Automatic Data | data processing & | |
Processing, Inc. | outsourced services | 3.2 |
Chevron Corp. | integrated oil & gas | 2.8 |
Medtronic, Inc. | health care | |
| equipment | 2.4 |
Accenture Ltd. | IT consulting & | |
| other services | 2.4 |
Abbott Laboratories | pharmaceuticals | 2.4 |
Johnson & Johnson | pharmaceuticals | 2.4 |
BP PLC ADR | integrated oil & gas | 2.3 |
Top Ten | | 28.2% |
The holdings listed exclude any temporary cash investments and equity index products.
Investment Focus
1 The expense ratio shown is from the prospectus dated May 29, 2008. For the fiscal year ended January 31, 2009, the expense ratio was 0.36%.
10
Dividend Growth Fund
Performance Summary
All of the returns in this report represent past performance, which is not a guarantee of future results that may be achieved by the fund. (Current performance may be lower or higher than the performance data cited. For performance data current to the most recent month-end, visit our website at www.vanguard.com/performance.) Note, too, that both investment returns and principal value can fluctuate widely, so an investor’s shares, when sold, could be worth more or less than their original cost. The returns shown do not reflect taxes that a shareholder would pay on fund distributions or on the sale of fund shares.
Cumulative Performance: January 31, 1999, Through January 31, 2009
Initial Investment of $10,000
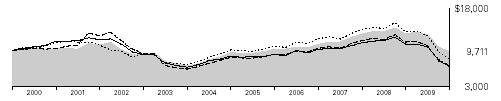
| | Average Annual Total Returns | |
| Periods Ended January 31, 2009 | Final Value |
| One | Five | Ten | of a $10,000 |
| Year | Years | Years | Investment |
Dividend Growth Fund | -25.97% | 0.39% | -0.29% | $9,711 |
Dow Jones Wilshire 5000 Index | -38.69 | -3.75 | -1.83 | 8,317 |
Dividend Growth Spliced Index | -39.04 | -4.05 | -3.41 | 7,065 |
Dividend Growth Spliced Average | -38.14 | -4.99 | -3.67 | 6,879 |
Note: Prior to December 6, 2002, the fund was known as the Utilities Income Fund.
Dividend Growth Spliced Index: Prior to December 6, 2002, the comparative benchmark was known as the Utilities Composite Index. The index weightings have been: 40% S&P Utilities Index, 40% S&P Telephone Index, and 20% Lehman Utility Bond Index through April 30, 1999; 63.75% S&P Utilities Index, 21.25% S&P Telephone Index, and 15% Lehman Utility Bond Index through March 31, 2000; 75% S&P Utilities Index and 25% S&P Telephone Index through December 31, 2001; 75% S&P Utilities Index and 25% S&P Integrated Telecommunication Services Index through December 6, 2002; and Russell 1000 Index thereafter.
Dividend Growth Spliced Average: Based on the average utility fund through December 6, 2002, and the average large-cap core fund thereafter. Derived from data provided by Lipper Inc.
Vanguard fund total returns do not include the account service fee that may be applicable to certain accounts with balances below $10,000.
Note: See Financial Highlights table for dividend and capital gains information.
11
Dividend Growth Fund
Fiscal-Year Total Returns (%): January 31, 1999, Through January 31, 2009
Note: Prior to December 6, 2002, the fund was known as the Utilities Income Fund.
Dividend Growth Spliced Index: Prior to December 6, 2002, the comparative benchmark was known as the Utilities Composite Index. The index weightings have been: 40% S&P Utilities Index, 40% S&P Telephone Index, and 20% Lehman Utility Bond Index through April 30, 1999; 63.75% S&P Utilities Index, 21.25% S&P Telephone Index, and 15% Lehman Utility Bond Index through March 31, 2000; 75% S&P Utilities Index and 25% S&P Telephone Index through December 31, 2001; 75% S&P Utilities Index and 25% S&P Integrated Telecommunication Services Index through December 6, 2002; and Russell 1000 Index thereafter.
Average Annual Total Returns: Periods Ended December 31, 2008
This table presents average annual total returns through the latest calendar quarter—rather than through the end of the fiscal period. Securities and Exchange Commission rules require that we provide this information.
| Inception Date | One Year | Five Years | Ten Years |
Dividend Growth Fund | 5/15/1992 | -25.57% | 1.96% | 0.16% |
Vanguard fund total returns do not include the account service fee that may be applicable to certain accounts with balances below $10,000.
Note: See Financial Highlights table for dividend and capital gains information.
12
Dividend Growth Fund
Financial Statements
Statement of Net Assets
As of January 31, 2009
The fund provides a complete list of its holdings four times in each fiscal year, at the quarter-ends. For the second and fourth fiscal quarters, the lists appear in the fund’s semiannual and annual reports to shareholders. For the first and third fiscal quarters, the fund files the lists with the Securities and Exchange Commission on Form N-Q. Shareholders can look up the fund’s Forms N-Q on the SEC’s website at www.sec.gov. Forms N-Q may also be reviewed and copied at the SEC’s Public Reference Room (see the back cover of this report for further information).
| | Market |
| | Value• |
| Shares | ($000) |
Common Stocks (92.7%) | | |
Consumer Discretionary (6.0%) | | |
Staples, Inc. | 2,139,700 | 34,107 |
NIKE, Inc. Class B | 665,100 | 30,096 |
The Walt Disney Co. | 1,116,400 | 23,087 |
McDonald’s Corp. | 301,900 | 17,516 |
| | 104,806 |
Consumer Staples (14.3%) | | |
Sysco Corp. | 1,480,100 | 32,992 |
PepsiCo, Inc. | 616,500 | 30,967 |
Walgreen Co. | 1,126,700 | 30,883 |
Hormel Foods Corp. | 1,003,600 | 29,937 |
The Coca-Cola Co. | 686,500 | 29,327 |
The Procter & Gamble Co. | 534,300 | 29,119 |
Wal-Mart Stores, Inc. | 596,800 | 28,121 |
Kimberly-Clark Corp. | 467,200 | 24,047 |
General Mills, Inc. | 236,400 | 13,983 |
| | 249,376 |
Energy (17.4%) | | |
Total SA ADR | 1,255,900 | 62,519 |
ExxonMobil Corp. | 779,800 | 59,639 |
Marathon Oil Corp. | 2,084,400 | 56,758 |
Chevron Corp. | 696,900 | 49,145 |
BP PLC ADR | 924,300 | 39,255 |
Schlumberger Ltd. | 875,000 | 35,709 |
| | 303,025 |
Financials (4.6%) | | |
Ace Ltd. | 713,300 | 31,143 |
Marsh & | | |
McLennan Cos., Inc. | 1,385,600 | 26,784 |
JPMorgan Chase & Co. | 865,400 | 22,076 |
| | 80,003 |
Health Care (17.4%) | | |
Medtronic, Inc. | 1,265,900 | 42,395 |
Abbott Laboratories | 753,300 | 41,763 |
Johnson & Johnson | 714,400 | 41,214 |
Cardinal Health, Inc. | 1,025,400 | 38,606 |
Wyeth | 896,400 | 38,518 |
| | Market |
| | Value• |
| Shares | ($000) |
AstraZeneca Group PLC | | |
ADR | 995,300 | 38,349 |
Eli Lilly & Co. | 923,800 | 34,014 |
Schering-Plough Corp. | 1,616,500 | 28,386 |
| | 303,245 |
Industrials (15.6%) | | |
Honeywell | | |
International Inc. | 1,066,900 | 35,005 |
Lockheed Martin Corp. | 411,800 | 33,784 |
United Technologies Corp. | 660,500 | 31,697 |
Emerson Electric Co. | 959,500 | 31,376 |
Illinois Tool Works, Inc. | 957,000 | 31,255 |
Burlington Northern | | |
Santa Fe Corp. | 453,300 | 30,031 |
Caterpillar, Inc. | 954,900 | 29,459 |
United Parcel Service, Inc. | 659,100 | 28,005 |
The Boeing Co. | 519,400 | 21,976 |
| | 272,588 |
Information Technology (12.1%) | | |
Automatic | | |
Data Processing, Inc. | 1,517,100 | 55,116 |
Accenture Ltd. | 1,339,100 | 42,262 |
International Business | | |
Machines Corp. | 344,700 | 31,592 |
Paychex, Inc. | 1,199,000 | 29,124 |
Linear Technology Corp. | 1,176,600 | 27,556 |
Microsoft Corp. | 1,527,100 | 26,113 |
| | 211,763 |
Materials (2.8%) | | |
Praxair, Inc. | 458,500 | 28,546 |
Monsanto Co. | 256,400 | 19,502 |
| | 48,048 |
Telecommunication Services (1.4%) | | |
AT&T Inc. | 987,400 | 24,310 |
| | |
Utilities (1.1%) | | |
Dominion Resources, Inc. | 571,400 | 20,102 |
Total Common Stocks | | |
(Cost $1,871,423) | | 1,617,266 |
13
Dividend Growth Fund
| Face | Market |
| Amount | Value• |
| ($000) | ($000) |
Temporary Cash Investment (6.2%) | | |
Repurchase Agreement | | |
Credit Suisse Securities | | |
(USA) LLC 0.300%, 2/2/09 | | |
(Dated 1/30/09, Repurchase | | |
Value $108,803,000, | | |
collateralized by Federal | | |
Home Loan Mortgage Corp. | | |
7.000%–13.250%, | | |
9/1/09–8/1/20 and Federal | | |
National Mortgage Assn. | | |
3.500%–10.500%, | | |
4/1/09–12/1/48) | | |
(Cost $108,800) | 108,800 | 108,800 |
Total Investments (98.9%) | | |
(Cost $1,980,223) | | 1,726,066 |
Other Assets and Liabilities (1.1%) | | |
Other Assets | | 29,946 |
Liabilities | | (11,364) |
| | 18,582 |
Net Assets (100%) | | |
Applicable to 167,426,799 outstanding | | |
$.001 par value shares of beneficial | | |
interest (unlimited authorization) | | 1,744,648 |
Net Asset Value Per Share | | $10.42 |
At January 31, 2009, net assets consisted of: |
| | Amount |
| | ($000) |
Paid-in Capital | | 2,085,974 |
Undistributed Net Investment Income | | 7 |
Accumulated Net Realized Losses | | (87,176) |
Unrealized Appreciation (Depreciation) | | (254,157) |
Net Assets | | 1,744,648 |
• | See Note A in Notes to Financial Statements. |
ADR—American Depositary Receipt.
See accompanying Notes, which are an integral part of the Financial Statements.
14
Dividend Growth Fund
Statement of Operations
| Year Ended |
| January 31, 2009 |
| ($000) |
Investment Income | |
Income | |
Dividends | 39,237 |
Interest | 888 |
Security Lending | 165 |
Total Income | 40,290 |
Expenses | |
Investment Advisory Fees—Note B | |
Basic Fee | 1,794 |
Performance Adjustment | 537 |
The Vanguard Group—Note C | |
Management and Administrative | 2,832 |
Marketing and Distribution | 334 |
Custodian Fees | 17 |
Auditing Fees | 22 |
Shareholders’ Reports | 41 |
Trustees’ Fees and Expenses | 2 |
Total Expenses | 5,579 |
Expenses Paid Indirectly | (74) |
Net Expenses | 5,505 |
Net Investment Income | 34,785 |
Realized Net Gain (Loss) on Investment Securities Sold | (83,870) |
Change in Unrealized Appreciation (Depreciation) of Investment Securities | (437,850) |
Net Increase (Decrease) in Net Assets Resulting from Operations | (486,935) |
See accompanying Notes, which are an integral part of the Financial Statements.
15
Dividend Growth Fund
Statement of Changes in Net Assets
| Year Ended January 31, |
| 2009 | 2008 |
| ($000) | ($000) |
Increase (Decrease) in Net Assets | | |
Operations | | |
Net Investment Income | 34,785 | 24,190 |
Realized Net Gain (Loss) | (83,870) | 63,097 |
Change in Unrealized Appreciation (Depreciation) | (437,850) | (92,066) |
Net Increase (Decrease) in Net Assets Resulting from Operations | (486,935) | (4,779) |
Distributions | | |
Net Investment Income | (34,618) | (23,790) |
Realized Capital Gain | — | (8,839) |
Total Distributions | (34,618) | (32,629) |
Capital Share Transactions | | |
Issued | 1,222,167 | 350,693 |
Issued in Lieu of Cash Distributions | 29,865 | 28,508 |
Redeemed | (311,560) | (258,780) |
Net Increase (Decrease) from Capital Share Transactions | 940,472 | 120,421 |
Total Increase (Decrease) | 418,919 | 83,013 |
Net Assets | | |
Beginning of Period | 1,325,729 | 1,242,716 |
End of Period1 | 1,744,648 | 1,325,729 |
1 | Net Assets—End of Period includes undistributed (overdistributed) net investment income of $7,000 and ($160,000). |
See accompanying Notes, which are an integral part of the Financial Statements.
16
Dividend Growth Fund
Financial Highlights
For a Share Outstanding | Year Ended January 31, |
Throughout Each Period | 2009 | 2008 | 2007 | 2006 | 2005 |
Net Asset Value, Beginning of Period | $14.38 | $14.74 | $12.75 | $11.89 | $11.33 |
Investment Operations | | | | | |
Net Investment Income | .264 | .290 | .260 | .220 | .2301 |
Net Realized and Unrealized Gain (Loss) | | | | | |
on Investments | (3.960) | (.270) | 1.990 | .880 | .550 |
Total from Investment Operations | (3.696) | .020 | 2.250 | 1.100 | .780 |
Distributions | | | | | |
Dividends from Net Investment Income | (.264) | (.280) | (.260) | (.240) | (.220) |
Distributions from Realized Capital Gains | — | (.100) | — | — | — |
Total Distributions | (.264) | (.380) | (.260) | (.240) | (.220) |
Net Asset Value, End of Period | $10.42 | $14.38 | $14.74 | $12.75 | $11.89 |
| | | | | |
Total Return2 | -25.97% | -0.01% | 17.84% | 9.34% | 6.92% |
| | | | | |
Ratios/Supplemental Data | | | | | |
Net Assets, End of Period (Millions) | $1,745 | $1,326 | $1,243 | $995 | $965 |
Ratio of Total Expenses to | | | | | |
Average Net Assets3 | 0.36% | 0.32% | 0.38% | 0.37% | 0.37% |
Ratio of Net Investment Income to | | | | | |
Average Net Assets | 2.25% | 1.91% | 1.93% | 1.85% | 2.04%1 |
Portfolio Turnover Rate | 28% | 36% | 41% | 16% | 20% |
1 | Net investment income per share and the ratio of net investment income to average net assets include $.03 and 0.28%, respectively, resulting from a special dividend from Microsoft Corp. in November 2004. |
2 | Total returns do not include the account service fee that may be applicable to certain accounts with balances below $10,000. |
3 | Includes performance-based investment advisory fee increases (decreases) of 0.03%, 0.00%, 0.01%, 0.01%, and 0.01%. |
See accompanying Notes, which are an integral part of the Financial Statements.
17
Dividend Growth Fund
Notes to Financial Statements
Vanguard Dividend Growth Fund is registered under the Investment Company Act of 1940 as an open-end investment company, or mutual fund.
A. The following significant accounting policies conform to generally accepted accounting principles for U.S. mutual funds. The fund consistently follows such policies in preparing its financial statements.
1. Security Valuation: Securities are valued as of the close of trading on the New York Stock Exchange (generally 4 p.m., Eastern time) on the valuation date. Equity securities are valued at the latest quoted sales prices or official closing prices taken from the primary market in which each security trades; such securities not traded on the valuation date are valued at the mean of the latest quoted bid and asked prices. Securities for which market quotations are not readily available, or whose values have been materially affected by events occurring before the fund’s pricing time but after the close of the securities’ primary markets, are valued by methods deemed by the board of trustees to represent fair value. Temporary cash investments acquired over 60 days to maturity are valued using the latest bid prices or using valuations based on a matrix system (which considers such factors as security prices, yields, maturities, and ratings), both as furnished by independent pricing services. Other temporary cash investments are valued at amortized cost, which approximates market value.
2. Repurchase Agreements: The fund may invest in repurchase agreements. Securities pledged as collateral for repurchase agreements are held by a custodian bank until the agreements mature. Each agreement requires that the market value of the collateral be sufficient to cover payments of interest and principal; however, in the event of default or bankruptcy by the other party to the agreement, retention of the collateral may be subject to legal proceedings.
3. Federal Income Taxes: The fund intends to continue to qualify as a regulated investment company and distribute all of its taxable income. Management has analyzed the fund’s tax positions taken on federal income tax returns for all open tax years (tax years ended January 31, 2006–2009), and has concluded that no provision for federal income tax is required in the fund’s financial statements.
4. Distributions: Distributions to shareholders are recorded on the ex-dividend date.
5. Security Lending: The fund may lend its securities to qualified institutional borrowers to earn additional income. Security loans are required to be secured at all times by collateral at least equal to the market value of securities loaned. The fund invests cash collateral received in Vanguard Market Liquidity Fund, and records a liability for the return of the collateral, during the period the securities are on loan. Security lending income represents the income earned on investing cash collateral, less expenses associated with the loan.
6. Other: Dividend income is recorded on the ex-dividend date. Interest income is accrued daily. Security transactions are accounted for on the date securities are bought or sold. Costs used to determine realized gains (losses) on the sale of investment securities are those of the specific securities sold.
B. Wellington Management Company, LLP, provides investment advisory services to the fund for a fee calculated at an annual percentage rate of average net assets. The basic fee is subject to quarterly adjustments based on the fund’s performance for the preceding three years relative to the Russell 1000 Index. For the year ended January 31, 2009, the investment advisory fee represented an effective annual basic rate of 0.12% of the fund’s average net assets before an increase of $537,000 (0.03%) based on performance.
18
Dividend Growth Fund
C. The Vanguard Group furnishes at cost corporate management, administrative, marketing, and distribution services. The costs of such services are allocated to the fund under methods approved by the board of trustees. The fund has committed to provide up to 0.40% of its net assets in capital contributions to Vanguard. At January 31, 2009, the fund had contributed capital of $459,000 to Vanguard (included in Other Assets), representing 0.03% of the fund’s net assets and 0.18% of Vanguard’s capitalization. The fund’s trustees and officers are also directors and officers of Vanguard.
D. The fund has asked its investment advisor to direct certain security trades, subject to obtaining the best price and execution, to brokers who have agreed to rebate to the fund part of the commissions generated. Such rebates are used solely to reduce the fund’s management and administrative expenses. The fund’s custodian bank has also agreed to reduce its fees when the fund maintains cash on deposit in the non-interest-bearing custody account. For the year ended January 31, 2009, these arrangements reduced the fund’s management and administrative expenses by $73,000 and custodian fees by $1,000.
E. Distributions are determined on a tax basis and may differ from net investment income and realized capital gains for financial reporting purposes. Differences may be permanent or temporary. Permanent differences are reclassified among capital accounts in the financial statements to reflect their tax character. Temporary differences arise when certain items of income, expense, gain, or loss are recognized in different periods for financial statement and tax purposes; these differences will reverse at some time in the future. Differences in classification may also result from the treatment of short-term gains as ordinary income for tax purposes.
For tax purposes, at January 31, 2009, the fund had $2,195,000 of ordinary income available for distribution. The fund had available realized losses of $86,563,000 to offset future net capital gains of $17,975,000 through January 31, 2017, and $68,588,000 through January 31, 2018.
At January 31, 2009, the cost of investment securities for tax purposes was $1,980,420,000. Net unrealized depreciation of investment securities for tax purposes was $254,354,000, consisting of unrealized gains of $51,361,000 on securities that had risen in value since their purchase and $305,715,000 in unrealized losses on securities that had fallen in value since their purchase.
F. During the year ended January 31, 2009, the fund purchased $1,271,561,000 of investment securities and sold $426,916,000 of investment securities, other than temporary cash investments.
G. Capital shares issued and redeemed were:
| Year Ended January 31, |
| 2009 | 2008 |
| Shares | Shares |
| (000) | (000) |
Issued | 97,909 | 23,079 |
Issued in Lieu of Cash Distributions | 2,499 | 1,863 |
Redeemed | (25,173) | (17,075) |
Net Increase (Decrease) in Shares Outstanding | 75,235 | 7,867 |
19
Dividend Growth Fund
H. In September 2006, the Financial Accounting Standards Board issued Statement of Financial Accounting Standards No. 157 (“FAS 157”), “Fair Value Measurements.” FAS 157 establishes a framework for measuring fair value and expands disclosures about fair value measurements in financial statements.
The various inputs that may be used to determine the value of the fund’s investments are summarized in three broad levels. The inputs or methodologies used for valuing securities are not necessarily an indication of the risk associated with investing in those securities.
Level 1—Quoted prices in active markets for identical securities.
Level 2—Other significant observable inputs (including quoted prices for similar securities, interest rates, prepayment speeds, credit risk, etc.).
Level 3—Significant unobservable inputs (including the fund’s own assumptions used to determine the fair value of investments).
The following table summarizes the fund’s investments as of January 31, 2009, based on the inputs used to value them:
| Investments |
| in Securities |
Valuation Inputs | ($000) |
Level 1—Quoted prices | 1,617,266 |
Level 2—Other significant observable inputs | 108,800 |
Level 3—Significant unobservable inputs | — |
Total | 1,726,066 |
20
Report of Independent Registered Public Accounting Firm
To the Trustees of Vanguard Specialized Funds and the Shareholders of Vanguard Dividend Growth Fund:
In our opinion, the accompanying statement of net assets and the related statements of operations and of changes in net assets and the financial highlights present fairly, in all material respects, the financial position of Vanguard Dividend Growth Fund (constituting a separate portfolio of Vanguard Specialized Funds, hereafter referred to as the “Fund”) at January 31, 2009, the results of its operations for the year then ended, the changes in its net assets for each of the two years in the period then ended and the financial highlights for each of the five years in the period then ended, in conformity with accounting principles generally accepted in the United States of America. These financial statements and financial highlights (hereafter referred to as “financial statements”) are the responsibility of the Fund’s management; our responsibility is to express an opinion on these financial statements based on our audits. We conducted our audits of these financial statements in accordance with the standards of the Public Company Accounting Oversight Board (United States). Those standards require that we plan and perform the audit to obtain reasonable assurance about whether the financial statements are free of material misstatement. An audit includes examining, on a test basis, evidence supporting the amounts and disclosures in the financial statements, assessing the accounting principles used and significant estimates made by management, and evaluating the overall financial statement presentation. We believe that our audits, which included confirmation of securities at January 31, 2009 by correspondence with the custodians and broker, provide a reasonable basis for our opinion.
PricewaterhouseCoopers LLP
Philadelphia, Pennsylvania
March 20, 2009
Special 2008 tax information (unaudited) for Vanguard Dividend Growth Fund |
This information for the fiscal year ended January 31, 2009, is included pursuant to provisions of the Internal Revenue Code.
The fund distributed $34,618,000 of qualified dividend income to shareholders during the fiscal year.
For corporate shareholders, 93.0% of investment income (dividend income plus short-term gains, if any) qualifies for the dividends-received deduction.
21
Your Fund’s After-Tax Returns
This table presents returns for your fund both before and after taxes. The after-tax returns are shown in two ways: (1) assuming that an investor owned the fund during the entire period and paid taxes on the fund’s distributions, and (2) assuming that an investor paid taxes on the fund’s distributions and sold all shares at the end of each period.
Calculations are based on the highest individual federal income tax and capital gains tax rates in effect at the times of the distributions and the hypothetical sales. State and local taxes were not considered. After-tax returns reflect any qualified dividend income, using actual prior-year figures and estimates for 2009. (In the example, returns after the sale of fund shares may be higher than those assuming no sale. This occurs when the sale would have produced a capital loss. The calculation assumes that the investor received a tax deduction for the loss.)
Please note that your actual after-tax returns will depend on your tax situation and may differ from those shown. Also note that if you own the fund in a tax-deferred account, such as an individual retirement account or a 401(k) plan, this information does not apply to you. Such accounts are not subject to current taxes.
Finally, keep in mind that a fund’s performance—whether before or after taxes—does not guarantee future results.
Average Annual Total Returns: Dividend Growth Fund | | | |
Periods Ended January 31, 2009 | | | |
| One | Five | Ten |
| Year | Years | Years |
Returns Before Taxes | -25.97% | 0.39% | -0.29% |
Returns After Taxes on Distributions | -26.20 | 0.09 | -1.34 |
Returns After Taxes on Distributions and Sale of Fund Shares | -16.48 | 0.40 | -0.63 |
Vanguard fund total returns do not include the account service fee that may be applicable to certain accounts with balances below $10,000.
22
About Your Fund’s Expenses
As a shareholder of the fund, you incur ongoing costs, which include costs for portfolio management, administrative services, and shareholder reports (like this one), among others. Operating expenses, which are deducted from a fund’s gross income, directly reduce the investment return of the fund.
A fund’s expenses are expressed as a percentage of its average net assets. This figure is known as the expense ratio. The following examples are intended to help you understand the ongoing costs (in dollars) of investing in your fund and to compare these costs with those of other mutual funds. The examples are based on an investment of $1,000 made at the beginning of the period shown and held for the entire period.
The accompanying table illustrates your fund’s costs in two ways:
• Based on actual fund return. This section helps you to estimate the actual expenses that you paid over the period. The “Ending Account Value” shown is derived from the fund’s actual return, and the third column shows the dollar amount that would have been paid by an investor who started with $1,000 in the fund. You may use the information here, together with the amount you invested, to estimate the expenses that you paid over the period.
To do so, simply divide your account value by $1,000 (for example, an $8,600 account value divided by $1,000 = 8.6), then multiply the result by the number given for your fund under the heading “Expenses Paid During Period.”
• Based on hypothetical 5% yearly return. This section is intended to help you compare your fund’s costs with those of other mutual funds. It assumes that the fund had a yearly return of 5% before expenses, but that the expense ratio is unchanged. In this case—because the return used is not the fund’s actual return—the results do not apply to your investment. The example is useful in making comparisons because the Securities and Exchange Commission requires all mutual funds to calculate expenses based on a 5% return. You can assess your fund’s costs by comparing this hypothetical example with the hypothetical examples that appear in shareholder reports of other funds.
Note that the expenses shown in the table are meant to highlight and help you compare ongoing costs only and do not reflect transaction costs incurred by the fund for buying and selling securities. Further, the expenses do not include the account service fee described in the prospectus. If such a fee were applied to your account, your costs would be higher. Your fund does not charge transaction fees, such as purchase or redemption fees, nor does it carry a “sales load.”
The calculations assume no shares were bought or sold during the period. Your actual costs may have been higher or lower, depending on the amount of your investment and the timing of any purchases or redemptions.
You can find more information about the fund’s expenses, including annual expense ratios, in the Financial Statements section of this report. For additional information on operating expenses and other shareholder costs, please refer to your fund’s current prospectus.
23
Six Months Ended January 31, 2009 | | | |
| Beginning | Ending | Expenses |
| Account Value | Account Value | Paid During |
Dividend Growth Fund | 7/31/2008 | 1/31/2009 | Period |
Based on Actual Fund Return | $1,000.00 | $750.75 | $1.68 |
Based on Hypothetical 5% Yearly Return | 1,000.00 | 1,023.29 | 1.94 |
The calculations are based on expenses incurred in the most recent six-month period. The fund’s annualized six-month expense ratio for that period is 0.38%. The dollar amounts shown as “Expenses Paid” are equal to the annualized expense ratio multiplied by the average account value over the period, multiplied by the number of days in the most recent six-month period, then divided by the number of days in the most recent 12-month period.
24
Glossary
30-Day SEC Yield. A fund’s 30-day SEC yield is derived using a formula specified by the U.S. Securities and Exchange Commission. Under the formula, data related to the fund’s security holdings in the previous 30 days are used to calculate the fund’s hypothetical net income for that period, which is then annualized and divided by the fund’s estimated average net assets over the calculation period. For the purposes of this calculation, a security’s income is based on its current market yield to maturity (in the case of bonds) or its projected dividend yield (for stocks). Because the SEC yield represents hypothetical annualized income, it will differ—at times significantly—from the fund’s actual experience. As a result, the fund’s income distributions may be higher or lower than implied by the SEC yield.
Beta. A measure of the magnitude of a fund’s past share-price fluctuations in relation to the ups and downs of a given market index. The index is assigned a beta of 1.00. Compared with a given index, a fund with a beta of 1.20 typically would have seen its share price rise or fall by 12% when the index rose or fell by 10%. For this report, beta is based on returns over the past 36 months for both the fund and the index. Note that a fund’s beta should be reviewed in conjunction with its R-squared (see definition). The lower the R-squared, the less correlation there is between the fund and the index, and the less reliable beta is as an indicator of volatility.
Dividend Yield. Dividend income earned by stocks, expressed as a percentage of the aggregate market value (or of net asset value, for a fund). The yield is determined by dividing the amount of the annual dividends by the aggregate value (or net asset value) at the end of the period. For a fund, the dividend yield is based solely on stock holdings and does not include any income produced by other investments.
Earnings Growth Rate. The average annual rate of growth in earnings over the past five years for the stocks now in a fund.
Equity Exposure. A measure that reflects a fund’s investments in stocks and stock futures. Any holdings in short-term reserves are excluded.
Expense Ratio. The percentage of a fund’s average net assets used to pay its annual administrative and advisory expenses. These expenses directly reduce returns to investors.
Foreign Holdings. The percentage of a fund represented by stocks or depositary receipts of companies based outside the United States.
Inception Date. The date on which the assets of a fund (or one of its share classes) are first invested in accordance with the fund’s investment objective. For funds with a subscription period, the inception date is the day after that period ends. Investment performance is measured from the inception date.
Median Market Cap. An indicator of the size of companies in which a fund invests; the midpoint of market capitalization (market price x shares outstanding) of a fund’s stocks, weighted by the proportion of the fund’s assets invested in each stock. Stocks representing half of the fund’s assets have market capitalizations above the median, and the rest are below it.
Price/Book Ratio. The share price of a stock divided by its net worth, or book value, per share. For a fund, the weighted average price/book ratio of the stocks it holds.
25
Price/Earnings Ratio. The ratio of a stock’s current price to its per-share earnings over the past year. For a fund, the weighted average P/E of the stocks it holds. P/E is an indicator of market expectations about corporate prospects; the higher the P/E, the greater the expectations for a company’s future growth.
R-Squared. A measure of how much of a fund’s past returns can be explained by the returns from the market in general, as measured by a given index. If a fund’s total returns were precisely synchronized with an index’s returns, its R-squared would be 1.00. If the fund’s returns bore no relationship to the index’s returns, its R-squared would be 0. For this report, R-squared is based on returns over the past 36 months for both the fund and the index.
Return on Equity. The annual average rate of return generated by a company during the past five years for each dollar of shareholder’s equity (net income divided by shareholder’s equity). For a fund, the weighted average return on equity for the companies whose stocks it holds.
Short-Term Reserves. The percentage of a fund invested in highly liquid, short-term securities that can be readily converted to cash.
Turnover Rate. An indication of the fund’s trading activity. Funds with high turnover rates incur higher transaction costs and may be more likely to distribute capital gains (which may be taxable to investors). The turnover rate excludes in-kind transactions, which have minimal impact on costs.
26
This page intentionally left blank.
The People Who Govern Your Fund
The trustees of your mutual fund are there to see that the fund is operated and managed in your best interests since, as a shareholder, you are a part owner of the fund. Your fund’s trustees also serve on the board of directors of The Vanguard Group, Inc., which is owned by the Vanguard funds and provides services to them on an at-cost basis.
A majority of Vanguard’s board members are independent, meaning that they have no affiliation with Vanguard or the funds they oversee, apart from the sizable personal investments they have made as private individuals. The independent board members have distinguished backgrounds in business, academia, and public service. Each of the trustees and executive officers oversees 156 Vanguard funds.
The following table provides information for each trustee and executive officer of the fund. More information about the trustees is in the Statement of Additional Information, which can be obtained, without charge, by contacting Vanguard at 800-662-7447, or online at www.vanguard.com.
Chairman of the Board and Interested Trustee | Rajiv L. Gupta |
| Born 1945. Trustee Since December 2001.2 Principal |
John J. Brennan1 | Occupation(s) During the Past Five Years: Chairman, |
Born 1954. Trustee Since May 1987. Chairman of | President, and Chief Executive Officer of Rohm and |
the Board. Principal Occupation(s) During the Past Five | Haas Co. (chemicals); Board Member of the American |
Years: Chairman of the Board and Director/Trustee of | Chemistry Council; Director of Tyco International, Ltd. |
The Vanguard Group, Inc., and of each of the investment | (diversified manufacturing and services), since 2005. |
companies served by The Vanguard Group; Chief | |
Executive Officer and President of The Vanguard Group | |
and of each of the investment companies served by The | Amy Gutmann |
Vanguard Group (1996–2008). | Born 1949. Trustee Since June 2006. Principal |
| Occupation(s) During the Past Five Years: President of |
| the University of Pennsylvania since 2004; Professor in |
Independent Trustees | the School of Arts and Sciences, Annenberg School for |
| Communication, and Graduate School of Education of |
| the University of Pennsylvania since 2004; Provost |
Charles D. Ellis | (2001–2004) and Laurance S. Rockefeller Professor of |
Born 1937. Trustee Since January 2001. Principal | Politics and the University Center for Human Values |
Occupation(s) During the Past Five Years: Applecore | (1990–2004), Princeton University; Director of Carnegie |
Partners (pro bono ventures in education); Senior | Corporation of New York since 2005 and of Schuylkill |
Advisor to Greenwich Associates (international business | River Development Corporation and Greater Philadelphia |
strategy consulting); Successor Trustee of Yale University; | Chamber of Commerce since 2004; Trustee of the |
Overseer of the Stern School of Business at New York | National Constitution Center since 2007. |
University; Trustee of the Whitehead Institute for | |
Biomedical Research. | |
| JoAnn Heffernan Heisen |
| Born 1950. Trustee Since July 1998. Principal |
Emerson U. Fullwood | Occupation(s) During the Past Five Years: Retired |
Born 1948. Trustee Since January 2008. Principal | Corporate Vice President, Chief Global Diversity Officer, |
Occupation(s) During the Past Five Years: Retired | and Member of the Executive Committee of Johnson & |
Executive Chief Staff and Marketing Officer for | Johnson (pharmaceuticals/consumer products); Vice |
North America and Corporate Vice President of | President and Chief Information Officer (1997–2005) |
Xerox Corporation (photocopiers and printers); | of Johnson & Johnson; Director of the University |
Director of SPX Corporation (multi-industry | Medical Center at Princeton and Women’s Research |
manufacturing), of the United Way of Rochester, | and Education Institute. |
and of the Boy Scouts of America. | |
André F. Perold | F. William McNabb III1 | |
Born 1952. Trustee Since December 2004. Principal | Born 1957. Chief Executive Officer Since August 2008. |
Occupation(s) During the Past Five Years: George Gund | President Since March 2008. Principal Occupation(s) |
Professor of Finance and Banking, Senior Associate | During the Past Five Years: Chief Executive Officer, |
Dean, and Director of Faculty Recruiting, Harvard | Director, and President of The Vanguard Group, Inc., |
Business School; Director and Chairman of UNX, Inc. | since 2008; Chief Executive Officer and President of |
(equities trading firm); Chair of the Investment | each of the investment companies served by The |
Committee of HighVista Strategies LLC (private | Vanguard Group since 2008; Director of Vanguard |
investment firm) since 2005. | Marketing Corporation; Managing Director of The |
| Vanguard Group (1995–2008). |
| | |
Alfred M. Rankin, Jr. | | |
Born 1941. Trustee Since January 1993. Principal | Heidi Stam1 | |
Occupation(s) During the Past Five Years: Chairman, | Born 1956. Secretary Since July 2005. Principal |
President, Chief Executive Officer, and Director of | Occupation(s) During the Past Five Years: Managing |
NACCO Industries, Inc. (forklift trucks/housewares/ | Director of The Vanguard Group, Inc., since 2006; |
lignite); Director of Goodrich Corporation (industrial | General Counsel of The Vanguard Group since 2005; |
products/aircraft systems and services). | Secretary of The Vanguard Group and of each of the |
| investment companies served by The Vanguard Group |
| since 2005; Director and Senior Vice President of |
J. Lawrence Wilson | Vanguard Marketing Corporation since 2005; Principal |
Born 1936. Trustee Since April 1985. Principal | of The Vanguard Group (1997–2006). |
Occupation(s) During the Past Five Years: Retired | | |
Chairman and Chief Executive Officer of Rohm and | | |
Haas Co. (chemicals); Director of Cummins Inc. (diesel | Vanguard Senior Management Team |
engines) and AmerisourceBergen Corp. (pharmaceutical | | |
distribution); Trustee of Vanderbilt University and of | | |
Culver Educational Foundation. | R. Gregory Barton | Michael S. Miller |
| Mortimer J. Buckley | James M. Norris |
| Kathleen C. Gubanich | Glenn W. Reed |
Executive Officers | Paul A. Heller | George U. Sauter |
| | |
| | |
Thomas J. Higgins1 | Founder | |
Born 1957. Chief Financial Officer Since September | | |
2008. Principal Occupation(s) During the Past Five | | |
Years: Principal of The Vanguard Group, Inc.; Chief | John C. Bogle | |
Financial Officer of each of the investment companies | Chairman and Chief Executive Officer, 1974–1996 |
served by The Vanguard Group since 2008; Treasurer | | |
of each of the investment companies served by The | | |
Vanguard Group (1998–2008). | | |
| | |
| | |
Kathryn J. Hyatt1 | | |
Born 1955. Treasurer Since November 2008. Principal | | |
Occupation(s) During the Past Five Years: Principal of | | |
The Vanguard Group, Inc.; Treasurer of each of the | | |
investment companies served by The Vanguard | | |
Group since 2008; Assistant Treasurer of each of the | | |
investment companies served by The Vanguard Group | | |
(1988–2008). | | |
1 These individuals are “interested persons” as defined in the Investment Company Act of 1940.
2 December 2002 for Vanguard Equity Income Fund, Vanguard Growth Equity Fund, the Vanguard Municipal Bond Funds, and the Vanguard State Tax-Exempt Funds.
| 
|
| P.O. Box 2600 |
| Valley Forge, PA 19482-2600 |
Connect with Vanguard® > www.vanguard.com
Fund Information > 800-662-7447 | The funds or securities referred to herein are not |
| sponsored, endorsed, or promoted by MSCI, and MSCI |
Direct Investor Account Services > 800-662-2739 | bears no liability with respect to any such funds or |
| securities. For any such funds or securities, the |
Institutional Investor Services > 800-523-1036 | prospectus or the Statement of Additional Information |
| contains a more detailed description of the limited |
Text Telephone for People | relationship MSCI has with The Vanguard Group and |
With Hearing Impairment > 800-952-3335 | any related funds. |
| |
| |
This material may be used in conjunction | Russell is a trademark of The Frank Russell Company. |
with the offering of shares of any Vanguard | |
fund only if preceded or accompanied by | |
the fund’s current prospectus. | |
| |
All comparative mutual fund data are from Lipper Inc. | |
or Morningstar, Inc., unless otherwise noted. | |
| |
You can obtain a free copy of Vanguard’s proxy voting | |
guidelines by visiting our website, www.vanguard.com, | |
and searching for “proxy voting guidelines,” or by calling | |
Vanguard at 800-662-2739. The guidelines are also | |
available from the SEC’s website, www.sec.gov. In | |
addition, you may obtain a free report on how your fund | |
voted the proxies for securities it owned during the 12 | |
months ended June 30. To get the report, visit either | |
www.vanguard.com or www.sec.gov. | |
| |
You can review and copy information about your fund at | |
the SEC’s Public Reference Room in Washington, D.C. To | |
find out more about this public service, call the SEC at | |
202-551-8090. Information about your fund is also | |
available on the SEC’s website, and you can receive | |
copies of this information, for a fee, by sending a | |
request in either of two ways: via e-mail addressed to | |
publicinfo@sec.gov or via regular mail addressed to the | © 2009 The Vanguard Group, Inc. |
Public Reference Section, Securities and Exchange | All rights reserved. |
Commission, Washington, DC 20549-0102. | Vanguard Marketing Corporation, Distributor. |
| |
| Q570 032009 |
> | The Investor Shares of Vanguard Dividend Appreciation Index Fund returned –29.48% for the fiscal year ended January 31, 2009. Despite the disappointing result, the fund closely matched the return of its benchmark. |
> | As the global financial crisis continued, the broad U.S. stock market returned –38.69% for the 12 months. |
> | The financial sector weighed most heavily on the fund’s performance, although every economic sector contributed to its decline. |
Contents | |
| |
Your Fund’s Total Returns | 1 |
President’s Letter | 2 |
Fund Profile | 7 |
Performance Summary | 8 |
Financial Statements | 10 |
Your Fund’s After-Tax Returns | 22 |
About Your Fund’s Expenses | 23 |
Glossary | 25 |
Please note: The opinions expressed in this report are just that—informed opinions. They should not be considered promises or advice. Also, please keep in mind that the information and opinions cover the period through the date on the front of this report. Of course, the risks of investing in your fund are spelled out in the prospectus.
Your Fund’s Total Returns
Fiscal Year Ended January 31, 2009 | | |
| Ticker | Total |
| Symbol | Returns |
Vanguard Dividend Appreciation Index Fund | | |
Investor Shares | VDAIX | –29.48% |
ETF Shares1 | VIG | |
Market Price | | –28.83 |
Net Asset Value | | –29.38 |
Dividend Achievers Select Index | | –29.38 |
Average Large-Cap Core Fund2 | | –38.14 |
Your Fund’s Performance at a Glance | | | | |
January 31, 2008–January 31, 2009 | | | | |
| | | Distributions Per Share |
| Starting | Ending | Income | Capital |
| Share Price | Share Price | Dividends | Gains |
Vanguard Dividend Appreciation Index Fund | | | |
Investor Shares | $21.40 | $14.79 | $0.383 | $0.000 |
ETF Shares | 53.48 | 36.96 | 1.026 | 0.000 |
1 Vanguard ETF™ Shares are traded on the NYSE Arca exchange and are available only through brokers. The table shows the ETF returns based on both the NYSE Arca market price and the net asset value for a share. U.S. Pat. No. 6,879,964 B2; 7,337,138.
2 Derived from data provided by Lipper Inc.
1

President’s Letter
Dear Shareholder,
For the fiscal year ended January 31, 2009, Vanguard Dividend Appreciation Index Fund’s Investor Shares returned –29.48%. This disappointing result reflects the volatility in the global financial markets and an environment in which most stock funds posted double-digit losses.
However, the Dividend Appreciation Index Fund’s focus on companies with strong dividend profiles provided some relative shelter. The broader market, as measured by the Dow Jones Wilshire 5000, returned –38.69%. The average return of peer-group funds was –38.14%.
The per-share distributions for the fund’s Investor Shares increased from 32.7 cents in fiscal 2008 to 38.3 cents during fiscal 2009, representing a 17% increase in dividend distributions.
Although financial stocks represented only about 10% of the portfolio on average during the period, they weighed most heavily on the fund’s return.
Stocks fell worldwide as the credit crisis deepened
The 12 months ended January 31, 2009, represented one of the worst ever one-year spans for stocks. The broad U.S. stock market’s return was nearly –39%, and international stocks returned about –45%. The trouble stemmed from the
2
financial sector, where some of the world’s largest institutions imploded, largely because of their exposure to low-quality mortgages in the United States. The effects of the credit crisis were wide and deep, with virtually no country or industry sector spared.
The stock market struggled through the first part of the fiscal year, then declined sharply in September, October, and November. December offered a brief reprieve before the market fell again in January.
In a flight to safety, investors chose low-yield Treasuries
As economic uncertainty and market volatility grew more pronounced in the second half of the year, investors sought the relative safety of short-term government issues. This drove prices for Treasuries higher, and their yields lower. In some cases, investors were willing to accept very low—or even slightly negative—yields for the short-term safekeeping of their assets.
Market Barometer | | | |
| | Average Annual Total Returns |
| | Periods Ended January 31, 2009 |
| One Year | Three Years | Five Years |
Stocks | | | |
Russell 1000 Index (Large-caps) | –39.04% | –12.03% | –4.05% |
Russell 2000 Index (Small-caps) | –36.84 | –14.31 | –4.06 |
Dow Jones Wilshire 5000 Index (Entire market) | –38.69 | –12.03 | –3.75 |
MSCI All Country World Index ex USA (International) | –44.72 | –11.41 | 0.79 |
| | | |
Bonds | | | |
Barclays Capital U.S. Aggregate Bond Index | | | |
(Broad taxable market) | 2.59% | 5.19% | 4.30% |
Barclays Capital Municipal Bond Index | –0.16 | 3.00 | 3.33 |
Citigroup 3-Month Treasury Bill Index | 1.52 | 3.65 | 3.08 |
| | | |
CPI | | | |
Consumer Price Index | 0.03% | 2.11% | 2.66% |
3
At the same time, the Federal Reserve Board steered short-term interest rates lower in its ongoing campaign to encourage lending. During your fund’s fiscal year, the target for the federal funds rate dropped from 3.00% to a range of 0%–0.25%.
For the full 12-month period, the broad taxable bond market returned 2.59%, and tax-exempt bonds returned –0.16%—somewhat pedestrian (if disappointing) returns that masked a year of uncommon volatility for bonds.
Financial stocks paced declines in dismal market environment
The Dividend Appreciation Index Fund, like all equity funds, faced extreme challenges during the past 12 months. The difficulties that began in the subprime-mortgage market plagued the entire financial industry and spread through every economic sector.
The financial companies in the index plunged more than 67% for the fiscal year. American International Group, which suffered a liquidity crisis and had to be rescued by the federal government, plummeted more than 97% and accounted for 3 percentage points of the fund’s 12-month loss. Lehman Brothers, which filed for bankruptcy, lost nearly 100% of its value, accounting for almost 1 percentage point of the fund’s decline. Credit woes continued to affect banks, insurance companies faced investment losses rooted in the global financial crisis, and real estate firms dealt with both falling property values and dried up demand and financing for future projects.
Total Returns | |
April 27, 2006,1 Through January 31, 2009 | |
| Average |
| Annual Return |
Dividend Appreciation Index Fund Investor Shares | –8.96% |
Dividend Achievers Select Index | –8.77 |
Average Large-Cap Core Fund2 | –13.96 |
The figures shown represent past performance, which is not a guarantee of future results. (Current performance may be lower or higher than the performance data cited. For performance data current to the most recent month-end, visit our website at www.vanguard.com/performance.) Note, too, that both investment returns and principal value can fluctuate widely, so an investor’s shares, when sold, could be worth more or less than their original cost.
1 Inception.
2 Derived from data provided by Lipper Inc.
4
Consumer staples fared better than most other sectors of the economy, but the sector’s relative success simply meant somewhat more modest losses. And because the sector comprised more than 25% of the fund’s portfolio, on average, it significantly weakened absolute returns. Consumers watched their wallets as the nation remained in a recession and higher fuel prices through most of the year prevented more shopping trips. The consumer discretionary sector also took a hit as shoppers delayed bigger purchases and trimmed entertainment expenses.
Despite severe volatility in commodity prices, the energy sector held up relatively well. The recent energy boom has left the major oil companies in good financial health, and thus less vulnerable to credit-market trouble.
The fund is still relatively new
Since their inception on April 27, 2006, the Dividend Appreciation Index Fund’s Investor Shares have produced an annualized return of –8.96%, a clear disappointment, but in line with the fund’s benchmark index.
Vanguard Quantitative Equity Group, the fund’s investment advisor, seeks to capture the returns of an index made up of stocks with a history of increasing dividends, a strategy that has the potential to produce rising income payments for investors over time.
The fund’s limited history provides little meaningful information about the effectiveness of the fund’s investment strategy. However, we’re confident that the Dividend Appreciation Index Fund will benefit over the long term from its diversified stock portfolio, its low expense ratio, and the skill of the Quantitative Equity Group.
Expense Ratios1 | | | |
Your Fund Compared With Its Peer Group | | | |
| | | Average |
| Investor | ETF | Large-Cap |
| Shares | Shares | Core Fund |
Dividend Appreciation Index Fund | 0.40% | 0.28% | 1.26% |
1 The fund expense ratios shown are from the prospectus dated May 29, 2008. For the fiscal year ended January 31, 2009, the fund’s expense ratios were 0.36% for Investor Shares and 0.24% for ETF Shares. The peer-group expense ratio is derived from data provided by Lipper Inc. and captures information through year-end 2008.
5
Dividend-paying stocks can provide a cushion
The past year has been an extremely volatile time for global financial markets. Investors obviously have reasons to be disappointed and frustrated, but making an emotional decision to sell a stock fund could lead to more dissatisfaction.
At Vanguard, we suggest that shareholders focus on investment principles that have been proven over time: Seek balance and diversification across and within asset classes, pay attention to costs, and avoid trying to time the market or chase performance.
To handle the market’s inevitable turmoil, we urge shareholders to build and maintain a balanced portfolio of stock, bond, and money market mutual funds suited to their specific goals, time horizon, and risk tolerance. Vanguard Dividend Appreciation Index Fund can be an important part of such a diversified portfolio.
Thank you for entrusting your assets to Vanguard.
Sincerely,

F. William McNabb III
President and Chief Executive Officer
February 12, 2009
Vanguard Dividend Appreciation ETF |
Premium/Discount: April 21, 20061–January 31, 2009 |
| | | | |
| Market Price Above or | Market Price Below |
| Equal to Net Asset Value | | Net Asset Value |
| Number | Percentage | Number | Percentage |
Basis Point Differential2 | of Days | of Total Days | of Days | of Total Days |
0–24.9 | 333 | 47.50% | 337 | 48.08% |
25–49.9 | 14 | 2.00 | 5 | 0.71 |
50–74.9 | 5 | 0.71 | 0 | 0.00 |
75–100.0 | 3 | 0.43 | 1 | 0.14 |
>100.0 | 3 | 0.43 | 0 | 0.00 |
Total | 358 | 51.07% | 343 | 48.93% |
| | | | | |
1 Inception.
2 One basis point equals 1/100 of a percentage point.
6
Dividend Appreciation Index Fund
Fund Profile
As of January 31, 2009
Portfolio Characteristics | | |
| | Comparative | Broad |
| Fund | Index1 | Index2 |
Number of Stocks | 2323 | 187 | 4,554 |
Median Market Cap | $37.6B | $37.6B | $24.3B |
Price/Earnings Ratio | 11.7x | 11.7x | 11.7x |
Price/Book Ratio | 2.4x | 2.4x | 1.6x |
Yield4 | | 3.1% | 2.9% |
Investor Shares | 2.7% | | |
ETF Shares | 3.0% | | |
Return on Equity | 25.4% | 25.4% | 21.1% |
Earnings Growth Rate | 15.1% | 15.1% | 18.3% |
Foreign Holdings | 0.0% | 0.0% | 0.0% |
Turnover Rate | 34% | — | — |
Expense Ratio | | | |
(1/31/2008)5 | | — | — |
Investor Shares | 0.40% | | |
ETF Shares | 0.28% | | |
Short-Term Reserves6 | –0.3% | — | — |
Sector Diversification (% of equity exposure) |
| | Comparative | Broad |
| Fund | Index1 | Index2 |
Consumer | | | |
Discretionary | 11.1% | 11.1% | 8.7% |
Consumer Staples | 25.4 | 25.4 | 11.2 |
Energy | 8.2 | 8.2 | 13.2 |
Financials | 12.0 | 12.0 | 13.1 |
Health Care | 14.2 | 14.2 | 15.6 |
Industrials | 14.9 | 14.9 | 10.7 |
Information Technology | 6.2 | 6.2 | 16.0 |
Materials | 5.1 | 5.1 | 3.3 |
Telecommunication | | | |
Service | 0.0 | 0.0 | 3.4 |
Utilities | 2.9 | 2.9 | 4.8 |
Ten Largest Holdings7 (% of total net assets) |
| | |
Abbott Laboratories | pharmaceuticals | 4.2% |
Johnson & Johnson | pharmaceuticals | 4.1 |
The Coca-Cola Co. | soft drinks | 4.1 |
Wal-Mart Stores, Inc. | hypermarkets | |
| and super centers | 4.1 |
International Business | | |
Machines Corp. | computer hardware | 4.1 |
ExxonMobil Corp. | integrated oil | |
| and gas | 4.0 |
PepsiCo, Inc. | soft drinks | 4.0 |
Chevron Corp. | integrated oil | |
| and gas | 4.0 |
McDonald’s Corp. | restaurants | 4.0 |
The Procter & Gamble Co. | household | |
| products | 3.9 |
Top Ten | | 40.5% |
Investment Focus
1 Dividend Achievers Select Index.
2 Dow Jones Wilshire 5000 Index.
3 The temporary difference between the number of stocks in the fund and the number of stocks in the target index resulted from the annual reconstitution of the index. The fund generally holds the same number of stocks as the index.
4 30-day SEC yield for the fund; annualized dividend yield for the indexes. See the Glossary.
5 The expense ratios shown are from the prospectus dated May 29, 2008. For the fiscal year ended January 31, 2009, expense ratios were 0.36% for Investor Shares and 0.24% for ETF Shares.
6 Short-Term reserves appear as a negative value because of security purchases that were settled after January 31, 2009.
7 The holdings listed exclude any temporary cash investments and equity index products.
7
Dividend Appreciation Index Fund
Performance Summary
All of the returns in this report represent past performance, which is not a guarantee of future results that may be achieved by the fund. (Current performance may be lower or higher than the performance data cited. For performance data current to the most recent month-end, visit our website at www.vanguard.com/performance.) Note, too, that both investment returns and principal value can fluctuate widely, so an investor’s shares, when sold, could be worth more or less than their original cost. The returns shown do not reflect taxes that a shareholder would pay on fund distributions or on the sale of fund shares.
Cumulative Performance: April 27, 2006–January 31, 2009
Initial Investment of $10,000
| Average Annual Total Returns | |
| Periods Ended January 31, 2009 | Final Value |
| | Since | of a $10,000 |
| One Year | Inception1 | Investment |
Dividend Appreciation Index Fund Investor Shares2 | –29.48% | –8.96% | $7,714 |
Dow Jones Wilshire 5000 Index | –38.69 | –13.87 | 6,619 |
Dividend Achievers Select Index | –29.38 | –8.77 | 7,759 |
Average Large-Cap Core Fund3 | –38.14 | –13.96 | 6,598 |
| | | Final Value |
| | Since | of a $10,000 |
| One Year | Inception1 | Investment |
Dividend Appreciation Index Fund | | | |
ETF Shares Net Asset Value | –29.38% | –8.72% | $7,760 |
Dow Jones Wilshire 5000 Index | –38.69 | –13.88 | 6,600 |
Dividend Achievers Select Index | –29.38 | –8.63 | 7,781 |
Cumulative Returns of ETF Shares: April 21, 2006–January 31, 2009 | |
| | |
| One Year | Since Inception1 |
Dividend Appreciation Index Fund ETF Shares Market Price | –28.83% | –22.18% |
Dividend Appreciation Index Fund ETF Shares Net Asset Value | –29.38 | –22.40 |
Dividend Achievers Select Index | –29.38 | –22.19 |
1 Performance for the fund and its comparative standards is calculated since the following inception dates: April 27, 2006, for the Investor Shares and April 21, 2006, for the ETF Shares.
2 Total returns do not include the account service fee that may be applicable to certain accounts with balances below $10,000.
3 Derived from data provided by Lipper Inc.
8
Dividend Appreciation Index Fund
Fiscal Year Total Returns (%): April 27, 2006–January 31, 2009
Average Annual Total Returns: Periods Ended December 31, 2008
This table presents average annual total returns through the latest calendar quarter—rather than through the end of the fiscal period. Securities and Exchange Commission rules require that we provide this information.
| | | Since |
| Inception Date | One Year | Inception |
Investor Shares1 | 4/27/2006 | –26.56% | –6.31% |
ETF Shares | 4/21/2006 | | |
Market Price | | –26.38 | –6.06 |
Net Asset Value | | –26.50 | –6.08 |
1 Total returns do not include the account service fee that may be applicable to certain accounts with balances below $10,000.
Note: See Financial Highlights tables for dividend and capital gains information.
9
Dividend Appreciation Index Fund
Financial Statements
Statement of Net Assets
As of January 31, 2009
The fund provides a complete list of its holdings four times in each fiscal year, at the quarter-ends. For the second and fourth fiscal quarters, the lists appear in the fund’s semiannual and annual reports to shareholders. For the first and third fiscal quarters, the fund files the lists with the Securities and Exchange Commission on Form N-Q. Shareholders can look up the fund’s Forms N-Q on the SEC’s website at www.sec.gov. Forms N-Q may also be reviewed and copied at the SEC’s Public Reference Room (see the back cover of this report for further information).
| | Market |
| | Value• |
| Shares | ($000) |
Common Stocks (100.2%) | | |
Consumer Discretionary (11.1%) | | |
McDonald’s Corp. | 815,610 | 47,322 |
Lowe’s Cos., Inc. | 1,103,763 | 20,166 |
Target Corp. | 518,419 | 16,175 |
Johnson Controls, Inc. | 544,602 | 6,813 |
TJX Cos., Inc. | 285,784 | 5,550 |
H & R Block, Inc. | 249,232 | 5,167 |
The McGraw-Hill | | |
Cos., Inc. | 223,458 | 4,914 |
Sherwin-Williams Co. | 97,979 | 4,679 |
Genuine Parts Co. | 127,023 | 4,067 |
VF Corp. | 71,845 | 4,025 |
Fortune Brands, Inc. | 113,255 | 3,624 |
Ross Stores, Inc. | 86,455 | 2,544 |
Family Dollar Stores, Inc. | 89,823 | 2,494 |
The Stanley Works | 53,753 | 1,680 |
John Wiley & Sons | | |
Class A | 33,471 | 1,186 |
Matthews | | |
International Corp. | 19,582 | 763 |
Wolverine | | |
World Wide, Inc. | 37,527 | 681 |
Cato Corp. Class A | 19,529 | 258 |
Weyco Group, Inc. | 8,569 | 247 |
Home Depot, Inc. | 2,404 | 52 |
Harley-Davidson, Inc. | 447 | 5 |
Nordstrom, Inc. | 351 | 4 |
Gannett Co., Inc. | 381 | 2 |
Polaris Industries, Inc. | 61 | 1 |
Meredith Corp. | 71 | 1 |
Harte-Hanks, Inc. | 96 | 1 |
| | 132,421 |
| | |
Consumer Staples (25.4%) | | |
Beverages (8.4%) | | |
The Coca-Cola Co. | 1,137,332 | 48,587 |
PepsiCo, Inc. | 958,295 | 48,135 |
Brown-Forman Corp. | | |
Class B | 70,824 | 3,216 |
| | Market |
| | Value• |
| Shares | ($000) |
Food & Staples Retailing (6.2%) | | |
Wal-Mart Stores, Inc. | 1,024,793 | 48,288 |
Walgreen Co. | 609,455 | 16,705 |
Sysco Corp. | 401,893 | 8,958 |
SUPERVALU, Inc. | 417 | 7 |
| | |
Food Products (2.3%) | | |
Archer-Daniels-Midland Co. | 458,492 | 12,554 |
The Hershey Co. | 107,873 | 4,022 |
J.M. Smucker Co. | 80,002 | 3,612 |
Hormel Foods Corp. | 93,649 | 2,794 |
McCormick & Co., Inc. | 82,328 | 2,638 |
Lancaster Colony Corp. | 20,002 | 728 |
Tootsie Roll | | |
Industries, Inc. | 25,605 | 611 |
| | |
Household Products (7.9%) | | |
The Procter & | | |
Gamble Co. | 857,984 | 46,760 |
Colgate-Palmolive Co. | 377,311 | 24,540 |
Kimberly-Clark Corp. | 291,370 | 14,997 |
The Clorox Co. | 107,770 | 5,405 |
Church & Dwight, Inc. | 49,628 | 2,642 |
| | |
Personal Products (0.6%) | | |
Avon Products, Inc. | 331,396 | 6,777 |
Universal Corp. (VA) | 39 | 1 |
| | 301,977 |
| | |
Energy (8.2%) | | |
ExxonMobil Corp. | 629,906 | 48,175 |
Chevron Corp. | 676,429 | 47,702 |
Helmerich & Payne, Inc. | 67,225 | 1,510 |
Holly Corp. | 28,577 | 668 |
| | 98,055 |
| | |
Financials (12.0%) | | |
Wells Fargo & Co. | 2,346,498 | 44,349 |
AFLAC Inc. | 593,123 | 13,766 |
The Chubb Corp. | 281,826 | 12,000 |
State Street Corp. | 458,636 | 10,672 |
10
Dividend Appreciation Index Fund
| | | Market |
| | | Value• |
| | Shares | ($000) |
| Franklin Resources Corp. | 189,983 | 9,199 |
| Northern Trust Corp. | 132,453 | 7,619 |
| T. Rowe Price Group Inc. | 190,603 | 5,257 |
| Commerce | | |
| Bancshares, Inc. | 62,158 | 2,172 |
| HCC Insurance | | |
| Holdings, Inc. | 85,725 | 2,007 |
| Brown & Brown, Inc. | 102,606 | 1,963 |
| Cullen/Frost Bankers, Inc. | 44,544 | 1,950 |
| Legg Mason Inc. | 119,078 | 1,912 |
| SEI Investments Co. | 149,069 | 1,889 |
| Valley National Bancorp | 132,101 | 1,720 |
| Transatlantic Holdings, Inc. | 51,187 | 1,646 |
| Eaton Vance Corp. | 80,983 | 1,550 |
| City National Corp. | 43,121 | 1,492 |
| Wesco Financial Corp. | 4,768 | 1,438 |
| Bank of Hawaii Corp. | 39,299 | 1,410 |
| UMB Financial Corp. | 33,243 | 1,288 |
| First Niagara Financial | | |
| Group, Inc. | 95,177 | 1,243 |
| BancorpSouth, Inc. | 64,678 | 1,222 |
| United Bankshares, Inc. | 44,738 | 939 |
| Westamerica | | |
| Bancorporation | 21,901 | 936 |
| R.L.I. Corp. | 15,743 | 889 |
| Trustmark Corp. | 41,162 | 836 |
| Glacier Bancorp, Inc. | 52,350 | 804 |
| State Auto Financial Corp. | 35,274 | 780 |
| First Financial | | |
| Bankshares, Inc. | 16,787 | 745 |
| Harleysville Group, Inc. | 23,072 | 656 |
| S & T Bancorp, Inc. | 24,377 | 620 |
| BancFirst Corp. | 15,025 | 535 |
| Community Bank | | |
| System, Inc. | 28,140 | 505 |
| IBERIABANK Corp. | 11,577 | 491 |
| WesBanco, Inc. | 21,934 | 453 |
| Chemical Financial Corp. | 18,394 | 419 |
^ | First Busey Corp. | 42,260 | 370 |
| Tompkins Trustco, Inc. | 7,335 | 368 |
| First Source Corp. | 20,222 | 360 |
| First Financial Corp. (IN) | 10,663 | 353 |
| Community Trust | | |
| Bancorp Inc. | 12,138 | 340 |
| Bank of the Ozarks, Inc. | 14,755 | 335 |
| Sterling Bancshares, Inc. | 56,369 | 313 |
| Capital City Bank | | |
| Group, Inc. | 19,059 | 305 |
| Republic Bancorp, Inc. | | |
| Class A | 16,720 | 301 |
| Simmons First | | |
| National Corp. | 11,033 | 272 |
| Renasant Corp. | 19,372 | 235 |
| Southside Bancshares, Inc. | 12,095 | 230 |
| Sandy Spring Bancorp, Inc. | 15,958 | 225 |
| | Market |
| | Value• |
| Shares | ($000) |
First Community | | |
Bancshares, Inc. | 12,937 | 223 |
Heartland Financial | | |
USA, Inc. | 15,907 | 219 |
Washington Trust | | |
Bancorp, Inc. | 12,744 | 208 |
WSFS Financial Corp. | 7,614 | 196 |
Lakeland Financial Corp. | 9,416 | 194 |
Mainsource Financial | | |
Group, Inc. | 18,339 | 179 |
S.Y. Bancorp, Inc. | 7,718 | 176 |
Arrow Financial Corp. | 7,405 | 174 |
Flushing Financial Corp. | 21,625 | 171 |
Southwest Bancorp, Inc. | 8,068 | 85 |
The Allstate Corp. | 896 | 19 |
The Hartford Financial | | |
Services Group Inc. | 541 | 7 |
Lincoln National Corp. | 450 | 7 |
M & T Bank Corp. | 156 | 6 |
Cincinnati Financial Corp. | 268 | 6 |
American International | | |
Group, Inc. | 4,106 | 5 |
Synovus Financial Corp. | 1,003 | 4 |
Erie Indemnity Co. | | |
Class A | 87 | 3 |
CVB Financial Corp. | 124 | 1 |
Ambac Financial Group, Inc. | 898 | 1 |
Protective Life Corp. | 115 | 1 |
Forest City Enterprise | | |
Class A | 140 | 1 |
Suffolk Bancorp | 15 | — |
Peoples Bancorp, Inc. | 17 | — |
Old Second Bancorp, Inc. | 19 | — |
Banner Corp. | 30 | — |
West Coast Bancorp | 30 | — |
Horizon Financial Corp. | 23 | — |
First State Bancorporation | 36 | — |
Anchor Bancorp Wisconsin Inc. | 33 | — |
| | 143,265 |
| | |
Health Care (14.2%) | | |
Abbott Laboratories | 907,129 | 50,291 |
Johnson & Johnson | 852,473 | 49,179 |
Medtronic, Inc. | 708,815 | 23,738 |
Becton, Dickinson & Co. | 163,855 | 11,907 |
Stryker Corp. | 259,857 | 10,976 |
Cardinal Health, Inc. | 219,795 | 8,275 |
C.R. Bard, Inc. | 67,728 | 5,795 |
DENTSPLY International Inc. | 102,555 | 2,760 |
Beckman Coulter, Inc. | 39,400 | 1,959 |
Teleflex Inc. | 26,040 | 1,385 |
Owens & Minor, Inc. | 26,730 | 1,063 |
West Pharmaceutical Services, Inc. | 25,138 | 835 |
Meridian Bioscience Inc. | 32,982 | 701 |
11
Dividend Appreciation Index Fund
| | | Market |
| | | Value• |
| | Shares | ($000) |
| Eli Lilly & Co. | 1,819 | 67 |
| Hill-Rom Holdings, Inc. | 106 | 2 |
| | | 168,933 |
| | | |
Industrials (15.0%) | | |
| United Technologies Corp. | 700,329 | 33,609 |
| 3M Co. | 501,033 | 26,951 |
| Emerson Electric Co. | 555,020 | 18,149 |
| Caterpillar, Inc. | 568,380 | 17,535 |
| General Dynamics Corp. | 260,619 | 14,785 |
| Danaher Corp. | 218,375 | 12,214 |
| Illinois Tool Works, Inc. | 357,588 | 11,679 |
| C.H. Robinson | | |
| Worldwide Inc. | 139,997 | 6,437 |
| Expeditors | | |
| International | | |
| of Washington, Inc. | 163,413 | 4,545 |
| Parker Hannifin Corp. | 114,327 | 4,368 |
| W.W. Grainger, Inc. | 55,527 | 4,051 |
| Dover Corp. | 133,124 | 3,765 |
| Fastenal Co. | 100,528 | 3,436 |
| Roper Industries Inc. | 62,188 | 2,558 |
| Cintas Corp. | 101,641 | 2,312 |
| Donaldson Co., Inc. | 55,979 | 1,742 |
| Pentair, Inc. | 65,657 | 1,502 |
| Harsco Corp. | 56,610 | 1,343 |
| CLARCOR Inc. | 36,874 | 1,119 |
| Carlisle Co., Inc. | 44,721 | 835 |
| Brady Corp. | | |
| Class A | 36,280 | 759 |
| Nordson Corp. | 20,688 | 625 |
| ABM Industries Inc. | 40,986 | 609 |
| Mine Safety | | |
| Appliances Co. | 28,130 | 552 |
| Franklin Electric, Inc. | 16,105 | 419 |
| A.O. Smith Corp. | 15,085 | 415 |
| Gorman-Rupp Co. | 12,932 | 331 |
| Universal Forest | | |
| Products, Inc. | 15,020 | 315 |
| McGrath RentCorp | 14,003 | 294 |
| Badger Meter, Inc. | 11,901 | 281 |
| Raven Industries, Inc. | 11,825 | 258 |
| Tennant Co. | 12,674 | 172 |
| Courier Corp. | 7,888 | 124 |
| General Electric Co. | 6,622 | 80 |
| Pitney Bowes, Inc. | 355 | 8 |
| Avery Dennison Corp. | 173 | 4 |
^ | HNI Corp. | 77 | 1 |
| Otter Tail Corp. | 50 | 1 |
| LSI Industries Inc. | 49 | — |
| NACCO Industries, Inc. | | |
| Class A | 11 | — |
| | | 178,183 |
| | Market |
| | Value• |
| Shares | ($000) |
Information Technology (6.2%) | | |
International Business | | |
Machines Corp. | 526,410 | 48,245 |
Automatic Data | | |
Processing, Inc. | 371,547 | 13,498 |
Paychex, Inc. | 261,193 | 6,344 |
Linear Technology Corp. | 138,534 | 3,244 |
Diebold, Inc. | 51,071 | 1,266 |
Jack Henry & | | |
Associates Inc. | 61,098 | 1,088 |
Total System Services, Inc. | 382 | 5 |
| | 73,690 |
| | |
Materials (5.2%) | | |
Praxair, Inc. | 199,328 | 12,410 |
Nucor Corp. | 226,698 | 9,247 |
Rohm & Haas Co. | 147,652 | 8,149 |
Air Products & | | |
Chemicals, Inc. | 130,980 | 6,588 |
Ecolab, Inc. | 164,014 | 5,570 |
Vulcan Materials Co. | 99,783 | 4,935 |
Sigma-Aldrich Corp. | 96,972 | 3,499 |
Martin Marietta Materials, Inc. | 33,595 | 2,705 |
AptarGroup Inc. | 51,988 | 1,602 |
Bemis Co., Inc. | 70,421 | 1,589 |
Sonoco Products Co. | 66,515 | 1,525 |
Albemarle Corp. | 61,649 | 1,372 |
Valspar Corp. | 66,723 | 1,158 |
H.B. Fuller Co. | 34,793 | 486 |
Stepan Co. | 7,861 | 288 |
Myers Industries, Inc. | 22,672 | 142 |
PPG Industries, Inc. | 280 | 11 |
RPM International, Inc. | 198 | 2 |
| | 61,278 |
| | |
Telecommunication Services (0.0%) | | |
Shenandoah | | |
Telecommunications Co. | 15,720 | 383 |
AT&T Inc. | 5,758 | 142 |
CenturyTel, Inc. | 204 | 6 |
| | 531 |
| | |
Utilities (2.9%) | | |
FPL Group, Inc. | 278,358 | 14,349 |
Questar Corp. | 109,639 | 3,726 |
MDU Resources | | |
Group, Inc. | 131,641 | 2,618 |
Aqua America, Inc. | 93,152 | 1,932 |
UGI Corp. Holding Co. | 73,103 | 1,855 |
National Fuel Gas Co. | 55,604 | 1,666 |
Piedmont Natural Gas, Inc. | 61,594 | 1,596 |
Energen Corp. | 49,188 | 1,437 |
New Jersey | | |
Resources Corp. | 29,132 | 1,168 |
WGL Holdings Inc. | 34,424 | 1,105 |
12
Dividend Appreciation Index Fund
| | Market |
| | Value• |
| Shares | ($000) |
Northwest Natural Gas Co. | 18,744 | 805 |
California Water | | |
Service Group | 15,222 | 662 |
MGE Energy, Inc. | 15,880 | 509 |
SJW Corp. | 14,013 | 377 |
American States Water Co. | 9,673 | 334 |
Middlesex Water Co. | 9,510 | 157 |
Connecticut Water | | |
Services, Inc. | 5,804 | 134 |
Black Hills Corp. | 68 | 2 |
Southwest Water Co. | 42 | — |
| | 34,432 |
Total Common Stocks | | |
(Cost $1,353,102) | | 1,192,765 |
Temporary Cash Investment (0.0%) | | |
1,2 Vanguard Market Liquidity | | |
Fund, 0.780% (Cost $188) | 187,893 | 188 |
Total Investments (100.2%) | | |
(Cost $1,353,290) | | 1,192,953 |
Other Assets and Liabilities—Net (–0.2%) | | (2,189) |
Net Assets (100%) | | 1,190,764 |
| | |
Statement of Assets and Liabilities | | |
Assets | | |
Investment in Securities, at Value | | 1,192,953 |
Receivables for | | |
Investment Securities Sold | | 234,328 |
Receivables for Capital Shares Issued | | 4,359 |
Other Assets | | 2,209 |
Total Assets | | 1,433,849 |
Liabilities | | |
Payables for Investment | | |
Securities Purchased | | 240,764 |
Payables for Capital | | |
Shares Redeemed | | 1,618 |
Security Lending Collateral | | |
Payable to Brokers | | 166 |
Other Liabilities | | 537 |
Total Liabilities | | 243,085 |
Net Assets | | 1,190,764 |
At January 31, 2009, net assets consisted of: |
| Amount |
| ($000) |
Paid-in Capital | 1,519,576 |
Undistributed Net Investment Income | 1,762 |
Accumulated Net Realized Losses | (170,237) |
Unrealized Appreciation (Depreciation) | (160,337) |
Net Assets | 1,190,764 |
| |
Investor Shares—Net Assets | |
Applicable to 26,111,735 outstanding | |
$.001 par value shares of beneficial | |
interest (unlimited authorization) | 386,210 |
Net Asset Value Per Share— | |
Investor Shares | $14.79 |
| |
ETF Shares—Net Assets | |
Applicable to 21,766,895 outstanding | |
$.001 par value shares of beneficial | |
interest (unlimited authorization) | 804,554 |
Net Asset Value Per Share— | |
ETF Shares | $36.96 |
• | See Note A in Notes to Financial Statements. |
^ Part of security position is on loan to broker-dealers. The total value of securities on loan is $145,000.
1 Affiliated money market fund available only to Vanguard funds and certain trusts and accounts managed by Vanguard. Rate shown is the 7-day yield.
2 Includes $166,000 of collateral received for securities on loan.
See accompanying Notes, which are an integral part of the Financial Statements.
13
Dividend Appreciation Index Fund
Statement of Operations
| Year Ended |
| January 31, 2009 |
| ($000) |
Investment Income | |
Income | |
Dividends | 21,654 |
Interest1 | 32 |
Security Lending | 71 |
Total Income | 21,757 |
Expenses | |
The Vanguard Group—Note B | |
Investment Advisory Services | 81 |
Management and Administrative | |
Investor Shares | 1,159 |
ETF Shares | 877 |
Marketing and Distribution | |
Investor Shares | 104 |
ETF Shares | 107 |
Custodian Fees | 89 |
Auditing Fees | 22 |
Shareholders’ Reports | |
Investor Shares | 10 |
ETF Shares | 12 |
Trustees’ Fees and Expenses | 1 |
Total Expenses | 2,462 |
Net Investment Income | 19,295 |
Realized Net Gain (Loss) on Investment Securities Sold | (150,714) |
Change in Unrealized Appreciation (Depreciation) of Investment Securities | (162,335) |
Net Increase (Decrease) in Net Assets Resulting from Operations | (293,754) |
1 Interest income from an affiliated company of the fund was $32,000.
See accompanying Notes, which are an integral part of the Financial Statements.
14
Dividend Appreciation Index Fund
Statement of Changes in Net Assets
| Year Ended January 31, |
| 2009 | 2008 |
| ($000) | ($000) |
Increase (Decrease) In Net Assets | | |
Operations | | |
Net Investment Income | 19,295 | 7,113 |
Realized Net Gain (Loss) | (150,714) | (8,098) |
Change in Unrealized Appreciation (Depreciation) | (162,335) | (9,574) |
Net Increase (Decrease) in Net Assets Resulting from Operations | (293,754) | (10,559) |
Distributions | | |
Net Investment Income | | |
Investor Shares | (7,677) | (4,174) |
ETF Shares | (10,413) | (2,783) |
Realized Capital Gain | | |
Investor Shares | — | — |
ETF Shares | — | — |
Total Distributions | (18,090) | (6,957) |
Capital Share Transactions | | |
Investor Shares | 164,638 | 204,617 |
ETF Shares | 679,485 | 197,765 |
Net Increase (Decrease) from Capital Share Transactions | 844,123 | 402,382 |
Total Increase (Decrease) | 532,279 | 384,866 |
Net Assets | | |
Beginning of Period | 658,485 | 273,619 |
End of Period1 | 1,190,764 | 658,485 |
1 Net Assets—End of Period includes undistributed net investment income of $1,762,000 and $557,000.
See accompanying Notes, which are an integral part of the Financial Statements.
15
Dividend Appreciation Index Fund
Financial Highlights
Investor Shares | | | |
| | | April 27, |
| | Year Ended | 20061 to |
| | January 31, | Jan. 31, |
For a Share Outstanding Throughout Each Period | 2009 | 2008 | 2007 |
Net Asset Value, Beginning of Period | $21.40 | $21.84 | $20.05 |
Investment Operations | | | |
Net Investment Income | .387 | .325 | .214 |
Net Realized and Unrealized Gain (Loss) on Investments | (6.614) | (.438) | 1.782 |
Total from Investment Operations | (6.227) | (.113) | 1.996 |
Distributions | | | |
Dividends from Net Investment Income | (.383) | (.327) | (.206) |
Distributions from Realized Capital Gains | — | — | — |
Total Distributions | (.383) | (.327) | (.206) |
Net Asset Value, End of Period | $14.79 | $21.40 | $21.84 |
| | | |
Total Return2 | –29.48% | –0.58% | 10.02% |
| | | |
Ratios/Supplemental Data | | | |
Net Assets, End of Period (Millions) | $386 | $357 | $163 |
Ratio of Total Expenses to Average Net Assets | 0.36% | 0.40% | 0.40%3 |
Ratio of Net Investment Income to Average Net Assets | 2.25% | 1.56% | 1.53%3 |
Portfolio Turnover Rate4 | 34% | 17% | 21% |
1 Inception.
2 Total returns do not include the account service fee that may be applicable to certain accounts with balances below $10,000.
3 Annualized.
4 Excludes the value of portfolio securities received or delivered as a result of in-kind purchases or redemptions of the fund’s capital shares, including ETF Creation Units.
See accompanying Notes, which are an integral part of the Financial Statements.
16
Dividend Appreciation Index Fund
Financial Highlights
ETF Shares | | | |
| | | April 21, |
| | Year Ended | 20061 to |
| | January 31, | Jan. 31, |
For a Share Outstanding Throughout Each Period | 2009 | 2008 | 2007 |
Net Asset Value, Beginning of Period | $53.48 | $54.60 | $49.94 |
Investment Operations | | | |
Net Investment Income | 1.032 | .873 | .555 |
Net Realized and Unrealized Gain (Loss) on Investments | (16.526) | (1.120) | 4.631 |
Total from Investment Operations | (15.494) | (.247) | 5.186 |
Distributions | | | |
Dividends from Net Investment Income | (1.026) | (.873) | (.526) |
Distributions from Realized Capital Gains | — | — | — |
Total Distributions | (1.026) | (.873) | (.526) |
Net Asset Value, End of Period | $36.96 | $53.48 | $54.60 |
| | | |
Total Return | –29.38% | –0.51% | 10.45% |
| | | |
Ratios/Supplemental Data | | | |
Net Assets, End of Period (Millions) | $805 | $302 | $111 |
Ratio of Total Expenses to Average Net Assets | 0.24% | 0.28% | 0.28%2 |
Ratio of Net Investment Income to Average Net Assets | 2.37% | 1.68% | 1.65%2 |
Portfolio Turnover Rate3 | 34% | 17% | 21% |
1 Inception.
2 Annualized.
3 Excludes the value of portfolio securities received or delivered as a result of in-kind purchases or redemptions of the fund’s capital shares, including ETF Creation Units.
See accompanying Notes, which are an integral part of the Financial Statements.
17
Dividend Appreciation Index Fund
Notes to Financial Statements
Vanguard Dividend Appreciation Index Fund is registered under the Investment Company Act of 1940 as an open-end investment company, or mutual fund. The fund offers two classes of shares: Investor Shares and ETF Shares. Investor Shares are available to any investor who meets the fund’s minimum purchase requirements. ETF Shares are listed for trading on the NYSE Arca, Inc.; they can be purchased and sold through a broker.
A. The following significant accounting policies conform to generally accepted accounting principles for U.S. mutual funds. The fund consistently follows such policies in preparing its financial statements.
1. Security Valuation: Securities are valued as of the close of trading on the New York Stock Exchange (generally 4 p.m., Eastern time) on the valuation date. Equity securities are valued at the latest quoted sales prices or official closing prices taken from the primary market in which each security trades; such securities not traded on the valuation date are valued at the mean of the latest quoted bid and asked prices. Securities for which market quotations are not readily available, or whose values have been materially affected by events occurring before the fund’s pricing time but after the close of the securities’ primary markets, are valued by methods deemed by the board of trustees to represent fair value. Investments in Vanguard Market Liquidity Fund are valued at that fund’s net asset value.
2. Federal Income Taxes: The fund intends to continue to qualify as a regulated investment company and distribute all of its taxable income. Management has analyzed the fund’s tax positions taken on federal income tax returns for all open tax years (tax years ended January 31, 2007–2009), and has concluded that no provision for federal income tax is required in the fund’s financial statements.
3. Distributions: Distributions to shareholders are recorded on the ex-dividend date.
4. Security Lending: The fund may lend its securities to qualified institutional borrowers to earn additional income. Security loans are required to be secured at all times by collateral at least equal to the market value of securities loaned. The fund invests cash collateral received in Vanguard Market Liquidity Fund, and records a liability for the return of the collateral, during the period the securities are on loan. Security lending income represents the income earned on investing cash collateral, less expenses associated with the loan.
5. Other: Dividend income is recorded on the ex-dividend date. Interest income includes income distributions received from Vanguard Market Liquidity Fund and is accrued daily. Security transactions are accounted for on the date securities are bought or sold. Costs used to determine realized gains (losses) on the sale of investment securities are those of the specific securities sold.
Each class of shares has equal rights as to assets and earnings, except that each class separately bears certain class-specific expenses related to maintenance of shareholder accounts (included in Management and Administrative expenses) and shareholder reporting. Marketing and distribution expenses are allocated to each class of shares based on a method approved by the board of trustees. Income, other non-class-specific expenses, and gains and losses on investments are allocated to each class of shares based on its relative net assets.
B. The Vanguard Group furnishes at cost investment advisory, corporate management, administrative, marketing, and distribution services. The costs of such services are allocated to the fund under methods approved by the board of trustees. The fund has committed to provide up to 0.40% of its net assets in capital contributions to Vanguard. At January 31, 2009, the fund had contributed capital of
18
Dividend Appreciation Index Fund
$285,000 to Vanguard (included in Other Assets), representing 0.02% of the fund’s net assets and 0.11% of Vanguard’s capitalization. The fund’s trustees and officers are also directors and officers of Vanguard.
C. Distributions are determined on a tax basis and may differ from net investment income and realized capital gains for financial reporting purposes. Differences may be permanent or temporary. Permanent differences are reclassified among capital accounts in the financial statements to reflect their tax character. Temporary differences arise when certain items of income, expense, gain, or loss are recognized in different periods for financial statement and tax purposes; these differences will reverse at some time in the future. Differences in classification may also result from the treatment of short-term gains as ordinary income for tax purposes.
During the year ended January 31, 2009, the fund realized $2,388,000 of net capital gains resulting from in-kind redemptions—in which shareholders exchanged fund shares for securities held by the fund rather than for cash. Because such gains are not taxable to the fund, and are not distributed to shareholders, they have been reclassified from accumulated net realized losses to paid-in capital.
For tax purposes, at January 31, 2009, the fund had $2,145,000 of ordinary income available for distribution. The fund had available realized losses of $166,419,000 to offset future net capital gains of $609,000 through January 31, 2016, $22,242,000 through January 31, 2017, and $143,568,000 through January 31, 2018.
At January 31, 2009, the cost of investment securities for tax purposes was $1,357,108,000. Net unrealized depreciation of investment securities for tax purposes was $164,155,000, consisting of unrealized gains of $4,974,000 on securities that had risen in value since their purchase and $169,129,000 in unrealized losses on securities that had fallen in value since their purchase.
D. During the year ended January 31, 2009, the fund purchased $1,156,139,000 of investment securities and sold $306,412,000 of investment securities other than temporary cash investments.
E. Capital share transactions for each class of shares were:
| | | Year Ended January 31, |
| | 2009 | | 2008 |
| Amount | Shares | Amount | Shares |
| ($000) | (000) | ($000) | (000) |
Investor Shares | | | | |
Issued | 229,131 | 12,962 | 233,275 | 10,505 |
Issued in Lieu of Cash Distributions | 6,983 | 372 | 3,696 | 165 |
Redeemed | (71,476) | (3,895) | (32,354) | (1,454) |
Net Increase (Decrease)—Investor Shares | 164,638 | 9,439 | 204,617 | 9,216 |
ETF Shares | | | | |
Issued | 692,968 | 16,425 | 241,521 | 4,414 |
Issued in Lieu of Cash Distributions | — | — | — | — |
Redeemed | (13,483) | (300) | (43,756) | (800) |
Net Increase (Decrease)—ETF Shares | 679,485 | 16,125 | 197,765 | 3,614 |
19
Dividend Appreciation Index Fund
F. In September 2006, the Financial Accounting Standards Board issued Statement of Financial Accounting Standards No. 157 (“FAS 157”), “Fair Value Measurements.” FAS 157 establishes a framework for measuring fair value and expands disclosures about fair value measurements in financial statements.
The various inputs that may be used to determine the value of the fund’s investments are summarized in three broad levels. The inputs or methodologies used for valuing securities are not necessarily an indication of the risk associated with investing in those securities.
Level 1—Quoted prices in active markets for identical securities.
Level 2—Other significant observable inputs (including quoted prices for similar securities, interest rates, prepayment speeds, credit risk, etc.).
Level 3—Significant unobservable inputs (including the fund’s own assumptions used to determine the fair value of investments).
At January 31, 2009, 100% of the fund’s investments were valued based on Level 1 inputs.
20
Report of Independent Registered Public Accounting Firm
To the Trustees of Vanguard Specialized Funds and the Shareholders of Vanguard Dividend Appreciation Index Fund:
In our opinion, the accompanying statements of net assets and of assets and liabilities and the related statements of operations and of changes in net assets and the financial highlights present fairly, in all material respects, the financial position of Vanguard Dividend Appreciation Index Fund (constituting a separate portfolio of Vanguard Specialized Funds, hereafter referred to as the “Fund“) at January 31, 2009, the results of its operations for the year then ended, the changes in its net assets for each of the two years in the period then ended and the financial highlights for each of the periods indicated, in conformity with accounting principles generally accepted in the United States of America. These financial statements and financial highlights (hereafter referred to as “financial statements“) are the responsibility of the Fund’s management; our responsibility is to express an opinion on these financial statements based on our audits. We conducted our audits of these financial statements in accordance with the standards of the Public Company Accounting Oversight Board (United States). Those standards require that we plan and perform the audit to obtain reasonable assurance about whether the financial statements are free of material misstatement. An audit includes examining, on a test basis, evidence supporting the amounts and disclosures in the financial statements, assessing the accounting principles used and significant estimates made by management, and evaluating the overall financial statement presentation. We believe that our audits, which included confirmation of securities at January 31, 2009 by correspondence with the custodian, and by agreement to the underlying ownership records for Vanguard Market Liquidity Fund, provide a reasonable basis for our opinion.
PricewaterhouseCoopers LLP
Philadelphia, Pennsylvania
March 20, 2009
Special 2008 tax information (unaudited) for Vanguard Dividend Appreciation Index Fund |
This information for the fiscal year ended January 31, 2009, is included pursuant to provisions of the Internal Revenue Code.
The fund distributed $18,090,000 of qualified dividend income to shareholders during the fiscal year.
For corporate shareholders, 100% of investment income (dividend income plus short-term gains, if any) qualifies for the dividends-received deduction.
21
Your Fund’s After-Tax Returns
This table presents returns for your fund both before and after taxes. The after-tax returns are shown in two ways: (1) assuming that an investor owned the fund during the entire period and paid taxes on the fund’s distributions, and (2) assuming that an investor paid taxes on the fund’s distributions and sold all shares at the end of each period.
Calculations are based on the highest individual federal income tax and capital gains tax rates in effect at the times of the distributions and the hypothetical sales. State and local taxes were not considered. After-tax returns reflect any qualified dividend income, using actual prior-year figures and estimates for 2009. (In the example, returns after the sale of fund shares may be higher than those assuming no sale. This occurs when the sale would have produced a capital loss. The calculation assumes that the investor received a tax deduction for the loss.)
The table shows returns for Investor Shares only; returns for other share classes will differ. Please note that your actual after-tax returns will depend on your tax situation and may differ from those shown. Also note that if you own the fund in a tax-deferred account, such as an individual retirement account or a 401(k) plan, this information does not apply to you. Such accounts are not subject to current taxes.
Finally, keep in mind that a fund’s performance—whether before or after taxes—does not guarantee future results.
Average Annual Total Returns: Dividend Appreciation Index Fund Investor Shares1 |
Periods Ended January 31, 2009 | | |
| One | Since |
| Year | Inception2 |
Returns Before Taxes | –29.48% | –8.96% |
Returns After Taxes on Distributions | –29.69 | –9.18 |
Returns After Taxes on Distributions and Sale of Fund Shares | –18.77 | –7.42 |
1 Total returns do not include the account service fee that may be applicable to certain accounts with balances below $10,000.
2 April 27, 2006.
22
About Your Fund’s Expenses
As a shareholder of the fund, you incur ongoing costs, which include costs for portfolio management, administrative services, and shareholder reports (like this one), among others. Operating expenses, which are deducted from a fund’s gross income, directly reduce the investment return of the fund.
A fund’s expenses are expressed as a percentage of its average net assets. This figure is known as the expense ratio. The following examples are intended to help you understand the ongoing costs (in dollars) of investing in your fund and to compare these costs with those of other mutual funds. The examples are based on an investment of $1,000 made at the beginning of the period shown and held for the entire period.
The accompanying table illustrates your fund’s costs in two ways:
• Based on actual fund return. This section helps you to estimate the actual expenses that you paid over the period. The “Ending Account Value“ shown is derived from the fund’s actual return, and the third column shows the dollar amount that would have been paid by an investor who started with $1,000 in the fund. You may use the information here, together with the amount you invested, to estimate the expenses that you paid over the period.
To do so, simply divide your account value by $1,000 (for example, an $8,600 account value divided by $1,000 = 8.6), then multiply the result by the number given for your fund under the heading “Expenses Paid During Period.“
• Based on hypothetical 5% yearly return. This section is intended to help you compare your fund’s costs with those of other mutual funds. It assumes that the fund had a yearly return of 5% before expenses, but that the expense ratio is unchanged. In this case—because the return used is not the fund’s actual return—the results do not apply to your investment. The example is useful in making comparisons because the Securities and Exchange Commission requires all mutual funds to calculate expenses based on a 5% return. You can assess your fund’s costs by comparing this hypothetical example with the hypothetical examples that appear in shareholder reports of other funds.
Six Months Ended January 31, 2009 | | | |
| Beginning | Ending | Expenses |
| Account Value | Account Value | Paid During |
Dividend Appreciation Index Fund | 7/31/2008 | 1/31/2009 | Period1 |
Based on Actual Fund Return | | | |
Investor Shares | $1,000.00 | $739.44 | $1.62 |
ETF Shares | 1,000.00 | 740.07 | 1.10 |
Based on Hypothetical 5% Yearly Return | | | |
Investor Shares | $1,000.00 | $1,023.34 | $1.89 |
ETF Shares | 1,000.00 | 1,023.95 | 1.28 |
1 These calculations are based on expenses incurred in the most recent six-month period. The fund’s annualized six-month expense ratios for that period are 0.37% for Investor Shares and 0.25% for ETF Shares. The dollar amounts shown as “Expenses Paid“ are equal to the annualized expense ratio multiplied by the average account value over the period, multiplied by the number of days in the most recent six-month period, then divided by the number of days in the most recent 12-month period.
23
Note that the expenses shown in the table are meant to highlight and help you compare ongoing costs only and do not reflect transaction costs incurred by the fund for buying and selling securities. Further, the expenses do not include the account service fee described in the prospectus. If such a fee were applied to your account, your costs would be higher. Your fund does not charge transaction fees, such as purchase or redemption fees, nor does it carry a “sales load.“
The calculations assume no shares were bought or sold during the period. Your actual costs may have been higher or lower, depending on the amount of your investment and the timing of any purchases or redemptions.
You can find more information about the fund’s expenses, including annual expense ratios, in the Financial Statements section of this report. For additional information on operating expenses and other shareholder costs, please refer to your fund’s current prospectus.
24
Glossary
Earnings Growth Rate. The average annual rate of growth in earnings over the past five years for the stocks now in a fund.
Equity Exposure. A measure that reflects a fund’s investments in stocks and stock futures. Any holdings in short-term reserves are excluded.
Expense Ratio. The percentage of a fund’s average net assets used to pay its annual administrative and advisory expenses. These expenses directly reduce returns to investors.
Foreign Holdings. The percentage of a fund’s net assets represented by securities of companies based outside the United States.
Inception Date. The date on which the assets of a fund (or one of its share classes) are first invested in accordance with the fund’s investment objective. For funds with a subscription period, the inception date is the day after that period ends. Investment performance is measured from the inception date.
Median Market Cap. An indicator of the size of companies in which a fund invests; the midpoint of market capitalization (market price x shares outstanding) of a fund’s stocks, weighted by the proportion of the fund’s assets invested in each stock. Stocks representing half of the fund���s assets have market capitalizations above the median, and the rest are below it.
Price/Book Ratio. The share price of a stock divided by its net worth, or book value, per share. For a fund, the weighted average price/book ratio of the stocks it holds.
Price/Earnings Ratio. The ratio of a stock’s current price to its per-share earnings over the past year. For a fund, the weighted average P/E of the stocks it holds. P/E is an indicator of market expectations about corporate prospects; the higher the P/E, the greater the expectations for a company’s future growth.
Return on Equity. The annual average rate of return generated by a company during the past five years for each dollar of shareholder’s equity (net income divided by shareholder’s equity). For a fund, the weighted average return on equity for the companies whose stocks it holds.
Short-Term Reserves. The percentage of a fund invested in highly liquid, short-term securities that can be readily converted to cash.
Turnover Rate. An indication of the fund’s trading activity. Funds with high turnover rates incur higher transaction costs and may be more likely to distribute capital gains (which may be taxable to investors). The turnover rate excludes in-kind transactions, which have minimal impact on costs.
Yield. A fund’s 30-day SEC yield is derived using a formula specified by the U.S. Securities and Exchange Commission. Under the formula, data related to the fund’s security holdings in the previous 30 days are used to calculate the fund’s hypothetical net income for that period, which is then annualized and divided by the fund’s estimated average net assets over the calculation period. For the purposes of this calculation, a security’s income is based on its current market yield to maturity (in the case of bonds) or its projected dividend yield (for stocks). Because the SEC yield represents hypothetical annualized income, it will differ—at times significantly—from the fund’s actual experience. As a result, the fund’s income distributions may be higher or lower than implied by the SEC yield.
25
This page intentionally left blank.
This page intentionally left blank.
The People Who Govern Your Fund
The trustees of your mutual fund are there to see that the fund is operated and managed in your best interests since, as a shareholder, you are a part owner of the fund. Your fund’s trustees also serve on the board of directors of The Vanguard Group, Inc., which is owned by the Vanguard funds and provides services to them on an at-cost basis.
A majority of Vanguard’s board members are independent, meaning that they have no affiliation with Vanguard or the funds they oversee, apart from the sizable personal investments they have made as private individuals. The independent board members have distinguished backgrounds in business, academia, and public service. Each of the trustees and executive officers oversees 156 Vanguard funds.
The following table provides information for each trustee and executive officer of the fund. More information about the trustees is in the Statement of Additional Information, which can be obtained, without charge, by contacting Vanguard at 800-662-7447, or online at www.vanguard.com.
Chairman of the Board and Interested Trustee | Rajiv L. Gupta |
| Born 1945. Trustee Since December 2001.2 Principal |
John J. Brennan1 | Occupation(s) During the Past Five Years: Chairman, |
Born 1954. Trustee Since May 1987. Chairman of | President, and Chief Executive Officer of Rohm and |
the Board. Principal Occupation(s) During the Past Five | Haas Co. (chemicals); Board Member of the American |
Years: Chairman of the Board and Director/Trustee of | Chemistry Council; Director of Tyco International, Ltd. |
The Vanguard Group, Inc., and of each of the investment | (diversified manufacturing and services), since 2005. |
companies served by The Vanguard Group; Chief | |
Executive Officer and President of The Vanguard Group | |
and of each of the investment companies served by The | Amy Gutmann |
Vanguard Group (1996–2008). | Born 1949. Trustee Since June 2006. Principal |
| Occupation(s) During the Past Five Years: President of |
| the University of Pennsylvania since 2004; Professor in |
Independent Trustees | the School of Arts and Sciences, Annenberg School for |
| Communication, and Graduate School of Education of |
| the University of Pennsylvania since 2004; Provost |
Charles D. Ellis | (2001–2004) and Laurance S. Rockefeller Professor of |
Born 1937. Trustee Since January 2001. Principal | Politics and the University Center for Human Values |
Occupation(s) During the Past Five Years: Applecore | (1990–2004), Princeton University; Director of Carnegie |
Partners (pro bono ventures in education); Senior | Corporation of New York since 2005 and of Schuylkill |
Advisor to Greenwich Associates (international business | River Development Corporation and Greater Philadelphia |
strategy consulting); Successor Trustee of Yale University; | Chamber of Commerce since 2004; Trustee of the |
Overseer of the Stern School of Business at New York | National Constitution Center since 2007. |
University; Trustee of the Whitehead Institute for | |
Biomedical Research. | |
| JoAnn Heffernan Heisen |
| Born 1950. Trustee Since July 1998. Principal |
Emerson U. Fullwood | Occupation(s) During the Past Five Years: Retired |
Born 1948. Trustee Since January 2008. Principal | Corporate Vice President, Chief Global Diversity Officer, |
Occupation(s) During the Past Five Years: Retired | and Member of the Executive Committee of Johnson & |
Executive Chief Staff and Marketing Officer for | Johnson (pharmaceuticals/consumer products); Vice |
North America and Corporate Vice President of | President and Chief Information Officer (1997–2005) |
Xerox Corporation (photocopiers and printers); | of Johnson & Johnson; Director of the University |
Director of SPX Corporation (multi-industry | Medical Center at Princeton and Women’s Research |
manufacturing), of the United Way of Rochester, | and Education Institute. |
and of the Boy Scouts of America. | |
André F. Perold | F. William McNabb III1 | |
Born 1952. Trustee Since December 2004. Principal | Born 1957. Chief Executive Officer Since August 2008. |
Occupation(s) During the Past Five Years: George Gund | President Since March 2008. Principal Occupation(s) |
Professor of Finance and Banking, Senior Associate | During the Past Five Years: Chief Executive Officer, |
Dean, and Director of Faculty Recruiting, Harvard | Director, and President of The Vanguard Group, Inc., |
Business School; Director and Chairman of UNX, Inc. | since 2008; Chief Executive Officer and President of |
(equities trading firm); Chair of the Investment | each of the investment companies served by The |
Committee of HighVista Strategies LLC (private | Vanguard Group since 2008; Director of Vanguard |
investment firm) since 2005. | Marketing Corporation; Managing Director of The |
| Vanguard Group (1995–2008). |
| | |
Alfred M. Rankin, Jr. | | |
Born 1941. Trustee Since January 1993. Principal | Heidi Stam1 | |
Occupation(s) During the Past Five Years: Chairman, | Born 1956. Secretary Since July 2005. Principal |
President, Chief Executive Officer, and Director of | Occupation(s) During the Past Five Years: Managing |
NACCO Industries, Inc. (forklift trucks/housewares/ | Director of The Vanguard Group, Inc., since 2006; |
lignite); Director of Goodrich Corporation (industrial | General Counsel of The Vanguard Group since 2005; |
products/aircraft systems and services). | Secretary of The Vanguard Group and of each of the |
| investment companies served by The Vanguard Group |
| since 2005; Director and Senior Vice President of |
J. Lawrence Wilson | Vanguard Marketing Corporation since 2005; Principal |
Born 1936. Trustee Since April 1985. Principal | of The Vanguard Group (1997–2006). |
Occupation(s) During the Past Five Years: Retired | | |
Chairman and Chief Executive Officer of Rohm and | | |
Haas Co. (chemicals); Director of Cummins Inc. (diesel | Vanguard Senior Management Team |
engines) and AmerisourceBergen Corp. (pharmaceutical | | |
distribution); Trustee of Vanderbilt University and of | | |
Culver Educational Foundation. | R. Gregory Barton | Michael S. Miller |
| Mortimer J. Buckley | James M. Norris |
| Kathleen C. Gubanich | Glenn W. Reed |
Executive Officers | Paul A. Heller | George U. Sauter |
| | |
| | |
Thomas J. Higgins1 | Founder | |
Born 1957. Chief Financial Officer Since September | | |
2008. Principal Occupation(s) During the Past Five | | |
Years: Principal of The Vanguard Group, Inc.; Chief | John C. Bogle | |
Financial Officer of each of the investment companies | Chairman and Chief Executive Officer, 1974–1996 |
served by The Vanguard Group since 2008; Treasurer | | |
of each of the investment companies served by The | | |
Vanguard Group (1998–2008). | | |
| | |
| | |
Kathryn J. Hyatt1 | | |
Born 1955. Treasurer Since November 2008. Principal | | |
Occupation(s) During the Past Five Years: Principal of | | |
The Vanguard Group, Inc.; Treasurer of each of the | | |
investment companies served by The Vanguard | | |
Group since 2008; Assistant Treasurer of each of the | | |
investment companies served by The Vanguard Group | | |
(1988–2008). | | |
1 These individuals are “interested persons” as defined in the Investment Company Act of 1940.
2 December 2002 for Vanguard Equity Income Fund, Vanguard Growth Equity Fund, the Vanguard Municipal Bond Funds, and the Vanguard State Tax-Exempt Funds.
| 
|
| P.O. Box 2600 |
| Valley Forge, PA 19482-2600 |
Connect with Vanguard® > www.vanguard.com
Fund Information > 800-662-7447 | All comparative mutual fund data are from Lipper Inc. |
| or Morningstar, Inc., unless otherwise noted. |
Direct Investor Account Services > 800-662-2739 | |
| |
Institutional Investor Services > 800-523-1036 | You can obtain a free copy of Vanguard’s proxy voting |
| guidelines by visiting our website, www.vanguard.com, |
Text Telephone for People | and searching for “proxy voting guidelines,“ or by |
With Hearing Impairment > 800-952-3335 | calling Vanguard at 800-662-2739. The guidelines are |
| also available from the SEC’s website, www.sec.gov. |
| In addition, you may obtain a free report on how your |
This material may be used in conjunction | fund voted the proxies for securities it owned during |
with the offering of shares of any Vanguard | the 12 months ended June 30. To get the report, visit |
fund only if preceded or accompanied by | either www.vanguard.com or www.sec.gov. |
the fund’s current prospectus. | |
| |
| You can review and copy information about your fund |
| at the SEC’s Public Reference Room in Washington, D.C. |
“Dividend Achievers” is a trademark of Mergent, Inc., | To find out more about this public service, call the SEC |
and has been licensed for use by The Vanguard Group, | at 202-551-8090. Information about your fund is also |
Inc. Vanguard mutual funds are not sponsored, endorsed, | available on the SEC’s website, and you can receive |
sold, or promoted by Mergent, and Mergent makes no | copies of this information, for a fee, by sending a |
representation regarding the advisability of investing | request in either of two ways: via e-mail addressed to |
in the funds. | publicinfo@sec.gov or via regular mail addressed to the |
| Public Reference Section, Securities and Exchange |
| Commission, Washington, DC 20549-0102. |
The funds or securities referred to herein are not | |
sponsored, endorsed, or promoted by MSCI, and MSCI | |
bears no liability with respect to any such funds or | |
securities. For any such funds or securities, the | |
prospectus or the Statement of Additional Information | |
contains a more detailed description of the limited | |
relationship MSCI has with The Vanguard Group and | |
any related funds. | |
| |
| |
Russell is a trademark of The Frank Russell Company. | |
| © 2009 The Vanguard Group, Inc. |
| All rights reserved. |
| Vanguard Marketing Corporation, Distributor. |
| |
| Q6020 032009 |
Item 2: Code of Ethics. The Registrant has adopted a code of ethics that applies to the Registrant’s principal executive officer, principal financial officer, principal accounting officer or controller or persons performing similar functions. The Code of Ethics was amended during the reporting period covered by this report to make certain technical, non-material changes.
Item 3: Audit Committee Financial Expert. The following members of the Audit Committee have been determined by the Registrant’s Board of Trustees to be Audit Committee Financial Experts serving on its Audit Committee, and to be independent: Charles D. Ellis, Rajiv L. Gupta, JoAnn Heffernan Heisen, André F. Perold, Alfred M. Rankin, Jr., and J. Lawrence Wilson.
Item 4: Principal Accountant Fees and Services.
(a) Audit Fees.
Audit Fees of the Registrant
Fiscal Year Ended January 31, 2009: $141,000
Fiscal Year Ended January 31, 2008: $133,000
Aggregate Audit Fees of Registered Investment Companies in the Vanguard Group.
Fiscal Year Ended January 31, 2009: $3,055,590
Fiscal Year Ended January 31, 2008: $2,835,320
(b) Audit-Related Fees.
Fiscal Year Ended January 31, 2009: $626,240
Fiscal Year Ended January 31, 2008: $630,400
Includes fees billed in connection with assurance and related services provided to the Registrant, The Vanguard Group, Inc., Vanguard Marketing Corporation, and other registered investment companies in the Vanguard Group.
(c) Tax Fees.
Fiscal Year Ended January 31, 2009: $230,400
Fiscal Year Ended January 31, 2008: $215,900
Includes fees billed in connection with tax compliance, planning and advice services provided to the Registrant, The Vanguard Group, Inc., Vanguard Marketing Corporation, and other registered investment companies in the Vanguard Group and related to income and excise taxes.
(d) All Other Fees.
Fiscal Year Ended January 31, 2009: $0
Fiscal Year Ended January 31, 2008: $0
Includes fees billed for services related to risk management and privacy matters. Services were provided to the Registrant, The Vanguard Group, Inc., Vanguard Marketing Corporation, and other registered investment companies in the Vanguard Group.
(e) (1) Pre-Approval Policies. The policy of the Registrant’s Audit Committee is to consider and, if appropriate, approve before the principal accountant is engaged for such services, all specific audit and non-audit services provided to: (1) the Registrant; (2) The Vanguard Group, Inc.; (3) other entities controlled by The Vanguard Group, Inc. that provide ongoing services to the Registrant; and (4) other registered investment companies in the Vanguard Group. In making a determination, the Audit Committee considers whether the services are consistent with maintaining the principal accountant’s independence.
In the event of a contingency situation in which the principal accountant is needed to provide services in between scheduled Audit Committee meetings, the Chairman of the Audit Committee would be called on to consider and, if appropriate, pre-approve audit or permitted non-audit services in an amount sufficient to complete services through the next Audit Committee meeting, and to determine if such services would be consistent with maintaining the accountant’s independence. At the next scheduled Audit Committee meeting, services and fees would be presented to the Audit Committee for formal consideration, and, if appropriate, approval by the entire Audit Committee. The Audit Committee would again consider whether such services and fees are consistent with maintaining the principal accountant’s independence.
The Registrant’s Audit Committee is informed at least annually of all audit and non-audit services provided by the principal accountant to the Vanguard complex, whether such services are provided to: (1) the Registrant; (2) The Vanguard Group, Inc.; (3) other entities controlled by The Vanguard Group, Inc. that provide ongoing services to the Registrant; or (4) other registered investment companies in the Vanguard Group.
(2) No percentage of the principal accountant’s fees or services were approved pursuant to the waiver provision of paragraph (c)(7)(i)(C) of Rule 2-01 of Regulation S-X.
(f) For the most recent fiscal year, over 50% of the hours worked under the principal accountant’s engagement were not performed by persons other than full-time, permanent employees of the principal accountant.
(g) Aggregate Non-Audit Fees.
Fiscal Year Ended January 31, 2009: $230,400
Fiscal Year Ended January 31, 2008: $215,900
Includes fees billed for non-audit services provided to the Registrant, The Vanguard Group, Inc., Vanguard Marketing Corporation, and other registered investment companies in the Vanguard Group.
(h) For the most recent fiscal year, the Audit Committee has determined that the provision of all non-audit services was consistent with maintaining the principal accountant’s independence.
Item 5: Not Applicable.
Item 6: Not Applicable.
Item 7: Not Applicable.
Item 8: Not Applicable.
Item 9: Not Applicable.
Item 10: Not Applicable.
Item 11: Controls and Procedures.
(a) Disclosure Controls and Procedures. The Principal Executive and Financial Officers concluded that the Registrant's Disclosure Controls and Procedures are effective based on their evaluation of the Disclosure Controls and Procedures as of a date within 90 days of the filing date of this report.
(b) Internal Control Over Financial Reporting. There were no significant changes in Registrant’s Internal Control Over Financial Reporting or in other factors that could significantly affect this control subsequent to the date of the evaluation, including any corrective actions with regard to significant deficiencies and material weaknesses.
Item 12: Exhibits.
Pursuant to the requirements of the Securities Exchange Act of 1934 and the Investment Company Act of 1940, the registrant has duly caused this report to be signed on its behalf by the undersigned, thereunto duly authorized.
| VANGUARD SPECIALIZED FUNDS |
| |
By: | /s/ F. WILLIAM MCNABB III* |
| F. WILLIAM MCNABB III |
| CHIEF EXECUTIVE OFFICER |
| |
Date: March 23, 2009 |
Pursuant to the requirements of the Securities Exchange Act of 1934 and the Investment Company Act of 1940, this report has been signed below by the following persons on behalf of the registrant and in the capacities and on the dates indicated.
| VANGUARD SPECIALIZED FUNDS |
| |
By: | /s/ F. WILLIAM MCNABB III* |
| F. WILLIAM MCNABB III |
| CHIEF EXECUTIVE OFFICER |
| |
Date: March 23, 2009 |
| VANGUARD SPECIALIZED FUNDS |
| |
By: | /s/ THOMAS J. HIGGINS* |
| THOMAS J. HIGGINS |
| CHIEF FINANCIAL OFFICER |
| |
Date: March 23, 2009 |
* By: /s/ Heidi Stam
Heidi Stam, pursuant to a Power of Attorney filed on January 18, 2008, see file Number 2-29601, Incorporated by Reference; and pursuant to a Power of Attorney filed on September 26, 2008, see File Number 2-47371, Incorporated by Reference.