UNITED STATES
SECURITIES AND EXCHANGE COMMISSION
Washington, D.C. 20549
FORM N-CSR
CERTIFIED SHAREHOLDER REPORT
OF
REGISTERED MANAGEMENT INVESTMENT COMPANIES
Investment Company Act file number: 811-3916
Name of Registrant: Vanguard Specialized Funds
Address of Registrant:
P.O. Box 2600
Valley Forge, PA 19482
Name and address of agent for service:
Heidi Stam, Esquire
P.O. Box 876
Valley Forge, PA 19482
Registrant’s telephone number, including area code: (610) 669-1000
Date of fiscal year end: January 31
Date of reporting period: February 1, 2011 – January 31, 2012
Item 1: Reports to Shareholders

Annual Report | January 31, 2012
Vanguard Energy Fund
> Vanguard Energy Fund returned about –4% for the fiscal year ended January 31, 2012, amid weak fuel demand and an oversupply of natural gas.
> The fund’s return was slightly behind that of its benchmark and significantly ahead of the average return of peer funds.
> Weakness was evident across the energy sector, but providers of oil and gas equipment and services were among the worst performers for the period.
| |
| Contents | |
| Your Fund’s Total Returns. | 1 |
| Chairman’s Letter. | 2 |
| Advisors’ Report. | 8 |
| Fund Profile. | 12 |
| Performance Summary. | 14 |
| Financial Statements. | 16 |
| Your Fund’s After-Tax Returns. | 32 |
| About Your Fund’s Expenses. | 33 |
| Glossary. | 35 |
Please note: The opinions expressed in this report are just that—informed opinions. They should not be considered promises or advice.
Also, please keep in mind that the information and opinions cover the period through the date on the front of this report. Of course, the risks of investing in your fund are spelled out in the prospectus.
See the Glossary for definitions of investment terms used in this report.
About the cover: Vanguard was named for the HMS Vanguard, flagship of British Admiral Horatio Nelson. A ship—whose performance and safety depend on the work of all hands—has served as a fitting metaphor for the Vanguard crew as we strive to help clients reach their financial goals.
Your Fund’s Total Returns
Fiscal Year Ended January 31, 2012
| |
| | Total |
| | Returns |
| Vanguard Energy Fund | |
| Investor Shares | -3.82% |
| Admiral™ Shares | -3.76 |
| MSCI ACWI Energy Index | -3.66 |
| Global Natural Resources Funds Average | -12.47 |
Global Natural Resources Funds Average: Derived from data provided by Lipper Inc.
Admiral Shares carry lower expenses and are available to investors who meet certain account-balance requirements.
Your Fund’s Performance at a Glance
January 31, 2011 , Through January 31, 2012
| | | | |
| | | | Distributions Per Share |
| | Starting | Ending | Income | Capital |
| | Share Price | Share Price | Dividends | Gains |
| Vanguard Energy Fund | | | | |
| Investor Shares | $69.20 | $62.60 | $1.102 | $2.621 |
| Admiral Shares | 129.93 | 117.52 | 2.159 | 4.920 |
1

Chairman’s Letter
Dear Shareholder,
After two straight years of double-digit returns, the energy sector was one of the market’s laggards for the fiscal year ended January 31, 2012. Vanguard Energy Fund returned about –4%, a disappointing result that slightly trailed the return of its benchmark but was well ahead of its peer-group average.
Unlike many of its peers, the Energy Fund concentrates on large-capitalization stocks and avoids smaller companies, which are more sensitive to swings in the economy and commodity prices. Large-cap energy stocks held up better than their small-cap counterparts in the uncertain economic environment.
Oil prices wavered but remained high over the period as concerns heightened in the Middle East. Meanwhile, natural gas prices drifted near decade lows because of increased production and mild winter weather in much of the United States. Integrated oil and gas companies, which make up about half of the fund’s portfolio by capitalization, managed a return of slightly over 1% for the period. Oil and gas equipment and services providers posted a double-digit negative return, and the fund’s stock choices in this area didn’t measure up against those in the benchmark index. Oil and gas exploration and production firms, another large allocation in the fund, performed better against the benchmark, but still generated a negative return.
2
If you invest in the Energy Fund through a taxable account, you may wish to review information about the fund’s after-tax performance provided later in this report.
Volatility was a constant
in fast-changing markets
For the 12 months ended January 31, the broad U.S. stock market returned 3.55%. This modest result reflected rallies and reversals driven by drama on the global stage, including Europe’s debt crisis and rating agency Standard & Poor’s decision to downgrade the U.S. credit rating. (Vanguard’s confidence in the full faith and credit of the U.S. Treasury remains unshaken.)
The recent volatility is consistent with the pattern of the past five years, as suggested by the figures in the Market Barometer. The dramatic differences in average annual returns over the one-, three-, and five-year periods are a consequence of the stock market’s heady spikes and precipitous declines.
Although the outcome is different, this turbulence is also apparent in the returns of international stock markets. In the past 12 months, non-U.S. stock markets delivered negative results. Weakness was widespread, with the worst returns in Europe and Japan.
| | | |
| Market Barometer | | | |
| |
| | | Average Annual Total Returns |
| | | Periods Ended January 31, 2012 |
| | One | Three | Five |
| | Year | Years | Years |
| Stocks | | | |
| Russell 1000 Index (Large-caps) | 3.95% | 20.01% | 0.55% |
| Russell 2000 Index (Small-caps) | 2.86 | 23.03 | 1.19 |
| Dow Jones U.S. Total Stock Market Index | 3.55 | 20.54 | 0.88 |
| MSCI All Country World Index ex USA (International) | -8.75 | 16.70 | -1.71 |
| |
| Bonds | | | |
| Barclays Capital U.S. Aggregate Bond Index (Broad | | | |
| taxable market) | 8.66% | 7.40% | 6.70% |
| Barclays Capital Municipal Bond Index (Broad | | | |
| tax-exempt market) | 14.10 | 8.10 | 5.76 |
| Citigroup Three-Month U.S. Treasury Bill Index | 0.07 | 0.10 | 1.27 |
| |
| CPI | | | |
| Consumer Price Index | 2.93% | 2.39% | 2.29% |
3
Modest yields and high returns
in the bond market
Bonds ended the fiscal year with surprisingly strong returns. At the start of the period, the 10-year Treasury note’s slender yield of 3.38% seemed like a good reason to temper expectations. As stock market volatility spiked and investors put a premium on safety, however, yields moved lower still. The 10-year T-note finished the period at 1.80%. The Barclays Capital U.S. Aggregate Bond Index, a broad taxable bond market benchmark, returned 8.66%.
Municipal bonds did even better, as prices snapped back from a fear-driven plunge in the months preceding the new fiscal year. Although last year’s low expectations for bonds proved misguided, it’s worth remembering that low yields do imply lower future returns: As yields tumble, the scope for further declines—and increases in prices—diminishes. Savings instruments such as the 3-month Treasury bill returned a little more than 0%, consistent with the Federal Reserve’s target for the shortest-term interest rates.
Energy stocks and oil prices
followed an uneven path
As I mentioned, the broad market traced a volatile path over the fiscal year, but the energy sector encountered even lower valleys and higher peaks during its journey. Ultimately, the sector’s negative results over the period more than offset the positive ones. Of the broad market’s ten industry sectors, only financials performed worse.
Expense Ratios
Your Fund Compared With Its Peer Group
| | | |
| | Investor | Admiral | Peer Group |
| | Shares | Shares | Average |
| Energy Fund | 0.34% | 0.28% | 1.37% |
The fund expense ratios shown are from the prospectus dated May 26, 2011, and represent estimated costs for the current fiscal year. For the fiscal year ended January 31, 2012, the fund’s expense ratios were 0.34% for Investor Shares and 0.28% for Admiral Shares. The peer-group expense ratio is derived from data provided by Lipper Inc. and captures information through year-end 2011.
Peer group: Global Natural Resources Funds.
4
Vanguard Energy Fund’s stocks advanced nearly 10% over the first three months of the fiscal year, driven by higher oil prices. But the momentum didn’t last as the year progressed. The price of oil pulled back from its peak—but still remained near historical highs—as demand weakened in the sluggish U.S. economy and price-sensitive consumers cut back on driving and made fewer trips to the pump. Over the year’s final six months, the fund saw double-digit swings before finishing the period on an uptick.
A variety of factors drove the fund’s results. The giant integrated oil and gas companies benefited from oil prices that, while volatile, ended the year higher than where they started. To a lesser degree, the same integrated companies also have an interest in the natural gas business. Profit margins there were affected by lower prices caused by overproduction. An unseasonably warm winter in many parts of the United States also muted demand for natural gas.
Although the developments in natural gas didn’t bode well for the oil and gas exploration and production industry, the advisors’ stock-picking in this category was strong.
The fund’s oil and gas equipment and services providers, which include drillers, ran into difficulties. Stock prices in this group tend to be more volatile within the
Total Returns
Ten Years Ended January 31, 2012
| |
| | Average |
| | Annual Return |
| Energy Fund Investor Shares | 15.00% |
| Spliced Energy Index | 11.11 |
| Global Natural Resources Funds Average | 12.07 |
Spliced Energy Index: S&P 500 Index through November 30, 2000; S&P Energy Sector Index through May 31, 2010; MSCI All Country World Energy Index thereafter.
Global Natural Resources Funds Average: Derived from data provided by Lipper Inc.
The figures shown represent past performance, which is not a guarantee of future results. (Current performance may be lower or higher than the performance data cited. For performance data current to the most recent month-end, visit our website at vanguard.com/performance.) Note, too, that both investment returns and principal value can fluctuate widely, so an investor’s shares, when sold, could be worth more or less than their original cost.
5
|
| A note on energy stocks and |
| oil prices |
| Although energy stocks have enjoyed |
| strong gains in the past ten years, it’s |
| important to keep in mind the context |
| in which those gains occurred. |
| |
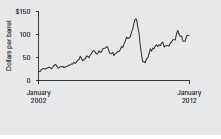
| The price per barrel of oil has jumped |
| from $28.66 to $98.47 over the |
| decade, an increase of more than |
| 240% (not adjusted for inflation). |
| That extraordinary rise has been a |
| major factor in the advance of energy |
| stocks, which are heavily influenced |
| by, but don’t perfectly track, the price |
| of oil. |
| |
| As you can see in the chart below, |
| the price per barrel of oil doesn’t |
| always climb and can be extremely |
| volatile. While the price is up for the |
| ten years, it’s down sharply from its |
| peak of a few years ago. Fluctuations |
| in the price of oil, of course, can lead |
| to volatility for energy stocks. |
Price of oil (WesternTexas Intermediate): January 2002–January 2012
already risky energy sector and didn’t respond well to the fluctuation in oil prices and the deterioration of natural gas prices.
A mix of skill and circumstances
boosted the fund over a decade
The Energy Fund recorded a notable performance for the past decade–– compared to its benchmark index and peer group as well as the broader market. Over the ten years ended January 31, 2012, the fund posted an average annual return of 15.00%, a few percentage points better than its benchmark index and peer-group average. The broader market, as measured by the Dow Jones U.S. Total Stock Market Index, managed a 4.55% average annual return for the same period.
The decade was marked by an impressive rise in energy prices, specifically oil; we would caution investors against projecting similar price increases into the future. (For more on oil prices, please see the sidebar at left.) The past year showed that the energy sector is prone to fits of turmoil and that it is just as likely to trail the broad market as it is to outperform it. Even though the market environment will sometimes frown on the sector instead of favor it, we have confidence in the skill and experience of the fund’s advisors––Wellington Management Company, llp, and Vanguard Quantitative Equity Group––in evaluating stocks and developing risk controls. The advisors’ efforts are aided by the fund’s low costs, which allow you to keep a larger share of your fund’s returns.
6
For more details on the advisors’ strategies and the fund’s positioning during the year, see the Advisors’ Report that follows this letter.
Sector funds on the side
can complement the main course
Investors’ fortitude was tested over the past year as stocks exhibited a great deal of volatility before finishing the period with a small gain. In contrast to its performance over the decade, the energy sector provided more than its share of the volatility without the performance. This sector can be especially challenging as geopolitical tensions, new technology, natural disasters, supply and production issues, and weather conditions can all affect stock returns. Moreover, energy stocks—like many individual market sectors—are more susceptible than the broad market to economic upturns and downturns.
That’s why a sector-specific fund should play a supporting, rather than a starring role in a diversified portfolio. Vanguard Energy Fund, by providing low-cost exposure to the energy market, can be an important part of a diversified and balanced portfolio that includes a mix of stocks, bonds, and money market funds tailored to your goals, time horizon, and risk tolerance.
Thank you for entrusting your assets to Vanguard.
Sincerely,

F. William McNabb III
Chairman and Chief Executive Officer
February 10, 2012
7
Advisors’ Report
Vanguard Energy Fund returned –3.82% for Investor Shares and –3.76% for Admiral Shares in the fiscal year ended January 31, 2012. Your fund is managed by two advisors, a strategy that enhances the fund’s diversification by providing exposure to distinct, yet complementary, investment approaches. It’s not uncommon for different advisors to have different views about individual securities or the broader investment environment.
The advisors, the amount and percentage of fund assets each manages, and brief descriptions of their investment strategies are presented in the table below. The advisors have also provided a discussion of the investment environment that existed during the year and of how their portfolio positioning reflects this assessment. These reports were prepared on February 14, 2012.
Wellington Management Company, LLP
Portfolio Manager:
Karl E. Bandtel, Senior Vice President
For the 12 months ended January 31, U.S. equities as a group returned 4.2% as measured by the Standard & Poor’s 500 Index, outpacing the energy sector for this volatile period. Capital markets oscillated throughout the fiscal year; concerns on a global macroeconomic scale seemed to drive much of the market movement. Chief among these concerns was the ongoing sovereign-debt challenge in Europe.
| | | |
| Vanguard Energy Fund Investment Advisors | |
| |
| | Fund Assets Managed | |
| Investment Advisor | % | $ Million | Investment Strategy |
| Wellington Management | 95 | 12,076 | Emphasizes long-term total-return opportunities from |
| Company, LLP | | | the various energy subsectors: international oils, |
| | | | foreign integrated oils and foreign producers, North |
| | | | American producers, oil services and equipment, |
| | | | transportation and distribution, and refining and |
| | | | marketing. |
| Vanguard Quantitative Equity | 3 | 359 | Employs a quantitative fundamental management |
| Group | | | approach, using models that assess valuation, market |
| | | | sentiment, earnings quality and growth, and |
| | | | management decisions of companies relative to their |
| | | | peers. |
| Cash Investments | 2 | 266 | These short-term reserves are invested by Vanguard in |
| | | | equity index products to simulate investments in stock. |
| | | | Each advisor may also maintain a modest cash |
| | | | position. |
8
Commodity prices also fluctuated during the period. Although unrest in the Middle East and North Africa contributed to initial increases in oil prices, oil subsequently fell after Western governments decided to release strategic reserves. Crude oil finished the period up, closing near $100 per barrel (West Texas Intermediate).
In the United States, the price of natural gas ended near $2.50 per million BTUs (Henry Hub), down substantially from where it began the year. Abundant shale formations continued to provide low-cost supplies, while a mild winter in much of the country tempered demand locally. Abroad, rising demand from emerging markets and the aftermath of the nuclear disaster in Japan kept prices higher in Europe and Asia.
Our position in Cabot Oil & Gas, a natural gas-focused energy producer, contributed to the portfolio’s performance during the period. Wellhead results topped the market’s expectations, increasing investors’ confidence in the quality of Cabot’s resource base. We see a strong outlook for production growth as the completion of significant infrastructure projects unlocks natural gas production constraints in the firm’s high-quality Marcellus shale acreage. We trimmed our position as the stock’s price increased.
Also helpful was our holding in Occidental Petroleum, an energy producer operating principally in the Middle East and the United States, with promising assets in Texas, California, and North Dakota. The market responded favorably to the stock as earnings topped expectations on higher-than-expected oil and gas production and sales. Occidental possesses a long-life, low-decline oil resource base with upside potential in an emerging California shale play. The company has high leverage to oil, a strong production growth outlook, and a solid track record of financial discipline, which is reflected in its sound balance sheet, robust cash flow, and commitment to maintaining dividend growth.
Consol Energy is a coal and natural gas producer and energy services provider. Its stock price declined during the period in part because of weak natural gas prices. We were able to take advantage of this weakness and increase our position at attractive valuations. The company has sustainable sources of profitability and solid production. In our view, the market is underestimating the long-term value of Consol’s undeveloped natural gas assets.
Our position in Chesapeake Energy, a U.S.-based producer of natural gas and oil, also detracted from performance during the period. The stock underperformed on concerns that the company’s increased spending on leaseholds and capital expenditures would not result in higher production. Chesapeake is a major leaseholder in the Utica shale, for which positive results were recently released. We believe this news adds several billion dollars of incremental value, increases Chesapeake’s two-year production growth rate, and offers the potential for strong growth in cash flow. We added to the position on the stock’s weakness.
9
Our long-term outlook remains favorable for the energy sector. However, as always, we urge caution regarding the near-term direction of commodity prices and the inherent volatility that accompanies investing in stocks of energy companies. Crude oil prices will likely continue to vary with changes to the outlook for both supply and demand. While natural gas pricing remains driven by regional factors, we think the wide price arbitrage with other fuels and changing views about nuclear power generation will drive long-term global demand for natural gas.
The portfolio remains focused on upstream companies and skewed in favor of low-cost producers with compelling valuations based on our assessment of their long-term resource bases. We believe many of these companies have the ability to create value for shareholders absent generally rising commodity prices. Our investment process remains steady with an emphasis on large-capitalization integrated oil and exploration and production companies. Maintaining a large-cap, low-turnover bias, this global portfolio has representation across the energy subsectors.
Vanguard Quantitative Equity Group
Portfolio Manager:
James D. Troyer, CFA, Principal
For the just-ended fiscal year, the energy stocks in our benchmark index returned –3.13%, slightly outpacing the –3.46% return of the aggregate global equity market as measured by the FTSE All-World Index. After climbing 2.9% in the first six months of the period, energy-related equities returned –5.9% for the second half.
Driving the pullback in the third calendar quarter of 2011 were concerns that fuel demand could weaken because of slowing growth in China, the United States, and Germany. In addition, stock markets overall were affected by the lack of progress in addressing the U.S. deficit and debt issues as well as the unresolved European sovereign-debt crisis. Investors will likely continue to be cautious until they see progress by U.S. and European leaders in tackling these difficult problems.
Although portfolio performance is affected by the macroeconomic factors described above, our approach to investing focuses on specific stock fundamentals. A key characteristic of our strategy is that we do not maintain a view on the overall market for energy shares. Nor do we attempt to make calls on relative country performance. Rather, our investment process seeks to identify individual stocks that we believe are undervalued or that have shown price improvement relative to peers on the basis of recent earnings pronouncements. Our valuation signal was the stronger contributor to our stock selection in the past fiscal year. However all of the core signals contributed positively to the portfolio, strengthening our confidence in the diversified approach we employ in constructing a portfolio.
10
For the period, our most successful holdings represented regions across the globe: Noble Energy (+33%) and El Paso (+51%) in the United States; Petronas Dagangan (+39%) in Malaysia; and Royal Dutch Shell B (+10%) in the United Kingdom. Equally important to performance was our ability to limit exposure to underperforming stocks, such as Switzerland’s Transocean (–37%) and Canada’s Cameco (–43%).
The portfolio’s results were dampened by our overweighting of Korea’s GS Holdings (–25%) and Indonesia’s Bumi Resources (–31%), two energy stocks that under-performed the benchmark as a whole. We also suffered from underweighting some better-performing stocks, such as Petrohawk Energy (+93%) and Spectra Energy (+25%) in the United States. (Petrohawk was purchased in August by BHP Billiton.)
Looking ahead, we believe that our approach to constructing a portfolio, which focuses on stocks that exhibit lower price multiples than their peers while offering similar growth prospects, is an attractive strategy for the long term. We thank you for your investment and look forward to the coming year.
11
Energy Fund
Fund Profile
As of January 31, 2012
| | | |
| Share-Class Characteristics | | |
| | Investor | | Admiral |
| | Shares | | Shares |
| Ticker Symbol | VGENX | | VGELX |
| Expense Ratio1 | 0.34% | | 0.28% |
| 30-Day SEC Yield | 1.77% | | 1.83% |
| |
| |
| Portfolio Characteristics | | |
| | | | DJ |
| | | MSCI | U.S. Total |
| | | ACWI | Market |
| | Fund | Energy | Index |
| Number of Stocks | 143 | 168 | 3,738 |
| Median Market Cap $43.4B | $87.5B | $32.6B |
| Price/Earnings Ratio | 10.9x | 10.4x | 15.5x |
| Price/Book Ratio | 1.6x | 1.7x | 2.2x |
| Return on Equity | 18.6% | 20.4% | 19.1% |
| Earnings Growth Rate | -2.9% | -1.3% | 7.1% |
| Dividend Yield | 2.1% | 2.6% | 2.0% |
| Foreign Holdings | 41.3% | 54.8% | 0.0% |
| Turnover Rate | 24% | — | — |
| Short-Term Reserves | 1.8% | — | — |
| | |
| Volatility Measures | | |
| | | DJ |
| | Spliced | U.S. Total |
| | Energy | Market |
| | Index | Index |
| R-Squared | 0.92 | 0.76 |
| Beta | 1.07 | 1.20 |
| These measures show the degree and timing of the fund’s fluctuations compared with the indexes over 36 months. |
|
| |
| |
| Ten Largest Holdings (% of total net assets) |
| |
| Exxon Mobil Corp. | Integrated Oil & | |
| | Gas | 7.9% |
| Royal Dutch Shell plc | Integrated Oil & | |
| | Gas | 4.8 |
| Chevron Corp. | Integrated Oil & | |
| | Gas | 4.7 |
| Occidental Petroleum | Integrated Oil & | |
| Corp. | Gas | 4.5 |
| BP plc | Integrated Oil & | |
| | Gas | 3.9 |
| Total SA | Integrated Oil & | |
| | Gas | 2.9 |
| Schlumberger Ltd. | Oil & Gas | |
| | Equipment & | |
| | Services | 2.6 |
| Canadian Natural | Oil & Gas | |
| Resources Ltd. | Exploration & | |
| | Production | 2.4 |
| Consol Energy Inc. | Coal & Consumable |
| | Fuels | 2.3 |
| Baker Hughes Inc. | Oil & Gas | |
| | Equipment & | |
| | Services | 2.0 |
| Top Ten | | 38.0% |
| The holdings listed exclude any temporary cash investments and equity index products. |
| | |
1 The expense ratios shown are from the prospectus dated May 26, 2011, and represent estimated costs for the current fiscal year. For the fiscal year ended January 31, 2012, the expense ratios were 0.34% for Investor Shares and 0.28% for Admiral Shares.
12
Energy Fund
| | |
| Subindustry Diversification (% of equity exposure) | |
| | |
| | | MSCI |
| | | ACWI |
| | Fund | Energy |
| Coal & Consumable Fuels | 3.9% | 2.4% |
| Industrials | 0.8 | 0.0 |
| Integrated Oil & Gas | 49.1 | 59.4 |
| Materials | 0.1 | 0.0 |
| Oil & Gas Drilling | 2.0 | 2.0 |
| Oil & Gas Equipment & | | |
| Services | 9.2 | 9.1 |
| Oil & Gas Exploration & | | |
| Production | 29.4 | 19.1 |
| Oil & Gas Refining & | | |
| Marketing | 2.8 | 3.7 |
| Oil & Gas Storage & | | |
| Transportation | 1.5 | 4.3 |
| Other | 1.2 | 0.0 |
| |
| Market Diversification (% of equity exposure) |
| |
| Europe | | |
| United Kingdom | | 12.0% |
| France | | 3.0 |
| Italy | | 1.7 |
| Norway | | 1.7 |
| Other | | 0.7 |
| Subtotal | | 19.1% |
| Pacific | | |
| Japan | | 1.7% |
| Other | | 0.2 |
| Subtotal | | 1.9% |
| Emerging Markets | | |
| Russia | | 3.2% |
| China | | 2.6 |
| Brazil | | 2.4 |
| Other | | 1.5 |
| Subtotal | | 9.7% |
| North America | | |
| United States | | 58.1% |
| Canada | | 11.2 |
| Subtotal | | 69.3% |
13
Energy Fund
Performance Summary
All of the returns in this report represent past performance, which is not a guarantee of future results that may be achieved by the fund. (Current performance may be lower or higher than the performance data cited. For performance data current to the most recent month-end, visit our website at vanguard.com/performance.) Note, too, that both investment returns and principal value can fluctuate widely, so an investor’s shares, when sold, could be worth more or less than their original cost. The returns shown do not reflect taxes that a shareholder would pay on fund distributions or on the sale of fund shares.
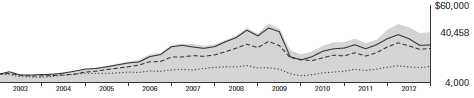
Cumulative Performance: January 31, 2002, Through January 31, 2012
Initial Investment of $10,000
| | | | |
| | | Average Annual Total Returns | |
| | | Periods Ended January 31, 2012 | |
| | | | | Final Value |
| | One | Five | Ten | of a $10,000 |
| | Year | Years | Years | Investment |
| Energy Fund Investor Shares | -3.82% | 5.08% | 15.00% | $40,458 |
| Dow Jones U.S. Total Stock Market | | | | |
| Index | 3.55 | 0.88 | 4.55 | 15,604 |
| |
| Spliced Energy Index | -3.66 | 3.65 | 11.11 | 28,686 |
| Global Natural Resources Funds | | | | |
| Average | -12.47 | 0.84 | 12.07 | 31,257 |
Spliced Energy Index: S&P 500 Index through November 30, 2000; S&P Energy Sector Index through May 31, 2010; MSCI All Country World Energy Index thereafter.
Global Natural Resources Funds Average: Derived from data provided by Lipper Inc.
| | | | |
| | | | | Final Value |
| | One | Five | Ten | of a $50,000 |
| | Year | Years | Years | Investment |
| Energy Fund Admiral Shares | -3.76% | 5.15% | 15.07% | $203,594 |
| Dow Jones U.S. Total Stock Market Index | 3.55 | 0.88 | 4.55 | 78,018 |
| Spliced Energy Index | -3.66 | 3.65 | 11.11 | 143,428 |
Vanguard fund returns do not reflect the 1% fee on redemptions of shares held for less than one year.
See Financial Highlights for dividend and capital gains information.
14
Energy Fund
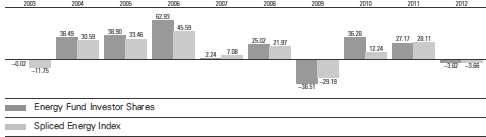
Fiscal-Year Total Returns (%): January 31, 2002, Through January 31, 2012
Average Annual Total Returns: Periods Ended December 31, 2011
This table presents returns through the latest calendar quarter—rather than through the end of the fiscal period.
Securities and Exchange Commission rules require that we provide this information.
| | | | |
| | Inception | One | Five | Ten |
| | Date | Year | Years | Years |
| Investor Shares | 5/23/1984 | -1.74% | 3.83% | 14.27% |
| Admiral Shares | 11/12/2001 | -1.68 | 3.91 | 14.34 |
Vanguard fund returns do not reflect the 1% fee on redemptions of shares held for less than one year.
15
Energy Fund
Financial Statements
Statement of Net Assets
As of January 31, 2012
The fund reports a complete list of its holdings in regulatory filings four times in each fiscal year, at the quarter-ends. For the second and fourth fiscal quarters, the lists appear in the fund’s semiannual and annual reports to shareholders. For the first and third fiscal quarters, the fund files the lists with the Securities and Exchange Commission on Form N-Q. Shareholders can look up the fund’s Forms N-Q on the SEC’s website at sec.gov. Forms N-Q may also be reviewed and copied at the SEC’s Public Reference Room (see the back cover of this report for further information).
| | | |
| | | | Market |
| | | | Value |
| | | Shares | ($000) |
| Common Stocks (96.3%)1 | | |
| United States (55.1%) | | |
| Energy Equipment & Services (9.6%) | |
| | Schlumberger Ltd. | 4,401,764 | 330,881 |
| | Baker Hughes Inc. | 5,289,950 | 259,895 |
| | Halliburton Co. | 6,456,762 | 237,480 |
| | National Oilwell Varco Inc. | 1,356,176 | 100,330 |
| * | Weatherford | | |
| | International Ltd. | 5,495,000 | 91,986 |
| * | SEACOR Holdings Inc. | 907,408 | 83,055 |
| | Noble Corp. | 1,718,925 | 59,887 |
| | Transocean Ltd. | 1,071,900 | 50,701 |
| | Helmerich & Payne Inc. | 43,000 | 2,653 |
| * | Nabors Industries Ltd. | 127,700 | 2,378 |
| | | | 1,219,246 |
| Exchange-Traded Fund (0.5%) | |
| ^,2 | Vanguard Energy ETF | 663,000 | 68,196 |
| |
| Oil, Gas & Consumable Fuels (45.0%) | |
| | Coal & Consumable Fuels (2.9%) | |
| | Consol Energy Inc. | 8,143,800 | 291,059 |
| | Peabody Energy Corp. | 2,089,500 | 71,231 |
| |
| | Integrated Oil & Gas (19.9%) | |
| | Exxon Mobil Corp. | 12,052,619 | 1,009,286 |
| | Chevron Corp. | 5,786,735 | 596,497 |
| | Occidental | | |
| | Petroleum Corp. | 5,773,061 | 575,978 |
| | ConocoPhillips | 3,375,209 | 230,223 |
| | Hess Corp. | 2,001,039 | 112,659 |
| | Murphy Oil Corp. | 52,000 | 3,099 |
| |
| | Oil & Gas Exploration & Production (19.8%) |
| | Anadarko Petroleum Corp. 2,720,830 | 219,625 |
| | Devon Energy Corp. | 3,318,507 | 211,754 |
| | Chesapeake Energy Corp. | 9,427,137 | 199,195 |
| * | Denbury Resources Inc. | 10,185,144 | 192,092 |
| | Apache Corp. | 1,931,500 | 190,987 |
| | EOG Resources Inc. | 1,742,336 | 184,932 |
| | | |
| | | | Market |
| | | | Value |
| | | Shares | ($000) |
| | Noble Energy Inc. | 1,811,592 | 182,373 |
| | Cabot Oil & Gas Corp. | 4,386,662 | 139,935 |
| | EQT Corp. | 2,536,700 | 128,154 |
| | Range Resources Corp. | 2,191,400 | 126,049 |
| | Marathon Oil Corp. | 3,976,391 | 124,819 |
| | Pioneer Natural | | |
| | Resources Co. | 1,042,130 | 103,483 |
| * | Southwestern Energy Co. | 2,804,405 | 87,329 |
| * | Newfield Exploration Co. | 2,237,203 | 84,589 |
| * | WPX Energy Inc. | 4,741,500 | 78,140 |
| * | Ultra Petroleum Corp. | 2,285,936 | 54,931 |
| * | Cobalt International | | |
| | Energy Inc. | 2,630,417 | 52,714 |
| * | Whiting Petroleum Corp. | 1,006,400 | 50,411 |
| | QEP Resources Inc. | 1,555,218 | 44,541 |
| * | Gran Tierra Energy Inc. | 7,632,200 | 43,539 |
| | EXCO Resources Inc. | 1,155,038 | 9,079 |
| * | Concho Resources Inc. | 25,900 | 2,762 |
| | Energen Corp. | 41,800 | 2,013 |
| * | Plains Exploration & | | |
| | Production Co. | 15,800 | 596 |
| |
| | Oil & Gas Refining & Marketing (1.8%) |
| | Valero Energy Corp. | 4,854,212 | 116,453 |
| | Marathon | | |
| | Petroleum Corp. | 2,506,745 | 95,808 |
| | Sunoco Inc. | 488,900 | 18,754 |
| | HollyFrontier Corp. | 90,900 | 2,667 |
| |
| | Oil & Gas Storage & Transportation (0.6%) |
| | El Paso Corp. | 2,553,800 | 68,621 |
| | Williams Cos. Inc. | 65,500 | 1,888 |
| | Kinder Morgan | | |
| | Management LLC | 9,700 | 746 |
| | Spectra Energy Corp. | 10,800 | 340 |
| | | | 5,709,351 |
| Total United States | | 6,996,793 |
16
| | | |
| Energy Fund | | |
| |
| |
| |
| | | | Market |
| | | | Value |
| | | Shares | ($000) |
| International (41.2%) | | |
| | Argentina (0.7%) | | |
| | YPF SA ADR | 2,447,500 | 85,662 |
| |
| | Australia (0.2%) | | |
| | Oil Search Ltd. | 3,897,262 | 27,288 |
| | Woodside Petroleum Ltd. | 18,084 | 656 |
| | Caltex Australia Ltd. | 15,105 | 204 |
| | | | 28,148 |
| | Brazil (2.4%) | | |
| | Petroleo Brasileiro | | |
| | SA ADR | 8,017,100 | 244,923 |
| * | OGX Petroleo e Gas | | |
| | Participacoes SA | 4,265,200 | 40,401 |
| * | HRT Participacoes | | |
| | em Petroleo SA | 33,100 | 8,677 |
| | Petroleo Brasileiro SA | | |
| | Prior Pfd. | 393,744 | 5,537 |
| | Petroleo Brasileiro SA | 261,732 | 4,031 |
| | Ultrapar Participacoes SA | 17,700 | 358 |
| | | | 303,927 |
| | Canada (11.0%) | | |
| | Canadian Natural | | |
| | Resources Ltd. | 7,481,918 | 296,359 |
| | Suncor Energy Inc. | 5,768,512 | 199,014 |
| | Cenovus Energy Inc. | 4,335,000 | 157,967 |
| | Encana Corp. | 8,175,300 | 156,393 |
| | Progress Energy | | |
| | Resources Corp. | 6,333,400 | 67,080 |
| | Talisman Energy Inc. | 5,222,200 | 62,394 |
| | Cameco Corp. | 2,659,500 | 61,887 |
| | Pacific Rubiales | | |
| | Energy Corp. | 2,365,800 | 59,528 |
| | TransCanada Corp. | 1,427,696 | 58,734 |
| | Penn West | | |
| | Petroleum Ltd. | 2,328,421 | 50,666 |
| | Husky Energy Inc. | 1,836,700 | 44,860 |
| | Imperial Oil Ltd. | 798,977 | 38,063 |
| | Petrominerales Ltd. | 1,803,180 | 37,639 |
| | Niko Resources Ltd. | 647,950 | 31,658 |
| * | Tourmaline Oil Corp. | 1,059,000 | 25,643 |
| * | Celtic Exploration Ltd. | 819,400 | 15,102 |
| * | MEG Energy Corp. | 274,017 | 12,341 |
| | Suncor Energy Inc. | 176,134 | 6,067 |
| | Imperial Oil Ltd. | 72,900 | 3,474 |
| | Canadian Natural | | |
| | Resources Ltd. | 73,378 | 2,907 |
| | Cenovus Energy Inc. | 65,639 | 2,395 |
| | Enbridge Inc. | 30,450 | 1,146 |
| ^ | Pengrowth Energy Corp. | 93,400 | 936 |
| | Pembina Pipeline Corp. | 18,700 | 500 |
| | Encana Corp. | 14,939 | 286 |
| | | | 1,393,039 |
| | | |
| | | | Market |
| | | | Value |
| | | Shares | ($000) |
| | China (2.6%) | | |
| | PetroChina Co. Ltd. ADR | 1,261,200 | 183,505 |
| | Beijing Enterprises | | |
| | Holdings Ltd. | 12,960,500 | 75,083 |
| | China Shenhua | | |
| | Energy Co. Ltd. | 12,757,000 | 56,026 |
| | China Petroleum & | | |
| | Chemical Corp. | 3,408,000 | 4,112 |
| | CNOOC Ltd. | 1,985,717 | 4,045 |
| | PetroChina Co. Ltd. | 1,810,000 | 2,636 |
| | Yanzhou Coal | | |
| | Mining Co. Ltd. | 218,000 | 520 |
| | China Oilfield | | |
| | Services Ltd. | 170,000 | 277 |
| | | | 326,204 |
| | France (2.9%) | | |
| | Total SA ADR | 6,809,000 | 360,673 |
| | Total SA | 227,511 | 12,058 |
| | Technip SA | 11,028 | 1,039 |
| | | | 373,770 |
| | India (0.8%) | | |
| | Reliance Industries Ltd. | 5,982,428 | 98,632 |
| |
| | Indonesia (0.0%) | | |
| | Adaro Energy Tbk PT | 1,599,500 | 325 |
| | Indo Tambangraya | | |
| | Megah TBK PT | 44,000 | 179 |
| | | | 504 |
| | Italy (1.7%) | | |
| | ENI SPA ADR | 4,154,350 | 184,869 |
| | ENI SPA | 1,148,998 | 25,458 |
| | | | 210,327 |
| | Japan (1.7%) | | |
| | Inpex Corp. | 29,843 | 204,173 |
| | JX Holdings Inc. | 537,200 | 3,258 |
| | Idemitsu Kosan Co. Ltd. | 19,400 | 2,103 |
| | TonenGeneral Sekiyu KK | 31,000 | 296 |
| | | | 209,830 |
| | Netherlands (0.0%) | | |
| | SBM Offshore NV | 107,511 | 1,827 |
| |
| | Norway (1.6%) | | |
| | Statoil ASA ADR | 5,100,000 | 128,826 |
| ^,3 | Nordic American | | |
| | Tankers Ltd. | 3,169,697 | 43,932 |
| * | Petroleum Geo- | | |
| | Services ASA | 2,128,238 | 27,339 |
| | Statoil ASA | 194,710 | 4,902 |
| | Seadrill Ltd. | 58,301 | 2,171 |
| | Aker Solutions ASA | 18,271 | 225 |
| | | | 207,395 |
17
| | | |
| Energy Fund | | |
| |
| |
| |
| | | | Market |
| | | | Value |
| | | Shares | ($000) |
| | Poland (0.0%) | | |
| | Polskie Gornictwo Naftowe | |
| | i Gazownictwo SA | 1,735,697 | 2,096 |
| * | Polski Koncern | | |
| | Naftowy Orlen SA | 35,651 | 407 |
| | | | 2,503 |
| | Russia (3.1%) | | |
| | Gazprom OAO ADR | 19,047,718 | 231,430 |
| | Rosneft Oil Co. GDR | 10,902,955 | 80,506 |
| | Lukoil OAO ADR | 1,222,018 | 71,781 |
| | Tatneft ADR | 84,412 | 2,949 |
| | AK Transneft OAO | | |
| | Prior Pfd. | 1,228 | 2,344 |
| | Surgutneftegas | | |
| | OJSC ADR | 187,640 | 1,760 |
| | Surgutneftegas OJSC | | |
| | Prior Pfd. | 2,471,100 | 1,532 |
| | NovaTek OAO GDR | 10,124 | 1,370 |
| | Gazprom OAO | 124,674 | 755 |
| | | | 394,427 |
| | South Africa (0.0%) | | |
| | Sasol Ltd. | 97,648 | 4,993 |
| |
| | South Korea (0.0%) | | |
| | SK Innovation Co. Ltd. | 20,200 | 3,049 |
| | S-Oil Corp. | 5,039 | 545 |
| | GS Holdings | 5,687 | 314 |
| | | | 3,908 |
| | Spain (0.7%) | | |
| | Repsol YPF SA | 3,384,231 | 93,319 |
| | | |
| | | | Market |
| | | | Value |
| | | Shares | ($000) |
| | Thailand (0.0%) | | |
| | PTT PCL (Foreign) | 277,500 | 3,042 |
| | Banpu PCL | 16,000 | 308 |
| | | | 3,350 |
| | Turkey (0.0%) | | |
| | Tupras Turkiye Petrol | | |
| | Rafinerileri AS | 99,675 | 2,266 |
| |
| | United Kingdom (11.8%) | | |
| | BP plc ADR | 10,562,400 | 484,920 |
| | Royal Dutch | | |
| | Shell plc ADR | 6,197,100 | 442,225 |
| | BG Group plc | 10,391,553 | 234,151 |
| | Royal Dutch | | |
| | Shell plc Class B | 4,083,196 | 149,231 |
| | Ensco plc ADR | 2,469,306 | 129,984 |
| * | Cairn Energy plc | 4,147,078 | 18,481 |
| | BP plc | 2,108,249 | 15,860 |
| | Royal Dutch Shell plc | | |
| | Class A | 425,028 | 15,079 |
| * | Cove Energy plc | 1,588,637 | 3,419 |
| | Royal Dutch Shell plc | | |
| | Class A | 92,959 | 3,306 |
| | Tullow Oil plc | 19,975 | 439 |
| | | | 1,497,095 |
| Total International | | 5,241,126 |
| Total Common Stocks | | |
| (Cost $8,146,809) | | 12,237,919 |
18
| | | |
| Energy Fund | | |
| |
| |
| |
| | | | Market |
| | | | Value• |
| | | Shares | ($000) |
| Temporary Cash Investments (3.6%)1 | | |
| Money Market Fund (1.6%) | | |
| 4,5 | Vanguard Market Liquidity Fund, 0.096% | 199,740,107 | 199,740 |
| |
| | | Face | |
| | | Amount | |
| | | ($000) | |
| Repurchase Agreement (1.9%) | | |
| | Deutsche Bank Securities Inc. 0.240%, 2/1/12 | | |
| | (Dated 1/31/12, Repurchase Value $238,902,000, | | |
| | collateralized by Federal National Mortgage Assn. | | |
| | 4.000%–6.000%, 7/1/26–6/1/41) | 238,900 | 238,900 |
| |
| U.S. Government and Agency Obligations (0.1%) | | |
| 6,7 | Federal Home Loan Bank Discount Notes, 0.025%, 3/14/12 | 2,000 | 2,000 |
| 6,7 | Federal Home Loan Bank Discount Notes, 0.030%, 3/21/12 | 1,000 | 1,000 |
| 6,7 | Federal Home Loan Bank Discount Notes, 0.030%, 4/9/12 | 6,100 | 6,099 |
| 6,7 | Federal Home Loan Bank Discount Notes, 0.045%, 4/13/12 | 2,000 | 2,000 |
| 6,8 | Freddie Mac Discount Notes, 0.050%, 4/24/12 | 3,000 | 3,000 |
| | United States Treasury Note/Bond, 1.000%, 4/30/12 | 100 | 100 |
| | | | 14,199 |
| Total Temporary Cash Investments (Cost $452,839) | | 452,839 |
| Total Investments (99.9%) (Cost $8,599,648) | | 12,690,758 |
| Other Assets and Liabilities (0.1%) | | |
| Other Assets | | 80,933 |
| Liabilities5 | | (70,286) |
| | | | 10,647 |
| Net Assets (100%) | | 12,701,405 |
| |
| |
| At January 31, 2012, net assets consisted of: | | |
| | | | Amount |
| | | | ($000) |
| Paid-in Capital | | 8,468,925 |
| Overdistributed Net Investment Income | | (25,183) |
| Accumulated Net Realized Gains | | 158,954 |
| Unrealized Appreciation (Depreciation) | | |
| Investment Securities | | 4,091,110 |
| Futures Contracts | | 7,562 |
| Foreign Currencies | | 37 |
| Net Assets | | 12,701,405 |
19
| |
| Energy Fund | |
| |
| |
| |
| | Amount |
| | ($000) |
| Investor Shares—Net Assets | |
| Applicable to 94,977,343 outstanding $.001 par value shares of | |
| beneficial interest (unlimited authorization) | 5,945,446 |
| Net Asset Value Per Share—Investor Shares | $62.60 |
| |
| Admiral Shares—Net Assets | |
| Applicable to 57,486,862 outstanding $.001 par value shares of | |
| beneficial interest (unlimited authorization) | 6,755,959 |
| Net Asset Value Per Share—Admiral Shares | $117.52 |
See Note A in Notes to Financial Statements.
* Non-income-producing security.
^ Part of security position is on loan to broker-dealers. The total value of securities on loan is $12,902,000.
1 The fund invests a portion of its cash reserves in equity markets through the use of index futures contracts. After giving effect to futures investments, the fund’s effective common stock and temporary cash investment positions represent 98.0% and 1.9%, respectively, of net assets.
2 Considered an affiliated company of the fund as the issuer is another member of The Vanguard Group.
3 Considered an affiliated company of the fund as the fund owns more than 5% of the outstanding voting securities of such company.
4 Affiliated money market fund available only to Vanguard funds and certain trusts and accounts managed by Vanguard. Rate shown is the 7-day yield.
5 Includes $13,671,000 of collateral received for securities on loan.
6 Securities with a value of $14,099,000 have been segregated as initial margin for open futures contracts.
7 The issuer operates under a congressional charter; its securities are generally neither guaranteed by the U.S. Treasury nor backed by the full faith and credit of the U.S. government.
8 The issuer was placed under federal conservatorship in September 2008; since that time, its daily operations have been managed by the Federal Housing Finance Agency and it receives capital from the U.S. Treasury in exchange for senior preferred stock.
ADR—American Depositary Receipt.
GDR—Global Depositary Receipt.
See accompanying Notes, which are an integral part of the Financial Statements.
20
Energy Fund
Statement of Operations
| |
| | Year Ended |
| | January 31, 2012 |
| | ($000) |
| Investment Income | |
| Income | |
| Dividends1,2 | 255,151 |
| Interest2 | 616 |
| Security Lending | 10,190 |
| Total Income | 265,957 |
| Expenses | |
| Investment Advisory Fees—Note B | |
| Basic Fee | 18,710 |
| Performance Adjustment | 757 |
| The Vanguard Group—Note C | |
| Management and Administrative—Investor Shares | 10,938 |
| Management and Administrative—Admiral Shares | 7,592 |
| Marketing and Distribution—Investor Shares | 1,454 |
| Marketing and Distribution—Admiral Shares | 1,300 |
| Custodian Fees | 519 |
| Auditing Fees | 30 |
| Shareholders’ Reports—Investor Shares | 99 |
| Shareholders’ Reports—Admiral Shares | 18 |
| Trustees’ Fees and Expenses | 27 |
| Total Expenses | 41,444 |
| Net Investment Income | 224,513 |
| Realized Net Gain (Loss) | |
| Investment Securities Sold2 | 608,382 |
| Futures Contracts | 4,144 |
| Foreign Currencies and Forward Currency Contracts | (447) |
| Realized Net Gain (Loss) | 612,079 |
| Change in Unrealized Appreciation (Depreciation) | |
| Investment Securities | (1,389,873) |
| Futures Contracts | 2,445 |
| Foreign Currencies | 8 |
| Change in Unrealized Appreciation (Depreciation) | (1,387,420) |
| Net Increase (Decrease) in Net Assets Resulting from Operations | (550,828) |
1 Dividends are net of foreign withholding taxes of $18,764,000.
2 Dividend income, interest income, and realized net gain (loss) from affiliated companies of the fund were $2,843,000, $269,000, and $149,841,000, respectively.
See accompanying Notes, which are an integral part of the Financial Statements.
21
Energy Fund
Statement of Changes in Net Assets
| | |
| | Year Ended January 31, |
| | 2012 | 2011 |
| | ($000) | ($000) |
| Increase (Decrease) in Net Assets | | |
| Operations | | |
| Net Investment Income | 224,513 | 199,818 |
| Realized Net Gain (Loss) | 612,079 | 457,168 |
| Change in Unrealized Appreciation (Depreciation) | (1,387,420) | 2,204,352 |
| Net Increase (Decrease) in Net Assets Resulting from Operations | (550,828) | 2,861,338 |
| Distributions | | |
| Net Investment Income | | |
| Investor Shares | (99,757) | (90,181) |
| Admiral Shares | (118,812) | (94,977) |
| Realized Capital Gain1 | | |
| Investor Shares | (241,252) | (207,111) |
| Admiral Shares | (269,367) | (195,797) |
| Total Distributions | (729,188) | (588,066) |
| Capital Share Transactions | | |
| Investor Shares | (156,067) | (1,004,028) |
| Admiral Shares | 535,094 | 1,358,485 |
| Net Increase (Decrease) from Capital Share Transactions | 379,027 | 354,457 |
| Total Increase (Decrease) | (900,989) | 2,627,729 |
| Net Assets | | |
| Beginning of Period | 13,602,394 | 10,974,665 |
| End of Period2 | 12,701,405 | 13,602,394 |
1 Includes fiscal 2012 and 2011 short-term gain distributions totaling $54,868,000 and $62,911,000, respectively. Short-term gain distributions are treated as ordinary income dividends for tax purposes.
2 Net Assets—End of Period includes undistributed (overdistributed) net investment income of ($25,183,000) and ($16,406,000).
See accompanying Notes, which are an integral part of the Financial Statements.
22
Energy Fund
Financial Highlights
| | | | | |
| Investor Shares | | | | | |
| |
| For a Share Outstanding | | | Year Ended January 31, |
| Throughout Each Period | 2012 | 2011 | 2010 | 2009 | 2008 |
| Net Asset Value, Beginning of Period | $69.20 | $57.17 | $42.62 | $73.93 | $63.55 |
| Investment Operations | | | | | |
| Net Investment Income | 1.072 | 1.053 | .910 | 1.2761 | 1.226 |
| Net Realized and Unrealized Gain (Loss) | | | | | |
| on Investments | (3.949) | 14.103 | 14.591 | (28.853) | 14.639 |
| Total from Investment Operations | (2.877) | 15.156 | 15.501 | (27.577) | 15.865 |
| Distributions | | | | | |
| Dividends from Net Investment Income | (1.102) | (.977) | (.951) | (1.264) | (1.177) |
| Distributions from Realized Capital Gains | (2.621) | (2.149) | — | (2.469) | (4.308) |
| Total Distributions | (3.723) | (3.126) | (.951) | (3.733) | (5.485) |
| Net Asset Value, End of Period | $62.60 | $69.20 | $57.17 | $42.62 | $73.93 |
| |
| Total Return2 | -3.82% | 27.17% | 36.28% | -38.51% | 25.02% |
| |
| Ratios/Supplemental Data | | | | | |
| Net Assets, End of Period (Millions) | $5,945 | $6,731 | $6,536 | $4,434 | $7,919 |
| Ratio of Total Expenses to | | | | | |
| Average Net Assets | 0.34%3 | 0.34%3 | 0.38%3 | 0.28%3 | 0.25% |
| Ratio of Net Investment Income to | | | | | |
| Average Net Assets | 1.67% | 1.74% | 1.73% | 1.84% | 1.67% |
| Portfolio Turnover Rate | 24% | 31% | 27% | 21% | 22% |
1 Calculated based on average shares outstanding.
2 Total returns do not include transaction or account service fees that may have applied in the periods shown. Fund prospectuses provide information about any applicable transaction and account service fees.
3 Includes performance-based investment advisory fee increases (decreases) of 0.01% for fiscal 2012, 0.00% for fiscal 2011, 0.03% for fiscal 2010, and 0.01% for fiscal 2009.
See accompanying Notes, which are an integral part of the Financial Statements.
23
Energy Fund
Financial Highlights
| | | | | |
| Admiral Shares | | | | | |
| |
| For a Share Outstanding | | | Year Ended January 31, |
| Throughout Each Period | 2012 | 2011 | 2010 | 2009 | 2008 |
| Net Asset Value, Beginning of Period | $129.93 | $107.34 | $80.02 | $138.86 | $119.35 |
| Investment Operations | | | | | |
| Net Investment Income | 2.101 | 2.045 | 1.780 | 2.4801 | 2.418 |
| Net Realized and Unrealized Gain (Loss) | | | | | |
| on Investments | (7.432) | 26.479 | 27.395 | (54.203) | 27.505 |
| Total from Investment Operations | (5.331) | 28.524 | 29.175 | (51.723) | 29.923 |
| Distributions | | | | | |
| Dividends from Net Investment Income | (2.159) | (1.899) | (1.855) | (2.480) | (2.322) |
| Distributions from Realized Capital Gains | (4.920) | (4.035) | — | (4.637) | (8.091) |
| Total Distributions | (7.079) | (5.934) | (1.855) | (7.117) | (10.413) |
| Net Asset Value, End of Period | $117.52 | $129.93 | $107.34 | $80.02 | $138.86 |
| |
| Total Return2 | -3.76% | 27.24% | 36.37% | -38.46% | 25.13% |
| |
| Ratios/Supplemental Data | | | | | |
| Net Assets, End of Period (Millions) | $6,756 | $6,871 | $4,439 | $2,889 | $5,214 |
| Ratio of Total Expenses to | | | | | |
| Average Net Assets | 0.28%3 | 0.28%3 | 0.31%3 | 0.21%3 | 0.17% |
| Ratio of Net Investment Income to | | | | | |
| Average Net Assets | 1.73% | 1.80% | 1.80% | 1.91% | 1.75% |
| Portfolio Turnover Rate | 24% | 31% | 27% | 21% | 22% |
1 Calculated based on average shares outstanding.
2 Total returns do not include transaction fees that may have applied in the periods shown. Fund prospectuses provide information about any applicable transaction fees.
3 Includes performance-based investment advisory fee increases (decreases) of 0.01% for fiscal 2012, 0.00% for fiscal 2011, 0.03% for fiscal 2010, and 0.01% for fiscal 2009.
See accompanying Notes, which are an integral part of the Financial Statements.
24
Energy Fund
Notes to Financial Statements
Vanguard Energy Fund is registered under the Investment Company Act of 1940 as an open-end investment company, or mutual fund. The fund invests in securities of foreign issuers, which may subject it to investment risks not normally associated with investing in securities of U.S. corporations. The fund offers two classes of shares: Investor Shares and Admiral Shares. Investor Shares are available to any investor who meets the fund’s minimum purchase requirements. Admiral Shares are designed for investors who meet certain administrative, service, and account-size criteria.
A. The following significant accounting policies conform to generally accepted accounting principles for U.S. mutual funds. The fund consistently follows such policies in preparing its financial statements.
1. Security Valuation: Securities are valued as of the close of trading on the New York Stock Exchange (generally 4 p.m., Eastern time) on the valuation date. Equity securities are valued at the latest quoted sales prices or official closing prices taken from the primary market in which each security trades; such securities not traded on the valuation date are valued at the mean of the latest quoted bid and asked prices. Securities for which market quotations are not readily available, or whose values have been affected by events occurring before the fund’s pricing time but after the close of the securities’ primary markets, are valued at their fair values calculated according to procedures adopted by the board of trustees. These procedures include obtaining quotations from an independent pricing service, monitoring news to identify significant market- or security-specific events, and evaluating changes in the values of foreign market proxies (for example, ADRs, futures contracts, or exchange-traded funds), between the time the foreign markets close and the fund’s pricing time. When fair-value pricing is employed, the prices of securities used by a fund to calculate its net asset value may differ from quoted or published prices for the same securities. Investments in Vanguard Market Liquidity Fund are valued at that fund’s net asset value. Temporary cash investments acquired over 60 days to maturity are valued using the latest bid prices or using valuations based on a matrix system (which considers such factors as security prices, yields, maturities, and ratings), both as furnished by independent pricing services. Other temporary cash investments are valued at amortized cost, which approximates market value.
2. Foreign Currency: Securities and other assets and liabilities denominated in foreign currencies are translated into U.S. dollars using exchange rates obtained from an independent third party as of the fund’s pricing time on the valuation date. Realized gains (losses) and unrealized appreciation (depreciation) on investment securities include the effects of changes in exchange rates since the securities were purchased, combined with the effects of changes in security prices. Fluctuations in the value of other assets and liabilities resulting from changes in exchange rates are recorded as unrealized foreign currency gains (losses) until the assets or liabilities are settled in cash, at which time they are recorded as realized foreign currency gains (losses).
3. Futures and Forward Currency Contracts: The fund uses index futures contracts to a limited extent, with the objective of maintaining full exposure to the stock market while maintaining liquidity. The fund may purchase or sell futures contracts to achieve a desired level of investment, whether to accommodate portfolio turnover or cash flows from capital share transactions. The primary risks associated with the use of futures contracts are imperfect correlation between changes in market values of stocks held by the fund and the prices of futures contracts, and the possibility of an illiquid market.
The fund also enters into forward currency contracts to provide the appropriate currency exposure related to any open futures contracts or to protect the value of securities and related receivables and payables against changes in foreign exchange rates. The primary risk associated with the fund’s use of these contracts is that a counterparty will fail to fulfill its obligation to pay gains due to the fund under the contracts. Counterparty risk is mitigated by entering into forward currency contracts only with highly rated counterparties, by a master netting arrangement between the fund and the counterparty,
25
Energy Fund
and by the posting of collateral by the counterparty. The forward currency contracts contain provisions whereby a counterparty may terminate open contracts if the fund’s net assets decline below a certain level, triggering a payment by the fund if the fund is in a net liability position at the time of the termination. The payment amount would be reduced by any collateral the fund has posted. Any securities posted as collateral for open contracts are noted in the Statement of Net Assets.
Futures contracts are valued at their quoted daily settlement prices. Forward currency contracts are valued at their quoted daily prices obtained from an independent third party, adjusted for currency risk based on the expiration date of each contract. The aggregate principal amounts of the contracts are not recorded in the Statement of Net Assets. Fluctuations in the value of the contracts are recorded in the Statement of Net Assets as an asset (liability) and in the Statement of Operations as unrealized appreciation (depreciation) until the contracts are closed, when they are recorded as realized gains (losses) on futures or forward currency contracts.
4. Repurchase Agreements: The fund may enter into repurchase agreements. Securities pledged as collateral for repurchase agreements are held by a custodian bank until the agreements mature. Each agreement requires that the market value of the collateral be sufficient to cover payments of interest and principal. In the event of default or bankruptcy by the other party to the agreement, the fund may sell or retain the collateral; however such action may be subject to legal proceedings.
5. Federal Income Taxes: The fund intends to continue to qualify as a regulated investment company and distribute all of its taxable income. Management has analyzed the fund’s tax positions taken for all open federal income tax years (January 31, 2009–2012), and has concluded that no provision for federal income tax is required in the fund’s financial statements.
6. Distributions: Distributions to shareholders are recorded on the ex-dividend date.
7. Security Lending: The fund may lend its securities to qualified institutional borrowers to earn additional income. Security loans are required to be secured at all times by collateral at least equal to the market value of securities loaned. The fund invests cash collateral received in Vanguard Market Liquidity Fund, and records a liability for the return of the collateral, during the period the securities are on loan. Security lending income represents fees charged to borrowers plus income earned on investing cash collateral, less expenses associated with the loan.
8. Other: Dividend income is recorded on the ex-dividend date. Interest income includes income distributions received from Vanguard Market Liquidity Fund and is accrued daily. Security transactions are accounted for on the date securities are bought or sold. Costs used to determine realized gains (losses) on the sale of investment securities are those of the specific securities sold. Fees assessed on redemptions of capital shares are credited to paid-in capital.
Each class of shares has equal rights as to assets and earnings, except that each class separately bears certain class-specific expenses related to maintenance of shareholder accounts (included in Management and Administrative expenses) and shareholder reporting. Marketing and distribution expenses are allocated to each class of shares based on a method approved by the board of trustees. Income, other non-class-specific expenses, and gains and losses on investments are allocated to each class of shares based on its relative net assets.
26
Energy Fund
B. Wellington Management Company, llp, provides investment advisory services to a portion of the fund for a fee calculated at an annual percentage rate of average net assets managed by the advisor. The basic fee is subject to quarterly adjustments based on the fund’s performance for the preceding three years relative to a combined index composed of the S&P Citigroup BMI World Energy Index and the S&P 500 Energy Equal Weighted Blend Index through July 31, 2010, and the current benchmark, MSCI ACWI Energy Index, thereafter. The benchmark will be fully phased in by July 2013.
The Vanguard Group provides investment advisory services to a portion of the fund on an at-cost basis; the fund paid Vanguard advisory fees of $335,000 for the year ended January 31, 2012.
For the year ended January 31, 2012, the aggregate investment advisory fee represented an effective annual basic rate of 0.14% of the fund’s average net assets, before an increase of $757,000 (0.01%) based on performance.
C. The Vanguard Group furnishes at cost corporate management, administrative, marketing, and distribution services. The costs of such services are allocated to the fund under methods approved by the board of trustees. The fund has committed to provide up to 0.40% of its net assets in capital contributions to Vanguard. At January 31, 2012, the fund had contributed capital of $1,961,000 to Vanguard (included in Other Assets), representing 0.02% of the fund’s net assets and 0.78% of Vanguard’s capitalization. The fund’s trustees and officers are also directors and officers of Vanguard.
D. Various inputs may be used to determine the value of the fund’s investments. These inputs are summarized in three broad levels for financial statement purposes. The inputs or methodologies used to value securities are not necessarily an indication of the risk associated with investing in those securities.
Level 1—Quoted prices in active markets for identical securities.
Level 2—Other significant observable inputs (including quoted prices for similar securities, interest rates, prepayment speeds, credit risk, etc.).
Level 3—Significant unobservable inputs (including the fund’s own assumptions used to determine the fair value of investments).
The following table summarizes the market value of the fund’s investments as of January 31, 2012, based on the inputs used to value them:
| | | |
| | Level 1 | Level 2 | Level 3 |
| Investments | ($000) | ($000) | ($000) |
| Common Stocks—United States | 6,996,793 | — | — |
| Common Stocks—International | 3,741,561 | 1,499,565 | — |
| Temporary Cash Investments | 199,740 | 253,099 | — |
| Futures Contracts—Liabilities1 | (110) | — | — |
| Total | 10,937,984 | 1,752,664 | — |
| 1 Represents variation margin on the last day of the reporting period. |
27
Energy Fund
E. Realized net gain (loss) on derivatives for the year ended January 31, 2012, was:
| | | |
| | | Foreign | |
| | Equity | Exchange | |
| | Contracts | Contracts | Total |
| Realized Net Gain (Loss) on Derivatives | ($000) | ($000) | ($000) |
| Futures Contracts | 4,144 | — | 4,144 |
| Forward Currency Contracts | — | 577 | 577 |
| Realized Net Gain (Loss) on Derivatives | 4,144 | 577 | 4,721 |
At January 31, 2012, the aggregate settlement value of open futures contracts and the related unrealized appreciation (depreciation) were:
| | | | |
| | | | | ($000) |
| | | | Aggregate | |
| | | Number of | Settlement | Unrealized |
| | | Long (Short) | Value | Appreciation |
| Futures Contracts | Expiration | Contracts | Long (Short) | (Depreciation) |
| E-mini S&P 500 Index | March 2012 | 2,218 | 145,079 | 3,868 |
| S&P 500 Index | March 2012 | 186 | 60,831 | 3,694 |
Unrealized appreciation (depreciation) on open futures contracts is required to be treated as realized gain (loss) for tax purposes.
F. Distributions are determined on a tax basis and may differ from net investment income and realized capital gains for financial reporting purposes. Differences may be permanent or temporary. Permanent differences are reclassified among capital accounts in the financial statements to reflect their tax character. Temporary differences arise when certain items of income, expense, gain, or loss are recognized in different periods for financial statement and tax purposes; these differences will reverse at some time in the future. Differences in classification may also result from the treatment of short-term gains as ordinary income for tax purposes.
During the year ended January 31, 2012, the fund realized net foreign currency losses of $1,024,000, which decreased distributable net income for tax purposes; accordingly, such losses have been reclassified from accumulated net realized gains to overdistributed net investment income.
Certain of the fund’s investments are in securities considered to be “passive foreign investment companies,” for which any unrealized appreciation and/or realized gains are required to be included in distributable net income for tax purposes. During the year ended January 31, 2012, the fund realized gains on the sale of passive foreign investment companies of $85,000, which have been included in current and prior periods’ taxable income; accordingly, such gains have been reclassified from accumulated net realized gains to overdistributed net investment income. Unrealized appreciation of $6,778,000 on the fund’s passive foreign investment company holdings through October 31, 2011 (the most recent previous mark-to-market date for tax purposes), has been distributed and is reflected in the balance of overdistributed net investment income. Since October 31, 2011, the fund’s passive foreign investment company holdings have appreciated in value by $7,117,000, increasing the amount of taxable income available for distribution as of January 31, 2012. Unrealized appreciation of the fund’s passive foreign investment company holdings at January 31, 2012, was $13,895,000.
28
Energy Fund
The fund realized gains on the sale of securities that were subject to capital gains tax in certain foreign countries. Capital gains taxes reduce realized gains for financial statement purposes but are treated as an expense for tax purposes. Accordingly, $105,000 of capital gains tax has been reclassified from accumulated net realized gains to overdistributed net investment income.
The fund used a tax accounting practice to treat a portion of the price of capital shares redeemed during the year as distributions from net investment income and realized capital gains. Accordingly, the fund has reclassified $13,677,000 from overdistributed net investment income, and $37,683,000 from accumulated net realized gains, to paid-in capital.
For tax purposes, at January 31, 2012, the fund had $10,367,000 of ordinary income and $209,819,000 of long-term capital gains available for distribution. The fund realized short-term losses of $33,865,000 during the period from November 1, 2011 through January 31, 2012, which are deferred and will be treated as realized for tax purposes in fiscal 2013.
At January 31, 2012, the cost of investment securities for tax purposes was $8,622,971,000. Net unrealized appreciation of investment securities for tax purposes was $4,067,787,000, consisting of unrealized gains of $4,390,289,000 on securities that had risen in value since their purchase and $322,502,000 in unrealized losses on securities that had fallen in value since their purchase.
G. During the year ended January 31, 2012, the fund purchased $3,283,401,000 of investment securities and sold $3,154,768,000 of investment securities, other than temporary cash investments.
H. Capital share transactions for each class of shares were:
| | | | |
| | | | Year Ended January 31, |
| | | 2012 | | 2011 |
| | Amount | Shares | Amount | Shares |
| | ($000) | (000) | ($000) | (000) |
| Investor Shares | | | | |
| Issued | 1,166,296 | 17,219 | 993,363 | 16,506 |
| Issued in Lieu of Cash Distributions | 328,737 | 5,528 | 286,379 | 4,616 |
| Redeemed1 | (1,651,100) | (25,049) | (2,283,770) | (38,167) |
| Net Increase (Decrease)—Investor Shares | (156,067) | (2,302) | (1,004,028) | (17,045) |
| Admiral Shares | | | | |
| Issued | 1,350,158 | 10,745 | 1,900,020 | 16,578 |
| Issued in Lieu of Cash Distributions | 352,941 | 3,171 | 261,084 | 2,235 |
| Redeemed1 | (1,168,005) | (9,311) | (802,619) | (7,281) |
| Net Increase (Decrease)—Admiral Shares | 535,094 | 4,605 | 1,358,485 | 11,532 |
| 1 Net of redemption fees for fiscal 2012 and 2011 of $2,001,000 and $2,317,000, respectively (fund totals). |
29
Energy Fund
I. Certain of the fund’s investments are in companies that are considered to be affiliated companies of the fund because the fund owns more than 5% of the outstanding voting securities of the company. Transactions during the period in securities of these companies were as follows:
| | | | | |
| | | | Current Period Transactions | |
| | Jan. 31, 2011 | | Proceeds from | | Jan. 31, 2012 |
| | Market | Purchases | Securities | Dividend | Market |
| | Value | at Cost | Sold | Income | Value |
| | ($000) | ($000) | ($000) | ($000) | ($000) |
| Cabot Oil & Gas Corp. | 266,816 | 11,159 | 278,882 | 453 | NA1 |
| Nordic American Tankers Ltd. | — | 61,811 | 398 | 1,317 | 43,932 |
| | 266,816 | | | 1,770 | 43,932 |
1 Not applicable—At January 31, 2012, the security was still held, but the issuer was no longer an affiliated company of the fund.
J. In preparing the financial statements as of January 31, 2012, management considered the impact of subsequent events for potential recognition or disclosure in these financial statements.
30
Report of Independent Registered
Public Accounting Firm
To the Trustees of Vanguard Specialized Funds and the Shareholders of Vanguard Energy Fund:
In our opinion, the accompanying statement of net assets and the related statements of operations and of changes in net assets and the financial highlights present fairly, in all material respects, the financial position of Vanguard Energy Fund (constituting a separate portfolio of Vanguard Specialized Funds, hereafter referred to as the “Fund”) at January 31, 2012, the results of its operations for the year then ended, the changes in its net assets for each of the two years in the period then ended and the financial highlights for each of the five years in the period then ended, in conformity with accounting principles generally accepted in the United States of America. These financial statements and financial highlights (hereafter referred to as “financial statements”) are the responsibility of the Fund’s management; our responsibility is to express an opinion on these financial statements based on our audits. We conducted our audits of these financial statements in accordance with the standards of the Public Company Accounting Oversight Board (United States). Those standards require that we plan and perform the audit to obtain reasonable assurance about whether the financial statements are free of material misstatement. An audit includes examining, on a test basis, evidence supporting the amounts and disclosures in the financial statements, assessing the accounting principles used and significant estimates made by management, and evaluating the overall financial statement presentation. We believe that our audits, which included confirmation of securities at January 31, 2012 by correspondence with the custodians and brokers and by agreement to the underlying ownership records of Vanguard Market Liquidity Fund, provide a reasonable basis for our opinion.
PricewaterhouseCoopers LLP
Philadelphia, Pennsylvania
March 12, 2012
|
| Special 2011 tax information (unaudited) for Vanguard Energy Fund |
This information for the fiscal year ended January 31, 2012, is included pursuant to provisions of the Internal Revenue Code.
The fund distributed $491,171,000 as capital gain dividends (from net long-term capital gains) to shareholders during the fiscal year.
The fund distributed $169,108,000 of qualified dividend income to shareholders during the fiscal year.
For corporate shareholders, 40.1% of investment income (dividend income plus short-term gains, if any) qualifies for the dividends-received deduction.
31
Your Fund’s After-Tax Returns
This table presents returns for your fund both before and after taxes. The after-tax returns are shown in two ways: (1) assuming that an investor owned the fund during the entire period and paid taxes on the fund’s distributions, and (2) assuming that an investor paid taxes on the fund’s distributions and sold all shares at the end of each period.
Calculations are based on the highest individual federal income tax and capital gains tax rates in effect at the times of the distributions and the hypothetical sales. State and local taxes were not considered. After-tax returns reflect any qualified dividend income , using actual prior-year figures and estimates for 2012. (In the example, returns after the sale of fund shares may be higher than those assuming no sale. This occurs when the sale would have produced a capital loss. The calculation assumes that the investor received a tax deduction for the loss.)
The table shows returns for Investor Shares only; returns for other share classes will differ. Please note that your actual after-tax returns will depend on your tax situation and may differ from those shown. Also note that if you own the fund in a tax-deferred account, such as an individual retirement account or a 401(k) plan, this information does not apply to you. Such accounts are not subject to current taxes.
Finally, keep in mind that a fund’s performance—whether before or after taxes—does not guarantee future results.
Average Annual Total Returns: Energy Fund Investor Shares
Periods Ended January 31, 2012
| | | |
| | One | Five | Ten |
| | Year | Years | Years |
| Returns Before Taxes | -3.82% | 5.08% | 15.00% |
| Returns After Taxes on Distributions | -4.85 | 4.14 | 14.03 |
| Returns After Taxes on Distributions and Sale of Fund Shares | -1.60 | 4.18 | 13.22 |
Returns do not reflect the 1% fee on redemptions of shares held for less than one year.
32
About Your Fund’s Expenses
As a shareholder of the fund, you incur ongoing costs, which include costs for portfolio management, administrative services, and shareholder reports (like this one), among others. Operating expenses, which are deducted from a fund’s gross income, directly reduce the investment return of the fund.
A fund’s expenses are expressed as a percentage of its average net assets. This figure is known as the expense ratio. The following examples are intended to help you understand the ongoing costs (in dollars) of investing in your fund and to compare these costs with those of other mutual funds. The examples are based on an investment of $1,000 made at the beginning of the period shown and held for the entire period.
The accompanying table illustrates your fund’s costs in two ways:
• Based on actual fund return. This section helps you to estimate the actual expenses that you paid over the period. The ”Ending Account Value“ shown is derived from the fund‘s actual return, and the third column shows the dollar amount that would have been paid by an investor who started with $1,000 in the fund. You may use the information here, together with the amount you invested, to estimate the expenses that you paid over the period.
To do so, simply divide your account value by $1,000 (for example, an $8,600 account value divided by $1,000 = 8.6), then multiply the result by the number given for your fund under the heading ”Expenses Paid During Period.“
• Based on hypothetical 5% yearly return. This section is intended to help you compare your fund‘s costs with those of other mutual funds. It assumes that the fund had a yearly return of 5% before expenses, but that the expense ratio is unchanged. In this case—because the return used is not the fund’s actual return—the results do not apply to your investment. The example is useful in making comparisons because the Securities and Exchange Commission requires all mutual funds to calculate expenses based on a 5% return. You can assess your fund’s costs by comparing this hypothetical example with the hypothetical examples that appear in shareholder reports of other funds.
Note that the expenses shown in the table are meant to highlight and help you compare ongoing costs only and do not reflect transaction costs incurred by the fund for buying and selling securities. Further, the expenses do not include any purchase, redemption, or account service fees described in the fund prospectus. If such fees were applied to your account, your costs would be higher. Your fund does not carry a “sales load.”
The calculations assume no shares were bought or sold during the period. Your actual costs may have been higher or lower, depending on the amount of your investment and the timing of any purchases or redemptions.
You can find more information about the fund’s expenses, including annual expense ratios, in the Financial Statements section of this report. For additional information on operating expenses and other shareholder costs, please refer to your fund’s current prospectus.
33
| | | |
| Six Months Ended January 31, 2012 | | | |
| | Beginning | Ending | Expenses |
| | Account Value | Account Value | Paid During |
| Energy Fund | 7/31/2011 | 1/31/2012 | Period |
| Based on Actual Fund Return | | | |
| Investor Shares | $1,000.00 | $921.74 | $1.70 |
| Admiral Shares | 1,000.00 | 922.01 | 1.40 |
| Based on Hypothetical 5% Yearly Return | | | |
| Investor Shares | $1,000.00 | $1,023.44 | $1.79 |
| Admiral Shares | 1,000.00 | 1,023.74 | 1.48 |
The calculations are based on expenses incurred in the most recent six-month period. The fund’s annualized six-month expense ratios for that period are 0.35% for Investor Shares and 0.29% for Admiral Shares. The dollar amounts shown as “Expenses Paid” are equal to the annualized expense ratio multiplied by the average account value over the period, multiplied by the number of days in the most recent six-month period, then divided by the number of days in the most recent 12-month period.
34
Glossary
30-Day SEC Yield. A fund’s 30-day SEC yield is derived using a formula specified by the U.S. Securities and Exchange Commission. Under the formula, data related to the fund’s security holdings in the previous 30 days are used to calculate the fund’s hypothetical net income for that period, which is then annualized and divided by the fund’s estimated average net assets over the calculation period. For the purposes of this calculation, a security’s income is based on its current market yield to maturity (for bonds), its actual income (for asset-backed securities), or its projected dividend yield (for stocks). Because the SEC yield represents hypothetical annualized income, it will differ—at times significantly—from the fund’s actual experience. As a result, the fund’s income distributions may be higher or lower than implied by the SEC yield.
Beta. A measure of the magnitude of a fund’s past share-price fluctuations in relation to the ups and downs of a given market index. The index is assigned a beta of 1.00. Compared with a given index, a fund with a beta of 1.20 typically would have seen its share price rise or fall by 12% when the index rose or fell by 10%. For this report, beta is based on returns over the past 36 months for both the fund and the index. Note that a fund’s beta should be reviewed in conjunction with its R-squared (see definition). The lower the R-squared, the less correlation there is between the fund and the index, and the less reliable beta is as an indicator of volatility.
Dividend Yield. Dividend income earned by stocks, expressed as a percentage of the aggregate market value (or of net asset value, for a fund). The yield is determined by dividing the amount of the annual dividends by the aggregate value (or net asset value) at the end of the period. For a fund, the dividend yield is based solely on stock holdings and does not include any income produced by other investments.
Earnings Growth Rate. The average annual rate of growth in earnings over the past five years for the stocks now in a fund.
Equity Exposure. A measure that reflects a fund’s investments in stocks and stock futures. Any holdings in short-term reserves are excluded.
Expense Ratio. A fund’s total annual operating expenses expressed as a percentage of the fund’s average net assets. The expense ratio includes management and administrative expenses, but does not include the transaction costs of buying and selling portfolio securities.
Foreign Holdings. The percentage of a fund represented by securities or depositary receipts of companies based outside the United States.
Inception Date. The date on which the assets of a fund (or one of its share classes) are first invested in accordance with the fund’s investment objective. For funds with a subscription period, the inception date is the day after that period ends. Investment performance is measured from the inception date.
Median Market Cap. An indicator of the size of companies in which a fund invests; the midpoint of market capitalization (market price x shares outstanding) of a fund’s stocks, weighted by the proportion of the fund’s assets invested in each stock. Stocks representing half of the fund’s assets have market capitalizations above the median, and the rest are below it.
Price/Book Ratio. The share price of a stock divided by its net worth, or book value, per share. For a fund, the weighted average price/book ratio of the stocks it holds.
35
Price/Earnings Ratio. The ratio of a stock’s current price to its per-share earnings over the past year. For a fund, the weighted average P/E of the stocks it holds. P/E is an indicator of market expectations about corporate prospects; the higher the P/E, the greater the expectations for a company’s future growth.
R-Squared. A measure of how much of a fund’s past returns can be explained by the returns from the market in general, as measured by a given index. If a fund’s total returns were precisely synchronized with an index’s returns, its R-squared would be 1.00. If the fund’s returns bore no relationship to the index’s returns, its R-squared would be 0. For this report, R-squared is based on returns over the past 36 months for both the fund and the index.
Return on Equity. The annual average rate of return generated by a company during the past five years for each dollar of shareholder’s equity (net income divided by shareholder’s equity). For a fund, the weighted average return on equity for the companies whose stocks it holds.
Short-Term Reserves. The percentage of a fund invested in highly liquid, short-term securities that can be readily converted to cash.
Turnover Rate. An indication of the fund’s trading activity. Funds with high turnover rates incur higher transaction costs and may be more likely to distribute capital gains (which may be taxable to investors). The turnover rate excludes in-kind transactions, which have minimal impact on costs.
36
This page intentionally left blank.
This page intentionally left blank.
This page intentionally left blank.
The People Who Govern Your Fund
The trustees of your mutual fund are there to see that the fund is operated and managed in your best interests since, as a shareholder, you are a part owner of the fund. Your fund’s trustees also serve on the board of directors of The Vanguard Group, Inc., which is owned by the Vanguard funds and provides services to them on an at-cost basis.
A majority of Vanguard’s board members are independent, meaning that they have no affiliation with Vanguard or the funds they oversee, apart from the sizable personal investments they have made as private individuals. The independent board members have distinguished backgrounds in business, academia, and public service. Each of the trustees and executive officers oversees 181 Vanguard funds.
The following table provides information for each trustee and executive officer of the fund. More information about the trustees is in the Statement of Additional Information, which can be obtained, without charge, by contacting Vanguard at 800-662-7447, or online at vanguard.com.
| |
| Interested Trustee1 | (chemicals); Director of Tyco International, Ltd. |
| | (diversified manufacturing and services) and Hewlett- |
| F. William McNabb III | Packard Co. (electronic computer manufacturing); |
| Born 1957. Trustee Since July 2009. Chairman of the | Senior Advisor at New Mountain Capital; Trustee |
| Board. Principal Occupation(s) During the Past Five | of The Conference Board; Member of the Board of |
| Years: Chairman of the Board of The Vanguard Group, | Managers of Delphi Automotive LLP (automotive |
| Inc., and of each of the investment companies served | components). |
| by The Vanguard Group, since January 2010; Director | |
| of The Vanguard Group since 2008; Chief Executive | Amy Gutmann |
| Officer and President of The Vanguard Group and of | Born 1949. Trustee Since June 2006. Principal |
| each of the investment companies served by The | Occupation(s) During the Past Five Years: President |
| Vanguard Group since 2008; Director of Vanguard | of the University of Pennsylvania; Christopher H. |
| Marketing Corporation; Managing Director of The | Browne Distinguished Professor of Political Science |
| Vanguard Group (1995–2008). | in the School of Arts and Sciences with secondary |
| | appointments at the Annenberg School for Commu- |
| | nication and the Graduate School of Education |
| Independent Trustees | of the University of Pennsylvania; Director of |
| | Carnegie Corporation of New York, Schuylkill River |
| Emerson U. Fullwood | Development Corporation, and Greater Philadelphia |
| Born 1948. Trustee Since January 2008. Principal | Chamber of Commerce; Trustee of the National |
| Occupation(s) During the Past Five Years: Executive | Constitution Center; Chair of the Presidential |
| Chief Staff and Marketing Officer for North America | Commission for the Study of Bioethical Issues. |
| and Corporate Vice President (retired 2008) of Xerox | |
| Corporation (document management products and | JoAnn Heffernan Heisen |
| services); Executive in Residence and 2010 | Born 1950. Trustee Since July 1998. Principal |
| Distinguished Minett Professor at the Rochester | Occupation(s) During the Past Five Years: Corporate |
| Institute of Technology; Director of SPX Corporation | Vice President and Chief Global Diversity Officer |
| (multi-industry manufacturing), the United Way of | (retired 2008) and Member of the Executive |
| Rochester, Amerigroup Corporation (managed health | Committee (1997–2008) of Johnson & Johnson |
| care), the University of Rochester Medical Center, | (pharmaceuticals/consumer products); Director of |
| Monroe Community College Foundation, and North | Skytop Lodge Corporation (hotels), the University |
| Carolina A&T University. | Medical Center at Princeton, the Robert Wood |
| | Johnson Foundation, and the Center for Work Life |
| Rajiv L. Gupta | Policy; Member of the Advisory Board of the |
| Born 1945. Trustee Since December 2001.2 | Maxwell School of Citizenship and Public Affairs |
| Principal Occupation(s) During the Past Five Years: | at Syracuse University. |
| Chairman and Chief Executive Officer (retired 2009) | |
| and President (2006–2008) of Rohm and Haas Co. | |
| | |
| F. Joseph Loughrey | the investment companies served by The Vanguard |
| Born 1949. Trustee Since October 2009. Principal | Group since 2010; Assistant Controller of each of |
| Occupation(s) During the Past Five Years: President | the investment companies served by The Vanguard |
| and Chief Operating Officer (retired 2009) and Vice | Group (2001–2010). | |
| Chairman of the Board (2008–2009) of Cummins Inc. | | |
| (industrial machinery); Director of SKF AB (industrial | Thomas J. Higgins | |
| machinery), Hillenbrand, Inc. (specialized consumer | Born 1957. Chief Financial Officer Since September |
| services), the Lumina Foundation for Education, and | 2008. Principal Occupation(s) During the Past Five |
| Oxfam America; Chairman of the Advisory Council | Years: Principal of The Vanguard Group, Inc.; Chief |
| for the College of Arts and Letters and Member | Financial Officer of each of the investment companies |
| of the Advisory Board to the Kellogg Institute for | served by The Vanguard Group since 2008; Treasurer |
| International Studies at the University of Notre Dame. | of each of the investment companies served by The |
| | Vanguard Group (1998–2008). |
| André F. Perold | | |
| Born 1952. Trustee Since December 2004. Principal | Kathryn J. Hyatt | |
| Occupation(s) During the Past Five Years: George | Born 1955. Treasurer Since November 2008. Principal |
| Gund Professor of Finance and Banking at the Harvard | Occupation(s) During the Past Five Years: Principal |
| Business School (retired July 2011); Chief Investment | of The Vanguard Group, Inc.; Treasurer of each of |
| Officer and Managing Partner of HighVista Strategies | the investment companies served by The Vanguard |
| LLC (private investment firm); Director of Rand | Group since 2008; Assistant Treasurer of each of the |
| Merchant Bank; Overseer of the Museum of Fine | investment companies served by The Vanguard Group |
| Arts Boston. | (1988–2008). | |
| |
| Alfred M. Rankin, Jr. | Heidi Stam | |
| Born 1941. Trustee Since January 1993. Principal | Born 1956. Secretary Since July 2005. Principal |
| Occupation(s) During the Past Five Years: Chairman, | Occupation(s) During the Past Five Years: Managing |
| President, and Chief Executive Officer of NACCO | Director of The Vanguard Group, Inc., since 2006; |
| Industries, Inc. (forklift trucks/housewares/lignite); | General Counsel of The Vanguard Group since 2005; |
| Director of Goodrich Corporation (industrial products/ | Secretary of The Vanguard Group and of each of the |
| aircraft systems and services) and the National | investment companies served by The Vanguard Group |
| Association of Manufacturers; Chairman of the Federal | since 2005; Director and Senior Vice President of |
| Reserve Bank of Cleveland and of University Hospitals | Vanguard Marketing Corporation since 2005; |
| of Cleveland; Advisory Chairman of the Board of The | Principal of The Vanguard Group (1997–2006). |
| Cleveland Museum of Art. | | |
| |
| Peter F. Volanakis | Vanguard Senior Management Team |
| Born 1955. Trustee Since July 2009. Principal | | |
| Occupation(s) During the Past Five Years: President | Mortimer J. Buckley | Michael S. Miller |
| and Chief Operating Officer (retired 2010) of Corning | Kathleen C. Gubanich | James M. Norris |
| Incorporated (communications equipment); Director of | Paul A. Heller | Glenn W. Reed |
| Corning Incorporated (2000-2010) and Dow Corning | Martha G. King | George U. Sauter |
| (2001-2010); Director of SPX Corporation (multi- | Chris D. McIsaac | |
| industry manufacturing), the Corning Foundation, and | | |
| the Corning Museum of Glass; Overseer of the Amos | Chairman Emeritus and Senior Advisor |
| Tuck School of Business Administration at Dartmouth | | |
| College; Advisor to the Norris Cotton Cancer Center. | John J. Brennan | |
| | Chairman, 1996–2009 | |
| | Chief Executive Officer and President, 1996–2008 |
| Executive Officers | | |
| |
| Glenn Booraem | Founder | |
| Born 1967. Controller Since July 2010. Principal | | |
| Occupation(s) During the Past Five Years: Principal | John C. Bogle | |
| of The Vanguard Group, Inc.; Controller of each of | Chairman and Chief Executive Officer, 1974–1996 |
1 Mr. McNabb is considered an “interested person,” as defined in the Investment Company Act of 1940, because he is an officer of the Vanguard funds.
2 December 2002 for Vanguard Equity Income Fund, Vanguard Growth Equity Fund, the Vanguard Municipal Bond Funds, and the Vanguard State Tax-Exempt Funds.
| 
|
| P.O. Box 2600 |
| Valley Forge, PA 19482-2600 |
Connect with Vanguard® > vanguard.com
| |
| Fund Information > 800-662-7447 | CFA® is a trademark owned by CFA Institute. |
| Direct Investor Account Services > 800-662-2739 | |
| Institutional Investor Services > 800-523-1036 | |
| Text Telephone for People | |
| With Hearing Impairment > 800-749-7273 | |
| |
| This material may be used in conjunction | |
| with the offering of shares of any Vanguard | |
| fund only if preceded or accompanied by | |
| the fund’s current prospectus. | |
| |
| All comparative mutual fund data are from Lipper Inc. or | |
| Morningstar, Inc., unless otherwise noted. | |
| |
| You can obtain a free copy of Vanguard’s proxy voting | |
| guidelines by visiting vanguard.com/proxyreporting or by | |
| calling Vanguard at 800-662-2739. The guidelines are | |
| also available from the SEC’s website, sec.gov. In | |
| addition, you may obtain a free report on how your fund | |
| voted the proxies for securities it owned during the 12 | |
| months ended June 30. To get the report, visit either | |
| vanguard.com/proxyreporting or sec.gov. | |
| |
| You can review and copy information about your fund at | |
| the SEC’s Public Reference Room in Washington, D.C. To | |
| find out more about this public service, call the SEC at | |
| 202-551-8090. Information about your fund is also | |
| available on the SEC’s website, and you can receive | |
| copies of this information, for a fee, by sending a | |
| request in either of two ways: via e-mail addressed to | |
| publicinfo@sec.gov or via regular mail addressed to the | |
| Public Reference Section, Securities and Exchange | |
| Commission, Washington, DC 20549-1520. | |
| |
| |
| | © 2012 The Vanguard Group, Inc. |
| | All rights reserved. |
| | Vanguard Marketing Corporation, Distributor. |
| |
| | Q510 032012 |

Annual Report | January 31, 2012
Vanguard Precious Metals and Mining Fund
> For the fiscal year ended January 31, 2012, Vanguard Precious Metals and Mining Fund returned about –1%.
> The fund outperformed its benchmark for the period, but lagged the average return of its peers.
> The advisor’s selections among gold-oriented and diversified metals and mining stocks helped the fund’s performance relative to the benchmark.
| |
| Contents | |
| Your Fund’s Total Returns. | 1 |
| Chairman’s Letter. | 2 |
| Advisor’s Report. | 8 |
| Fund Profile. | 12 |
| Performance Summary. | 13 |
| Financial Statements. | 15 |
| Your Fund’s After-Tax Returns. | 25 |
| About Your Fund’s Expenses. | 26 |
| Glossary. | 28 |
Please note: The opinions expressed in this report are just that—informed opinions. They should not be considered promises or advice.
Also, please keep in mind that the information and opinions cover the period through the date on the front of this report. Of course, the risks of investing in your fund are spelled out in the prospectus.
See the Glossary for definitions of investment terms used in this report.
About the cover: Vanguard was named for the HMS Vanguard, flagship of British Admiral Horatio Nelson. A ship—whose performance and safety depend on the work of all hands—has served as a fitting metaphor for the Vanguard crew as we strive to help clients reach their financial goals.
Your Fund’s Total Returns
Fiscal Year Ended January 31, 2012
| |
| | Total |
| | Returns |
| Vanguard Precious Metals and Mining Fund | -0.97% |
| S&P Custom Precious Metals and Mining Index | -5.66 |
| Precious Metal Funds Average | 3.41 |
| Precious Metal Funds Average: Derived from data provided by Lipper Inc. |
Your Fund’s Performance at a Glance
January 31, 2011 , Through January 31, 2012
| | | | |
| | | | Distributions Per Share |
| | Starting | Ending | Income | Capital |
| | Share Price | Share Price | Dividends | Gains |
| Vanguard Precious Metals and Mining Fund | $24.15 | $22.14 | $0.123 | $1.461 |
1

Chairman’s Letter
Dear Shareholder,
The fiscal year ended January 31, 2012, was a volatile period for the global stock markets, as concerns over slowing economic growth, natural and nuclear disaster in Japan, and government debt issues at home and abroad weighed on investors. In this turbulent environment, U.S. stocks significantly outperformed their international counterparts.
Vanguard Precious Metals and Mining Fund, which invests in both domestic and foreign stocks, returned –0.97% for the period. The fund outperformed its benchmark index (–5.66%), but lagged its peer-group average (+3.41%). The fund’s exposure to diversified metals and mining and gold-oriented stocks helped its performance compared with the benchmark.
If you hold the fund in a taxable account, you may wish to review information on after-tax performance provided later in this report.
Volatility was a constant
in fast-changing markets
For the 12 months ended January 31, the broad U.S. stock market returned 3.55%. This modest result reflected rallies and reversals driven by drama on the global stage, including Europe’s debt crisis and rating agency Standard & Poor’s decision to downgrade the U.S. credit rating.
2
(Vanguard’s confidence in the full faith and credit of the U.S. Treasury remains unshaken.)
The recent volatility is consistent with the pattern of the past five years, as suggested by the figures in the Market Barometer. The dramatic differences in average annual returns over the one-, three-, and five-year periods are a consequence of the stock market’s heady spikes and precipitous declines.
Although the outcome was different, this turbulence is also apparent in the returns of international stock markets. In the past 12 months, non-U.S. stock markets delivered negative results. Weakness was widespread, with the worst returns in Europe and Japan.
Modest yields and high returns
in the bond market
Bonds ended the fiscal year with surprisingly strong returns. At the start of the period, the 10-year Treasury note’s slender yield of 3.38% seemed like a good reason to temper expectations. As stock market volatility spiked and investors put a premium on safety, however, yields moved lower still. The 10-year T-note finished the period at 1.80%. The Barclays Capital U.S. Aggregate Bond Index, a broad taxable bond market benchmark, returned 8.66%.
Municipal bonds did even better, as prices snapped back from a fear-driven plunge in the months preceding the new fiscal year. Although last year’s low expectations proved misguided, it’s worth remembering
| | | |
| Market Barometer | | | |
| |
| | | Average Annual Total Returns |
| | | Periods Ended January 31, 2012 |
| | One | Three | Five |
| | Year | Years | Years |
| Stocks | | | |
| Russell 1000 Index (Large-caps) | 3.95% | 20.01% | 0.55% |
| Russell 2000 Index (Small-caps) | 2.86 | 23.03 | 1.19 |
| Dow Jones U.S. Total Stock Market Index | 3.55 | 20.54 | 0.88 |
| MSCI All Country World Index ex USA (International) | -8.75 | 16.70 | -1.71 |
| |
| Bonds | | | |
| Barclays Capital U.S. Aggregate Bond Index (Broad | | | |
| taxable market) | 8.66% | 7.40% | 6.70% |
| Barclays Capital Municipal Bond Index (Broad | | | |
| tax-exempt market) | 14.10 | 8.10 | 5.76 |
| Citigroup Three-Month U.S. Treasury Bill Index | 0.07 | 0.10 | 1.27 |
| |
| CPI | | | |
| Consumer Price Index | 2.93% | 2.39% | 2.29% |
3
that low yields do imply lower future returns: As yields tumble, the scope for further declines—and increases in prices—diminishes.
Savings instruments such as the 3-month Treasury bill returned a little more than 0%, consistent with the Federal Reserve’s target for the shortest-term interest rates.
The fund bested its benchmark
but trailed its peer average
Vanguard Precious Metals and Mining Fund offers exposure to a small area of the market, primarily investing in companies involved in the mining of, or exploration for, precious and nonprecious metals and minerals. While the portfolio is concentrated—the fund holds about 40– 50 stocks—its holdings represent a broad range of both industry subsectors and geographical regions. The fund’s wide exposure within the sector can help mitigate some of its volatility, but investors can still expect returns to vary widely from year to year.
In this most recent fiscal year, in fact, the fund’s broad range of holdings detracted from its performance compared with its peer group. Holdings in industries outside the precious-metals precincts weighed on performance. Together, Noble Group (–36%), a Singapore-based commodities trading company, and K+S AG (–34%), a Germany-based potash and salt producer, cut more than 3 percentage points from the fund’s return as investors cooled toward companies most sensitive to the economic cycles.
Expense Ratios
Your Fund Compared With Its Peer Group
| | |
| | | Peer Group |
| | Fund | Average |
| Precious Metals and Mining Fund | 0.27% | 1.36% |
The fund expense ratio shown is from the prospectus dated May 26, 2011, and represents estimated costs for the current fiscal year. For the fiscal year ended January 31, 2012, the fund’s expense ratio was 0.29%. The peer-group expense ratio is derived from data provided by Lipper Inc. and captures information through year-end 2011.
Peer group: Precious Metal Funds.
4
One non-precious-metals holding that produced a notably strong return was Iluka Resources (+135%), an Australian mineral sands producer and the portfolio’s top performer for the period. Iluka stock contributed more than 6 percentage points to the fund’s total return.
The fund has been underweighted in gold stocks compared with its benchmark index and peers. Recently, however, its advisor, M&G Investment Management Ltd., has started gradually increasing the portfolio’s exposure to the yellow metal. At the end of the 12 months, gold-oriented stocks accounted for about 56% of the fund’s assets and had contributed about 2.3 percentage points to the overall return for the period. This allocation, up from about 37% one year ago, was also more than the 41% held by the index.
At the same time it was increasing the fund’s position in gold, M&G scaled back the allocation to platinum-oriented stocks. By the end of the fiscal year, the fund had eliminated its position in two of the world’s largest platinum producers, Lonmin (–38%) and Northam Platinum (–27%), whose South African mines have experienced repeated disruptions in recent years. The fund’s limited exposure to platinum—which was down about 11% for the 12-month period—boosted returns relative to the index.
Total Returns
Ten Years Ended January 31, 2012
| |
| | Average |
| | Annual Return |
| Precious Metals and Mining Fund | 18.13% |
| Spliced Precious Metals and Mining Index | 17.59 |
| Precious Metal Funds Average | 20.25 |
Spliced Precious Metals and Mining Index: S&P/Citigroup World Equity Gold Index through June 30, 2005; S&P Custom Precious Metals and Mining Index thereafter.
Precious Metal Funds Average: Derived from data provided by Lipper Inc.
The figures shown represent past performance, which is not a guarantee of future results. (Current performance may be lower or higher than the performance data cited. For performance data current to the most recent month-end, visit our website at vanguard.com/performance.) Note, too, that both investment returns and principal value can fluctuate widely, so an investor’s shares, when sold, could be worth more or less than their original cost.
5
The fund’s long-term results:
Strong, unlikely to be sustained
For the ten years ended January 31, the fund posted an average annual return of 18.13%. The fund’s results were slightly better than those of its benchmark (+17.59%), but trailed its peer-group average (+20.25%), again a reflection of its more broadly diversified portfolio. The fund significantly outperformed the broad U.S. stock market, which produced an average annual return of 4.55% for the period.
The fund’s exceptional absolute return over the past decade—a period that included sharply higher prices for precious metals, extreme volatility in the financial markets, a global recession, and Europe’s sovereign-debt crisis—reflects well on its advisor, London-based M&G Investment Management, which has managed the fund since its inception. More broadly, however, it reflects an unusually rewarding period for metals and mining stocks.
It would be unwise to expect this performance to continue for the next decade. A powerful, yet underappreciated, reality of investing is that periods of strength set the stage for more moderate performance as returns drift back toward long-term averages.
Sector funds can help
diversify a balanced portfolio
Over the past several years, global financial markets have moved up and down like a playground seesaw. As investors, if we’ve learned anything during this time, it’s that periods of extreme volatility really aren’t that unusual.
Maintaining a balanced portfolio that’s diversified across asset classes is a simple and effective strategy for dealing with these ups and downs, whether the swings are mild or wild. In strong markets, the equity portion of a balanced portfolio can offer investors the opportunity for long-term growth. In volatile times such as those we’ve experienced in recent years, bonds and short-term investments can provide a cushion from dramatic swings in the stock market.
For these reasons, Vanguard encourages investors to create a long-term investment plan that includes a steady mix of stocks, bonds, and short-term investments appropriate for their goals and risk tolerance.
Vanguard Precious Metals and Mining Fund can help further diversify such a well-balanced portfolio, providing exposure to metals and mining stocks in regions around the world. Because of its narrow investment scope, this fund can be more
6
volatile than one that’s diversified across multiple sectors, and returns often vary widely from year to year. For investors who keep that in mind, the fund can have a useful role within a long-term investment plan.
As always, thank you for entrusting your assets to Vanguard.
Sincerely,

F. William McNabb III
Chairman and Chief Executive Officer
February 14, 2012
7
Advisor’s Report
Vanguard Precious Metals and Mining Fund produced a return of –0.97% for the 12 months ended January 31, 2012, performing better than its customized benchmark index (–5.66%) but lagging the average return of its peer funds (+3.41%).
The markets
The past fiscal year saw extreme volatility in global financial markets, punctuated by growing concerns over anemic global growth, elevated levels of debt in the developed world, and heightened geopolitical tensions, particularly in the Middle East. In August, the struggle by U.S. lawmakers over the debt ceiling and the subsequent S&P downgrade of Treasury debt to AA+ caused U.S. and global stock markets to decline sharply.
Unsurprisingly, gold was a beneficiary of this uncertainty, continuing its 11-year rally to reach a record high of $1,905 per troy ounce before normalizing in December; gold prices rose 29% over the period as a whole. The story was different for the more economically sensitive metals, such as copper, nickel, and platinum. Against the backdrop of slowing global growth, these metals—which had performed relatively well in 2009 and 2010—succumbed to weak demand and fell in value.
The fund’s performance
At the start of 2011, in light of rising debt levels and growing imbalances in the global economy, we took steps to reposition the portfolio and to bolster the fund’s exposure to mining companies that provided relatively defensive qualities in an uncertain economic environment. Our increased allocation to selected gold miners proved helpful to fund performance—not solely because of rising prices for the metal, but thanks to company-specific factors as well.
The gold industry at an aggregate level has historically employed a profligate approach to capital allocation, opting for overpriced merger-and-acquisition activity to attain growth rather than focusing on shareholder returns. However, several gold miners have come to recognize the importance of implementing a more return-oriented business model along with a dividend policy that instills capital discipline while also rewarding investors for their long-term financial support. In this regard, U.S.-listed Newmont Mining has been an industry role model: In April 2011, the company announced it would link future dividends to the underlying gold price, a development we have encouraged.
Key examples of this new orientation toward shareholders were Canadian-listed Alacer Gold and Centerra Gold, U.S.-based Minefinders, and Australian-listed Resolute Mining. Alacer Gold, formed from a merger between Avoca Resources and Anatolia
8
Minerals Development, continues to perform well under a strong management team. Our confidence in low-cost miner Centerra Gold was well-placed, as the cash-generative company had a strong year that was supported by positive drill results.
In the cases of Minefinders and Resolute Mining, we had great confidence in the ability and integrity of the management teams, and we have been able to offer valuable support during challenging periods for these companies. Thanks to capital injections, Minefinders restructured its balance sheet and Resolute resolved production issues. Minefinders was recently bought by Pan American Silver at a significant premium, underscoring the company’s value.
Outside of the precious-metals industry, the fund’s exposure to Iluka Resources embodies the long-term, collaborative approach we prefer to adopt with management teams who demonstrate a clear alignment of company and shareholder interests.
Iluka is an Australian miner of mineral sands whose products are used in a range of industrial and consumer applications. In a period when the market resoundingly recognized the favorable industry supply/ demand dynamics, Iluka was able to capitalize on its position of strength, raising prices significantly. The company’s share price more than doubled over the period, validating an investment thesis we had formalized in 2004 and nurtured since then. Another beneficiary of these market conditions was U.K.-listed Kenmare Resources, also a producer of these esoteric minerals.
The more economically sensitive holdings in the portfolio detracted from performance. Critically, however, our decisions to decrease or, in certain cases, eliminate select holdings reduced the impact. Share prices for French-listed Eramet and Canadian-listed Sherritt International fell meaningfully during the period because of company-specific factors along with the weakening demand that hurt nickel prices. Concerns persisted regarding Sherritt’s Ambatovy nickel project in Madagascar, with further capital expenditure placing an increasing financial strain on the company.
U.K.-listed platinum producer Lonmin, with assets in South Africa, was another detractor from performance. Given increasing energy shortages and an active miners’ trade union, the operational environment for labor- and energy-intensive platinum producers such as Lonmin has become progressively more challenging. German potash and salt producer K+S had a tough year owing to falling potash prices and a warm winter that softened demand for salt.
9
It was also a difficult time for Australian coal and iron ore producer Aquila Resources, which saw production halted by adverse weather conditions and faced additional cash-flow pressures arising from a lengthy dispute with its Brazilian joint venture partner, Vale. Shares in Australian copper miner OZ Minerals and Singaporean commodities trader Noble Group also declined.
Purchases and sales
During the period, we increased the fund’s positions in several well-managed, cash-generative gold mining companies that display return-focused business models, including Australia-based Medusa Mining and Canadian-listed Alacer Gold, Centerra Gold, and Eldorado Gold. We also added to our holding in K+S as its share price declined on short-term pricing pressures. We have confidence in K+S management, which continues to maintain a substantial global market share through careful investment in economically attractive mines.
We purchased additional shares in Aquila Resources as the market continued to undervalue the company’s potential despite its encouraging progress with development projects. We increased our allocation to Belgium-based Umicore, which, through its innovative processing plant, has become a pioneer in the recycling of multiple metals and minerals.
Other, less substantial, purchases were made in a select group of small-cap miners with exciting growth potential and capable management teams. We continue to carry out detailed research to uncover miners of esoteric minerals benefiting from high-quality, low-cost assets and favorable industry supply/demand dynamics. Among the new holdings were Australian companies Ivanhoe Australia, which has a diverse portfolio of unusual metals and minerals, and Galaxy Resources, which focuses on lithium mining.
Sales during the period focused on holdings that were cyclical in nature but that also—crucially—faced operational headwinds. We eliminated our holdings in platinum producers Northam Platinum and Lonmin, each of which has assets based in the challenging operational environment of South Africa. In the case of Lonmin, the company’s inability to introduce effective safety measures also contributed to our decision to exit the position.
Canadian coal and nickel producer Sherritt International and French nickel and manganese producer Eramet also have left the portfolio, as ongoing operational disappointments reduced our confidence in the companies’ ability to generate superior returns. Following a phenomenal year that rewarded our high expectations for Iluka Resources, we sold much of our position, but the company still has a meaningful weighting in the portfolio.
10
Looking ahead
We continue to believe that the appetite for a broad range of commodities will be supported over many years by infrastructure expenditure worldwide, as well as by industrialization and rising urbanization in developing markets. We shall be closely monitoring individual companies’ success in dealing with issues such as dividend policy within the gold industry, rising taxation across the mining spectrum, and labor relations as workers jostle for their share of natural resources profits.
However, we remain convinced of the merits of sticking to our long-term principles and focusing both on company fundamentals and on structural supply/ demand imbalances for selected metals and minerals. In light of ongoing uncertainty about the economic outlook, we shall continue to invest in financially sound, well-managed companies with strategically important assets whose value is not properly appreciated by investors. Finally, we believe strongly that being a shareholder of a business is synonymous with being an owner, and we seek companies that share our philosophy.
Portfolio Managers:
Graham E. French
Matthew Vaight, UKSIP
M&G Investment Management Ltd.
February 16, 2012
11
Precious Metals and Mining Fund
Fund Profile
As of January 31, 2012
| | | |
| Portfolio Characteristics | | |
| | | S&P | |
| | | Precious | DJ |
| | | Metals and | U.S. Total |
| | | Mining | Market |
| | Fund | Index | Index |
| Number of Stocks | 45 | 424 | 3,738 |
| Median Market Cap | $2.8B | $27.4B | $32.6B |
| Price/Earnings Ratio | 20.8x | 12.4x | 15.5x |
| Price/Book Ratio | 2.6x | 2.1x | 2.2x |
| Return on Equity | 3.3% | 16.6% | 19.1% |
| Earnings Growth Rate 15.6% | 5.7% | 7.1% |
| Dividend Yield | 1.3% | 1.6% | 2.0% |
| Foreign Holdings | 89.0% | 89.0% | 0.0% |
| Turnover Rate | 22% | — | — |
| Ticker Symbol | VGPMX | — | — |
| Expense Ratio1 | 0.27% | — | — |
| Short-Term Reserves | 0.7% | — | — |
| |
| |
| |
| Market Diversification (% of equity exposure) |
| |
| Europe | | | |
| United Kingdom | | | 9.6% |
| France | | | 4.6 |
| Germany | | | 3.7 |
| Belgium | | | 1.7 |
| Other | | | 0.2 |
| Subtotal | | | 19.8% |
| Pacific | | | |
| Australia | | | 27.5% |
| Singapore | | | 3.1 |
| Subtotal | | | 30.6% |
| Emerging Markets | | | 0.6% |
| North America | | | |
| Canada | | | 38.0% |
| United States | | | 11.0 |
| Subtotal | | | 49.0% |
| | |
| Volatility Measures | | |
| | S&P | |
| | Precious | DJ |
| | Metals and | U.S. Total |
| | Mining | Market |
| | Index | Index |
| R-Squared | 0.94 | 0.59 |
| Beta | 1.05 | 1.34 |
| These measures show the degree and timing of the fund’s fluctuations compared with the indexes over 36 months. |
|
| |
| Ten Largest Holdings (% of total net assets) |
| Newmont Mining Corp. | Gold | 8.9% |
| Centerra Gold Inc. | Gold | 8.5 |
| Hochschild Mining plc | Precious Metals & |
| | Minerals | 7.2 |
| Nevsun Resources Ltd. | Gold | 5.7 |
| Alacer Gold Corp. | Gold | 5.4 |
| NovaGold Resources | | |
| Inc. | Gold | 5.0 |
| Aquila Resources Ltd. | Coal & Consumable |
| | Fuels | 4.8 |
| Imerys SA | Construction | |
| | Materials | 4.6 |
| OZ Minerals Ltd. | Diversified Metals | |
| | & Mining | 4.5 |
| Eldorado Gold Corp. | Gold | 4.1 |
| Top Ten | | 58.7% |
The holdings listed exclude any temporary cash investments and equity index products.
Allocation by Region (% of equity exposure)
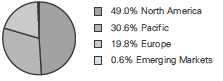
1 The expense ratio shown is from the prospectus dated May 26, 2011, and represents estimated costs for the current fiscal year. For the fiscal year ended January 31, 2012, the expense ratio was 0.29%.
12
Precious Metals and Mining Fund
Performance Summary
All of the returns in this report represent past performance, which is not a guarantee of future results that may be achieved by the fund. (Current performance may be lower or higher than the performance data cited. For performance data current to the most recent month-end, visit our website at vanguard.com/performance.) Note, too, that both investment returns and principal value can fluctuate widely, so an investor’s shares, when sold, could be worth more or less than their original cost. The returns shown do not reflect taxes that a shareholder would pay on fund distributions or on the sale of fund shares.
Cumulative Performance: January 31, 2002, Through January 31, 2012
Initial Investment of $10,000
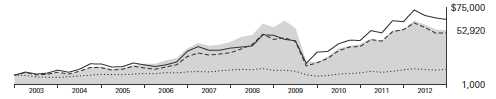
| | | | |
| | | Average Annual Total Returns | |
| | | Periods Ended January 31, 2012 | |
| | | | | Final Value |
| | One | Five | Ten | of a $10,000 |
| | Year | Years | Years | Investment |
| Precious Metals and Mining Fund | -0.97% | 4.92% | 18.13% | $52,920 |
| Dow Jones U.S. Total Stock Market | | | | |
| Index | 3.55 | 0.88 | 4.55 | 15,604 |
| Spliced Precious Metals and Mining | | | | |
| Index | -5.66 | 9.94 | 17.59 | 50,544 |
| Precious Metal Funds Average | 3.41 | 12.01 | 20.25 | 63,237 |
Spliced Precious Metals and Mining Index: S&P/Citigroup World Equity Gold Index through June 30, 2005; S&P Custom Precious Metals and Mining Index thereafter.
Precious Metal Funds Average: Derived from data provided by Lipper Inc.
Vanguard fund returns do not reflect the 1% fee on redemptions of shares held for less than one year.
See Financial Highlights for dividend and capital gains information.
13
Precious Metals and Mining Fund
Fiscal-Year Total Returns (%): January 31, 2002, Through January 31, 2012
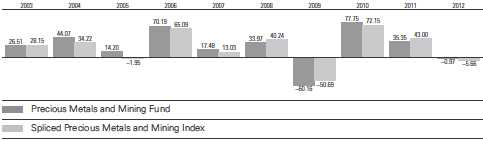
Average Annual Total Returns: Periods Ended December 31, 2011
This table presents returns through the latest calendar quarter—rather than through the end of the fiscal period.
Securities and Exchange Commission rules require that we provide this information.
| | | | |
| | Inception | One | Five | Ten |
| | Date | Year | Years | Years |
| Precious Metals and Mining Fund | 5/23/1984 | -21.70% | 2.60% | 17.57% |
Vanguard fund returns do not reflect the 1% fee on redemptions of shares held for less than one year.
14
Precious Metals and Mining Fund
Financial Statements
Statement of Net Assets
As of January 31, 2012
The fund reports a complete list of its holdings in regulatory filings four times in each fiscal year, at the quarter-ends. For the second and fourth fiscal quarters, the lists appear in the fund’s semiannual and annual reports to shareholders. For the first and third fiscal quarters, the fund files the lists with the Securities and Exchange Commission on Form N-Q. Shareholders can look up the fund’s Forms N-Q on the SEC’s website at sec.gov. Forms N-Q may also be reviewed and copied at the SEC’s Public Reference Room (see the back cover of this report for further information).
| | | |
| | | | Market |
| | | | Value |
| | | Shares | ($000) |
| Common Stocks (99.4%) | | |
| Australia (27.4%) | | |
| *,^,1Aquila Resources Ltd. | 33,165,000 | 211,654 |
| 1 | OZ Minerals Ltd. | 17,200,000 | 199,102 |
| | Iluka Resources Ltd. | 9,050,000 | 175,865 |
| 1 | Medusa Mining Ltd. | 25,250,000 | 144,972 |
| *,1 | St. Barbara Ltd. | 51,000,000 | 126,529 |
| *,1 | Resolute Mining Ltd. | 51,965,029 | 112,781 |
| *,1 | Cudeco Ltd. | 14,576,547 | 55,382 |
| *,1 | Discovery Metals Ltd. | 25,000,000 | 40,996 |
| * | Ivanhoe Australia Ltd. | 19,600,000 | 39,210 |
| 1 | Panoramic Resources | | |
| | Ltd. | 19,700,000 | 27,580 |
| *,1 | Galaxy Resources Ltd. | 26,363,638 | 24,581 |
| *,1 | Equatorial Resources | | |
| | Ltd. | 6,250,000 | 15,509 |
| *,1 | Reed Resources Ltd. | 24,000,000 | 9,921 |
| *,1 | Glory Resources Ltd. | 33,500,000 | 8,711 |
| * | Gindalbie Metals Ltd. | 8,000,000 | 5,305 |
| *,1 | Apex Minerals NL | 624,120,369 | 3,979 |
| *,1 | Speewah Metals Ltd. | 13,500,000 | 3,430 |
| *,1 | Kumarina Resources | | |
| | Ltd. | 9,300,000 | 2,567 |
| *,1 | Drummond Gold Ltd. | 35,000,000 | 929 |
| * | Zambezi Resources Ltd. | 4,895,833 | 57 |
| * | MIL Resources Ltd. | 2,685,873 | 46 |
| | | | 1,209,106 |
| Belgium (1.7%) | | |
| | Umicore SA | 1,600,000 | 74,532 |
| |
| Canada (37.6%) | | |
| 1 | Centerra Gold Inc. | 18,950,000 | 375,144 |
| 1 | Nevsun Resources Ltd. | 38,500,000 | 253,032 |
| *,1 | Alacer Gold Corp. | 25,350,000 | 239,924 |
| *,^,1NovaGold Resources | | |
| | Inc. | 21,200,000 | 219,420 |
| ^ | Eldorado Gold Corp. | 12,000,000 | 181,789 |
| *,1 | Minefinders Corp. | 12,200,000 | 172,996 |
| *,1 | Harry Winston | | |
| | Diamond Corp. | 9,500,000 | 111,135 |
| | | |
| | | | Market |
| | | | Value |
| | | Shares | ($000) |
| 1 | SEMAFO Inc. | 14,700,000 | 98,225 |
| * | Claude Resources Inc. | 2,400,000 | 3,360 |
| * | Bear Creek Mining Corp. | 750,000 | 2,760 |
| * | Belo Sun Mining Corp. | 2,000,000 | 2,254 |
| * | Lake Shore Gold Corp. | 1,000,000 | 1,476 |
| | | | 1,661,515 |
| France (4.6%) | | |
| | Imerys SA | 3,650,000 | 203,780 |
| |
| Germany (3.7%) | | |
| | K&S AG | 3,400,000 | 162,545 |
| |
| Indonesia (0.1%) | | |
| | Vale Indonesia Tbk | 6,500,000 | 2,886 |
| |
| Ireland (0.2%) | | |
| * | Kenmare Resources plc | 13,627,035 | 10,297 |
| |
| Papua New Guinea (0.0%) | | |
| * | Bougainville Copper Ltd. | 2,000,000 | 1,402 |
| |
| Russia (0.5%) | | |
| | Uralkali OJSC GDR | 650,000 | 23,216 |
| |
| Singapore (3.1%) | | |
| | Noble Group Ltd. | 127,180,353 | 135,750 |
| |
| United Kingdom (9.6%) | | |
| 1 | Hochschild Mining plc | 40,500,000 | 315,742 |
| | Petropavlovsk plc | 9,000,000 | 107,705 |
| | | | 423,447 |
| United States (10.9%) | | |
| | Newmont Mining Corp. | 6,400,000 | 393,472 |
| 1 | AMCOL International Corp. | 3,080,000 | 87,965 |
| | | | |
| | | | 481,437 |
| Total Common Stocks | | |
| (Cost $3,702,462) | | 4,389,913 |
15
| | |
| Precious Metals and Mining Fund | |
| |
| |
| | | Market |
| | | Value |
| | Shares | ($000) |
| Precious Metals (0.1%) | |
| * Platinum Bullion | | |
| (In Troy Ounces) | 2,009 | 3,183 |
| Total Precious Metals | | |
| (Cost $1,213) | | 3,183 |
| Temporary Cash Investment (3.9%) | |
| Money Market Fund (3.9%) | |
| 2,3 Vanguard Market Liquidity | |
| Fund, 0.096% | | |
| (Cost $170,701) | 170,701,267 | 170,701 |
| Total Investments (103.4%) | |
| (Cost $3,874,376) | | 4,563,797 |
| Other Assets and Liabilities (-3.4%) | |
| Other Assets | | 6,698 |
| Liabilities3 | | (155,198) |
| | | (148,500) |
| Net Assets (100%) | | |
| Applicable to 199,381,543 outstanding | |
| $.001 par value shares of beneficial | |
| interest (unlimited authorization) | 4,415,297 |
| Net Asset Value Per Share | $22.14 |
| |
| Statement of Assets and Liabilities | |
| Assets | | |
| Investments in Securities, at Value | 4,563,797 |
| Other Assets | | 6,698 |
| Total Assets | | 4,570,495 |
| Liabilities | | |
| Security Lending Collateral Payable | |
| to Brokers | | 139,049 |
| Other Liabilities | | 16,149 |
| Total Liabilities | | 155,198 |
| Net Assets | | 4,415,297 |
| |
| At January 31, 2012, net assets consisted of: |
| | Amount |
| | ($000) |
| Paid-in Capital | 3,834,919 |
| Overdistributed Net Investment Income | (168,670) |
| Accumulated Net Realized Gains | 59,633 |
| Unrealized Appreciation (Depreciation) | |
| Investment Securities | 689,421 |
| Foreign Currencies | (6) |
| Net Assets | 4,415,297 |
See Note A in Notes to Financial Statements.
* Non-income-producing security.
^ Part of security position is on loan to broker-dealers. The total value of securities on loan is $131,582,000.
1 Considered an affiliated company of the fund as the fund owns more than 5% of the outstanding voting securities of such company.
2 Affiliated money market fund available only to Vanguard funds and certain trusts and accounts managed by Vanguard. Rate shown is the 7-day yield.
3 Includes $139,049,000 of collateral received for securities on loan.
GDR—Global Depositary Receipt.
See accompanying Notes, which are an integral part of the Financial Statements.
16
Precious Metals and Mining Fund
Statement of Operations
| |
| | Year Ended |
| | January 31, 2012 |
| | ($000) |
| Investment Income | |
| Income | |
| Dividends1,2 | 87,637 |
| Interest2 | 143 |
| Security Lending | 2,465 |
| Total Income | 90,245 |
| Expenses | |
| Investment Advisory Fees—Note B | |
| Basic Fee | 5,866 |
| Performance Adjustment | (1,456) |
| The Vanguard Group—Note C | |
| Management and Administrative | 8,204 |
| Marketing and Distribution | 1,074 |
| Custodian Fees | 478 |
| Auditing Fees | 25 |
| Shareholders’ Reports | 50 |
| Trustees’ Fees and Expenses | 11 |
| Total Expenses | 14,252 |
| Net Investment Income | 75,993 |
| Realized Net Gain (Loss) | |
| Investment Securities Sold2 | 397,148 |
| Foreign Currencies | (2,814) |
| Realized Net Gain (Loss) | 394,334 |
| Change in Unrealized Appreciation (Depreciation) | |
| Investment Securities | (524,171) |
| Foreign Currencies | (140) |
| Change in Unrealized Appreciation (Depreciation) | (524,311) |
| Net Increase (Decrease) in Net Assets Resulting from Operations | (53,984) |
1 Dividends are net of foreign withholding taxes of $2,876,000.
2 Dividend income, interest income, and realized net gain (loss) from affiliated companies of the fund were $63,897,000, $143,000, and $290,646,000, respectively.
See accompanying Notes, which are an integral part of the Financial Statements.
17
Precious Metals and Mining Fund
Statement of Changes in Net Assets
| | |
| | Year Ended January 31, |
| | 2012 | 2011 |
| | ($000) | ($000) |
| Increase (Decrease) in Net Assets | | |
| Operations | | |
| Net Investment Income | 75,993 | 26,820 |
| Realized Net Gain (Loss) | 394,334 | 138,087 |
| Change in Unrealized Appreciation (Depreciation) | (524,311) | 1,089,283 |
| Net Increase (Decrease) in Net Assets Resulting from Operations | (53,984) | 1,254,190 |
| Distributions | | |
| Net Investment Income | (24,181) | (221,507) |
| Realized Capital Gain | (276,223) | (38,436) |
| Total Distributions | (300,404) | (259,943) |
| Capital Share Transactions | | |
| Issued | 741,011 | 1,200,221 |
| Issued in Lieu of Cash Distributions | 277,838 | 239,830 |
| Redeemed1 | (1,279,248) | (1,088,329) |
| Net Increase (Decrease) from Capital Share Transactions | (260,399) | 351,722 |
| Total Increase (Decrease) | (614,787) | 1,345,969 |
| Net Assets | | |
| Beginning of Period | 5,030,084 | 3,684,115 |
| End of Period2 | 4,415,297 | 5,030,084 |
1 Net of redemption fees for fiscal 2012 and 2011 of $2,635,000 and $2,999,000, respectively.
2 Net Assets—End of Period includes undistributed (overdistributed) net investment income of ($168,670,000) and ($227,207,000).
See accompanying Notes, which are an integral part of the Financial Statements.
18
Precious Metals and Mining Fund
Financial Highlights
| | | | | |
| For a Share Outstanding | | | Year Ended January 31, |
| Throughout Each Period | 2012 | 2011 | 2010 | 2009 | 2008 |
| Net Asset Value, Beginning of Period | $24.15 | $18.74 | $10.74 | $33.45 | $28.64 |
| Investment Operations | | | | | |
| Net Investment Income | .3341 | .181 | .0932 | .653 | .9002 |
| Net Realized and Unrealized Gain (Loss) | | | | | |
| on Investments3 | (.760) | 6.521 | 8.207 | (19.849) | 8.362 |
| Total from Investment Operations | (.426) | 6.702 | 8.300 | (19.196) | 9.262 |
| Distributions | | | | | |
| Dividends from Net Investment Income | (.123) | (1.101) | (.300) | (.763) | (.670) |
| Distributions from Realized Capital Gains | (1.461) | (.191) | — | (2.751) | (3.782) |
| Total Distributions | (1.584) | (1.292) | (.300) | (3.514) | (4.452) |
| Net Asset Value, End of Period | $22.14 | $24.15 | $18.74 | $10.74 | $33.45 |
| |
| Total Return4 | -0.97% | 35.35% | 77.75% | -60.16% | 33.97% |
| |
| Ratios/Supplemental Data | | | | | |
| Net Assets, End of Period (Millions) | $4,415 | $5,030 | $3,684 | $1,644 | $4,635 |
| Ratio of Total Expenses to | | | | | |
| Average Net Assets5 | 0.29% | 0.27% | 0.27% | 0.30% | 0.28% |
| Ratio of Net Investment Income to | | | | | |
| Average Net Assets | 1.54%1 | 0.61% | 0.59%2 | 2.17% | 2.70%2 |
| Portfolio Turnover Rate | 22% | 34% | 17% | 22% | 29% |
1 Net investment income per share and the ratio of net investment income to average net assets include $.103 and 0.40%, respectively, resulting from a special dividend from OZ Minerals Ltd. in May 2011.
2 Net investment income per share and the ratio of net investment income to average net assets for the year ended January 31, 2008, include $0.190 and 0.65%, respectively, resulting from a special dividend from Centennial Coal Co. Ltd. in January 2008. Based on additional information reported by the company in 2009, a portion of the special dividend was reallocated to return of capital. The reallocation reduced net investment income per share and the ratio of net investment income to average net assets for the year ended January 31, 2010, by $.134 and 0.90% respectively. The reallocation has no impact on net assets, net asset values per share, or total returns.
3 Includes increases from redemption fees of $.01, $.01, $.01, $.01, and $.01.
4 Total returns do not include transaction or account service fees that may have applied in the periods shown. Fund prospectuses provide information about any applicable transaction and account service fees.
5 Includes performance-based investment advisory fee increases (decreases) of (0.03%), (0.05%), (0.08%), 0.00%, and (0.01%).
See accompanying Notes, which are an integral part of the Financial Statements.
19
Precious Metals and Mining Fund
Notes to Financial Statements
Vanguard Precious Metals and Mining Fund is registered under the Investment Company Act of 1940 as an open-end investment company, or mutual fund. The fund invests in securities of foreign issuers, which may subject it to investment risks not normally associated with investing in securities of United States corporations.
A. The following significant accounting policies conform to generally accepted accounting principles for U.S. mutual funds. The fund consistently follows such policies in preparing its financial statements.
1. Security Valuation: Securities are valued as of the close of trading on the New York Stock Exchange (generally 4 p.m., Eastern time) on the valuation date. Equity securities are valued at the latest quoted sales prices or official closing prices taken from the primary market in which each security trades; such securities not traded on the valuation date are valued at the mean of the latest quoted bid and asked prices. Securities for which market quotations are not readily available, or whose values have been affected by events occurring before the fund’s pricing time but after the close of the securities’ primary markets, are valued at their fair values calculated according to procedures adopted by the board of trustees. These procedures include obtaining quotations from an independent pricing service, monitoring news to identify significant market- or security-specific events, and evaluating changes in the values of foreign market proxies (for example, ADRs, futures contracts, or exchange-traded funds), between the time the foreign markets close and the fund’s pricing time. When fair-value pricing is employed, the prices of securities used by a fund to calculate its net asset value may differ from quoted or published prices for the same securities. Precious metals are valued at the mean of the latest quoted bid and asked prices. Investments in Vanguard Market Liquidity Fund are valued at that fund’s net asset value.
2. Foreign Currency: Securities and other assets and liabilities denominated in foreign currencies are translated into U.S. dollars using exchange rates obtained from an independent third party as of the fund’s pricing time on the valuation date. Realized gains (losses) and unrealized appreciation (depreciation) on investment securities include the effects of changes in exchange rates since the securities were purchased, combined with the effects of changes in security prices. Fluctuations in the value of other assets and liabilities resulting from changes in exchange rates are recorded as unrealized foreign currency gains (losses) until the assets or liabilities are settled in cash, at which time they are recorded as realized foreign currency gains (losses).
3. Federal Income Taxes: The fund intends to continue to qualify as a regulated investment company and distribute all of its taxable income. Management has analyzed the fund’s tax positions taken for all open federal income tax years (January 31, 2009–2012), and has concluded that no provision for federal income tax is required in the fund’s financial statements.
4. Distributions: Distributions to shareholders are recorded on the ex-dividend date.
5. Security Lending: The fund may lend its securities to qualified institutional borrowers to earn additional income. Security loans are required to be secured at all times by collateral at least equal to the market value of securities loaned. The fund invests cash collateral received in Vanguard Market Liquidity Fund, and records a liability for the return of the collateral, during the period the securities are on loan. Security lending income represents fees charged to borrowers plus income earned on investing cash collateral, less expenses associated with the loan.
20
Precious Metals and Mining Fund
6. Other: Dividend income is recorded on the ex-dividend date. Interest income includes income distributions received from Vanguard Market Liquidity Fund and is accrued daily. Security transactions are accounted for on the date securities are bought or sold. Costs used to determine realized gains (losses) on the sale of investment securities are those of the specific securities sold. Fees assessed on redemptions of capital shares are credited to paid-in capital.
B. M&G Investment Management Ltd. provides investment advisory services to the fund for a fee calculated at an annual percentage rate of average net assets. The basic fee is subject to quarterly adjustments based on the fund’s performance for the preceding three years relative to the S&P Custom Precious Metals and Mining Index. For the year ended January 31, 2012, the investment advisory fee represented an effective annual basic rate of 0.12% of the fund’s average net assets before a decrease of $1,456,000 (0.03%) based on performance.
C. The Vanguard Group furnishes at cost corporate management, administrative, marketing, and distribution services. The costs of such services are allocated to the fund under methods approved by the board of trustees. The fund has committed to provide up to 0.40% of its net assets in capital contributions to Vanguard. At January 31, 2012, the fund had contributed capital of $625,000 to Vanguard (included in Other Assets), representing 0.01% of the fund’s net assets and 0.25% of Vanguard’s capitalization. The fund’s trustees and officers are also directors and officers of Vanguard.
D. Various inputs may be used to determine the value of the fund’s investments. These inputs are summarized in three broad levels for financial statement purposes. The inputs or methodologies used to value securities are not necessarily an indication of the risk associated with investing in those securities.
Level 1—Quoted prices in active markets for identical securities.
Level 2—Other significant observable inputs (including quoted prices for similar securities, interest rates, prepayment speeds, credit risk, etc.).
Level 3—Significant unobservable inputs (including the fund’s own assumptions used to determine the fair value of investments).
The following table summarizes the market value of the fund’s investments as of January 31, 2012, based on the inputs used to value them:
| | | |
| | Level 1 | Level 2 | Level 3 |
| Investments | ($000) | ($000) | ($000) |
| Common Stocks—North America | 2,142,952 | — | — |
| Common Stocks—Other | — | 2,246,961 | — |
| Precious Metals | 3,183 | — | — |
| Temporary Cash Investments | 170,701 | — | — |
| Total | 2,316,836 | 2,246,961 | — |
E. Distributions are determined on a tax basis and may differ from net investment income and realized capital gains for financial reporting purposes. Differences may be permanent or temporary. Permanent differences are reclassified among capital accounts in the financial statements to reflect their tax character. Temporary differences arise when certain items of income, expense, gain, or loss are recognized in different periods for financial statement and tax purposes; these differences will reverse at some time in the future. Differences in classification may also result from the treatment of short-term gains as ordinary income for tax purposes.
21
Precious Metals and Mining Fund
During the year ended January 31, 2012, the fund realized net foreign currency losses of $2,814,000, which decreased distributable net income for tax purposes; accordingly, such losses have been reclassified from accumulated net realized gains to overdistributed net investment income.
Certain of the fund’s investments are in securities considered to be “passive foreign investment companies,” for which any unrealized appreciation and/or realized gains are required to be included in distributable net income for tax purposes. During the year ended January 31, 2012, the fund realized gains on the sale of passive foreign investment companies of $13,775,000, which have been included in current and prior periods’ taxable income; accordingly, such gains have been reclassified from accumulated net realized gains to overdistributed net investment income. Unrealized appreciation of $156,680,000 on the fund’s passive foreign investment company holdings through October 31, 2011 (the most recent previous mark-to-market date for tax purposes), has been distributed and is reflected in the balance of overdistributed net investment income. Since October 31, 2011, unrealized appreciation on passive foreign investment companies holdings increased by $66,793,000, increasing the amount of taxable income available for distribution as of January 31, 2012. Unrealized appreciation on the fund’s passive foreign investment company holdings at January 31, 2012, was $223,473,000.
The fund used a tax accounting practice to treat a portion of the price of capital shares redeemed during the year as distributions from net investment income and realized capital gains. Accordingly, the fund has reclassified $4,236,000 from overdistributed net investment income, and $18,378,000 from accumulated net realized gains, to paid-in capital.
For tax purposes, at January 31, 2012, the fund had $62,700,000 of ordinary income and $59,633,000 of long-term capital gains available for distribution.
At January 31, 2012, the cost of investment securities for tax purposes was $4,097,849,000. Net unrealized appreciation of investment securities for tax purposes was $465,948,000, consisting of unrealized gains of $797,695,000 on securities that had risen in value since their purchase and $331,747,000 in unrealized losses on securities that had fallen in value since their purchase.
F. During the year ended January 31, 2012, the fund purchased $1,067,970,000 of investment securities and sold $1,504,548,000 of investment securities, other than temporary cash investments.
G. Capital shares issued and redeemed were:
| | |
| | Year Ended January 31, |
| | 2012 | 2011 |
| | Shares | Shares |
| | (000) | (000) |
| Issued | 29,915 | 51,798 |
| Issued in Lieu of Cash Distributions | 14,027 | 9,325 |
| Redeemed | (52,827) | (49,471) |
| Net Increase (Decrease) in Shares Outstanding | (8,885) | 11,652 |
22
Precious Metals and Mining Fund
H. Certain of the fund’s investments are in companies that are considered to be affiliated companies of the fund because the fund owns more than 5% of the outstanding voting securities of the company. Transactions during the period in securities of these companies were as follows:
| | | | | |
| | | | Current Period Transactions | |
| Jan. 31, 2011 | | Proceeds from | | Jan. 31, 2012 |
| | Market | Purchases | Securities | Dividend | Market |
| | Value | at Cost | Sold | Income | Value |
| | ($000) | ($000) | ($000) | ($000) | ($000) |
| Alacer Gold Corp. | NA1 | 58,397 | — | — | 239,924 |
| AMCOL International Corp. | 92,154 | — | — | 2,218 | 87,965 |
| Anatolia Minerals Development Ltd. | 127,401 | — | — | — | NA1 |
| Apex Minerals NL | 8,648 | 2,857 | — | — | 3,979 |
| Aquila Resources Ltd. | 241,802 | 31,537 | — | — | 211,654 |
| Centerra Gold Inc. | 288,870 | 18,237 | — | 6,305 | 375,144 |
| Cudeco Ltd. | 45,365 | 6,556 | — | — | 55,382 |
| Discovery Metals Ltd. | — | 41,346 | — | — | 40,996 |
| Drummond Gold Ltd. | 2,002 | 805 | — | — | 929 |
| Equatorial Resources Ltd. | 16,927 | 3,833 | — | — | 15,509 |
| Galaxy Resources Ltd. | — | 26,782 | — | — | 24,581 |
| Glory Resources Ltd. | — | 8,611 | — | — | 8,711 |
| Harry Winston Diamond Corp. | 105,450 | — | 3,910 | — | 111,135 |
| Hochschild Mining plc | 315,318 | — | — | 2,371 | 315,742 |
| Iluka Resources Ltd. | 358,880 | — | 526,282 | 6,660 | NA2 |
| Imerys SA | 257,069 | — | 18,295 | 5,432 | NA2 |
| Kumarina Resources Ltd. | — | 2,332 | — | — | 2,567 |
| Medusa Mining Ltd. | 92,107 | 91,493 | — | 1,623 | 144,972 |
| Minefinders Corp. | 56,202 | 87,236 | — | — | 172,996 |
| Nevsun Resources Ltd. | 229,920 | — | — | 2,669 | 253,032 |
| NovaGold Resources Inc. | — | 212,937 | 1,029 | — | 219,420 |
| OZ Minerals Ltd. | 275,736 | 16,674 | 7,542 | 34,082 | 199,102 |
| Panoramic Resources Ltd. | 46,214 | — | — | 1,193 | 27,580 |
| Reed Resources Ltd. | — | 12,591 | — | — | 9,921 |
| Resolute Mining Ltd. | 69,127 | — | — | — | 112,781 |
| SEMAFO Inc. | 198,122 | — | 39,184 | 244 | 98,225 |
| Sherritt International Corp. | 169,982 | — | 114,397 | 1,100 | — |
| Speewah Metals Ltd. | — | 4,983 | — | — | 3,430 |
| St. Barbara Ltd. | 97,094 | — | — | — | 126,529 |
| | 3,094,390 | | | 63,897 | 2,862,206 |
1 Not applicable—In February 2011, Anatolia Minerals Development Ltd. merged into Alacer Gold Corp.
2 Not applicable—At January 31, 2012, the security was still held, but the issuer was no longer an affiliated company of the fund.
I. In preparing the financial statements as of January 31, 2012, management considered the impact of subsequent events for potential recognition or disclosure in these financial statements.
23
Report of Independent Registered
Public Accounting Firm
To the Trustees of Vanguard Specialized Funds and the Shareholders of Vanguard Precious Metals and Mining Fund: In our opinion, the accompanying statement of net assets and statement of assets and liabilities and the related statements of operations and of changes in net assets and the financial highlights present fairly, in all material respects, the financial position of Vanguard Precious Metals and Mining Fund (constituting a separate portfolio of Vanguard Specialized Funds, hereafter referred to as the “Fund”) at January 31, 2012, the results of its operations for the year then ended, the changes in its net assets for each of the two years in the period then ended and the financial highlights for each of five years in the period then ended, in conformity with accounting principles generally accepted in the United States of America. These financial statements and financial highlights (hereafter referred to as “financial statements”) are the responsibility of the Fund’s management; our responsibility is to express an opinion on these financial statements based on our audits. We conducted our audits of these financial statements in accordance with the standards of the Public Company Accounting Oversight Board (United States). Those standards require that we plan and perform the audit to obtain reasonable assurance about whether the financial statements are free of material misstatement. An audit includes examining, on a test basis, evidence supporting the amounts and disclosures in the financial statements, assessing the accounting principles used and significant estimates made by management, and evaluating the overall financial statement presentation. We believe that our audits, which included confirmation of securities at January 31, 2012 by correspondence with the custodian and by agreement to the underlying ownership records of Vanguard Market Liquidity Fund, provide a reasonable basis for our opinion.
PricewaterhouseCoopers LLP
Philadelphia, Pennsylvania
March 12, 2012
|
| Special 2011 tax information (unaudited) for Vanguard Precious Metals and Mining Fund |
This information for the fiscal year ended January 31, 2012, is included pursuant to provisions of the Internal Revenue Code.
The fund distributed $294,602,000 as capital gain dividends (from net long-term capital gains) to shareholders during the fiscal year.
The fund distributed $24,181,000 of qualified dividend income to shareholders during the fiscal year.
For corporate shareholders, 11.2% of investment income (dividend income plus short-term gains, if any) qualifies for the dividends-received deduction.
The fund designates to shareholders foreign source income of $63,141,000 and foreign taxes paid of $2,651,000. Shareholders received more detailed information with their Form 1099-DIV in January 2012 to determine the calendar-year amounts to be included on their 2011 tax returns.
24
Your Fund’s After-Tax Returns
This table presents returns for your fund both before and after taxes. The after-tax returns are shown in two ways: (1) assuming that an investor owned the fund during the entire period and paid taxes on the fund’s distributions, and (2) assuming that an investor paid taxes on the fund’s distributions and sold all shares at the end of each period.
Calculations are based on the highest individual federal income tax and capital gains tax rates in effect at the times of the distributions and the hypothetical sales. State and local taxes were not considered. After-tax returns reflect any qualified dividend income , using actual prior-year figures and estimates for 2012. (In the example, returns after the sale of fund shares may be higher than those assuming no sale. This occurs when the sale would have produced a capital loss. The calculation assumes that the investor received a tax deduction for the loss.) Please note that your actual after-tax returns will depend on your tax situation and may differ from those shown. Also note that if you own the fund in a tax-deferred account, such as an individual retirement account or a 401(k) plan, this information does not apply to you. Such accounts are not subject to current taxes.
Finally, keep in mind that a fund’s performance—whether before or after taxes—does not guarantee future results.
Average Annual Total Returns: Precious Metals and Mining Fund
Periods Ended January 31, 2012
| | | |
| | One | Five | Ten |
| | Year | Years | Years |
| Returns Before Taxes | -0.97% | 4.92% | 18.13% |
| Returns After Taxes on Distributions | -2.04 | 3.24 | 16.34 |
| Returns After Taxes on Distributions and Sale of Fund Shares | 0.64 | 3.77 | 15.72 |
Returns do not reflect the 1% fee on redemptions of shares held for less than one year.
25
About Your Fund’s Expenses
As a shareholder of the fund, you incur ongoing costs, which include costs for portfolio management, administrative services, and shareholder reports (like this one), among others. Operating expenses, which are deducted from a fund’s gross income, directly reduce the investment return of the fund.
A fund’s expenses are expressed as a percentage of its average net assets. This figure is known as the expense ratio. The following examples are intended to help you understand the ongoing costs (in dollars) of investing in your fund and to compare these costs with those of other mutual funds. The examples are based on an investment of $1,000 made at the beginning of the period shown and held for the entire period.
The accompanying table illustrates your fund’s costs in two ways:
• Based on actual fund return. This section helps you to estimate the actual expenses that you paid over the period. The ”Ending Account Value“ shown is derived from the fund‘s actual return, and the third column shows the dollar amount that would have been paid by an investor who started with $1,000 in the fund. You may use the information here, together with the amount you invested, to estimate the expenses that you paid over the period.
To do so, simply divide your account value by $1,000 (for example, an $8,600 account value divided by $1,000 = 8.6), then multiply the result by the number given for your fund under the heading ”Expenses Paid During Period.“
• Based on hypothetical 5% yearly return. This section is intended to help you compare your fund‘s costs with those of other mutual funds. It assumes that the fund had a yearly return of 5% before expenses, but that the expense ratio is unchanged. In this case—because the return used is not the fund’s actual return—the results do not apply to your investment. The example is useful in making comparisons because the Securities and Exchange Commission requires all mutual funds to calculate expenses based on a 5% return. You can assess your fund’s costs by comparing this hypothetical example with the hypothetical examples that appear in shareholder reports of other funds.
Note that the expenses shown in the table are meant to highlight and help you compare ongoing costs only and do not reflect transaction costs incurred by the fund for buying and selling securities. Further, the expenses do not include any purchase, redemption, or account service fees described in the fund prospectus. If such fees were applied to your account, your costs would be higher. Your fund does not carry a “sales load.”
The calculations assume no shares were bought or sold during the period. Your actual costs may have been higher or lower, depending on the amount of your investment and the timing of any purchases or redemptions.
You can find more information about the fund’s expenses, including annual expense ratios, in the Financial Statements section of this report. For additional information on operating expenses and other shareholder costs, please refer to your fund’s current prospectus.
26
| | | |
| Six Months Ended January 31, 2012 | | | |
| | Beginning | Ending | Expenses |
| | Account Value | Account Value | Paid During |
| Precious Metals and Mining Fund | 7/31/2011 | 1/31/2012 | Period |
| Based on Actual Fund Return | $1,000.00 | $909.49 | $1.49 |
| Based on Hypothetical 5% Yearly Return | 1,000.00 | 1,023.64 | 1.58 |
The calculations are based on expenses incurred in the most recent six-month period. The fund’s annualized six-month expense ratio for that period is 0.31%. The dollar amounts shown as “Expenses Paid” are equal to the annualized expense ratio multiplied by the average account value over the period, multiplied by the number of days in the most recent six-month period, then divided by the number of days in the most recent 12-month period.
27
Glossary
Beta. A measure of the magnitude of a fund’s past share-price fluctuations in relation to the ups and downs of a given market index. The index is assigned a beta of 1.00. Compared with a given index, a fund with a beta of 1.20 typically would have seen its share price rise or fall by 12% when the index rose or fell by 10%. For this report, beta is based on returns over the past 36 months for both the fund and the index. Note that a fund’s beta should be reviewed in conjunction with its R-squared (see definition). The lower the R-squared, the less correlation there is between the fund and the index, and the less reliable beta is as an indicator of volatility.
Dividend Yield. Dividend income earned by stocks, expressed as a percentage of the aggregate market value (or of net asset value, for a fund). The yield is determined by dividing the amount of the annual dividends by the aggregate value (or net asset value) at the end of the period. For a fund, the dividend yield is based solely on stock holdings and does not include any income produced by other investments.
Earnings Growth Rate. The average annual rate of growth in earnings over the past five years for the stocks now in a fund.
Equity Exposure. A measure that reflects a fund’s investments in stocks and stock futures. Any holdings in short-term reserves are excluded.
Expense Ratio. A fund’s total annual operating expenses expressed as a percentage of the fund’s average net assets. The expense ratio includes management and administrative expenses, but does not include the transaction costs of buying and selling portfolio securities.
Foreign Holdings. The percentage of a fund represented by securities or depositary receipts of companies based outside the United States.
Inception Date. The date on which the assets of a fund (or one of its share classes) are first invested in accordance with the fund’s investment objective. For funds with a subscription period, the inception date is the day after that period ends. Investment performance is measured from the inception date.
Median Market Cap. An indicator of the size of companies in which a fund invests; the midpoint of market capitalization (market price x shares outstanding) of a fund’s stocks, weighted by the proportion of the fund’s assets invested in each stock. Stocks representing half of the fund’s assets have market capitalizations above the median, and the rest are below it.
Price/Book Ratio. The share price of a stock divided by its net worth, or book value, per share. For a fund, the weighted average price/book ratio of the stocks it holds.
R-Squared. A measure of how much of a fund’s past returns can be explained by the returns from the market in general, as measured by a given index. If a fund’s total returns were precisely synchronized with an index’s returns, its R-squared would be 1.00. If the fund’s returns bore no relationship to the index’s returns, its R-squared would be 0. For this report, R-squared is based on returns over the past 36 months for both the fund and the index.
Return on Equity. The annual average rate of return generated by a company during the past five years for each dollar of shareholder’s equity (net income divided by shareholder’s equity). For a fund, the weighted average return on equity for the companies whose stocks it holds.
28
Short-Term Reserves. The percentage of a fund invested in highly liquid, short-term securities that can be readily converted to cash.
Turnover Rate. An indication of the fund’s trading activity. Funds with high turnover rates incur higher transaction costs and may be more likely to distribute capital gains (which may be taxable to investors). The turnover rate excludes in-kind transactions, which have minimal impact on costs.
29
This page intentionally left blank.
This page intentionally left blank.
The People Who Govern Your Fund
The trustees of your mutual fund are there to see that the fund is operated and managed in your best interests since, as a shareholder, you are a part owner of the fund. Your fund’s trustees also serve on the board of directors of The Vanguard Group, Inc., which is owned by the Vanguard funds and provides services to them on an at-cost basis.
A majority of Vanguard’s board members are independent, meaning that they have no affiliation with Vanguard or the funds they oversee, apart from the sizable personal investments they have made as private individuals. The independent board members have distinguished backgrounds in business, academia, and public service. Each of the trustees and executive officers oversees 181 Vanguard funds.
The following table provides information for each trustee and executive officer of the fund. More information about the trustees is in the Statement of Additional Information, which can be obtained, without charge, by contacting Vanguard at 800-662-7447, or online at vanguard.com.
| |
| Interested Trustee1 | (chemicals); Director of Tyco International, Ltd. |
| | (diversified manufacturing and services) and Hewlett- |
| F. William McNabb III | Packard Co. (electronic computer manufacturing); |
| Born 1957. Trustee Since July 2009. Chairman of the | Senior Advisor at New Mountain Capital; Trustee |
| Board. Principal Occupation(s) During the Past Five | of The Conference Board; Member of the Board of |
| Years: Chairman of the Board of The Vanguard Group, | Managers of Delphi Automotive LLP (automotive |
| Inc., and of each of the investment companies served | components). |
| by The Vanguard Group, since January 2010; Director | |
| of The Vanguard Group since 2008; Chief Executive | Amy Gutmann |
| Officer and President of The Vanguard Group and of | Born 1949. Trustee Since June 2006. Principal |
| each of the investment companies served by The | Occupation(s) During the Past Five Years: President |
| Vanguard Group since 2008; Director of Vanguard | of the University of Pennsylvania; Christopher H. |
| Marketing Corporation; Managing Director of The | Browne Distinguished Professor of Political Science |
| Vanguard Group (1995–2008). | in the School of Arts and Sciences with secondary |
| | appointments at the Annenberg School for Commu- |
| | nication and the Graduate School of Education |
| Independent Trustees | of the University of Pennsylvania; Director of |
| | Carnegie Corporation of New York, Schuylkill River |
| Emerson U. Fullwood | Development Corporation, and Greater Philadelphia |
| Born 1948. Trustee Since January 2008. Principal | Chamber of Commerce; Trustee of the National |
| Occupation(s) During the Past Five Years: Executive | Constitution Center; Chair of the Presidential |
| Chief Staff and Marketing Officer for North America | Commission for the Study of Bioethical Issues. |
| and Corporate Vice President (retired 2008) of Xerox | |
| Corporation (document management products and | JoAnn Heffernan Heisen |
| services); Executive in Residence and 2010 | Born 1950. Trustee Since July 1998. Principal |
| Distinguished Minett Professor at the Rochester | Occupation(s) During the Past Five Years: Corporate |
| Institute of Technology; Director of SPX Corporation | Vice President and Chief Global Diversity Officer |
| (multi-industry manufacturing), the United Way of | (retired 2008) and Member of the Executive |
| Rochester, Amerigroup Corporation (managed health | Committee (1997–2008) of Johnson & Johnson |
| care), the University of Rochester Medical Center, | (pharmaceuticals/consumer products); Director of |
| Monroe Community College Foundation, and North | Skytop Lodge Corporation (hotels), the University |
| Carolina A&T University. | Medical Center at Princeton, the Robert Wood |
| | Johnson Foundation, and the Center for Work Life |
| Rajiv L. Gupta | Policy; Member of the Advisory Board of the |
| Born 1945. Trustee Since December 2001.2 | Maxwell School of Citizenship and Public Affairs |
| Principal Occupation(s) During the Past Five Years: | at Syracuse University. |
| Chairman and Chief Executive Officer (retired 2009) | |
| and President (2006–2008) of Rohm and Haas Co. | |
| | |
| F. Joseph Loughrey | the investment companies served by The Vanguard |
| Born 1949. Trustee Since October 2009. Principal | Group since 2010; Assistant Controller of each of |
| Occupation(s) During the Past Five Years: President | the investment companies served by The Vanguard |
| and Chief Operating Officer (retired 2009) and Vice | Group (2001–2010). | |
| Chairman of the Board (2008–2009) of Cummins Inc. | | |
| (industrial machinery); Director of SKF AB (industrial | Thomas J. Higgins | |
| machinery), Hillenbrand, Inc. (specialized consumer | Born 1957. Chief Financial Officer Since September |
| services), the Lumina Foundation for Education, and | 2008. Principal Occupation(s) During the Past Five |
| Oxfam America; Chairman of the Advisory Council | Years: Principal of The Vanguard Group, Inc.; Chief |
| for the College of Arts and Letters and Member | Financial Officer of each of the investment companies |
| of the Advisory Board to the Kellogg Institute for | served by The Vanguard Group since 2008; Treasurer |
| International Studies at the University of Notre Dame. | of each of the investment companies served by The |
| | Vanguard Group (1998–2008). |
| André F. Perold | | |
| Born 1952. Trustee Since December 2004. Principal | Kathryn J. Hyatt | |
| Occupation(s) During the Past Five Years: George | Born 1955. Treasurer Since November 2008. Principal |
| Gund Professor of Finance and Banking at the Harvard | Occupation(s) During the Past Five Years: Principal |
| Business School (retired July 2011); Chief Investment | of The Vanguard Group, Inc.; Treasurer of each of |
| Officer and Managing Partner of HighVista Strategies | the investment companies served by The Vanguard |
| LLC (private investment firm); Director of Rand | Group since 2008; Assistant Treasurer of each of the |
| Merchant Bank; Overseer of the Museum of Fine | investment companies served by The Vanguard Group |
| Arts Boston. | (1988–2008). | |
| |
| Alfred M. Rankin, Jr. | Heidi Stam | |
| Born 1941. Trustee Since January 1993. Principal | Born 1956. Secretary Since July 2005. Principal |
| Occupation(s) During the Past Five Years: Chairman, | Occupation(s) During the Past Five Years: Managing |
| President, and Chief Executive Officer of NACCO | Director of The Vanguard Group, Inc., since 2006; |
| Industries, Inc. (forklift trucks/housewares/lignite); | General Counsel of The Vanguard Group since 2005; |
| Director of Goodrich Corporation (industrial products/ | Secretary of The Vanguard Group and of each of the |
| aircraft systems and services) and the National | investment companies served by The Vanguard Group |
| Association of Manufacturers; Chairman of the Federal | since 2005; Director and Senior Vice President of |
| Reserve Bank of Cleveland and of University Hospitals | Vanguard Marketing Corporation since 2005; |
| of Cleveland; Advisory Chairman of the Board of The | Principal of The Vanguard Group (1997–2006). |
| Cleveland Museum of Art. | | |
| |
| Peter F. Volanakis | Vanguard Senior Management Team |
| Born 1955. Trustee Since July 2009. Principal | | |
| Occupation(s) During the Past Five Years: President | Mortimer J. Buckley | Michael S. Miller |
| and Chief Operating Officer (retired 2010) of Corning | Kathleen C. Gubanich | James M. Norris |
| Incorporated (communications equipment); Director of | Paul A. Heller | Glenn W. Reed |
| Corning Incorporated (2000-2010) and Dow Corning | Martha G. King | George U. Sauter |
| (2001-2010); Director of SPX Corporation (multi- | Chris D. McIsaac | |
| industry manufacturing), the Corning Foundation, and | | |
| the Corning Museum of Glass; Overseer of the Amos | Chairman Emeritus and Senior Advisor |
| Tuck School of Business Administration at Dartmouth | | |
| College; Advisor to the Norris Cotton Cancer Center. | John J. Brennan | |
| | Chairman, 1996–2009 | |
| |
| Executive Officers | Chief Executive Officer and President, 1996–2008 |
| |
| Glenn Booraem | Founder | |
| Born 1967. Controller Since July 2010. Principal | | |
| Occupation(s) During the Past Five Years: Principal | John C. Bogle | |
| of The Vanguard Group, Inc.; Controller of each of | Chairman and Chief Executive Officer, 1974–1996 |
1 Mr. McNabb is considered an “interested person,” as defined in the Investment Company Act of 1940, because he is an officer of the Vanguard funds.
2 December 2002 for Vanguard Equity Income Fund, Vanguard Growth Equity Fund, the Vanguard Municipal Bond Funds, and the Vanguard State Tax-Exempt Funds.
| 
|
| P.O. Box 2600 |
| Valley Forge, PA 19482-2600 |
Connect with Vanguard® > vanguard.com
| |
| Fund Information > 800-662-7447 | |
| Direct Investor Account Services > 800-662-2739 | |
| Institutional Investor Services > 800-523-1036 | |
| Text Telephone for People | |
| With Hearing Impairment > 800-749-7273 | |
| |
| This material may be used in conjunction | |
| with the offering of shares of any Vanguard | |
| fund only if preceded or accompanied by | |
| the fund’s current prospectus. | |
| |
| All comparative mutual fund data are from Lipper Inc. or | |
| Morningstar, Inc., unless otherwise noted. | |
| |
| You can obtain a free copy of Vanguard’s proxy voting | |
| guidelines by visiting vanguard.com/proxyreporting or by | |
| calling Vanguard at 800-662-2739. The guidelines are | |
| also available from the SEC’s website, sec.gov. In | |
| addition, you may obtain a free report on how your fund | |
| voted the proxies for securities it owned during the 12 | |
| months ended June 30. To get the report, visit either | |
| vanguard.com/proxyreporting or sec.gov. | |
| |
| You can review and copy information about your fund at | |
| the SEC’s Public Reference Room in Washington, D.C. To | |
| find out more about this public service, call the SEC at | |
| 202-551-8090. Information about your fund is also | |
| available on the SEC’s website, and you can receive | |
| copies of this information, for a fee, by sending a | |
| request in either of two ways: via e-mail addressed to | |
| publicinfo@sec.gov or via regular mail addressed to the | |
| Public Reference Section, Securities and Exchange | |
| Commission, Washington, DC 20549-1520. | |
| |
| |
| | © 2012 The Vanguard Group, Inc. |
| | All rights reserved. |
| | Vanguard Marketing Corporation, Distributor. |
| |
| | Q530 032012 |

Annual Report | January 31, 2012
Vanguard Health Care Fund
> For the fiscal year ended January 31, 2012, Vanguard Health Care Fund returned more than 12%, outpacing the results of its benchmark index and its peer group.
> The fund benefited from the advisor’s astute stock choices, especially among biotechnology firms.
> For the decade ended January 31, the fund remained significantly ahead of its comparative standards in performance.
| |
| Contents | |
| Your Fund’s Total Returns. | 1 |
| Chairman’s Letter. | 2 |
| Advisor’s Report. | 7 |
| Fund Profile. | 10 |
| Performance Summary. | 11 |
| Financial Statements. | 13 |
| Your Fund’s After-Tax Returns. | 26 |
| About Your Fund’s Expenses. | 27 |
| Glossary. | 29 |
Please note: The opinions expressed in this report are just that—informed opinions. They should not be considered promises or advice.
Also, please keep in mind that the information and opinions cover the period through the date on the front of this report. Of course, the risks of investing in your fund are spelled out in the prospectus.
See the Glossary for definitions of investment terms used in this report.
About the cover: Vanguard was named for the HMS Vanguard, flagship of British Admiral Horatio Nelson. A ship—whose performance and safety depend on the work of all hands—has served as a fitting metaphor for the Vanguard crew as we strive to help clients reach their financial goals.
Your Fund’s Total Returns
| |
| Fiscal Year Ended January 31, 2012 | |
| |
| | Total |
| | Returns |
| Vanguard Health Care Fund | |
| Investor Shares | 12.50% |
| Admiral™ Shares | 12.57 |
| MSCI All Country World Health Care Index | 10.99 |
| Global Health/Biotechnology Funds Average | 10.06 |
Global Health/Biotechnology Funds Average: Derived from data provided by Lipper Inc.
Admiral Shares carry lower expenses and are available to investors who meet certain account-balance requirements.
Your Fund’s Performance at a Glance
January 31, 2011 , Through January 31, 2012
| | | | |
| | | | Distributions Per Share |
| | Starting | Ending | Income | Capital |
| | Share Price | Share Price | Dividends | Gains |
| Vanguard Health Care Fund | | | | |
| Investor Shares | $124.30 | $131.96 | $2.237 | $5.183 |
| Admiral Shares | 52.45 | 55.68 | 0.980 | 2.187 |
1

Chairman’s Letter
Dear Shareholder,
The past year was marked by sizable gains for health care stocks as investors sought safety from global economic uncertainty. In this environment, Vanguard Health Care Fund prospered, outpacing its benchmark index and its peers.
For the 12 months ended January 31, 2012, the Health Care Fund returned 12.50% for Investor Shares and 12.57% for Admiral Shares. The fund’s benchmark, the MSCI All Country World Health Care Index, returned 10.99%, while global health and biotechnology funds posted an average return of 10.06% for the period.
If you own shares of the fund in a taxable account, you may wish to review the fund’s after-tax returns later in this report.
Volatility was a constant
in fast-changing markets
For the 12 months ended January 31, the broad U.S. stock market returned 3.55%. This modest result reflected rallies and reversals driven by drama on the global stage, including Europe’s debt crisis and rating agency Standard & Poor’s decision to downgrade the U.S. credit rating. (Vanguard’s confidence in the full faith and credit of the U.S. Treasury remains unshaken.)
2
The recent volatility is consistent with the pattern of the past five years, as suggested by the figures in the Market Barometer table. The dramatic differences in average annual returns over the one-, three-, and five-year periods are a consequence of the stock market’s heady spikes and precipitous declines.
Although the outcome is different, this turbulence is also apparent in the returns of international stock markets. In the past 12 months, non-U.S. stock markets delivered negative results. Weakness was widespread, with the worst returns in Europe and Japan.
Modest yields and high returns
in the bond market
Bonds ended the fiscal year with surprisingly strong returns. At the start of the period, the 10-year U.S. Treasury note’s slender yield of 3.38% seemed like a good reason to temper expectations. As stock market volatility spiked and investors put a premium on safety, however, yields moved lower still. The note finished the period at 1.80%. The Barclays Capital U.S. Aggregate Bond Index, a broad taxable bond market benchmark, returned 8.66%.
Municipal bonds did even better, as prices snapped back from a fear-driven plunge in the months preceding the new fiscal year.
| | | |
| Market Barometer | | | |
| |
| | | Average Annual Total Returns |
| | | Periods Ended January 31, 2012 |
| | One | Three | Five |
| | Year | Years | Years |
| Stocks | | | |
| Russell 1000 Index (Large-caps) | 3.95% | 20.01% | 0.55% |
| Russell 2000 Index (Small-caps) | 2.86 | 23.03 | 1.19 |
| Dow Jones U.S. Total Stock Market Index | 3.55 | 20.54 | 0.88 |
| MSCI All Country World Index ex USA (International) | -8.75 | 16.70 | -1.71 |
| |
| Bonds | | | |
| Barclays Capital U.S. Aggregate Bond Index (Broad | | | |
| taxable market) | 8.66% | 7.40% | 6.70% |
| Barclays Capital Municipal Bond Index (Broad | | | |
| tax-exempt market) | 14.10 | 8.10 | 5.76 |
| Citigroup Three-Month U.S. Treasury Bill Index | 0.07 | 0.10 | 1.27 |
| |
| CPI | | | |
| Consumer Price Index | 2.93% | 2.39% | 2.29% |
3
Although last year’s low expectations proved misguided, it’s worth remembering that low yields do imply lower future returns: As yields tumble, the scope for further declines—and increases in prices—diminishes. Savings instruments such as the 3-month Treasury bill returned a little more than 0%, consistent with the Federal Reserve’s target for the shortest-term interest rates.
Favorable climate and stock choices
lifted the fund’s performance
As I noted, health care stocks were in favor during the past fiscal year, and they significantly outperformed the modest gains notched by the broad U.S. stock market. It was the first fiscal year since the one ended January 31, 2009, during the depths of the financial crisis, health care stocks fared better than the overall equity market.
Health care is seen for the most part as a defensive sector, meaning that many of its stocks are relatively insensitive to the economy’s ups and downs. When concerns about the global economy returned to the fore in 2011, investors sought a safe haven in health care. Of course, no business or industry is entirely immune from economic forces. Managed care companies, whose stocks are owned by your fund, did see a drop in their members’ usage of medical services. But that slackening in demand worked to the companies’ advantage, reducing costs and boosting profitability.
Expense Ratios
Your Fund Compared With Its Peer Group
| | | |
| | Investor | Admiral | Peer Group |
| | Shares | Shares | Average |
| Health Care Fund | 0.35% | 0.30% | 1.39% |
The fund expense ratios shown are from the prospectus dated May 26, 2011, and represent estimated costs for the current fiscal year. For the fiscal year ended January 31, 2012, the fund’s expense ratios were 0.35% for Investor Shares and 0.30% for Admiral Shares. The peer-group expense ratio is derived from data provided by Lipper Inc. and captures information through year-end 2011.
Peer group: Global Health/Biotechnology Funds.
4
In addition to the favorable environment, your fund also benefited from the stock-picking acumen of its advisor, Wellington Management Company, llp. Strong performances from a diverse range of holdings, including biotechnology firms and prescription drug distributors, helped the fund deliver benchmark-beating returns.
Wellington chooses stocks it deems attractively valued and then typically holds those stocks for the long term, leading to a portfolio turnover rate that’s lower than that of many other heath care funds. The advisor also can look outside of the United States for opportunities. As of the end of the fiscal year, about 13% of the portfolio was invested in Europe, while nearly 9% was invested in the Pacific region. The Advisor’s Report that follows this letter provides additional details about the management of the fund during the year.
Fund’s long-term results
outshine the competition
Vanguard Health Care Fund’s long-term results continue to be significantly better than the fund’s comparative standards. For the ten years ended January 31, the fund’s Investor Shares had an average annual return of 7.15%, more than 4 percentage points ahead of its benchmark index and more than 3 percentage points better than the average annual return of peer funds. The fund also outperformed the broad U.S. stock market for the period—the Dow Jones U.S. Total Stock Market had an average annual return of 4.55%.
Total Returns
Ten Years Ended January 31, 2012
| |
| | Average |
| | Annual Return |
| Health Care Fund Investor Shares | 7.15% |
| Spliced Health Care Index | 2.48 |
| Global Health/Biotechnology Funds Average | 3.87 |
Spliced Health Care Index: S&P 500 Index through December 31, 2001; S&P Health Care Index through May 31, 2010; MSCI All Country World Health Care Index thereafter.
Global Health/Biotechnology Funds Average: Derived from data provided by Lipper Inc.
The figures shown represent past performance, which is not a guarantee of future results. (Current performance may be lower or higher than the performance data cited. For performance data current to the most recent month-end, visit our website at vanguard.com/performance.) Note, too, that both investment returns and principal value can fluctuate widely, so an investor’s shares, when sold, could be worth more or less than their original cost.
5
The fund’s record is especially impressive when you consider the market turmoil of the past decade. Credit goes to Wellington, your fund’s experienced advisor, whose strong stock-picking skills, coupled with the fund’s low costs, have produced notable results for long-term shareholders.
Stay focused
on what you can control
As I mentioned, both the past year and the past decade have been volatile, and it’s natural to feel some anxiety as a result of what we’ve experienced. But rather than worry about the market’s gyrations, which you can’t control, it’s more constructive to focus instead on what you can control.
This point was underscored by a recent Vanguard research paper, Penny Saved, Penny Earned, that can be found at vanguard.com/research. The study showed that retirement investors have a greater likelihood of reaching their goals by increasing their savings rate and savings time horizon. Doing one or both of these things can generally provide a higher chance of success than simply counting on the possibility of higher portfolio returns, the authors concluded.
We also believe you can move closer to your goals by owning a balanced and diversified portfolio that fits your tolerance for investment risk. Vanguard Health Care Fund can be a part of such a well-balanced portfolio; the fund offers investors broad exposure to one of the economy’s most innovative segments.
As always, thank you for entrusting your assets to Vanguard.
Sincerely,

F. William McNabb III
Chairman and Chief Executive Officer
February 10, 2012
6
Advisor’s Report
Vanguard Health Care Fund gained more than 12% for the 12 months ended January 31, 2012. The fund’s return was ahead of that of its benchmark, the MSCI All Country World Health Care Index, and the average return for health/biotechnology funds.
The investment environment
With the Standard & Poor’s 500 Index returning more than 4%, the health care sector outperformed the broader market for the fiscal year. The sector’s relative advantage seemed to be driven by apprehension about global economic growth and the perceived comparative safety of health care stocks. A continued improving backdrop to health care fundamentals also drove the higher returns, including less uncertainty related to health care reform and an increase in approvals by the Food and Drug Administration (FDA).
Our successes
Our largest holding at the close of the fiscal year, Merck, was also our greatest contributor to performance during the period. UnitedHealth Group, Humana, and Amgen also contributed favorably to the portfolio’s results on an absolute basis.
After suffering a steep mid-period decline, Merck’s stock price rebounded later in the fiscal year. The market responded favorably after the company’s earnings
Major Portfolio Changes
Year Ended January 31, 2012
| |
| Additions | Comments |
| Teva Pharmaceuticals | Initiated a position during the period. Teva is a global |
| | pharmaceutical and generic drug company; its stock trades at a |
| | compelling valuation. The company has the leading global generic |
| | drug business, and its recent acquisition of Cephalon should help |
| | position the company in branded pharmaceuticals. |
| Vanguard Health Systems | Initiated a position. Vanguard Health Systems owns and operates |
| | urban-based hospitals; the company takes a different approach |
| | from competitors, as it targets underperforming hospitals that can |
| | subsequently be improved operationally. |
| Bristol-Myers Squibb | Increased our position because of positive developments for a |
| | number of drugs in the company’s pipeline, such as apixaban and |
| | ipilimumab; these drugs will help Bristol-Myers Squibb overcome |
| | its Plavix patent expiration. |
| |
| Reductions | Comments |
| Cephalon | Trimmed after the stock rose and ultimately eliminated the |
| | position as Teva Pharmaceuticals offered to buy the company, |
| | outbidding Valeant Pharmaceutical. |
| Beckman Coulter | Trimmed and then eliminated our position when Danaher |
| | completed a tender offer for the company. |
| Genzyme | Eliminated our position after the stock rose following an acquisition |
| | offer by Sanofi. |
7
exceeded consensus expectations. Management recently held an upbeat event for investors and analysts and raised its dividend for the first time since the Vioxx litigation, which was also an encouraging sign to investors. The company has an attractive valuation, a solid dividend yield, and a diversified pharmaceutical revenue base. Merck is benefiting from strong sales of existing products, particularly its diabetes drug Januvia, which we believe is under-appreciated by market participants. The company is doing a good job controlling costs, and the drug pipeline is improving. We increased our position during the period.
UnitedHealth Group, which at the close of the period was our second-largest holding, continued to perform well, as did managed care stocks as a group. Managed care companies have benefited from lower medical costs and utilization as a result of the softer economy. We believe the fundamentals for commercial HMOs remain favorable, as medical inflation remains under control and pricing remains strong. Given our long-term expectations, consensus earnings estimates for UnitedHealth Group look conservative.
Our shortfalls
Our exposure to Japan held back performance during the period. Shares of Shionogi, Daiichi Sankyo, and Takeda Pharmaceutical declined, weighing on the portfolio. Shionogi, a pharmaceutical company, dropped as the market frowned when the company announced another downward revision in earnings for its U.S. subsidiary, hindering management’s credibility. Investors also worried about the impact that the newly available generic version of Lipitor would have on Crestor sales. In our view, the market has punished Shionogi disproportionately. We believe the company’s promising new HIV drug and continued increases in sales of Crestor will drive earnings growth. We increased our position size modestly.
Daiichi Sankyo, another major pharmaceutical company in Japan, delivered uninspiring earnings because of costs connected to new launches in Japan and research and development. We are excited about the potential for Daiichi Sankyo’s anticoagulant drug edoxaban, currently in phase 3 clinical trials.
The fund’s positioning
The health care industry continues to face risks, but it also has opportunities. While we increasingly believe that the impact of health care reform on the industry will be manageable, significant uncertainty remains. Health care will continue to be in the spotlight as the United States and Europe struggle with ways to reduce debt burdens.
Emerging markets represent a new growth frontier for the global therapeutic and device companies, which is positive for the sector. We are also encouraged by an improved trend at the FDA. Finally, unlike industries that tend to demonstrate a higher degree of sensitivity to muted economic growth, the health care sector has historically demonstrated more resilience.
8
We will continue to strive to identify early the drugs and devices with the best chances of changing medicine, as well as the service companies that are best positioned to capture opportunities along the health care chain. We will continue to stay diversified, focused on the long haul, and positioned in the most attractive health care stocks.
Edward P. Owens, CFA
Senior Vice President and Portfolio Manager
Jean M. Hynes, CFA
Senior Vice President and Associate Portfolio Manager
Wellington Management Company, LLP
February 14, 2012
9
Health Care Fund
Fund Profile
As of January 31, 2012
| | | |
| Share-Class Characteristics | | |
| | Investor | Admiral |
| | Shares | Shares |
| Ticker Symbol | VGHCX | VGHAX |
| Expense Ratio1 | 0.35% | 0.30% |
| 30-Day SEC Yield | 1.64% | 1.69% |
| |
| Portfolio Characteristics | | |
| | | MSCI | DJ |
| | | ACWI | U.S. Total |
| | | Health | Market |
| | Fund | Care | Index |
| Number of Stocks | 80 | 134 | 3,738 |
| Median Market Cap $28.5B | $56.1B | $32.6B |
| Price/Earnings Ratio | 14.0x | 16.0x | 15.5x |
| Price/Book Ratio | 2.2x | 2.6x | 2.2x |
| Return on Equity | 19.9% | 21.3% | 19.1% |
| Earnings Growth Rate | 8.3% | 8.0% | 7.1% |
| Dividend Yield | 2.4% | 2.8% | 2.0% |
| Foreign Holdings | 20.8% | 41.6% | 0.0% |
| Turnover Rate | 8% | — | — |
| Short-Term Reserves | 6.9% | — | — |
| |
| Subindustry Diversification (% of equity exposure) |
| | | |
| | | | MSCI |
| | | | ACWI |
| | | | Health |
| | | Fund | Care |
| Biotechnology | | 9.3% | 8.1% |
| Consumer Staples | | 1.8 | 0.0 |
| Health Care Distributors | 5.8 | 2.6 |
| Health Care Equipment | | 9.7 | 11.1 |
| Health Care Facilities | | 2.1 | 0.4 |
| Health Care Services | | 3.4 | 4.6 |
| Health Care Supplies | | 0.5 | 1.0 |
| Health Care Technology | 1.8 | 0.4 |
| Industrials | | 0.3 | 0.0 |
| Life Sciences Tools & | | | |
| Services | | 0.3 | 2.7 |
| Managed Health Care | | 14.6 | 5.3 |
| Materials | | 1.2 | 0.0 |
| Pharmaceuticals | | 49.2 | 63.8 |
| | |
| Volatility Measures | | |
| | Spliced | DJ |
| | Health | U.S. Total |
| | Care | Market |
| | Index | Index |
| R-Squared | 0.95 | 0.61 |
| Beta | 0.91 | 0.59 |
| These measures show the degree and timing of the fund’s fluctuations compared with the indexes over 36 months. |
|
| |
| Ten Largest Holdings (% of total net assets) |
| Merck & Co. Inc. | Pharmaceuticals | 6.3% |
| UnitedHealth Group Inc. | Managed Health | |
| | Care | 4.5 |
| Roche Holding AG | Pharmaceuticals | 3.9 |
| Forest Laboratories Inc. | Pharmaceuticals | 3.8 |
| Pfizer Inc. | Pharmaceuticals | 3.8 |
| Amgen Inc. | Biotechnology | 3.8 |
| McKesson Corp. | Health Care | |
| | Distributors | 3.7 |
| AstraZeneca plc | Pharmaceuticals | 3.2 |
| Abbott Laboratories | Pharmaceuticals | 3.1 |
| Eli Lilly & Co. | Pharmaceuticals | 2.9 |
| Top Ten | | 39.0% |
| The holdings listed exclude any temporary cash investments and equity index products. |
| | |
| |
| Market Diversification (% of equity exposure) |
| |
| Europe | | |
| Switzerland | | 6.0% |
| United Kingdom | | 4.0 |
| Germany | | 1.2 |
| Other | | 1.9 |
| Subtotal | | 13.1% |
| Pacific | | |
| Japan | | 8.5% |
| Middle East | | 0.7% |
| North America | | |
| United States | | 77.7% |
1 The expense ratios shown are from the prospectus dated May 26, 2011, and represent estimated costs for the current fiscal year. For the fiscal year ended January 31, 2012, the expense ratios were 0.35% for Investor Shares and 0.30% for Admiral Shares.
10
Health Care Fund
Performance Summary
All of the returns in this report represent past performance, which is not a guarantee of future results that may be achieved by the fund. (Current performance may be lower or higher than the performance data cited. For performance data current to the most recent month-end, visit our website at vanguard.com/performance.) Note, too, that both investment returns and principal value can fluctuate widely, so an investor’s shares, when sold, could be worth more or less than their original cost. The returns shown do not reflect taxes that a shareholder would pay on fund distributions or on the sale of fund shares.
Cumulative Performance: January 31, 2002, Through January 31, 2012
Initial Investment of $10,000
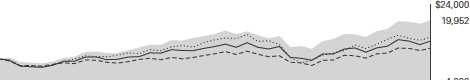
| | | | |
| | | Average Annual Total Returns | |
| | | Periods Ended January 31, 2012 | |
| | | | | Final Value |
| | One | Five | Ten | of a $10,000 |
| | Year | Years | Years | Investment |
| Health Care Fund Investor Shares | 12.50% | 3.98% | 7.15% | $19,952 |
| Dow Jones U.S. Total Stock Market | | | | |
| Index | 3.55 | 0.88 | 4.55 | 15,604 |
| |
| Spliced Health Care Index | 10.99 | 2.46 | 2.48 | 12,774 |
| Global Health/Biotechnology Funds | | | | |
| Average | 10.06 | 2.07 | 3.87 | 14,612 |
Spliced Health Care Index: S&P 500 Index through December 31, 2001; S&P Health Care Index through May 31, 2010; MSCI All Country World Health Care Index thereafter.
Global Health/Biotechnology Funds Average: Derived from data provided by Lipper Inc.
| | | | |
| | | | | Final Value |
| | One | Five | Ten | of a $50,000 |
| | Year | Years | Years | Investment |
| Health Care Fund Admiral Shares | 12.57% | 4.04% | 7.23% | $100,523 |
| Dow Jones U.S. Total Stock Market Index | 3.55 | 0.88 | 4.55 | 78,018 |
| Spliced Health Care Index | 10.99 | 2.46 | 2.48 | 63,871 |
Vanguard fund returns do not reflect the 1% fee on redemptions of shares held for less than one year.
See Financial Highlights for dividend and capital gains information.
11
Health Care Fund
Fiscal-Year Total Returns (%): January 31, 2002, Through January 31, 2012
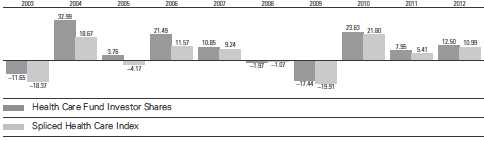
Average Annual Total Returns: Periods Ended December 31, 2011
This table presents returns through the latest calendar quarter—rather than through the end of the fiscal period.
Securities and Exchange Commission rules require that we provide this information.
| | | | |
| | Inception | One | Five | Ten |
| | Date | Year | Years | Years |
| Investor Shares | 5/23/1984 | 11.45% | 4.03% | 6.72% |
| Admiral Shares | 11/12/2001 | 11.51 | 4.10 | 6.80 |
Vanguard fund returns do not reflect the 1% fee on redemptions of shares held for less than one year.
12
Health Care Fund
Financial Statements
Statement of Net Assets
As of January 31, 2012
The fund reports a complete list of its holdings in regulatory filings four times in each fiscal year, at the quarter-ends. For the second and fourth fiscal quarters, the lists appear in the fund’s semiannual and annual reports to shareholders. For the first and third fiscal quarters, the fund files the lists with the Securities and Exchange Commission on Form N-Q. Shareholders can look up the fund’s Forms N-Q on the SEC’s website at sec.gov. Forms N-Q may also be reviewed and copied at the SEC’s Public Reference Room (see the back cover of this report for further information).
| | | |
| | | | Market |
| | | | Value |
| | | Shares | ($000) |
| Common Stocks (93.2%) | | |
| United States (72.4%) | | |
| Biotechnology (8.7%) | | |
| | Amgen Inc. | 11,958,355 | 812,092 |
| * | Gilead Sciences Inc. | 7,892,100 | 385,450 |
| * | Biogen Idec Inc. | 2,220,000 | 261,782 |
| * | Vertex Pharmaceuticals | | |
| | Inc. | 2,743,700 | 101,380 |
| * | United Therapeutics | | |
| | Corp. | 1,787,000 | 87,885 |
| * | Regeneron | | |
| | Pharmaceuticals Inc. | 692,200 | 62,893 |
| * | Onyx Pharmaceuticals | | |
| | Inc. | 1,452,700 | 59,473 |
| * | Cubist Pharmaceuticals | | |
| | Inc. | 1,323,142 | 54,011 |
| * | Ironwood | | |
| | Pharmaceuticals Inc. | 2,000,000 | 30,000 |
| | | | 1,854,966 |
| Chemicals (1.1%) | | |
| | Sigma-Aldrich Corp. | 3,380,000 | 229,975 |
| |
| Food & Staples Retailing (1.7%) | |
| | Walgreen Co. | 10,294,700 | 343,431 |
| | CVS Caremark Corp. | 300,000 | 12,525 |
| | | | 355,956 |
| Health Care Equipment & Supplies (9.5%) |
| | Medtronic Inc. | 10,901,100 | 420,455 |
| | St. Jude Medical Inc. | 9,010,900 | 375,845 |
| * | Boston Scientific Corp. | 46,800,000 | 278,928 |
| | Becton Dickinson and | | |
| | Co. | 3,102,500 | 243,267 |
| | Baxter International Inc. | 3,700,000 | 205,276 |
| * | Zimmer Holdings Inc. | 2,400,000 | 145,800 |
| * | CareFusion Corp. | 4,734,654 | 113,395 |
| | Covidien plc | 2,150,000 | 110,725 |
| | DENTSPLY International | | |
| | Inc. | 2,485,400 | 93,799 |
| | | |
| | | | Market |
| | | | Value |
| | | Shares | ($000) |
| * | NuVasive Inc. | 1,680,103 | 26,042 |
| | STERIS Corp. | 803,083 | 24,157 |
| | | | 2,037,689 |
| Health Care Providers & Services (23.9%) | |
| | UnitedHealth Group Inc. | 18,685,100 | 967,701 |
| | McKesson Corp. | 9,789,900 | 800,031 |
| | Humana Inc. | 6,210,094 | 552,823 |
| | WellPoint Inc. | 7,902,400 | 508,282 |
| | Quest Diagnostics Inc. | 6,185,400 | 359,248 |
| | Cigna Corp. | 7,510,600 | 336,700 |
| | Cardinal Health Inc. | 6,236,708 | 268,366 |
| *,1 | Coventry Health Care Inc. | 8,527,500 | 256,422 |
| * | Laboratory Corp. of | | |
| | America Holdings | 2,681,360 | 245,049 |
| *,1 | Health Net Inc. | 4,613,458 | 174,112 |
| | Universal Health | | |
| | Services Inc. Class B | 4,120,800 | 170,148 |
| *,1 | Health Management | | |
| | Associates Inc. Class A | 15,556,900 | 99,720 |
| | Aetna Inc. | 2,250,000 | 98,325 |
| | Owens & Minor Inc. | 3,000,000 | 91,230 |
| * | HCA Holdings Inc. | 3,300,000 | 80,652 |
| * | Tenet Healthcare Corp. | 5,600,000 | 29,624 |
| * | DaVita Inc. | 354,600 | 29,010 |
| * | Vanguard Health | | |
| | Systems Inc. | 2,556,780 | 28,610 |
| * | WellCare Health Plans | | |
| | Inc. | 349,000 | 20,856 |
| * | HealthSouth Corp. | 386,000 | 7,446 |
| | | | 5,124,355 |
| Health Care Technology (1.6%) | |
| * | Cerner Corp. | 5,800,000 | 353,162 |
| |
| Life Sciences Tools & Services (0.3%) | |
| * | PAREXEL International Corp.2,740,400 | 66,044 |
| |
| Machinery (0.3%) | | |
| | Pall Corp. | 1,174,600 | 70,100 |
13
| | | |
| Health Care Fund | | |
| |
| |
| |
| | | | Market |
| | | | Value |
| | | Shares | ($000) |
| Pharmaceuticals (25.3%) | | |
| | Merck & Co. Inc. | 35,390,648 | 1,354,046 |
| *,1 | Forest Laboratories Inc. | 25,903,000 | 823,198 |
| | Pfizer Inc. | 38,083,888 | 814,995 |
| | Abbott Laboratories | 12,400,000 | 671,460 |
| | Eli Lilly & Co. | 15,864,300 | 630,447 |
| | Bristol-Myers Squibb Co. | 11,603,061 | 374,083 |
| | Johnson & Johnson | 4,500,000 | 296,595 |
| | Perrigo Co. | 2,209,100 | 211,190 |
| * | Watson Pharmaceuticals | | |
| | Inc. | 1,700,000 | 99,671 |
| * | Salix Pharmaceuticals | | |
| | Ltd. | 1,554,300 | 74,917 |
| * | Hospira Inc. | 2,095,070 | 72,196 |
| * | Warner Chilcott plc | | |
| | Class A | 232,200 | 3,917 |
| | | | 5,426,715 |
| Total United States | | 15,518,962 |
| International (20.8%) | | |
| Belgium (0.8%) | | |
| | UCB SA | 4,175,704 | 170,091 |
| |
| France (0.4%) | | |
| | Sanofi | 671,976 | 49,823 |
| | Ipsen SA | 1,400,000 | 41,139 |
| | | | 90,962 |
| Germany (1.1%) | | |
| | Bayer AG | 2,694,656 | 189,293 |
| | Fresenius Medical Care | | |
| | AG & Co. KGaA | 611,950 | 43,751 |
| | | | 233,044 |
| Ireland (0.6%) | | |
| * | Elan Corp. plc ADR | 8,894,800 | 121,058 |
| * | Alkermes plc | 320,000 | 6,019 |
| | | | 127,077 |
| Israel (0.6%) | | |
| | Teva Pharmaceutical | | |
| | Industries Ltd. ADR | 2,950,000 | 133,133 |
| |
| Japan (8.0%) | | |
| | Astellas Pharma Inc. | 14,365,700 | 590,295 |
| | Daiichi Sankyo Co. Ltd. | 13,001,500 | 248,217 |
| | Takeda Pharmaceutical | | |
| | Co. Ltd. | 5,599,900 | 243,454 |
| | Eisai Co. Ltd. | 5,793,700 | 240,154 |
| | Shionogi & Co. Ltd. | 10,966,234 | 146,561 |
| | Mitsubishi Tanabe | | |
| | Pharma Corp. | 7,100,000 | 100,338 |
| | Chugai Pharmaceutical | | |
| | Co. Ltd. | 5,321,700 | 84,774 |
| | Ono Pharmaceutical Co. | | |
| | Ltd. | 960,000 | 54,209 |
| | | | 1,708,002 |
| | |
| | | Market |
| | | Value |
| | Shares | ($000) |
| Switzerland (5.5%) | | |
| Roche Holding AG | 4,273,977 | 725,100 |
| Novartis AG | 4,969,880 | 269,732 |
| Roche Holding AG | | |
| (Bearer) | 664,320 | 116,537 |
| Novartis AG ADR | 1,461,400 | 79,442 |
| | | 1,190,811 |
| United Kingdom (3.8%) | | |
| AstraZeneca plc | 14,181,500 | 683,032 |
| GlaxoSmithKline plc ADR | 2,742,381 | 122,145 |
| | | 805,177 |
| Total International | | 4,458,297 |
| Total Common Stocks | | |
| (Cost $12,685,361) | | 19,977,259 |
| Temporary Cash Investments (6.9%) | |
| |
| |
| | Face | |
| | Amount | |
| | ($000) | |
| Repurchase Agreements (5.0%) | |
| Bank of America | | |
| Securities LLC 0.220%, | | |
| 2/1/12 (Dated 1/31/12, | | |
| Repurchase Value | | |
| $168,601,000, | | |
| collateralized by Federal | | |
| National Mortgage Assn. | | |
| 4.000%–4.500%, | | |
| 12/1/40–1/1/42) | 168,600 | 168,600 |
| Deutsche Bank Securities | | |
| Inc. 0.240%, 2/1/12 | | |
| (Dated 1/31/12, | | |
| Repurchase Value | | |
| $122,301,000, | | |
| collateralized by Federal | | |
| National Mortgage Assn. | | |
| 3.500%–6.000%, | | |
| 7/1/23–8/1/41) | 122,300 | 122,300 |
| HSBC Bank USA 0.220%, | | |
| 2/1/12 (Dated 1/31/12, | | |
| Repurchase Value | | |
| $660,104,000, | | |
| collateralized by Federal | | |
| National Mortgage Assn. | | |
| 4.000%–6.500%, | | |
| 12/1/23–12/1/41) | 660,100 | 660,100 |
14
| | |
| Health Care Fund | | |
| |
| |
| |
| | Face | Market |
| | Amount | Value |
| | ($000) | ($000) |
| UBS Securities LLC | | |
| 0.240%, 2/1/12 | | |
| (Dated 1/31/12, | | |
| Repurchase Value | | |
| $126,801,000, | | |
| collateralized by Federal | | |
| Home Loan Mortgage | | |
| Corp. 3.000%–4.500%, | | |
| 10/1/26–7/1/41) | 126,800 | 126,800 |
| | | 1,077,800 |
| Commercial Paper (1.9%) | | |
| General Electric Capital | | |
| Corp., 0.200%, 5/22/12 | 200,000 | 199,876 |
| General Electric Capital | | |
| Services Inc., 0.290%, | | |
| 4/10/12 | 200,000 | 199,922 |
| | | 399,798 |
| Total Temporary Cash Investments | |
| (Cost $1,477,566) | | 1,477,598 |
| Total Investments (100.1%) | | |
| (Cost $14,162,927) | | 21,454,857 |
| Other Assets and Liabilities (-0.1%) | |
| Other Assets | | 62,828 |
| Liabilities | | (87,219) |
| | | (24,391) |
| Net Assets (100%) | | 21,430,466 |
| |
| |
| Statement of Assets and Liabilities | |
| Assets | | |
| Investments in Securities, at Value | 21,454,857 |
| Receivables for Investment | | |
| Securities Sold | | 28,502 |
| Receivables for Capital Shares Issued | 8,463 |
| Other Assets | | 25,863 |
| Total Assets | | 21,517,685 |
| Liabilities | | |
| Payables for Investment | | |
| Securities Purchased | | 10,913 |
| Payables for Capital Shares Redeemed | 8,455 |
| Other Liabilities | | 67,851 |
| Total Liabilities | | 87,219 |
| Net Assets | | 21,430,466 |
| |
| At January 31, 2012, net assets consisted of: |
| | Amount |
| | ($000) |
| Paid-in Capital | 14,179,930 |
| Overdistributed Net Investment Income | (49,588) |
| Accumulated Net Realized Gains | 9,898 |
| Unrealized Appreciation (Depreciation) | |
| Investment Securities | 7,291,930 |
| Forward Currency Contracts | (1,884) |
| Foreign Currencies | 180 |
| Net Assets | 21,430,466 |
| |
| |
| Investor Shares—Net Assets | |
| Applicable to 64,128,032 outstanding | |
| $.001 par value shares of beneficial | |
| interest (unlimited authorization) | 8,462,199 |
| Net Asset Value Per Share— | |
| Investor Shares | $131.96 |
| |
| |
| Admiral Shares—Net Assets | |
| Applicable to 232,920,905 outstanding | |
| $.001 par value shares of beneficial | |
| interest (unlimited authorization) | 12,968,267 |
| Net Asset Value Per Share— | |
| Admiral Shares | $55.68 |
See Note A in Notes to Financial Statements.
* Non-income-producing security.
1 Considered an affiliated company of the fund as the fund owns more than 5% of the outstanding voting securities of such company.
ADR—American Depositary Receipt.
See accompanying Notes, which are an integral part of the Financial Statements.
15
Health Care Fund
Statement of Operations
| |
| | Year Ended |
| | January 31, 2012 |
| | ($000) |
| Investment Income | |
| Income | |
| Dividends1,2 | 426,449 |
| Interest | 2,123 |
| Security Lending | 2,443 |
| Total Income | 431,015 |
| Expenses | |
| Investment Advisory Fees—Note B | 30,997 |
| The Vanguard Group—Note C | |
| Management and Administrative—Investor Shares | 15,376 |
| Management and Administrative—Admiral Shares | 15,923 |
| Marketing and Distribution—Investor Shares | 1,550 |
| Marketing and Distribution—Admiral Shares | 1,927 |
| Custodian Fees | 476 |
| Auditing Fees | 29 |
| Shareholders’ Reports—Investor Shares | 167 |
| Shareholders’ Reports—Admiral Shares | 32 |
| Trustees’ Fees and Expenses | 44 |
| Total Expenses | 66,521 |
| Net Investment Income | 364,494 |
| Realized Net Gain (Loss) | |
| Investment Securities Sold2 | 726,353 |
| Foreign Currencies and Forward Currency Contracts | (16,977) |
| Realized Net Gain (Loss) | 709,376 |
| Change in Unrealized Appreciation (Depreciation) | |
| Investment Securities | 1,355,899 |
| Foreign Currencies and Forward Currency Contracts | 682 |
| Change in Unrealized Appreciation (Depreciation) | 1,356,581 |
| Net Increase (Decrease) in Net Assets Resulting from Operations | 2,430,451 |
1 Dividends are net of foreign withholding taxes of $15,810,000.
2 Dividend income and realized net gain (loss) from affiliated companies of the fund were $0 and $121,949,000, respectively.
See accompanying Notes, which are an integral part of the Financial Statements.
16
Health Care Fund
Statement of Changes in Net Assets
| | |
| | Year Ended January 31, |
| | 2012 | 2011 |
| | ($000) | ($000) |
| Increase (Decrease) in Net Assets | | |
| Operations | | |
| Net Investment Income | 364,494 | 332,268 |
| Realized Net Gain (Loss) | 709,376 | 495,846 |
| Change in Unrealized Appreciation (Depreciation) | 1,356,581 | 664,193 |
| Net Increase (Decrease) in Net Assets Resulting from Operations | 2,430,451 | 1,492,307 |
| Distributions | | |
| Net Investment Income | | |
| Investor Shares | (137,158) | (137,642) |
| Admiral Shares | (217,791) | (186,814) |
| Realized Capital Gain1 | | |
| Investor Shares | (320,941) | (249,625) |
| Admiral Shares | (484,740) | (269,464) |
| Total Distributions | (1,160,630) | (843,545) |
| Capital Share Transactions | | |
| Investor Shares | (517,566) | (3,590,779) |
| Admiral Shares | 772,975 | 2,535,574 |
| Net Increase (Decrease) from Capital Share Transactions | 255,409 | (1,055,205) |
| Total Increase (Decrease) | 1,525,230 | (406,443) |
| Net Assets | | |
| Beginning of Period | 19,905,236 | 20,311,679 |
| End of Period2 | 21,430,466 | 19,905,236 |
1 Includes fiscal 2012 and 2011 short-term gain distributions totaling $79,746,000 and $15,575,000, respectively. Short-term gain distributions are treated as ordinary income dividends for tax purposes.
2 Net Assets—End of Period includes undistributed (overdistributed) net investment income of ($49,588,000) and ($36,363,000).
See accompanying Notes, which are an integral part of the Financial Statements.
17
Health Care Fund
Financial Highlights
| | | | | |
| Investor Shares | | | | | |
| |
| For a Share Outstanding | | | Year Ended January 31, |
| Throughout Each Period | 2012 | 2011 | 2010 | 2009 | 2008 |
| Net Asset Value, Beginning of Period | $124.30 | $120.06 | $99.12 | $133.80 | $149.69 |
| Investment Operations | | | | | |
| Net Investment Income | 2.300 | 2.046 | 1.902 | 1.998 | 2.7661 |
| Net Realized and Unrealized Gain (Loss) | | | | | |
| on Investments | 12.780 | 7.404 | 21.530 | (25.229) | (5.317) |
| Total from Investment Operations | 15.080 | 9.450 | 23.432 | (23.231) | (2.551) |
| Distributions | | | | | |
| Dividends from Net Investment Income | (2.237) | (2.007) | (1.761) | (1.925) | (2.747) |
| Distributions from Realized Capital Gains | (5.183) | (3.203) | (.731) | (9.524) | (10.592) |
| Total Distributions | (7.420) | (5.210) | (2.492) | (11.449) | (13.339) |
| Net Asset Value, End of Period | $131.96 | $124.30 | $120.06 | $99.12 | $133.80 |
| |
| Total Return2 | 12.50% | 7.95% | 23.63% | -17.44% | -1.97% |
| |
| Ratios/Supplemental Data | | | | | |
| Net Assets, End of Period (Millions) | $8,462 | $8,447 | $11,692 | $10,478 | $14,314 |
| Ratio of Total Expenses to | | | | | |
| Average Net Assets | 0.35% | 0.35% | 0.36% | 0.29% | 0.26% |
| Ratio of Net Investment Income to | | | | | |
| Average Net Assets | 1.72% | 1.67% | 1.73% | 1.64% | 1.78%1 |
| Portfolio Turnover Rate | 8% | 9% | 6% | 12% | 9% |
1 Net investment income per share and the ratio of net investment income to average net assets include $0.585 and 0.40%, respectively, resulting from a special dividend from Health Management Associates Class A in March 2007.
2 Total returns do not include transaction or account service fees that may have applied in the periods shown. Fund prospectuses provide information about any applicable transaction or account service fees.
See accompanying Notes, which are an integral part of the Financial Statements.
18
Health Care Fund
Financial Highlights
| | | | | |
| Admiral Shares | | | | | |
| |
| For a Share Outstanding | | | Year Ended January 31, |
| Throughout Each Period | 2012 | 2011 | 2010 | 2009 | 2008 |
| Net Asset Value, Beginning of Period | $52.45 | $50.67 | $41.83 | $56.47 | $63.19 |
| Investment Operations | | | | | |
| Net Investment Income | 1.005 | .891 | .835 | .879 | 1.2201 |
| Net Realized and Unrealized Gain (Loss) | | | | | |
| on Investments | 5.392 | 3.115 | 9.091 | (10.648) | (2.257) |
| Total from Investment Operations | 6.397 | 4.006 | 9.926 | (9.769) | (1.037) |
| Distributions | | | | | |
| Dividends from Net Investment Income | (.980) | (.874) | (.777) | (.852) | (1.212) |
| Distributions from Realized Capital Gains | (2.187) | (1.352) | (.309) | (4.019) | (4.471) |
| Total Distributions | (3.167) | (2.226) | (1.086) | (4.871) | (5.683) |
| Net Asset Value, End of Period | $55.68 | $52.45 | $50.67 | $41.83 | $56.47 |
| |
| Total Return2 | 12.57% | 7.99% | 23.72% | -17.38% | -1.90% |
| |
| Ratios/Supplemental Data | | | | | |
| Net Assets, End of Period (Millions) | $12,968 | $11,459 | $8,619 | $7,576 | $10,513 |
| Ratio of Total Expenses to | | | | | |
| Average Net Assets | 0.30% | 0.30% | 0.29% | 0.22% | 0.18% |
| Ratio of Net Investment Income to | | | | | |
| Average Net Assets | 1.77% | 1.72% | 1.80% | 1.71% | 1.86%1 |
| Portfolio Turnover Rate | 8% | 9% | 6% | 12% | 9% |
1 Net investment income per share and the ratio of net investment income to average net assets include $0.247 and 0.40%, respectively, resulting from a special dividend from Health Management Associates Class A in March 2007.
2 Total returns do not include transaction or account service fees that may have applied in the periods shown. Fund prospectuses provide information about any applicable transaction or account service fees.
See accompanying Notes, which are an integral part of the Financial Statements.
19
Health Care Fund
Notes to Financial Statements
Vanguard Health Care Fund is registered under the Investment Company Act of 1940 as an open-end investment company, or mutual fund. The fund invests in securities of foreign issuers, which may subject it to investment risks not normally associated with investing in securities of U.S. corporations. The fund offers two classes of shares: Investor Shares and Admiral Shares. Investor Shares are available to any investor who meets the fund’s minimum purchase requirements. Admiral Shares are designed for investors who meet certain administrative, service, and account-size criteria.
A. The following significant accounting policies conform to generally accepted accounting principles for U.S. mutual funds. The fund consistently follows such policies in preparing its financial statements.
1. Security Valuation: Securities are valued as of the close of trading on the New York Stock Exchange (generally 4 p.m., Eastern time) on the valuation date. Equity securities are valued at the latest quoted sales prices or official closing prices taken from the primary market in which each security trades; such securities not traded on the valuation date are valued at the mean of the latest quoted bid and asked prices. Securities for which market quotations are not readily available, or whose values have been affected by events occurring before the fund’s pricing time but after the close of the securities’ primary markets, are valued at their fair values calculated according to procedures adopted by the board of trustees. These procedures include obtaining quotations from an independent pricing service, monitoring news to identify significant market- or security-specific events, and evaluating changes in the values of foreign market proxies (for example, ADRs, futures contracts, or exchange-traded funds), between the time the foreign markets close and the fund’s pricing time. When fair-value pricing is employed, the prices of securities used by a fund to calculate its net asset value may differ from quoted or published prices for the same securities. Investments in Vanguard Market Liquidity Fund are valued at that fund’s net asset value. Temporary cash investments acquired over 60 days to maturity are valued using the latest bid prices or using valuations based on a matrix system (which considers such factors as security prices, yields, maturities, and ratings), both as furnished by independent pricing services. Other temporary cash investments are valued at amortized cost, which approximates market value.
2. Foreign Currency: Securities and other assets and liabilities denominated in foreign currencies are translated into U.S. dollars using exchange rates obtained from an independent third party as of the fund’s pricing time on the valuation date. Realized gains (losses) and unrealized appreciation (depreciation) on investment securities include the effects of changes in exchange rates since the securities were purchased, combined with the effects of changes in security prices. Fluctuations in the value of other assets and liabilities resulting from changes in exchange rates are recorded as unrealized foreign currency gains (losses) until the assets or liabilities are settled in cash, at which time they are recorded as realized foreign currency gains (losses).
3. Forward Currency Contracts: The fund enters into forward currency contracts to protect the value of securities and related receivables and payables against changes in future foreign exchange rates. The fund’s risks in using these contracts include movement in the values of the foreign currencies relative to the U.S. dollar and the ability of the counterparties to fulfill their obligations under the contracts. Counterparty risk is mitigated by entering into forward currency contracts only with highly rated counterparties, by a master netting arrangement between the fund and the counterparty, and by the posting of collateral by the counterparty. The forward currency contracts contain provisions whereby a counterparty may terminate open contracts if the fund’s net assets decline below a certain level, triggering a payment by the fund if the fund is in a net liability position at the time of the termination. The payment amount would be reduced by any collateral the fund has posted.
Any securities posted as collateral for open contracts are noted in the Statement of Net Assets.
20
Health Care Fund
Forward currency contracts are valued at their quoted daily prices obtained from an independent third party, adjusted for currency risk based on the expiration date of each contract. The aggregate principal amounts of the contracts are not recorded in the Statement of Net Assets. Fluctuations in the value of the contracts are recorded in the Statement of Net Assets as an asset (liability) and in the Statement of Operations as unrealized appreciation (depreciation) until the contracts are closed, when they are recorded as realized forward currency contract gains (losses).
4. Repurchase Agreements: The fund may enter into repurchase agreements. Securities pledged as collateral for repurchase agreements are held by a custodian bank until the agreements mature. Each agreement requires that the market value of the collateral be sufficient to cover payments of interest and principal. In the event of default or bankruptcy by the other party to the agreement, the fund may sell or retain the collateral; however such action may be subject to legal proceedings.
5. Federal Income Taxes: The fund intends to continue to qualify as a regulated investment company and distribute all of its taxable income. Management has analyzed the fund’s tax positions taken for all open federal income tax years (January 31, 2009–2012), and has concluded that no provision for federal income tax is required in the fund’s financial statements.
6. Distributions: Distributions to shareholders are recorded on the ex-dividend date.
7. Security Lending: The fund may lend its securities to qualified institutional borrowers to earn additional income. Security loans are required to be secured at all times by collateral at least equal to the market value of securities loaned. The fund invests cash collateral received in Vanguard Market Liquidity Fund, and records a liability for the return of the collateral, during the period the securities are on loan. Security lending income represents fees charged to borrowers plus income earned on investing cash collateral, less expenses associated with the loan.
8. Other: Dividend income is recorded on the ex-dividend date. Interest income is accrued daily. Premiums and discounts on debt securities purchased are amortized and accreted, respectively, to interest income over the lives of the respective securities. Security transactions are accounted for on the date securities are bought or sold. Costs used to determine realized gains (losses) on the sale of investment securities are those of the specific securities sold. Fees assessed on redemptions of capital shares are credited to paid-in capital.
Each class of shares has equal rights as to assets and earnings, except that each class separately bears certain class-specific expenses related to maintenance of shareholder accounts (included in Management and Administrative expenses) and shareholder reporting. Marketing and distribution expenses are allocated to each class of shares based on a method approved by the board of trustees. Income, other non-class-specific expenses, and gains and losses on investments are allocated to each class of shares based on its relative net assets.
B. Wellington Management Company, LLP provides investment advisory services to the fund for a fee calculated at an annual percentage rate of average net assets. For the year ended January 31, 2012, the investment advisory fee represented an effective annual rate of 0.15% of the fund’s average net assets.
21
Health Care Fund
C. The Vanguard Group furnishes at cost corporate management, administrative, marketing, and distribution services. The costs of such services are allocated to the fund under methods approved by the board of trustees. The fund has committed to provide up to 0.40% of its net assets in capital contributions to Vanguard. At January 31, 2012, the fund had contributed capital of $3,364,000 to Vanguard (included in Other Assets), representing 0.02% of the fund’s net assets and 1.35% of Vanguard’s capitalization. The fund’s trustees and officers are also directors and officers of Vanguard.
D. Various inputs may be used to determine the value of the fund’s investments. These inputs are summarized in three broad levels for financial statement purposes. The inputs or methodologies used to value securities are not necessarily an indication of the risk associated with investing in those securities.
Level 1—Quoted prices in active markets for identical securities.
Level 2—Other significant observable inputs (including quoted prices for similar securities, interest rates, prepayment speeds, credit risk, etc.).
Level 3—Significant unobservable inputs (including the fund’s own assumptions used to determine the fair value of investments).
The following table summarizes the market value of the fund’s investments as of January 31, 2012, based on the inputs used to value them:
| | | |
| | Level 1 | Level 2 | Level 3 |
| Investments | ($000) | ($000) | ($000) |
| Common Stocks—U.S. | 15,518,962 | — | — |
| Common Stocks—International | 461,797 | 3,996,500 | — |
| Temporary Cash Investments | — | 1,477,598 | — |
| Forward Currency Contracts—Liabilities | — | (1,884) | — |
| Total | 15,980,759 | 5,472,214 | — |
At January 31, 2012, the fund had open forward currency contracts to receive and deliver currencies as follows. Unrealized appreciation (depreciation) on open forward currency contracts is treated as realized gain (loss) for tax purposes.
| | | | | | |
| | | | | | | Unrealized |
| | Contract | | | | | Appreciation |
| | Settlement | | | Contract Amount (000) | (Depreciation) |
| Counterparty | Date | | Receive | | Deliver | ($000) |
| Bank of America NA | 2/23/12 | USD | 19,062,436 | JPY | 250,080 | (1,884) |
JPY—Japanese yen.
USD—U.S. dollar.
E. Distributions are determined on a tax basis and may differ from net investment income and realized capital gains for financial reporting purposes. Differences may be permanent or temporary. Permanent differences are reclassified among capital accounts in the financial statements to reflect their tax character. Temporary differences arise when certain items of income, expense, gain, or loss are recognized in different periods for financial statement and tax purposes; these differences will reverse at some time in the future. Differences in classification may also result from the treatment of short-term gains as ordinary income for tax purposes.
22
Health Care Fund
During the year ended January 31, 2012, the fund realized net foreign currency losses of $5,183,000, which decreased distributable net income for tax purposes; accordingly, such losses have been reclassified from accumulated net realized gains to overdistributed net investment income. Certain of the fund’s investments are in securities considered to be “passive foreign investment companies,” for which any unrealized appreciation and/or realized gains are required to be included in distributable net income for tax purposes. Unrealized appreciation of $19,498,000 on the fund’s passive foreign investment company holdings through October 31, 2011 (the most recent previous mark-to-market date for tax purposes), has been distributed and is reflected in the balance of overdistributed net investment income. Since October 31, 2011, the fund’s passive foreign investment company holdings have appreciated in value by $3,968,000, increasing the amount of taxable income available for distribution as of January 31, 2012. Unrealized appreciation of the fund’s passive foreign investment company holdings at January 31, 2012, was $23,466,000.
The fund used a tax accounting practice to treat a portion of the price of capital shares redeemed during the year as distributions from net investment income and realized capital gains. Accordingly, the fund has reclassified $17,587,000 from overdistributed net investment income, and $34,266,000 from accumulated net realized gains, to paid-in capital.
For tax purposes, at January 31, 2012, the fund had $16,208,000 of ordinary income and $8,659,000 of long-term capital gains available for distribution.
At January 31, 2012, the cost of investment securities for tax purposes was $14,186,393,000. Net unrealized appreciation of investment securities for tax purposes was $7,268,464,000, consisting of unrealized gains of $7,847,370,000 on securities that had risen in value since their purchase and $578,906,000 in unrealized losses on securities that had fallen in value since their purchase.
F. During the year ended January 31, 2012, the fund purchased $1,483,607,000 of investment securities and sold $2,108,639,000 of investment securities, other than temporary cash investments.
G. Capital share transactions for each class of shares were:
| | | | |
| | | | Year Ended January 31, |
| | | 2012 | | 2011 |
| | Amount | Shares | Amount | Shares |
| | ($000) | (000) | ($000) | (000) |
| Investor Shares | | | | |
| Issued | 721,109 | 5,453 | 498,477 | 4,155 |
| Issued in Lieu of Cash Distributions | 436,880 | 3,494 | 369,784 | 3,003 |
| Redeemed1 | (1,675,555) | (12,775) | (4,459,040) | (36,589) |
| Net Increase (Decrease)—Investor Shares | (517,566) | (3,828) | (3,590,779) | (29,431) |
| Admiral Shares | | | | |
| Issued | 1,204,865 | 21,697 | 3,306,725 | 63,748 |
| Issued in Lieu of Cash Distributions | 640,586 | 12,144 | 414,764 | 7,993 |
| Redeemed1 | (1,072,476) | (19,374) | (1,185,915) | (23,405) |
| Net Increase (Decrease)—Admiral Shares | 772,975 | 14,467 | 2,535,574 | 48,336 |
| 1 Net of redemption fees for fiscal 2012 and 2011 of $1,116,000 and $727,000, respectively (fund totals). |
23
Health Care Fund
H. Certain of the fund’s investments are in companies that are considered to be affiliated companies of the fund because the fund owns more than 5% of the outstanding voting securities of the company. Transactions during the period in securities of these companies were as follows:
| | | | | |
| | | | Current Period Transactions | |
| | Jan. 31, 2011 | | Proceeds from | | Jan. 31, 2012 |
| | Market | Purchases | Securities | Dividend | Market |
| | Value | at Cost | Sold | Income | Value |
| | ($000) | ($000) | ($000) | ($000) | ($000) |
| Cephalon Inc. | 337,419 | 5,721 | 456,575 | — | — |
| Coventry Health Care Inc. | 258,566 | — | 3,203 | — | 256,422 |
| Forest Laboratories Inc. | 914,668 | 10,019 | 94,611 | — | 823,198 |
| Health Management Associates Inc. | | | | |
| Class A | 131,558 | 12,348 | 2,845 | — | 99,720 |
| Health Net Inc. | N/A1 | 2,444 | 5,049 | — | 174,112 |
| NuVasive Inc. | 59,526 | — | 14,774 | — | N/A2 |
| | 1,701,737 | | | | 1,353,452 |
1 Not applicable—At January 31, 2011 the issuer was not an affiliated company of the fund.
2 Not applicable—At January 31, 2012, the security was still held, but the issuer was no longer an affiliated company of the fund.
I. In preparing the financial statements as of January 31, 2012, management considered the impact of subsequent events for potential recognition or disclosure in these financial statements.
24
Report of Independent Registered
Public Accounting Firm
To the Trustees of Vanguard Specialized Funds and the Shareholders of Vanguard Health Care Fund:
In our opinion, the accompanying statement of net assets and statement of assets and liabilities and the related statements of operations and of changes in net assets and the financial highlights present fairly, in all material respects, the financial position of Vanguard Health Care Fund (constituting a separate portfolio of Vanguard Specialized Funds, hereafter referred to as the “Fund”) at January 31, 2012, the results of its operations for the year then ended, the changes in its net assets for each of the two years in the period then ended and the financial highlights for each of the five years in the period then ended, in conformity with accounting principles generally accepted in the United States of America. These financial statements and financial highlights (hereafter referred to as “financial statements”) are the responsibility of the Fund’s management; our responsibility is to express an opinion on these financial statements based on our audits. We conducted our audits of these financial statements in accordance with the standards of the Public Company Accounting Oversight Board (United States). Those standards require that we plan and perform the audit to obtain reasonable assurance about whether the financial statements are free of material misstatement. An audit includes examining, on a test basis, evidence supporting the amounts and disclosures in the financial statements, assessing the accounting principles used and significant estimates made by management, and evaluating the overall financial statement presentation. We believe that our audits, which included confirmation of securities at January 31, 2012 by correspondence with the custodians and brokers, provide a reasonable basis for our opinion.
PricewaterhouseCoopers LLP
Philadelphia, Pennsylvania
March 12, 2012
|
| Special 2011 tax information (unaudited) for Vanguard Health Care Fund |
This information for the fiscal year ended January 31, 2012, is included pursuant to provisions of the Internal Revenue Code.
The fund distributed $756,872,000 as capital gain dividends (from net long-term capital gains) to shareholders during the fiscal year.
The fund distributed $404,686,000 of qualified dividend income to shareholders during the fiscal year.
For corporate shareholders, 59.4% of investment income (dividend income plus short-term gains, if any) qualifies for the dividends-received deduction.
25
Your Fund’s After-Tax Returns
This table presents returns for your fund both before and after taxes. The after-tax returns are shown in two ways: (1) assuming that an investor owned the fund during the entire period and paid taxes on the fund’s distributions, and (2) assuming that an investor paid taxes on the fund’s distributions and sold all shares at the end of each period.
Calculations are based on the highest individual federal income tax and capital gains tax rates in effect at the times of the distributions and the hypothetical sales. State and local taxes were not considered. After-tax returns reflect any qualified dividend income , using actual prior-year figures and estimates for 2012. (In the example, returns after the sale of fund shares may be higher than those assuming no sale. This occurs when the sale would have produced a capital loss. The calculation assumes that the investor received a tax deduction for the loss.)
The table shows returns for Investor Shares only; returns for other share classes will differ. Please note that your actual after-tax returns will depend on your tax situation and may differ from those shown. Also note that if you own the fund in a tax-deferred account, such as an individual retirement account or a 401(k) plan, this information does not apply to you. Such accounts are not subject to current taxes.
Finally, keep in mind that a fund’s performance—whether before or after taxes—does not guarantee future results.
Average Annual Total Returns: Health Care Fund Investor Shares
Periods Ended January 31, 2012
| | | |
| | One | Five | Ten |
| | Year | Years | Years |
| Returns Before Taxes | 12.50% | 3.98% | 7.15% |
| Returns After Taxes on Distributions | 11.51 | 2.97 | 6.20 |
| Returns After Taxes on Distributions and Sale of Fund Shares | 9.26 | 3.22 | 6.02 |
Returns do not reflect the 1% fee on redemptions of shares held for less than one year.
26
About Your Fund’s Expenses
As a shareholder of the fund, you incur ongoing costs, which include costs for portfolio management, administrative services, and shareholder reports (like this one), among others. Operating expenses, which are deducted from a fund’s gross income, directly reduce the investment return of the fund.
A fund’s expenses are expressed as a percentage of its average net assets. This figure is known as the expense ratio. The following examples are intended to help you understand the ongoing costs (in dollars) of investing in your fund and to compare these costs with those of other mutual funds. The examples are based on an investment of $1,000 made at the beginning of the period shown and held for the entire period.
The accompanying table illustrates your fund’s costs in two ways:
• Based on actual fund return. This section helps you to estimate the actual expenses that you paid over the period. The ”Ending Account Value“ shown is derived from the fund‘s actual return, and the third column shows the dollar amount that would have been paid by an investor who started with $1,000 in the fund. You may use the information here, together with the amount you invested, to estimate the expenses that you paid over the period.
To do so, simply divide your account value by $1,000 (for example, an $8,600 account value divided by $1,000 = 8.6), then multiply the result by the number given for your fund under the heading ”Expenses Paid During Period.“
• Based on hypothetical 5% yearly return. This section is intended to help you compare your fund‘s costs with those of other mutual funds. It assumes that the fund had a yearly return of 5% before expenses, but that the expense ratio is unchanged. In this case—because the return used is not the fund’s actual return—the results do not apply to your investment. The example is useful in making comparisons because the Securities and Exchange Commission requires all mutual funds to calculate expenses based on a 5% return. You can assess your fund’s costs by comparing this hypothetical example with the hypothetical examples that appear in shareholder reports of other funds.
Note that the expenses shown in the table are meant to highlight and help you compare ongoing costs only and do not reflect transaction costs incurred by the fund for buying and selling securities. Further, the expenses do not include any purchase, redemption, or account service fees described in the fund prospectus. If such fees were applied to your account, your costs would be higher. Your fund does not carry a “sales load.”
The calculations assume no shares were bought or sold during the period. Your actual costs may have been higher or lower, depending on the amount of your investment and the timing of any purchases or redemptions.
You can find more information about the fund’s expenses, including annual expense ratios, in the Financial Statements section of this report. For additional information on operating expenses and other shareholder costs, please refer to your fund’s current prospectus.
27
| | | |
| Six Months Ended January 31, 2012 | | | |
| | Beginning | Ending | Expenses |
| | Account Value | Account Value | Paid During |
| Health Care Fund | 7/31/2011 | 1/31/2012 | Period |
| Based on Actual Fund Return | | | |
| Investor Shares | $1,000.00 | $1,019.37 | $1.78 |
| Admiral Shares | 1,000.00 | 1,019.66 | 1.53 |
| Based on Hypothetical 5% Yearly Return | | | |
| Investor Shares | $1,000.00 | $1,023.44 | $1.79 |
| Admiral Shares | 1,000.00 | 1,023.69 | 1.53 |
The calculations are based on expenses incurred in the most recent six-month period. The fund’s annualized six-month expense ratios for that period are 0.35% for Investor Shares and 0.30% for Admiral Shares. The dollar amounts shown as “Expenses Paid” are equal to the annualized expense ratio multiplied by the average account value over the period, multiplied by the number of days in the most recent six-month period, then divided by the number of days in the most recent 12-month period.
28
Glossary
30-Day SEC Yield. A fund’s 30-day SEC yield is derived using a formula specified by the U.S. Securities and Exchange Commission. Under the formula, data related to the fund’s security holdings in the previous 30 days are used to calculate the fund’s hypothetical net income for that period, which is then annualized and divided by the fund’s estimated average net assets over the calculation period. For the purposes of this calculation, a security’s income is based on its current market yield to maturity (for bonds), its actual income (for asset-backed securities), or its projected dividend yield (for stocks). Because the SEC yield represents hypothetical annualized income, it will differ—at times significantly—from the fund’s actual experience. As a result, the fund’s income distributions may be higher or lower than implied by the SEC yield.
Beta. A measure of the magnitude of a fund’s past share-price fluctuations in relation to the ups and downs of a given market index. The index is assigned a beta of 1.00. Compared with a given index, a fund with a beta of 1.20 typically would have seen its share price rise or fall by 12% when the index rose or fell by 10%. For this report, beta is based on returns over the past 36 months for both the fund and the index. Note that a fund’s beta should be reviewed in conjunction with its R-squared (see definition). The lower the R-squared, the less correlation there is between the fund and the index, and the less reliable beta is as an indicator of volatility.
Dividend Yield. Dividend income earned by stocks, expressed as a percentage of the aggregate market value (or of net asset value, for a fund). The yield is determined by dividing the amount of the annual dividends by the aggregate value (or net asset value) at the end of the period. For a fund, the dividend yield is based solely on stock holdings and does not include any income produced by other investments.
Earnings Growth Rate. The average annual rate of growth in earnings over the past five years for the stocks now in a fund.
Equity Exposure. A measure that reflects a fund’s investments in stocks and stock futures. Any holdings in short-term reserves are excluded.
Expense Ratio. A fund’s total annual operating expenses expressed as a percentage of the fund’s average net assets. The expense ratio includes management and administrative expenses, but does not include the transaction costs of buying and selling portfolio securities.
Foreign Holdings. The percentage of a fund represented by securities or depositary receipts of companies based outside the United States.
Inception Date. The date on which the assets of a fund (or one of its share classes) are first invested in accordance with the fund’s investment objective. For funds with a subscription period, the inception date is the day after that period ends. Investment performance is measured from the inception date.
Median Market Cap. An indicator of the size of companies in which a fund invests; the midpoint of market capitalization (market price x shares outstanding) of a fund’s stocks, weighted by the proportion of the fund’s assets invested in each stock. Stocks representing half of the fund’s assets have market capitalizations above the median, and the rest are below it.
Price/Book Ratio. The share price of a stock divided by its net worth, or book value, per share. For a fund, the weighted average price/book ratio of the stocks it holds.
29
Price/Earnings Ratio. The ratio of a stock’s current price to its per-share earnings over the past year. For a fund, the weighted average P/E of the stocks it holds. P/E is an indicator of market expectations about corporate prospects; the higher the P/E, the greater the expectations for a company’s future growth.
R-Squared. A measure of how much of a fund’s past returns can be explained by the returns from the market in general, as measured by a given index. If a fund’s total returns were precisely synchronized with an index’s returns, its R-squared would be 1.00. If the fund’s returns bore no relationship to the index’s returns, its R-squared would be 0. For this report, R-squared is based on returns over the past 36 months for both the fund and the index.
Return on Equity. The annual average rate of return generated by a company during the past five years for each dollar of shareholder’s equity (net income divided by shareholder’s equity). For a fund, the weighted average return on equity for the companies whose stocks it holds.
Short-Term Reserves. The percentage of a fund invested in highly liquid, short-term securities that can be readily converted to cash.
Turnover Rate. An indication of the fund’s trading activity. Funds with high turnover rates incur higher transaction costs and may be more likely to distribute capital gains (which may be taxable to investors). The turnover rate excludes in-kind transactions, which have minimal impact on costs.
30
This page intentionally left blank.
The People Who Govern Your Fund
The trustees of your mutual fund are there to see that the fund is operated and managed in your best interests since, as a shareholder, you are a part owner of the fund. Your fund’s trustees also serve on the board of directors of The Vanguard Group, Inc., which is owned by the Vanguard funds and provides services to them on an at-cost basis.
A majority of Vanguard’s board members are independent, meaning that they have no affiliation with Vanguard or the funds they oversee, apart from the sizable personal investments they have made as private individuals. The independent board members have distinguished backgrounds in business, academia, and public service. Each of the trustees and executive officers oversees 181 Vanguard funds.
The following table provides information for each trustee and executive officer of the fund. More information about the trustees is in the Statement of Additional Information, which can be obtained, without charge, by contacting Vanguard at 800-662-7447, or online at vanguard.com.
| |
| Interested Trustee1 | (chemicals); Director of Tyco International, Ltd. |
| | (diversified manufacturing and services) and Hewlett- |
| F. William McNabb III | Packard Co. (electronic computer manufacturing); |
| Born 1957. Trustee Since July 2009. Chairman of the | Senior Advisor at New Mountain Capital; Trustee |
| Board. Principal Occupation(s) During the Past Five | of The Conference Board; Member of the Board of |
| Years: Chairman of the Board of The Vanguard Group, | Managers of Delphi Automotive LLP (automotive |
| Inc., and of each of the investment companies served | components). |
| by The Vanguard Group, since January 2010; Director | |
| of The Vanguard Group since 2008; Chief Executive | Amy Gutmann |
| Officer and President of The Vanguard Group and of | Born 1949. Trustee Since June 2006. Principal |
| each of the investment companies served by The | Occupation(s) During the Past Five Years: President |
| Vanguard Group since 2008; Director of Vanguard | of the University of Pennsylvania; Christopher H. |
| Marketing Corporation; Managing Director of The | Browne Distinguished Professor of Political Science |
| Vanguard Group (1995–2008). | in the School of Arts and Sciences with secondary |
| | appointments at the Annenberg School for Commu- |
| | nication and the Graduate School of Education |
| Independent Trustees | of the University of Pennsylvania; Director of |
| | Carnegie Corporation of New York, Schuylkill River |
| Emerson U. Fullwood | Development Corporation, and Greater Philadelphia |
| Born 1948. Trustee Since January 2008. Principal | Chamber of Commerce; Trustee of the National |
| Occupation(s) During the Past Five Years: Executive | Constitution Center; Chair of the Presidential |
| Chief Staff and Marketing Officer for North America | Commission for the Study of Bioethical Issues. |
| and Corporate Vice President (retired 2008) of Xerox | |
| Corporation (document management products and | JoAnn Heffernan Heisen |
| services); Executive in Residence and 2010 | Born 1950. Trustee Since July 1998. Principal |
| Distinguished Minett Professor at the Rochester | Occupation(s) During the Past Five Years: Corporate |
| Institute of Technology; Director of SPX Corporation | Vice President and Chief Global Diversity Officer |
| (multi-industry manufacturing), the United Way of | (retired 2008) and Member of the Executive |
| Rochester, Amerigroup Corporation (managed health | Committee (1997–2008) of Johnson & Johnson |
| care), the University of Rochester Medical Center, | (pharmaceuticals/consumer products); Director of |
| Monroe Community College Foundation, and North | Skytop Lodge Corporation (hotels), the University |
| Carolina A&T University. | Medical Center at Princeton, the Robert Wood |
| | Johnson Foundation, and the Center for Work Life |
| Rajiv L. Gupta | Policy; Member of the Advisory Board of the |
| Born 1945. Trustee Since December 2001.2 | Maxwell School of Citizenship and Public Affairs |
| Principal Occupation(s) During the Past Five Years: | at Syracuse University. |
| Chairman and Chief Executive Officer (retired 2009) | |
| and President (2006–2008) of Rohm and Haas Co. | |
| | |
| F. Joseph Loughrey | the investment companies served by The Vanguard |
| Born 1949. Trustee Since October 2009. Principal | Group since 2010; Assistant Controller of each of |
| Occupation(s) During the Past Five Years: President | the investment companies served by The Vanguard |
| and Chief Operating Officer (retired 2009) and Vice | Group (2001–2010). | |
| Chairman of the Board (2008–2009) of Cummins Inc. | | |
| (industrial machinery); Director of SKF AB (industrial | Thomas J. Higgins | |
| machinery), Hillenbrand, Inc. (specialized consumer | Born 1957. Chief Financial Officer Since September |
| services), the Lumina Foundation for Education, and | 2008. Principal Occupation(s) During the Past Five |
| Oxfam America; Chairman of the Advisory Council | Years: Principal of The Vanguard Group, Inc.; Chief |
| for the College of Arts and Letters and Member | Financial Officer of each of the investment companies |
| of the Advisory Board to the Kellogg Institute for | served by The Vanguard Group since 2008; Treasurer |
| International Studies at the University of Notre Dame. | of each of the investment companies served by The |
| | Vanguard Group (1998–2008). |
| André F. Perold | | |
| Born 1952. Trustee Since December 2004. Principal | Kathryn J. Hyatt | |
| Occupation(s) During the Past Five Years: George | Born 1955. Treasurer Since November 2008. Principal |
| Gund Professor of Finance and Banking at the Harvard | Occupation(s) During the Past Five Years: Principal |
| Business School (retired July 2011); Chief Investment | of The Vanguard Group, Inc.; Treasurer of each of |
| Officer and Managing Partner of HighVista Strategies | the investment companies served by The Vanguard |
| LLC (private investment firm); Director of Rand | Group since 2008; Assistant Treasurer of each of the |
| Merchant Bank; Overseer of the Museum of Fine | investment companies served by The Vanguard Group |
| Arts Boston. | (1988–2008). | |
| |
| Alfred M. Rankin, Jr. | Heidi Stam | |
| Born 1941. Trustee Since January 1993. Principal | Born 1956. Secretary Since July 2005. Principal |
| Occupation(s) During the Past Five Years: Chairman, | Occupation(s) During the Past Five Years: Managing |
| President, and Chief Executive Officer of NACCO | Director of The Vanguard Group, Inc., since 2006; |
| Industries, Inc. (forklift trucks/housewares/lignite); | General Counsel of The Vanguard Group since 2005; |
| Director of Goodrich Corporation (industrial products/ | Secretary of The Vanguard Group and of each of the |
| aircraft systems and services) and the National | investment companies served by The Vanguard Group |
| Association of Manufacturers; Chairman of the Federal | since 2005; Director and Senior Vice President of |
| Reserve Bank of Cleveland and of University Hospitals | Vanguard Marketing Corporation since 2005; |
| of Cleveland; Advisory Chairman of the Board of The | Principal of The Vanguard Group (1997–2006). |
| Cleveland Museum of Art. | | |
| |
| Peter F. Volanakis | Vanguard Senior Management Team |
| Born 1955. Trustee Since July 2009. Principal | | |
| Occupation(s) During the Past Five Years: President | Mortimer J. Buckley | Michael S. Miller |
| and Chief Operating Officer (retired 2010) of Corning | Kathleen C. Gubanich | James M. Norris |
| Incorporated (communications equipment); Director of | Paul A. Heller | Glenn W. Reed |
| Corning Incorporated (2000-2010) and Dow Corning | Martha G. King | George U. Sauter |
| (2001-2010); Director of SPX Corporation (multi- | Chris D. McIsaac | |
| industry manufacturing), the Corning Foundation, and | | |
| the Corning Museum of Glass; Overseer of the Amos | Chairman Emeritus and Senior Advisor |
| Tuck School of Business Administration at Dartmouth | | |
| College; Advisor to the Norris Cotton Cancer Center. | John J. Brennan | |
| | Chairman, 1996–2009 | |
| |
| Executive Officers | Chief Executive Officer and President, 1996–2008 |
| |
| Glenn Booraem | Founder | |
| Born 1967. Controller Since July 2010. Principal | | |
| Occupation(s) During the Past Five Years: Principal | John C. Bogle | |
| of The Vanguard Group, Inc.; Controller of each of | Chairman and Chief Executive Officer, 1974–1996 |
1 Mr. McNabb is considered an “interested person,” as defined in the Investment Company Act of 1940, because he is an officer of the Vanguard funds.
2 December 2002 for Vanguard Equity Income Fund, Vanguard Growth Equity Fund, the Vanguard Municipal Bond Funds, and the Vanguard State Tax-Exempt Funds.
| 
|
| P.O. Box 2600 |
| Valley Forge, PA 19482-2600 |
Connect with Vanguard® > vanguard.com
| |
| Fund Information > 800-662-7447 | CFA® is a trademark owned by CFA Institute. |
| Direct Investor Account Services > 800-662-2739 | |
| Institutional Investor Services > 800-523-1036 | |
| Text Telephone for People | |
| With Hearing Impairment > 800-749-7273 | |
| |
| This material may be used in conjunction | |
| with the offering of shares of any Vanguard | |
| fund only if preceded or accompanied by | |
| the fund’s current prospectus. | |
| |
| All comparative mutual fund data are from Lipper Inc. or | |
| Morningstar, Inc., unless otherwise noted. | |
| |
| You can obtain a free copy of Vanguard’s proxy voting | |
| guidelines by visiting vanguard.com/proxyreporting or by | |
| calling Vanguard at 800-662-2739. The guidelines are | |
| also available from the SEC’s website, sec.gov. In | |
| addition, you may obtain a free report on how your fund | |
| voted the proxies for securities it owned during the 12 | |
| months ended June 30. To get the report, visit either | |
| vanguard.com/proxyreporting or sec.gov. | |
| |
| You can review and copy information about your fund at | |
| the SEC’s Public Reference Room in Washington, D.C. To | |
| find out more about this public service, call the SEC at | |
| 202-551-8090. Information about your fund is also | |
| available on the SEC’s website, and you can receive | |
| copies of this information, for a fee, by sending a | |
| request in either of two ways: via e-mail addressed to | |
| publicinfo@sec.gov or via regular mail addressed to the | |
| Public Reference Section, Securities and Exchange | |
| Commission, Washington, DC 20549-1520. | |
| |
| |
| | © 2012 The Vanguard Group, Inc. |
| | All rights reserved. |
| | Vanguard Marketing Corporation, Distributor. |
| |
| | Q520 032012 |

Annual Report | January 31, 2012
Vanguard REIT Index Fund
> Vanguard REIT Index Fund returned nearly 12% for the fiscal year ended January 31, 2012, closely tracking its benchmark index and finishing ahead of the average return for real estate funds.
> REITs posted double-digit returns for the third straight year and surpassed the broad stock market by a significant margin.
> Most segments of the REIT market delivered solid results, with retail REITs recording the strongest showing.
| |
| Contents | |
| Your Fund’s Total Returns. | 1 |
| Chairman’s Letter. | 2 |
| Fund Profile. | 7 |
| Performance Summary. | 8 |
| Financial Statements. | 11 |
| Your Fund’s After-Tax Returns. | 30 |
| About Your Fund’s Expenses. | 31 |
| Glossary. | 33 |
 REIT Index Fund
Please note: The opinions expressed in this report are just that—informed opinions. They should not be considered promises or advice.
Also, please keep in mind that the information and opinions cover the period through the date on the front of this report. Of course, the risks of investing in your fund are spelled out in the prospectus.
See the Glossary for definitions of investment terms used in this report.
About the cover: Vanguard was named for the HMS Vanguard, flagship of British Admiral Horatio Nelson. A ship—whose performance and safety depend on the work of all hands—has served as a fitting metaphor for the Vanguard crew as we strive to help clients reach their financial goals.
Your Fund’s Total Returns
Fiscal Year Ended January 31, 2012
| |
| | Total |
| | Returns |
| Vanguard REIT Index Fund | |
| Investor Shares | 11.80% |
| Admiral™ Shares | 11.95 |
| Signal® Shares | 11.96 |
| Institutional Shares | 12.01 |
| ETF Shares | |
| Market Price | 11.93 |
| Net Asset Value | 11.94 |
| MSCI US REIT Index | 12.01 |
| Real Estate Funds Average | 11.08 |
| Real Estate Funds Average: Derived from data provided by Lipper Inc. |
Admiral Shares carry lower expenses and are available to investors who meet certain account-balance requirements. Signal Shares and Institutional Shares are available to certain institutional investors who meet specific administrative, service, and account-size criteria. The Vanguard ETF® Shares shown are traded on the NYSE Arca exchange and are available only through brokers. The table provides ETF returns based on both the NYSE Arca market price and the net asset value for a share. U.S. Pat. No. 6,879,964 B2; 7,337,138; 7,720,749; 7,925,573; 8,090,646.
For the ETF Shares, the market price is determined by the midpoint of the bid-offer spread as of the closing time of the New York Stock Exchange (generally 4 p.m., Eastern time). The net asset value is also determined as of the NYSE closing time. For more information about how the ETF Shares' market prices have compared with their net asset value, visit vanguard.com, select your ETF, and then select the Price and Performance tab. The ETF premium/discount analysis there shows the percentages of days on which the ETF Shares' market price was above or below the NAV.
Your Fund’s Performance at a Glance
January 31, 2011 , Through January 31, 2012
| | | | | |
| | | | Distributions Per Share | |
| | Starting | Ending | Income | Capital | Return of |
| | Share Price | Share Price | Dividends | Gains | Capital |
| Vanguard REIT Index Fund | | | | | |
| Investor Shares | $18.99 | $20.50 | $0.439 | $0.000 | $0.215 |
| Admiral Shares | 81.03 | 87.47 | 1.948 | 0.000 | 0.957 |
| Signal Shares | 21.63 | 23.35 | 0.520 | 0.000 | 0.256 |
| Institutional Shares | 12.54 | 13.54 | 0.304 | 0.000 | 0.149 |
| ETF Shares | 57.17 | 61.72 | 1.375 | 0.000 | 0.675 |
1

Chairman’s Letter
Dear Shareholder,
Real estate investment trusts weren’t immune to the turmoil that plagued the broader stock market over the past fiscal year, but they emerged from the volatility in much better shape than most market sectors. After two fiscal years of results that topped 40%, REITs registered a more modest––but still commendable–– showing for the year ended January 31, 2012.
Vanguard REIT Index Fund returned about 12% for the period, a performance that was in line with that of its benchmark, the MSCI US REIT Index, a bit better than the average return of its peer group, and more than triple the return of the broader market, as measured by the Dow Jones U.S. Total Stock Market Index.
Most sectors of the REIT market finished the year with solid returns. Retail, specialized, and residential REITs––the portfolio’s largest segments by market capitalization––all made significant contributions to performance. The return of office REITs was more subdued.
If you own the fund in a taxable account, you may wish to review information about its aftertax returns provided later in this report.
Volatility was a constant
in fast-changing markets
For the 12 months ended January 31, the broad U.S. stock market returned 3.55%. This modest result reflected rallies and
2
reversals driven by drama on the global stage, including Europe’s debt crisis and rating agency Standard & Poor’s decision to downgrade the U.S. credit rating. (Vanguard’s confidence in the full faith and credit of the U.S. Treasury remains unshaken.)
The recent volatility is consistent with the pattern of the past five years, as suggested by the figures in the Market Barometer. The dramatic differences in average annual returns over the one, three, and fiveyear periods are a consequence of the stock market’s heady spikes and precipitous declines.
Although the outcome was different, this turbulence is also apparent in the returns of international stock markets. In the past 12 months, nonU.S. stock markets delivered negative results. Weakness was widespread, with the worst returns in Europe and Japan.
Modest yields and high returns
in the bond market
Bonds ended the fiscal year with surprisingly strong returns. At the start of the period, the 10year Treasury note’s slender yield of 3.38% seemed like a good reason to temper expectations. As stock market volatility spiked and investors put a premium on safety, however, yields moved lower still. The 10year Tnote finished the period at 1.80%. The Barclays Capital U.S. Aggregate Bond Index, a broad taxable bond market benchmark, returned 8.66%.
| | | |
| Market Barometer | | | |
| |
| | | Average Annual Total Returns |
| | | Periods Ended January 31, 2012 |
| | One | Three | Five |
| | Year | Years | Years |
| Stocks | | | |
| Russell 1000 Index (Large-caps) | 3.95% | 20.01% | 0.55% |
| Russell 2000 Index (Small-caps) | 2.86 | 23.03 | 1.19 |
| Dow Jones U.S. Total Stock Market Index | 3.55 | 20.54 | 0.88 |
| MSCI All Country World Index ex USA (International) | -8.75 | 16.70 | -1.71 |
| |
| Bonds | | | |
| Barclays Capital U.S. Aggregate Bond Index (Broad | | | |
| taxable market) | 8.66% | 7.40% | 6.70% |
| Barclays Capital Municipal Bond Index (Broad | | | |
| tax-exempt market) | 14.10 | 8.10 | 5.76 |
| Citigroup Three-Month U.S. Treasury Bill Index | 0.07 | 0.10 | 1.27 |
| |
| CPI | | | |
| Consumer Price Index | 2.93% | 2.39% | 2.29% |
3
Municipal bonds did even better, as prices snapped back from a feardriven plunge in the months preceding the new fiscal year. Although last year’s low expectations proved misguided, it’s worth remembering that low yields do imply lower future returns: As yields tumble, the scope for further declines—and increases in prices—diminishes.
Savings instruments such as the 3month Treasury bill returned a little more than 0%, consistent with the Federal Reserve’s target for the shortestterm interest rates.
REIT stocks trumped
the broader U.S. market
REITs own and sometimes operate properties that produce income. Their fortunes are tied to occupancy rates, and supply and demand dictates what they can charge for rent. To qualify as a REIT, a company must distribute at least 90% of its taxable income to investors as dividends, and in an environment of low interest rates, REITs have attracted yieldstarved investors. It’s worth remembering, of course, that REITs offer high dividend yields not because they are necessarily any better than other companies at generating income, but because they must pay out just about all of their earnings.
Although REITs hit some air pockets over the recent period, investors still found them desirable, especially compared with the broader market. Just like the broader market, REITs climbed at the fiscal year’s start, dropped over the second and third
Expense Ratios
Your Fund Compared With Its Peer Group
| | | | | | |
| | | | | | | Peer |
| | Investor | Admiral | Signal | Institutional | ETF | Group |
| | Shares | Shares | Shares | Shares | Shares | Average |
| REIT Index Fund | 0.26% | 0.12% | 0.12% | 0.08% | 0.12% | 1.33% |
The fund expense ratios shown are from the prospectus dated May 26, 2011, and represent estimated costs for the current fiscal year. For the fiscal year ended January 31, 2012, the fund’s expense ratios were 0.24% for Investor Shares, 0.10% for Admiral Shares, 0.10% for Signal Shares, 0.08% for Institutional Shares, and 0.10% for ETF Shares. The peer-group expense ratio is derived from data provided by Lipper Inc. and captures information through year-end 2011.
Peer group: Real Estate Funds.
4
quarters as investors worried about the possible impact of Europe’s debt crisis on the U.S. economy, and rallied again in the fourth as the economy showed signs of improvement. But REITs’ peaks were higher than those of the broader market, and their valleys not as low.
Within the retail group, highend shopping malls and centers were the brightest spots, benefiting from a surge in luxury spending. The popularity of internet shopping hasn’t prevented upscale consumers from flocking to destination stores, many of which occupy space in highrent malls and shopping districts.
On the other hand, residential and specialized REITs benefited from the continued effects of the economic crisis. The sour housing market pushed demand for rentals up, which helped residential REITs, and gave a boost to the selfstorage industry, a top performer in specialized REITs.
Office REITs delivered a mixed performance. Many companies, still wary after the financial crisis’s wreckage, haven’t shifted into a hiring mode. The two smallest areas of the market, industrial and diversified REITs, turned in flat and negative results, respectively.
Impressive long-term record
despite periods of turmoil
Over the past decade, the Investor Shares of the REIT Index Fund have posted an average annual return of 10.91%. Although the REIT market faced great challenges, including the severe subprime mortgage
Total Returns
Ten Years Ended January 31, 2012
| |
| | Average |
| | Annual Return |
| REIT Index Fund Investor Shares | 10.91% |
| REIT Spliced Index | 10.92 |
| Real Estate Funds Average | 10.25 |
REIT Spliced Index: MSCI US REIT Index adjusted to include a 2% cash position (Lipper Money Market Average) through April 30, 2009; MSCI US REIT Index thereafter.
Real Estate Funds Average: Derived from data provided by Lipper Inc.
The figures shown represent past performance, which is not a guarantee of future results. (Current performance may be lower or higher than the performance data cited. For performance data current to the most recent month-end, visit our website at vanguard.com/performance.) Note, too, that both investment returns and principal value can fluctuate widely, so an investor’s shares, when sold, could be worth more or less than their original cost.
5
problems that triggered the financial crisis and recession, it has significantly outperformed the broader market over the decade.
The portfolio has captured the REIT market’s strength by closely tracking its benchmark index. That it has done so is a tribute to the experience and skill of the portfolio’s advisor, Vanguard Quantitative Equity Group. The group’s efforts are aided by the portfolio’s low operating expenses.
REITs can further diversify
a well-constructed program
While the REIT Index Fund has produced a notable record over the past decade, it’s important to remember that REITs are narrowly focused investments that can experience a high degree of volatility. The solid––even sensational––gains of the last three years were preceded by fiscalyear returns of about –48% for 2009 and –23% for 2008.
A good way to prepare for these unpredictable, but inevitable, reversals is to construct a balanced portfolio of stock, bond, and money market funds that is tailored to your specific goals, time horizon, and risk tolerance. Diversification and balance give you the opportunity to benefit from the longterm growth potential in riskier assets while offering some protection against shortterm setbacks.
For those investors who can tolerate the highs and lows that inevitably accompany a narrowly focused investment, the REIT Index Fund, with its low expenses, can play a role in a welldiversified investment program.
As always, thank you for entrusting your assets to Vanguard.
Sincerely,

F. William McNabb III
Chairman and Chief Executive Officer
February 14, 2012
6
REIT Index Fund
Fund Profile
As of January 31, 2012
| | | | | |
| Share-Class Characteristics | | | | | |
| | Investor | Admiral | Signal | Institutional | |
| | Shares | Shares | Shares | Shares | ETF Shares |
| Ticker Symbol | VGSIX | VGSLX | VGRSX | VGSNX | VNQ |
| Expense Ratio1 | 0.26% | 0.12% | 0.12% | 0.08% | 0.12% |
| | | |
| Portfolio Characteristics | | |
| | | | DJ |
| | | | U.S. Total |
| | | MSCI US | Market |
| | Fund | REIT Index | Index |
| Number of Stocks | 112 | 111 | 3,738 |
| Median Market Cap | $11.0B | $11.0B | $32.6B |
| Price/Earnings Ratio | 61.0x | 60.8x | 15.5x |
| Price/Book Ratio | 2.2x | 2.2x | 2.2x |
| Return on Equity | 4.9% | 4.9% | 19.1% |
| Earnings Growth Rate | 0.4% | 0.3% | 7.1% |
| Dividend Yield | 3.6% | 3.6% | 2.0% |
| Foreign Holdings | 0.0% | 0.0% | 0.0% |
| Turnover Rate | 10% | — | — |
| Short-Term Reserves | 0.7% | — | — |
| Dividend Yield: This yield may include some payments that represent a return of capital, capital gains distributions, or both by the underlying REITs. These amounts are determined by each REITat the end of its fiscal year. |
|
|
| | | |
| |
| |
| Subindustry Diversification (% of equity exposure) |
| | | |
| | | | MSCI US |
| | | Fund | REIT Index |
| Diversified REITs | | 6.1% | 6.0% |
| Industrial REITs | | 5.0 | 4.9 |
| Office REITs | | 16.1 | 16.2 |
| Residential REITs | | 18.4 | 18.3 |
| Retail REITs | | 26.3 | 26.3 |
| Specialized REITs | | 28.1 | 28.3 |
| | |
| Volatility Measures | | |
| | | DJ |
| | REIT | U.S. Total |
| | Spliced | Market |
| | Index | Index |
| R-Squared | 1.00 | 0.70 |
| Beta | 1.01 | 1.33 |
| These measures show the degree and timing of the fund’s fluctuations compared with the indexes over 36 months. |
|
| |
| Ten Largest Holdings (% of total net assets) |
| Simon Property Group | | |
| Inc. | Retail REITs | 10.3% |
| Public Storage | Specialized REITs | 5.2 |
| Equity Residential | Residential REITs | 4.6 |
| HCP Inc. | Specialized REITs | 4.4 |
| Ventas Inc. | Specialized REITs | 4.3 |
| Boston Properties Inc. | Office REITs | 3.9 |
| ProLogis Inc. | Industrial REITs | 3.8 |
| Vornado Realty Trust | Diversified REITs | 3.5 |
| AvalonBay Communities | | |
| Inc. | Residential REITs | 3.3 |
| Host Hotels & Resorts | | |
| Inc. | Specialized REITs | 3.0 |
| Top Ten | | 46.3% |
| The holdings listed exclude any temporary cash investments and equity index products. |
| | |
1 The expense ratios shown are from the prospectus dated May 26, 2011, and represent estimated costs for the current fiscal year. For the fiscal year ended January 31, 2012, the expense ratios were 0.24% for Investor Shares, 0.10% for Admiral Shares, 0.10% for Signal Shares, 0.08% for Institutional Shares, and 0.10% for ETF Shares.
7
REIT Index Fund
Performance Summary
All of the returns in this report represent past performance, which is not a guarantee of future results that may be achieved by the fund. (Current performance may be lower or higher than the performance data cited. For performance data current to the most recent month-end, visit our website at vanguard.com/performance.) Note, too, that both investment returns and principal value can fluctuate widely, so an investor’s shares, when sold, could be worth more or less than their original cost. The returns shown do not reflect taxes that a shareholder would pay on fund distributions or on the sale of fund shares.
Cumulative Performance: January 31, 2002, Through January 31, 2012
Initial Investment of $10,000
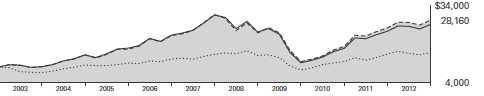
| | | | |
| | | Average Annual Total Returns | |
| | | Periods Ended January 31, 2012 | |
| | | | | Final Value |
| | One | Five | Ten | of a $10,000 |
| | Year | Years | Years | Investment |
| REIT Index Fund Investor Shares | 11.80% | -1.43% | 10.91% | $28,160 |
| Dow Jones U.S. Total Stock Market | | | | |
| Index | 3.55 | 0.88 | 4.55 | 15,604 |
| REIT Spliced Index | 12.01 | -1.46 | 10.92 | 28,202 |
| Real Estate Funds Average | 11.08 | -2.56 | 10.25 | 26,536 |
REIT Spliced Index: MSCI US REIT Index adjusted to include a 2% cash position (Lipper Money Market Average) through April 30, 2009; MSCI US REIT Index thereafter.
Real Estate Funds Average: Derived from data provided by Lipper Inc.
| | | | |
| | | | | Final Value |
| | One | Five | Ten | of a $10,000 |
| | Year | Years | Years | Investment |
| REIT Index Fund Admiral Shares | 11.95% | -1.31% | 11.00% | $28,406 |
| Dow Jones U.S. Total Stock Market Index | 3.55 | 0.88 | 4.55 | 15,604 |
| REIT Spliced Index | 12.01 | -1.46 | 10.92 | 28,202 |
Vanguard fund returns do not reflect the 1% fee on redemptions of shares held for less than one year. The fee does not apply to the ETF Shares.
See Financial Highlights for dividend and capital gains information.
8
REIT Index Fund
| | | |
| | Average Annual Total Returns | |
| | Periods Ended January 31, 2012 | |
| | | Since | Final Value |
| | One | Inception | of a $10,000 |
| | Year | (6/4/2007) | Investment |
| REIT Index Fund Signal Shares | 11.96% | -0.45% | $9,794 |
| Dow Jones U.S. Total Stock Market Index | 3.55 | -0.67 | 9,694 |
| REIT Spliced Index | 12.01 | -0.60 | 9,725 |
"Since Inception" performance is calculated from the Signal Shares’ inception date for both the fund and its comparative standards.
| | | | |
| | | | Since | Final Value |
| | One | Five | Inception | of a $5,000,000 |
| | Year | Years | (12/2/2003) | Investment |
| REIT Index Fund Institutional Shares | 12.01% | -1.28% | 9.24% | $10,291,608 |
| Dow Jones U.S. Total Stock Market Index | 3.55 | 0.88 | 5.37 | 7,660,974 |
| REIT Spliced Index | 12.01 | -1.46 | 9.11 | 10,191,825 |
"Since Inception" performance is calculated from the Institutional Shares’ inception date for both the fund and its comparative standards.
| | | | |
| | | | Since | Final Value |
| | One | Five | Inception | of a $10,000 |
| | Year | Years | (9/23/2004) | Investment |
| REIT Index Fund | | | | |
| ETF Shares Net Asset Value | 11.94% | -1.32% | 8.32% | $17,998 |
| Dow Jones U.S. Total Stock Market Index | 3.55 | 0.88 | 5.27 | 14,595 |
| REIT Spliced Index | 12.01 | -1.46 | 8.21 | 17,872 |
"Since Inception" performance is calculated from the ETF Shares’ inception date for both the fund and its comparative standards.
Cumulative Returns of ETF Shares:September 23, 2004 , Through January 31, 2012
| | | |
| | | | Since |
| | One | Five | Inception |
| | Year | Years | (9/23/2004) |
| REIT Index Fund | | | |
| ETF Shares Market Price | 11.93% | -6.45% | 79.92% |
| REIT Index Fund | | | |
| ETF Shares Net Asset Value | 11.94 | -6.42 | 79.98 |
| REIT Spliced Index | 12.01 | -7.07 | 78.72 |
"Since Inception" performance is calculated from the ETF Shares’ inception date for both the fund and its comparative standards.
Vanguard fund returns do not reflect the 1% fee on redemptions of shares held for less than one year. The fee does not apply to the ETF Shares.
9
REIT Index Fund
Fiscal-Year Total Returns (%): January 31, 2002, Through January 31, 2012
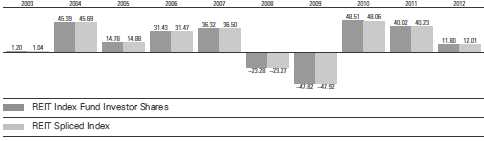
Average Annual Total Returns: Periods Ended December 31, 2011
This table presents returns through the latest calendar quarter—rather than through the end of the fiscal period.
Securities and Exchange Commission rules require that we provide this information.
| | | | |
| | Inception | One | Five | Ten |
| | Date | Year | Years | Years |
| Investor Shares | 5/13/1996 | 8.47% | -1.06% | 10.19% |
| Admiral Shares | 11/12/2001 | 8.62 | -0.93 | 10.28 |
| Signal Shares | 6/4/2007 | 8.62 | — | -1.811 |
| Institutional Shares | 12/2/2003 | 8.70 | -0.90 | 8.501 |
| ETF Shares | 9/23/2004 | | | |
| Market Price | | 8.60 | -0.91 | 7.491 |
| Net Asset Value | | 8.62 | -0.94 | 7.491 |
| 1 Return since inception. |
Vanguard fund returns do not reflect the 1% fee on redemptions of shares held for less than one year. The fee does not apply to the ETF
Shares.
10
REIT Index Fund
Financial Statements
Statement of Net Assets
As of January 31, 2012
The fund reports a complete list of its holdings in regulatory filings four times in each fiscal year, at the quarter-ends. For the second and fourth fiscal quarters, the lists appear in the fund’s semiannual and annual reports to shareholders. For the first and third fiscal quarters, the fund files the lists with the Securities and Exchange Commission on Form N-Q. Shareholders can look up the fund’s Forms N-Q on the SEC’s website at sec.gov. Forms N-Q may also be reviewed and copied at the SEC’s Public Reference Room (see the back cover of this report for further information).
| | | |
| | | | Market |
| | | | Value |
| | | Shares | ($000) |
| Real Estate Investment Trusts (99.5%)1 | |
| Diversified REITs (6.1%) | | |
| 2 | Vornado Realty Trust | 9,475,363 | 766,367 |
| 2 | Liberty Property Trust | 6,602,790 | 219,807 |
| 2 | Washington Real Estate | | |
| | Investment Trust | 3,769,036 | 112,317 |
| | PS Business Parks Inc. | 1,128,667 | 70,135 |
| | American Assets | | |
| | Trust Inc. | 1,906,104 | 42,201 |
| 2 | Cousins Properties Inc. | 5,331,204 | 39,291 |
| 2 | Investors Real | | |
| | Estate Trust | 4,640,622 | 34,434 |
| 2 | Retail Opportunity | | |
| | Investments Corp. | 2,781,506 | 32,989 |
| 2 | Winthrop Realty Trust | 1,692,894 | 20,230 |
| *,2 | CapLease Inc. | 3,692,499 | 15,361 |
| | | | 1,353,132 |
| Industrial REITs (4.9%) | | |
| 2 | ProLogis Inc. | 26,202,523 | 830,882 |
| 2 | DCT Industrial Trust Inc. | 14,053,025 | 77,573 |
| 2 | EastGroup Properties Inc. | 1,544,859 | 73,381 |
| *,2 | First Industrial | | |
| | Realty Trust Inc. | 4,697,287 | 53,925 |
| 2 | First Potomac | | |
| | Realty Trust | 2,858,874 | 42,540 |
| | Monmouth Real Estate | | |
| | Investment Corp. | | |
| | Class A | 1,652,554 | 15,385 |
| | | | 1,093,686 |
| Office REITs (16.1%) | | |
| 2 | Boston Properties Inc. | 8,386,183 | 872,582 |
| ^,2 | Digital Realty Trust Inc. | 5,672,964 | 401,986 |
| 2 | SL Green Realty Corp. | 4,878,777 | 358,736 |
| 2 | Alexandria Real Estate | | |
| | Equities Inc. | 3,535,406 | 255,999 |
| 2 | Duke Realty Corp. | 14,430,547 | 193,225 |
| 2 | Piedmont Office Realty | | |
| | Trust Inc. Class A | 9,865,995 | 182,718 |
| 2 | BioMed Realty Trust Inc. | 8,781,202 | 163,067 |
| | | |
| | | | Market |
| | | | Value |
| | | Shares | ($000) |
| 2 | Douglas Emmett Inc. | 6,921,300 | 144,724 |
| 2 | Mack-Cali Realty Corp. | 4,969,337 | 142,918 |
| 2 | Kilroy Realty Corp. | 3,337,386 | 138,935 |
| 2 | Highwoods | | |
| | Properties Inc. | 4,132,919 | 136,758 |
| 2 | Corporate Office | | |
| | Properties Trust | 4,105,155 | 99,468 |
| 2 | DuPont Fabros | | |
| | Technology Inc. | 3,564,661 | 90,899 |
| 2 | Brandywine Realty Trust | 7,737,174 | 82,324 |
| | CommonWealth REIT | 3,775,107 | 74,256 |
| 2 | Lexington Realty Trust | 8,111,111 | 69,756 |
| | Government Properties | | |
| | Income Trust | 2,146,871 | 51,740 |
| 2 | Franklin Street | | |
| | Properties Corp. | 4,184,844 | 42,644 |
| 2 | Coresite Realty Corp. | 1,133,015 | 22,717 |
| | Hudson Pacific | | |
| | Properties Inc. | 1,150,423 | 17,682 |
| *,2 | Parkway Properties Inc. | 1,261,638 | 12,200 |
| | | | 3,555,334 |
| Residential REITs (18.3%) | | |
| 2 | Equity Residential | 16,925,250 | 1,007,899 |
| 2 | AvalonBay | | |
| | Communities Inc. | 5,368,428 | 730,160 |
| 2 | UDR Inc. | 12,506,336 | 325,415 |
| 2 | Camden Property Trust | 4,448,485 | 286,927 |
| 2 | Essex Property Trust Inc. | 1,930,397 | 277,977 |
| 2 | BRE Properties Inc. | 4,266,401 | 221,085 |
| 2 | American Campus | | |
| | Communities Inc. | 3,969,274 | 169,885 |
| *,2 | Apartment Investment | | |
| | & Management Co. | 6,896,101 | 169,368 |
| 2 | Home Properties Inc. | 2,726,395 | 162,439 |
| 2 | Equity Lifestyle | | |
| | Properties Inc. | 2,206,941 | 154,795 |
| 2 | Mid-America Apartment | | |
| | Communities Inc. | 2,120,270 | 135,528 |
| 2 | Post Properties Inc. | 2,881,303 | 128,765 |
11
REIT Index Fund
| | | |
| | | | Market |
| | | | Value |
| | | Shares | ($000) |
| 2 | Colonial Properties Trust | 4,709,504 | 100,689 |
| 2 | Sun Communities Inc. | 1,401,899 | 56,230 |
| 2 | Education Realty | | |
| | Trust Inc. | 5,144,048 | 55,041 |
| 2 | Associated Estates | | |
| | Realty Corp. | 2,372,105 | 39,638 |
| 2 | Campus Crest | | |
| | Communities Inc. | 1,752,062 | 18,730 |
| | | | 4,040,571 |
| Retail REITs (26.2%) | | |
| 2 | Simon Property | | |
| | Group Inc. | 16,759,652 | 2,276,966 |
| 2 | Kimco Realty Corp. | 23,233,015 | 424,002 |
| 2 | Macerich Co. | 7,530,564 | 408,910 |
| | General Growth | | |
| | Properties Inc. | 24,835,805 | 391,909 |
| 2 | Federal Realty | | |
| | Investment Trust | 3,585,287 | 338,666 |
| 2 | Realty Income Corp. | 7,603,884 | 276,781 |
| 2 | Taubman Centers Inc. | 3,304,658 | 221,511 |
| 2 | Regency Centers Corp. | 5,132,337 | 212,068 |
| | DDR Corp. | 12,622,943 | 174,954 |
| 2 | National Retail | | |
| | Properties Inc. | 5,902,624 | 159,430 |
| 2 | Weingarten Realty | | |
| | Investors | 6,553,071 | 159,043 |
| 2 | Tanger Factory | | |
| | Outlet Centers | 4,904,572 | 144,685 |
| 2 | CBL & Associates | | |
| | Properties Inc. | 8,046,010 | 139,759 |
| | Equity One Inc. | 3,599,814 | 67,856 |
| 2 | Glimcher Realty Trust | 6,133,871 | 59,069 |
| 2 | Acadia Realty Trust | 2,430,866 | 51,097 |
| | Alexander’s Inc. | 116,556 | 45,224 |
| 2 | Inland Real Estate Corp. | 5,072,421 | 43,369 |
| 2 | Pennsylvania Real Estate | | |
| | Investment Trust | 3,021,495 | 37,104 |
| | Getty Realty Corp. | 1,525,841 | 25,573 |
| 2 | Ramco-Gershenson | | |
| | Properties Trust | 2,201,871 | 25,476 |
| | Saul Centers Inc. | 702,344 | 25,032 |
| | Urstadt Biddle | | |
| | Properties Inc. Class A | 1,122,783 | 21,962 |
| 2 | Excel Trust Inc. | 1,677,865 | 21,309 |
| 2 | Kite Realty Group Trust | 3,447,414 | 17,237 |
| * | Cedar Realty Trust Inc. | 3,301,539 | 16,475 |
| † | Rouse Properties Inc. | 930,694 | 11,503 |
| | Urstadt Biddle | | |
| | Properties Inc. | 69,255 | 1,308 |
| | | | 5,798,278 |
| Specialized REITs (27.9%) | | |
| | Public Storage | 8,281,110 | 1,149,915 |
| 2 | HCP Inc. | 23,244,244 | 976,956 |
| 2 | Ventas Inc. | 16,436,182 | 958,394 |
| | | |
| | | | Market |
| | | | Value |
| | | Shares | ($000) |
| 2 | Host Hotels & | | |
| | Resorts Inc. | 40,310,837 | 661,904 |
| 2 | Health Care REIT Inc. | 10,833,681 | 619,795 |
| | Senior Housing | | |
| | Properties Trust | 7,216,263 | 163,665 |
| 2 | Extra Space Storage Inc. | 5,112,072 | 134,550 |
| 2 | LaSalle Hotel Properties | 4,857,109 | 131,385 |
| ^,2 | Omega Healthcare | | |
| | Investors Inc. | 5,885,373 | 122,651 |
| | Hospitality | | |
| | Properties Trust | 5,047,508 | 122,301 |
| 2 | Entertainment | | |
| | Properties Trust | 2,663,588 | 118,450 |
| 2 | DiamondRock | | |
| | Hospitality Co. | 9,555,355 | 100,713 |
| 2 | RLJ Lodging Trust | 5,462,617 | 97,453 |
| 2 | Healthcare Realty | | |
| | Trust Inc. | 4,442,951 | 93,613 |
| 2 | CubeSmart | 6,484,235 | 73,791 |
| 2 | Sovran Self Storage Inc. | 1,581,480 | 73,570 |
| 2 | Medical Properties | | |
| | Trust Inc. | 6,376,790 | 68,359 |
| | National Health | | |
| | Investors Inc. | 1,344,822 | 65,103 |
| 2 | Pebblebrook Hotel Trust | 2,905,531 | 64,445 |
| *,2 | Sunstone Hotel | | |
| | Investors Inc. | 6,756,334 | 62,766 |
| 2 | LTC Properties Inc. | 1,731,980 | 55,337 |
| * | Strategic Hotels | | |
| | & Resorts Inc. | 8,476,909 | 52,642 |
| 2 | Hersha Hospitality | | |
| | Trust Class A | 8,728,132 | 47,394 |
| 2 | Sabra Health Care | | |
| | REIT Inc. | 2,105,688 | 29,943 |
| 2 | Chesapeake | | |
| | Lodging Trust | 1,745,002 | 29,717 |
| * | Ashford Hospitality | | |
| | Trust Inc. | 3,108,379 | 28,006 |
| 2 | Universal Health Realty | | |
| | Income Trust | 685,553 | 27,415 |
| *,2 | FelCor Lodging Trust Inc. | 6,758,810 | 25,751 |
| *,2 | Summit Hotel | | |
| | Properties Inc. | 1,557,965 | 14,567 |
| 2 | Cogdell Spencer Inc. | 2,769,514 | 11,770 |
| | | | 6,182,321 |
| Total Real Estate Investment Trusts | |
| (Cost $18,773,168) | | 22,023,322 |
| Temporary Cash Investments (0.8%)1 | |
| Money Market Fund (0.8%) | | |
| 3,4 | Vanguard Market Liquidity | | |
| | Fund, 0.096% | 174,712,989 | 174,713 |
12
REIT Index Fund
| | | |
| | | Face | Market |
| | Amount | Value |
| | | ($000) | ($000) |
| U.S. Government and Agency Obligations (0.0%) |
| 5 | Federal Home Loan Bank | | |
| | Discount Notes, | | |
| | 0.030%, 2/8/12 | 3,000 | 3,000 |
| 6 | Freddie Mac | | |
| | Discount Notes, | | |
| | 0.040%, 2/15/12 | 3,000 | 3,000 |
| 6 | Freddie Mac | | |
| | Discount Notes, | | |
| | 0.050%, 4/4/12 | 5,000 | 4,999 |
| | | | 10,999 |
| Total Temporary Cash Investments | |
| (Cost $185,713) | | 185,712 |
| Total Investments (100.3%) | | |
| (Cost $18,958,881) | | 22,209,034 |
| Other Assets and Liabilities (-0.3%) | |
| Other Assets | | 59,241 |
| Liabilities4 | | (130,971) |
| | | | (71,730) |
| Net Assets (100%) | | 22,137,304 |
| |
| |
| Statement of Assets and Liabilities | |
| Assets | | |
| Investments in Securities, at Value | | 22,209,034 |
| Accrued Income Receivable | | 31,476 |
| Receivables for Capital Shares Issued | 16,863 |
| Other Assets | | 10,902 |
| Total Assets | | 22,268,275 |
| Liabilities | | |
| Security Lending Collateral Payable | | |
| | to Brokers | | 51,508 |
| Payables for Investment Securities | | |
| | Purchased | | 35,402 |
| Other Liabilities | | 44,061 |
| Total Liabilities | | 130,971 |
| Net Assets | | 22,137,304 |
| |
| At January 31, 2012, net assets consisted of: |
| | Amount |
| | ($000) |
| Paid-in Capital | 19,431,292 |
| Overdistributed Net Investment Income | (2,364) |
| Accumulated Net Realized Losses | (546,913) |
| Unrealized Appreciation (Depreciation) | |
| Investment Securities | 3,250,153 |
| Swap Contracts | 5,136 |
| Net Assets | 22,137,304 |
| |
| |
| Investor Shares—Net Assets | |
| Applicable to 125,113,936 outstanding | |
| $.001 par value shares of beneficial | |
| interest (unlimited authorization) | 2,564,512 |
| Net Asset Value Per Share— | |
| Investor Shares | $20.50 |
| |
| |
| Admiral Shares—Net Assets | |
| Applicable to 64,161,836 outstanding | |
| $.001 par value shares of beneficial | |
| interest (unlimited authorization) | 5,612,309 |
| Net Asset Value Per Share— | |
| Admiral Shares | $87.47 |
| |
| |
| Signal Shares—Net Assets | |
| Applicable to 52,511,477 outstanding | |
| $.001 par value shares of beneficial | |
| interest (unlimited authorization) | 1,226,091 |
| Net Asset Value Per Share— | |
| Signal Shares | $23.35 |
| |
| |
| Institutional Shares—Net Assets | |
| Applicable to 171,662,037 outstanding | |
| $.001 par value shares of beneficial | |
| interest (unlimited authorization) | 2,323,982 |
| Net Asset Value Per Share— | |
| Institutional Shares | $13.54 |
13
REIT Index Fund
| |
| | Amount |
| | ($000) |
| ETF Shares—Net Assets | |
| Applicable to 168,674,688 outstanding | |
| $.001 par value shares of beneficial | |
| interest (unlimited authorization) | 10,410,410 |
| Net Asset Value Per Share— | |
| ETF Shares | $61.72 |
See Note A in Notes to Financial Statements.
* Non-income-producing security.
^ Part of security position is on loan to broker-dealers. The total value of securities on loan is $49,508,000.
† Non-income-producing security. New issue that has not paid a dividend as of January 31, 2012.
1 The fund invests a portion of its assets in Real Estate Investment Trusts through the use of swap contracts. After giving effect to swap investments, the fund’s effective Real Estate Investment Trust and temporary cash investment positions represent 100.0% and 0.3%, respectively, of net assets.
2 Considered an affiliated company of the fund as the fund owns more than 5% of the outstanding voting securities of such company.
3 Affiliated money market fund available only to Vanguard funds and certain trusts and accounts managed by Vanguard. Rate shown is the 7-day yield.
4 Includes $51,508,000 of collateral received for securities on loan.
5 The issuer operates under a congressional charter; its securities are generally neither guaranteed by the U.S. Treasury nor backed by the full faith and credit of the U.S. government.
6 The issuer was placed under federal conservatorship in September 2008; since that time, its daily operations have been managed by the Federal Housing Finance Agency and it receives capital from the U.S. Treasury in exchange for senior preferred stock.
REIT—Real Estate Investment Trust.
See accompanying Notes, which are an integral part of the Financial Statements.
14
REIT Index Fund
Statement of Operations
| |
| | Year Ended |
| | January 31, 2012 |
| | ($000) |
| Investment Income | |
| Income | |
| Dividends1 | 492,842 |
| Interest1 | 149 |
| Security Lending | 403 |
| Total Income | 493,394 |
| Expenses | |
| The Vanguard Group—Note B | |
| Investment Advisory Services | 1,117 |
| Management and Administrative—Investor Shares | 5,168 |
| Management and Administrative—Admiral Shares | 3,794 |
| Management and Administrative—Signal Shares | 672 |
| Management and Administrative—Institutional Shares | 844 |
| Management and Administrative—ETF Shares | 5,695 |
| Marketing and Distribution—Investor Shares | 757 |
| Marketing and Distribution—Admiral Shares | 810 |
| Marketing and Distribution—Signal Shares | 270 |
| Marketing and Distribution—Institutional Shares | 508 |
| Marketing and Distribution—ETF Shares | 2,503 |
| Custodian Fees | 260 |
| Auditing Fees | 34 |
| Shareholders’ Reports—Investor Shares | 83 |
| Shareholders’ Reports—Admiral Shares | 21 |
| Shareholders’ Reports—Signal Shares | 12 |
| Shareholders’ Reports—Institutional Shares | 17 |
| Shareholders’ Reports—ETF Shares | 112 |
| Trustees’ Fees and Expenses | 20 |
| Total Expenses | 22,697 |
| Net Investment Income | 470,697 |
| Realized Net Gain (Loss) | |
| Capital Gain Distributions Received | 89,768 |
| Investment Securities Sold | 109,563 |
| Swap Contracts | 21,058 |
| Realized Net Gain (Loss)1 | 220,389 |
| Change in Unrealized Appreciation (Depreciation) | |
| Investment Securities | 1,515,804 |
| Swap Contracts | (14,655) |
| Change in Unrealized Appreciation (Depreciation) | 1,501,149 |
| Net Increase (Decrease) in Net Assets Resulting from Operations | 2,192,235 |
1 Dividend income, interest income, and realized net gain (loss) from affiliated companies of the fund were $431,962,000, $143,000, and $220,657,000, respectively.
See accompanying Notes, which are an integral part of the Financial Statements.
15
REIT Index Fund
Statement of Changes in Net Assets
| | |
| | Year Ended January 31, |
| | 2012 | 2011 |
| | ($000) | ($000) |
| Increase (Decrease) in Net Assets | | |
| Operations | | |
| Net Investment Income | 470,697 | 330,632 |
| Realized Net Gain (Loss) | 220,389 | 707,808 |
| Change in Unrealized Appreciation (Depreciation) | 1,501,149 | 3,581,425 |
| Net Increase (Decrease) in Net Assets Resulting from Operations | 2,192,235 | 4,619,865 |
| Distributions | | |
| Net Investment Income | | |
| Investor Shares | (58,500) | (135,406) |
| Admiral Shares | (119,159) | (88,776) |
| Signal Shares | (25,078) | (23,109) |
| Institutional Shares | (45,416) | (48,372) |
| ETF Shares | (215,013) | (227,850) |
| Realized Capital Gain | | |
| Investor Shares | — | — |
| Admiral Shares | — | — |
| Signal Shares | — | — |
| Institutional Shares | — | — |
| ETF Shares | — | — |
| Return of Capital | | |
| Investor Shares | (28,724) | — |
| Admiral Shares | (58,509) | — |
| Signal Shares | (12,314) | — |
| Institutional Shares | (22,300) | — |
| ETF Shares | (105,574) | — |
| Total Distributions | (690,587) | (523,513) |
| Capital Share Transactions | | |
| Investor Shares | (279,552) | (2,088,856) |
| Admiral Shares | 489,968 | 2,816,862 |
| Signal Shares | 308,673 | 165,550 |
| Institutional Shares | 536,824 | 345,514 |
| ETF Shares | 1,682,526 | 1,620,012 |
| Net Increase (Decrease) from Capital Share Transactions | 2,738,439 | 2,859,082 |
| Total Increase (Decrease) | 4,240,087 | 6,955,434 |
| Net Assets | | |
| Beginning of Period | 17,897,217 | 10,941,783 |
| End of Period1 | 22,137,304 | 17,897,217 |
1 Net Assets—End of Period includes undistributed (overdistributed) net investment income of ($2,364,000) and ($4,689,000).
See accompanying Notes, which are an integral part of the Financial Statements.
16
REIT Index Fund
Financial Highlights
| | | | | |
| Investor Shares | | | | | |
| |
| For a Share Outstanding | | | Year Ended January 31, |
| Throughout Each Period | 2012 | 2011 | 2010 | 2009 | 2008 |
| Net Asset Value, Beginning of Period | $18.99 | $14.05 | $10.02 | $20.38 | $27.76 |
| Investment Operations | | | | | |
| Net Investment Income | .442 | .399 | .477 | .593 | .615 |
| Net Realized and Unrealized Gain (Loss) | | | | | |
| on Investments1 | 1.722 | 5.144 | 4.192 | (9.975) | (6.985) |
| Total from Investment Operations | 2.164 | 5.543 | 4.669 | (9.382) | (6.370) |
| Distributions | | | | | |
| Dividends from Net Investment Income | (.439) | (.603) | (.481) | (.571) | (.622) |
| Distributions from Realized Capital Gains | — | — | — | (.125) | (.199) |
| Return of Capital | (.215) | — | (.158) | (.282) | (.189) |
| Total Distributions | (.654) | (.603) | (.639) | (.978) | (1.010) |
| Net Asset Value, End of Period | $20.50 | $18.99 | $14.05 | $10.02 | $20.38 |
| |
| Total Return2 | 11.80% | 40.02% | 48.51% | -47.82% | -23.28% |
| |
| Ratios/Supplemental Data | | | | | |
| Net Assets, End of Period (Millions) | $2,565 | $2,658 | $3,572 | $2,274 | $4,046 |
| Ratio of Total Expenses to | | | | | |
| Average Net Assets | 0.24% | 0.26% | 0.26% | 0.21% | 0.20% |
| Ratio of Net Investment Income to | | | | | |
| Average Net Assets | 2.30% | 2.22% | 3.94% | 3.36% | 2.52% |
| Portfolio Turnover Rate3 | 10% | 12% | 16% | 10% | 13% |
1 Includes increases from redemption fees of $.00, $.00, $.00, $.00, and $.02.
2 Total returns do not include transaction or account service fees that may have applied in the periods shown. Fund prospectuses provide information about any applicable transaction and account service fees.
3 Excludes the value of portfolio securities received or delivered as a result of in-kind purchases or redemptions of the fund’s capital shares, including ETF Creation Units.
See accompanying Notes, which are an integral part of the Financial Statements.
17
REIT Index Fund
Financial Highlights
| | | | | |
| Admiral Shares | | | | | |
| |
| For a Share Outstanding | | | Year Ended January 31, |
| Throughout Each Period | 2012 | 2011 | 2010 | 2009 | 2008 |
| Net Asset Value, Beginning of Period | $81.03 | $59.95 | $42.74 | $86.94 | $118.46 |
| Investment Operations | | | | | |
| Net Investment Income | 1.960 | 1.806 | 2.083 | 2.581 | 2.707 |
| Net Realized and Unrealized Gain (Loss) | | | | | |
| on Investments1 | 7.385 | 21.948 | 17.909 | (42.527) | (29.817) |
| Total from Investment Operations | 9.345 | 23.754 | 19.992 | (39.946) | (27.110) |
| Distributions | | | | | |
| Dividends from Net Investment Income | (1.948) | (2.674) | (2.094) | (2.491) | (2.735) |
| Distributions from Realized Capital Gains | — | — | — | (.535) | (.849) |
| Return of Capital | (.957) | — | (.688) | (1.228) | (.826) |
| Total Distributions | (2.905) | (2.674) | (2.782) | (4.254) | (4.410) |
| Net Asset Value, End of Period | $87.47 | $81.03 | $59.95 | $42.74 | $86.94 |
| |
| Total Return2 | 11.95% | 40.21% | 48.73% | -47.77% | -23.23% |
| |
| Ratios/Supplemental Data | | | | | |
| Net Assets, End of Period (Millions) | $5,612 | $4,715 | $1,296 | $873 | $1,706 |
| Ratio of Total Expenses to | | | | | |
| Average Net Assets | 0.10% | 0.12% | 0.13% | 0.11% | 0.10% |
| Ratio of Net Investment Income to | | | | | |
| Average Net Assets | 2.44% | 2.36% | 4.07% | 3.46% | 2.62% |
| Portfolio Turnover Rate3 | 10% | 12% | 16% | 10% | 13% |
1 Includes increases from redemption fees of $.01, $.00, $.01, $.02, and $.10.
2 Total returns do not include transaction or account service fees that may have applied in the periods shown. Fund prospectuses provide information about any applicable transaction and account service fees.
3 Excludes the value of portfolio securities received or delivered as a result of in-kind purchases or redemptions of the fund’s capital shares, including ETF Creation Units.
See accompanying Notes, which are an integral part of the Financial Statements.
18
REIT Index Fund
Financial Highlights
| | | | | |
| Signal Shares | | | | | |
| | | | | | |
| | | | | | June 4, |
| | | | 20071 to |
| For a Share Outstanding | | | | Year Ended January 31, | Jan. 31, |
| Throughout Each Period | 2012 | 2011 | 2010 | 2009 | 2008 |
| Net Asset Value, Beginning of Period | $21.63 | $16.00 | $11.41 | $23.21 | $30.05 |
| Investment Operations | | | | | |
| Net Investment Income | .522 | .483 | .557 | .688 | .470 |
| Net Realized and Unrealized Gain (Loss) | | | | | |
| on Investments2 | 1.974 | 5.862 | 4.775 | (11.353) | (6.311) |
| Total from Investment Operations | 2.496 | 6.345 | 5.332 | (10.665) | (5.841) |
| Distributions | | | | | |
| Dividends from Net Investment Income | (.520) | (.715) | (.559) | (.664) | (.620) |
| Distributions from Realized Capital Gains | — | — | — | (.143) | (.192) |
| Return of Capital | (.256) | — | (.183) | (.328) | (.187) |
| Total Distributions | (.776) | (.715) | (.742) | (1.135) | (.999) |
| Net Asset Value, End of Period | $23.35 | $21.63 | $16.00 | $11.41 | $23.21 |
| |
| Total Return2 | 11.96% | 40.25% | 48.68% | -47.77% | -19.68% |
| |
| Ratios/Supplemental Data | | | | | |
| Net Assets, End of Period (Millions) | $1,226 | $835 | $489 | $350 | $538 |
| Ratio of Total Expenses to | | | | | |
| Average Net Assets | 0.10% | 0.12% | 0.14% | 0.11% | 0.10%3 |
| Ratio of Net Investment Income to | | | | | |
| Average Net Assets | 2.44% | 2.36% | 4.06% | 3.46% | 2.62%3 |
| Portfolio Turnover Rate4 | 10% | 12% | 16% | 10% | 13% |
1 Inception.
2 Total returns do not include transaction fees that may have applied in the periods shown. Fund prospectuses provide information about any applicable transaction fees.
3 Annualized.
4 Excludes the value of portfolio securities received or delivered as a result of in-kind purchases or redemptions of the fund’s capital shares, including ETF Creation Units.
See accompanying Notes, which are an integral part of the Financial Statements.
19
REIT Index Fund
Financial Highlights
| | | | | |
| Institutional Shares | | | | | |
| |
| For a Share Outstanding | | | Year Ended January 31, |
| Throughout Each Period | 2012 | 2011 | 2010 | 2009 | 2008 |
| Net Asset Value, Beginning of Period | $12.54 | $9.28 | $6.61 | $13.46 | $18.33 |
| Investment Operations | | | | | |
| Net Investment Income | .305 | .284 | .326 | .401 | .420 |
| Net Realized and Unrealized Gain (Loss) | | | | | |
| on Investments1 | 1.148 | 3.395 | 2.777 | (6.591) | (4.605) |
| Total from Investment Operations | 1.453 | 3.679 | 3.103 | (6.190) | (4.185) |
| Distributions | | | | | |
| Dividends from Net Investment Income | (.304) | (.419) | (.326) | (.386) | (.426) |
| Distributions from Realized Capital Gains | — | — | — | (.083) | (.131) |
| Return of Capital | (.149) | — | (.107) | (.191) | (.128) |
| Total Distributions | (.453) | (.419) | (.433) | (.660) | (.685) |
| Net Asset Value, End of Period | $13.54 | $12.54 | $9.28 | $6.61 | $13.46 |
| |
| Total Return2 | 12.01% | 40.24% | 48.90% | -47.82% | -23.18% |
| |
| Ratios/Supplemental Data | | | | | |
| Net Assets, End of Period (Millions) | $2,324 | $1,614 | $907 | $504 | $722 |
| Ratio of Total Expenses to | | | | | |
| Average Net Assets | 0.08% | 0.08% | 0.09% | 0.09% | 0.09% |
| Ratio of Net Investment Income to | | | | | |
| Average Net Assets | 2.46% | 2.40% | 4.11% | 3.48% | 2.63% |
| Portfolio Turnover Rate3 | 10% | 12% | 16% | 10% | 13% |
1 Includes increases from redemption fees of $.00, $.00, $.00, $.00, and $.01.
2 Total returns do not include transaction fees that may have applied in the periods shown. Fund prospectuses provide information about any applicable transaction fees.
3 Excludes the value of portfolio securities received or delivered as a result of in-kind purchases or redemptions of the fund’s capital shares, including ETF Creation Units.
See accompanying Notes, which are an integral part of the Financial Statements.
20
REIT Index Fund
Financial Highlights
| | | | | |
| ETF Shares | | | | | |
| |
| For a Share Outstanding | | | Year Ended January 31, |
| Throughout Each Period | 2012 | 2011 | 2010 | 2009 | 2008 |
| Net Asset Value, Beginning of Period | $57.17 | $42.30 | $30.14 | $61.31 | $83.55 |
| Investment Operations | | | | | |
| Net Investment Income | 1.384 | 1.278 | 1.473 | 1.820 | 1.908 |
| Net Realized and Unrealized Gain (Loss) | | | | | |
| on Investments1 | 5.216 | 15.483 | 12.651 | (29.990) | (21.037) |
| Total from Investment Operations | 6.600 | 16.761 | 14.124 | (28.170) | (19.129) |
| Distributions | | | | | |
| Dividends from Net Investment Income | (1.375) | (1.891) | (1.478) | (1.757) | (1.931) |
| Distributions from Realized Capital Gains | — | — | — | (.377) | (.598) |
| Return of Capital | (.675) | — | (.486) | (.866) | (.582) |
| Total Distributions | (2.050) | (1.891) | (1.964) | (3.000) | (3.111) |
| Net Asset Value, End of Period | $61.72 | $57.17 | $42.30 | $30.14 | $61.31 |
| |
| Total Return | 11.94% | 40.19% | 48.74% | -47.77% | -23.23% |
| |
| Ratios/Supplemental Data | | | | | |
| Net Assets, End of Period (Millions) | $10,410 | $8,075 | $4,678 | $1,414 | $2,082 |
| Ratio of Total Expenses to | | | | | |
| Average Net Assets | 0.10% | 0.12% | 0.13% | 0.11% | 0.10% |
| Ratio of Net Investment Income to | | | | | |
| Average Net Assets | 2.44% | 2.36% | 4.07% | 3.46% | 2.62% |
| Portfolio Turnover Rate2 | 10% | 12% | 16% | 10% | 13% |
1 Includes increases from redemption fees of $.01, $.01, $.01, $.01, and $.04.
2 Excludes the value of portfolio securities received or delivered as a result of in-kind purchases or redemptions of the fund’s capital shares, including ETF Creation Units.
See accompanying Notes, which are an integral part of the Financial Statements.
21
REIT Index Fund
Notes to Financial Statements
Vanguard REIT Index Fund is registered under the Investment Company Act of 1940 as an open-end investment company, or mutual fund. The fund offers five classes of shares: Investor Shares, Admiral Shares, Signal Shares, Institutional Shares, and ETF Shares. Investor Shares are available to any investor who meets the fund’s minimum purchase requirements. Admiral Shares, Signal Shares, and Institutional Shares are designed for investors who meet certain administrative, service, and account-size criteria. ETF Shares are listed for trading on the NYSE Arca, Inc.; they can be purchased and sold through a broker.
A. The following significant accounting policies conform to generally accepted accounting principles for U.S. mutual funds. The fund consistently follows such policies in preparing its financial statements.
1. Security Valuation: Securities are valued as of the close of trading on the New York Stock Exchange (generally 4 p.m., Eastern time) on the valuation date. Equity securities are valued at the latest quoted sales prices or official closing prices taken from the primary market in which each security trades; such securities not traded on the valuation date are valued at the mean of the latest quoted bid and asked prices. Securities for which market quotations are not readily available, or whose values have been materially affected by events occurring before the fund’s pricing time but after the close of the securities’ primary markets, are valued by methods deemed by the board of trustees to represent fair value. Investments in Vanguard Market Liquidity Fund are valued at that fund’s net asset value. Temporary cash investments acquired over 60 days to maturity are valued using the latest bid prices or using valuations based on a matrix system (which considers such factors as security prices, yields, maturities, and ratings), both as furnished by independent pricing services. Other temporary cash investments are valued at amortized cost, which approximates market value.
2. Swap Contracts: The fund enters into swap transactions to earn the total return on a specified security or index. Under the terms of the swaps, the fund receives the total return (either receiving the increase or paying the decrease) on a reference security or index, applied to a notional principal amount. In return, the fund agrees to pay the counterparty a floating rate, which is reset periodically based on short-term interest rates, applied to the same notional amount. At the same time, the fund invests an amount approximating the notional amount of the swap in high-quality temporary cash investments.
The notional amounts of swap contracts are not recorded in the Statement of Net Assets. Swaps are valued daily based on market quotations received from independent pricing services or recognized dealers and the change in value is recorded as unrealized appreciation (depreciation) until periodic payments are made, or the swap terminates, at which time realized gain (loss) is recorded. The primary risk associated with the swaps is that a counterparty will default on its obligation to pay net amounts due to the fund. The fund’s maximum risk of loss from counterparty credit risk is the amount of unrealized appreciation on the swap contract. This risk is mitigated by entering into swaps only with highly rated counterparties, by a master netting arrangement between the fund and the counterparty, and by the posting of collateral by the counterparty. The swap contracts contain provisions whereby a counterparty may terminate open contracts if the fund’s net assets decline below a certain level, triggering a payment by the fund if the fund is in a net liability position at the time of the termination. The payment amount would be reduced by any collateral the fund has posted. Any securities posted as collateral for open contracts are noted in the Statement of Net Assets.
22
REIT Index Fund
3. Federal Income Taxes: The fund intends to continue to qualify as a regulated investment company and distribute all of its taxable income. Management has analyzed the fund’s tax positions taken for all open federal income tax years (January 31, 2009–2012), and has concluded that no provision for federal income tax is required in the fund’s financial statements.
4. Distributions: Distributions to shareholders are recorded on the ex-dividend date. Distributions declared by the fund are reallocated at fiscal year-end to ordinary income, capital gain, and return of capital to reflect their tax character.
5. Security Lending: The fund may lend its securities to qualified institutional borrowers to earn additional income. Security loans are required to be secured at all times by collateral at least equal to the market value of securities loaned. The fund invests cash collateral received in Vanguard Market Liquidity Fund, and records a liability for the return of the collateral, during the period the securities are on loan. Security lending income represents fees charged to borrowers plus income earned on investing cash collateral, less expenses associated with the loan.
6. Other: Distributions received from REITs are recorded on the ex-dividend date. Each REIT reports annually the tax character of its distributions. Dividend income, capital gain distributions received, and unrealized appreciation (depreciation) reflect the amounts of taxable income, capital gain, and return of capital reported by the REITs, and management’s estimates of such amounts for REIT distributions for which actual information has not been reported. Interest income includes income distributions received from Vanguard Market Liquidity Fund and is accrued daily. Security transactions are accounted for on the date securities are bought or sold. Costs used to determine realized gains (losses) on the sale of investment securities are those of the specific securities sold. Fees assessed on redemptions of capital shares are credited to paid-in capital.
Each class of shares has equal rights as to assets and earnings, except that each class separately bears certain class-specific expenses related to maintenance of shareholder accounts (included in Management and Administrative expenses) and shareholder reporting. Marketing and distribution expenses are allocated to each class of shares based on a method approved by the board of trustees. Income, other non-class-specific expenses, and gains and losses on investments are allocated to each class of shares based on its relative net assets.
B. The Vanguard Group furnishes at cost investment advisory, corporate management, administrative, marketing, and distribution services. The costs of such services are allocated to the fund under methods approved by the board of trustees. The fund has committed to provide up to 0.40% of its net assets in capital contributions to Vanguard. At January 31, 2012, the fund had contributed capital of $3,248,000 to Vanguard (included in Other Assets), representing 0.02% of the fund’s net assets and 1.30% of Vanguard’s capitalization. The fund’s trustees and officers are also directors and officers of Vanguard.
C. Various inputs may be used to determine the value of the fund’s investments. These inputs are summarized in three broad levels for financial statement purposes. The inputs or methodologies used to value securities are not necessarily an indication of the risk associated with investing in those securities.
Level 1—Quoted prices in active markets for identical securities.
Level 2—Other significant observable inputs (including quoted prices for similar securities, interest rates, prepayment speeds, credit risk, etc.).
Level 3—Significant unobservable inputs (including the fund’s own assumptions used to determine the fair value of investments).
23
REIT Index Fund
The following table summarizes the market value of the fund’s investments as of January 31, 2012, based on the inputs used to value them:
| | | |
| | Level 1 | Level 2 | Level 3 |
| Investments | ($000) | ($000) | ($000) |
| Real Estate Investment Trusts | 22,023,322 | — | — |
| Temporary Cash Investments | 174,713 | 10,999 | — |
| Swap Contracts—Assets | — | 5,136 | — |
| Total | 22,198,035 | 16,135 | — |
D. At January 31, 2012, the fund had the following open total return swap contracts:
| | | | | |
| | | | | Floating | Unrealized |
| | | | Notional | Interest Rate | Appreciation |
| | Termination | | Amount | Received | (Depreciation) |
| Reference Entity | Date | Counterparty | ($000) | (Paid) | ($000) |
| CommonWealth REIT | 7/2/12 | GSI | 17,020 | (0.645%)1 | 3,141 |
| Senior Housing Properties Trust | 7/11/12 | GSI | 45,040 | (0.646%)1 | 1,059 |
| Hospitality Properties Trust | 8/30/12 | GSI | 48,420 | (0.620%)1 | 936 |
GSI—Goldman Sachs International.
1 Based on one-month London Interbank Offered Rate (LIBOR) as of the most recent payment date plus a 0.35% spread.
At January 31, 2012 the counterparty had deposited in segregated accounts securities with a value sufficient to cover substantially all amounts due to the fund in connection with open swap contracts.
E. Distributions are determined on a tax basis and may differ from net investment income and realized capital gains for financial reporting purposes. Differences may be permanent or temporary. Permanent differences are reclassified among capital accounts in the financial statements to reflect their tax character. Temporary differences arise when certain items of income, expense, gain, or loss are recognized in different periods for financial statement and tax purposes; these differences are primarily attributed to tax deferral of losses on wash sales and will reverse at some time in the future. Differences in classification may also result from the treatment of short-term gains as ordinary income for tax purposes.
Realized and unrealized gains (losses) on certain of the fund’s swap contracts are treated as ordinary income (loss) for tax purposes. Accordingly, realized losses of $5,206,000 on swap contracts have been reclassified from accumulated net realized losses to overdistributed net investment income.
During the year ended January 31, 2012, the fund realized $509,732,000 of net capital gains resulting from in-kind redemptions—in which shareholders exchanged fund shares for securities held by the fund rather than for cash. Because such gains are not taxable to the fund, and are not distributed to shareholders, they have been reclassified from accumulated net realized losses to paid-in capital.
For tax purposes, at January 31, 2012, the fund had no ordinary income available for distribution. The fund had available capital losses totaling $426,316,000 to offset future net capital gains. Of this amount, $73,864,000 is subject to expire January 31, 2018. Capital losses of $352,452,000 realized beginning in fiscal 2012 may be carried forward indefinitely but must be used before any expiring loss carryforwards.
24
REIT Index Fund
At January 31, 2012, the cost of investment securities for tax purposes was $19,079,478,000. Net unrealized appreciation of investment securities for tax purposes was $3,129,556,000, consisting of unrealized gains of $4,072,961,000 on securities that had risen in value since their purchase and $943,405,000 in unrealized losses on securities that had fallen in value since their purchase.
F. During the year ended January 31, 2012, the fund purchased $5,929,594,000 of investment securities and sold $3,192,333,000 of investment securities, other than temporary cash investments.
G. Capital share transactions for each class of shares were:
| | | | |
| | | | Year Ended January 31, |
| | | 2012 | | 2011 |
| | Amount | Shares | Amount | Shares |
| | ($000) | (000) | ($000) | (000) |
| Investor Shares | | | | |
| Issued | 616,468 | 31,976 | 1,119,064 | 66,009 |
| Issued in Lieu of Cash Distributions | 83,897 | 4,515 | 127,317 | 7,559 |
| Redeemed1 | (979,917) | (51,365) | (3,335,237) | (187,837) |
| Net Increase (Decrease)—Investor Shares | (279,552) | (14,874) | (2,088,856) | (114,269) |
| Admiral Shares | | | | |
| Issued | 931,513 | 11,395 | 3,046,641 | 39,695 |
| Issued in Lieu of Cash Distributions | 158,554 | 1,998 | 76,303 | 1,031 |
| Redeemed1 | (600,099) | (7,419) | (306,082) | (4,162) |
| Net Increase (Decrease)—Admiral Shares | 489,968 | 5,974 | 2,816,862 | 36,564 |
| Signal Shares | | | | |
| Issued | 566,444 | 25,739 | 321,123 | 16,049 |
| Issued in Lieu of Cash Distributions | 31,742 | 1,500 | 19,720 | 1,017 |
| Redeemed1 | (289,513) | (13,351) | (175,293) | (8,979) |
| Net Increase (Decrease)—Signal Shares | 308,673 | 13,888 | 165,550 | 8,087 |
| Institutional Shares | | | | |
| Issued | 805,740 | 64,220 | 520,734 | 46,474 |
| Issued in Lieu of Cash Distributions | 60,743 | 4,947 | 43,165 | 3,829 |
| Redeemed1 | (329,659) | (26,151) | (218,385) | (19,340) |
| Net Increase (Decrease)—Institutional Shares | 536,824 | 43,016 | 345,514 | 30,963 |
| ETF Shares | | | | |
| Issued | 2,952,696 | 50,521 | 2,900,778 | 55,854 |
| Issued in Lieu of Cash Distributions | — | — | — | — |
| Redeemed1 | (1,270,170) | (23,100) | (1,280,766) | (25,200) |
| Net Increase (Decrease)—ETF Shares | 1,682,526 | 27,421 | 1,620,012 | 30,654 |
| 1 Net of redemption fees for fiscal 2012 and 2011 of $2,201,000 and $1,715,000, respectively (fund totals). |
25
REIT Index Fund
H. Certain of the fund’s investments are in companies that are considered to be affiliated companies of the fund because the fund owns more than 5% of the outstanding voting securities of the company. Transactions during the period in securities of these companies were as follows:
| | | | | |
| | | | Current Period Transactions | |
| Jan. 31, 2011 | | Proceeds From | | Jan. 31, 2012 |
| | Market | Purchases | Securities | Dividend | Market |
| | Value | at Cost | Sold | Income | Value |
| | ($000) | ($000) | ($000) | ($000) | ($000) |
| Acadia Realty Trust | 40,311 | 12,618 | 7,540 | 1,593 | 51,097 |
| Alexandria Real Estate Equities Inc. | 226,629 | 83,270 | 37,237 | 5,965 | 255,999 |
| AMB Property Corp. | 306,798 | 29,936 | 17,456 | 635 | NA1 |
| American Campus Communities Inc. | 114,126 | 35,658 | 19,358 | 2,478 | 169,885 |
| Apartment Investment & | | | | | |
| Management Co. | 162,533 | 37,240 | 23,452 | — | 169,368 |
| Associated Estates Realty Corp. | 32,287 | 8,649 | 5,509 | 947 | 39,638 |
| AvalonBay Communities Inc. | 536,504 | 201,108 | 106,042 | 6,078 | 730,160 |
| BioMed Realty Trust Inc. | 124,720 | 55,294 | 22,347 | 3,762 | 163,067 |
| Boston Properties Inc. | 714,506 | 196,656 | 111,721 | 16,044 | 872,582 |
| Brandywine Realty Trust | 83,207 | 18,977 | 11,885 | 2,852 | 82,324 |
| BRE Properties Inc. | 155,336 | 68,410 | 29,454 | 3,658 | 221,085 |
| Camden Property Trust | 201,759 | 80,444 | 31,395 | 4,219 | 286,927 |
| Campus Crest Communities Inc. | — | 24,319 | 1,908 | 357 | 18,730 |
| CapLease Inc. | 17,153 | 5,507 | 2,240 | — | 15,361 |
| CBL & Associates Properties Inc. | 121,604 | 36,831 | 18,865 | 6,479 | 139,759 |
| Chesapeake Lodging Trust | 17,155 | 17,598 | 3,314 | 1,297 | 29,717 |
| Cogdell Spencer Inc. | — | 17,715 | 1,101 | 518 | 11,770 |
| Colonial Properties Trust | NA2 | 32,177 | 11,077 | 1,250 | 100,689 |
| CommonWealth REIT | 104,486 | 34,552 | 39,965 | 4,599 | NA3 |
| Coresite Realty Corp. | — | 21,862 | 1,762 | 486 | 22,717 |
| Corporate Office Properties Trust | 130,927 | 34,986 | 17,813 | 3,671 | 99,468 |
| Cousins Properties Inc. | NA2 | 8,655 | 6,170 | 352 | 39,291 |
| CubeSmart | NA4 | 26,778 | 7,600 | 1,264 | 73,791 |
| DCT Industrial Trust Inc. | 63,617 | 25,124 | 10,611 | 1,263 | 77,573 |
| DiamondRock Hospitality Co. | 109,137 | 21,349 | 14,573 | 2,294 | 100,713 |
| Digital Realty Trust Inc. | 258,083 | 99,638 | 41,780 | 14,288 | 401,986 |
| Douglas Emmett Inc. | NA2 | 35,297 | 16,448 | 290 | 144,724 |
| Duke Realty Corp. | 187,260 | 41,261 | 29,609 | 314 | 193,225 |
| DuPont Fabros Technology Inc. | 73,806 | 19,219 | 10,686 | 1,633 | 90,899 |
| EastGroup Properties Inc. | 63,886 | 14,698 | 10,862 | 2,545 | 73,381 |
| Education Realty Trust Inc. | 29,855 | 17,654 | 5,481 | 505 | 55,041 |
| Entertainment Properties Trust | 116,245 | 26,135 | 19,331 | 5,327 | 118,450 |
| Equity Lifestyle Properties Inc. | 90,236 | 58,364 | 19,722 | 2,942 | 154,795 |
| Equity Residential | 834,696 | 234,514 | 143,531 | 10,912 | 1,007,899 |
26
| | | | | |
| REIT Index Fund | | | | | |
| |
| |
| |
| |
| | | | Current Period Transactions | |
| | Jan. 31, 2011 | | Proceeds From | | Jan. 31, 2012 |
| | Market | Purchases | Securities | Dividend | Market |
| | Value | at Cost | Sold | Income | Value |
| | ($000) | ($000) | ($000) | ($000) | ($000) |
| Essex Property Trust Inc. | 191,192 | 68,082 | 30,296 | 4,905 | 277,977 |
| Excel Trust Inc. | — | 18,814 | 359 | 257 | 21,309 |
| Extra Space Storage Inc. | 86,814 | 29,552 | 16,253 | 2,733 | 134,550 |
| Federal Realty Investment Trust | 268,442 | 68,925 | 47,044 | 8,329 | 338,666 |
| FelCor Lodging Trust Inc. | 37,074 | 14,663 | 5,973 | — | 25,751 |
| First Industrial Realty Trust Inc. | NA2 | 27,344 | 8,678 | — | 53,925 |
| First Potomac Realty Trust | 42,369 | 9,704 | 5,853 | 795 | 42,540 |
| Franklin Street Properties Corp. | NA2 | 11,574 | 7,701 | 1,610 | 42,644 |
| Glimcher Realty Trust | 46,936 | 14,398 | 6,802 | 1,512 | 59,069 |
| HCP Inc. | 735,442 | 265,668 | 135,060 | 20,429 | 976,956 |
| Health Care REIT Inc. | 386,747 | 233,456 | 81,976 | 14,441 | 619,795 |
| Healthcare Realty Trust Inc. | 72,625 | 28,871 | 9,531 | 1,287 | 93,613 |
| Hersha Hospitality Trust Class A | NA2 | 10,947 | 6,218 | 1,466 | 47,394 |
| Highwoods Properties Inc. | 127,528 | 29,207 | 20,649 | 4,621 | 136,758 |
| Home Properties Inc. | 113,412 | 61,692 | 20,686 | 3,521 | 162,439 |
| Hospitality Properties Trust | 166,756 | 35,186 | 71,015 | 10,695 | NA3 |
| Host Hotels & Resorts Inc. | 666,656 | 151,749 | 76,553 | 5,375 | 661,904 |
| Inland Real Estate Corp. | NA2 | 13,255 | 5,089 | 1,616 | 43,369 |
| Investors Real Estate Trust | 37,726 | 7,866 | 4,213 | 389 | 34,434 |
| Kilroy Realty Corp. | 108,501 | 39,168 | 19,332 | 884 | 138,935 |
| Kimco Realty Corp. | 398,942 | 92,895 | 69,372 | 11,989 | 424,002 |
| Kite Realty Group Trust | 18,139 | 3,208 | 3,045 | 69 | 17,237 |
| LaSalle Hotel Properties | 105,317 | 45,438 | 17,029 | 623 | 131,385 |
| Lexington Realty Trust | NA2 | 23,448 | 13,358 | 2,237 | 69,756 |
| Liberty Property Trust | 214,922 | 47,076 | 32,113 | 9,477 | 219,807 |
| LTC Properties Inc. | NA2 | 19,895 | 6,659 | 2,249 | 55,337 |
| Macerich Co. | 344,024 | 84,119 | 59,106 | 6,222 | 408,910 |
| Mack-Cali Realty Corp. | 151,101 | 45,442 | 23,595 | 6,792 | 142,918 |
| Medical Properties Trust Inc. | 66,357 | 14,923 | 10,919 | 1,927 | 68,359 |
| Mid-America Apartment | | | | | |
| Communities Inc. | 113,621 | 39,188 | 16,673 | 3,934 | 135,528 |
| National Retail Properties Inc. | 112,590 | 54,190 | 18,293 | 5,774 | 159,430 |
| Nationwide Health Properties Inc. | 252,397 | 32,934 | 16,433 | 3,116 | NA5 |
| Omega Healthcare Investors Inc. | 114,744 | 30,195 | 13,800 | 5,952 | 122,651 |
| Parkway Properties Inc. | 20,131 | 3,319 | 2,146 | — | 12,200 |
| Pebblebrook Hotel Trust | 42,336 | 26,374 | 8,103 | 1,265 | 64,445 |
| Pennsylvania Real Estate | | | | | |
| Investment Trust | 39,004 | 8,174 | 5,512 | 1,109 | 37,104 |
27
| | | | | |
| REIT Index Fund | | | | | |
| |
| |
| |
| |
| | | | Current Period Transactions | |
| Jan. 31, 2011 | | Proceeds From | | Jan. 31, 2012 |
| | Market | Purchases | Securities | Dividend | Market |
| | Value | at Cost | Sold | Income | Value |
| | ($000) | ($000) | ($000) | ($000) | ($000) |
| Piedmont Office Realty | | | | | |
| Trust Inc. Class A | NA2 | 121,760 | 24,618 | 7,816 | 182,718 |
| Post Properties Inc. | 97,936 | 26,089 | 16,114 | 722 | 128,765 |
| ProLogis | 451,601 | 51,965 | 23,231 | 128 | NA1 |
| ProLogis Inc. | NA1 | 161,172 | 77,743 | 1,730 | 830,882 |
| Ramco-Gershenson Properties Trust | 25,193 | 5,966 | 2,791 | 701 | 25,476 |
| Realty Income Corp. | 222,337 | 82,787 | 39,396 | 10,071 | 276,781 |
| Regency Centers Corp. | 191,767 | 61,205 | 31,816 | 2,875 | 212,068 |
| Retail Opportunity Investments Corp. | 22,249 | 9,498 | 3,854 | 621 | 32,989 |
| RLJ Lodging Trust | — | 89,988 | 2,099 | 794 | 97,453 |
| Sabra Health Care REIT Inc. | 23,841 | 15,302 | 2,799 | 1,409 | 29,943 |
| Senior Housing Properties Trust | 170,540 | 60,938 | 71,582 | 6,984 | NA3 |
| Simon Property Group Inc. | 1,614,275 | 442,480 | 337,546 | 56,495 | 2,276,966 |
| SL Green Realty Corp. | 309,255 | 94,217 | 46,798 | 2,524 | 358,736 |
| Sovran Self Storage Inc. | 57,636 | 14,169 | 10,593 | 2,177 | 73,570 |
| Strategic Hotels & Resorts Inc. | 45,290 | 13,035 | 12,185 | — | NA3 |
| Summit Hotel Properties Inc. | — | 13,780 | 242 | — | 14,567 |
| Sun Communities Inc. | NA2 | 21,591 | 4,623 | 197 | 56,230 |
| Sunstone Hotel Investors Inc. | 65,475 | 12,804 | 8,992 | — | 62,766 |
| Tanger Factory Outlet Centers | 114,860 | 33,432 | 18,989 | 3,713 | 144,685 |
| Taubman Centers Inc. | 155,550 | 45,695 | 25,135 | 4,126 | 221,511 |
| UDR Inc. | 228,881 | 110,761 | 40,440 | 6,012 | 325,415 |
| Universal Health Realty Income Trust | 23,004 | 5,580 | 3,375 | 827 | 27,415 |
| Ventas Inc. | 473,402 | 240,206 | 112,301 | 27,318 | 958,394 |
| Vornado Realty Trust | NA2 | 182,537 | 130,040 | 24,072 | 766,367 |
| Washington Real Estate | | | | | |
| Investment Trust | 104,158 | 28,314 | 16,131 | 4,147 | 112,317 |
| Weingarten Realty Investors | 152,390 | 34,458 | 25,399 | 7,065 | 159,043 |
| Winthrop Realty Trust | NA2 | 6,900 | 2,114 | 1,021 | 20,230 |
| 14,548,347 | | | 431,962 | 19,388,495 |
1 Not applicable—In June 2011, AMB Property Corp. merged with ProLogis to form ProLogis Inc.
2 Not applicable—At January 31, 2011, the issuer was not an affiliated company of the fund.
3 Not applicable—At January 31, 2012, the security was still held, but the issuer was no longer an affiliated company of the fund.
4 Not applicable—In September 2011, U-Store-It Trust merged into CubeSmart. (At January 31, 2011, U-Store-It Trust was not an affiliated company of the fund.)
5 Not applicable—In July 2011, Nationwide Health Properties Inc. merged with Ventas Inc.
I. In preparing the financial statements as of January 31, 2012, management considered the impact of subsequent events for potential recognition or disclosure in these financial statements.
28
Report of Independent Registered
Public Accounting Firm
To the Trustees of Vanguard Specialized Funds and the Shareholders of Vanguard REIT Index Fund:
In our opinion, the accompanying statement of net assets and statement of assets and liabilities and the related statements of operations and of changes in net assets and the financial highlights present fairly, in all material respects, the financial position of Vanguard REIT Index Fund (constituting a separate portfolio of Vanguard Specialized Funds, hereafter referred to as the “Fund”) at January 31, 2012, the results of its operations for the year then ended, the changes in its net assets for each of the two years in the period then ended and the financial highlights for each of the periods indicated, in conformity with accounting principles generally accepted in the United States of America. These financial statements and financial highlights (hereafter referred to as “financial statements”) are the responsibility of the Fund’s management; our responsibility is to express an opinion on these financial statements based on our audits. We conducted our audits of these financial statements in accordance with the standards of the Public Company Accounting Oversight Board (United States). Those standards require that we plan and perform the audit to obtain reasonable assurance about whether the financial statements are free of material misstatement. An audit includes examining, on a test basis, evidence supporting the amounts and disclosures in the financial statements, assessing the accounting principles used and significant estimates made by management, and evaluating the overall financial statement presentation. We believe that our audits, which included confirmation of securities at January 31, 2012 by correspondence with the custodian and broker and by agreement to the underlying ownership records of Vanguard Market Liquidity Fund, provide a reasonable basis for our opinion.
PricewaterhouseCoopers LLP
Philadelphia, Pennsylvania
March 12, 2012
|
| Special 2011 tax information (unaudited) for Vanguard REIT Index Fund |
This information for the fiscal year ended January 31, 2012, is included pursuant to provisions of the Internal Revenue Code.
The fund distributed $3,103,000 of qualified dividend income to shareholders during the fiscal year.
29
Your Fund’s After-Tax Returns
This table presents returns for your fund both before and after taxes. The after-tax returns are shown in two ways: (1) assuming that an investor owned the fund during the entire period and paid taxes on the fund’s distributions, and (2) assuming that an investor paid taxes on the fund’s distributions and sold all shares at the end of each period.
Calculations are based on the highest individual federal income tax and capital gains tax rates in effect at the times of the distributions and the hypothetical sales. State and local taxes were not considered. After-tax returns reflect any qualified dividend income , using actual prior-year figures and estimates for 2012. (In the example, returns after the sale of fund shares may be higher than those assuming no sale. This occurs when the sale would have produced a capital loss. The calculation assumes that the investor received a tax deduction for the loss.)
The table shows returns for Investor Shares only; returns for other share classes will differ. Please note that your actual after-tax returns will depend on your tax situation and may differ from those shown. Also note that if you own the fund in a tax-deferred account, such as an individual retirement account or a 401(k) plan, this information does not apply to you. Such accounts are not subject to current taxes.
Finally, keep in mind that a fund’s performance—whether before or after taxes—does not guarantee future results.
Average Annual Total Returns: REIT Index Fund Investor Shares
Periods Ended January 31, 2012
| | | |
| | One | Five | Ten |
| | Year | Years | Years |
| Returns Before Taxes | 11.80% | -1.43% | 10.91% |
| Returns After Taxes on Distributions | 10.89 | -2.59 | 9.39 |
| Returns After Taxes on Distributions and Sale of Fund Shares | 7.61 | -1.93 | 8.74 |
Returns do not reflect the 1% fee on redemptions of shares held for less than one year.
30
About Your Fund’s Expenses
As a shareholder of the fund, you incur ongoing costs, which include costs for portfolio management, administrative services, and shareholder reports (like this one), among others. Operating expenses, which are deducted from a fund’s gross income, directly reduce the investment return of the fund.
A fund’s expenses are expressed as a percentage of its average net assets. This figure is known as the expense ratio. The following examples are intended to help you understand the ongoing costs (in dollars) of investing in your fund and to compare these costs with those of other mutual funds. The examples are based on an investment of $1,000 made at the beginning of the period shown and held for the entire period.
The accompanying table illustrates your fund’s costs in two ways:
• Based on actual fund return. This section helps you to estimate the actual expenses that you paid over the period. The ”Ending Account Value“ shown is derived from the fund‘s actual return, and the third column shows the dollar amount that would have been paid by an investor who started with $1,000 in the fund. You may use the information here, together with the amount you invested, to estimate the expenses that you paid over the period.
To do so, simply divide your account value by $1,000 (for example, an $8,600 account value divided by $1,000 = 8.6), then multiply the result by the number given for your fund under the heading ”Expenses Paid During Period.“
• Based on hypothetical 5% yearly return. This section is intended to help you compare your fund‘s costs with those of other mutual funds. It assumes that the fund had a yearly return of 5% before expenses, but that the expense ratio is unchanged. In this case—because the return used is not the fund’s actual return—the results do not apply to your investment. The example is useful in making comparisons because the Securities and Exchange Commission requires all mutual funds to calculate expenses based on a 5% return. You can assess your fund’s costs by comparing this hypothetica example with the hypothetical examples that appear in shareholder reports of other funds.
Note that the expenses shown in the table are meant to highlight and help you compare ongoing costs only and do not reflect transaction costs incurred by the fund for buying and selling securities. Further, the expenses do not include any purchase, redemption, or account service fees described in the fund prospectus. If such fees were applied to your account, your costs would be higher. Your fund does not carry a “sales load.”
The calculations assume no shares were bought or sold during the period. Your actual costs may have been higher or lower, depending on the amount of your investment and the timing of any purchases or redemptions.
You can find more information about the fund’s expenses, including annual expense ratios, in the Financial Statements section of this report. For additional information on operating expenses and other shareholder costs, please refer to your fund’s current prospectus.
31
| | | |
| Six Months Ended January 31, 2012 | | | |
| | Beginning | Ending | Expenses |
| | Account Value | Account Value | Paid During |
| REIT Index Fund | 7/31/2011 | 1/31/2012 | Period |
| Based on Actual Fund Return | | | |
| Investor Shares | $1,000.00 | $1,031.75 | $1.23 |
| Admiral Shares | 1,000.00 | 1,032.25 | 0.51 |
| Signal Shares | 1,000.00 | 1,032.47 | 0.51 |
| Institutional Shares | 1,000.00 | 1,032.55 | 0.41 |
| ETF Shares | 1,000.00 | 1,032.14 | 0.51 |
| Based on Hypothetical 5% Yearly Return | | | |
| Investor Shares | $1,000.00 | $1,024.00 | $1.22 |
| Admiral Shares | 1,000.00 | 1,024.70 | 0.51 |
| Signal Shares | 1,000.00 | 1,024.70 | 0.51 |
| Institutional Shares | 1,000.00 | 1,024.80 | 0.41 |
| ETF Shares | 1,000.00 | 1,024.70 | 0.51 |
The calculations are based on expenses incurred in the most recent six-month period. The fund’s annualized six-month expense ratios for that period are 0.24% for Investor Shares, 0.10% for Admiral Shares, 0.10% for Signal Shares, 0.08% for Institutional Shares, and 0.10% for ETF Shares. The dollar amounts shown as “Expenses Paid” are equal to the annualized expense ratio multiplied by the average account value over the period, multiplied by the number of days in the most recent six-month period, then divided by the number of days in the most recent 12-month period.
32
Glossary
Beta. A measure of the magnitude of a fund’s past share-price fluctuations in relation to the ups and downs of a given market index. The index is assigned a beta of 1.00. Compared with a given index, a fund with a beta of 1.20 typically would have seen its share price rise or fall by 12% when the index rose or fell by 10%. For this report, beta is based on returns over the past 36 months for both the fund and the index. Note that a fund’s beta should be reviewed in conjunction with its R-squared (see definition). The lower the R-squared, the less correlation there is between the fund and the index, and the less reliable beta is as an indicator of volatility.
Dividend Yield. Dividend income earned by stocks, expressed as a percentage of the aggregate market value (or of net asset value, for a fund). The yield is determined by dividing the amount of the annual dividends by the aggregate value (or net asset value) at the end of the period. For a fund, the dividend yield is based solely on stock holdings and does not include any income produced by other investments. This yield may include some payments that represent a return of capital, capital gains distributions, or both by the underlying stocks.
Earnings Growth Rate. The average annual rate of growth in earnings over the past five years for the stocks now in a fund.
Expense Ratio. A fund’s total annual operating expenses expressed as a percentage of the fund’s average net assets. The expense ratio includes management and administrative expenses, but does not include the transaction costs of buying and selling portfolio securities.
Foreign Holdings. The percentage of a fund represented by securities or depositary receipts of companies based outside the United States.
Inception Date. The date on which the assets of a fund (or one of its share classes) are first invested in accordance with the fund’s investment objective. For funds with a subscription period, the inception date is the day after that period ends. Investment performance is measured from the inception date.
Median Market Cap. An indicator of the size of companies in which a fund invests; the midpoint of market capitalization (market price x shares outstanding) of a fund’s stocks, weighted by the proportion of the fund’s assets invested in each stock. Stocks representing half of the fund’s assets have market capitalizations above the median, and the rest are below it.
Price/Book Ratio. The share price of a stock divided by its net worth, or book value, per share. For a fund, the weighted average price/book ratio of the stocks it holds.
Price/Earnings Ratio. The ratio of a stock’s current price to its per-share earnings over the past year. For a fund, the weighted average P/E of the stocks it holds. P/E is an indicator of market expectations about corporate prospects; the higher the P/E, the greater the expectations for a company’s future growth.
R-Squared. A measure of how much of a fund’s past returns can be explained by the returns from the market in general, as measured by a given index. If a fund’s total returns were precisely synchronized with an index’s returns, its R-squared would be 1.00. If the fund’s returns bore no relationship to the index’s returns, its R-squared would be 0. For this report, R-squared is based on returns over the past 36 months for both the fund and the index.
33
Return on Equity. The annual average rate of return generated by a company during the past five years for each dollar of shareholder’s equity (net income divided by shareholder’s equity). For a fund, the weighted average return on equity for the companies whose stocks it holds.
Short-Term Reserves. The percentage of a fund invested in highly liquid, short-term securities that can be readily converted to cash.
Turnover Rate. An indication of the fund’s trading activity. Funds with high turnover rates incur higher transaction costs and may be more likely to distribute capital gains (which may be taxable to investors). The turnover rate excludes in-kind transactions, which have minimal impact on costs.
34
This page intentionally left blank.
The People Who Govern Your Fund
The trustees of your mutual fund are there to see that the fund is operated and managed in your best interests since, as a shareholder, you are a part owner of the fund. Your fund’s trustees also serve on the board of directors of The Vanguard Group, Inc., which is owned by the Vanguard funds and provides services to them on an at-cost basis.
A majority of Vanguard’s board members are independent, meaning that they have no affiliation with Vanguard or the funds they oversee, apart from the sizable personal investments they have made as private individuals. The independent board members have distinguished backgrounds in business, academia, and public service. Each of the trustees and executive officers oversees 181 Vanguard funds.
The following table provides information for each trustee and executive officer of the fund. More information about the trustees is in the Statement of Additional Information, which can be obtained, without charge, by contacting Vanguard at 800-662-7447, or online at vanguard.com.
| |
| Interested Trustee1 | (chemicals); Director of Tyco International, Ltd. |
| | (diversified manufacturing and services) and Hewlett- |
| F. William McNabb III | Packard Co. (electronic computer manufacturing); |
| Born 1957. Trustee Since July 2009. Chairman of the | Senior Advisor at New Mountain Capital; Trustee |
| Board. Principal Occupation(s) During the Past Five | of The Conference Board; Member of the Board of |
| Years: Chairman of the Board of The Vanguard Group, | Managers of Delphi Automotive LLP (automotive |
| Inc., and of each of the investment companies served | components). |
| by The Vanguard Group, since January 2010; Director | |
| of The Vanguard Group since 2008; Chief Executive | Amy Gutmann |
| Officer and President of The Vanguard Group and of | Born 1949. Trustee Since June 2006. Principal |
| each of the investment companies served by The | Occupation(s) During the Past Five Years: President |
| Vanguard Group since 2008; Director of Vanguard | of the University of Pennsylvania; Christopher H. |
| Marketing Corporation; Managing Director of The | Browne Distinguished Professor of Political Science |
| Vanguard Group (1995–2008). | in the School of Arts and Sciences with secondary |
| | appointments at the Annenberg School for Commu- |
| | nication and the Graduate School of Education |
| Independent Trustees | of the University of Pennsylvania; Director of |
| | Carnegie Corporation of New York, Schuylkill River |
| Emerson U. Fullwood | Development Corporation, and Greater Philadelphia |
| Born 1948. Trustee Since January 2008. Principal | Chamber of Commerce; Trustee of the National |
| Occupation(s) During the Past Five Years: Executive | Constitution Center; Chair of the Presidential |
| Chief Staff and Marketing Officer for North America | Commission for the Study of Bioethical Issues. |
| and Corporate Vice President (retired 2008) of Xerox | |
| Corporation (document management products and | JoAnn Heffernan Heisen |
| services); Executive in Residence and 2010 | Born 1950. Trustee Since July 1998. Principal |
| Distinguished Minett Professor at the Rochester | Occupation(s) During the Past Five Years: Corporate |
| Institute of Technology; Director of SPX Corporation | Vice President and Chief Global Diversity Officer |
| (multi-industry manufacturing), the United Way of | (retired 2008) and Member of the Executive |
| Rochester, Amerigroup Corporation (managed health | Committee (1997–2008) of Johnson & Johnson |
| care), the University of Rochester Medical Center, | (pharmaceuticals/consumer products); Director of |
| Monroe Community College Foundation, and North | Skytop Lodge Corporation (hotels), the University |
| Carolina A&T University. | Medical Center at Princeton, the Robert Wood |
| | Johnson Foundation, and the Center for Work Life |
| Rajiv L. Gupta | Policy; Member of the Advisory Board of the |
| Born 1945. Trustee Since December 2001.2 | Maxwell School of Citizenship and Public Affairs |
| Principal Occupation(s) During the Past Five Years: | at Syracuse University. |
| Chairman and Chief Executive Officer (retired 2009) | |
| and President (2006–2008) of Rohm and Haas Co. | |
| | |
| F. Joseph Loughrey | the investment companies served by The Vanguard |
| Born 1949. Trustee Since October 2009. Principal | Group since 2010; Assistant Controller of each of |
| Occupation(s) During the Past Five Years: President | the investment companies served by The Vanguard |
| and Chief Operating Officer (retired 2009) and Vice | Group (2001–2010). | |
| Chairman of the Board (2008–2009) of Cummins Inc. | | |
| (industrial machinery); Director of SKF AB (industrial | Thomas J. Higgins | |
| machinery), Hillenbrand, Inc. (specialized consumer | Born 1957. Chief Financial Officer Since September |
| services), the Lumina Foundation for Education, and | 2008. Principal Occupation(s) During the Past Five |
| Oxfam America; Chairman of the Advisory Council | Years: Principal of The Vanguard Group, Inc.; Chief |
| for the College of Arts and Letters and Member | Financial Officer of each of the investment companies |
| of the Advisory Board to the Kellogg Institute for | served by The Vanguard Group since 2008; Treasurer |
| International Studies at the University of Notre Dame. | of each of the investment companies served by The |
| | Vanguard Group (1998–2008). |
| André F. Perold | | |
| Born 1952. Trustee Since December 2004. Principal | Kathryn J. Hyatt | |
| Occupation(s) During the Past Five Years: George | Born 1955. Treasurer Since November 2008. Principal |
| Gund Professor of Finance and Banking at the Harvard | Occupation(s) During the Past Five Years: Principal |
| Business School (retired July 2011); Chief Investment | of The Vanguard Group, Inc.; Treasurer of each of |
| Officer and Managing Partner of HighVista Strategies | the investment companies served by The Vanguard |
| LLC (private investment firm); Director of Rand | Group since 2008; Assistant Treasurer of each of the |
| Merchant Bank; Overseer of the Museum of Fine | investment companies served by The Vanguard Group |
| Arts Boston. | (1988–2008). | |
| |
| Alfred M. Rankin, Jr. | Heidi Stam | |
| Born 1941. Trustee Since January 1993. Principal | Born 1956. Secretary Since July 2005. Principal |
| Occupation(s) During the Past Five Years: Chairman, | Occupation(s) During the Past Five Years: Managing |
| President, and Chief Executive Officer of NACCO | Director of The Vanguard Group, Inc., since 2006; |
| Industries, Inc. (forklift trucks/housewares/lignite); | General Counsel of The Vanguard Group since 2005; |
| Director of Goodrich Corporation (industrial products/ | Secretary of The Vanguard Group and of each of the |
| aircraft systems and services) and the National | investment companies served by The Vanguard Group |
| Association of Manufacturers; Chairman of the Federal | since 2005; Director and Senior Vice President of |
| Reserve Bank of Cleveland and of University Hospitals | Vanguard Marketing Corporation since 2005; |
| of Cleveland; Advisory Chairman of the Board of The | Principal of The Vanguard Group (1997–2006). |
| Cleveland Museum of Art. | | |
| |
| Peter F. Volanakis | Vanguard Senior Management Team |
| Born 1955. Trustee Since July 2009. Principal | Mortimer J. Buckley | Michael S. Miller |
| Occupation(s) During the Past Five Years: President | Kathleen C. Gubanich | James M. Norris |
| and Chief Operating Officer (retired 2010) of Corning | Paul A. Heller | Glenn W. Reed |
| Incorporated (communications equipment); Director of | Martha G. King | George U. Sauter |
| Corning Incorporated (2000-2010) and Dow Corning | Chris D. McIsaac | |
| (2001-2010); Director of SPX Corporation (multi- | | |
| industry manufacturing), the Corning Foundation, and | | |
| the Corning Museum of Glass; Overseer of the Amos | Chairman Emeritus and Senior Advisor |
| Tuck School of Business Administration at Dartmouth | | |
| College; Advisor to the Norris Cotton Cancer Center. | John J. Brennan | |
| | Chairman, 1996–2009 | |
| | Chief Executive Officer and President, 1996–2008 |
| Executive Officers | | |
| |
| Glenn Booraem | Founder | |
| Born 1967. Controller Since July 2010. Principal | | |
| Occupation(s) During the Past Five Years: Principal | John C. Bogle | |
| of The Vanguard Group, Inc.; Controller of each of | Chairman and Chief Executive Officer, 1974–1996 |
1 Mr. McNabb is considered an “interested person,” as defined in the Investment Company Act of 1940, because he is an officer of the Vanguard funds.
2 December 2002 for Vanguard Equity Income Fund, Vanguard Growth Equity Fund, the Vanguard Municipal Bond Funds, and the Vanguard State Tax-Exempt Funds.
|  |
| P.O. Box 2600 |
| Valley Forge, PA 19482-2600 |
Connect with Vanguard® > vanguard.com
| |
| Fund Information > 800-662-7447 | The funds or securities referred to herein are not |
| Direct Investor Account Services > 800-662-2739 | sponsored, endorsed, or promoted by MSCI, and MSCI |
| | bears no liability with respect to any such funds or |
| Institutional Investor Services > 800-523-1036 | securities. The prospectus or the Statement of |
| Text Telephone for People | Additional Information contains a more detailed |
| With Hearing Impairment > 800-749-7273 | description of the limited relationship MSCI has with |
| | Vanguard and any related funds. |
| This material may be used in conjunction | |
| with the offering of shares of any Vanguard | |
| fund only if preceded or accompanied by | |
| the fund’s current prospectus. | |
| |
| All comparative mutual fund data are from Lipper Inc. or | |
| Morningstar, Inc., unless otherwise noted. | |
| |
| You can obtain a free copy of Vanguard’s proxy voting | |
| guidelines by visiting vanguard.com/proxyreporting or by | |
| calling Vanguard at 800-662-2739. The guidelines are | |
| also available from the SEC’s website, sec.gov. In | |
| addition, you may obtain a free report on how your fund | |
| voted the proxies for securities it owned during the 12 | |
| months ended June 30. To get the report, visit either | |
| vanguard.com/proxyreporting or sec.gov. | |
| |
| You can review and copy information about your fund at | |
| the SEC’s Public Reference Room in Washington, D.C. To | |
| find out more about this public service, call the SEC at | |
| 202-551-8090. Information about your fund is also | |
| available on the SEC’s website, and you can receive | |
| copies of this information, for a fee, by sending a | |
| request in either of two ways: via e-mail addressed to | |
| publicinfo@sec.gov or via regular mail addressed to the | |
| Public Reference Section, Securities and Exchange | |
| Commission, Washington, DC 20549-1520. | |
| |
| |
| | © 2012 The Vanguard Group, Inc. |
| | All rights reserved. |
| | Vanguard Marketing Corporation, Distributor. |
| |
| | Q1230 032012 |

Annual Report | January 31, 2012
Vanguard Dividend Growth Fund
> For the 12 months ended January 31, 2012, Vanguard Dividend Growth Fund returned nearly 10%.
> The fund outperformed the return of its target benchmark and the average return of peer funds.
> The fund benefited from its focus on high-quality, large-capitalization companies, most notably in the health care, consumer discretionary, and consumer staples sectors.
| |
| Contents | |
| Your Fund’s Total Returns. | 1 |
| Chairman’s Letter. | 2 |
| Advisor’s Report. | 8 |
| Fund Profile. | 10 |
| Performance Summary. | 11 |
| Financial Statements. | 13 |
| Your Fund’s After-Tax Returns. | 22 |
| About Your Fund’s Expenses. | 23 |
| Trustees Approve Advisory Agreement. | 25 |
| Glossary. | 26 |
Please note: The opinions expressed in this report are just that—informed opinions. They should not be considered promises or advice.
Also, please keep in mind that the information and opinions cover the period through the date on the front of this report. Of course, the risks of investing in your fund are spelled out in the prospectus.
See the Glossary for definitions of investment terms used in this report.
About the cover: Vanguard was named for the HMS Vanguard, flagship of British Admiral Horatio Nelson. A ship—whose performance and safety depend on the work of all hands—has served as a fitting metaphor for the Vanguard crew as we strive to help clients reach their financial goals.
Your Fund’s Total Returns
Fiscal Year Ended January 31, 2012
| |
| | Total |
| | Returns |
| Vanguard Dividend Growth Fund | 9.90% |
| Dividend Achievers Select Index | 7.57 |
| Large-Cap Core Funds Average | 1.95 |
| Large-Cap Core Funds Average: Derived from data provided by Lipper Inc. |
Your Fund’s Performance at a Glance
January 31, 2011 , Through January 31, 2012
| | | | |
| | | | Distributions Per Share |
| | Starting | Ending | Income | Capital |
| | Share Price | Share Price | Dividends | Gains |
| Vanguard Dividend Growth Fund | $14.68 | $15.81 | $0.313 | $0.000 |
1

Chairman’s Letter
Dear Shareholder,
For the 12 months ended January 31, 2012, the investment environment favored Vanguard Dividend Growth Fund’s holdings in large, high-quality companies with track records of increasing dividends over time. Investors wishing to steer clear of more volatile equities, as well as those pursuing greater yields than those offered by money market or bond funds, bid up the prices of dividend-paying stocks. The fund returned about 10% for the period, outpacing its benchmark—the Dividend Achievers Select Index—which returned about 8%.
The fund significantly outperformed the average return of its large-capitalization core fund peers and the broad U.S. stock market. For the full year, its income distribution was about 15% higher than its fiscal 2011 distribution.
The fund posted positive results in all sectors, with the exception of industrials. Health care, consumer discretionary, and consumer staples stocks contributed most to returns.
If you own the Dividend Growth Fund in a taxable account, you may wish to review the information about its after-tax returns later in this report.
2
Volatility was a constant
in fast-changing markets
For the 12 months ended January 31, the broad U.S. stock market returned 3.55%. This modest result reflected rallies and reversals driven by drama on the global stage, including Europe’s debt crisis and rating agency Standard & Poor’s decision to downgrade the U.S. credit rating. (Vanguard’s confidence in the full faith and credit of the U.S. Treasury remains unshaken.)
The recent volatility is consistent with the pattern of the past five years, as suggested by the figures in the Market Barometer. The dramatic differences in average annual returns over the one-, three-, and five-year periods are a consequence of the stock market’s heady spikes and precipitous declines.
Although the outcome was different, this turbulence is also apparent in the returns of international stock markets. In the past 12 months, non-U.S. stock markets delivered negative results. Weakness was widespread, with the worst returns in Europe and Japan.
Modest yields and high returns
in the bond market
Bonds ended the fiscal year with surprisingly strong returns. At the start of the period, the 10-year Treasury note’s slender yield of 3.38% seemed
| | | |
| Market Barometer | | | |
| |
| | | Average Annual Total Returns |
| | | Periods Ended January 31, 2012 |
| | One | Three | Five |
| | Year | Years | Years |
| Stocks | | | |
| Russell 1000 Index (Large-caps) | 3.95% | 20.01% | 0.55% |
| Russell 2000 Index (Small-caps) | 2.86 | 23.03 | 1.19 |
| Dow Jones U.S. Total Stock Market Index | 3.55 | 20.54 | 0.88 |
| MSCI All Country World Index ex USA (International) | -8.75 | 16.70 | -1.71 |
| |
| Bonds | | | |
| Barclays Capital U.S. Aggregate Bond Index (Broad | | | |
| taxable market) | 8.66% | 7.40% | 6.70% |
| Barclays Capital Municipal Bond Index (Broad | | | |
| tax-exempt market) | 14.10 | 8.10 | 5.76 |
| Citigroup Three-Month U.S. Treasury Bill Index | 0.07 | 0.10 | 1.27 |
| |
| CPI | | | |
| Consumer Price Index | 2.93% | 2.39% | 2.29% |
3
to be a good reason to temper expectations. As stock market volatility spiked and investors put a premium on safety, however, yields moved lower still.
The 10-year T-note finished the period at 1.80%. The Barclays Capital U.S. Aggregate Bond Index, a broad taxable bond market benchmark, returned 8.66%.
Municipal bonds did even better, as prices snapped back from a fear-driven plunge in the months preceding the new fiscal year. Although last year’s low expectations proved misguided, it’s worth remembering that low yields do imply lower future returns: As yields tumble, the scope for further declines—and increases in prices—diminishes.
Savings instruments such as the 3-month Treasury bill returned a little more than 0%, consistent with the Federal Reserve’s target for the shortest-term interest rates.
A focus on high-quality
companies boosted returns
Dividend Growth Fund invests in large, high-quality companies with strong potential for steady earnings and dividend growth. This longstanding strategy found favor over the fiscal year, as investors sought perceived safety in larger, more established companies and income from dividend-paying stocks.
Expense Ratios
Your Fund Compared With Its Peer Group
| | |
| | | Peer Group |
| | Fund | Average |
| Dividend Growth Fund | 0.34% | 1.19% |
The fund expense ratio shown is from the prospectus dated May 26, 2011, and represents estimated costs for the current fiscal year. For the fiscal year ended January 31, 2012, the fund’s expense ratio was 0.31%. The peer-group expense ratio is derived from data provided by Lipper Inc. and captures information through year-end 2011.
Peer group: Large-Cap Core Funds.
4
The fund posted positive results in nine out of the ten market sectors. Strong stock selection added to its performance relative to its benchmark index.
Health care—the largest weighting in the fund, representing roughly 16 percent of its assets, on average—contributed most, both on an absolute and relative basis. When concerns about the global economy resurfaced early in the period, investors flocked to these stocks, which are often viewed as safe havens in volatile times.
Consumer discretionary holdings were the fund’s second-strongest contributors. The sector gained because of improved consumer spending and a good holiday season for retailers. The fund didn’t perform quite as well as it could have, however, as it missed out on some of the strength in fast-food restaurants and apparel retailers.
Holdings in consumer staples and energy boosted the fund’s absolute and relative performance. CVS (+24%) and WalMart (+12%), which increased its dividend by 21% last year, were the biggest contributors within consumer staples. In energy, Enbridge (+34%), a Canadian oil and gas transportation company, added most. The company announced in December that its 2012 dividend would increase by 15%.
Total Returns
Ten Years Ended January 31, 2012
| |
| | Average |
| | Annual Return |
| Dividend Growth Fund | 5.60% |
| Dividend Growth Spliced Index | 2.61 |
| Dividend Growth Spliced Average | 1.79 |
Dividend Growth Spliced Index: Prior to December 6, 2002, the comparative benchmark was known as the Utilities Composite Index. The index weightings were: 40% S&P Utilities Index, 40% S&P Telephone Index, and 20% Lehman Brothers Utility Bond Index through April 30, 1999; 63.75% S&P Utilities Index, 21.25% S&P Telephone Index, and 15% Lehman Brothers Utility Bond Index through March 31, 2000; 75% S&P Utilities Index and 25% S&P Telephone Index through December 31, 2001; and 75% S&P Utilities Index and 25% S&P Integrated Telecommunication Services Index through December 6, 2002. The fund’s benchmark was the Russell 1000 Index through January 31, 2010, after which it was changed to the Dividend Achievers Select Index. The Dividend Achievers Select Index is administered exclusively for Vanguard by Mergent, Inc.
Dividend Growth Spliced Average: Based on the Utility Funds Average through December 6, 2002, and the Large-Cap Core Funds Average thereafter. Derived from data provided by Lipper Inc.
The figures shown represent past performance, which is not a guarantee of future results. (Current performance may be lower or higher than the performance data cited. For performance data current to the most recent month-end, visit our website at vanguard.com/performance.) Note, too, that both investment returns and principal value can fluctuate widely, so an investor’s shares, when sold, could be worth more or less than their original cost.
5
Industrials was the only sector in which the fund posted a negative return. Its stocks weighed slightly on both absolute and relative performance.
Fund bests index and peers
over the long term
For the ten years ended January 31, 2012, Vanguard Dividend Growth Fund returned an average of 5.60% annually, significantly outpacing both its benchmark (+2.65%) and its peers (+1.79%). It also beat the broad U.S. stock market, which posted an average annual return of 4.55%.
The fund’s strong performance over the past decade—a period encompassing extreme volatility in the financial markets, a global recession, and Europe’s sovereign debt crisis—can be attributed to its advisor. Wellington Management Company, llp, has managed the fund since its inception.
|
| Investment insight |
|
| Historically low bond yields have prompted some pundits in the financial press to |
| suggest switching from bonds into higher-yielding stocks. Dividend-oriented stocks |
| can play a valuable role in a portfolio, but they are not bond substitutes. |
| |
| The chart below shows that since 2007, the quarterly returns of dividend-oriented |
| stocks have been much more volatile than those of bonds. If your appetite for risk |
| has not increased, your exposure to stocks, even those that have consistently |
| increased their dividends, probably shouldn’t either. |
| |
| Dividend-oriented stock returns and bond returns by quarter, 2007 through 2011 |

6
(The fund has undergone significant changes in its mandate and strategy since it launched in 1992 as Vanguard Utilities Income Fund. It changed its name in 2002 and, at the same time, broadly diversified its investments and began to focus on companies with long-term potential for dividend growth.) We believe that the team’s ongoing emphasis on high-quality companies, accompanied by the fund’s low costs, will continue to generate competitive results over the long term.
A balanced portfolio is key
regardless of market conditions
While the financial markets will inevitably continue to swell and dip, we believe investors are well-served by maintaining a diversified, balanced plan that offers the potential for wealth accumulation through exposure to stocks and a cushion from the market’s occasional—and inevitable— reversals through exposure to bonds.
Vanguard Dividend Growth Fund can play an important role in the stock portion of such a portfolio because it invests in large, high-quality companies with solid track records of increasing their earnings payouts. And the fund’s low costs can help you keep more of the return on your investment.
Thank you for investing your assets at Vanguard.
Sincerely,

F. William McNabb III
Chairman and Chief Executive Officer
February 14, 2012
7
Advisor’s Report
The Vanguard Dividend Growth Fund returned 9.90% for the 12 months ended January 31, 2012, besting the 7.57% gain of the Dividend Achievers Select Index.
The investment environment
The investment environment remains uncertain. Indeed, the last 12 months have been marked by rapid change in market sentiment, and much of the swing can be directly tied to the ongoing economic drama in Europe. How the issues in Europe will ultimately be resolved remains a giant open question in our view, so we remain cautious, despite a strong rally in global markets thus far in 2012. Regardless of the environment, we will remain singularly focused on our philosophical foundation, defined by dividend growth.
The fund’s successes
On an absolute basis, all but one sector contributed positively to performance for the period, with the fund’s holdings in health care, consumer discretionary, and consumer staples contributing the most. Among the portfolio’s top contributors were Enbridge, McDonald’s, and Amgen.
Based on our current data, we expect the portfolio to produce asset-weighted dividend growth of 8.3% for 2012. The current portfolio produced dividend growth of 15.4% in calendar 2011. Our run rate calculation is a rough estimate of potential dividend growth that takes a company’s current declared dividend rate, annualizes it, and compares it to the previous calendar year’s actual dividend rate. This calculation does not accurately reflect dividend increases that may be announced later in the year, nor does it take into account the actual dollar size of the increases. Therefore, companies in the early stages of dividend growth tend to show large percentage increases, even though their absolute cash dividend may be small. Despite these shortcomings, we still view this estimate as a reasonable report card.
Among the more notable dividend run rate increases thus far in 2012 were those by ACE (38.2%) and Lockheed Martin (23.1%). Roughly ten companies held in the portfolio have yet to announce any change in expected dividend for 2012, although we expect them to announce increases as the year progresses.
The fund’s shortfalls
Industrials was the only sector that did not make a positive contribution to performance. A number of individual stocks also detracted from the fund’s absolute performance. Among the more noteworthy detractors were General Dynamics, Target, and Western Union. While we would prefer all stocks in the fund to perform well at all times, it is inevitable that some holdings will detract over a given time period. We assess a stock’s contribution over a longer time- frame, with a consistent focus on dividend action. We expect the aforementioned three companies to raise their dividends meaningfully over the next five years.
8
The fund’s positioning and
investment strategy
Our primary objective is to identify companies that we believe will steadily and reliably increase their dividend payments. We seek to fulfill this objective by carefully building the portfolio one stock at a time, giving central consideration to each company’s dividend growth prospects. Our industry weightings are a result of this process. The fund has significant positions in the health care, energy, consumer staples, and technology sectors and less exposure to utilities, telecommunication services, materials, and financials.
An analogy I like to use to describe our approach relates to ice hockey, a game in which there are three broad categories of players. The first group includes those very rare talents who have an instinct for where the puck is going and are able to skate to that spot before anyone else. Wayne Gretzky comes to mind. Most players fall into the second category, those who skate to where the puck is in hopes of catching it before it inevitably moves away. Finally, the third kind of player simply skates his lane . . . up and down the ice. Eventually, the puck ends up on his stick and he takes advantage of that opportunity. But he spends much of the game being patient and steadily skating where he is supposed to skate.
In this context, hockey is similar to investing. We view ourselves as “skate your lane” investors. In years such as 2009 and 2010, the “puck” rarely found our stick. But for much of the last 12 months it did, and the virtue of this mindset scored strong returns for shareholders. We intend to stay in our lane.
Donald J. Kilbride
Senior Vice President and
Equity Portfolio Manager
Wellington Management Company, LLP
February 16, 2012
9
Dividend Growth Fund
Fund Profile
As of January 31, 2012
| | | |
| Portfolio Characteristics | | |
| | | Dividend | DJ |
| | | Achievers | U.S. Total |
| | | Select | Market |
| | Fund | Index | Index |
| Number of Stocks | 48 | 126 | 3,738 |
| Median Market Cap $56.1B | $44.4B | $32.6B |
| Price/Earnings Ratio | 14.3x | 14.2x | 15.5x |
| Price/Book Ratio | 2.7x | 2.9x | 2.2x |
| Return on Equity | 24.4% | 24.6% | 19.1% |
| Earnings Growth Rate | 7.0% | 5.5% | 7.1% |
| Dividend Yield | 2.5% | 2.4% | 2.0% |
| Foreign Holdings | 4.1% | 0.0% | 0.0% |
| Turnover Rate | 13% | — | — |
| Ticker Symbol | VDIGX | — | — |
| Expense Ratio1 | 0.34% | — | — |
| 30-Day SEC Yield | 2.19% | — | — |
| Short-Term Reserves | 6.8% | — | — |
| |
| Sector Diversification (% of equity exposure) |
| | | Dividend | DJ |
| | | Achievers | U.S. Total |
| | | Select | Market |
| | Fund | Index | Index |
| Consumer | | | |
| Discretionary | 13.7% | 13.1% | 11.7% |
| Consumer Staples | 14.3 | 23.6 | 9.5 |
| Energy | 12.8 | 14.8 | 11.0 |
| Financials | 8.1 | 6.3 | 15.4 |
| Health Care | 15.6 | 5.6 | 11.7 |
| Industrials | 14.6 | 21.5 | 11.3 |
| Information | | | |
| Technology | 15.3 | 6.9 | 19.0 |
| Materials | 3.9 | 6.5 | 4.3 |
| Telecommunication | | | |
| Services | 0.0 | 0.1 | 2.5 |
| Utilities | 1.7 | 1.6 | 3.6 |
| | |
| Volatility Measures | | |
| | | DJ |
| | Dividend | U.S. Total |
| | Growth | Market |
| Spliced Index | Index |
| R-Squared | 0.95 | 0.92 |
| Beta | 0.84 | 0.74 |
| These measures show the degree and timing of the fund’s fluctuations compared with the indexes over 36 months. | |
| |
| |
| Ten Largest Holdings (% of total net assets) |
| Occidental Petroleum | Integrated Oil & | |
| Corp. | Gas | 3.4% |
| Automatic Data | Data Processing & | |
| Processing Inc. | Outsourced | |
| | Services | 3.0 |
| Microsoft Corp. | Systems Software | 3.0 |
| PepsiCo Inc. | Soft Drinks | 2.9 |
| Johnson & Johnson | Pharmaceuticals | 2.8 |
| United Parcel Service | Air Freight & | |
| Inc. | Logistics | 2.7 |
| Target Corp. | General | |
| | Merchandise Stores | 2.7 |
| Exxon Mobil Corp. | Integrated Oil & | |
| | Gas | 2.6 |
| General Dynamics Corp. | Aerospace & | |
| | Defense | 2.6 |
| Medtronic Inc. | Health Care | |
| | Equipment | 2.5 |
| Top Ten | | 28.2% |
| The holdings listed exclude any temporary cash investments and equity index products. |
| | |
Investment Focus
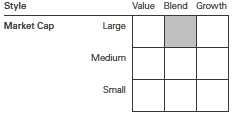
1 The expense ratio shown is from the prospectus dated May 26, 2011, and represents estimated costs for the current fiscal year. For the fiscal year ended January 31, 2012, the expense ratio was 0.31%.
10
Dividend Growth Fund
Performance Summary
All of the returns in this report represent past performance, which is not a guarantee of future results that may be achieved by the fund. (Current performance may be lower or higher than the performance data cited. For performance data current to the most recent month-end, visit our website at vanguard.com/performance.) Note, too, that both investment returns and principal value can fluctuate widely, so an investor’s shares, when sold, could be worth more or less than their original cost. The returns shown do not reflect taxes that a shareholder would pay on fund distributions or on the sale of fund shares.
Cumulative Performance: January 31, 2002, Through January 31, 2012
Initial Investment of $10,000
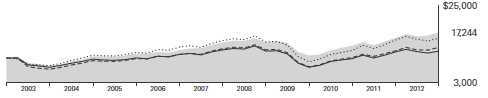
| | | | |
| | | Average Annual Total Returns | |
| | | Periods Ended January 31, 2012 | |
| | | | | Final Value |
| | One | Five | Ten | of a $10,000 |
| | Year | Years | Years | Investment |
| Dividend Growth Fund | 9.90% | 3.68% | 5.60% | $17,244 |
| Dow Jones U.S. Total Stock Market | | | | |
| Index | 3.55 | 0.88 | 4.55 | 15,604 |
| Dividend Growth Spliced Index | 7.57 | 0.55 | 2.61 | 12,942 |
| Dividend Growth Spliced Average | 1.95 | -0.55 | 1.79 | 11,937 |
Note: Prior to December 6, 2002, the fund was known as the Utilities Income Fund.
Dividend Growth Spliced Index: Prior to December 6, 2002, the comparative benchmark was known as the Utilities Composite Index. The index weightings were: 40% S&P Utilities Index, 40% S&P Telephone Index, and 20% Lehman Brothers Utility Bond Index through April 30, 1999; 63.75% S&P Utilities Index, 21.25% S&P Telephone Index, and 15% Lehman Brothers Utility Bond Index through March 31, 2000; 75% S&P Utilities Index and 25% S&P Telephone Index through December 31, 2001; and 75% S&P Utilities Index and 25% S&P Integrated Telecommunication Services Index through December 6, 2002. The fund’s benchmark was the Russell 1000 Index through January 31, 2010, after which it was changed to the Dividend Achievers Select Index. The Dividend Achievers Select Index is administered exclusively for Vanguard by Mergent, Inc.
Dividend Growth Spliced Average: Based on the Utility Funds Average through December 6, 2002, and the Large-Cap Core Funds Average thereafter. Derived from data provided by Lipper Inc.
See Financial Highlights for dividend and capital gains information.
11
Dividend Growth Fund
Fiscal-Year Total Returns (%): January 31, 2002, Through January 31, 2012
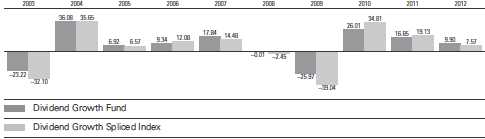
Average Annual Total Returns: Periods Ended December 31, 2011
This table presents returns through the latest calendar quarter—rather than through the end of the fiscal period.
Securities and Exchange Commission rules require that we provide this information.
| | | | |
| | Inception | One | Five | Ten |
| | Date | Year | Years | Years |
| Dividend Growth Fund | 5/15/1992 | 9.43% | 3.40% | 4.97% |
12
Dividend Growth Fund
Financial Statements
Statement of Net Assets
As of January 31, 2012
The fund reports a complete list of its holdings in regulatory filings four times in each fiscal year, at the quarter-ends. For the second and fourth fiscal quarters, the lists appear in the fund’s semiannual and annual reports to shareholders. For the first and third fiscal quarters, the fund files the lists with the Securities and Exchange Commission on Form N-Q. Shareholders can look up the fund’s Forms N-Q on the SEC’s website at sec.gov. Forms N-Q may also be reviewed and copied at the SEC’s Public Reference Room (see the back cover of this report for further information).
| | |
| | | Market |
| | | Value |
| | Shares | ($000) |
| Common Stocks (92.9%) | | |
| Consumer Discretionary (12.7%) | |
| Target Corp. | 4,622,859 | 234,887 |
| Lowe’s Cos. Inc. | 6,198,351 | 166,302 |
| NIKE Inc. Class B | 1,587,916 | 165,127 |
| McDonald’s Corp. | 1,649,394 | 163,373 |
| Mattel Inc. | 4,830,335 | 149,740 |
| Walt Disney Co. | 3,561,853 | 138,556 |
| Comcast Corp. Class A | 3,848,500 | 102,332 |
| | | 1,120,317 |
| Consumer Staples (13.3%) | | |
| PepsiCo Inc. | 3,856,245 | 253,240 |
| Sysco Corp. | 6,668,007 | 200,774 |
| Procter & Gamble Co. | 2,616,050 | 164,916 |
| CVS Caremark Corp. | 3,898,591 | 162,766 |
| Colgate-Palmolive Co. | 1,656,581 | 150,285 |
| Wal-Mart Stores Inc. | 2,208,153 | 135,492 |
| Coca-Cola Co. | 1,620,388 | 109,425 |
| | | 1,176,898 |
| Energy (11.9%) | | |
| Occidental | | |
| Petroleum Corp. | 2,991,917 | 298,504 |
| Exxon Mobil Corp. | 2,786,196 | 233,316 |
| BG Group plc | 8,405,470 | 189,399 |
| Enbridge Inc. | 4,585,192 | 172,220 |
| Chevron Corp. | 1,517,775 | 156,452 |
| | | 1,049,891 |
| Financials (7.5%) | | |
| ACE Ltd. | 2,430,876 | 169,189 |
| Wells Fargo & Co. | 5,163,730 | 150,833 |
| PNC Financial | | |
| Services Group Inc. | 2,539,468 | 149,625 |
| Marsh & McLennan | | |
| Cos. Inc. | 3,110,011 | 98,245 |
| Chubb Corp. | 1,411,110 | 95,123 |
| | | 663,015 |
| Health Care (14.5%) | | |
| Johnson & Johnson | 3,765,639 | 248,193 |
| Medtronic Inc. | 5,779,642 | 222,921 |
| | |
| | | Market |
| | | Value |
| | Shares | ($000) |
| Cardinal Health Inc. | 4,455,703 | 191,729 |
| Pfizer Inc. | 8,798,627 | 188,291 |
| Abbott Laboratories | 2,894,338 | 156,728 |
| Amgen Inc. | 2,192,082 | 148,864 |
| UnitedHealth Group Inc. | 2,409,185 | 124,772 |
| | | 1,281,498 |
| Industrials (13.6%) | | |
| United Parcel | | |
| Service Inc. Class B | 3,140,041 | 237,544 |
| General Dynamics Corp. | 3,279,943 | 226,841 |
| Honeywell | | |
| International Inc. | 2,537,353 | 147,268 |
| Lockheed Martin Corp. | 1,692,572 | 139,333 |
| Waste Management Inc. | 3,693,422 | 128,383 |
| Northrop Grumman Corp. | 2,102,618 | 122,057 |
| Emerson Electric Co. | 1,904,098 | 97,833 |
| United Technologies Corp. | 1,237,004 | 96,919 |
| | | 1,196,178 |
| Information Technology (14.3%) | |
| Automatic Data | | |
| Processing Inc. | 4,884,125 | 267,552 |
| Microsoft Corp. | 8,935,784 | 263,874 |
| International Business | | |
| Machines Corp. | 1,115,939 | 214,930 |
| Oracle Corp. | 6,859,341 | 193,433 |
| Western Union Co. | 9,740,772 | 186,049 |
| Accenture plc Class A | 2,327,244 | 133,444 |
| | | 1,259,282 |
| Materials (3.6%) | | |
| Ecolab Inc. | 2,887,289 | 174,508 |
| Praxair Inc. | 1,349,495 | 143,316 |
| | | 317,824 |
| Utilities (1.5%) | | |
| Dominion Resources Inc. | 2,732,499 | 136,734 |
| Total Common Stocks | | |
| (Cost $7,006,142) | | 8,201,637 |
13
| | |
| Dividend Growth Fund | | |
| |
| |
| |
| | Face | Market |
| | Amount | Value |
| | ($000) | ($000) |
| Temporary Cash Investments (6.7%) | |
| Repurchase Agreements (6.7%) | |
| Morgan Stanley 0.230%, | | |
| 2/1/12 (Dated 1/31/12, | | |
| Repurchase Value | | |
| $274,202,000, | | |
| collateralized by Federal | | |
| Home Loan Mortgage | | |
| Corp. 3.000%–4.500%, | | |
| 1/1/22–9/1/41) | 274,200 | 274,200 |
| RBS Securities, Inc. | | |
| 0.220%, 2/1/12 (Dated | | |
| 1/31/12, Repurchase Value | | |
| $321,902,000, collateralized | | |
| by Government National | | |
| Mortgage Assn. | | |
| 1.746%–5.390%, | | |
| 5/20/60–11/20/61) | 321,900 | 321,900 |
| | | 596,100 |
| Total Temporary Cash Investments | |
| (Cost $596,100) | | 596,100 |
| Total Investments (99.6%) | | |
| (Cost $7,602,242) | | 8,797,737 |
| Other Assets and Liabilities (0.4%) | |
| Other Assets | | 147,958 |
| Liabilities | | (116,992) |
| | | 30,966 |
| Net Assets (100%) | | |
| Applicable to 558,490,128 outstanding | |
| $.001 par value shares of beneficial | |
| interest (unlimited authorization) | 8,828,703 |
| Net Asset Value Per Share | | $15.81 |
| |
| At January 31, 2012, net assets consisted of: |
| | Amount |
| | ($000) |
| Paid-in Capital | 7,693,398 |
| Undistributed Net Investment Income | 6,561 |
| Accumulated Net Realized Losses | (66,751) |
| Unrealized Appreciation (Depreciation) | 1,195,495 |
| Net Assets | 8,828,703 |
See Note A in Notes to Financial Statements.
See accompanying Notes, which are an integral part of the Financial Statements.
14
Dividend Growth Fund
Statement of Operations
| |
| | Year Ended |
| | January 31, 2012 |
| | ($000) |
| Investment Income | |
| Income | |
| Dividends1 | 157,342 |
| Interest | 222 |
| Security Lending | 386 |
| Total Income | 157,950 |
| Expenses | |
| Investment Advisory Fees—Note B | |
| Basic Fee | 6,313 |
| Performance Adjustment | 233 |
| The Vanguard Group—Note C | |
| Management and Administrative | 10,474 |
| Marketing and Distribution | 1,514 |
| Custodian Fees | 81 |
| Auditing Fees | 27 |
| Shareholders’ Reports | 78 |
| Trustees’ Fees and Expenses | 13 |
| Total Expenses | 18,733 |
| Net Investment Income | 139,217 |
| Realized Net Gain (Loss) | |
| Investment Securities Sold | 43,051 |
| Foreign Currencies | 16 |
| Realized Net Gain (Loss) | 43,067 |
| Change in Unrealized Appreciation (Depreciation) of Investment Securities | 483,727 |
| Net Increase (Decrease) in Net Assets Resulting from Operations | 666,011 |
| 1 Dividends are net of foreign withholding taxes of $525,000. |
See accompanying Notes, which are an integral part of the Financial Statements.
15
Dividend Growth Fund
Statement of Changes in Net Assets
| | |
| | Year Ended January 31, |
| | 2012 | 2011 |
| | ($000) | ($000) |
| Increase (Decrease) in Net Assets | | |
| Operations | | |
| Net Investment Income | 139,217 | 83,102 |
| Realized Net Gain (Loss) | 43,067 | 20,217 |
| Change in Unrealized Appreciation (Depreciation) | 483,727 | 504,924 |
| Net Increase (Decrease) in Net Assets Resulting from Operations | 666,011 | 608,243 |
| Distributions | | |
| Net Investment Income | (135,265) | (80,042) |
| Realized Capital Gain | — | — |
| Total Distributions | (135,265) | (80,042) |
| Capital Share Transactions | | |
| Issued | 4,174,976 | 2,215,256 |
| Issued in Lieu of Cash Distributions | 117,021 | 67,883 |
| Redeemed | (989,177) | (630,529) |
| Net Increase (Decrease) from Capital Share Transactions | 3,302,820 | 1,652,610 |
| Total Increase (Decrease) | 3,833,566 | 2,180,811 |
| Net Assets | | |
| Beginning of Period | 4,995,137 | 2,814,326 |
| End of Period1 | 8,828,703 | 4,995,137 |
| 1 Net Assets—End of Period includes undistributed (overdistributed) net investment income of $6,561,000 and $2,593,000. |
See accompanying Notes, which are an integral part of the Financial Statements.
16
Dividend Growth Fund
Financial Highlights
| | | | | |
| For a Share Outstanding | | | Year Ended January 31, |
| Throughout Each Period | 2012 | 2011 | 2010 | 2009 | 2008 |
| Net Asset Value, Beginning of Period | $14.68 | $12.82 | $10.42 | $14.38 | $14.74 |
| Investment Operations | | | | | |
| Net Investment Income | .317 | .283 | .291 | .264 | .290 |
| Net Realized and Unrealized Gain (Loss) | | | | | |
| on Investments | 1.126 | 1.850 | 2.401 | (3.960) | (.270) |
| Total from Investment Operations | 1.443 | 2.133 | 2.692 | (3.696) | .020 |
| Distributions | | | | | |
| Dividends from Net Investment Income | (.313) | (.273) | (.292) | (.264) | (.280) |
| Distributions from Realized Capital Gains | — | — | — | — | (.100) |
| Total Distributions | (.313) | (.273) | (.292) | (.264) | (.380) |
| Net Asset Value, End of Period | $15.81 | $14.68 | $12.82 | $10.42 | $14.38 |
| |
| Total Return1 | 9.90% | 16.85% | 26.01% | -25.97% | -0.01% |
| |
| Ratios/Supplemental Data | | | | | |
| Net Assets, End of Period (Millions) | $8,829 | $4,995 | $2,814 | $1,745 | $1,326 |
| Ratio of Total Expenses to | | | | | |
| Average Net Assets2 | 0.31% | 0.34% | 0.38% | 0.36% | 0.32% |
| Ratio of Net Investment Income to | | | | | |
| Average Net Assets | 2.28% | 2.25% | 2.59% | 2.25% | 1.91% |
| Portfolio Turnover Rate | 13% | 17% | 24% | 28% | 36% |
1 Total returns do not include account service fees that may have applied in the periods shown. Fund prospectuses provide information about any applicable account service fees.
2 Includes performance-based investment advisory fee increases (decreases) of 0.00%, 0.03%, 0.03%, 0.03%, and 0.00%.
See accompanying Notes, which are an integral part of the Financial Statements.
17
Dividend Growth Fund
Notes to Financial Statements
Vanguard Dividend Growth Fund is registered under the Investment Company Act of 1940 as an open-end investment company, or mutual fund.
A. The following significant accounting policies conform to generally accepted accounting principles for U.S. mutual funds. The fund consistently follows such policies in preparing its financial statements.
1. Security Valuation: Securities are valued as of the close of trading on the New York Stock Exchange (generally 4 p.m., Eastern time) on the valuation date. Equity securities are valued at the latest quoted sales prices or official closing prices taken from the primary market in which each security trades; such securities not traded on the valuation date are valued at the mean of the latest quoted bid and asked prices. Securities for which market quotations are not readily available, or whose values have been affected by events occurring before the fund’s pricing time but after the close of the securities’ primary markets, are valued at their fair values calculated according to procedures adopted by the board of trustees. These procedures include obtaining quotations from an independent pricing service, monitoring news to identify significant market- or security-specific events, and evaluating changes in the values of foreign market proxies (for example, ADRs, futures contracts, or exchange-traded funds), between the time the foreign markets close and the fund’s pricing time. When fair-value pricing is employed, the prices of securities used by a fund to calculate its net asset value may differ from quoted or published prices for the same securities. Investments in Vanguard Market Liquidity Fund are valued at that fund’s net asset value. Temporary cash investments acquired over 60 days to maturity are valued using the latest bid prices or using valuations based on a matrix system (which considers such factors as security prices, yields, maturities, and ratings), both as furnished by independent pricing services. Other temporary cash investments are valued at amortized cost, which approximates market value.
2. Foreign Currency: Securities and other assets and liabilities denominated in foreign currencies are translated into U.S. dollars using exchange rates obtained from an independent third party as of the fund’s pricing time on the valuation date. Realized gains (losses) and unrealized appreciation (depreciation) on investment securities include the effects of changes in exchange rates since the securities were purchased, combined with the effects of changes in security prices. Fluctuations in the value of other assets and liabilities resulting from changes in exchange rates are recorded as unrealized foreign currency gains (losses) until the assets or liabilities are settled in cash, at which time they are recorded as realized foreign currency gains (losses).
3. Repurchase Agreements: The fund may enter into repurchase agreements. Securities pledged as collateral for repurchase agreements are held by a custodian bank until the agreements mature. Each agreement requires that the market value of the collateral be sufficient to cover payments of interest and principal. In the event of default or bankruptcy by the other party to the agreement, the fund may sell or retain the collateral; however such action may be subject to legal proceedings.
4. Federal Income Taxes: The fund intends to continue to qualify as a regulated investment company and distribute all of its taxable income. Management has analyzed the fund’s tax positions taken for all open federal income tax years (January 31, 2009–2012), and has concluded that no provision for federal income tax is required in the fund’s financial statements.
5. Distributions: Distributions to shareholders are recorded on the ex-dividend date.
6. Security Lending: The fund may lend its securities to qualified institutional borrowers to earn additional income. Security loans are required to be secured at all times by collateral at least equal to the market value of securities loaned. The fund invests cash collateral received in Vanguard Market Liquidity Fund, and records a liability for the return of the collateral, during the period the securities are on loan. Security lending income represents fees charged to borrowers plus income earned on investing cash collateral, less expenses associated with the loan.
18
Dividend Growth Fund
7. Other: Dividend income is recorded on the ex-dividend date. Interest income is accrued daily. Security transactions are accounted for on the date securities are bought or sold. Costs used to determine realized gains (losses) on the sale of investment securities are those of the specific securities sold.
B. Wellington Management Company, LLP, provides investment advisory services to the fund for a fee calculated at an annual percentage rate of average net assets. The basic fee is subject to quarterly adjustments based on the fund’s performance for the preceding three years relative to the Russell 1000 Index for periods prior to February 1, 2010, and the current benchmark, the Dividend Achievers Select Index, beginning February 1, 2010. The benchmark change will be fully phased in by January 2013. For the year ended January 31, 2012, the investment advisory fee represented an effective annual basic rate of 0.10% of the fund’s average net assets before an increase of $233,000 (0.00%) based on performance.
C. The Vanguard Group furnishes at cost corporate management, administrative, marketing, and distribution services. The costs of such services are allocated to the fund under methods approved by the board of trustees. The fund has committed to provide up to 0.40% of its net assets in capital contributions to Vanguard. At January 31, 2012, the fund had contributed capital of $1,243,000 to Vanguard (included in Other Assets), representing 0.01% of the fund’s net assets and 0.50% of Vanguard’s capitalization. The fund’s trustees and officers are also directors and officers of Vanguard.
D. Various inputs may be used to determine the value of the fund’s investments. These inputs are summarized in three broad levels for financial statement purposes. The inputs or methodologies used to value securities are not necessarily an indication of the risk associated with investing in those securities.
Level 1—Quoted prices in active markets for identical securities.
Level 2—Other significant observable inputs (including quoted prices for similar securities, interest rates, prepayment speeds, credit risk, etc.).
Level 3—Significant unobservable inputs (including the fund’s own assumptions used to determine the fair value of investments).
The following table summarizes the market value of the fund’s investments as of January 31, 2012, based on the inputs used to value them:
| | | |
| | Level 1 | Level 2 | Level 3 |
| Investments | ($000) | ($000) | ($000) |
| Common Stocks | 8,012,238 | 189,399 | — |
| Temporary Cash Investments | — | 596,100 | — |
| Total | 8,012,238 | 785,499 | — |
E. Distributions are determined on a tax basis and may differ from net investment income and realized capital gains for financial reporting purposes. Differences may be permanent or temporary. Permanent differences are reclassified among capital accounts in the financial statements to reflect their tax character. Temporary differences arise when certain items of income, expense, gain, or loss are recognized in different periods for financial statement and tax purposes; these differences will reverse at some time in the future. Differences in classification may also result from the treatment of short-term gains as ordinary income for tax purposes.
19
Dividend Growth Fund
During the year ended January 31, 2012, the fund realized net foreign currency gains of $16,000, which increased distributable net income for tax purposes; accordingly, such gains have been reclassified from accumulated net realized losses to undistributed net investment income.
For tax purposes, at January 31, 2012, the fund had $13,465,000 of ordinary income available for distribution. The fund had available capital loss carryforwards totaling $63,309,000 to offset future net capital gains through January 31, 2018.
At January 31, 2012, the cost of investment securities for tax purposes was $7,605,268,000. Net unrealized appreciation of investment securities for tax purposes was $1,192,469,000, consisting of unrealized gains of $1,219,358,000 on securities that had risen in value since their purchase and $26,889,000 in unrealized losses on securities that had fallen in value since their purchase.
F. During the year ended January 31, 2012, the fund purchased $3,620,207,000 of investment securities and sold $754,948,000 of investment securities, other than temporary cash investments.
G. Capital shares issued and redeemed were:
| | |
| | Year Ended January 31, |
| | 2012 | 2011 |
| | Shares | Shares |
| | (000) | (000) |
| Issued | 276,882 | 162,602 |
| Issued in Lieu of Cash Distributions | 7,601 | 5,031 |
| Redeemed | (66,333) | (46,786) |
| Net Increase (Decrease) in Shares Outstanding | 218,150 | 120,847 |
H. In preparing the financial statements as of January 31, 2012, management considered the impact of subsequent events for potential recognition or disclosure in these financial statements.
20
Report of Independent Registered
Public Accounting Firm
To the Trustees of Vanguard Specialized Funds and the Shareholders of Vanguard Dividend Growth Fund:
In our opinion, the accompanying statement of net assets and the related statements of operations and of changes in net assets and the financial highlights present fairly, in all material respects, the financial position of Vanguard Dividend Growth Fund (constituting a separate portfolio of Vanguard Specialized Funds, hereafter referred to as the “Fund”) at January 31, 2012, the results of its operations for the year then ended, the changes in its net assets for each of the two years in the period then ended and the financial highlights for each of the five years in the period then ended, in conformity with accounting principles generally accepted in the United States of America. These financial statements and financial highlights (hereafter referred to as “financial statements”) are the responsibility of the Fund’s management; our responsibility is to express an opinion on these financial statements based on our audits. We conducted our audits of these financial statements in accordance with the standards of the Public Company Accounting Oversight Board (United States). Those standards require that we plan and perform the audit to obtain reasonable assurance about whether the financial statements are free of material misstatement. An audit includes examining, on a test basis, evidence supporting the amounts and disclosures in the financial statements, assessing the accounting principles used and significant estimates made by management, and evaluating the overall financial statement presentation. We believe that our audits, which included confirmation of securities at January 31, 2012 by correspondence with the custodians and brokers provide a reasonable basis for our opinion.
PricewaterhouseCoopers LLP
Philadelphia, Pennsylvania
March 12, 2012
|
| Special 2011 tax information (unaudited) for Vanguard Dividend Growth Fund |
This information for the fiscal year ended January 31, 2012, is included pursuant to provisions of the Internal Revenue Code.
The fund distributed $135,265,000 of qualified dividend income to shareholders during the fiscal year.
For corporate shareholders, 100.0% of investment income (dividend income plus short-term gains, if any) qualifies for the dividends-received deduction.
21
Your Fund’s After-Tax Returns
This table presents returns for your fund both before and after taxes. The after-tax returns are shown in two ways: (1) assuming that an investor owned the fund during the entire period and paid taxes on the fund’s distributions, and (2) assuming that an investor paid taxes on the fund’s distributions and sold all shares at the end of each period.
Calculations are based on the highest individual federal income tax and capital gains tax rates in effect at the times of the distributions and the hypothetical sales. State and local taxes were not considered. After-tax returns reflect any qualified dividend income , using actual prior-year figures and estimates for 2012. (In the example, returns after the sale of fund shares may be higher than those assuming no sale. This occurs when the sale would have produced a capital loss. The calculation assumes that the investor received a tax deduction for the loss.)
Please note that your actual after-tax returns will depend on your tax situation and may differ from those shown. Also note that if you own the fund in a tax-deferred account, such as an individual retirement account or a 401(k) plan, this information does not apply to you. Such accounts are not subject to current taxes.
Finally, keep in mind that a fund’s performance—whether before or after taxes—does not guarantee future results.
Average Annual Total Returns: Dividend Growth Fund
Periods Ended January 31, 2012
| | | |
| | One | Five | Ten |
| | Year | Years | Years |
| Returns Before Taxes | 9.90% | 3.68% | 5.60% |
| Returns After Taxes on Distributions | 9.57 | 3.34 | 5.15 |
| Returns After Taxes on Distributions and Sale of Fund Shares | 6.86 | 3.11 | 4.73 |
22
About Your Fund’s Expenses
As a shareholder of the fund, you incur ongoing costs, which include costs for portfolio management, administrative services, and shareholder reports (like this one), among others. Operating expenses, which are deducted from a fund’s gross income, directly reduce the investment return of the fund.
A fund’s expenses are expressed as a percentage of its average net assets. This figure is known as the expense ratio. The following examples are intended to help you understand the ongoing costs (in dollars) of investing in your fund and to compare these costs with those of other mutual funds. The examples are based on an investment of $1,000 made at the beginning of the period shown and held for the entire period.
The accompanying table illustrates your fund’s costs in two ways:
• Based on actual fund return. This section helps you to estimate the actual expenses that you paid over the period. The ”Ending Account Value“ shown is derived from the fund‘s actual return, and the third column shows the dollar amount that would have been paid by an investor who started with $1,000 in the fund. You may use the information here, together with the amount you invested, to estimate the expenses that you paid over the period.
To do so, simply divide your account value by $1,000 (for example, an $8,600 account value divided by $1,000 = 8.6), then multiply the result by the number given for your fund under the heading ”Expenses Paid During Period.“
• Based on hypothetical 5% yearly return. This section is intended to help you compare your fund‘s costs with those of other mutual funds. It assumes that the fund had a yearly return of 5% before expenses, but that the expense ratio is unchanged. In this case—because the return used is not the fund’s actual return—the results do not apply to your investment. The example is useful in making comparisons because the Securities and Exchange Commission requires all mutual funds to calculate expenses based on a 5% return. You can assess your fund’s costs by comparing this hypothetical example with the hypothetical examples that appear in shareholder reports of other funds.
Note that the expenses shown in the table are meant to highlight and help you compare ongoing costs only and do not reflect transaction costs incurred by the fund for buying and selling securities. Further, the expenses do not include any purchase, redemption, or account service fees described in the fund prospectus. If such fees were applied to your account, your costs would be higher. Your fund does not carry a “sales load.”
The calculations assume no shares were bought or sold during the period. Your actual costs may have been higher or lower, depending on the amount of your investment and the timing of any purchases or redemptions.
You can find more information about the fund’s expenses, including annual expense ratios, in the Financial Statements section of this report. For additional information on operating expenses and other shareholder costs, please refer to your fund’s current prospectus.
23
| | | |
| Six Months Ended January 31, 2012 | | | |
| | Beginning | Ending | Expenses |
| | Account Value | Account Value | Paid During |
| Dividend Growth Fund | 7/31/2011 | 1/31/2012 | Period |
| Based on Actual Fund Return | $1,000.00 | $1,069.74 | $1.46 |
| Based on Hypothetical 5% Yearly Return | 1,000.00 | 1,023.79 | 1.43 |
The calculations are based on expenses incurred in the most recent six-month period. The fund’s annualized six-month expense ratio for that period is 0.28%. The dollar amounts shown as “Expenses Paid” are equal to the annualized expense ratio multiplied by the average account value over the period, multiplied by the number of days in the most recent six-month period, then divided by the number of days in the most recent 12-month period.
24
Trustees Approve Advisory Agreement
The board of trustees of Vanguard Dividend Growth Fund has renewed the fund’s investment advisory agreement with Wellington Management Company, LLP. The board determined that the retention of the advisor was in the best interests of the fund and its shareholders.
The board based its decision upon an evaluation of the advisor’s investment staff, portfolio management process, and performance. The trustees considered the factors discussed below, among others. However, no single factor determined whether the board approved the agreement. Rather, it was the totality of the circumstances that drove the board’s decision.
Nature, extent, and quality of services
The board considered the quality of the fund’s investment management over both the short and long term, and took into account the organizational depth and stability of the advisor. The board noted that Wellington Management, founded in 1928, is among the nation’s oldest and most respected institutional managers. The portfolio manager is backed by a well-tenured team of research analysts who conduct detailed fundamental analysis of their respective industries and companies. Wellington Management has provided high-quality advisory services to the fund. The firm has advised the fund since its inception in 1992.
The board concluded that Wellington Management’s experience, stability, depth, and performance, among other factors, warranted continuation of the advisory agreement.
Investment performance
The board considered the short- and long-term performance of the fund, including any periods of outperformance or underperformance of a relevant benchmark and peer group. The board noted that since the fund’s reconstituted dividend growth mandate, which began in 2002, short- and long-term performance has been strong relative to the Dividend Growth Spliced Index over the one-, five- and ten-year periods, but has lagged for the three-year period. Information about the fund’s most recent performance can be found in the Performance Summary section of this report.
Cost
The board concluded that the fund’s expense ratio was well below the average expense ratio charged by funds in its peer group and that the fund’s advisory fee rate was also well below its peer-group average. Information about the fund’s expense ratio appears in the About Your Fund’s Expenses section of this report as well as in the Financial Statements section, which also includes information about the advisory fee rate.
The board did not consider profitability of Wellington Management in determining whether to approve the advisory fee, because Wellington Management is independent of Vanguard, and the advisory fee is the result of arm’s-length negotiations.
The benefit of economies of scale
The board concluded that the fund’s shareholders benefit from economies of scale because of breakpoints in the fund’s advisory fee schedule. The breakpoints reduce the effective rate of the fee as the fund’s assets increase.
The board will consider whether to renew the advisory agreement again after a one-year period.
25
Glossary
30-Day SEC Yield. A fund’s 30-day SEC yield is derived using a formula specified by the U.S. Securities and Exchange Commission. Under the formula, data related to the fund’s security holdings in the previous 30 days are used to calculate the fund’s hypothetical net income for that period, which is then annualized and divided by the fund’s estimated average net assets over the calculation period. For the purposes of this calculation, a security’s income is based on its current market yield to maturity (for bonds), its actual income (for asset-backed securities), or its projected dividend yield (for stocks). Because the SEC yield represents hypothetical annualized income, it will differ—at times significantly—from the fund’s actual experience. As a result, the fund’s income distributions may be higher or lower than implied by the SEC yield.
Beta. A measure of the magnitude of a fund’s past share-price fluctuations in relation to the ups and downs of a given market index. The index is assigned a beta of 1.00. Compared with a given index, a fund with a beta of 1.20 typically would have seen its share price rise or fall by 12% when the index rose or fell by 10%. For this report, beta is based on returns over the past 36 months for both the fund and the index. Note that a fund’s beta should be reviewed in conjunction with its R-squared (see definition). The lower the R-squared, the less correlation there is between the fund and the index, and the less reliable beta is as an indicator of volatility.
Dividend Yield. Dividend income earned by stocks, expressed as a percentage of the aggregate market value (or of net asset value, for a fund). The yield is determined by dividing the amount of the annual dividends by the aggregate value (or net asset value) at the end of the period. For a fund, the dividend yield is based solely on stock holdings and does not include any income produced by other investments.
Earnings Growth Rate. The average annual rate of growth in earnings over the past five years for the stocks now in a fund.
Equity Exposure. A measure that reflects a fund’s investments in stocks and stock futures. Any holdings in short-term reserves are excluded.
Expense Ratio. A fund’s total annual operating expenses expressed as a percentage of the fund’s average net assets. The expense ratio includes management and administrative expenses, but does not include the transaction costs of buying and selling portfolio securities.
Foreign Holdings. The percentage of a fund represented by securities or depositary receipts of companies based outside the United States.
Inception Date. The date on which the assets of a fund (or one of its share classes) are first invested in accordance with the fund’s investment objective. For funds with a subscription period, the inception date is the day after that period ends. Investment performance is measured from the inception date.
Median Market Cap. An indicator of the size of companies in which a fund invests; the midpoint of market capitalization (market price x shares outstanding) of a fund’s stocks, weighted by the proportion of the fund’s assets invested in each stock. Stocks representing half of the fund’s assets have market capitalizations above the median, and the rest are below it.
Price/Book Ratio. The share price of a stock divided by its net worth, or book value, per share. For a fund, the weighted average price/book ratio of the stocks it holds.
26
Price/Earnings Ratio. The ratio of a stock’s current price to its per-share earnings over the past year. For a fund, the weighted average P/E of the stocks it holds. P/E is an indicator of market expectations about corporate prospects; the higher the P/E, the greater the expectations for a company’s future growth.
R-Squared. A measure of how much of a fund’s past returns can be explained by the returns from the market in general, as measured by a given index. If a fund’s total returns were precisely synchronized with an index’s returns, its R-squared would be 1.00. If the fund’s returns bore no relationship to the index’s returns, its R-squared would be 0. For this report, R-squared is based on returns over the past 36 months for both the fund and the index.
Return on Equity. The annual average rate of return generated by a company during the past five years for each dollar of shareholder’s equity (net income divided by shareholder’s equity). For a fund, the weighted average return on equity for the companies whose stocks it holds.
Short-Term Reserves. The percentage of a fund invested in highly liquid, short-term securities that can be readily converted to cash.
Turnover Rate. An indication of the fund’s trading activity. Funds with high turnover rates incur higher transaction costs and may be more likely to distribute capital gains (which may be taxable to investors). The turnover rate excludes in-kind transactions, which have minimal impact on costs.
27
The People Who Govern Your Fund
The trustees of your mutual fund are there to see that the fund is operated and managed in your best interests since, as a shareholder, you are a part owner of the fund. Your fund’s trustees also serve on the board of directors of The Vanguard Group, Inc., which is owned by the Vanguard funds and provides services to them on an at-cost basis.
A majority of Vanguard’s board members are independent, meaning that they have no affiliation with Vanguard or the funds they oversee, apart from the sizable personal investments they have made as private individuals. The independent board members have distinguished backgrounds in business, academia, and public service. Each of the trustees and executive officers oversees 181 Vanguard funds.
The following table provides information for each trustee and executive officer of the fund. More information about the trustees is in the Statement of Additional Information, which can be obtained, without charge, by contacting Vanguard at 800-662-7447, or online at vanguard.com.
| |
| Interested Trustee1 | (chemicals); Director of Tyco International, Ltd. |
| | (diversified manufacturing and services) and Hewlett- |
| F. William McNabb III | Packard Co. (electronic computer manufacturing); |
| Born 1957. Trustee Since July 2009. Chairman of the | Senior Advisor at New Mountain Capital; Trustee |
| Board. Principal Occupation(s) During the Past Five | of The Conference Board; Member of the Board of |
| Years: Chairman of the Board of The Vanguard Group, | Managers of Delphi Automotive LLP (automotive |
| Inc., and of each of the investment companies served | components). |
| by The Vanguard Group, since January 2010; Director | |
| of The Vanguard Group since 2008; Chief Executive | Amy Gutmann |
| Officer and President of The Vanguard Group and of | Born 1949. Trustee Since June 2006. Principal |
| each of the investment companies served by The | Occupation(s) During the Past Five Years: President |
| Vanguard Group since 2008; Director of Vanguard | of the University of Pennsylvania; Christopher H. |
| Marketing Corporation; Managing Director of The | Browne Distinguished Professor of Political Science |
| Vanguard Group (1995–2008). | in the School of Arts and Sciences with secondary |
| | appointments at the Annenberg School for Commu- |
| | nication and the Graduate School of Education |
| Independent Trustees | of the University of Pennsylvania; Director of |
| | Carnegie Corporation of New York, Schuylkill River |
| Emerson U. Fullwood | Development Corporation, and Greater Philadelphia |
| Born 1948. Trustee Since January 2008. Principal | Chamber of Commerce; Trustee of the National |
| Occupation(s) During the Past Five Years: Executive | Constitution Center; Chair of the Presidential |
| Chief Staff and Marketing Officer for North America | Commission for the Study of Bioethical Issues. |
| and Corporate Vice President (retired 2008) of Xerox | |
| Corporation (document management products and | JoAnn Heffernan Heisen |
| services); Executive in Residence and 2010 | Born 1950. Trustee Since July 1998. Principal |
| Distinguished Minett Professor at the Rochester | Occupation(s) During the Past Five Years: Corporate |
| Institute of Technology; Director of SPX Corporation | Vice President and Chief Global Diversity Officer |
| (multi-industry manufacturing), the United Way of | (retired 2008) and Member of the Executive |
| Rochester, Amerigroup Corporation (managed health | Committee (1997–2008) of Johnson & Johnson |
| care), the University of Rochester Medical Center, | (pharmaceuticals/consumer products); Director of |
| Monroe Community College Foundation, and North | Skytop Lodge Corporation (hotels), the University |
| Carolina A&T University. | Medical Center at Princeton, the Robert Wood |
| | Johnson Foundation, and the Center for Work Life |
| Rajiv L. Gupta | Policy; Member of the Advisory Board of the |
| Born 1945. Trustee Since December 2001.2 | Maxwell School of Citizenship and Public Affairs |
| Principal Occupation(s) During the Past Five Years: | at Syracuse University. |
| Chairman and Chief Executive Officer (retired 2009) | |
| and President (2006–2008) of Rohm and Haas Co. | |
| | |
| F. Joseph Loughrey | the investment companies served by The Vanguard |
| Born 1949. Trustee Since October 2009. Principal | Group since 2010; Assistant Controller of each of |
| Occupation(s) During the Past Five Years: President | the investment companies served by The Vanguard |
| and Chief Operating Officer (retired 2009) and Vice | Group (2001–2010). | |
| Chairman of the Board (2008–2009) of Cummins Inc. | | |
| (industrial machinery); Director of SKF AB (industrial | Thomas J. Higgins | |
| machinery), Hillenbrand, Inc. (specialized consumer | Born 1957. Chief Financial Officer Since September |
| services), the Lumina Foundation for Education, and | 2008. Principal Occupation(s) During the Past Five |
| Oxfam America; Chairman of the Advisory Council | Years: Principal of The Vanguard Group, Inc.; Chief |
| for the College of Arts and Letters and Member | Financial Officer of each of the investment companies |
| of the Advisory Board to the Kellogg Institute for | served by The Vanguard Group since 2008; Treasurer |
| International Studies at the University of Notre Dame. | of each of the investment companies served by The |
| | Vanguard Group (1998–2008). |
| André F. Perold | | |
| Born 1952. Trustee Since December 2004. Principal | Kathryn J. Hyatt | |
| Occupation(s) During the Past Five Years: George | Born 1955. Treasurer Since November 2008. Principal |
| Gund Professor of Finance and Banking at the Harvard | Occupation(s) During the Past Five Years: Principal |
| Business School (retired July 2011); Chief Investment | of The Vanguard Group, Inc.; Treasurer of each of |
| Officer and Managing Partner of HighVista Strategies | the investment companies served by The Vanguard |
| LLC (private investment firm); Director of Rand | Group since 2008; Assistant Treasurer of each of the |
| Merchant Bank; Overseer of the Museum of Fine | investment companies served by The Vanguard Group |
| Arts Boston. | (1988–2008). | |
| |
| Alfred M. Rankin, Jr. | Heidi Stam | |
| Born 1941. Trustee Since January 1993. Principal | Born 1956. Secretary Since July 2005. Principal |
| Occupation(s) During the Past Five Years: Chairman, | Occupation(s) During the Past Five Years: Managing |
| President, and Chief Executive Officer of NACCO | Director of The Vanguard Group, Inc., since 2006; |
| Industries, Inc. (forklift trucks/housewares/lignite); | General Counsel of The Vanguard Group since 2005; |
| Director of Goodrich Corporation (industrial products/ | Secretary of The Vanguard Group and of each of the |
| aircraft systems and services) and the National | investment companies served by The Vanguard Group |
| Association of Manufacturers; Chairman of the Federal | since 2005; Director and Senior Vice President of |
| Reserve Bank of Cleveland and of University Hospitals | Vanguard Marketing Corporation since 2005; |
| of Cleveland; Advisory Chairman of the Board of The | Principal of The Vanguard Group (1997–2006). |
| Cleveland Museum of Art. | | |
| |
| Peter F. Volanakis | Vanguard Senior Management Team |
| Born 1955. Trustee Since July 2009. Principal | Mortimer J. Buckley | Michael S. Miller |
| Occupation(s) During the Past Five Years: President | Kathleen C. Gubanich | James M. Norris |
| and Chief Operating Officer (retired 2010) of Corning | Paul A. Heller | Glenn W. Reed |
| Corning Incorporated (2000-2010) and Dow Corning | Martha G. King | George U. Sauter |
| (2001-2010); Director of SPX Corporation (multi- | Chris D. McIsaac | |
| industry manufacturing), the Corning Foundation, and | | |
| the Corning Museum of Glass; Overseer of the Amos | Chairman Emeritus and Senior Advisor |
| Tuck School of Business Administration at Dartmouth | | |
| College; Advisor to the Norris Cotton Cancer Center. | John J. Brennan | |
| | Chairman, 1996–2009 | |
| | Chief Executive Officer and President, 1996–2008 |
| Executive Officers | | |
| |
| Glenn Booraem | Founder | |
| Born 1967. Controller Since July 2010. Principal | | |
| Occupation(s) During the Past Five Years: Principal | John C. Bogle | |
| of The Vanguard Group, Inc.; Controller of each of | Chairman and Chief Executive Officer, 1974–1996 |
1 Mr. McNabb is considered an “interested person,” as defined in the Investment Company Act of 1940, because he is an officer of the Vanguard funds.
2 December 2002 for Vanguard Equity Income Fund, Vanguard Growth Equity Fund, the Vanguard Municipal Bond Funds, and the Vanguard State Tax-Exempt Funds.
|  |
| P.O. Box 2600 |
| Valley Forge, PA 19482-2600 |
Connect with Vanguard® > vanguard.com
| |
| Fund Information > 800-662-7447 | |
| Direct Investor Account Services > 800-662-2739 | |
| Institutional Investor Services > 800-523-1036 | |
| Text Telephone for People | |
| With Hearing Impairment > 800-749-7273 | |
| |
| This material may be used in conjunction | |
| with the offering of shares of any Vanguard | |
| fund only if preceded or accompanied by | |
| the fund’s current prospectus. | |
| |
| All comparative mutual fund data are from Lipper Inc. or | |
| Morningstar, Inc., unless otherwise noted. | |
| |
| You can obtain a free copy of Vanguard’s proxy voting | |
| guidelines by visiting vanguard.com/proxyreporting or by | |
| calling Vanguard at 800-662-2739. The guidelines are | |
| also available from the SEC’s website, sec.gov. In | |
| addition, you may obtain a free report on how your fund | |
| voted the proxies for securities it owned during the 12 | |
| months ended June 30. To get the report, visit either | |
| vanguard.com/proxyreporting or sec.gov. | |
| |
| You can review and copy information about your fund at | |
| the SEC’s Public Reference Room in Washington, D.C. To | |
| find out more about this public service, call the SEC at | |
| 202-551-8090. Information about your fund is also | |
| available on the SEC’s website, and you can receive | |
| copies of this information, for a fee, by sending a | |
| request in either of two ways: via e-mail addressed to | |
| publicinfo@sec.gov or via regular mail addressed to the | |
| Public Reference Section, Securities and Exchange | |
| Commission, Washington, DC 20549-1520. | |
| |
| |
| | © 2012 The Vanguard Group, Inc. |
| | All rights reserved. |
| | Vanguard Marketing Corporation, Distributor. |
| |
| | Q570 032012 |

Annual Report | January 31, 2012
Vanguard Dividend Appreciation
Index Fund
> For the fiscal year ended January 31, 2012, Vanguard Dividend Appreciation Index Fund returned more than 7%.
> The fund closely tracked the return of its benchmark, the Dividend Achievers Select Index, and was well ahead of the average return of large-capitalization core funds.
> Seven of the index’s ten market sectors advanced, with strong pockets of performance within consumer discretionary, information technology, and materials.
| |
| Contents | |
| Your Fund’s Total Returns. | 1 |
| Chairman’s Letter. | 2 |
| Fund Profile. | 8 |
| Performance Summary. | 9 |
| Financial Statements. | 11 |
| Your Fund’s After-Tax Returns. | 22 |
| About Your Fund’s Expenses. | 23 |
| Glossary. | 25 |
Please note: The opinions expressed in this report are just that—informed opinions. They should not be considered promises or advice. Also, please keep in mind that the information and opinions cover the period through the date on the front of this report. Of course, the risks of investing in your fund are spelled out in the prospectus.
See the Glossary for definitions of investment terms used in this report.
About the cover: Vanguard was named for the HMS Vanguard, flagship of British Admiral Horatio Nelson. A ship—whose performance and safety depend on the work of all hands—has served as a fitting metaphor for the Vanguard crew as we strive to help clients reach their financial goals.
Your Fund’s Total Returns
| |
| Fiscal Year Ended January 31, 2012 | |
| |
| | Total |
| | Returns |
| Vanguard Dividend Appreciation Index Fund | |
| Investor Shares | 7.34% |
| ETF Shares | |
| Market Price | 7.46 |
| Net Asset Value | 7.46 |
| Dividend Achievers Select Index | 7.57 |
| Large-Cap Core Funds Average | 1.95 |
| Large-Cap Core Funds Average: Derived from data provided by Lipper Inc. |
The Vanguard ETF® Shares shown are traded on the NYSE Arca exchange and are available only through brokers. The table provides ETF returns based on both the NYSE Arca market price and the net asset value for a share. U.S. Pat. No. 6,879,964 B2; 7,337,138; 7,720,749; 7,925,573; 8,090,646.
For the ETF Shares, the market price is determined by the midpoint of the bid-offer spread as of the closing time of the New York Stock Exchange (generally 4 p.m., Eastern time). The net asset value is also determined as of the NYSE closing time. For more information about how the ETF Shares' market prices have compared with their net asset value, visit vanguard.com, select your ETF, and then select the Price and Performance tab. The ETF premium/discount analysis there shows the percentages of days on which the ETF Shares' market price was above or below the NAV.
Your Fund’s Performance at a Glance
January 31, 2011 , Through January 31, 2012
| | | | |
| | | | Distributions Per Share |
| | Starting | Ending | Income | Capital |
| | Share Price | Share Price | Dividends | Gains |
| Vanguard Dividend Appreciation Index Fund | | | | |
| Investor Shares | $21.33 | $22.42 | $0.444 | $0.000 |
| ETF Shares | 53.32 | 56.04 | 1.172 | 0.000 |
1

Chairman’s Letter
Dear Shareholder,
Vanguard Dividend Appreciation Index Fund returned more than 7% for the 12 months ended January 31, 2012. The fund’s performance was in line with that of its benchmark, the Dividend Achievers Select Index, and more than 5 percentage points ahead of the average return of large-capitalization core funds.
During the period, the holdings in the fund’s portfolio—large, profitable companies with track records of increasing dividends over time—prospered. They found favor with investors wishing to steer clear of more volatile equities, as well as those willing to assume greater risk in pursuit of greater yields than those offered by money market instruments and low-yielding bonds.
As cash-rich companies increased their dividend payouts, the 30-day SEC yield for the fund’s Investor Shares rose from 2.02% at the beginning of the fiscal year to 2.15% at the end, even as share prices rose.
If you hold shares of the fund in a taxable account, you may wish to review the information about its after-tax returns later in this report.
Volatility was a constant
in fast-changing markets
For the 12 months ended January 31, the broad U.S. stock market returned 3.55%. This modest result reflected rallies and reversals driven by drama on the global stage, including Europe’s debt crisis and
2
rating agency Standard & Poor’s decision to downgrade the U.S. credit rating. (Vanguard’s confidence in the full faith and credit of the U.S. Treasury remains unshaken.)
The recent volatility is consistent with the pattern of the past five years, as suggested by the figures in the Market Barometer. The dramatic differences in average annual returns over the one-, three-, and five-year periods are a consequence of the stock market’s heady spikes and precipitous declines.
Although the outcome is different, this turbulence is also apparent in the returns of international stock markets. In the past 12 months, non-U.S. stock markets delivered negative results. Weakness was widespread, with the worst returns in Europe and Japan.
Modest yields and high returns
in the bond market
Bonds ended the fiscal year with surprisingly strong returns. At the start of the period, the 10-year Treasury note’s slender yield of 3.38% seemed like a good reason to temper expectations. As stock market volatility spiked and investors put a premium on safety, however, yields moved lower still. The 10-year T-note finished the period at 1.80%. The Barclays Capital U.S. Aggregate Bond Index, a broad taxable bond market benchmark, returned 8.66%.
| | | |
| Market Barometer | | | |
| |
| | | Average Annual Total Returns |
| | | Periods Ended January 31, 2012 |
| | One | Three | Five |
| | Year | Years | Years |
| Stocks | | | |
| Russell 1000 Index (Large-caps) | 3.95% | 20.01% | 0.55% |
| Russell 2000 Index (Small-caps) | 2.86 | 23.03 | 1.19 |
| Dow Jones U.S. Total Stock Market Index | 3.55 | 20.54 | 0.88 |
| MSCI All Country World Index ex USA (International) | -8.75 | 16.70 | -1.71 |
| |
| Bonds | | | |
| Barclays Capital U.S. Aggregate Bond Index (Broad | | | |
| taxable market) | 8.66% | 7.40% | 6.70% |
| Barclays Capital Municipal Bond Index (Broad | | | |
| tax-exempt market) | 14.10 | 8.10 | 5.76 |
| Citigroup Three-Month U.S. Treasury Bill Index | 0.07 | 0.10 | 1.27 |
| |
| CPI | | | |
| Consumer Price Index | 2.93% | 2.39% | 2.29% |
3
Municipal bonds did even better, as prices snapped back from a fear-driven plunge in the months preceding the new fiscal year. Although last year’s low expectations for bonds proved misguided, it’s worth remembering that low yields do imply lower future returns: As yields tumble, the scope for further declines—and increases in prices—diminishes.
Savings instruments such as the 3-month Treasury bill returned a little more than 0%, consistent with the Federal Reserve’s target for the shortest-term interest rates.
Dividend-focused stocks were
the market’s sweet spot
Investor appetite for dividend-focused stocks surged during the 12-month period: High-stakes budgetary showdowns in Europe and the United States roiled the markets while money market instruments and U.S. Treasury bonds provided dismally low yields. Dividend-focused stocks tend to exhibit lower volatility than the overall market, and many of them have plenty of cash on their balance sheets to pay out to shareholders. Equity investors took note, as the fund’s benchmark index which includes companies that have consistently grown their dividend payouts returned 7.57%, more than double the return of the broad stock market. The run-up was also driven in part by income-seeking investors, who began turning to these stocks as an alternative to low-yielding fixed-income investments—albeit one with a much higher risk of price fluctuations.
Expense Ratios
Your Fund Compared With Its Peer Group
| | | |
| | Investor | ETF | Peer Group |
| | Shares | Shares | Average |
| Dividend Appreciation Index Fund | 0.30% | 0.18% | 1.19% |
The fund expense ratios shown are from the prospectus dated May 26, 2011, and represent estimated costs for the current fiscal year. For the fiscal year ended January 31, 2012, the fund’s expense ratios were 0.25% for Investor Shares and 0.13% for ETF Shares. The peer-group expense ratio is derived from data provided by Lipper Inc. and captures information through year-end 2011.
Peer group: Large-Cap Core Funds.
4
Three of the index’s ten sectors generated the lion’s share of results. Consumer discretionary stocks returned 26% after an upturn in consumer spending on the back of lower energy costs, a slight improvement in the labor market, and a good holiday season for retailers. A handful of apparel, restaurant, and leisure goods companies saw their stock prices climb by as much as 69% as a result of higher earnings, increased dividend payouts, or both.
Information technology traditionally hasn’t been a dividend-rich sector. Although tech stocks still account for a small share of the index, some of the industry’s larger companies have matured, and their strong cash flow has enabled them to pay out impressive dividends. Returns varied greatly: While some equipment and software stocks posted double-digit declines, a strong showing from IT services pushed the sector’s return to more than 17%.
Although the broad materials sector saw significant declines in mining, steel, and aluminum stocks, the corresponding sector in the benchmark index is largely composed of chemical company stocks, many of which posted double-digit returns. This component of the index gained almost 13% over the 12-month period.
The only significant detractor was telecommunication services, which has the smallest weighting in the index. Holdings in wireless services dragged the sector’s return down to around –12%.
Total Returns
Inception Through January 31, 2012
| |
| | Average |
| | Annual Return |
| Dividend Appreciation Index Fund Investor Shares (Returns since inception: 4/27/2006) | 3.90% |
| Dividend Achievers Select Index | 4.19 |
| Large-Cap Core Funds Average | 1.00 |
| Large-Cap Core Funds Average: Derived from data provided by Lipper Inc. |
The figures shown represent past performance, which is not a guarantee of future results. (Current performance may be lower or higher than the performance data cited. For performance data current to the most recent month-end, visit our website at vanguard.com/performance.) Note, too, that both investment returns and principal value can fluctuate widely, so an investor’s shares, when sold, could be worth more or less than their original cost.
5
A strong showing
since inception
The U.S. stock market has weathered a lot of ups and downs since the fund was launched in April 2006, posting an average annual return of 2.60%. The Dividend Achievers Select Index, with its defensive holdings in well-established companies that have grown their dividend payouts, fared better, returning an annualized 4.19%. The fund closely tracked its expense-free benchmark, with an average annual return of 3.90% for Investor Shares. Its large-cap core fund peers posted an average annual return of 1.00% for the same period.
Hold your course
in good markets and in bad
While the financial markets will inevitably continue to swell and dip, we believe investors are well-served by maintaining
|
| Investment insight |
|
| Historically low bond yields have prompted some pundits in the financial press to |
| suggest switching from bonds into higher-yielding stocks. Dividend-oriented stocks |
| can play a valuable role in a portfolio, but they are not bond substitutes. |
| |
| The chart below shows that since 2007, the quarterly returns of high-yield stocks |
| have been much more volatile than those of bonds. If your appetite for risk has not |
| increased, your exposure to stocks, even those that have been raising their dividends, |
| probably shouldn’t, either. |
| |
| Dividend-oriented stock returns and bond returns by quarter, 2007 through 2011 |
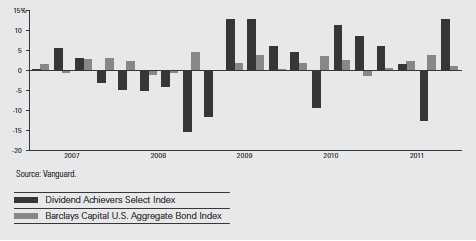
6
a diversified, balanced portfolio. This plan offers the potential for wealth accumulation through exposure to stocks and also a cushion from the market’s occasional—and inevitable—reversals through exposure to bonds.
Vanguard Dividend Appreciation Index Fund can play an important part in the stock component of such a portfolio because it invests in large, high-quality companies with solid track records of increasing their earnings payout. And, as with all Vanguard funds, its low expenses can help put more of the fund’s return in your pocket.
Thank you for entrusting your assets to Vanguard.
Sincerely,

F. William McNabb III
Chairman and Chief Executive Officer
February 13, 2012
7
Dividend Appreciation Index Fund
Fund Profile
As of January 31, 2012
| | | |
| Share-Class Characteristics | | |
| |
| | Investor | | ETF |
| | Shares | | Shares |
| Ticker Symbol | VDAIX | | VIG |
| Expense Ratio1 | 0.30% | | 0.18% |
| 30-Day SEC Yield | 2.15% | | 2.26% |
| |
| Portfolio Characteristics | | |
| | Dividend | DJ |
| | Achievers | U.S. Total |
| | | Select | Market |
| | Fund | Index | Index |
| Number of Stocks | 144 | 126 | 3,738 |
| Median Market Cap $41.3B | $44.4B | $32.6B |
| Price/Earnings Ratio | 15.1x | 14.2x | 15.5x |
| Price/Book Ratio | 3.0x | 2.9x | 2.2x |
| Return on Equity | 24.7% | 24.6% | 19.1% |
| Earnings Growth Rate | 7.0% | 5.5% | 7.1% |
| Dividend Yield | 2.3% | 2.4% | 2.0% |
| Foreign Holdings | 0.0% | 0.0% | 0.0% |
| Turnover Rate | 14% | — | — |
| Short-Term Reserves | -0.1% | — | — |
| |
| Sector Diversification (% of equity exposure) |
| | Dividend | DJ |
| | Achievers | U.S. Total |
| | | Select | Market |
| | Fund | Index | Index |
| Consumer | | | |
| Discretionary | 14.5% | 13.1% | 11.7% |
| Consumer Staples | 23.5 | 23.6 | 9.5 |
| Energy | 10.4 | 14.8 | 11.0 |
| Financials | 6.3 | 6.3 | 15.4 |
| Health Care | 5.6 | 5.6 | 11.7 |
| Industrials | 23.0 | 21.5 | 11.3 |
| Information | | | |
| Technology | 6.5 | 6.9 | 19.0 |
| Materials | 8.6 | 6.5 | 4.3 |
| Telecommunication | | | |
| Services | 0.1 | 0.1 | 2.5 |
| Utilities | 1.5 | 1.6 | 3.6 |
| | |
| Volatility Measures | | |
| | Dividend | DJ |
| | Achievers | U.S. Total |
| | Select | Market |
| | Index | Index |
| R-Squared | 1.00 | 0.95 |
| Beta | 1.00 | 0.81 |
| These measures show the degree and timing of the fund’s fluctuations compared with the indexes over 36 months. |
|
| |
| Ten Largest Holdings (% of total net assets) |
| International Business | IT Consulting & | |
| Machines Corp. | Other Services | 4.1% |
| Wal-Mart Stores Inc. | Hypermarkets & | |
| | Super Centers | 4.0 |
| PepsiCo Inc. | Soft Drinks | 4.0 |
| Coca-Cola Co. | Soft Drinks | 4.0 |
| McDonald's Corp. | Restaurants | 3.9 |
| Procter & Gamble Co. | Household | |
| | Products | 3.9 |
| Chevron Corp. | Integrated Oil & | |
| | Gas | 3.9 |
| Exxon Mobil Corp. | Integrated Oil & | |
| | Gas | 3.8 |
| United Technologies | Aerospace & | |
| Corp. | Defense | 3.7 |
| Caterpillar Inc. | Construction & | |
| | Farm Machinery & |
| | Heavy Trucks | 3.3 |
| Top Ten | | 38.6% |
| The holdings listed exclude any temporary cash investments and equity index products. |
| | |
Investment Focus
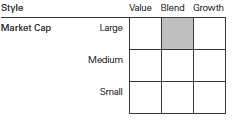
1 The expense ratios shown are from the prospectus dated May 26, 2011, and represent estimated costs for the current fiscal year. For the fiscal year ended January 31, 2012, the expense ratios were 0.25% for Investor Shares and 0.13% for ETF Shares.
8
Dividend Appreciation Index Fund
Performance Summary
All of the returns in this report represent past performance, which is not a guarantee of future results that may be achieved by the fund. (Current performance may be lower or higher than the performance data cited. For performance data current to the most recent month-end, visit our website at vanguard.com/performance.) Note, too, that both investment returns and principal value can fluctuate widely, so an investor’s shares, when sold, could be worth more or less than their original cost. The returns shown do not reflect taxes that a shareholder would pay on fund distributions or on the sale of fund shares.
Cumulative Performance: April 27, 2006, Through January 31, 2012
Initial Investment of $10,000
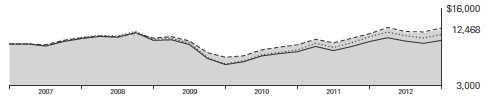
| | | | |
| | | Average Annual Total Returns | |
| | | Periods Ended January 31, 2012 | |
| | | | Since | Final Value |
| | One | Five | Inception | of a $10,000 |
| | Year | Years | (4/27/2006) | Investment |
| Dividend Appreciation Index Fund | | | | |
| Investor Shares | 7.34% | 2.53% | 3.90% | $12,468 |
| Dow Jones U.S. Total Stock Market | | | | |
| Index | 3.55 | 0.88 | 2.60 | 11,593 |
| |
| Dividend Achievers Select Index | 7.57 | 2.81 | 4.19 | 12,671 |
| Large-Cap Core Funds Average | 1.95 | -0.55 | 1.00 | 10,593 |
Large-Cap Core Funds Average: Derived from data provided by Lipper Inc.
"Since Inception" performance is calculated from the Investor Shares’ inception date for both the fund and its comparative standards.
| | | | |
| | | | Since | Final Value |
| | One | Five | Inception | of a $10,000 |
| | Year | Years | (4/21/2006) | Investment |
| Dividend Appreciation Index Fund | | | | |
| ETF Shares Net Asset Value | 7.46% | 2.65% | 4.06% | $12,588 |
| Dow Jones U.S. Total Stock Market Index | 3.55 | 0.88 | 2.54 | 11,561 |
| Dividend Achievers Select Index | 7.57 | 2.81 | 4.23 | 12,707 |
| "Since Inception" performance is calculated from the ETF Shares’ inception date for both the fund and its comparative standards. |
See Financial Highlights for dividend and capital gains information.
9
Dividend Appreciation Index Fund
| | | |
| Cumulative Returns of ETF Shares:April 27, 2006 , Through January 31, 2012 | | |
| | | | Since |
| | One | Five | Inception |
| | Year | Years | (4/21/2006) |
| Dividend Appreciation Index Fund | | | |
| ETF Shares Market Price | 7.46% | 13.89% | 25.99% |
| Dividend Appreciation Index Fund | | | |
| ETF Shares Net Asset Value | 7.46 | 13.97 | 25.88 |
| Dividend Achievers Select Index | 7.57 | 14.86 | 27.07 |
| "Since Inception" performance is calculated from the ETF Shares’ inception date for both the fund and its comparative standards. |
Fiscal-Year Total Returns (%): April 27, 2006, Through January 31, 2012
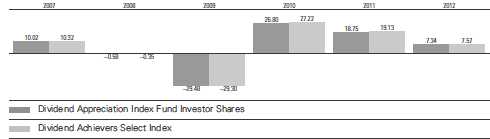
Average Annual Total Returns: Periods Ended December 31, 2011
This table presents returns through the latest calendar quarter—rather than through the end of the fiscal period.
Securities and Exchange Commission rules require that we provide this information.
| | | | |
| | Inception | One | Five | Since |
| | Date | Year | Years | Inception |
| Investor Shares | 4/27/2006 | 6.05% | 2.33% | 3.50% |
| ETF Shares | 4/21/2006 | | | |
| Market Price | | 6.19 | 2.43 | 3.67 |
| Net Asset Value | | 6.21 | 2.45 | 3.66 |
10
Dividend Appreciation Index Fund
Financial Statements
Statement of Net Assets
As of January 31, 2012
The fund reports a complete list of its holdings in regulatory filings four times in each fiscal year, at the quarter-ends. For the second and fourth fiscal quarters, the lists appear in the fund’s semiannual and annual reports to shareholders. For the first and third fiscal quarters, the fund files the lists with the Securities and Exchange Commission on Form N-Q. Shareholders can look up the fund’s Forms N-Q on the SEC’s website at sec.gov. Forms N-Q may also be reviewed and copied at the SEC’s Public Reference Room (see the back cover of this report for further information).
| | |
| | | Market |
| | | Value |
| | Shares | ($000) |
| Common Stocks (100.0%) | | |
| Consumer Discretionary (14.5%) | |
| McDonald’s Corp. | 4,732,791 | 468,783 |
| NIKE Inc. Class B | 2,323,117 | 241,581 |
| Target Corp. | 4,517,184 | 229,518 |
| Lowe’s Cos. Inc. | 7,952,615 | 213,369 |
| TJX Cos. Inc. | 2,407,496 | 164,047 |
| VF Corp. | 697,408 | 91,702 |
| McGraw-Hill Cos. Inc. | 1,874,205 | 86,213 |
| Ross Stores Inc. | 1,384,298 | 70,350 |
| Genuine Parts Co. | 976,098 | 62,256 |
| Family Dollar Stores Inc. | 802,284 | 44,767 |
| Polaris Industries Inc. | 414,931 | 26,722 |
| John Wiley & Sons Inc. | | |
| Class A | 321,761 | 14,605 |
| Matthews International | | |
| Corp. Class A | 184,273 | 6,074 |
| Meredith Corp. | 1,221 | 38 |
| | | 1,720,025 |
| Consumer Staples (23.5%) | | |
| Wal-Mart Stores Inc. | 7,832,377 | 480,595 |
| PepsiCo Inc. | 7,215,752 | 473,858 |
| Coca-Cola Co. | 6,962,656 | 470,188 |
| Procter & Gamble Co. | 7,338,017 | 462,589 |
| Colgate-Palmolive Co. | 3,331,198 | 302,206 |
| Walgreen Co. | 5,617,598 | 187,403 |
| Archer-Daniels- | | |
| Midland Co. | 4,208,057 | 120,477 |
| JM Smucker Co. | 720,191 | 56,737 |
| Hormel Foods Corp. | 1,730,321 | 49,799 |
| Brown-Forman Corp. | | |
| Class B | 551,283 | 44,770 |
| Church & Dwight Co. Inc. | 933,151 | 42,337 |
| McCormick & Co. Inc. | 778,019 | 39,321 |
| Nu Skin Enterprises Inc. | | |
| Class A | 407,732 | 20,366 |
| Casey’s General | | |
| Stores Inc. | 242,885 | 12,372 |
| Lancaster Colony Corp. | 177,887 | 12,361 |
| | | |
| | | | Market |
| | | | Value |
| | | Shares | ($000) |
| | Sanderson Farms Inc. | 141,836 | 7,225 |
| | Tootsie Roll Industries Inc. | 235,344 | 5,705 |
| | Avon Products Inc. | 14,234 | 253 |
| | | | 2,788,562 |
| Energy (10.4%) | | |
| | Chevron Corp. | 4,459,708 | 459,707 |
| | Exxon Mobil Corp. | 5,455,085 | 456,809 |
| | EOG Resources Inc. | 1,651,710 | 175,312 |
| | Murphy Oil Corp. | 1,165,626 | 69,471 |
| | Helmerich & Payne Inc. | 681,446 | 42,052 |
| | Energen Corp. | 447,655 | 21,564 |
| ^ | CARBO Ceramics Inc. | 147,407 | 14,335 |
| | ConocoPhillips | 34,100 | 2,326 |
| | | | 1,241,576 |
| Financials (6.3%) | | |
| | Franklin Resources Inc. | 1,359,716 | 144,266 |
| | Aflac Inc. | 2,768,520 | 133,526 |
| | Chubb Corp. | 1,785,377 | 120,352 |
| | T Rowe Price Group Inc. | 1,574,411 | 91,064 |
| | WR Berkley Corp. | 878,032 | 30,090 |
| | Erie Indemnity Co. | | |
| | Class A | 327,447 | 25,105 |
| | Commerce | | |
| | Bancshares Inc. | 549,883 | 21,346 |
| | Brown & Brown Inc. | 923,182 | 21,030 |
| | Transatlantic Holdings Inc. | 374,300 | 20,755 |
| | SEI Investments Co. | 1,088,976 | 20,005 |
| | HCC Insurance | | |
| | Holdings Inc. | 678,457 | 18,834 |
| | Eaton Vance Corp. | 682,318 | 17,529 |
| | Delphi Financial Group Inc. | 358,342 | 15,950 |
| | Prosperity Bancshares Inc. | 293,874 | 12,199 |
| | StanCorp Financial | | |
| | Group Inc. | 274,508 | 10,613 |
| | RLI Corp. | 136,598 | 9,742 |
| | UMB Financial Corp. | 244,559 | 9,435 |
| | Westamerica | | |
| | Bancorporation | 182,653 | 8,484 |
| | Bank of the Ozarks Inc. | 227,025 | 6,354 |
11
| | |
| Dividend Appreciation Index Fund | |
| |
| |
| |
| | | Market |
| | | Value |
| | Shares | ($000) |
| 1st Source Corp. | 158,365 | 3,965 |
| Bancfirst Corp. | 92,453 | 3,713 |
| First Financial Corp. | 84,223 | 2,950 |
| Republic Bancorp Inc. | | |
| Class A | 113,874 | 2,894 |
| Southside Bancshares Inc. | 110,534 | 2,365 |
| Cullen/Frost Bankers Inc. | 2,068 | 115 |
| | | 752,681 |
| Health Care (5.6%) | | |
| Medtronic Inc. | 6,722,847 | 259,300 |
| Stryker Corp. | 2,373,013 | 131,536 |
| Becton Dickinson and Co. | 1,354,846 | 106,234 |
| Cardinal Health Inc. | 2,199,788 | 94,657 |
| CR Bard Inc. | 536,348 | 49,623 |
| Owens & Minor Inc. | 393,203 | 11,957 |
| West Pharmaceutical | | |
| Services Inc. | 211,681 | 8,569 |
| | | 661,876 |
| Industrials (23.0%) | | |
| United Technologies | | |
| Corp. | 5,673,556 | 444,523 |
| Caterpillar Inc. | 3,628,200 | 395,909 |
| 3M Co. | 4,406,782 | 382,112 |
| Emerson Electric Co. | 4,536,211 | 233,071 |
| Illinois Tool Works Inc. | 2,884,412 | 152,960 |
| Norfolk Southern Corp. | 2,112,283 | 152,507 |
| General Dynamics Corp. | 2,171,290 | 150,166 |
| Fastenal Co. | 1,840,149 | 85,898 |
| WW Grainger Inc. | 424,375 | 80,945 |
| CH Robinson | | |
| Worldwide Inc. | 1,105,883 | 76,129 |
| Dover Corp. | 1,182,316 | 74,971 |
| Parker Hannifin Corp. | 928,729 | 74,930 |
| Stanley Black & | | |
| Decker Inc. | 1,061,449 | 74,492 |
| Expeditors International | | |
| of Washington Inc. | 1,286,338 | 57,435 |
| Roper Industries Inc. | 586,125 | 54,738 |
| Donaldson Co. Inc. | 469,204 | 33,923 |
| Cintas Corp. | 788,275 | 29,206 |
| Pentair Inc. | 584,726 | 21,530 |
| Carlisle Cos. Inc. | 374,126 | 17,857 |
| Nordson Corp. | 390,367 | 17,699 |
| Graco Inc. | 371,556 | 17,084 |
| CLARCOR Inc. | 318,289 | 16,363 |
| Valmont Industries Inc. | 154,233 | 16,181 |
| AO Smith Corp. | 251,490 | 10,683 |
| Brady Corp. Class A | 303,200 | 9,815 |
| Mine Safety Appliances Co. | 231,669 | 7,909 |
| Raven Industries Inc. | 113,867 | 7,389 |
| ABM Industries Inc. | 334,150 | 7,251 |
| Franklin Electric Co. Inc. | 136,169 | 6,817 |
| Tennant Co. | 124,862 | 4,805 |
| McGrath Rentcorp | 150,675 | 4,797 |
| | |
| | | Market |
| | | Value |
| | Shares | ($000) |
| NACCO Industries Inc. | | |
| Class A | 42,365 | 4,330 |
| Gorman-Rupp Co. | 120,658 | 3,786 |
| Harsco Corp. | 2,519 | 56 |
| Universal Forest | | |
| Products Inc. | 616 | 20 |
| | | 2,728,287 |
| Information Technology (6.5%) | |
| International Business | | |
| Machines Corp. | 2,512,642 | 483,935 |
| Automatic Data | | |
| Processing Inc. | 3,066,970 | 168,009 |
| Linear Technology Corp. | 1,358,139 | 45,253 |
| Factset Research | | |
| Systems Inc. | 282,203 | 24,924 |
| Harris Corp. | 591,171 | 24,238 |
| Jack Henry & | | |
| Associates Inc. | 565,651 | 19,345 |
| Badger Meter Inc. | 90,923 | 2,922 |
| Cass Information | | |
| Systems Inc. | 66,981 | 2,646 |
| | | 771,272 |
| Materials (8.6%) | | |
| Monsanto Co. | 3,076,122 | 252,396 |
| Praxair Inc. | 1,925,145 | 204,450 |
| Air Products & | | |
| Chemicals Inc. | 1,313,578 | 115,634 |
| Ecolab Inc. | 1,893,309 | 114,432 |
| PPG Industries Inc. | 961,412 | 86,123 |
| Sherwin-Williams Co. | 641,671 | 62,582 |
| Sigma-Aldrich Corp. | 733,852 | 49,931 |
| Albemarle Corp. | 501,426 | 32,247 |
| Royal Gold Inc. | 355,558 | 27,072 |
| Valspar Corp. | 572,026 | 24,735 |
| Aptargroup Inc. | 439,971 | 23,063 |
| Bemis Co. Inc. | 680,005 | 21,271 |
| HB Fuller Co. | 276,179 | 7,904 |
| Stepan Co. | 65,176 | 5,601 |
| | | 1,027,441 |
| Telecommunication Services (0.1%) | |
| Telephone & Data | | |
| Systems Inc. | 297,516 | 7,825 |
| Atlantic Tele-Network Inc. | 110,476 | 3,987 |
| Shenandoah | | |
| Telecommunications Co. | 763 | 7 |
| | | 11,819 |
| Utilities (1.5%) | | |
| Northeast Utilities | 1,220,759 | 42,421 |
| National Fuel Gas Co. | 602,248 | 30,281 |
| MDU Resources | | |
| Group Inc. | 1,241,900 | 26,552 |
| Questar Corp. | 1,187,082 | 22,887 |
| Aqua America Inc. | 923,924 | 20,382 |
12
| | |
| Dividend Appreciation Index Fund | |
| |
| |
| |
| | | Market |
| | | Value |
| | Shares | ($000) |
| New Jersey | | |
| Resources Corp. | 280,538 | 13,387 |
| South Jersey | | |
| Industries Inc. | 204,590 | 11,228 |
| MGE Energy Inc. | 160,001 | 7,178 |
| American States Water Co. | 120,842 | 4,371 |
| SJW Corp. | 126,021 | 2,985 |
| UGI Corp. | 3,586 | 97 |
| California Water | | |
| Service Group | 1,353 | 25 |
| | | 181,794 |
| Total Common Stocks | | |
| (Cost $10,596,293) | | 11,885,333 |
| Temporary Cash Investment (0.1%) | |
| Money Market Fund (0.1%) | | |
| 1,2 Vanguard Market | | |
| Liquidity Fund, 0.096% | | |
| (Cost $14,550) | 14,550,286 | 14,550 |
| Total Investments (100.1%) | | |
| (Cost $10,610,843) | | 11,899,883 |
| Other Assets and Liabilities (-0.1%) | |
| Other Assets | | 1,009,138 |
| Liabilities2 | | (1,026,400) |
| | | (17,262) |
| Net Assets (100%) | | 11,882,621 |
| |
| |
| Statement of Assets and Liabilities | |
| Assets | | |
| Investments in Securities, at Value | 11,899,883 |
| Receivables for Investment | | |
| Securities Sold | | 992,309 |
| Other Assets | | 16,829 |
| Total Assets | | 12,909,021 |
| Liabilities | | |
| Payables for Investment | | |
| Securities Purchased | | 1,010,457 |
| Security Lending Collateral | | |
| Payable to Brokers | | 2,620 |
| Other Liabilities | | 13,323 |
| Total Liabilities | | 1,026,400 |
| Net Assets | | 11,882,621 |
| |
| At January 31, 2012, net assets consisted of: |
| | Amount |
| | ($000) |
| Paid-in Capital | 10,888,684 |
| Undistributed Net Investment Income | 7,705 |
| Accumulated Net Realized Losses | (302,808) |
| Unrealized Appreciation (Depreciation) | 1,289,040 |
| Net Assets | 11,882,621 |
| |
| |
| Investor Shares—Net Assets | |
| Applicable to 98,402,582 outstanding | |
| $.001 par value shares of beneficial | |
| interest (unlimited authorization) | 2,206,109 |
| Net Asset Value Per Share— | |
| Investor Shares | $22.42 |
| |
| |
| ETF Shares—Net Assets | |
| Applicable to 172,677,674 outstanding | |
| $.001 par value shares of beneficial | |
| interest (unlimited authorization) | 9,676,512 |
| Net Asset Value Per Share— | |
| ETF Shares | $56.04 |
See Note A in Notes to Financial Statements.
^ Part of security position is on loan to broker-dealers. The total value of securities on loan is $2,548,000.
1 Affiliated money market fund available only to Vanguard funds and certain trusts and accounts managed by Vanguard. Rate shown is the 7-day yield.
2 Includes $2,620,000 of collateral received for securities on loan.
See accompanying Notes, which are an integral part of the Financial Statements.
13
Dividend Appreciation Index Fund
Statement of Operations
| |
| | Year Ended |
| | January 31, 2012 |
| | ($000) |
| Investment Income | |
| Income | |
| Dividends | 208,555 |
| Interest1 | 9 |
| Security Lending | 1 |
| Total Income | 208,565 |
| Expenses | |
| The Vanguard Group—Note B | |
| Investment Advisory Services | 483 |
| Management and Administrative—Investor Shares | 3,672 |
| Management and Administrative—ETF Shares | 6,695 |
| Marketing and Distribution—Investor Shares | 440 |
| Marketing and Distribution—ETF Shares | 1,754 |
| Custodian Fees | 74 |
| Auditing Fees | 27 |
| Shareholders’ Reports—Investor Shares | 16 |
| Shareholders’ Reports—ETF Shares | 187 |
| Trustees’ Fees and Expenses | 7 |
| Total Expenses | 13,355 |
| Net Investment Income | 195,210 |
| Realized Net Gain (Loss) on Investment Securities Sold | (953) |
| Change in Unrealized Appreciation (Depreciation) of Investment Securities | 547,378 |
| Net Increase (Decrease) in Net Assets Resulting from Operations | 741,635 |
| 1 Interest income from an affiliated company of the fund was $9,000. |
See accompanying Notes, which are an integral part of the Financial Statements.
14
Dividend Appreciation Index Fund
Statement of Changes in Net Assets
| | |
| | Year Ended January 31, |
| | 2012 | 2011 |
| | ($000) | ($000) |
| Increase (Decrease) in Net Assets | | |
| Operations | | |
| Net Investment Income | 195,210 | 95,486 |
| Realized Net Gain (Loss) | (953) | 62,018 |
| Change in Unrealized Appreciation (Depreciation) | 547,378 | 607,952 |
| Net Increase (Decrease) in Net Assets Resulting from Operations | 741,635 | 765,456 |
| Distributions | | |
| Net Investment Income | | |
| Investor Shares | (35,636) | (19,694) |
| ETF Shares | (156,111) | (74,247) |
| Realized Capital Gain | | |
| Investor Shares | — | — |
| ETF Shares | — | — |
| Total Distributions | (191,747) | (93,941) |
| Capital Share Transactions | | |
| Investor Shares | 687,152 | 655,145 |
| ETF Shares | 4,240,039 | 2,547,856 |
| Net Increase (Decrease) from Capital Share Transactions | 4,927,191 | 3,203,001 |
| Total Increase (Decrease) | 5,477,079 | 3,874,516 |
| Net Assets | | |
| Beginning of Period | 6,405,542 | 2,531,026 |
| End of Period1 | 11,882,621 | 6,405,542 |
| 1 Net Assets—End of Period includes undistributed net investment income of $7,705,000 and $4,242,000. |
See accompanying Notes, which are an integral part of the Financial Statements.
15
Dividend Appreciation Index Fund
Financial Highlights
| | | | | |
| Investor Shares | | | | | |
| |
| For a Share Outstanding | | | Year Ended January 31, |
| Throughout Each Period | 2012 | 2011 | 2010 | 2009 | 2008 |
| Net Asset Value, Beginning of Period | $21.33 | $18.33 | $14.79 | $21.40 | $21.84 |
| Investment Operations | | | | | |
| Net Investment Income | .445 | .392 | .369 | .387 | .325 |
| Net Realized and Unrealized Gain (Loss) | | | | | |
| on Investments | 1.089 | 3.006 | 3.543 | (6.614) | (.438) |
| Total from Investment Operations | 1.534 | 3.398 | 3.912 | (6.227) | (.113) |
| Distributions | | | | | |
| Dividends from Net Investment Income | (.444) | (.398) | (.372) | (.383) | (.327) |
| Distributions from Realized Capital Gains | — | — | — | — | — |
| Total Distributions | (.444) | (.398) | (.372) | (.383) | (.327) |
| Net Asset Value, End of Period | $22.42 | $21.33 | $18.33 | $14.79 | $21.40 |
| |
| Total Return1 | 7.34% | 18.75% | 26.80% | -29.48% | -0.58% |
| |
| Ratios/Supplemental Data | | | | | |
| Net Assets, End of Period (Millions) | $2,206 | $1,421 | $613 | $386 | $357 |
| Ratio of Total Expenses to | | | | | |
| Average Net Assets | 0.25% | 0.30% | 0.35% | 0.36% | 0.40% |
| Ratio of Net Investment Income to | | | | | |
| Average Net Assets | 2.14% | 2.13% | 2.24% | 2.25% | 1.56% |
| Portfolio Turnover Rate2 | 14% | 15% | 20% | 34% | 17% |
1 Total returns do not include account service fees that may have applied in the periods shown. Fund prospectuses provide information about any applicable account service fees.
2 Excludes the value of portfolio securities received or delivered as a result of in-kind purchases or redemptions of the fund’s capital shares, including ETF Creation Units.
See accompanying Notes, which are an integral part of the Financial Statements.
16
Dividend Appreciation Index Fund
Financial Highlights
| | | | | |
| ETF Shares | | | | | |
| |
| For a Share Outstanding | | | Year Ended January 31, |
| Throughout Each Period | 2012 | 2011 | 2010 | 2009 | 2008 |
| Net Asset Value, Beginning of Period | $53.32 | $45.81 | $36.96 | $53.48 | $54.60 |
| Investment Operations | | | | | |
| Net Investment Income | 1.173 | 1.034 | .973 | 1.032 | .873 |
| Net Realized and Unrealized Gain (Loss) | | | | | |
| on Investments | 2.719 | 7.524 | 8.856 | (16.526) | (1.120) |
| Total from Investment Operations | 3.892 | 8.558 | 9.829 | (15.494) | (.247) |
| Distributions | | | | | |
| Dividends from Net Investment Income | (1.172) | (1.048) | (.979) | (1.026) | (.873) |
| Distributions from Realized Capital Gains | — | — | — | — | — |
| Total Distributions | (1.172) | (1.048) | (.979) | (1.026) | (.873) |
| Net Asset Value, End of Period | $56.04 | $53.32 | $45.81 | $36.96 | $53.48 |
| |
| Total Return | 7.46% | 18.91% | 26.95% | -29.38% | -0.51% |
| |
| Ratios/Supplemental Data | | | | | |
| Net Assets, End of Period (Millions) | $9,677 | $4,985 | $1,918 | $805 | $302 |
| Ratio of Total Expenses to | | | | | |
| Average Net Assets | 0.13% | 0.18% | 0.23% | 0.24% | 0.28% |
| Ratio of Net Investment Income to | | | | | |
| Average Net Assets | 2.26% | 2.25% | 2.36% | 2.37% | 1.68% |
| Portfolio Turnover Rate1 | 14% | 15% | 20% | 34% | 17% |
1 Excludes the value of portfolio securities received or delivered as a result of in-kind purchases or redemptions of the fund’s capital shares, including ETF Creation Units.
See accompanying Notes, which are an integral part of the Financial Statements.
17
Dividend Appreciation Index Fund
Notes to Financial Statements
Vanguard Dividend Appreciation Index Fund is registered under the Investment Company Act of 1940 as an open-end investment company, or mutual fund. The fund offers two classes of shares: Investor Shares and ETF Shares. Investor Shares are available to any investor who meets the fund’s minimum purchase requirements. ETF Shares are listed for trading on the NYSE Arca, Inc.; they can be purchased and sold through a broker.
A. The following significant accounting policies conform to generally accepted accounting principles for U.S. mutual funds. The fund consistently follows such policies in preparing its financial statements.
1. Security Valuation: Securities are valued as of the close of trading on the New York Stock Exchange (generally 4 p.m., Eastern time) on the valuation date. Equity securities are valued at the latest quoted sales prices or official closing prices taken from the primary market in which each security trades; such securities not traded on the valuation date are valued at the mean of the latest quoted bid and asked prices. Securities for which market quotations are not readily available, or whose values have been materially affected by events occurring before the fund’s pricing time but after the close of the securities’ primary markets, are valued by methods deemed by the board of trustees to represent fair value. Investments in Vanguard Market Liquidity Fund are valued at that fund’s net asset value.
2. Federal Income Taxes: The fund intends to continue to qualify as a regulated investment company and distribute all of its taxable income. Management has analyzed the fund’s tax positions taken for all open federal income tax years (January 31, 2009–2012), and has concluded that no provision for federal income tax is required in the fund’s financial statements.
3. Distributions: Distributions to shareholders are recorded on the ex-dividend date.
4. Security Lending: The fund may lend its securities to qualified institutional borrowers to earn additional income. Security loans are required to be secured at all times by collateral at least equal to the market value of securities loaned. The fund invests cash collateral received in Vanguard Market Liquidity Fund, and records a liability for the return of the collateral, during the period the securities are on loan. Security lending income represents fees charged to borrowers plus income earned on investing cash collateral, less expenses associated with the loan.
5. Other: Dividend income is recorded on the ex-dividend date. Interest income includes income distributions received from Vanguard Market Liquidity Fund and is accrued daily. Security transactions are accounted for on the date securities are bought or sold. Costs used to determine realized gains (losses) on the sale of investment securities are those of the specific securities sold.
Each class of shares has equal rights as to assets and earnings, except that each class separately bears certain class-specific expenses related to maintenance of shareholder accounts (included in Management and Administrative expenses) and shareholder reporting. Marketing and distribution expenses are allocated to each class of shares based on a method approved by the board of trustees. Income, other non-class-specific expenses, and gains and losses on investments are allocated to each class of shares based on its relative net assets.
B. The Vanguard Group furnishes at cost investment advisory, corporate management, administrative, marketing, and distribution services. The costs of such services are allocated to the fund under methods approved by the board of trustees. The fund has committed to provide up to 0.40% of its
18
Dividend Appreciation Index Fund
net assets in capital contributions to Vanguard. At January 31, 2012, the fund had contributed capital of $1,769,000 to Vanguard (included in Other Assets), representing 0.01% of the fund’s net assets and 0.71% of Vanguard’s capitalization. The fund’s trustees and officers are also directors and officers of Vanguard.
C. Various inputs may be used to determine the value of the fund’s investments. These inputs are summarized in three broad levels for financial statement purposes. The inputs or methodologies used to value securities are not necessarily an indication of the risk associated with investing in those securities.
Level 1—Quoted prices in active markets for identical securities.
Level 2—Other significant observable inputs (including quoted prices for similar securities, interest rates, prepayment speeds, credit risk, etc.).
Level 3—Significant unobservable inputs (including the fund’s own assumptions used to determine the fair value of investments).
At January 31, 2012, 100% of the market value of the fund’s investments was based on Level 1 inputs.
D. Distributions are determined on a tax basis and may differ from net investment income and realized capital gains for financial reporting purposes. Differences may be permanent or temporary. Permanent differences are reclassified among capital accounts in the financial statements to reflect their tax character. Temporary differences arise when certain items of income, expense, gain, or loss are recognized in different periods for financial statement and tax purposes; these differences will reverse at some time in the future. Differences in classification may also result from the treatment of short-term gains as ordinary income for tax purposes.
During the year ended January 31, 2012, the fund realized $65,097,000 of net capital gains resulting from in-kind redemptions—in which shareholders exchanged fund shares for securities held by the fund rather than for cash. Because such gains are not taxable to the fund, and are not distributed to shareholders, they have been reclassified from accumulated net realized losses to paid-in capital.
For tax purposes, at January 31, 2012, the fund had $11,643,000 of ordinary income available for distribution. The fund had available capital losses totaling $284,147,000 to offset future net capital gains. Of this amount, $191,649,000 is subject to expiration dates; $609,000 may be used to offset future net capital gains through January 31, 2016, $22,242,000 through January 31, 2017, $146,149,000 through January 31, 2018, and $22,649,000 through January 31, 2019. Capital losses of $92,498,000 realized beginning in fiscal year 2012 may be carried forward indefinitely but must be used before any expiring loss carryforwards.
At January 31, 2012, the cost of investment securities for tax purposes was $10,629,503,000. Net unrealized appreciation of investment securities for tax purposes was $1,270,380,000, consisting of unrealized gains of $1,331,060,000 on securities that had risen in value since their purchase and $60,680,000 in unrealized losses on securities that had fallen in value since their purchase.
E. During the year ended January 31, 2012, the fund purchased $6,407,243,000 of investment securities and sold $1,467,852,000 of investment securities, other than temporary cash investments.
19
Dividend Appreciation Index Fund
F. Capital share transactions for each class of shares were:
| | | | |
| | | | Year Ended January 31, |
| | | 2012 | | 2011 |
| | Amount | Shares | Amount | Shares |
| | ($000) | (000) | ($000) | (000) |
| Investor Shares | | | | |
| Issued | 1,067,783 | 49,431 | 764,953 | 38,773 |
| Issued in Lieu of Cash Distributions | 30,641 | 1,454 | 18,250 | 928 |
| Redeemed | (411,272) | (19,093) | (128,058) | (6,510) |
| Net Increase (Decrease)—Investor Shares | 687,152 | 31,792 | 655,145 | 33,191 |
| ETF Shares | | | | |
| Issued | 4,439,908 | 82,895 | 3,186,243 | 64,200 |
| Issued in Lieu of Cash Distributions | — | — | — | — |
| Redeemed | (199,869) | (3,700) | (638,387) | (12,600) |
| Net Increase (Decrease)—ETF Shares | 4,240,039 | 79,195 | 2,547,856 | 51,600 |
G. In preparing the financial statements as of January 31, 2012, management considered the impact of subsequent events for potential recognition or disclosure in these financial statements.
20
Report of Independent Registered
Public Accounting Firm
To the Trustees of Vanguard Specialized Funds and the Shareholders of Vanguard Dividend Appreciation Index Fund:
In our opinion, the accompanying statement of net assets and statement of assets and liabilities and the related statements of operations and of changes in net assets and the financial highlights present fairly, in all material respects, the financial position of Vanguard Dividend Appreciation Index Fund (constituting a separate portfolio of Vanguard Specialized Funds, hereafter referred to as the “Fund”) at January 31, 2012, the results of its operations for the year then ended, the changes in its net assets for each of the two years in the period then ended and the financial highlights for each of the five years in the period then ended, in conformity with accounting principles generally accepted in the United States of America. These financial statements and financial highlights (hereafter referred to as “financial statements”) are the responsibility of the Fund’s management; our responsibility is to express an opinion on these financial statements based on our audits. We conducted our audits of these financial statements in accordance with the standards of the Public Company Accounting Oversight Board (United States). Those standards require that we plan and perform the audit to obtain reasonable assurance about whether the financial statements are free of material misstatement. An audit includes examining, on a test basis, evidence supporting the amounts and disclosures in the financial statements, assessing the accounting principles used and significant estimates made by management, and evaluating the overall financial statement presentation. We believe that our audits, which included confirmation of securities at January 31, 2012 by correspondence with the custodian and by agreement to the underlying ownership records of Vanguard Market Liquidity Fund, provide a reasonable basis for our opinion.
PricewaterhouseCoopers LLP
Philadelphia, Pennsylvania
March 12, 2012
|
| Special 2011 tax information (unaudited) for Vanguard Dividend Appreciation Index Fund |
This information for the fiscal year ended January 31, 2012, is included pursuant to provisions of the Internal Revenue Code.
The fund distributed $191,747,000 of qualified dividend income to shareholders during the fiscal year.
For corporate shareholders, 100% of investment income (dividend income plus short-term gains, if any) qualifies for the dividends-received deduction.
21
Your Fund’s After-Tax Returns
This table presents returns for your fund both before and after taxes. The after-tax returns are shown in two ways: (1) assuming that an investor owned the fund during the entire period and paid taxes on the fund’s distributions, and (2) assuming that an investor paid taxes on the fund’s distributions and sold all shares at the end of each period.
Calculations are based on the highest individual federal income tax and capital gains tax rates in effect at the times of the distributions and the hypothetical sales. State and local taxes were not considered. After-tax returns reflect any qualified dividend income , using actual prior-year figures and estimates for 2012. (In the example, returns after the sale of fund shares may be higher than those assuming no sale. This occurs when the sale would have produced a capital loss. The calculation assumes that the investor received a tax deduction for the loss.)
The table shows returns for Investor Shares only; returns for other share classes will differ. Please note that your actual after-tax returns will depend on your tax situation and may differ from those shown. Also note that if you own the fund in a tax-deferred account, such as an individual retirement account or a 401(k) plan, this information does not apply to you. Such accounts are not subject to current taxes.
Finally, keep in mind that a fund’s performance—whether before or after taxes—does not guarantee future results.
Average Annual Total Returns: Dividend Appreciation Index Fund Investor Shares
Periods Ended January 31, 2012
| | | |
| | | | Since |
| | One | Five | Inception |
| | Year | Years | (4/27/2006) |
| Returns Before Taxes | 7.34% | 2.53% | 3.90% |
| Returns After Taxes on Distributions | 7.00 | 2.23 | 3.61 |
| Returns After Taxes on Distributions and Sale of Fund Shares | 5.17 | 2.12 | 3.31 |
22
About Your Fund’s Expenses
As a shareholder of the fund, you incur ongoing costs, which include costs for portfolio management, administrative services, and shareholder reports (like this one), among others. Operating expenses, which are deducted from a fund’s gross income, directly reduce the investment return of the fund.
A fund’s expenses are expressed as a percentage of its average net assets. This figure is known as the expense ratio. The following examples are intended to help you understand the ongoing costs (in dollars) of investing in your fund and to compare these costs with those of other mutual funds. The examples are based on an investment of $1,000 made at the beginning of the period shown and held for the entire period.
The accompanying table illustrates your fund’s costs in two ways:
• Based on actual fund return. This section helps you to estimate the actual expenses that you paid over the period. The ”Ending Account Value“ shown is derived from the fund‘s actual return, and the third column shows the dollar amount that would have been paid by an investor who started with $1,000 in the fund. You may use the information here, together with the amount you invested, to estimate the expenses that you paid over the period.
To do so, simply divide your account value by $1,000 (for example, an $8,600 account value divided by $1,000 = 8.6), then multiply the result by the number given for your fund under the heading ”Expenses Paid During Period.“
• Based on hypothetical 5% yearly return. This section is intended to help you compare your fund‘s costs with those of other mutual funds. It assumes that the fund had a yearly return of 5% before expenses, but that the expense ratio is unchanged. In this case—because the return used is not the fund’s actual return—the results do not apply to your investment. The example is useful in making comparisons because the Securities and Exchange Commission requires all mutual funds to calculate expenses based on a 5% return. You can assess your fund’s costs by comparing this hypothetical example with the hypothetical examples that appear in shareholder reports of other funds.
Note that the expenses shown in the table are meant to highlight and help you compare ongoing costs only and do not reflect transaction costs incurred by the fund for buying and selling securities. Further, the expenses do not include any purchase, redemption, or account service fees described in the fund prospectus. If such fees were applied to your account, your costs would be higher. Your fund does not carry a “sales load.”
The calculations assume no shares were bought or sold during the period. Your actual costs may have been higher or lower, depending on the amount of your investment and the timing of any purchases or redemptions.
You can find more information about the fund’s expenses, including annual expense ratios, in the Financial Statements section of this report. For additional information on operating expenses and other shareholder costs, please refer to your fund’s current prospectus.
23
| | | |
| Six Months Ended January 31, 2012 | | | |
| | Beginning | Ending | Expenses |
| | Account Value | Account Value | Paid During |
| Dividend Appreciation Index Fund | 7/31/2011 | 1/31/2012 | Period |
| Based on Actual Fund Return | | | |
| Investor Shares | $1,000.00 | $1,048.45 | $1.24 |
| ETF Shares | 1,000.00 | 1,048.93 | 0.67 |
| Based on Hypothetical 5% Yearly Return | | | |
| Investor Shares | $1,000.00 | $1,024.00 | $1.22 |
| ETF Shares | 1,000.00 | 1,024.55 | 0.66 |
The calculations are based on expenses incurred in the most recent six-month period. The fund’s annualized six-month expense ratios for that period are 0.24% for Investor Shares and 0.13% for ETF Shares. The dollar amounts shown as “Expenses Paid” are equal to the annualized expense ratio multiplied by the average account value over the period, multiplied by the number of days in the most recent six-month period, then divided by the number of days in the most recent 12-month period.
24
Glossary
30-Day SEC Yield. A fund’s 30-day SEC yield is derived using a formula specified by the U.S. Securities and Exchange Commission. Under the formula, data related to the fund’s security holdings in the previous 30 days are used to calculate the fund’s hypothetical net income for that period, which is then annualized and divided by the fund’s estimated average net assets over the calculation period. For the purposes of this calculation, a security’s income is based on its current market yield to maturity (for bonds), its actual income (for asset-backed securities), or its projected dividend yield (for stocks). Because the SEC yield represents hypothetical annualized income, it will differ—at times significantly—from the fund’s actual experience. As a result, the fund’s income distributions may be higher or lower than implied by the SEC yield.
Beta. A measure of the magnitude of a fund’s past share-price fluctuations in relation to the ups and downs of a given market index. The index is assigned a beta of 1.00. Compared with a given index, a fund with a beta of 1.20 typically would have seen its share price rise or fall by 12% when the index rose or fell by 10%. For this report, beta is based on returns over the past 36 months for both the fund and the index. Note that a fund’s beta should be reviewed in conjunction with its R-squared (see definition). The lower the R-squared, the less correlation there is between the fund and the index, and the less reliable beta is as an indicator of volatility.
Dividend Yield. Dividend income earned by stocks, expressed as a percentage of the aggregate market value (or of net asset value, for a fund). The yield is determined by dividing the amount of the annual dividends by the aggregate value (or net asset value) at the end of the period. For a fund, the dividend yield is based solely on stock holdings and does not include any income produced by other investments.
Earnings Growth Rate. The average annual rate of growth in earnings over the past five years for the stocks now in a fund.
Equity Exposure. A measure that reflects a fund’s investments in stocks and stock futures. Any holdings in short-term reserves are excluded.
Expense Ratio. A fund’s total annual operating expenses expressed as a percentage of the fund’s average net assets. The expense ratio includes management and administrative expenses, but does not include the transaction costs of buying and selling portfolio securities.
Foreign Holdings. The percentage of a fund represented by securities or depositary receipts of companies based outside the United States.
Inception Date. The date on which the assets of a fund (or one of its share classes) are first invested in accordance with the fund’s investment objective. For funds with a subscription period, the inception date is the day after that period ends. Investment performance is measured from the inception date.
Median Market Cap. An indicator of the size of companies in which a fund invests; the midpoint of market capitalization (market price x shares outstanding) of a fund’s stocks, weighted by the proportion of the fund’s assets invested in each stock. Stocks representing half of the fund’s assets have market capitalizations above the median, and the rest are below it.
Price/Book Ratio. The share price of a stock divided by its net worth, or book value, per share. For a fund, the weighted average price/book ratio of the stocks it holds.
25
Price/Earnings Ratio. The ratio of a stock’s current price to its per-share earnings over the past year. For a fund, the weighted average P/E of the stocks it holds. P/E is an indicator of market expectations about corporate prospects; the higher the P/E, the greater the expectations for a company’s future growth.
R-Squared. A measure of how much of a fund’s past returns can be explained by the returns from the market in general, as measured by a given index. If a fund’s total returns were precisely synchronized with an index’s returns, its R-squared would be 1.00. If the fund’s returns bore no relationship to the index’s returns, its R-squared would be 0. For this report, R-squared is based on returns over the past 36 months for both the fund and the index.
Return on Equity. The annual average rate of return generated by a company during the past five years for each dollar of shareholder’s equity (net income divided by shareholder’s equity). For a fund, the weighted average return on equity for the companies whose stocks it holds.
Short-Term Reserves. The percentage of a fund invested in highly liquid, short-term securities that can be readily converted to cash.
Turnover Rate. An indication of the fund’s trading activity. Funds with high turnover rates incur higher transaction costs and may be more likely to distribute capital gains (which may be taxable to investors). The turnover rate excludes in-kind transactions, which have minimal impact on costs.
26
This page intentionally left blank.
The People Who Govern Your Fund
The trustees of your mutual fund are there to see that the fund is operated and managed in your best interests since, as a shareholder, you are a part owner of the fund. Your fund’s trustees also serve on the board of directors of The Vanguard Group, Inc., which is owned by the Vanguard funds and provides services to them on an at-cost basis.
A majority of Vanguard’s board members are independent, meaning that they have no affiliation with Vanguard or the funds they oversee, apart from the sizable personal investments they have made as private individuals. The independent board members have distinguished backgrounds in business, academia, and public service. Each of the trustees and executive officers oversees 181 Vanguard funds.
The following table provides information for each trustee and executive officer of the fund. More information about the trustees is in the Statement of Additional Information, which can be obtained, without charge, by contacting Vanguard at 800-662-7447, or online at vanguard.com.
| |
| Interested Trustee1 | (chemicals); Director of Tyco International, Ltd. |
| | (diversified manufacturing and services) and Hewlett- |
| F. William McNabb III | Packard Co. (electronic computer manufacturing); |
| Born 1957. Trustee Since July 2009. Chairman of the | Senior Advisor at New Mountain Capital; Trustee |
| Board. Principal Occupation(s) During the Past Five | of The Conference Board; Member of the Board of |
| Years: Chairman of the Board of The Vanguard Group, | Managers of Delphi Automotive LLP (automotive |
| Inc., and of each of the investment companies served | components). |
| by The Vanguard Group, since January 2010; Director | |
| of The Vanguard Group since 2008; Chief Executive | Amy Gutmann |
| Officer and President of The Vanguard Group and of | Born 1949. Trustee Since June 2006. Principal |
| each of the investment companies served by The | Occupation(s) During the Past Five Years: President |
| Vanguard Group since 2008; Director of Vanguard | of the University of Pennsylvania; Christopher H. |
| Marketing Corporation; Managing Director of The | Browne Distinguished Professor of Political Science |
| Vanguard Group (1995–2008). | in the School of Arts and Sciences with secondary |
| | appointments at the Annenberg School for Commu- |
| | nication and the Graduate School of Education |
| Independent Trustees | of the University of Pennsylvania; Director of |
| | Carnegie Corporation of New York, Schuylkill River |
| Emerson U. Fullwood | Development Corporation, and Greater Philadelphia |
| Born 1948. Trustee Since January 2008. Principal | Chamber of Commerce; Trustee of the National |
| Occupation(s) During the Past Five Years: Executive | Constitution Center; Chair of the Presidential |
| Chief Staff and Marketing Officer for North America | Commission for the Study of Bioethical Issues. |
| and Corporate Vice President (retired 2008) of Xerox | |
| Corporation (document management products and | JoAnn Heffernan Heisen |
| services); Executive in Residence and 2010 | Born 1950. Trustee Since July 1998. Principal |
| Distinguished Minett Professor at the Rochester | Occupation(s) During the Past Five Years: Corporate |
| Institute of Technology; Director of SPX Corporation | Vice President and Chief Global Diversity Officer |
| (multi-industry manufacturing), the United Way of | (retired 2008) and Member of the Executive |
| Rochester, Amerigroup Corporation (managed health | Committee (1997–2008) of Johnson & Johnson |
| care), the University of Rochester Medical Center, | (pharmaceuticals/consumer products); Director of |
| Monroe Community College Foundation, and North | Skytop Lodge Corporation (hotels), the University |
| Carolina A&T University. | Medical Center at Princeton, the Robert Wood |
| | Johnson Foundation, and the Center for Work Life |
| Rajiv L. Gupta | Policy; Member of the Advisory Board of the |
| Born 1945. Trustee Since December 2001.2 | Maxwell School of Citizenship and Public Affairs |
| Principal Occupation(s) During the Past Five Years: | at Syracuse University. |
| Chairman and Chief Executive Officer (retired 2009) | |
| and President (2006–2008) of Rohm and Haas Co. | |
| | |
| F. Joseph Loughrey | the investment companies served by The Vanguard |
| Born 1949. Trustee Since October 2009. Principal | Group since 2010; Assistant Controller of each of |
| Occupation(s) During the Past Five Years: President | the investment companies served by The Vanguard |
| and Chief Operating Officer (retired 2009) and Vice | Group (2001–2010). | |
| Chairman of the Board (2008–2009) of Cummins Inc. | | |
| (industrial machinery); Director of SKF AB (industrial | Thomas J. Higgins | |
| machinery), Hillenbrand, Inc. (specialized consumer | Born 1957. Chief Financial Officer Since September |
| services), the Lumina Foundation for Education, and | 2008. Principal Occupation(s) During the Past Five |
| Oxfam America; Chairman of the Advisory Council | Years: Principal of The Vanguard Group, Inc.; Chief |
| for the College of Arts and Letters and Member | Financial Officer of each of the investment companies |
| of the Advisory Board to the Kellogg Institute for | served by The Vanguard Group since 2008; Treasurer |
| International Studies at the University of Notre Dame. | of each of the investment companies served by The |
| | Vanguard Group (1998–2008). |
| André F. Perold | | |
| Born 1952. Trustee Since December 2004. Principal | Kathryn J. Hyatt | |
| Occupation(s) During the Past Five Years: George | Born 1955. Treasurer Since November 2008. Principal |
| Gund Professor of Finance and Banking at the Harvard | Occupation(s) During the Past Five Years: Principal |
| Business School (retired July 2011); Chief Investment | of The Vanguard Group, Inc.; Treasurer of each of |
| Officer and Managing Partner of HighVista Strategies | the investment companies served by The Vanguard |
| LLC (private investment firm); Director of Rand | Group since 2008; Assistant Treasurer of each of the |
| Merchant Bank; Overseer of the Museum of Fine | investment companies served by The Vanguard Group |
| Arts Boston. | (1988–2008). | |
| |
| Alfred M. Rankin, Jr. | Heidi Stam | |
| Born 1941. Trustee Since January 1993. Principal | Born 1956. Secretary Since July 2005. Principal |
| Occupation(s) During the Past Five Years: Chairman, | Occupation(s) During the Past Five Years: Managing |
| President, and Chief Executive Officer of NACCO | Director of The Vanguard Group, Inc., since 2006; |
| Industries, Inc. (forklift trucks/housewares/lignite); | General Counsel of The Vanguard Group since 2005; |
| Director of Goodrich Corporation (industrial products/ | Secretary of The Vanguard Group and of each of the |
| aircraft systems and services) and the National | investment companies served by The Vanguard Group |
| Association of Manufacturers; Chairman of the Federal | since 2005; Director and Senior Vice President of |
| Reserve Bank of Cleveland and of University Hospitals | Vanguard Marketing Corporation since 2005; |
| of Cleveland; Advisory Chairman of the Board of The | Principal of The Vanguard Group (1997–2006). |
| Cleveland Museum of Art. | | |
| |
| Peter F. Volanakis | Vanguard Senior Management Team |
| Born 1955. Trustee Since July 2009. Principal | Mortimer J. Buckley | Michael S. Miller |
| Occupation(s) During the Past Five Years: President | Kathleen C. Gubanich | James M. Norris |
| and Chief Operating Officer (retired 2010) of Corning | Paul A. Heller | Glenn W. Reed |
| Incorporated (communications equipment); Director of | Martha G. King | George U. Sauter |
| Corning Incorporated (2000-2010) and Dow Corning | Chris D. McIsaac | |
| (2001-2010); Director of SPX Corporation (multi- | | |
| industry manufacturing), the Corning Foundation, and | | |
| the Corning Museum of Glass; Overseer of the Amos | Chairman Emeritus and Senior Advisor |
| Tuck School of Business Administration at Dartmouth | | |
| College; Advisor to the Norris Cotton Cancer Center. | John J. Brennan | |
| | Chairman, 1996–2009 | |
| | Chief Executive Officer and President, 1996–2008 |
| Executive Officers | | |
| |
| Glenn Booraem | Founder | |
| Born 1967. Controller Since July 2010. Principal | | |
| Occupation(s) During the Past Five Years: Principal | John C. Bogle | |
| of The Vanguard Group, Inc.; Controller of each of | Chairman and Chief Executive Officer, 1974–1996 |
1 Mr. McNabb is considered an “interested person,” as defined in the Investment Company Act of 1940, because he is an officer of the Vanguard funds.
2 December 2002 for Vanguard Equity Income Fund, Vanguard Growth Equity Fund, the Vanguard Municipal Bond Funds, and the Vanguard State Tax-Exempt Funds.
|  |
| P.O. Box 2600 |
| Valley Forge, PA 19482-2600 |
Connect with Vanguard® > vanguard.com
| |
| Fund Information > 800-662-7447 | “Dividend Achievers” is a trademark of Mergent, Inc., |
| Direct Investor Account Services > 800-662-2739 | and has been licensed for use by The Vanguard Group, |
| | Inc. Vanguard mutual funds are not sponsored, |
| Institutional Investor Services > 800-523-1036 | endorsed, sold, or promoted by Mergent, and Mergent |
| Text Telephone for People | makes no representation regarding the advisability of |
| With Hearing Impairment > 800-749-7273 | investing in the funds. |
| |
| This material may be used in conjunction | |
| with the offering of shares of any Vanguard | |
| fund only if preceded or accompanied by | |
| the fund’s current prospectus. | |
| |
| All comparative mutual fund data are from Lipper Inc. or | |
| Morningstar, Inc., unless otherwise noted. | |
| |
| You can obtain a free copy of Vanguard’s proxy voting | |
| guidelines by visiting vanguard.com/proxyreporting or by | |
| calling Vanguard at 800-662-2739. The guidelines are | |
| also available from the SEC’s website, sec.gov. In | |
| addition, you may obtain a free report on how your fund | |
| voted the proxies for securities it owned during the 12 | |
| months ended June 30. To get the report, visit either | |
| vanguard.com/proxyreporting or sec.gov. | |
| |
| You can review and copy information about your fund at | |
| the SEC’s Public Reference Room in Washington, D.C. To | |
| find out more about this public service, call the SEC at | |
| 202-551-8090. Information about your fund is also | |
| available on the SEC’s website, and you can receive | |
| copies of this information, for a fee, by sending a | |
| request in either of two ways: via e-mail addressed to | |
| publicinfo@sec.gov or via regular mail addressed to the | |
| Public Reference Section, Securities and Exchange | |
| Commission, Washington, DC 20549-1520. | |
| |
| |
| | © 2012 The Vanguard Group, Inc. |
| | All rights reserved. |
| | Vanguard Marketing Corporation, Distributor. |
| |
| | Q6020 032012 |
Item 2: Code of Ethics. The Registrant has adopted a code of ethics that applies to the Registrant’s principal executive officer, principal financial officer, principal accounting officer or controller or persons performing similar functions. The Code of Ethics was amended during the reporting period covered by this report to make certain technical, non-material changes.
Item 3: Audit Committee Financial Expert. The following members of the Audit Committee have been determined by the Registrant’s Board of Trustees to be Audit Committee Financial Experts serving on its Audit Committee, and to be independent: Rajiv L. Gupta, JoAnn Heffernan Heisen, André F. Perold, and Alfred M. Rankin, Jr.
Item 4: Principal Accountant Fees and Services.
(a) Audit Fees.
Audit Fees of the Registrant
Fiscal Year Ended January 31, 2012: $172,000
Fiscal Year Ended January 31, 2011: $161,000
Aggregate Audit Fees of Registered Investment Companies in the Vanguard Group.
Fiscal Year Ended January 31, 2012: $3,978,540
Fiscal Year Ended January 31, 2011: $3,607,060
(b) Audit-Related Fees.
Fiscal Year Ended January 31, 2012: $1,341,750
Fiscal Year Ended January 31, 2011: $791,350
Includes fees billed in connection with assurance and related services provided to the Registrant, The Vanguard Group, Inc., Vanguard Marketing Corporation, and other registered investment companies in the Vanguard Group.
(c) Tax Fees.
Fiscal Year Ended January 31, 2012: $373,830
Fiscal Year Ended January 31, 2011: $336,090
Includes fees billed in connection with tax compliance, planning and advice services provided to the Registrant, The Vanguard Group, Inc., Vanguard Marketing Corporation, and other registered investment companies in the Vanguard Group and related to income and excise taxes.
(d) All Other Fees.
Fiscal Year Ended January 31, 2012: $16,000
Fiscal Year Ended January 31, 2011: $16,000
Includes fees billed for services related to risk management and privacy matters. Services were provided to the Registrant, The Vanguard Group, Inc., Vanguard Marketing Corporation, and other registered investment companies in the Vanguard Group.
(e) (1) Pre-Approval Policies. The policy of the Registrant’s Audit Committee is to consider and, if appropriate, approve before the principal accountant is engaged for such services, all specific audit and non-audit services provided to: (1) the Registrant; (2) The Vanguard Group, Inc.; (3) other entities controlled by The Vanguard Group, Inc. that provide ongoing services to the Registrant; and (4) other registered investment
companies in the Vanguard Group. In making a determination, the Audit Committee considers whether the services are consistent with maintaining the principal accountant’s independence.
In the event of a contingency situation in which the principal accountant is needed to provide services in between scheduled Audit Committee meetings, the Chairman of the Audit Committee would be called on to consider and, if appropriate, pre-approve audit or permitted non-audit services in an amount sufficient to complete services through the next Audit Committee meeting, and to determine if such services would be consistent with maintaining the accountant’s independence. At the next scheduled Audit Committee meeting, services and fees would be presented to the Audit Committee for formal consideration, and, if appropriate, approval by the entire Audit Committee. The Audit Committee would again consider whether such services and fees are consistent with maintaining the principal accountant’s independence.
The Registrant’s Audit Committee is informed at least annually of all audit and non-audit services provided by the principal accountant to the Vanguard complex, whether such services are provided to: (1) the Registrant; (2) The Vanguard Group, Inc.; (3) other entities controlled by The Vanguard Group, Inc. that provide ongoing services to the Registrant; or (4) other registered investment companies in the Vanguard Group.
(2) No percentage of the principal accountant’s fees or services were approved pursuant to the waiver provision of paragraph (c)(7)(i)(C) of Rule 2-01 of Regulation S-X.
(f) For the most recent fiscal year, over 50% of the hours worked under the principal accountant’s engagement were not performed by persons other than full-time, permanent employees of the principal accountant.
(g) Aggregate Non-Audit Fees.
Fiscal Year Ended January 31, 2012: $389,830
Fiscal Year Ended January 31, 2011: $352,090
Includes fees billed for non-audit services provided to the Registrant, The Vanguard Group, Inc., Vanguard Marketing Corporation, and other registered investment companies in the Vanguard Group.
(h) For the most recent fiscal year, the Audit Committee has determined that the provision of all non-audit services was consistent with maintaining the principal accountant’s independence.
Item 5: Audit Committee of Listed Registrants.
The Registrant is a listed issuer as defined in rule 10A-3 under the Securities Exchange Act of 1934 (“Exchange Act”). The Registrant has a separately-designated standing audit committee established in accordance with Section 3(a)(58)(A) of the Exchange Act. The Registrant’s audit committee members are: Emerson U. Fullwood, Rajiv L. Gupta, Amy Gutmann, JoAnn Heffernan Heisen, F. Joseph Loughrey, André F. Perold, Alfred M. Rankin, Jr., and Peter F. Volanakis.
Item 6: Investments.
Not Applicable.
Item 7: Disclosure of Proxy Voting Policies and Procedures for Closed-End Management Investment Companies.
Not Applicable.
Item 8: Portfolio Managers of Closed-End Management Investment Companies.
Not Applicable.
Item 9: Purchase of Equity Securities by Closed-End Management Investment Company and Affiliated Purchasers.
Not Applicable.
Item 10: Submission of Matters to a Vote of Security Holders.
Not Applicable.
Item 11: Controls and Procedures.
(a) Disclosure Controls and Procedures. The Principal Executive and Financial Officers concluded that the Registrant's Disclosure Controls and Procedures are effective based on their evaluation of the Disclosure Controls and Procedures as of a date within 90 days of the filing date of this report.
(b) Internal Control Over Financial Reporting. There were no significant changes in Registrant’s Internal Control Over Financial Reporting or in other factors that could significantly affect this control subsequent to the date of the evaluation, including any corrective actions with regard to significant deficiencies and material weaknesses.
Item 12: Exhibits.
(a) Code of Ethics.
(b) Certifications.
Pursuant to the requirements of the Securities Exchange Act of 1934 and the Investment Company Act of 1940, the registrant has duly caused this report to be signed on its behalf by the undersigned, thereunto duly authorized.
| |
| | VANGUARD SPECIALIZED FUNDS |
| |
| By: | /s/ F. WILLIAM MCNABB III* |
| | F. WILLIAM MCNABB III |
| | CHIEF EXECUTIVE OFFICER |
| |
| Date: March 21, 2012 |
Pursuant to the requirements of the Securities Exchange Act of 1934 and the Investment Company Act of 1940, this report has been signed below by the following persons on behalf of the registrant and in the capacities and on the dates indicated.
| |
| | VANGUARD SPECIALIZED FUNDS |
| |
| By: | /s/ F. WILLIAM MCNABB III* |
| | F. WILLIAM MCNABB III |
| | CHIEF EXECUTIVE OFFICER |
| |
| Date: March 21, 2012 |
| |
| | VANGUARD SPECIALIZED FUNDS |
| |
| By: | /s/ THOMAS J. HIGGINS* |
| | THOMAS J. HIGGINS |
| | CHIEF FINANCIAL OFFICER |
| |
| Date: March 21, 2012 |
* By: /s/ Heidi Stam
Heidi Stam, pursuant to a Power of Attorney filed on November 28, 2011 see file Number 33-23444, Incorporated by Reference.