UNITED STATES
SECURITIES AND EXCHANGE COMMISSION
Washington, D.C. 20549
FORM N-CSR
CERTIFIED SHAREHOLDER REPORT
OF
REGISTERED MANAGEMENT INVESTMENT COMPANIES
| | |
| Investment Company Act file number: | 811-03916 | |
Name of Registrant: | Vanguard Specialized Funds |
Address of Registrant: | P.O. Box 2600 |
| | Valley Forge, PA 19482 |
Name and address of agent for service: | Heidi Stam, Esquire |
| | P.O. Box 876 |
| | Valley Forge, PA 19482 |
Registrant’s telephone number, including area code: (610) 669-1000 |
Date of fiscal year end: January 31 | |
Date of reporting period: February 1, 2013 – January 31, 2014 |
Item 1: Reports to Shareholders | |

Annual Report | January 31, 2014
Vanguard Energy Fund

Vanguard’s Principles for Investing Success
We want to give you the best chance of investment success. These principles,
grounded in Vanguard’s research and experience, can put you on the right path.
Goals. Create clear, appropriate investment goals.
Balance. Develop a suitable asset allocation using broadly diversified funds.
Cost. Minimize cost.
Discipline. Maintain perspective and long-term discipline.
A single theme unites these principles: Focus on the things you can control.
We believe there is no wiser course for any investor.
| |
| Contents | |
| Your Fund’s Total Returns. | 1 |
| Chairman’s Letter. | 2 |
| Advisors’ Report. | 9 |
| Fund Profile. | 13 |
| Performance Summary. | 15 |
| Financial Statements. | 17 |
| Your Fund’s After-Tax Returns. | 31 |
| About Your Fund’s Expenses. | 32 |
| Glossary. | 34 |
Please note: The opinions expressed in this report are just that—informed opinions. They should not be considered promises or advice.
Also, please keep in mind that the information and opinions cover the period through the date on the front of this report. Of course, the
risks of investing in your fund are spelled out in the prospectus.
See the Glossary for definitions of investment terms used in this report.
About the cover: The ship’s wheel represents leadership and guidance, essential qualities in navigating difficult seas.
This one is a replica based on an 18th-century British vessel. The HMSVanguard, another ship of that era, served as the
flagship for British Admiral Horatio Nelson when he defeated a French fleet at the Battle of the Nile.
Your Fund’s Total Returns
| |
| Fiscal Year Ended January 31, 2014 | |
| |
| | Total |
| | Returns |
| Vanguard Energy Fund | |
| Investor Shares | 5.88% |
| Admiral™ Shares | 5.94 |
| MSCI ACWI Energy Index | 0.74 |
| Global Natural Resources Funds Average | 2.40 |
| Global Natural Resources Funds Average: Derived from data provided by Lipper, a Thomson Reuters Company. |
Admiral Shares carry lower expenses and are available to investors who meet certain account-balance requirements.
| | | | |
| Your Fund’s Performance at a Glance | | | | |
| January 31, 2013, Through January 31, 2014 | | | | |
| | | | Distributions Per Share |
| | Starting | Ending | | |
| | Share | Share | Income | Capital |
| | Price | Price | Dividends | Gains |
| Vanguard Energy Fund | | | | |
| Investor Shares | $62.66 | $63.85 | $1.277 | $1.237 |
| Admiral Shares | 117.63 | 119.83 | 2.500 | 2.321 |
1

Chairman’s Letter
Dear Shareholder,
Vanguard Energy Fund returned almost 6% for the 12 months ended January 31, 2014. A January pullback by the U.S. stock market in general—and energy stocks in particular—cut the fund’s fiscal-year return almost in half.
Still, the fund’s larger allocation to some U.S.-based oil and gas exploration companies helped it outpace the 0.74% return of its benchmark index. Your fund also maintained its edge over its global natural resource peer funds, whose average return was 2.40%. Many of those peer funds have significant allocations to sectors other than energy, such as materials, which lagged.
The energy sector lagged the broad U.S. stock market for the third consecutive year. Investors looked favorably on companies involved in the shale oil and gas production boom in North Dakota, Pennsylvania, and elsewhere in the United States. But forecasts of slower growth in global energy demand have tempered the outlook for the sector.
If you invest in the Energy Fund through a taxable account, you may wish to review information about the fund’s after-tax performance provided later in this report.
U.S. stocks found a groove before recent volatility
After delivering exceptional returns in 2013, U.S. stocks slid in January because of economic concerns at home and abroad.
2
Nevertheless, U.S. stocks produced impressive gains of nearly 23% for the 12 months ended January 31.
Strong corporate earnings growth and investors’ willingness to pay for those earnings drove stock markets, with support from the Federal Reserve’s stimulative bond-buying program. The Fed, noting the economy’s improvement, began paring back its bond purchases in January (and announced that it would continue tapering in February).
Overall, international stocks advanced about 6% for the 12 months, with the developed markets of Europe and the Pacific region posting positive returns. Concerns about China’s slower growth and tighter U.S. monetary policy were among the factors that hurt stocks and currencies in various emerging-market countries.
For 2014, Vanguard Chief Economist Joe Davis and his team are guarded in their outlook for global stock returns, and their forecast for the bond market remains muted. Although Joe readily acknowledges that such forecasts are accompanied by uncertainty, he writes, “We believe that a long-term, strategic approach with a balanced, diversified, low-cost portfolio can remain a high-value proposition in the decade ahead.” (You can read more about our expectations for bond and stock returns in Vanguard’s Economic and Investment Outlook, available at vanguard.com/research.)
| | | |
| Market Barometer | | | |
| |
| | Average Annual Total Returns |
| | Periods Ended January 31, 2014 |
| | One | Three | Five |
| | Year | Years | Years |
| Stocks | | | |
| Russell 1000 Index (Large-caps) | 22.23% | 14.14% | 19.84% |
| Russell 2000 Index (Small-caps) | 27.03 | 14.69 | 22.26 |
| Russell 3000 Index (Broad U.S. market) | 22.60 | 14.18 | 20.03 |
| FTSE All-World ex US Index (International) | 5.78 | 3.37 | 14.38 |
| |
| Bonds | | | |
| Barclays U.S. Aggregate Bond Index (Broad taxable market) | 0.12% | 3.73% | 4.93% |
| Barclays Municipal Bond Index (Broad tax-exempt market) | -1.07 | 5.76 | 5.54 |
| Citigroup Three-Month U.S. Treasury Bill Index | 0.05 | 0.06 | 0.09 |
| |
| CPI | | | |
| Consumer Price Index | 1.58% | 2.03% | 2.07% |
3
Bond returns were flat as the Fed firmed its strategy
Investors spurned bonds for most of the 12-month period, wary of the Fed’s expected curtailment of its bond-buying program. In January, however, despite the start of that tapering, fixed income investments regained appeal as stocks slumped.
The broad U.S. taxable bond market returned 0.12% for the fiscal year, while municipal bonds returned –1.07%. The yield of the benchmark 10-year Treasury note generally increased during the period, eclipsing 3.00% at times, and finished at about 2.70%. (Bond prices and yields move in opposite directions.) The Fed’s continued target of 0%–0.25% for short-term interest rates tightly restricted returns of money market funds and savings accounts.
International bond markets (as measured by the Barclays Global Aggregate Index ex USD) returned –1.24%.
Some integrated giants stalled, other energy businesses advanced Higher natural gas prices made news in January, when much of the United States was in the grip of a deep freeze; prices ended the fiscal year higher than where they began. In contrast, crude oil prices
| | | |
| Expense Ratios | | | |
| Your Fund Compared With Its Peer Group | | | |
| | Investor | Admiral | Peer Group |
| | Shares | Shares | Average |
| Energy Fund | 0.31% | 0.26% | 1.34% |
The fund expense ratios shown are from the prospectus dated May 28, 2013, and represent estimated costs for the current fiscal year. For the
fiscal year ended January 31, 2014, the fund’s expense ratios were 0.38% for Investor Shares and 0.32% for Admiral Shares. This increase
from the estimated expense ratio reflects a performance-based investment advisory fee adjustment. When the performance adjustment is
positive, the fund’s expenses increase; when it is negative, expenses decrease. The peer-group expense ratio is derived from data provided
by Lipper, a Thomson Reuters Company, and captures information through year-end 2013.
Peer group: Global Natural Resources Funds.
4
rose at times over the fiscal year amid concerns about strife in the Middle East and Sudan (an oil producer), but ended the period near where they began. These price trends were reflected in varying degrees in the performance of the fund’s holdings.
The returns of exploration and production companies and of integrated oil and gas giants, which together represented more than three-quarters of the fund’s average assets, diverged notably. Explorers and producers, especially U.S. firms that rank among the fund’s top-ten holdings, sprinted ahead of the less-nimble global giants during the first half of the fiscal year.
They then widened their lead—buoyed in part by strong prices and optimism about U.S. production trends. The fund’s oil and gas exploration and production holdings returned almost 13% as a group, with individual company returns approaching 50% or more.
At the other end of the results scale, the major international oil and gas companies as a group were about flat for the year. Some of the fund’s largest holdings posted modest gains, but many emerging-market firms struggled amid the downdraft in developing markets and concern about growth prospects.
| |
| Total Returns | |
| Ten Years Ended January 31, 2014 | |
| | Average |
| | Annual Return |
| Energy Fund Investor Shares | 12.57% |
| Spliced Energy Index | 10.01 |
| Global Natural Resources Funds Average | 8.73 |
For a benchmark description, see the Glossary.
Global Natural Resources Funds Average: Derived from data provided by Lipper, a Thomson Reuters Company.
The figures shown represent past performance, which is not a guarantee of future results. (Current performance may be
lower or higher than the performance data cited. For performance data current to the most recent month-end, visit our
website at vanguard.com/performance.) Note, too, that both investment returns and principal value can fluctuate widely, so
an investor’s shares, when sold, could be worth more or less than their original cost.
5
|
| Beware of chasing a sector’s ups and downs |
| |
| Funds that focus on a single sector—as Vanguard Energy Fund does—can be more volatile |
| than more broadly diversified funds. Sector funds can soar one year and plunge the next. |
| This tendency toward volatility can stir up investors’ worst instincts, tempting them to |
| invest during times of strong performance and to bail as prices inevitably recede. |
| |
| As we all know, buying high and selling low hurts performance. Because many sector fund |
| investors do fall prey to the temptation to jump in and out of the market, the average annual |
| return experienced by sector fund investors (the “investor return”) is often lower than the |
| average annual total return of the funds themselves over the same period.1 |
| |
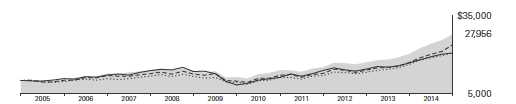
| The chart below will give you an idea of the price that sector fund investors can pay for chasing |
| performance. It compares the average annual total returns for U.S. energy funds with the |
| average annual investor returns for these funds for recent three-, five-, and ten-year periods. |
| |
| While sector funds can play a valuable supplemental role in your portfolio, you shouldn’t let |
| their inherent volatility affect your level of investment in them. |
| |
| Energy funds: Their returns vs. their investors’ returns |
| Periods ended December 31, 2013 |
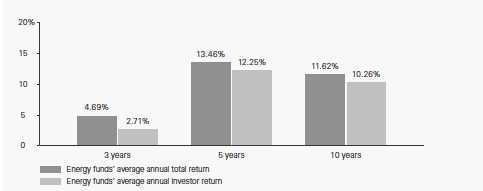
| Notes: Fund averages assume all distributions were reinvested. All returns were calculated on a month-end basis. |
| Source: Vanguard calculations, derived from data provided by Morningstar, Inc. |
| |
| |
| 1 The investor return is based on a money-weighted calculation that takes into account the timing of investors’ cash inflows |
| and outflows. |
Compared with the benchmark index, the Energy Fund’s advisors added the most value with their choices of U.S. exploration and production companies. Refiners and marketers, as well as providers of equipment and services, also lifted relative returns, which were held back by some integrated multinationals.
The Advisors’ Report that follows this letter provides additional details about the management of the fund during the fiscal year.
Discipline and focus produced strong long-term results
The Energy Fund’s long-term performance continued to impress. For the ten years ended January 31, 2014, the average annual return of Investor Shares was 12.57%, more than 2 percentage points ahead of the benchmark index and almost 4 percentage points ahead of peer funds. Your fund also outperformed the broad U.S. stock market by about 5 percentage points.
In May, Vanguard Energy Fund will mark its 30th anniversary. Since its inception, the fund has been ably guided by Wellington Management Company. I thank Wellington for its ongoing distinguished service, dedication, and expertise. (Since 2005, a portion of the fund has also been managed by Vanguard Equity Investment Group.)
When traveling a long, bumpy road, be sure to pack some patience
Over time, even a small degree of outperformance can meaningfully affect a portfolio’s value. That’s why many investors remain drawn to active management—they want the opportunity for market-beating returns, even though considerable research has shown that only a minority of active managers consistently outperform their benchmarks.
Long-term outperformance is uncommon largely because active management tends to be costlier than indexing. The higher a fund’s expense ratio, the higher the hurdle it must overcome to beat its benchmark after accounting for expenses.
For investors, impatience can create a still higher hurdle. Even managers with the best market-beating records can’t avoid short periods of underperformance. An investor who is unwilling to endure some lean years could unwisely abandon a talented manager and miss out on long-term rewards. (You can read more in The Bumpy Road to Outperformance, available at vanguard.com/research.)
7
That’s why Vanguard recommends that you pay attention to costs and take a patient, long-term view. Vanguard does its part to try to give investors the best chance for success by offering access to world-class active managers and by operating our funds at costs well below industry averages.
As always, thank you for investing with Vanguard.
Sincerely,

F. William McNabb III
Chairman and Chief Executive Officer
February 13, 2014
8
Advisors’ Report
Vanguard Energy Fund returned 5.88% for Investor Shares and 5.94% for Admiral Shares in the fiscal year ended January 31, 2014, ahead of the 0.74% return of its benchmark index and the 2.40% average return of global natural resources peer funds. Your fund is managed by two advisors, a strategy that can enhance the fund’s diversification by providing exposure to distinct yet complementary investment approaches. It’s not uncommon for different advisors to have different views about individual securities or the broader investment environment.
The advisors, the amount and percentage of fund assets each manages, and brief descriptions of their investment strategies are presented in the table below. The advisors have also provided a discussion of the investment environment that existed during the year and of how their portfolio positioning reflects this assessment. These reports were prepared on February 12, 2014.
Wellington Management Company, llp
Portfolio Manager:
Karl E. Bandtel, Senior Vice President
The investment environment
Global equities advanced during the fiscal year ended January 31, 2014. Despite liquidity concerns in China and tepid economic growth in Europe, investors were emboldened by signs of stronger
| | | |
| Vanguard Energy Fund Investment Advisors | |
| |
| | Fund Assets Managed | |
| Investment Advisor | % | $ Million | Investment Strategy |
| Wellington Management | 95 | 11,112 | Emphasizes long-term total-return opportunities from |
| Company, LLP | | | the various energy subsectors: international oils, |
| | | | foreign integrated oils and foreign producers, North |
| | | | American producers, oil services and equipment, |
| | | | transportation and distribution, and refining and |
| | | | marketing. |
| Vanguard Equity Investment | 3 | 390 | Employs a quantitative fundamental management |
| Group | | | approach, using models that assess valuation, |
| | | | management decisions, market sentiment, and |
| | | | earnings and balance-sheet quality of companies as |
| | | | compared with their peers. |
| Cash Investments | 2 | 176 | These short-term reserves are invested by Vanguard in |
| | | | equity index products to simulate investments in stock. |
| | | | Each advisor may also maintain a modest cash |
| | | | position. |
9
growth in the United States and Japan. U.S. stock returns were particularly strong, and more volatile smaller-company stocks led the way. Emerging-market stocks trailed their developed-market counterparts. As a group, stocks in the global energy sector finished roughly where they started, lagging the approximately 13% return of the broad MSCI All Country World Index.
Energy commodity spot price movements were mixed. The price of West Texas Intermediate (WTI) crude oil (a benchmark based on oil produced domestically) was flat for the period, closing at $98 per barrel. However, the spread between Brent (a benchmark based on oil produced outside the United States) and WTI crude oil prices narrowed, as Brent declined from $116 to $108 per barrel. Henry Hub natural gas prices rose from $3.33 to just over $5 per million Btu. In our view, the market does not fully appreciate the long-term natural gas demand story, and we expect that the prospect of increased demand in the next few years will support healthy prices.
Our successes
Stock selection within the oil and gas sub-sector was the key driver of our success. We also benefited from favorable security selection within the energy equipment and services subsector.
Top individual contributors included Cabot Oil & Gas, Pioneer Natural Resources, EQT, EOG Resources, and Baker Hughes, all based in the United States. In fact, nine of our top 10 absolute contributors during this period were stocks of U.S.-domiciled companies.
Pioneer Natural Resources is engaged in oil and gas exploration and production. The company has unconventional oil production sources in the Permian Basin in the U.S. Southwest, and recent appraisal drilling gave reason for optimism about the size and quality of these reserves. This bolstered investor confidence, supporting the company’s stock price.
We are optimistic about the company’s growth prospects, and we increased our position.
EOG Resources is an exploration and production company focused primarily in North America. EOG has a strong asset portfolio, and reserves could be significantly higher than current estimates. The company’s focus on organic growth, operational efficiency, and cost control has resulted in strong profitability metrics, yet the shares remain attractively priced in our view. We added to our position during the period.
Our shortfalls
Our most significant detractors during the period included Petrobras (Brazil), PetroChina (China), Cenovus Energy (Canada), Inpex (Japan), and Cobalt International Energy (United States).
Petrobras, an integrated oil and gas company, experienced production delays related to the deployment of drilling platforms. That, coupled with a broader sell-off across emerging markets (Brazil in particular), depressed the stock. We believe that production growth will improve and accelerate into 2014. We expect that
10
downstream retail margins, previously disappointing, should also improve to more normal levels. We continue to hold our position.
Cobalt International Energy is an oil-focused exploration and production company. Following disappointing drilling results this summer, Cobalt’s stock price remained under pressure as investors maintained high expectations for the company. We are closely monitoring important prospects and appraisals that could be significant catalysts for the stock, and maintain a position.
The fund’s positioning
Our long-term outlook for the energy sector remains favorable. However, as always, we urge caution regarding the near-term direction of commodity prices and, by extension, the inherent volatility that accompanies investing in stocks of energy companies.
Over time, we believe that substituting natural gas for coal—in North America and overseas—is a significant opportunity for patient investors. Such substitutions, combined with the impact of several projects under way to enable the export of U.S. natural gas, are likely to keep narrowing the wide disparity between global energy prices and North American natural gas prices.
We hold stocks domiciled in 14 countries. Over 35% of the portfolio’s assets are invested in international stocks (including roughly 5% in emerging markets), and we will probably seek opportunities to increase
this exposure as we pare back positions in North America on the margin and redeploy the proceeds into investments with more attractive valuations.
Our portfolio remains skewed toward low-cost producers with compelling valuations, based on our assessment of their long-term resource bases. We believe many of these companies are able to create value for shareholders absent generally rising commodity prices.
Our low-turnover investment process remains steady with an emphasis on finding mid- and large-capitalization integrated oil and exploration and production companies that are attractively valued. We will continue to focus on stocks of companies that have clean balance sheets, long-lived resources, and high-quality management teams.
Vanguard Equity Investment Group
Portfolio Managers:
James D. Troyer, CFA, Principal
James P. Stetler, Principal
Michael R. Roach, CFA
Generally, the fiscal year was a weak period for energy stocks; the fund’s benchmark underperformed the broad global equity market (as represented by the MSCI All Country World Index) in each of the four quarters. The first quarter’s relative performance was the weakest: The fund’s benchmark lagged by more than 6 percentage points.
11
From a macroeconomic perspective, the changing of the guard at the Federal Reserve created market volatility because of uncertainty about its approach to monetary policy, leading to sharp fluctuations in interest rates. Emerging markets have been under pressure because of the Fed’s tapering and slowing economic growth. As a result, the demand for commodities has been relatively flat. Crude oil prices in the United States finished the year nearly unchanged. All these factors led to a relatively weak performance by the energy stocks throughout this reporting period.
We use a quantitative approach to investing that focuses on specific stock fundamentals. We do not take a stand on the overall market for energy stocks. In addition, we do not attempt to make predictions on different geographic regions. We focus our investment process on identifying stocks that we believe are undervalued based on our multi-signal model.
Over the period ended January 31, our most successful overweighted holdings included the following: in the United States, First Solar (+80%), Noble Energy (+17%), and Chesapeake Energy (+35%); in Japan, Showa Shell Sekiyu K.K. (+93%); and in China, China Oilfield Services Limited Class H (+27%). Our performance was aided significantly by our ability to underweight exposures that did not do as well, such as Ecopetrol SA (–34%) in Colombia and PetroChina Co. Ltd. Class H (–29%) in China.
Our results were hurt by overweighting Tatneft (–21%) and Rosneft (–19%) in Russia; PTT Public (–16%) in Thailand; and Turkiye Petrol Rafinerileri (–36%) in Turkey and by underweighting U.S.-based Pioneer Natural Resources (+44%).
Although exceptional performance by the broad stock market did not translate into a very robust year for energy stocks, our model was able to effectively capture a spread between overvalued and undervalued energy stocks. While it is difficult to predict the direction of the sector returns, we are confident that our model should continue to capture the relative attractiveness of individual stocks. Attractive fundamentals remain one of the main drivers of our strategy, which the market should reward in the long run. We thank you for your investment and look forward to the next productive fiscal year.
12
Energy Fund
Fund Profile
As of January 31, 2014
| | |
| Share-Class Characteristics | |
| | Investor | Admiral |
| | Shares | Shares |
| Ticker Symbol | VGENX | VGELX |
| Expense Ratio1 | 0.31% | 0.26% |
| 30-Day SEC Yield | 1.79% | 1.85% |
| | | |
| Portfolio Characteristics | | |
| | | | DJ |
| | | | U.S. |
| | | | Total |
| | | MSCI | Market |
| | | ACWI | FA |
| | Fund | Energy | Index |
| Number of Stocks | 124 | 168 | 3,635 |
| Median Market Cap | $42.9B | $70.6B | $41.3B |
| Price/Earnings Ratio | 14.0x | 12.0x | 19.1x |
| Price/Book Ratio | 1.7x | 1.5x | 2.6x |
| Return on Equity | 12.8% | 15.4% | 16.5% |
| Earnings Growth | | | |
| Rate | -0.8% | 2.7% | 11.4% |
| Dividend Yield | 2.2% | 3.1% | 1.9% |
| Foreign Holdings | 35.6% | 49.4% | 0.0% |
| Turnover Rate | 17% | — | — |
| Short-Term Reserves | 2.9% | — | — |
| | |
| Volatility Measures | | |
| | | DJ |
| | MSCI | U.S. Total |
| | ACWI | Market |
| | Energy | FA Index |
| R-Squared | 0.98 | 0.80 |
| Beta | 1.04 | 1.39 |
| These measures show the degree and timing of the fund’s fluctuations compared with the indexes over 36 months. |
| | |
| Ten Largest Holdings (% of total net assets) |
| Exxon Mobil Corp. | Integrated Oil & Gas | 8.8% |
| Royal Dutch Shell plc | Integrated Oil & Gas | 5.0 |
| Chevron Corp. | Integrated Oil & Gas | 4.9 |
| Schlumberger Ltd. | Oil & Gas Equipment | |
| | & Services | 4.0 |
| BP plc | Integrated Oil & Gas | 3.7 |
| Total SA | Integrated Oil & Gas | 3.3 |
| Pioneer Natural | Oil & Gas Exploration | |
| Resources Co. | & Production | 3.2 |
| Cabot Oil & Gas Corp. | Oil & Gas Exploration | |
| | & Production | 3.0 |
| EOG Resources Inc. | Oil & Gas Exploration | |
| | & Production | 2.9 |
| CONSOL Energy Inc. | Coal & Consumable | |
| | Fuels | 2.4 |
| Top Ten | | 41.2% |
| The holdings listed exclude any temporary cash investments and equity index products. |
1 The expense ratios shown are from the prospectus dated May 28, 2013, and represent estimated costs for the current fiscal year. For the fiscal
year ended January 31, 2014, the expense ratios were 0.38% for Investor Shares and 0.32% for Admiral Shares.
13
Energy Fund
| |
| Market Diversification (% of equity exposure) |
| |
| Europe | |
| United Kingdom | 11.0% |
| France | 3.8 |
| Italy | 2.1 |
| Other | 2.5 |
| Subtotal | 19.4% |
| Pacific | |
| Japan | 1.6% |
| Other | 0.5 |
| Subtotal | 2.1% |
| Emerging Markets | |
| China | 2.0% |
| Russia | 1.9 |
| Brazil | 1.1 |
| Other | 0.8 |
| Subtotal | 5.8% |
| North America | |
| United States | 63.6% |
| Canada | 9.1 |
| Subtotal | 72.7% |
| | |
| Subindustry Diversification (% of equity exposure) | |
| | | MSCI |
| | | ACWI |
| | Fund | Energy |
| Coal & Consumable Fuels | 3.0% | 1.3% |
| Industrials | 0.1 | 0.0 |
| Integrated Oil & Gas | 43.4 | 53.3 |
| Oil & Gas Drilling | 1.1 | 2.3 |
| Oil & Gas Equipment & | | |
| Services | 10.2 | 10.2 |
| Oil & Gas Exploration & | | |
| Production | 33.8 | 21.1 |
| Oil & Gas Refining & | | |
| Marketing | 6.0 | 6.0 |
| Oil & Gas Storage & | | |
| Transportation | 1.4 | 5.8 |
| Other | 1.0 | 0.0 |
14
Energy Fund
Performance Summary
All of the returns in this report represent past performance, which is not a guarantee of future results that may be achieved by the fund. (Current performance may be lower or higher than the performance data cited. For performance data current to the most recent month-end, visit our website at vanguard.com/performance.) Note, too, that both investment returns and principal value can fluctuate widely, so an investor’s shares, when sold, could be worth more or less than their original cost. The returns shown do not reflect taxes that a shareholder would pay on fund distributions or on the sale of fund shares.
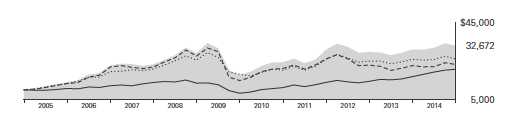
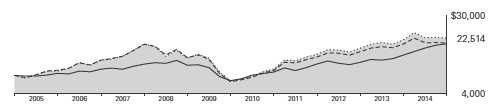
Cumulative Performance: January 31, 2004, Through January 31, 2014
Initial Investment of $10,000
| | | | | |
| | | Average Annual Total Returns | |
| | | Periods Ended January 31, 2014 | |
| | | | | | Final Value |
| | | One | Five | Ten | of a $10,000 |
| | | Year | Years | Years | Investment |
| | Energy Fund*Investor Shares | 5.88% | 12.93% | 12.57% | $32,672 |
| •••••••• | Spliced Energy Index | 0.74 | 7.64 | 10.01 | 25,969 |
| – – – – | Global Natural Resources Funds | | | | |
| | Average | 2.40 | 9.31 | 8.73 | 23,099 |
| | Dow Jones U.S. Total Stock Market | | | | |
| | Float Adjusted Index | 22.53 | 20.13 | 7.51 | 20,637 |
| For a benchmark description, see the Glossary. |
| Global Natural Resources Funds Average: Derived from data provided by Lipper, a Thomson Reuters Company. |
| | | | |
| | | | | Final Value |
| | One | Five | Ten | of a $50,000 |
| | Year | Years | Years | Investment |
| Energy Fund Admiral Shares | 5.94% | 13.00% | 12.64% | $164,438 |
| Spliced Energy Index | 0.74 | 7.64 | 10.01 | 129,847 |
| Dow Jones U.S. Total Stock Market Float | | | | |
| Adjusted Index | 22.53 | 20.13 | 7.51 | 103,186 |
See Financial Highlights for dividend and capital gains information.
15
Energy Fund
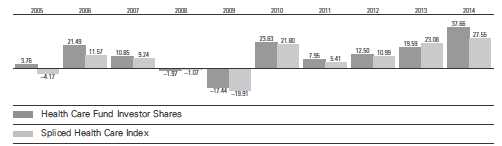
Fiscal-Year Total Returns (%): January 31, 2004, Through January 31, 2014
For a benchmark description, see the Glossary.
Average Annual Total Returns: Periods Ended December 31, 2013
This table presents returns through the latest calendar quarter—rather than through the end of the fiscal period.
Securities and Exchange Commission rules require that we provide this information.
| | | | |
| | Inception | One | Five | Ten |
| | Date | Year | Years | Years |
| Investor Shares | 5/23/1984 | 18.14% | 13.34% | 13.22% |
| Admiral Shares | 11/12/2001 | 18.22 | 13.41 | 13.29 |
16
Energy Fund
Financial Statements
Statement of Net Assets
As of January 31, 2014
The fund reports a complete list of its holdings in regulatory filings four times in each fiscal year, at the quarter-ends. For the second and fourth fiscal quarters, the lists appear in the fund’s semiannual and annual reports to shareholders. For the first and third fiscal quarters, the fund files the lists with the Securities and Exchange Commission on Form N-Q. Shareholders can look up the fund’s Forms N-Q on the SEC’s website at sec.gov. Forms N-Q may also be reviewed and copied at the SEC’s Public Reference Room (see the back cover of this report for further information).
| | | |
| | | | Market |
| | | | Value |
| | | Shares | ($000) |
| Common Stocks (96.0%)1 | | |
| United States (60.4%) | | |
| Energy Equipment & Services (10.5%) | |
| | Schlumberger Ltd. | 5,349,319 | 468,440 |
| | Baker Hughes Inc. | 4,858,970 | 275,212 |
| | Halliburton Co. | 3,846,172 | 188,501 |
| | Ensco plc Class A | 2,366,024 | 119,177 |
| | National Oilwell Varco | | |
| | Inc. | 1,155,496 | 86,674 |
| * | SEACOR Holdings Inc. | 875,753 | 73,721 |
| | Transocean Ltd. | 85,330 | 3,693 |
| * | Weatherford International | | |
| | Ltd. | 225,400 | 3,052 |
| | Patterson-UTI Energy Inc. | 105,200 | 2,702 |
| | | | 1,221,172 |
| Oil, Gas & Consumable Fuels (49.5%) | |
| | Coal & Consumable Fuels (2.4%) | |
| | CONSOL Energy Inc. | 7,556,085 | 282,220 |
| |
| | Integrated Oil & Gas (16.5%) | |
| | Exxon Mobil Corp. | 11,131,244 | 1,025,855 |
| | Chevron Corp. | 5,176,740 | 577,880 |
| | Occidental Petroleum | | |
| | Corp. | 2,860,323 | 250,478 |
| | Hess Corp. | 892,039 | 67,340 |
| |
| | Oil & Gas Exploration & Production (26.0%) |
| | Pioneer Natural | | |
| | Resources Co. | 2,188,865 | 370,619 |
| | Cabot Oil & Gas Corp. | 8,652,714 | 345,935 |
| | EOG Resources Inc. | 2,080,741 | 343,822 |
| | Range Resources Corp. | 3,151,190 | 271,601 |
| | Anadarko Petroleum | | |
| | Corp. | 2,959,000 | 238,762 |
| | EQT Corp. | 2,348,870 | 217,999 |
| | Noble Energy Inc. | 2,964,978 | 184,807 |
| | | |
| * | Southwestern Energy Co. | 4,377,085 | 178,104 |
| * | Denbury Resources Inc. | 8,530,204 | 137,080 |
| | ConocoPhillips | 2,057,809 | 133,655 |
| | Devon Energy Corp. | 1,702,625 | 100,829 |
| | Energen Corp. | 1,338,117 | 94,632 |
| | Apache Corp. | 850,250 | 68,241 |
| * | Cobalt International | | |
| | Energy Inc. | 4,071,172 | 66,645 |
| * | Whiting Petroleum Corp. | 1,085,355 | 63,363 |
| * | Newfield Exploration Co. | 2,445,858 | 60,584 |
| | Marathon Oil Corp. | 1,790,746 | 58,718 |
| * | Antero Resources Corp. | 766,205 | 45,007 |
| | Murphy Oil Corp. | 693,800 | 39,276 |
| * | Rice Energy Inc. | 625,700 | 14,716 |
| | Chesapeake Energy Corp. | 161,300 | 4,340 |
| * | Ultra Petroleum Corp. | 114,100 | 2,733 |
| | Cimarex Energy Co. | 2,900 | 284 |
| |
| | Oil & Gas Refining & Marketing (4.6%) |
| | Valero Energy Corp. | 3,702,684 | 189,207 |
| | Phillips 66 | 2,395,184 | 175,064 |
| | Marathon Petroleum | | |
| | Corp. | 1,988,150 | 173,069 |
| |
| | Oil & Gas Storage & Transportation (0.0%) |
| | Williams Cos. Inc. | 30,900 | 1,251 |
| | Kinder Morgan Inc. | 24,573 | 836 |
| | | | 5,784,952 |
| Other (0.4%) | | |
| ^,2 | Vanguard Energy ETF | 363,000 | 43,103 |
| |
| Semiconductors & | | |
| Semiconductor Equipment (0.0%) | |
| * | First Solar Inc. | 47,850 | 2,420 |
| Total United States | | 7,051,647 |
17
Energy Fund
| | | |
| | | | Market |
| | | | Value |
| | | Shares | ($000) |
| International (35.6%) | | |
| Australia (0.5%) | | |
| | Oil Search Ltd. | 7,880,526 | 55,385 |
| | Woodside Petroleum Ltd. | 137,420 | 4,481 |
| | Caltex Australia Ltd. | 131,971 | 2,231 |
| | | | 62,097 |
| Austria (0.0%) | | |
| | OMV AG | 61,211 | 2,648 |
| |
| Brazil (1.1%) | | |
| | Petroleo Brasileiro SA | | |
| | ADR | 10,710,075 | 120,060 |
| | Petroleo Brasileiro SA | | |
| | Prior Pfd. | 385,244 | 2,329 |
| | Petroleo Brasileiro SA | 249,132 | 1,405 |
| | Petroleo Brasileiro SA | | |
| | ADR Type A | 3,950 | 47 |
| | | | 123,841 |
| Canada (8.8%) | | |
| | Suncor Energy Inc. XNYS | 6,858,682 | 225,170 |
| | Canadian Natural | | |
| | Resources Ltd. XNYS | 5,263,443 | 172,378 |
| | Enbridge Inc. XTSE | 3,623,600 | 152,155 |
| | Cenovus Energy Inc. | | |
| | XTSE | 5,084,180 | 132,951 |
| | Encana Corp. XNYS | 6,104,390 | 109,696 |
| * | Tourmaline Oil Corp. | 2,090,870 | 88,403 |
| | Pacific Rubiales Energy | | |
| | Corp. | 4,928,495 | 74,918 |
| | Cameco Corp. | 2,573,670 | 54,613 |
| | Suncor Energy Inc. XTSE | 249,134 | 8,185 |
| | Canadian Natural | | |
| | Resources Ltd. XTSE | 200,678 | 6,580 |
| | Enbridge Inc. XYNS | 52,350 | 2,198 |
| | Encana Corp. XTSE | 106,100 | 1,907 |
| | TransCanada Corp. | 41,996 | 1,826 |
| | Cenovus Energy Inc. | | |
| | XNYS | 21,139 | 553 |
| | Husky Energy Inc. | 9,500 | 282 |
| | Canadian Oil Sands Ltd. | 15,700 | 282 |
| | Penn West Petroleum Ltd. | 27,900 | 209 |
| | | | 1,032,306 |
| China (1.9%) | | |
| ^ | PetroChina Co. Ltd. ADR | 1,576,895 | 151,240 |
| | Kunlun Energy Co. Ltd. | 37,747,555 | 62,186 |
| | China Petroleum | | |
| | & Chemical Corp. | 5,907,600 | 4,649 |
| * | GCL-Poly Energy | | |
| | Holdings Ltd. | 7,465,000 | 2,542 |
| | China Longyuan | | |
| | Power Group Corp. | 2,044,000 | 2,434 |
| | CNOOC Ltd. | 887,717 | 1,373 |
| | PetroChina Co. Ltd. | 770,000 | 739 |
| | | | 225,163 |
| | | |
| Finland (0.0%) | | |
| ^ | Neste Oil Oyj | 122,111 | 2,178 |
| |
| France (3.7%) | | |
| | Total SA ADR | 6,428,920 | 367,542 |
| | Technip SA | 583,816 | 49,726 |
| | Total SA | 290,072 | 16,564 |
| | | | 433,832 |
| Hong Kong (0.0%) | | |
| * | Brightoil Petroleum | | |
| | Holdings Ltd. | 1,494,000 | 404 |
| |
| Hungary (0.0%) | | |
| | MOL Hungarian Oil | | |
| | & Gas plc | 33,756 | 2,071 |
| |
| India (0.7%) | | |
| | Reliance Industries Ltd. | 5,656,658 | 75,118 |
| | Cairn India Ltd. | 449,366 | 2,323 |
| | Bharat Petroleum Corp. | | |
| | Ltd. | 302,008 | 1,750 |
| | | | 79,191 |
| Israel (0.0%) | | |
| | Paz Oil Co. Ltd. | 7,768 | 1,150 |
| * | Oil Refineries Ltd. | 1,715,759 | 489 |
| | | | 1,639 |
| Italy (2.1%) | | |
| ^ | Eni SPA ADR | 5,126,205 | 232,730 |
| | Eni SPA | 395,517 | 8,962 |
| | | | 241,692 |
| Japan (1.6%) | | |
| | Inpex Corp. | 10,910,400 | 128,362 |
| | JX Holdings Inc. | 10,593,570 | 50,888 |
| * | Cosmo Oil Co. Ltd. | 1,221,000 | 2,273 |
| | Showa Shell Sekiyu KK | 229,300 | 2,167 |
| | | | 183,690 |
| Malaysia (0.0%) | | |
| | Petronas Dagangan Bhd. | 30,500 | 279 |
| |
| Netherlands (0.0%) | | |
| * | SBM Offshore NV | 123,968 | 2,386 |
| |
| Norway (0.9%) | | |
| | Statoil ASA ADR | 4,090,890 | 96,995 |
| | Statoil ASA | 128,174 | 3,042 |
| | | | 100,037 |
| Poland (0.0%) | | |
| | Polskie Gornictwo | | |
| | Naftowe | | |
| | i Gazownictwo SA | 1,499,525 | 2,205 |
| | Polski Koncern Naftowy | | |
| | Orlen SA | 47,146 | 582 |
| | | | 2,787 |
18
Energy Fund
| | | |
| | | | Market |
| | | | Value |
| | | Shares | ($000) |
| Portugal (0.8%) | | |
| | Galp Energia SGPS SA | 6,012,388 | 93,001 |
| |
| Russia (1.8%) | | |
| | Gazprom OAO ADR | 13,064,048 | 107,713 |
| | Rosneft OAO GDR | 13,826,431 | 94,790 |
| | Lukoil OAO ADR | 94,591 | 5,373 |
| | Tatneft OAO ADR | 82,155 | 2,717 |
| | AK Transneft OAO | | |
| | Prior Pfd. | 1,082 | 2,459 |
| | Gazprom OAO | 124,674 | 516 |
| | | | 213,568 |
| Singapore (0.0%) | | |
| | Sembcorp Industries Ltd. | 246,000 | 1,012 |
| |
| South Africa (0.1%) | | |
| | Sasol Ltd. | 110,232 | 5,298 |
| |
| South Korea (0.0%) | | |
| | SK Holdings Co. Ltd. | 15,004 | 2,509 |
| |
| Spain (0.8%) | | |
| | Repsol SA | 3,874,697 | 90,722 |
| |
| Thailand (0.1%) | | |
| | PTT PCL (Foreign) | 345,700 | 2,885 |
| | PTT Exploration & | | |
| | Production PCL (Foreign) | 608,900 | 2,745 |
| * | PTT Global Chemical PCL | 1,079,000 | 2,327 |
| | Thai Oil PCL (Foreign) | 370,900 | 592 |
| | | | 8,549 |
| Turkey (0.0%) | | |
| | Tupras Turkiye | | |
| | Petrol Rafinerileri AS | 108,194 | 1,785 |
| |
| United Kingdom (10.7%) | | |
| | Royal Dutch Shell plc | | |
| | ADR | 7,946,585 | 549,109 |
| | BP plc ADR | 8,889,185 | 416,814 |
| | BG Group plc | 9,997,141 | 167,763 |
| * | Ophir Energy plc | 13,649,538 | 62,471 |
| | BP plc | 2,616,674 | 20,505 |
| | Royal Dutch Shell plc | | |
| | Class B | 342,693 | 12,512 |
| | Royal Dutch Shell plc | | |
| | Class A | 331,089 | 11,436 |
| | Royal Dutch | | |
| | Shell plc Class A | | |
| | (Amsterdam Shares) | 174,727 | 6,038 |
| * | Essar Energy plc | 419,393 | 397 |
| * | Cairn Energy plc | 1 | — |
| | | | 1,247,045 |
| Total International | | 4,159,730 |
| Total Common Stocks | | |
| (Cost $6,820,860) | | 11,211,377 |
| | | |
| Temporary Cash Investments (4.1%)1 | |
| Money Market Fund (1.2%) | | |
| 3,4 | Vanguard Market Liquidity | |
| | Fund, 0.130% | 139,960,034 | 139,960 |
| |
| | | Face | |
| | | Amount | |
| | | ($000) | |
| Repurchase Agreement (2.8%) | |
| | RBS Securities, Inc. 0.020%, | |
| | 2/3/14 (Dated 1/31/14, | | |
| | Repurchase Value | | |
| | $329,601,000, collateralized | |
| | by U.S. Treasury Note/Bonds | |
| | 0.250%-3.250%, | | |
| | 9/30/15–7/31/18, | | |
| | with a value of | | |
| | $336,194,000) | 329,600 | 329,600 |
| |
| U.S. Government and Agency Obligations (0.1%) |
| 5,6 | Federal Home Loan | | |
| | Bank Discount Notes, | | |
| | 0.070%, 2/5/14 | 2,400 | 2,400 |
| 5,6 | Federal Home Loan | | |
| | Bank Discount Notes, | | |
| | 0.070%, 3/12/14 | 2,900 | 2,899 |
| 5,6 | Federal Home Loan | | |
| | Bank Discount Notes, | | |
| | 0.090%, 3/21/14 | 300 | 300 |
| 5,6 | Federal Home Loan | | |
| | Bank Discount Notes, | | |
| | 0.062%, 4/21/14 | 6,800 | 6,797 |
| | | | 12,396 |
| Total Temporary Cash Investments | |
| (Cost $481,959) | | 481,956 |
| Total Investments (100.1%) | | |
| (Cost $7,302,819) | | 11,693,333 |
| Other Assets and Liabilities (-0.1%) | |
| Other Assets | | 51,229 |
| Liabilities4 | | (66,736) |
| | | | (15,507) |
| Net Assets (100%) | | 11,677,826 |
19
Energy Fund
| |
| At January 31, 2014, net assets consisted of: |
| | Amount |
| | ($000) |
| Paid-in Capital | 7,275,356 |
| Overdistributed Net Investment Income | (26,108) |
| Accumulated Net Realized Gains | 42,134 |
| Unrealized Appreciation (Depreciation) | |
| Investment Securities | 4,390,514 |
| Futures Contracts | (4,012) |
| Foreign Currencies | (58) |
| Net Assets | 11,677,826 |
| |
| |
| Investor Shares—Net Assets | |
| Applicable to 64,815,764 outstanding | |
| $.001 par value shares of beneficial | |
| interest (unlimited authorization) | 4,138,303 |
| Net Asset Value Per Share— | |
| Investor Shares | $63.85 |
| |
| |
| Admiral Shares—Net Assets | |
| Applicable to 62,920,073 outstanding | |
| $.001 par value shares of beneficial | |
| interest (unlimited authorization) | 7,539,523 |
| Net Asset Value Per Share— | |
| Admiral Shares | $119.83 |
See Note A in Notes to Financial Statements.
* Non-income-producing security.
^ Includes partial security positions on loan to broker-dealers. The total value of securities on loan is $12,945,000.
1 The fund invests a portion of its cash reserves in equity markets through the use of index futures contracts. After giving effect to futures
investments, the fund’s effective common stock and temporary cash investment positions represent 97.1% and 3.0%, respectively, of net
assets.
2 Considered an affiliated company of the fund as the issuer is another member of The Vanguard Group.
3 Affiliated money market fund available only to Vanguard funds and certain trusts and accounts managed by Vanguard. Rate shown is the
7-day yield.
4 Includes $13,653,000 of collateral received for securities on loan.
5 The issuer operates under a congressional charter; its securities are generally neither guaranteed by the U.S. Treasury nor backed by the full
faith and credit of the U.S. government.
6 Securities with a value of $7,898,000 have been segregated as initial margin for open futures contracts.
ADR—American Depositary Receipt.
GDR—Global Depositary Receipt.
See accompanying Notes, which are an integral part of the Financial Statements.
20
Energy Fund
Statement of Operations
| |
| | Year Ended |
| | January 31, 2014 |
| | ($000) |
| Investment Income | |
| Income | |
| Dividends1,2 | 274,816 |
| Interest2 | 322 |
| Securities Lending | 7,177 |
| Total Income | 282,315 |
| Expenses | |
| Investment Advisory Fees—Note B | |
| Basic Fee | 17,090 |
| Performance Adjustment | 4,627 |
| The Vanguard Group—Note C | |
| Management and Administrative—Investor Shares | 8,420 |
| Management and Administrative—Admiral Shares | 8,251 |
| Marketing and Distribution—Investor Shares | 922 |
| Marketing and Distribution—Admiral Shares | 1,112 |
| Custodian Fees | 398 |
| Auditing Fees | 30 |
| Shareholders’ Reports—Investor Shares | 82 |
| Shareholders’ Reports—Admiral Shares | 27 |
| Trustees’ Fees and Expenses | 25 |
| Total Expenses | 40,984 |
| Net Investment Income | 241,331 |
| Realized Net Gain (Loss) | |
| Investment Securities Sold2 | 299,600 |
| Futures Contracts | 24,012 |
| Foreign Currencies | (811) |
| Realized Net Gain (Loss) | 322,801 |
| Change in Unrealized Appreciation (Depreciation) | |
| Investment Securities | 134,824 |
| Futures Contracts | (8,595) |
| Foreign Currencies | (78) |
| Change in Unrealized Appreciation (Depreciation) | 126,151 |
| Net Increase (Decrease) in Net Assets Resulting from Operations | 690,283 |
| 1 Dividends are net of foreign withholding taxes of $19,164,000. |
| 2 Dividend income, interest income, and realized net gain (loss) from affiliated companies of the fund were $796,000, $103,000, and |
| $4,048,000, respectively. |
See accompanying Notes, which are an integral part of the Financial Statements.
21
Energy Fund
Statement of Changes in Net Assets
| | |
| | Year Ended January 31, |
| | 2014 | 2013 |
| | ($000) | ($000) |
| Increase (Decrease) in Net Assets | | |
| Operations | | |
| Net Investment Income | 241,331 | 262,512 |
| Realized Net Gain (Loss) | 322,801 | 25,428 |
| Change in Unrealized Appreciation (Depreciation) | 126,151 | 161,584 |
| Net Increase (Decrease) in Net Assets Resulting from Operations | 690,283 | 449,524 |
| Distributions | | |
| Net Investment Income | | |
| Investor Shares | (84,107) | (114,465) |
| Admiral Shares | (153,175) | (147,695) |
| Realized Capital Gain1 | | |
| Investor Shares | (78,608) | (98,885) |
| Admiral Shares | (143,323) | (111,067) |
| Total Distributions | (459,213) | (472,112) |
| Capital Share Transactions | | |
| Investor Shares | (1,350,467) | (570,595) |
| Admiral Shares | 678,643 | 10,358 |
| Net Increase (Decrease) from Capital Share Transactions | (671,824) | (560,237) |
| Total Increase (Decrease) | (440,754) | (582,825) |
| Net Assets | | |
| Beginning of Period | 12,118,580 | 12,701,405 |
| End of Period2 | 11,677,826 | 12,118,580 |
| 1 Includes fiscal 2014 and 2013 short-term gain distributions totaling $ 6,818,000 and $0. Short-term gain distributions are treated as ordinary |
| income dividends for tax purposes. |
| 2 Net Assets—End of Period includes undistributed (overdistributed) net investment income of ($26,108,000) and ($22,363,000). |
See accompanying Notes, which are an integral part of the Financial Statements.
22
Energy Fund
Financial Highlights
| | | | | |
| Investor Shares | | | | | |
| |
| For a Share Outstanding | Year Ended January 31, |
| Throughout Each Period | 2014 | 2013 | 2012 | 2011 | 2010 |
| Net Asset Value, Beginning of Period | $62.66 | $62.60 | $69.20 | $57.17 | $42.62 |
| Investment Operations | | | | | |
| Net Investment Income | 1.291 | 1.336 | 1.072 | 1.053 | .910 |
| Net Realized and Unrealized Gain (Loss) | | | | | |
| on Investments | 2.413 | 1.098 | (3.949) | 14.103 | 14.591 |
| Total from Investment Operations | 3.704 | 2.434 | (2.877) | 15.156 | 15.501 |
| Distributions | | | | | |
| Dividends from Net Investment Income | (1.277) | (1.340) | (1.102) | (.977) | (.951) |
| Distributions from Realized Capital Gains | (1.237) | (1.034) | (2.621) | (2.149) | — |
| Total Distributions | (2.514) | (2.374) | (3.723) | (3.126) | (.951) |
| Net Asset Value, End of Period | $63.85 | $62.66 | $62.60 | $69.20 | $57.17 |
| |
| Total Return1 | 5.88% | 4.07% | -3.82% | 27.17% | 36.28% |
| |
| Ratios/Supplemental Data | | | | | |
| Net Assets, End of Period (Millions) | $4,138 | $5,340 | $5,945 | $6,731 | $6,536 |
| Ratio of Total Expenses to Average Net Assets2 | 0.38% | 0.31% | 0.34% | 0.34% | 0.38% |
| Ratio of Net Investment Income to | | | | | |
| Average Net Assets | 1.97% | 2.15% | 1.67% | 1.74% | 1.73% |
| Portfolio Turnover Rate | 17% | 18% | 24% | 31% | 27% |
1 Total returns do not include transaction or account service fees that may have applied in the periods shown. Fund prospectuses provide
information about any applicable transaction and account service fees.
2 Includes performance-based investment advisory fee increases (decreases) of 0.04%, (0.02%), 0.01%, 0.00%, and 0.03%.
See accompanying Notes, which are an integral part of the Financial Statements.
23
Energy Fund
Financial Highlights
| | | | | |
| Admiral Shares | | | | | |
| |
| For a Share Outstanding | Year Ended January 31, |
| Throughout Each Period | 2014 | 2013 | 2012 | 2011 | 2010 |
| Net Asset Value, Beginning of Period | $117.63 | $117.52 | $129.93 | $107.34 | $80.02 |
| Investment Operations | | | | | |
| Net Investment Income | 2.530 | 2.586 | 2.101 | 2.045 | 1.780 |
| Net Realized and Unrealized Gain (Loss) | | | | | |
| on Investments | 4.491 | 2.060 | (7.432) | 26.479 | 27.395 |
| Total from Investment Operations | 7.021 | 4.646 | (5.331) | 28.524 | 29.175 |
| Distributions | | | | | |
| Dividends from Net Investment Income | (2.500) | (2.595) | (2.159) | (1.899) | (1.855) |
| Distributions from Realized Capital Gains | (2.321) | (1.941) | (4.920) | (4.035) | — |
| Total Distributions | (4.821) | (4.536) | (7.079) | (5.934) | (1.855) |
| Net Asset Value, End of Period | $119.83 | $117.63 | $117.52 | $129.93 | $107.34 |
| |
| Total Return1 | 5.94% | 4.14% | -3.76% | 27.24% | 36.37% |
| |
| Ratios/Supplemental Data | | | | | |
| Net Assets, End of Period (Millions) | $7,540 | $6,778 | $6,756 | $6,871 | $4,439 |
| Ratio of Total Expenses to Average Net Assets2 | 0.32% | 0.26% | 0.28% | 0.28% | 0.31% |
| Ratio of Net Investment Income to | | | | | |
| Average Net Assets | 2.03% | 2.20% | 1.73% | 1.80% | 1.80% |
| Portfolio Turnover Rate | 17% | 18% | 24% | 31% | 27% |
1 Total returns do not include transaction fees that may have applied in the periods shown. Fund prospectuses provide information about any
applicable transaction fees.
2 Includes performance-based investment advisory fee increases (decreases) of 0.04%, (0.02%), 0.01%, 0.00%, and 0.03%.
See accompanying Notes, which are an integral part of the Financial Statements.
24
Energy Fund
Notes to Financial Statements
Vanguard Energy Fund is registered under the Investment Company Act of 1940 as an open-end investment company, or mutual fund. The fund invests in securities of foreign issuers, which may subject it to investment risks not normally associated with investing in securities of U.S. corporations. The fund offers two classes of shares: Investor Shares and Admiral Shares. Investor Shares are available to any investor who meets the fund’s minimum purchase requirements. Admiral Shares are designed for investors who meet certain administrative, service, and account-size criteria.
A. The following significant accounting policies conform to generally accepted accounting principles for U.S. mutual funds. The fund consistently follows such policies in preparing its financial statements.
1. Security Valuation: Securities are valued as of the close of trading on the New York Stock Exchange (generally 4 p.m., Eastern time) on the valuation date. Equity securities are valued at the latest quoted sales prices or official closing prices taken from the primary market in which each security trades; such securities not traded on the valuation date are valued at the mean of the latest quoted bid and asked prices. Securities for which market quotations are not readily available, or whose values have been affected by events occurring before the fund’s pricing time but after the close of the securities’ primary markets, are valued at their fair values calculated according to procedures adopted by the board of trustees. These procedures include obtaining quotations from an independent pricing service, monitoring news to identify significant market- or security-specific events, and evaluating changes in the values of foreign market proxies (for example, ADRs, futures contracts, or exchange-traded funds), between the time the foreign markets close and the fund’s pricing time. When fair-value pricing is employed, the prices of securities used by a fund to calculate its net asset value may differ from quoted or published prices for the same securities. Investments in Vanguard Market Liquidity Fund are valued at that fund’s net asset value. Temporary cash investments acquired over 60 days to maturity are valued using the latest bid prices or using valuations based on a matrix system (which considers such factors as security prices, yields, maturities, and ratings), both as furnished by independent pricing services. Other temporary cash investments are valued at amortized cost, which approximates market value.
2. Foreign Currency: Securities and other assets and liabilities denominated in foreign currencies are translated into U.S. dollars using exchange rates obtained from an independent third party as of the fund’s pricing time on the valuation date. Realized gains (losses) and unrealized appreciation (depreciation) on investment securities include the effects of changes in exchange rates since the securities were purchased, combined with the effects of changes in security prices. Fluctuations in the value of other assets and liabilities resulting from changes in exchange rates are recorded as unrealized foreign currency gains (losses) until the assets or liabilities are settled in cash, at which time they are recorded as realized foreign currency gains (losses).
3. Futures Contracts: The fund uses index futures contracts to a limited extent, with the objective of maintaining full exposure to the stock market while maintaining liquidity. The fund may purchase or sell futures contracts to achieve a desired level of investment, whether to accommodate portfolio turnover or cash flows from capital share transactions. The primary risks associated with the use of futures contracts are imperfect correlation between changes in market values of stocks held by the fund and the prices of futures contracts, and the possibility of an illiquid market. Counterparty risk involving futures is mitigated because a regulated clearinghouse is the counterparty instead of the clearing broker. To further mitigate counterparty risk, the fund trades futures contracts on an exchange, monitors the financial strength of its clearing brokers and clearinghouse, and has entered into clearing agreements with its clearing brokers. The clearinghouse imposes initial margin requirements to secure the fund’s performance and requires daily settlement of variation margin representing changes in the market value of each contract.
25
Energy Fund
Futures contracts are valued at their quoted daily settlement prices. The aggregate notional amounts of the contracts are not recorded in the Statement of Net Assets. Fluctuations in the value of the contracts are recorded in the Statement of Net Assets as an asset (liability) and in the Statement of Operations as unrealized appreciation (depreciation) until the contracts are closed, when they are recorded as realized futures gains (losses).
During the year ended January 31, 2014, the fund’s average investments in long and short futures contracts represented 1% and 0% of net assets, respectively, based on quarterly average aggregate settlement values.
4. Repurchase Agreements: The fund enters into repurchase agreements with institutional counterparties. Securities pledged as collateral to the fund under repurchase agreements are held by a custodian bank until the agreements mature. Each agreement requires that the market value of the collateral be sufficient to cover payments of interest and principal. The fund further mitigates its counterparty risk by entering into repurchase agreements only with a diverse group of prequalified counterparties, monitoring their financial strength, and entering into master repurchase agreements with its counterparties. The master repurchase agreements provide that, in the event of a counter-party’s default (including bankruptcy), the fund may terminate any repurchase agreements with that counterparty, determine the net amount owed, and sell or retain the collateral up to the net amount owed to the fund. Such action may be subject to legal proceedings, which may delay or limit the disposition of collateral.
5. Federal Income Taxes: The fund intends to continue to qualify as a regulated investment company and distribute all of its taxable income. Management has analyzed the fund’s tax positions taken for all open federal income tax years (January 31, 2011–2014), and has concluded that no provision for federal income tax is required in the fund’s financial statements.
6. Distributions: Distributions to shareholders are recorded on the ex-dividend date.
7. Securities Lending: To earn additional income, the fund may lend its securities to qualified institutional borrowers. Security loans are required to be secured at all times by collateral in an amount at least equal to the market value of securities loaned. Daily market fluctuations could cause the value of loaned securities to be more or less than the value of the collateral received. When this occurs, the collateral is adjusted and settled on the next business day. The fund further mitigates its counterparty risk by entering into securities lending transactions only with a diverse group of prequalified counterparties, monitoring their financial strength, and entering into master securities lending agreements with its counterparties. The master securities lending agreements provide that, in the event of a counterparty’s default (including bankruptcy), the fund may terminate any loans with that borrower, determine the net amount owed, and sell or retain the collateral up to the net amount owed to the fund; however, such actions may be subject to legal proceedings. While collateral mitigates counterparty risk, in the absence of a default the fund may experience delays and costs in recovering the securities loaned. The fund invests cash collateral received in Vanguard Market Liquidity Fund, and records a liability for the return of the collateral, during the period the securities are on loan. Securities lending income represents fees charged to borrowers plus income earned on invested cash collateral, less expenses associated with the loan.
26
Energy Fund
8. Other: Dividend income is recorded on the ex-dividend date. Interest income includes income distributions received from Vanguard Market Liquidity Fund and is accrued daily. Premiums and discounts on debt securities purchased are amortized and accreted, respectively, to interest income over the lives of the respective securities. Security transactions are accounted for on the date securities are bought or sold. Costs used to determine realized gains (losses) on the sale of investment securities are those of the specific securities sold.
Each class of shares has equal rights as to assets and earnings, except that each class separately bears certain class-specific expenses related to maintenance of shareholder accounts (included in Management and Administrative expenses) and shareholder reporting. Marketing and distribution expenses are allocated to each class of shares based on a method approved by the board of trustees. Income, other non-class-specific expenses, and gains and losses on investments are allocated to each class of shares based on its relative net assets.
B. Wellington Management Company, LLP, provides investment advisory services to a portion of the fund for a fee calculated at an annual percentage rate of average net assets managed by the advisor. The basic fee is subject to quarterly adjustments based on performance for the preceding three years relative to the MSCI ACWI Energy Index.
The Vanguard Group provides investment advisory services to a portion of the fund on an at-cost basis; the fund paid Vanguard advisory fees of $387,000 for the year ended January 31, 2014.
For the year ended January 31, 2014, the aggregate investment advisory fee represented an effective annual basic rate of 0.14% of the fund’s average net assets, before an increase of $4,627,000 (0.04%) based on performance.
C. The Vanguard Group furnishes at cost corporate management, administrative, marketing, and distribution services. The costs of such services are allocated to the fund under methods approved by the board of trustees. The fund has committed to provide up to 0.40% of its net assets in capital contributions to Vanguard. At January 31, 2014, the fund had contributed capital of $1,375,000 to Vanguard (included in Other Assets), representing 0.01% of the fund’s net assets and 0.55% of Vanguard’s capitalization. The fund’s trustees and officers are also directors and officers of Vanguard.
D. Various inputs may be used to determine the value of the fund’s investments. These inputs are summarized in three broad levels for financial statement purposes. The inputs or methodologies used to value securities are not necessarily an indication of the risk associated with investing in those securities.
Level 1—Quoted prices in active markets for identical securities.
Level 2—Other significant observable inputs (including quoted prices for similar securities, interest rates, prepayment speeds, credit risk, etc.).
Level 3—Significant unobservable inputs (including the fund’s own assumptions used to determine the fair value of investments).
27
Energy Fund
The following table summarizes the market value of the fund’s investments as of January 31, 2014, based on the inputs used to value them:
| | | |
| | Level 1 | Level 2 | Level 3 |
| Investments | ($000) | ($000) | ($000) |
| Common Stocks—United States | 7,051,647 | — | — |
| Common Stocks—International | 2,966,842 | 1,192,888 | — |
| Temporary Cash Investments | 139,960 | 341,996 | — |
| Futures Contracts—Assets1 | 35 | — | — |
| Futures Contracts—Liabilities1 | (420) | — | — |
| Total | 10,158,064 | 1,534,884 | — |
| 1 Represents variation margin on the last day of the reporting period. |
E. At January 31, 2014, the aggregate settlement value of open futures contracts and the related unrealized appreciation (depreciation) were:
| | | | |
| | | | ($000) |
| | | | Aggregate | |
| | | Number of | Settlement | Unrealized |
| | | Long (Short) | Value | Appreciation |
| Futures Contracts | Expiration | Contracts | Long (Short) | (Depreciation) |
| E-mini S&P 500 Index | March 2014 | 1,309 | 116,278 | (4,093) |
| S&P 500 Index | March 2014 | 40 | 17,766 | 81 |
| | | | | (4,012) |
Unrealized appreciation (depreciation) on open futures contracts is required to be treated as realized gain (loss) for tax purposes.
F. Distributions are determined on a tax basis and may differ from net investment income and realized capital gains for financial reporting purposes. Differences may be permanent or temporary. Permanent differences are reclassified among capital accounts in the financial statements to reflect their tax character. Temporary differences arise when certain items of income, expense, gain, or loss are recognized in different periods for financial statement and tax purposes. These differences will reverse at some time in the future. Differences in classification may also result from the treatment of short-term gains as ordinary income for tax purposes.
During the year ended January 31, 2014, the fund realized net foreign currency losses of $811,000, which decreased distributable net income for tax purposes; accordingly, such losses have been reclassified from accumulated net realized gains to overdistributed net investment income. Certain of the fund’s investments are in securities considered to be passive foreign investment companies, for which any unrealized appreciation and/or realized gains are required to be included in distributable net income for tax purposes. During the year ended January 31, 2014, the fund realized gains on the sale of passive foreign investment companies of $3,239,000, which have been included in current and prior periods’ taxable income; accordingly, such gains have been reclassified from accumulated net realized gains to overdistributed net investment income.
28
Energy Fund
The fund used a tax accounting practice to treat a portion of the price of capital shares redeemed during the year as distributions from net investment income and realized capital gains. Accordingly, the fund has reclassified $10,222,000 from overdistributed net investment income, and $28,270,000 from accumulated net realized gains, to paid-in capital.
The fund used a capital loss carryforward of $15,701,000 to offset taxable capital gains realized during the year ended January 31, 2014, reducing the amount of capital gains that would otherwise be available to distribute to shareholders. For tax purposes, at January 31, 2014, the fund had $39,110,000 of long-term capital gains available for distribution.
At January 31, 2014, the cost of investment securities for tax purposes was $7,306,557,000. Net unrealized appreciation of investment securities for tax purposes was $4,386,776,000, consisting of unrealized gains of $4,628,427,000 on securities that had risen in value since their purchase and $241,651,000 in unrealized losses on securities that had fallen in value since their purchase.
G. During the year ended January 31, 2014, the fund purchased $1,971,275,000 of investment securities and sold $2,699,382,000 of investment securities, other than temporary cash investments.
H. Capital share transactions for each class of shares were:
| | | | |
| | Year Ended January 31, |
| | 2014 | 2013 |
| | Amount | Shares | Amount | Shares |
| | ($000) | (000) | ($000) | (000) |
| Investor Shares | | | | |
| Issued | 502,609 | 7,800 | 695,926 | 11,544 |
| Issued in Lieu of Cash Distributions | 153,964 | 2,391 | 204,348 | 3,375 |
| Redeemed1 | (2,007,040) | (30,600) | (1,470,869) | (24,672) |
| Net Increase (Decrease)—Investor Shares | (1,350,467) | (20,409) | (570,595) | (9,753) |
| Admiral Shares | | | | |
| Issued | 1,701,087 | 13,744 | 1,015,171 | 9,110 |
| Issued in Lieu of Cash Distributions | 266,568 | 2,204 | 233,904 | 2,064 |
| Redeemed1 | (1,289,012) | (10,651) | (1,238,717) | (11,038) |
| Net Increase (Decrease) —Admiral Shares | 678,643 | 5,297 | 10,358 | 136 |
| 1 Net of redemption fees for fiscal 2013 of $642,000 (fund total). Effective May 23, 2012, the redemption fee was eliminated. |
I. Management has determined that no material events or transactions occurred subsequent to January 31, 2014, that would require recognition or disclosure in these financial statements.
29
Report of Independent Registered
Public Accounting Firm
To the Trustees of Vanguard Specialized Funds and the Shareholders of Vanguard Energy Fund:
In our opinion, the accompanying statement of net assets and the related statements of operations and of changes in net assets and the financial highlights present fairly, in all material respects, the financial position of Vanguard Energy Fund (constituting a separate portfolio of Vanguard Specialized Funds, hereafter referred to as the “Fund”) at January 31, 2014, the results of its operations for the year then ended, the changes in its net assets for each of the two years in the period then ended, and the financial highlights for each of the five years in the period then ended, in conformity with accounting principles generally accepted in the United States of America. These financial statements and financial highlights (hereafter referred to as “financial statements”) are the responsibility of the Fund’s management; our responsibility is to express an opinion on these financial statements based on our audits. We conducted our audits of these financial statements in accordance with the standards of the Public Company Accounting Oversight Board (United States). Those standards require that we plan and perform the audit to obtain reasonable assurance about whether the financial statements are free of material misstatement. An audit includes examining, on a test basis, evidence supporting the amounts and disclosures in the financial statements, assessing the accounting principles used and significant estimates made by management, and evaluating the overall financial statement presentation. We believe that our audits, which included confirmation of securities at January 31, 2014 by correspondence with the custodians and brokers and by agreement to the underlying ownership records of the transfer agent, provide a reasonable basis for our opinion.
/s/PricewaterhouseCoopers LLP
Philadelphia, Pennsylvania
March 13, 2014
Special 2013 tax information (unaudited) for Vanguard Energy Fund
This information for the fiscal year ended January 31, 2014, is included pursuant to provisions of the
Internal Revenue Code.
The fund distributed $239,401,000 as capital gain dividends (from net long-term capital gains) to
shareholders during the fiscal year.
For nonresident alien shareholders, 100% of short-term capital gain dividends distributed by the fund
are qualified short-term capital gains.
The fund distributed $192,815,000 of qualified dividend income to shareholders during the fiscal year.
For corporate shareholders, 52.0% of investment income (dividend income plus short-term gains, if
any) qualifies for the dividends-received deduction.
30
Your Fund’s After-Tax Returns
This table presents returns for your fund both before and after taxes. The after-tax returns are shown in two ways: (1) assuming that an investor owned the fund during the entire period and paid taxes on the fund’s distributions, and (2) assuming that an investor paid taxes on the fund’s distributions and sold all shares at the end of each period.
Calculations are based on the highest individual federal income tax and capital gains tax rates in effect at the times of the distributions and the hypothetical sales. State and local taxes were not considered. After-tax returns reflect any qualified dividend income, using actual prior-year figures and estimates for 2014. (In the example, returns after the sale of fund shares may be higher than those assuming no sale. This occurs when the sale would have produced a capital loss. The calculation assumes that the investor received a tax deduction for the loss.)
The table shows returns for one share class only; returns for other share classes will differ. Please note that your actual after-tax returns will depend on your tax situation and may differ from those shown. Also note that if you own the fund in a tax-deferred account, such as an individual retirement account or a 401(k) plan, this information does not apply to you. Such accounts are not subject to current taxes.
Finally, keep in mind that a fund’s performance—whether before or after taxes—does not guarantee future results.
Average Annual Total Returns: Energy Fund Investor Shares
Periods Ended January 31, 2014
| | | |
| | One | Five | Ten |
| | Year | Years | Years |
| Returns Before Taxes | 5.88% | 12.93% | 12.57% |
| Returns After Taxes on Distributions | 4.85 | 12.06 | 11.70 |
| Returns After Taxes on Distributions and Sale of Fund Shares | 4.04 | 10.48 | 10.64 |
31
About Your Fund’s Expenses
As a shareholder of the fund, you incur ongoing costs, which include costs for portfolio management, administrative services, and shareholder reports (like this one), among others. Operating expenses, which are deducted from a fund’s gross income, directly reduce the investment return of the fund.
A fund’s expenses are expressed as a percentage of its average net assets. This figure is known as the expense ratio. The following examples are intended to help you understand the ongoing costs (in dollars) of investing in your fund and to compare these costs with those of other mutual funds. The examples are based on an investment of $1,000 made at the beginning of the period shown and held for the entire period.
The accompanying table illustrates your fund’s costs in two ways:
• Based on actual fund return. This section helps you to estimate the actual expenses that you paid over the period. The ”Ending Account Value“ shown is derived from the fund‘s actual return, and the third column shows the dollar amount that would have been paid by an investor who started with $1,000 in the fund. You may use the information here, together with the amount you invested, to estimate the expenses that you paid over the period.
To do so, simply divide your account value by $1,000 (for example, an $8,600 account value divided by $1,000 = 8.6), then multiply the result by the number given for your fund under the heading ”Expenses Paid During Period.“
• Based on hypothetical 5% yearly return. This section is intended to help you compare your fund‘s costs with those of other mutual funds. It assumes that the fund had a yearly return of 5% before expenses, but that the expense ratio is unchanged. In this case—because the return used is not the fund’s actual return—the results do not apply to your investment. The example is useful in making comparisons because the Securities and Exchange Commission requires all mutual funds to calculate expenses based on a 5% return. You can assess your fund’s costs by comparing this hypothetical example with the hypothetical examples that appear in shareholder reports of other funds.
Note that the expenses shown in the table are meant to highlight and help you compare ongoing costs only and do not reflect transaction costs incurred by the fund for buying and selling securities. Further, the expenses do not include any purchase, redemption, or account service fees described in the fund prospectus. If such fees were applied to your account, your costs would be higher. Your fund does not carry a “sales load.”
The calculations assume no shares were bought or sold during the period. Your actual costs may have been higher or lower, depending on the amount of your investment and the timing of any purchases or redemptions.
You can find more information about the fund’s expenses, including annual expense ratios, in the Financial Statements section of this report. For additional information on operating expenses and other shareholder costs, please refer to your fund’s current prospectus.
32
| | | |
| Six Months Ended January 31, 2014 | | | |
| | Beginning | Ending | Expenses |
| | Account Value | Account Value | Paid During |
| Energy Fund | 7/31/2013 | 1/31/2014 | Period |
| Based on Actual Fund Return | | | |
| Investor Shares | $1,000.00 | $1,029.69 | $1.94 |
| Admiral Shares | 1,000.00 | 1,030.10 | 1.64 |
| Based on Hypothetical 5% Yearly Return | | | |
| Investor Shares | $1,000.00 | $1,023.29 | $1.94 |
| Admiral Shares | 1,000.00 | 1,023.59 | 1.63 |
The calculations are based on expenses incurred in the most recent six-month period. The fund’s annualized six-month expense ratios for that
period are 0.38% for Investor Shares and 0.32% for Admiral Shares. The dollar amounts shown as “Expenses Paid” are equal to the
annualized expense ratio multiplied by the average account value over the period, multiplied by the number of days in the most recent
six-month period, then divided by the number of days in the most recent 12-month period.
33
Glossary
30-Day SEC Yield. A fund’s 30-day SEC yield is derived using a formula specified by the U.S. Securities and Exchange Commission. Under the formula, data related to the fund’s security holdings in the previous 30 days are used to calculate the fund’s hypothetical net income for that period, which is then annualized and divided by the fund’s estimated average net assets over the calculation period. For the purposes of this calculation, a security’s income is based on its current market yield to maturity (for bonds), its actual income (for asset-backed securities), or its projected dividend yield (for stocks). Because the SEC yield represents hypothetical annualized income, it will differ—at times significantly—from the fund’s actual experience. As a result, the fund’s income distributions may be higher or lower than implied by the SEC yield.
Beta. A measure of the magnitude of a fund’s past share-price fluctuations in relation to the ups and downs of a given market index. The index is assigned a beta of 1.00. Compared with a given index, a fund with a beta of 1.20 typically would have seen its share price rise or fall by 12% when the index rose or fell by 10%. For this report, beta is based on returns over the past 36 months for both the fund and the index. Note that a fund’s beta should be reviewed in conjunction with its R-squared (see definition). The lower the R-squared, the less correlation there is between the fund and the index, and the less reliable beta is as an indicator of volatility.
Dividend Yield. Dividend income earned by stocks, expressed as a percentage of the aggregate market value (or of net asset value, for a fund). The yield is determined by dividing the amount of the annual dividends by the aggregate value (or net asset value) at the end of the period. For a fund, the dividend yield is based solely on stock holdings and does not include any income produced by other investments.
Earnings Growth Rate. The average annual rate of growth in earnings over the past five years for the stocks now in a fund.
Equity Exposure. A measure that reflects a fund’s investments in stocks and stock futures. Any holdings in short-term reserves are excluded.
Expense Ratio. A fund’s total annual operating expenses expressed as a percentage of the fund’s average net assets. The expense ratio includes management and administrative expenses, but does not include the transaction costs of buying and selling portfolio securities.
Foreign Holdings. The percentage of a fund represented by securities or depositary receipts of companies based outside the United States.
Inception Date. The date on which the assets of a fund (or one of its share classes) are first invested in accordance with the fund’s investment objective. For funds with a subscription period, the inception date is the day after that period ends. Investment performance is measured from the inception date.
Median Market Cap. An indicator of the size of companies in which a fund invests; the midpoint of market capitalization (market price x shares outstanding) of a fund’s stocks, weighted by the proportion of the fund’s assets invested in each stock. Stocks representing half of the fund’s assets have market capitalizations above the median, and the rest are below it.
Price/Book Ratio. The share price of a stock divided by its net worth, or book value, per share. For a fund, the weighted average price/book ratio of the stocks it holds.
34
Price/Earnings Ratio. The ratio of a stock’s current price to its per-share earnings over the past year. For a fund, the weighted average P/E of the stocks it holds. P/E is an indicator of market expectations about corporate prospects; the higher the P/E, the greater the expectations for a company’s future growth.
R-Squared. A measure of how much of a fund’s past returns can be explained by the returns from the market in general, as measured by a given index. If a fund’s total returns were precisely synchronized with an index’s returns, its R-squared would be 1.00. If the fund’s returns bore no relationship to the index’s returns, its R-squared would be 0. For this report, R-squared is based on returns over the past 36 months for both the fund and the index.
Return on Equity. The annual average rate of return generated by a company during the past five years for each dollar of shareholder’s equity (net income divided by shareholder’s equity). For a fund, the weighted average return on equity for the companies whose stocks it holds.
Short-Term Reserves. The percentage of a fund invested in highly liquid, short-term securities that can be readily converted to cash.
Turnover Rate. An indication of the fund’s trading activity. Funds with high turnover rates incur higher transaction costs and may be more likely to distribute capital gains (which may be taxable to investors). The turnover rate excludes in-kind transactions, which have minimal impact on costs.
Benchmark Information
Spliced Energy Index: S&P 500 Index through November 30, 2000; S&P Energy Sector Index through May 31, 2010; MSCI All Country World Energy Index thereafter.
35
The People Who Govern Your Fund
The trustees of your mutual fund are there to see that the fund is operated and managed in your best interests since, as a shareholder, you are a part owner of the fund. Your fund’s trustees also serve on the board of directors of The Vanguard Group, Inc., which is owned by the Vanguard funds and provides services to them on an at-cost basis.
A majority of Vanguard’s board members are independent, meaning that they have no affiliation with Vanguard or the funds they oversee, apart from the sizable personal investments they have made as private individuals. The independent board members have distinguished backgrounds in business, academia, and public service. Each of the trustees and executive officers oversees 180 Vanguard funds.
The following table provides information for each trustee and executive officer of the fund. More information about the trustees is in the Statement of Additional Information, which can be obtained, without charge, by contacting Vanguard at 800-662-7447, or online at vanguard.com.
| |
| InterestedTrustee1 | and Delphi Automotive LLP (automotive components); |
| | Senior Advisor at New Mountain Capital. |
| F. William McNabb III | |
| Born 1957. Trustee Since July 2009. Chairman of the | Amy Gutmann |
| Board. Principal Occupation(s) During the Past Five | Born 1949. Trustee Since June 2006. Principal |
| Years: Chairman of the Board of The Vanguard Group, | Occupation(s) During the Past Five Years: President of |
| Inc., and of each of the investment companies served | the University of Pennsylvania; Christopher H. Browne |
| by The Vanguard Group, since January 2010; Director | Distinguished Professor of Political Science, School of |
| of The Vanguard Group since 2008; Chief Executive | Arts and Sciences, and Professor of Communication, |
| Officer and President of The Vanguard Group, and of | Annenberg School for Communication, with secondary |
| each of the investment companies served by The | faculty appointments in the Department of Philosophy, |
| Vanguard Group, since 2008; Director of Vanguard | School of Arts and Sciences, and at the Graduate |
| Marketing Corporation; Managing Director of The | School of Education, University of Pennsylvania; |
| Vanguard Group (1995–2008). | Trustee of the National Constitution Center; Chair |
| | of the Presidential Commission for the Study of |
| IndependentTrustees | Bioethical Issues. |
| |
| Emerson U. Fullwood | JoAnn Heffernan Heisen |
| Born 1948. Trustee Since January 2008. Principal | Born 1950. Trustee Since July 1998. Principal |
| Occupation(s) During the Past Five Years: Executive | Occupation(s) During the Past Five Years: Corporate |
| Chief Staff and Marketing Officer for North America | Vice President and Chief Global Diversity Officer |
| and Corporate Vice President (retired 2008) of Xerox | (retired 2008) and Member of the Executive |
| Corporation (document management products and | Committee (1997–2008) of Johnson & Johnson |
| services); Executive in Residence and 2010 | (pharmaceuticals/medical devices/consumer |
| Distinguished Minett Professor at the Rochester | products); Director of Skytop Lodge Corporation |
| Institute of Technology; Director of SPX Corporation | (hotels), the University Medical Center at Princeton, |
| (multi-industry manufacturing), the United Way of | the Robert Wood Johnson Foundation, and the Center |
| Rochester, Amerigroup Corporation (managed health | for Talent Innovation; Member of the Advisory Board |
| care), the University of Rochester Medical Center, | of the Maxwell School of Citizenship and Public Affairs |
| Monroe Community College Foundation, and North | at Syracuse University. |
| Carolina A&T University. | |
| F. Joseph Loughrey |
| Rajiv L. Gupta | Born 1949. Trustee Since October 2009. Principal |
| Born 1945. Trustee Since December 2001.2 | Occupation(s) During the Past Five Years: President |
| Principal Occupation(s) During the Past Five Years: | and Chief Operating Officer (retired 2009) of Cummins |
| Chairman and Chief Executive Officer (retired 2009) | Inc. (industrial machinery); Chairman of the Board |
| and President (2006–2008) of Rohm and Haas Co. | of Hillenbrand, Inc. (specialized consumer services), |
| (chemicals); Director of Tyco International, Ltd. | and of Oxfam America; Director of SKF AB (industrial |
| (diversified manufacturing and services), Hewlett- | machinery), Hyster-Yale Materials Handling, Inc. |
| Packard Co. (electronic computer manufacturing), | (forklift trucks), the Lumina Foundation for Education, |
| | |
| and the V Foundation for Cancer Research; Member | Executive Officers | |
| of the Advisory Council for the College of Arts and | | |
| Letters and of the Advisory Board to the Kellogg | Glenn Booraem | |
| Institute for International Studies, both at the | Born 1967. Controller Since July 2010. Principal |
| University of Notre Dame. | Occupation(s) During the Past Five Years: Principal |
| | of The Vanguard Group, Inc.; Controller of each of |
| Mark Loughridge | the investment companies served by The Vanguard |
| Born 1953. Trustee Since March 2012. Principal | Group; Assistant Controller of each of the investment |
| Occupation(s) During the Past Five Years: Senior Vice | companies served by The Vanguard Group (2001–2010). |
| President and Chief Financial Officer (retired 2013) | | |
| at IBM (information technology services); Fiduciary | Thomas J. Higgins | |
| Member of IBM’s Retirement Plan Committee (2004– | Born 1957. Chief Financial Officer Since September |
| 2013); Member of the Council on Chicago Booth. | 2008. Principal Occupation(s) During the Past Five |
| | Years: Principal of The Vanguard Group, Inc.; Chief |
| Scott C. Malpass | Financial Officer of each of the investment companies |
| Born 1962. Trustee Since March 2012. Principal | served by The Vanguard Group; Treasurer of each of |
| Occupation(s) During the Past Five Years: Chief | the investment companies served by The Vanguard |
| Investment Officer and Vice President at the University | Group (1998–2008). | |
| of Notre Dame; Assistant Professor of Finance at the | | |
| Mendoza College of Business at Notre Dame; Member | Kathryn J. Hyatt | |
| of the Notre Dame 403(b) Investment Committee; | Born 1955. Treasurer Since November 2008. Principal |
| Board Member of TIFF Advisory Services, Inc. | Occupation(s) During the Past Five Years: Principal of |
| (investment advisor); Member of the Investment | The Vanguard Group, Inc.; Treasurer of each of the |
| Advisory Committees of the Financial Industry | investment companies served by The Vanguard |
| Regulatory Authority (FINRA) and of Major League | Group; Assistant Treasurer of each of the investment |
| Baseball. | companies served by The Vanguard Group (1988–2008). |
| |
| André F. Perold | Heidi Stam | |
| Born 1952. Trustee Since December 2004. Principal | Born 1956. Secretary Since July 2005. Principal |
| Occupation(s) During the Past Five Years: George | Occupation(s) During the Past Five Years: Managing |
| Gund Professor of Finance and Banking, Emeritus | Director of The Vanguard Group, Inc.; General Counsel |
| at the Harvard Business School (retired 2011); | of The Vanguard Group; Secretary of The Vanguard |
| Chief Investment Officer and Managing Partner of | Group and of each of the investment companies |
| HighVista Strategies LLC (private investment firm); | served by The Vanguard Group; Director and Senior |
| Director of Rand Merchant Bank; Overseer of the | Vice President of Vanguard Marketing Corporation. |
| Museum of Fine Arts Boston. | | |
| | Vanguard Senior ManagementTeam |
| Alfred M. Rankin, Jr. | | |
| Born 1941. Trustee Since January 1993. Principal | Mortimer J. Buckley | Chris D. McIsaac |
| Occupation(s) During the Past Five Years: Chairman, | Kathleen C. Gubanich | Michael S. Miller |
| President, and Chief Executive Officer of NACCO | Paul A. Heller | James M. Norris |
| Industries, Inc. (housewares/lignite), and of Hyster- | Martha G. King | Glenn W. Reed |
| Yale Materials Handling, Inc. (forklift trucks); Chairman | John T. Marcante | |
| of the Board of University Hospitals of Cleveland. | | |
| |
| Peter F. Volanakis | Chairman Emeritus and Senior Advisor |
| Born 1955. Trustee Since July 2009. Principal | | |
| Occupation(s) During the Past Five Years: President | John J. Brennan | |
| and Chief Operating Officer (retired 2010) of Corning | Chairman, 1996–2009 | |
| Incorporated (communications equipment); Trustee of | Chief Executive Officer and President, 1996–2008 |
| Colby-Sawyer College; Member of the Advisory Board | | |
| of the Norris Cotton Cancer Center and of the Advisory | | |
| Board of the Parthenon Group (strategy consulting). | Founder | |
| | John C. Bogle | |
| | Chairman and Chief Executive Officer, 1974–1996 |
1 Mr. McNabb is considered an “interested person,” as defined in the Investment Company Act of 1940, because he is an officer of the
Vanguard funds.
2 December 2002 for Vanguard Equity Income Fund, Vanguard Growth Equity Fund, the Vanguard Municipal Bond Funds, and the Vanguard
State Tax-Exempt Funds.
|  |
| | P.O. Box 2600 |
| | Valley Forge, PA 19482-2600 |
| |
| |
| |
| Connect with Vanguard® > vanguard.com | |
| |
| |
| |
| Fund Information > 800-662-7447 | CFA® is a trademark owned by CFA Institute. |
| Direct Investor Account Services > 800-662-2739 | |
| Institutional Investor Services > 800-523-1036 | |
| Text Telephone for People | |
| With Hearing Impairment > 800-749-7273 | |
| |
| This material may be used in conjunction | |
| with the offering of shares of any Vanguard | |
| fund only if preceded or accompanied by | |
| the fund’s current prospectus. | |
| |
| All comparative mutual fund data are from Lipper, a | |
| Thomson Reuters Company, or Morningstar, Inc., unless | |
| otherwise noted. | |
| |
| You can obtain a free copy of Vanguard’s proxy voting | |
| guidelines by visiting vanguard.com/proxyreporting or by | |
| calling Vanguard at 800-662-2739. The guidelines are | |
| also available from the SEC’s website, sec.gov. In | |
| addition, you may obtain a free report on how your fund | |
| voted the proxies for securities it owned during the 12 | |
| months ended June 30. To get the report, visit either | |
| vanguard.com/proxyreporting or sec.gov. | |
| |
| You can review and copy information about your fund at | |
| the SEC’s Public Reference Room in Washington, D.C. To | |
| find out more about this public service, call the SEC at | |
| 202-551-8090. Information about your fund is also | |
| available on the SEC’s website, and you can receive | |
| copies of this information, for a fee, by sending a | |
| request in either of two ways: via e-mail addressed to | |
| publicinfo@sec.gov or via regular mail addressed to the | |
| Public Reference Section, Securities and Exchange | |
| Commission, Washington, DC 20549-1520. | |
| |
| | © 2014 The Vanguard Group, Inc. |
| | All rights reserved. |
| | Vanguard Marketing Corporation, Distributor. |
| |
| | Q510 032014 |

Annual Report | January 31, 2014
Vanguard Health Care Fund

Vanguard’s Principles for Investing Success
We want to give you the best chance of investment success. These principles, grounded in Vanguard’s research and experience, can put you on the right path.
Goals. Create clear, appropriate investment goals.
Balance. Develop a suitable asset allocation using broadly diversified funds. Cost. Minimize cost.
Discipline. Maintain perspective and long-term discipline.
A single theme unites these principles: Focus on the things you can control.
We believe there is no wiser course for any investor.
| |
| Contents | |
| Your Fund’s Total Returns. | 1 |
| Chairman’s Letter. | 2 |
| Advisor’s Report. | 8 |
| Fund Profile. | 11 |
| Performance Summary. | 12 |
| Financial Statements. | 14 |
| Your Fund’s After-Tax Returns. | 29 |
| About Your Fund’s Expenses. | 30 |
| Glossary. | 32 |
Please note: The opinions expressed in this report are just that—informed opinions. They should not be considered promises or advice.
Also, please keep in mind that the information and opinions cover the period through the date on the front of this report. Of course, the
risks of investing in your fund are spelled out in the prospectus.
See the Glossary for definitions of investment terms used in this report.
About the cover: The ship’s wheel represents leadership and guidance, essential qualities in navigating difficult seas.
This one is a replica based on an 18th-century British vessel. The HMSVanguard, another ship of that era, served as the
flagship for British Admiral Horatio Nelson when he defeated a French fleet at the Battle of the Nile.
Your Fund’s Total Returns
| |
| Fiscal Year Ended January 31, 2014 | |
| |
| | Total |
| | Returns |
| Vanguard Health Care Fund | |
| Investor Shares | 37.66% |
| Admiral™ Shares | 37.74 |
| MSCI All Country World Health Care Index | 27.55 |
| Global Health/Biotechnology Funds Average | 40.50 |
| Global Health/Biotechnology Funds Average: Derived from data provided by Lipper, a Thomson Reuters Company. |
| Admiral Shares carry lower expenses and are available to investors who meet certain account-balance requirements. |
| | | | |
| Your Fund’s Performance at a Glance | | | | |
| January 31, 2013, Through January 31, 2014 | | | | |
| | | | Distributions Per Share |
| | Starting | Ending | | |
| | Share | Share | Income | Capital |
| | Price | Price | Dividends | Gains |
| Vanguard Health Care Fund | | | | |
| Investor Shares | $152.58 | $191.63 | $2.357 | $14.001 |
| Admiral Shares | 64.37 | 80.84 | 1.042 | 5.906 |
1

Chairman’s Letter
Dear Shareholder,
Vanguard Health Care Fund notched its best fiscal-year performance in more than a dozen years, with a nearly 38% return for the 12 months ended January 31, 2014. The fund’s result was 10 percentage points better than that of the benchmark, the MSCI All Country World Health Care Index.
The impressive advance, however, lagged the average return for peer funds, mainly because competing funds, in general, were more heavily invested in small biotechnology firms than the Health Care Fund has been.
These smallcap biotech stocks were very much in favor during the period as investors embraced the risks inherent in developing new therapies. It’s important to keep in mind that biotech stocks are extremely volatile: Shares can soar or plummet depending on the outcome of clinical trials. In other periods, peer funds’ outsized allocations to small biotech firms have led to steep losses.
If you own shares of the Health Care Fund in a taxable account, you may wish to review the fund’s aftertax returns later in this report.
U.S. stocks found a groove before January’s volatility set in U.S. stocks delivered generous returns in 2013, then slid over the first month of the new year. For the 12 months ended
2
January 31, the broad U.S. market produced an impressive gain of nearly 23% despite the late reversal.
Strong corporate earnings growth and investors’ willingness to pay for those earnings drove stock markets, which were also buoyed by the Federal Reserve’s stimulative bondbuying program. The Fed, noting the economy’s improvement, began paring back its bond purchases in January. Nevertheless, stocks declined over the period’s final month as investors worried about recent economic trends at home and abroad.
Overall, international stocks advanced about 6% for the 12 months. Developed markets in Europe and the Pacific region posted gains; however, concerns about China’s weaker economy hurt stocks and currencies in various emergingmarket countries.
For 2014, Vanguard Chief Economist Joe Davis and his team are guarded in their outlook for global stock returns, and their forecast for the bond market remains muted. Although Joe readily acknowledges that such forecasts are accompanied by uncertainty, he writes, “We believe that a longterm, strategic approach with a balanced, diversified, lowcost portfolio can remain a highvalue proposition in the decade ahead.” (You can read more about our expectations for bond and stock returns in Vanguard’s Economic and Investment Outlook, available at vanguard.com/research.)
| | | |
| Market Barometer | | | |
| |
| | | Average Annual Total Returns |
| | | Periods Ended January 31, 2014 |
| | One | Three | Five |
| | Year | Years | Years |
| Stocks | | | |
| Russell 1000 Index (Large-caps) | 22.23% | 14.14% | 19.84% |
| Russell 2000 Index (Small-caps) | 27.03 | 14.69 | 22.26 |
| Russell 3000 Index (Broad U.S. market) | 22.60 | 14.18 | 20.03 |
| FTSE All-World ex US Index (International) | 5.78 | 3.37 | 14.38 |
| |
| Bonds | | | |
| Barclays U.S. Aggregate Bond Index (Broad taxable market) | 0.12% | 3.73% | 4.93% |
| Barclays Municipal Bond Index (Broad tax-exempt market) | -1.07 | 5.76 | 5.54 |
| Citigroup Three-Month U.S. Treasury Bill Index | 0.05 | 0.06 | 0.09 |
| |
| CPI | | | |
| Consumer Price Index | 1.58% | 2.03% | 2.07% |
3
Bond returns were flat as the Fed firmed its strategy
Investors avoided bonds for most of the 12month period, wary of the Fed’s expected curtailment of its bondbuying program. In January, however, despite the start of that tapering, fixed income investments regained appeal as stocks slumped.
The broad U.S. taxable bond market returned 0.12% for the 12 months, while municipal bonds posted returns of –1.07%. The yield of the benchmark 10year Treasury note generally increased during the fiscal year, eclipsing 3.00% at times, and finished at 2.70%. (Bond prices and yields move in opposite directions.) The Fed’s continued target of 0%–0.25% for shortterm interest rates tightly restricted returns of money market returns and savings accounts.
International bond markets (as measured by the Barclays Global Aggregate Index ex USD) returned –1.24%.
The Health Care Fund recorded its best showing since 2001
This was the first full fiscal year for which Jean M. Hynes of Wellington Management Company served as your fund’s sole portfolio manager. She assumed that position when Edward P. Owens retired in December 2012 after nearly three decades of managing the Health Care Fund. In last year’s letter, I expressed confidence that Jean—who was part of Ed’s team for
| | | |
| Expense Ratios | | | |
| Your Fund Compared With Its Peer Group | | | |
| | Investor | Admiral | Peer Group |
| | Shares | Shares | Average |
| Health Care Fund | 0.35% | 0.30% | 1.30% |
The fund expense ratios shown are from the prospectus dated May 28, 2013, and represent estimated costs for the current fiscal year. For the
fiscal year ended January 31, 2014, the fund’s expense ratios were 0.35% for Investor Shares and 0.30% for Admiral Shares. The peer-group
expense ratio is derived from data provided by Lipper, a Thomson Reuters Company, and captures information through year-end 2013.
Peer group: Global Health/Biotechnology Funds.
4
about two decades and had been associate portfolio manager since 2008—would carry on the fund’s tradition of excellence.
The 2014 fiscal year turned out to be an auspicious start to her tenure at the helm. As I noted earlier, the fund posted its highest fiscalyear return since the 12 months ended January 31, 2001. This success reflects not only Jean’s contribution but that of the deeply experienced team at Wellington that provides researchbased insights into the health care industry.
To be sure, the fund also benefited from the generally strong performance of health care stocks during the third straight fiscal year in which this sector outpaced the broad U.S. stock market. Pharmaceutical and biotechnology stocks have been buoyed by advances in genetically targeted treatments for diseases. Shares of managed care insurance companies, meanwhile, have risen on the possibility that the Affordable Care Act will lead to an increase in the number of people getting health insurance.
The advisor’s stock choices helped the fund capitalize on the health care sector’s broad rise: Returns for the fund’s biotechnology and pharmaceutical stocks were about 10 percentage points ahead of those groups’ counterparts in the benchmark index, while returns for its holdings in distributors of health care products topped 60%, compared with about 50% for the benchmark.
| |
| Total Returns | |
| Ten Years Ended January 31, 2014 | |
| | Average |
| | Annual Return |
| Health Care Fund Investor Shares | 10.83% |
| Spliced Health Care Index | 7.55 |
| Global Health/Biotechnology Funds Average | 9.09 |
For a benchmark description, see the Glossary.
Global Health/Biotechnology Funds Average: Derived from data provided by Lipper, a Thomson Reuters Company.
The figures shown represent past performance, which is not a guarantee of future results. (Current performance may be
lower or higher than the performance data cited. For performance data current to the most recent month-end, visit our
website at vanguard.com/performance.) Note, too, that both investment returns and principal value can fluctuate widely, so
an investor’s shares, when sold, could be worth more or less than their original cost.
5
|
| Beware of chasing a sector’s ups and downs |
| |
| Funds that focus on a single sector—as Vanguard Health Care Fund does—can be more |
| volatile than more broadly diversified funds. Sector funds can soar one year and plunge the |
| next. This tendency toward volatility can stir up investors’ worst instincts, tempting them to |
| invest during times of strong performance and to bail as prices inevitably recede. |
| |
| As we all know, buying high and selling low hurts performance. Because many sector fund |
| investors do fall prey to the temptation to jump in and out of the market, the average annual |
| return experienced by sector fund investors (the “investor return”) is often lower than the |
| average annual total return of the funds themselves over the same period.1 |
| |
| The chart below will give you an idea of the price that sector fund investors can pay for chasing |
| performance. It compares the average annual total returns for health care funds with the |
| average annual investor returns for these funds for recent three, five, and tenyear periods. |
| |
| While sector funds can play a valuable supplemental role in your portfolio, you shouldn’t let |
| their inherent volatility affect your level of investment in them. |
| |
| Health care funds: Their returns vs. their investors’ returns |
| Periods ended December 31, 2013 |
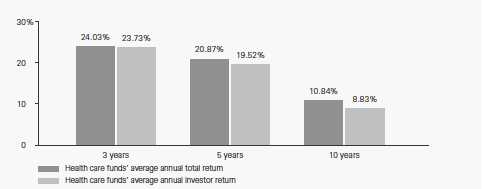
| Notes: Fund averages assume all distributions were reinvested. All returns were calculated on a month-end basis. |
| Source: Vanguard calculations, derived from data provided by Morningstar, Inc. |
| |
| |
| 1 The investor return is based on a money-weighted calculation that takes into account the timing of investors’ cash inflows |
| and outflows. |
6
As for weak spots, to pull up shares of certain Japanese pharmaceutical companies modestly detracted from the fund’s performance. In addition to some companyspecific setbacks, such as disappointing clinical trial results, returns of these stocks were reduced for U.S. investors by the decline in the value of the Japanese yen.
The Advisor’s Report that follows this letter provides additional details about the management and performance of your fund during the year.
With active management, patience can be rewarded
As you can see in the table on page 5, for the ten years ended January 31, the Health Care Fund outperformed its comparative standards. Its average annual return for the decade was more than 1 percentage point better than that of its peer funds and more than 3 percentage points better than that of its benchmark index.
Such outperformance might sound fairly modest when annualized over a decade, but it is actually quite significant when considered in terms of cumulative returns. As of January 31, the tenyear cumulative return for your fund’s Investor Shares was about 180% compared with 139% for the peergroup average and 107% for the benchmark index.
Higher returns, of course, translate into greater wealth for fund shareholders. An investment of $10,000 in the Health Care Fund on January 31, 2004, would have nearly tripled to $27,956 ten years later. By comparison, over the same period, an investor who earned the average return for peer funds would have ended up with $23,861, and an investor who received the benchmark’s return would have $20,700.
The Health Care Fund’s record is impressive, but there were certainly challenges along the way, including the 2008–2009 financial crisis. The rewards of the outperformance were earned by shareholders who stood fast in the face of periodic disappointing results.
It’s important to remember that even the best marketbeating managers can’t avoid shortterm periods of underperformance. An investor who is unwilling to endure some lean years could unwisely abandon a talented manager and miss out on longterm rewards. (You can read more in The Bumpy Road to Outperformance, available at vanguard.com/research.)
That’s why Vanguard recommends paying attention to costs and taking a patient, longterm view, as Wellington does. As part of our efforts to give investors the best chance for success, we offer access to worldclass active managers at costs well below industry averages.
As always, thank you for investing with Vanguard.
Sincerely,

F. William McNabb III
Chairman and Chief Executive Officer February 12, 2014
7
Advisor’s Report
For the fiscal year ended January 31, 2014, Vanguard Health Care Fund delivered solid absolute and relative returns, gaining 37.66% for Investor Shares and 37.74% for Admiral Shares. The fund topped the 27.55% return of its benchmark, the MSCI All Country World Health Care Index, but trailed the 40.50% average return of global health/biotechnology funds.
| |
| Major Portfolio Changes | |
| Year Ended January 31, 2014 | |
| |
| Additions | Comments |
| Vertex Pharmaceuticals | This biotech firm discovers, develops, and commercializes |
| | smallmolecule pharmaceuticals for the treatment of diseases |
| | that currently have limited or no effective treatments. We added |
| | to our position during the period as we continue to be most |
| | interested in Vertex’s development of drugs for cystic fibrosis. |
| BristolMyers Squibb | BristolMyers Squibb is an integrated global pharmaceutical |
| | company involved in the development as well as the distribution |
| | of biopharmaceutical products. The stock rose after management |
| | reported solid earnings and reiterated the strength of the firm’s |
| | immunooncology pipeline (more than 25 ongoing trials; at least |
| | eight different tumor types are targeted). The firm’s decision to sell |
| | its diabetes franchise to partner AstraZeneca was also welcomed by |
| | investors. We believe the sales and profit potential of the company’s |
| | immunooncology franchise is underappreciated, and we added to |
| | the fund’s position. |
| Edwards Lifesciences | We took advantage of weakness to initiate a position in Edwards |
| | Lifesciences, a U.S.based medical device company specializing in |
| | heart valve technology and treatments for cardiovascular disease. |
| | The stock had suffered because investors were worried about |
| | potential competition from Medtronic. |
| |
| Reductions | Comments |
| AbbVie | The stock was a very strong performer following the company’s |
| | spinoff from Abbott in January 2013. AbbVie’s sales of Humira, |
| | now a $10 billionplus product, continue to grow in the double digits, |
| | driving strong earnings growth, but it could face competition from |
| | similar drugs later in the decade. We trimmed the fund’s position |
| | into strength. |
| Pfizer | We decreased our exposure to Pfizer during the period. Early in |
| | 2013, Pfizer issued public shares of its animalhealth company |
| | Zoetis. During the fiscal year, we had the opportunity to swap |
| | shares of Pfizer for Zoetis as Pfizer split off the rest of the company. |
| | This reduced our position in Pfizer and increased our position in |
| | Zoetis. We are attracted to the longterm fundamentals of the |
| animalhealth industry. |
|
8
The investment environment
Overall, it was an impressive 12month period for the health care sector, which outpaced the 21.52% gain of the broader Standard & Poor’s 500 Index.
Shares of biopharmaceutical companies, which have demonstrated an ability to develop drugs that satisfy unmet needs across many therapeutic areas, continued to generate strong returns for the fund. These companies’ research is increasingly productive, and they have also gotten a lift from a more favorable regulatory backdrop compared with previous years.
Health care services companies also advanced sharply. Helped by a favorable pricing environment, pharmaceutical supply chain companies, including retail drug stores and drug distributors, performed well. HMOs also trended higher. Hospital stocks performed strongly in the first half of the fiscal year, although their returns flattened after that.
Our successes
Top contributors to the fund’s performance included Forest Laboratories and McKesson. Amgen, UnitedHealth Group, Merck, and BristolMyers Squibb also boosted returns significantly.
Shares of Forest Laboratories, a U.S.based pharmaceutical company, soared. Toward the end of the period, the company’s new CEO announced a costreduction plan as well as an acquisition that will add to earnings; both announcements were wellreceived by the market. The board’s authorization of a sizable accelerated sharerepurchase program also helped the stock.
At the end of the fiscal year, Forest Laboratories was our secondlargest holding. We believe the company’s drug lineup and strategic options are not fully appreciated by the market.
Shares of McKesson, a U.S.based health services company, climbed as its base business outperformed expectations thanks to strongerthanexpected fundamentals and execution. The stock also benefited from news that McKesson will acquire Celesio, a German pharmaceutical wholesaler. We view this acquisition, which aims to increase the company’s purchasing power for generic drugs, as an earningsaccretive opportunity, and McKesson remains one of the fund’s top ten holdings.
Biotechnology company Amgen was another strong performer. The company’s pipeline, which includes two potential blockbuster drugs (one for cholesterol and one for osteoporosis), gives it a solid growth outlook. We slightly trimmed our position, however, redeploying the proceeds to other stocks that, on the margin, we view as more attractive.
One of the top absolute contributors to the fund’s performance, the global pharmaceutical giant Merck, is also the fund’s largest holding. We believe that the company is one of the most attractive largecap pharmaceutical stocks and that its innovative pipeline of drugs, particularly its lead immunooncology drug, is unappreciated. During the period, the company announced that it was implementing a cost reduction program.
9
Our shortfalls
Given the sector’s strength during the period, it’s not surprising that there were few absolute detractors. The fund’s exposure to a few stocks of companies based in Japan weighed on returns. Relative to the benchmark, however, our biggest detractors were an underweighted allocation to Gilead Sciences, which has developed what could become a blockbuster drug for hepatitisC, and a lack of exposure to Valeant Pharmaceuticals, which benefited from accretive acquisitions.
Despite the strong overall performance of the Japanese market, our Japanese biopharmaceutical holdings hindered returns, in part because of the depreciation of the yen (although our currency hedge mitigated the depreciation to some extent). Particularly notable detractors were Eisai and Takeda Pharmaceutical. Shares of Eisai fell as a result of declining earnings and skepticism about the potential of Belviq, its new obesity drug. Takeda suffered two major setbacks for drugs in latestage testing: the failure of a prostate cancer drug to show a survival benefit and the termination of a diabetes drug because of safety concerns.
The fund’s positioning
Valuations of biopharmaceutical companies have trended upward, affording us the opportunity to trim certain positions while maintaining exposure to those companies with unrecognized value.
Within the health services category, our positions in pharmaceutical distributors and drugstores reflect our view that the outlook for the pharmaceutical supply chain remains favorable in light of trends in utilization, price inflation, and generic pharmaceuticals. There are also increasing opportunities to leverage purchasing synergies. The health insurance and hospital stocks in our portfolio are those we believe to be wellequipped to handle the challenges and opportunities that arrive with the implementation of the Affordable Care Act and the launch of insurance exchanges.
Lastly, within a stabilizing but still uncertain global economy and a difficult political environment, pockets of the health care sector should still be able to generate sustainable growth. We will keep striving to identify the drugs and devices with the best chances of changing medicine and the service companies that are best positioned to capture opportunities along the health care chain. We will remain diversified across the industry’s subsectors and regions, focused on the long haul, and positioned in the most attractive health care stocks.
Jean M. Hynes, CFA
Senior Vice President and
Portfolio Manager
Wellington Management Company, llp
February 20, 2014
10
Health Care Fund
Fund Profile
As of January 31, 2014
| | |
| Share-Class Characteristics | |
| | Investor | Admiral |
| | Shares | Shares |
| Ticker Symbol | VGHCX | VGHAX |
| Expense Ratio1 | 0.35% | 0.30% |
| 30-Day SEC Yield | 1.20% | 1.25% |
| | | |
| Portfolio Characteristics | | |
| | | | DJ |
| | | | U.S. |
| | | MSCI | Total |
| | | ACWI | Market |
| | | Health | FA |
| | Fund | Care | Index |
| Number of Stocks | 94 | 147 | 3,635 |
| Median Market Cap | $28.3B | $78.0B | $41.3B |
| Price/Earnings Ratio | 25.2x | 23.1x | 19.1x |
| Price/Book Ratio | 3.3x | 3.7x | 2.6x |
| Return on Equity | 16.4% | 20.7% | 16.5% |
| Earnings Growth | | | |
| Rate | 6.8% | 7.0% | 11.4% |
| Dividend Yield | 1.6% | 2.1% | 1.9% |
| Foreign Holdings | 21.3% | 41.2% | 0.0% |
| Turnover Rate | 21% | — | — |
| Short-Term Reserves | 4.5% | — | — |
| | |
| Subindustry Diversification (% of equity | |
| exposure) | | |
| | | MSCI |
| | | ACWI |
| | | Health |
| | Fund | Care |
| Biotechnology | 12.2% | 13.5% |
| Drug Retail | 2.8 | 0.0 |
| Fertilizers & Agricultural | | |
| Chemicals | 0.5 | 0.0 |
| Health Care Distributors | 5.2 | 2.9 |
| Health Care Equipment | 11.9 | 10.8 |
| Health Care Facilities | 2.4 | 1.2 |
| Health Care Services | 0.9 | 4.0 |
| Health Care Supplies | 0.4 | 1.0 |
| Health Care Technology | 2.3 | 0.5 |
| Life Sciences Tools & Services | 4.2 | 3.3 |
| Managed Health Care | 10.5 | 4.5 |
| Pharmaceuticals | 46.7 | 58.3 |
| | |
| Volatility Measures | | |
| | MSCI | DJ |
| | ACWI | U.S. Total |
| | Health | Market |
| | Care | FA Index |
| R-Squared | 0.91 | 0.67 |
| Beta | 0.85 | 0.61 |
| These measures show the degree and timing of the fund’s |
| fluctuations compared with the indexes over 36 months. |
| | |
| Ten Largest Holdings (% of total net assets) |
| Merck & Co. Inc. | Pharmaceuticals | 5.6% |
| Forest Laboratories Inc. | Pharmaceuticals | 5.1 |
| UnitedHealth Group Inc. | Managed Health | |
| | Care | 4.2 |
| Bristol-Myers Squibb Co. Pharmaceuticals | 4.0 |
| Roche Holding AG | Pharmaceuticals | 3.8 |
| McKesson Corp. | Health Care | |
| | Distributors | 3.7 |
| Eli Lilly & Co. | Pharmaceuticals | 3.6 |
| AstraZeneca plc | Pharmaceuticals | 3.5 |
| Amgen Inc. | Biotechnology | 2.9 |
| Vertex Pharmaceuticals | | |
| Inc. | Biotechnology | 2.5 |
| Top Ten | | 38.9% |
| The holdings listed exclude any temporary cash investments and equity index products. |
| |
| Market Diversification (% of equity exposure) |
| |
| Europe | |
| Switzerland | 6.3% |
| United Kingdom | 3.6 |
| Belgium | 2.0 |
| Other | 1.5 |
| Subtotal | 13.4% |
| Pacific | |
| Japan | 7.1% |
| North America | |
| United States | 77.4% |
| Other | 0.3 |
| Subtotal | 77.7% |
| Middle East | |
| Israel | 1.8% |
1 The expense ratios shown are from the prospectus dated May 28, 2013, and represent estimated costs for the current fiscal year. For the fiscal
year ended January 31, 2014, the expense ratios were 0.35% for Investor Shares and 0.30% for Admiral Shares.
11
Health Care Fund
Performance Summary
All of the returns in this report represent past performance, which is not a guarantee of future results that may be achieved by the fund. (Current performance may be lower or higher than the performance data cited. For performance data current to the most recent month-end, visit our website at vanguard.com/performance.) Note, too, that both investment returns and principal value can fluctuate widely, so an investor’s shares, when sold, could be worth more or less than their original cost. The returns shown do not reflect taxes that a shareholder would pay on fund distributions or on the sale of fund shares.
Cumulative Performance: January 31, 2004, Through January 31, 2014
Initial Investment of $10,000
| | | | | |
| | | Average Annual Total Returns | |
| | | Periods Ended January 31, 2014 | |
| | | | | | Final Value |
| | | One | Five | Ten | of a $10,000 |
| | | Year | Years | Years | Investment |
| | Health Care Fund*Investor Shares | 37.66% | 19.84% | 10.83% | $27,956 |
| •••••••• | Spliced Health Care Index | 27.55 | 17.47 | 7.55 | 20,700 |
| – – – – | Global Health/Biotechnology Funds | | | | |
| | Average | 40.50 | 19.69 | 9.09 | 23,861 |
| | Dow Jones U.S. Total Stock Market | | | | |
| | Float Adjusted Index | 22.53 | 20.13 | 7.51 | 20,637 |
| For a benchmark description, see the Glossary. |
| Global Health/Biotechnology Funds Average: Derived from data provided by Lipper, a Thomson Reuters Company. | |
| | | | |
| | | | | Final Value |
| | One | Five | Ten | of a $50,000 |
| | Year | Years | Years | Investment |
| Health Care Fund Admiral Shares | 37.74% | 19.91% | 10.90% | $140,746 |
| Spliced Health Care Index | 27.55 | 17.47 | 7.55 | 103,502 |
| Dow Jones U.S. Total Stock Market Float | | | | |
| Adjusted Index | 22.53 | 20.13 | 7.51 | 103,186 |
See Financial Highlights for dividend and capital gains information.
12
Health Care Fund
Fiscal-Year Total Returns (%): January 31, 2004, Through January 31, 2014
For a benchmark description, see the Glossary.
Average Annual Total Returns: Periods Ended December 31, 2013
This table presents returns through the latest calendar quarter—rather than through the end of the fiscal period.
Securities and Exchange Commission rules require that we provide this information.
| | | | |
| | Inception | One | Five | Ten |
| | Date | Year | Years | Years |
| Investor Shares | 5/23/1984 | 43.19% | 18.73% | 10.90% |
| Admiral Shares | 11/12/2001 | 43.27 | 18.79 | 10.98 |
13
Health Care Fund
Financial Statements
Statement of Net Assets
As of January 31, 2014
The fund reports a complete list of its holdings in regulatory filings four times in each fiscal year, at the quarter-ends. For the second and fourth fiscal quarters, the lists appear in the fund’s semiannual and annual reports to shareholders. For the first and third fiscal quarters, the fund files the lists with the Securities and Exchange Commission on Form N-Q. Shareholders can look up the fund’s Forms N-Q on the SEC’s website at sec.gov. Forms N-Q may also be reviewed and copied at the SEC’s Public Reference Room (see the back cover of this report for further information).
| | | |
| | | | Market |
| | | | Value |
| | | Shares | ($000) |
| Common Stocks (96.0%) | | |
| United States (74.4%) | | |
| Biotechnology (11.3%) | | |
| | Amgen Inc. | 8,506,055 | 1,011,795 |
| * | Vertex | | |
| | Pharmaceuticals Inc. | 10,981,500 | 867,978 |
| * | Regeneron | | |
| | Pharmaceuticals Inc. | 1,497,000 | 432,019 |
| *,1 | Alnylam | | |
| | Pharmaceuticals Inc. | 4,105,200 | 343,441 |
| * | Incyte Corp. Ltd. | 4,457,643 | 292,065 |
| * | Gilead Sciences Inc. | 2,974,800 | 239,918 |
| * | Alkermes plc | 4,523,387 | 220,199 |
| * | Biogen Idec Inc. | 676,400 | 211,470 |
| * | Quintiles Transnational | | |
| | Holdings Inc. | 3,636,278 | 173,196 |
| * | Cubist | | |
| | Pharmaceuticals Inc. | 1,323,142 | 96,708 |
| * | Ironwood | | |
| | Pharmaceuticals Inc. | | |
| | Class A | 3,364,198 | 46,661 |
| | | | 3,935,450 |
| Chemicals (0.4%) | | |
| | Monsanto Co. | 1,480,600 | 157,758 |
| |
| Food & Staples Retailing (2.7%) | |
| | Walgreen Co. | 10,913,200 | 625,872 |
| | CVS Caremark Corp. | 4,388,100 | 297,162 |
| | | | 923,034 |
| Health Care Equipment & Supplies (11.5%) |
| | Medtronic Inc. | 10,532,800 | 595,735 |
| * | Boston Scientific Corp. | 36,787,000 | 497,728 |
| | St. Jude Medical Inc. | 5,844,300 | 354,924 |
| * | Edwards | | |
| | Lifesciences Corp. | 5,324,000 | 346,699 |
| | | |
| | Covidien plc | 4,994,700 | 340,838 |
| | Abbott Laboratories | 7,591,400 | 278,301 |
| | Becton Dickinson | | |
| | and Co. | 2,571,700 | 278,052 |
| | CR Bard Inc. | 1,839,200 | 238,342 |
| * | CareFusion Corp. | 4,970,354 | 202,641 |
| | Zimmer Holdings Inc. | 2,146,200 | 201,678 |
| | Baxter International Inc. | 2,410,000 | 164,603 |
| * | Hologic Inc. | 7,379,300 | 157,622 |
| | DENTSPLY | | |
| | International Inc. | 2,826,100 | 130,396 |
| | Stryker Corp. | 1,433,500 | 111,240 |
| * | NuVasive Inc. | 1,628,303 | 60,964 |
| | STERIS Corp. | 803,083 | 36,854 |
| | | | 3,996,617 |
| Health Care Providers & Services (17.9%) | |
| | UnitedHealth Group Inc. | 19,992,000 | 1,445,022 |
| | McKesson Corp. | 7,449,500 | 1,299,267 |
| | Humana Inc. | 6,641,294 | 646,198 |
| | Cigna Corp. | 6,847,500 | 591,008 |
| | Aetna Inc. | 5,936,383 | 405,633 |
| | WellPoint Inc. | 4,027,400 | 346,356 |
| | Cardinal Health Inc. | 5,043,241 | 343,041 |
| * | HCA Holdings Inc. | 6,746,600 | 339,152 |
| | Universal Health | | |
| | Services Inc. Class B | 3,873,600 | 317,713 |
| * | Express Scripts | | |
| | Holding Co. | 1,397,400 | 104,372 |
| | Owens & Minor Inc. | 3,000,000 | 103,920 |
| * | Community Health | | |
| | Systems Inc. | 2,166,704 | 89,723 |
| * | Tenet Healthcare Corp. | 1,400,000 | 64,414 |
| * | WellCare Health Plans Inc. | 854,506 | 55,637 |
| * | MEDNAX Inc. | 805,600 | 44,824 |
| * | Premier Inc. Class A | 125,000 | 4,336 |
| | HealthSouth Corp. | 24,624 | 766 |
14
Health Care Fund
| | | |
| | | | Market |
| | | | Value |
| | | Shares | ($000) |
| * | Community Health | | |
| | Systems Inc. Rights | 18,834,700 | 753 |
| | | | 6,202,135 |
| Health Care Technology (2.2%) | |
| * | Cerner Corp. | 10,765,200 | 612,432 |
| * | Allscripts Healthcare | | |
| | Solutions Inc. | 8,542,653 | 141,466 |
| | | | 753,898 |
| Life Sciences Tools & Services (3.6%) | |
| * | Illumina Inc. | 2,240,200 | 340,511 |
| | Agilent Technologies Inc. | 5,624,200 | 327,047 |
| *,1 | PAREXEL | | |
| | International Corp. | 4,805,700 | 234,566 |
| * | Covance Inc. | 2,246,400 | 212,420 |
| * | Bruker Corp. | 3,285,758 | 66,865 |
| | PerkinElmer Inc. | 1,441,400 | 62,845 |
| | | | 1,244,254 |
| Pharmaceuticals (24.8%) | | |
| | Merck & Co. Inc. | 36,561,348 | 1,936,655 |
| *,1 | Forest Laboratories Inc. | 26,666,866 | 1,768,013 |
| | Bristol-Myers Squibb Co. | 27,724,261 | 1,385,381 |
| | Eli Lilly & Co. | 22,895,000 | 1,236,559 |
| * | Perrigo Co. plc | 3,094,152 | 481,636 |
| * | Hospira Inc. | 8,011,770 | 352,598 |
| | Pfizer Inc. | 10,398,122 | 316,103 |
| | Zoetis Inc. | 8,412,017 | 255,389 |
| * | Mylan Inc. | 4,775,700 | 216,864 |
| * | Salix Pharmaceuticals Ltd. | 2,147,945 | 209,081 |
| * | Actavis plc | 986,000 | 186,334 |
| *,1 | Medicines Co. | 4,599,069 | 159,864 |
| | AbbVie Inc. | 1,407,500 | 69,291 |
| * | Mallinckrodt plc | 500,325 | 28,934 |
| | | | 8,602,702 |
| Total United States | | 25,815,848 |
| International (21.6%) | | |
| Belgium (1.9%) | | |
| 1 | UCB SA | 9,345,949 | 661,141 |
| |
| Canada (0.3%) | | |
| * | Catamaran Corp. | 2,113,400 | 102,753 |
| |
| Denmark (0.2%) | | |
| | H Lundbeck A/S | 2,224,230 | 55,081 |
| |
| France (0.4%) | | |
| | Sanofi | 1,092,844 | 106,975 |
| | Ipsen SA | 1,094,832 | 45,930 |
| | | | 152,905 |
| | |
| Germany (0.6%) | | |
| Bayer AG | 1,197,999 | 157,727 |
| Fresenius Medical Care | | |
| AG & Co. KGaA | 511,950 | 36,010 |
| | | 193,737 |
| Ireland (0.1%) | | |
| *,1 Prothena Corp. plc | 1,327,524 | 41,074 |
| |
| Israel (1.7%) | | |
| Teva Pharmaceutical | | |
| Industries Ltd. ADR | 13,145,600 | 586,688 |
| |
| Japan (6.8%) | | |
| Astellas Pharma Inc. | 13,771,400 | 846,921 |
| Daiichi Sankyo Co. Ltd. | 17,335,000 | 286,925 |
| Shionogi & Co. Ltd. | 13,726,534 | 279,036 |
| Takeda Pharmaceutical | | |
| Co. Ltd. | 5,599,900 | 261,082 |
| Eisai Co. Ltd. | 6,188,800 | 236,803 |
| Chugai Pharmaceutical | | |
| Co. Ltd. | 5,621,700 | 127,296 |
| Ono Pharmaceutical | | |
| Co. Ltd. | 1,415,800 | 123,717 |
| * Olympus Corp. | 3,797,100 | 111,564 |
| Mitsubishi Tanabe | | |
| Pharma Corp. | 7,100,000 | 104,315 |
| | | 2,377,659 |
| Norway (0.1%) | | |
| * Algeta ASA | 565,247 | 32,380 |
| |
| Switzerland (6.0%) | | |
| Roche Holding AG | 4,159,833 | 1,143,139 |
| Novartis AG | 6,849,049 | 541,648 |
| Actelion Ltd. | 2,403,582 | 225,451 |
| Roche Holding AG | | |
| (Bearer) | 664,320 | 182,488 |
| | | 2,092,726 |
| United Kingdom (3.5%) | | |
| AstraZeneca plc | 19,027,287 | 1,207,976 |
| Total International | | 7,504,120 |
| Total Common Stocks | | |
| (Cost $17,661,180) | | 33,319,968 |
15
Health Care Fund
| | |
| | Face | Market |
| | Amount | Value |
| | ($000) | ($000) |
| Temporary Cash Investments (4.3%) | |
| Repurchase Agreements (2.9%) | |
| Bank of America Securities, | |
| LLC 0.020%, 2/3/14 | | |
| (Dated 1/31/14, Repurchase | |
| Value $16,000,000, | | |
| collateralized by Federal | |
| Home Loan Mortgage Corp. | |
| 4.000%, 3/1/43, and Federal | |
| National Mortgage Assn. | |
| 3.500%–4.000%, | | |
| 5/1/43–1/1/44, with a | | |
| value of $16,320,000) | 16,000 | 16,000 |
| Barclays Capital Inc. 0.020%, | | |
| 2/3/14 (Dated 1/31/14, | | |
| Repurchase Value | | |
| $68,400,000, collateralized | |
| by U.S. Treasury Note/Bond | |
| 1.750%–2.875%, | | |
| 5/31/16–5/15/43, with a | |
| value of $69,768,000) | 68,400 | 68,400 |
| Barclays Capital Inc. 0.020%, | | |
| 2/5/14 (Dated 1/29/14, | | |
| Repurchase Value | | |
| $175,001,000, collateralized | |
| by Federal Home Loan | |
| Mortgage Corp. 4.000%– | |
| 4.700%, 7/1/38–1/1/43, | |
| Federal National Mortgage | |
| Assn. 1.339%–5.500%, | |
| 12/1/27–6/1/43, and U.S. | |
| Treasury Note/Bond 2.000%, | |
| 11/30/20, with a value of | |
| $178,500,000) | 175,000 | 175,000 |
| BNP Paribas Securities Corp. | |
| 0.040%, 2/3/14 (Dated | | |
| 1/31/14, Repurchase Value | |
| $53,900,000, collateralized | |
| by Federal Home Loan | |
| Mortgage Corp. 3.000%– | |
| 6.500%, 7/1/14–6/1/42, | |
| Federal National Mortgage | |
| Assn. 2.500%–6.500%, | |
| 8/1/20–10/1/43, Government | |
| National Mortgage Assn. | |
| 3.000%–6.500%, 5/15/23– | |
| 12/20/43, and U.S. Treasury | |
| Note/Bond 1.000%–1.875%, | |
| 5/15/14–9/30/17, with a value | |
| of $54,978,000) | 53,900 | 53,900 |
| HSBC Bank USA 0.020%, | | |
| 2/3/14 (Dated 1/31/14, | | |
| Repurchase Value | | |
| $17,700,000, collateralized | | |
| by Federal National | | |
| Mortgage Assn. 4.000%, | | |
| 6/1/26, with a value of | | |
| $18,055,000) | 17,700 | 17,700 |
| HSBC Bank USA 0.020%, | | |
| 2/3/14 (Dated 1/31/14, | | |
| Repurchase Value | | |
| $225,000,000, collateralized | | |
| by Federal National | | |
| Mortgage Assn. 3.000%– | | |
| 4.000%, 2/1/32–1/1/43, | | |
| with a value of | | |
| $229,504,000) | 225,000 | 225,000 |
| Morgan Stanley & Co., Inc. | | |
| 0.030%, 2/3/14 (Dated | | |
| 1/31/14, Repurchase | | |
| Value $467,801,000, | | |
| collateralized by Federal | | |
| Home Loan Mortgage | | |
| Corp. 2.500%–7.000%, | | |
| 1/1/18–1/1/44, and Federal | | |
| National Mortgage Assn. | | |
| 3.000%–5.000%, 2/1/27– | | |
| 12/1/43, with a value of | | |
| $477,156,000) | 467,800 | 467,800 |
| | | 1,023,800 |
| Commercial Paper (1.4%) | | |
| 3M Co., 0.050%, 3/25/14 | 74,000 | 73,985 |
| General Electric Capital | | |
| Corp., 0.130%, 3/12/14 | 200,000 | 199,968 |
| General Electric Capital | | |
| Corp., 0.180%, 3/11/14 | 200,000 | 199,968 |
| | | 473,921 |
| Total Temporary Cash Investments | |
| (Cost $1,497,729) | | 1,497,721 |
| Total Investments (100.3%) | | |
| (Cost $19,158,909) | | 34,817,689 |
| Other Assets and Liabilities (-0.3%) | |
| Other Assets | | 117,186 |
| Liabilities | | (208,322) |
| | | (91,136) |
| Net Assets (100%) | | 34,726,553 |
16
Health Care Fund
| |
| At January 31, 2014, net assets consisted of: |
| | Amount |
| | ($000) |
| Paid-in Capital | 17,640,037 |
| Overdistributed Net Investment Income | (83,069) |
| Accumulated Net Realized Gains | 1,505,296 |
| Unrealized Appreciation (Depreciation) | |
| Investment Securities | 15,658,780 |
| Forward Currency Contracts | 5,044 |
| Foreign Currencies | 465 |
| Net Assets | 34,726,553 |
| |
| |
| Investor Shares—Net Assets | |
| Applicable to 51,690,044 outstanding | |
| $.001 par value shares of beneficial | |
| interest (unlimited authorization) | 9,905,425 |
| Net Asset Value Per Share— | |
| Investor Shares | $191.63 |
| |
| |
| Admiral Shares—Net Assets | |
| Applicable to 307,052,552 outstanding | |
| $.001 par value shares of beneficial | |
| interest (unlimited authorization) | 24,821,128 |
| Net Asset Value Per Share— | |
| Admiral Shares | $80.84 |
See Note A in Notes to Financial Statements.
* Non-income-producing security.
1 Considered an affiliated company of the fund as the fund owns more than 5% of the outstanding voting securities of such company.
ADR—American Depositary Receipt.
See accompanying Notes, which are an integral part of the Financial Statements.
17
Health Care Fund
Statement of Assets and Liabilities
As of January 31, 2014
| |
| | Amount |
| | ($000) |
| Assets | |
| Investments in Securities, at Value | |
| Unaffiliated Issuers | 31,609,590 |
| Affiliated Issuers | 3,208,099 |
| Total Investments in Securities | 34,817,689 |
| Receivables for Investment Securities Sold | 64,140 |
| Other Assets | 53,046 |
| Total Assets | 34,934,875 |
| Liabilities | |
| Payables for Investment Securities Purchased | 116,918 |
| Other Liabilities | 91,404 |
| Total Liabilities | 208,322 |
| Net Assets | 34,726,553 |
See accompanying Notes, which are an integral part of the Financial Statements.
18
Health Care Fund
Statement of Operations
| |
| | Year Ended |
| | January 31, 2014 |
| | ($000) |
| Investment Income | |
| Income | |
| Dividends1,2 | 494,571 |
| Interest | 1,383 |
| Securities Lending | 1,619 |
| Total Income | 497,573 |
| Expenses | |
| Investment Advisory Fees—Note B | 43,423 |
| The Vanguard Group—Note C | |
| Management and Administrative—Investor Shares | 16,764 |
| Management and Administrative—Admiral Shares | 27,297 |
| Marketing and Distribution—Investor Shares | 1,412 |
| Marketing and Distribution—Admiral Shares | 2,485 |
| Custodian Fees | 703 |
| Auditing Fees | 29 |
| Shareholders’ Reports—Investor Shares | 151 |
| Shareholders’ Reports—Admiral Shares | 68 |
| Trustees’ Fees and Expenses | 56 |
| Total Expenses | 92,388 |
| Net Investment Income | 405,185 |
| Realized Net Gain (Loss) | |
| Investment Securities Sold2 | 3,307,784 |
| Foreign Currencies and Forward Currency Contracts | 44,202 |
| Realized Net Gain (Loss) | 3,351,986 |
| Change in Unrealized Appreciation (Depreciation) | |
| Investment Securities | 5,689,024 |
| Foreign Currencies and Forward Currency Contracts | (24,512) |
| Change in Unrealized Appreciation (Depreciation) | 5,664,512 |
| Net Increase (Decrease) in Net Assets Resulting from Operations | 9,421,683 |
| 1 Dividends are net of foreign withholding taxes of $17,080,000. |
| 2 Dividend income and realized net gain (loss) from affiliated companies of the fund were $7,462,000 and ($26,180,000), respectively. |
See accompanying Notes, which are an integral part of the Financial Statements.
19
Health Care Fund
Statement of Changes in Net Assets
| | |
| | Year Ended January 31, |
| | 2014 | 2013 |
| | ($000) | ($000) |
| Increase (Decrease) in Net Assets | | |
| Operations | | |
| Net Investment Income | 405,185 | 446,924 |
| Realized Net Gain (Loss) | 3,351,986 | 954,764 |
| Change in Unrealized Appreciation (Depreciation) | 5,664,512 | 2,709,551 |
| Net Increase (Decrease) in Net Assets Resulting from Operations | 9,421,683 | 4,111,239 |
| Distributions | | |
| Net Investment Income | | |
| Investor Shares | (114,317) | (153,444) |
| Admiral Shares | (298,735) | (289,547) |
| Realized Capital Gain1 | | |
| Investor Shares | (709,234) | (121,753) |
| Admiral Shares | (1,636,385) | (223,106) |
| Total Distributions | (2,758,671) | (787,850) |
| Capital Share Transactions | | |
| Investor Shares | (941,911) | (1,034,400) |
| Admiral Shares | 4,322,361 | 963,636 |
| Net Increase (Decrease) from Capital Share Transactions | 3,380,450 | (70,764) |
| Total Increase (Decrease) | 10,043,462 | 3,252,625 |
| Net Assets | | |
| Beginning of Period | 24,683,091 | 21,430,466 |
| End of Period2 | 34,726,553 | 24,683,091 |
| 1 Includes fiscal 2014 and 2013 short-term gain distributions totaling $146,863,000 and $27,207,000, respectively. Short-term gain |
| distributions are treated as ordinary income dividends for tax purposes. |
| 2 Net Assets—End of Period includes undistributed (overdistributed) net investment income of ($83,069,000) and ($58,424,000). |
See accompanying Notes, which are an integral part of the Financial Statements.
20
Health Care Fund
Financial Highlights
| | | | | |
| Investor Shares | | | | | |
| |
| For a Share Outstanding | Year Ended January 31, |
| Throughout Each Period | 2014 | 2013 | 2012 | 2011 | 2010 |
| Net Asset Value, Beginning of Period | $152.58 | $131.96 | $124.30 | $120.06 | $99.12 |
| Investment Operations | | | | | |
| Net Investment Income | 2.350 | 2.777 | 2.300 | 2.046 | 1.902 |
| Net Realized and Unrealized Gain (Loss) | | | | | |
| on Investments | 53.058 | 22.791 | 12.780 | 7.404 | 21.530 |
| Total from Investment Operations | 55.408 | 25.568 | 15.080 | 9.450 | 23.432 |
| Distributions | | | | | |
| Dividends from Net Investment Income | (2.357) | (2.757) | (2.237) | (2.007) | (1.761) |
| Distributions from Realized Capital Gains | (14.001) | (2.191) | (5.183) | (3.203) | (.731) |
| Total Distributions | (16.358) | (4.948) | (7.420) | (5.210) | (2.492) |
| Net Asset Value, End of Period | $191.63 | $152.58 | $131.96 | $124.30 | $120.06 |
| |
| Total Return1 | 37.66% | 19.59% | 12.50% | 7.95% | 23.63% |
| |
| Ratios/Supplemental Data | | | | | |
| Net Assets, End of Period (Millions) | $9,905 | $8,681 | $8,462 | $8,447 | $11,692 |
| Ratio of Total Expenses to | | | | | |
| Average Net Assets | 0.35% | 0.35% | 0.35% | 0.35% | 0.36% |
| Ratio of Net Investment Income to | | | | | |
| Average Net Assets | 1.33% | 1.94% | 1.72% | 1.67% | 1.73% |
| Portfolio Turnover Rate | 21% | 8% | 8% | 9% | 6% |
| 1 Total returns do not include transaction or account service fees that may have applied in the periods shown. Fund prospectuses provide |
| information about any applicable transaction and account service fees. |
See accompanying Notes, which are an integral part of the Financial Statements.
21
Health Care Fund
Financial Highlights
| | | | | |
| Admiral Shares | | | | | |
| |
| For a Share Outstanding | Year Ended January 31, |
| Throughout Each Period | 2014 | 2013 | 2012 | 2011 | 2010 |
| Net Asset Value, Beginning of Period | $64.37 | $55.68 | $52.45 | $50.67 | $41.83 |
| Investment Operations | | | | | |
| Net Investment Income | 1.040 | 1.211 | 1.005 | .891 | .835 |
| Net Realized and Unrealized Gain (Loss) | | | | | |
| on Investments | 22.378 | 9.605 | 5.392 | 3.115 | 9.091 |
| Total from Investment Operations | 23.418 | 10.816 | 6.397 | 4.006 | 9.926 |
| Distributions | | | | | |
| Dividends from Net Investment Income | (1.042) | (1.201) | (.980) | (.874) | (.777) |
| Distributions from Realized Capital Gains | (5.906) | (.925) | (2.187) | (1.352) | (.309) |
| Total Distributions | (6.948) | (2.126) | (3.167) | (2.226) | (1.086) |
| Net Asset Value, End of Period | $80.84 | $64.37 | $55.68 | $52.45 | $50.67 |
| |
| Total Return1 | 37.74% | 19.65% | 12.57% | 7.99% | 23.72% |
| |
| Ratios/Supplemental Data | | | | | |
| Net Assets, End of Period (Millions) | $24,821 | $16,002 | $12,968 | $11,459 | $8,619 |
| Ratio of Total Expenses to | | | | | |
| Average Net Assets | 0.30% | 0.30% | 0.30% | 0.30% | 0.29% |
| Ratio of Net Investment Income to | | | | | |
| Average Net Assets | 1.38% | 1.99% | 1.77% | 1.72% | 1.80% |
| Portfolio Turnover Rate | 21% | 8% | 8% | 9% | 6% |
| 1 Total returns do not include transaction fees that may have applied in the periods shown. Fund prospectuses provide information about any |
| applicable transaction fees. |
See accompanying Notes, which are an integral part of the Financial Statements.
22
Health Care Fund
Notes to Financial Statements
Vanguard Health Care Fund is registered under the Investment Company Act of 1940 as an open-end investment company, or mutual fund. The fund invests in securities of foreign issuers, which may subject it to investment risks not normally associated with investing in securities of U.S. corporations. The fund offers two classes of shares: Investor Shares and Admiral Shares. Investor Shares are available to any investor who meets the fund’s minimum purchase requirements. Admiral Shares are designed for investors who meet certain administrative, service, and account-size criteria.
A. The following significant accounting policies conform to generally accepted accounting principles for U.S. mutual funds. The fund consistently follows such policies in preparing its financial statements.
1. Security Valuation: Securities are valued as of the close of trading on the New York Stock Exchange (generally 4 p.m., Eastern time) on the valuation date. Equity securities are valued at the latest quoted sales prices or official closing prices taken from the primary market in which each security trades; such securities not traded on the valuation date are valued at the mean of the latest quoted bid and asked prices. Securities for which market quotations are not readily available, or whose values have been affected by events occurring before the fund’s pricing time but after the close of the securities’ primary markets, are valued at their fair values calculated according to procedures adopted by the board of trustees. These procedures include obtaining quotations from an independent pricing service, monitoring news to identify significant market- or security-specific events, and evaluating changes in the values of foreign market proxies (for example, ADRs, futures contracts, or exchange-traded funds), between the time the foreign markets close and the fund’s pricing time. When fair-value pricing is employed, the prices of securities used by a fund to calculate its net asset value may differ from quoted or published prices for the same securities. Temporary cash investments acquired over 60 days to maturity are valued using the latest bid prices or using valuations based on a matrix system (which considers such factors as security prices, yields, maturities, and ratings), both as furnished by independent pricing services. Other temporary cash investments are valued at amortized cost, which approximates market value.
2. Foreign Currency: Securities and other assets and liabilities denominated in foreign currencies are translated into U.S. dollars using exchange rates obtained from an independent third party as of the fund’s pricing time on the valuation date. Realized gains (losses) and unrealized appreciation (depreciation) on investment securities include the effects of changes in exchange rates since the securities were purchased, combined with the effects of changes in security prices. Fluctuations in the value of other assets and liabilities resulting from changes in exchange rates are recorded as unrealized foreign currency gains (losses) until the assets or liabilities are settled in cash, at which time they are recorded as realized foreign currency gains (losses).
3. Forward Currency Contracts: The fund enters into forward currency contracts to protect the value of securities and related receivables and payables against changes in future foreign exchange rates. The fund’s risks in using these contracts include movement in the values of the foreign currencies relative to the U.S. dollar and the ability of the counterparties to fulfill their obligations under the contracts. The fund mitigates its counterparty risk by entering into forward currency contracts only with a diverse group of prequalified counterparties, monitoring their financial strength, entering into master netting arrangements with its counterparties, and requiring its counterparties to transfer collateral as security for their performance. The master netting arrangements provide that, in the event of a counterparty’s default (including bankruptcy), the fund may terminate the forward currency contracts, determine the net amount owed by either party in accordance with its master netting
23
Health Care Fund
arrangements, and sell or retain any collateral held up to the net amount owed to the fund under the master netting arrangements. The forward currency contracts contain provisions whereby a counter-party may terminate open contracts if the fund’s net assets decline below a certain level, triggering a payment by the fund if the fund is in a net liability position at the time of the termination. The payment amount would be reduced by any collateral the fund has pledged. Any assets pledged as collateral for open contracts are noted in the Statement of Net Assets. The value of collateral received or pledged is compared daily to the value of the forward currency contracts exposure with each counterparty, and any difference, if in excess of a specified minimum transfer amount, is adjusted and settled within two business days.
Forward currency contracts are valued at their quoted daily prices obtained from an independent third party, adjusted for currency risk based on the expiration date of each contract. The aggregate notional amounts of the contracts are not recorded in the Statement of Net Assets. Fluctuations in the value of the contracts are recorded in the Statement of Net Assets as an asset (liability) and in the Statement of Operations as unrealized appreciation (depreciation) until the contracts are closed, when they are recorded as realized forward currency contract gains (losses).
During the year ended January 31, 2014, the fund’s average investment in forward currency contracts represented less than 1% of net assets, based on quarterly average notional amounts.
4. Repurchase Agreements: The fund enters into repurchase agreements with institutional counter-parties. Securities pledged as collateral to the fund under repurchase agreements are held by a custodian bank until the agreements mature. Each agreement requires that the market value of the collateral be sufficient to cover payments of interest and principal. The fund further mitigates its counterparty risk by entering into repurchase agreements only with a diverse group of prequalified counterparties, monitoring their financial strength, and entering into master repurchase agreements with its counterparties. The master repurchase agreements provide that, in the event of a counter-party’s default (including bankruptcy), the fund may terminate any repurchase agreements with that counterparty, determine the net amount owed, and sell or retain the collateral up to the net amount owed to the fund. Such action may be subject to legal proceedings, which may delay or limit the disposition of collateral.
5. Federal Income Taxes: The fund intends to continue to qualify as a regulated investment company and distribute all of its taxable income. Management has analyzed the fund’s tax positions taken for all open federal income tax years (January 31, 2011–2014), and has concluded that no provision for federal income tax is required in the fund’s financial statements.
6. Distributions: Distributions to shareholders are recorded on the ex-dividend date.
7. Securities Lending: To earn additional income, the fund may lend its securities to qualified institutional borrowers. Security loans are required to be secured at all times by collateral in an amount at least equal to the market value of securities loaned. Daily market fluctuations could cause the value of loaned securities to be more or less than the value of the collateral received. When this occurs, the collateral is adjusted and settled on the next business day. The fund further mitigates its counterparty risk by entering into securities lending transactions only with a diverse group of prequalified counterparties, monitoring their financial strength, and entering into master securities lending agreements with its counterparties. The master securities lending agreements provide that,
24
Health Care Fund
in the event of a counterparty’s default (including bankruptcy), the fund may terminate any loans with that borrower, determine the net amount owed, and sell or retain the collateral up to the net amount owed to the fund; however, such actions may be subject to legal proceedings. While collateral mitigates counterparty risk, in the absence of a default the fund may experience delays and costs in recovering the securities loaned. The fund invests cash collateral received in Vanguard Market Liquidity Fund, and records a liability for the return of the collateral, during the period the securities are on loan. Securities lending income represents fees charged to borrowers plus income earned on invested cash collateral, less expenses associated with the loan.
8. Other: Dividend income is recorded on the ex-dividend date. Interest income is accrued daily. Premiums and discounts on debt securities purchased are amortized and accreted, respectively, to interest income over the lives of the respective securities. Security transactions are accounted for on the date securities are bought or sold. Costs used to determine realized gains (losses) on the sale of investment securities are those of the specific securities sold.
Each class of shares has equal rights as to assets and earnings, except that each class separately bears certain class-specific expenses related to maintenance of shareholder accounts (included in Management and Administrative expenses) and shareholder reporting. Marketing and distribution expenses are allocated to each class of shares based on a method approved by the board of trustees. Income, other non-class-specific expenses, and gains and losses on investments are allocated to each class of shares based on its relative net assets.
B. Wellington Management Company, LLP, provides investment advisory services to the fund for a fee calculated at an annual percentage rate of average net assets. For the year ended January 31, 2014, the investment advisory fee represented an effective annual rate of 0.15% of the fund’s average net assets.
C. The Vanguard Group furnishes at cost corporate management, administrative, marketing, and distribution services. The costs of such services are allocated to the fund under methods approved by the board of trustees. The fund has committed to provide up to 0.40% of its net assets in capital contributions to Vanguard. At January 31, 2014, the fund had contributed capital of $3,734,000 to Vanguard (included in Other Assets), representing 0.01% of the fund’s net assets and 1.49% of Vanguard’s capitalization. The fund’s trustees and officers are also directors and officers of Vanguard.
D. Various inputs may be used to determine the value of the fund’s investments. These inputs are summarized in three broad levels for financial statement purposes. The inputs or methodologies used to value securities are not necessarily an indication of the risk associated with investing in those securities.
Level 1—Quoted prices in active markets for identical securities.
Level 2—Other significant observable inputs (including quoted prices for similar securities, interest rates, prepayment speeds, credit risk, etc.).
Level 3—Significant unobservable inputs (including the fund’s own assumptions used to determine the fair value of investments).
25
Health Care Fund
The following table summarizes the market value of the fund’s investments as of January 31, 2014, based on the inputs used to value them:
| | | |
| | Level 1 | Level 2 | Level 3 |
| Investments | ($000) | ($000) | ($000) |
| Common Stocks—U.S. | 25,815,848 | — | — |
| Common Stocks—International | 730,515 | 6,773,605 | — |
| Temporary Cash Investments | — | 1,497,721 | — |
| Forward Currency Contracts—Assets | — | 5,044 | — |
| Total | 26,546,363 | 8,276,370 | — |
At January 31, 2014, the fund had open forward currency contracts to receive and deliver currencies as follows. Unrealized appreciation (depreciation) on open forward currency contracts is treated as realized gain (loss) for tax purposes.
| | | | | |
| | | | | | Unrealized |
| | Contract | | | | Appreciation |
| | Settlement | | Contract Amount (000) | (Depreciation) |
| Counterparty | Date | | Receive | Deliver | ($000) |
| Bank of America NA | 2/14/14 | USD | 191,630 | JPY 19,062,436 | 5,044 |
| JPY—Japanese yen. |
| USD—U.S. dollar. |
At January 31, 2014, the counterparty had deposited in segregated accounts securities with a value of $5,055,000 in connection with amounts due to the fund for open forward currency contracts.
E. Distributions are determined on a tax basis and may differ from net investment income and realized capital gains for financial reporting purposes. Differences may be permanent or temporary. Permanent differences are reclassified among capital accounts in the financial statements to reflect their tax character. Temporary differences arise when certain items of income, expense, gain, or loss are recognized in different periods for financial statement and tax purposes. These differences will reverse at some time in the future. Differences in classification may also result from the treatment of short-term gains as ordinary income for tax purposes.
During the year ended January 31, 2014, the fund realized net foreign currency losses of $3,385,000, which decreased distributable net income for tax purposes; accordingly, such losses have been reclassified from accumulated net realized gains to overdistributed net investment income.
The fund used a tax accounting practice to treat a portion of the price of capital shares redeemed during the year as distributions from net investment income and realized capital gains. Accordingly, the fund has reclassified $13,393,000 from overdistributed net investment income, and $98,572,000 from accumulated net realized gains, to paid-in capital.
For tax purposes, at January 31, 2014, the fund had $136,160,000 of ordinary income and $1,407,046,000 of long-term capital gains available for distribution.
At January 31, 2014, the cost of investment securities for tax purposes was $19,227,914,000. Net unrealized appreciation of investment securities for tax purposes was $15,589,775,000, consisting of unrealized gains of $15,646,557,000 on securities that had risen in value since their purchase and $56,782,000 in unrealized losses on securities that had fallen in value since their purchase.
26
Health Care Fund
F. During the year ended January 31, 2014, the fund purchased $7,024,810,000 of investment securities and sold $5,832,765,000 of investment securities, other than temporary cash investments.
G. Capital share transactions for each class of shares were:
| | | | |
| | Year Ended January 31, |
| | | 2014 | | 2013 |
| | Amount | Shares | Amount | Shares |
| | ($000) | (000) | ($000) | (000) |
| Investor Shares | | | | |
| Issued | 1,769,228 | 10,118 | 795,411 | 5,590 |
| Issued in Lieu of Cash Distributions | 784,653 | 4,547 | 261,109 | 1,808 |
| Redeemed1 | (3,495,792) | (19,870) | (2,090,920) | (14,631) |
| Net Increase (Decrease)—Investor Shares | (941,911) | (5,205) | (1,034,400) | (7,233) |
| Admiral Shares | | | | |
| Issued | 4,148,023 | 55,782 | 1,750,549 | 28,857 |
| Issued in Lieu of Cash Distributions | 1,775,274 | 24,189 | 467,163 | 7,666 |
| Redeemed1 | (1,600,936) | (21,502) | (1,254,076) | (20,860) |
| Net Increase (Decrease)—Admiral Shares | 4,322,361 | 58,469 | 963,636 | 15,663 |
| 1 Net of redemption fees for fiscal 2013 of $378,000 (fund total). Effective May 23, 2012, the redemption fee was eliminated. |
H. Certain of the fund’s investments are in companies that are considered to be affiliated companies of the fund because the fund owns more than 5% of the outstanding voting securities of the company. Transactions during the period in securities of these companies were as follows:
| | | | | |
| | | Current Period Transactions | |
| | Jan. 31, 2013 | | Proceeds from | | Jan. 31, 2014 |
| | Market | Purchases | Securities | Dividend | Market |
| | Value | at Cost | Sold | Income | Value |
| | ($000) | ($000) | ($000) | ($000) | ($000) |
| Alnylam Pharmaceuticals Inc. | — | 231,402 | — | — | 343,441 |
| Forest Laboratories Inc. | 956,887 | 12,310 | — | — | 1,768,013 |
| Health Management | | | | | |
| Associates Inc. Class A | 163,458 | 38,387 | 254,993 | — | — |
| Medicines Co. | NA1 | 129,843 | — | — | 159,864 |
| PAREXEL International Corp. | NA1 | 100,908 | — | — | 234,566 |
| Prothena Corp. plc | NA1 | 25,414 | — | — | 41,074 |
| UCB SA | NA1 | 180,039 | — | 7,462 | 661,141 |
| | 1,120,345 | | | 7,462 | 3,208,099 |
| 1 Not applicable — At January 31, 2013, the issuer was not an affiliated company of the fund. |
I. Management has determined that no material events or transactions occurred subsequent to
January 31, 2014, that would require recognition or disclosure in these financial statements.
27
Report of Independent Registered
Public Accounting Firm
To the Trustees of Vanguard Specialized Funds and the Shareholders of Vanguard Health Care Fund:
In our opinion, the accompanying statement of net assets and statement of assets and liabilities and the related statements of operations and of changes in net assets and the financial highlights present fairly, in all material respects, the financial position of Vanguard Health Care Fund (constituting a separate portfolio of Vanguard Specialized Funds, hereafter referred to as the “Fund”) at January 31, 2014, the results of its operations for the year then ended, the changes in its net assets for each of the two years in the period then ended, and the financial highlights for each of the five years in the period then ended, in conformity with accounting principles generally accepted in the United States of America. These financial statements and financial highlights (hereafter referred to as “financial statements”) are the responsibility of the Fund’s management; our responsibility is to express an opinion on these financial statements based on our audits. We conducted our audits of these financial statements in accordance with the standards of the Public Company Accounting Oversight Board (United States). Those standards require that we plan and perform the audit to obtain reasonable assurance about whether the financial statements are free of material misstatement. An audit includes examining, on a test basis, evidence supporting the amounts and disclosures in the financial statements, assessing the accounting principles used and significant estimates made by management, and evaluating the overall financial statement presentation. We believe that our audits, which included confirmation of securities at January 31, 2014 by correspondence with the custodians and brokers, provide a reasonable basis for our opinion.
/s/PricewaterhouseCoopers LLP
Philadelphia, Pennsylvania
March 13, 2014
Special 2013 tax information (unaudited) for Vanguard Health Care Fund
This information for the fiscal year ended January 31, 2014, is included pursuant to provisions of
the Internal Revenue Code.
The fund distributed $2,290,707,000 as capital gain dividends (from net long-term capital gains)
to shareholders during the fiscal year.
For nonresident alien shareholders, 100% of short-term capital gain dividends distributed by the fund
are qualified short-term capital gains.
The fund distributed $466,995,000 of qualified dividend income to shareholders during the fiscal year.
For corporate shareholders, 46.0% of investment income (dividend income plus short-term gains,
if any) qualifies for the dividends-received deduction.
28
Your Fund’s After-Tax Returns
This table presents returns for your fund both before and after taxes. The after-tax returns are shown in two ways: (1) assuming that an investor owned the fund during the entire period and paid taxes on the fund’s distributions, and (2) assuming that an investor paid taxes on the fund’s distributions and sold all shares at the end of each period.
Calculations are based on the highest individual federal income tax and capital gains tax rates in effect at the times of the distributions and the hypothetical sales. State and local taxes were not considered. After-tax returns reflect any qualified dividend income, using actual prior-year figures and estimates for 2014. (In the example, returns after the sale of fund shares may be higher than those assuming no sale. This occurs when the sale would have produced a capital loss. The calculation assumes that the investor received a tax deduction for the loss.)
The table shows returns for one share class only; returns for other share classes will differ. Please note that your actual after-tax returns will depend on your tax situation and may differ from those shown. Also note that if you own the fund in a tax-deferred account, such as an individual retirement account or a 401(k) plan, this information does not apply to you. Such accounts are not subject to current taxes.
Finally, keep in mind that a fund’s performance—whether before or after taxes—does not guarantee future results.
| | | |
| Average Annual Total Returns: Health Care Fund Investor Shares | | |
| Periods Ended January 31, 2014 | | | |
| |
| |
| | One | Five | Ten |
| | Year | Years | Years |
| Returns Before Taxes | 37.66% | 19.84% | 10.83% |
| Returns After Taxes on Distributions | 34.67 | 18.77 | 9.72 |
| Returns After Taxes on Distributions and Sale of Fund Shares | 23.19 | 16.14 | 8.81 |
29
About Your Fund’s Expenses
As a shareholder of the fund, you incur ongoing costs, which include costs for portfolio management, administrative services, and shareholder reports (like this one), among others. Operating expenses, which are deducted from a fund’s gross income, directly reduce the investment return of the fund.
A fund’s expenses are expressed as a percentage of its average net assets. This figure is known as the expense ratio. The following examples are intended to help you understand the ongoing costs (in dollars) of investing in your fund and to compare these costs with those of other mutual funds. The examples are based on an investment of $1,000 made at the beginning of the period shown and held for the entire period.
The accompanying table illustrates your fund’s costs in two ways:
• Based on actual fund return. This section helps you to estimate the actual expenses that you paid over the period. The ”Ending Account Value“ shown is derived from the fund‘s actual return, and the third column shows the dollar amount that would have been paid by an investor who started with $1,000 in the fund. You may use the information here, together with the amount you invested, to estimate the expenses that you paid over the period.
To do so, simply divide your account value by $1,000 (for example, an $8,600 account value divided by $1,000 = 8.6), then multiply the result by the number given for your fund under the heading ”Expenses Paid During Period.“
• Based on hypothetical 5% yearly return. This section is intended to help you compare your fund‘s costs with those of other mutual funds. It assumes that the fund had a yearly return of 5% before expenses, but that the expense ratio is unchanged. In this case—because the return used is not the fund’s actual return—the results do not apply to your investment. The example is useful in making comparisons because the Securities and Exchange Commission requires all mutual funds to calculate expenses based on a 5% return. You can assess your fund’s costs by comparing this hypothetical example with the hypothetical examples that appear in shareholder reports of other funds.
Note that the expenses shown in the table are meant to highlight and help you compare ongoing costs only and do not reflect transaction costs incurred by the fund for buying and selling securities. Further, the expenses do not include any purchase, redemption, or account service fees described in the fund prospectus. If such fees were applied to your account, your costs would be higher. Your fund does not carry a “sales load.”
The calculations assume no shares were bought or sold during the period. Your actual costs may have been higher or lower, depending on the amount of your investment and the timing of any purchases or redemptions.
You can find more information about the fund’s expenses, including annual expense ratios, in the Financial Statements section of this report. For additional information on operating expenses and other shareholder costs, please refer to your fund’s current prospectus.
30
| | | |
| Six Months Ended January 31, 2014 | | | |
| | Beginning | Ending | Expenses |
| | Account Value | Account Value | Paid During |
| Health Care Fund | 7/31/2013 | 1/31/2014 | Period |
| Based on Actual Fund Return | | | |
| Investor Shares | $1,000.00 | $1,155.08 | $1.85 |
| Admiral Shares | 1,000.00 | 1,155.43 | 1.58 |
| Based on Hypothetical 5% Yearly Return | | | |
| Investor Shares | $1,000.00 | $1,023.49 | $1.73 |
| Admiral Shares | 1,000.00 | 1,023.74 | 1.48 |
The calculations are based on expenses incurred in the most recent six-month period. The fund’s annualized six-month expense ratios for that
period are 0.34% for Investor Shares and 0.29% for Admiral Shares. The dollar amounts shown as “Expenses Paid” are equal to the
annualized expense ratio multiplied by the average account value over the period, multiplied by the number of days in the most recent
six-month period, then divided by the number of days in the most recent 12-month period.
31
Glossary
30-Day SEC Yield. A fund’s 30-day SEC yield is derived using a formula specified by the U.S. Securities and Exchange Commission. Under the formula, data related to the fund’s security holdings in the previous 30 days are used to calculate the fund’s hypothetical net income for that period, which is then annualized and divided by the fund’s estimated average net assets over the calculation period. For the purposes of this calculation, a security’s income is based on its current market yield to maturity (for bonds), its actual income (for asset-backed securities), or its projected dividend yield (for stocks). Because the SEC yield represents hypothetical annualized income, it will differ—at times significantly—from the fund’s actual experience. As a result, the fund’s income distributions may be higher or lower than implied by the SEC yield.
Beta. A measure of the magnitude of a fund’s past share-price fluctuations in relation to the ups and downs of a given market index. The index is assigned a beta of 1.00. Compared with a given index, a fund with a beta of 1.20 typically would have seen its share price rise or fall by 12% when the index rose or fell by 10%. For this report, beta is based on returns over the past 36 months for both the fund and the index. Note that a fund’s beta should be reviewed in conjunction with its R-squared (see definition). The lower the R-squared, the less correlation there is between the fund and the index, and the less reliable beta is as an indicator of volatility.
Dividend Yield. Dividend income earned by stocks, expressed as a percentage of the aggregate market value (or of net asset value, for a fund). The yield is determined by dividing the amount of the annual dividends by the aggregate value (or net asset value) at the end of the period. For a fund, the dividend yield is based solely on stock holdings and does not include any income produced by other investments.
Earnings Growth Rate. The average annual rate of growth in earnings over the past five years for the stocks now in a fund.
Equity Exposure. A measure that reflects a fund’s investments in stocks and stock futures. Any holdings in short-term reserves are excluded.
Expense Ratio. A fund’s total annual operating expenses expressed as a percentage of the fund’s average net assets. The expense ratio includes management and administrative expenses, but does not include the transaction costs of buying and selling portfolio securities.
Foreign Holdings. The percentage of a fund represented by securities or depositary receipts of companies based outside the United States.
Inception Date. The date on which the assets of a fund (or one of its share classes) are first invested in accordance with the fund’s investment objective. For funds with a subscription period, the inception date is the day after that period ends. Investment performance is measured from the inception date.
Median Market Cap. An indicator of the size of companies in which a fund invests; the midpoint of market capitalization (market price x shares outstanding) of a fund’s stocks, weighted by the proportion of the fund’s assets invested in each stock. Stocks representing half of the fund’s assets have market capitalizations above the median, and the rest are below it.
Price/Book Ratio. The share price of a stock divided by its net worth, or book value, per share. For a fund, the weighted average price/book ratio of the stocks it holds.
32
Price/Earnings Ratio. The ratio of a stock’s current price to its per-share earnings over the past year. For a fund, the weighted average P/E of the stocks it holds. P/E is an indicator of market expectations about corporate prospects; the higher the P/E, the greater the expectations for a company’s future growth.
R-Squared. A measure of how much of a fund’s past returns can be explained by the returns from the market in general, as measured by a given index. If a fund’s total returns were precisely synchronized with an index’s returns, its R-squared would be 1.00. If the fund’s returns bore no relationship to the index’s returns, its R-squared would be 0. For this report, R-squared is based on returns over the past 36 months for both the fund and the index.
Return on Equity. The annual average rate of return generated by a company during the past five years for each dollar of shareholder’s equity (net income divided by shareholder’s equity). For a fund, the weighted average return on equity for the companies whose stocks it holds.
Short-Term Reserves. The percentage of a fund invested in highly liquid, short-term securities that can be readily converted to cash.
Turnover Rate. An indication of the fund’s trading activity. Funds with high turnover rates incur higher transaction costs and may be more likely to distribute capital gains (which may be taxable to investors). The turnover rate excludes in-kind transactions, which have minimal impact on costs.
Benchmark Information
Spliced Health Care Index: S&P 500 Index through December 31, 2001; S&P Health Care Index through May 31, 2010; MSCI All Country World Health Care Index thereafter.
33
This page intentionally left blank.
This page intentionally left blank.
The People Who Govern Your Fund
The trustees of your mutual fund are there to see that the fund is operated and managed in your best interests since, as a shareholder, you are a part owner of the fund. Your fund’s trustees also serve on the board of directors of The Vanguard Group, Inc., which is owned by the Vanguard funds and provides services to them on an at-cost basis.
A majority of Vanguard’s board members are independent, meaning that they have no affiliation with Vanguard or the funds they oversee, apart from the sizable personal investments they have made as private individuals. The independent board members have distinguished backgrounds in business, academia, and public service. Each of the trustees and executive officers oversees 180 Vanguard funds.
The following table provides information for each trustee and executive officer of the fund. More information about the trustees is in the Statement of Additional Information, which can be obtained, without charge, by contacting Vanguard at 800-662-7447, or online at vanguard.com.
| |
| InterestedTrustee1 | and Delphi Automotive LLP (automotive components); |
| | Senior Advisor at New Mountain Capital. |
| F. William McNabb III | |
| Born 1957. Trustee Since July 2009. Chairman of the | Amy Gutmann |
| Board. Principal Occupation(s) During the Past Five | Born 1949. Trustee Since June 2006. Principal |
| Years: Chairman of the Board of The Vanguard Group, | Occupation(s) During the Past Five Years: President of |
| Inc., and of each of the investment companies served | the University of Pennsylvania; Christopher H. Browne |
| by The Vanguard Group, since January 2010; Director | Distinguished Professor of Political Science, School of |
| of The Vanguard Group since 2008; Chief Executive | Arts and Sciences, and Professor of Communication, |
| Officer and President of The Vanguard Group, and of | Annenberg School for Communication, with secondary |
| each of the investment companies served by The | faculty appointments in the Department of Philosophy, |
| Vanguard Group, since 2008; Director of Vanguard | School of Arts and Sciences, and at the Graduate |
| Marketing Corporation; Managing Director of The | School of Education, University of Pennsylvania; |
| Vanguard Group (1995–2008). | Trustee of the National Constitution Center; Chair |
| | of the Presidential Commission for the Study of |
| | Bioethical Issues. |
| IndependentTrustees | |
| | JoAnn Heffernan Heisen |
| Emerson U. Fullwood | Born 1950. Trustee Since July 1998. Principal |
| Born 1948. Trustee Since January 2008. Principal | Occupation(s) During the Past Five Years: Corporate |
| Occupation(s) During the Past Five Years: Executive | Vice President and Chief Global Diversity Officer |
| Chief Staff and Marketing Officer for North America | (retired 2008) and Member of the Executive |
| and Corporate Vice President (retired 2008) of Xerox | Committee (1997–2008) of Johnson & Johnson |
| Corporation (document management products and | (pharmaceuticals/medical devices/consumer |
| services); Executive in Residence and 2010 | products); Director of Skytop Lodge Corporation |
| Distinguished Minett Professor at the Rochester | (hotels), the University Medical Center at Princeton, |
| Institute of Technology; Director of SPX Corporation | the Robert Wood Johnson Foundation, and the Center |
| (multi-industry manufacturing), the United Way of | for Talent Innovation; Member of the Advisory Board |
| Rochester, Amerigroup Corporation (managed health | of the Maxwell School of Citizenship and Public Affairs |
| care), the University of Rochester Medical Center, | at Syracuse University. |
| Monroe Community College Foundation, and North | |
| Carolina A&T University. | |
| | F. Joseph Loughrey |
| Rajiv L. Gupta | Born 1949. Trustee Since October 2009. Principal |
| Born 1945. Trustee Since December 2001.2 | Occupation(s) During the Past Five Years: President |
| Principal Occupation(s) During the Past Five Years: | and Chief Operating Officer (retired 2009) of Cummins |
| Chairman and Chief Executive Officer (retired 2009) | Inc. (industrial machinery); Chairman of the Board |
| and President (2006–2008) of Rohm and Haas Co. | of Hillenbrand, Inc. (specialized consumer services), |
| (chemicals); Director of Tyco International, Ltd. | and of Oxfam America; Director of SKF AB (industrial |
| (diversified manufacturing and services), Hewlett- | machinery), Hyster-Yale Materials Handling, Inc. |
| Packard Co. (electronic computer manufacturing), | (forklift trucks), the Lumina Foundation for Education, |
| | |
| and the V Foundation for Cancer Research; Member | Executive Officers | |
| of the Advisory Council for the College of Arts and | | |
| Letters and of the Advisory Board to the Kellogg | Glenn Booraem | |
| Institute for International Studies, both at the | Born 1967. Controller Since July 2010. Principal |
| University of Notre Dame. | Occupation(s) During the Past Five Years: Principal |
| | of The Vanguard Group, Inc.; Controller of each of |
| Mark Loughridge | the investment companies served by The Vanguard |
| Born 1953. Trustee Since March 2012. Principal | Group; Assistant Controller of each of the investment |
| Occupation(s) During the Past Five Years: Senior Vice | companies served by The Vanguard Group (2001–2010). |
| President and Chief Financial Officer (retired 2013) | | |
| at IBM (information technology services); Fiduciary | Thomas J. Higgins | |
| Member of IBM’s Retirement Plan Committee (2004– | Born 1957. Chief Financial Officer Since September |
| 2013); Member of the Council on Chicago Booth. | 2008. Principal Occupation(s) During the Past Five |
| | Years: Principal of The Vanguard Group, Inc.; Chief |
| Scott C. Malpass | Financial Officer of each of the investment companies |
| Born 1962. Trustee Since March 2012. Principal | served by The Vanguard Group; Treasurer of each of |
| Occupation(s) During the Past Five Years: Chief | the investment companies served by The Vanguard |
| Investment Officer and Vice President at the University | Group (1998–2008). | |
| of Notre Dame; Assistant Professor of Finance at the | | |
| Mendoza College of Business at Notre Dame; Member | Kathryn J. Hyatt | |
| of the Notre Dame 403(b) Investment Committee; | Born 1955. Treasurer Since November 2008. Principal |
| Board Member of TIFF Advisory Services, Inc. | Occupation(s) During the Past Five Years: Principal of |
| (investment advisor); Member of the Investment | The Vanguard Group, Inc.; Treasurer of each of the |
| Advisory Committees of the Financial Industry | investment companies served by The Vanguard |
| Regulatory Authority (FINRA) and of Major League | Group; Assistant Treasurer of each of the investment |
| Baseball. | companies served by The Vanguard Group (1988–2008). |
| |
| André F. Perold | Heidi Stam | |
| Born 1952. Trustee Since December 2004. Principal | Born 1956. Secretary Since July 2005. Principal |
| Occupation(s) During the Past Five Years: George | Occupation(s) During the Past Five Years: Managing |
| Gund Professor of Finance and Banking, Emeritus | Director of The Vanguard Group, Inc.; General Counsel |
| at the Harvard Business School (retired 2011); | of The Vanguard Group; Secretary of The Vanguard |
| Chief Investment Officer and Managing Partner of | Group and of each of the investment companies |
| HighVista Strategies LLC (private investment firm); | served by The Vanguard Group; Director and Senior |
| Director of Rand Merchant Bank; Overseer of the | Vice President of Vanguard Marketing Corporation. |
| Museum of Fine Arts Boston. | | |
| | Vanguard Senior ManagementTeam |
| Alfred M. Rankin, Jr. | | |
| Born 1941. Trustee Since January 1993. Principal | Mortimer J. Buckley | Chris D. McIsaac |
| Occupation(s) During the Past Five Years: Chairman, | Kathleen C. Gubanich | Michael S. Miller |
| President, and Chief Executive Officer of NACCO | Paul A. Heller | James M. Norris |
| Industries, Inc. (housewares/lignite), and of Hyster- | Martha G. King | Glenn W. Reed |
| Yale Materials Handling, Inc. (forklift trucks); Chairman | John T. Marcante | |
| of the Board of University Hospitals of Cleveland. | | |
| |
| Peter F. Volanakis | Chairman Emeritus and Senior Advisor |
| Born 1955. Trustee Since July 2009. Principal | | |
| Occupation(s) During the Past Five Years: President | John J. Brennan | |
| and Chief Operating Officer (retired 2010) of Corning | Chairman, 1996–2009 | |
| Incorporated (communications equipment); Trustee of | Chief Executive Officer and President, 1996–2008 |
| Colby-Sawyer College; Member of the Advisory Board | | |
| of the Norris Cotton Cancer Center and of the Advisory | | |
| Board of the Parthenon Group (strategy consulting). | Founder | |
| | John C. Bogle | |
| | Chairman and Chief Executive Officer, 1974–1996 |
1 Mr. McNabb is considered an “interested person,” as defined in the Investment Company Act of 1940, because he is an officer of the
Vanguard funds.
2 December 2002 for Vanguard Equity Income Fund, Vanguard Growth Equity Fund, the Vanguard Municipal Bond Funds, and the Vanguard
State Tax-Exempt Funds.
|  |
| | P.O. Box 2600 |
| | Valley Forge, PA 19482-2600 |
| |
| |
| |
| Connect with Vanguard® > vanguard.com | |
| |
| |
| |
| Fund Information > 800-662-7447 | CFA® is a trademark owned by CFA Institute. |
| Direct Investor Account Services > 800-662-2739 | |
| Institutional Investor Services > 800-523-1036 | |
| Text Telephone for People | |
| With Hearing Impairment > 800-749-7273 | |
| |
| This material may be used in conjunction | |
| with the offering of shares of any Vanguard | |
| fund only if preceded or accompanied by | |
| the fund’s current prospectus. | |
| |
| All comparative mutual fund data are from Lipper, a | |
| Thomson Reuters Company, or Morningstar, Inc., unless | |
| otherwise noted. | |
| |
| You can obtain a free copy of Vanguard’s proxy voting | |
| guidelines by visiting vanguard.com/proxyreporting or by | |
| calling Vanguard at 800-662-2739. The guidelines are | |
| also available from the SEC’s website, sec.gov. In | |
| addition, you may obtain a free report on how your fund | |
| voted the proxies for securities it owned during the 12 | |
| months ended June 30. To get the report, visit either | |
| vanguard.com/proxyreporting or sec.gov. | |
| |
| You can review and copy information about your fund at | |
| the SEC’s Public Reference Room in Washington, D.C. To | |
| find out more about this public service, call the SEC at | |
| 202-551-8090. Information about your fund is also | |
| available on the SEC’s website, and you can receive | |
| copies of this information, for a fee, by sending a | |
| request in either of two ways: via e-mail addressed to | |
| publicinfo@sec.gov or via regular mail addressed to the | |
| Public Reference Section, Securities and Exchange | |
| Commission, Washington, DC 20549-1520. | |
| |
| | © 2014 The Vanguard Group, Inc. |
| | All rights reserved. |
| | Vanguard Marketing Corporation, Distributor. |
| |
| | Q520 032014 |

Annual Report | January 31, 2014
Vanguard Precious Metals and Mining Fund

Vanguard’s Principles for Investing Success
We want to give you the best chance of investment success. These principles, grounded in Vanguard’s research and experience, can put you on the right path.
Goals. Create clear, appropriate investment goals.
Balance. Develop a suitable asset allocation using broadly diversified funds. Cost. Minimize cost.
Discipline. Maintain perspective and long-term discipline.
A single theme unites these principles: Focus on the things you can control.
We believe there is no wiser course for any investor.
| |
| Contents | |
| Your Fund’s Total Returns. | 1 |
| Chairman’s Letter. | 2 |
| Advisor’s Report. | 9 |
| Fund Profile. | 12 |
| Performance Summary. | 14 |
| Financial Statements. | 16 |
| Your Fund’s After-Tax Returns. | 27 |
| About Your Fund’s Expenses. | 28 |
| Glossary. | 30 |
Please note: The opinions expressed in this report are just that—informed opinions. They should not be considered promises or advice.
Also, please keep in mind that the information and opinions cover the period through the date on the front of this report. Of course, the
risks of investing in your fund are spelled out in the prospectus.
See the Glossary for definitions of investment terms used in this report.
About the cover: The ship’s wheel represents leadership and guidance, essential qualities in navigating difficult seas.
This one is a replica based on an 18th-century British vessel. The HMSVanguard, another ship of that era, served as the
flagship for British Admiral Horatio Nelson when he defeated a French fleet at the Battle of the Nile.
Your Fund’s Total Returns
| |
| Fiscal Year Ended January 31, 2014 | |
| |
| | Total |
| | Returns |
| Vanguard Precious Metals and Mining Fund | -32.82% |
| S&P Global Custom Metals and Mining Index | -27.99 |
| Precious Metals Equity Funds Average | -39.54 |
| Precious Metals Equity Funds Average: Derived from data provided by Lipper, a Thomson Reuters Company. |
| | | | | |
| Your Fund’s Performance at a Glance | | | | | |
| January 31, 2013, Through January 31, 2014 | | | | | |
| | | | Distributions Per Share | |
| | Starting | Ending | | | |
| | Share | Share | Income | Capital | Return of |
| | Price | Price | Dividends | Gains | Capital |
| Vanguard Precious Metals and Mining Fund | $15.46 | $10.38 | $0.007 | $0.000 | $0.001 |
1

Chairman’s Letter
Dear Shareholder,
For the fiscal year ended January 31, 2014, Vanguard Precious Metals and Mining Fund returned –32.82%. This result trailed the –27.99% return of the fund’s benchmark, the Standard & Poor’s Global Custom Metals and Mining Index, but surpassed the –39.54% average return of its peers.
Although this performance is undoubtedly disappointing, such dramatic ups and downs can be expected from your fund. Precious metals and mining stocks tend to be much more volatile than the broad market. Prices for metals such as gold and silver have experienced dramatic ups and downs over the past several years, reacting to ever-changing monetary and fiscal policy around the globe, expectations for inflation, and geopolitical tumult. Mining stocks are typically highly sensitive to these price swings.
During the fiscal year just ended, tumbling metals prices combined with rising operating costs to create a difficult environment for the industry and for your fund. The fund’s bias toward smaller-capitalization companies detracted from its returns relative to the benchmark, which focuses mostly on larger firms.
2
On a separate note, Graham French, a manager of the Precious Metals and Mining Fund since 1996, retired in November.
Your fund is now co-managed by Graham’s colleague Randeep Somel, who took on this role in 2013, and Jamie Horvat, who is new to the fund. I am confident that it will continue to benefit from M&G Investment Management’s long-term approach and its deep expertise in the precious metals and mining industry. We wish Graham well in his retirement and thank him for his years of exemplary service to Vanguard clients.
If you hold the fund in a taxable account, you may wish to review the information on after-tax performance provided later in this report.
U.S. stocks found a groove before recent volatility
U.S. stocks delivered generous returns in 2013, then slid during the first month of the new year. For the 12 months ended January 31, they produced impressive gains of nearly 23% despite the late reversal.
Strong corporate earnings growth and investors’ willingness to pay for those earnings drove stock markets, which were also buoyed by the Federal Reserve’s stimulative bond-buying program. The Fed, noting the economy’s improvement, began paring back its purchases in January. Nevertheless, stocks declined over the period’s final month as investors worried about recent economic developments at home and abroad.
| | | |
| Market Barometer | | | |
| |
| | Average Annual Total Returns |
| | Periods Ended January 31, 2014 |
| | One | Three | Five |
| | Year | Years | Years |
| Stocks | | | |
| Russell 1000 Index (Large-caps) | 22.23% | 14.14% | 19.84% |
| Russell 2000 Index (Small-caps) | 27.03 | 14.69 | 22.26 |
| Russell 3000 Index (Broad U.S. market) | 22.60 | 14.18 | 20.03 |
| FTSE All-World ex US Index (International) | 5.78 | 3.37 | 14.38 |
| |
| Bonds | | | |
| Barclays U.S. Aggregate Bond Index (Broad taxable market) | 0.12% | 3.73% | 4.93% |
| Barclays Municipal Bond Index (Broad tax-exempt market) | -1.07 | 5.76 | 5.54 |
| Citigroup Three-Month U.S. Treasury Bill Index | 0.05 | 0.06 | 0.09 |
| |
| CPI | | | |
| Consumer Price Index | 1.58% | 2.03% | 2.07% |
3
Overall, international stocks advanced about 6% for the 12 months. The developed markets of Europe and the Pacific region posted positive returns, but concerns about China’s weaker economy hurt stocks and currencies in some emerging-market countries.
For 2014, Vanguard Chief Economist Joe Davis and his team are guarded in their outlook for global stock returns, and their forecast for the bond market remains muted. Although Joe readily acknowledges that such forecasts are accompanied by uncertainty, he writes, “We believe that a long-term, strategic approach with a balanced, diversified, low-cost portfolio can remain a high-value proposition in the decade ahead.” (You can read more about our expectations for bond and stock returns in Vanguard’s Economic and Investment Outlook, available at vanguard.com/research.)
Bond returns were flat as Fed firmed its strategy
Investors spurned bonds for most of the fiscal year, wary of the Fed’s expected curtailment of its purchasing program. In January, however, despite the start of that tapering, fixed income investments regained appeal as stocks slumped.
The broad U.S. taxable bond market returned 0.12% for the 12 months, and municipal bonds returned –1.07%. The yield of the benchmark 10-year Treasury note generally increased, eclipsing 3.00%
| | |
| Expense Ratios | | |
| Your Fund Compared With Its Peer Group | | |
| | | Peer Group |
| | Fund | Average |
| Precious Metals and Mining Fund | 0.26% | 1.30% |
The fund expense ratio shown is from the prospectus dated May 28, 2013, and represents estimated costs for the current fiscal year. For the
fiscal year ended January 31, 2014, the fund’s expense ratio was 0.25%. The peer-group expense ratio is derived from data provided by
Lipper, a Thomson Reuters Company, and captures information through year-end 2013.
Peer group: Precious Metals Equity Funds.
4
at times, and finished at about 2.70%. (Bond prices and yields move in opposite directions.)
International bond markets (as measured by the Barclays Global Aggregate Index ex USD) returned –1.24%. The Fed’s continued target of 0%–0.25% for short-term interest rates tightly restricted returns of money market funds and savings accounts.
Falling metal prices, rising costs led to big losses for the sector
Vanguard Precious Metals and Mining Fund is a global sector fund that offers exposure to a market niche. It invests primarily in companies involved in the mining of or exploration for precious and rare metals and minerals.
It’s important to keep in mind that if you’re invested in the broad stock market, you already have exposure to this industry, whose stocks represent less than 5% of the global stock market’s total value. If you choose to increase your exposure by investing in this fund, be aware of the risks that go along with the potential rewards.
As I mentioned earlier, sharply declining metal prices, combined with rising operating costs, wreaked havoc on the industry during the past year.
Gold and silver prices were among the hardest hit. Gold dipped about 25% for the 12 months, and silver was down about 39%. Base metals such as copper (–13%) and aluminum (–19%) held up slightly better. This gave your fund a boost
| |
| Total Returns | |
| Ten Years Ended January 31, 2014 | |
| | Average |
| | Annual Return |
| Precious Metals and Mining Fund | 3.72% |
| Spliced Global Custom Metals and Mining Index | 6.04 |
| Precious Metals Equity Funds Average | 3.40 |
For a benchmark description, see the Glossary.
Precious Metals Equity Funds Average: Derived from data provided by Lipper, a Thomson Reuters Company.
The figures shown represent past performance, which is not a guarantee of future results. (Current performance may be
lower or higher than the performance data cited. For performance data current to the most recent month-end, visit our
website at vanguard.com/performance.) Note, too, that both investment returns and principal value can fluctuate widely, so
an investor’s shares, when sold, could be worth more or less than their original cost.
5
|
| Beware of chasing a sector’s ups and downs |
| |
| Funds that focus on a single sector—as Vanguard Precious Metals and Mining Fund does— |
| can be more volatile than more broadly diversified funds. Sector funds can soar one year and |
| plunge the next. This tendency toward volatility can stir up investors’ worst instincts, tempting |
| them to invest during times of strong performance and to bail as prices inevitably recede. |
| |
| As we all know, buying high and selling low hurts performance. Because many sector fund |
| investors do fall prey to the temptation to jump in and out of the market, the average annual |
| return experienced by sector fund investors (the “investor return”) is often lower than the |
| average annual total return of the funds themselves over the same period.1 |
| |
| The chart below will give you an idea of the price that sector fund investors can pay for |
| chasing performance. It compares the average annual total returns for precious metals |
| and mining funds with the average annual investor returns for these funds for recent three-, |
| five-, and ten-year periods. |
| |
| While sector funds can play a valuable supplemental role in your portfolio, we caution investors |
| about the perils of market-timing, particularly with funds which are inherently volatile. |
| |
| Precious metals funds: Their returns vs. their investors’ returns |
| Periods ended December 31, 2013 |
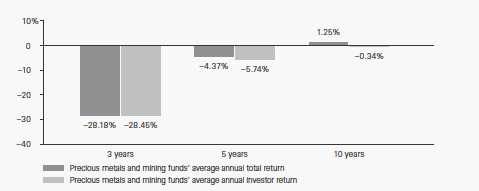
| Notes: Fund averages assume all distributions were reinvested. All returns were calculated on a month-end basis. |
| Source: Vanguard calculations, derived from data provided by Morningstar, Inc. |
| |
| |
| 1 The investor return is based on a money-weighted calculation that takes into account the timing of investors’ cash inflows |
| and outflows. |
6
compared to its peers, which tend to have more exposure to gold and silver mining stocks and less to other metals.
The volatile environment of the past fiscal year was especially difficult for the industry’s smaller players; larger, more established firms held up better. This hurt relative returns because your fund favors smaller-cap companies, whereas its benchmark index focuses mostly on large-caps.
Unlike many of its peers, your fund is not exclusively focused on the precious metals industry. Its exposure to a wider range of businesses, particularly chemical companies, aided its relative performance. Although these other holdings have not been standouts, their returns have been slightly better than those of typical precious metals and mining stocks.
The fund’s long-term results were tempered by recent struggles
For the 10-year period ended January 31, 2014, the fund posted an average annual return of 3.72%. This result trailed that of the benchmark index (6.04%) but outpaced the average return of peers (3.40%).
Disappointing returns for the past two years have weighed down long-term results. When I wrote to you two years ago, the fund had an average annual return of 18.13%. At the time, I noted that it would be unwise to expect that level of achievement to continue. Periods of exceptional strength typically give way to results that bring performance more in line with long-term averages, and this is especially true for a fund that focuses on a narrow slice of the market.
Recent challenges notwithstanding, we remain fully confident in M&G Investment Management, the London-based firm that has managed the fund since its inception in 1984. The fund will mark its 30th anniversary in May, and we congratulate M&G on its three decades of stewardship of Vanguard assets. We believe that the team’s ongoing efforts, accompanied by the fund’s low costs, will continue to generate competitive results over the long term.
When traveling a long, bumpy road, be sure to pack some patience
Over time, even a small degree of outperformance can meaningfully affect a portfolio’s value. That’s why many investors remain drawn to active management—they want the opportunity for market-beating returns, even though considerable research has shown that only a minority of active managers beat their benchmarks.
Long-term outperformance is uncommon largely because active management tends to be costlier than indexing. The higher a fund’s expense ratio, the higher the hurdle it must overcome to beat its benchmark after accounting for expenses.
For investors, impatience can present yet another obstacle. Even managers with the best market-beating records can’t avoid short-term periods of underperformance.
7
An investor who is unwilling to endure some lean years could unwisely abandon a talented manager and miss out on long-term rewards. (You can read more in The Bumpy Road to Outperformance, available at vanguard.com/research.)
That’s why Vanguard recommends that you pay attention to costs and take a patient, long-term view, as M&G Investment Management does. Vanguard does its part to try to give investors the best chance for success by offering access to world-class active managers and by operating our funds at costs well below industry averages.
As always, thank you for investing with Vanguard.
Sincerely,

F. William McNabb III
Chairman and Chief Executive Officer
February 18, 2014
8
Advisor’s Report
Vanguard Precious Metals and Mining Fund returned –32.82% for the fiscal year ended January 31, 2014. This result lagged that of the fund’s customized benchmark index (–27.99%) but surpassed the average return of peer funds (–39.54%).
The markets
In the past 12 months, developed markets experienced steadier growth. This was most notable in the United States, where, in recognition of improving economic stability, the Federal Reserve stated in December that it would begin to reduce its bond-buying stimulus program in January. After this announcement, emerging markets declined. Currencies weakened in the face of a strengthening U.S. dollar, and governments hiked interest rates to control inflation. Meanwhile, concerns arose about softening growth in these commodity-hungry economies. Against this backdrop, metal and mineral prices faced pressure. In keeping with its historical inverse relationship with the U.S. dollar, gold was particularly weak.
The market environment has been challenging for miners. In recent years, they have concentrated on growth rather than cash flow, value creation, and shareholder return. As a result, the investment community has retreated. However, the industry is now putting a renewed focus on cutting capital expenditure, selling noncore assets, and returning capital through dividends.
Barrick Gold, the world’s largest gold miner, is one example of this shift. During 2013, the company suspended work at key growth project Pascua-Lama, began divesting some assets, and implemented a cost-cutting strategy to further improve margins. Of its 22 gold mines, five now generate 75% of the company’s free cash flow. Throughout the industry, a new generation of managers and company boards is working to restore investor confidence in the midst of an ongoing commodity boom featuring robust prices and strong demand.
The fund’s performance
Despite very favorable long-term demand/ supply dynamics for platinum, its price softened over the period. Two South African miners, Impala Platinum and Anglo American, suffered as their operational challenges mounted. The fund’s lack of these stocks helped its relative performance. Platinum’s ore bodies are depleting and its mine depths demand increasingly robust infrastructure, the construction of which has been impeded by power shortages. In addition, relations with trade unions have been tense and have halted production at times.
Because of these difficulties, we are seeking exposure to the metal through two stable producers of recycled platinum-group metals: Belgium-based Umicore and London-listed Johnson Matthey. These companies are part of an oligopoly whose complex operations keep competition at bay. With healthy balance sheets and strategies dedicated to generating high
9
returns and creating value, they constitute the fund’s largest positions and contributed significantly to performance.
A standout in precious minerals was Canadian miner Dominion Diamond (formerly Harry Winston Diamond). Now a pure miner after divesting its luxury brand business at a premium early in the year, the company benefited from resiliency in the price of rough diamonds. The market for diamonds is becoming increasingly compelling. Global production peaked in 2006, existing mines are aging, and the lack of new discoveries leads us to believe that supply will fail to keep up with demand, supporting future prices. French diversified miner Imerys also performed strongly. The company has successfully implemented a cost-cutting strategy and at the start of 2013 sold a noncore arm of its business.
Conversely, the fund’s long-standing U.K.-listed silver miner Hochschild Mining turned in a weak performance. Silver, which tends to have the most volatile price of the precious metals, lost significant value in an environment of reduced commodity prices. Cost inflation also drove down margins. Australian gold producer St. Barbara posted poor results as well. Its acquisition of assets in Papua New Guinea proved significantly more challenging to improve than management first anticipated.
Outside of precious metals, Australian miner OZ Minerals, which mainly focuses on copper, contributed negatively to performance after a pit wall failure at its primary asset, Prominent Hill, derailed
production. Because of this and additional concerns about how management will deploy balance-sheet capital, the company trades at a very compelling valuation. Management is confident such issues are behind it and believes it can return to previous production levels.
Purchases and sales
We initiated a position in British-Australian diversified miner BHP Billiton. For many years, the fund has been significantly underweighted in large-cap diversified miners; historically, they have been poorly managed and engaged in value-destructive acquisitive practices. But BHP Billiton’s newly appointed CEO is consolidating the business, stopping costly growth projects, selling noncore assets, and raising the dividend. Demand for the company’s resources remains robust, and it has best-in-class low-cost, high-quality assets in favorable locations.
We also opened new positions in several gold miners, including U.K.-listed African Barrick and Canadian-based Agnico Eagle Mines and Kinross Gold. Like BHP Billiton, Agnico Eagle has a management team committed to returning capital to shareholders and a portfolio of quality assets in safe territories that does not depend on a sole mine.
Kinross has written off its ill-fated acquisition of the Tasiast mine, is reducing capital expenditure and introducing a more stringent capital discipline policy, and is extremely attractively valued. African Barrick, a positive contributor during its
10
short time in the fund, was added at what we believe to be a very attractive valuation. We also bought U.K.-listed Johnson Matthey, which fabricates platinum-intensive auto catalysts and derives more than 20% of its earnings from recycling platinum-group metals.
The largest sale in the last quarter was German salt and potash producer K+S. The company’s inability to control capital expenditure at its complex Canadian Legacy project became a concern, especially given the business’s rising operating costs relative to peers. We therefore exited the position after a period of strong relative performance. We sold our holdings in Canadian-based Eldorado Gold and Australian-based Medusa Mining based on operational concerns; in Medusa’s case, attempts to expand production proved more challenging than anticipated.
Looking ahead
A perfect storm of prolonged management indiscipline toward capital investment and concerns over future emerging-market growth has wiped huge value from company capitalizations across the industry. However, demand remains strong, as reflected to a degree in the robust nature of commodity prices. Today, valuations have reached the levels they attained during the height of the global financial crisis in 2008. In light of the ongoing thirst for materials, we feel this offers great value.
Just as important, the marked change in management of these businesses represents a new stage for the industry. As capital expenditure is curtailed and exploration reduced, future supply will become constrained, which should once again elevate prices, improve margins, and potentially generate significant returns.
Recent years have been challenging, but we remain confident that our long-term approach of identifying best-in-class assets, retaining exposure to the most favorable commodities, and working with management teams will continue to create significant value for investors.
Portfolio Managers:
Randeep Somel, CFA
Jamie J. Horvat
M&G Investment Management Limited
February 24, 2014
11
Precious Metals and Mining Fund
Fund Profile
As of January 31, 2014
| | | |
| Portfolio Characteristics | | |
| | | S&P | DJ |
| | | Global | U.S. |
| | | Custom | Total |
| | | Metals and | Market |
| | | Mining | FA |
| | Fund | Index | Index |
| Number of Stocks | 42 | 292 | 3,635 |
| Median Market Cap | $4.8B | $10.6B | $41.3B |
| Price/Earnings Ratio | -84.0x | -206.6x | 19.1x |
| Price/Book Ratio | 1.2x | 1.4x | 2.6x |
| Return on Equity | 8.7% | 10.6% | 16.5% |
| Earnings Growth | | | |
| Rate | 2.8% | 14.5% | 11.4% |
| Dividend Yield | 2.6% | 2.4% | 1.9% |
| Foreign Holdings | 81.8% | 88.6% | 0.0% |
| Turnover Rate | 34% | — | — |
| Ticker Symbol | VGPMX | — | — |
| Expense Ratio1 | 0.26% | — | — |
| Short-Term Reserves | 6.6% | — | — |
| | |
| Volatility Measures | | |
| | S&P | |
| | Global | |
| | Custom | DJ |
| | Metals and | U.S. Total |
| | Mining | Market |
| | Index | FA Index |
| R-Squared | 0.91 | 0.28 |
| Beta | 1.01 | 1.12 |
| These measures show the degree and timing of the fund’s fluctuations compared with the indexes over 36 months. |
| | |
| Ten Largest Holdings (% of total net assets) |
| Johnson Matthey plc | Specialty Chemicals | 8.8% |
| Umicore SA | Specialty Chemicals | 8.0 |
| Dominion Diamond | Precious Metals & | |
| Corp. | Minerals | 7.2 |
| Nevsun Resources Ltd. | Diversified Metals & | |
| | Mining | 6.0 |
| Kinross Gold Corp. | Gold | 5.6 |
| Agnico Eagle Mines Ltd. Gold | 5.3 |
| Potash Corp. of | Fertilizers & | |
| Saskatchewan Inc. | Agricultural | |
| | Chemicals | 4.8 |
| BHP Billiton Ltd. | Diversified Metals & | |
| | Mining | 4.5 |
| Iluka Resources Ltd. | Diversified Metals & | |
| | Mining | 4.5 |
| AMCOL International | Diversified Metals & | |
| Corp. | Mining | 4.4 |
| Top Ten | | 59.1% |
| The holdings listed exclude any temporary cash investments and equity index products. |
Allocation by Region (% of equity exposure)
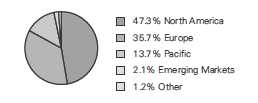
1 The expense ratio shown is from the prospectus dated May 28, 2013, and represents estimated costs for the current fiscal year. For the fiscal year
ended January 31, 2014, the expense ratio was 0.25%.
12
Precious Metals and Mining Fund
| |
| Market Diversification (% of equity exposure) |
| |
| Europe | |
| United Kingdom | 25.6% |
| Belgium | 8.5 |
| France | 1.6 |
| Subtotal | 35.7% |
| Pacific | |
| Australia | 13.7% |
| Emerging Markets | |
| Russia | 2.1% |
| North America | |
| Canada | 34.8% |
| United States | 12.5 |
| Subtotal | 47.3% |
| Other | |
| Subtotal | 1.2% |
13
Precious Metals and Mining Fund
Performance Summary
All of the returns in this report represent past performance, which is not a guarantee of future results that may be achieved by the fund. (Current performance may be lower or higher than the performance data cited. For performance data current to the most recent month-end, visit our website at vanguard.com/performance.) Note, too, that both investment returns and principal value can fluctuate widely, so an investor’s shares, when sold, could be worth more or less than their original cost. The returns shown do not reflect taxes that a shareholder would pay on fund distributions or on the sale of fund shares.
Cumulative Performance: January 31, 2004, Through January 31, 2014
Initial Investment of $10,000
| | | | | |
| | | Average Annual Total Returns | |
| | | Periods Ended January 31, 2014 | |
| | | | | | Final Value |
| | | One | Five | Ten | of a $10,000 |
| | | Year | Years | Years | Investment |
| | Precious Metals and Mining Fund* | -32.82% | 3.40% | 3.72% | $14,408 |
| •••••••• | Spliced Global Custom Metals and | | | | |
| | Mining Index | -27.99 | 7.27 | 6.04 | 17,975 |
| – – – – | Precious Metals Equity Funds | | | | |
| | Average | -39.54 | -1.91 | 3.40 | 13,974 |
| | Dow Jones U.S. Total Stock Market | | | | |
| | Float Adjusted Index | 22.53 | 20.13 | 7.51 | 20,637 |
| For a benchmark description, see the Glossary. |
| Precious Metals Equity Funds Average: Derived from data provided by Lipper, a Thomson Reuters Company. |
See Financial Highlights for dividend and capital gains information.
14
Precious Metals and Mining Fund
Fiscal-Year Total Returns (%): January 31, 2004, Through January 31, 2014
For a benchmark description, see the Glossary.
Average Annual Total Returns: Periods Ended December 31, 2013
This table presents returns through the latest calendar quarter—rather than through the end of the fiscal period.
Securities and Exchange Commission rules require that we provide this information.
| | | | |
| | Inception | One | Five | Ten |
| | Date | Year | Years | Years |
| Precious Metals and Mining Fund | 5/23/1984 | -35.13% | 1.40% | 2.97% |
15
Precious Metals and Mining Fund
Financial Statements
Statement of Net Assets
As of January 31, 2014
The fund reports a complete list of its holdings in regulatory filings four times in each fiscal year, at the quarter-ends. For the second and fourth fiscal quarters, the lists appear in the fund’s semiannual and annual reports to shareholders. For the first and third fiscal quarters, the fund files the lists with the Securities and Exchange Commission on Form N-Q. Shareholders can look up the fund’s Forms N-Q on the SEC’s website at sec.gov. Forms N-Q may also be reviewed and copied at the SEC’s Public Reference Room (see the back cover of this report for further information).
| | | |
| | | | Market |
| | | | Value |
| | | Shares | ($000) |
| Common Stocks (93.5%) | | |
| Australia (13.1%) | | |
| | Iluka Resources Ltd. | 13,500,000 | 103,255 |
| 1 | OZ Minerals Ltd. | 30,000,000 | 92,430 |
| *,^,1Aquila Resources Ltd. | 25,000,000 | 52,981 |
| *,^,1St. Barbara Ltd. | 60,536,881 | 16,588 |
| * | Resolute Mining Ltd. | 25,500,000 | 12,164 |
| *,1 | Equatorial Resources Ltd. | 10,082,288 | 5,118 |
| *,1 | Galaxy Resources Ltd. | 86,393,638 | 5,066 |
| *,1 | Glory Resources Ltd. | 33,500,000 | 4,912 |
| 1 | Panoramic Resources | | |
| | Ltd. | 21,534,362 | 4,509 |
| *,1 | Reed Resources Ltd. | 76,166,667 | 3,377 |
| * | Galaxy Resources Ltd. | | |
| | Warrants | | |
| | Exp. 12/31/2014 | 18,750,000 | 263 |
| *,1 | Apex Minerals NL | 55,654,166 | — |
| | | | 300,663 |
| Belgium (8.0%) | | |
| | Umicore SA | 4,300,000 | 184,006 |
| |
| Canada (33.4%) | | |
| *,1 | Dominion Diamond Corp. | 11,374,400 | 165,650 |
| 1 | Nevsun Resources Ltd. | 37,839,800 | 138,958 |
| * | Kinross Gold Corp. | 28,000,000 | 128,240 |
| | Agnico Eagle Mines Ltd. | 3,900,000 | 121,212 |
| | Potash Corp. of | | |
| | Saskatchewan Inc. | 3,500,000 | 109,737 |
| | Centerra Gold Inc. | 10,000,000 | 38,698 |
| | Alamos Gold Inc. | 2,500,000 | 22,941 |
| * | Mountain Province | | |
| | Diamonds Inc. | 3,000,000 | 14,061 |
| | Alacer Gold Corp. | 4,950,000 | 10,444 |
| *,^,1Belo Sun Mining Corp. | 20,000,000 | 7,093 |
| | Barrick Gold Corp. | 350,000 | 6,744 |
| *,^ | NovaCopper Inc. | 2,033,333 | 2,806 |
| * | Bear Creek Mining Corp. | 477,800 | 871 |
| * | Luna Gold Corp. | 409,000 | 525 |
| | | | 767,980 |
| | | |
| France (1.5%) | | |
| | Imerys SA | 413,418 | 33,615 |
| |
| Ireland (0.0%) | | |
| * | Kenmare Resources plc | 3,139,111 | 901 |
| |
| Papua New Guinea (0.0%) | | |
| * | Bougainville Copper Ltd. | 2,000,000 | 855 |
| |
| Russia (1.9%) | | |
| | Uralkali OJSC GDR | 1,850,000 | 44,595 |
| |
| United Kingdom (23.9%) | | |
| | Johnson Matthey plc | 3,800,000 | 201,689 |
| | BHP Billiton plc | 3,500,000 | 103,331 |
| 1 | Hochschild Mining plc | 39,026,886 | 98,261 |
| 1 | African Barrick Gold plc | 22,955,000 | 82,897 |
| | Antofagasta plc | 3,500,000 | 48,885 |
| 1 | Petropavlovsk plc | 13,000,000 | 15,010 |
| | | | 550,073 |
| United States (11.7%) | | |
| 1 | AMCOL International | | |
| | Corp. | 2,998,000 | 102,142 |
| | Mosaic Co. | 1,950,000 | 87,087 |
| | Newmont Mining Corp. | 3,600,000 | 77,760 |
| | Gold Resource Corp. | 500,000 | 2,305 |
| | | | 269,294 |
| Total Common Stocks | | |
| (Cost $3,015,667) | | 2,151,982 |
| Precious Metals (0.1%) | | |
| * | Platinum Bullion | | |
| | (In Troy Ounces) | 2,009 | 2,765 |
| Total Precious Metals (Cost $1,212) | 2,765 |
16
Precious Metals and Mining Fund
| | |
| | | Market |
| | | Value |
| | Shares | ($000) |
| Temporary Cash Investment (7.0%) | |
| Money Market Fund (7.0%) | |
| 2,3 Vanguard Market Liquidity | |
| Fund, 0.130% | | |
| (Cost $161,852) | 161,852,351 | 161,852 |
| Total Investments (100.6%) | |
| (Cost $3,178,731) | | 2,316,599 |
| Other Assets and Liabilities (-0.6%) | |
| Other Assets | | 10,137 |
| Liabilities3 | | (24,240) |
| | | (14,103) |
| Net Assets (100%) | | |
| Applicable to 221,921,234 outstanding | |
| $.001 par value shares of beneficial | |
| interest (unlimited authorization) | 2,302,496 |
| Net Asset Value Per Share | $10.38 |
| |
| |
| At January 31, 2014, net assets consisted of: |
| |
| | | Amount |
| | | ($000) |
| Paid-in Capital | | 4,118,100 |
| Overdistributed Net Investment Income | (169,135) |
| Accumulated Net Realized Losses | (784,358) |
| Unrealized Appreciation (Depreciation) | |
| Investment Securities4 | (862,132) |
| Foreign Currencies | | 21 |
| Net Assets | | 2,302,496 |
See Note A in Notes to Financial Statements.
* Non-income-producing security.
^ Includes partial security positions on loan to broker-dealers. The total value of securities on loan is $8,307,000.
1 Considered an affiliated company of the fund as the fund owns more than 5% of the outstanding voting securities of such company.
2 Affiliated money market fund available only to Vanguard funds and certain trusts and accounts managed by Vanguard. Rate shown is the
7-day yield.
3 Includes $13,823,000 of collateral received for securities on loan.
4 Includes precious metals.
GDR—Global Depositary Receipt.
See accompanying Notes, which are an integral part of the Financial Statements.
17
Precious Metals and Mining Fund
Statement of Assets and Liabilities
As of January 31, 2014
| |
| | Amount |
| | ($000) |
| Assets | |
| Investments in Securities, at Value1 | |
| Unaffiliated Issuers1 | 1,359,755 |
| Affiliated Vanguard Funds | 161,852 |
| Other Affiliated Issuers | 794,992 |
| Total Investments in Securities | 2,316,599 |
| Receivables for Investment Securities Sold | 3,229 |
| Receivables for Capital Shares Issued | 3,219 |
| Other Assets | 3,689 |
| Total Assets | 2,326,736 |
| Liabilities | |
| Securities Lending Collateral Payable to Brokers | 13,823 |
| Other Liabilities | 10,417 |
| Total Liabilities | 24,240 |
| Net Assets | 2,302,496 |
1 Includes precious metals.
See accompanying Notes, which are an integral part of the Financial Statements.
18
Precious Metals and Mining Fund
Statement of Operations
| |
| | Year Ended |
| | January 31, 2014 |
| | ($000) |
| Investment Income | |
| Income | |
| Dividends1,2 | 56,578 |
| Interest2 | 121 |
| Securities Lending | 1,931 |
| Total Income | 58,630 |
| Expenses | |
| Investment Advisory Fees—Note B | |
| Basic Fee | 3,443 |
| Performance Adjustment | (2,250) |
| The Vanguard Group—Note C | |
| Management and Administrative | 4,070 |
| Marketing and Distribution | 605 |
| Custodian Fees | 220 |
| Auditing Fees | 26 |
| Shareholders’ Reports | 63 |
| Trustees’ Fees and Expenses | 7 |
| Total Expenses | 6,184 |
| Net Investment Income | 52,446 |
| Realized Net Gain (Loss) | |
| Investment Securities Sold2 | (538,340) |
| Foreign Currencies | 606 |
| Realized Net Gain (Loss) | (537,734) |
| Change in Unrealized Appreciation (Depreciation) | |
| Investment Securities3 | (575,325) |
| Foreign Currencies | 35 |
| Change in Unrealized Appreciation (Depreciation) | (575,290) |
| Net Increase (Decrease) in Net Assets Resulting from Operations | (1,060,578) |
| 1 Dividends are net of foreign withholding taxes of $5,781,000. |
| 2 Dividend income, interest income, and realized net gain (loss) from affiliated companies of the fund were $17,970,000, $121,000, and |
| ($428,319,000), respectively. |
| 3 Includes precious metals. |
See accompanying Notes, which are an integral part of the Financial Statements.
19
Precious Metals and Mining Fund
Statement of Changes in Net Assets
| | |
| | Year Ended January 31, |
| | 2014 | 2013 |
| | ($000) | ($000) |
| Increase (Decrease) in Net Assets | | |
| Operations | | |
| Net Investment Income | 52,446 | 55,569 |
| Realized Net Gain (Loss) | (537,734) | (213,883) |
| Change in Unrealized Appreciation (Depreciation) | (575,290) | (976,236) |
| Net Increase (Decrease) in Net Assets Resulting from Operations | (1,060,578) | (1,134,550) |
| Distributions | | |
| Net Investment Income | (1,513) | (141,196) |
| Realized Capital Gain | — | (59,601) |
| Return of Capital | (113) | — |
| Total Distributions | (1,626) | (200,797) |
| Capital Share Transactions | | |
| Issued | 1,113,198 | 824,259 |
| Issued in Lieu of Cash Distributions | 1,497 | 184,683 |
| Redeemed1 | (861,854) | (977,033) |
| Net Increase (Decrease) from Capital Share Transactions | 252,841 | 31,909 |
| Total Increase (Decrease) | (809,363) | (1,303,438) |
| Net Assets | | |
| Beginning of Period | 3,111,859 | 4,415,297 |
| End of Period2 | 2,302,496 | 3,111,859 |
| 1 Net of redemption fees for fiscal 2013 of $435,000. Effective May 23, 2012, the redemption fee was eliminated. |
| 2 Net Assets—End of Period includes undistributed (overdistributed) net investment income of ($169,135,000) and ($254,002,000). |
See accompanying Notes, which are an integral part of the Financial Statements.
20
Precious Metals and Mining Fund
Financial Highlights
| | | | | |
| For a Share Outstanding | Year Ended January 31, |
| Throughout Each Period | 2014 | 2013 | 2012 | 2011 | 2010 |
| Net Asset Value, Beginning of Period | $15.46 | $22.14 | $24.15 | $18.74 | $10.74 |
| Investment Operations | | | | | |
| Net Investment Income | . 2431 | .292 | .3342 | .181 | .0933 |
| Net Realized and Unrealized Gain (Loss) | | | | | |
| on Investments 4 | (5.315) | (5.962) | (.760) | 6.521 | 8.207 |
| Total from Investment Operations | (5.072) | (5.670) | (.426) | 6.702 | 8.300 |
| Distributions | | | | | |
| Dividends from Net Investment Income | (.007) | (.710) | (.123) | (1.101) | (.300) |
| Distributions from Realized Capital Gains | — | (.300) | (1.461) | (.191) | — |
| Return of Capital | (.001) | — | — | — | — |
| Total Distributions | (.008) | (1.010) | (1.584) | (1.292) | (.300) |
| Net Asset Value, End of Period | $10.38 | $15.46 | $22.14 | $24.15 | $18.74 |
| |
| Total Return5 | -32.82% | -26.13% | -0.97% | 35.35% | 77.75% |
| |
| Ratios/Supplemental Data | | | | | |
| Net Assets, End of Period (Millions) | $2,302 | $3,112 | $4,415 | $5,030 | $3,684 |
| Ratio of Total Expenses to Average Net Assets6 | 0.25% | 0.26% | 0.29% | 0.27% | 0.27% |
| Ratio of Net Investment Income to | | | | | |
| Average Net Assets | 2.10% | 1.62% | 1.54%2 | 0.61% | 0.59%3 |
| Portfolio Turnover Rate | 34% | 30% | 22% | 34% | 17% |
1 Calculated based on average shares outstanding.
2 Net investment income per share and the ratio of net investment income to average net assets include $.103 and 0.40%, respectively,
resulting from a special dividend from OZ Minerals Ltd. in May 2011.
3 The fund received a special dividend from Centennial Coal Co. Ltd. in January 2008. Based on additional information reported by the
company in 2009, a portion of the special dividend was reallocated to return of capital. The reallocation reduced net investment income per
share and the ratio of net investment income to average net assets for the year ended January 31, 2010, by $.134 and 0.90%, respectively.
The reallocation had no impact on net assets, net asset values per share, or total returns.
4 Includes increases from redemption fees of $.00, $.00, $.01, $.01, and $.01. Effective May 23, 2012, the redemption fee was eliminated.
5 Total returns do not include transaction or account service fees that may have applied in the periods shown. Fund prospectuses provide
information about any applicable transaction and account service fees.
6 Includes performance-based investment advisory fee increases (decreases) of (0.09%), (0.07%), (0.03%), (0.05%), and (0.08%).
See accompanying Notes, which are an integral part of the Financial Statements.
21
Precious Metals and Mining Fund
Notes to Financial Statements
Vanguard Precious Metals and Mining Fund is registered under the Investment Company Act of 1940 as an open-end investment company, or mutual fund. The fund invests in securities of foreign issuers, which may subject it to investment risks not normally associated with investing in securities of United States corporations.
A. The following significant accounting policies conform to generally accepted accounting principles for U.S. mutual funds. The fund consistently follows such policies in preparing its financial statements.
1. Security Valuation: Securities are valued as of the close of trading on the New York Stock Exchange (generally 4 p.m., Eastern time) on the valuation date. Equity securities are valued at the latest quoted sales prices or official closing prices taken from the primary market in which each security trades; such securities not traded on the valuation date are valued at the mean of the latest quoted bid and asked prices. Securities for which market quotations are not readily available, or whose values have been affected by events occurring before the fund’s pricing time but after the close of the securities’ primary markets, are valued at their fair values calculated according to procedures adopted by the board of trustees. These procedures include obtaining quotations from an independent pricing service, monitoring news to identify significant market- or security-specific events, and evaluating changes in the values of foreign market proxies (for example, ADRs, futures contracts, or exchange-traded funds), between the time the foreign markets close and the fund’s pricing time. When fair-value pricing is employed, the prices of securities used by a fund to calculate its net asset value may differ from quoted or published prices for the same securities. Precious metals are valued at the latest quoted bid prices. Investments in Vanguard Market Liquidity Fund are valued at that fund’s net asset value.
2. Foreign Currency: Securities and other assets and liabilities denominated in foreign currencies are translated into U.S. dollars using exchange rates obtained from an independent third party as of the fund’s pricing time on the valuation date. Realized gains (losses) and unrealized appreciation (depreciation) on investment securities include the effects of changes in exchange rates since the securities were purchased, combined with the effects of changes in security prices. Fluctuations in the value of other assets and liabilities resulting from changes in exchange rates are recorded as unrealized foreign currency gains (losses) until the assets or liabilities are settled in cash, at which time they are recorded as realized foreign currency gains (losses).
3. Federal Income Taxes: The fund intends to continue to qualify as a regulated investment company and distribute all of its taxable income. Management has analyzed the fund’s tax positions taken for all open federal income tax years (January 31, 2011–2014), and has concluded that no provision for federal income tax is required in the fund’s financial statements.
4. Distributions: Distributions to shareholders are recorded on the ex-dividend date.
5. Securities Lending: To earn additional income, the fund may lend its securities to qualified institutional borrowers. Security loans are required to be secured at all times by collateral in an amount at least equal to the market value of securities loaned. Daily market fluctuations could cause the value of loaned securities to be more or less than the value of the collateral received. When this occurs, the collateral is adjusted and settled on the next business day. The fund further mitigates its counterparty risk by entering into securities lending transactions only with a diverse group of prequalified counterparties, monitoring their financial strength, and entering into master securities lending agreements with its counterparties. The master securities lending agreements provide that, in the event of a counterparty’s default (including bankruptcy), the fund may terminate any loans with that borrower, determine the net amount owed, and sell or retain the collateral up to the net amount
22
Precious Metals and Mining Fund
owed to the fund; however, such actions may be subject to legal proceedings. While collateral mitigates counterparty risk, in the absence of a default the fund may experience delays and costs in recovering the securities loaned. The fund invests cash collateral received in Vanguard Market Liquidity Fund, and records a liability for the return of the collateral, during the period the securities are on loan. Securities lending income represents fees charged to borrowers plus income earned on invested cash collateral, less expenses associated with the loan.
6. Other: Dividend income is recorded on the ex-dividend date. Interest income includes income distributions received from Vanguard Market Liquidity Fund and is accrued daily. Security transactions are accounted for on the date securities are bought or sold. Costs used to determine realized gains (losses) on the sale of investment securities are those of the specific securities sold.
B. M&G Investment Management Limited provides investment advisory services to the fund for a fee calculated at an annual percentage rate of average net assets. The basic fee is subject to quarterly adjustments based on the fund’s performance for the preceding three years relative to the S&P Global Custom Metals and Mining Index. For the year ended January 31, 2014, the investment advisory fee represented an effective annual basic rate of 0.14% of the fund’s average net assets before a decrease of $2,250,000 (0.09%) based on performance.
C. The Vanguard Group furnishes at cost corporate management, administrative, marketing, and distribution services. The costs of such services are allocated to the fund under methods approved by the board of trustees. The fund has committed to provide up to 0.40% of its net assets in capital contributions to Vanguard. At January 31, 2014, the fund had contributed capital of $249,000 to Vanguard (included in Other Assets), representing 0.01% of the fund’s net assets and 0.10% of Vanguard’s capitalization. The fund’s trustees and officers are also directors and officers of Vanguard.
D. Various inputs may be used to determine the value of the fund’s investments. These inputs are summarized in three broad levels for financial statement purposes. The inputs or methodologies used to value securities are not necessarily an indication of the risk associated with investing in those securities.
Level 1—Quoted prices in active markets for identical securities.
Level 2—Other significant observable inputs (including quoted prices for similar securities, interest rates, prepayment speeds, credit risk, etc.).
Level 3—Significant unobservable inputs (including the fund’s own assumptions used to determine the fair value of investments).
The following table summarizes the market value of the fund’s investments as of January 31, 2014, based on the inputs used to value them:
| | | |
| | Level 1 | Level 2 | Level 3 |
| Investments | ($000) | ($000) | ($000) |
| Common Stocks—North America | 1,037,274 | — | — |
| Common Stocks—Other | — | 1,114,708 | — |
| Precious Metals | — | 2,765 | — |
| Temporary Cash Investments | 161,852 | — | — |
| Total | 1,199,126 | 1,117,473 | — |
23
Precious Metals and Mining Fund
E. Distributions are determined on a tax basis and may differ from net investment income and realized capital gains for financial reporting purposes. Differences may be permanent or temporary. Permanent differences are reclassified among capital accounts in the financial statements to reflect their tax character. Temporary differences arise when certain items of income, expense, gain, or loss are recognized in different periods for financial statement and tax purposes; such differences are primarily attributed to the tax treatment of unrealized appreciation on passive foreign investment companies. These differences will reverse at some time in the future. Differences in classification may also result from the treatment of short-term gains as ordinary income for tax purposes.
During the year ended January 31, 2014, the fund realized net foreign currency gains of $606,000, which increased distributable net income for tax purposes; accordingly, such gains have been reclassified from accumulated net realized losses to overdistributed net investment income. Certain of the fund’s investments are in securities considered to be passive foreign investment companies, for which any unrealized appreciation and/or realized gains are required to be included in distributable net income for tax purposes. During the year ended January 31, 2014, the fund realized gains on the sale of passive foreign investment companies of $31,872,000, which have been included in current and prior periods’ taxable income; accordingly, such gains have been reclassified from accumulated net realized losses to overdistributed net investment income. Passive foreign investment companies held at January 31, 2014, had unrealized appreciation of $161,965,000, of which all has been distributed and is reflected in the balance of overdistributed net investment income.
For tax purposes, the fund had a net operating loss of $1,456,000 for the year ended January 31, 2014. This amount has been reclassified from overdistributed net investment income to paid-in capital. At January 31, 2014, the fund had no ordinary income available for distribution. The fund had available capital losses totaling $784,391,000 that may be carried forward indefinitely to offset future net capital gains.
At January 31, 2014, the cost of investment securities for tax purposes was $3,340,696,000. Net unrealized depreciation of investment securities for tax purposes was $1,024,097,000, consisting of unrealized gains of $40,420,000 on securities that had risen in value since their purchase and $1,064,517,000 in unrealized losses on securities that had fallen in value since their purchase.
F. During the year ended January 31, 2014, the fund purchased $989,784,000 of investment securities and sold $826,699,000 of investment securities, other than temporary cash investments.
G. Capital shares issued and redeemed were:
| | |
| | Year Ended January 31, |
| | 2014 | 2013 |
| | Shares | Shares |
| | (000) | (000) |
| Issued | 95,795 | 49,065 |
| Issued in Lieu of Cash Distributions | 108 | 10,433 |
| Redeemed | (75,233) | (57,628) |
| Net Increase (Decrease) in Shares Outstanding | 20,670 | 1,870 |
24
Precious Metals and Mining Fund
H. Certain of the fund’s investments are in companies that are considered to be affiliated companies of the fund because the fund owns more than 5% of the outstanding voting securities of the company. Transactions during the period in securities of these companies were as follows:
| | | | | |
| | | Current Period Transactions | |
| | Jan. 31, 2013 | | Proceeds from | | Jan. 31, 2014 |
| | Market | Purchases | Securities | Dividend | Market |
| | Value | at Cost | Sold | Income | Value |
| | ($000) | ($000) | ($000) | ($000) | ($000) |
| African Barrick Gold plc | — | 63,261 | — | 23 | 82,897 |
| AMCOL International Corp. | 90,952 | 592 | 3,123 | 2,448 | 102,142 |
| Apex Minerals NL | 2,379 | — | — | — | — |
| Aquila Resources Ltd. | 118,009 | — | 21,053 | — | 52,981 |
| Belo Sun Mining Corp. | NA1 | 6,510 | — | — | 7,093 |
| Centerra Gold Inc. | 143,067 | — | 21,925 | 2,061 | NA2 |
| Cudeco Ltd. | 83,557 | — | 29,437 | — | — |
| Discovery Metals Ltd. | 37,582 | — | 21,272 | — | — |
| Dominion Diamond Corp.3 | 172,673 | — | 4,411 | — | 165,650 |
| Drummond Gold Ltd. | 291 | — | 65 | — | — |
| Equatorial Resources Ltd. | 15,601 | — | — | — | 5,118 |
| Galaxy Resources Ltd. | 29,401 | 899 | — | — | 5,066 |
| Glory Resources Ltd. | 6,987 | 26 | 32 | — | 4,912 |
| Hochschild Mining plc | 271,517 | 2,139 | 4,565 | 1,213 | 98,261 |
| Inova Resources Ltd.4 | 18,564 | — | 7,316 | — | — |
| King River Copper Ltd.5 | 624 | — | 288 | — | — |
| Kumarina Resources Ltd. | 1,362 | — | 952 | — | — |
| Medusa Mining Ltd. | 130,694 | — | 61,031 | — | — |
| Nevsun Resources Ltd. | 162,894 | — | 2,251 | 4,510 | 138,958 |
| OZ Minerals Ltd. | 146,856 | 43,380 | 3,459 | 6,992 | 92,430 |
| Panoramic Resources Ltd. | 11,738 | — | 142 | 212 | 4,509 |
| Petropavlovsk plc | 63,402 | 19,235 | 5,538 | 511 | 15,010 |
| Reed Resources Ltd. | 13,483 | — | — | — | 3,377 |
| Resolute Mining Ltd. | 88,720 | — | 31,540 | — | NA2 |
| St. Barbara Ltd. | 90,653 | — | — | — | 16,588 |
| | 1,701,006 | | | 17,970 | 794,992 |
| 1 Not applicable — At January 31, 2013, the issuer was not an affiliated company of the fund. |
| 2 Not applicable — At January 31, 2014, the security was still held, but the issuer was no longer an affiliated company of the fund. |
| 3 In March 2013, Harry Winston Diamond Corp. changed its name to Dominion Diamond Corp. |
| 4 In June 2013, Ivanhoe Australia Ltd. changed its name to Inova Resources Ltd. |
| 5 In May 2013, Speewah Metals Ltd. changed its name to King River Copper Ltd. |
I. Management has determined that no material events or transactions occurred subsequent to January 31, 2014, that would require recognition or disclosure in these financial statements.
25
Report of Independent Registered
Public Accounting Firm
To the Trustees of Vanguard Specialized Funds and the Shareholders of Vanguard Precious Metals and Mining Fund:
In our opinion, the accompanying statement of net assets and statement of assets and liabilities and the related statements of operations and of changes in net assets and the financial highlights present fairly, in all material respects, the financial position of Vanguard Precious Metals and Mining Fund (constituting a separate portfolio of Vanguard Specialized Funds, hereafter referred to as the “Fund”) at January 31, 2014, the results of its operations for the year then ended, the changes in its net assets for each of the two years in the period then ended, and the financial highlights for each of five years in the period then ended, in conformity with accounting principles generally accepted in the United States of America. These financial statements and financial highlights (hereafter referred to as “financial statements”) are the responsibility of the Fund’s management; our responsibility is to express an opinion on these financial statements based on our audits. We conducted our audits of these financial statements in accordance with the standards of the Public Company Accounting Oversight Board (United States). Those standards require that we plan and perform the audit to obtain reasonable assurance about whether the financial statements are free of material misstatement. An audit includes examining, on a test basis, evidence supporting the amounts and disclosures in the financial statements, assessing the accounting principles used and significant estimates made by management, and evaluating the overall financial statement presentation. We believe that our audits, which included confirmation of securities at January 31, 2014 by correspondence with the custodian and by agreement to the underlying ownership records of the transfer agent, provide a reasonable basis for our opinion.
/s/PricewaterhouseCoopers LLP
Philadelphia, Pennsylvania
March 17, 2014
Special 2013 tax information (unaudited) for Vanguard Precious Metals and Mining Fund
This information for the fiscal year ended January 31, 2014, is included pursuant to provisions of the
Internal Revenue Code.
The fund distributed $446,000 of qualified dividend income to shareholders during the fiscal year.
For corporate shareholders, 13.1% of investment income (dividend income plus short-term gains,
if any) qualifies for the dividends-received deduction.
26
Your Fund’s After-Tax Returns
This table presents returns for your fund both before and after taxes. The after-tax returns are shown in two ways: (1) assuming that an investor owned the fund during the entire period and paid taxes on the fund’s distributions, and (2) assuming that an investor paid taxes on the fund’s distributions and sold all shares at the end of each period.
Calculations are based on the highest individual federal income tax and capital gains tax rates in effect at the times of the distributions and the hypothetical sales. State and local taxes were not considered. After-tax returns reflect any qualified dividend income, using actual prior-year figures and estimates for 2014. (In the example, returns after the sale of fund shares may be higher than those assuming no sale. This occurs when the sale would have produced a capital loss. The calculation assumes that the investor received a tax deduction for the loss.)
Please note that your actual after-tax returns will depend on your tax situation and may differ from those shown. Also note that if you own the fund in a tax-deferred account, such as an individual retirement account or a 401(k) plan, this information does not apply to you. Such accounts are not subject to current taxes.
Finally, keep in mind that a fund’s performance—whether before or after taxes—does not guarantee future results.
| | | |
| Average Annual Total Returns: Precious Metals and Mining Fund | | |
| Periods Ended January 31, 2014 | | | |
| | One | Five | Ten |
| | Year | Years | Years |
| Returns Before Taxes | -32.82% | 3.40% | 3.72% |
| Returns After Taxes on Distributions | -32.83 | 2.50 | 2.36 |
| Returns After Taxes on Distributions and Sale of Fund Shares | -18.57 | 3.31 | 4.00 |
27
About Your Fund’s Expenses
As a shareholder of the fund, you incur ongoing costs, which include costs for portfolio management, administrative services, and shareholder reports (like this one), among others. Operating expenses, which are deducted from a fund’s gross income, directly reduce the investment return of the fund.
A fund’s expenses are expressed as a percentage of its average net assets. This figure is known as the expense ratio. The following examples are intended to help you understand the ongoing costs (in dollars) of investing in your fund and to compare these costs with those of other mutual funds. The examples are based on an investment of $1,000 made at the beginning of the period shown and held for the entire period.
The accompanying table illustrates your fund’s costs in two ways:
• Based on actual fund return. This section helps you to estimate the actual expenses that you paid over the period. The ”Ending Account Value“ shown is derived from the fund‘s actual return, and the third column shows the dollar amount that would have been paid by an investor who started with $1,000 in the fund. You may use the information here, together with the amount you invested, to estimate the expenses that you paid over the period.
To do so, simply divide your account value by $1,000 (for example, an $8,600 account value divided by $1,000 = 8.6), then multiply the result by the number given for your fund under the heading ”Expenses Paid During Period.“
• Based on hypothetical 5% yearly return. This section is intended to help you compare your fund‘s costs with those of other mutual funds. It assumes that the fund had a yearly return of 5% before expenses, but that the expense ratio is unchanged. In this case—because the return used is not the fund’s actual return—the results do not apply to your investment. The example is useful in making comparisons because the Securities and Exchange Commission requires all mutual funds to calculate expenses based on a 5% return. You can assess your fund’s costs by comparing this hypothetical example with the hypothetical examples that appear in shareholder reports of other funds.
Note that the expenses shown in the table are meant to highlight and help you compare ongoing costs only and do not reflect transaction costs incurred by the fund for buying and selling securities. Further, the expenses do not include any purchase, redemption, or account service fees described in the fund prospectus. If such fees were applied to your account, your costs would be higher. Your fund does not carry a “sales load.”
The calculations assume no shares were bought or sold during the period. Your actual costs may have been higher or lower, depending on the amount of your investment and the timing of any purchases or redemptions.
You can find more information about the fund’s expenses, including annual expense ratios, in the Financial Statements section of this report. For additional information on operating expenses and other shareholder costs, please refer to your fund’s current prospectus.
28
| | | |
| Six Months Ended January 31, 2014 | | | |
| | Beginning | Ending | Expenses |
| | Account Value | Account Value | Paid During |
| Precious Metals and Mining Fund | 7/31/2013 | 1/31/2014 | Period |
| Based on Actual Fund Return | $1,000.00 | $983.89 | $1.20 |
| Based on Hypothetical 5% Yearly Return | 1,000.00 | 1,024.00 | 1.22 |
The calculations are based on expenses incurred in the most recent six-month period. The fund’s annualized six-month expense ratio for that
period is 0.24%. The dollar amounts shown as “Expenses Paid” are equal to the annualized expense ratio multiplied by the average account
value over the period, multiplied by the number of days in the most recent six-month period, then divided by the number of days in the most
recent 12-month period.
29
Glossary
Beta. A measure of the magnitude of a fund’s past share-price fluctuations in relation to the ups and downs of a given market index. The index is assigned a beta of 1.00. Compared with a given index, a fund with a beta of 1.20 typically would have seen its share price rise or fall by 12% when the index rose or fell by 10%. For this report, beta is based on returns over the past 36 months for both the fund and the index. Note that a fund’s beta should be reviewed in conjunction with its R-squared (see definition). The lower the R-squared, the less correlation there is between the fund and the index, and the less reliable beta is as an indicator of volatility.
Dividend Yield. Dividend income earned by stocks, expressed as a percentage of the aggregate market value (or of net asset value, for a fund). The yield is determined by dividing the amount of the annual dividends by the aggregate value (or net asset value) at the end of the period. For a fund, the dividend yield is based solely on stock holdings and does not include any income produced by other investments.
Earnings Growth Rate. The average annual rate of growth in earnings over the past five years for the stocks now in a fund.
Equity Exposure. A measure that reflects a fund’s investments in stocks and stock futures. Any holdings in short-term reserves are excluded.
Expense Ratio. A fund’s total annual operating expenses expressed as a percentage of the fund’s average net assets. The expense ratio includes management and administrative expenses, but does not include the transaction costs of buying and selling portfolio securities.
Foreign Holdings. The percentage of a fund represented by securities or depositary receipts of companies based outside the United States.
Inception Date. The date on which the assets of a fund (or one of its share classes) are first invested in accordance with the fund’s investment objective. For funds with a subscription period, the inception date is the day after that period ends. Investment performance is measured from the inception date.
Median Market Cap. An indicator of the size of companies in which a fund invests; the midpoint of market capitalization (market price x shares outstanding) of a fund’s stocks, weighted by the proportion of the fund’s assets invested in each stock. Stocks representing half of the fund’s assets have market capitalizations above the median, and the rest are below it.
Price/Book Ratio. The share price of a stock divided by its net worth, or book value, per share. For a fund, the weighted average price/book ratio of the stocks it holds.
Price/Earnings Ratio. The ratio of a stock’s current price to its per-share earnings over the past year. For a fund, the weighted average P/E of the stocks it holds. P/E is an indicator of market expectations about corporate prospects; the higher the P/E, the greater the expectations for a company’s future growth.
R-Squared. A measure of how much of a fund’s past returns can be explained by the returns from the market in general, as measured by a given index. If a fund’s total returns were precisely synchronized with an index’s returns, its R-squared would be 1.00. If the fund’s returns bore no relationship to the index’s returns, its R-squared would be 0. For this report, R-squared is based on returns over the past 36 months for both the fund and the index.
30
Return on Equity. The annual average rate of return generated by a company during the past five years for each dollar of shareholder’s equity (net income divided by shareholder’s equity). For a fund, the weighted average return on equity for the companies whose stocks it holds.
Short-Term Reserves. The percentage of a fund invested in highly liquid, short-term securities that can be readily converted to cash.
Turnover Rate. An indication of the fund’s trading activity. Funds with high turnover rates incur higher transaction costs and may be more likely to distribute capital gains (which may be taxable to investors). The turnover rate excludes in-kind transactions, which have minimal impact on costs.
Benchmark Information
Spliced Global Custom Metals and Mining Index: S&P/Citigroup World Equity Gold Index through June 30, 2005; S&P Global Custom Metals and Mining Index thereafter.
31
The People Who Govern Your Fund
The trustees of your mutual fund are there to see that the fund is operated and managed in your best interests since, as a shareholder, you are a part owner of the fund. Your fund’s trustees also serve on the board of directors of The Vanguard Group, Inc., which is owned by the Vanguard funds and provides services to them on an at-cost basis.
A majority of Vanguard’s board members are independent, meaning that they have no affiliation with Vanguard or the funds they oversee, apart from the sizable personal investments they have made as private individuals. The independent board members have distinguished backgrounds in business, academia, and public service. Each of the trustees and executive officers oversees 180 Vanguard funds.
The following table provides information for each trustee and executive officer of the fund. More information about the trustees is in the Statement of Additional Information, which can be obtained, without charge, by contacting Vanguard at 800-662-7447, or online at vanguard.com.
| |
| InterestedTrustee1 | and Delphi Automotive LLP (automotive components); |
| | Senior Advisor at New Mountain Capital. |
| F. William McNabb III | |
| Born 1957. Trustee Since July 2009. Chairman of the | Amy Gutmann |
| Board. Principal Occupation(s) During the Past Five | Born 1949. Trustee Since June 2006. Principal |
| Years: Chairman of the Board of The Vanguard Group, | Occupation(s) During the Past Five Years: President of |
| Inc., and of each of the investment companies served | the University of Pennsylvania; Christopher H. Browne |
| by The Vanguard Group, since January 2010; Director | Distinguished Professor of Political Science, School of |
| of The Vanguard Group since 2008; Chief Executive | Arts and Sciences, and Professor of Communication, |
| Officer and President of The Vanguard Group, and of | Annenberg School for Communication, with secondary |
| each of the investment companies served by The | faculty appointments in the Department of Philosophy, |
| Vanguard Group, since 2008; Director of Vanguard | School of Arts and Sciences, and at the Graduate |
| Marketing Corporation; Managing Director of The | School of Education, University of Pennsylvania; |
| Vanguard Group (1995–2008). | Trustee of the National Constitution Center; Chair |
| | of the Presidential Commission for the Study of |
| | Bioethical Issues. |
| IndependentTrustees | |
| | |
| Emerson U. Fullwood | JoAnn Heffernan Heisen |
| Born 1948. Trustee Since January 2008. Principal | Born 1950. Trustee Since July 1998. Principal |
| Occupation(s) During the Past Five Years: Executive | Occupation(s) During the Past Five Years: Corporate |
| Chief Staff and Marketing Officer for North America | Vice President and Chief Global Diversity Officer |
| and Corporate Vice President (retired 2008) of Xerox | (retired 2008) and Member of the Executive |
| Corporation (document management products and | Committee (1997–2008) of Johnson & Johnson |
| services); Executive in Residence and 2010 | (pharmaceuticals/medical devices/consumer |
| Distinguished Minett Professor at the Rochester | products); Director of Skytop Lodge Corporation |
| Institute of Technology; Director of SPX Corporation | (hotels), the University Medical Center at Princeton, |
| (multi-industry manufacturing), the United Way of | the Robert Wood Johnson Foundation, and the Center |
| Rochester, Amerigroup Corporation (managed health | for Talent Innovation; Member of the Advisory Board |
| care), the University of Rochester Medical Center, | of the Maxwell School of Citizenship and Public Affairs |
| Monroe Community College Foundation, and North | at Syracuse University. |
| Carolina A&T University. | |
| |
| Rajiv L. Gupta | F. Joseph Loughrey |
| Born 1945. Trustee Since December 2001.2 | Born 1949. Trustee Since October 2009. Principal |
| Principal Occupation(s) During the Past Five Years: | Occupation(s) During the Past Five Years: President |
| Chairman and Chief Executive Officer (retired 2009) | and Chief Operating Officer (retired 2009) of Cummins |
| and President (2006–2008) of Rohm and Haas Co. | Inc. (industrial machinery); Chairman of the Board |
| (chemicals); Director of Tyco International, Ltd. | of Hillenbrand, Inc. (specialized consumer services), |
| (diversified manufacturing and services), Hewlett- | and of Oxfam America; Director of SKF AB (industrial |
| Packard Co. (electronic computer manufacturing), | machinery), Hyster-Yale Materials Handling, Inc. |
| | (forklift trucks), the Lumina Foundation for Education, |
| | |
| and the V Foundation for Cancer Research; Member | Executive Officers | |
| of the Advisory Council for the College of Arts and | | |
| Letters and of the Advisory Board to the Kellogg | Glenn Booraem | |
| Institute for International Studies, both at the | Born 1967. Controller Since July 2010. Principal |
| University of Notre Dame. | Occupation(s) During the Past Five Years: Principal |
| | of The Vanguard Group, Inc.; Controller of each of |
| Mark Loughridge | the investment companies served by The Vanguard |
| Born 1953. Trustee Since March 2012. Principal | Group; Assistant Controller of each of the investment |
| Occupation(s) During the Past Five Years: Senior Vice | companies served by The Vanguard Group (2001–2010). |
| President and Chief Financial Officer (retired 2013) | | |
| at IBM (information technology services); Fiduciary | Thomas J. Higgins | |
| Member of IBM’s Retirement Plan Committee (2004– | Born 1957. Chief Financial Officer Since September |
| 2013); Member of the Council on Chicago Booth. | 2008. Principal Occupation(s) During the Past Five |
| | Years: Principal of The Vanguard Group, Inc.; Chief |
| Scott C. Malpass | Financial Officer of each of the investment companies |
| Born 1962. Trustee Since March 2012. Principal | served by The Vanguard Group; Treasurer of each of |
| Occupation(s) During the Past Five Years: Chief | the investment companies served by The Vanguard |
| Investment Officer and Vice President at the University | Group (1998–2008). | |
| of Notre Dame; Assistant Professor of Finance at the | | |
| Mendoza College of Business at Notre Dame; Member | Kathryn J. Hyatt | |
| of the Notre Dame 403(b) Investment Committee; | Born 1955. Treasurer Since November 2008. Principal |
| Board Member of TIFF Advisory Services, Inc. | Occupation(s) During the Past Five Years: Principal of |
| (investment advisor); Member of the Investment | The Vanguard Group, Inc.; Treasurer of each of the |
| Advisory Committees of the Financial Industry | investment companies served by The Vanguard |
| Regulatory Authority (FINRA) and of Major League | Group; Assistant Treasurer of each of the investment |
| Baseball. | companies served by The Vanguard Group (1988–2008). |
| |
| André F. Perold | Heidi Stam | |
| Born 1952. Trustee Since December 2004. Principal | Born 1956. Secretary Since July 2005. Principal |
| Occupation(s) During the Past Five Years: George | Occupation(s) During the Past Five Years: Managing |
| Gund Professor of Finance and Banking, Emeritus | Director of The Vanguard Group, Inc.; General Counsel |
| at the Harvard Business School (retired 2011); | of The Vanguard Group; Secretary of The Vanguard |
| Chief Investment Officer and Managing Partner of | Group and of each of the investment companies |
| HighVista Strategies LLC (private investment firm); | served by The Vanguard Group; Director and Senior |
| Director of Rand Merchant Bank; Overseer of the | Vice President of Vanguard Marketing Corporation. |
| Museum of Fine Arts Boston. | | |
| | Vanguard Senior ManagementTeam |
| Alfred M. Rankin, Jr. | | |
| Born 1941. Trustee Since January 1993. Principal | Mortimer J. Buckley | Chris D. McIsaac |
| Occupation(s) During the Past Five Years: Chairman, | Kathleen C. Gubanich | Michael S. Miller |
| President, and Chief Executive Officer of NACCO | Paul A. Heller | James M. Norris |
| Industries, Inc. (housewares/lignite), and of Hyster- | Martha G. King | Glenn W. Reed |
| Yale Materials Handling, Inc. (forklift trucks); Chairman | John T. Marcante | |
| of the Board of University Hospitals of Cleveland. | | |
| |
| Peter F. Volanakis | Chairman Emeritus and Senior Advisor |
| Born 1955. Trustee Since July 2009. Principal | | |
| Occupation(s) During the Past Five Years: President | John J. Brennan | |
| and Chief Operating Officer (retired 2010) of Corning | Chairman, 1996–2009 | |
| Incorporated (communications equipment); Trustee of | Chief Executive Officer and President, 1996–2008 |
| Colby-Sawyer College; Member of the Advisory Board | | |
| of the Norris Cotton Cancer Center and of the Advisory | | |
| Board of the Parthenon Group (strategy consulting). | Founder | |
| | John C. Bogle | |
| | Chairman and Chief Executive Officer, 1974–1996 |
1 Mr. McNabb is considered an “interested person,” as defined in the Investment Company Act of 1940, because he is an officer of the
Vanguard funds.
2 December 2002 for Vanguard Equity Income Fund, Vanguard Growth Equity Fund, the Vanguard Municipal Bond Funds, and the Vanguard
State Tax-Exempt Funds.
|  |
| | P.O. Box 2600 |
| | Valley Forge, PA 19482-2600 |
| |
| |
| |
| Connect with Vanguard® > vanguard.com | |
| |
| |
| |
| Fund Information > 800-662-7447 | CFA® is a trademark owned by CFA Institute. |
| Direct Investor Account Services > 800-662-2739 | |
| Institutional Investor Services > 800-523-1036 | |
| Text Telephone for People | |
| With Hearing Impairment > 800-749-7273 | |
| |
| This material may be used in conjunction | |
| with the offering of shares of any Vanguard | |
| fund only if preceded or accompanied by | |
| the fund’s current prospectus. | |
| |
| All comparative mutual fund data are from Lipper, a | |
| Thomson Reuters Company, or Morningstar, Inc., unless | |
| otherwise noted. | |
| |
| You can obtain a free copy of Vanguard’s proxy voting | |
| guidelines by visiting vanguard.com/proxyreporting or by | |
| calling Vanguard at 800-662-2739. The guidelines are | |
| also available from the SEC’s website, sec.gov. In | |
| addition, you may obtain a free report on how your fund | |
| voted the proxies for securities it owned during the 12 | |
| months ended June 30. To get the report, visit either | |
| vanguard.com/proxyreporting or sec.gov. | |
| |
| You can review and copy information about your fund at | |
| the SEC’s Public Reference Room in Washington, D.C. To | |
| find out more about this public service, call the SEC at | |
| 202-551-8090. Information about your fund is also | |
| available on the SEC’s website, and you can receive | |
| copies of this information, for a fee, by sending a | |
| request in either of two ways: via e-mail addressed to | |
| publicinfo@sec.gov or via regular mail addressed to the | |
| Public Reference Section, Securities and Exchange | |
| Commission, Washington, DC 20549-1520. | |
| |
| | © 2014 The Vanguard Group, Inc. |
| | All rights reserved. |
| | Vanguard Marketing Corporation, Distributor. |
| |
| | Q530 032014 |

Annual Report | January 31, 2014
Vanguard Dividend Growth Fund

Vanguard’s Principles for Investing Success
We want to give you the best chance of investment success. These principles,
grounded in Vanguard’s research and experience, can put you on the right path.
Goals. Create clear, appropriate investment goals.
Balance. Develop a suitable asset allocation using broadly diversified funds.
Cost. Minimize cost.
Discipline. Maintain perspective and long-term discipline.
A single theme unites these principles: Focus on the things you can control.
We believe there is no wiser course for any investor.
| |
| Contents | |
| Your Fund’s Total Returns. | 1 |
| Chairman’s Letter. | 2 |
| Advisor’s Report. | 7 |
| Fund Profile. | 9 |
| Performance Summary. | 10 |
| Financial Statements. | 12 |
| Your Fund’s After-Tax Returns. | 22 |
| About Your Fund’s Expenses. | 23 |
| Trustees Approve Advisory Arrangement. | 25 |
| Glossary. | 26 |
Please note: The opinions expressed in this report are just that—informed opinions. They should not be considered promises or advice.
Also, please keep in mind that the information and opinions cover the period through the date on the front of this report. Of course, the
risks of investing in your fund are spelled out in the prospectus.
See the Glossary for definitions of investment terms used in this report.
About the cover: The ship’s wheel represents leadership and guidance, essential qualities in navigating difficult seas.
This one is a replica based on an 18th-century British vessel. The HMSVanguard, another ship of that era, served as the
flagship for British Admiral Horatio Nelson when he defeated a French fleet at the Battle of the Nile.
Your Fund’s Total Returns
| |
| Fiscal Year Ended January 31, 2014 | |
| |
| | Total |
| | Returns |
| Vanguard Dividend Growth Fund | 19.60% |
| NASDAQ US Dividend Achievers Select Index | 15.70 |
| Large-Cap Core Funds Average | 20.41 |
| Large-Cap Core Funds Average: Derived from data provided by Lipper, a Thomson Reuters Company. |
| | | | |
| Your Fund’s Performance at a Glance | | | |
| January 31, 2013, Through January 31, 2014 | | | |
| |
| | | | Distributions Per Share |
| | Starting | Ending | | |
| | Share | Share | Income | Capital |
| | Price | Price | Dividends | Gains |
| Vanguard Dividend Growth Fund | $17.52 | $20.45 | $0.384 | $0.104 |
1

Chairman’s Letter
Dear Shareholder,
U.S. stocks delivered robust returns for the 12 months ended January 31, 2014, despite volatility as the new year began.
Vanguard Dividend Growth Fund returned 19.60%, nearly 4 percentage points ahead of its benchmark index and slightly behind the average return of its peers. The fund’s investments in the health care, industrial, and information technology sectors helped its relative performance.
The fund’s 30-day SEC yield declined from 2.24% at the start of the fiscal year to 2.05% at the end.
U.S. stocks found a groove before January volatility set in
A late stumble didn’t stop U.S. stocks from notching an impressive gain of 23% for the 12 months. Strong corporate earnings growth and investors’ willingness to pay for those earnings drove stock markets, which were also buoyed by the Federal Reserve’s stimulative bond-buying program. The Fed, noting the economy’s improvement, began paring back its bond purchases in January. Nevertheless, stocks declined over that month as investors worried about recent economic developments at home and abroad.
Overall, international stocks advanced about 6% for the 12 months. Developed markets of Europe and the Pacific region posted gains; however, concerns about
2
China’s weaker economy hurt stocks and currencies in various emerging-market countries.
For 2014, Vanguard Chief Economist Joe Davis and his team are guarded in their outlook for global stock returns, and their forecast for the bond market remains muted. Although Joe readily acknowledges that such forecasts are accompanied by uncertainty, he writes, “We believe that a long-term, strategic approach with a balanced, diversified, low-cost portfolio can remain a high-value proposition in the decade ahead.” (You can read more about our expectations for bond and stock returns in Vanguard’s Economic and Investment Outlook, available at vanguard.com/research.)
Bond returns were flat as the Fed firmed its strategy
Investors spurned bonds for most of the period, wary of the Fed’s expected curtailment of its bond-buying program. In January, however, despite the start of that tapering, fixed income investments regained appeal as stocks slumped.
The broad U.S. taxable bond market returned 0.12% for the 12 months, while municipal bonds posted returns of –1.07%. The yield of the benchmark 10-year Treasury note generally increased, eclipsing 3.00% at times, and finished at about 2.70%. (Bond prices and yields move in opposite directions.)
| | | |
| Market Barometer | | | |
| |
| | Average Annual Total Returns |
| | Periods Ended January 31, 2014 |
| | One | Three | Five |
| | Year | Years | Years |
| Stocks | | | |
| Russell 1000 Index (Large-caps) | 22.23% | 14.14% | 19.84% |
| Russell 2000 Index (Small-caps) | 27.03 | 14.69 | 22.26 |
| Russell 3000 Index (Broad U.S. market) | 22.60 | 14.18 | 20.03 |
| FTSE All-World ex US Index (International) | 5.78 | 3.37 | 14.38 |
| |
| Bonds | | | |
| Barclays U.S. Aggregate Bond Index (Broad taxable market) | 0.12% | 3.73% | 4.93% |
| Barclays Municipal Bond Index (Broad tax-exempt market) | -1.07 | 5.76 | 5.54 |
| Citigroup Three-Month U.S. Treasury Bill Index | 0.05 | 0.06 | 0.09 |
| |
| CPI | | | |
| Consumer Price Index | 1.58% | 2.03% | 2.07% |
3
International bond markets (as measured by the Barclays Global Aggregate Index ex USD) returned –1.24%. The Fed’s continued target of 0%–0.25% for short-term interest rates tightly restricted returns of money market funds and savings accounts.
The fund’s health care stocks helped drive relative performance
The Dividend Growth Fund focuses on large, financially sound companies that the advisor believes have strong dividend growth potential. Unlike other dividend-oriented funds, it doesn’t strive to hold stocks with the highest yields. In fact, the fund sometimes invests in stocks with relatively low current yields if its advisor, Wellington Management Company, sees potential for growth.
The fund’s performance benefited as the U.S. economy gradually strengthened over the period. Eight of the nine industry sectors in which the fund invests posted positive returns.
The advisor’s allocation to health care stocks—which was more than double that of the fund’s benchmark—contributed most to relative performance. Because the benchmark, the NASDAQ US Dividend Achievers Select Index, filters out companies that haven’t increased their annual regular dividends for at least ten consecutive years, it sometimes ends up with smaller allocations to top-performing, high-yielding market sectors such as health care. But the fund’s advisor is not bound by such parameters, and that proved to be an advantage.
| | |
| Expense Ratios | | |
| Your Fund Compared With Its Peer Group | | |
| | | Peer Group |
| | Fund | Average |
| Dividend Growth Fund | 0.29% | 1.15% |
The fund expense ratio shown is from the prospectus dated May 28, 2013, and represents estimated costs for the current fiscal year. For the
fiscal year ended January 31, 2014, the fund’s expense ratio was 0.31%. The peer-group expense ratio is derived from data provided by
Lipper, a Thomson Reuters Company, and captures information through year-end 2013.
Peer group: Large-Cap Core Funds.
4
Health care stocks produced more than a quarter of the fund’s total return. Pharmaceutical companies stood out, boosted by improved drug pipelines and increased international demand. Health care distributors and managed-care providers also did well.
The industrial and information technology sectors were bright spots, too. Manufacturers of aerospace and defense products profited from a rise in corporate spending and factory orders. Although some of that activity cooled at the tail end of the fiscal year, many of these companies still benefited from cost-cutting and from technological improvements made to offset cutbacks in government spending.
Increased business spending in information technology boosted the fund’s tech holdings. The stocks of software, data processing, and consulting companies performed best.
Energy was the weakest performer and the only sector with a negative return. Poor selection among integrated oil and gas stocks resulted in a shortfall relative to the benchmark.
Over a volatile decade, the fund surpassed its comparative standards
For the ten years ended January 31, 2014, the Dividend Growth Fund posted an average annual return of 8.39%, well ahead of both its benchmark index and the average return of its peers.
| |
| Total Returns | |
| Ten Years Ended January 31, 2014 | |
| | Average |
| | Annual Return |
| Dividend Growth Fund | 8.39% |
| Dividend Growth Spliced Index | 6.49 |
| Dividend Growth Spliced Average | 5.58 |
For a benchmark description, see the Glossary.
Dividend Growth Spliced Average: Derived from data provided by Lipper, a Thomson Reuters Company.
The figures shown represent past performance, which is not a guarantee of future results. (Current performance may be
lower or higher than the performance data cited. For performance data current to the most recent month-end, visit our
website at vanguard.com/performance.) Note, too, that both investment returns and principal value can fluctuate widely, so
an investor’s shares, when sold, could be worth more or less than their original cost.
5
Despite the decade’s volatility, the fund has fulfilled its mandate to offer investors a reliable way to tap into the stocks of large-capitalization U.S. companies committed to increasing their dividends.
The fund’s admirable track record is a credit to the experience and talent of Wellington Management Company, backed by Vanguard’s low costs, which allow you to keep more of the fund’s returns.
When traveling a long, bumpy road, be sure to pack some patience
Over time, even a small degree of outperformance can meaningfully affect a portfolio’s value. That’s why many investors remain drawn to active management—they want the opportunity for market-beating returns, even though considerable research has shown that only a minority of active managers outperform their benchmarks.
Long-term outperformance is uncommon largely because active management tends to be costlier than indexing. The higher a fund’s expense ratio, the higher the hurdle it must overcome to beat its benchmark after accounting for expenses.
For investors, impatience can create a still higher hurdle. Even managers with the best market-beating records struggle to avoid short-term periods of underperformance. An investor who is unwilling to endure some lean years could unwisely abandon a talented manager and miss out on long-term rewards. (You can read more in The Bumpy Road to Outperformance, available at vanguard.com/research.)
That’s why Vanguard recommends that you pay attention to costs and take a patient, long-term view. Vanguard does its part to try to give investors the best chance for success by offering access to world-class active managers and by operating our funds at costs well below industry averages.
As always, thank you for investing with Vanguard.
Sincerely,

F. William McNabb III
Chairman and Chief Executive Officer
February 14, 2014
6
Advisor’s Report
Vanguard Dividend Growth Fund returned 19.60% for the 12 months ended January 31, 2014, besting the 15.70% return of its benchmark, the NASDAQ US Dividend Achievers Select Index.
The investment environment
As has been the case for much of the last few years, we remain highly cautious in our investment posture. The reasons are the same. In our opinion, soft underlying economic conditions globally are being masked by central bank liquidity measures. Although we are still uncertain about the public policy virtue of such measures, they have clearly buoyed the markets. Their ultimate unwinding presents risk to all assets, especially stocks.
We think it’s critical that the private sector be prepared to take the baton from central banks around the world. And although economic conditions seem better, fourth-quarter results from a cross-section of companies offer little real evidence that fundamentals are sufficiently strong.
The fund’s successes
All sectors except energy boosted absolute performance for the period. The fund’s holdings in the industrial and health care sectors helped the most. Top absolute contributors included Lockheed Martin, Microsoft, and Cardinal Health.
On a “run-rate” basis, the portfolio is expected to produce asset-weighted dividend growth of 14.2% for calendar 2013. The 2012 figure was about 28.3%. Our run-rate calculation roughly estimates potential dividend growth; it takes a company’s current declared dividend rate, annualizes it, and compares it with the previous year’s actual rate. It does not accurately reflect, nor factor in the dollar amount of, dividend increases that may be announced later in the year. Therefore, companies in the early stages of dividend growth tend to show large percentage increases, yet the absolute cash dividend may be small. Despite these shortcomings, we view this estimate as a reasonable report card.
Among the notable dividend run-rate increases thus far in 2014 were those of Praxair (18.2%) and UnitedHealth (40.0%).
The fund’s shortfalls
The energy sector failed to produce a positive relative return for the fund, with Chevron and BG Group among its biggest absolute detractors. IBM, in information technology, was an absolute detractor as well. Although we would prefer that all stocks in the fund always do well, some will inevitably hinder performance over a given period. We assess a stock’s contribution over a longer time frame and stay consistently focused on dividend action.
7
The fund’s positioning and investment strategy
Our primary objective is to identify companies that we believe will steadily and reliably grow their dividend payments. We seek to fulfill this objective by carefully building the portfolio one stock at a time, giving central consideration to each company’s dividend growth prospects. Our industry and sector weightings are an output of this process. At the end of the fiscal year, the fund had significant allocations to the health care, consumer discretionary, and industrial sectors and less exposure to utilities, and materials.
Since our last report, little has changed in the fund’s positioning, and our investment strategy remains the same. If anything, we are simply trying to trim stocks that have appreciated significantly and add to those that have lagged the broader market.
So the top ten positions have changed modestly; otherwise, we remain steady.
Donald J. Kilbride
Senior Vice President and
Equity Portfolio Manager
Wellington Management Company, llp
February 19, 2014
8
Dividend Growth Fund
Fund Profile
As of January 31, 2014
| | | |
| Portfolio Characteristics | | |
| | | NASDAQ | |
| | | US | |
| | | Dividend | DJ |
| | | Achievers | U.S. Total |
| | | Select | Market |
| | Fund | Index | FA Index |
| Number of Stocks | 50 | 146 | 3,635 |
| Median Market Cap | $71.8B | $56.9B | $41.3B |
| Price/Earnings Ratio | 16.9x | 17.5x | 19.1x |
| Price/Book Ratio | 3.3x | 3.2x | 2.6x |
| Return on Equity | 22.8% | 21.7% | 16.5% |
| Earnings Growth Rate | 9.3% | 6.7% | 11.4% |
| Dividend Yield | 2.5% | 2.2% | 1.9% |
| Foreign Holdings | 9.8% | 0.0% | 0.0% |
| Turnover Rate | 18% | — | — |
| Ticker Symbol | VDIGX | — | — |
| Expense Ratio1 | 0.29% | — | — |
| 30-Day SEC Yield | 2.05% | — | — |
| Short-Term Reserves | 3.0% | — | — |
| | | |
| Sector Diversification (% of equity exposure) |
| | | NASDAQ | DJ |
| | | US | U.S. |
| | | Dividend | Total |
| | | Achievers | Market |
| | | Select | FA |
| | Fund | Index | Index |
| Consumer Discretionary 15.8% | 12.9% | 13.0% |
| Consumer Staples | 13.4 | 22.5 | 8.3 |
| Energy | 9.3 | 12.5 | 9.2 |
| Financials | 11.1 | 7.6 | 17.3 |
| Health Care | 18.3 | 8.9 | 13.2 |
| Industrials | 14.3 | 20.3 | 11.7 |
| Information Technology | 12.0 | 5.7 | 18.3 |
| Materials | 4.4 | 8.6 | 3.8 |
| Telecommunication | | | |
| Services | 0.0 | 0.1 | 2.1 |
| Utilities | 1.4 | 0.9 | 3.1 |
| | |
| Volatility Measures | | |
| | NASDAQ | |
| | US Dividend | DJ |
| | Achievers | U.S. Total |
| | Select | Market |
| | Index | FA Index |
| R-Squared | 0.94 | 0.90 |
| Beta | 0.86 | 0.73 |
| These measures show the degree and timing of the fund’s fluctuations compared with the indexes over 36 months. |
| | |
| Ten Largest Holdings (% of total net assets) |
| McDonald's Corp. | Restaurants | 3.0% |
| Microsoft Corp. | Systems Software | 3.0 |
| United Parcel Service | Air Freight & | |
| Inc. | Logistics | 2.9 |
| Merck & Co. Inc. | Pharmaceuticals | 2.7 |
| Wal-Mart Stores Inc. | Hypermarkets & | |
| | Super Centers | 2.7 |
| Praxair Inc. | Industrial Gases | 2.5 |
| Roche Holding AG | Pharmaceuticals | 2.5 |
| Johnson & Johnson | Pharmaceuticals | 2.4 |
| United Technologies | Aerospace & | |
| Corp. | Defense | 2.4 |
| Lockheed Martin Corp. | Aerospace & | |
| | Defense | 2.4 |
| Top Ten | | 26.5% |
| The holdings listed exclude any temporary cash investments and equity index products. |
Investment Focus
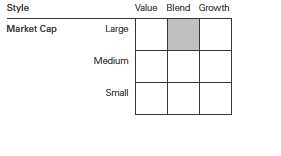
1 The expense ratio shown is from the prospectus dated May 28, 2013, and represents estimated costs for the current fiscal year. For the fiscal year
ended January 31, 2014, the expense ratio was 0.31%.
9
Dividend Growth Fund
Performance Summary
All of the returns in this report represent past performance, which is not a guarantee of future results that may be achieved by the fund. (Current performance may be lower or higher than the performance data cited. For performance data current to the most recent month-end, visit our website at vanguard.com/performance.) Note, too, that both investment returns and principal value can fluctuate widely, so an investor’s shares, when sold, could be worth more or less than their original cost. The returns shown do not reflect taxes that a shareholder would pay on fund distributions or on the sale of fund shares.
Cumulative Performance: January 31, 2004, Through January 31, 2014
Initial Investment of $10,000
| | | | | |
| | | Average Annual Total Returns | |
| | | Periods Ended January 31, 2014 | |
| | | | | | Final Value |
| | | One | Five | Ten | of a $10,000 |
| | | Year | Years | Years | Investment |
| | Dividend Growth Fund* | 19.60% | 17.02% | 8.39% | $22,376 |
| •••••••• | Dividend Growth Spliced Index | 15.70 | 18.18 | 6.49 | 18,749 |
| – – – – | Dividend Growth Spliced Average | 20.41 | 17.69 | 5.58 | 17,215 |
| | Dow Jones U.S. Total Stock Market | | | | |
| | Float Adjusted Index | 22.53 | 20.13 | 7.51 | 20,637 |
| For a benchmark description, see the Glossary. |
| Dividend Growth Spliced Average: Derived from data provided by Lipper, a Thomson Reuters Company. |
See Financial Highlights for dividend and capital gains information.
10
Dividend Growth Fund
Fiscal-Year Total Returns (%): January 31, 2004, Through January 31, 2014
For a benchmark description, see the Glossary.
Average Annual Total Returns: Periods Ended December 31, 2013
This table presents returns through the latest calendar quarter—rather than through the end of the fiscal period.
Securities and Exchange Commission rules require that we provide this information.
| | | | |
| | Inception | One | Five | Ten |
| | Date | Year | Years | Years |
| Dividend Growth Fund | 5/15/1992 | 31.53% | 16.60% | 9.03% |
11
Dividend Growth Fund
Financial Statements
Statement of Net Assets
As of January 31, 2014
The fund reports a complete list of its holdings in regulatory filings four times in each fiscal year, at the quarter-ends. For the second and fourth fiscal quarters, the lists appear in the fund’s semiannual and annual reports to shareholders. For the first and third fiscal quarters, the fund files the lists with the Securities and Exchange Commission on Form N-Q. Shareholders can look up the fund’s Forms N-Q on the SEC’s website at sec.gov. Forms N-Q may also be reviewed and copied at the SEC’s Public Reference Room (see the back cover of this report for further information).
| | |
| | | Market |
| | | Value |
| | Shares | ($000) |
| Common Stocks (97.0%) | | |
| Consumer Discretionary (15.3%) | |
| McDonald’s Corp. | 6,192,991 | 583,194 |
| Omnicom Group Inc. | 5,469,775 | 396,996 |
| Lowe’s Cos. Inc. | 8,224,884 | 380,730 |
| TJX Cos. Inc. | 6,288,601 | 360,714 |
| Target Corp. | 6,008,940 | 340,347 |
| NIKE Inc. Class B | 4,466,832 | 325,409 |
| Mattel Inc. | 7,510,176 | 284,185 |
| Walt Disney Co. | 3,627,325 | 263,380 |
| | | 2,934,955 |
| Consumer Staples (13.0%) | | |
| Wal-Mart Stores Inc. | 6,974,417 | 520,849 |
| Procter & Gamble Co. | 4,887,256 | 374,462 |
| Anheuser-Busch | | |
| InBev NV | 3,529,151 | 338,477 |
| CVS Caremark Corp. | 4,997,646 | 338,441 |
| Coca-Cola Co. | 8,620,550 | 326,029 |
| Diageo plc | 10,490,215 | 312,996 |
| Colgate-Palmolive Co. | 4,621,362 | 282,966 |
| | | 2,494,220 |
| Energy (9.0%) | | |
| Chevron Corp. | 3,976,962 | 443,949 |
| BG Group plc | 23,005,137 | 386,050 |
| Exxon Mobil Corp. | 3,937,068 | 362,840 |
| Enbridge Inc. | 8,585,948 | 360,524 |
| Occidental Petroleum | | |
| Corp. | 2,017,370 | 176,661 |
| | | 1,730,024 |
| Financials (10.8%) | | |
| ACE Ltd. | 3,888,923 | 364,820 |
| PNC Financial Services | | |
| Group Inc. | 4,496,709 | 359,197 |
| Wells Fargo & Co. | 7,520,468 | 340,978 |
| BlackRock Inc. | 1,082,685 | 325,314 |
| Public Storage | 1,649,777 | 259,988 |
| Marsh & McLennan | | |
| Cos. Inc. | 5,204,497 | 237,898 |
| Chubb Corp. | 2,082,992 | 176,096 |
| | | 2,064,291 |
| | |
| Health Care (17.8%) | | |
| Merck & Co. Inc. | 9,926,228 | 525,792 |
| Roche Holding AG | 1,709,376 | 469,744 |
| Johnson & Johnson | 5,275,092 | 466,687 |
| Cardinal Health Inc. | 6,627,168 | 450,780 |
| UnitedHealth Group Inc. | 5,851,010 | 422,911 |
| Medtronic Inc. | 7,355,680 | 416,037 |
| Amgen Inc. | 2,990,152 | 355,679 |
| Pfizer Inc. | 9,651,557 | 293,407 |
| | | 3,401,037 |
| Industrials (13.9%) | | |
| United Parcel Service | | |
| Inc. Class B | 5,781,917 | 550,612 |
| United Technologies | | |
| Corp. | 4,022,413 | 458,635 |
| Lockheed Martin Corp. | 3,012,327 | 454,590 |
| General Dynamics Corp. | 3,968,312 | 402,030 |
| Honeywell | | |
| International Inc. | 3,459,177 | 315,581 |
| Northrop Grumman Corp. | 2,288,567 | 264,444 |
| Emerson Electric Co. | 3,117,785 | 205,587 |
| | | 2,651,479 |
| Information Technology (11.6%) | |
| Microsoft Corp. | 15,027,326 | 568,784 |
| Accenture plc Class A | 5,491,437 | 438,656 |
| Automatic Data | | |
| Processing Inc. | 5,541,775 | 424,500 |
| International Business | | |
| Machines Corp. | 2,254,796 | 398,377 |
| Oracle Corp. | 10,513,213 | 387,938 |
| | | 2,218,255 |
| Materials (4.3%) | | |
| Praxair Inc. | 3,793,398 | 473,113 |
| Ecolab Inc. | 3,369,666 | 338,786 |
| | | 811,899 |
| Utilities (1.3%) | | |
| Dominion Resources Inc. | 3,756,451 | 255,101 |
| Total Common Stocks | | |
| (Cost $14,022,687) | | 18,561,261 |
12
Dividend Growth Fund
| | |
| | Face | Market |
| | Amount | Value• |
| | ($000) | ($000) |
| Temporary Cash Investments (3.0%) | |
| Repurchase Agreements (3.0%) | |
| rbs securities, inc. | | |
| 0.020%, 2/3/14 (dated | | |
| 1/31/14, repurchase | | |
| value $315,001,000, | | |
| collaterized by u.s. | | |
| Treasury Note/Bond, | | |
| 1.375%–3.125%, | | |
| 7/31/18–2/15/22, with | | |
| a value of $321,303,000) | 315,000 | 315,000 |
| Morgan Stanley & Co., Inc. | | |
| 0.030%, 2/3/14 (Dated | | |
| 1/31/14, Repurchase | | |
| Value $256,001,000, | | |
| collaterized by Federal | | |
| National Mortgage Assn. | | |
| 2.500%–5.500%, | | |
| 4/1/27–12/1/43 and | | |
| Federal Home Loan | | |
| Mortgage Corp. | | |
| 2.000%–6.000%, | | |
| 6/1/25–6/1/43, with | | |
| a value of $261,120,000) | 256,000 | 256,000 |
| | | 571,000 |
| Total Temporary Cash Investments | |
| (Cost $571,000) | | 571,000 |
| Total Investments (100.0%) | | |
| (Cost $14,593,687) | | 19,132,261 |
| Other Assets and Liabilities (0.0%) | |
| Other Assets | | 46,309 |
| Liabilities | | (41,274) |
| | | 5,035 |
| Net Assets (100%) | | |
| Applicable to 935,731,690 outstanding | |
| $.001 par value shares of beneficial | |
| interest (unlimited authorization) | 19,137,296 |
| Net Asset Value Per Share | | $20.45 |
| |
| At January 31, 2014, net assets consisted of: |
| | Amount |
| | ($000) |
| Paid-in Capital | 14,573,660 |
| Undistributed Net Investment Income | 2,577 |
| Accumulated Net Realized Gains | 22,346 |
| Unrealized Appreciation (Depreciation) | |
| Investment Securities | 4,538,574 |
| Foreign Currencies | 139 |
| Net Assets | 19,137,296 |
• See Note A in Notes to Financial Statements.
See accompanying Notes, which are an integral part of the Financial Statements.
13
| |
| Dividend Growth Fund | |
| |
| |
| Statement of Operations | |
| |
| | Year Ended |
| | January 31, 2014 |
| | ($000) |
| Investment Income | |
| Income | |
| Dividends1 | 379,767 |
| Interest | 395 |
| Securities Lending | 1,017 |
| Total Income | 381,179 |
| Expenses | |
| Investment Advisory Fees—Note B | |
| Basic Fee | 16,666 |
| Performance Adjustment | 3,239 |
| The Vanguard Group—Note C | |
| Management and Administrative | 27,040 |
| Marketing and Distribution | 3,636 |
| Custodian Fees | 164 |
| Auditing Fees | 27 |
| Shareholders’ Reports | 189 |
| Trustees’ Fees and Expenses | 31 |
| Total Expenses | 50,992 |
| Net Investment Income | 330,187 |
| Realized Net Gain (Loss) | |
| Investment Securities Sold | 223,285 |
| Foreign Currencies | 524 |
| Realized Net Gain (Loss) | 223,809 |
| Change in Unrealized Appreciation (Depreciation) | |
| Investment Securities | 2,176,632 |
| Foreign Currencies | 120 |
| Change in Unrealized Appreciation (Depreciation) | 2,176,752 |
| Net Increase (Decrease) in Net Assets Resulting from Operations | 2,730,748 |
| 1 Dividends are net of foreign withholding taxes of $4,702,000. |
See accompanying Notes, which are an integral part of the Financial Statements.
14
| | |
| Dividend Growth Fund | | |
| |
| |
| Statement of Changes in Net Assets | | |
| |
| | Year Ended January 31, |
| | 2014 | 2013 |
| | ($000) | ($000) |
| Increase (Decrease) in Net Assets | | |
| Operations | | |
| Net Investment Income | 330,187 | 241,028 |
| Realized Net Gain (Loss) | 223,809 | (32,138) |
| Change in Unrealized Appreciation (Depreciation) | 2,176,752 | 1,166,466 |
| Net Increase (Decrease) in Net Assets Resulting from Operations | 2,730,748 | 1,375,356 |
| Distributions | | |
| Net Investment Income | (329,157) | (246,574) |
| Realized Capital Gain | (93,833) | — |
| Total Distributions | (422,990) | (246,574) |
| Capital Share Transactions | | |
| Issued | 6,120,018 | 4,594,475 |
| Issued in Lieu of Cash Distributions | 378,204 | 216,370 |
| Redeemed | (2,372,492) | (2,064,522) |
| Net Increase (Decrease) from Capital Share Transactions | 4,125,730 | 2,746,323 |
| Total Increase (Decrease) | 6,433,488 | 3,875,105 |
| Net Assets | | |
| Beginning of Period | 12,703,808 | 8,828,703 |
| End of Period1 | 19,137,296 | 12,703,808 |
| 1 Net Assets—End of Period includes undistributed net investment income of $2,577,000 and $1,023,000. |
See accompanying Notes, which are an integral part of the Financial Statements.
15
| | | | | |
| Dividend Growth Fund | | | | | |
| |
| |
| Financial Highlights | | | | | |
| |
| |
| For a Share Outstanding | Year Ended January 31, |
| Throughout Each Period | 2014 | 2013 | 2012 | 2011 | 2010 |
| Net Asset Value, Beginning of Period | $17.52 | $15.81 | $14.68 | $12.82 | $10.42 |
| Investment Operations | | | | | |
| Net Investment Income | .385 | .357 | .317 | .283 | .291 |
| Net Realized and Unrealized Gain (Loss) | | | | | |
| on Investments | 3.033 | 1.721 | 1.126 | 1.850 | 2.401 |
| Total from Investment Operations | 3.418 | 2.078 | 1.443 | 2.133 | 2.692 |
| Distributions | | | | | |
| Dividends from Net Investment Income | (.384) | (.368) | (.313) | (.273) | (.292) |
| Distributions from Realized Capital Gains | (.104) | — | — | — | — |
| Total Distributions | (.488) | (.368) | (.313) | (.273) | (.292) |
| Net Asset Value, End of Period | $20.45 | $17.52 | $15.81 | $14.68 | $12.82 |
| |
| Total Return1 | 19.60% | 13.36% | 9.90% | 16.85% | 26.01% |
| |
| Ratios/Supplemental Data | | | | | |
| Net Assets, End of Period (Millions) | $19,137 | $12,704 | $8,829 | $4,995 | $2,814 |
| Ratio of Total Expenses to | | | | | |
| Average Net Assets2 | 0.31% | 0.29% | 0.31% | 0.34% | 0.38% |
| Ratio of Net Investment Income to | | | | | |
| Average Net Assets | 2.03% | 2.22% | 2.28% | 2.25% | 2.59% |
| Portfolio Turnover Rate | 18% | 11% | 13% | 17% | 24% |
1 Total returns do not include account service fees that may have applied in the periods shown. Fund prospectuses provide information about
any applicable account service fees.
2 Includes performance-based investment advisory fee increases (decreases) of 0.02%, 0.00%, 0.00%, 0.03%, and 0.03%.
See accompanying Notes, which are an integral part of the Financial Statements.
16
Dividend Growth Fund
Notes to Financial Statements
Vanguard Dividend Growth Fund is registered under the Investment Company Act of 1940 as an open-end investment company, or mutual fund.
A. The following significant accounting policies conform to generally accepted accounting principles for U.S. mutual funds. The fund consistently follows such policies in preparing its financial statements.
1. Security Valuation: Securities are valued as of the close of trading on the New York Stock Exchange (generally 4 p.m., Eastern time) on the valuation date. Equity securities are valued at the latest quoted sales prices or official closing prices taken from the primary market in which each security trades; such securities not traded on the valuation date are valued at the mean of the latest quoted bid and asked prices. Securities for which market quotations are not readily available, or whose values have been affected by events occurring before the fund’s pricing time but after the close of the securities’ primary markets, are valued at their fair values calculated according to procedures adopted by the board of trustees. These procedures include obtaining quotations from an independent pricing service, monitoring news to identify significant market- or security-specific events, and evaluating changes in the values of foreign market proxies (for example, ADRs, futures contracts, or exchange-traded funds), between the time the foreign markets close and the fund’s pricing time. When fair-value pricing is employed, the prices of securities used by a fund to calculate its net asset value may differ from quoted or published prices for the same securities. Temporary cash investments acquired over 60 days to maturity are valued using the latest bid prices or using valuations based on a matrix system (which considers such factors as security prices, yields, maturities, and ratings), both as furnished by independent pricing services. Other temporary cash investments are valued at amortized cost, which approximates market value.
2. Foreign Currency: Securities and other assets and liabilities denominated in foreign currencies are translated into U.S. dollars using exchange rates obtained from an independent third party as of the fund’s pricing time on the valuation date. Realized gains (losses) and unrealized appreciation (depreciation) on investment securities include the effects of changes in exchange rates since the securities were purchased, combined with the effects of changes in security prices. Fluctuations in the value of other assets and liabilities resulting from changes in exchange rates are recorded as unrealized foreign currency gains (losses) until the assets or liabilities are settled in cash, at which time they are recorded as realized foreign currency gains (losses).
3. Repurchase Agreements: The fund enters into repurchase agreements with institutional counterparties. Securities pledged as collateral to the fund under repurchase agreements are held by a custodian bank until the agreements mature. Each agreement requires that the market value of the collateral be sufficient to cover payments of interest and principal. The fund further mitigates its counterparty risk by entering into repurchase agreements only with a diverse group of prequalified counterparties, monitoring their financial strength, and entering into master repurchase agreements with its counterparties. The master repurchase agreements provide that, in the event of a counter-party’s default (including bankruptcy), the fund may terminate any repurchase agreements with that counterparty, determine the net amount owed, and sell or retain the collateral up to the net amount owed to the fund. Such action may be subject to legal proceedings, which may delay or limit the disposition of collateral.
17
Dividend Growth Fund
4. Federal Income Taxes: The fund intends to continue to qualify as a regulated investment company and distribute all of its taxable income. Management has analyzed the fund’s tax positions taken for all open federal income tax years (January 31, 2011–2014), and has concluded that no provision for federal income tax is required in the fund’s financial statements.
5. Distributions: Distributions to shareholders are recorded on the ex-dividend date.
6. Securities Lending: To earn additional income, the fund may lend its securities to qualified institutional borrowers. Security loans are required to be secured at all times by collateral in an amount at least equal to the market value of securities loaned. Daily market fluctuations could cause the value of loaned securities to be more or less than the value of the collateral received. When this occurs, the collateral is adjusted and settled on the next business day. The fund further mitigates its counterparty risk by entering into securities lending transactions only with a diverse group of prequalified counterparties, monitoring their financial strength, and entering into master securities lending agreements with its counterparties. The master securities lending agreements provide that, in the event of a counterparty’s default (including bankruptcy), the fund may terminate any loans with that borrower, determine the net amount owed, and sell or retain the collateral up to the net amount owed to the fund; however, such actions may be subject to legal proceedings. While collateral mitigates counterparty risk, in the absence of a default the fund may experience delays and costs in recovering the securities loaned. The fund invests cash collateral received in Vanguard Market Liquidity Fund, and records a liability for the return of the collateral, during the period the securities are on loan. Securities lending income represents fees charged to borrowers plus income earned on invested cash collateral, less expenses associated with the loan.
7. Other: Dividend income is recorded on the ex-dividend date. Interest income is accrued daily. Security transactions are accounted for on the date securities are bought or sold. Costs used to determine realized gains (losses) on the sale of investment securities are those of the specific securities sold.
B. Wellington Management Company, LLP, provides investment advisory services to the fund for a fee calculated at an annual percentage rate of average net assets. The basic fee is subject to quarterly adjustments based on the fund’s performance for the preceding three years relative to the NASDAQ US Dividend Achievers Select Index. For the year ended January 31, 2014, the investment advisory fee represented an effective annual basic rate of 0.10% of the fund’s average net assets before an increase of $3,239,000 (0.02%) based on performance.
C. The Vanguard Group furnishes at cost corporate management, administrative, marketing, and distribution services. The costs of such services are allocated to the fund under methods approved by the board of trustees. The fund has committed to provide up to 0.40% of its net assets in capital contributions to Vanguard. At January 31, 2014, the fund had contributed capital of $2,179,000 to Vanguard (included in Other Assets), representing 0.01% of the fund’s net assets and 0.87% of Vanguard’s capitalization. The fund’s trustees and officers are also directors and officers of Vanguard.
18
Dividend Growth Fund
D. Various inputs may be used to determine the value of the fund’s investments. These inputs are summarized in three broad levels for financial statement purposes. The inputs or methodologies used to value securities are not necessarily an indication of the risk associated with investing in those securities.
Level 1—Quoted prices in active markets for identical securities.
Level 2—Other significant observable inputs (including quoted prices for similar securities, interest rates, prepayment speeds, credit risk, etc.).
Level 3—Significant unobservable inputs (including the fund’s own assumptions used to determine the fair value of investments).
The following table summarizes the market value of the fund’s investments as of January 31, 2014, based on the inputs used to value them:
| | | |
| | Level 1 | Level 2 | Level 3 |
| Investments | ($000) | ($000) | ($000) |
| Common Stocks | 17,053,994 | 1,507,267 | — |
| Temporary Cash Investments | — | 571,000 | — |
| Total | 17,053,994 | 2,078,267 | — |
E. Distributions are determined on a tax basis and may differ from net investment income and realized capital gains for financial reporting purposes. Differences may be permanent or temporary. Permanent differences are reclassified among capital accounts in the financial statements to reflect their tax character. Temporary differences arise when certain items of income, expense, gain, or loss are recognized in different periods for financial statement and tax purposes. These differences will reverse at some time in the future. Differences in classification may also result from the treatment of short-term gains as ordinary income for tax purposes.
During the year ended January 31, 2014, the fund realized net foreign currency gains of $524,000, which increased distributable net income for tax purposes; accordingly, such gains have been reclassified from accumulated net realized gains to undistributed net investment income.
The fund used a tax accounting practice to treat a portion of the price of capital shares redeemed during the year as distributions from realized capital gains. Accordingly, the fund has reclassified $8,209,000 from accumulated net realized gains to paid-in capital.
The fund used capital loss carryforwards of $98,481,000 to offset taxable capital gains realized during the year ended January 31, 2014, reducing the amount of capital gains that would otherwise be available to distribute to shareholders. For tax purposes, at January 31, 2014, the fund had $30,697,000 of ordinary income and $13,768,000 of long-term capital gains available for distribution.
At January 31, 2014, the cost of investment securities for tax purposes was $14,595,130,000.
Net unrealized appreciation of investment securities for tax purposes was $4,537,131,000, consisting of unrealized gains of $4,636,115,000 on securities that had risen in value since their purchase and $98,984,000 in unrealized losses on securities that had fallen in value since their purchase.
19
Dividend Growth Fund
F. During the year ended January 31, 2014, the fund purchased $6,882,990,000 of investment securities and sold $2,853,799,000 of investment securities, other than temporary cash investments.
G. Capital shares issued and redeemed were:
| | |
| | Year Ended January 31, |
| | 2014 | 2013 |
| | Shares | Shares |
| | (000) | (000) |
| Issued | 311,805 | 278,157 |
| Issued in Lieu of Cash Distributions | 18,932 | 13,395 |
| Redeemed | (120,255) | (124,792) |
| Net Increase (Decrease) in Shares Outstanding | 210,482 | 166,760 |
H. Management has determined that no material events or transactions occurred subsequent to January 31, 2014, that would require recognition or disclosure in these financial statements.
20
Report of Independent Registered
Public Accounting Firm
To the Trustees of Vanguard Specialized Funds and the Shareholders of Vanguard Dividend Growth Fund:
In our opinion, the accompanying statement of net assets and the related statements of operations and of changes in net assets and the financial highlights present fairly, in all material respects, the financial position of Vanguard Dividend Growth Fund (constituting a separate portfolio of Vanguard Specialized Funds, hereafter referred to as the “Fund”) at January 31, 2014, the results of its operations for the year then ended, the changes in its net assets for each of the two years in the period then ended, and the financial highlights for each of the five years in the period then ended, in conformity with accounting principles generally accepted in the United States of America. These financial statements and financial highlights (hereafter referred to as “financial statements”) are the responsibility of the Fund’s management; our responsibility is to express an opinion on these financial statements based on our audits. We conducted our audits of these financial statements in accordance with the standards of the Public Company Accounting Oversight Board (United States). Those standards require that we plan and perform the audit to obtain reasonable assurance about whether the financial statements are free of material misstatement. An audit includes examining, on a test basis, evidence supporting the amounts and disclosures in the financial statements, assessing the accounting principles used and significant estimates made by management, and evaluating the overall financial statement presentation. We believe that our audits, which included confirmation of securities at January 31, 2014 by correspondence with the custodians and brokers, provide a reasonable basis for our opinion.
/s/PricewaterhouseCoopers LLP
Philadelphia, Pennsylvania
March 17, 2014
Special 2013 tax information (unaudited) for Vanguard Dividend Growth Fund
This information for the fiscal year ended January 31, 2014, is included pursuant to provisions of
the Internal Revenue Code.
The fund distributed $101,316,000 as capital gains dividends (from net long-term capital gains)
to shareholders during the fiscal year.
The fund distributed $329,157,000 of qualified dividend income to shareholders during the fiscal year.
For corporate shareholders, 92.9% of investment income (dividend income plus short-term gains,
if any) qualifies for the dividends-received deduction.
21
Your Fund’s After-Tax Returns
This table presents returns for your fund both before and after taxes. The after-tax returns are shown in two ways: (1) assuming that an investor owned the fund during the entire period and paid taxes on the fund’s distributions, and (2) assuming that an investor paid taxes on the fund’s distributions and sold all shares at the end of each period.
Calculations are based on the highest individual federal income tax and capital gains tax rates in effect at the times of the distributions and the hypothetical sales. State and local taxes were not considered. After-tax returns reflect any qualified dividend income, using actual prior-year figures and estimates for 2014. (In the example, returns after the sale of fund shares may be higher than those assuming no sale. This occurs when the sale would have produced a capital loss. The calculation assumes that the investor received a tax deduction for the loss.)
Please note that your actual after-tax returns will depend on your tax situation and may differ from those shown. Also note that if you own the fund in a tax-deferred account, such as an individual retirement account or a 401(k) plan, this information does not apply to you. Such accounts are not subject to current taxes.
Finally, keep in mind that a fund’s performance—whether before or after taxes—does not guarantee future results.
| | | |
| Average Annual Total Returns: Dividend Growth Fund | | | |
| Periods Ended January 31, 2014 | | | |
| | One | Five | Ten |
| | Year | Years | Years |
| Returns Before Taxes | 19.60% | 17.02% | 8.39% |
| Returns After Taxes on Distributions | 18.91 | 16.58 | 8.02 |
| Returns After Taxes on Distributions and Sale of Fund Shares | 11.63 | 13.85 | 6.88 |
22
About Your Fund’s Expenses
As a shareholder of the fund, you incur ongoing costs, which include costs for portfolio management, administrative services, and shareholder reports (like this one), among others. Operating expenses, which are deducted from a fund’s gross income, directly reduce the investment return of the fund.
A fund’s expenses are expressed as a percentage of its average net assets. This figure is known as the expense ratio. The following examples are intended to help you understand the ongoing costs (in dollars) of investing in your fund and to compare these costs with those of other mutual funds. The examples are based on an investment of $1,000 made at the beginning of the period shown and held for the entire period.
The accompanying table illustrates your fund’s costs in two ways:
• Based on actual fund return. This section helps you to estimate the actual expenses that you paid over the period. The ”Ending Account Value“ shown is derived from the fund‘s actual return, and the third column shows the dollar amount that would have been paid by an investor who started with $1,000 in the fund. You may use the information here, together with the amount you invested, to estimate the expenses that you paid over the period.
To do so, simply divide your account value by $1,000 (for example, an $8,600 account value divided by $1,000 = 8.6), then multiply the result by the number given for your fund under the heading ”Expenses Paid During Period.“
• Based on hypothetical 5% yearly return. This section is intended to help you compare your fund‘s costs with those of other mutual funds. It assumes that the fund had a yearly return of 5% before expenses, but that the expense ratio is unchanged. In this case—because the return used is not the fund’s actual return—the results do not apply to your investment. The example is useful in making comparisons because the Securities and Exchange Commission requires all mutual funds to calculate expenses based on a 5% return. You can assess your fund’s costs by comparing this hypothetical example with the hypothetical examples that appear in shareholder reports of other funds.
Note that the expenses shown in the table are meant to highlight and help you compare ongoing costs only and do not reflect transaction costs incurred by the fund for buying and selling securities. Further, the expenses do not include any purchase, redemption, or account service fees described in the fund prospectus. If such fees were applied to your account, your costs would be higher. Your fund does not carry a “sales load.”
The calculations assume no shares were bought or sold during the period. Your actual costs may have been higher or lower, depending on the amount of your investment and the timing of any purchases or redemptions.
You can find more information about the fund’s expenses, including annual expense ratios, in the Financial Statements section of this report. For additional information on operating expenses and other shareholder costs, please refer to your fund’s current prospectus.
23
| | | |
| Six Months Ended January 31, 2014 | | | |
| | Beginning | Ending | Expenses |
| | Account Value | Account Value | Paid During |
| Dividend Growth Fund | 7/31/2013 | 1/31/2014 | Period |
| Based on Actual Fund Return | $1,000.00 | $1,049.22 | $1.60 |
| Based on Hypothetical 5% Yearly Return | 1,000.00 | 1,023.64 | 1.58 |
The calculations are based on expenses incurred in the most recent six-month period. The fund’s annualized six-month expense ratio for that
period is 0.31%. The dollar amounts shown as “Expenses Paid” are equal to the annualized expense ratio multiplied by the average account
value over the period, multiplied by the number of days in the most recent six-month period, then divided by the number of days in the most
recent 12-month period.
24
Trustees Approve Advisory Arrangement
The board of trustees of Vanguard Dividend Growth Fund has renewed the fund’s investment advisory arrangement and approved an amended investment advisory agreement with Wellington Management Company, LLP (Wellington Management), effective February 1, 2014. The amended agreement contains a new base fee schedule; however, other terms of the existing agreement have not changed. The board determined that renewing the fund’s advisory arrangement and amending the fee schedule was in the best interests of the fund and its shareholders.
The board based its decision upon an evaluation of the advisor’s investment staff, portfolio management process, and performance. The trustees considered the factors discussed below, among others. However, no single factor determined whether the board approved the arrangement. Rather, it was the totality of the circumstances that drove the board’s decision.
Nature, extent, and quality of services
The board considered the quality of the fund’s investment management services over both the short and long term, and took into account the organizational depth and stability of the advisor. The board noted that Wellington Management, founded in 1928, is among the nation’s oldest and most respected institutional managers. The firm has advised the fund since its inception in 1992. The portfolio manager is backed by a well-tenured team of research analysts who conduct detailed fundamental analysis of their respective industries and companies. Wellington Management has provided high-quality advisory services to the fund and has demonstrated strong organizational depth and stability over both the short and long term. The board noted that the new fee arrangement would help Wellington Management to continue to attract and retain top investment talent, and thereby support enhanced organizational depth and stability, which would benefit the fund and its shareholders.
The board concluded that Wellington Management’s experience, stability, depth, and performance, among other factors, warranted approval of the advisory arrangement.
Investment performance
The board considered the short- and long-term performance of the fund, including any periods of outperformance or underperformance relative to a benchmark index and peer group. The board concluded that the performance was such that the advisory arrangement should continue. Information about the fund’s most recent performance can be found in the Performance Summary section of this report.
Cost
The board concluded that the fund’s expense ratio was well below the average expense ratio charged by funds in its peer group and that the fund’s advisory fee rate was also well below its peer-group average. Information about the fund’s expenses appears in the About Your Fund’s Expenses section of this report as well as in the Financial Statements section, which also includes information about the advisory fee rate.
The board did not consider profitability of Wellington Management in determining whether to approve the advisory fee, because Wellington Management is independent of Vanguard and the advisory fee is the result of arm’s-length negotiations.
The benefit of economies of scale
The board concluded that the fund’s shareholders benefit from economies of scale because of breakpoints in the fund’s advisory fee schedule. The breakpoints reduce the effective rate of the fee as the fund’s assets increase.
The board will consider whether to renew the advisory arrangement again after a one-year period.
25
Glossary
30-Day SEC Yield. A fund’s 30-day SEC yield is derived using a formula specified by the U.S. Securities and Exchange Commission. Under the formula, data related to the fund’s security holdings in the previous 30 days are used to calculate the fund’s hypothetical net income for that period, which is then annualized and divided by the fund’s estimated average net assets over the calculation period. For the purposes of this calculation, a security’s income is based on its current market yield to maturity (for bonds), its actual income (for asset-backed securities), or its projected dividend yield (for stocks). Because the SEC yield represents hypothetical annualized income, it will differ—at times significantly—from the fund’s actual experience. As a result, the fund’s income distributions may be higher or lower than implied by the SEC yield.
Beta. A measure of the magnitude of a fund’s past share-price fluctuations in relation to the ups and downs of a given market index. The index is assigned a beta of 1.00. Compared with a given index, a fund with a beta of 1.20 typically would have seen its share price rise or fall by 12% when the index rose or fell by 10%. For this report, beta is based on returns over the past 36 months for both the fund and the index. Note that a fund’s beta should be reviewed in conjunction with its R-squared (see definition). The lower the R-squared, the less correlation there is between the fund and the index, and the less reliable beta is as an indicator of volatility.
Dividend Yield. Dividend income earned by stocks, expressed as a percentage of the aggregate market value (or of net asset value, for a fund). The yield is determined by dividing the amount of the annual dividends by the aggregate value (or net asset value) at the end of the period. For a fund, the dividend yield is based solely on stock holdings and does not include any income produced by other investments.
Earnings Growth Rate. The average annual rate of growth in earnings over the past five years for the stocks now in a fund.
Equity Exposure. A measure that reflects a fund’s investments in stocks and stock futures. Any holdings in short-term reserves are excluded.
Expense Ratio. A fund’s total annual operating expenses expressed as a percentage of the fund’s average net assets. The expense ratio includes management and administrative expenses, but does not include the transaction costs of buying and selling portfolio securities.
Foreign Holdings. The percentage of a fund represented by securities or depositary receipts of companies based outside the United States.
Inception Date. The date on which the assets of a fund (or one of its share classes) are first invested in accordance with the fund’s investment objective. For funds with a subscription period, the inception date is the day after that period ends. Investment performance is measured from the inception date.
Median Market Cap. An indicator of the size of companies in which a fund invests; the midpoint of market capitalization (market price x shares outstanding) of a fund’s stocks, weighted by the proportion of the fund’s assets invested in each stock. Stocks representing half of the fund’s assets have market capitalizations above the median, and the rest are below it.
Price/Book Ratio. The share price of a stock divided by its net worth, or book value, per share. For a fund, the weighted average price/book ratio of the stocks it holds.
26
Price/Earnings Ratio. The ratio of a stock’s current price to its per-share earnings over the past year. For a fund, the weighted average P/E of the stocks it holds. P/E is an indicator of market expectations about corporate prospects; the higher the P/E, the greater the expectations for a company’s future growth.
R-Squared. A measure of how much of a fund’s past returns can be explained by the returns from the market in general, as measured by a given index. If a fund’s total returns were precisely synchronized with an index’s returns, its R-squared would be 1.00. If the fund’s returns bore no relationship to the index’s returns, its R-squared would be 0. For this report, R-squared is based on returns over the past 36 months for both the fund and the index.
Return on Equity. The annual average rate of return generated by a company during the past five years for each dollar of shareholder’s equity (net income divided by shareholder’s equity). For a fund, the weighted average return on equity for the companies whose stocks it holds.
Short-Term Reserves. The percentage of a fund invested in highly liquid, short-term securities that can be readily converted to cash.
Turnover Rate. An indication of the fund’s trading activity. Funds with high turnover rates incur higher transaction costs and may be more likely to distribute capital gains (which may be taxable to investors). The turnover rate excludes in-kind transactions, which have minimal impact on costs.
Benchmark Information
Dividend Growth Spliced Average: Based on the Utility Funds Average through December 6, 2002, and the Large-Cap Core Funds Average thereafter. Derived from data provided by Lipper, a Thomson Reuters Company.
Dividend Growth Spliced Index: Russell 1000 Index through January 31, 2010; NASDAQ US Dividend Achievers Select Index (formerly known as the Dividend Achievers Select Index) thereafter. Prior to December 6, 2002, the comparative benchmark was known as the Utilities Composite Index. The index weightings were: 40% S&P Utilities Index, 40% S&P Telephone Index, and 20% Lehman Brothers Utility Bond Index through April 30, 1999; 63.75% S&P Utilities Index, 21.25% S&P Telephone Index, and 15% Lehman Brothers Utility Bond Index through March 31, 2000; 75% S&P Utilities Index and 25% S&P Telephone Index through December 31, 2001; and 75% S&P Utilities Index and 25% S&P Integrated Telecommunication Services Index through December 6, 2002.
27
The People Who Govern Your Fund
The trustees of your mutual fund are there to see that the fund is operated and managed in your best interests since, as a shareholder, you are a part owner of the fund. Your fund’s trustees also serve on the board of directors of The Vanguard Group, Inc., which is owned by the Vanguard funds and provides services to them on an at-cost basis.
A majority of Vanguard’s board members are independent, meaning that they have no affiliation with Vanguard or the funds they oversee, apart from the sizable personal investments they have made as private individuals. The independent board members have distinguished backgrounds in business, academia, and public service. Each of the trustees and executive officers oversees 180 Vanguard funds.
The following table provides information for each trustee and executive officer of the fund. More information about the trustees is in the Statement of Additional Information, which can be obtained, without charge, by contacting Vanguard at 800-662-7447, or online at vanguard.com.
| |
| InterestedTrustee1 | and Delphi Automotive LLP (automotive components); |
| | Senior Advisor at New Mountain Capital. |
| F. William McNabb III | |
| Born 1957. Trustee Since July 2009. Chairman of the | Amy Gutmann |
| Board. Principal Occupation(s) During the Past Five | Born 1949. Trustee Since June 2006. Principal |
| Years: Chairman of the Board of The Vanguard Group, | Occupation(s) During the Past Five Years: President of |
| Inc., and of each of the investment companies served | the University of Pennsylvania; Christopher H. Browne |
| by The Vanguard Group, since January 2010; Director | Distinguished Professor of Political Science, School of |
| of The Vanguard Group since 2008; Chief Executive | Arts and Sciences, and Professor of Communication, |
| Officer and President of The Vanguard Group, and of | Annenberg School for Communication, with secondary |
| each of the investment companies served by The | faculty appointments in the Department of Philosophy, |
| Vanguard Group, since 2008; Director of Vanguard | School of Arts and Sciences, and at the Graduate |
| Marketing Corporation; Managing Director of The | School of Education, University of Pennsylvania; |
| Vanguard Group (1995–2008). | Trustee of the National Constitution Center; Chair |
| | of the Presidential Commission for the Study of |
| | Bioethical Issues. |
| IndependentTrustees |
| | JoAnn Heffernan Heisen |
| Emerson U. Fullwood | Born 1950. Trustee Since July 1998. Principal |
| Born 1948. Trustee Since January 2008. Principal | Occupation(s) During the Past Five Years: Corporate |
| Occupation(s) During the Past Five Years: Executive | Vice President and Chief Global Diversity Officer |
| Chief Staff and Marketing Officer for North America | (retired 2008) and Member of the Executive |
| and Corporate Vice President (retired 2008) of Xerox | Committee (1997–2008) of Johnson & Johnson |
| Corporation (document management products and | (pharmaceuticals/medical devices/consumer |
| services); Executive in Residence and 2010 | products); Director of Skytop Lodge Corporation |
| Distinguished Minett Professor at the Rochester | (hotels), the University Medical Center at Princeton, |
| Institute of Technology; Director of SPX Corporation | the Robert Wood Johnson Foundation, and the Center |
| (multi-industry manufacturing), the United Way of | for Talent Innovation; Member of the Advisory Board |
| Rochester, Amerigroup Corporation (managed health | of the Maxwell School of Citizenship and Public Affairs |
| care), the University of Rochester Medical Center, | at Syracuse University. |
| Monroe Community College Foundation, and North | |
| Carolina A&T University. |
| F. Joseph Loughrey |
| Rajiv L. Gupta | Born 1949. Trustee Since October 2009. Principal |
| Born 1945. Trustee Since December 2001.2 | Occupation(s) During the Past Five Years: President |
| Principal Occupation(s) During the Past Five Years: | and Chief Operating Officer (retired 2009) of Cummins |
| Chairman and Chief Executive Officer (retired 2009) | Inc. (industrial machinery); Chairman of the Board |
| and President (2006–2008) of Rohm and Haas Co. | of Hillenbrand, Inc. (specialized consumer services), |
| (chemicals); Director of Tyco International, Ltd. | and of Oxfam America; Director of SKF AB (industrial |
| (diversified manufacturing and services), Hewlett- | machinery), Hyster-Yale Materials Handling, Inc. |
| Packard Co. (electronic computer manufacturing), | (forklift trucks), the Lumina Foundation for Education, |
| | |
| and the V Foundation for Cancer Research; Member | Executive Officers | |
| of the Advisory Council for the College of Arts and | | |
| Letters and of the Advisory Board to the Kellogg | Glenn Booraem | |
| Institute for International Studies, both at the | Born 1967. Controller Since July 2010. Principal |
| University of Notre Dame. | Occupation(s) During the Past Five Years: Principal |
| | of The Vanguard Group, Inc.; Controller of each of |
| Mark Loughridge | the investment companies served by The Vanguard |
| Born 1953. Trustee Since March 2012. Principal | Group; Assistant Controller of each of the investment |
| Occupation(s) During the Past Five Years: Senior Vice | companies served by The Vanguard Group (2001–2010). |
| President and Chief Financial Officer (retired 2013) | | |
| at IBM (information technology services); Fiduciary | Thomas J. Higgins | |
| Member of IBM’s Retirement Plan Committee (2004– | Born 1957. Chief Financial Officer Since September |
| 2013); Member of the Council on Chicago Booth. | 2008. Principal Occupation(s) During the Past Five |
| | Years: Principal of The Vanguard Group, Inc.; Chief |
| Scott C. Malpass | Financial Officer of each of the investment companies |
| Born 1962. Trustee Since March 2012. Principal | served by The Vanguard Group; Treasurer of each of |
| Occupation(s) During the Past Five Years: Chief | the investment companies served by The Vanguard |
| Investment Officer and Vice President at the University | Group (1998–2008). | |
| of Notre Dame; Assistant Professor of Finance at the | | |
| Mendoza College of Business at Notre Dame; Member | Kathryn J. Hyatt | |
| of the Notre Dame 403(b) Investment Committee; | Born 1955. Treasurer Since November 2008. Principal |
| Board Member of TIFF Advisory Services, Inc. | Occupation(s) During the Past Five Years: Principal of |
| (investment advisor); Member of the Investment | The Vanguard Group, Inc.; Treasurer of each of the |
| Advisory Committees of the Financial Industry | investment companies served by The Vanguard |
| Regulatory Authority (FINRA) and of Major League | Group; Assistant Treasurer of each of the investment |
| Baseball. | companies served by The Vanguard Group (1988–2008). |
| |
| André F. Perold | Heidi Stam | |
| Born 1952. Trustee Since December 2004. Principal | Born 1956. Secretary Since July 2005. Principal |
| Occupation(s) During the Past Five Years: George | Occupation(s) During the Past Five Years: Managing |
| Gund Professor of Finance and Banking, Emeritus | Director of The Vanguard Group, Inc.; General Counsel |
| at the Harvard Business School (retired 2011); | of The Vanguard Group; Secretary of The Vanguard |
| Chief Investment Officer and Managing Partner of | Group and of each of the investment companies |
| HighVista Strategies LLC (private investment firm); | served by The Vanguard Group; Director and Senior |
| Director of Rand Merchant Bank; Overseer of the | Vice President of Vanguard Marketing Corporation. |
| Museum of Fine Arts Boston. | | |
| | Vanguard Senior ManagementTeam |
| Alfred M. Rankin, Jr. | | |
| Born 1941. Trustee Since January 1993. Principal | Mortimer J. Buckley | Chris D. McIsaac |
| Occupation(s) During the Past Five Years: Chairman, | Kathleen C. Gubanich | Michael S. Miller |
| President, and Chief Executive Officer of NACCO | Paul A. Heller | James M. Norris |
| Industries, Inc. (housewares/lignite), and of Hyster- | Martha G. King | Glenn W. Reed |
| Yale Materials Handling, Inc. (forklift trucks); Chairman | John T. Marcante | |
| of the Board of University Hospitals of Cleveland. | | |
| |
| Peter F. Volanakis | Chairman Emeritus and Senior Advisor |
| Born 1955. Trustee Since July 2009. Principal | | |
| Occupation(s) During the Past Five Years: President | John J. Brennan | |
| and Chief Operating Officer (retired 2010) of Corning | Chairman, 1996–2009 | |
| Incorporated (communications equipment); Trustee of | Chief Executive Officer and President, 1996–2008 |
| Colby-Sawyer College; Member of the Advisory Board | | |
| of the Norris Cotton Cancer Center and of the Advisory | | |
| Board of the Parthenon Group (strategy consulting). | Founder | |
| | John C. Bogle | |
| | Chairman and Chief Executive Officer, 1974–1996 |
1 Mr. McNabb is considered an “interested person,” as defined in the Investment Company Act of 1940, because he is an officer of the
Vanguard funds.
2 December 2002 for Vanguard Equity Income Fund, Vanguard Growth Equity Fund, the Vanguard Municipal Bond Funds, and the Vanguard
State Tax-Exempt Funds.
|  |
| | P.O. Box 2600 |
| | Valley Forge, PA 19482-2600 |
| |
| |
| |
| Connect with Vanguard® > vanguard.com | |
| |
| |
| |
| Fund Information > 800-662-7447 | |
| Direct Investor Account Services > 800-662-2739 | |
| Institutional Investor Services > 800-523-1036 | |
| Text Telephone for People | |
| With Hearing Impairment > 800-749-7273 | |
| |
| This material may be used in conjunction | |
| with the offering of shares of any Vanguard | |
| fund only if preceded or accompanied by | |
| the fund’s current prospectus. | |
| |
| All comparative mutual fund data are from Lipper, a | |
| Thomson Reuters Company, or Morningstar, Inc., unless | |
| otherwise noted. | |
| |
| You can obtain a free copy of Vanguard’s proxy voting | |
| guidelines by visiting vanguard.com/proxyreporting or by | |
| calling Vanguard at 800-662-2739. The guidelines are | |
| also available from the SEC’s website, sec.gov. In | |
| addition, you may obtain a free report on how your fund | |
| voted the proxies for securities it owned during the 12 | |
| months ended June 30. To get the report, visit either | |
| vanguard.com/proxyreporting or sec.gov. | |
| |
| You can review and copy information about your fund at | |
| the SEC’s Public Reference Room in Washington, D.C. To | |
| find out more about this public service, call the SEC at | |
| 202-551-8090. Information about your fund is also | |
| available on the SEC’s website, and you can receive | |
| copies of this information, for a fee, by sending a | |
| request in either of two ways: via e-mail addressed to | |
| publicinfo@sec.gov or via regular mail addressed to the | |
| Public Reference Section, Securities and Exchange | |
| Commission, Washington, DC 20549-1520. | |
| |
| | © 2014 The Vanguard Group, Inc. |
| | All rights reserved. |
| | Vanguard Marketing Corporation, Distributor. |
| |
| | Q570 032014 |

Annual Report | January 31, 2014
Vanguard Dividend Appreciation Index Fund

Vanguard’s Principles for Investing Success
We want to give you the best chance of investment success. These principles, grounded in Vanguard’s research and experience, can put you on the right path.
Goals. Create clear, appropriate investment goals.
Balance. Develop a suitable asset allocation using broadly diversified funds. Cost. Minimize cost.
Discipline. Maintain perspective and long-term discipline.
A single theme unites these principles: Focus on the things you can control.
We believe there is no wiser course for any investor.
| |
| Contents | |
| Your Fund’s Total Returns. | 1 |
| Chairman’s Letter. | 2 |
| Fund Profile. | 8 |
| Performance Summary. | 9 |
| Financial Statements. | 12 |
| Your Fund’s After-Tax Returns. | 25 |
| About Your Fund’s Expenses. | 26 |
| Glossary. | 28 |
Please note: The opinions expressed in this report are just that—informed opinions. They should not be considered promises or advice.
Also, please keep in mind that the information and opinions cover the period through the date on the front of this report. Of course, the
risks of investing in your fund are spelled out in the prospectus.
See the Glossary for definitions of investment terms used in this report.
About the cover: The ship’s wheel represents leadership and guidance, essential qualities in navigating difficult seas.
This one is a replica based on an 18th-century British vessel. The HMSVanguard, another ship of that era, served as the
flagship for British Admiral Horatio Nelson when he defeated a French fleet at the Battle of the Nile.
Your Fund’s Total Returns
| |
| Fiscal Year Ended January 31, 2014 | |
| |
| | Total |
| | Returns |
| Vanguard Dividend Appreciation Index Fund | |
| Investor Shares | 15.51% |
| Admiral™ Shares (Inception: 12/19/2013) | -3.00 |
| ETF Shares | |
| Market Price | 15.58 |
| Net Asset Value | 15.60 |
| NASDAQ US Dividend Achievers Select Index | 15.70 |
| Large-Cap Core Funds Average | 20.41 |
| Large-Cap Core Funds Average: Derived from data provided by Lipper, a Thomson Reuters Company. |
The Vanguard ETF® Shares shown are traded on the NYSE Arca exchange and are available only through brokers. The table provides ETF returns based on both the NYSE Arca market price and the net asset value for a share. U.S. Pat. Nos. 6,879,964; 7,337,138; 7,720,749; 7,925,573; 8,090,646; and 8,417,623.
For the ETF Shares, the market price is determined by the midpoint of the bid-offer spread as of the closing time of the New York Stock Exchange (generally 4 p.m., Eastern time). The net asset value is also determined as of the NYSE closing time. For more information about how the ETF Shares' market prices have compared with their net asset value, visit vanguard.com, select your ETF, and then select the Price and Performance tab. The ETF premium/discount analysis there shows the percentages of days on which the ETF Shares' market price was above or below the NAV.
Your Fund’s Performance at a Glance
January 31, 2013, Through January 31, 2014
| | | | |
| | | | Distributions Per Share |
| | Starting | Ending | | |
| | Share | Share | Income | Capital |
| | Price | Price | Dividends | Gains |
| Vanguard Dividend Appreciation Index Fund | | | | |
| Investor Shares | $25.23 | $28.59 | $0.530 | $0.000 |
| Admiral Shares (Inception: 12/19/2013) | 20.00 | 19.40 | 0.000 | 0.000 |
| ETF Shares | 63.08 | 71.47 | 1.388 | 0.000 |
1

Chairman’s Letter
Dear Shareholder,
Vanguard Dividend Appreciation Index Fund returned more than 15% for the fiscal year ended January 31, 2014. The fund achieved its goal of closely tracking its benchmark, the NASDAQ US Dividend Achievers Select Index.
The fund’s return was less than the average return for large-capitalization core funds, its designated peer group. These funds, on the whole, differ from your fund, though, in that they don’t focus on stocks with consistent growth in dividends.
The Dividend Appreciation Index Fund’s 30-day SEC yield for Investor Shares declined just slightly, from 2.06% at the start of the period to 2.05% at the end.
Please note that on December 19, 2013, we added Admiral Shares to your fund’s share-class offerings as part of our ongoing efforts to lower the cost of investing. The return shown for Admiral Shares in this report reflects the period from December 19 through January 31, 2014.
U.S. stocks found a groove before January’s volatility set in U.S. stocks delivered generous returns in 2013, then slid over the first month of the new year. For the 12 months ended January 31, U.S. stocks produced an impressive gain of nearly 23% despite the late reversal.
Strong corporate earnings growth and investors’ willingness to pay for those earnings drove stock markets, which
2
were also buoyed by the Federal Reserve’s stimulative bond-buying program. The Fed, noting the economy’s improvement, began paring back its bond purchases in January. Nevertheless, stocks declined over the period’s final month as investors worried about recent economic concerns at home and abroad.
Overall, international stocks advanced about 6% for the 12 months, with the developed markets of Europe and the Pacific region posting positive returns. Concerns about China’s weaker economy hurt stocks and currencies in various emerging-market countries.
For 2014, Vanguard Chief Economist Joe Davis and his team are guarded in their outlook for global stock returns, and their forecast for the bond market remains muted. Although Joe readily acknowledges that such forecasts are accompanied by uncertainty, he writes, “We believe that a long-term, strategic approach with a balanced, diversified, low-cost portfolio can remain a high-value proposition in the decade ahead.” (You can read more about our expectations for bond and stock returns in Vanguard’s Economic and Investment Outlook, available at vanguard.com/research.)
Bond returns were flat as the Fed firmed its strategy
Investors spurned bonds for most of the 12-month period, wary of the Fed’s expected curtailment of its bond-buying program. In January, however, despite
| | | |
| Market Barometer | | | |
| |
| | Average Annual Total Returns |
| | Periods Ended January 31, 2014 |
| | One | Three | Five |
| | Year | Years | Years |
| Stocks | | | |
| Russell 1000 Index (Large-caps) | 22.23% | 14.14% | 19.84% |
| Russell 2000 Index (Small-caps) | 27.03 | 14.69 | 22.26 |
| Russell 3000 Index (Broad U.S. market) | 22.60 | 14.18 | 20.03 |
| FTSE All-World ex US Index (International) | 5.78 | 3.37 | 14.38 |
| |
| Bonds | | | |
| Barclays U.S. Aggregate Bond Index (Broad taxable market) | 0.12% | 3.73% | 4.93% |
| Barclays Municipal Bond Index (Broad tax-exempt market) | -1.07 | 5.76 | 5.54 |
| Citigroup Three-Month U.S. Treasury Bill Index | 0.05 | 0.06 | 0.09 |
| |
| CPI | | | |
| Consumer Price Index | 1.58% | 2.03% | 2.07% |
3
the start of that tapering, fixed income investments regained appeal as stocks slumped.
The broad U.S. taxable bond market returned 0.12% for the 12 months, while municipal bonds posted returns of –1.07%. The yield of the benchmark 10-year Treasury note generally increased during the fiscal year, eclipsing 3.00% at times, and finished at about 2.70%. (Bond prices and yields move in opposite directions.) International bond markets (as measured by the Barclays Global Aggregate Index ex USD) returned –1.24%.
The Fed’s continued target of 0%–0.25% for short-term interest rates tightly restricted returns of money market funds and savings accounts.
The strengthening economy lifted many of the fund’s key sector stocks
The Dividend Appreciation Index Fund focuses on blue-chip U.S. companies that are able to increase their dividends and are committed to doing so. Its target index’s concentration on both a stock’s long-term track record and its potential for dividend growth distinguishes this fund from other dividend-oriented ones that solely aim to invest in the highest-yielding stocks. The fund’s mandate also sets it apart from index funds that track the broad stock market. (See the box on page 6 for more about your fund’s benchmark.)
Your fund produced solid returns for the fiscal year as many of its key sector holdings benefited from the strengthening U.S. and global economy. Eight of the ten
| | | | |
| Expense Ratios | | | | |
| Your Fund Compared With Its Peer Group | | | | |
| |
| | Investor | Admiral | ETF | Peer Group |
| | Shares | Shares | Shares | Average |
| Dividend Appreciation Index Fund | 0.20% | 0.10% | 0.10% | 1.15% |
The fund expense ratios shown are from the prospectus dated December 19, 2013 (May 28, 2013, for ETF Shares), and represent estimated
costs for the current fiscal year. For the fiscal year ended January 31, 2014, the fund’s expense ratios were 0.20% for Investor Shares, 0.10%
(annualized) for Admiral Shares, and 0.10% for ETF Shares. The peer-group expense ratio is derived from data provided by Lipper, a Thomson
Reuters Company, and captures information through year-end 2013.
Peer group: Large-Cap Core Funds.
4
industry sectors represented in its index reported double-digit returns, and only one sector declined.
The industrial and consumer-related sectors performed best. Industrials, which constituted about a fifth of the index’s holdings on average, contributed most to the fund’s return. Manufacturers of aerospace, defense, and diversified industrial products profited from a rise in corporate spending and factory orders during much of 2013. Although some of that activity cooled by the end of the fiscal year, many of these companies still gained from cost-cutting and from technological improvements made to offset cutbacks in government spending.
Together, the consumer goods and consumer services sectors produced about 42% of the fund’s return. A boost in consumer confidence and gradual improvements in the labor and housing markets helped personal-goods retailers, soft-drink companies, and household-product corporations. Consumers also were willing to open their wallets and spend more not only on shopping but also on dining out and entertainment.
Because its index filters out companies that don’t regularly increase their dividends, the fund had smaller allocations to some top-performing and high-yielding market sectors, including health care and financials, than would be seen in a fund that tracks a broad stock market index.
| |
| Total Returns | |
| Inception Through January 31, 2014 | |
| | Average |
| | Annual Return |
| Dividend Appreciation Index Fund Investor Shares (Returns since inception: 4/27/2006) | 6.73% |
| NASDAQ US Dividend Achievers Select Index | 7.00 |
| Large-Cap Core Funds Average | 5.11 |
| Large-Cap Core Funds Average: Derived from data provided by Lipper, a Thomson Reuters Company. |
The figures shown represent past performance, which is not a guarantee of future results. (Current performance may be
lower or higher than the performance data cited. For performance data current to the most recent month-end, visit our
website at vanguard.com/performance.) Note, too, that both investment returns and principal value can fluctuate widely, so
an investor’s shares, when sold, could be worth more or less than their original cost.
5
| | |
| What’s inside your fund’s benchmark index? | |
| |
| As an investor in an index fund, you can better understand your investment by knowing how |
| the benchmark index is put together. Your fund’s benchmark, the NASDAQ US Dividend |
| Achievers Select Index, included more than 140 stocks as of January 31, 2014. But how were |
| those stocks selected? | | |
| |
| In this case, the index provider includes only the stocks of U.S. companies traded on the |
| New York Stock Exchange or Nasdaq that have consecutively increased their regular annual |
| dividend payments for the last ten or more years. Real estate investment trusts (REITs) and |
| limited partnerships are excluded because of potentially unfavorable tax treatment of the |
| dividends they pay. Additional filters screen for minimum trading volume and dividend quality. |
| |
| The index is designed to weight stocks by market capitalization, with no stock constituting |
| more than 4% when the index is rebalanced every March. | |
| |
| The focus on dividend appreciation means that the composition of the index—and hence |
| of your fund—differs significantly from that of the broad U.S. stock market. For example, as |
| you can see from the table below, the index is tilted more toward consumer sectors and less |
| toward financials than the overall stock market, as measured by the CRSP US Total Market |
| Index. Your benchmark index’s smaller exposure to financials, which are traditionally a large |
| source of dividends, reflects the decision made by many financial companies not to increase |
| their dividends during and after the 2008–2009 financial crisis. | |
| |
| How your fund’s index compares with a broad U.S. stock index | |
| |
| | NASDAQ US Dividend | |
| Equity sector diversification | Achievers Select Index | CRSP US Total Market Index |
| Basic materials | 5.5% | 3.0% |
| Consumer goods | 22.8 | 9.9 |
| Consumer services | 16.1 | 13.3 |
| Financials | 7.6 | 18.6 |
| Health care | 8.1 | 12.4 |
| Industrials | 22.6 | 13.5 |
| Oil & gas | 12.0 | 8.9 |
| Technology | 4.0 | 15.3 |
| Telecommunications | 0.1 | 1.9 |
| Utilities | 1.2 | 3.2 |
| Notes: Sector categories are based on the Industry Classification Benchmark system. Index weighting percentages are as of January 31, 2014. |
| Source: Vanguard. |
6
The technology sector, which constituted a tiny portion of its benchmark, posted a negative return for the fund as demand for software and computer services sagged.
The fund has a solid record of tracking its benchmark index
From your fund’s inception on April 27, 2006, through January 31, 2014, its Investor Shares posted an annual average return of 6.73%. The return was in line with that of the fund’s index and ahead of the average return of its designated peer group.
The fund successfully tracked its benchmark for the nearly seven years of its existence, a period that includes the 2008–2009 financial crisis. Credit goes to the fund’s advisor, Vanguard Equity Investment Group, whose experience and sophisticated portfolio-tracking techniques allowed the fund to capture the returns of its benchmark while keeping costs low.
The power of compounding can put time on your side
The purpose of my annual letter to you is, of course, to report on how your fund fared over the past year. But although it’s important to be aware of how your fund is doing in the latest market environment, short-term performance isn’t what matters most. The focus on the preceding 12 months shouldn’t distract investors from the long-term commitment they need to help achieve their goals.
To be sure, there are many aspects of investing success that you can’t control, overall market performance being the obvious example. But you can control how long you invest, and that’s important because it allows you to harness the power of compounding—the snowball effect that occurs when your earnings generate even more earnings. As Benjamin Franklin put it, “Money makes money.”
A simple example illustrates the benefits of compounding that can potentially result from investing and then reinvesting your money over the long haul. Suppose you were able to put away $10,000 and earn 6% a year (keep in mind this is hypothetical; actual returns would probably be different, and certainly a lot less predictable).
If you kept reinvesting the earnings (again, assuming a hypothetical 6% yearly return), after ten years you would have almost $18,000. After 30 years, you would have more than $57,000.
Compounding can make a real difference in your account balance over time—particularly when combined with Vanguard’s low expense ratios, which allow you to keep more of the return on your investment.
As always, thank you for entrusting your assets to Vanguard.
Sincerely,

F. William McNabb III
Chairman and Chief Executive Officer
February 13, 2014
7
Dividend Appreciation Index Fund
Fund Profile
As of January 31, 2014
| | | |
| Share-Class Characteristics | | |
| |
| | Investor | Admiral | ETF |
| | Shares | Shares | Shares |
| Ticker Symbol | VDAIX | VDADX | VIG |
| Expense Ratio1 | 0.20% | 0.10% | 0.10% |
| 30-Day SEC Yield | 2.05% | 2.15% | 2.15% |
| | | |
| Portfolio Characteristics | | |
| | | NASDAQ | DJ |
| | | US | U.S. |
| | | Dividend | Total |
| | | Achievers | Market |
| | | Select | FA |
| | Fund | Index | Index |
| Number of Stocks | 146 | 146 | 3,635 |
| Median Market Cap | $56.9B | $56.9B | $41.3B |
| Price/Earnings Ratio | 17.5x | 17.5x | 19.1x |
| Price/Book Ratio | 3.2x | 3.2x | 2.6x |
| Return on Equity | 21.7% | 21.7% | 16.5% |
| Earnings Growth | | | |
| Rate | 6.7% | 6.7% | 11.4% |
| Dividend Yield | 2.2% | 2.2% | 1.9% |
| Foreign Holdings | 0.0% | 0.0% | 0.0% |
| Turnover Rate | 3% | — | — |
| Short-Term Reserves | 0.0% | — | — |
| | | |
| Sector Diversification (% of equity exposure) |
| | | NASDAQ | |
| | | US | |
| | | Dividend | DJ |
| | | Achievers | U.S. Total |
| | | Select | Market |
| | Fund | Index | FA Index |
| Basic Materials | 5.5% | 5.5% | 3.0% |
| Consumer Goods | 22.8 | 22.8 | 10.0 |
| Consumer Services | 16.1 | 16.1 | 13.5 |
| Financials | 7.6 | 7.6 | 18.5 |
| Health Care | 8.1 | 8.1 | 12.3 |
| Industrials | 22.6 | 22.6 | 13.4 |
| Oil & Gas | 12.0 | 12.0 | 9.0 |
| Technology | 4.0 | 4.0 | 15.1 |
| Telecommunications | 0.1 | 0.1 | 2.0 |
| Utilities | 1.2 | 1.2 | 3.2 |
| | |
| Volatility Measures | | |
| | NASDAQ | |
| | US Dividend | DJ |
| | Achievers | U.S. Total |
| | Select | Market |
| | Index | FA Index |
| R-Squared | 1.00 | 0.91 |
| Beta | 1.00 | 0.83 |
| These measures show the degree and timing of the fund’s fluctuations compared with the indexes over 36 months. |
| | |
| Ten Largest Holdings (% of total net assets) |
| Abbott Laboratories | Pharmaceuticals | 3.9% |
| PepsiCo Inc. | Soft Drinks | 3.9 |
| Procter & Gamble Co. | Nondurable | |
| | Household Products | 3.8 |
| Wal-Mart Stores Inc. | Broadline Retailers | 3.8 |
| Coca-Cola Co. | Soft Drinks | 3.6 |
| United Technologies | | |
| Corp. | Aerospace | 3.6 |
| Exxon Mobil Corp. | Integrated Oil & Gas | 3.6 |
| Chevron Corp. | Integrated Oil & Gas | 3.4 |
| McDonald's Corp. | Restaurants & Bars | 3.3 |
| 3M Co. | Diversified Industrials | 3.1 |
| Top Ten | | 36.0% |
| The holdings listed exclude any temporary cash investments and equity index products. |
Investment Focus
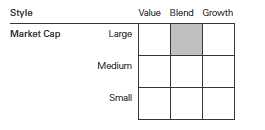
1 The expense ratios shown are from the prospectus dated December 19, 2013 (May 28, 2013, for ETF Shares), and represent estimated costs for the current fiscal year. For the fiscal year ended January 31, 2014, the expense ratios were 0.20% for Investor Shares, 0.10% (annualized) for Admiral Shares, and 0.10% for ETF Shares.
8
Dividend Appreciation Index Fund
Performance Summary
All of the returns in this report represent past performance, which is not a guarantee of future results that may be achieved by the fund. (Current performance may be lower or higher than the performance data cited. For performance data current to the most recent month-end, visit our website at vanguard.com/performance.) Note, too, that both investment returns and principal value can fluctuate widely, so an investor’s shares, when sold, could be worth more or less than their original cost. The returns shown do not reflect taxes that a shareholder would pay on fund distributions or on the sale of fund shares.
Cumulative Performance: April 27, 2006, Through January 31, 2014
Initial Investment of $10,000
| | | | | |
| | | | Average Annual Total Returns | |
| | | Periods Ended January 31, 2014 | |
| | | | | Since | Final Value |
| | | One | Five | Inception | of a $10,000 |
| | | Year | Years | (4/27/2006) | Investment |
| |
| | Dividend Appreciation Index | | | | |
| | Fund*Investor Shares | 15.51% | 16.54% | 6.73% | $16,583 |
| •••••••• | NASDAQ US Dividend Achievers | | | | |
| | Select Index | 15.70 | 16.82 | 7.00 | 16,909 |
| |
| – – – – | Large-Cap Core Funds Average | 20.41 | 17.69 | 5.11 | 14,729 |
| |
| | Dow Jones U.S. Total Stock Market | | | | |
| | Float Adjusted Index | 22.53 | 20.13 | 6.71 | 16,561 |
| Large-Cap Core Funds Average: Derived from data provided by Lipper, a Thomson Reuters Company. |
"Since Inception" performance is calculated from the Investor Shares’ inception date for both the fund and its comparative standards.
See Financial Highlights for dividend and capital gains information.
9
Dividend Appreciation Index Fund
| | |
| | Average Annual Total Returns | |
| | Period Ended January 31, 2014 | |
| |
| | Since | Final Value |
| | Inception | of a $10,000 |
| | (12/19/2013) | Investment |
| Dividend Appreciation Index Fund Admiral | | |
| Shares | -3.00% | $9,700 |
| NASDAQ US Dividend Achievers Select Index | -3.01 | 9,699 |
| Dow Jones U.S. Total Stock Market Float | | |
| Adjusted Index | -0.81 | 9,919 |
| "Since Inception" performance is calculated from the Admiral Shares’ inception date for both the fund and its comparative standards. |
| | | | |
| | | | Since | Final Value |
| | One | Five | Inception | of a $10,000 |
| | Year | Years | (4/21/2006) | Investment |
| Dividend Appreciation Index Fund | | | | |
| ETF Shares Net Asset Value | 15.60% | 16.67% | 6.88% | $16,777 |
| NASDAQ US Dividend Achievers Select Index | 15.70 | 16.82 | 7.02 | 16,957 |
| Dow Jones U.S. Total Stock Market Float | | | | |
| Adjusted Index | 22.53 | 20.13 | 6.66 | 16,516 |
| "Since Inception" performance is calculated from the ETF Shares’ inception date for both the fund and its comparative standards. |
| | | |
| Cumulative Returns of ETF Shares: April 21, 2006, Through January 31, 2014 | | |
| | | | Since |
| | One | Five | Inception |
| | Year | Years | (4/21/2006) |
| Dividend Appreciation Index Fund ETF Shares | | | |
| Market Price | 15.58% | 115.57% | 67.76% |
| Dividend Appreciation Index Fund ETF Shares Net | | | |
| Asset Value | 15.60 | 116.19 | 67.77 |
| NASDAQ US Dividend Achievers Select Index | 15.70 | 117.57 | 69.57 |
| "Since Inception" performance is calculated from the ETF Shares’ inception date for both the fund and its comparative standards. |
10
Dividend Appreciation Index Fund
Fiscal-Year Total Returns (%): April 27, 2006, Through January 31, 2014
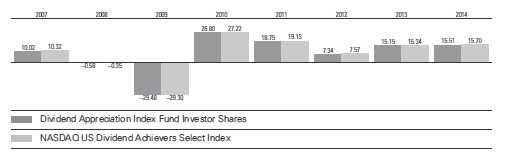
Average Annual Total Returns: Periods Ended December 31, 2013
This table presents returns through the latest calendar quarter—rather than through the end of the fiscal period.
Securities and Exchange Commission rules require that we provide this information.
| | | | |
| | Inception | One | Five | Since |
| | Date | Year | Years | Inception |
| Investor Shares | 4/27/2006 | 28.85% | 15.77% | 7.53% |
| Admiral Shares | 12/19/2013 | — | — | 2.15 |
| ETF Shares | 4/21/2006 | | | |
| Market Price | | 29.01 | 15.90 | 7.68 |
| Net Asset Value | | 28.99 | 15.91 | 7.68 |
11
Dividend Appreciation Index Fund
Financial Statements
Statement of Net Assets
As of January 31, 2014
The fund reports a complete list of its holdings in regulatory filings four times in each fiscal year, at the quarter-ends. For the second and fourth fiscal quarters, the lists appear in the fund’s semiannual and annual reports to shareholders. For the first and third fiscal quarters, the fund files the lists with the Securities and Exchange Commission on Form N-Q. Shareholders can look up the fund’s Forms N-Q on the SEC’s website at sec.gov. Forms N-Q may also be reviewed and copied at the SEC’s Public Reference Room (see the back cover of this report for further information).
| | |
| | | Market |
| | | Value |
| | Shares | ($000) |
| Common Stocks (100.0%)1 | | |
| Basic Materials (5.5%) | | |
| Praxair Inc. | 2,421,733 | 302,039 |
| Ecolab Inc. | 2,381,706 | 239,457 |
| PPG Industries Inc. | 1,192,827 | 217,524 |
| Air Products & | | |
| Chemicals Inc. | 1,645,098 | 172,966 |
| Sigma-Aldrich Corp. | 954,714 | 88,760 |
| International Flavors & | | |
| Fragrances Inc. | 634,812 | 55,025 |
| Albemarle Corp. | 738,897 | 47,422 |
| RPM International Inc. | 1,016,823 | 40,337 |
| Royal Gold Inc. | 547,413 | 30,622 |
| HB Fuller Co. | 362,595 | 16,890 |
| Stepan Co. | 166,514 | 10,555 |
| | | 1,221,597 |
| Consumer Goods (22.8%) | | |
| PepsiCo Inc. | 10,865,814 | 873,177 |
| Procter & Gamble Co. | 11,145,126 | 853,940 |
| Coca-Cola Co. | 21,149,091 | 799,859 |
| Colgate-Palmolive Co. | 7,447,080 | 455,985 |
| Monsanto Co. | 4,050,047 | 431,532 |
| NIKE Inc. Class B | 5,675,728 | 413,477 |
| VF Corp. | 3,775,994 | 220,707 |
| Archer-Daniels- | | |
| Midland Co. | 5,141,787 | 202,998 |
| Stanley Black & | | |
| Decker Inc. | 1,337,973 | 103,559 |
| Genuine Parts Co. | 1,225,519 | 100,799 |
| Hormel Foods Corp. | 1,930,329 | 87,714 |
| Bunge Ltd. | 1,117,887 | 84,691 |
| JM Smucker Co. | 858,756 | 82,775 |
| Brown-Forman Corp. | | |
| Class B | 1,047,526 | 80,659 |
| Church & Dwight Co. Inc. | 1,085,295 | 70,088 |
| Polaris Industries Inc. | 523,455 | 65,537 |
| McCormick & Co. Inc. | 1,012,435 | 64,978 |
| Nu Skin Enterprises Inc. | | |
| Class A | 404,734 | 34,463 |
| | | |
| Lancaster Colony Corp. | 215,765 | 18,754 |
| Andersons Inc. | | 142,710 | 11,808 |
| Tootsie Roll Industries Inc. | 300,492 | 9,117 |
| | | | 5,066,617 |
| Consumer Services (16.1%) | | |
| Wal-Mart Stores Inc. | 11,245,748 | 839,832 |
| McDonald’s Corp. | | 7,853,865 | 739,599 |
| Walgreen Co. | | 7,338,963 | 420,890 |
| Lowe’s Cos. Inc. | | 8,606,560 | 398,398 |
| TJX Cos. Inc. | | 5,709,149 | 327,477 |
| Target Corp. | | 5,151,154 | 291,761 |
| Cardinal Health Inc. | | 2,588,902 | 176,097 |
| Ross Stores Inc. | | 1,628,064 | 110,562 |
| Tiffany & Co. | | 965,370 | 80,309 |
| Family Dollar Stores Inc. | 1,032,747 | 63,844 |
| FactSet Research | | | |
| Systems Inc. | | 344,508 | 36,439 |
| Rollins Inc. | | 1,077,700 | 31,059 |
| John Wiley & Sons Inc. | | |
| Class A | | 421,708 | 22,831 |
| Casey’s General Stores Inc. 311,700 | 21,404 |
| Cracker Barrel Old Country | | |
| Store Inc. | | 195,672 | 19,374 |
| Matthews International | | |
| Corp. Class A | | 223,140 | 9,488 |
| | | | 3,589,364 |
| Financials (7.6%) | | | |
| Franklin Resources Inc. | 4,985,032 | 259,271 |
| ACE Ltd. | | 2,653,671 | 248,941 |
| Aflac Inc. | | 3,844,683 | 241,369 |
| Chubb Corp. | | 2,022,397 | 170,973 |
| McGraw Hill Financial Inc. | 2,206,727 | 167,799 |
| T. Rowe Price Group Inc. | 1,915,345 | 150,240 |
| SEI Investments Co. | | 1,322,819 | 45,055 |
| PartnerRe Ltd. | | 421,455 | 41,374 |
| WR Berkley Corp. | | 1,021,257 | 39,584 |
| RenaissanceRe | | | |
| Holdings Ltd. | | 390,583 | 35,430 |
| Brown & Brown Inc. | | 1,107,321 | 34,870 |
12
| | | |
| Dividend Appreciation Index Fund | |
| |
| |
| |
| | | | Market |
| | | | Value |
| | | Shares | ($000) |
| HCC Insurance | | | |
| Holdings Inc. | | 794,053 | 34,073 |
| Eaton Vance Corp. | | 859,061 | 32,704 |
| Commerce Bancshares Inc. 749,642 | 32,587 |
| Prosperity Bancshares Inc. | 501,384 | 31,367 |
| Erie Indemnity Co. Class A | 388,323 | 27,249 |
| UMB Financial Corp. | | 368,152 | 21,828 |
| StanCorp Financial | | | |
| Group Inc. | | 338,091 | 21,722 |
| Bank of the Ozarks Inc. | 263,205 | 16,687 |
| RLI Corp. | | 327,817 | 13,657 |
| Bancfirst Corp. | | 129,703 | 7,008 |
| 1st Source Corp. | | 200,014 | 5,894 |
| First Financial Corp. | | 112,015 | 3,604 |
| Republic Bancorp Inc | 147,812 | 3,413 |
| | | | 1,686,699 |
| Health Care (8.1%) | | | |
| Abbott Laboratories | 23,928,143 | 877,206 |
| Medtronic Inc. | | 7,390,740 | 418,020 |
| Stryker Corp. | | 2,718,207 | 210,933 |
| Becton Dickinson | | | |
| and Co. | | 1,511,783 | 163,454 |
| CR Bard Inc. | | 643,230 | 83,356 |
| West Pharmaceutical | | |
| Services Inc. | | 529,962 | 25,147 |
| Owens & Minor Inc. | | 489,096 | 16,942 |
| | | | 1,795,058 |
| Industrials (22.6%) | | | |
| United Technologies Corp. 6,995,061 | 797,577 |
| 3M Co. | | 5,333,947 | 683,759 |
| Caterpillar Inc. | | 5,019,680 | 471,398 |
| Emerson Electric Co. | 5,537,061 | 365,114 |
| Automatic Data | | | |
| Processing Inc. | | 3,830,236 | 293,396 |
| General Dynamics Corp. | 2,864,940 | 290,247 |
| Illinois Tool Works Inc. | 3,597,280 | 283,717 |
| Norfolk Southern Corp. | 2,315,982 | 214,437 |
| Sherwin-Williams Co. | 791,659 | 145,079 |
| WW Grainger Inc. | | 543,116 | 127,350 |
| Parker Hannifin Corp. | 1,117,646 | 126,708 |
| Dover Corp. | | 1,451,718 | 125,661 |
| Pentair Ltd. | | 1,639,484 | 121,863 |
| Roper Industries Inc. | | 764,904 | 104,975 |
| Fastenal Co. | | 2,356,061 | 103,502 |
| CH Robinson | | | |
| Worldwide Inc. | | 1,254,699 | 73,450 |
| Expeditors International | | |
| of Washington Inc. | | 1,583,605 | 64,706 |
| Cintas Corp. | | 984,544 | 56,188 |
| Valspar Corp. | | 686,259 | 48,230 |
| MDU Resources | | | |
| Group Inc. | | 1,468,182 | 47,041 |
| Donaldson Co. Inc. | | 1,078,242 | 44,488 |
| Lincoln Electric | | | |
| Holdings Inc. | | 633,526 | 43,840 |
| | |
| | | Market |
| | | Value |
| | Shares | ($000) |
| Jack Henry & | | |
| Associates Inc. | 670,967 | 37,427 |
| Carlisle Cos. Inc. | 484,649 | 36,121 |
| Nordson Corp. | 501,392 | 34,756 |
| Graco Inc. | 462,347 | 32,128 |
| Aptargroup Inc. | 503,372 | 32,115 |
| Bemis Co. Inc. | 799,633 | 30,794 |
| Valmont Industries Inc. | 205,892 | 30,138 |
| AO Smith Corp. | 595,754 | 28,132 |
| CLARCOR Inc. | 397,092 | 22,007 |
| Franklin Electric Co. Inc. | 368,589 | 14,685 |
| Mine Safety Appliances Co. | 289,466 | 14,583 |
| ABM Industries Inc. | 419,162 | 11,175 |
| Raven Industries Inc. | 285,686 | 10,699 |
| Brady Corp. Class A | 380,994 | 10,424 |
| Tennant Co. | 146,147 | 9,372 |
| ^ Lindsay Corp. | 91,189 | 7,751 |
| McGrath RentCorp | 205,019 | 7,508 |
| Gorman-Rupp Co. | 215,653 | 6,864 |
| Badger Meter Inc. | 110,892 | 5,649 |
| Cass Information | | |
| Systems Inc. | 101,833 | 5,511 |
| NACCO Industries Inc. | | |
| Class A | 51,890 | 3,064 |
| | | 5,023,629 |
| Oil & Gas (12.0%) | | |
| Exxon Mobil Corp. | 8,591,549 | 791,797 |
| Chevron Corp. | 6,795,164 | 758,544 |
| Occidental | | |
| Petroleum Corp. | 6,158,522 | 539,302 |
| EOG Resources Inc. | 2,166,237 | 357,949 |
| Murphy Oil Corp. | 1,557,726 | 88,183 |
| Helmerich & Payne Inc. | 791,292 | 69,665 |
| Energen Corp. | 556,846 | 39,380 |
| CARBO Ceramics Inc. | 186,675 | 21,490 |
| | | 2,666,310 |
| Technology (4.0%) | | |
| International Business | | |
| Machines Corp. | 3,839,284 | 678,325 |
| Linear Technology Corp. | 1,805,296 | 80,408 |
| Maxim Integrated | | |
| Products Inc. | 2,289,040 | 69,266 |
| Harris Corp. | 929,879 | 64,478 |
| | | 892,477 |
| Telecommunications (0.1%) | | |
| Telephone & | | |
| Data Systems Inc. | 754,405 | 20,384 |
| Atlantic Tele-Network Inc. | 107,591 | 6,267 |
| | | 26,651 |
| Utilities (1.2%) | | |
| ONEOK Inc. | 1,528,733 | 104,703 |
| National Fuel Gas Co. | 653,893 | 49,277 |
| UGI Corp. | 878,371 | 38,113 |
| Aqua America Inc. | 1,354,610 | 32,443 |
13
Dividend Appreciation Index Fund
| | |
| | | Market |
| | | Value |
| | Shares | ($000) |
| South Jersey | | |
| Industries Inc. | 242,662 | 12,944 |
| MGE Energy Inc. | 186,214 | 10,603 |
| American States Water Co. | 301,374 | 8,559 |
| SJW Corp. | 153,485 | 4,391 |
| Connecticut Water | | |
| Service Inc. | 86,449 | 2,913 |
| York Water Co. | 102,746 | 2,093 |
| | | 266,039 |
| Total Common Stocks | | |
| (Cost $17,677,616) | | 22,234,441 |
| Temporary Cash Investments (0.0%)1 | |
| Money Market Fund (0.0%) | | |
| 2,3 Vanguard Market | | |
| Liquidity Fund, | | |
| 0.130% | 2,615,097 | 2,615 |
| |
| | Face | |
| | Amount | |
| | ($000) | |
| U.S. Government and Agency Obligations (0.0%) |
| 4,5 Freddie Mac | | |
| Discount Notes, | | |
| 0.070%, 3/31/14 | 1,400 | 1,400 |
| Total Temporary Cash Investments | |
| (Cost $4,015) | | 4,015 |
| Total Investments (100.0%) | | |
| (Cost $17,681,631) | | 22,238,456 |
| Other Assets and Liabilities (0.0%) | |
| Other Assets | | 32,546 |
| Liabilities3 | | (33,886) |
| | | (1,340) |
| Net Assets (100%) | | 22,237,116 |
| |
| At January 31, 2014, net assets consisted of: |
| | Amount |
| | ($000) |
| Paid-in Capital | 17,893,040 |
| Undistributed Net Investment Income | 18,731 |
| Accumulated Net Realized Losses | (231,414) |
| Unrealized Appreciation (Depreciation) | |
| Investment Securities | 4,556,825 |
| Futures Contracts | (66) |
| Net Assets | 22,237,116 |
| |
| |
| Investor Shares—Net Assets | |
| Applicable to 103,727,093 outstanding | |
| $.001 par value shares of beneficial | |
| interest (unlimited authorization) | 2,965,633 |
| Net Asset Value Per Share— | |
| Investor Shares | $28.59 |
| |
| |
| Admiral Shares—Net Assets | |
| Applicable to 39,200,452 outstanding | |
| $.001 par value shares of beneficial | |
| interest (unlimited authorization) | 760,294 |
| Net Asset Value Per Share— | |
| Admiral Shares | $19.40 |
| |
| |
| ETF Shares—Net Assets | |
| Applicable to 259,002,585 outstanding | |
| $.001 par value shares of beneficial | |
| interest (unlimited authorization) | 18,511,189 |
| Net Asset Value Per Share— | |
| ETF Shares | $71.47 |
See Note A in Notes to Financial Statements.
^ Includes partial security positions on loan to broker-dealers. The total value of securities on loan is $1,709,000.
1 The fund invests a portion of its cash reserves in equity markets through the use of index futures contracts. After giving effect to futures
investments, the fund’s effective common stock and temporary cash investment positions represent 100.0% and 0.0%, respectively, of
net assets.
2 Affiliated money market fund available only to Vanguard funds and certain trusts and accounts managed by Vanguard. Rate shown is the
7-day yield.
3 Includes $1,749,000 of collateral received for securities on loan.
4 The issuer was placed under federal conservatorship in September 2008; since that time, its daily operations have been managed by the
Federal Housing Finance Agency and it receives capital from the U.S. Treasury, as needed to maintain a positive net worth, in exchange for
senior preferred stock.
5 Securities with a value of $600,000 have been segregated as initial margin for open futures contracts.
See accompanying Notes, which are an integral part of the Financial Statements.
14
Dividend Appreciation Index Fund
Statement of Operations
| |
| | Year Ended |
| | January 31, 2014 |
| | ($000) |
| Investment Income | |
| Income | |
| Dividends | 436,934 |
| Interest1 | 27 |
| Securities Lending | 953 |
| Total Income | 437,914 |
| Expenses | |
| The Vanguard Group—Note B | |
| Investment Advisory Services | 1,123 |
| Management and Administrative—Investor Shares | 5,584 |
| Management and Administrative—Admiral Shares | 59 |
| Management and Administrative—ETF Shares | 11,217 |
| Marketing and Distribution—Investor Shares | 809 |
| Marketing and Distribution—Admiral Shares | — |
| Marketing and Distribution—ETF Shares | 3,938 |
| Custodian Fees | 192 |
| Auditing Fees | 27 |
| Shareholders’ Reports—Investor Shares | 50 |
| Shareholders’ Reports—Admiral Shares | — |
| Shareholders’ Reports—ETF Shares | 412 |
| Trustees’ Fees and Expenses | 16 |
| Total Expenses | 23,427 |
| Net Investment Income | 414,487 |
| Realized Net Gain (Loss) | |
| Investment Securities Sold | 236,982 |
| Futures Contracts | 5,210 |
| Realized Net Gain (Loss) | 242,192 |
| Change in Unrealized Appreciation (Depreciation) | |
| Investment Securities | 2,075,222 |
| Futures Contracts | 36 |
| Change in Unrealized Appreciation (Depreciation) | 2,075,258 |
| Net Increase (Decrease) in Net Assets Resulting from Operations | 2,731,937 |
| 1 Interest income from an affiliated company of the fund was $26,000. |
See accompanying Notes, which are an integral part of the Financial Statements.
15
Dividend Appreciation Index Fund
Statement of Changes in Net Assets
| | |
| | Year Ended January 31, |
| | 2014 | 2013 |
| | ($000) | ($000) |
| Increase (Decrease) in Net Assets | | |
| Operations | | |
| Net Investment Income | 414,487 | 332,151 |
| Realized Net Gain (Loss) | 242,192 | 481,383 |
| Change in Unrealized Appreciation (Depreciation) | 2,075,258 | 1,192,461 |
| Net Increase (Decrease) in Net Assets Resulting from Operations | 2,731,937 | 2,005,995 |
| Distributions | | |
| Net Investment Income | | |
| Investor Shares | (65,045) | (56,344) |
| Admiral Shares | — | — |
| ETF Shares | (337,724) | (276,499) |
| Realized Capital Gain | | |
| Investor Shares | — | — |
| Admiral Shares | — | — |
| ETF Shares | — | — |
| Total Distributions | (402,769) | (332,843) |
| Capital Share Transactions | | |
| Investor Shares | (265,587) | 295,165 |
| Admiral Shares | 789,364 | — |
| ETF Shares | 3,461,648 | 2,071,585 |
| Net Increase (Decrease) from Capital Share Transactions | 3,985,425 | 2,366,750 |
| Total Increase (Decrease) | 6,314,593 | 4,039,902 |
| Net Assets | | |
| Beginning of Period | 15,922,523 | 11,882,621 |
| End of Period1 | 22,237,116 | 15,922,523 |
| 1 Net Assets—End of Period includes undistributed net investment income of $18,731,000 and $7,013,000. |
See accompanying Notes, which are an integral part of the Financial Statements.
16
Dividend Appreciation Index Fund
Financial Highlights
| | | | | |
| Investor Shares | | | | | |
| |
| For a Share Outstanding | Year Ended January 31, |
| Throughout Each Period | 2014 | 2013 | 2012 | 2011 | 2010 |
| Net Asset Value, Beginning of Period | $25.23 | $22.42 | $21.33 | $18.33 | $14.79 |
| Investment Operations | | | | | |
| Net Investment Income | . 540 | . 538 | .445 | .392 | .369 |
| Net Realized and Unrealized Gain (Loss) | | | | | |
| on Investments | 3.350 | 2.812 | 1.089 | 3.006 | 3.543 |
| Total from Investment Operations | 3.890 | 3.350 | 1.534 | 3.398 | 3.912 |
| Distributions | | | | | |
| Dividends from Net Investment Income | (. 530) | (. 540) | (. 444) | (. 398) | (.372) |
| Distributions from Realized Capital Gains | — | — | — | — | — |
| Total Distributions | (. 530) | (. 540) | (. 444) | (. 398) | (.372) |
| Net Asset Value, End of Period | $28.59 | $25.23 | $22.42 | $21.33 | $18.33 |
| |
| Total Return1 | 15.51% | 15.15% | 7.34% | 18.75% | 26.80% |
| |
| Ratios/Supplemental Data | | | | | |
| Net Assets, End of Period (Millions) | $2,966 | $2,804 | $2,206 | $1,421 | $613 |
| Ratio of Total Expenses to Average Net Assets | 0.20% | 0.20% | 0.25% | 0.30% | 0.35% |
| Ratio of Net Investment Income to | | | | | |
| Average Net Assets | 1.98% | 2.32% | 2.14% | 2.13% | 2.24% |
| Portfolio Turnover Rate 2 | 3% | 15% | 14% | 15% | 20% |
1 Total returns do not include account service fees that may have applied in the periods shown. Fund prospectuses provide information about
any applicable account service fees.
2 Excludes the value of portfolio securities received or delivered as a result of in-kind purchases or redemptions of the fund’s capital shares,
including ETF Creation Units.
See accompanying Notes, which are an integral part of the Financial Statements.
17
Dividend Appreciation Index Fund
Financial Highlights
| |
| Admiral Shares | |
| | December 19, 20131 to |
| For a Share Outstanding Throughout the Period | January 31, 2014 |
| Net Asset Value, Beginning of Period | $20.00 |
| Investment Operations | |
| Net Investment Income | . 030 |
| Net Realized and Unrealized Gain (Loss) on Investments | (.630) |
| Total from Investment Operations | (. 600) |
| Distributions | |
| Dividends from Net Investment Income | — |
| Distributions from Realized Capital Gains | — |
| Total Distributions | — |
| Net Asset Value, End of Period | $19.40 |
| |
| Total Return2 | -3.00% |
| |
| Ratios/Supplemental Data | |
| Net Assets, End of Period (Millions) | $760 |
| Ratio of Total Expenses to Average Net Assets | 0.10%3 |
| Ratio of Net Investment Income to Average Net Assets | 2.08%3 |
| Portfolio Turnover Rate 4 | 3% |
1 Inception.
2 Total returns do not include account services fees that may have applied in the periods shown. Fund prospectuses provide information about
any applicable account services fees.
3 Annualized.
4 Excludes the value of portfolio securities received or delivered as a result of in-kind purchases or redemptions of the fund’s capital shares,
including ETF Creation Units.
See accompanying Notes, which are an integral part of the Financial Statements.
18
Dividend Appreciation Index Fund
Financial Highlights
| | | | | |
| ETF Shares | | | | | |
| |
| For a Share Outstanding | Year Ended January 31, |
| Throughout Each Period | 2014 | 2013 | 2012 | 2011 | 2010 |
| Net Asset Value, Beginning of Period | $63.08 | $56.04 | $53.32 | $45.81 | $36.96 |
| Investment Operations | | | | | |
| Net Investment Income | 1.421 | 1.401 | 1.173 | 1.034 | .973 |
| Net Realized and Unrealized Gain (Loss) | | | | | |
| on Investments | 8.357 | 7.049 | 2.719 | 7.524 | 8.856 |
| Total from Investment Operations | 9.778 | 8.450 | 3.892 | 8.558 | 9.829 |
| Distributions | | | | | |
| Dividends from Net Investment Income | (1.388) | (1.410) | (1.172) | (1.048) | (.979) |
| Distributions from Realized Capital Gains | — | — | — | — | — |
| Total Distributions | (1.388) | (1.410) | (1.172) | (1.048) | (.979) |
| Net Asset Value, End of Period | $71.47 | $63.08 | $56.04 | $53.32 | $45.81 |
| |
| Total Return | 15.60% | 15.29% | 7.46% | 18.91% | 26.95% |
| |
| Ratios/Supplemental Data | | | | | |
| Net Assets, End of Period (Millions) | $18,511 | $13,119 | $9,677 | $4,985 | $1,918 |
| Ratio of Total Expenses to Average Net Assets | 0.10% | 0.10% | 0.13% | 0.18% | 0.23% |
| Ratio of Net Investment Income to | | | | | |
| Average Net Assets | 2.08% | 2.42% | 2.26% | 2.25% | 2.36% |
| Portfolio Turnover Rate1 | 3% | 15% | 14% | 15% | 20% |
1 Excludes the value of portfolio securities received or delivered as a result of in-kind purchases or redemptions of the fund’s capital shares,
including ETF Creation Units.
See accompanying Notes, which are an integral part of the Financial Statements.
19
Dividend Appreciation Index Fund
Notes to Financial Statements
Vanguard Dividend Appreciation Index Fund is registered under the Investment Company Act of 1940 as an open-end investment company, or mutual fund. The fund offers three classes of shares: Investor Shares, Admiral Shares, and ETF Shares. Investor Shares are available to any investor who meets the fund’s minimum purchase requirements. Admiral Shares are designed for investors who meet certain administrative, service, and account-size criteria. ETF Shares are listed for trading on NYSE Arca; they can be purchased and sold through a broker.
A. The following significant accounting policies conform to generally accepted accounting principles for U.S. mutual funds. The fund consistently follows such policies in preparing its financial statements.
1. Security Valuation: Securities are valued as of the close of trading on the New York Stock Exchange (generally 4 p.m., Eastern time) on the valuation date. Equity securities are valued at the latest quoted sales prices or official closing prices taken from the primary market in which each security trades; such securities not traded on the valuation date are valued at the mean of the latest quoted bid and asked prices. Securities for which market quotations are not readily available, or whose values have been materially affected by events occurring before the fund’s pricing time but after the close of the securities’ primary markets, are valued by methods deemed by the board of trustees to represent fair value. Investments in Vanguard Market Liquidity Fund are valued at that fund’s net asset value. Temporary cash investments acquired over 60 days to maturity are valued using the latest bid prices or using valuations based on a matrix system (which considers such factors as security prices, yields, maturities, and ratings), both as furnished by independent pricing services. Other temporary cash investments are valued at amortized cost, which approximates market value.
2. Futures Contracts: The fund uses index futures contracts to a limited extent, with the objectives of maintaining full exposure to the stock market, enhancing returns, maintaining liquidity, and minimizing transaction costs. The fund may purchase futures contracts to immediately invest incoming cash in the market, or sell futures in response to cash outflows, thereby simulating a fully invested position in the underlying index while maintaining a cash balance for liquidity. The fund may seek to enhance returns by using futures contracts instead of the underlying securities when futures are believed to be priced more attractively than the underlying securities. The primary risks associated with the use of futures contracts are imperfect correlation between changes in market values of stocks held by the fund and the prices of futures contracts, and the possibility of an illiquid market. Counterparty risk involving futures is mitigated because a regulated clearinghouse is the counterparty instead of the clearing broker. To further mitigate counterparty risk, the fund trades futures contracts on an exchange, monitors the financial strength of its clearing brokers and clearinghouse, and has entered into clearing agreements with its clearing brokers. The clearinghouse imposes initial margin requirements to secure the fund’s performance and requires daily settlement of variation margin representing changes in the market value of each contract.
Futures contracts are valued at their quoted daily settlement prices. The aggregate notional amounts of the contracts are not recorded in the Statement of Net Assets. Fluctuations in the value of the contracts are recorded in the Statement of Net Assets as an asset (liability) and in the Statement of Operations as unrealized appreciation (depreciation) until the contracts are closed, when they are recorded as realized futures gains (losses).
During the year ended January 31, 2014, the fund’s average investments in long and short futures contracts represented less than 1% and 0% of net assets, respectively, based on quarterly average aggregate settlement values.
20
Dividend Appreciation Index Fund
3. Federal Income Taxes: The fund intends to continue to qualify as a regulated investment company and distribute all of its taxable income. Management has analyzed the fund’s tax positions taken for all open federal income tax years (January 31, 2011–2014), and has concluded that no provision for federal income tax is required in the fund’s financial statements.
4. Distributions: Distributions to shareholders are recorded on the ex-dividend date.
5. Securities Lending: To earn additional income, the fund may lend its securities to qualified institutional borrowers. Security loans are required to be secured at all times by collateral in an amount at least equal to the market value of securities loaned. Daily market fluctuations could cause the value of loaned securities to be more or less than the value of the collateral received. When this occurs, the collateral is adjusted and settled on the next business day. The fund further mitigates its counterparty risk by entering into securities lending transactions only with a diverse group of prequalified counterparties, monitoring their financial strength, and entering into master securities lending agreements with its counterparties. The master securities lending agreements provide that, in the event of a counterparty’s default (including bankruptcy), the fund may terminate any loans with that borrower, determine the net amount owed, and sell or retain the collateral up to the net amount owed to the fund; however, such actions may be subject to legal proceedings. While collateral mitigates counterparty risk, in the absence of a default the fund may experience delays and costs in recovering the securities loaned. The fund invests cash collateral received in Vanguard Market Liquidity Fund, and records a liability for the return of the collateral, during the period the securities are on loan. Securities lending income represents fees charged to borrowers plus income earned on invested cash collateral, less expenses associated with the loan.
6. Other: Dividend income is recorded on the ex-dividend date. Interest income includes income distributions received from Vanguard Market Liquidity Fund and is accrued daily. Premiums and discounts on debt securities purchased are amortized and accreted, respectively, to interest income over the lives of the respective securities. Security transactions are accounted for on the date securities are bought or sold. Costs used to determine realized gains (losses) on the sale of investment securities are those of the specific securities sold.
Each class of shares has equal rights as to assets and earnings, except that each class separately bears certain class-specific expenses related to maintenance of shareholder accounts (included in Management and Administrative expenses) and shareholder reporting. Marketing and distribution expenses are allocated to each class of shares based on a method approved by the board of trustees. Income, other non-class-specific expenses, and gains and losses on investments are allocated to each class of shares based on its relative net assets.
B. The Vanguard Group furnishes at cost investment advisory, corporate management, administrative, marketing, and distribution services. The costs of such services are allocated to the fund under methods approved by the board of trustees. The fund has committed to provide up to 0.40% of its net assets in capital contributions to Vanguard. At January 31, 2014, the fund had contributed capital of $2,580,000 to Vanguard (included in Other Assets), representing 0.01% of the fund’s net assets and 1.03% of Vanguard’s capitalization. The fund’s trustees and officers are also directors and officers of Vanguard.
21
Dividend Appreciation Index Fund
C. Various inputs may be used to determine the value of the fund’s investments. These inputs are summarized in three broad levels for financial statement purposes. The inputs or methodologies used to value securities are not necessarily an indication of the risk associated with investing in those securities.
Level 1—Quoted prices in active markets for identical securities.
Level 2—Other significant observable inputs (including quoted prices for similar securities, interest rates, prepayment speeds, credit risk, etc.).
Level 3—Significant unobservable inputs (including the fund’s own assumptions used to determine the fair value of investments).
The following table summarizes the market value of the fund’s investments as of January 31, 2014, based on the inputs used to value them:
| | | |
| | Level 1 | Level 2 | Level 3 |
| Investments | ($000) | ($000) | ($000) |
| Common Stocks | 22,234,441 | — | — |
| Temporary Cash Investments | 2,615 | 1,400 | — |
| Futures Contracts—Liabilities1 | (7) | — | — |
| Total | 22,237,049 | 1,400 | — |
| 1 Represents variation margin on the last day of the reporting period. |
D. At January 31, 2014, the aggregate settlement value of open futures contracts and the related unrealized appreciation (depreciation) were:
| | | | |
| | | | ($000) |
| | | | Aggregate | |
| | | Number of | Settlement | Unrealized |
| | | Long (Short) | Value | Appreciation |
| Futures Contracts | Expiration | Contracts | Long (Short) | (Depreciation) |
| E-mini S&P 500 Index | March 2014 | 30 | 2,665 | (66) |
Unrealized appreciation (depreciation) on open futures contracts is required to be treated as realized gain (loss) for tax purposes.
E. Distributions are determined on a tax basis and may differ from net investment income and realized capital gains for financial reporting purposes. Differences may be permanent or temporary. Permanent differences are reclassified among capital accounts in the financial statements to reflect their tax character. Temporary differences arise when certain items of income, expense, gain, or loss are recognized in different periods for financial statement and tax purposes. These differences will reverse at some time in the future. Differences in classification may also result from the treatment of short-term gains as ordinary income for tax purposes.
During the year ended January 31, 2014, the fund realized $226,836,000 of net capital gains resulting from in-kind redemptions—in which shareholders exchanged fund shares for securities held by the fund rather than for cash. Because such gains are not taxable to the fund, and are not distributed to shareholders, they have been reclassified from accumulated net realized losses to paid-in capital.
22
Dividend Appreciation Index Fund
For tax purposes, at January 31, 2014, the fund had $25,614,000 of ordinary income available for distribution. The fund used capital loss carryforwards of $15,364,000 to offset taxable capital gains realized during the year ended January 31, 2014. At January 31, 2014, the fund had available capital losses totaling $231,480,000 to offset future net capital gains. Of this amount, $191,649,000 is subject to expiration dates; $609,000 may be used to offset future net capital gains through January 31, 2016, $22,242,000 through January 31, 2017, $146,149,000 through January 31, 2018, and $22,649,000 through January 31, 2019. Capital losses of $39,831,000 realized beginning in fiscal 2012 may be carried forward indefinitely under the Regulated Investment Company Modernization Act of 2010, but must be used before any expiring loss carryforwards.
At January 31, 2014, the cost of investment securities for tax purposes was $17,681,631,000. Net unrealized appreciation of investment securities for tax purposes was $4,556,825,000, consisting of unrealized gains of $4,592,149,000 on securities that had risen in value since their purchase and $35,324,000 in unrealized losses on securities that had fallen in value since their purchase.
F. During the year ended January 31, 2014, the fund purchased $5,380,173,000 of investment securities and sold $1,281,765,000 of investment securities, other than temporary cash investments. Purchases and sales include $3,915,191,000 and $639,222,000, respectively, in connection with in-kind purchases and redemptions of the fund’s capital shares.
G. Capital share transactions for each class of shares were:
| | | | |
| | Year Ended January 31, |
| | 2014 | 2013 |
| | Amount | Shares | Amount | Shares |
| | ($000) | (000) | ($000) | (000) |
| Investor Shares | | | | |
| Issued | 1,116,394 | 40,789 | 952,479 | 40,707 |
| Issued in Lieu of Cash Distributions | 53,392 | 1,935 | 46,434 | 1,980 |
| Redeemed | (1,435,373) | (50,108) | (703,748) | (29,978) |
| Net Increase (Decrease)—Investor Shares | (265,587) | (7,384) | 295,165 | 12,709 |
| Admiral Shares1 | | | | |
| Issued | 808,063 | 40,135 | — | — |
| Issued in Lieu of Cash Distributions | — | — | — | — |
| Redeemed | (18,699) | (935) | — | — |
| Net Increase (Decrease) —Admiral Shares | 789,364 | 39,200 | — | — |
| ETF Shares | | | | |
| Issued | 4,104,546 | 60,317 | 3,350,319 | 56,407 |
| Issued in Lieu of Cash Distributions | — | — | — | — |
| Redeemed | (642,898) | (9,300) | (1,278,734) | (21,100) |
| Net Increase (Decrease) —ETF Shares | 3,461,648 | 51,017 | 2,071,585 | 35,307 |
| 1 Inception was December 19, 2013, for Admiral Shares. |
H. Management has determined that no material events or transactions occurred subsequent to January 31, 2014, that would require recognition or disclosure in these financial statements.
23
Report of Independent Registered
Public Accounting Firm
To the Trustees of Vanguard Specialized Funds and the Shareholders of Vanguard Dividend Appreciation Index Fund:
In our opinion, the accompanying statement of net assets and the related statements of operations and of changes in net assets and the financial highlights present fairly, in all material respects, the financial position of Vanguard Dividend Appreciation Index Fund (constituting a separate portfolio of Vanguard Specialized Funds, hereafter referred to as the “Fund”) at January 31, 2014, the results of its operations for the year then ended, the changes in its net assets for each of the two years in the period then ended, and the financial highlights for each of the periods then ended, in conformity with accounting principles generally accepted in the United States of America. These financial statements and financial highlights (hereafter referred to as “financial statements”) are the responsibility of the Fund’s management; our responsibility is to express an opinion on these financial statements based on our audits. We conducted our audits of these financial statements in accordance with the standards of the Public Company Accounting Oversight Board (United States). Those standards require that we plan and perform the audit to obtain reasonable assurance about whether the financial statements are free of material misstatement. An audit includes examining, on a test basis, evidence supporting the amounts and disclosures in the financial statements, assessing the accounting principles used and significant estimates made by management, and evaluating the overall financial statement presentation. We believe that our audits, which included confirmation of securities at January 31, 2014 by correspondence with the custodian and by agreement to the underlying ownership records of the transfer agent, provide a reasonable basis for our opinion.
/s/PricewaterhouseCoopers LLP
Philadelphia, Pennsylvania
March 13, 2014
Special 2014 tax information (unaudited) for Vanguard Dividend Appreciation Index Fund
This information for the fiscal year ended January 31, 2014, is included pursuant to provisions of the
Internal Revenue Code.
The fund distributed $402,769,000 of qualified dividend income to shareholders during the fiscal year.
For corporate shareholders, 100% of investment income (dividend income plus short-term gains,
if any) qualifies for the dividends-received deduction.
24
Your Fund’s After-Tax Returns
This table presents returns for your fund both before and after taxes. The after-tax returns are shown in two ways: (1) assuming that an investor owned the fund during the entire period and paid taxes on the fund’s distributions, and (2) assuming that an investor paid taxes on the fund’s distributions and sold all shares at the end of each period.
Calculations are based on the highest individual federal income tax and capital gains tax rates in effect at the times of the distributions and the hypothetical sales. State and local taxes were not considered. After-tax returns reflect any qualified dividend income, using actual prior-year figures and estimates for 2014. (In the example, returns after the sale of fund shares may be higher than those assuming no sale. This occurs when the sale would have produced a capital loss. The calculation assumes that the investor received a tax deduction for the loss.)
The table shows returns for one share class only; returns for other share classes will differ. Please note that your actual after-tax returns will depend on your tax situation and may differ from those shown. Also note that if you own the fund in a tax-deferred account, such as an individual retirement account or a 401(k) plan, this information does not apply to you. Such accounts are not subject to current taxes.
Finally, keep in mind that a fund’s performance—whether before or after taxes—does not guarantee future results.
Average Annual Total Returns: Dividend Appreciation Index Fund Investor Shares
Periods Ended January 31, 2014
| | | |
| | | | Since |
| | One | Five | Inception |
| | Year | Years | (4/27/2006) |
| Returns Before Taxes | 15.51% | 16.54% | 6.73% |
| Returns After Taxes on Distributions | 14.99 | 16.13 | 6.40 |
| Returns After Taxes on Distributions and Sale of Fund Shares | 9.18 | 13.45 | 5.41 |
25
About Your Fund’s Expenses
As a shareholder of the fund, you incur ongoing costs, which include costs for portfolio management, administrative services, and shareholder reports (like this one), among others. Operating expenses, which are deducted from a fund’s gross income, directly reduce the investment return of the fund.
A fund’s expenses are expressed as a percentage of its average net assets. This figure is known as the expense ratio. The following examples are intended to help you understand the ongoing costs (in dollars) of investing in your fund and to compare these costs with those of other mutual funds. The examples are based on an investment of $1,000 made at the beginning of the period shown and held for the entire period.
The accompanying table illustrates your fund’s costs in two ways:
• Based on actual fund return. This section helps you to estimate the actual expenses that you paid over the period. The ”Ending Account Value“ shown is derived from the fund‘s actual return, and the third column shows the dollar amount that would have been paid by an investor who started with $1,000 in the fund. You may use the information here, together with the amount you invested, to estimate the expenses that you paid over the period.
To do so, simply divide your account value by $1,000 (for example, an $8,600 account value divided by $1,000 = 8.6), then multiply the result by the number given for your fund under the heading ”Expenses Paid During Period.“
• Based on hypothetical 5% yearly return. This section is intended to help you compare your fund‘s costs with those of other mutual funds. It assumes that the fund had a yearly return of 5% before expenses, but that the expense ratio is unchanged. In this case—because the return used is not the fund’s actual return—the results do not apply to your investment. The example is useful in making comparisons because the Securities and Exchange Commission requires all mutual funds to calculate expenses based on a 5% return. You can assess your fund’s costs by comparing this hypothetical example with the hypothetical examples that appear in shareholder reports of other funds.
Note that the expenses shown in the table are meant to highlight and help you compare ongoing costs only and do not reflect transaction costs incurred by the fund for buying and selling securities. Further, the expenses do not include any purchase, redemption, or account service fees described in the fund prospectus. If such fees were applied to your account, your costs would be higher. Your fund does not carry a “sales load.”
The calculations assume no shares were bought or sold during the period. Your actual costs may have been higher or lower, depending on the amount of your investment and the timing of any purchases or redemptions.
You can find more information about the fund’s expenses, including annual expense ratios, in the Financial Statements section of this report. For additional information on operating expenses and other shareholder costs, please refer to your fund’s current prospectus.
26
| | | |
| Six Months Ended January 31, 2014 | | | |
| | Beginning | Ending | Expenses |
| | Account Value | Account Value | Paid During |
| Dividend Appreciation Index Fund | 7/31/2013 | 1/31/2014 | Period |
| Based on Actual Fund Return | | | |
| Investor Shares | $1,000.00 | $1,034.97 | $1.03 |
| ETF Shares | 1,000.00 | 1,035.68 | 0.51 |
| Based on Hypothetical 5% Yearly Return | | | |
| Investor Shares | $1,000.00 | $1,024.20 | $1.02 |
| ETF Shares | 1,000.00 | 1,024.70 | 0.51 |
The calculations are based on expenses incurred in the most recent six-month period. The fund’s annualized six-month expense ratios for that
period are 0.20% for Investor Shares and 0.10% for ETF Shares. The dollar amounts shown as “Expenses Paid” are equal to the annualized
expense ratio multiplied by the average account value over the period, multiplied by the number of days in the most recent six-month period,
then divided by the number of days in the most recent 12-month period. This table does not include figures for share classes with less than
six months of history.
27
Glossary
30-Day SEC Yield. A fund’s 30-day SEC yield is derived using a formula specified by the U.S. Securities and Exchange Commission. Under the formula, data related to the fund’s security holdings in the previous 30 days are used to calculate the fund’s hypothetical net income for that period, which is then annualized and divided by the fund’s estimated average net assets over the calculation period. For the purposes of this calculation, a security’s income is based on its current market yield to maturity (for bonds), its actual income (for asset-backed securities), or its projected dividend yield (for stocks). Because the SEC yield represents hypothetical annualized income, it will differ—at times significantly—from the fund’s actual experience. As a result, the fund’s income distributions may be higher or lower than implied by the SEC yield.
Beta. A measure of the magnitude of a fund’s past share-price fluctuations in relation to the ups and downs of a given market index. The index is assigned a beta of 1.00. Compared with a given index, a fund with a beta of 1.20 typically would have seen its share price rise or fall by 12% when the index rose or fell by 10%. For this report, beta is based on returns over the past 36 months for both the fund and the index. Note that a fund’s beta should be reviewed in conjunction with its R-squared (see definition). The lower the R-squared, the less correlation there is between the fund and the index, and the less reliable beta is as an indicator of volatility.
Dividend Yield. Dividend income earned by stocks, expressed as a percentage of the aggregate market value (or of net asset value, for a fund). The yield is determined by dividing the amount of the annual dividends by the aggregate value (or net asset value) at the end of the period. For a fund, the dividend yield is based solely on stock holdings and does not include any income produced by other investments.
Earnings Growth Rate. The average annual rate of growth in earnings over the past five years for the stocks now in a fund.
Equity Exposure. A measure that reflects a fund’s investments in stocks and stock futures. Any holdings in short-term reserves are excluded.
Expense Ratio. A fund’s total annual operating expenses expressed as a percentage of the fund’s average net assets. The expense ratio includes management and administrative expenses, but does not include the transaction costs of buying and selling portfolio securities.
Foreign Holdings. The percentage of a fund represented by securities or depositary receipts of companies based outside the United States.
Inception Date. The date on which the assets of a fund (or one of its share classes) are first invested in accordance with the fund’s investment objective. For funds with a subscription period, the inception date is the day after that period ends. Investment performance is measured from the inception date.
Median Market Cap. An indicator of the size of companies in which a fund invests; the midpoint of market capitalization (market price x shares outstanding) of a fund’s stocks, weighted by the proportion of the fund’s assets invested in each stock. Stocks representing half of the fund’s assets have market capitalizations above the median, and the rest are below it.
Price/Book Ratio. The share price of a stock divided by its net worth, or book value, per share. For a fund, the weighted average price/book ratio of the stocks it holds.
28
Price/Earnings Ratio. The ratio of a stock’s current price to its per-share earnings over the past year. For a fund, the weighted average P/E of the stocks it holds. P/E is an indicator of market expectations about corporate prospects; the higher the P/E, the greater the expectations for a company’s future growth.
R-Squared. A measure of how much of a fund’s past returns can be explained by the returns from the market in general, as measured by a given index. If a fund’s total returns were precisely synchronized with an index’s returns, its R-squared would be 1.00. If the fund’s returns bore no relationship to the index’s returns, its R-squared would be 0. For this report, R-squared is based on returns over the past 36 months for both the fund and the index.
Return on Equity. The annual average rate of return generated by a company during the past five years for each dollar of shareholder’s equity (net income divided by shareholder’s equity). For a fund, the weighted average return on equity for the companies whose stocks it holds.
Short-Term Reserves. The percentage of a fund invested in highly liquid, short-term securities that can be readily converted to cash.
Turnover Rate. An indication of the fund’s trading activity. Funds with high turnover rates incur higher transaction costs and may be more likely to distribute capital gains (which may be taxable to investors). The turnover rate excludes in-kind transactions, which have minimal impact on costs.
29
This page intentionally left blank.
This page intentionally left blank.
The People Who Govern Your Fund
The trustees of your mutual fund are there to see that the fund is operated and managed in your best interests since, as a shareholder, you are a part owner of the fund. Your fund’s trustees also serve on the board of directors of The Vanguard Group, Inc., which is owned by the Vanguard funds and provides services to them on an at-cost basis.
A majority of Vanguard’s board members are independent, meaning that they have no affiliation with Vanguard or the funds they oversee, apart from the sizable personal investments they have made as private individuals. The independent board members have distinguished backgrounds in business, academia, and public service. Each of the trustees and executive officers oversees 180 Vanguard funds.
The following table provides information for each trustee and executive officer of the fund. More information about the trustees is in the Statement of Additional Information, which can be obtained, without charge, by contacting Vanguard at 800-662-7447, or online at vanguard.com.
| |
| InterestedTrustee1 | and Delphi Automotive LLP (automotive components); |
| | Senior Advisor at New Mountain Capital. |
| F. William McNabb III | |
| Born 1957. Trustee Since July 2009. Chairman of the | Amy Gutmann |
| Board. Principal Occupation(s) During the Past Five | Born 1949. Trustee Since June 2006. Principal |
| Years: Chairman of the Board of The Vanguard Group, | Occupation(s) During the Past Five Years: President of |
| Inc., and of each of the investment companies served | the University of Pennsylvania; Christopher H. Browne |
| by The Vanguard Group, since January 2010; Director | Distinguished Professor of Political Science, School of |
| of The Vanguard Group since 2008; Chief Executive | Arts and Sciences, and Professor of Communication, |
| Officer and President of The Vanguard Group, and of | Annenberg School for Communication, with secondary |
| each of the investment companies served by The | faculty appointments in the Department of Philosophy, |
| Vanguard Group, since 2008; Director of Vanguard | School of Arts and Sciences, and at the Graduate |
| Marketing Corporation; Managing Director of The | School of Education, University of Pennsylvania; |
| Vanguard Group (1995–2008). | Trustee of the National Constitution Center; Chair |
| | of the Presidential Commission for the Study of |
| | Bioethical Issues. |
| IndependentTrustees | |
| | |
| Emerson U. Fullwood | JoAnn Heffernan Heisen |
| Born 1948. Trustee Since January 2008. Principal | Born 1950. Trustee Since July 1998. Principal |
| Occupation(s) During the Past Five Years: Executive | Occupation(s) During the Past Five Years: Corporate |
| Chief Staff and Marketing Officer for North America | Vice President and Chief Global Diversity Officer |
| and Corporate Vice President (retired 2008) of Xerox | (retired 2008) and Member of the Executive |
| Corporation (document management products and | Committee (1997–2008) of Johnson & Johnson |
| services); Executive in Residence and 2010 | (pharmaceuticals/medical devices/consumer |
| Distinguished Minett Professor at the Rochester | products); Director of Skytop Lodge Corporation |
| Institute of Technology; Director of SPX Corporation | (hotels), the University Medical Center at Princeton, |
| (multi-industry manufacturing), the United Way of | the Robert Wood Johnson Foundation, and the Center |
| Rochester, Amerigroup Corporation (managed health | for Talent Innovation; Member of the Advisory Board |
| care), the University of Rochester Medical Center, | of the Maxwell School of Citizenship and Public Affairs |
| Monroe Community College Foundation, and North | at Syracuse University. |
| Carolina A&T University. | |
| F. Joseph Loughrey |
| Rajiv L. Gupta | Born 1949. Trustee Since October 2009. Principal |
| Born 1945. Trustee Since December 2001.2 | Occupation(s) During the Past Five Years: President |
| Principal Occupation(s) During the Past Five Years: | and Chief Operating Officer (retired 2009) of Cummins |
| Chairman and Chief Executive Officer (retired 2009) | Inc. (industrial machinery); Chairman of the Board |
| and President (2006–2008) of Rohm and Haas Co. | of Hillenbrand, Inc. (specialized consumer services), |
| (chemicals); Director of Tyco International, Ltd. | and of Oxfam America; Director of SKF AB (industrial |
| (diversified manufacturing and services), Hewlett- | machinery), Hyster-Yale Materials Handling, Inc. |
| Packard Co. (electronic computer manufacturing), | (forklift trucks), the Lumina Foundation for Education, |
| | |
| and the V Foundation for Cancer Research; Member | Executive Officers | |
| of the Advisory Council for the College of Arts and | | |
| Letters and of the Advisory Board to the Kellogg | Glenn Booraem | |
| Institute for International Studies, both at the | Born 1967. Controller Since July 2010. Principal |
| University of Notre Dame. | Occupation(s) During the Past Five Years: Principal |
| | of The Vanguard Group, Inc.; Controller of each of |
| Mark Loughridge | the investment companies served by The Vanguard |
| Born 1953. Trustee Since March 2012. Principal | Group; Assistant Controller of each of the investment |
| Occupation(s) During the Past Five Years: Senior Vice | companies served by The Vanguard Group (2001–2010). |
| President and Chief Financial Officer (retired 2013) | | |
| at IBM (information technology services); Fiduciary | Thomas J. Higgins | |
| Member of IBM’s Retirement Plan Committee (2004– | Born 1957. Chief Financial Officer Since September |
| 2013); Member of the Council on Chicago Booth. | 2008. Principal Occupation(s) During the Past Five |
| | Years: Principal of The Vanguard Group, Inc.; Chief |
| Scott C. Malpass | Financial Officer of each of the investment companies |
| Born 1962. Trustee Since March 2012. Principal | served by The Vanguard Group; Treasurer of each of |
| Occupation(s) During the Past Five Years: Chief | the investment companies served by The Vanguard |
| Investment Officer and Vice President at the University | Group (1998–2008). | |
| of Notre Dame; Assistant Professor of Finance at the | | |
| Mendoza College of Business at Notre Dame; Member | Kathryn J. Hyatt | |
| of the Notre Dame 403(b) Investment Committee; | Born 1955. Treasurer Since November 2008. Principal |
| Board Member of TIFF Advisory Services, Inc. | Occupation(s) During the Past Five Years: Principal of |
| (investment advisor); Member of the Investment | The Vanguard Group, Inc.; Treasurer of each of the |
| Advisory Committees of the Financial Industry | investment companies served by The Vanguard |
| Regulatory Authority (FINRA) and of Major League | Group; Assistant Treasurer of each of the investment |
| Baseball. | companies served by The Vanguard Group (1988–2008). |
| |
| André F. Perold | Heidi Stam | |
| Born 1952. Trustee Since December 2004. Principal | Born 1956. Secretary Since July 2005. Principal |
| Occupation(s) During the Past Five Years: George | Occupation(s) During the Past Five Years: Managing |
| Gund Professor of Finance and Banking, Emeritus | Director of The Vanguard Group, Inc.; General Counsel |
| at the Harvard Business School (retired 2011); | of The Vanguard Group; Secretary of The Vanguard |
| Chief Investment Officer and Managing Partner of | Group and of each of the investment companies |
| HighVista Strategies LLC (private investment firm); | served by The Vanguard Group; Director and Senior |
| Director of Rand Merchant Bank; Overseer of the | Vice President of Vanguard Marketing Corporation. |
| Museum of Fine Arts Boston. | | |
| | Vanguard Senior ManagementTeam |
| Alfred M. Rankin, Jr. | | |
| Born 1941. Trustee Since January 1993. Principal | Mortimer J. Buckley | Chris D. McIsaac |
| Occupation(s) During the Past Five Years: Chairman, | Kathleen C. Gubanich | Michael S. Miller |
| President, and Chief Executive Officer of NACCO | Paul A. Heller | James M. Norris |
| Industries, Inc. (housewares/lignite), and of Hyster- | Martha G. King | Glenn W. Reed |
| Yale Materials Handling, Inc. (forklift trucks); Chairman | John T. Marcante | |
| of the Board of University Hospitals of Cleveland. | | |
| |
| Peter F. Volanakis | Chairman Emeritus and Senior Advisor |
| Born 1955. Trustee Since July 2009. Principal | | |
| Occupation(s) During the Past Five Years: President | John J. Brennan | |
| and Chief Operating Officer (retired 2010) of Corning | Chairman, 1996–2009 | |
| Incorporated (communications equipment); Trustee of | Chief Executive Officer and President, 1996–2008 |
| Colby-Sawyer College; Member of the Advisory Board | | |
| of the Norris Cotton Cancer Center and of the Advisory | | |
| Board of the Parthenon Group (strategy consulting). | Founder | |
| | John C. Bogle | |
| | Chairman and Chief Executive Officer, 1974–1996 |
1 Mr. McNabb is considered an “interested person,” as defined in the Investment Company Act of 1940, because he is an officer of the
Vanguard funds.
2 December 2002 for Vanguard Equity Income Fund, Vanguard Growth Equity Fund, the Vanguard Municipal Bond Funds, and the Vanguard
State Tax-Exempt Funds.
|  |
| | P.O. Box 2600 |
| | Valley Forge, PA 19482-2600 |
| |
| |
| |
| Connect with Vanguard® > vanguard.com | |
| |
| |
| |
| Fund Information > 800-662-7447 | “Dividend Achievers” is a trademark of The NASDAQ |
| Direct Investor Account Services > 800-662-2739 | OMX Group, Inc. (collectively, with its affiliates |
| | “NASDAQ OMX”), and has been licensed for use by The |
| Institutional Investor Services > 800-523-1036 | Vanguard Group, Inc. Vanguard mutual funds are not |
| Text Telephone for People | sponsored, endorsed, sold, or promoted by NASDAQ |
| With Hearing Impairment > 800-749-7273 | OMX and NASDAQ OMX makes no representation |
| | regarding the advisability of investing in the funds. |
| This material may be used in conjunction | NASDAQ OMX makes no warranties and bears no |
| with the offering of shares of any Vanguard | liability with respect to the Vanguard mutual funds. |
| fund only if preceded or accompanied by | |
| the fund’s current prospectus. | |
| |
| All comparative mutual fund data are from Lipper, a | |
| Thomson Reuters Company, or Morningstar, Inc., unless | |
| otherwise noted. | |
| |
| You can obtain a free copy of Vanguard’s proxy voting | |
| guidelines by visiting vanguard.com/proxyreporting or by | |
| calling Vanguard at 800-662-2739. The guidelines are | |
| also available from the SEC’s website, sec.gov. In | |
| addition, you may obtain a free report on how your fund | |
| voted the proxies for securities it owned during the 12 | |
| months ended June 30. To get the report, visit either | |
| vanguard.com/proxyreporting or sec.gov. | |
| |
| You can review and copy information about your fund at | |
| the SEC’s Public Reference Room in Washington, D.C. To | |
| find out more about this public service, call the SEC at | |
| 202-551-8090. Information about your fund is also | |
| available on the SEC’s website, and you can receive | |
| copies of this information, for a fee, by sending a | |
| request in either of two ways: via e-mail addressed to | |
| publicinfo@sec.gov or via regular mail addressed to the | |
| Public Reference Section, Securities and Exchange | |
| Commission, Washington, DC 20549-1520. | |
| |
| | © 2014 The Vanguard Group, Inc. |
| | All rights reserved. |
| | Vanguard Marketing Corporation, Distributor. |
| |
| | Q6020 032014 |

Annual Report | January 31, 2014
Vanguard REIT Index Fund

Vanguard’s Principles for Investing Success
We want to give you the best chance of investment success. These principles,
grounded in Vanguard’s research and experience, can put you on the right path.
Goals. Create clear, appropriate investment goals.
Balance. Develop a suitable asset allocation using broadly diversified funds.
Cost. Minimize cost.
Discipline. Maintain perspective and long-term discipline.
A single theme unites these principles: Focus on the things you can control.
We believe there is no wiser course for any investor.
| |
| Contents | |
| Your Fund’s Total Returns. | 1 |
| Chairman’s Letter. | 2 |
| Fund Profile. | 9 |
| Performance Summary. | 10 |
| Financial Statements. | 13 |
| Your Fund’s After-Tax Returns. | 34 |
| About Your Fund’s Expenses. | 35 |
| Glossary. | 37 |

REIT Index Fund
Please note: The opinions expressed in this report are just that—informed opinions. They should not be considered promises or advice.
Also, please keep in mind that the information and opinions cover the period through the date on the front of this report. Of course, the
risks of investing in your fund are spelled out in the prospectus.
See the Glossary for definitions of investment terms used in this report.
About the cover: The ship’s wheel represents leadership and guidance, essential qualities in navigating difficult seas.
This one is a replica based on an 18th-century British vessel. The HMSVanguard, another ship of that era, served as the
flagship for British Admiral Horatio Nelson when he defeated a French fleet at the Battle of the Nile.
Your Fund’s Total Returns
| |
| Fiscal Year Ended January 31, 2014 | |
| |
| | Total |
| | Returns |
| Vanguard REIT Index Fund | |
| Investor Shares | 2.78% |
| Admiral™ Shares | 2.94 |
| Signal® Shares | 2.90 |
| Institutional Shares | 2.97 |
| ETF Shares | |
| Market Price | 2.84 |
| Net Asset Value | 2.93 |
| MSCI US REIT Index | 2.99 |
| Real Estate Funds Average | 1.73 |
| Real Estate Funds Average: Derived from data provided by Lipper, a Thomson Reuters Company. |
Admiral Shares carry lower expenses and are available to investors who meet certain account-balance requirements. Signal Shares and Institutional Shares are available to certain institutional investors who meet specific administrative, service, and account-size criteria. The Vanguard ETF® Shares shown are traded on the NYSE Arca exchange and are available only through brokers. The table provides ETF returns based on both the NYSE Arca market price and the net asset value for a share. U.S. Pat. Nos. 6,879,964; 7,337,138; 7,720,749; 7,925,573; 8,090,646; and 8,417,623.
For the ETF Shares, the market price is determined by the midpoint of the bid-offer spread as of the closing time of the New York Stock Exchange (generally 4 p.m., Eastern time). The net asset value is also determined as of the NYSE closing time. For more information about how the ETF Shares' market prices have compared with their net asset value, visit vanguard.com, select your ETF, and then select the Price and Performance tab. The ETF premium/discount analysis there shows the percentages of days on which the ETF Shares' market price was above or below the NAV.
Your Fund’s Performance at a Glance
January 31, 2013, Through January 31, 2014
| | | | | |
| | | | Distributions Per Share | |
| | Starting | Ending | | | |
| | Share | Share | Income | Capital | Return of |
| | Price | Price | Dividends | Gains | Capital |
| Vanguard REIT Index Fund | | | | | |
| Investor Shares | $22.66 | $22.37 | $0.626 | $0.000 | $0.268 |
| Admiral Shares | 96.70 | 95.46 | 2.772 | 0.000 | 1.185 |
| Signal Shares | 25.82 | 25.48 | 0.741 | 0.000 | 0.316 |
| Institutional Shares | 14.97 | 14.78 | 0.431 | 0.000 | 0.184 |
| ETF Shares | 68.24 | 67.36 | 1.955 | 0.000 | 0.836 |
1

Chairman’s Letter
Dear Shareholder,
For the 12 months ended January 31, 2014, the performance of real estate investment trusts (REITs) was a notable exception to the healthy returns produced by nearly every sector and slice of the U.S. stock market.
Vanguard REIT Index Fund returned 2.78% for Investor Shares—a modest outcome, especially compared with the broad market’s robust advance—as rising interest rates pinched REITs. The fund’s result was in line with its benchmark index and about 1 percentage point ahead of the average return of its peers.
The tepid performance was a significant departure from recent years, when the returns of REITs outpaced or closely approached those of the broader market.
Please note that on October 16, we announced plans to streamline Vanguard’s share-class offerings by phasing out Signal Shares. Your fund’s Signal Shares will be converted to Admiral Shares by October 2014.
U.S. stocks found a groove before January volatility set in U.S. stocks delivered generous returns in 2013, then slid over the first month of the new year. For the 12 months ended January 31, U.S. stocks produced an impressive gain of nearly 23% despite the late reversal.
2
Strong corporate earnings growth and investors’ willingness to pay for those earnings drove stock markets, which were also buoyed by the Federal Reserve’s stimulative bond-buying program. The Fed, noting the economy’s improvement, began paring back its bond purchases in January. Nevertheless, stocks declined over that month as investors worried about economic developments at home and abroad.
Overall, international stocks advanced about 6% for the 12 months; developed markets in Europe and the Pacific region posted gains, but concerns about China’s weaker economy hurt stocks and currencies in various emerging-market countries. Worries about emerging markets underlay much of the U.S. market’s January decline.
For 2014, Vanguard Chief Economist Joe Davis and his team are guarded in their outlook for global stock returns, and their forecast for the bond market remains muted. Although Joe readily acknowledges that such forecasts are accompanied by uncertainty, he writes, “We believe that a long-term, strategic approach with a balanced, diversified, low-cost portfolio can remain a high-value proposition in the decade ahead.” (You can read more about our expectations for bond and stock returns in Vanguard’s Economic and Investment Outlook, available at vanguard.com/research.)
| | | |
| Market Barometer | | | |
| |
| | Average Annual Total Returns |
| | Periods Ended January 31, 2014 |
| | One | Three | Five |
| | Year | Years | Years |
| Stocks | | | |
| Russell 1000 Index (Large-caps) | 22.23% | 14.14% | 19.84% |
| Russell 2000 Index (Small-caps) | 27.03 | 14.69 | 22.26 |
| Russell 3000 Index (Broad U.S. market) | 22.60 | 14.18 | 20.03 |
| FTSE All-World ex US Index (International) | 5.78 | 3.37 | 14.38 |
| |
| Bonds | | | |
| Barclays U.S. Aggregate Bond Index (Broad taxable market) | 0.12% | 3.73% | 4.93% |
| Barclays Municipal Bond Index (Broad tax-exempt market) | -1.07 | 5.76 | 5.54 |
| Citigroup Three-Month U.S. Treasury Bill Index | 0.05 | 0.06 | 0.09 |
| |
| CPI | | | |
| Consumer Price Index | 1.58% | 2.03% | 2.07% |
3
Bond returns were flat as the Fed firmed its strategy
Investors spurned bonds for most of the 12-month period, wary of the Fed’s expected curtailment of its bond-buying program. In January, however, despite the start of that tapering, fixed income investments regained appeal as stocks slumped.
The broad U.S. taxable bond market returned 0.12% for the 12 months, while municipal bonds posted returns of –1.07%. The yield of the benchmark 10-year Treasury note generally increased during the fiscal year, eclipsing 3.00% at times, and finished at about 2.70%. (Bond prices and yields move in opposite directions.)
International bond markets (as measured by the Barclays Global Aggregate Index ex USD) returned –1.24%. The Fed’s continued target of 0%–0.25% for short-term interest rates tightly restricted returns of money market funds and savings accounts.
A rise in bond yields curbed results for REITs
In general, the various companies that make up the real estate ecosystem––developers, property managers, sales organizations, and landlords—generated strong revenues and income during the fiscal year. However, as I mentioned at the beginning of this letter, rising interest rates diminished the return of REITs, which had an impressive four-year run before the recent downturn.
| | | | | | |
| Expense Ratios | | | | | | |
| Your Fund Compared With Its Peer Group | | | | | | |
| | | | | | | Peer |
| | Investor | Admiral | Signal | Institutional | ETF | Group |
| | Shares | Shares | Shares | Shares | Shares | Average |
| REIT Index Fund | 0.24% | 0.10% | 0.10% | 0.08% | 0.10% | 1.30% |
The fund expense ratios shown are from the prospectus dated May 28, 2013, and represent estimated costs for the current fiscal year. For the
fiscal year ended January 31, 2014, the fund’s expense ratios were 0.24% for Investor Shares, 0.10% for Admiral Shares, 0.10% for Signal
Shares, 0.08% for Institutional Shares, and 0.10% for ETF Shares. The peer-group expense ratio is derived from data provided by Lipper, a
Thomson Reuters Company, and captures information through year-end 2013.
Peer group: Real Estate Funds.
4
Bond yields, after falling for several years, rose noticeably over the period. The rise in interest rates led REITs to reverse course in the spring and sink during the rest of 2013. The yield of the 10-year Treasury note, which began the fiscal year at 1.99%, stood at 2.97% on December 31. In January, however, it retreated again, and REITs advanced about 4% for the month.
Rising interest rates can hurt REITs in several ways. These companies are required to pay out at least 90% of their income as dividends to their investors. Consequently, they rely heavily on the markets to raise cash to finance growth. But rising rates make capital more expensive, cutting into REITs’ profit margins. Their dividends also face more competition from other income-generating investments, including bonds—which typically carry less risk than REITs do—when those assets are offering higher yields.
Although REITs performed modestly for the most part, no segment of the sector declined. Specialized REITs, which made up nearly 30% of the fund on average during the period, returned about 4%. Leading the category were hotels, which benefited from a postrecession rebound in travel, and storage facilities, which tend to have short-term leases and so can easily raise their rental income.
| |
| Total Returns | |
| Ten Years Ended January 31, 2014 | |
| | Average |
| | Annual Return |
| REIT Index Fund Investor Shares | 8.45% |
| REIT Spliced Index | 8.51 |
| Real Estate Funds Average | 7.66 |
For a benchmark description, see the Glossary.
Real Estate Funds Average: Derived from data provided by Lipper, a Thomson Reuters Company.
The figures shown represent past performance, which is not a guarantee of future results. (Current performance may be
lower or higher than the performance data cited. For performance data current to the most recent month-end, visit our
website at vanguard.com/performance.) Note, too, that both investment returns and principal value can fluctuate widely, so
an investor’s shares, when sold, could be worth more or less than their original cost.
5
Retail REITs, the fund’s second-largest subsector, returned less than 2% as rising interest rates restrained shopping center and mall operators. Despite the January rally, residential REITs posted a fiscal-year return of less than 1%. Within that group, REITs that invest in manufactured housing benefited from increased demand. But those that own apartments, particularly student housing, tumbled as long-term leases prevented their yields from rising as fast as those of some other REITs. Office REITs managed a return of about 3% as companies slowly started hiring again.
REITs’ ten-year returns exceeded those of the broader stock market
Over the decade ended January 31, 2014, the REIT Index Fund posted an average annual return of 8.45% for Investor Shares. REITs, despite their subpar performance over the latest fiscal year and major difficulties during the 2008–2009 financial crisis, outpaced the broader market by about 1 percentage point over the decade. Your fund’s ten-year return also exceeded the average for its peer group.
In addition, the fund met its goal of closely tracking its benchmark index, a tribute to the experience and skill of the portfolio’s advisor, Vanguard Equity Investment Group. The advisor’s efforts were helped by the portfolio’s low expenses.
The power of compounding can put time on your side
The purpose of my annual letter to you is, of course, to report on how your fund fared over the past year. But although it’s important to be aware of how your fund is doing in the latest market environment, short-term performance isn’t what matters most. The focus on the preceding 12 months shouldn’t distract investors from the long-term commitment they need to help achieve their goals.
To be sure, there are many aspects of investing success that you can’t control, overall market performance being the obvious example. But you can control how long you invest, and that’s important because it allows you to harness the power of compounding—the snowball effect that occurs when your earnings generate even more earnings. As Benjamin Franklin put it, “Money makes money.”
A simple example illustrates the benefits of compounding that can potentially result from investing and then reinvesting your money over the long haul. Suppose you were able to put away $10,000 and earn 6% a year. (Keep in mind this is hypothetical; actual returns would probably be different, and certainly a lot less predictable.)
6
|
| Beware of chasing a sector’s ups and downs |
| |
| Funds that focus on a single sector—as Vanguard REIT Index Fund does—can be more volatile |
| than more broadly diversified funds. Sector funds can soar one year and plunge the next. |
| This tendency toward volatility can stir up investors’ worst instincts, tempting them to invest |
| during times of strong performance and to bail as prices inevitably recede. |
| |
| As we all know, buying high and selling low hurts performance. Because many sector fund |
| investors do fall prey to the temptation to jump in and out of the market, the average annual |
| return experienced by sector fund investors (the “investor return”) is often lower than the |
| average annual total return of the funds themselves over the same period.1 |
| |
| The chart below will give you an idea of the price that sector fund investors can pay for chasing |
| performance. It compares the average annual total returns for real estate funds with the |
| average annual investor returns for these funds for recent three-, five-, and ten-year periods. |
| |
| While sector funds can play a valuable supplemental role in your portfolio, you shouldn’t let |
| their inherent volatility affect your level of investment in them. |
| |
| Real estate funds: Their returns vs. their investors’ returns |
| Periods ended December 31, 2013 |
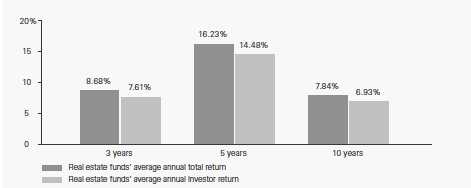
| Notes: Fund averages assume all distributions were reinvested. All returns were calculated on a month-end basis. |
| Source: Vanguard calculations, derived from data provided by Morningstar, Inc. |
| |
| 1 The investor return is based on a money-weighted calculation that takes into account the timing of investors’ cash inflows and outflows. |
7
If you keep reinvesting the earnings (again, assuming a hypothetical 6% yearly return), after ten years you would have almost $18,000. After 30 years, you would have more than $57,000.
Compounding can make a real difference in your account balance over time—particularly when combined with Vanguard’s low expense ratios—which allow you to keep more of the return on your investment.
As always, thank you for entrusting your assets to Vanguard.
Sincerely,

F. William McNabb III
Chairman and Chief Executive Officer
February 18, 2014
8
REIT Index Fund
Fund Profile
As of January 31, 2014
| | | | | |
| Share-Class Characteristics | | | | | |
| | Investor | Admiral | Signal | Institutional | |
| | Shares | Shares | Shares | Shares | ETF Shares |
| Ticker Symbol | VGSIX | VGSLX | VGRSX | VGSNX | VNQ |
| Expense Ratio1 | 0.24% | 0.10% | 0.10% | 0.08% | 0.10% |
| | | |
| Portfolio Characteristics | | |
| | | | DJ |
| | | | U.S. |
| | | | Total |
| | | | Market |
| | | MSCI US | FA |
| | Fund | REIT Index | Index |
| Number of Stocks | 131 | 130 | 3,635 |
| Median Market Cap | $7.8B | $7.8B | $41.3B |
| Price/Earnings Ratio | 51.2x | 51.2x | 19.1x |
| Price/Book Ratio | 2.1x | 2.1x | 2.6x |
| Return on Equity | 5.0% | 5.0% | 16.5% |
| Earnings Growth | | | |
| Rate | 8.3% | 8.3% | 11.4% |
| Dividend Yield | 4.0% | 4.0% | 1.9% |
| Foreign Holdings | 0.0% | 0.0% | 0.0% |
| Turnover Rate | 11% | — | — |
| Short-Term Reserves | 0.0% | — | — |
| Dividend Yield: This yield may include some payments that represent a return of capital, capital gains distributions, or both by |
| the underlying REITs. These amounts are determined by each REIT at the end of its fiscal year. |
| | |
| Subindustry Diversification (% of equity exposure) |
| | | MSCI US |
| | Fund | REIT Index |
| Diversified REITs | 8.9% | 8.4% |
| Industrial REITs | 5.1 | 5.1 |
| Office REITs | 13.7 | 13.7 |
| Residential REITs | 16.2 | 16.2 |
| Retail REITs | 26.9 | 27.4 |
| Specialized REITs | 29.2 | 29.2 |
| | |
| Volatility Measures | | |
| | | DJ |
| | | U.S. Total |
| | MSCI US | Market |
| | REIT Index | FA Index |
| R-Squared | 1.00 | 0.48 |
| Beta | 1.00 | 0.90 |
| These measures show the degree and timing of the fund’s fluctuations compared with the indexes over 36 months. |
| | |
| Ten Largest Holdings (% of total net assets) |
| Simon Property Group | | |
| Inc. | Retail REITs | 9.3% |
| Public Storage | Specialized REITs | 4.5 |
| Prologis Inc. | Industrial REITs | 3.7 |
| Equity Residential | Residential REITs | 3.7 |
| Ventas Inc. | Specialized REITs | 3.5 |
| HCP Inc. | Specialized REITs | 3.5 |
| Health Care REIT Inc. | Specialized REITs | 3.2 |
| Boston Properties Inc. | Office REITs | 3.2 |
| Vornado Realty Trust | Diversified REITs | 3.0 |
| AvalonBay Communities | | |
| Inc. | Residential REITs | 2.9 |
| Top Ten | | 40.5% |
| The holdings listed exclude any temporary cash investments and equity index products. |
1 The expense ratios shown are from the prospectus dated May 28, 2013, and represent estimated costs for the current fiscal year. For the fiscal
year ended January 31, 2014, the expense ratios were 0.24% for Investor Shares, 0.10% for Admiral Shares, 0.10% for Signal Shares, 0.08% for
Institutional Shares, and 0.10% for ETF Shares.
9
REIT Index Fund
Performance Summary
All of the returns in this report represent past performance, which is not a guarantee of future results that may be achieved by the fund. (Current performance may be lower or higher than the performance data cited. For performance data current to the most recent month-end, visit our website at vanguard.com/performance.) Note, too, that both investment returns and principal value can fluctuate widely, so an investor’s shares, when sold, could be worth more or less than their original cost. The returns shown do not reflect taxes that a shareholder would pay on fund distributions or on the sale of fund shares.
Cumulative Performance: January 31, 2004, Through January 31, 2014
Initial Investment of $10,000
| | | | | |
| | | | Average Annual Total Returns | |
| | | Periods Ended January 31, 2014 | |
| | | | | | Final Value |
| | | One | Five | Ten | of a $10,000 |
| | | Year | Years | Years | Investment |
| | REIT Index Fund*Investor Shares | 2.78% | 22.29% | 8.45% | $22,514 |
| •••••••• | REIT Spliced Index | 2.99 | 22.40 | 8.51 | 22,637 |
| – – – – | Real Estate Funds Average | 1.73 | 21.45 | 7.66 | 20,917 |
| | Dow Jones U.S. Total Stock Market | | | | |
| | Float Adjusted Index | 22.53 | 20.13 | 7.51 | 20,637 |
| For a benchmark description, see the Glossary. |
| Real Estate Funds Average: Derived from data provided by Lipper, a Thomson Reuters Company. |
| | | | |
| | | | | Final Value |
| | One | Five | Ten | of a $10,000 |
| | Year | Years | Years | Investment |
| REIT Index Fund Admiral Shares | 2.94% | 22.47% | 8.57% | $22,755 |
| REIT Spliced Index | 2.99 | 22.40 | 8.51 | 22,637 |
| Dow Jones U.S. Total Stock Market Float | | | | |
| Adjusted Index | 22.53 | 20.13 | 7.51 | 20,637 |
See Financial Highlights for dividend and capital gains information.
10
REIT Index Fund
| | | | |
| | Average Annual Total Returns | |
| | Periods Ended January 31, 2014 | |
| | | | Since | Final Value |
| | One | Five | Inception | of a $10,000 |
| | Year | Years | (6/4/2007) | Investment |
| REIT Index Fund Signal Shares | 2.90% | 22.46% | 2.19% | $11,554 |
| REIT Spliced Index | 2.99 | 22.40 | 2.11 | 11,490 |
| Dow Jones U.S. Total Stock Market Float | | | | |
| Adjusted Index | 22.53 | 20.13 | 5.00 | 13,843 |
| "Since Inception" performance is calculated from the Signal Shares’ inception date for both the fund and its comparative standards. |
| | | | |
| | | | | Final Value |
| | One | Five | Ten | of a $5,000,000 |
| | Year | Years | Years | Investment |
| |
| REIT Index Fund Institutional Shares | 2.97% | 22.53% | 8.60% | $11,410,020 |
| |
| REIT Spliced Index | 2.99 | 22.40 | 8.51 | 11,318,260 |
| Dow Jones U.S. Total Stock Market Float | | | | |
| Adjusted Index | 22.53 | 20.13 | 7.51 | 10,318,609 |
| | | | |
| | | | Since | Final Value |
| | One | Five | Inception | of a $10,000 |
| | Year | Years | (9/23/2004) | Investment |
| REIT Index Fund | | | | |
| ETF Shares Net Asset Value | 2.93% | 22.46% | 8.38% | $21,236 |
| REIT Spliced Index | 2.99 | 22.40 | 8.32 | 21,116 |
| Dow Jones U.S. Total Stock Market Float | | | | |
| Adjusted Index | 22.53 | 20.13 | 8.15 | 20,808 |
| "Since Inception" performance is calculated from the ETF Shares’ inception date for both the fund and its comparative standards. |
| | | |
| Cumulative Returns of ETF Shares: September 23, 2004, Through January 31, 2014 | |
| | | | Since |
| | One | Five | Inception |
| | Year | Years | (9/23/2004) |
| REIT Index Fund ETF Shares Market Price | 2.84% | 173.75% | 112.21% |
| REIT Index Fund ETF Shares Net Asset Value | 2.93 | 175.43 | 112.36 |
| REIT Spliced Index | 2.99 | 174.77 | 111.16 |
| "Since Inception" performance is calculated from the ETF Shares’ inception date for both the fund and its comparative standards. |
11
REIT Index Fund
Fiscal-Year Total Returns (%): January 31, 2004, Through January 31, 2014
For a benchmark description, see the Glossary.
Average Annual Total Returns: Periods Ended December 31, 2013
This table presents returns through the latest calendar quarter—rather than through the end of the fiscal period.
Securities and Exchange Commission rules require that we provide this information.
| | | | |
| | Inception | One | Five | Ten |
| | Date | Year | Years | Years |
| Investor Shares | 5/13/1996 | 2.31% | 16.74% | 8.46% |
| Admiral Shares | 11/12/2001 | 2.42 | 16.89 | 8.58 |
| Signal Shares | 6/4/2007 | 2.43 | 16.91 | 1.581 |
| Institutional Shares | 12/2/2003 | 2.48 | 16.93 | 8.62 |
| ETF Shares | 9/23/2004 | | | |
| Market Price | | 2.34 | 16.92 | 7.971 |
| Net Asset Value | | 2.42 | 16.89 | 7.981 |
| 1 Return since inception. |
12
REIT Index Fund
Financial Statements
Statement of Net Assets
As of January 31, 2014
The fund reports a complete list of its holdings in regulatory filings four times in each fiscal year, at the quarter-ends. For the second and fourth fiscal quarters, the lists appear in the fund’s semiannual and annual reports to shareholders. For the first and third fiscal quarters, the fund files the lists with the Securities and Exchange Commission on Form N-Q. Shareholders can look up the fund’s Forms N-Q on the SEC’s website at sec.gov. Forms N-Q may also be reviewed and copied at the SEC’s Public Reference Room (see the back cover of this report for further information).
| | | |
| | | | Market |
| | | | Value |
| | | Shares | ($000) |
| Real Estate Investment Trusts (100.0%) | |
| Diversified REITs (8.9%) | | |
| 1 | Vornado Realty Trust | 11,492,343 | 1,055,342 |
| 1 | Liberty Property Trust | 9,756,496 | 355,136 |
| 1 | Duke Realty Corp. | 22,196,077 | 348,700 |
| 1 | Spirit Realty Capital Inc. | 24,030,230 | 254,720 |
| ^,1 | American Realty Capital | | |
| | Properties Inc. | 12,626,086 | 174,745 |
| 1 | Lexington Realty Trust | 13,298,497 | 143,757 |
| 1 | Cousins Properties Inc. | 11,721,894 | 126,010 |
| | WP Carey Inc. | 2,096,835 | 123,881 |
| 1 | PS Business Parks Inc. | 1,364,953 | 107,244 |
| 1 | Washington REIT | 4,541,173 | 105,809 |
| 1 | American Assets | | |
| | Trust Inc. | 2,347,701 | 78,578 |
| 1 | Investors Real | | |
| | Estate Trust | 7,070,870 | 61,446 |
| | Select Income REIT | 2,040,270 | 56,311 |
| 1 | First Potomac | | |
| | Realty Trust | 4,008,018 | 52,345 |
| 1 | RAIT Financial Trust | 5,562,525 | 46,948 |
| 1 | Winthrop Realty Trust | 2,233,343 | 25,639 |
| 1 | Whitestone REIT | 1,454,699 | 19,857 |
| 1 | One Liberty Properties Inc. | 848,980 | 17,710 |
| | | | 3,154,178 |
| Industrial REITs (5.1%) | | |
| *,1 | Prologis Inc. | 34,048,836 | 1,319,733 |
| 1 | DCT Industrial Trust Inc. | 21,399,385 | 154,075 |
| 1 | EastGroup Properties Inc. | 2,079,051 | 123,371 |
| 1 | First Industrial Realty | | |
| | Trust Inc. | 7,133,603 | 122,413 |
| 1 | STAG Industrial Inc. | 2,891,362 | 62,049 |
| 1 | Monmouth Real | | |
| | Estate Investment | | |
| | Corp. Class A | 2,672,996 | 24,698 |
| | | | 1,806,339 |
| Office REITs (13.7%) | | |
| 1 | Boston Properties Inc. | 10,406,436 | 1,124,832 |
| 1 | SL Green Realty Corp. | 6,280,966 | 588,966 |
| ^,1 | Digital Realty Trust Inc. | 8,770,118 | 447,188 |
| | | |
| 1 | Alexandria Real Estate | | |
| | Equities Inc. | 4,878,496 | 342,129 |
| 1 | Kilroy Realty Corp. | 5,561,229 | 293,633 |
| 1 | BioMed Realty Trust Inc. | 13,119,918 | 255,970 |
| 1 | Douglas Emmett Inc. | 9,251,012 | 235,253 |
| 1 | Highwoods Properties Inc. 6,063,970 | 225,216 |
| 1 | CommonWealth REIT | 8,079,496 | 198,594 |
| 1 | Piedmont Office Realty | | |
| | Trust Inc. Class A | 11,362,048 | 189,405 |
| 1 | Brandywine Realty Trust 10,701,071 | 152,490 |
| 1 | Corporate Office | | |
| | Properties Trust | 5,965,501 | 148,243 |
| 1 | Mack-Cali Realty Corp. | 5,709,631 | 115,506 |
| 1 | DuPont Fabros | | |
| | Technology Inc. | 4,418,467 | 114,836 |
| 1 | Government Properties | | |
| | Income Trust | 3,733,594 | 92,220 |
| | Parkway Properties Inc. | 4,671,875 | 82,879 |
| 1 | Hudson Pacific | | |
| | Properties Inc. | 3,593,358 | 78,084 |
| 1 | Franklin Street | | |
| | Properties Corp. | 6,157,937 | 73,834 |
| 1 | CoreSite Realty Corp. | 1,462,173 | 44,859 |
| 1 | CyrusOne Inc. | 1,128,525 | 24,387 |
| | | | 4,828,524 |
| Residential REITs (16.2%) | | |
| 1 | Equity Residential | 23,376,281 | 1,294,578 |
| 1 | AvalonBay | | |
| | Communities Inc. | 8,394,856 | 1,036,765 |
| 1 | UDR Inc. | 17,122,757 | 416,768 |
| 1 | Essex Property Trust Inc. | 2,597,217 | 411,321 |
| 1 | Camden Property Trust | 5,822,378 | 359,939 |
| 1 | Mid-America Apartment | | |
| | Communities Inc. | 5,102,426 | 329,311 |
| 1 | BRE Properties Inc. | 5,269,543 | 311,430 |
| 1 | Apartment Investment & | | |
| | Management Co. | | |
| | Class A | 9,963,728 | 278,685 |
| 1 | American Campus | | |
| | Communities Inc. | 7,155,308 | 248,719 |
13
REIT Index Fund
| | | |
| | | | Market |
| | | | Value |
| | | Shares | ($000) |
| 1 | Home Properties Inc. | 3,883,355 | 216,497 |
| 1 | Equity Lifestyle | | |
| | Properties Inc. | 5,407,460 | 212,567 |
| 1 | Post Properties Inc. | 3,729,162 | 175,010 |
| 1 | Sun Communities Inc. | 2,342,518 | 109,513 |
| 1 | Education Realty | | |
| | Trust Inc. | 7,840,549 | 70,800 |
| | American Homes 4 | | |
| | Rent Class A | 3,790,812 | 63,231 |
| 1 | Associated Estates | | |
| | Realty Corp. | 3,445,586 | 55,026 |
| 1 | Silver Bay Realty | | |
| | Trust Corp. | 2,552,309 | 40,505 |
| 1 | Campus Crest | | |
| | Communities Inc. | 4,408,524 | 38,927 |
| *,1 | American Residential | | |
| | Properties Inc. | 2,084,165 | 38,557 |
| | | | 5,708,149 |
| Retail REITs (26.9%) | | |
| 1 | Simon Property | | |
| | Group Inc. | 21,191,347 | 3,281,268 |
| | General Growth | | |
| | Properties Inc. | 33,015,651 | 664,935 |
| 1 | Kimco Realty Corp. | 27,973,478 | 584,925 |
| ^,1 | Realty Income Corp. | 13,395,974 | 546,288 |
| 1 | Macerich Co. | 9,597,019 | 543,191 |
| 1 | Federal Realty | | |
| | Investment Trust | 4,486,190 | 488,995 |
| ^,1 | Cole Real Estate | | |
| | Investment Inc. | 32,054,425 | 485,625 |
| 1 | Regency Centers Corp. | 6,302,428 | 303,399 |
| 1 | DDR Corp. | 18,581,377 | 291,170 |
| 1 | Taubman Centers Inc. | 4,359,443 | 283,451 |
| ^,1 | National Retail | | |
| | Properties Inc. | 8,275,937 | 274,761 |
| 1 | Weingarten Realty | | |
| | Investors | 7,910,158 | 229,316 |
| 1 | Tanger Factory | | |
| | Outlet Centers | 6,448,178 | 215,240 |
| 1 | CBL & Associates | | |
| | Properties Inc. | 11,022,451 | 187,272 |
| 1 | Retail Properties of | | |
| | America Inc. | 12,820,555 | 169,103 |
| | Equity One Inc. | 4,482,654 | 101,577 |
| 1 | Acadia Realty Trust | 3,786,522 | 96,367 |
| *,1 | Pennsylvania REIT | 4,653,676 | 86,791 |
| 1 | Glimcher Realty Trust | 9,904,445 | 84,782 |
| 1 | Ramco-Gershenson | | |
| | Properties Trust | 4,546,509 | 72,608 |
| 1 | Retail Opportunity | | |
| | Investments Corp. | 4,906,507 | 70,948 |
| 1 | Inland Real Estate Corp. | 6,124,060 | 64,548 |
| 1 | Kite Realty Group Trust | 8,594,973 | 55,438 |
| | Alexander’s Inc. | 156,940 | 53,333 |
| | Rouse Properties Inc. | 2,318,823 | 40,440 |
| | | |
| | Saul Centers Inc. | 832,510 | 38,795 |
| 1 | Excel Trust Inc. | 3,292,302 | 37,565 |
| 1 | Getty Realty Corp. | 1,821,386 | 34,606 |
| *,1 | Cedar Realty Trust Inc. | 5,070,578 | 31,995 |
| 1 | Agree Realty Corp. | 1,015,525 | 29,034 |
| | Urstadt Biddle | | |
| | Properties Inc. Class A | 1,534,443 | 28,786 |
| 1 | AmREIT Inc. | 1,271,514 | 20,700 |
| | Urstadt Biddle | | |
| | Properties Inc. | 69,255 | 1,093 |
| | | | 9,498,345 |
| Specialized REITs (29.2%) | | |
| 1 | Public Storage | 9,984,186 | 1,573,408 |
| 1 | Ventas Inc. | 20,024,031 | 1,249,299 |
| 1 | HCP Inc. | 31,125,850 | 1,218,577 |
| 1 | Health Care REIT Inc. | 19,553,321 | 1,132,528 |
| 1 | Host Hotels & | | |
| | Resorts Inc. | 51,218,232 | 941,903 |
| 1 | Extra Space Storage Inc. | 7,215,563 | 329,463 |
| 1 | Senior Housing | | |
| | Properties Trust | 12,844,099 | 289,249 |
| 1 | Corrections Corp. of | | |
| | America | 7,901,061 | 265,239 |
| 1 | Hospitality Properties | | |
| | Trust | 10,129,378 | 260,325 |
| ^,1 | Omega Healthcare | | |
| | Investors Inc. | 8,000,346 | 255,531 |
| 1 | LaSalle Hotel Properties | 7,030,883 | 216,270 |
| 1 | RLJ Lodging Trust | 7,543,236 | 188,430 |
| 1 | EPR Properties | 3,466,738 | 177,081 |
| 1 | Geo Group Inc. | 4,916,893 | 164,618 |
| 1 | Sunstone Hotel | | |
| | Investors Inc. | 12,487,920 | 160,220 |
| 1 | DiamondRock | | |
| | Hospitality Co. | 13,348,372 | 154,574 |
| 1 | Healthcare Realty | | |
| | Trust Inc. | 6,546,122 | 150,037 |
| 1 | Sovran Self Storage Inc. | 2,147,205 | 145,817 |
| 1 | Medical Properties | | |
| | Trust Inc. | 10,931,060 | 145,055 |
| 1 | CubeSmart | 8,765,838 | 144,461 |
| ^,1 | Ryman Hospitality | | |
| | Properties Inc. | 3,103,821 | 128,374 |
| 1 | Healthcare Trust of | | |
| | America Inc. Class A | 11,870,320 | 127,369 |
| 1 | Pebblebrook Hotel Trust | 4,205,696 | 126,718 |
| 1 | National Health | | |
| | Investors Inc. | 1,879,363 | 118,344 |
| *,1 | Strategic Hotels & | | |
| | Resorts Inc. | 11,228,066 | 104,533 |
| 1 | LTC Properties Inc. | 2,373,177 | 90,062 |
| 1 | Chesapeake | | |
| | Lodging Trust | 3,318,336 | 80,802 |
| 1 | Sabra Health Care | | |
| | REIT Inc. | 2,549,548 | 73,758 |
14
REIT Index Fund
| | | | |
| | | | | Market |
| | | | | Value |
| | | | Shares | ($000) |
| 1 | Hersha Hospitality Trust | | |
| | Class A | | 12,455,881 | 67,635 |
| 1 | FelCor Lodging Trust Inc. | 7,628,728 | 62,250 |
| 1 | Summit Hotel | | | |
| | Properties Inc. | | 5,545,252 | 49,408 |
| 1 | Ashford Hospitality | | | |
| | Trust Inc. | | 5,228,945 | 49,152 |
| 1 | Universal Health Realty | | |
| | Income Trust | | 824,646 | 34,965 |
| 1 | Ashford Hospitality | | | |
| | Prime Inc. | | 1,643,945 | 27,125 |
| | Aviv REIT Inc. | | 1,019,424 | 24,864 |
| | | | | 10,327,444 |
| Total Real Estate Investment Trusts | |
| (Cost $31,231,792) | | | 35,322,979 |
| Temporary Cash Investments (0.7%) | |
| Money Market Fund (0.7%) | | |
| 2,3 | Vanguard Market Liquidity | | |
| | Fund, 0.130% | 232,584,602 | 232,585 |
| |
| | | | Face | |
| | | | Amount | |
| | | | ($000) | |
| U.S. Government and Agency Obligations (0.0%) |
| 4 | Federal Home Loan Bank | | |
| | Discount Notes, | | | |
| | 0.085%, 2/12/14 | | 14,000 | 13,999 |
| Total Temporary Cash Investments | |
| (Cost $246,584) | | | 246,584 |
| Total Investments (100.7%) | | |
| (Cost $31,478,376) | | | 35,569,563 |
| Other Assets and Liabilities (-0.7%) | |
| Other Assets | | | 136,620 |
| Liabilities3 | | | (385,665) |
| | | | | (249,045) |
| Net Assets (100%) | | | 35,320,518 |
| |
| At January 31, 2014, net assets consisted of: |
| | Amount |
| | ($000) |
| Paid-in Capital | 31,743,733 |
| Overdistributed Net Investment Income | (24,149) |
| Accumulated Net Realized Losses | (490,253) |
| Unrealized Appreciation (Depreciation) | 4,091,187 |
| Net Assets | 35,320,518 |
| |
| |
| Investor Shares—Net Assets | |
| Applicable to 110,951,415 outstanding | |
| $.001 par value shares of beneficial | |
| interest (unlimited authorization) | 2,482,272 |
| Net Asset Value Per Share— | |
| Investor Shares | $22.37 |
| |
| |
| Admiral Shares—Net Assets | |
| Applicable to 83,663,132 outstanding | |
| $.001 par value shares of beneficial | |
| interest (unlimited authorization) | 7,986,644 |
| Net Asset Value Per Share— | |
| Admiral Shares | $95.46 |
| |
| |
| Signal Shares—Net Assets | |
| Applicable to 94,250,761 outstanding | |
| $.001 par value shares of beneficial | |
| interest (unlimited authorization) | 2,401,808 |
| Net Asset Value Per Share— | |
| Signal Shares | $25.48 |
15
REIT Index Fund
| |
| | Amount |
| | ($000) |
| Institutional Shares—Net Assets | |
| Applicable to 265,448,750 outstanding | |
| $.001 par value shares of beneficial | |
| interest (unlimited authorization) | 3,922,192 |
| Net Asset Value Per Share— | |
| Institutional Shares | $14.78 |
| |
| |
| ETF Shares—Net Assets | |
| Applicable to 275,054,244 outstanding | |
| $.001 par value shares of beneficial | |
| interest (unlimited authorization) | 18,527,602 |
| Net Asset Value Per Share— | |
| ETF Shares | $67.36 |
See Note A in Notes to Financial Statements.
^ Includes partial security positions on loan to broker-dealers. The total value of securities on loan is $225,567,000.
* Non-income-producing security.
1 Considered an affiliated company of the fund as the fund owns more than 5% of the outstanding voting securities of such company.
2 Affiliated money market fund available only to Vanguard funds and certain trusts and accounts managed by Vanguard. Rate shown is
the 7-day yield.
3 Includes $232,585,000 of collateral received for securities on loan.
4 The issuer operates under a congressional charter; its securities are generally neither guaranteed by the U.S. Treasury nor backed by
the full faith and credit of the U.S. government.
REIT—Real Estate Investment Trust.
See accompanying Notes, which are an integral part of the Financial Statements.
16
REIT Index Fund
Statement of Assets and Liabilities
As of January 31, 2014
| |
| | Amount |
| | ($000) |
| Assets | |
| Investments in Securities, at Value | |
| Unaffiliated Issuers | 1,294,124 |
| Affiliated Vanguard Funds | 232,585 |
| Other Affiliated Issuers | 34,042,854 |
| Total Investments in Securities | 35,569,563 |
| Receivables for Accrued Income | 38,644 |
| Receivables for Investment Securities Sold | 18,450 |
| Other Assets | 79,526 |
| Total Assets | 35,706,183 |
| Liabilities | |
| Securities Lending Collateral Payable to Brokers | 232,585 |
| Payables for Investment Securities Purchased | 65,813 |
| Other Liabilities | 87,267 |
| Total Liabilities | 385,665 |
| Net Assets | 35,320,518 |
See accompanying Notes, which are an integral part of the Financial Statements.
17
REIT Index Fund
Statement of Operations
| |
| | Year Ended |
| | January 31, 2014 |
| | ($000) |
| Investment Income | |
| Income | |
| Dividends1 | 955,610 |
| Interest1 | 291 |
| Securities Lending | 759 |
| Total Income | 956,660 |
| Expenses | |
| The Vanguard Group—Note B | |
| Investment Advisory Services | 1,872 |
| Management and Administrative—Investor Shares | 5,706 |
| Management and Administrative—Admiral Shares | 6,202 |
| Management and Administrative—Signal Shares | 1,570 |
| Management and Administrative—Institutional Shares | 1,827 |
| Management and Administrative—ETF Shares | 11,801 |
| Marketing and Distribution—Investor Shares | 665 |
| Marketing and Distribution—Admiral Shares | 1,171 |
| Marketing and Distribution—Signal Shares | 554 |
| Marketing and Distribution—Institutional Shares | 886 |
| Marketing and Distribution—ETF Shares | 4,590 |
| Custodian Fees | 276 |
| Auditing Fees | 34 |
| Shareholders’ Reports—Investor Shares | 46 |
| Shareholders’ Reports—Admiral Shares | 21 |
| Shareholders’ Reports—Signal Shares | 22 |
| Shareholders’ Reports—Institutional Shares | 17 |
| Shareholders’ Reports—ETF Shares | 567 |
| Trustees’ Fees and Expenses | 33 |
| Total Expenses | 37,860 |
| Net Investment Income | 918,800 |
| Realized Net Gain (Loss) | |
| Capital Gain Distributions Received | 226,529 |
| Investment Securities Sold | 1,095,312 |
| Swap Contracts | 29,738 |
| Realized Net Gain (Loss)1 | 1,351,579 |
| Change in Unrealized Appreciation (Depreciation) | |
| Investment Securities | (1,506,035) |
| Swap Contracts | (1,123) |
| Change in Unrealized Appreciation (Depreciation) | (1,507,158) |
| Net Increase (Decrease) in Net Assets Resulting from Operations | 763,221 |
| 1 Dividend income, interest income, and realized net gain (loss) from affiliated companies of the fund were $930,491,000, $271,000, and |
| $1,283,040, respectively. |
| See accompanying Notes, which are an integral part of the Financial Statements. |
18
REIT Index Fund
Statement of Changes in Net Assets
| | |
| | Year Ended January 31, |
| | 2014 | 2013 |
| | ($000) | ($000) |
| Increase (Decrease) in Net Assets | | |
| Operations | | |
| Net Investment Income | 918,800 | 668,720 |
| Realized Net Gain (Loss) | 1,351,579 | 623,632 |
| Change in Unrealized Appreciation (Depreciation) | (1,507,158) | 2,343,056 |
| Net Increase (Decrease) in Net Assets Resulting from Operations | 763,221 | 3,635,408 |
| Distributions | | |
| Net Investment Income | | |
| Investor Shares | (73,658) | (63,020) |
| Admiral Shares | (224,168) | (159,134) |
| Signal Shares | (65,893) | (37,229) |
| Institutional Shares | (106,402) | (68,007) |
| ETF Shares | (520,883) | (341,096) |
| Realized Capital Gain | | |
| Investor Shares | — | — |
| Admiral Shares | — | — |
| Signal Shares | — | — |
| Institutional Shares | — | — |
| ETF Shares | — | — |
| Return of Capital | | |
| Investor Shares | (31,477) | (28,556) |
| Admiral Shares | (95,796) | (72,108) |
| Signal Shares | (28,159) | (16,870) |
| Institutional Shares | (45,470) | (30,816) |
| ETF Shares | (222,594) | (154,560) |
| Total Distributions | (1,414,500) | (971,396) |
| Capital Share Transactions | | |
| Investor Shares | (304,730) | (19,586) |
| Admiral Shares | 720,250 | 1,150,759 |
| Signal Shares | 572,687 | 494,034 |
| Institutional Shares | 799,400 | 586,219 |
| ETF Shares | 1,928,162 | 5,243,286 |
| Net Increase (Decrease) from Capital Share Transactions | 3,715,769 | 7,454,712 |
| Total Increase (Decrease) | 3,064,490 | 10,118,724 |
| Net Assets | | |
| Beginning of Period | 32,256,028 | 22,137,304 |
| End of Period1 | 35,320,518 | 32,256,028 |
| 1 Net Assets—End of Period includes undistributed (overdistributed) net investment income of ($24,149,000) and $18,317,000. |
See accompanying Notes, which are an integral part of the Financial Statements.
19
REIT Index Fund
Financial Highlights
| | | | | |
| Investor Shares | | | | | |
| |
| For a Share Outstanding | Year Ended January 31, |
| Throughout Each Period | 2014 | 2013 | 2012 | 2011 | 2010 |
| Net Asset Value, Beginning of Period | $22.66 | $20.50 | $18.99 | $14.05 | $10.02 |
| Investment Operations | | | | | |
| Net Investment Income | . 579 | .514 | .442 | . 399 | .477 |
| Net Realized and Unrealized Gain (Loss) | | | | | |
| on Investments | .025 | 2.393 | 1.722 | 5.144 | 4.192 |
| Total from Investment Operations | .604 | 2.907 | 2.164 | 5.543 | 4.669 |
| Distributions | | | | | |
| Dividends from Net Investment Income | (. 626) | (. 514) | (. 439) | (. 603) | (. 481) |
| Distributions from Realized Capital Gains | — | — | — | — | — |
| Return of Capital | (. 268) | (. 233) | (. 215) | — | (.158) |
| Total Distributions | (.894) | (.747) | (.654) | (.603) | (.639) |
| Net Asset Value, End of Period | $22.37 | $22.66 | $20.50 | $18.99 | $14.05 |
| |
| Total Return1 | 2.78% | 14.45% | 11.80% | 40.02% | 48.51% |
| |
| Ratios/Supplemental Data | | | | | |
| Net Assets, End of Period (Millions) | $2,482 | $2,817 | $2,565 | $2,658 | $3,572 |
| Ratio of Total Expenses to Average Net Assets | 0.24% | 0.24% | 0.24% | 0.26% | 0.26% |
| Ratio of Net Investment Income to | | | | | |
| Average Net Assets | 2.51% | 2.39% | 2.30% | 2.22% | 3.94% |
| Portfolio Turnover Rate2 | 11% | 9% | 10% | 12% | 16% |
1 Total returns do not include transaction or account service fees that may have applied in the periods shown. Fund prospectuses provide
information about any applicable transaction and account service fees.
2 Excludes the value of portfolio securities received or delivered as a result of in-kind purchases or redemptions of the fund’s capital shares,
including ETF Creation Units.
See accompanying Notes, which are an integral part of the Financial Statements.
20
REIT Index Fund
Financial Highlights
| | | | | |
| Admiral Shares | | | | | |
| |
| For a Share Outstanding | Year Ended January 31, |
| Throughout Each Period | 2014 | 2013 | 2012 | 2011 | 2010 |
| Net Asset Value, Beginning of Period | $96.70 | $87.47 | $81.03 | $59.95 | $42.74 |
| Investment Operations | | | | | |
| Net Investment Income | 2.569 | 2.285 | 1.960 | 1.806 | 2.083 |
| Net Realized and Unrealized Gain (Loss) | | | | | �� |
| on Investments | .148 | 10.263 | 7.385 | 21.948 | 17.909 |
| Total from Investment Operations | 2.717 | 12.548 | 9.345 | 23.754 | 19.992 |
| Distributions | | | | | |
| Dividends from Net Investment Income | (2.772) | (2.283) | (1.948) | (2.674) | (2.094) |
| Distributions from Realized Capital Gains | — | — | — | — | — |
| Return of Capital | (1.185) | (1.035) | (. 957) | — | (.688) |
| Total Distributions | (3.957) | (3.318) | (2.905) | (2.674) | (2.782) |
| Net Asset Value, End of Period | $95.46 | $96.70 | $87.47 | $81.03 | $59.95 |
| |
| Total Return1 | 2.94% | 14.63% | 11.95% | 40.21% | 48.73% |
| |
| Ratios/Supplemental Data | | | | | |
| Net Assets, End of Period (Millions) | $7,987 | $7,399 | $5,612 | $4,715 | $1,296 |
| Ratio of Total Expenses to Average Net Assets | 0.10% | 0.10% | 0.10% | 0.12% | 0.13% |
| Ratio of Net Investment Income to | | | | | |
| Average Net Assets | 2.65% | 2.53% | 2.44% | 2.36% | 4.07% |
| Portfolio Turnover Rate2 | 11% | 9% | 10% | 12% | 16% |
1 Total returns do not include transaction or account service fees that may have applied in the periods shown. Fund prospectuses provide
information about any applicable transaction and account service fees.
2 Excludes the value of portfolio securities received or delivered as a result of in-kind purchases or redemptions of the fund’s capital shares,
including ETF Creation Units.
See accompanying Notes, which are an integral part of the Financial Statements.
21
REIT Index Fund
Financial Highlights
| | | | | |
| Signal Shares | | | | | |
| |
| For a Share Outstanding | Year Ended January 31, |
| Throughout Each Period | 2014 | 2013 | 2012 | 2011 | 2010 |
| Net Asset Value, Beginning of Period | $25.82 | $23.35 | $21.63 | $16.00 | $11.41 |
| Investment Operations | | | | | |
| Net Investment Income | . 687 | .610 | . 522 | . 483 | .557 |
| Net Realized and Unrealized Gain (Loss) | | | | | |
| on Investments | .030 | 2.744 | 1.974 | 5.862 | 4.775 |
| Total from Investment Operations | .717 | 3.354 | 2.496 | 6.345 | 5.332 |
| Distributions | | | | | |
| Dividends from Net Investment Income | (.741) | (.608) | (. 520) | (.715) | (.559) |
| Distributions from Realized Capital Gains | — | — | — | — | — |
| Return of Capital | (. 316) | (. 276) | (. 256) | — | (.183) |
| Total Distributions | (1.057) | (.884) | (.776) | (.715) | (.742) |
| Net Asset Value, End of Period | $25.48 | $25.82 | $23.35 | $21.63 | $16.00 |
| |
| Total Return1 | 2.90% | 14.65% | 11.96% | 40.25% | 48.68% |
| |
| Ratios/Supplemental Data | | | | | |
| Net Assets, End of Period (Millions) | $2,402 | $1,873 | $1,226 | $835 | $489 |
| Ratio of Total Expenses to Average Net Assets | 0.10% | 0.10% | 0.10% | 0.12% | 0.14% |
| Ratio of Net Investment Income to | | | | | |
| Average Net Assets | 2.65% | 2.53% | 2.44% | 2.36% | 4.06% |
| Portfolio Turnover Rate2 | 11% | 9% | 10% | 12% | 16% |
1 Total returns do not include transaction fees that may have applied in the periods shown. Fund prospectuses provide information about any
applicable transaction fees.
2 Excludes the value of portfolio securities received or delivered as a result of in-kind purchases or redemptions of the fund’s capital shares,
including ETF Creation Units.
See accompanying Notes, which are an integral part of the Financial Statements.
22
REIT Index Fund
Financial Highlights
| | | | | |
| Institutional Shares | | | | | |
| |
| For a Share Outstanding | Year Ended January 31, |
| Throughout Each Period | 2014 | 2013 | 2012 | 2011 | 2010 |
| Net Asset Value, Beginning of Period | $14.97 | $13.54 | $12.54 | $9.28 | $6.61 |
| Investment Operations | | | | | |
| Net Investment Income | .400 | .356 | .305 | .284 | .326 |
| Net Realized and Unrealized Gain (Loss) | | | | | |
| on Investments | .025 | 1.590 | 1.148 | 3.395 | 2.777 |
| Total from Investment Operations | .425 | 1.946 | 1.453 | 3.679 | 3.103 |
| Distributions | | | | | |
| Dividends from Net Investment Income | (. 431) | (. 355) | (. 304) | (. 419) | (. 326) |
| Distributions from Realized Capital Gains | — | — | — | — | — |
| Return of Capital | (.184) | (.161) | (.149) | — | (.107) |
| Total Distributions | (.615) | (.516) | (.453) | (.419) | (.433) |
| Net Asset Value, End of Period | $14.78 | $14.97 | $13.54 | $12.54 | $9.28 |
| |
| Total Return1 | 2.97% | 14.66% | 12.01% | 40.24% | 48.90% |
| |
| Ratios/Supplemental Data | | | | | |
| Net Assets, End of Period (Millions) | $3,922 | $3,185 | $2,324 | $1,614 | $907 |
| Ratio of Total Expenses to Average Net Assets | 0.08% | 0.08% | 0.08% | 0.08% | 0.09% |
| Ratio of Net Investment Income to | | | | | |
| Average Net Assets | 2.67% | 2.55% | 2.46% | 2.40% | 4.11% |
| Portfolio Turnover Rate2 | 11% | 9% | 10% | 12% | 16% |
1 Total returns do not include transaction fees that may have applied in the periods shown. Fund prospectuses provide information about any
applicable transaction fees.
2 Excludes the value of portfolio securities received or delivered as a result of in-kind purchases or redemptions of the fund’s capital shares,
including ETF Creation Units.
See accompanying Notes, which are an integral part of the Financial Statements.
23
REIT Index Fund
Financial Highlights
| | | | | |
| ETF Shares | | | | | |
| |
| For a Share Outstanding | Year Ended January 31, |
| Throughout Each Period | 2014 | 2013 | 2012 | 2011 | 2010 |
| Net Asset Value, Beginning of Period | $68.24 | $61.72 | $57.17 | $42.30 | $30.14 |
| Investment Operations | | | | | |
| Net Investment Income | 1.814 | 1.613 | 1.384 | 1.278 | 1.473 |
| Net Realized and Unrealized Gain (Loss) | | | | | |
| on Investments | .097 | 7.250 | 5.216 | 15.483 | 12.651 |
| Total from Investment Operations | 1.911 | 8.863 | 6.600 | 16.761 | 14.124 |
| Distributions | | | | | |
| Dividends from Net Investment Income | (1.955) | (1.612) | (1.375) | (1.891) | (1.478) |
| Distributions from Realized Capital Gains | — | — | — | — | — |
| Return of Capital | (.836) | (.731) | (.675) | — | (.486) |
| Total Distributions | (2.791) | (2.343) | (2.050) | (1.891) | (1.964) |
| Net Asset Value, End of Period | $67.36 | $68.24 | $61.72 | $57.17 | $42.30 |
| |
| Total Return | 2.93% | 14.64% | 11.94% | 40.19% | 48.74% |
| |
| Ratios/Supplemental Data | | | | | |
| Net Assets, End of Period (Millions) | $18,528 | $16,983 | $10,410 | $8,075 | $4,678 |
| Ratio of Total Expenses to | | | | | |
| Average Net Assets | 0.10% | 0.10% | 0.10% | 0.12% | 0.13% |
| Ratio of Net Investment Income to | | | | | |
| Average Net Assets | 2.65% | 2.53% | 2.44% | 2.36% | 4.07% |
| Portfolio Turnover Rate1 | 11% | 9% | 10% | 12% | 16% |
1 Excludes the value of portfolio securities received or delivered as a result of in-kind purchases or redemptions of the fund’s capital shares,
including ETF Creation Units.
See accompanying Notes, which are an integral part of the Financial Statements.
24
REIT Index Fund
Notes to Financial Statements
Vanguard REIT Index Fund is registered under the Investment Company Act of 1940 as an open-end investment company, or mutual fund. The fund offers five classes of shares: Investor Shares, Admiral Shares, Signal Shares, Institutional Shares, and ETF Shares. Investor Shares are available to any investor who meets the fund’s minimum purchase requirements. Admiral Shares, Signal Shares, and Institutional Shares, are designed for investors who meet certain administrative, service, and account-size criteria. ETF Shares are listed for trading on NYSE Arca; they can be purchased and sold through a broker.
A. The following significant accounting policies conform to generally accepted accounting principles for U.S. mutual funds. The fund consistently follows such policies in preparing its financial statements.
1. Security Valuation: Securities are valued as of the close of trading on the New York Stock Exchange (generally 4 p.m., Eastern time) on the valuation date. Equity securities are valued at the latest quoted sales prices or official closing prices taken from the primary market in which each security trades; such securities not traded on the valuation date are valued at the mean of the latest quoted bid and asked prices. Securities for which market quotations are not readily available, or whose values have been materially affected by events occurring before the fund’s pricing time but after the close of the securities’ primary markets, are valued by methods deemed by the board of trustees to represent fair value. Investments in Vanguard Market Liquidity Fund are valued at that fund’s net asset value. Temporary cash investments acquired over 60 days to maturity are valued using the latest bid prices or using valuations based on a matrix system (which considers such factors as security prices, yields, maturities, and ratings), both as furnished by independent pricing services. Other temporary cash investments are valued at amortized cost, which approximates market value.
2. Swap Contracts: The fund has entered into equity swap contracts to earn the total return on selected reference securities in the fund’s target index. Under the terms of each swap, the fund receives the total return on the referenced security (i.e., receiving the increase or paying the decrease in value of the selected reference security and receiving the equivalent of any dividends in respect of the selected referenced security) over a specified period of time, applied to a notional amount that represents the value of a designated number of shares of the selected reference security at the beginning of the equity swap contract. The fund also pays a floating rate that is based on short-term interest rates, applied to the notional amount. At the same time, the fund invests an amount approximating the notional amount of the swap in high-quality temporary cash investments.
The notional amounts of swap contracts are not recorded in the Statement of Net Assets. Swaps are valued daily based on market quotations received from independent pricing services or recognized dealers and the change in value is recorded as unrealized appreciation (depreciation) until termination of the swap, at which time realized gain (loss) is recorded. The primary risks associated with the swaps are that a counterparty will default on its obligation to pay net amounts due to the fund, or that the fund will incur fees in the event it terminates a swap prior to the scheduled termination date. The fund’s maximum risk of loss from counterparty credit risk is the amount of unrealized appreciation on the swap contract. The fund mitigates its counterparty risk by entering into swaps only with a diverse group of pre-qualified counterparties, monitoring their financial strength, entering into master netting arrangements with its counterparties, and requiring its counterparties to transfer collateral as security for their performance. In the event of a counterparty’s default (including bankruptcy), the fund may terminate any swap contracts with that counterparty, determine the net amount owed by either party in accordance with its master netting arrangements, and sell or retain any collateral held up to the net amount owed to the fund under the master netting arrangements. The swap contracts contain provisions whereby a counterparty may terminate open contracts if the fund’s net assets decline below a certain level, triggering a payment by the fund if the fund is in a net liability position at the
25
REIT Index Fund
time of the termination. The payment amount would be reduced by any collateral the fund has pledged. Any securities pledged as collateral for open contracts are noted in the Statement of Net Assets. The value of collateral received or pledged is compared daily to the value of the swap contracts exposure with each counterparty, and any difference, if in excess of a specified minimum transfer amount, is adjusted and settled within two business days.
The fund had no open swap contracts at January 31, 2014.
3. Federal Income Taxes: The fund intends to continue to qualify as a regulated investment company and distribute all of its taxable income. Management has analyzed the fund’s tax positions taken for all open federal income tax years (January 31, 2011–2014), and has concluded that no provision for federal income tax is required in the fund’s financial statements.
4. Distributions: Distributions to shareholders are recorded on the ex-dividend date. Distributions declared by the fund are reallocated at fiscal year-end to ordinary income, capital gain, and return of capital to reflect their tax character.
5. Securities Lending: To earn additional income, the fund may lend its securities to qualified institutional borrowers. Security loans are required to be secured at all times by collateral in an amount at least equal to the market value of securities loaned. Daily market fluctuations could cause the value of loaned securities to be more or less than the value of the collateral received. When this occurs, the collateral is adjusted and settled on the next business day. The fund further mitigates its counterparty risk by entering into securities lending transactions only with a diverse group of prequalified counterparties, monitoring their financial strength, and entering into master securities lending agreements with its counterparties. The master securities lending agreements provide that, in the event of a counterparty’s default (including bankruptcy), the fund may terminate any loans with that borrower, determine the net amount owed, and sell or retain the collateral up to the net amount owed to the fund; however, such actions may be subject to legal proceedings. While collateral mitigates counterparty risk, in the absence of a default the fund may experience delays and costs in recovering the securities loaned. The fund invests cash collateral received in Vanguard Market Liquidity Fund, and records a liability for the return of the collateral, during the period the securities are on loan. Securities lending income represents fees charged to borrowers plus income earned on invested cash collateral, less expenses associated with the loan.
6. Other: Distributions received from REITs are recorded on the ex-dividend date. Each REIT reports annually the tax character of its distributions. Dividend income, capital gain distributions received, and unrealized appreciation (depreciation) reflect the amounts of taxable income, capital gain, and return of capital reported by the REITs, and management’s estimates of such amounts for REIT distributions for which actual information has not been reported. Interest income includes income distributions received from Vanguard Market Liquidity Fund and is accrued daily. Premiums and discounts on debt securities purchased are amortized and accreted, respectively, to interest income over the lives of the respective securities. Security transactions are accounted for on the date securities are bought or sold. Costs used to determine realized gains (losses) on the sale of investment securities are those of the specific securities sold.
Each class of shares has equal rights as to assets and earnings, except that each class separately bears certain class-specific expenses related to maintenance of shareholder accounts (included in Management and Administrative expenses) and shareholder reporting. Marketing and distribution expenses are allocated to each class of shares based on a method approved by the board of trustees. Income, other non-class-specific expenses, and gains and losses on investments are allocated to each class of shares based on its relative net assets.
26
REIT Index Fund
B. The Vanguard Group furnishes at cost investment advisory, corporate management, administrative, marketing, and distribution services. The costs of such services are allocated to the fund under methods approved by the board of trustees. The fund has committed to provide up to 0.40% of its net assets in capital contributions to Vanguard. At January 31, 2014, the fund had contributed capital of $3,708,000 to Vanguard (included in Other Assets), representing 0.01% of the fund’s net assets and 1.48% of Vanguard’s capitalization. The fund’s trustees and officers are also directors and officers of Vanguard.
C. Various inputs may be used to determine the value of the fund’s investments. These inputs are summarized in three broad levels for financial statement purposes. The inputs or methodologies used to value securities are not necessarily an indication of the risk associated with investing in those securities.
Level 1—Quoted prices in active markets for identical securities.
Level 2—Other significant observable inputs (including quoted prices for similar securities, interest rates, prepayment speeds, credit risk, etc.).
Level 3—Significant unobservable inputs (including the fund’s own assumptions used to determine the fair value of investments).
The following table summarizes the market value of the fund’s investments as of January 31, 2014, based on the inputs used to value them:
| | | |
| | Level 1 | Level 2 | Level 3 |
| Investments | ($000) | ($000) | ($000) |
| Real Estate Investment Trusts | 35,322,979 | — | — |
| Temporary Cash Investments | 232,585 | 13,999 | — |
| Total | 35,555,564 | 13,999 | — |
D. Distributions are determined on a tax basis and may differ from net investment income and realized capital gains for financial reporting purposes. Differences may be permanent or temporary. Permanent differences are reclassified among capital accounts in the financial statements to reflect their tax character. Temporary differences arise when certain items of income, expense, gain, or loss are recognized in different periods for financial statement and tax purposes. These differences will reverse at some time in the future. Differences in classification may also result from the treatment of short-term gains as ordinary income for tax purposes.
Realized and unrealized gains (losses) on certain of the fund’s swap contracts are treated as ordinary income (loss) for tax purposes; the effect on the fund’s income dividends to shareholders is offset by a change in principal return. Realized gains of $29,738,000 on swap contracts have been reclassified from accumulated net realized losses to overdistributed net investment income.
During the year ended January 31, 2014, the fund realized $1,489,940,000 of net capital gains resulting from in-kind redemptions—in which shareholders exchanged fund shares for securities held by the fund rather than for cash. Because such gains are not taxable to the fund, and are not distributed to shareholders, they have been reclassified from accumulated net realized losses to paid-in capital.
For tax purposes, at January 31, 2014, the fund had no ordinary income available for distribution. At January 31, 2014, the fund had available capital losses totaling $403,596,000 to offset future net capital gains. Of this amount, $73,864,000 is subject to expiration on January 31, 2018. Capital
27
REIT Index Fund
losses of $329,732,000 realized beginning in fiscal 2012 may be carried forward indefinitely under the Regulated Investment Company Modernization Act of 2010, but must be used before any expiring loss carryforwards.
At January 31, 2014, the cost of investment securities for tax purposes was $31,565,033,000. Net unrealized appreciation of investment securities for tax purposes was $4,004,530,000, consisting of unrealized gains of $4,599,123,000 on securities that had risen in value since their purchase and $594,593,000 in unrealized losses on securities that had fallen in value since their purchase.
E. During the year ended January 31, 2014, the fund purchased $11,111,795,000 of investment securities and sold $7,260,984,000 of investment securities, other than temporary cash investments. Purchases and sales include $4,750,028,000 and $3,549,749,000, respectively, in connection with in-kind purchases and redemptions of the fund’s capital shares.
F. Capital share transactions for each class of shares were:
| | | | |
| | Year Ended January 31, |
| | 2014 | 2013 |
| | Amount | Shares | Amount | Shares |
| | ($000) | (000) | ($000) | (000) |
| Investor Shares | | | | |
| Issued | 690,690 | 29,921 | 760,608 | 35,236 |
| Issued in Lieu of Cash Distributions | 99,859 | 4,526 | 87,324 | 4,088 |
| Redeemed1 | (1,095,279) | (47,793) | (867,518) | (40,141) |
| Net Increase (Decrease)—Investor Shares | (304,730) | (13,346) | (19,586) | (817) |
| Admiral Shares | | | | |
| Issued | 2,061,271 | 20,919 | 1,747,526 | 18,827 |
| Issued in Lieu of Cash Distributions | 287,172 | 3,054 | 206,798 | 2,265 |
| Redeemed1 | (1,628,193) | (16,819) | (803,565) | (8,745) |
| Net Increase (Decrease) —Admiral Shares | 720,250 | 7,154 | 1,150,759 | 12,347 |
| Signal Shares | | | | |
| Issued | 1,307,317 | 50,253 | 851,832 | 34,732 |
| Issued in Lieu of Cash Distributions | 83,873 | 3,346 | 47,416 | 1,944 |
| Redeemed1 | (818,503) | (31,910) | (405,214) | (16,626) |
| Net Increase (Decrease)—Signal Shares | 572,687 | 21,689 | 494,034 | 20,050 |
| Institutional Shares | | | | |
| Issued | 1,361,402 | 90,266 | 831,473 | 58,509 |
| Issued in Lieu of Cash Distributions | 136,949 | 9,423 | 88,358 | 6,253 |
| Redeemed1 | (698,951) | (47,012) | (333,612) | (23,653) |
| Net Increase (Decrease) —Institutional Shares | 799,400 | 52,677 | 586,219 | 41,109 |
| ETF Shares | | | | |
| Issued | 5,442,281 | 78,370 | 6,065,629 | 93,009 |
| Issued in Lieu of Cash Distributions | — | — | — | — |
| Redeemed1 | (3,514,119) | (52,200) | (822,343) | (12,800) |
| Net Increase (Decrease) —ETF Shares | 1,928,162 | 26,170 | 5,243,286 | 80,209 |
| 1 Net of redemption fees for fiscal 2013 of $490,000 (fund total). Effective May 23, 2012, the redemption fee was eliminated. |
28
REIT Index Fund
G. Certain of the fund’s investments are in companies that are considered to be affiliated companies of the fund because the fund owns more than 5% of the outstanding voting securities of the company. Transactions during the period in securities of these companies were as follows:
| | | | | | |
| | | | Current Period Transactions | |
| Jan. 31, 2013 | | Proceeds From | | Jan. 31, 2014 |
| | | Market | Purchases | Securities | Dividend | Market |
| | | Value | at Cost | Sold | Income | Value |
| | | ($000) | ($000) | ($000) | ($000) | ($000) |
| Acadia Realty Trust | | 88,862 | 25,094 | 14,560 | 2,749 | 96,367 |
| Agree Realty Corp. | | — | 36,978 | 3,568 | 933 | 29,034 |
| Alexandria Real Estate Equities Inc. | | 315,127 | 102,829 | 61,470 | 10,685 | 342,129 |
| American Assets Trust Inc. | | NA1 | 15,622 | 14,114 | 1,920 | 78,578 |
| American Campus Communities Inc. | | 338,049 | 59,054 | 61,623 | 5,804 | 248,719 |
| American Realty Capital Properties Inc. | — | 211,029 | 18,749 | 2,351 | 174,745 |
| American Residential Properties Inc. | | — | 37,594 | 626 | — | 38,557 |
| AmREIT Inc. | | — | 27,018 | 2,149 | 522 | 20,700 |
| Apartment Investment & | | | | | | |
| Management Co. Class A | | 274,916 | 59,948 | 61,912 | 1,735 | 278,685 |
| Ashford Hospitality Prime Inc. | | — | 32,780 | 682 | 51 | 27,125 |
| Ashford Hospitality Trust Inc. | | 51,967 | 19,902 | 11,040 | 152 | 49,152 |
| Associated Estates Realty Corp. | | 55,343 | 17,432 | 17,924 | 1,832 | 55,026 |
| AvalonBay Communities Inc. | 1,008,381 | 319,393 | 230,394 | 14,776 | 1,036,765 |
| BioMed Realty Trust Inc. | | 217,255 | 101,998 | 49,891 | 11,869 | 255,970 |
| Boston Properties Inc. | 1,099,015 | 227,760 | 228,740 | 24,979 | 1,124,832 |
| Brandywine Realty Trust | | 126,405 | 42,341 | 30,126 | 5,454 | 152,490 |
| BRE Properties Inc. | | 270,564 | 56,046 | 56,926 | 2,487 | 311,430 |
| Camden Property Trust | | 401,599 | 80,120 | 76,535 | 8,104 | 359,939 |
| Campus Crest Communities Inc. | | 32,253 | 29,562 | 8,330 | 719 | 38,927 |
| CapLease Inc. | | 27,523 | 12,680 | 6,863 | 1,697 | NA2 |
| CBL & Associates Properties Inc. | | 224,140 | 53,434 | 41,605 | 9,915 | 187,272 |
| Cedar Realty Trust Inc. | | 23,254 | 12,964 | 7,029 | — | 31,995 |
| Chesapeake Lodging Trust | | 57,111 | 28,462 | 14,380 | 3,275 | 80,802 |
| Cole Real Estate Investment Inc. | | — | 448,442 | 51,932 | 8,580 | 485,625 |
| CommonWealth REIT | | NA1 | 155,839 | 36,892 | 1,110 | 198,594 |
| Colonial Properties Trust | | 126,868 | 18,393 | 21,155 | 210 | NA3 |
| CoreSite Realty Corp. | | 43,153 | 9,440 | 9,064 | 1,681 | 44,859 |
| Corporate Office Properties Trust | | 145,959 | 37,172 | 26,117 | 4,553 | 148,243 |
| Corrections Corp. of America | | — | 351,426 | 46,707 | 57,610 | 265,239 |
| Cousins Properties Inc. | | 57,791 | 73,925 | 19,478 | 1,604 | 126,010 |
| CubeSmart | | 123,618 | 34,334 | 23,629 | 2,332 | 144,461 |
| CyrusOne Inc. | | — | 24,087 | 528 | 127 | 24,387 |
| DCT Industrial Trust Inc. | | 130,337 | 49,568 | 27,143 | 3,199 | 154,075 |
29
| | | | | |
| REIT Index Fund | | | | | |
| |
| |
| |
| |
| | | Current Period Transactions | |
| | Jan. 31, 2013 | | Proceeds From | | Jan. 31, 2014 |
| | Market | Purchases | Securities | Dividend | Market |
| | Value | at Cost | Sold | Income | Value |
| | ($000) | ($000) | ($000) | ($000) | ($000) |
| DDR Corp. | 279,488 | 112,108 | 84,038 | 1,387 | 291,170 |
| DiamondRock Hospitality Co. | 123,227 | 27,623 | 28,253 | 3,237 | 154,574 |
| Digital Realty Trust Inc. | 573,635 | 115,493 | 93,250 | 19,555 | 447,188 |
| Douglas Emmett Inc. | 214,347 | 46,939 | 44,545 | 1,998 | 235,253 |
| Duke Realty Corp. | 335,614 | 75,153 | 65,901 | 7,874 | 348,700 |
| DuPont Fabros Technology Inc. | 103,611 | 24,538 | 22,845 | 3,745 | 114,836 |
| EastGroup Properties Inc. | 113,225 | 25,162 | 21,076 | 3,942 | 123,371 |
| Education Realty Trust Inc. | 82,448 | 15,556 | 13,494 | 1,503 | 70,800 |
| EPR Properties | 151,972 | 46,948 | 35,410 | 7,987 | 177,081 |
| Equity Lifestyle Properties Inc. | 194,671 | 42,207 | 42,581 | 3,892 | 212,567 |
| Equity Residential | 1,233,700 | 347,823 | 276,843 | 16,592 | 1,294,578 |
| Essex Property Trust Inc. | 387,732 | 90,220 | 77,058 | 9,703 | 411,321 |
| Excel Trust Inc. | 37,766 | 9,802 | 5,911 | 1,260 | 37,565 |
| Extra Space Storage Inc. | 287,018 | 62,731 | 60,894 | 8,098 | 329,463 |
| Federal Realty Investment Trust | 469,888 | 98,630 | 91,162 | 13,159 | 488,995 |
| FelCor Lodging Trust Inc. | 43,963 | 9,268 | 12,367 | 151 | 62,250 |
| First Industrial Realty Trust Inc. | 101,333 | 34,842 | 23,061 | 2,378 | 122,413 |
| First Potomac Realty Trust | 48,444 | 17,538 | 10,346 | 305 | 52,345 |
| Franklin Street Properties Corp. | 67,189 | 29,456 | 15,256 | 3,143 | 73,834 |
| Geo Group Inc. | — | 198,985 | 28,362 | 7,687 | 164,618 |
| Getty Realty Corp. | 34,898 | 6,892 | 7,341 | 1,458 | 34,606 |
| Glimcher Realty Trust | 107,903 | 21,573 | 19,080 | 1,387 | 84,782 |
| Government Properties | | | | | |
| Income Trust | NA1 | 65,373 | 40,245 | 4,078 | 92,220 |
| HCP Inc. | 1,454,683 | 293,162 | 295,830 | 41,140 | 1,218,577 |
| Health Care REIT Inc. | 1,110,067 | 371,211 | 230,432 | 31,137 | 1,132,528 |
| Healthcare Realty Trust Inc. | 151,739 | 40,353 | 25,581 | 1,627 | 150,037 |
| Healthcare Trust of America Inc. | | | | | |
| Class A | NA1 | 110,083 | 12,962 | 2,953 | 127,369 |
| Hersha Hospitality Trust Class A | 65,325 | 14,992 | 14,327 | 1,350 | 67,635 |
| Highwoods Properties Inc. | 189,621 | 62,014 | 31,855 | 7,014 | 225,216 |
| Home Properties Inc. | 212,371 | 66,769 | 39,083 | 6,523 | 216,497 |
| Hospitality Properties Trust | NA1 | 209,284 | 87,562 | 12,529 | 260,325 |
| Host Hotels & Resorts Inc. | 840,039 | 201,555 | 177,072 | 22,281 | 941,903 |
| Hudson Pacific Properties Inc. | 52,550 | 38,058 | 13,233 | 205 | 78,084 |
| Inland Real Estate Corp. | 56,094 | 12,360 | 12,576 | 2,736 | 64,548 |
| Investors Real Estate Trust | 59,445 | 18,602 | 11,636 | 1,437 | 61,446 |
| Kilroy Realty Corp. | 255,449 | 77,211 | 54,097 | 4,132 | 293,633 |
30
| | | | | |
| REIT Index Fund | | | | | |
| |
| |
| |
| |
| | | Current Period Transactions | |
| Jan. 31, 2013 | | Proceeds From | | Jan. 31, 2014 |
| | Market | Purchases | Securities | Dividend | Market |
| | Value | at Cost | Sold | Income | Value |
| | ($000) | ($000) | ($000) | ($000) | ($000) |
| Kimco Realty Corp. | 585,251 | 126,336 | 128,219 | 11,106 | 584,925 |
| Kite Realty Group Trust | 30,295 | 29,889 | 6,888 | 476 | 55,438 |
| LaSalle Hotel Properties | 178,179 | 52,849 | 36,580 | 6,357 | 216,270 |
| Lexington Realty Trust | 117,318 | 57,087 | 26,224 | 4,123 | 143,757 |
| Liberty Property Trust | 318,803 | 126,275 | 65,579 | 13,594 | 355,136 |
| LTC Properties Inc. | 78,514 | 30,477 | 17,999 | 3,563 | 90,062 |
| Macerich Co. | 550,468 | 126,796 | 102,252 | 9,655 | 543,191 |
| Mack-Cali Realty Corp. | 165,215 | 29,613 | 39,001 | 3,766 | 115,506 |
| Medical Properties Trust Inc. | 126,256 | 49,574 | 27,703 | 6,507 | 145,055 |
| Mid-America Apartment | | | | | |
| Communities Inc. | 186,049 | 56,705 | 41,564 | 9,797 | 329,311 |
| Monmouth Real Estate | | | | | |
| Investment Corp. Class A | 24,302 | 8,289 | 3,825 | 524 | 24,698 |
| National Health Investors Inc. | 104,258 | 35,158 | 20,599 | 4,867 | 118,344 |
| National Retail Properties Inc. | 239,868 | 72,383 | 44,262 | 10,692 | 274,761 |
| Omega Healthcare Investors Inc. | 192,333 | 55,191 | 40,360 | 12,749 | 255,531 |
| One Liberty Properties Inc. | — | 24,441 | 1,921 | 618 | 17,710 |
| Pebblebrook Hotel Trust | 101,678 | 23,575 | 20,075 | 2,665 | 126,718 |
| Pennsylvania REIT | 67,938 | 36,464 | 16,954 | — | 86,791 |
| Piedmont Office Realty Trust Inc. | | | | | |
| Class A | 226,058 | 44,056 | 49,094 | 6,520 | 189,405 |
| Post Properties Inc. | 182,038 | 36,640 | 37,256 | 4,581 | 175,010 |
| Prologis Inc. | 1,272,712 | 365,814 | 270,282 | — | 1,319,733 |
| PS Business Parks Inc. | 95,846 | 23,595 | 21,189 | 2,328 | 107,244 |
| Public Storage | 1,554,285 | 327,146 | 336,620 | 51,339 | 1,573,408 |
| RAIT Financial Trust | — | 45,977 | 818 | 721 | 46,948 |
| Ramco-Gershenson Properties Trust | 48,952 | 32,719 | 11,710 | 2,565 | 72,608 |
| Realty Income Corp. | 541,372 | 168,807 | 120,036 | 18,401 | 546,288 |
| Regency Centers Corp. | 310,317 | 67,947 | 62,666 | 10,916 | 303,399 |
| Retail Opportunity Investments Corp. | 46,279 | 27,556 | 8,772 | 1,009 | 70,948 |
| Retail Properties of America Inc. | NA1 | 130,676 | 26,878 | 3,901 | 169,103 |
| RLJ Lodging Trust | 138,950 | 55,540 | 35,539 | 6,371 | 188,430 |
| Ryman Hospitality Properties Inc. | — | 158,929 | 22,417 | 5,736 | 128,374 |
| Sabra Health Care REIT Inc. | 64,368 | 13,679 | 13,575 | 1,202 | 73,758 |
| Senior Housing Properties Trust | NA1 | 186,654 | 110,148 | 11,167 | 289,249 |
| Silver Bay Realty Trust Corp. | — | 59,630 | 6,899 | 29 | 40,505 |
| Simon Property Group Inc. | 3,364,241 | 706,567 | 664,208 | 96,847 | 3,281,268 |
| SL Green Realty Corp. | 501,752 | 115,174 | 109,869 | 8,522 | 588,966 |
31
| | | | | |
| REIT Index Fund | | | | | |
| |
| |
| |
| |
| | | Current Period Transactions | |
| Jan. 31, 2013 | | Proceeds From | | Jan. 31, 2014 |
| | Market | Purchases | Securities | Dividend | Market |
| | Value | at Cost | Sold | Income | Value |
| | ($000) | ($000) | ($000) | ($000) | ($000) |
| Sovran Self Storage Inc. | 133,031 | 33,345 | 25,765 | 4,683 | 145,817 |
| Spirit Realty Capital Inc. | — | 72,054 | 18,766 | 7,142 | 254,720 |
| STAG Industrial Inc. | 56,540 | 11,974 | 11,215 | 2,650 | 62,049 |
| Strategic Hotels & Resorts Inc. | 82,729 | 18,875 | 19,376 | — | 104,533 |
| Summit Hotel Properties Inc. | 40,173 | 18,889 | 7,894 | 644 | 49,408 |
| Sun Communities Inc. | 84,004 | 38,516 | 20,981 | 2,228 | 109,513 |
| Sunstone Hotel Investors Inc. | 127,199 | 49,790 | 28,975 | 1,162 | 160,220 |
| Tanger Factory Outlet Centers | 230,253 | 45,969 | 46,477 | 5,195 | 215,240 |
| Taubman Centers Inc. | 348,170 | 69,104 | 61,654 | 7,494 | 283,451 |
| UDR Inc. | 413,878 | 86,393 | 89,938 | 12,939 | 416,768 |
| Universal Health Realty Income Trust | 46,002 | 7,917 | 7,897 | 1,615 | 34,965 |
| Ventas Inc. | 1,355,759 | 286,934 | 309,137 | 54,037 | 1,249,299 |
| Vornado Realty Trust | 977,994 | 205,261 | 206,071 | 33,846 | 1,055,342 |
| Washington REIT | 130,785 | 24,532 | 25,480 | 3,391 | 105,809 |
| Weingarten Realty Investors | 230,036 | 50,087 | 50,928 | 4,869 | 229,316 |
| Whitestone REIT | 15,919 | 7,509 | 2,966 | 1,432 | 19,857 |
| Winthrop Realty Trust | 24,604 | 6,933 | 4,983 | 1,352 | 25,639 |
| 30,389,916 | | | 930,491 | 34,042,854 |
1 Not applicable—At January 31, 2013, the issuer was not an affiliated company of the fund.
2 Not applicable—In November 2013, CapLease Inc. merged with American Realty Capital Properties Inc.
3 Not applicable—In October 2013, Colonial Properties Trust merged with Mid-America Apartment Communities Inc.
H. Management has determined that no material events or transactions occurred subsequent to
January 31, 2014, that would require recognition or disclosure in these financial statements.
32
Report of Independent Registered
Public Accounting Firm
To the Trustees of Vanguard Specialized Funds and the Shareholders of Vanguard REIT Index Fund: In our opinion, the accompanying statement of net assets and statement of assets and liabilities and the related statements of operations and of changes in net assets and the financial highlights present fairly, in all material respects, the financial position of Vanguard REIT Index Fund (constituting a separate portfolio of Vanguard Specialized Funds, hereafter referred to as the “Fund”) at January 31, 2014, the results of its operations for the year then ended, the changes in its net assets for each of the two years in the period then ended, and the financial highlights for each of the five years in the period then ended, in conformity with accounting principles generally accepted in the United States of America. These financial statements and financial highlights (hereafter referred to as “financial statements”) are the responsibility of the Fund’s management; our responsibility is to express an opinion on these financial statements based on our audits. We conducted our audits of these financial statements in accordance with the standards of the Public Company Accounting Oversight Board (United States). Those standards require that we plan and perform the audit to obtain reasonable assurance about whether the financial statements are free of material misstatement. An audit includes examining, on a test basis, evidence supporting the amounts and disclosures in the financial statements, assessing the accounting principles used and significant estimates made by management, and evaluating the overall financial statement presentation. We believe that our audits, which included confirmation of securities at January 31, 2014 by correspondence with the custodian and by agreement to the underlying ownership records of the transfer agent, provide a reasonable basis for our opinion.
/s/PricewaterhouseCoopers LLP
Philadelphia, Pennsylvania
March 17, 2014
Special 2013 tax information (unaudited) for Vanguard REIT Index Fund
This information for the fiscal year ended January 31, 2014, is included pursuant to provisions of the
Internal Revenue Code.
The fund distributed $56,606,000 of qualified dividend income to shareholders during the fiscal year.
33
Your Fund’s After-Tax Returns
This table presents returns for your fund both before and after taxes. The after-tax returns are shown in two ways: (1) assuming that an investor owned the fund during the entire period and paid taxes on the fund’s distributions, and (2) assuming that an investor paid taxes on the fund’s distributions and sold all shares at the end of each period.
Calculations are based on the highest individual federal income tax and capital gains tax rates in effect at the times of the distributions and the hypothetical sales. State and local taxes were not considered. After-tax returns reflect any qualified dividend income, using actual prior-year figures and estimates for 2014. (In the example, returns after the sale of fund shares may be higher than those assuming no sale. This occurs when the sale would have produced a capital loss. The calculation assumes that the investor received a tax deduction for the loss.)
The table shows returns for one share class only; returns for other share classes will differ. Please note that your actual after-tax returns will depend on your tax situation and may differ from those shown. Also note that if you own the fund in a tax-deferred account, such as an individual retirement account or a 401(k) plan, this information does not apply to you. Such accounts are not subject to current taxes.
Finally, keep in mind that a fund’s performance—whether before or after taxes—does not guarantee future results.
Average Annual Total Returns: REIT Index Fund Investor Shares
Periods Ended January 31, 2014
| | | |
| | One | Five | Ten |
| | Year | Years | Years |
| Returns Before Taxes | 2.78% | 22.29% | 8.45% |
| Returns After Taxes on Distributions | 1.57 | 20.94 | 7.16 |
| Returns After Taxes on Distributions and Sale of Fund Shares | 1.59 | 17.63 | 6.32 |
34
About Your Fund’s Expenses
As a shareholder of the fund, you incur ongoing costs, which include costs for portfolio management, administrative services, and shareholder reports (like this one), among others. Operating expenses, which are deducted from a fund’s gross income, directly reduce the investment return of the fund.
A fund’s expenses are expressed as a percentage of its average net assets. This figure is known as the expense ratio. The following examples are intended to help you understand the ongoing costs (in dollars) of investing in your fund and to compare these costs with those of other mutual funds. The examples are based on an investment of $1,000 made at the beginning of the period shown and held for the entire period.
The accompanying table illustrates your fund’s costs in two ways:
• Based on actual fund return. This section helps you to estimate the actual expenses that you paid over the period. The ”Ending Account Value“ shown is derived from the fund‘s actual return, and the third column shows the dollar amount that would have been paid by an investor who started with $1,000 in the fund. You may use the information here, together with the amount you invested, to estimate the expenses that you paid over the period.
To do so, simply divide your account value by $1,000 (for example, an $8,600 account value divided by $1,000 = 8.6), then multiply the result by the number given for your fund under the heading ”Expenses Paid During Period.“
• Based on hypothetical 5% yearly return. This section is intended to help you compare your fund‘s costs with those of other mutual funds. It assumes that the fund had a yearly return of 5% before expenses, but that the expense ratio is unchanged. In this case—because the return used is not the fund’s actual return—the results do not apply to your investment. The example is useful in making comparisons because the Securities and Exchange Commission requires all mutual funds to calculate expenses based on a 5% return. You can assess your fund’s costs by comparing this hypothetical example with the hypothetical examples that appear in shareholder reports of other funds.
Note that the expenses shown in the table are meant to highlight and help you compare ongoing costs only and do not reflect transaction costs incurred by the fund for buying and selling securities. Further, the expenses do not include any purchase, redemption, or account service fees described in the fund prospectus. If such fees were applied to your account, your costs would be higher. Your fund does not carry a “sales load.”
The calculations assume no shares were bought or sold during the period. Your actual costs may have been higher or lower, depending on the amount of your investment and the timing of any purchases or redemptions.
You can find more information about the fund’s expenses, including annual expense ratios, in the Financial Statements section of this report. For additional information on operating expenses and other shareholder costs, please refer to your fund’s current prospectus.
35
| | | |
| Six Months Ended January 31, 2014 | | | |
| | Beginning | Ending | Expenses |
| | Account Value | Account Value | Paid During |
| REIT Index Fund | 7/31/2013 | 1/31/2014 | Period |
| Based on Actual Fund Return | | | |
| Investor Shares | $1,000.00 | $994.78 | $1.21 |
| Admiral Shares | 1,000.00 | 995.73 | 0.50 |
| Signal Shares | 1,000.00 | 995.61 | 0.50 |
| Institutional Shares | 1,000.00 | 996.03 | 0.40 |
| ETF Shares | 1,000.00 | 995.66 | 0.50 |
| Based on Hypothetical 5% Yearly Return | | | |
| Investor Shares | $1,000.00 | $1,024.00 | $1.22 |
| Admiral Shares | 1,000.00 | 1,024.70 | 0.51 |
| Signal Shares | 1,000.00 | 1,024.70 | 0.51 |
| Institutional Shares | 1,000.00 | 1,024.80 | 0.41 |
| ETF Shares | 1,000.00 | 1,024.70 | 0.51 |
The calculations are based on expenses incurred in the most recent six-month period. The fund’s annualized six-month expense ratios for that
period are 0.24% for Investor Shares, 0.10% for Admiral Shares, 0.10% for Signal Shares, 0.08% for Institutional Shares, and 0.10% for ETF
Shares. The dollar amounts shown as “Expenses Paid” are equal to the annualized expense ratio multiplied by the average account value over
the period, multiplied by the number of days in the most recent six-month period, then divided by the number of days in the most recent
12-month period.
36
Glossary
Beta. A measure of the magnitude of a fund’s past share-price fluctuations in relation to the ups and downs of a given market index. The index is assigned a beta of 1.00. Compared with a given index, a fund with a beta of 1.20 typically would have seen its share price rise or fall by 12% when the index rose or fell by 10%. For this report, beta is based on returns over the past 36 months for both the fund and the index. Note that a fund’s beta should be reviewed in conjunction with its R-squared (see definition). The lower the R-squared, the less correlation there is between the fund and the index, and the less reliable beta is as an indicator of volatility.
Dividend Yield. Dividend income earned by stocks, expressed as a percentage of the aggregate market value (or of net asset value, for a fund). The yield is determined by dividing the amount of the annual dividends by the aggregate value (or net asset value) at the end of the period. For a fund, the dividend yield is based solely on stock holdings and does not include any income produced by other investments. This yield may include some payments that represent a return of capital, capital gains distributions, or both by the underlying stocks.
Earnings Growth Rate. The average annual rate of growth in earnings over the past five years for the stocks now in a fund.
Expense Ratio. A fund’s total annual operating expenses expressed as a percentage of the fund’s average net assets. The expense ratio includes management and administrative expenses, but does not include the transaction costs of buying and selling portfolio securities.
Foreign Holdings. The percentage of a fund represented by securities or depositary receipts of companies based outside the United States.
Inception Date. The date on which the assets of a fund (or one of its share classes) are first invested in accordance with the fund’s investment objective. For funds with a subscription period, the inception date is the day after that period ends. Investment performance is measured from the inception date.
Median Market Cap. An indicator of the size of companies in which a fund invests; the midpoint of market capitalization (market price x shares outstanding) of a fund’s stocks, weighted by the proportion of the fund’s assets invested in each stock. Stocks representing half of the fund’s assets have market capitalizations above the median, and the rest are below it.
Price/Book Ratio. The share price of a stock divided by its net worth, or book value, per share. For a fund, the weighted average price/book ratio of the stocks it holds.
Price/Earnings Ratio. The ratio of a stock’s current price to its per-share earnings over the past year. For a fund, the weighted average P/E of the stocks it holds. P/E is an indicator of market expectations about corporate prospects; the higher the P/E, the greater the expectations for a company’s future growth.
R-Squared. A measure of how much of a fund’s past returns can be explained by the returns from the market in general, as measured by a given index. If a fund’s total returns were precisely synchronized with an index’s returns, its R-squared would be 1.00. If the fund’s returns bore no relationship to the index’s returns, its R-squared would be 0. For this report, R-squared is based on returns over the past 36 months for both the fund and the index.
37
Return on Equity. The annual average rate of return generated by a company during the past five years for each dollar of shareholder’s equity (net income divided by shareholder’s equity). For a fund, the weighted average return on equity for the companies whose stocks it holds.
Short-Term Reserves. The percentage of a fund invested in highly liquid, short-term securities that can be readily converted to cash.
Turnover Rate. An indication of the fund’s trading activity. Funds with high turnover rates incur higher transaction costs and may be more likely to distribute capital gains (which may be taxable to investors). The turnover rate excludes in-kind transactions, which have minimal impact on costs.
Benchmark Information
REIT Spliced Index: MSCI US REIT Index adjusted to include a 2% cash position (Lipper Money Market Average) through April 30, 2009; MSCI US REIT Index thereafter.
38
This page intentionally left blank.
The People Who Govern Your Fund
The trustees of your mutual fund are there to see that the fund is operated and managed in your best interests since, as a shareholder, you are a part owner of the fund. Your fund’s trustees also serve on the board of directors of The Vanguard Group, Inc., which is owned by the Vanguard funds and provides services to them on an at-cost basis.
A majority of Vanguard’s board members are independent, meaning that they have no affiliation with Vanguard or the funds they oversee, apart from the sizable personal investments they have made as private individuals. The independent board members have distinguished backgrounds in business, academia, and public service. Each of the trustees and executive officers oversees 180 Vanguard funds.
The following table provides information for each trustee and executive officer of the fund. More information about the trustees is in the Statement of Additional Information, which can be obtained, without charge, by contacting Vanguard at 800-662-7447, or online at vanguard.com.
| |
| InterestedTrustee1 | and Delphi Automotive LLP (automotive components); |
| | Senior Advisor at New Mountain Capital. |
| F. William McNabb III | |
| Born 1957. Trustee Since July 2009. Chairman of the | Amy Gutmann |
| Board. Principal Occupation(s) During the Past Five | Born 1949. Trustee Since June 2006. Principal |
| Years: Chairman of the Board of The Vanguard Group, | Occupation(s) During the Past Five Years: President of |
| Inc., and of each of the investment companies served | the University of Pennsylvania; Christopher H. Browne |
| by The Vanguard Group, since January 2010; Director | Distinguished Professor of Political Science, School of |
| of The Vanguard Group since 2008; Chief Executive | Arts and Sciences, and Professor of Communication, |
| Officer and President of The Vanguard Group, and of | Annenberg School for Communication, with secondary |
| each of the investment companies served by The | faculty appointments in the Department of Philosophy, |
| Vanguard Group, since 2008; Director of Vanguard | School of Arts and Sciences, and at the Graduate |
| Marketing Corporation; Managing Director of The | School of Education, University of Pennsylvania; |
| Vanguard Group (1995–2008). | Trustee of the National Constitution Center; Chair |
| | of the Presidential Commission for the Study of |
| | Bioethical Issues. |
| IndependentTrustees | |
| | |
| Emerson U. Fullwood | JoAnn Heffernan Heisen |
| Born 1948. Trustee Since January 2008. Principal | Born 1950. Trustee Since July 1998. Principal |
| Occupation(s) During the Past Five Years: Executive | Occupation(s) During the Past Five Years: Corporate |
| Chief Staff and Marketing Officer for North America | Vice President and Chief Global Diversity Officer |
| and Corporate Vice President (retired 2008) of Xerox | (retired 2008) and Member of the Executive |
| Corporation (document management products and | Committee (1997–2008) of Johnson & Johnson |
| services); Executive in Residence and 2010 | (pharmaceuticals/medical devices/consumer |
| Distinguished Minett Professor at the Rochester | products); Director of Skytop Lodge Corporation |
| Institute of Technology; Director of SPX Corporation | (hotels), the University Medical Center at Princeton, |
| (multi-industry manufacturing), the United Way of | the Robert Wood Johnson Foundation, and the Center |
| Rochester, Amerigroup Corporation (managed health | for Talent Innovation; Member of the Advisory Board |
| care), the University of Rochester Medical Center, | of the Maxwell School of Citizenship and Public Affairs |
| Monroe Community College Foundation, and North | at Syracuse University. |
| Carolina A&T University. | |
| |
| Rajiv L. Gupta | F. Joseph Loughrey |
| Born 1945. Trustee Since December 2001.2 | Born 1949. Trustee Since October 2009. Principal |
| Principal Occupation(s) During the Past Five Years: | Occupation(s) During the Past Five Years: President |
| Chairman and Chief Executive Officer (retired 2009) | and Chief Operating Officer (retired 2009) of Cummins |
| and President (2006–2008) of Rohm and Haas Co. | Inc. (industrial machinery); Chairman of the Board |
| (chemicals); Director of Tyco International, Ltd. | of Hillenbrand, Inc. (specialized consumer services), |
| (diversified manufacturing and services), Hewlett- | and of Oxfam America; Director of SKF AB (industrial |
| Packard Co. (electronic computer manufacturing), | machinery), Hyster-Yale Materials Handling, Inc. |
| | (forklift trucks), the Lumina Foundation for Education, |
| | |
| and the V Foundation for Cancer Research; Member | Executive Officers | |
| of the Advisory Council for the College of Arts and | | |
| Letters and of the Advisory Board to the Kellogg | Glenn Booraem | |
| Institute for International Studies, both at the | Born 1967. Controller Since July 2010. Principal |
| University of Notre Dame. | Occupation(s) During the Past Five Years: Principal |
| | of The Vanguard Group, Inc.; Controller of each of |
| Mark Loughridge | the investment companies served by The Vanguard |
| Born 1953. Trustee Since March 2012. Principal | Group; Assistant Controller of each of the investment |
| Occupation(s) During the Past Five Years: Senior Vice | companies served by The Vanguard Group (2001–2010). |
| President and Chief Financial Officer (retired 2013) | | |
| at IBM (information technology services); Fiduciary | Thomas J. Higgins | |
| Member of IBM’s Retirement Plan Committee (2004– | Born 1957. Chief Financial Officer Since September |
| 2013); Member of the Council on Chicago Booth. | 2008. Principal Occupation(s) During the Past Five |
| | Years: Principal of The Vanguard Group, Inc.; Chief |
| Scott C. Malpass | Financial Officer of each of the investment companies |
| Born 1962. Trustee Since March 2012. Principal | served by The Vanguard Group; Treasurer of each of |
| Occupation(s) During the Past Five Years: Chief | the investment companies served by The Vanguard |
| Investment Officer and Vice President at the University | Group (1998–2008). | |
| of Notre Dame; Assistant Professor of Finance at the | | |
| Mendoza College of Business at Notre Dame; Member | Kathryn J. Hyatt | |
| of the Notre Dame 403(b) Investment Committee; | Born 1955. Treasurer Since November 2008. Principal |
| Board Member of TIFF Advisory Services, Inc. | Occupation(s) During the Past Five Years: Principal of |
| (investment advisor); Member of the Investment | The Vanguard Group, Inc.; Treasurer of each of the |
| Advisory Committees of the Financial Industry | investment companies served by The Vanguard |
| Regulatory Authority (FINRA) and of Major League | Group; Assistant Treasurer of each of the investment |
| Baseball. | companies served by The Vanguard Group (1988–2008). |
| |
| André F. Perold | Heidi Stam | |
| Born 1952. Trustee Since December 2004. Principal | Born 1956. Secretary Since July 2005. Principal |
| Occupation(s) During the Past Five Years: George | Occupation(s) During the Past Five Years: Managing |
| Gund Professor of Finance and Banking, Emeritus | Director of The Vanguard Group, Inc.; General Counsel |
| at the Harvard Business School (retired 2011); | of The Vanguard Group; Secretary of The Vanguard |
| Chief Investment Officer and Managing Partner of | Group and of each of the investment companies |
| HighVista Strategies LLC (private investment firm); | served by The Vanguard Group; Director and Senior |
| Director of Rand Merchant Bank; Overseer of the | Vice President of Vanguard Marketing Corporation. |
| Museum of Fine Arts Boston. | | |
| | Vanguard Senior ManagementTeam |
| Alfred M. Rankin, Jr. | | |
| Born 1941. Trustee Since January 1993. Principal | Mortimer J. Buckley | Chris D. McIsaac |
| Occupation(s) During the Past Five Years: Chairman, | Kathleen C. Gubanich | Michael S. Miller |
| President, and Chief Executive Officer of NACCO | Paul A. Heller | James M. Norris |
| Industries, Inc. (housewares/lignite), and of Hyster- | Martha G. King | Glenn W. Reed |
| Yale Materials Handling, Inc. (forklift trucks); Chairman | John T. Marcante | |
| of the Board of University Hospitals of Cleveland. | | |
| |
| Peter F. Volanakis | Chairman Emeritus and Senior Advisor |
| Born 1955. Trustee Since July 2009. Principal | | |
| Occupation(s) During the Past Five Years: President | John J. Brennan | |
| and Chief Operating Officer (retired 2010) of Corning | Chairman, 1996–2009 | |
| Incorporated (communications equipment); Trustee of | Chief Executive Officer and President, 1996–2008 |
| Colby-Sawyer College; Member of the Advisory Board | | |
| of the Norris Cotton Cancer Center and of the Advisory | | |
| Board of the Parthenon Group (strategy consulting). | Founder | |
| | John C. Bogle | |
| | Chairman and Chief Executive Officer, 1974–1996 |
1 Mr. McNabb is considered an “interested person,” as defined in the Investment Company Act of 1940, because he is an officer of the
Vanguard funds.
2 December 2002 for Vanguard Equity Income Fund, Vanguard Growth Equity Fund, the Vanguard Municipal Bond Funds, and the Vanguard
State Tax-Exempt Funds.
|  |
| | P.O. Box 2600 |
| | Valley Forge, PA 19482-2600 |
| |
| |
| |
| Connect with Vanguard® > vanguard.com | |
| |
| |
| |
| Fund Information > 800-662-7447 | The funds or securities referred to herein are not |
| Direct Investor Account Services > 800-662-2739 | sponsored, endorsed, or promoted by MSCI, and MSCI |
| | bears no liability with respect to any such funds or |
| Institutional Investor Services > 800-523-1036 | securities. The prospectus or the Statement of |
| Text Telephone for People | Additional Information contains a more detailed |
| With Hearing Impairment > 800-749-7273 | description of the limited relationship MSCI has with |
| | Vanguard and any related funds. |
| This material may be used in conjunction | |
| with the offering of shares of any Vanguard | |
| fund only if preceded or accompanied by | |
| the fund’s current prospectus. | |
| |
| All comparative mutual fund data are from Lipper, a | |
| Thomson Reuters Company, or Morningstar, Inc., unless | |
| otherwise noted. | |
| |
| You can obtain a free copy of Vanguard’s proxy voting | |
| guidelines by visiting vanguard.com/proxyreporting or by | |
| calling Vanguard at 800-662-2739. The guidelines are | |
| also available from the SEC’s website, sec.gov. In | |
| addition, you may obtain a free report on how your fund | |
| voted the proxies for securities it owned during the 12 | |
| months ended June 30. To get the report, visit either | |
| vanguard.com/proxyreporting or sec.gov. | |
| |
| You can review and copy information about your fund at | |
| the SEC’s Public Reference Room in Washington, D.C. To | |
| find out more about this public service, call the SEC at | |
| 202-551-8090. Information about your fund is also | |
| available on the SEC’s website, and you can receive | |
| copies of this information, for a fee, by sending a | |
| request in either of two ways: via e-mail addressed to | |
| publicinfo@sec.gov or via regular mail addressed to the | |
| Public Reference Section, Securities and Exchange | |
| Commission, Washington, DC 20549-1520. | |
| |
| | © 2014 The Vanguard Group, Inc. |
| | All rights reserved. |
| | Vanguard Marketing Corporation, Distributor. |
| |
| | Q1230 032014 |
Item 2: Code of Ethics. The Registrant has adopted a code of ethics that applies to the Registrant’s principal executive officer, principal financial officer, principal accounting officer or controller or persons performing similar functions. The Code of Ethics was amended during the reporting period covered by this report to make certain technical, non-material changes.
Item 3: Audit Committee Financial Expert. The following members of the Audit Committee have been determined by the Registrant’s Board of Trustees to be Audit Committee Financial Experts serving on its Audit Committee, and to be independent: Rajiv L. Gupta, Amy Gutmann, JoAnn Heffernan Heisen, F. Joseph Loughrey, Mark Loughridge, Scott C. Malpass, André F. Perold, and Alfred M. Rankin, Jr.
Item 4: Principal Accountant Fees and Services.
(a) Audit Fees.
Audit Fees of the Registrant
Fiscal Year Ended January 31, 2014: $173,000
Fiscal Year Ended January 31, 2013: $173,000
Aggregate Audit Fees of Registered Investment Companies in the Vanguard Group.
Fiscal Year Ended January 31, 2014: $5,714,113
Fiscal Year Ended January 31, 2013: $4,809,780
Includes fees billed in connection with audits of the Registrant and other registered investment companies in the Vanguard complex. Also includes fees billed in connection with audits of The Vanguard Group, Inc. and Vanguard Marketing Corporation for Fiscal Year Ended January 31, 2014.
(b) Audit-Related Fees.
Fiscal Year Ended January 31, 2014: $1,552,950
Fiscal Year Ended January 31, 2013: $1,812,565
Includes fees billed in connection with assurance and related services provided to the Registrant, other registered investment companies in the Vanguard complex, The Vanguard Group, Inc., and Vanguard Marketing Corporation.
(c) Tax Fees.
Fiscal Year Ended January 31, 2014: $110,000
Fiscal Year Ended January 31, 2013: $490,518
Includes fees billed in connection with tax compliance, planning, and advice services provided to the Registrant, other registered investment companies in the Vanguard complex,
The Vanguard Group, Inc., and Vanguard Marketing Corporation. Also includes fees billed in connection with certain tax services related to audits of the Registrant and other registered investment companies in the Vanguard complex for Fiscal Year Ended January 31, 2013.
(d) All Other Fees.
Fiscal Year Ended January 31, 2014: $132,000
Fiscal Year Ended January 31, 2013: $16,000
Includes fees billed for services related to tax reported information provided to the Registrant, other registered investment companies in the Vanguard complex, The Vanguard Group, Inc., and Vanguard Marketing Corporation.
(e) (1) Pre-Approval Policies. The policy of the Registrant’s Audit Committee is to consider and, if appropriate, approve before the principal accountant is engaged for such services, all specific audit and non-audit services provided to: the Registrant, other registered investment companies in the Vanguard complex, The Vanguard Group, Inc., and entities controlled by The Vanguard Group, Inc. that provide ongoing services to the Registrant. In making a determination, the Audit Committee considers whether the services are consistent with maintaining the principal accountant’s independence.
In the event of a contingency situation in which the principal accountant is needed to provide services in between scheduled Audit Committee meetings, the Chairman of the Audit Committee would be called on to consider and, if appropriate, pre-approve audit or permitted non-audit services in an amount sufficient to complete services through the next Audit Committee meeting, and to determine if such services would be consistent with maintaining the accountant’s independence. At the next scheduled Audit Committee meeting, services and fees would be presented to the Audit Committee for formal consideration, and, if appropriate, approval by the entire Audit Committee. The Audit Committee would again consider whether such services and fees are consistent with maintaining the principal accountant’s independence.
The Registrant’s Audit Committee is informed at least annually of all audit and non-audit services provided by the principal accountant to the Vanguard complex, whether such services are provided to: the Registrant, other registered investment companies in the Vanguard complex, The Vanguard Group, Inc., or other entities controlled by The Vanguard Group, Inc. that provide ongoing services to the Registrant.
(2) No percentage of the principal accountant’s fees or services were approved pursuant to the waiver provision of paragraph (c)(7)(i)(C) of Rule 2-01 of Regulation S-X.
(f) For the most recent fiscal year, over 50% of the hours worked under the principal accountant’s engagement were not performed by persons other than full-time, permanent employees of the principal accountant.
(g) Aggregate Non-Audit Fees.
Fiscal Year Ended January 31, 2014: $242,000
Fiscal Year Ended January 31, 2013: $506,518
Includes fees billed for non-audit services provided to the Registrant, other registered investment companies in the Vanguard complex, The Vanguard Group, Inc., and Vanguard Marketing Corporation.
(h) For the most recent fiscal year, the Audit Committee has determined that the provision of all non-audit services was consistent with maintaining the principal accountant’s independence.
Item 5: Audit Committee of Listed Registrants.
The Registrant is a listed issuer as defined in rule 10A-3 under the Securities Exchange Act of 1934 (“Exchange Act”). The Registrant has a separately-designated standing audit committee established in accordance with Section 3(a)(58)(A) of the Exchange Act. The Registrant’s audit committee members are: Emerson U. Fullwood, Rajiv L. Gupta, Amy Gutmann, JoAnn Heffernan Heisen, F. Joseph Loughrey, Mark Loughridge, Scott C. Malpass, André F. Perold, Alfred M. Rankin, Jr., and Peter F. Volanakis.
Item 6: Investments.
Not Applicable.
Item 7: Disclosure of Proxy Voting Policies and Procedures for Closed-End Management
Investment Companies.
Not Applicable.
Item 8: Portfolio Managers of Closed-End Management Investment Companies.
Not Applicable.
Item 9: Purchase of Equity Securities by Closed-End Management Investment Company and
Affiliated Purchasers.
Not Applicable.
Item 10: Submission of Matters to a Vote of Security Holders.
Not Applicable.
Item 11: Controls and Procedures.
(a) Disclosure Controls and Procedures. The Principal Executive and Financial Officers concluded that the Registrant’s Disclosure Controls and Procedures are effective based on their evaluation of the Disclosure Controls and Procedures as of a date within 90 days of the filing date of this report.
(b) Internal Control Over Financial Reporting. There were no significant changes in Registrant’s Internal Control Over Financial Reporting or in other factors that could significantly affect this control subsequent to the date of the evaluation, including any corrective actions with regard to significant deficiencies and material weaknesses.
Item 12: Exhibits.
(a) Code of Ethics.
(b) Certifications.
Pursuant to the requirements of the Securities Exchange Act of 1934 and the Investment Company Act of 1940, the registrant has duly caused this report to be signed on its behalf by the undersigned, thereunto duly authorized.
| |
| | VANGUARD SPECIALIZED FUNDS |
| |
| |
| BY: | /s/ F. WILLIAM MCNABB III* |
| | F. WILLIAM MCNABB III |
| | CHIEF EXECUTIVE OFFICER |
| |
| Date: March 19, 2014 |
Pursuant to the requirements of the Securities Exchange Act of 1934 and the Investment Company Act of 1940, this report has been signed below by the following persons on behalf of the registrant and in the capacities and on the dates indicated.
| |
| | VANGUARD SPECIALIZED FUNDS |
| |
BY: | /s/ F. WILLIAM MCNABB III* |
| | F. WILLIAM MCNABB III |
| | CHIEF EXECUTIVE OFFICER |
Date: March 19, 2014 |
| VANGUARD SPECIALIZED FUNDS |
| |
BY: | /s/ THOMAS J. HIGGINS* |
| THOMAS J. HIGGINS |
| | CHIEF FINANCIAL OFFICER |
Date: March 19, 2014 |
* By: /s/ Heidi Stam
Heidi Stam, pursuant to a Power of Attorney filed on March 27, 2012 see file Number 2-11444, Incorporated by Reference.