UNITED STATES
SECURITIES AND EXCHANGE COMMISSION
Washington, D.C. 20549
FORM N-CSR
CERTIFIED SHAREHOLDER REPORT
OF
REGISTERED MANAGEMENT INVESTMENT COMPANIES
Investment Company Act file number: 811-03916
Name of Registrant: Vanguard Specialized Funds
Address of Registrant:
P.O. Box 2600
Valley Forge, PA 19482
Name and address of agent for service:
Heidi Stam, Esquire
P.O. Box 876
Valley Forge, PA 19482
Registrant’s telephone number, including area code: (610) 669-1000
Date of fiscal year end: January 31
Date of reporting period: February 1, 2012 – January 31, 2013
Item 1: Reports to Shareholders

|
| Annual Report | January 31, 2013 |
| Vanguard Energy Fund |
|
 |
> Vanguard Energy Fund returned about 4% for the 12 months ended January 31, 2013.
> The fund’s return was slightly higher than that of its benchmark index and exceeded the average return of similar funds.
> The energy sector underperformed the broad U.S. stock market. Integrated oil and gas companies weighed on returns, while refining and marketing firms did particularly well.
| |
| Contents | |
| Your Fund’s Total Returns. | 1 |
| Chairman’s Letter. | 2 |
| Advisors’ Report. | 8 |
| Fund Profile. | 13 |
| Performance Summary. | 15 |
| Financial Statements. | 17 |
| Your Fund’s After-Tax Returns. | 31 |
| About Your Fund’s Expenses. | 32 |
| Glossary. | 34 |
Please note: The opinions expressed in this report are just that—informed opinions. They should not be considered promises or advice.
Also, please keep in mind that the information and opinions cover the period through the date on the front of this report. Of course, the risks of investing in your fund are spelled out in the prospectus.
See the Glossary for definitions of investment terms used in this report.
About the cover: Our cover photograph shows rigging on the HMSSurprise, a replica of an 18th-century Royal Navy frigate. It was featured in the 2003 movie Master and Commander: The Far Side of the World, which was based on Patrick O’Brian’s sea novels, set amid the Napoleonic Wars. Vanguard was named for another ship of that era, the HMSVanguard, which was the flagship of British Admiral Horatio Nelson at the Battle of the Nile.
| |
| Your Fund’s Total Returns | |
| |
| |
| |
| |
| Fiscal Year Ended January 31, 2013 | |
| |
| | Total |
| | Returns |
| Vanguard Energy Fund | |
| Investor Shares | 4.07% |
| Admiral™ Shares | 4.14 |
| MSCI ACWI Energy Index | 3.56 |
| Global Natural Resources Funds Average | -0.94 |
Global Natural Resources Funds Average: Derived from data provided by Lipper Inc.
Admiral Shares carry lower expenses and are available to investors who meet certain account-balance requirements.
Your Fund’s Performance at a Glance
January 31, 2012, Through January 31, 2013
| | | | |
| | | | Distributions Per Share |
| | Starting | Ending | Income | Capital |
| | Share Price | Share Price | Dividends | Gains |
| Vanguard Energy Fund | | | | |
| Investor Shares | $62.60 | $62.66 | $1.340 | $1.034 |
| Admiral Shares | 117.52 | 117.63 | 2.595 | 1.941 |
1

Chairman’s Letter
Dear Shareholder,
Vanguard Energy Fund returned about 4% for the fiscal year ended January 31, 2013. The fund’s result slightly surpassed that of its benchmark index and was well ahead of the average return of global natural resources funds, which invest in both energy and materials stocks.
After a disappointing first half of the period, crude oil and natural gas prices rebounded, which in turn helped energy stocks to end up in positive territory for the 12 months. Profitable selections among some refining and marketing firms were offset by setbacks in several large integrated oil and gas firms.
For the second straight fiscal year, the energy sector trailed the performance of the broader market. But unlike the situation in the previous year, when the Energy Fund’s return was negative, investors’ brighter outlook for the global economy helped push up energy consumption.
If you invest in the Energy Fund through a taxable account, you may wish to review information about the fund’s after-tax performance provided later in this report.
Led by European shares, stocks saw double-digit returns
Global stock markets rose sharply in the 12 months ended January 31, with European equities delivering the most robust results. Investors seemed buoyed by progress in addressing fiscal challenges in Europe and elsewhere.
2
European stocks gained about 20% even as economic woes persisted for many countries in the region. This disparity is less unusual than it may appear. Vanguard research has found that the relationship between a country’s economic growth and its stock market returns has typically been weak over time.
In the United States, attention to federal budget challenges intensified as 2012 drew to a close. The focus on the “fiscal cliff” led to investor anxiety before policymakers reached a limited tax rate agreement on the cusp of the new year. Although a credible long-term deficit-reduction strategy has yet to be crafted, investors propelled U.S. stocks to a 12-month gain of nearly 17%.
Bonds’ advance slowed; challenges may lie ahead
The broad U.S. taxable bond market returned a little more than 2.5% for the fiscal year. That modest result contrasts with the strong returns to which bond investors may have grown accustomed over recent years.
Bonds have been in a long-running bull market, as prices climbed and yields tumbled over many years. (Bond prices and yields move in opposite directions.) The yield of the 10-year U.S. Treasury note slipped to a record low in July, closing below 1.5%. That trend later reversed, and the 10-year yield broke 2% in late January.
| | | |
| Market Barometer | | | |
| |
| | | Average Annual Total Returns |
| | | Periods Ended January 31, 2013 |
| | One | Three | Five |
| | Year | Years | Years |
| Stocks | | | |
| Russell 1000 Index (Large-caps) | 17.03% | 14.48% | 4.28% |
| Russell 2000 Index (Small-caps) | 15.47 | 15.98 | 6.31 |
| Russell 3000 Index (Broad U.S. market) | 16.90 | 14.60 | 4.44 |
| MSCI All Country World Index ex USA (International) | 13.86 | 7.03 | -0.10 |
| |
| Bonds | | | |
| Barclays U.S. Aggregate Bond Index (Broad taxable market) | 2.59% | 5.41% | 5.45% |
| Barclays Municipal Bond Index (Broad tax-exempt market) | 4.80 | 6.53 | 5.73 |
| Citigroup Three-Month U.S. Treasury Bill Index | 0.08 | 0.09 | 0.38 |
| |
| CPI | | | |
| Consumer Price Index | 1.59% | 2.05% | 1.76% |
3
Bonds can provide critical diversification benefits to a portfolio, but their return prospects look much less promising than they have in recent years. As yields have dropped, the opportunity for price appreciation has greatly diminished. (You can read more about our expectations for bond and stock returns in Vanguard’s Economic and Investment Outlook, available at vanguard.com/research.)
As for money market funds and savings accounts, their returns barely budged as the Federal Reserve held short-term interest rates between 0% and 0.25%, a policy in place since late 2008.
Rebounding fuel prices helped energy stocks finish in the black
The energy sector rose during the 12-month period, but not as much as the market overall. The industry’s comparatively tepid performance was reflected in the Energy Fund’s return of about 4%, which lagged returns from U.S. and international markets.
During the first half of the period, energy stocks retreated modestly as sovereign-debt worries weighed down the European economy, growth in China appeared to decelerate, and oil prices declined, crimping profit margins for oil companies. Furthermore, overproduction and an unusually warm winter kept natural gas prices near decade lows.
Expense Ratios
Your Fund Compared With Its Peer Group
| | | |
| | Investor | Admiral | Peer Group |
| | Shares | Shares | Average |
| Energy Fund | 0.34% | 0.28% | 1.32% |
The fund expense ratios shown are from the prospectus dated May 29, 2012, and represent estimated costs for the current fiscal year. For the fiscal year ended January 31, 2013, the fund’s expense ratios were 0.31% for Investor Shares and 0.26% for Admiral Shares. The peer-group expense ratio is derived from data provided by Lipper Inc. and captures information through year-end 2012.
Peer group: Global Natural Resources Funds.
4
But the sector turned around in the period’s second half. Oil prices rebounded, with Brent crude, a benchmark based on oil produced outside the United States, soaring about 30% from June to January and finishing the 12 months up nearly 5%. In an unusual divergence, West Texas Intermediate Crude, a benchmark based on oil produced domestically, fell 1% during the 12 months as increased U.S. and Canadian production and a temporary distribution bottleneck held down prices in North America.
The fluctuations in global petroleum prices are noteworthy because the Energy Fund, its benchmark, and its peer group funds have all tended to follow the ups and downs of oil more in recent years than they did previously. Natural gas prices, meanwhile, finished the period up about one-third after U.S. gas drillers recalibrated their production to reduce oversupply.
U.S. refining and marketing stocks offset losses from foreign firms
The unexpected boost in U.S. energy production is remaking the energy landscape. Amidst these changes, your fund’s advisors continue to invest across the globe, seeking the best long-term energy-related investments. The fund’s strongest performers this past fiscal year included U.S. refining and marketing companies, a relatively small segment of the fund’s holdings that soared about 63%. These companies took advantage of being able to buy cheaper U.S. oil, which boosted profit margins.
Total Returns
Ten Years Ended January 31, 2013
| |
| | Average |
| | Annual Return |
| Energy Fund Investor Shares | 15.46% |
| Spliced Energy Index | 12.91 |
| Global Natural Resources Funds Average | 12.13 |
For a benchmark description, see the Glossary.
Global Natural Resources Funds Average: Derived from data provided by Lipper Inc.
The figures shown represent past performance, which is not a guarantee of future results. (Current performance may be lower or higher than the performance data cited. For performance data current to the most recent month-end, visit our website at vanguard.com/performance.) Note, too, that both investment returns and principal value can fluctuate widely, so an investor’s shares, when sold, could be worth more or less than their original cost.
5
Oil and gas exploration and production companies, the fund’s second-largest segment by asset size, rose modestly (+4%). The fund’s holdings in this subsector outperformed their counterparts in the benchmark index.
On the other hand, the fund’s holdings in integrated oil and gas companies—the largest subsector in both the fund and the index—barely gained ground, underperforming their counterparts in the index. Returns were especially
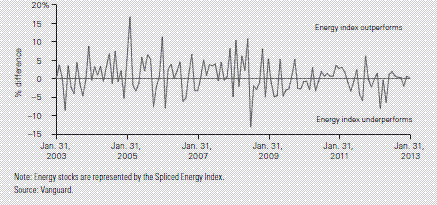
|
| Investment insight |
| A reminder about volatility |
| Energy stocks, like most industry sectors, tend to be more volatile than the broad |
| market. During the past ten years, the Spliced Energy Index, Vanguard Energy |
| Fund’s performance benchmark, has often risen or fallen to a greater degree |
| month-by-month than the S&P 500 Index, as the chart below shows. |
| |
| Such a result should be no surprise. After all, less diversification generally means |
| more risk. In the energy sector, the ups and downs are also consistent with the |
| dynamic variables inherent to the industry. These factors include dramatic price |
| spikes or declines, new drilling technologies, refining and distribution problems, and |
| geopolitical tumult—all of which have affected energy prices in recent years. The |
| sector’s volatility is one reason we suggest that the Energy Fund should typically |
| represent only a modest portion of a stock portfolio. |
| |
| Performance difference of energy stocks from S&P 500 Index |
| (January 31, 2003–January 31, 2013) |
|
 |
|
|
6
constrained by steep losses among some of the largest oil producers in South America.
For the ten years ended January 31, 2013, the fund had an average annual return of 15.46%, more than 2 percentage points ahead of its benchmark index and peer-group average. The broad market, as measured by the Dow Jones U.S. Total Stock Market Float Adjusted Index, had an average annual return of 8.8% for the same period.
The Advisors’ Report that follows this letter provides additional details about the management of the fund during the fiscal year.
Following four principles can help investors succeed
Our clients often ask what they should do to cope with uncertainties in the market. How should they react? Should they do something different with their money? The first point to keep in mind is that investing has always involved uncertainties. The financier J.P. Morgan, when asked what he thought the stock market would do, had a standard response: “It will fluctuate.”
In our view, the most sensible approach is to focus on what’s within your control. In short, we believe investors can give themselves a greater chance for success by acting on four key points:
• Goals. What are you investing for? Each goal should be measurable and attainable. Getting there shouldn’t depend on outsize returns, or on impractical budgeting requirements.
• Balance. After identifying your goals, pursue them through a balanced asset allocation using broadly diversified funds.
• Cost. You won’t be surprised to hear that we place a big emphasis on controlling cost. The lower your costs, the greater the share of an investment’s return that you keep.
• Discipline. All the rest depends on this: In the face of market turmoil, discipline and long-term perspective can help you stay on track toward your goals.
Successful investing doesn’t have to be complicated, but that’s not to say it’s easy. Investing can provoke strong emotions, and it’s hard to stay levelheaded during times of volatility. If you’re getting pulled off course, try to redirect your attention to the principles I’ve outlined. These principles—which reflect the core philosophy Vanguard has held for decades—can be the answer to uncertainty.
As always, thank you for investing with Vanguard.
Sincerely,

F. William McNabb III
Chairman and Chief Executive Officer
February 13, 2013
7
Advisors’ Report
Vanguard Energy Fund returned 4.07% for Investor Shares and 4.14% for Admiral Shares in the fiscal year ended January 31, 2013. Your fund is managed by two advisors, a strategy that enhances the fund’s diversification by providing exposure to distinct yet complementary investment approaches. It’s not uncommon for different advisors to have different views about individual securities or the broader investment environment.
The advisors, the amount and percentage of fund assets each manages, and brief descriptions of their investment strategies are presented in the table below. The advisors have also provided a discussion of the investment environment that existed during the year and of how their portfolio positioning reflects this assessment. These reports were prepared on February 19, 2013.
Wellington Management Company, LLP
Portfolio Manager:
Karl E. Bandtel, Senior Vice President
The investment environment
Broad-market equities around the world posted solid performance during the 12 months ended January 31, 2013, as the MSCI All Country World Index returned 15.5% (in U.S. dollar terms), outpacing the more modest performance of stocks in the energy sector.
| | | |
| Vanguard Energy Fund Investment Advisors | |
| |
| | Fund Assets Managed | |
| Investment Advisor | % | $ Million | Investment Strategy |
| Wellington Management | 95 | 11,507 | Emphasizes long-term total-return opportunities from |
| Company, LLP | | | the various energy subsectors: international oils, |
| | | | foreign integrated oils and foreign producers, North |
| | | | American producers, oil services and equipment, |
| | | | transportation and distribution, and refining and |
| | | | marketing. |
| Vanguard Equity Investment | 3 | 384 | Employs a quantitative fundamental management |
| Group | | | approach, using models that assess valuation, market |
| | | | sentiment, earnings quality and growth, and |
| | | | management decisions of companies relative to their |
| | | | peers. |
| Cash Investments | 2 | 228 | These short-term reserves are invested by Vanguard in |
| | | | equity index products to simulate investments in stock. |
| | | | Each advisor may also maintain a modest cash |
| | | | position. |
8
In commodities markets, competing crosscurrents were at play, particularly with oil. On the one hand, increasing production in the United States and Iraq, coupled with falling demand from developed markets, is exerting downward pressure on prices. On the other, increased demand from emerging markets and declining production outside North America and OPEC are supportive of higher prices. The price of crude oil fluctuated throughout the period, but it finished close to $98 per barrel (West Texas Intermediate), about where it started.
The price of natural gas in the United States, which began the fiscal year near $2.50 per million BTUs (Henry Hub), fell below $2 before advancing to $3.33 at the period’s close. Although its price rebounded from historical lows, natural gas remains, in our view, inexpensive compared with coal and oil, at least in North America. Over time, we believe that the replacement of oil with natural gas as a fuel source in the United States, Europe, and Asia presents a significant opportunity. This substitution, combined with the impact of several projects under way to facilitate the export of U.S. natural gas, is likely to further shrink the wide price disparity between global energy prices and North American natural gas.
Our successes
Stock selection within the energy equipment and services subsector—along with modest exposure to Beijing Enterprises Holdings, a Hong Kong-based industrial conglomerate—bolstered the portfolio’s relative returns.
Our position in shares of natural gas producer Cabot Oil & Gas was a notable contributor to the portfolio’s performance. The company announced strong results, driven largely by robust production in Pennsylvania’s Marcellus Shale. Cabot, whose entire resource base is in the continental United States, is a low-cost producer with a strong balance sheet. We believe the company should benefit from reduced natural gas production industrywide as prices remain below marginal cost. This cutback in production should ultimately lead to higher natural gas prices. We continue to hold the stock.
Marathon Petroleum is a U.S. refiner and marketer of petroleum products. Share prices nearly doubled during the period because of continued low feedstock costs as West Texas Intermediate crude remained inexpensive compared with global oil prices. In October, Marathon announced a deal to buy a refinery at an attractive valuation. We trimmed our position as the stock climbed.
9
Our shortfalls
Security selection among integrated oil and gas companies hindered relative returns. The portfolio’s significant detractors during the period included YPF, an Argentine integrated company. Shares fell when Argentina’s government took over day-to-day control (and a 51% majority stake) of the company by decree. YPF has an attractive asset profile at an inexpensive valuation relative to the rest of the energy universe, but our concerns that the government would not treat the company’s minority shareholders well did not diminish. We began reducing our holdings in YPF midway through the year and eliminated them altogether shortly before the period’s close.
Another detractor was Occidental Petroleum, an energy exploration and production company that operates principally in the United States (with promising assets in Texas, California, and North Dakota) and the Middle East. Occidental is among a select few exploration and production firms that have increased production while maintaining attractive returns on capital, generating excess free cash flow, and prioritizing the dividend.
The stock was out of favor during the fiscal year, at least in part because of investors’ concerns about performance in California and skepticism about large investments in Texas and the Mideast. In our view, the market’s concerns are overdone. Occidental has high leverage to oil, a strong outlook for production growth, and a solid track record of financial discipline. This discipline is reflected in the company’s sound balance sheet, robust cash flow, and commitment to maintaining dividend growth. We continue to hold the stock.
In a rising equity market, our cash position was also a slight drag on performance.
The fund’s positioning
Our long-term outlook for the energy sector remains favorable. However, as always, we urge caution regarding the near-term direction of commodity prices and the volatility inherent in investing in energy stocks. Over the long term, energy prices are likely to be bound by marginal cost on the low end and marginal utility on the high end. Crude oil prices will keep varying with changes to the outlook for both supply and demand. And although regional factors still drive natural gas pricing, we believe that the wide price disparity with other fuels and changing views about both coal-fired and nuclear power generation will drive global long-term demand.
The trends of growing demand, shrinking spare capacity, and logistical challenges favor resource owners, particularly those with high-quality assets and experienced management teams. We believe such companies are best positioned to succeed in an environment of a tight supply-and-demand balance and rising capital intensity. Given our view that the basic drivers of
10
energy prices persist, we remain focused on analyzing company fundamentals, with an eye toward taking advantage of cyclical opportunities. We also focus on capital allocation and cost structure to identify companies with a relative cost advantage.
The portfolio remains focused on upstream companies and skewed in favor of low-cost producers with compelling valuations, based on our assessment of their long-term resource bases. We believe that many of these companies can create value for shareholders absent generally rising commodity prices. Our investment process remains consistent, emphasizing large-capitalization integrated oil and exploration and production companies. Maintaining a large-cap, low-turnover bias, this global portfolio has representation across energy’s subsectors.
Vanguard Equity Investment Group
Portfolio Managers:
James D. Troyer, CFA, Principal
James P. Stetler, Principal Michael R. Roach, CFA
Energy stocks recovered in the second half of the fiscal year, along with the rest of the global market, but not enough to make up for a poor first half.
Our quantitative approach to investing focuses on specific stock fundamentals. Because we believe there is no single indicator for identifying outperforming stocks, we diversify our analysis across multiple factors:
• Valuation, which measures the price we pay for earnings and cash flows.
• Management decisions, which assesses the actions taken by company management that signal its informed opinions regarding a firm’s prospects and earnings.
• Market sentiment, which captures how investors reflect their opinions of a company through their activity in the market.
• Quality, which measures balance-sheet strength and the sustainability of earnings.
Our risk-control process then neutralizes the portfolio’s variance from our benchmark in market capitalization, volatility, and other factors. In our view, the possible rewards do not justify such risk exposures.
The results from our stock selection model were positive as a whole. Our quality model was flat, but all other factors contributed positively, with valuation the strongest.
For the period, our most successful holdings were spread throughout various global regions, including Marathon Petroleum (+99%) and HollyFrontier (+93%) in the United States, Lukoil (+22%) in Russia, and Polski Koncern Naftowy (+39%) in Poland. Equally important to performance was our ability to limit or avoid exposure to underperforming stocks, such as Italy’s Saipem (–38%) and Brazil’s OGX Petróleo (–78%).
11
The portfolio’s results were dampened by our overweighting of Japan Petroleum Exploration (–15%) and the Netherlands’ SBM Offshore (–26%), two energy stocks that underperformed the benchmark as a whole. In addition, our underweighting of stronger-performing stocks such as Transocean (+21%), based in Switzerland, and Colombia-based Ecopetrol (+32%) hurt results relative to the benchmark.
Since the 2008–2009 market decline ended, investors have been rewarded with attractive returns across asset classes. However, even with the United States recently averting the “fiscal cliff,” many serious issues remain. Low investor confidence and higher volatility—whether caused by sluggish economic growth here or abroad, unresolved deficit and debt levels, high unemployment, or ambiguity about corporate profits—may be with us for a while.
We cannot predict how broader economic or political events will affect the markets, but we are confident that our strategy to capture the spread between undervalued and overvalued stocks will deliver worthwhile returns for long-term investors and remain an important part of a diversified investment plan.
We thank you for your investment and look forward to the new fiscal year.
12
Energy Fund
Fund Profile
As of January 31, 2013
| | |
| Share-Class Characteristics | |
| | Investor | Admiral |
| | Shares | Shares |
| Ticker Symbol | VGENX | VGELX |
| Expense Ratio1 | 0.34% | 0.28% |
| 30-Day SEC Yield | 1.83% | 1.89% |
| | | |
| Portfolio Characteristics | | |
| | | | DJ U.S. |
| | | | Total |
| | | MSCI | Market |
| | | ACWI | FA |
| | Fund | Energy | Index |
| Number of Stocks | 128 | 170 | 3,595 |
| Median Market Cap | $40.0B | $73.3B | $37.6B |
| Price/Earnings Ratio | 12.2x | 11.3x | 17.2x |
| Price/Book Ratio | 1.6x | 1.6x | 2.2x |
| Return on Equity | 16.2% | 18.4% | 16.8% |
| Earnings Growth Rate | -2.2% | 1.6% | 9.1% |
| Dividend Yield | 2.2% | 2.9% | 2.0% |
| Foreign Holdings | 37.5% | 53.0% | 0.0% |
| Turnover Rate | 18% | — | — |
| Short-Term Reserves | 3.9% | — | — |
| | |
| Volatility Measures | | |
| | | DJ U.S. |
| | | Total |
| | Spliced | Market |
| | Energy | FA |
| | Index | Index |
| R-Squared | 0.98 | 0.84 |
| Beta | 1.03 | 1.36 |
These measures show the degree and timing of the fund’s fluctuations compared with the indexes over 36 months.
| | |
| Ten Largest Holdings (% of total net assets) |
| Exxon Mobil Corp. | Integrated Oil & Gas | 8.7% |
| Royal Dutch Shell plc | Integrated Oil & Gas | 5.4 |
| Chevron Corp. | Integrated Oil & Gas | 5.2 |
| BP plc | Integrated Oil & Gas | 4.1 |
| Occidental Petroleum | | |
| Corp. | Integrated Oil & Gas | 3.3 |
| Total SA | Integrated Oil & Gas | 3.0 |
| Schlumberger Ltd. | Oil & Gas Equipment | |
| | & Services | 2.3 |
| Anadarko Petroleum | Oil & Gas Exploration | |
| Corp. | & Production | 2.3 |
| Eni SPA | Integrated Oil & Gas | 2.1 |
| CONSOL Energy Inc. | Coal & Consumable | |
| | Fuels | 2.1 |
| Top Ten | | 38.5% |
The holdings listed exclude any temporary cash investments and equity index products.
1 The expense ratios shown are from the prospectus dated May 29, 2012, and represent estimated costs for the current fiscal year. For the fiscal year ended January 31, 2013, the expense ratios were 0.31% for Investor Shares and 0.26% for Admiral Shares.
13
Energy Fund
| |
| Market Diversification (% of equity exposure) |
| |
| Europe | |
| United Kingdom | 11.5% |
| France | 3.5 |
| Italy | 2.2 |
| Norway | 1.0 |
| Other | 1.6 |
| Subtotal | 19.8% |
| Pacific | |
| Japan | 2.0% |
| Other | 0.3 |
| Subtotal | 2.3% |
| Emerging Markets | |
| China | 2.5% |
| Russia | 2.3 |
| Brazil | 1.5 |
| Other | 1.0 |
| Subtotal | 7.3% |
| North America | |
| United States | 61.0% |
| Canada | 9.6 |
| Subtotal | 70.6% |
| | |
| Subindustry Diversification (% of equity exposure) | |
| | | MSCI |
| | | ACWI |
| | Fund | Energy |
| Coal & Consumable Fuels | 3.6% | 1.9% |
| Industrials | 0.9 | 0.0 |
| Integrated Oil & Gas | 46.7 | 54.9 |
| Oil & Gas Drilling | 2.2 | 2.6 |
| Oil & Gas Equipment & | | |
| Services | 9.0 | 9.6 |
| Oil & Gas Exploration & | | |
| Production | 29.7 | 20.3 |
| Oil & Gas Refining & Marketing | 5.6 | 5.8 |
| Oil & Gas Storage & | | |
| Transportation | 1.3 | 4.9 |
| Other | 1.0 | 0.0 |
14
Energy Fund
Performance Summary
All of the returns in this report represent past performance, which is not a guarantee of future results that may be achieved by the fund. (Current performance may be lower or higher than the performance data cited. For performance data current to the most recent month-end, visit our website at vanguard.com/performance.) Note, too, that both investment returns and principal value can fluctuate widely, so an investor’s shares, when sold, could be worth more or less than their original cost. The returns shown do not reflect taxes that a shareholder would pay on fund distributions or on the sale of fund shares.
Cumulative Performance: January 31, 2003, Through January 31, 2013
Initial Investment of $10,000
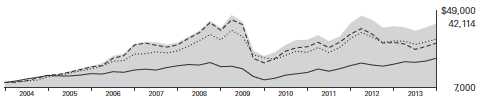
| | | | |
| | | Average Annual Total Returns | |
| | Periods Ended January 31, 2013 | |
| |
| | | | | Final Value |
| | One | Five | Ten | of a $10,000 |
| | Year | Years | Years | Investment |
| |
| Energy Fund Investor Shares | 4.07% | 1.30% | 15.46% | $42,114 |
| |
| Spliced Energy Index | 3.56 | 0.31 | 12.91 | 33,662 |
| Global Natural Resources Funds | | | | |
| Average | -0.94 | -3.89 | 12.13 | 31,410 |
| Dow Jones U.S. Total Stock Market | | | | |
| Float Adjusted Index | 16.88 | 4.61 | 8.80 | 23,250 |
For a benchmark description, see the Glossary.
Global Natural Resources Funds Average: Derived from data provided by Lipper Inc.
| | | | |
| | | | | Final Value |
| | One | Five | Ten | of a $50,000 |
| | Year | Years | Years | Investment |
| Energy Fund Admiral Shares | 4.14% | 1.36% | 15.54% | $211,989 |
| Spliced Energy Index | 3.56 | 0.31 | 12.91 | 168,311 |
| Dow Jones U.S. Total Stock Market Float | | | | |
| Adjusted Index | 16.88 | 4.61 | 8.80 | 116,248 |
See Financial Highlights for dividend and capital gains information.
15
Energy Fund
Fiscal-Year Total Returns (%): January 31, 2003, Through January 31, 2013
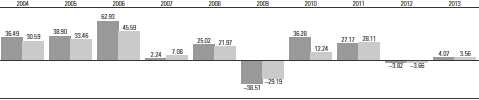
|
| Energy Fund Investor Shares |
| Spliced Energy Index |
For a benchmark description, see the Glossary.
Average Annual Total Returns: Periods Ended December 31, 2012
This table presents returns through the latest calendar quarter—rather than through the end of the fiscal period.
Securities and Exchange Commission rules require that we provide this information.
| | | | |
| | Inception | One | Five | Ten |
| | Date | Year | Years | Years |
| Investor Shares | 5/23/1984 | 2.67% | -1.99% | 14.64% |
| Admiral Shares | 11/12/2001 | 2.73 | -1.92 | 14.71 |
16
Energy Fund
Financial Statements
Statement of Net Assets
As of January 31, 2013
The fund reports a complete list of its holdings in regulatory filings four times in each fiscal year, at the quarter-ends. For the second and fourth fiscal quarters, the lists appear in the fund’s semiannual and annual reports to shareholders. For the first and third fiscal quarters, the fund files the lists with the Securities and Exchange Commission on Form N-Q. Shareholders can look up the fund’s Forms N-Q on the SEC’s website at sec.gov. Forms N-Q may also be reviewed and copied at the SEC’s Public Reference Room (see the back cover of this report for further information).
| | | |
| | | | Market |
| | | | Value |
| | | Shares | ($000) |
| Common Stocks (94.8%)1 | | |
| United States (57.3%) | | |
| Energy Equipment & Services (10.2%) | | |
| | Schlumberger Ltd. | 3,612,154 | 281,929 |
| | Baker Hughes Inc. | 5,246,680 | 234,632 |
| | Halliburton Co. | 5,291,397 | 215,254 |
| | Ensco plc Class A | 2,913,941 | 185,239 |
| | National Oilwell Varco Inc. | 1,252,206 | 92,839 |
| | SEACOR Holdings Inc. | 875,753 | 79,667 |
| * | Weatherford | | |
| | International Ltd. | 4,760,750 | 63,556 |
| | Transocean Ltd. | 1,115,307 | 63,249 |
| | Bristow Group Inc. | 199,882 | 11,389 |
| | Diamond Offshore | | |
| | Drilling Inc. | 35,800 | 2,688 |
| * | Nabors Industries Ltd. | 158,300 | 2,639 |
| | | | 1,233,081 |
| Exchange-Traded Fund (0.6%) | |
| ^,2 | Vanguard Energy ETF | 663,000 | 73,228 |
| |
| Oil, Gas & Consumable Fuels (46.5%) | |
| | Coal & Consumable Fuels (2.5%) | |
| | CONSOL Energy Inc. | 8,144,580 | 255,251 |
| | Peabody Energy Corp. | 2,050,985 | 51,582 |
| |
| | Integrated Oil & Gas (18.2%) | |
| | Exxon Mobil Corp. | 11,669,894 | 1,049,940 |
| | Chevron Corp. | 5,493,855 | 632,617 |
| | Occidental | | |
| | Petroleum Corp. | 4,514,416 | 398,488 |
| | Hess Corp. | 1,210,099 | 81,270 |
| | Murphy Oil Corp. | 792,400 | 47,164 |
| |
| | Oil & Gas Exploration & Production (21.4%) |
| | Anadarko Petroleum Corp. | 3,460,125 | 276,879 |
| | Cabot Oil & Gas Corp. | 4,531,452 | 239,170 |
| | EOG Resources Inc. | 1,616,891 | 202,079 |
| | Devon Energy Corp. | 3,502,355 | 200,300 |
| * | Southwestern Energy Co. | 4,962,040 | 170,198 |
| | | |
| | | | Market |
| | | | Value |
| | | Shares | ($000) |
| * | Denbury Resources Inc. | 8,950,734 | 166,752 |
| | Noble Energy Inc. | 1,506,179 | 162,351 |
| | EQT Corp. | 2,555,315 | 151,811 |
| | Range Resources Corp. | 2,224,125 | 149,394 |
| | ConocoPhillips | 2,500,754 | 145,044 |
| | Apache Corp. | 1,707,595 | 143,028 |
| | Pioneer Natural | | |
| | Resources Co. | 827,195 | 97,229 |
| | Chesapeake Energy Corp. | 4,594,432 | 92,716 |
| * | Cobalt International | | |
| | Energy Inc. | 3,074,622 | 74,437 |
| * | WPX Energy Inc. | 4,228,689 | 63,557 |
| | Marathon Oil Corp. | 1,850,346 | 62,190 |
| * | Whiting Petroleum Corp. | 1,250,655 | 59,506 |
| * | Newfield Exploration Co. | 1,855,658 | 54,742 |
| | Energen Corp. | 718,861 | 34,606 |
| * | Kosmos Energy Ltd. | 1,765,010 | 21,851 |
| *,^ | Ultra Petroleum Corp. | 634,916 | 11,568 |
| * | Laredo Petroleum | | |
| | Holdings Inc. | 471,700 | 8,703 |
| * | Plains Exploration & | | |
| | Production Co. | 36,020 | 1,720 |
| |
| | Oil & Gas Refining & Marketing (3.9%) |
| | Valero Energy Corp. | 4,593,974 | 200,894 |
| | Marathon Petroleum Corp. 2,028,175 | 150,511 |
| | Phillips 66 | 1,611,754 | 97,624 |
| * | PBF Energy Inc. | 443,200 | 14,803 |
| | HollyFrontier Corp. | 64,900 | 3,389 |
| |
| | Oil & Gas Storage & Transportation (0.5%) |
| | Kinder Morgan Inc. | 1,629,016 | 61,023 |
| | Williams Cos. Inc. | 123,300 | 4,322 |
| | | | 5,638,709 |
| Total United States | | 6,945,018 |
| International (37.5%) | | |
| Australia (0.3%) | | |
| | Oil Search Ltd. | 3,897,262 | 29,761 |
| | Caltex Australia Ltd. | 116,620 | 2,367 |
17
| | | |
| Energy Fund | | |
| |
| |
| |
| | | | Market |
| | | | Value |
| | | Shares | ($000) |
| | Woodside Petroleum Ltd. | 22,387 | 829 |
| | | | 32,957 |
| Austria (0.0%) | | |
| | OMV AG | 70,995 | 2,925 |
| |
| Brazil (1.4%) | | |
| | Petroleo Brasileiro | | |
| | SA ADR | 9,057,270 | 165,567 |
| | Petroleo Brasileiro | | |
| | SA Prior Pfd. | 385,244 | 3,498 |
| | Petroleo Brasileiro | | |
| | SA | 249,132 | 2,281 |
| | Petroleo Brasileiro | | |
| | SA ADR Type A | 81,450 | 1,473 |
| | | | 172,819 |
| Canada (9.2%) | | |
| | Canadian Natural | | |
| | Resources Ltd. | 7,839,568 | 236,912 |
| | Suncor Energy Inc. | 5,733,817 | 195,064 |
| | Cenovus Energy Inc. | 4,770,205 | 158,562 |
| | Encana Corp. | 7,078,325 | 137,036 |
| | TransCanada Corp. | 1,729,401 | 81,858 |
| * | Tourmaline Oil Corp. | 1,856,200 | 62,996 |
| | Canadian Oil Sands Ltd. | 2,826,210 | 59,393 |
| | Cameco Corp. | 2,573,670 | 55,463 |
| | Pacific Rubiales | | |
| | Energy Corp. | 2,061,295 | 48,091 |
| | Penn West | | |
| | Petroleum Ltd. | 2,608,021 | 26,393 |
| | Petrominerales Ltd. | 2,260,180 | 20,123 |
| * | Athabasca Oil Corp. | 1,519,900 | 16,138 |
| | Suncor Energy Inc. | 235,234 | 7,995 |
| | Encana Corp. | 180,400 | 3,487 |
| | Husky Energy Inc. | 102,600 | 3,199 |
| | Enbridge Inc. | 46,550 | 2,046 |
| | Canadian Natural | | |
| | Resources Ltd. | 65,078 | 1,965 |
| | Cenovus Energy Inc. | 33,639 | 1,117 |
| | Canadian Oil Sands Ltd. | | |
| | (Toronto Shares) | 40,900 | 861 |
| | | | 1,118,699 |
| China (2.4%) | | |
| | PetroChina Co. Ltd. ADR | 934,610 | 132,902 |
| | Beijing Enterprises | | |
| | Holdings Ltd. | 12,171,235 | 87,755 |
| | China Shenhua | | |
| | Energy Co. Ltd. | 11,588,390 | 49,831 |
| | CNOOC Ltd. | 2,962,717 | 6,097 |
| | China Petroleum & | | |
| | Chemical Corp. | 3,672,000 | 4,455 |
| | China Oilfield | | |
| | Services Ltd. | 1,114,000 | 2,412 |
| | PetroChina Co. Ltd. | 1,112,000 | 1,577 |
| | | |
| | | | Market |
| | | | Value |
| | | Shares | ($000) |
| * | China High Speed | | |
| | Transmission Equipment | | |
| | Group Co. Ltd. | 516,000 | 206 |
| | | | 285,235 |
| Finland (0.0%) | | |
| | Neste Oil Oyj | 152,229 | 2,429 |
| |
| France (3.4%) | | |
| | Total SA ADR | 6,392,765 | 347,063 |
| | Technip SA | 378,135 | 40,945 |
| | Total SA | 298,394 | 16,171 |
| * | Cie Generale de | | |
| | Geophysique - Veritas | 80,374 | 2,328 |
| | | | 406,507 |
| Hungary (0.0%) | | |
| | MOL Hungarian Oil | | |
| | and Gas plc | 31,961 | 2,752 |
| |
| India (0.8%) | | |
| | Reliance Industries Ltd. | 5,740,902 | 95,707 |
| | Oil & Natural Gas | | |
| | Corp. Ltd. | 444,511 | 2,839 |
| | Cairn India Ltd. | 322,307 | 1,959 |
| | | | 100,505 |
| Israel (0.0%) | | |
| | Delek Group Ltd. | 3,000 | 741 |
| |
| Italy (2.1%) | | |
| | Eni SPA ADR | 4,985,140 | 248,908 |
| | Eni SPA | 390,833 | 9,762 |
| | | | 258,670 |
| Japan (1.9%) | | |
| | Inpex Corp. | 28,493 | 164,968 |
| | JX Holdings Inc. | 11,176,470 | 65,939 |
| | Idemitsu Kosan Co. Ltd. | 23,700 | 2,078 |
| | | | 232,985 |
| Malaysia (0.0%) | | |
| | Petronas Dagangan Bhd. | 274,500 | 2,014 |
| |
| Norway (0.9%) | | |
| | Statoil ASA ADR | 3,968,560 | 105,286 |
| | Statoil ASA | 220,901 | 5,885 |
| | Aker Solutions ASA | 119,458 | 2,613 |
| | | | 113,784 |
| Poland (0.0%) | | |
| * | Polski Koncern Naftowy | | |
| | Orlen SA | 155,742 | 2,465 |
| * | Grupa Lotos SA | 147,504 | 1,911 |
| | | | 4,376 |
| Portugal (0.7%) | | |
| | Galp Energia SGPS SA | 4,956,196 | 80,451 |
| | |
| Energy Fund | | |
| |
| |
| |
| | | Market |
| | | Value |
| | Shares | ($000) |
| Russia (2.2%) | | |
| Gazprom OAO ADR | 16,615,955 | 156,489 |
| Rosneft OAO GDR | 10,482,740 | 92,027 |
| Lukoil OAO ADR | 102,145 | 6,887 |
| Tatneft OAO ADR | 75,220 | 3,465 |
| AK Transneft OAO | | |
| Prior Pfd. | 1,074 | 2,525 |
| TMK OAO GDR | 128,997 | 1,964 |
| Gazprom OAO | 124,674 | 590 |
| | | 263,947 |
| South Africa (0.1%) | | |
| Sasol Ltd. | 117,950 | 5,094 |
| |
| Spain (0.9%) | | |
| * Repsol SA | 4,885,444 | 108,952 |
| |
| Thailand (0.1%) | | |
| PTT PCL (Foreign) | 265,500 | 3,045 |
| PTT Exploration & | | |
| Production PCL (Foreign) | 516,000 | 2,882 |
| Thai Oil PCL (Foreign) | 930,700 | 2,302 |
| | | 8,229 |
| United Kingdom (11.1%) | | |
| Royal Dutch Shell | | |
| plc ADR | 6,798,495 | 479,430 |
| BP plc ADR | 10,614,065 | 472,538 |
| BG Group plc | 10,148,942 | 180,135 |
| Royal Dutch Shell | | |
| plc Class B | 4,168,037 | 151,497 |
| BP plc | 2,484,319 | 18,390 |
| * Genel Energy plc | 1,288,081 | 15,706 |
| Royal Dutch Shell | | |
| plc Class A | 387,301 | 13,730 |
| Royal Dutch Shell | | |
| plc Class A | | |
| (Amsterdam Shares) | 132,417 | 4,683 |
| AMEC plc | 127,701 | 2,188 |
| Tullow Oil plc | 16,591 | 299 |
| Cairn Energy plc | 1 | — |
| | | 1,338,596 |
| Total International | | 4,542,667 |
| Total Common Stocks | | |
| (Cost $7,231,992) | | 11,487,685 |
| | | | |
| | | | | Market |
| | | | | Value |
| | | | Shares | ($000) |
| Temporary Cash Investments (5.2%)1 | |
| Money Market Fund (1.2%) | | |
| 3,4 | Vanguard Market | | | |
| | Liquidity Fund, | | | |
| | 0.143% | 142,615,651 | 142,616 |
| |
| | | | Face | |
| | | | Amount | |
| | | | ($000) | |
| Repurchase Agreement (3.8%) | | |
| | RBS Securities, Inc. 0.130%, | | |
| | 2/1/13 (Dated 1/31/13, | | |
| | Repurchase Value | | | |
| | $463,502,000, collateralized | | |
| | by U.S. Treasury Note/Bonds | |
| | 0.250%–3.250%, | | | |
| | 2/28/13–12/31/16) | | 463,500 | 463,500 |
| |
| U.S. Government and Agency Obligations (0.2%) |
| 5,6 | Fannie Mae Discount | | |
| | Notes, 0.097%, 3/27/13 | 10,100 | 10,097 |
| 5 | Fannie Mae Discount | | |
| | Notes, 0.100%, 4/3/13 | 15,000 | 14,996 |
| 5,6 | Freddie Mac Discount | | |
| | Notes, 0.125%, 2/19/13 | 100 | 100 |
| | | | | 25,193 |
| Total Temporary Cash Investments | |
| (Cost $631,312) | | | 631,309 |
| Total Investments (100.0%) | | |
| (Cost $7,863,304) | | | 12,118,994 |
| Other Assets and Liabilities (0.0%) | |
| Other Assets | | | 67,588 |
| Liabilities4 | | | (68,002) |
| | | | | (414) |
| Net Assets (100%) | | | 12,118,580 |
19
| |
| Energy Fund | |
| |
| |
| |
| At January 31, 2013, net assets consisted of: |
| | Amount |
| | ($000) |
| Paid-in Capital | 7,908,688 |
| Overdistributed Net Investment Income | (22,363) |
| Accumulated Net Realized Losses | (28,038) |
| Unrealized Appreciation (Depreciation) | |
| Investment Securities | 4,255,690 |
| Futures Contracts | 4,583 |
| Foreign Currencies | 20 |
| Net Assets | 12,118,580 |
| |
| |
| Investor Shares—Net Assets | |
| Applicable to 85,224,294 outstanding | |
| $.001 par value shares of beneficial | |
| interest (unlimited authorization) | 5,340,387 |
| Net Asset Value Per Share— | |
| Investor Shares | $62.66 |
| |
| |
| Admiral Shares—Net Assets | |
| Applicable to 57,623,003 outstanding | |
| $.001 par value shares of beneficial | |
| interest (unlimited authorization) | 6,778,193 |
| Net Asset Value Per Share— | |
| Admiral Shares | $117.63 |
See Note A in Notes to Financial Statements.
* Non-income-producing security.
^ Part of security position is on loan to broker-dealers. The total value of securities on loan is $9,307,000.
1 The fund invests a portion of its cash reserves in equity markets through the use of index futures contracts. After giving effect to futures investments, the fund’s effective common stock and temporary cash investment positions represent 96.0% and 4.0%, respectively, of net assets.
2 Considered an affiliated company of the fund as the issuer is another member of The Vanguard Group.
3 Affiliated money market fund available only to Vanguard funds and certain trusts and accounts managed by Vanguard. Rate shown is the 7-day yield.
4 Includes $9,575,000 of collateral received for securities on loan.
5 The issuer was placed under federal conservatorship in September 2008; since that time, its daily operations have been managed by the Federal Housing Finance Agency and it receives capital from the U.S. Treasury, as needed to maintain a positive net worth, in exchange for senior preferred stock.
6 Securities with a value of $7,398,000 have been segregated as initial margin for open futures contracts.
ADR—American Depositary Receipt.
GDR—Global Depositary Receipt.
See accompanying Notes, which are an integral part of the Financial Statements.
20
| |
| Energy Fund | |
| |
| |
| Statement of Operations | |
| |
| | Year Ended |
| | January 31, 2013 |
| | ($000) |
| Investment Income | |
| Income | |
| Dividends1,2 | 287,135 |
| Interest2 | 749 |
| Security Lending | 8,556 |
| Total Income | 296,440 |
| Expenses | |
| Investment Advisory Fees—Note B | |
| Basic Fee | 17,136 |
| Performance Adjustment | (2,933) |
| The Vanguard Group—Note C | |
| Management and Administrative—Investor Shares | 9,295 |
| Management and Administrative—Admiral Shares | 7,411 |
| Marketing and Distribution—Investor Shares | 1,188 |
| Marketing and Distribution—Admiral Shares | 1,142 |
| Custodian Fees | 494 |
| Auditing Fees | 30 |
| Shareholders’ Reports—Investor Shares | 108 |
| Shareholders’ Reports—Admiral Shares | 26 |
| Trustees’ Fees and Expenses | 31 |
| Total Expenses | 33,928 |
| Net Investment Income | 262,512 |
| Realized Net Gain (Loss) | |
| Investment Securities Sold2 | 5,231 |
| Futures Contracts | 20,640 |
| Foreign Currencies | (443) |
| Realized Net Gain (Loss) | 25,428 |
| Change in Unrealized Appreciation (Depreciation) | |
| Investment Securities | 164,580 |
| Futures Contracts | (2,979) |
| Foreign Currencies | (17) |
| Change in Unrealized Appreciation (Depreciation) | 161,584 |
| Net Increase (Decrease) in Net Assets Resulting from Operations | 449,524 |
1 Dividends are net of foreign withholding taxes of $18,609,000.
2 Dividend income, interest income, and realized net gain (loss) from affiliated companies of the fund were $2,245,000, $155,000, and ($21,736,000), respectively.
See accompanying Notes, which are an integral part of the Financial Statements.
21
| | |
| Energy Fund | | |
| |
| |
| Statement of Changes in Net Assets | | |
| |
| | Year Ended January 31, |
| | 2013 | 2012 |
| | ($000) | ($000) |
| Increase (Decrease) in Net Assets | | |
| Operations | | |
| Net Investment Income | 262,512 | 224,513 |
| Realized Net Gain (Loss) | 25,428 | 612,079 |
| Change in Unrealized Appreciation (Depreciation) | 161,584 | (1,387,420) |
| Net Increase (Decrease) in Net Assets Resulting from Operations | 449,524 | (550,828) |
| Distributions | | |
| Net Investment Income | | |
| Investor Shares | (114,465) | (99,757) |
| Admiral Shares | (147,695) | (118,812) |
| Realized Capital Gain1 | | |
| Investor Shares | (98,885) | (241,252) |
| Admiral Shares | (111,067) | (269,367) |
| Total Distributions | (472,112) | (729,188) |
| Capital Share Transactions | | |
| Investor Shares | (570,595) | (156,067) |
| Admiral Shares | 10,358 | 535,094 |
| Net Increase (Decrease) from Capital Share Transactions | (560,237) | 379,027 |
| Total Increase (Decrease) | (582,825) | (900,989) |
| Net Assets | | |
| Beginning of Period | 12,701,405 | 13,602,394 |
| End of Period2 | 12,118,580 | 12,701,405 |
1 Includes fiscal 2013 and 2012 short-term gain distributions totaling $0 and $54,868,000, respectively. Short-term gain distributions are treated as ordinary income dividends for tax purposes.
2 Net Assets—End of Period includes undistributed (overdistributed) net investment income of ($22,363,000) and ($25,183,000).
See accompanying Notes, which are an integral part of the Financial Statements.
22
| | | | | |
| Energy Fund | | | | | |
| |
| |
| Financial Highlights | | | | | |
| |
| |
| Investor Shares | | | | | |
| |
| For a Share Outstanding | | | Year Ended January 31, |
| Throughout Each Period | 2013 | 2012 | 2011 | 2010 | 2009 |
| Net Asset Value, Beginning of Period | $62.60 | $69.20 | $57.17 | $42.62 | $73.93 |
| Investment Operations | | | | | |
| Net Investment Income | 1.336 | 1.072 | 1.053 | .910 | 1.2761 |
| Net Realized and Unrealized Gain (Loss) | | | | | |
| on Investments | 1.098 | (3.949) | 14.103 | 14.591 | (28.853) |
| Total from Investment Operations | 2.434 | (2.877) | 15.156 | 15.501 | (27.577) |
| Distributions | | | | | |
| Dividends from Net Investment Income | (1.340) | (1.102) | (.977) | (.951) | (1.264) |
| Distributions from Realized Capital Gains | (1.034) | (2.621) | (2.149) | — | (2.469) |
| Total Distributions | (2.374) | (3.723) | (3.126) | (.951) | (3.733) |
| Net Asset Value, End of Period | $62.66 | $62.60 | $69.20 | $57.17 | $42.62 |
| |
| Total Return2 | 4.07% | -3.82% | 27.17% | 36.28% | -38.51% |
| |
| Ratios/Supplemental Data | | | | | |
| Net Assets, End of Period (Millions) | $5,340 | $5,945 | $6,731 | $6,536 | $4,434 |
| Ratio of Total Expenses to | | | | | |
| Average Net Assets3 | 0.31% | 0.34% | 0.34% | 0.38% | 0.28% |
| Ratio of Net Investment Income to | | | | | |
| Average Net Assets | 2.15% | 1.67% | 1.74% | 1.73% | 1.84% |
| Portfolio Turnover Rate | 18% | 24% | 31% | 27% | 21% |
1 Calculated based on average shares outstanding.
2 Total returns do not include transaction or account service fees that may have applied in the periods shown. Fund prospectuses provide information about any applicable transaction and account service fees.
3 Includes performance-based investment advisory fee increases (decreases) of (0.02%), 0.01%, 0.00%, 0.03%, and 0.01%.
See accompanying Notes, which are an integral part of the Financial Statements.
23
| | | | | |
| Energy Fund | | | | | |
| |
| |
| Financial Highlights | | | | | |
| |
| |
| Admiral Shares | | | | | |
| |
| For a Share Outstanding | | | Year Ended January 31, |
| Throughout Each Period | 2013 | 2012 | 2011 | 2010 | 2009 |
| Net Asset Value, Beginning of Period | $117.52 | $129.93 | $107.34 | $80.02 | $138.86 |
| Investment Operations | | | | | |
| Net Investment Income | 2.586 | 2.101 | 2.045 | 1.780 | 2.4801 |
| Net Realized and Unrealized Gain (Loss) | | | | | |
| on Investments | 2.060 | (7.432) | 26.479 | 27.395 | (54.203) |
| Total from Investment Operations | 4.646 | (5.331) | 28.524 | 29.175 | (51.723) |
| Distributions | | | | | |
| Dividends from Net Investment Income | (2.595) | (2.159) | (1.899) | (1.855) | (2.480) |
| Distributions from Realized Capital Gains | (1.941) | (4.920) | (4.035) | — | (4.637) |
| Total Distributions | (4.536) | (7.079) | (5.934) | (1.855) | (7.117) |
| Net Asset Value, End of Period | $117.63 | $117.52 | $129.93 | $107.34 | $80.02 |
| |
| Total Return2 | 4.14% | -3.76% | 27.24% | 36.37% | -38.46% |
| |
| Ratios/Supplemental Data | | | | | |
| Net Assets, End of Period (Millions) | $6,778 | $6,756 | $6,871 | $4,439 | $2,889 |
| Ratio of Total Expenses to | | | | | |
| Average Net Assets3 | 0.26% | 0.28% | 0.28% | 0.31% | 0.21% |
| Ratio of Net Investment Income to | | | | | |
| Average Net Assets | 2.20% | 1.73% | 1.80% | 1.80% | 1.91% |
| Portfolio Turnover Rate | 18% | 24% | 31% | 27% | 21% |
1 Calculated based on average shares outstanding.
2 Total returns do not include transaction or account service fees that may have applied in the periods shown. Fund prospectuses provide information about any applicable transaction and account service fees.
3 Includes performance-based investment advisory fee increases (decreases) of (0.02%), 0.01%, 0.00%, 0.03%, and 0.01%.
See accompanying Notes, which are an integral part of the Financial Statements.
24
Energy Fund
Notes to Financial Statements
Vanguard Energy Fund is registered under the Investment Company Act of 1940 as an open-end investment company, or mutual fund. The fund invests in securities of foreign issuers, which may subject it to investment risks not normally associated with investing in securities of U.S. corporations. The fund offers two classes of shares: Investor Shares and Admiral Shares. Investor Shares are available to any investor who meets the fund’s minimum purchase requirements. Admiral Shares are designed for investors who meet certain administrative, service, and account-size criteria.
A. The following significant accounting policies conform to generally accepted accounting principles for U.S. mutual funds. The fund consistently follows such policies in preparing its financial statements.
1. Security Valuation: Securities are valued as of the close of trading on the New York Stock Exchange (generally 4 p.m., Eastern time) on the valuation date. Equity securities are valued at the latest quoted sales prices or official closing prices taken from the primary market in which each security trades; such securities not traded on the valuation date are valued at the mean of the latest quoted bid and asked prices. Securities for which market quotations are not readily available, or whose values have been affected by events occurring before the fund’s pricing time but after the close of the securities’ primary markets, are valued at their fair values calculated according to procedures adopted by the board of trustees. These procedures include obtaining quotations from an independent pricing service, monitoring news to identify significant market- or security-specific events, and evaluating changes in the values of foreign market proxies (for example, ADRs, futures contracts, or exchange-traded funds), between the time the foreign markets close and the fund’s pricing time. When fair-value pricing is employed, the prices of securities used by a fund to calculate its net asset value may differ from quoted or published prices for the same securities. Investments in Vanguard Market Liquidity Fund are valued at that fund’s net asset value. Temporary cash investments acquired over 60 days to maturity are valued using the latest bid prices or using valuations based on a matrix system (which considers such factors as security prices, yields, maturities, and ratings), both as furnished by independent pricing services. Other temporary cash investments are valued at amortized cost, which approximates market value.
2. Foreign Currency: Securities and other assets and liabilities denominated in foreign currencies are translated into U.S. dollars using exchange rates obtained from an independent third party as of the fund’s pricing time on the valuation date. Realized gains (losses) and unrealized appreciation (depreciation) on investment securities include the effects of changes in exchange rates since the securities were purchased, combined with the effects of changes in security prices. Fluctuations in the value of other assets and liabilities resulting from changes in exchange rates are recorded as unrealized foreign currency gains (losses) until the assets or liabilities are settled in cash, at which time they are recorded as realized foreign currency gains (losses).
3. Futures Contracts: The fund uses index futures contracts to a limited extent, with the objective of maintaining full exposure to the stock market while maintaining liquidity. The fund may purchase or sell futures contracts to achieve a desired level of investment, whether to accommodate portfolio turnover or cash flows from capital share transactions. The primary risks associated with the use of futures contracts are imperfect correlation between changes in market values of stocks held by the fund and the prices of futures contracts, and the possibility of an illiquid market.
Futures contracts are valued at their quoted daily settlement prices. The aggregate principal amounts of the contracts are not recorded in the Statement of Net Assets. Fluctuations in the value of the contracts are recorded in the Statement of Net Assets as an asset (liability) and in the Statement of Operations as unrealized appreciation (depreciation) until the contracts are closed, when they are recorded as realized futures gains (losses).
25
Energy Fund
During the year ended January 31, 2013, the fund’s average investment in futures contracts represented 1% of net assets, based on quarterly average aggregate settlement values.
4. Repurchase Agreements: The fund may enter into repurchase agreements. Securities pledged as collateral for repurchase agreements are held by a custodian bank until the agreements mature. Each agreement requires that the market value of the collateral be sufficient to cover payments of interest and principal. In the event of default or bankruptcy by the other party to the agreement, the fund may sell or retain the collateral; however, such action may be subject to legal proceedings.
5. Federal Income Taxes: The fund intends to continue to qualify as a regulated investment company and distribute all of its taxable income. Management has analyzed the fund’s tax positions taken for all open federal income tax years (January 31, 2010–2013), and has concluded that no provision for federal income tax is required in the fund’s financial statements.
6. Distributions: Distributions to shareholders are recorded on the ex-dividend date.
7. Security Lending: The fund may lend its securities to qualified institutional borrowers to earn additional income. Security loans are required to be secured at all times by collateral at least equal to the market value of securities loaned. The fund invests cash collateral received in Vanguard Market Liquidity Fund, and records a liability for the return of the collateral, during the period the securities are on loan. Security lending income represents fees charged to borrowers plus income earned on investing cash collateral, less expenses associated with the loan.
8. Other: Dividend income is recorded on the ex-dividend date. Interest income includes income distributions received from Vanguard Market Liquidity Fund and is accrued daily. Security transactions are accounted for on the date securities are bought or sold. Costs used to determine realized gains (losses) on the sale of investment securities are those of the specific securities sold. Fees assessed on redemptions of capital shares prior to May 23, 2012, were credited to paid-in capital.
Each class of shares has equal rights as to assets and earnings, except that each class separately bears certain class-specific expenses related to maintenance of shareholder accounts (included in Management and Administrative expenses) and shareholder reporting. Marketing and distribution expenses are allocated to each class of shares based on a method approved by the board of trustees. Income, other non-class-specific expenses, and gains and losses on investments are allocated to each class of shares based on its relative net assets.
B. Wellington Management Company, LLP, provides investment advisory services to a portion of the fund for a fee calculated at an annual percentage rate of average net assets managed by the advisor. The basic fee is subject to quarterly adjustments based on performance for the preceding three years relative to a combined index composed of the S&P Citigroup BMI World Energy Index and the S&P 500 Energy Equal Weighted Blend Index through July 31, 2010, and the current benchmark, MSCI ACWI Energy Index, thereafter. The benchmark will be fully phased in by July 2013.
The Vanguard Group provides investment advisory services to a portion of the fund on an at-cost basis; the fund paid Vanguard advisory fees of $342,000 for the year ended January 31, 2013.
For the year ended January 31, 2013, the aggregate investment advisory fee represented an effective annual basic rate of 0.14% of the fund’s average net assets, before a decrease of $2,933,000 (0.02%) based on performance.
C. The Vanguard Group furnishes at cost corporate management, administrative, marketing, and distribution services. The costs of such services are allocated to the fund under methods approved by the board of trustees. The fund has committed to provide up to 0.40% of its net assets in capital
26
Energy Fund
contributions to Vanguard. At January 31, 2013, the fund had contributed capital of $1,558,000 to Vanguard (included in Other Assets), representing 0.01% of the fund’s net assets and 0.62% of Vanguard’s capitalization. The fund’s trustees and officers are also directors and officers of Vanguard.
D. Various inputs may be used to determine the value of the fund’s investments. These inputs are summarized in three broad levels for financial statement purposes. The inputs or methodologies used to value securities are not necessarily an indication of the risk associated with investing in those securities.
Level 1—Quoted prices in active markets for identical securities.
Level 2—Other significant observable inputs (including quoted prices for similar securities, interest rates, prepayment speeds, credit risk, etc.).
Level 3—Significant unobservable inputs (including the fund’s own assumptions used to determine the fair value of investments).
The following table summarizes the market value of the fund’s investments as of January 31, 2013, based on the inputs used to value them:
| | | |
| | Level 1 | Level 2 | Level 3 |
| Investments | ($000) | ($000) | ($000) |
| Common Stocks—United States | 6,945,018 | — | — |
| Common Stocks—International | 3,077,645 | 1,465,022 | — |
| Temporary Cash Investments | 142,616 | 488,693 | — |
| Futures Contracts—Liabilities1 | (202) | — | — |
| Total | 10,165,077 | 1,953,715 | — |
| 1 Represents variation margin on the last day of the reporting period. |
E. At January 31, 2013, the aggregate settlement value of open futures contracts and the related unrealized appreciation (depreciation) were:
| | | | |
| | | | | ($000) |
| | | | Aggregate | |
| | | Number of | Settlement | Unrealized |
| | | Long (Short) | Value | Appreciation |
| Futures Contracts | Expiration | Contracts | Long (Short) | (Depreciation) |
| E-mini S&P 500 Index | March 2013 | 1,545 | 115,357 | 2,930 |
| S&P 500 Index | March 2013 | 95 | 35,466 | 1,653 |
Unrealized appreciation (depreciation) on open futures contracts is required to be treated as realized gain (loss) for tax purposes.
F. Distributions are determined on a tax basis and may differ from net investment income and realized capital gains for financial reporting purposes. Differences may be permanent or temporary. Permanent differences are reclassified among capital accounts in the financial statements to reflect their tax character. Temporary differences arise when certain items of income, expense, gain, or loss are recognized in different periods for financial statement and tax purposes; these differences will reverse at some time in the future. Differences in classification may also result from the treatment of short-term gains as ordinary income for tax purposes.
27
Energy Fund
During the year ended January 31, 2013, the fund realized net foreign currency losses of $443,000, which decreased distributable net income for tax purposes; accordingly, such losses have been reclassified from accumulated net realized losses to overdistributed net investment income. Certain of the fund’s investments are in securities considered to be “passive foreign investment companies,” for which any unrealized appreciation and/or realized gains are required to be included in distributable net investment income for tax purposes. During the year ended January, 31, 2013, the fund realized gains on the sale of passive foreign investment companies of $2,914,000 which have been included in current and prior periods’ taxable income; accordingly, such gains have been reclassified from accumulated net realized losses to overdistributed net investment income. Passive foreign investment companies held at January 31, 2013, had unrealized appreciation of $28,046,000.
For tax purposes, at January 31, 2013, the fund had $28,735,000 of ordinary income available for distribution. At January 31, 2013, the fund had available capital losses totaling $15,701,000 that may be carried forward indefinitely to offset future net capital gains.
At January 31, 2013, the cost of investment securities for tax purposes was $7,898,962,000. Net unrealized appreciation of investment securities for tax purposes was $4,220,032,000, consisting of unrealized gains of $4,418,274,000 on securities that had risen in value since their purchase and $198,242,000 in unrealized losses on securities that had fallen in value since their purchase.
G. During the year ended January 31, 2013, the fund purchased $2,131,318,000 of investment securities and sold $3,050,032,000 of investment securities, other than temporary cash investments.
H. Capital share transactions for each class of shares were:
| | | | |
| | | | Year Ended January 31, |
| | | 2013 | | 2012 |
| | Amount | Shares | Amount | Shares |
| | ($000) | (000) | ($000) | (000) |
| Investor Shares | | | | |
| Issued | 695,926 | 11,544 | 1,166,296 | 17,219 |
| Issued in Lieu of Cash Distributions | 204,348 | 3,375 | 328,737 | 5,528 |
| Redeemed1 | (1,470,869) | (24,672) | (1,651,100) | (25,049) |
| Net Increase (Decrease)—Investor Shares | (570,595) | (9,753) | (156,067) | (2,302) |
| Admiral Shares | | | | |
| Issued | 1,015,171 | 9,110 | 1,350,158 | 10,745 |
| Issued in Lieu of Cash Distributions | 233,904 | 2,064 | 352,941 | 3,171 |
| Redeemed1 | (1,238,717) | (11,038) | (1,168,005) | (9,311) |
| Net Increase (Decrease)—Admiral Shares | 10,358 | 136 | 535,094 | 4,605 |
1 Net of redemption fees for fiscal 2013 and 2012 of $642,000 and $2,001,000, respectively (fund totals). Effective May 23, 2012, the redemption fee was eliminated.
28
Energy Fund
I. The fund invested in a company that was considered to be an affiliated company of the fund because the fund owned more than 5% of the outstanding voting securities of the company. Transactions during the period in securities of this company were as follows:
| | | | | |
| | | | Current Period Transactions | |
| | Jan. 31, 2012 | | Proceeds from | | Jan. 31, 2013 |
| | Market | Purchases | Securities | Dividend | Market |
| | Value | at Cost | Sold | Income | Value |
| | ($000) | ($000) | ($000) | ($000) | ($000) |
| Nordic American Tankers Ltd. | 43,932 | — | 38,132 | 923 | — |
J. In preparing the financial statements as of January 31, 2013, management considered the impact of subsequent events for potential recognition or disclosure in these financial statements.
29
Report of Independent Registered
Public Accounting Firm
To the Trustees of Vanguard Specialized Funds and the Shareholders of Vanguard Energy Fund:
In our opinion, the accompanying statement of net assets and the related statements of operations and of changes in net assets and the financial highlights present fairly, in all material respects, the financial position of Vanguard Energy Fund (constituting a separate portfolio of Vanguard Specialized Funds, hereafter referred to as the “Fund”) at January 31, 2013, the results of its operations for the year then ended, the changes in its net assets for each of the two years in the period then ended and the financial highlights for each of the five years in the period then ended, in conformity with accounting principles generally accepted in the United States of America. These financial statements and financial highlights (hereafter referred to as “financial statements”) are the responsibility of the Fund’s management; our responsibility is to express an opinion on these financial statements based on our audits. We conducted our audits of these financial statements in accordance with the standards of the Public Company Accounting Oversight Board (United States). Those standards require that we plan and perform the audit to obtain reasonable assurance about whether the financial statements are free of material misstatement. An audit includes examining, on a test basis, evidence supporting the amounts and disclosures in the financial statements, assessing the accounting principles used and significant estimates made by management, and evaluating the overall financial statement presentation. We believe that our audits, which included confirmation of securities at January 31, 2013 by correspondence with the custodians and brokers and by agreement to the underlying ownership records of the transfer agent, provide a reasonable basis for our opinion.
PricewaterhouseCoopers LLP
Philadelphia, Pennsylvania
March 13, 2013
| |
| Special 2012 tax information (unaudited) for Vanguard Energy Fund |
This information for the fiscal year ended January 31, 2013, is included pursuant to provisions of the Internal Revenue Code.
The fund distributed $209,952,000 as capital gain dividends (from net long-term capital gains) to shareholders during the fiscal year.
The fund distributed $216,964,000 of qualified dividend income to shareholders during the fiscal year.
For corporate shareholders, 40.7% of investment income (dividend income plus short-term gains, if any) qualifies for the dividends-received deduction.
30
Your Fund’s After-Tax Returns
This table presents returns for your fund both before and after taxes. The after-tax returns are shown in two ways: (1) assuming that an investor owned the fund during the entire period and paid taxes on the fund’s distributions, and (2) assuming that an investor paid taxes on the fund’s distributions and sold all shares at the end of each period.
Calculations are based on the highest individual federal income tax and capital gains tax rates in effect at the times of the distributions and the hypothetical sales. State and local taxes were not considered. After-tax returns reflect any qualified dividend income, using actual prior-year figures and estimates for 2013. (In the example, returns after the sale of fund shares may be higher than those assuming no sale. This occurs when the sale would have produced a capital loss. The calculation assumes that the investor received a tax deduction for the loss.)
The table shows returns for Investor Shares only; returns for other share classes will differ. Please note that your actual after-tax returns will depend on your tax situation and may differ from those shown. Also note that if you own the fund in a tax-deferred account, such as an individual retirement account or a 401(k) plan, this information does not apply to you. Such accounts are not subject to current taxes.
Finally, keep in mind that a fund’s performance—whether before or after taxes—does not guarantee future results.
Average Annual Total Returns: Energy Fund Investor Shares
Periods Ended January 31, 2013
| | | |
| | One | Five | Ten |
| | Year | Years | Years |
| Returns Before Taxes | 4.07% | 1.30% | 15.46% |
| Returns After Taxes on Distributions | 3.39 | 0.50 | 14.62 |
| Returns After Taxes on Distributions and Sale of | | | |
| Fund Shares | 3.30 | 1.16 | 13.28 |
31
About Your Fund’s Expenses
As a shareholder of the fund, you incur ongoing costs, which include costs for portfolio management, administrative services, and shareholder reports (like this one), among others. Operating expenses, which are deducted from a fund’s gross income, directly reduce the investment return of the fund.
A fund’s expenses are expressed as a percentage of its average net assets. This figure is known as the expense ratio. The following examples are intended to help you understand the ongoing costs (in dollars) of investing in your fund and to compare these costs with those of other mutual funds. The examples are based on an investment of $1,000 made at the beginning of the period shown and held for the entire period.
The accompanying table illustrates your fund’s costs in two ways:
• Based on actual fund return. This section helps you to estimate the actual expenses that you paid over the period. The ”Ending Account Value“ shown is derived from the fund‘s actual return, and the third column shows the dollar amount that would have been paid by an investor who started with $1,000 in the fund. You may use the information here, together with the amount you invested, to estimate the expenses that you paid over the period.
To do so, simply divide your account value by $1,000 (for example, an $8,600 account value divided by $1,000 = 8.6), then multiply the result by the number given for your fund under the heading ”Expenses Paid During Period.“
• Based on hypothetical 5% yearly return. This section is intended to help you compare your fund‘s costs with those of other mutual funds. It assumes that the fund had a yearly return of 5% before expenses, but that the expense ratio is unchanged. In this case—because the return used is not the fund’s actual return—the results do not apply to your investment. The example is useful in making comparisons because the Securities and Exchange Commission requires all mutual funds to calculate expenses based on a 5% return. You can assess your fund’s costs by comparing this hypothetical example with the hypothetical examples that appear in shareholder reports of other funds.
Note that the expenses shown in the table are meant to highlight and help you compare ongoing costs only and do not reflect transaction costs incurred by the fund for buying and selling securities. Further, the expenses do not include any purchase, redemption, or account service fees described in the fund prospectus. If such fees were applied to your account, your costs would be higher. Your fund does not carry a “sales load.”
The calculations assume no shares were bought or sold during the period. Your actual costs may have been higher or lower, depending on the amount of your investment and the timing of any purchases or redemptions.
You can find more information about the fund’s expenses, including annual expense ratios, in the Financial Statements section of this report. For additional information on operating expenses and other shareholder costs, please refer to your fund’s current prospectus.
32
| | | |
| Six Months Ended January 31, 2013 | | | |
| | Beginning | Ending | Expenses |
| | Account Value | Account Value | Paid During |
| Energy Fund | 7/31/2012 | 1/31/2013 | Period |
| Based on Actual Fund Return | | | |
| Investor Shares | $1,000.00 | $1,107.75 | $1.75 |
| Admiral Shares | 1,000.00 | 1,108.18 | 1.43 |
| Based on Hypothetical 5% Yearly Return | | | |
| Investor Shares | $1,000.00 | $1,023.54 | $1.68 |
| Admiral Shares | 1,000.00 | 1,023.84 | 1.38 |
The calculations are based on expenses incurred in the most recent six-month period. The fund’s annualized six-month expense ratios for that period are 0.33% for Investor Shares and 0.27% for Admiral Shares. The dollar amounts shown as “Expenses Paid” are equal to the annualized expense ratio multiplied by the average account value over the period, multiplied by the number of days in the most recent six-month period, then divided by the number of days in the most recent 12-month period.
33
Glossary
30-Day SEC Yield. A fund’s 30-day SEC yield is derived using a formula specified by the U.S. Securities and Exchange Commission. Under the formula, data related to the fund’s security holdings in the previous 30 days are used to calculate the fund’s hypothetical net income for that period, which is then annualized and divided by the fund’s estimated average net assets over the calculation period. For the purposes of this calculation, a security’s income is based on its current market yield to maturity (for bonds), its actual income (for asset-backed securities), or its projected dividend yield (for stocks). Because the SEC yield represents hypothetical annualized income, it will differ—at times significantly—from the fund’s actual experience. As a result, the fund’s income distributions may be higher or lower than implied by the SEC yield.
Beta. A measure of the magnitude of a fund’s past share-price fluctuations in relation to the ups and downs of a given market index. The index is assigned a beta of 1.00. Compared with a given index, a fund with a beta of 1.20 typically would have seen its share price rise or fall by 12% when the index rose or fell by 10%. For this report, beta is based on returns over the past 36 months for both the fund and the index. Note that a fund’s beta should be reviewed in conjunction with its R-squared (see definition). The lower the R-squared, the less correlation there is between the fund and the index, and the less reliable beta is as an indicator of volatility.
Dividend Yield. Dividend income earned by stocks, expressed as a percentage of the aggregate market value (or of net asset value, for a fund). The yield is determined by dividing the amount of the annual dividends by the aggregate value (or net asset value) at the end of the period. For a fund, the dividend yield is based solely on stock holdings and does not include any income produced by other investments.
Earnings Growth Rate. The average annual rate of growth in earnings over the past five years for the stocks now in a fund.
Equity Exposure. A measure that reflects a fund’s investments in stocks and stock futures. Any holdings in short-term reserves are excluded.
Expense Ratio. A fund’s total annual operating expenses expressed as a percentage of the fund’s average net assets. The expense ratio includes management and administrative expenses, but does not include the transaction costs of buying and selling portfolio securities.
Foreign Holdings. The percentage of a fund represented by securities or depositary receipts of companies based outside the United States.
Inception Date. The date on which the assets of a fund (or one of its share classes) are first invested in accordance with the fund’s investment objective. For funds with a subscription period, the inception date is the day after that period ends. Investment performance is measured from the inception date.
Median Market Cap. An indicator of the size of companies in which a fund invests; the midpoint of market capitalization (market price x shares outstanding) of a fund’s stocks, weighted by the proportion of the fund’s assets invested in each stock. Stocks representing half of the fund’s assets have market capitalizations above the median, and the rest are below it.
Price/Book Ratio. The share price of a stock divided by its net worth, or book value, per share. For a fund, the weighted average price/book ratio of the stocks it holds.
34
Price/Earnings Ratio. The ratio of a stock’s current price to its per-share earnings over the past year. For a fund, the weighted average P/E of the stocks it holds. P/E is an indicator of market expectations about corporate prospects; the higher the P/E, the greater the expectations for a company’s future growth.
R-Squared. A measure of how much of a fund’s past returns can be explained by the returns from the market in general, as measured by a given index. If a fund’s total returns were precisely synchronized with an index’s returns, its R-squared would be 1.00. If the fund’s returns bore no relationship to the index’s returns, its R-squared would be 0. For this report, R-squared is based on returns over the past 36 months for both the fund and the index.
Return on Equity. The annual average rate of return generated by a company during the past five years for each dollar of shareholder’s equity (net income divided by shareholder’s equity). For a fund, the weighted average return on equity for the companies whose stocks it holds.
Short-Term Reserves. The percentage of a fund invested in highly liquid, short-term securities that can be readily converted to cash.
Turnover Rate. An indication of the fund’s trading activity. Funds with high turnover rates incur higher transaction costs and may be more likely to distribute capital gains (which may be taxable to investors). The turnover rate excludes in-kind transactions, which have minimal impact on costs.
Benchmark Information
Spliced Energy Index: S&P 500 Index through November 30, 2000; S&P Energy Sector Index through May 31, 2010; MSCI All Country World Energy Index thereafter.
35
The People Who Govern Your Fund
The trustees of your mutual fund are there to see that the fund is operated and managed in your best interests since, as a shareholder, you are a part owner of the fund. Your fund’s trustees also serve on the board of directors of The Vanguard Group, Inc., which is owned by the Vanguard funds and provides services to them on an at-cost basis.
A majority of Vanguard’s board members are independent, meaning that they have no affiliation with Vanguard or the funds they oversee, apart from the sizable personal investments they have made as private individuals. The independent board members have distinguished backgrounds in business, academia, and public service. Each of the trustees and executive officers oversees 180 Vanguard funds.
The following table provides information for each trustee and executive officer of the fund. More information about the trustees is in the Statement of Additional Information, which can be obtained, without charge, by contacting Vanguard at 800-662-7447, or online at vanguard.com.
| |
| InterestedTrustee1 | and Delphi Automotive LLP (automotive components); |
| | Senior Advisor at New Mountain Capital; Trustee of |
| F. William McNabb III | The Conference Board. |
| Born 1957. Trustee Since July 2009. Chairman of the | |
| Board. Principal Occupation(s) During the Past Five | Amy Gutmann |
| Years: Chairman of the Board of The Vanguard Group, | Born 1949. Trustee Since June 2006. Principal |
| Inc., and of each of the investment companies served | Occupation(s) During the Past Five Years: President |
| by The Vanguard Group, since January 2010; Director | of the University of Pennsylvania; Christopher H. |
| of The Vanguard Group since 2008; Chief Executive | Browne Distinguished Professor of Political Science |
| Officer and President of The Vanguard Group and of | in the School of Arts and Sciences with secondary |
| each of the investment companies served by The | appointments at the Annenberg School for |
| Vanguard Group since 2008; Director of Vanguard | Communication and the Graduate School of Education |
| Marketing Corporation; Managing Director of The | of the University of Pennsylvania; Member of the |
| Vanguard Group (1995–2008). | National Commission on the Humanities and Social |
| | Sciences; Trustee of Carnegie Corporation of New |
| | York and of the National Constitution Center; Chair |
| IndependentTrustees | of the U. S. Presidential Commission for the Study |
| | of Bioethical Issues. |
| Emerson U. Fullwood | |
| Born 1948. Trustee Since January 2008. Principal | JoAnn Heffernan Heisen |
| Occupation(s) During the Past Five Years: Executive | Born 1950. Trustee Since July 1998. Principal |
| Chief Staff and Marketing Officer for North America | Occupation(s) During the Past Five Years: Corporate |
| and Corporate Vice President (retired 2008) of Xerox | Vice President and Chief Global Diversity Officer |
| Corporation (document management products and | (retired 2008) and Member of the Executive |
| services); Executive in Residence and 2010 | Committee (1997–2008) of Johnson & Johnson |
| Distinguished Minett Professor at the Rochester | (pharmaceuticals/medical devices/consumer |
| Institute of Technology; Director of SPX Corporation | products); Director of Skytop Lodge Corporation |
| (multi-industry manufacturing), the United Way of | (hotels), the University Medical Center at Princeton, |
| Rochester, Amerigroup Corporation (managed health | the Robert Wood Johnson Foundation, and the Center |
| care), the University of Rochester Medical Center, | for Talent Innovation; Member of the Advisory Board |
| Monroe Community College Foundation, and North | of the Maxwell School of Citizenship and Public Affairs |
| Carolina A&T University. | at Syracuse University. |
|
| Rajiv L. Gupta | F. Joseph Loughrey |
| Born 1945. Trustee Since December 2001.2 | Born 1949. Trustee Since October 2009. Principal |
| Principal Occupation(s) During the Past Five Years: | Occupation(s) During the Past Five Years: President |
| Chairman and Chief Executive Officer (retired 2009) | and Chief Operating Officer (retired 2009) of Cummins |
| and President (2006–2008) of Rohm and Haas Co. | Inc. (industrial machinery); Director of SKF AB |
| (chemicals); Director of Tyco International, Ltd. | (industrial machinery), Hillenbrand, Inc. (specialized |
| (diversified manufacturing and services), Hewlett- | consumer services), the Lumina Foundation for |
| Packard Co. (electronic computer manufacturing), | |
| |
| | |
| Education, and Oxfam America; Chairman of the | Executive Officers | |
| Advisory Council for the College of Arts and Letters | | |
| and Member of the Advisory Board to the Kellogg | Glenn Booraem | |
| Institute for International Studies at the University | Born 1967. Controller Since July 2010. Principal |
| of Notre Dame. | Occupation(s) During the Past Five Years: Principal |
| | of The Vanguard Group, Inc.; Controller of each of |
| Mark Loughridge | the investment companies served by The Vanguard |
| Born 1953. Trustee Since March 2012. Principal | Group; Assistant Controller of each of the investment |
| Occupation(s) During the Past Five Years: Senior Vice | companies served by The Vanguard Group (2001–2010). |
| President and Chief Financial Officer at IBM (information | | |
| technology services); Fiduciary Member of IBM’s | Thomas J. Higgins | |
| Retirement Plan Committee. | Born 1957. Chief Financial Officer Since September |
| | 2008. Principal Occupation(s) During the Past Five |
| Scott C. Malpass | Years: Principal of The Vanguard Group, Inc.; Chief |
| Born 1962. Trustee Since March 2012. Principal | Financial Officer of each of the investment companies |
| Occupation(s) During the Past Five Years: Chief | served by The Vanguard Group; Treasurer of each of |
| Investment Officer and Vice President at the University | the investment companies served by The Vanguard |
| of Notre Dame; Assistant Professor of Finance at the | Group (1998–2008). | |
| Mendoza College of Business at Notre Dame; Member | | |
| of the Notre Dame 403(b) Investment Committee; | Kathryn J. Hyatt | |
| Director of TIFF Advisory Services, Inc. (investment | Born 1955. Treasurer Since November 2008. Principal |
| advisor); Member of the Investment Advisory | Occupation(s) During the Past Five Years: Principal of |
| Committees of the Financial Industry Regulatory | The Vanguard Group, Inc.; Treasurer of each of the |
| Authority (FINRA) and of Major League Baseball. | investment companies served by The Vanguard |
| | Group; Assistant Treasurer of each of the investment |
| André F. Perold | companies served by The Vanguard Group (1988–2008). |
| Born 1952. Trustee Since December 2004. Principal | | |
| Occupation(s) During the Past Five Years: George | Heidi Stam | |
| Gund Professor of Finance and Banking at the Harvard | Born 1956. Secretary Since July 2005. Principal |
| Business School (retired 2011); Chief Investment | Occupation(s) During the Past Five Years: Managing |
| Officer and Managing Partner of HighVista Strategies | Director of The Vanguard Group, Inc.; General Counsel |
| LLC (private investment firm); Director of Rand | of The Vanguard Group; Secretary of The Vanguard |
| Merchant Bank; Overseer of the Museum of Fine | Group and of each of the investment companies |
| Arts Boston. | served by The Vanguard Group; Director and Senior |
| | Vice President of Vanguard Marketing Corporation. |
| Alfred M. Rankin, Jr. | | |
| Born 1941. Trustee Since January 1993. Principal | Vanguard Senior ManagementTeam | |
| Occupation(s) During the Past Five Years: Chairman, | | |
| President, and Chief Executive Officer of NACCO | Mortimer J. Buckley | Chris D. McIsaac |
| Industries, Inc. (housewares/lignite) and of Hyster-Yale | Kathleen C. Gubanich | Michael S. Miller |
| Materials Handling, Inc. (forklift trucks); Director of | Paul A. Heller | James M. Norris |
| the National Association of Manufacturers; Chairman | Martha G. King | Glenn W. Reed |
| of the Board of University Hospitals of Cleveland; | | |
| Advisory Chairman of the Board of The Cleveland | Chairman Emeritus and Senior Advisor | |
| Museum of Art. | | |
| | John J. Brennan | |
| Peter F. Volanakis | Chairman, 1996–2009 | |
| Born 1955. Trustee Since July 2009. Principal | Chief Executive Officer and President, 1996–2008 | |
| Occupation(s) During the Past Five Years: President | | |
| and Chief Operating Officer (retired 2010) of Corning | Founder | |
| Incorporated (communications equipment); Director | | |
| of SPX Corporation (multi-industry manufacturing); | John C. Bogle | |
| Overseer of the Amos Tuck School of Business | Chairman and Chief Executive Officer, 1974–1996 | |
| Administration at Dartmouth College; Advisor to the | | |
| Norris Cotton Cancer Center. | | |
1 Mr. McNabb is considered an “interested person,” as defined in the Investment Company Act of 1940, because he is an officer of the Vanguard funds.
2 December 2002 for Vanguard Equity Income Fund, Vanguard Growth Equity Fund, the Vanguard Municipal Bond Funds, and the Vanguard State Tax-Exempt Funds.
|  |
| P.O. Box 2600 |
| Valley Forge, PA 19482-2600 |
Connect with Vanguard® > vanguard.com
| |
| Fund Information > 800-662-7447 | CFA® is a trademark owned by CFA Institute. |
| Direct Investor Account Services > 800-662-2739 | |
| Institutional Investor Services > 800-523-1036 | |
| Text Telephone for People | |
| With Hearing Impairment > 800-749-7273 | |
| |
| This material may be used in conjunction | |
| with the offering of shares of any Vanguard | |
| fund only if preceded or accompanied by | |
| the fund’s current prospectus. | |
| |
| All comparative mutual fund data are from Lipper Inc. or | |
| Morningstar, Inc., unless otherwise noted. | |
| |
| You can obtain a free copy of Vanguard’s proxy voting | |
| guidelines by visiting vanguard.com/proxyreporting or by | |
| calling Vanguard at 800-662-2739. The guidelines are | |
| also available from the SEC’s website, sec.gov. In | |
| addition, you may obtain a free report on how your fund | |
| voted the proxies for securities it owned during the 12 | |
| months ended June 30. To get the report, visit either | |
| vanguard.com/proxyreporting or sec.gov. | |
| |
| You can review and copy information about your fund at | |
| the SEC’s Public Reference Room in Washington, D.C. To | |
| find out more about this public service, call the SEC at | |
| 202-551-8090. Information about your fund is also | |
| available on the SEC’s website, and you can receive | |
| copies of this information, for a fee, by sending a | |
| request in either of two ways: via e-mail addressed to | |
| publicinfo@sec.gov or via regular mail addressed to the | |
| Public Reference Section, Securities and Exchange | |
| Commission, Washington, DC 20549-1520. | |
| |
| |
| | © 2013 The Vanguard Group, Inc. |
| | All rights reserved. |
| | Vanguard Marketing Corporation, Distributor. |
| |
| | Q510 032013 |
| 
|
| Annual Report | January 31, 2013 |
| Vanguard Precious Metals and Mining Fund |
|
 |
> For the fiscal year ended January 31, 2013, Vanguard Precious Metals and Mining Fund returned –26.13%.
> The fund trailed the result of its benchmark and the average return of its peer funds for the period.
> Holdings in diversified metals and mining companies weighed heaviest on the fund’s performance.
| |
| Contents | |
| Your Fund’s Total Returns. | 1 |
| Chairman’s Letter. | 2 |
| Advisor’s Report. | 8 |
| Fund Profile. | 11 |
| Performance Summary. | 12 |
| Financial Statements. | 14 |
| Your Fund’s After-Tax Returns. | 24 |
| About Your Fund’s Expenses. | 25 |
| Glossary. | 27 |
Please note: The opinions expressed in this report are just that—informed opinions. They should not be considered promises or advice.
Also, please keep in mind that the information and opinions cover the period through the date on the front of this report. Of course, the risks of investing in your fund are spelled out in the prospectus.
See the Glossary for definitions of investment terms used in this report.
About the cover: Our cover photograph shows rigging on the HMSSurprise, a replica of an 18th-century Royal Navy frigate. It was featured in the 2003 movie Master and Commander: The Far Side of the World, which was based on Patrick O’Brian’s sea novels, set amid the Napoleonic Wars. Vanguard was named for another ship of that era, the HMSVanguard, which was the flagship of British Admiral Horatio Nelson at the Battle of the Nile.
| |
| Your Fund’s Total Returns | |
| |
| |
| |
| |
| Fiscal Year Ended January 31, 2013 | |
| |
| | Total |
| | Returns |
| Vanguard Precious Metals and Mining Fund | -26.13% |
| S&P Custom Precious Metals and Mining Index | -15.05 |
| Precious Metals Equity Funds Average | -24.13 |
| Precious Metals Equity Funds Average: Derived from data provided by Lipper Inc. | |
Your Fund’s Performance at a Glance
January 31, 2012, Through January 31, 2013
| | | | |
| | | | Distributions Per Share |
| | Starting | Ending | | |
| | Share | Share | Income | Capital |
| | Price | Price | Dividends | Gains |
| Vanguard Precious Metals and Mining Fund | $22.14 | $15.46 | $0.710 | $0.300 |
1

Chairman’s Letter
Dear Shareholder,
For the fiscal year ended January 31, 2013, Vanguard Precious Metals and Mining Fund returned –26.13%. The fund lagged its benchmark, the Standard & Poor’s Custom Precious Metals and Mining Index, which returned –15.05% for the period. The fund also trailed the –24.13% average return of its peers.
The fund’s holdings in the diversified metals and mining industry and among gold-related companies weighed heaviest on returns. A lack of exposure to gold bullion also hindered results.
If you hold the fund in a taxable account, you may wish to review the information on after-tax performance provided later in this report.
Led by European shares, stocks saw double-digit returns
Global stock markets rose sharply in the 12 months ended January 31, with equities in Europe delivering the most robust results. Investors seemed buoyed by progress in addressing fiscal challenges there and elsewhere.
European stocks gained about 20% even as many countries in the region continued to struggle with economic woes. This disparity isn’t as unusual as it may appear. Vanguard research has found that the relationship between a country’s economic growth and its stock market returns has typically been weak over time.
2
In the United States, attention to federal budget challenges intensified as 2012 drew to a close. The focus on the “fiscal cliff” led to investor anxiety before policymakers reached a limited tax-rate agreement on the cusp of the new year. Although a credible long-term deficit-reduction strategy has yet to be crafted, investors propelled U.S. stocks to a 12-month gain of nearly 17% for the fund’s fiscal year.
Bonds’ advance slowed; challenges may lie ahead
The broad U.S. taxable bond market returned a little more than 2.5% for the fiscal year. That modest result contrasts with the strong returns to which bond investors may have grown accustomed.
Bonds have been in a long-running bull market, as prices climbed and yields tumbled over many years. (Bond prices and yields move in opposite directions.) Indeed, the yield of the 10-year U.S. Treasury note slipped to a record low in July, closing below 1.5%. Recently, however, that trend reversed, and the 10-year yield broke 2% in late January.
Bonds can provide critical diversification benefits to a portfolio, but their return prospects look much less promising than in recent years. As yields have dropped, the opportunity for price appreciation has greatly diminished. (You can read more about our expectations for bond and stock returns in Vanguard’s Economic and Investment Outlook, available at vanguard.com/research.)
| | | |
| Market Barometer | | | |
| |
| | | Average Annual Total Returns |
| | | Periods Ended January 31, 2013 |
| | One | Three | Five |
| | Year | Years | Years |
| Stocks | | | |
| Russell 1000 Index (Large-caps) | 17.03% | 14.48% | 4.28% |
| Russell 2000 Index (Small-caps) | 15.47 | 15.98 | 6.31 |
| Russell 3000 Index (Broad U.S. market) | 16.90 | 14.60 | 4.44 |
| MSCI All Country World Index ex USA (International) | 13.86 | 7.03 | -0.10 |
| |
| Bonds | | | |
| Barclays U.S. Aggregate Bond Index (Broad taxable market) | 2.59% | 5.41% | 5.45% |
| Barclays Municipal Bond Index (Broad tax-exempt market) | 4.80 | 6.53 | 5.73 |
| Citigroup Three-Month U.S. Treasury Bill Index | 0.08 | 0.09 | 0.38 |
| |
| CPI | | | |
| Consumer Price Index | 1.59% | 2.05% | 1.76% |
3
As for money market funds and savings accounts, their returns barely budged as the Federal Reserve held short-term interest rates between 0% and 0.25%, a policy in place since late 2008.
Poor stock selection leads to disappointing results
Vanguard Precious Metals and Mining Fund offers exposure to a concentrated area of the market, investing primarily in companies that are involved in the mining of, or exploration for, precious and rare metals and minerals.
During the fiscal year, stock selection in diversified metals and mining companies, as well as in gold mining companies, weighed on the fund’s performance.
Within diversified metals and mining, the fund avoided or had limited exposure to some of the industry’s top performers, which hurt the fund’s return compared with the index, as did its lack of exposure to gold bullion.
While the fund has historically had less of its assets in gold stocks than its peers, in recent years your fund’s advisor, M&G Investment Management, had increased the fund’s exposure to this category. At the end of last year, gold stocks accounted for about 56% of the fund’s assets. However, during the most recent 12-month period, M&G began once again to scale back the fund’s exposure to gold. At the close of the reporting period, gold stocks accounted for less than 30% of the fund’s holdings, compared with about 38% for the index.
| | |
| Expense Ratios | | |
| Your Fund Compared With Its Peer Group | | |
| | | Peer Group |
| | Fund | Average |
| Precious Metals and Mining Fund | 0.29% | 1.30% |
The fund expense ratio shown is from the prospectus dated May 29, 2012, and represents estimated costs for the current fiscal year. For the fiscal year ended January 31, 2013, the fund’s expense ratio was 0.26%. The peer-group expense ratio is derived from data provided by Lipper Inc. and captures information through year-end 2012.
Peer group: Precious Metals Equity Funds.
4
While limiting the fund’s position in gold stocks, the advisor simultaneously increased the portfolio’s exposure to chemical companies—more specifically, fertilizer and agricultural companies—which aren’t typically included in the index. At the end of the reporting period, chemical companies accounted for about 27% of the fund’s holdings. (In comparison, chemical stocks made up less than 1% of the index.) Exposure to these stocks added modestly to performance.
The fund turned in another decade of solid performance
For the ten-year period ended January 31, 2013, the fund posted an average annual return of 11.94%. The fund’s performance trailed that of its benchmark (12.85%) and peers (12.47%) but outpaced that of the broad U.S. stock market (8.53%, as measured by the Russell 3000 Index).
This year’s disappointing return had an impact on the fund’s ten-year results; when I wrote to you a year ago, the fund had an average annual return of 18.13%. At the time, I noted that it would be unwise to expect that level of performance to continue, since, especially for a fund that focuses on a narrow slice of the market, periods of exceptional strength typically give way to results that bring performance more in line with long-term averages.
| |
| Total Returns | |
| Ten Years Ended January 31, 2013 | |
| | Average |
| | Annual Return |
| Precious Metals and Mining Fund | 11.94% |
| Spliced Precious Metals and Mining Index | 12.85 |
| Precious Metals Equity Funds Average | 12.47 |
For a benchmark description, see the Glossary.
Precious Metals Equity Funds Average: Derived from data provided by Lipper Inc.
The figures shown represent past performance, which is not a guarantee of future results. (Current performance may be lower or higher than the performance data cited. For performance data current to the most recent month-end, visit our website at vanguard.com/performance.) Note, too, that both investment returns and principal value can fluctuate widely, so an investor’s shares, when sold, could be worth more or less than their original cost.
5
Although recent struggles may have moderated the fund’s long-term results, it nonetheless has produced double-digit returns over the past decade. The fund’s performance is a credit to M&G—the London-based firm that has managed the fund since its inception in 1984. We believe that the team’s ongoing efforts, accompanied by the fund’s low costs, will continue to generate competitive results over the long term.
Following four principles can help investors succeed
Our clients often ask what they should do to cope with uncertainties in the market. How should they react? Should they do something different with their money?
The first point to keep in mind is that investing has always involved uncertainties. The financier J.P. Morgan, when asked what he thought the stock market would do, had a standard response: “It will fluctuate.”
In our view at Vanguard, the most sensible approach is to focus on what’s within an investor’s control. In short, we believe investors can give themselves a greater chance for success by acting on four key points:
• Goals. What are you investing for? Each goal should be measurable and attainable. Getting there shouldn’t depend on outsize returns, or on impractical budgeting requirements.
|
| Investment insight |
| A broader focus sets your fund apart from its peers—and gold prices |
| As an investor in Vanguard Precious Metals and Mining Fund, you may have noticed |
| that your fund doesn’t perform in lockstep with the price of gold. This is to be |
| expected. Unlike other funds in its category, it isn’t a “gold” fund. Some of its peers |
| invest directly in gold bullion, and some have a distinct focus on the stocks of |
| companies operating in the gold industry. Your fund has no exposure to the actual |
| metal, and while it may hold the stocks of gold-mining companies, it has a broader |
| mandate and invests in an array of equities related to precious metals, base metals, |
| minerals, and mining. |
| |
| Although the Precious Metals and Mining Fund may be more diversified, on average, |
| than competing funds, it does invest in a concentrated area of the market. Vanguard |
| generally advises that funds with such a relatively narrow focus play a supporting— |
| rather than a lead—role in a balanced, diversified portfolio. |
6
• Balance. After identifying your goals, pursue them through a balanced asset allocation using broadly diversified funds.
• Cost. You won’t be surprised to hear that we place a big emphasis on controlling cost. The lower your costs, the greater the share of an investment’s return that you keep.
• Discipline. All the rest depends on this: In the face of market turmoil, discipline and long-term perspective can help you stay on track toward your goals.
Successful investing doesn’t have to be complicated, but that’s not to say it’s easy. Investing can provoke strong emotions, and it’s hard to stay level-headed during times of volatility. If you’re getting pulled off course, try to redirect your attention to the principles I’ve outlined. These principles—which reflect the core philosophy Vanguard has held for decades—can be the answer to uncertainty.
As always, thank you for investing with Vanguard.
Sincerely,

F. William McNabb III
Chairman and Chief Executive Officer
February 15, 2013
7
Advisor’s Report
Vanguard Precious Metals and Mining Fund produced a return of –26.13% over the 12-month period ended January 31, 2013. This was behind the customized benchmark index, which returned –15.05%, and the peer average return of –24.13%.
The markets
During the first half of the reporting period, concern about slower growth in China dominated the headlines, hurting investor sentiment. Looking to restore confidence in the markets, U.S. Federal Reserve Chairman Ben Bernanke committed to further asset purchases and European Central Bank President Mario Draghi promised ‘‘to do whatever it takes’’ to get the economy back on track. Markets responded positively in the latter part of 2012, as Chinese growth concerns abated and the United States avoided its ‘‘fiscal cliff.’’
Despite the uncertainty, most commodity prices remained high by historical standards, although this was not necessarily reflected in the share prices of mining companies. While strong material prices suggest robust underlying demand, the stock valuations of miners are subject to additional factors that materially affected performance. In our view, this divergence stems mostly from poor stewardship of shareholder capital by management. The number and size of write-downs across the industry reflect profligate merger-and-acquisition deals that have destroyed value for investors. Other contributing factors have included failure by management to control cost inflation, the rise in geopolitical events that affect mine production, and, as a consequence of these issues, personnel changes among senior managers.
The fund’s performance
As investors, the core tenets we seek when identifying future investments are trustworthy management that aligns company and minority shareholder interests; low-cost, high-quality assets in structurally compelling industries; and operations in territories with manageable geopolitical risk. These are our ideals. However, no one investment is free of complications. In a world of increasingly scarce resources, miners and investors must look further afield for opportunities. Sometimes, in our view, the market’s appraisal of geopolitical risk can be too severe, disproportionately undervaluing a company. Conversely, too much credit can be given to companies operating in a stable jurisdiction, leaving them with no margin for error. When identifying long-term investments that will create value for investors, all these factors come into play, as does a valuation that does not reflect the full potential of the business.
Two gold producers, Centerra Gold and Nevsun Resources, suffered last year as a result of their operating environment. The Kyrgyz Republic’s opposition party brought allegations over Centerra Gold’s operating practices, depressing the share price. Centerra Gold assured us that the claims were unsubstantiated, and we believe that once the issue is resolved the true value of the asset will be reflected. Nevsun Resources’ key operations were
8
affected by social unrest in Eritrea. In both cases, we believe the impact on share prices, although significant, will be short-lived and so continue to support the management teams.
Australian metal and mineral producers hurt performance. Slow progress on its key iron ore project in Western Australia depressed the share price of Aquila Resources. The significant rebound in the price of iron ore, however, did allow the shares to recover some of their losses. The CEO’s ability to raise capital and to reallocate it into the project leads us to continue to support the company. Copper miner OZ Minerals, in our view, continues to be materially undervalued. In spite of a weaker copper price, the low-cost miner continues to generate strong cash flows. The CEO continues to wait for the right strategic opportunity to invest the substantial cash on the balance sheet, meanwhile returning cash to shareholders through a doubling of the dividend.
Turning to positives, Imerys, the French diversified minerals miner, rose in value throughout the period. Since taking over in 2011, the CEO has developed the company’s portfolio into a unique group of specialist mineral assets, offering a valuable and diversified range of revenue streams. Harry Winston Diamond, the Canadian diamond miner and luxury brand business, also performed strongly. The company sold its retail luxury brand to Swiss watch company Swatch, unlocking value for investors and enabling the business to reallocate funds to its higher-returning core diamond mining business.
Umicore, a Belgium-based metal processor, was another strong performer. Through its innovative recycling plant, the company has effectively become one of the world’s largest platinum producers without taking any traditional mining risks. The industry continues to be affected by social and political troubles in South Africa, where more than 75% of the world’s platinum is produced. We believe maintaining exposure to the metal is crucial. Demand remains robust, both for jewelry and for use in catalytic converters as vehicle emission regulations tighten, while supply is becoming increasingly constrained.
Purchases and sales
During the period, we reduced the fund’s exposure to gold equities while increasing our positions in companies that mine a range of other metals and minerals. The largest purchases during the year were in potash producers. Potash is a key component in fertilizer, which is required to increase arable land yields in a world where the diets of consumers in emerging markets are becoming more protein-based. We initiated new positions in Canadian-listed Potash Corporation of Saskatchewan and U.S.-based Mosaic, while adding further to German-listed K+S as short-term pressure on the price of potash continued to affect the company’s share price.
The potash industry meets the fund’s investment criteria of high barriers to entry for new production, disciplined industry participants, and strong long-term demand with limited option for substitution. While pricing has been subdued, we expect that
9
to change as China and India replenish stocks after more than a year’s absence from the market.
Mineral sands producer Iluka Resources was added to after the share price fell sharply following the CEO’s decision to cut production in the face of slowing demand. In our view, this was a prudent decision that preserves the value of the company’s scarce asset for when demand, and therefore pricing power, returns.
As we explained in the semiannual report six months ago, the majority of portfolio sales took place in the first half of the period, as we sold down our gold exposure because of industry and stock-specific concerns. One significant reduction was in U.S.-listed Newmont Mining. Despite signs of improving capital discipline, the company failed to obtain the requisite operating permits before investing heavily in one of its Peruvian projects, stalling production and raising costs. We further reduced our position in Canadian-listed Eldorado Gold because of operational concerns regarding recently purchased assets in Greece. Alacer Gold was also sold down because of senior management changes and concerns over the future direction of the business. We also made complete sales in U.S.-listed Minefinders and NovaGold Resources. Minefinders was the subject of a takeover by Pan American Silver, enabling us to sell our holding at a significant premium. In the case of NovaGold Resources, we exited our position after losing confidence in management’s ability to operate the business effectively.
Looking ahead
We continue to believe that the appetite for a broad range of commodities will be supported over many years by infrastructure expenditure worldwide, as well as by industrialization and rising urbanization in developing markets. We shall closely monitor individual companies’ success in managing issues such as dividend policy within the gold industry, rising taxation across the mining industry as governments decide to take a greater share of the economic rent, and labor relations as workers jostle for their share of natural resources profits. (In that regard, the fund has little exposure to South Africa.) We note with interest the departure of several major mining companies’ CEOs. If the replacements adopt a more disciplined approach to managing shareholder capital, a new tone will be set for the industry, benefiting investors.
We remain convinced of the merits of sticking to our long-term principles and focusing both on company fundamentals and on structural supply/demand imbalances for selected metals and minerals. We shall continue to invest in financially sound, well-managed companies with strategically important assets whose value is not properly appreciated by investors.
Portfolio Managers:
Graham E. French
Matthew Vaight, UKSIP
M&G Investment Management Ltd.
February 25, 2013
10
Precious Metals and Mining Fund
| | | |
| Fund Profile | | |
| As of January 31, 2013 | | |
| |
| Portfolio Characteristics | | |
| | | S&P | |
| | | Custom | DJ U.S. |
| | | Precious | Total |
| | | Metals and | Market |
| | | Mining | FA |
| | Fund | Index | Index |
| Number of Stocks | 47 | 352 | 3,595 |
| Median Market Cap | $2.3B | $21.3B | $37.6B |
| Price/Earnings Ratio | 20.3x | 17.0x | 17.2x |
| Price/Book Ratio | 1.7x | 1.6x | 2.2x |
| Return on Equity | 11.1% | 14.2% | 16.8% |
| Earnings Growth Rate | 24.6% | 17.8% | 9.1% |
| Dividend Yield | 2.1% | 2.2% | 2.0% |
| Foreign Holdings | 87.5% | 89.9% | 0.0% |
| Turnover Rate | 30% | — | — |
| Ticker Symbol | VGPMX | — | — |
| Expense Ratio1 | 0.29% | — | — |
| Short-Term Reserves | 0.5% | — | — |
| |
| Market Diversification (% of equity exposure) |
| |
| Europe | |
| United Kingdom | 11.1% |
| Germany | 6.8 |
| Belgium | 6.5 |
| France | 5.0 |
| Other | 0.2 |
| Subtotal | 29.6% |
| Pacific | |
| Australia | 30.9% |
| Emerging Markets | |
| Russia | 2.3% |
| Other | 0.1 |
| Subtotal | 2.4% |
| North America | |
| Canada | 24.8% |
| United States | 12.3 |
| Subtotal | 37.1% |
| | |
| Volatility Measures | | |
| | S&P | |
| | Custom | DJ |
| | Precious | U.S. |
| | Metals and | Total |
| | Mining | Market |
| | Index FA | Index |
| R-Squared | 0.95 | 0.46 |
| Beta | 1.12 | 1.28 |
These measures show the degree and timing of the fund’s fluctuations compared with the indexes over 36 months.
| | |
| Ten Largest Holdings (% of total net assets) |
| Hochschild Mining plc | Precious Metals & | |
| | Minerals | 8.7% |
| Potash Corp. of | Fertilizers & | |
| Saskatchewan Inc. | Agricultural | |
| | Chemicals | 7.1 |
| K+S AG | Fertilizers & | |
| | Agricultural | |
| | Chemicals | 6.7 |
| Umicore SA | Precious Metals & | |
| | Minerals | 6.5 |
| Harry Winston Diamond | Precious Metals & | |
| Corp. | Minerals | 5.5 |
| Nevsun Resources Ltd. | Gold | 5.2 |
| Imerys SA | Construction | |
| | Materials | 4.9 |
| Iluka Resources Ltd. | Diversified Metals & | |
| | Mining | 4.8 |
| Newmont Mining Corp. | Gold | 4.8 |
| OZ Minerals Ltd. | Diversified Metals & | |
| | Minerals | 4.7 |
| Top Ten | | 58.9% |
The holdings listed exclude any temporary cash investments and equity index products.
Allocation by Region (% of equity exposure)
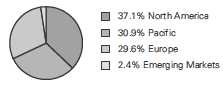
1 The expense ratio shown is from the prospectus dated May 29, 2012, and represents estimated costs for the current fiscal year. For the fiscal year ended January 31, 2013, the expense ratio was 0.26%.
11
Precious Metals and Mining Fund
Performance Summary
All of the returns in this report represent past performance, which is not a guarantee of future results that may be achieved by the fund. (Current performance may be lower or higher than the performance data cited. For performance data current to the most recent month-end, visit our website at vanguard.com/performance.) Note, too, that both investment returns and principal value can fluctuate widely, so an investor’s shares, when sold, could be worth more or less than their original cost. The returns shown do not reflect taxes that a shareholder would pay on fund distributions or on the sale of fund shares.
Cumulative Performance: January 31, 2003, Through January 31, 2013
Initial Investment of $10,000
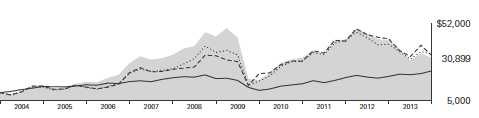
| | | | |
| | | Average Annual Total Returns | |
| | Periods Ended January 31, 2013 | |
| |
| | | | | Final Value |
| | One | Five | Ten | of a $10,000 |
| | Year | Years | Years | Investment |
| |
| Precious Metals and Mining Fund | -26.13% | -6.85% | 11.94% | $30,899 |
| Spliced Precious Metals and Mining | | | | |
| Index | -15.05 | -0.55 | 12.85 | 33,505 |
| Precious Metals Equity Funds | | | | |
| Average | -24.13 | -0.03 | 12.47 | 32,373 |
| Dow Jones U.S. Total Stock Market | | | | |
| Float Adjusted Index | 16.88 | 4.61 | 8.80 | 23,250 |
For a benchmark description, see the Glossary.
Precious Metals Equity Funds Average: Derived from data provided by Lipper Inc.
See Financial Highlights for dividend and capital gains information.
12
Precious Metals and Mining Fund
Fiscal-Year Total Returns (%): January 31, 2003, Through January 31, 2013
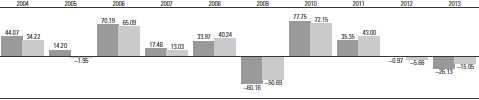
|
| Precious Metals and Mining Fund |
| Spliced Precious Metals and Mining Index |
For a benchmark description, see the Glossary.
Average Annual Total Returns: Periods Ended December 31, 2012
This table presents returns through the latest calendar quarter—rather than through the end of the fiscal period.
Securities and Exchange Commission rules require that we provide this information.
| | | | |
| | Inception | One | Five | Ten |
| | Date | Year | Years | Years |
| Precious Metals and Mining Fund | 5/23/1984 | -12.98% | -6.18% | 12.66% |
13
Precious Metals and Mining Fund
Financial Statements
Statement of Net Assets
As of January 31, 2013
The fund reports a complete list of its holdings in regulatory filings four times in each fiscal year, at the quarter-ends. For the second and fourth fiscal quarters, the lists appear in the fund’s semiannual and annual reports to shareholders. For the first and third fiscal quarters, the fund files the lists with the Securities and Exchange Commission on Form N-Q. Shareholders can look up the fund’s Forms N-Q on the SEC’s website at sec.gov. Forms N-Q may also be reviewed and copied at the SEC’s Public Reference Room (see the back cover of this report for further information).
| | | |
| | | | Market |
| | | | Value |
| | | Shares | ($000) |
| Common Stocks (99.7%) | | |
| Australia (30.9%) | | |
| | Iluka Resources Ltd. | 14,750,000 | 149,514 |
| 1 | OZ Minerals Ltd. | 20,250,000 | 146,856 |
| 1 | Medusa Mining Ltd. | 25,250,000 | 130,694 |
| *,^,1Aquila Resources Ltd. | 36,165,000 | 118,009 |
| *,1 | St. Barbara Ltd. | 60,536,881 | 90,653 |
| 1 | Resolute Mining Ltd. | 64,000,000 | 88,720 |
| *,^,1Cudeco Ltd. | 18,500,000 | 83,557 |
| *,1 | Discovery Metals Ltd. | 33,447,796 | 37,582 |
| *,1 | Galaxy Resources Ltd. | 73,893,638 | 29,401 |
| *,1 | Ivanhoe Australia Ltd. | 40,000,000 | 18,564 |
| *,1 | Equatorial Resources | | |
| | Ltd. | 10,082,288 | 15,601 |
| *,1 | Reed Resources Ltd. | 76,166,667 | 13,483 |
| * | Papillon Resources Ltd. | 7,500,000 | 12,950 |
| 1 | Panoramic Resources | | |
| | Ltd. | 22,200,000 | 11,738 |
| *,1 | Glory Resources Ltd. | 33,500,000 | 6,987 |
| *,1 | Apex Minerals NL | 55,654,166 | 2,379 |
| *,1 | Kumarina Resources | | |
| | Ltd. | 9,300,000 | 1,362 |
| *,^ | Gindalbie Metals Ltd. | 3,000,000 | 864 |
| *,1 | Speewah Metals Ltd. | 13,500,000 | 624 |
| *,1 | Drummond Gold Ltd. | 35,000,000 | 291 |
| | | | 959,829 |
| Belgium (6.5%) | | |
| | Umicore SA | 3,900,000 | 202,915 |
| |
| Canada (24.7%) | | |
| | Potash Corp. of | | |
| | Saskatchewan Inc. | 5,200,000 | 220,899 |
| *,1 | Harry Winston Diamond | | |
| | Corp. | 11,700,000 | 172,673 |
| 1 | Nevsun Resources Ltd. | 38,500,000 | 162,894 |
| 1 | Centerra Gold Inc. | 15,750,000 | 143,067 |
| * | Alacer Gold Corp. | 5,950,000 | 27,143 |
| *,^ | Belo Sun Mining Corp. | 12,500,000 | 19,676 |
| | Barrick Gold Corp. | 350,000 | 11,145 |
| | | |
| | | | Market |
| | | | Value |
| | | Shares | ($000) |
| *,^ | NovaCopper Inc. | 2,033,333 | 4,046 |
| | SEMAFO Inc. | 1,000,000 | 2,797 |
| * | Bear Creek Mining Corp. | 750,000 | 2,429 |
| | Eldorado Gold Corp. | 100,000 | 1,118 |
| * | Lake Shore Gold Corp. | 1,000,000 | 862 |
| * | Claude Resources Inc. | 400,000 | 220 |
| | | | 768,969 |
| France (5.0%) | | |
| | Imerys SA | 2,325,000 | 153,750 |
| |
| Germany (6.7%) | | |
| | K+S AG | 4,650,000 | 209,620 |
| |
| Indonesia (0.1%) | | |
| | Vale Indonesia Tbk PT | 6,500,000 | 1,835 |
| |
| Ireland (0.2%) | | |
| * | Kenmare Resources plc | 13,627,035 | 7,194 |
| |
| Papua New Guinea (0.0%) | | |
| * | Bougainville Copper Ltd. | 2,000,000 | 1,198 |
| |
| Russia (2.3%) | | |
| | Uralkali OJSC GDR | 1,850,000 | 70,393 |
| |
| United Kingdom (11.1%) | | |
| 1 | Hochschild Mining plc | 40,500,000 | 271,517 |
| 1 | Petropavlovsk plc | 11,500,000 | 63,402 |
| | Rio Tinto plc | 200,000 | 11,299 |
| | | | 346,218 |
| United States (12.2%) | | |
| | Newmont Mining Corp. | 3,450,000 | 148,212 |
| | Mosaic Co. | 2,300,000 | 140,875 |
| 1 | AMCOL International | | |
| | Corp. | 3,080,000 | 90,952 |
| | | | 380,039 |
| Total Common Stocks | | |
| (Cost $3,390,923) | | 3,101,960 |
14
| | |
| Precious Metals and Mining Fund | |
| |
| |
| | | Market |
| | | Valuet |
| | Shares | ($000) |
| Precious Metals (0.1%) | | |
| * Platinum Bullion | | |
| (In Troy Ounces) | 2,009 | 3,369 |
| Total Precious Metals (Cost $1,213) | 3,369 |
| Temporary Cash Investment (1.2%) | |
| Money Market Fund (1.2%) | |
| 2,3 Vanguard Market Liquidity | |
| Fund, 0.143% | | |
| (Cost $39,118) | 39,118,289 | 39,118 |
| Total Investments (101.0%) | |
| (Cost $3,431,254) | | 3,144,447 |
| Other Assets and Liabilities (-1.0%) | |
| Other Assets | | 30,733 |
| Liabilities3 | | (63,321) |
| | | (32,588) |
| Net Assets (100%) | | |
| Applicable to 201,251,211 outstanding | |
| $.001 par value shares of beneficial | |
| interest (unlimited authorization) | 3,111,859 |
| Net Asset Value Per Share | $15.46 |
| |
| | Market |
| | Valuet |
| | ($000) |
| Statement of Assets and Liabilities | |
| Assets | |
| Investments in Securities, at Value4 | |
| Unaffiliated Issuers4 | 1,404,323 |
| Affiliated Vanguard Funds | 39,118 |
| Other Affiliated Issuers | 1,701,006 |
| Total Investments in Securities | 3,144,447 |
| Receivables for Investment | |
| Securities Sold | 26,537 |
| Other Assets | 4,196 |
| Total Assets | 3,175,180 |
| Liabilities | |
| Payables for Investment | |
| Securities Purchased | 26,631 |
| Security Lending Collateral | |
| Payable to Brokers | 21,895 |
| Other Liabilities | 14,795 |
| Total Liabilities | 63,321 |
| Net Assets | 3,111,859 |
| |
| At January 31, 2013, net assets consisted of: |
| |
| | Amount |
| | ($000) |
| Paid-in Capital | 3,866,828 |
| Overdistributed Net Investment Income | (254,002) |
| Accumulated Net Realized Losses | (214,146) |
| Unrealized Appreciation (Depreciation) | |
| Investment Securities4 | (286,807) |
| Foreign Currencies | (14) |
| Net Assets | 3,111,859 |
t See Note A in Notes to Financial Statements.
* Non-income-producing security.
^ Part of security position is on loan to broker-dealers. The total value of securities on loan is $14,144,000.
1 Considered an affiliated company of the fund as the fund owns more than 5% of the outstanding voting securities of such company.
2 Affiliated money market fund available only to Vanguard funds and certain trusts and accounts managed by Vanguard. Rate shown is the 7-day yield.
3 Includes $21,895,000 of collateral received for securities on loan.
4 Includes precious metals.
GDR—Global Depositary Receipt.
See accompanying Notes, which are an integral part of the Financial Statements.
15
| |
| Precious Metals and Mining Fund | |
| |
| |
| Statement of Operations | |
| |
| | Year Ended |
| | January 31, 2013 |
| | ($000) |
| Investment Income | |
| Income | |
| Dividends1,2 | 62,179 |
| Interest2 | 100 |
| Security Lending | 2,220 |
| Total Income | 64,499 |
| Expenses | |
| Investment Advisory Fees—Note B | |
| Basic Fee | 4,380 |
| Performance Adjustment | (2,302) |
| The Vanguard Group—Note C | |
| Management and Administrative | 5,700 |
| Marketing and Distribution | 740 |
| Custodian Fees | 315 |
| Auditing Fees | 26 |
| Shareholders’ Reports | 61 |
| Trustees’ Fees and Expenses | 10 |
| Total Expenses | 8,930 |
| Net Investment Income | 55,569 |
| Realized Net Gain (Loss) | |
| Investment Securities Sold2,3 | (213,574) |
| Foreign Currencies | (309) |
| Realized Net Gain (Loss) | (213,883) |
| Change in Unrealized Appreciation (Depreciation) | |
| Investment Securities3 | (976,228) |
| Foreign Currencies | (8) |
| Change in Unrealized Appreciation (Depreciation) | (976,236) |
| Net Increase (Decrease) in Net Assets Resulting from Operations | (1,134,550) |
1 Dividends are net of foreign withholding taxes of $1,710,000.
2 Dividend income, interest income, and realized net gain (loss) from affiliated companies of the fund were $24,361,000, $100,000, and ($125,630,000), respectively.
3 Includes precious metals.
See accompanying Notes, which are an integral part of the Financial Statements.
16
| | |
| Precious Metals and Mining Fund | | |
| |
| |
| Statement of Changes in Net Assets | | |
| |
| | Year Ended January 31, |
| | 2013 | 2012 |
| | ($000) | ($000) |
| Increase (Decrease) in Net Assets | | |
| Operations | | |
| Net Investment Income | 55,569 | 75,993 |
| Realized Net Gain (Loss) | (213,883) | 394,334 |
| Change in Unrealized Appreciation (Depreciation) | (976,236) | (524,311) |
| Net Increase (Decrease) in Net Assets Resulting from Operations | (1,134,550) | (53,984) |
| Distributions | | |
| Net Investment Income | (141,196) | (24,181) |
| Realized Capital Gain | (59,601) | (276,223) |
| Total Distributions | (200,797) | (300,404) |
| Capital Share Transactions | | |
| Issued | 824,259 | 741,011 |
| Issued in Lieu of Cash Distributions | 184,683 | 277,838 |
| Redeemed1 | (977,033) | (1,279,248) |
| Net Increase (Decrease) from Capital Share Transactions | 31,909 | (260,399) |
| Total Increase (Decrease) | (1,303,438) | (614,787) |
| Net Assets | | |
| Beginning of Period | 4,415,297 | 5,030,084 |
| End of Period2 | 3,111,859 | 4,415,297 |
1 Net of redemption fees for fiscal 2013 and 2012 of $435,000 and $2,635,000, respectively. Effective May 23, 2012, the redemption fee was eliminated.
2 Net Assets--End of Period includes undistributed (overdistributed) net investment income of ($254,002,000) and ($168,670,000).
See accompanying Notes, which are an integral part of the Financial Statements.
17
| | | | | |
| Precious Metals and Mining Fund | | | | | |
| |
| |
| Financial Highlights | | | | | |
| |
| |
| For a Share Outstanding | | | Year Ended January 31, |
| Throughout Each Period | 2013 | 2012 | 2011 | 2010 | 2009 |
| Net Asset Value, Beginning of Period | $22.14 | $24.15 | $18.74 | $10.74 | $33.45 |
| Investment Operations | | | | | |
| Net Investment Income | .292 | .3341 | .181 | .0932 | .653 |
| Net Realized and Unrealized Gain (Loss) | | | | | |
| on Investments3 | (5.962) | (.760) | 6.521 | 8.207 | (19.849) |
| Total from Investment Operations | (5.670) | (.426) | 6.702 | 8.300 | (19.196) |
| Distributions | | | | | |
| Dividends from Net Investment Income | (.710) | (.123) | (1.101) | (.300) | (.763) |
| Distributions from Realized Capital Gains | (.300) | (1.461) | (.191) | — | (2.751) |
| Total Distributions | (1.010) | (1.584) | (1.292) | (.300) | (3.514) |
| Net Asset Value, End of Period | $15.46 | $22.14 | $24.15 | $18.74 | $10.74 |
| |
| Total Return4 | -26.13% | -0.97% | 35.35% | 77.75% | -60.16% |
| |
| Ratios/Supplemental Data | | | | | |
| Net Assets, End of Period (Millions) | $3,112 | $4,415 | $5,030 | $3,684 | $1,644 |
| Ratio of Total Expenses to Average | | | | | |
| Net Assets5 | 0.26% | 0.29% | 0.27% | 0.27% | 0.30% |
| Ratio of Net Investment Income to Average | | | | | |
| Net Assets | 1.62% | 1.54%1 | 0.61% | 0.59%2 | 2.17% |
| Portfolio Turnover Rate | 30% | 22% | 34% | 17% | 22% |
1 Net investment income per share and the ratio of net investment income to average net assets include $.103 and 0.40%, respectively, resulting from a special dividend from OZ Minerals Ltd. in May 2011.
2 The fund received a special dividend from Centennial Coal Co. Ltd. in January 2008. Based on additional information reported by the company in 2009, a portion of the special dividend was reallocated to return of capital. The reallocation reduced net investment income per share and the ratio of net investment income to average net assets for the year ended January 31,2010, by $.134 and 0.90%, respectively. The reallocation had no impact on net assets, net asset values per share, or total returns.
3 Includes increases from redemption fees of $.00, $.01, $.01, $.01, and $.01. Effective May 23, 2012, the redemption fee was eliminated.
4 Total returns do not include transaction or account service fees that may have applied in the periods shown. Fund prospectuses provide information about any applicable transaction and account service fees.
5 Includes performance-based investment advisory fee increases (decreases) of (0.07%), (0.03%), (0.05%), (0.08%), and 0.00%.
See accompanying Notes, which are an integral part of the Financial Statements.
18
Precious Metals and Mining Fund
Notes to Financial Statements
Vanguard Precious Metals and Mining Fund is registered under the Investment Company Act of 1940 as an open-end investment company, or mutual fund. The fund invests in securities of foreign issuers, which may subject it to investment risks not normally associated with investing in securities of United States corporations.
A. The following significant accounting policies conform to generally accepted accounting principles for U.S. mutual funds. The fund consistently follows such policies in preparing its financial statements.
1. Security Valuation: Securities are valued as of the close of trading on the New York Stock Exchange (generally 4 p.m., Eastern time) on the valuation date. Equity securities are valued at the latest quoted sales prices or official closing prices taken from the primary market in which each security trades; such securities not traded on the valuation date are valued at the mean of the latest quoted bid and asked prices. Securities for which market quotations are not readily available, or whose values have been affected by events occurring before the fund’s pricing time but after the close of the securities’ primary markets, are valued at their fair values calculated according to procedures adopted by the board of trustees. These procedures include obtaining quotations from an independent pricing service, monitoring news to identify significant market- or security-specific events, and evaluating changes in the values of foreign market proxies (for example, ADRs, futures contracts, or exchange-traded funds), between the time the foreign markets close and the fund’s pricing time. When fair-value pricing is employed, the prices of securities used by a fund to calculate its net asset value may differ from quoted or published prices for the same securities. Precious metals are valued at the latest quoted bid prices. Investments in Vanguard Market Liquidity Fund are valued at that fund’s net asset value.
2. Foreign Currency: Securities and other assets and liabilities denominated in foreign currencies are translated into U.S. dollars using exchange rates obtained from an independent third party as of the fund’s pricing time on the valuation date. Realized gains (losses) and unrealized appreciation (depreciation) on investment securities include the effects of changes in exchange rates since the securities were purchased, combined with the effects of changes in security prices. Fluctuations in the value of other assets and liabilities resulting from changes in exchange rates are recorded as unrealized foreign currency gains (losses) until the assets or liabilities are settled in cash, at which time they are recorded as realized foreign currency gains (losses).
3. Federal Income Taxes: The fund intends to continue to qualify as a regulated investment company and distribute all of its taxable income. Management has analyzed the fund’s tax positions taken for all open federal income tax years (January 31, 2010–2013), and has concluded that no provision for federal income tax is required in the fund’s financial statements.
4. Distributions: Distributions to shareholders are recorded on the ex-dividend date.
5. Security Lending: The fund may lend its securities to qualified institutional borrowers to earn additional income. Security loans are required to be secured at all times by collateral at least equal to the market value of securities loaned. The fund invests cash collateral received in Vanguard Market Liquidity Fund, and records a liability for the return of the collateral, during the period the securities are on loan. Security lending income represents fees charged to borrowers plus income earned on investing cash collateral, less expenses associated with the loan.
6. Other: Dividend income is recorded on the ex-dividend date. Interest income includes income distributions received from Vanguard Market Liquidity Fund and is accrued daily. Security transactions are accounted for on the date securities are bought or sold. Costs used to determine realized gains (losses) on the sale of investment securities are those of the specific securities sold. Fees assessed on redemptions of capital shares prior to May 23, 2012, were credited to paid-in capital.
19
Precious Metals and Mining Fund
B. M&G Investment Management Ltd. provides investment advisory services to the fund for a fee calculated at an annual percentage rate of average net assets. The basic fee is subject to quarterly adjustments based on the fund’s performance for the preceding three years relative to the S&P Custom Precious Metals and Mining Index. For the year ended January 31, 2013, the investment advisory fee represented an effective annual basic rate of 0.13% of the fund’s average net assets before a decrease of $2,302,000 (0.07%) based on performance.
C. The Vanguard Group furnishes at cost corporate management, administrative, marketing, and distribution services. The costs of such services are allocated to the fund under methods approved by the board of trustees. The fund has committed to provide up to 0.40% of its net assets in capital contributions to Vanguard. At January 31, 2013, the fund had contributed capital of $438,000 to Vanguard (included in Other Assets), representing 0.01% of the fund’s net assets and 0.18% of Vanguard’s capitalization. The fund’s trustees and officers are also directors and officers of Vanguard.
D. Various inputs may be used to determine the value of the fund’s investments. These inputs are summarized in three broad levels for financial statement purposes. The inputs or methodologies used to value securities are not necessarily an indication of the risk associated with investing in those securities.
Level 1—Quoted prices in active markets for identical securities.
Level 2—Other significant observable inputs (including quoted prices for similar securities, interest rates, prepayment speeds, credit risk, etc.).
Level 3—Significant unobservable inputs (including the fund’s own assumptions used to determine the fair value of investments).
The following table summarizes the market value of the fund’s investments as of January 31, 2013, based on the inputs used to value them:
| | | |
| | Level 1 | Level 2 | Level 3 |
| Investments | ($000) | ($000) | ($000) |
| Common Stocks—North America | 1,149,008 | — | — |
| Common Stocks—Other | — | 1,952,952 | — |
| Precious Metals | — | 3,369 | — |
| Temporary Cash Investments | 39,118 | — | — |
| Total | 1,188,126 | 1,956,321 | — |
E. Distributions are determined on a tax basis and may differ from net investment income and realized capital gains for financial reporting purposes. Differences may be permanent or temporary. Permanent differences are reclassified among capital accounts in the financial statements to reflect their tax character. Temporary differences arise when certain items of income, expense, gain, or loss are recognized in different periods for financial statement and tax purposes; these differences will reverse at some time in the future. Differences in classification may also result from the treatment of short-term gains as ordinary income for tax purposes.
During the year ended January 31, 2013, the fund realized net foreign currency losses of $309,000, which decreased distributable net income for tax purposes; accordingly, such losses have been reclassified from accumulated net realized losses to overdistributed net investment income. Certain of the fund’s investments are in securities considered to be “passive foreign investment companies,” for which any unrealized appreciation and/or realized gains are required to be included in distributable net investment income for tax purposes. During the year ended January 31, 2013, the fund realized gains
20
Precious Metals and Mining Fund
on the sale of passive foreign investment companies of $604,000, which have been included in current and prior periods’ taxable income; accordingly, such gains have been reclassified from accumulated net realized losses to overdistributed net investment income. Passive foreign investment companies held at October 31, 2012, had unrealized appreciation of $247,737,000 all of which has been distributed and is reflected in the balance of overdistributed net investment income. Since October 31, 2012, passive foreign investment companies depreciated in value by $19,910,000; these unrealized losses have been deferred and will reduce taxable income in fiscal 2014. Passive foreign investment companies held as of January 31, 2013, had unrealized appreciation of $227,827,000.
For tax purposes, at January 31, 2013, the fund had $1,513,000 of ordinary income available for distribution. The fund had available capital losses totaling $209,921,000 that may be carried forward indefinitely to offset future net capital gains.
At January 31, 2013, the cost of investment securities for tax purposes was $3,663,339,000. Net unrealized depreciation of investment securities for tax purposes was $518,892,000, consisting of unrealized gains of $152,297,000 on securities that had risen in value since their purchase and $671,189,000 in unrealized losses on securities that had fallen in value since their purchase.
F. During the year ended January 31, 2013, the fund purchased $1,042,045,000 of investment securities and sold $1,140,103,000 of investment securities, other than temporary cash investments.
G. Capital shares issued and redeemed were:
| | |
| | Year Ended January 31, |
| | 2013 | 2012 |
| | Shares | Shares |
| | (000) | (000) |
| Issued | 49,065 | 29,915 |
| Issued in Lieu of Cash Distributions | 10,433 | 14,027 |
| Redeemed | (57,628) | (52,827) |
| Net Increase (Decrease) in Shares Outstanding | 1,870 | (8,885) |
21
Precious Metals and Mining Fund
H. Certain of the fund’s investments are in companies that are considered to be affiliated companies of the fund because the fund owns more than 5% of the outstanding voting securities of the company. Transactions during the period in securities of these companies were as follows:
| | | | | |
| | | | Current Period Transactions | |
| | | | Proceeds | | |
| | Jan. 31, 2012 | | from | | Jan. 31, 2013 |
| | Market | Purchases | Securities | Dividend | Market |
| | Value | at Cost | Sold | Income | Value |
| | ($000) | ($000) | ($000) | ($000) | ($000) |
| Alacer Gold Corp. | 239,924 | — | 118,287 | — | NA1 |
| AMCOL International Corp. | 87,965 | — | — | 2,341 | 90,952 |
| Apex Minerals NL | 3,979 | 6,896 | — | — | 2,379 |
| Aquila Resources Ltd. | 211,654 | 11,380 | — | — | 118,009 |
| Centerra Gold Inc. | 375,144 | 6,732 | 46,850 | 1,743 | 143,067 |
| Cudeco Ltd. | 55,382 | 15,787 | — | — | 83,557 |
| Discovery Metals Ltd. | 40,996 | 48,865 | 28,853 | — | 37,582 |
| Drummond Gold Ltd. | 929 | — | — | — | 291 |
| Equatorial Resources Ltd. | 15,509 | 9,630 | — | — | 15,601 |
| Galaxy Resources Ltd. | 24,581 | 28,565 | — | — | 29,401 |
| Glory Resources Ltd. | 8,711 | — | — | — | 6,987 |
| Harry Winston Diamond Corp. | 111,135 | 30,681 | — | — | 172,673 |
| Hochschild Mining plc | 315,742 | — | — | 2,417 | 271,517 |
| Ivanhoe Australia Ltd. | NA2 | 17,988 | — | — | 18,564 |
| Kumarina Resources Ltd. | 2,567 | — | — | — | 1,362 |
| Medusa Mining Ltd. | 144,972 | — | — | 1,564 | 130,694 |
| Minefinders Corp. | 172,996 | — | 27,650 | — | NA3 |
| Nevsun Resources Ltd. | 253,032 | — | — | 3,309 | 162,894 |
| NovaGold Resources Inc. | 219,420 | — | 165,773 | 133 | — |
| OZ Minerals Ltd. | 199,102 | 49,852 | 23,117 | 7,620 | 146,856 |
| Panoramic Resources Ltd. | 27,580 | 1,501 | — | 413 | 11,738 |
| Petropavlovsk plc | NA2 | 15,155 | — | 1,727 | 63,402 |
| Reed Resources Ltd. | 9,921 | 10,266 | — | — | 13,483 |
| Resolute Mining Ltd. | 112,781 | 23,124 | — | 3,052 | 88,720 |
| SEMAFO Inc. | 98,225 | — | 69,032 | 42 | NA1 |
| Speewah Metals Ltd. | 3,430 | — | — | — | 624 |
| St. Barbara Ltd. | 126,529 | 14,477 | — | — | 90,653 |
| | 2,862,206 | | | 24,361 | 1,701,006 |
1 Not applicable--At January 31, 2013, the security was still held, but the issuer was no longer an affiliated company of the fund.
2 Not applicable--At January 31, 2012, the issuer was not an affiliated company of the fund.
3 Not applicable--In March 2012, Minefinders Corp. merged into Pan American Silver Corp. At January 31, 2013, the security was no longer held in the fund.
I. In preparing the financial statements as of January 31, 2013, management considered the impact of subsequent events for potential recognition or disclosure in these financial statements.
22
Report of Independent Registered
Public Accounting Firm
To the Trustees of Vanguard Specialized Funds and the Shareholders of Vanguard Precious Metals and Mining Fund:
In our opinion, the accompanying statement of net assets and statement of assets and liabilities and the related statements of operations and of changes in net assets and the financial highlights present fairly, in all material respects, the financial position of Vanguard Precious Metals and Mining Fund (constituting a separate portfolio of Vanguard Specialized Funds, hereafter referred to as the “Fund”) at January 31, 2013, the results of its operations for the year then ended, the changes in its net assets for each of the two years in the period then ended and the financial highlights for each of five years in the period then ended, in conformity with accounting principles generally accepted in the United States of America. These financial statements and financial highlights (hereafter referred to as “financial statements”) are the responsibility of the Fund’s management; our responsibility is to express an opinion on these financial statements based on our audits. We conducted our audits of these financial statements in accordance with the standards of the Public Company Accounting Oversight Board (United States). Those standards require that we plan and perform the audit to obtain reasonable assurance about whether the financial statements are free of material misstatement. An audit includes examining, on a test basis, evidence supporting the amounts and disclosures in the financial statements, assessing the accounting principles used and significant estimates made by management, and evaluating the overall financial statement presentation. We believe that our audits, which included confirmation of securities at January 31, 2013 by correspondence with the custodian and by agreement to the underlying ownership records of the transfer agent, provide a reasonable basis for our opinion.
PricewaterhouseCoopers LLP
Philadelphia, Pennsylvania
March 15, 2013
| |
| Special 2012 tax information (unaudited) for Vanguard Precious Metals and Mining Fund |
This information for the fiscal year ended January 31, 2013, is included pursuant to provisions of the Internal Revenue Code.
The fund distributed $59,633,000 as capital gain dividends (from net long-term capital gains) to shareholders during the fiscal year.
The fund distributed $41,625,000 of qualified dividend income to shareholders during the fiscal year.
For corporate shareholders, 13.1% of investment income (dividend income plus short-term gains, if any) qualifies for the dividends-received deduction.
The fund designates to shareholders foreign source income of $36,335,000 and foreign taxes paid of $1,770,000. Shareholders received more detailed information with their Form 1099-DIV in January 2013 to determine the calendar-year amounts to be included on their 2012 tax returns.
23
Your Fund’s After-Tax Returns
This table presents returns for your fund both before and after taxes. The after-tax returns are shown in two ways: (1) assuming that an investor owned the fund during the entire period and paid taxes on the fund’s distributions, and (2) assuming that an investor paid taxes on the fund’s distributions and sold all shares at the end of each period.
Calculations are based on the highest individual federal income tax and capital gains tax rates in effect at the times of the distributions and the hypothetical sales. State and local taxes were not considered. After-tax returns reflect any qualified dividend income, using actual prior-year figures and estimates for 2013. (In the example, returns after the sale of fund shares may be higher than those assuming no sale. This occurs when the sale would have produced a capital loss. The calculation assumes that the investor received a tax deduction for the loss.)
Please note that your actual after-tax returns will depend on your tax situation and may differ from those shown. Also note that if you own the fund in a tax-deferred account, such as an individual retirement account or a 401(k) plan, this information does not apply to you. Such accounts are not subject to current taxes.
Finally, keep in mind that a fund’s performance—whether before or after taxes—does not guarantee future results.
| | | |
| Average Annual Total Returns: Precious Metals and Mining Fund | | |
| Periods Ended January 31, 2013 | | | |
| | One | Five | Ten |
| | Year | Years | Years |
| Returns Before Taxes | -26.13% | -6.85% | 11.94% |
| Returns After Taxes on Distributions | -27.14 | -8.20 | 10.28 |
| Returns After Taxes on Distributions and Sale of Fund Shares | -13.85 | -4.69 | 10.36 |
24
About Your Fund’s Expenses
As a shareholder of the fund, you incur ongoing costs, which include costs for portfolio management, administrative services, and shareholder reports (like this one), among others. Operating expenses, which are deducted from a fund’s gross income, directly reduce the investment return of the fund.
A fund’s expenses are expressed as a percentage of its average net assets. This figure is known as the expense ratio. The following examples are intended to help you understand the ongoing costs (in dollars) of investing in your fund and to compare these costs with those of other mutual funds. The examples are based on an investment of $1,000 made at the beginning of the period shown and held for the entire period.
The accompanying table illustrates your fund’s costs in two ways:
• Based on actual fund return. This section helps you to estimate the actual expenses that you paid over the period. The ”Ending Account Value“ shown is derived from the fund‘s actual return, and the third column shows the dollar amount that would have been paid by an investor who started with $1,000 in the fund. You may use the information here, together with the amount you invested, to estimate the expenses that you paid over the period.
To do so, simply divide your account value by $1,000 (for example, an $8,600 account value divided by $1,000 = 8.6), then multiply the result by the number given for your fund under the heading ”Expenses Paid During Period.“
• Based on hypothetical 5% yearly return. This section is intended to help you compare your fund‘s costs with those of other mutual funds. It assumes that the fund had a yearly return of 5% before expenses, but that the expense ratio is unchanged. In this case—because the return used is not the fund’s actual return—the results do not apply to your investment. The example is useful in making comparisons because the Securities and Exchange Commission requires all mutual funds to calculate expenses based on a 5% return. You can assess your fund’s costs by comparing this hypothetical example with the hypothetical examples that appear in shareholder reports of other funds.
Note that the expenses shown in the table are meant to highlight and help you compare ongoing costs only and do not reflect transaction costs incurred by the fund for buying and selling securities. Further, the expenses do not include any purchase, redemption, or account service fees described in the fund prospectus. If such fees were applied to your account, your costs would be higher. Your fund does not carry a “sales load.”
The calculations assume no shares were bought or sold during the period. Your actual costs may have been higher or lower, depending on the amount of your investment and the timing of any purchases or redemptions.
You can find more information about the fund’s expenses, including annual expense ratios, in the Financial Statements section of this report. For additional information on operating expenses and other shareholder costs, please refer to your fund’s current prospectus.
25
| | | |
| Six Months Ended January 31, 2013 | | | |
| | Beginning | Ending | Expenses |
| | Account Value | Account Value | Paid During |
| Precious Metals and Mining Fund | 7/31/2012 | 1/31/2013 | Period |
| Based on Actual Fund Return | $1,000.00 | $1,049.68 | $1.29 |
| Based on Hypothetical 5% Yearly Return | 1,000.00 | 1,023.95 | 1.28 |
The calculations are based on expenses incurred in the most recent six-month period. The fund’s annualized six-month expense ratio for that period is 0.25%. The dollar amounts shown as “Expenses Paid” are equal to the annualized expense ratio multiplied by the average account value over the period, multiplied by the number of days in the most recent six-month period, then divided by the number of days in the most recent 12-month period.
26
Glossary
Beta. A measure of the magnitude of a fund’s past share-price fluctuations in relation to the ups and downs of a given market index. The index is assigned a beta of 1.00. Compared with a given index, a fund with a beta of 1.20 typically would have seen its share price rise or fall by 12% when the index rose or fell by 10%. For this report, beta is based on returns over the past 36 months for both the fund and the index. Note that a fund’s beta should be reviewed in conjunction with its R-squared (see definition). The lower the R-squared, the less correlation there is between the fund and the index, and the less reliable beta is as an indicator of volatility.
Dividend Yield. Dividend income earned by stocks, expressed as a percentage of the aggregate market value (or of net asset value, for a fund). The yield is determined by dividing the amount of the annual dividends by the aggregate value (or net asset value) at the end of the period. For a fund, the dividend yield is based solely on stock holdings and does not include any income produced by other investments.
Earnings Growth Rate. The average annual rate of growth in earnings over the past five years for the stocks now in a fund.
Equity Exposure. A measure that reflects a fund’s investments in stocks and stock futures. Any holdings in short-term reserves are excluded.
Expense Ratio. A fund’s total annual operating expenses expressed as a percentage of the fund’s average net assets. The expense ratio includes management and administrative expenses, but does not include the transaction costs of buying and selling portfolio securities.
Foreign Holdings. The percentage of a fund represented by securities or depositary receipts of companies based outside the United States.
Inception Date. The date on which the assets of a fund (or one of its share classes) are first invested in accordance with the fund’s investment objective. For funds with a subscription period, the inception date is the day after that period ends. Investment performance is measured from the inception date.
Median Market Cap. An indicator of the size of companies in which a fund invests; the midpoint of market capitalization (market price x shares outstanding) of a fund’s stocks, weighted by the proportion of the fund’s assets invested in each stock. Stocks representing half of the fund’s assets have market capitalizations above the median, and the rest are below it.
Price/Book Ratio. The share price of a stock divided by its net worth, or book value, per share. For a fund, the weighted average price/book ratio of the stocks it holds.
R-Squared. A measure of how much of a fund’s past returns can be explained by the returns from the market in general, as measured by a given index. If a fund’s total returns were precisely synchronized with an index’s returns, its R-squared would be 1.00. If the fund’s returns bore no relationship to the index’s returns, its R-squared would be 0. For this report, R-squared is based on returns over the past 36 months for both the fund and the index.
Return on Equity. The annual average rate of return generated by a company during the past five years for each dollar of shareholder’s equity (net income divided by shareholder’s equity). For a fund, the weighted average return on equity for the companies whose stocks it holds.
27
Short-Term Reserves. The percentage of a fund invested in highly liquid, short-term securities that can be readily converted to cash.
Turnover Rate. An indication of the fund’s trading activity. Funds with high turnover rates incur higher transaction costs and may be more likely to distribute capital gains (which may be taxable to investors). The turnover rate excludes in-kind transactions, which have minimal impact on costs.
Benchmark Information
Spliced Precious Metals and Mining Index: S&P/Citigroup World Equity Gold Index through June 30, 2005; S&P Custom Precious Metals and Mining Index thereafter.
28
This page intentionally left blank.
This page intentionally left blank.
This page intentionally left blank.
The People Who Govern Your Fund
The trustees of your mutual fund are there to see that the fund is operated and managed in your best interests since, as a shareholder, you are a part owner of the fund. Your fund’s trustees also serve on the board of directors of The Vanguard Group, Inc., which is owned by the Vanguard funds and provides services to them on an at-cost basis.
A majority of Vanguard’s board members are independent, meaning that they have no affiliation with Vanguard or the funds they oversee, apart from the sizable personal investments they have made as private individuals. The independent board members have distinguished backgrounds in business, academia, and public service. Each of the trustees and executive officers oversees 180 Vanguard funds.
The following table provides information for each trustee and executive officer of the fund. More information about the trustees is in the Statement of Additional Information, which can be obtained, without charge, by contacting Vanguard at 800-662-7447, or online at vanguard.com.
| |
| InterestedTrustee1 | and Delphi Automotive LLP (automotive components); |
| | Senior Advisor at New Mountain Capital; Trustee of |
| F. William McNabb III | The Conference Board. |
| Born 1957. Trustee Since July 2009. Chairman of the | |
| Board. Principal Occupation(s) During the Past Five | Amy Gutmann |
| Years: Chairman of the Board of The Vanguard Group, | Born 1949. Trustee Since June 2006. Principal |
| Inc., and of each of the investment companies served | Occupation(s) During the Past Five Years: President |
| by The Vanguard Group, since January 2010; Director | of the University of Pennsylvania; Christopher H. |
| of The Vanguard Group since 2008; Chief Executive | Browne Distinguished Professor of Political Science |
| Officer and President of The Vanguard Group and of | in the School of Arts and Sciences with secondary |
| each of the investment companies served by The | appointments at the Annenberg School for |
| Vanguard Group since 2008; Director of Vanguard | Communication and the Graduate School of Education |
| Marketing Corporation; Managing Director of The | of the University of Pennsylvania; Member of the |
| Vanguard Group (1995–2008). | National Commission on the Humanities and Social |
| | Sciences; Trustee of Carnegie Corporation of New |
| IndependentTrustees | York and of the National Constitution Center; Chair |
| | of the U. S. Presidential Commission for the Study |
| Emerson U. Fullwood | of Bioethical Issues. |
| Born 1948. Trustee Since January 2008. Principal |
| Occupation(s) During the Past Five Years: Executive | JoAnn Heffernan Heisen |
| Chief Staff and Marketing Officer for North America | Born 1950. Trustee Since July 1998. Principal |
| and Corporate Vice President (retired 2008) of Xerox | Occupation(s) During the Past Five Years: Corporate |
| Corporation (document management products and | Vice President and Chief Global Diversity Officer |
| services); Executive in Residence and 2010 | (retired 2008) and Member of the Executive |
| Distinguished Minett Professor at the Rochester | Committee (1997–2008) of Johnson & Johnson |
| Institute of Technology; Director of SPX Corporation | (pharmaceuticals/medical devices/consumer |
| (multi-industry manufacturing), the United Way of | products); Director of Skytop Lodge Corporation |
| Rochester, Amerigroup Corporation (managed health | (hotels), the University Medical Center at Princeton, |
| care), the University of Rochester Medical Center, | the Robert Wood Johnson Foundation, and the Center |
| Monroe Community College Foundation, and North | for Talent Innovation; Member of the Advisory Board |
| Carolina A&T University. | of the Maxwell School of Citizenship and Public Affairs |
| at Syracuse University. |
| Rajiv L. Gupta | |
| Born 1945. Trustee Since December 2001.2 | F. Joseph Loughrey |
| Principal Occupation(s) During the Past Five Years: | Born 1949. Trustee Since October 2009. Principal |
| Chairman and Chief Executive Officer (retired 2009) | Occupation(s) During the Past Five Years: President |
| and President (2006–2008) of Rohm and Haas Co. | and Chief Operating Officer (retired 2009) of Cummins |
| (chemicals); Director of Tyco International, Ltd. | Inc. (industrial machinery); Director of SKF AB |
| (diversified manufacturing and services), Hewlett- | (industrial machinery), Hillenbrand, Inc. (specialized |
| Packard Co. (electronic computer manufacturing), | consumer services), the Lumina Foundation for |
| | |
| Education, and Oxfam America; Chairman of the | Executive Officers | |
| Advisory Council for the College of Arts and Letters | | |
| and Member of the Advisory Board to the Kellogg | Glenn Booraem | |
| Institute for International Studies at the University | Born 1967. Controller Since July 2010. Principal |
| of Notre Dame. | Occupation(s) During the Past Five Years: Principal |
| | of The Vanguard Group, Inc.; Controller of each of |
| Mark Loughridge | the investment companies served by The Vanguard |
| Born 1953. Trustee Since March 2012. Principal | Group; Assistant Controller of each of the investment |
| Occupation(s) During the Past Five Years: Senior Vice | companies served by The Vanguard Group (2001–2010). |
| President and Chief Financial Officer at IBM (information | | |
| technology services); Fiduciary Member of IBM’s | Thomas J. Higgins | |
| Retirement Plan Committee. | Born 1957. Chief Financial Officer Since September |
| | 2008. Principal Occupation(s) During the Past Five |
| Scott C. Malpass | Years: Principal of The Vanguard Group, Inc.; Chief |
| Born 1962. Trustee Since March 2012. Principal | Financial Officer of each of the investment companies |
| Occupation(s) During the Past Five Years: Chief | served by The Vanguard Group; Treasurer of each of |
| Investment Officer and Vice President at the University | the investment companies served by The Vanguard |
| of Notre Dame; Assistant Professor of Finance at the | Group (1998–2008). | |
| Mendoza College of Business at Notre Dame; Member | | |
| of the Notre Dame 403(b) Investment Committee; | Kathryn J. Hyatt | |
| Director of TIFF Advisory Services, Inc. (investment | Born 1955. Treasurer Since November 2008. Principal |
| advisor); Member of the Investment Advisory | Occupation(s) During the Past Five Years: Principal of |
| Committees of the Financial Industry Regulatory | The Vanguard Group, Inc.; Treasurer of each of the |
| Authority (FINRA) and of Major League Baseball. | investment companies served by The Vanguard |
| | Group; Assistant Treasurer of each of the investment |
| André F. Perold | companies served by The Vanguard Group (1988–2008). |
| Born 1952. Trustee Since December 2004. Principal | | |
| Occupation(s) During the Past Five Years: George | Heidi Stam | |
| Gund Professor of Finance and Banking at the Harvard | Born 1956. Secretary Since July 2005. Principal |
| Business School (retired 2011); Chief Investment | Occupation(s) During the Past Five Years: Managing |
| Officer and Managing Partner of HighVista Strategies | Director of The Vanguard Group, Inc.; General Counsel |
| LLC (private investment firm); Director of Rand | of The Vanguard Group; Secretary of The Vanguard |
| Merchant Bank; Overseer of the Museum of Fine | Group and of each of the investment companies |
| Arts Boston. | served by The Vanguard Group; Director and Senior |
| | Vice President of Vanguard Marketing Corporation. |
| Alfred M. Rankin, Jr. | | |
| Born 1941. Trustee Since January 1993. Principal | Vanguard Senior ManagementTeam | |
| Occupation(s) During the Past Five Years: Chairman, | | |
| President, and Chief Executive Officer of NACCO | Mortimer J. Buckley | Chris D. McIsaac |
| Industries, Inc. (housewares/lignite) and of Hyster-Yale | Kathleen C. Gubanich | Michael S. Miller |
| Materials Handling, Inc. (forklift trucks); Director of | Paul A. Heller | James M. Norris |
| the National Association of Manufacturers; Chairman | Martha G. King | Glenn W. Reed |
| of the Board of University Hospitals of Cleveland; | | |
| Advisory Chairman of the Board of The Cleveland | Chairman Emeritus and Senior Advisor | |
| Museum of Art. | | |
| | John J. Brennan | |
| Peter F. Volanakis | Chairman, 1996–2009 | |
| Born 1955. Trustee Since July 2009. Principal | Chief Executive Officer and President, 1996–2008 | |
| Occupation(s) During the Past Five Years: President | | |
| and Chief Operating Officer (retired 2010) of Corning | Founder | |
| Incorporated (communications equipment); Director | | |
| of SPX Corporation (multi-industry manufacturing); | John C. Bogle | |
| Overseer of the Amos Tuck School of Business | Chairman and Chief Executive Officer, 1974–1996 | |
| Administration at Dartmouth College; Advisor to the | | |
| Norris Cotton Cancer Center. | |
1 Mr. McNabb is considered an “interested person,” as defined in the Investment Company Act of 1940, because he is an officer of the Vanguard funds.
2 December 2002 for Vanguard Equity Income Fund, Vanguard Growth Equity Fund, the Vanguard Municipal Bond Funds, and the Vanguard State Tax-Exempt Funds.
|  |
| P.O. Box 2600 |
| Valley Forge, PA 19482-2600 |
Connect with Vanguard® > vanguard.com
| |
| Fund Information > 800-662-7447 | |
| Direct Investor Account Services > 800-662-2739 | |
| Institutional Investor Services > 800-523-1036 | |
| Text Telephone for People | |
| With Hearing Impairment > 800-749-7273 | |
| |
| This material may be used in conjunction | |
| with the offering of shares of any Vanguard | |
| fund only if preceded or accompanied by | |
| the fund’s current prospectus. | |
| |
| All comparative mutual fund data are from Lipper Inc. or | |
| Morningstar, Inc., unless otherwise noted. | |
| |
| You can obtain a free copy of Vanguard’s proxy voting | |
| guidelines by visiting vanguard.com/proxyreporting or by | |
| calling Vanguard at 800-662-2739. The guidelines are | |
| also available from the SEC’s website, sec.gov. In | |
| addition, you may obtain a free report on how your fund | |
| voted the proxies for securities it owned during the 12 | |
| months ended June 30. To get the report, visit either | |
| vanguard.com/proxyreporting or sec.gov. | |
| |
| You can review and copy information about your fund at | |
| the SEC’s Public Reference Room in Washington, D.C. To | |
| find out more about this public service, call the SEC at | |
| 202-551-8090. Information about your fund is also | |
| available on the SEC’s website, and you can receive | |
| copies of this information, for a fee, by sending a | |
| request in either of two ways: via e-mail addressed to | |
| publicinfo@sec.gov or via regular mail addressed to the | |
| Public Reference Section, Securities and Exchange | |
| Commission, Washington, DC 20549-1520. | |
| |
| |
| | © 2013 The Vanguard Group, Inc. |
| | All rights reserved. |
| | Vanguard Marketing Corporation, Distributor. |
| |
| | Q530 032013 |
| 
|
| Annual Report | January 31, 2013 |
| Vanguard Health Care Fund |
|
 |
> For the fiscal year ended January 31, 2013, Vanguard Health Care Fund returned nearly 20% amid a broad-based advance for health care stocks.
> The fund trailed the result of its benchmark and the average return of its peer funds for the 12 months.
> For the decade ended January 31, the fund remained significantly ahead of its comparative standards in performance.
| |
| Contents | |
| Your Fund’s Total Returns. | 1 |
| Chairman’s Letter. | 2 |
| Advisor’s Report. | 8 |
| Fund Profile. | 11 |
| Performance Summary. | 12 |
| Financial Statements. | 14 |
| Your Fund’s After-Tax Returns. | 28 |
| About Your Fund’s Expenses. | 29 |
| Glossary. | 31 |
Please note: The opinions expressed in this report are just that—informed opinions. They should not be considered promises or advice.
Also, please keep in mind that the information and opinions cover the period through the date on the front of this report. Of course, the risks of investing in your fund are spelled out in the prospectus.
See the Glossary for definitions of investment terms used in this report.
About the cover: Our cover photograph shows rigging on the HMSSurprise, a replica of an 18th-century Royal Navy frigate. It was featured in the 2003 movie Master and Commander: The Far Side of the World, which was based on Patrick O’Brian’s sea novels, set amid the Napoleonic Wars. Vanguard was named for another ship of that era, the HMSVanguard, which was the flagship of British Admiral Horatio Nelson at the Battle of the Nile.
| |
| Your Fund’s Total Returns | |
| |
| |
| |
| |
| Fiscal Year Ended January 31, 2013 | |
| |
| | Total |
| | Returns |
| Vanguard Health Care Fund | |
| Investor Shares | 19.59% |
| Admiral™ Shares | 19.65 |
| MSCI All Country World Health Care Index | 23.08 |
| Global Health/Biotechnology Funds Average | 21.33 |
Global Health/Biotechnology Funds Average: Derived from data provided by Lipper Inc.
Admiral Shares carry lower expenses and are available to investors who meet certain account-balance requirements.
Your Fund’s Performance at a Glance
January 31, 2012, Through January 31, 2013
| | | | |
| | | | Distributions Per Share |
| | Starting | Ending | Income | Capital |
| | Share Price | Share Price | Dividends | Gains |
| Vanguard Health Care Fund | | | | |
| Investor Shares | $131.96 | $152.58 | $2.757 | $2.191 |
| Admiral Shares | 55.68 | 64.37 | 1.201 | 0.925 |
1

Chairman’s Letter
Dear Shareholder,
For the 12 months ended January 31, 2013, Vanguard Health Care Fund returned nearly 20% as health care stocks rallied and outpaced the broader U.S. market’s return. These stocks seemed to benefit from uncertainties about the economic outlook, both domestically and internationally. Investors often see health care as being insulated somewhat from fluctuations in the broader economy.
While delivering solid gains, the Health Care Fund lagged its comparative standards, experiencing disappointments among holdings in U.S. health insurers and pharmaceutical companies abroad. The fund’s benchmark, the MSCI All Country World Health Care Index, returned 23.08%, while global health and biotechnology funds posted an average return of 21.33% for the period. For the ten years ended January 31, 2013 the fund retained its significant performance edge over both its benchmark and its peers.
If you own shares of the fund in a taxable account, you may wish to review the fund’s after-tax returns later in this report.
Led by European shares, stocks returned double digits
Global stock markets rose sharply in the 12 months ended January 31, with European equities delivering the most robust results. Investors seemed buoyed by progress in addressing fiscal challenges there and elsewhere.
2
European stocks gained about 20% even as many countries in the region continued to struggle with economic woes. This disparity isn’t as unusual as it may appear. Vanguard research has found that the relationship between a country’s economic growth and its stock market returns has typically been weak over time.
In the United States, attention to federal budget challenges intensified as 2012 drew to a close. The focus on the “fiscal cliff” led to investor anxiety before policymakers reached a limited tax-rate agreement on the cusp of the new year. Although a credible long-term deficit-reduction strategy has yet to be crafted, investors propelled U.S. stocks to a 12-month gain of nearly 17%.
Bonds’ advance slowed; challenges may lie ahead
The broad U.S. taxable bond market returned a little more than 2.5% for the fiscal year. That modest result contrasts with the strong returns to which bond investors may have grown accustomed.
Bonds have been in a long-running bull market, as prices climbed and yields tumbled over many years. (Bond prices and yields move in opposite directions.) Indeed, the yield of the 10-year U.S. Treasury note slipped to a record low in July, closing below 1.5%. Recently, however, that trend reversed, and the 10-year yield broke 2% in late January.
| | | |
| Market Barometer | | | |
| |
| | | Average Annual Total Returns |
| | | Periods Ended January 31, 2013 |
| | One | Three | Five |
| | Year | Years | Years |
| Stocks | | | |
| Russell 1000 Index (Large-caps) | 17.03% | 14.48% | 4.28% |
| Russell 2000 Index (Small-caps) | 15.47 | 15.98 | 6.31 |
| Russell 3000 Index (Broad U.S. market) | 16.90 | 14.60 | 4.44 |
| MSCI All Country World Index ex USA (International) | 13.86 | 7.03 | -0.10 |
| |
| Bonds | | | |
| Barclays U.S. Aggregate Bond Index (Broad taxable market) | 2.59% | 5.41% | 5.45% |
| Barclays Municipal Bond Index (Broad tax-exempt market) | 4.80 | 6.53 | 5.73 |
| Citigroup Three-Month U.S. Treasury Bill Index | 0.08 | 0.09 | 0.38 |
| |
| CPI | | | |
| Consumer Price Index | 1.59% | 2.05% | 1.76% |
3
Bonds can provide critical diversification benefits to a portfolio, but their return prospects look much less promising than in recent years. As yields have dropped, the opportunity for price appreciation has greatly diminished. (You can read more about our expectations for bond and stock returns in Vanguard’s Economic and Investment Outlook, available at vanguard.com/research.)
As for money market funds and savings accounts, their returns barely budged as the Federal Reserve held short-term interest rates between 0% and 0.25%, a policy in place since late 2008.
The fund’s advisor keeps the focus on the long term
Your fund’s advisor, Wellington Management Company, chooses stocks it deems attractively valued and then typically holds on to those shares for extended periods, leading to a portfolio turnover rate that’s lower than those of many other heath care funds.
The advisor’s emphasis is where we believe it should be: on long-term results. In any given period, however, the Health Care Fund—like any actively managed fund—may underperform its benchmark and its peers.
Expense Ratios
Your Fund Compared With Its Peer Group
| | | |
| | Investor | Admiral | Peer Group |
| | Shares | Shares | Average |
| Health Care Fund | 0.35% | 0.30% | 1.32% |
The fund expense ratios shown are from the prospectus dated May 29, 2012, and represent estimated costs for the current fiscal year. For the fiscal year ended January 31, 2013, the fund’s expense ratios were 0.35% for Investor Shares and 0.30% for Admiral Shares. The peer-group expense ratio is derived from data provided by Lipper Inc. and captures information through year-end 2012.
Peer group: Global Health/Biotechnology Funds.
4
The fund’s relative performance in the fiscal year just ended was hurt by a sizable allocation to health insurers and health care service providers (about one-quarter of the portfolio’s holdings, on average). In previous years, this allocation has boosted the fund’s results compared with the competition. The service category did have gains in the past 12 months, but they were considerably less than those recorded by pharmaceutical companies in which the benchmark index had a higher weighting than the fund.
The advisor also can look beyond the United States for diversification opportunities. As of the end of the fiscal year, a little less than one-quarter of the portfolio was invested in companies based outside North America. But results were hampered by setbacks for some foreign drugmakers. The Advisor’s Report that follows this letter provides additional details about the management of the fund during the year.
Over the past decade, the fund has distinguished itself
The Health Care Fund’s long-term results continue to be significantly better than those of the fund’s comparative standards. For the ten years ended January 31, the fund’s Investor Shares had an average annual return of 10.45%, more than 3 percentage points ahead of the yearly gain of its benchmark index and nearly 2 percentage points above the average annual return of peer funds. Credit goes to Wellington, your fund’s experienced
Total Returns
Ten Years Ended January 31, 2013
| |
| | Average |
| | Annual Return |
| Health Care Fund Investor Shares | 10.45% |
| Spliced Health Care Index | 6.77 |
| Global Health/Biotechnology Funds Average | 8.49 |
For a benchmark description, see the Glossary.
Global Health/Biotechnology Funds Average: Derived from data provided by Lipper Inc.
The figures shown represent past performance, which is not a guarantee of future results. (Current performance may be lower or higher than the performance data cited. For performance data current to the most recent month-end, visit our website at vanguard.com/performance.) Note, too, that both investment returns and principal value can fluctuate widely, so an investor’s shares, when sold, could be worth more or less than their original cost.
5
advisor, whose superior stock-picking skills, coupled with the fund’s exceptionally low costs, have produced these strong results.
When I wrote to you in the semiannual report, I noted that Edward P. Owens, who had managed the Health Care Fund since its inception in 1984, would retire at the end of 2012. We wish Ed well in his retirement and thank him for his years of exemplary service to Vanguard clients.
The fund is now managed by Jean M. Hynes, who was part of Ed’s team for about two decades and has been the fund’s associate portfolio manager since 2008. I am confident that she and her colleagues at Wellington will carry on the fund’s tradition of excellence.
Following four principles can help investors succeed
Our clients often ask what they should do to cope with uncertainties in the market. How should they react? Should they do something different with their money?
The first point to keep in mind is that investing has always involved uncertainties. When asked what he thought the stock market would do, the financier J.P. Morgan had a standard response: “It will fluctuate.”
In our view, the most sensible approach is to focus on what’s within your control. In short, we believe investors can give themselves a greater chance for success by acting on four key points:
• Goals. What are you investing for? Each goal should be measurable and attainable. Getting there shouldn’t depend on outsize returns, or on impractical budgeting requirements.
• Balance. After identifying your goals, pursue them through a balanced asset allocation using broadly diversified funds.
• Cost. You won’t be surprised to hear that we place a big emphasis on controlling cost. The lower your costs, the greater the share of an investment’s return that you keep.
6
• Discipline. Everything else depends on this: In the face of market turmoil, discipline and long-term perspective can help you stay on track toward reaching your goals.
Successful investing doesn’t have to be complicated; but that’s not to say it’s easy. Investing can provoke strong emotions, and it’s hard to stay levelheaded during times of volatility. If you’re getting pulled off course, try to redirect your attention to the principles I’ve outlined. These principles—which reflect the core philosophy Vanguard has held for decades—can be the answer to uncertainty.
As always, thank you for entrusting your assets to Vanguard.
Sincerely,

F. William McNabb III
Chairman and Chief Executive Officer
February 13, 2013
7
Advisor’s Report
For the fiscal year ended January 31, 2013, Vanguard Health Care Fund returned 19.59% for Investor Shares and 19.65% for Admiral Shares. The fund’s performance lagged the 23.08% return of its benchmark, the MSCI All Country World Health Care Index, and also trailed the 21.33% average return of its competitors.
The investment environment
Overall, it was a solid year for the fund and the health care sector as a whole, which outpaced the Standard & Poor’s 500 Index return of 16.78%.
Shares of drug companies, particularly biotech stocks, continued to generate strong returns for the fund. As these firms work to develop unique drugs to satisfy unmet needs across many therapeutic areas, their research has grown increasingly productive and their technology platforms more valuable. We continue to believe the industry has a bright future despite an uncertain and potentially challenging regulatory and economic outlook.
Major Portfolio Changes
Year Ended January 31, 2013
| |
Additions Teva Pharmaceutical Industries | Comments Price weakness gave us the opportunity to increase our holdings. We see Teva as well-positioned to benefit over the longer term from continuing demand. |
Stryker | We initiated a position in this company, a manufacturer and wholesaler of orthopedics-focused specialty surgical and medical products. The new CEO is focused on improving execution and accelerating growth through opportunities including geographic expansion and product innovation. |
AbbVie | This is a new position resulting from a split in an existing holding. On January 1, Abbott Laboratories was divided into two firms: an innovation-focused pharmaceutical company called AbbVie and a diversified medical products company that retains the Abbott name (see below). |
| |
Reductions Abbott Laboratories | Comments We trimmed our position into strength. The stock was a solid performer during the year as the market embraced plans for the split. |
Gilead Sciences | We reduced our exposure to Gilead stock, which performed well during the period. Gilead is developing a potentially best-in-class, next-generation nucleotide for the treatment of hepatitis C. |
Coventry Health Care | We trimmed this holding into strength. The stock price advanced on news that Coventry would be acquired by Aetna, and we reduced our position ahead of the acquisition. |
8
During the fiscal year, the market’s focus shifted from the Affordable Care Act to the presidential election and then finally to the so-called fiscal cliff. We kept our own focus on companies least affected by the indecisive political climate, including certain managed-care organizations that we view as well positioned no matter what industry reform developments may occur over time.
Our successes
Our largest holding at the period’s close, Merck, was also among the most significant contributors to the fund’s absolute performance for the year. Roche was another leader of our pharmaceutical stocks, and Pfizer and Eli Lilly helped as well. In the biotech category, Amgen stood out.
Merck’s performance—its shares climbed by double digits over the 12 months—was particularly strong through the first half of the period thanks to the success of Phase 3 clinical trials for its novel osteoporosis treatment. We are attracted to the growth potential of the company’s current global lineup, including its diabetes drug Januvia and its vaccine business. Its late-stage pipeline, including the new osteoporosis drug, will augment this growth in the coming decade.
Shares of Roche, the Swiss-based global pharmaceutical company, advanced by more than 30%, and our large position made this holding the top absolute contributor to fund performance. We continue to own the stock as we have a favorable outlook on the company’s existing products and new drugs in the pipeline, particularly those targeting cancer.
Our shortfalls
Humana detracted most from our performance during the period. Our positions in Health Net, Elan, and Teva Pharmaceutical also hindered results, as did a few companies based in Japan (Daiichi Sankyo, Mitsubishi Tanabe Pharma, and Ono Pharmaceutical).
Humana’s stock dropped sharply in the summer after the company announced disappointing profits and tempered its forecasts, citing unanticipated costs associated with membership increases in its Medicare Advantage programs. Despite some near-term uncertainty, Humana has an important position in the Medicare market, which we expect will be more valued over time, and we added to our position.
Shares of Health Net, a managed-care company offering insurance and other medical service plans, also declined significantly. As the firm confronted rising costs and an increasingly competitive environment, its earnings volatility and execution challenges seemed to startle investors. Though we trimmed our holdings early in the period prior to a sharp drop in the stock, we later bought more shares, modestly increasing our position at a cheaper valuation.
Elan is an Ireland-based biotechnology company specializing in neuroscience. The stock fell after the firm released
9
disappointing results for a North American Phase 3 trial for bapineuzumab, a treat-ment for Alzheimer’s disease. However, because its value is anchored in multiple sclerosis drug Tysabri, a growing asset, we took advantage of the setback to add modestly to our holdings.
The fund’s positioning
The health care industry continues to offer many long-term opportunities, albeit with some challenges. After a decade of lower productivity, it is showing more signs of biopharmaceutical innovation, and we have been encouraged by favorable decisions from the U.S. Food and Drug Administration.
While we believe the impact of health care reform will likely be manageable over time, significant uncertainties remain. Health care will continue to be in the spotlight as the United States and Europe struggle to reduce their debt burdens in the years ahead.
Emerging markets represent a growth frontier for global therapeutic and device companies, which is a plus for the sector’s outlook. Finally, in contrast to industries that depend largely on discretionary spending and tend to exhibit greater sensitivity to sluggish economic growth, health care has historically demonstrated more independence from weaknesses in the economic cycle.
We will keep striving to identify the drugs and devices with the best chances of changing medicine and the service companies that are best-situated to capture opportunities along the health care chain. We will remain diversified across the industry’s subsectors and regions, focused on the long haul, and positioned in the most attractive health care stocks.
Jean M. Hynes, CFA
Senior Vice President and
Portfolio Manager
Wellington Management Company, LLP
February 16, 2013
10
Health Care Fund
Fund Profile
As of January 31, 2013
| | |
| Share-Class Characteristics | |
| | Investor | Admiral |
| | Shares | Shares |
| Ticker Symbol | VGHCX | VGHAX |
| Expense Ratio1 | 0.35% | 0.30% |
| 30-Day SEC Yield | 1.72% | 1.77% |
| | | |
| Portfolio Characteristics | | |
| | | | DJ U.S. |
| | | MSCI | Total |
| | | ACWI | Market |
| | | Health | FA |
| | Fund | Care | Index |
| Number of Stocks | 90 | 140 | 3,595 |
| Median Market Cap | $37.4B | $60.3B | $37.6B |
| Price/Earnings Ratio | 16.7x | 18.0x | 17.2x |
| Price/Book Ratio | 2.4x | 2.9x | 2.2x |
| Return on Equity | 19.5% | 21.9% | 16.8% |
| Earnings Growth Rate | 7.5% | 8.3% | 9.1% |
| Dividend Yield | 2.2% | 2.5% | 2.0% |
| Foreign Holdings | 22.6% | 42.7% | 0.0% |
| Turnover Rate | 8% | — | — |
| Short-Term Reserves | 7.7% | — | — |
| | |
| Subindustry Diversification (% of equity exposure) | |
| | | MSCI |
| | | ACWI |
| | | Health |
| | Fund | Care |
| Biotechnology | 9.5% | 9.9% |
| Consumer Staples | 2.2 | 0.0 |
| Health Care Distributors | 5.5 | 2.5 |
| Health Care Equipment | 11.3 | 12.2 |
| Health Care Facilities | 2.7 | 0.7 |
| Health Care Services | 1.4 | 4.3 |
| Health Care Supplies | 0.4 | 1.2 |
| Health Care Technology | 2.2 | 0.5 |
| Life Sciences Tools & Services | 0.9 | 2.6 |
| Managed Health Care | 13.0 | 4.6 |
| Materials | 0.7 | 0.0 |
| Pharmaceuticals | 50.2 | 61.5 |
| | |
| Volatility Measures | | |
| | | DJ U.S. |
| | Spliced | Total |
| | Health | Market |
| | Care | FA |
| | Index | Index |
| R-Squared | 0.94 | 0.63 |
| Beta | 0.86 | 0.54 |
These measures show the degree and timing of the fund’s fluctuations compared with the indexes over 36 months.
| | |
| Ten Largest Holdings (% of total net assets) |
| Merck & Co. Inc. | Pharmaceuticals | 6.2% |
| Roche Holding AG | Pharmaceuticals | 4.4 |
| UnitedHealth Group Inc. | Managed Health | |
| | Care | 4.2 |
| Amgen Inc. | Biotechnology | 4.1 |
| Forest Laboratories Inc. | Pharmaceuticals | 3.9 |
| Pfizer Inc. | Pharmaceuticals | 3.7 |
| McKesson Corp. | Health Care | |
| | Distributors | 3.6 |
| Eli Lilly & Co. | Pharmaceuticals | 3.3 |
| Astellas Pharma Inc. | Pharmaceuticals | 3.0 |
| AstraZeneca plc | Pharmaceuticals | 2.9 |
| Top Ten | | 39.3% |
The holdings listed exclude any temporary cash investments and equity index products.
| |
| Market Diversification (% of equity exposure) |
| |
| Europe | |
| Switzerland | 6.4% |
| United Kingdom | 3.6 |
| Belgium | 1.5 |
| Germany | 1.0 |
| Other | 1.1 |
| Subtotal | 13.6% |
| Pacific | |
| Japan | 8.6% |
| North America | |
| United States | 75.9% |
| Middle East | |
| Israel | 1.9% |
1 The expense ratios shown are from the prospectus dated May 29, 2012, and represent estimated costs for the current fiscal year. For the fiscal year ended January 31, 2013, the expense ratios were 0.35% for Investor Shares and 0.30% for Admiral Shares.
11
Health Care Fund
Performance Summary
All of the returns in this report represent past performance, which is not a guarantee of future results that may be achieved by the fund. (Current performance may be lower or higher than the performance data cited. For performance data current to the most recent month-end, visit our website at vanguard.com/performance.) Note, too, that both investment returns and principal value can fluctuate widely, so an investor’s shares, when sold, could be worth more or less than their original cost. The returns shown do not reflect taxes that a shareholder would pay on fund distributions or on the sale of fund shares.
Cumulative Performance: January 31, 2003, Through January 31, 2013
Initial Investment of $10,000
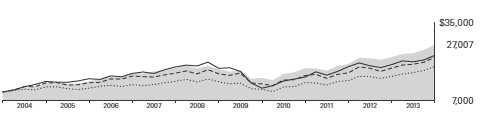
| | | | |
| | | Average Annual Total Returns | |
| | Periods Ended January 31, 2013 | |
| |
| | | | | Final Value |
| | One | Five | Ten | of a $10,000 |
| | Year | Years | Years | Investment |
| |
| Health Care Fund Investor Shares | 19.59% | 8.19% | 10.45% | $27,007 |
| |
| Spliced Health Care Index | 23.08 | 7.03 | 6.77 | 19,260 |
| Global Health/Biotechnology Funds | | | | |
| Average | 21.33 | 6.40 | 8.49 | 22,595 |
| Dow Jones U.S. Total Stock Market | | | | |
| Float Adjusted Index | 16.88 | 4.61 | 8.80 | 23,250 |
For a benchmark description, see the Glossary.
Global Health/Biotechnology Funds Average: Derived from data provided by Lipper Inc.
| | | | |
| | | | | Final Value |
| | One | Five | Ten | of a $50,000 |
| | Year | Years | Years | Investment |
| Health Care Fund Admiral Shares | 19.65% | 8.26% | 10.53% | $136,029 |
| Spliced Health Care Index | 23.08 | 7.03 | 6.77 | 96,299 |
| Dow Jones U.S. Total Stock Market Float | | | | |
| Adjusted Index | 16.88 | 4.61 | 8.80 | 116,248 |
See Financial Highlights for dividend and capital gains information.
12
Health Care Fund
Fiscal-Year Total Returns (%): January 31, 2003, Through January 31, 2013
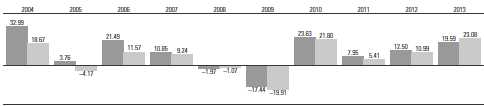
|
| Health Care Fund Investor Shares |
| Spliced Health Care Index |
For a benchmark description, see the Glossary.
Average Annual Total Returns: Periods Ended December 31, 2012
This table presents returns through the latest calendar quarter—rather than through the end of the fiscal period.
Securities and Exchange Commission rules require that we provide this information.
| | | | |
| | Inception | One | Five | Ten |
| | Date | Year | Years | Years |
| Investor Shares | 5/23/1984 | 15.11% | 6.08% | 9.54% |
| Admiral Shares | 11/12/2001 | 15.17 | 6.14 | 9.62 |
13
Health Care Fund
Financial Statements
Statement of Net Assets
As of January 31, 2013
The fund reports a complete list of its holdings in regulatory filings four times in each fiscal year, at the quarter-ends. For the second and fourth fiscal quarters, the lists appear in the fund’s semiannual and annual reports to shareholders. For the first and third fiscal quarters, the fund files the lists with the Securities and Exchange Commission on Form N-Q. Shareholders can look up the fund’s Forms N-Q on the SEC’s website at sec.gov. Forms N-Q may also be reviewed and copied at the SEC’s Public Reference Room (see the back cover of this report for further information).
| | | |
| | | | Market |
| | | | Value |
| | | Shares | ($000) |
| Common Stocks (93.7%) | | |
| United States (71.1%) | | |
| Biotechnology (8.3%) | | |
| | Amgen Inc. | 11,758,355 | 1,004,869 |
| * | GileadSciences Inc. | 6,964,200 | 274,738 |
| * | Biogen Idec Inc. | 1,520,000 | 237,241 |
| * | Regeneron | | |
| | Pharmaceuticals Inc. | 725,300 | 126,159 |
| * | Vertex | | |
| | Pharmaceuticals Inc. | 2,243,700 | 100,473 |
| * | United Therapeutics Corp. | 1,487,000 | 80,134 |
| * | Onyx Pharmaceuticals Inc. | 1,022,700 | 79,280 |
| * | Cubist | | |
| | Pharmaceuticals Inc. | 1,323,142 | 56,948 |
| * | Incyte Corp. Ltd. | 1,605,850 | 29,515 |
| * | Ironwood | | |
| | Pharmaceuticals Inc. | | |
| | Class A | 2,167,135 | 27,783 |
| * | Alkermes plc | 1,075,219 | 24,784 |
| | | | 2,041,924 |
| Chemicals (0.7%) | | |
| | Sigma-AldrichCorp. | 2,272,192 | 175,709 |
| |
| Food & Staples Retailing (2.0%) | |
| | Walgreen Co. | 11,670,400 | 466,349 |
| | CVS Caremark Corp. | 725,700 | 37,156 |
| | | | 503,505 |
| Health Care Equipment & Supplies (11.0%) |
| | Medtronic Inc. | 10,801,100 | 503,331 |
| * | Boston Scientific Corp. | 46,600,000 | 348,102 |
| | St. Jude Medical Inc. | 8,372,600 | 340,765 |
| | Abbott Laboratories | 9,347,700 | 316,700 |
| | Becton Dickinson and Co. | 2,902,500 | 243,926 |
| | Baxter International Inc. | 3,500,000 | 237,440 |
| | ZimmerHoldings Inc. | 2,400,000 | 179,040 |
| | Covidien plc | 2,397,600 | 149,466 |
| * | CareFusion Corp. | 4,734,654 | 146,964 |
| | | |
| | | | Market |
| | | | Value |
| | | Shares | ($000) |
| | DENTSPLY | | |
| | International Inc. | 2,285,400 | 95,438 |
| | Stryker Corp. | 1,433,500 | 89,809 |
| | STERISCorp. | 803,083 | 30,300 |
| * | NuVasive Inc. | 1,628,303 | 28,056 |
| | | | 2,709,337 |
| Health Care Providers & Services (20.9%) | |
| | UnitedHealth Group Inc. | 18,785,100 | 1,037,125 |
| | McKesson Corp. | 8,539,900 | 898,654 |
| | WellPoint Inc. | 7,702,400 | 499,270 |
| | Humana Inc. | 6,510,094 | 484,091 |
| | CignaCorp. | 7,710,600 | 449,836 |
| | Cardinal Health Inc. | 6,236,708 | 273,230 |
| | Universal Health | | |
| | Services Inc. Class B | 4,020,800 | 227,738 |
| | Aetna Inc. | 4,675,200 | 225,485 |
| | Coventry Health | | |
| | Care Inc. | 4,027,500 | 184,580 |
| | Quest Diagnostics Inc. | 3,027,600 | 175,450 |
| *,1 | Health Management | | |
| | Associates Inc. | | |
| | Class A | 15,656,900 | 163,458 |
| | HCA Holdings Inc. | 3,400,000 | 128,010 |
| * | Laboratory Corp. of | | |
| | America Holdings | 1,228,560 | 109,956 |
| * | Health Net Inc. | 3,863,458 | 105,086 |
| | Owens& Minor Inc. | 3,000,000 | 91,830 |
| * | Tenet Healthcare Corp. | 1,400,000 | 54,362 |
| * | Vanguard Health | | |
| | Systems Inc. | 2,556,780 | 35,718 |
| * | WellCare Health Plans Inc. | 349,000 | 17,698 |
| * | HealthSouth Corp. | 386,000 | 9,210 |
| | | | 5,170,787 |
| Health Care Technology (2.1%) | |
| * | Cerner Corp. | 5,600,000 | 462,280 |
| * | Allscripts Healthcare | | |
| | Solutions Inc. | 4,005,709 | 44,383 |
| | | | 506,663 |
14
| | | |
| Health Care Fund | | |
| |
| |
| |
| | | | Market |
| | | | Value |
| | | Shares | ($000) |
| Life Sciences Tools & Services (0.8%) | |
| | Agilent Technologies Inc. | 2,237,200 | 100,182 |
| * | PAREXEL International | | |
| | Corp. | 2,590,400 | 87,685 |
| * | Illumina Inc. | 418,500 | 21,189 |
| | | | 209,056 |
| Pharmaceuticals (25.3%) | | |
| | Merck & Co. Inc. | 35,490,648 | 1,534,971 |
| *,1 | Forest Laboratories Inc. | 26,360,524 | 956,887 |
| | Pfizer Inc. | 33,383,888 | 910,712 |
| | Eli Lilly & Co. | 15,364,300 | 824,909 |
| | Bristol-Myers Squibb Co. | 16,089,461 | 581,473 |
| | AbbVie Inc. | 14,151,000 | 519,200 |
| | Johnson & Johnson | 4,500,000 | 332,640 |
| | Perrigo Co. | 1,859,100 | 186,858 |
| * | Actavis Inc. | 1,600,000 | 138,224 |
| * | Hospira Inc. | 3,258,170 | 111,169 |
| * | Salix Pharmaceuticals Ltd. | 1,965,593 | 94,152 |
| * | Zoetis Inc. | 663,700 | 17,256 |
| * | Medicines Co. | 448,400 | 13,398 |
| * | Mylan Inc. | 397,900 | 11,249 |
| | | | 6,233,098 |
| Total United States | | 17,550,079 |
| International (22.6%) | | |
| Belgium (1.4%) | | |
| | UCB SA | 6,168,194 | 356,041 |
| |
| Denmark (0.0%) | | |
| | H Lundbeck A/S | 73,965 | 1,170 |
| |
| France (0.4%) | | |
| | Sanofi | 671,976 | 65,509 |
| | Ipsen SA | 1,157,403 | 40,719 |
| | | | 106,228 |
| Germany (0.9%) | | |
| | Bayer AG | 1,929,452 | 190,405 |
| | Fresenius Medical | | |
| | Care AG & Co. KGaA | 511,950 | 36,087 |
| | | | 226,492 |
| Ireland (0.5%) | | |
| * | Elan Corp. plc ADR | 11,236,320 | 118,094 |
| * | Prothena Corp. plc | 249,624 | 1,500 |
| | | | 119,594 |
| Israel (1.8%) | | |
| | Teva Pharmaceutical | | |
| | Industries Ltd. ADR | 11,361,300 | 431,616 |
| |
| Japan (8.1%) | | |
| | Astellas Pharma Inc. | 14,365,700 | 731,292 |
| | Takeda Pharmaceutical | | |
| | Co. Ltd. | 5,599,900 | 287,760 |
| | EisaiCo. Ltd. | 5,793,700 | 253,308 |
| | Daiichi Sankyo Co. Ltd. | 13,910,900 | 235,518 |
| | |
| | | Market |
| | | Value |
| | Shares | ($000) |
| Shionogi & Co. Ltd. | 12,066,234 | 215,652 |
| Chugai Pharmaceutical | | |
| Co. Ltd. | 5,621,700 | 115,645 |
| Mitsubishi Tanabe | | |
| Pharma Corp. | 7,100,000 | 95,180 |
| Ono Pharmaceutical | | |
| Co. Ltd. | 1,174,800 | 61,894 |
| | | 1,996,249 |
| Norway (0.1%) | | |
| *,^ Algeta ASA | 565,247 | 17,303 |
| |
| Switzerland (6.0%) | | |
| Roche Holding AG | 4,273,977 | 944,716 |
| Novartis AG | 4,476,362 | 304,287 |
| Roche Holding AG (Bearer) | 664,320 | 149,887 |
| Novartis AG ADR | 1,071,600 | 72,676 |
| Actelion Ltd. | 401,482 | 19,888 |
| | | 1,491,454 |
| United Kingdom (3.4%) | | |
| AstraZeneca plc | 14,695,048 | 710,069 |
| GlaxoSmithKline plc ADR | 2,742,381 | 125,080 |
| | | 835,149 |
| Total International | | 5,581,296 |
| Total Common Stocks | | |
| (Cost $13,161,625) | | 23,131,375 |
| Temporary Cash Investments (7.8%) | |
| Money Market Fund (0.0%) | | |
| 2,3 Vanguard Market | | |
| Liquidity Fund, 0.143% | 1,815,000 | 1,815 |
| |
| | Face | |
| | Amount | |
| | ($000) | |
| Repurchase Agreements (6.2%) | |
| Bank of America Securities, | |
| LLC 0.160%, 2/1/13 | | |
| (Dated 1/31/13, Repurchase | |
| Value $601,503,000, | | |
| collateralized by Federal | | |
| Home Loan Mortgage Corp. | |
| 3.500%-5.500%, | | |
| 11/1/38-5/1/42, and Federal | |
| National Mortgage Assn. | | |
| 3.500%-5.000%, | | |
| 8/1/40-1/1/43) | 601,500 | 601,500 |
| Barclays Capital Inc. | | |
| 0.130%, 2/1/13 (Dated | | |
| 1/31/13, Repurchase | | |
| Value $94,400,000, | | |
| collateralized by | | |
| U.S. Treasury Note/ | | |
| Bond 2.750%, 8/15/42) | 94,400 | 94,400 |
15
| | |
| Health Care Fund | | |
| |
| |
| |
| | | Market |
| | | Value• |
| | Shares | ($000) |
| Barclays Capital Inc. | | |
| 0.140%, 2/7/13 (Dated | | |
| 1/31/13, Repurchase | | |
| Value $250,007,000, | | |
| collateralized by Federal | | |
| National Mortgage Assn. | | |
| 4.000%, 3/1/42) | 250,000 | 250,000 |
| BNP Paribas Securities | | |
| Corp. 0.160%, 2/1/13 | | |
| (Dated 1/31/13, Repurchase | | |
| Value $21,100,000, | | |
| collateralized by Federal | | |
| Home Loan Mortgage | | |
| Corp. 4.000%-7.000%, | | |
| 12/1/18-1/1/42, Federal | | |
| National Mortgage Assn. | | |
| 3.500%-6.500%, | | |
| 9/1/16-6/1/42, and | | |
| Government National | | |
| Mortgage Assn. | | |
| 4.750%, 10/15/40) | 21,100 | 21,100 |
| HSBC Bank USA 0.160%, | | |
| 2/1/13 (Dated 1/31/13, | | |
| Repurchase Value | | |
| $356,902,000, collateralized | | |
| by Federal National | | |
| Mortgage Assn. | | |
| 4.000%-6.000%, | | |
| 3/1/34-10/1/41) | 356,900 | 356,900 |
| Morgan Stanley & Co., | | |
| Inc. 0.160%, 2/1/13 | | |
| (Dated 1/31/13, Repurchase | | |
| Value $175,001,000, | | |
| collateralized by Federal | | |
| National Mortgage Assn. | | |
| 3.000%-5.500%, | | |
| 11/1/35-11/1/42) | 175,000 | 175,000 |
| UBS Securities LLC | | |
| 0.150%, 2/1/13 (Dated | | |
| 1/31/13, Repurchase | | |
| Value $23,700,000, | | |
| collateralized by Federal | | |
| National Mortgage Assn. | | |
| 2.500%-3.500%, | | |
| 10/1/27-11/1/42) | 23,700 | 23,700 |
| | | 1,522,600 |
| | |
| | | Market |
| | | Value• |
| | Shares | ($000) |
| Commercial Paper (1.6%) | | |
| General Electric Capital | | |
| Corp., 0.200%, 3/5/13 | 200,000 | 199,966 |
| General Electric Capital | | |
| Corp., 0.200%, 5/8/13 | 200,000 | 199,898 |
| | | 399,864 |
| Total Temporary Cash Investments | |
| (Cost $1,924,273) | | 1,924,279 |
| Total Investments (101.5%) | | |
| (Cost $15,085,898) | | 25,055,654 |
| Other Assets and Liabilities (-1.5%) | |
| Other Assets | | 120,600 |
| Liabilities3 | | (493,163) |
| | | (372,563) |
| Net Assets (100%) | | 24,683,091 |
16
Health Care Fund
| |
| At January 31, 2013, net assets consisted of: |
| | Amount |
| | ($000) |
| Paid-in Capital | 14,147,622 |
| Overdistributed Net Investment Income | (58,424) |
| Accumulated Net Realized Gains | 594,116 |
| Unrealized Appreciation (Depreciation) | |
| Investment Securities | 9,969,756 |
| Forward Currency Contracts | 30,017 |
| Foreign Currencies | 4 |
| Net Assets | 24,683,091 |
| |
| |
| Investor Shares—Net Assets | |
| Applicable to 56,895,188 outstanding | |
| $.001 par value shares of beneficial | |
| interest (unlimited authorization) | 8,681,332 |
| Net Asset Value Per Share— | |
| Investor Shares | $152.58 |
| |
| |
| Admiral Shares—Net Assets | |
| Applicable to 248,583,476 outstanding | |
| $.001 par value shares of beneficial | |
| interest (unlimited authorization) | 16,001,759 |
| Net Asset Value Per Share— | |
| Admiral Shares | $64.37 |
See Note A in Notes to Financial Statements.
* Non-income-producing security.
^ Part of security position is on loan to broker-dealers. The total value of securities on loan is $1,683,000.
1 Considered an affiliated company of the fund as the fund owns more than 5% of the outstanding voting securities of such company.
2 Affiliated money market fund available only to Vanguard funds and certain trusts and accounts managed by Vanguard. Rate shown is the 7-day yield.
3 Includes $1,815,000 of collateral received for securities on loan.
ADR—American Depositary Receipt.
17
| |
| Health Care Fund | |
| |
| |
| Statement of Operations | |
| |
| | Year Ended |
| | January 31, 2013 |
| | ($000) |
| Investment Income | |
| Income | |
| Dividends1,2 | 513,532 |
| Interest | 2,974 |
| Security Lending | 2,339 |
| Total Income | 518,845 |
| Expenses | |
| Investment Advisory Fees—Note B | 33,646 |
| The Vanguard Group—Note C | |
| Management and Administrative—Investor Shares | 15,386 |
| Management and Administrative—Admiral Shares | 18,697 |
| Marketing and Distribution—Investor Shares | 1,405 |
| Marketing and Distribution—Admiral Shares | 2,006 |
| Custodian Fees | 521 |
| Auditing Fees | 29 |
| Shareholders’ Reports—Investor Shares | 132 |
| Shareholders’ Reports—Admiral Shares | 42 |
| Trustees’ Fees and Expenses | 57 |
| Total Expenses | 71,921 |
| Net Investment Income | 446,924 |
| Realized Net Gain (Loss) | |
| Investment Securities Sold2 | 945,269 |
| Foreign Currencies and Forward Currency Contracts | 9,495 |
| Realized Net Gain (Loss) | 954,764 |
| Change in Unrealized Appreciation (Depreciation) | |
| Investment Securities | 2,677,826 |
| Foreign Currencies and Forward Currency Contracts | 31,725 |
| Change in Unrealized Appreciation (Depreciation) | 2,709,551 |
| Net Increase (Decrease) in Net Assets Resulting from Operations | 4,111,239 |
1 Dividends are net of foreign withholding taxes of $15,732,000.
2 Dividend income and realized net gain (loss) from affiliated companies of the fund were $3,739,000 and $83,982,000, respectively.
See accompanying Notes, which are an integral part of the Financial Statements.
18
| | |
| Health Care Fund | | |
| |
| |
| Statement of Changes in Net Assets | | |
| |
| | Year Ended January 31, |
| | 2013 | 2012 |
| | ($000) | ($000) |
| Increase (Decrease) in Net Assets | | |
| Operations | | |
| Net Investment Income | 446,924 | 364,494 |
| Realized Net Gain (Loss) | 954,764 | 709,376 |
| Change in Unrealized Appreciation (Depreciation) | 2,709,551 | 1,356,581 |
| Net Increase (Decrease) in Net Assets Resulting from Operations | 4,111,239 | 2,430,451 |
| Distributions | | |
| Net Investment Income | | |
| Investor Shares | (153,444) | (137,158) |
| Admiral Shares | (289,547) | (217,791) |
| Realized Capital Gain1 | | |
| Investor Shares | (121,753) | (320,941) |
| Admiral Shares | (223,106) | (484,740) |
| Total Distributions | (787,850) | (1,160,630) |
| Capital Share Transactions | | |
| Investor Shares | (1,034,400) | (517,566) |
| Admiral Shares | 963,636 | 772,975 |
| Net Increase (Decrease) from Capital Share Transactions | (70,764) | 255,409 |
| Total Increase (Decrease) | 3,252,625 | 1,525,230 |
| Net Assets | | |
| Beginning of Period | 21,430,466 | 19,905,236 |
| End of Period2 | 24,683,091 | 21,430,466 |
1 Includes fiscal 2013 and 2012 short-term gain distributions totaling $27,207,000 and $79,746,000, respectively. Short-term gain distributions are treated as ordinary income dividends for tax purposes.
2 Net Assets—End of Period includes undistributed (overdistributed) net investment income of ($58,424,000) and ($49,588,000).
See accompanying Notes, which are an integral part of the Financial Statements.
19
| | | | | |
| Health Care Fund | | | | | |
| |
| |
| Financial Highlights | | | | | |
| |
| |
| Investor Shares | | | | | |
| |
| |
| For a Share Outstanding | | | Year Ended January 31, |
| Throughout Each Period | 2013 | 2012 | 2011 | 2010 | 2009 |
| Net Asset Value, Beginning of Period | $131.96 | $124.30 | $120.06 | $99.12 | $133.80 |
| Investment Operations | | | | | |
| Net Investment Income | 2.777 | 2.300 | 2.046 | 1.902 | 1.998 |
| Net Realized and Unrealized Gain (Loss) | | | | | |
| on Investments | 22.791 | 12.780 | 7.404 | 21.530 | (25.229) |
| Total from Investment Operations | 25.568 | 15.080 | 9.450 | 23.432 | (23.231) |
| Distributions | | | | | |
| Dividends from Net Investment Income | (2.757) | (2.237) | (2.007) | (1.761) | (1.925) |
| Distributions from Realized Capital Gains | (2.191) | (5.183) | (3.203) | (.731) | (9.524) |
| Total Distributions | (4.948) | (7.420) | (5.210) | (2.492) | (11.449) |
| Net Asset Value, End of Period | $152.58 | $131.96 | $124.30 | $120.06 | $99.12 |
| |
| Total Return1 | 19.59% | 12.50% | 7.95% | 23.63% | -17.44% |
| |
| Ratios/Supplemental Data | | | | | |
| Net Assets, End of Period (Millions) | $8,681 | $8,462 | $8,447 | $11,692 | $10,478 |
| Ratio of Total Expenses to Average Net Assets | 0.35% | 0.35% | 0.35% | 0.36% | 0.29% |
| Ratio of Net Investment Income to | | | | | |
| Average Net Assets | 1.94% | 1.72% | 1.67% | 1.73% | 1.64% |
| Portfolio Turnover Rate | 8% | 8% | 9% | 6% | 12% |
1 Total returns do not include transaction or account service fees that may have applied in the periods shown. Fund prospectuses provide information about any applicable transaction and account service fees.
See accompanying Notes, which are an integral part of the Financial Statements.
20
| | | | | |
| Health Care Fund | | | | | |
| |
| |
| Financial Highlights | | | | | |
| |
| |
| Admiral Shares | | | | | |
| |
| |
| For a Share Outstanding | | | Year Ended January 31, |
| Throughout Each Period | 2013 | 2012 | 2011 | 2010 | 2009 |
| Net Asset Value, Beginning of Period | $55.68 | $52.45 | $50.67 | $41.83 | $56.47 |
| Investment Operations | | | | | |
| Net Investment Income | 1.211 | 1.005 | .891 | .835 | .879 |
| Net Realized and Unrealized Gain (Loss) | | | | | |
| on Investments | 9.605 | 5.392 | 3.115 | 9.091 | (10.648) |
| Total from Investment Operations | 10.816 | 6.397 | 4.006 | 9.926 | (9.769) |
| Distributions | | | | | |
| Dividends from Net Investment Income | (1.201) | (.980) | (.874) | (.777) | (.852) |
| Distributions from Realized Capital Gains | (.925) | (2.187) | (1.352) | (.309) | (4.019) |
| Total Distributions | (2.126) | (3.167) | (2.226) | (1.086) | (4.871) |
| Net Asset Value, End of Period | $64.37 | $55.68 | $52.45 | $50.67 | $41.83 |
| |
| Total Return1 | 19.65% | 12.57% | 7.99% | 23.72% | -17.38% |
| |
| Ratios/Supplemental Data | | | | | |
| Net Assets, End of Period (Millions) | $16,002 | $12,968 | $11,459 | $8,619 | $7,576 |
| Ratio of Total Expenses to Average | | | | | |
| Net Assets | 0.30% | 0.30% | 0.30% | 0.29% | 0.22% |
| Ratio of Net Investment Income to | | | | | |
| Average Net Assets | 1.99% | 1.77% | 1.72% | 1.80% | 1.71% |
| Portfolio Turnover Rate | 8% | 8% | 9% | 6% | 12% |
1 Total returns do not include transaction or account service fees that may have applied in the periods shown. Fund prospectuses provide information about any applicable transaction and account service fees.
See accompanying Notes, which are an integral part of the Financial Statements.
21
Health Care Fund
Notes to Financial Statements
Vanguard Health Care Fund is registered under the Investment Company Act of 1940 as an open-end investment company, or mutual fund. The fund invests in securities of foreign issuers, which may subject it to investment risks not normally associated with investing in securities of U.S. corporations. The fund offers two classes of shares: Investor Shares and Admiral Shares. Investor Shares are available to any investor who meets the fund’s minimum purchase requirements. Admiral Shares are designed for investors who meet certain administrative, service, and account-size criteria.
A. The following significant accounting policies conform to generally accepted accounting principles for U.S. mutual funds. The fund consistently follows such policies in preparing its financial statements.
1. Security Valuation: Securities are valued as of the close of trading on the New York Stock Exchange (generally 4 p.m., Eastern time) on the valuation date. Equity securities are valued at the latest quoted sales prices or official closing prices taken from the primary market in which each security trades; such securities not traded on the valuation date are valued at the mean of the latest quoted bid and asked prices. Securities for which market quotations are not readily available, or whose values have been affected by events occurring before the fund’s pricing time but after the close of the securities’ primary markets, are valued at their fair values calculated according to procedures adopted by the board of trustees. These procedures include obtaining quotations from an independent pricing service, monitoring news to identify significant market- or security-specific events, and evaluating changes in the values of foreign market proxies (for example, ADRs, futures contracts, or exchange-traded funds), between the time the foreign markets close and the fund’s pricing time. When fair-value pricing is employed, the prices of securities used by a fund to calculate its net asset value may differ from quoted or published prices for the same securities. Investments in Vanguard Market Liquidity Fund are valued at that fund’s net asset value. Temporary cash investments acquired over 60 days to maturity are valued using the latest bid prices or using valuations based on a matrix system (which considers such factors as security prices, yields, maturities, and ratings), both as furnished by independent pricing services. Other temporary cash investments are valued at amortized cost, which approximates market value.
2. Foreign Currency: Securities and other assets and liabilities denominated in foreign currencies are translated into U.S. dollars using exchange rates obtained from an independent third party as of the fund’s pricing time on the valuation date. Realized gains (losses) and unrealized appreciation (depreciation) on investment securities include the effects of changes in exchange rates since the securities were purchased, combined with the effects of changes in security prices. Fluctuations in the value of other assets and liabilities resulting from changes in exchange rates are recorded as unrealized foreign currency gains (losses) until the assets or liabilities are settled in cash, at which time they are recorded as realized foreign currency gains (losses).
3. Forward Currency Contracts: The fund enters into forward currency contracts to protect the value of securities and related receivables and payables against changes in future foreign exchange rates. The fund’s risks in using these contracts include movement in the values of the foreign currencies relative to the U.S. dollar and the ability of the counterparties to fulfill their obligations under the contracts. The fund attempts to mitigate this risk by, among other things, performing a credit analysis of counterparties, monitoring exposure to counterparties, and requiring counterparties to post collateral to secure such exposure. The forward currency contracts contain provisions whereby a counterparty may terminate open contracts if the fund’s net assets decline below a certain level, triggering a payment by the fund if the fund is in a net liability position at the time of the termination. The payment amount would be reduced by any collateral the fund has posted. Any assets posted as collateral for open contracts are noted in the Statement of Net Assets.
22
Health Care Fund
Forward currency contracts are valued at their quoted daily prices obtained from an independent third party, adjusted for currency risk based on the expiration date of each contract. The aggregate principal amounts of the contracts are not recorded in the Statement of Net Assets. Fluctuations in the value of the contracts are recorded in the Statement of Net Assets as an asset (liability) and in the Statement of Operations as unrealized appreciation (depreciation) until the contracts are closed, when they are recorded as realized forward currency contract gains (losses).
During the year ended January 31, 2013, the fund’s average investment in forward currency contracts represented 1% of net assets, based on quarterly average notional amounts.
4. Repurchase Agreements: The fund may enter into repurchase agreements. Securities pledged as collateral for repurchase agreements are held by a custodian bank until the agreements mature. Each agreement requires that the market value of the collateral be sufficient to cover payments of interest and principal. In the event of default or bankruptcy by the other party to the agreement, the fund may sell or retain the collateral; however, such action may be subject to legal proceedings.
5. Federal Income Taxes: The fund intends to continue to qualify as a regulated investment company and distribute all of its taxable income. Management has analyzed the fund’s tax positions taken for all open federal income tax years (January 31, 2010–2013), and has concluded that no provision for federal income tax is required in the fund’s financial statements.
6. Distributions: Distributions to shareholders are recorded on the ex-dividend date.
7. Security Lending: The fund may lend its securities to qualified institutional borrowers to earn additional income. Security loans are required to be secured at all times by collateral at least equal to the market value of securities loaned. The fund invests cash collateral received in Vanguard Market Liquidity Fund, and records a liability for the return of the collateral, during the period the securities are on loan. Security lending income represents fees charged to borrowers plus income earned on investing cash collateral, less expenses associated with the loan.
8. Other: Dividend income is recorded on the ex-dividend date. Interest income is accrued daily.
Premiums and discounts on debt securities purchased are amortized and accreted, respectively, to interest income over the lives of the respective securities. Security transactions are accounted for on the date securities are bought or sold. Costs used to determine realized gains (losses) on the sale of investment securities are those of the specific securities sold. Fees assessed on redemptions of capital shares prior to May 23, 2012, were credited to paid-in capital.
Each class of shares has equal rights as to assets and earnings, except that each class separately bears certain class-specific expenses related to maintenance of shareholder accounts (included in Management and Administrative expenses) and shareholder reporting. Marketing and distribution expenses are allocated to each class of shares based on a method approved by the board of trustees. Income, other non-class-specific expenses, and gains and losses on investments are allocated to each class of shares based on its relative net assets.
B. Wellington Management Company, LLP, provides investment advisory services to the fund for a fee calculated at an annual percentage rate of average net assets. For the year ended January 31, 2013, the investment advisory fee represented an effective annual rate of 0.15% of the fund’s average net assets.
C. The Vanguard Group furnishes at cost corporate management, administrative, marketing, and distribution services. The costs of such services are allocated to the fund under methods approved by the board of trustees. The fund has committed to provide up to 0.40% of its net assets in capital
23
Health Care Fund
contributions to Vanguard. At January 31, 2013, the fund had contributed capital of $3,125,000 to Vanguard (included in Other Assets), representing 0.01% of the fund’s net assets and 1.25% of Vanguard’s capitalization. The fund’s trustees and officers are also directors and officers of Vanguard.
D. Various inputs may be used to determine the value of the fund’s investments. These inputs are summarized in three broad levels for financial statement purposes. The inputs or methodologies used to value securities are not necessarily an indication of the risk associated with investing in those securities.
Level 1—Quoted prices in active markets for identical securities.
Level 2—Other significant observable inputs (including quoted prices for similar securities, interest rates, prepayment speeds, credit risk, etc.).
Level 3—Significant unobservable inputs (including the fund’s own assumptions used to determine the fair value of investments).
The following table summarizes the market value of the fund’s investments as of January 31, 2013, based on the inputs used to value them:
| | | |
| | Level 1 | Level 2 | Level 3 |
| Investments | ($000) | ($000) | ($000) |
| Common Stocks—U. S. | 17,550,079 | — | — |
| Common Stocks—International | 748,966 | 4,832,330 | — |
| Temporary Cash Investments | 1,815 | 1,922,464 | — |
| Forward Currency Contracts—Assets | — | 30,017 | — |
| Total | 18,300,860 | 6,784,811 | — |
At January 31, 2013, the fund had open forward currency contracts to receive and deliver currencies as follows. Unrealized appreciation (depreciation) on open forward currency contracts is treated as realized gain (loss) for tax purposes.
| | | | | | |
| | | | | | | Unrealized |
| | Contract | | | | | Appreciation |
| | Settlement | | | | Contract Amount (000) | (Depreciation) |
| Counterparty | Date | | Receive | | Deliver | ($000) |
| Bank of America NA | 2/15/13 | USD | 238,706 | JPY | 19,062,436 | 30,017 |
| JPY—Japanese yen. | | | | | | |
| USD—U.S. dollar. | | | | | | |
At January 31, 2013, the counterparty had deposited in a segregated account securities with a value of $29,113,000 in connection with amounts due to the fund for open forward currency contracts.
E. Distributions are determined on a tax basis and may differ from net investment income and realized capital gains for financial reporting purposes. Differences may be permanent or temporary. Permanent differences are reclassified among capital accounts in the financial statements to reflect their tax character. Temporary differences arise when certain items of income, expense, gain, or loss are recognized in different periods for financial statement and tax purposes; these differences will reverse at some time in the future. Differences in classification may also result from the treatment of short-term gains as ordinary income for tax purposes.
24
Health Care Fund
During the year ended January 31, 2013, the fund realized net foreign currency losses of $820,000, which decreased distributable net income for tax purposes; accordingly, such losses have been reclassified from accumulated net realized gains to overdistributed net investment income. Certain of the fund’s investments are in securities considered to be “passive foreign investment companies,” for which any unrealized appreciation and/or realized gains are required to be included in distributable net investment income for tax purposes. Passive foreign investment companies held at January 31, 2013, had unrealized appreciation of $19,835,000, all of which has been distributed and is reflected in the balance of overdistributed net investment income.
The fund used a tax accounting practice to treat a portion of the price of capital shares redeemed during the year as distributions from net investment income and realized capital gains. Accordingly, the fund has reclassified $11,949,000 from overdistributed net investment income, and $26,507,000 from accumulated net realized gains, to paid-in capital.
For tax purposes, at January 31, 2013, the fund had $39,853,000 of ordinary income and $591,081,000 of long-term capital gains available for distribution.
At January 31, 2013, the cost of investment securities for tax purposes was $15,105,733,000. Net unrealized appreciation of investment securities for tax purposes was $9,949,921,000, consisting of unrealized gains of $10,113,906,000 on securities that had risen in value since their purchase and $163,985,000 in unrealized losses on securities that had fallen in value since their purchase.
F. During the year ended January 31, 2013, the fund purchased $1,709,797,000 of investment securities and sold $2,178,371,000 of investment securities, other than temporary cash investments.
G. Capital share transactions for each class of shares were:
| | | | |
| | | | Year Ended January 31, |
| | | 2013 | | 2012 |
| | Amount | Shares | Amount | Shares |
| | ($000) | (000) | ($000) | (000) |
| Investor Shares | | | | |
| Issued | 795,411 | 5,590 | 721,109 | 5,453 |
| Issued in Lieu of Cash Distributions | 261,109 | 1,808 | 436,880 | 3,494 |
| Redeemed1 | (2,090,920) | (14,631) | (1,675,555) | (12,775) |
| Net Increase (Decrease)—Investor Shares | (1,034,400) | (7,233) | (517,566) | (3,828) |
| Admiral Shares | | | | |
| Issued | 1,750,549 | 28,857 | 1,204,865 | 21,697 |
| Issued in Lieu of Cash Distributions | 467,163 | 7,666 | 640,586 | 12,144 |
| Redeemed1 | (1,254,076) | (20,860) | (1,072,476) | (19,374) |
| Net Increase (Decrease)—Admiral Shares | 963,636 | 15,663 | 772,975 | 14,467 |
1 Net of redemption fees for fiscal 2013 and 2012 of $378,000 and $1,116,000, respectively (fund totals). Effective May 23, 2012, redemption fees were eliminated.
25
Health Care Fund
H. Certain of the fund’s investments are in companies that are considered to be affiliated companies of the fund because the fund owns more than 5% of the outstanding voting securities of the company. Transactions during the period in securities of these companies were as follows:
| | | | | |
| | | | Current Period Transactions | |
| | | | Proceeds | | |
| Jan. 31, 2012 | | from | | Jan. 31, 2013 |
| | Market | Purchases | Securities | Dividend | Market |
| | Value | at Cost | Sold | Income | Value |
| | ($000) | ($000) | ($000) | ($000) | ($000) |
| Coventry Health Care Inc. | 256,422 | 3,041 | 200,412 | 3,739 | NA1 |
| Forest Laboratories Inc. | 823,198 | 16,677 | — | — | 956,887 |
| Health Management Associates Inc. | 99,720 | 665 | — | — | 163,458 |
| Class A | | | | | |
| Health Net Inc. | 174,112 | 4,460 | 37,048 | — | NA1 |
| | 1,353,452 | | | 3,739 | 1,120,345 |
1 Not applicable—At January 31, 2013, the security was still held, but the issuer was no longer an affiliated company of the fund.
I. In preparing the financial statements as of January 31, 2013, management considered the impact of subsequent events for potential recognition or disclosure in these financial statements.
26
Report of Independent Registered
Public Accounting Firm
To the Trustees of Vanguard Specialized Funds and the Shareholders of Vanguard Health Care Fund: In our opinion, the accompanying statement of net assets and the related statements of operations and of changes in net assets and the financial highlights present fairly, in all material respects, the financial position of Vanguard Health Care Fund (constituting a separate portfolio of Vanguard Specialized Funds, hereafter referred to as the “Fund”) at January 31, 2013, the results of its operations for the year then ended, the changes in its net assets for each of the two years in the period then ended and the financial highlights for each of the five years in the period then ended, in conformity with accounting principles generally accepted in the United States of America. These financial statements and financial highlights (hereafter referred to as “financial statements”) are the responsibility of the Fund’s management; our responsibility is to express an opinion on these financial statements based on our audits. We conducted our audits of these financial statements in accordance with the standards of the Public Company Accounting Oversight Board (United States). Those standards require that we plan and perform the audit to obtain reasonable assurance about whether the financial statements are free of material misstatement. An audit includes examining, on a test basis, evidence supporting the amounts and disclosures in the financial statements, assessing the accounting principles used and significant estimates made by management, and evaluating the overall financial statement presentation. We believe that our audits, which included confirmation of securities at January 31, 2013 by correspondence with the custodians and brokers and by agreement to the underlying ownership records of the transfer agent, provide a reasonable basis for our opinion.
PricewaterhouseCoopers LLP
Philadelphia, Pennsylvania
March 13, 2013
| |
| Special 2012 tax information (unaudited) for Vanguard Health Care Fund |
This information for the fiscal year ended January 31, 2013, is included pursuant to provisions of the Internal Revenue Code.
The fund distributed $342,484,000 as capital gain dividends (from net long-term capital gains) to shareholders during the fiscal year.
The fund distributed $470,198,000 of qualified dividend income to shareholders during the fiscal year.
For corporate shareholders, 65.6% of investment income (dividend income plus short-term gains, if any) qualifies for the dividends-received deduction.
27
Your Fund’s After-Tax Returns
This table presents returns for your fund both before and after taxes. The after-tax returns are shown in two ways: (1) assuming that an investor owned the fund during the entire period and paid taxes on the fund’s distributions, and (2) assuming that an investor paid taxes on the fund’s distributions and sold all shares at the end of each period.
Calculations are based on the highest individual federal income tax and capital gains tax rates in effect at the times of the distributions and the hypothetical sales. State and local taxes were not considered. After-tax returns reflect any qualified dividend income using actual prior-year figures and estimates for 2013. (In the example, returns after the sale of fund shares may be higher than those assuming no sale. This occurs when the sale would have produced a capital loss. The calculation assumes that the investor received a tax deduction for the loss.)
The table shows returns for Investor Shares only; returns for other share classes will differ. Please note that your actual after-tax returns will depend on your tax situation and may differ from those shown. Also note that if you own the fund in a tax-deferred account, such as an individual retirement account or a 401(k) plan, this information does not apply to you. Such accounts are not subject to current taxes.
Finally, keep in mind that a fund’s performance—whether before or after taxes—does not guarantee future results.
Average Annual Total Returns: Health Care Fund Investor Shares
Periods Ended January 31, 2013
| | | |
| | One | Five | Ten |
| | Year | Years | Years |
| Returns Before Taxes | 19.59% | 8.19% | 10.45% |
| Returns After Taxes on Distributions | 19.00 | 7.34 | 9.57 |
| Returns After Taxes on Distributions and Sale of Fund Shares | 12.14 | 6.59 | 8.73 |
28
About Your Fund’s Expenses
As a shareholder of the fund, you incur ongoing costs, which include costs for portfolio management, administrative services, and shareholder reports (like this one), among others. Operating expenses, which are deducted from a fund’s gross income, directly reduce the investment return of the fund.
A fund’s expenses are expressed as a percentage of its average net assets. This figure is known as the expense ratio. The following examples are intended to help you understand the ongoing costs (in dollars) of investing in your fund and to compare these costs with those of other mutual funds. The examples are based on an investment of $1,000 made at the beginning of the period shown and held for the entire period.
The accompanying table illustrates your fund’s costs in two ways:
• Based on actual fund return. This section helps you to estimate the actual expenses that you paid over the period. The ”Ending Account Value“ shown is derived from the fund‘s actual return, and the third column shows the dollar amount that would have been paid by an investor who started with $1,000 in the fund. You may use the information here, together with the amount you invested, to estimate the expenses that you paid over the period.
To do so, simply divide your account value by $1,000 (for example, an $8,600 account value divided by $1,000 = 8.6), then multiply the result by the number given for your fund under the heading ”Expenses Paid During Period.“
• Based on hypothetical 5% yearly return. This section is intended to help you compare your fund‘s costs with those of other mutual funds. It assumes that the fund had a yearly return of 5% before expenses, but that the expense ratio is unchanged. In this case—because the return used is not the fund’s actual return—the results do not apply to your investment. The example is useful in making comparisons because the Securities and Exchange Commission requires all mutual funds to calculate expenses based on a 5% return. You can assess your fund’s costs by comparing this hypothetical example with the hypothetical examples that appear in shareholder reports of other funds.
Note that the expenses shown in the table are meant to highlight and help you compare ongoing costs only and do not reflect transaction costs incurred by the fund for buying and selling securities. Further, the expenses do not include any purchase, redemption, or account service fees described in the fund prospectus. If such fees were applied to your account, your costs would be higher. Your fund does not carry a “sales load.”
The calculations assume no shares were bought or sold during the period. Your actual costs may have been higher or lower, depending on the amount of your investment and the timing of any purchases or redemptions.
You can find more information about the fund’s expenses, including annual expense ratios, in the Financial Statements section of this report. For additional information on operating expenses and other shareholder costs, please refer to your fund’s current prospectus.
29
| | | |
| Six Months Ended January 31, 2013 | | | |
| | Beginning | Ending | Expenses |
| | Account Value | Account Value | Paid During |
| Health Care Fund | 7/31/2012 | 1/31/2013 | Period |
| Based on Actual Fund Return | | | |
| Investor Shares | $1,000.00 | $1,125.02 | $1.87 |
| Admiral Shares | 1,000.00 | 1,125.33 | 1.61 |
| Based on Hypothetical 5% Yearly Return | | | |
| Investor Shares | $1,000.00 | $1,023.44 | $1.79 |
| Admiral Shares | 1,000.00 | 1,023.69 | 1.53 |
The calculations are based on expenses incurred in the most recent six-month period. The fund’s annualized six-month expense ratios for that period are 0.35% for Investor Shares and 0.30% for Admiral Shares. The dollar amounts shown as “Expenses Paid” are equal to the annualized expense ratio multiplied by the average account value over the period, multiplied by the number of days in the most recent six-month period, then divided by the number of days in the most recent 12-month period.
30
Glossary
30-Day SEC Yield. A fund’s 30-day SEC yield is derived using a formula specified by the U.S. Securities and Exchange Commission. Under the formula, data related to the fund’s security holdings in the previous 30 days are used to calculate the fund’s hypothetical net income for that period, which is then annualized and divided by the fund’s estimated average net assets over the calculation period. For the purposes of this calculation, a security’s income is based on its current market yield to maturity (for bonds), its actual income (for asset-backed securities), or its projected dividend yield (for stocks). Because the SEC yield represents hypothetical annualized income, it will differ—at times significantly—from the fund’s actual experience. As a result, the fund’s income distributions may be higher or lower than implied by the SEC yield.
Beta. A measure of the magnitude of a fund’s past share-price fluctuations in relation to the ups and downs of a given market index. The index is assigned a beta of 1.00. Compared with a given index, a fund with a beta of 1.20 typically would have seen its share price rise or fall by 12% when the index rose or fell by 10%. For this report, beta is based on returns over the past 36 months for both the fund and the index. Note that a fund’s beta should be reviewed in conjunction with its R-squared (see definition). The lower the R-squared, the less correlation there is between the fund and the index, and the less reliable beta is as an indicator of volatility.
Dividend Yield. Dividend income earned by stocks, expressed as a percentage of the aggregate market value (or of net asset value, for a fund). The yield is determined by dividing the amount of the annual dividends by the aggregate value (or net asset value) at the end of the period. For a fund, the dividend yield is based solely on stock holdings and does not include any income produced by other investments.
Earnings Growth Rate. The average annual rate of growth in earnings over the past five years for the stocks now in a fund.
Equity Exposure. A measure that reflects a fund’s investments in stocks and stock futures. Any holdings in short-term reserves are excluded.
Expense Ratio. A fund’s total annual operating expenses expressed as a percentage of the fund’s average net assets. The expense ratio includes management and administrative expenses, but does not include the transaction costs of buying and selling portfolio securities.
Foreign Holdings. The percentage of a fund represented by securities or depositary receipts of companies based outside the United States.
Inception Date. The date on which the assets of a fund (or one of its share classes) are first invested in accordance with the fund’s investment objective. For funds with a subscription period, the inception date is the day after that period ends. Investment performance is measured from the inception date.
Median Market Cap. An indicator of the size of companies in which a fund invests; the midpoint of market capitalization (market price x shares outstanding) of a fund’s stocks, weighted by the proportion of the fund’s assets invested in each stock. Stocks representing half of the fund’s assets have market capitalizations above the median, and the rest are below it.
Price/Book Ratio. The share price of a stock divided by its net worth, or book value, per share. For a fund, the weighted average price/book ratio of the stocks it holds.
31
Price/Earnings Ratio. The ratio of a stock’s current price to its per-share earnings over the past year. For a fund, the weighted average P/E of the stocks it holds. P/E is an indicator of market expectations about corporate prospects; the higher the P/E, the greater the expectations for a company’s future growth.
R-Squared. A measure of how much of a fund’s past returns can be explained by the returns from the market in general, as measured by a given index. If a fund’s total returns were precisely synchronized with an index’s returns, its R-squared would be 1.00. If the fund’s returns bore no relationship to the index’s returns, its R-squared would be 0. For this report, R-squared is based on returns over the past 36 months for both the fund and the index.
Return on Equity. The annual average rate of return generated by a company during the past five years for each dollar of shareholder’s equity (net income divided by shareholder’s equity). For a fund, the weighted average return on equity for the companies whose stocks it holds.
Short-Term Reserves. The percentage of a fund invested in highly liquid, short-term securities that can be readily converted to cash.
Turnover Rate. An indication of the fund’s trading activity. Funds with high turnover rates incur higher transaction costs and may be more likely to distribute capital gains (which may be taxable to investors). The turnover rate excludes in-kind transactions, which have minimal impact on costs.
Benchmark Information
Spliced Health Care Index: S&P 500 Index through December 31, 2001; S&P Health Care Index through May 31, 2010; MSCI All Country World Health Care Index thereafter.
32
This page intentionally left blank.
This page intentionally left blank.
This page intentionally left blank.
The People Who Govern Your Fund
The trustees of your mutual fund are there to see that the fund is operated and managed in your best interests since, as a shareholder, you are a part owner of the fund. Your fund’s trustees also serve on the board of directors of The Vanguard Group, Inc., which is owned by the Vanguard funds and provides services to them on an at-cost basis.
A majority of Vanguard’s board members are independent, meaning that they have no affiliation with Vanguard or the funds they oversee, apart from the sizable personal investments they have made as private individuals. The independent board members have distinguished backgrounds in business, academia, and public service. Each of the trustees and executive officers oversees 180 Vanguard funds.
The following table provides information for each trustee and executive officer of the fund. More information about the trustees is in the Statement of Additional Information, which can be obtained, without charge, by contacting Vanguard at 800-662-7447, or online at vanguard.com.
| |
| InterestedTrustee1 | and Delphi Automotive LLP (automotive components); |
| | Senior Advisor at New Mountain Capital; Trustee of |
| F. William McNabb III | The Conference Board. |
| Born 1957. Trustee Since July 2009. Chairman of the | |
| Board. Principal Occupation(s) During the Past Five | Amy Gutmann |
| Years: Chairman of the Board of The Vanguard Group, | Born 1949. Trustee Since June 2006. Principal |
| Inc., and of each of the investment companies served | Occupation(s) During the Past Five Years: President |
| by The Vanguard Group, since January 2010; Director | of the University of Pennsylvania; Christopher H. |
| of The Vanguard Group since 2008; Chief Executive | Browne Distinguished Professor of Political Science |
| Officer and President of The Vanguard Group and of | in the School of Arts and Sciences with secondary |
| each of the investment companies served by The | appointments at the Annenberg School for |
| Vanguard Group since 2008; Director of Vanguard | Communication and the Graduate School of Education |
| Marketing Corporation; Managing Director of The | of the University of Pennsylvania; Member of the |
| Vanguard Group (1995–2008). | National Commission on the Humanities and Social |
| | Sciences; Trustee of Carnegie Corporation of New |
| | York and of the National Constitution Center; Chair |
| IndependentTrustees | of the U.S. Presidential Commission for the Study |
| of Bioethical Issues. |
| Emerson U. Fullwood | |
| Born 1948. Trustee Since January 2008. Principal | JoAnn Heffernan Heisen |
| Occupation(s) During the Past Five Years: Executive | Born 1950. Trustee Since July 1998. Principal |
| Chief Staff and Marketing Officer for North America | Occupation(s) During the Past Five Years: Corporate |
| and Corporate Vice President (retired 2008) of Xerox | Vice President and Chief Global Diversity Officer |
| Corporation (document management products and | (retired 2008) and Member of the Executive |
| services); Executive in Residence and 2010 | Committee (1997–2008) of Johnson & Johnson |
| Distinguished Minett Professor at the Rochester | (pharmaceuticals/medical devices/consumer |
| Institute of Technology; Director of SPX Corporation | products); Director of Skytop Lodge Corporation |
| (multi-industry manufacturing), the United Way of | (hotels), the University Medical Center at Princeton, |
| Rochester, Amerigroup Corporation (managed health | the Robert Wood Johnson Foundation, and the Center |
| care), the University of Rochester Medical Center, | for Talent Innovation; Member of the Advisory Board |
| Monroe Community College Foundation, and North | of the Maxwell School of Citizenship and Public Affairs |
| Carolina A&T University. | at Syracuse University. |
| |
| Rajiv L. Gupta | F. Joseph Loughrey |
| Born 1945. Trustee Since December 2001. 2 | Born 1949. Trustee Since October 2009. Principal |
| Principal Occupation(s) During the Past Five Years: | Occupation(s) During the Past Five Years: President |
| Chairman and Chief Executive Officer (retired 2009) | and Chief Operating Officer (retired 2009) of Cummins |
| and President (2006–2008) of Rohm and Haas Co. | Inc. (industrial machinery); Director of SKF AB |
| (chemicals); Director of Tyco International, Ltd. | (industrial machinery), Hillenbrand, Inc. (specialized |
| (diversified manufacturing and services), Hewlett- | consumer services), the Lumina Foundation for |
| Packard Co. (electronic computer manufacturing), | |
| | |
| Education, and Oxfam America; Chairman of the | Executive Officers | |
| Advisory Council for the College of Arts and Letters | | |
| and Member of the Advisory Board to the Kellogg | Glenn Booraem | |
| Institute for International Studies at the University | Born 1967. Controller Since July 2010. Principal |
| of Notre Dame. | Occupation(s) During the Past Five Years: Principal |
| | of The Vanguard Group, Inc.; Controller of each of |
| Mark Loughridge | the investment companies served by The Vanguard |
| Born 1953. Trustee Since March 2012. Principal | Group; Assistant Controller of each of the investment |
| Occupation(s) During the Past Five Years: Senior Vice | companies served by The Vanguard Group (2001–2010). |
| President and Chief Financial Officer at IBM (information | | |
| technology services); Fiduciary Member of IBM’s | Thomas J. Higgins | |
| Retirement Plan Committee. | Born 1957. Chief Financial Officer Since September |
| | 2008. Principal Occupation(s) During the Past Five |
| Scott C. Malpass | Years: Principal of The Vanguard Group, Inc.; Chief |
| Born 1962. Trustee Since March 2012. Principal | Financial Officer of each of the investment companies |
| Occupation(s) During the Past Five Years: Chief | served by The Vanguard Group; Treasurer of each of |
| Investment Officer and Vice President at the University | the investment companies served by The Vanguard |
| of Notre Dame; Assistant Professor of Finance at the | Group (1998–2008). | |
| Mendoza College of Business at Notre Dame; Member | | |
| of the Notre Dame 403(b) Investment Committee; | Kathryn J. Hyatt | |
| Director of TIFF Advisory Services, Inc. (investment | Born 1955. Treasurer Since November 2008. Principal |
| advisor); Member of the Investment Advisory | Occupation(s) During the Past Five Years: Principal of |
| Committees of the Financial Industry Regulatory | The Vanguard Group, Inc.; Treasurer of each of the |
| Authority (FINRA) and of Major League Baseball. | investment companies served by The Vanguard |
| | Group; Assistant Treasurer of each of the investment |
| André F. Perold | companies served by The Vanguard Group (1988–2008). |
| Born 1952. Trustee Since December 2004. Principal | | |
| Occupation(s) During the Past Five Years: George | Heidi Stam | |
| Gund Professor of Finance and Banking at the Harvard | Born 1956. Secretary Since July 2005. Principal |
| Business School (retired 2011); Chief Investment | Occupation(s) During the Past Five Years: Managing |
| Officer and Managing Partner of HighVista Strategies | Director of The Vanguard Group, Inc.; General Counsel |
| LLC (private investment firm); Director of Rand | of The Vanguard Group; Secretary of The Vanguard |
| Merchant Bank; Overseer of the Museum of Fine | Group and of each of the investment companies |
| Arts Boston. | served by The Vanguard Group; Director and Senior |
| | Vice President of Vanguard Marketing Corporation. |
| Alfred M. Rankin, Jr. | | |
| Born 1941. Trustee Since January 1993. Principal | Vanguard Senior ManagementTeam | |
| Occupation(s) During the Past Five Years: Chairman, | | |
| President, and Chief Executive Officer of NACCO | Mortimer J. Buckley | Chris D. McIsaac |
| Industries, Inc. (housewares/lignite) and of Hyster-Yale | Kathleen C. Gubanich | Michael S. Miller |
| Materials Handling, Inc. (forklift trucks); Director of | Paul A. Heller | James M. Norris |
| the National Association of Manufacturers; Chairman | Martha G. King | Glenn W. Reed |
| of the Board of University Hospitals of Cleveland; | | |
| Advisory Chairman of the Board of The Cleveland | Chairman Emeritus and Senior Advisor | |
| Museum of Art. | | |
| | John J. Brennan | |
| Peter F. Volanakis | Chairman, 1996–2009 | |
| Born 1955. Trustee Since July 2009. Principal | Chief Executive Officer and President, 1996–2008 | |
| Occupation(s) During the Past Five Years: President | | |
| and Chief Operating Officer (retired 2010) of Corning | Founder | |
| Incorporated (communications equipment); Director | | |
| of SPX Corporation (multi-industry manufacturing); | John C. Bogle | |
| Overseer of the Amos Tuck School of Business | Chairman and Chief Executive Officer, 1974–1996 | |
| Administration at Dartmouth College; Advisor to the | | |
| Norris Cotton Cancer Center. | | |
1 Mr. McNabb is considered an “interested person,” as defined in the Investment Company Act of 1940, because he is an officer of the Vanguard funds.
2 December 2002 for Vanguard Equity Income Fund, Vanguard Growth Equity Fund, the Vanguard Municipal Bond Funds, and the Vanguard State Tax-Exempt Funds.
|  |
| P.O. Box 2600 |
| Valley Forge, PA 19482-2600 |
Connect with Vanguard® > vanguard.com
| |
| Fund Information > 800-662-7447 | CFA® is a trademark owned by CFA Institute. |
| Direct Investor Account Services > 800-662-2739 | |
| Institutional Investor Services > 800-523-1036 | |
| Text Telephone for People | |
| With Hearing Impairment > 800-749-7273 | |
| |
| This material may be used in conjunction | |
| with the offering of shares of any Vanguard | |
| fund only if preceded or accompanied by | |
| the fund’s current prospectus. | |
| |
| All comparative mutual fund data are from Lipper Inc. or | |
| Morningstar, Inc., unless otherwise noted. | |
| |
| You can obtain a free copy of Vanguard’s proxy voting | |
| guidelines by visiting vanguard.com/proxyreporting or by | |
| calling Vanguard at 800-662-2739. The guidelines are | |
| also available from the SEC’s website, sec.gov. In | |
| addition, you may obtain a free report on how your fund | |
| voted the proxies for securities it owned during the 12 | |
| months ended June 30. To get the report, visit either | |
| vanguard.com/proxyreporting or sec.gov. | |
| |
| You can review and copy information about your fund at | |
| the SEC’s Public Reference Room in Washington, D.C. To | |
| find out more about this public service, call the SEC at | |
| 202-551-8090. Information about your fund is also | |
| available on the SEC’s website, and you can receive | |
| copies of this information, for a fee, by sending a | |
| request in either of two ways: via e-mail addressed to | |
| publicinfo@sec.gov or via regular mail addressed to the | |
| Public Reference Section, Securities and Exchange | |
| Commission, Washington, DC 20549-1520. | |
| |
| |
| | © 2013 The Vanguard Group, Inc. |
| | All rights reserved. |
| | Vanguard Marketing Corporation, Distributor. |
| |
| | Q520 032013 |
|  |
| Annual Report | January 31, 2013 |
| Vanguard REIT Index Fund |
|
 |
> Vanguard REIT Index Fund returned more than 14% for the fiscal year ended January 31, 2013.
> The fund closely tracked its benchmark index, finishing ahead of the average return for real estate funds.
> All segments of the REIT market delivered positive results; retail REITs contributed the most to the fund’s return.
| |
| Contents | |
| Your Fund’s Total Returns. | 1 |
| Chairman’s Letter. | 2 |
| Fund Profile. | 8 |
| Performance Summary. | 9 |
| Financial Statements. | 12 |
| Your Fund’s After-Tax Returns. | 33 |
| About Your Fund’s Expenses. | 34 |
| Glossary. | 36 |

REIT Index Fund
Please note: The opinions expressed in this report are just that—informed opinions. They should not be considered promises or advice.
Also, please keep in mind that the information and opinions cover the period through the date on the front of this report. Of course, the risks of investing in your fund are spelled out in the prospectus.
See the Glossary for definitions of investment terms used in this report.
About the cover: Our cover photograph shows rigging on the HMSSurprise, a replica of an 18th-century Royal Navy frigate. It was featured in the 2003 movie Master and Commander: The Far Side of the World, which was based on Patrick O’Brian’s sea novels, set amid the Napoleonic Wars. Vanguard was named for another ship of that era, the HMSVanguard, which was the flagship of British Admiral Horatio Nelson at the Battle of the Nile.
| |
| Your Fund’s Total Returns | |
| |
| |
| |
| |
| Fiscal Year Ended January 31, 2013 | |
| |
| | Total |
| | Returns |
| Vanguard REIT Index Fund | |
| Investor Shares | 14.45% |
| Admiral™ Shares | 14.63 |
| Signal® Shares | 14.65 |
| Institutional Shares | 14.66 |
| ETF Shares | |
| Market Price | 14.69 |
| Net Asset Value | 14.64 |
| MSCI US REIT Index | 14.72 |
| Real Estate Funds Average | 14.29 |
| Real Estate Funds Average: Derived from data provided by Lipper Inc. | |
Admiral Shares carry lower expenses and are available to investors who meet certain account-balance requirements. Signal Shares and Institutional Shares are available to certain institutional investors who meet specific administrative, service, and account-size criteria. The Vanguard ETF® Shares shown are traded on the NYSE Arca exchange and are available only through brokers. The table provides ETF returns based on both the NYSE Arca market price and the net asset value for a share. U.S. Pat. No. 6,879,964 B2; 7,337,138; 7,720,749; 7,925,573; 8,090,646.
For the ETF Shares, the market price is determined by the midpoint of the bid-offer spread as of the closing time of the New York Stock Exchange (generally 4 p.m., Eastern time). The net asset value is also determined as of the NYSE closing time. For more information about how the ETF Shares' market prices have compared with their net asset value, visit vanguard.com, select your ETF, and then select the Price and Performance tab. The ETF premium/discount analysis there shows the percentages of days on which the ETF Shares' market price was above or below the NAV.
Your Fund’s Performance at a Glance
January 31, 2012, Through January 31, 2013
| | | | | |
| | | | Distributions Per Share | |
| | Starting | Ending | | | |
| | Share | Share | Income | Capital | Return of |
| | Price | Price | Dividends | Gains | Capital |
| Vanguard REIT Index Fund | | | | | |
| Investor Shares | $20.50 | $22.66 | $0.514 | $0.000 | $0.233 |
| Admiral Shares | 87.47 | 96.70 | 2.283 | 0.000 | 1.035 |
| Signal Shares | 23.35 | 25.82 | 0.608 | 0.000 | 0.276 |
| Institutional Shares | 13.54 | 14.97 | 0.355 | 0.000 | 0.161 |
| ETF Shares | 61.72 | 68.24 | 1.612 | 0.000 | 0.731 |
1

Chairman’s Letter
Dear Shareholder,
Over the past year, real estate investment trusts benefited from a strengthening U.S. economy and real estate market. Vanguard REIT Index Fund returned more than 14% for the 12 months ended January 31, 2013, in line with its benchmark and a bit ahead of the average return of its peers.
All segments of the fund delivered positive returns. Retail, specialized, and industrial REITs contributed most, while residential REITs’ results were more modest. Despite its solid performance, the fund slightly trailed the broad U.S. stock market for the first time since the 2009 fiscal year.
Led by European shares, stocks saw double-digit returns
Global stock markets rose sharply in the 12 months ended January 31, with European equities delivering the most robust results. Investors seemed buoyed by progress in addressing fiscal challenges in Europe and elsewhere.
European stocks gained about 20% even as many countries in the region continued to struggle with economic woes. This disparity isn’t as unusual as it may appear. Vanguard research has found that the relationship between a country’s economic growth and its stock market returns has typically been weak over time.
2
In the United States, attention to federal budget challenges intensified as 2012 drew to a close. The focus on the “fiscal cliff” led to investor anxiety before policymakers reached a limited tax rate agreement on the cusp of the new year. Although a credible long-term deficit-reduction strategy has yet to be crafted, investors propelled U.S. stocks to a 12-month gain of nearly 17%.
Bonds’ advance slowed; challenges may lie ahead
The broad U.S. taxable bond market returned a little more than 2.5% for the fiscal year. That modest result contrasts with the strong returns to which bond investors may have grown accustomed.
Bonds have been in a long-running bull market, as prices climbed and yields tumbled over many years. (Bond prices and yields move in opposite directions.) Indeed, the yield of the 10-year U.S. Treasury note slipped to a record low in July, closing below 1.5%. Recently, however, that trend reversed, and the 10-year yield broke 2% in late January.
Bonds can provide critical diversification benefits to a portfolio, but their return prospects look much less promising than in recent years. As yields have dropped, the opportunity for price appreciation has greatly diminished. (You can read more about our expectations for bond and
| | | |
| Market Barometer | | | |
| |
| | | Average Annual Total Returns |
| | | Periods Ended January 31, 2013 |
| | One | Three | Five |
| | Year | Years | Years |
| Stocks | | | |
| Russell 1000 Index (Large-caps) | 17.03% | 14.48% | 4.28% |
| Russell 2000 Index (Small-caps) | 15.47 | 15.98 | 6.31 |
| Russell 3000 Index (Broad U.S. market) | 16.90 | 14.60 | 4.44 |
| MSCI All Country World Index ex USA (International) | 13.86 | 7.03 | -0.10 |
| |
| Bonds | | | |
| Barclays U.S. Aggregate Bond Index (Broad taxable market) | 2.59% | 5.41% | 5.45% |
| Barclays Municipal Bond Index (Broad tax-exempt market) | 4.80 | 6.53 | 5.73 |
| Citigroup Three-Month U.S. Treasury Bill Index | 0.08 | 0.09 | 0.38 |
| |
| CPI | | | |
| Consumer Price Index | 1.59% | 2.05% | 1.76% |
3
stock returns in Vanguard’s Economic and Investment Outlook, available at vanguard.com/research.)
As for money market funds and savings accounts, their returns barely budged as the Federal Reserve held short-term interest rates between 0% and 0.25%, a policy in place since late 2008.
Rebound in commercial real estate bolstered demand for retail REITs
The REIT Index Fund turned in a solid performance for the fiscal year as improvements in economic fundamentals allowed property owners to raise rents and increase revenue. Investors’ attraction to the relatively high yields of REITs also helped.
Retail REITs, the second-largest subsector, contributed the most to the fund’s return. A rise in consumer spending led high-end mall operators to raise rents as retailers registered increased sales and opened new stores.
Within the specialized REIT segment, health care REITs benefited most as an aging U.S. population continued to drive demand for senior housing and skilled nursing facilities. The self-storage industry also produced strong returns as the migration of financially distressed homeowners to apartments generated demand for storage space.
Expense Ratios
Your Fund Compared With Its Peer Group
| | | | | | |
| | | | | | | Peer |
| | Investor | Admiral | Signal | Institutional | ETF | Group |
| | Shares | Shares | Shares | Shares | Shares | Average |
| REIT Index Fund | 0.24% | 0.10% | 0.10% | 0.08% | 0.10% | 1.31% |
The fund expense ratios shown are from the prospectus dated May 29, 2012, and represent estimated costs for the current fiscal year. For the fiscal year ended January 31, 2013, the fund’s expense ratios were 0.24% for Investor Shares, 0.10% for Admiral Shares, 0.10% for Signal Shares, 0.08% for Institutional Shares, and 0.10% for ETF Shares. The peer-group expense ratio is derived from data provided by Lipper Inc. and captures information through year-end 2012.
Peer group: Real Estate Funds.
4
Industrial REITs, a small subsector of the market, posted returns of almost 30% as economic expansion fueled a need for additional warehouse space. Residential REITs, which have been among the leaders in the past few years, lagged with returns of about 3%—hurt, apparently, by concern that some renters will be reentering the housing market at the same time new apartment buildings become available.
Fund has impressive record of tracking its benchmark index
The REIT Index Fund has recorded an average annual return of 12.28% over the past decade. Although REITs were hit particularly hard during the subprime mortgage crisis and suffered large declines in 2007 and 2008, they recovered enough to outpace the broad U.S. market’s average annual return of about 9%.
The fund has closely tracked its benchmark index and outperformed its peers. Vanguard Equity Investment Group, the fund’s advisor, is to be commended for successfully meeting it’s goal of tracking its benchmark index. The group’s sophisticated portfolio construction, management techniques, and decades of index-tracking experience were complemented by the fund’s low expenses, which allow you to keep more of the return on your investment.
Total Returns
Ten Years Ended January 31, 2013
| |
| | Average |
| | Annual Return |
| REIT Index Fund Investor Shares | 12.28% |
| REIT Spliced Index | 12.34 |
| Real Estate Funds Average | 11.57 |
For a benchmark description, see the Glossary.
Real Estate Funds Average: Derived from data provided by Lipper Inc
The figures shown represent past performance, which is not a guarantee of future results. (Current performance may be lower or higher than the performance data cited. For performance data current to the most recent month-end, visit our website at vanguard.com/performance.) Note, too, that both investment returns and principal value can fluctuate widely, so an investor’s shares, when sold, could be worth more or less than their original cost.
5
|
| Investment insight |
| REITs aren’t bonds |
| Many investors are attracted to REITs because they are required to distribute at |
| least 90% of their taxable income as dividends. |
| |
| Recently, historically low bond yields have made REITs even more appealing. The |
| dividend yield1 for the REIT Index Fund was 3.6% as of January 31, 2013, compared |
| with the 1.9% yield to maturity for the Barclays U.S. Aggregate Bond Index. |
| |
| There’s now a perception among some yield-starved investors that REITs can |
| substitute for bonds. But REITs are highly volatile and risky stock investments. As |
| you can see from the chart below, REITs correlate more with the broader equity |
| market than they do with the bond market, particularly during stock market declines. |
| |
| Investors searching for income should consider their long-term goals, risk tolerance, |
| and asset allocation. Compared to bonds, REITs represent a more aggressive and |
| stock-heavy strategic allocation. |
| |
| 1 This yield may include some payments that represent a return of capital, capital gains distributions, or both by the underlying REITs. |
| These amounts are determined by each REIT at the end of its fiscal year. |
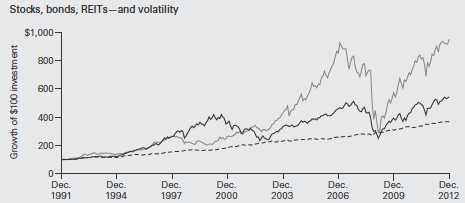
|
| Sources: Vanguard calculations based on data from Dow Jones, MSCI, FTSE, and Barclays. U.S. stock returns represented by |
| Dow Jones Wilshire 5000 from 1991 through April 2005 and MSCI U.S. Broad Market Index since May 2005; REITs returns |
| represented by FTSE NAREIT All Equity REITs Index; and bond returns represented by Barclays U.S. Aggregate Bond Index. |
6
Following four principles can help investors succeed
Our clients often ask what they should do to cope with uncertainties in the market. How should they react? Should they do something different with their money?
The first point to keep in mind is that investing has always involved uncertainties. When asked what he thought the stock market would do, financier J.P. Morgan had a standard response: “It will fluctuate.”
In our view, the most sensible approach is to focus on what’s within your control. In short, we believe investors can give themselves a greater chance for success by acting on four key points:
• Goals. What are you investing for? Each goal should be measurable and attainable. Getting there shouldn’t depend on outsize returns, or on impractical budgeting requirements.
• Balance. After identifying your goals, pursue them through a balanced asset allocation using broadly diversified funds.
• Cost. You won’t be surprised to hear that we place a big emphasis on controlling cost. The lower your costs, the greater the share of an investment’s return that you keep.
• Discipline. Everything else depends on this: In the face of market turmoil, discipline and long-term perspective can help you stay on track toward reaching your goals.
Successful investing doesn’t have to be complicated, but that’s not to say it’s easy. Investing can provoke strong emotions, and it’s hard to stay level-headed during times of volatility. If you’re getting pulled off course, try to redirect your attention to the principles I’ve outlined. These principles—which reflect the core philosophy Vanguard has held for decades—can be the answer to uncertainty.
As always, thank you for investing with Vanguard.
Sincerely,

F. William McNabb III
Chairman and Chief Executive Officer
February 15, 2013
7
|
| REIT Index Fund |
| |
| |
| Fund Profile |
| As of January 31, 2013 |
| | | | | |
| Share-Class Characteristics | | | | | |
| | Investor | Admiral | Signal | Institutional | ETF |
| | Shares | Shares | Shares | Shares | Shares |
| Ticker Symbol | VGSIX | VGSLX | VGRSX | VGSNX | VNQ |
| Expense Ratio1 | 0.24% | 0.10% | 0.10% | 0.08% | 0.10% |
| | | |
| Portfolio Characteristics | | |
| | | | DJ U.S. |
| | | | Total |
| | | | Market |
| | | MSCI US | FA |
| | Fund | REIT Index | Index |
| Number of Stocks | 117 | 116 | 3,595 |
| Median Market Cap | $8.5B | $8.5B | $37.6B |
| Price/Earnings Ratio | 61.9x | 61.5x | 17.2x |
| Price/Book Ratio | 2.3x | 2.3x | 2.2x |
| Return on Equity | 4.4% | 4.4% | 16.8% |
| Earnings Growth Rate | 8.0% | 7.8% | 9.1% |
| Dividend Yield | 3.6% | 3.6% | 2.0% |
| Foreign Holdings | 0.0% | 0.0% | 0.0% |
| Turnover Rate | 9% | — | — |
| Short-Term Reserves | 0.7% | — | — |
Dividend Yield: This yield may include some payments that represent a return of capital, capital gains distributions, or both by the underlying REITs. These amounts are determined by each REIT at the end of its fiscal year.
| | |
| Subindustry Diversification (% of equity exposure) |
| | | MSCI US |
| | Fund | REIT Index |
| Diversified REITs | 7.6% | 7.5% |
| Industrial REITs | 5.3 | 5.3 |
| Office REITs | 13.9 | 14.0 |
| Residential REITs | 17.1 | 17.0 |
| Retail REITs | 27.4 | 27.3 |
| Specialized REITs | 28.7 | 28.9 |
| | |
| Volatility Measures | | |
| | | DJ |
| | | U.S. |
| | | Total |
| | MSCI US | Market |
| | REIT Index | FA Index |
| R-Squared | 1.00 | 0.71 |
| Beta | 1.00 | 0.95 |
These measures show the degree and timing of the fund’s fluctuations compared with the indexes over 36 months.
| | |
| Ten Largest Holdings (% of total net assets) |
| Simon Property Group | | |
| Inc. | Retail REITs | 10.4% |
| Public Storage | Specialized REITs | 4.8 |
| HCP Inc. | Specialized REITs | 4.5 |
| Ventas Inc. | Specialized REITs | 4.2 |
| Prologis Inc. | Industrial REITs | 3.9 |
| Equity Residential | Residential REITs | 3.8 |
| Health Care REIT Inc. | Specialized REITs | 3.4 |
| Boston Properties Inc. | Office REITs | 3.4 |
| AvalonBay Communities | | |
| Inc. | Residential REITs | 3.1 |
| Vornado Realty Trust | Diversified REITs | 3.0 |
| Top Ten | | 44.5% |
The holdings listed exclude any temporary cash investments and equity index products.
1 The expense ratios shown are from the prospectus dated May 29, 2012, and represent estimated costs for the current fiscal year. For the fiscal year ended January 31, 2013, the expense ratios were 0.24% for Investor Shares, 0.10% for Admiral Shares, 0.10% for Signal Shares, 0.08% for Institutional Shares, and 0.10% for ETF Shares.
8
REIT Index Fund
Performance Summary
All of the returns in this report represent past performance, which is not a guarantee of future results that may be achieved by the fund. (Current performance may be lower or higher than the performance data cited. For performance data current to the most recent month-end, visit our website at vanguard.com/performance.) Note, too, that both investment returns and principal value can fluctuate widely, so an investor’s shares, when sold, could be worth more or less than their original cost. The returns shown do not reflect taxes that a shareholder would pay on fund distributions or on the sale of fund shares.
Cumulative Performance: January 31, 2003, Through January 31, 2013
Initial Investment of $10,000
| | | | |
| | | Average Annual Total Returns | |
| | Periods Ended January 31, 2013 | |
| | | | | Final Value |
| | One | Five | Ten | of a $10,000 |
| | Year | Years | Years | Investment |
| REIT Index Fund Investor Shares | 14.45% | 6.78% | 12.28% | $31,847 |
| REIT Spliced Index | 14.72 | 6.80 | 12.34 | 32,021 |
| Real Estate Funds Average | 14.29 | 5.15 | 11.57 | 29,874 |
| Dow Jones U.S. Total Stock Market | | | | |
| Float Adjusted Index | 16.88 | 4.61 | 8.80 | 23,250 |
For a benchmark description, see the Glossary.
Real Estate Funds Average: Derived from data provided by Lipper Inc.
| | | | |
| | | | | Final Value |
| | One | Five | Ten | of a $10,000 |
| | Year | Years | Years | Investment |
| REIT Index Fund Admiral Shares | 14.63% | 6.93% | 12.40% | $32,179 |
| REIT Spliced Index | 14.72 | 6.80 | 12.34 | 32,021 |
| Dow Jones U.S. Total Stock Market Float | | | | |
| Adjusted Index | 16.88 | 4.61 | 8.80 | 23,250 |
See Financial Highlights for dividend and capital gains information.
9
| | | | |
| REIT Index Fund | | | | |
| |
| |
| |
| |
| | | Average Annual Total Returns | |
| | Periods Ended January 31, 2013 | |
| | | | Since | Final Value |
| | One | Five | Inception | of a $10,000 |
| | Year | Years | (6/4/2007) | Investment |
| REIT Index Fund Signal Shares | 14.65% | 6.93% | 2.07% | $11,228 |
| REIT Spliced Index | 14.72 | 6.80 | 1.95 | 11,156 |
| Dow Jones U.S. Total Stock Market Float | | | | |
| Adjusted Index | 16.88 | 4.61 | 2.18 | 11,298 |
"Since Inception" performance is calculated from the Signal Shares’ inception date for both the fund and its comparative standards.
| | | | |
| | | | Since | Final Value |
| | One | Five | Inception | of a $5,000,000 |
| | Year | Years | (12/2/2003) | Investment |
| |
| REIT Index Fund Institutional Shares | 14.66% | 6.95% | 9.82% | $11,800,265 |
| |
| REIT Spliced Index | 14.72 | 6.80 | 9.71 | 11,691,903 |
| Dow Jones U.S. Total Stock Market Float | | | | |
| Adjusted Index | 16.88 | 4.61 | 6.52 | 8,917,534 |
"Since Inception" performance is calculated from the Institutional Shares’ inception date for both the fund and its comparative standards.
| | | | |
| | | | Since | Final Value |
| | One | Five | Inception | of a $10,000 |
| | Year | Years | (9/23/2004) | Investment |
| REIT Index Fund | | | | |
| ETF Shares Net Asset Value | 14.64% | 6.92% | 9.06% | $20,632 |
| REIT Spliced Index | 14.72 | 6.80 | 8.97 | 20,503 |
| Dow Jones U.S. Total Stock Market Float | | | | |
| Adjusted Index | 16.88 | 4.61 | 6.54 | 16,982 |
"Since Inception" performance is calculated from the ETF Shares’ inception date for both the fund and its comparative standards.
| | | |
| Cumulative Returns of ETF Shares: September 23, 2004, Through January 31, 2013 | |
| |
| | | | Since |
| | One | Five | Inception |
| | Year | Years | (9/23/2004) |
| REIT Index Fund ETF Shares | | | |
| Market Price | 14.69% | 40.04% | 106.36% |
| REIT Index Fund ETF Shares | | | |
| Net Asset Value | 14.64 | 39.75 | 106.32 |
| REIT Spliced Index | 14.72 | 38.94 | 105.03 |
"Since Inception" performance is calculated from the ETF Shares’ inception date for both the fund and its comparative standards.
10
REIT Index Fund
Fiscal-Year Total Returns (%): January 31, 2003, Through January 31, 2013
|
| REIT Index Fund Investor Shares |
| REIT Spliced Index |
For a benchmark description, see the Glossary.
Average Annual Total Returns: Periods Ended December 31, 2012
This table presents returns through the latest calendar quarter—rather than through the end of the fiscal period.
Securities and Exchange Commission rules require that we provide this information.
| | | | |
| | Inception | One | Five | Ten |
| | Date | Year | Years | Years |
| Investor Shares | 5/13/1996 | 17.53% | 5.94% | 11.57% |
| Admiral Shares | 11/12/2001 | 17.69 | 6.07 | 11.68 |
| Signal Shares | 6/4/2007 | 17.67 | 6.07 | 1.431 |
| Institutional Shares | 12/2/2003 | 17.65 | 6.11 | 9.481 |
| ETF Shares | 9/23/2004 | | | |
| Market Price | | 17.66 | 6.09 | 8.671 |
| Net Asset Value | | 17.67 | 6.07 | 8.671 |
| 1 Return since inception. |
11
REIT Index Fund
Financial Statements
Statement of Net Assets
As of January 31, 2013
The fund reports a complete list of its holdings in regulatory filings four times in each fiscal year, at the quarter-ends. For the second and fourth fiscal quarters, the lists appear in the fund’s semiannual and annual reports to shareholders. For the first and third fiscal quarters, the fund files the lists with the Securities and Exchange Commission on Form N-Q. Shareholders can look up the fund’s Forms N-Q on the SEC’s website at sec.gov. Forms N-Q may also be reviewed and copied at the SEC’s Public Reference Room (see the back cover of this report for further information).
| | | |
| | | | Market |
| | | | Value |
| | | Shares | ($000) |
| Real Estate Investment Trusts (99.3%)1 | |
| Diversified REITs (7.5%) | | |
| 2 | Vornado Realty Trust | 11,579,379 | 977,994 |
| 2 | Duke Realty Corp. | 21,778,996 | 335,614 |
| 2 | Liberty Property Trust | 8,138,946 | 318,803 |
| 2 | Washington REIT | 4,592,178 | 130,785 |
| | WP Carey Inc. | 2,136,148 | 119,902 |
| 2 | Lexington Realty Trust | 10,665,247 | 117,318 |
| 2 | PS Business Parks Inc. | 1,343,132 | 95,846 |
| | American Assets Trust | | |
| | Inc. | 2,312,630 | 66,835 |
| 2 | Investors Real Estate | | |
| | Trust | 6,350,960 | 59,445 |
| 2 | Cousins Properties Inc. | 6,493,380 | 57,791 |
| *,2 | First Potomac Realty | | |
| | Trust | 3,536,082 | 48,444 |
| | Select Income REIT | 1,191,369 | 29,987 |
| *,2 | CapLease Inc. | 4,753,571 | 27,523 |
| 2 | Winthrop Realty Trust | 2,058,866 | 24,604 |
| ^,2 | Whitestone REIT | 1,121,063 | 15,919 |
| | | | 2,426,810 |
| Industrial REITs (5.2%) | | |
| 2 | Prologis Inc. | 31,897,541 | 1,272,712 |
| 2 | DCT Industrial Trust Inc. | 18,461,340 | 130,337 |
| 2 | EastGroup Properties Inc. | 2,020,433 | 113,225 |
| *,2 | First Industrial Realty | | |
| | Trust Inc. | 6,466,665 | 101,333 |
| 2 | STAG Industrial Inc. | 2,867,130 | 56,540 |
| 2 | Monmouth Real Estate | | |
| | Investment Corp. | | |
| | Class A | 2,237,790 | 24,302 |
| | | | 1,698,449 |
| Office REITs (13.8%) | | |
| 2 | Boston Properties Inc. | 10,438,972 | 1,099,015 |
| 2 | Digital Realty Trust Inc. | 8,446,991 | 573,635 |
| 2 | SL Green Realty Corp. | 6,242,243 | 501,752 |
| 2 | Alexandria Real Estate | | |
| | Equities Inc. | 4,346,573 | 315,127 |
| 2 | Kilroy Realty Corp. | 5,119,221 | 255,449 |
| | | |
| | | | Market |
| | | | Value |
| | | Shares | ($000) |
| 2 | Piedmont Office Realty | | |
| | Trust Inc. Class A | 11,694,646 | 226,058 |
| 2 | BioMed Realty Trust Inc. | 10,675,919 | 217,255 |
| 2 | Douglas Emmett Inc. | 9,191,541 | 214,347 |
| 2 | Highwoods Properties | | |
| | Inc. | 5,267,260 | 189,621 |
| 2 | Mack-Cali Realty Corp. | 6,080,795 | 165,215 |
| 2 | Corporate Office | | |
| | Properties Trust | 5,516,226 | 145,959 |
| 2 | Brandywine Realty Trust | 9,929,717 | 126,405 |
| 2 | DuPont Fabros | | |
| | Technology Inc. | 4,382,870 | 103,611 |
| 2 | Franklin Street | | |
| | Properties Corp. | 5,168,381 | 67,189 |
| | Government | | |
| | Properties Income Trust | 2,641,016 | 65,629 |
| 2 | Hudson Pacific | | |
| | Properties Inc. | 2,452,170 | 52,550 |
| | CommonWealth REIT | 3,177,717 | 52,242 |
| 2 | Coresite Realty Corp. | 1,462,828 | 43,153 |
| * | Parkway Properties Inc. | 2,463,690 | 39,025 |
| | | | 4,453,237 |
| Residential REITs (17.0%) | | |
| 2 | Equity Residential | 22,272,977 | 1,233,700 |
| 2 | AvalonBay Communities | | |
| | Inc. | 7,769,329 | 1,008,381 |
| 2 | UDR Inc. | 17,324,315 | 413,878 |
| 2 | Camden Property Trust | 5,787,565 | 401,599 |
| 2 | Essex Property Trust Inc. | 2,521,342 | 387,732 |
| 2 | American Campus | | |
| | Communities Inc. | 7,258,948 | 338,049 |
| *,2 | Apartment Investment | | |
| | & Management Co. | | |
| | Class A | 10,077,550 | 274,916 |
| 2 | BRE Properties Inc. | 5,317,686 | 270,564 |
| 2 | Home Properties Inc. | 3,454,864 | 212,371 |
| 2 | Equity Lifestyle | | |
| | Properties Inc. | 2,718,870 | 194,671 |
| 2 | Mid-America Apartment | | |
| | Communities Inc. | 2,846,093 | 186,049 |
12
| | | |
| REIT Index Fund | | |
| |
| |
| |
| | | | Market |
| | | | Value |
| | | Shares | ($000) |
| 2 | Post Properties Inc. | 3,752,597 | 182,038 |
| 2 | Colonial Properties Trust | 5,790,399 | 126,868 |
| 2 | Sun Communities Inc. | 1,955,845 | 84,004 |
| 2 | Education Realty Trust | | |
| | Inc. | 7,669,553 | 82,448 |
| 2 | Associated Estates | | |
| | Realty Corp. | 3,426,812 | 55,343 |
| 2 | Campus Crest | | |
| | Communities Inc. | 2,669,983 | 32,253 |
| | | | 5,484,864 |
| Retail REITs (27.3%) | | |
| 2 | Simon Property | | |
| | Group Inc. | 21,002,877 | 3,364,241 |
| 2 | Kimco Realty Corp. | 28,177,726 | 585,251 |
| | General Growth | | |
| | Properties Inc. | 29,234,534 | 570,658 |
| 2 | Macerich Co. | 9,217,486 | 550,468 |
| ^,2 | Realty Income Corp. | 12,394,045 | 541,372 |
| 2 | Federal Realty | | |
| | Investment Trust | 4,439,183 | 469,888 |
| 2 | Taubman Centers Inc. | 4,272,029 | 348,170 |
| 2 | Regency Centers Corp. | 6,227,515 | 310,317 |
| 2 | DDR Corp. | 16,846,784 | 279,488 |
| ^,2 | National Retail | | |
| | Properties Inc. | 7,491,184 | 239,868 |
| 2 | Tanger Factory Outlet | | |
| | Centers | 6,500,641 | 230,253 |
| 2 | Weingarten Realty | | |
| | Investors | 7,976,267 | 230,036 |
| 2 | CBL & Associates | | |
| | Properties Inc. | 10,429,988 | 224,140 |
| 2 | Glimcher Realty Trust | 9,703,545 | 107,903 |
| | Equity One Inc. | 4,097,871 | 92,653 |
| 2 | Acadia Realty Trust | 3,399,465 | 88,862 |
| ^ | Retail Properties of | | |
| | America Inc. | 5,891,533 | 76,236 |
| *,2 | Pennsylvania REIT | 3,684,253 | 67,938 |
| 2 | Inland Real Estate Corp. | 6,177,792 | 56,094 |
| 2 | Ramco-Gershenson | | |
| | Properties Trust | 3,237,540 | 48,952 |
| | Alexander’s Inc. | 141,394 | 47,064 |
| ^,2 | Retail Opportunity | | |
| | Investments Corp. | 3,546,278 | 46,279 |
| 2 | Excel Trust Inc. | 3,002,079 | 37,766 |
| | Saul Centers Inc. | 822,627 | 35,167 |
| 2 | Getty Realty Corp. | 1,848,396 | 34,898 |
| | Urstadt Biddle | | |
| | Properties Inc. Class A | 1,555,061 | 31,474 |
| 2 | Kite Realty Group Trust | 5,007,374 | 30,295 |
| | Rouse Properties Inc. | 1,361,808 | 24,867 |
| 2 | Cedar Realty Trust Inc. | 4,220,246 | 23,254 |
| | Urstadt Biddle | | |
| | Properties Inc. | 69,255 | 1,281 |
| | | | 8,795,133 |
| | | |
| | | | Market |
| | | | Value |
| | | Shares | ($000) |
| Specialized REITs (28.5%) | | |
| 2 | Public Storage | 10,097,352 | 1,554,285 |
| 2 | HCP Inc. | 31,357,690 | 1,454,683 |
| 2 | Ventas Inc. | 20,451,932 | 1,355,759 |
| 2 | Health Care REIT Inc. | 17,664,972 | 1,110,067 |
| 2 | Host Hotels & Resorts | | |
| | Inc. | 50,032,133 | 840,039 |
| 2 | Extra Space Storage Inc. | 7,204,266 | 287,018 |
| | Senior Housing | | |
| | Properties Trust | 9,317,115 | 224,449 |
| ^,2 | Omega Healthcare | | |
| | Investors Inc. | 7,524,783 | 192,333 |
| 2 | LaSalle Hotel Properties | 6,526,711 | 178,179 |
| 2 | EPR Properties | 3,243,107 | 151,972 |
| 2 | Healthcare Realty | | |
| | Trust Inc. | 5,955,218 | 151,739 |
| | Hospitality | | |
| | Properties Trust | 5,855,610 | 147,678 |
| 2 | RLJ Lodging Trust | 6,645,159 | 138,950 |
| 2 | Sovran Self Storage Inc. | 2,039,109 | 133,031 |
| *,2 | Sunstone Hotel | | |
| | Investors Inc. | 10,993,860 | 127,199 |
| 2 | Medical Properties | | |
| | Trust Inc. | 9,387,077 | 126,256 |
| 2 | CubeSmart | 8,106,095 | 123,618 |
| 2 | DiamondRock | | |
| | Hospitality Co. | 13,511,704 | 123,227 |
| 2 | National Health | | |
| | Investors Inc. | 1,637,992 | 104,258 |
| 2 | Pebblebrook Hotel Trust | 4,081,810 | 101,678 |
| *,2 | Strategic Hotels & | | |
| | Resorts Inc. | 11,317,181 | 82,729 |
| 2 | LTC Properties Inc. | 2,108,317 | 78,514 |
| 2 | Hersha Hospitality | | |
| | Trust Class A | 12,372,079 | 65,325 |
| 2 | Sabra Health Care | | |
| | REIT Inc. | 2,565,486 | 64,368 |
| 2 | Chesapeake | | |
| | Lodging Trust | 2,674,969 | 57,111 |
| 2 | Ashford Hospitality | | |
| | Trust Inc. | 4,483,746 | 51,967 |
| 2 | Universal Health | | |
| | Realty Income Trust | 834,422 | 46,002 |
| *,2 | FelCor Lodging Trust Inc. | 8,171,491 | 43,963 |
| 2 | Summit Hotel | | |
| | Properties Inc. | 4,371,380 | 40,173 |
| | Healthcare Trust of | | |
| | America Inc. Class A | 2,945,016 | 31,541 |
| | | | 9,188,111 |
| Total Real Estate Investment Trusts | |
| (Cost $26,449,382) | | 32,046,604 |
13
| | |
| REIT Index Fund | | |
| |
| |
| |
| | | Market |
| | | Value• |
| | Shares | ($000) |
| Temporary Cash Investment (1.0%)1 | |
| Money Market Fund (1.0%) | |
| 3,4 Vanguard Market Liquidity | |
| Fund, 0.143% | | |
| (Cost $312,788) | 312,788,233 | 312,788 |
| Total Investments (100.3%) | |
| (Cost $26,762,170) | | 32,359,392 |
| Other Assets and Liabilities (-0.3%) | |
| Other Assets | | 74,967 |
| Liabilities4 | | (178,331) |
| | | (103,364) |
| Net Assets (100%) | | 32,256,028 |
| |
| |
| Statement of Assets and Liabilities | |
| Assets | | |
| Investments in Securities, at Value | |
| Unaffiliated Issuers | | 1,656,688 |
| Affiliated Vanguard Funds | 312,788 |
| Other Affiliated Issuers | 30,389,916 |
| Total Investments in Securities | 32,359,392 |
| Receivables for Capital Shares Issued | 22,105 |
| Receivables for Accrued Income | 48,843 |
| Other Assets | | 4,019 |
| Total Assets | | 32,434,359 |
| Liabilities | | |
| Payables for Investment Securities | |
| Purchased | | 65,289 |
| Security Lending Collateral Payable | |
| to Brokers | | 78,682 |
| Other Liabilities | | 34,360 |
| Total Liabilties | | 178,331 |
| Net Assets | | 32,256,028 |
| |
| At January 31, 2013, net assets consisted of: |
| | Amount |
| | ($000) |
| Paid-in Capital | 26,961,520 |
| Undistributed Net Investment Income | 18,317 |
| Accumulated Net Realized Losses | (322,154) |
| Unrealized Appreciation (Depreciation) | |
| Investment Securities | 5,597,222 |
| Swap Contracts | 1,123 |
| Net Assets | 32,256,028 |
| |
| |
| Investor Shares—Net Assets | |
| Applicable to 124,297,203 outstanding | |
| $.001 par value shares of beneficial | |
| interest (unlimited authorization) | 2,816,768 |
| Net Asset Value Per Share— | |
| Investor Shares | $22.66 |
| |
| |
| Admiral Shares—Net Assets | |
| Applicable to 76,508,893 outstanding | |
| $.001 par value shares of beneficial | |
| interest (unlimited authorization) | 7,398,725 |
| Net Asset Value Per Share— | |
| Admiral Shares | $96.70 |
| |
| |
| Signal Shares—Net Assets | |
| Applicable to 72,561,772 outstanding | |
| $.001 par value shares of beneficial | |
| interest (unlimited authorization) | 1,873,214 |
| Net Asset Value Per Share— | |
| Signal Shares | $25.82 |
14
| |
| REIT Index Fund | |
| |
| |
| |
| |
| | Amount |
| | ($000) |
| Institutional Shares—Net Assets | |
| Applicable to 212,771,437 outstanding | |
| $.001 par value shares of beneficial | |
| interest (unlimited authorization) | 3,184,663 |
| Net Asset Value Per Share— | |
| Institutional Shares | $14.97 |
| |
| |
| ETF Shares—Net Assets | |
| Applicable to 248,884,086 outstanding | |
| $.001 par value shares of beneficial | |
| interest (unlimited authorization) | 16,982,658 |
| Net Asset Value Per Share— | |
| ETF Shares | $68.24 |
See Note A in Notes to Financial Statements.
^ Part of security position is on loan to broker-dealers. The total value of securities on loan is $75,240,000.
* Non-income-producing security.
1 The fund invests a portion of its assets in Real Estate Investment Trusts through the use of swap contracts. After giving effect to swap investments, the fund’s effective Real Estate Investment Trust and temporary cash investment positions represent 100.0% and 0.3%, respectively, of net assets.
2 Considered an affiliated company of the fund as the fund owns more than 5% of the outstanding voting securities of such company.
3 Affiliated money market fund available only to Vanguard funds and certain trusts and accounts managed by Vanguard. Rate shown is the 7-day yield.
4 Includes $78,682,000 of collateral received for securities on loan.
REIT—Real Estate Investment Trust.
See accompanying Notes, which are an integral part of the Financial Statements.
15
| |
| REIT Index Fund | |
| |
| |
| Statement of Operations | |
| |
| |
| | Year Ended |
| | January 31, 2013 |
| | ($000) |
| Investment Income | |
| Income | |
| Dividends1 | 698,119 |
| Interest1 | 231 |
| Security Lending | 180 |
| Total Income | 698,530 |
| Expenses | |
| The Vanguard Group—Note B | |
| Investment Advisory Services | 1,505 |
| Management and Administrative—Investor Shares | 5,454 |
| Management and Administrative—Admiral Shares | 4,913 |
| Management and Administrative—Signal Shares | 980 |
| Management and Administrative—Institutional Shares | 1,254 |
| Management and Administrative—ETF Shares | 8,604 |
| Marketing and Distribution—Investor Shares | 689 |
| Marketing and Distribution—Admiral Shares | 955 |
| Marketing and Distribution—Signal Shares | 382 |
| Marketing and Distribution—Institutional Shares | 693 |
| Marketing and Distribution—ETF Shares | 3,402 |
| Custodian Fees | 271 |
| Auditing Fees | 34 |
| Shareholders’ Reports—Investor Shares | 65 |
| Shareholders’ Reports—Admiral Shares | 31 |
| Shareholders’ Reports—Signal Shares | 16 |
| Shareholders’ Reports—Institutional Shares | 20 |
| Shareholders’ Reports—ETF Shares | 511 |
| Trustees’ Fees and Expenses | 31 |
| Total Expenses | 29,810 |
| Net Investment Income | 668,720 |
| Realized Net Gain (Loss) | |
| Capital Gain Distributions Received | 141,291 |
| Investment Securities Sold | 461,894 |
| Swap Contracts | 20,447 |
| Realized Net Gain (Loss)1 | 623,632 |
| Change in Unrealized Appreciation (Depreciation) | |
| Investment Securities | 2,347,069 |
| Swap Contracts | (4,013) |
| Change in Unrealized Appreciation (Depreciation) | 2,343,056 |
| Net Increase (Decrease) in Net Assets Resulting from Operations | 3,635,408 |
1 Dividend income, interest income, and realized net gain (loss) from affiliated companies of the fund were $661,620,000, $220,000, and $584,211,000, respectively.
See accompanying Notes, which are an integral part of the Financial Statements.
16
| | |
| REIT Index Fund | | |
| |
| |
| Statement of Changes in Net Assets | | |
| |
| | Year Ended January 31, |
| | 2013 | 2012 |
| | ($000) | ($000) |
| Increase (Decrease) in Net Assets | | |
| Operations | | |
| Net Investment Income | 668,720 | 470,697 |
| Realized Net Gain (Loss) | 623,632 | 220,389 |
| Change in Unrealized Appreciation (Depreciation) | 2,343,056 | 1,501,149 |
| Net Increase (Decrease) in Net Assets Resulting from Operations | 3,635,408 | 2,192,235 |
| Distributions | | |
| Net Investment Income | | |
| Investor Shares | (63,020) | (58,500) |
| Admiral Shares | (159,134) | (119,159) |
| Signal Shares | (37,229) | (25,078) |
| Institutional Shares | (68,007) | (45,416) |
| ETF Shares | (341,096) | (215,013) |
| Realized Capital Gain | | |
| Investor Shares | — | — |
| Admiral Shares | — | — |
| Signal Shares | — | — |
| Institutional Shares | — | — |
| ETF Shares | — | — |
| Return of Capital | | |
| Investor Shares | (28,556) | (28,724) |
| Admiral Shares | (72,108) | (58,509) |
| Signal Shares | (16,870) | (12,314) |
| Institutional Shares | (30,816) | (22,300) |
| ETF Shares | (154,560) | (105,574) |
| Total Distributions | (971,396) | (690,587) |
| Capital Share Transactions | | |
| Investor Shares | (19,586) | (279,552) |
| Admiral Shares | 1,150,759 | 489,968 |
| Signal Shares | 494,034 | 308,673 |
| Institutional Shares | 586,219 | 536,824 |
| ETF Shares | 5,243,286 | 1,682,526 |
| Net Increase (Decrease) from Capital Share Transactions | 7,454,712 | 2,738,439 |
| Total Increase (Decrease) | 10,118,724 | 4,240,087 |
| Net Assets | | |
| Beginning of Period | 22,137,304 | 17,897,217 |
| End of Period1 | 32,256,028 | 22,137,304 |
1 Net Assets—End of Period includes undistributed (overdistributed) net investment income of $18,317,000 and ($2,364,000).
See accompanying Notes, which are an integral part of the Financial Statements.
17
| | | | | |
| REIT Index Fund | | | | | |
| |
| |
| Financial Highlights | | | | | |
| |
| |
| Investor Shares | | | | | |
| |
| |
| For a Share Outstanding | | | Year Ended January 31, |
| Throughout Each Period | 2013 | 2012 | 2011 | 2010 | 2009 |
| Net Asset Value, Beginning of Period | $20.50 | $18.99 | $14.05 | $10.02 | $20.38 |
| Investment Operations | | | | | |
| Net Investment Income | .514 | .442 | .399 | .477 | .593 |
| Net Realized and Unrealized Gain (Loss) | | | | | |
| on Investments | 2.393 | 1.722 | 5.144 | 4.192 | (9.975) |
| Total from Investment Operations | 2.907 | 2.164 | 5.543 | 4.669 | (9.382) |
| Distributions | | | | | |
| Dividends from Net Investment Income | (.514) | (.439) | (.603) | (.481) | (.571) |
| Distributions from Realized Capital Gains | — | — | — | — | (.125) |
| Return of Capital | (.233) | (.215) | — | (.158) | (.282) |
| Total Distributions | (.747) | (.654) | (.603) | (.639) | (.978) |
| Net Asset Value, End of Period | $22.66 | $20.50 | $18.99 | $14.05 | $10.02 |
| |
| Total Return1 | 14.45% | 11.80% | 40.02% | 48.51% | -47.82% |
| |
| Ratios/Supplemental Data | | | | | |
| Net Assets, End of Period (Millions) | $2,817 | $2,565 | $2,658 | $3,572 | $2,274 |
| Ratio of Total Expenses to | | | | | |
| Average Net Assets | 0.24% | 0.24% | 0.26% | 0.26% | 0.21% |
| Ratio of Net Investment Income to | | | | | |
| Average Net Assets | 2.39% | 2.30% | 2.22% | 3.94% | 3.36% |
| Portfolio Turnover Rate2 | 9% | 10% | 12% | 16% | 10% |
1 Total returns do not include transaction or account service fees that may have applied in the periods shown. Fund prospectuses provide information about any applicable transaction and account service fees.
2 Excludes the value of portfolio securities received or delivered as a result of in-kind purchases or redemptions of the fund’s capital shares, including ETF Creation Units.
See accompanying Notes, which are an integral part of the Financial Statements.
18
| | | | | |
| REIT Index Fund | | | | | |
| |
| |
| Financial Highlights | | | | | |
| |
| |
| Admiral Shares | | | | | |
| |
| |
| For a Share Outstanding | | | Year Ended January 31, |
| Throughout Each Period | 2013 | 2012 | 2011 | 2010 | 2009 |
| Net Asset Value, Beginning of Period | $87.47 | $81.03 | $59.95 | $42.74 | $86.94 |
| Investment Operations | | | | | |
| Net Investment Income | 2.285 | 1.960 | 1.806 | 2.083 | 2.581 |
| Net Realized and Unrealized Gain (Loss) | | | | | |
| on Investments | 10.263 | 7.385 | 21.948 | 17.909 | (42.527) |
| Total from Investment Operations | 12.548 | 9.345 | 23.754 | 19.992 | (39.946) |
| Distributions | | | | | |
| Dividends from Net Investment Income | (2.283) | (1.948) | (2.674) | (2.094) | (2.491) |
| Distributions from Realized Capital Gains | — | — | — | — | (.535) |
| Return of Capital | (1.035) | (.957) | — | (.688) | (1.228) |
| Total Distributions | (3.318) | (2.905) | (2.674) | (2.782) | (4.254) |
| Net Asset Value, End of Period | $96.70 | $87.47 | $81.03 | $59.95 | $42.74 |
| |
| Total Return1 | 14.63% | 11.95% | 40.21% | 48.73% | -47.77% |
| |
| Ratios/Supplemental Data | | | | | |
| Net Assets, End of Period (Millions) | $7,399 | $5,612 | $4,715 | $1,296 | $873 |
| Ratio of Total Expenses to | | | | | |
| Average Net Assets | 0.10% | 0.10% | 0.12% | 0.13% | 0.11% |
| Ratio of Net Investment Income to | | | | | |
| Average Net Assets | 2.53% | 2.44% | 2.36% | 4.07% | 3.46% |
| Portfolio Turnover Rate2 | 9% | 10% | 12% | 16% | 10% |
1 Total returns do not include transaction or account service fees that may have applied in the periods shown. Fund prospectuses provide information about any applicable transaction and account service fees.
2 Excludes the value of portfolio securities received or delivered as a result of in-kind purchases or redemptions of the fund’s capital shares, including ETF Creation Units.
See accompanying Notes, which are an integral part of the Financial Statements.
19
| | | | | |
| REIT Index Fund | | | | | |
| |
| |
| Financial Highlights | | | | | |
| |
| |
| Signal Shares | | | | | |
| |
| |
| For a Share Outstanding | | | Year Ended January 31, |
| Throughout Each Period | 2013 | 2012 | 2011 | 2010 | 2009 |
| Net Asset Value, Beginning of Period | $23.35 | $21.63 | $16.00 | $11.41 | $23.21 |
| Investment Operations | | | | | |
| Net Investment Income | .610 | .522 | .483 | .557 | .688 |
| Net Realized and Unrealized Gain (Loss) | | | | | |
| on Investments | 2.744 | 1.974 | 5.862 | 4.775 | (11.353) |
| Total from Investment Operations | 3.354 | 2.496 | 6.345 | 5.332 | (10.665) |
| Distributions | | | | | |
| Dividends from Net Investment Income | (.608) | (.520) | (.715) | (.559) | (.664) |
| Distributions from Realized Capital Gains | — | — | — | — | (.143) |
| Return of Capital | (.276) | (.256) | — | (.183) | (.328) |
| Total Distributions | (.884) | (.776) | (.715) | (.742) | (1.135) |
| Net Asset Value, End of Period | $25.82 | $23.35 | $21.63 | $16.00 | $11.41 |
| |
| Total Return1 | 14.65% | 11.96% | 40.25% | 48.68% | -47.77% |
| |
| Ratios/Supplemental Data | | | | | |
| Net Assets, End of Period (Millions) | $1,873 | $1,226 | $835 | $489 | $350 |
| Ratio of Total Expenses to | | | | | |
| Average Net Assets | 0.10% | 0.10% | 0.12% | 0.14% | 0.11% |
| Ratio of Net Investment Income to | | | | | |
| Average Net Assets | 2.53% | 2.44% | 2.36% | 4.06% | 3.46% |
| Portfolio Turnover Rate2 | 9% | 10% | 12% | 16% | 10% |
1 Total returns do not include transaction fees that may have applied in the periods shown. Fund prospectuses provide information about any applicable transaction fees.
2 Excludes the value of portfolio securities received or delivered as a result of in-kind purchases or redemptions of the fund’s capital shares, including ETF Creation Units.
See accompanying Notes, which are an integral part of the Financial Statements.
20
| | | | | |
| REIT Index Fund | | | | | |
| |
| |
| Financial Highlights | | | | | |
| |
| |
| Institutional Shares | | | | | |
| |
| |
| For a Share Outstanding | | | Year Ended January 31, |
| Throughout Each Period | 2013 | 2012 | 2011 | 2010 | 2009 |
| Net Asset Value, Beginning of Period | $13.54 | $12.54 | $9.28 | $6.61 | $13.46 |
| Investment Operations | | | | | |
| Net Investment Income | .356 | .305 | .284 | .326 | .401 |
| Net Realized and Unrealized Gain (Loss) | | | | | |
| on Investments | 1.590 | 1.148 | 3.395 | 2.777 | (6.591) |
| Total from Investment Operations | 1.946 | 1.453 | 3.679 | 3.103 | (6.190) |
| Distributions | | | | | |
| Dividends from Net Investment Income | (.355) | (.304) | (.419) | (.326) | (.386) |
| Distributions from Realized Capital Gains | — | — | — | — | (.083) |
| Return of Capital | (0.161) | (.149) | — | (.107) | (.191) |
| Total Distributions | (0.516) | (.453) | (.419) | (.433) | (.660) |
| Net Asset Value, End of Period | $14.97 | $13.54 | $12.54 | $9.28 | $6.61 |
| |
| Total Return1 | 14.66% | 12.01% | 40.24% | 48.90% | -47.82% |
| |
| Ratios/Supplemental Data | | | | | |
| Net Assets, End of Period (Millions) | $3,185 | $2,324 | $1,614 | $907 | $504 |
| Ratio of Total Expenses to | | | | | |
| Average Net Assets | 0.08% | 0.08% | 0.08% | 0.09% | 0.09% |
| Ratio of Net Investment Income to | | | | | |
| Average Net Assets | 2.55% | 2.46% | 2.40% | 4.11% | 3.48% |
| Portfolio Turnover Rate2 | 9% | 10% | 12% | 16% | 10% |
1 Total returns do not include transaction fees that may have applied in the periods shown. Fund prospectuses provide information about any applicable transaction fees.
2 Excludes the value of portfolio securities received or delivered as a result of in-kind purchases or redemptions of the fund’s capital shares, including ETF Creation Units.
See accompanying Notes, which are an integral part of the Financial Statements.
21
| | | | | |
| REIT Index Fund | | | | | |
| |
| |
| Financial Highlights | | | | | |
| |
| |
| ETF Shares | | | | | |
| |
| |
| For a Share Outstanding | | | Year Ended January 31, |
| Throughout Each Period | 2013 | 2012 | 2011 | 2010 | 2009 |
| Net Asset Value, Beginning of Period | $61.72 | $57.17 | $42.30 | $30.14 | $61.31 |
| Investment Operations | | | | | |
| Net Investment Income | 1.613 | 1.384 | 1.278 | 1.473 | 1.820 |
| Net Realized and Unrealized Gain (Loss) | | | | | |
| on Investments | 7.250 | 5.216 | 15.483 | 12.651 | (29.990) |
| Total from Investment Operations | 8.863 | 6.600 | 16.761 | 14.124 | (28.170) |
| Distributions | | | | | |
| Dividends from Net Investment Income | (1.612) | (1.375) | (1.891) | (1.478) | (1.757) |
| Distributions from Realized Capital Gains | — | — | — | — | (.377) |
| Return of Capital | (.731) | (.675) | — | (.486) | (.866) |
| Total Distributions | (2.343) | (2.050) | (1.891) | (1.964) | (3.000) |
| Net Asset Value, End of Period | $68.24 | $61.72 | $57.17 | $42.30 | $30.14 |
| |
| Total Return | 14.64% | 11.94% | 40.19% | 48.74% | -47.77% |
| |
| Ratios/Supplemental Data | | | | | |
| Net Assets, End of Period (Millions) | $16,983 | $10,410 | $8,075 | $4,678 | $1,414 |
| Ratio of Total Expenses to | | | | | |
| Average Net Assets | 0.10% | 0.10% | 0.12% | 0.13% | 0.11% |
| Ratio of Net Investment Income to | | | | | |
| Average Net Assets | 2.53% | 2.44% | 2.36% | 4.07% | 3.46% |
| Portfolio Turnover Rate1 | 9% | 10% | 12% | 16% | 10% |
1 Excludes the value of portfolio securities received or delivered as a result of in-kind purchases or redemptions of the fund’s capital shares, including ETF Creation Units.
See accompanying Notes, which are an integral part of the Financial Statements.
22
REIT Index Fund
Notes to Financial Statements
Vanguard REIT Index Fund is registered under the Investment Company Act of 1940 as an open-end investment company, or mutual fund. The fund offers five classes of shares: Investor Shares, Admiral Shares, Signal Shares, Institutional Shares, and ETF Shares. Investor Shares are available to any investor who meets the fund’s minimum purchase requirements. Admiral Shares, Signal Shares, and Institutional Shares, are designed for investors who meet certain administrative, service, and account-size criteria. ETF Shares are listed for trading on NYSE Arca; they can be purchased and sold through a broker.
A. The following significant accounting policies conform to generally accepted accounting principles for U.S. mutual funds. The fund consistently follows such policies in preparing its financial statements.
1. Security Valuation: Securities are valued as of the close of trading on the New York Stock Exchange (generally 4 p.m., Eastern time) on the valuation date. Equity securities are valued at the latest quoted sales prices or official closing prices taken from the primary market in which each security trades; such securities not traded on the valuation date are valued at the mean of the latest quoted bid and asked prices. Securities for which market quotations are not readily available, or whose values have been materially affected by events occurring before the fund’s pricing time but after the close of the securities’ primary markets, are valued by methods deemed by the board of trustees to represent fair value. Investments in Vanguard Market Liquidity Fund are valued at that fund’s net asset value.
2. Swap Contracts: The fund has entered into equity swap contracts to earn the total return on selected reference securities in the fund’s target index. Under the terms of each swap, the fund receives the total return on a referenced security (i.e., receiving the increase or paying the decrease in value of the selected reference security and receiving the equivalent of any dividends in respect of the selected reference security) over a specified period of time, applied to a notional amount that represents the value of a designated number of shares of the selected reference security at the beginning of the equity swap contract. The fund also pays a floating rate that is based on short-term interest rates, applied to the notional amount. At the same time, the fund invests an amount approximating the notional amount of the swap in high-quality temporary cash investments.
The notional amounts of swap contracts are not recorded in the Statement of Net Assets. Swaps are valued daily based on market quotations received from independent pricing services or recognized dealers and the change in value is recorded as unrealized appreciation (depreciation) until termination of the swap, at which time realized gain (loss) is recorded. The primary risks associated with the swaps are that a counterparty will default on its obligation to pay net amounts due to the fund, or that the fund will incur fees in the event it terminates a swap prior to the scheduled termination date. The fund’s maximum risk of loss from counterparty credit risk is the amount of unrealized appreciation on the swap contract. The fund attempts to mitigate this risk by, among other things, performing a credit analysis of counterparties, monitoring exposure to counterparties, and requiring counterparties to post collateral to secure such exposure. The swap contracts contain provisions whereby a counterparty may terminate open contracts if the fund’s net assets decline below a certain level, triggering a payment by the fund if the fund is in a net liability position at the time of the termination. The payment amount would be reduced by any collateral the fund has posted. Any securities posted as collateral for open contracts are noted in the Statement of Net Assets.
23
REIT Index Fund
During the year ended January 31, 2013, the fund’s average amount of total return swaps represented less than 1% of net assets, based on quarterly average notional amounts.
3. Federal Income Taxes: The fund intends to continue to qualify as a regulated investment company and distribute all of its taxable income. Management has analyzed the fund’s tax positions taken for all open federal income tax years (January 31, 2010–2013), and has concluded that no provision for federal income tax is required in the fund’s financial statements.
4. Distributions: Distributions to shareholders are recorded on the ex-dividend date. Distributions declared by the fund are reallocated at fiscal year-end to ordinary income, capital gain, and return of capital to reflect their tax character.
5. Security Lending: The fund may lend its securities to qualified institutional borrowers to earn additional income. Security loans are required to be secured at all times by collateral at least equal to the market value of securities loaned. The fund invests cash collateral received in Vanguard Market Liquidity Fund, and records a liability for the return of the collateral, during the period the securities are on loan. Security lending income represents fees charged to borrowers plus income earned on investing cash collateral, less expenses associated with the loan.
6. Other: Distributions received from REITs are recorded on the ex-dividend date. Each REIT reports annually the tax character of its distributions. Dividend income, capital gain distributions received, and unrealized appreciation (depreciation) reflect the amounts of taxable income, capital gain, and return of capital reported by the REITs, and management’s estimates of such amounts for REIT distributions for which actual information has not been reported. Interest income includes income distributions received from Vanguard Market Liquidity Fund and is accrued daily. Security transactions are accounted for on the date securities are bought or sold. Costs used to determine realized gains (losses) on the sale of investment securities are those of the specific securities sold. Fees assessed on redemptions of capital shares prior to May 23, 2012, were credited to paid-in capital.
Each class of shares has equal rights as to assets and earnings, except that each class separately bears certain class-specific expenses related to maintenance of shareholder accounts (included in Management and Administrative expenses) and shareholder reporting. Marketing and distribution expenses are allocated to each class of shares based on a method approved by the board of trustees. Income, other non-class-specific expenses, and gains and losses on investments are allocated to each class of shares based on its relative net assets.
B. The Vanguard Group furnishes at cost investment advisory, corporate management, administrative, marketing, and distribution services. The costs of such services are allocated to the fund under methods approved by the board of trustees. The fund has committed to provide up to 0.40% of its net assets in capital contributions to Vanguard. At January 31, 2013, the fund had contributed capital of $4,019,000 to Vanguard (included in Other Assets), representing 0.01% of the fund’s net assets and 1.60% of Vanguard’s capitalization. The fund’s trustees and officers are also directors and officers of Vanguard.
24
REIT Index Fund
C. Various inputs may be used to determine the value of the fund’s investments. These inputs are summarized in three broad levels for financial statement purposes. The inputs or methodologies used to value securities are not necessarily an indication of the risk associated with investing in those securities.
Level 1—Quoted prices in active markets for identical securities.
Level 2—Other significant observable inputs (including quoted prices for similar securities, interest rates, prepayment speeds, credit risk, etc.).
Level 3—Significant unobservable inputs (including the fund’s own assumptions used to determine the fair value of investments).
The following table summarizes the market value of the fund’s investments as of January 31, 2013, based on the inputs used to value them:
| | | |
| | Level 1 | Level 2 | Level 3 |
| Investments | ($000) | ($000) | ($000) |
| Real Estate Investment Trusts | 32,046,604 | — | — |
| Temporary Cash Investments | 312,788 | — | — |
| Swap Contracts—Assets | — | 1,722 | — |
| Swap Contracts—Liabilities | — | (599) | — |
| Total | 32,359,392 | 1,123 | — |
D. At January 31, 2013, the fund had the following open total return swap contracts:
| | | | | |
| | | | | Floating | Unrealized |
| | | | Notional | Interest Rate | Appreciation |
| | Termination | | Amount | Received | (Depreciation) |
| Reference Entity | Date | Counterparty1 | ($000) | (Paid) | ($000) |
| CommonWealth REIT | 4/16/13 | GSI | 4,974 | (0.554%)2 | (43) |
| CommonWealth REIT | 4/16/13 | GSI | 4,242 | (0.556%)2 | 263 |
| CommonWealth REIT | 4/16/13 | GSI | 1,678 | (0.553%)2 | (34) |
| CommonWealth REIT | 4/16/13 | GSI | 1,618 | (0.555%)2 | 26 |
| CommonWealth REIT | 8/7/13 | GSI | 29,711 | (0.558%)2 | 1,151 |
| Government Properties | | | | | |
| Income Trust | 12/10/13 | GSI | 14,249 | (0.558%)2 | 282 |
| Hospitality Propeties Trust | 10/2/13 | GSI | 69,714 | (0.552%)2 | (354) |
| Senior Housing Properties Trust | 8/9/13 | GSI | 75,950 | (0.558%)2 | (91) |
| Senior Housing Properties Trust | 8/9/13 | GSI | 7,253 | (0.554%)2 | (27) |
| Senior Housing Properties Trust | 8/9/13 | GSI | 2,443 | (0.555%)2 | (35) |
| Senior Housing Properties Trust | 8/9/13 | GSI | 2,424 | (0.553%)2 | (15) |
1 GSI—Goldman Sachs International.
2 Based on one-month London Interbank Offered Rate (LIBOR) as of the most recent payment date plus a 0.35% spread.
At January 31, 2013, the counterparty had deposited in segregated accounts securities with a value of $10,601,000 in connection with amounts due to the fund for open swap contracts.
25
REIT Index Fund
E. Distributions are determined on a tax basis and may differ from net investment income and realized capital gains for financial reporting purposes. Differences may be permanent or temporary. Permanent differences are reclassified among capital accounts in the financial statements to reflect their tax character. Temporary differences arise when certain items of income, expense, gain, or loss are recognized in different periods for financial statement and tax purposes; these differences will reverse at some time in the future. Differences in classification may also result from the treatment of short-term gains as ordinary income for tax purposes.
Realized and unrealized gains (losses) on certain of the fund’s swap contracts are treated as ordinary income (loss) for tax purposes. Realized gains of $20,447,000 on swap contracts have been reclassified from accumulated net realized losses to undistributed net investment income.
During the year ended January 31, 2013, the fund realized $378,426,000 of net capital gains resulting from in-kind redemptions—in which shareholders exchanged fund shares for securities held by the fund rather than for cash. Because such gains are not taxable to the fund, and are not distributed to shareholders, they have been reclassified from accumulated net realized losses to paid-in capital.
For tax purposes, at January 31, 2013, the fund had no ordinary income available for distribution. The fund used capital loss carryforwards of $131,846,000 to offset taxable capital gains realized during the year ended January 31,2013. At January 31,2013, the fund had available capital loss carryforwards totaling $294,470,000 to offset future net capital gains. Of this amount, $73,864,000 is subject to expiration on January 31, 2018. Capital losses of $220,606,000 realized beginning in fiscal 2012 may be carried forward indefinitely under the Regulated Investment Company Modernization Act of 2010, but must be used before any expiring loss carryforwards.
At January 31, 2013, the cost of investment securities for tax purposes was $26,789,854,000. Net unrealized appreciation of investment securities for tax purposes was $5,569,538,000, consisting of unrealized gains of $5,876,481,000 on securities that had risen in value since their purchase and $306,943,000 in unrealized losses on securities that had fallen in value since their purchase.
F. During the year ended January 31, 2013, the fund purchased $10,452,367,000 of investment securities and sold $3,094,759,000 of investment securities, other than temporary cash investments. Purchases and sales include $6,026,863,000 and $821,944,000, respectively, in connection with in-kind purchases and redemptions of the fund’s capital shares.
26
REIT Index Fund
G. Capital share transactions for each class of shares were:
| | | | |
| | | | Year Ended January 31, |
| | | 2013 | | 2012 |
| | Amount | Shares | Amount | Shares |
| | ($000) | (000) | ($000) | (000) |
| Investor Shares | | | | |
| Issued | 760,608 | 35,236 | 616,468 | 31,976 |
| Issued in Lieu of Cash Distributions | 87,324 | 4,088 | 83,897 | 4,515 |
| Redeemed1 | (867,518) | (40,141) | (979,917) | (51,365) |
| Net Increase (Decrease) —Investor Shares | (19,586) | (817) | (279,552) | (14,874) |
| Admiral Shares | | | | |
| Issued | 1,747,526 | 18,827 | 931,513 | 11,395 |
| Issued in Lieu of Cash Distributions | 206,798 | 2,265 | 158,554 | 1,998 |
| Redeemed1 | (803,565) | (8,745) | (600,099) | (7,419) |
| Net Increase (Decrease)—Admiral Shares | 1,150,759 | 12,347 | 489,968 | 5,974 |
| Signal Shares | | | | |
| Issued | 851,832 | 34,732 | 566,444 | 25,739 |
| Issued in Lieu of Cash Distributions | 47,416 | 1,944 | 31,742 | 1,500 |
| Redeemed1 | (405,214) | (16,626) | (289,513) | (13,351) |
| Net Increase (Decrease)—Signal Shares | 494,034 | 20,050 | 308,673 | 13,888 |
| Institutional Shares | | | | |
| Issued | 831,473 | 58,509 | 805,740 | 64,220 |
| Issued in Lieu of Cash Distributions | 88,358 | 6,253 | 60,743 | 4,947 |
| Redeemed1 | (333,612) | (23,653) | (329,659) | (26,151) |
| Net Increase (Decrease) —Institutional Shares | 586,219 | 41,109 | 536,824 | 43,016 |
| ETF Shares | | | | |
| Issued | 6,065,629 | 93,009 | 2,952,696 | 50,521 |
| Issued in Lieu of Cash Distributions | — | — | — | — |
| Redeemed1 | (822,343) | (12,800) | (1,270,170) | (23,100) |
| Net Increase (Decrease) —ETF Shares | 5,243,286 | 80,209 | 1,682,526 | 27,421 |
1 Net of redemption fees for fiscal 2013 and 2012 of $490,000 and $2,201,000, respectively (fund totals). Effective May 23, 2012, the redemption fee was eliminated.
27
REIT Index Fund
H. Certain of the fund’s investments are in companies that are considered to be affiliated companies of the fund because the fund owns more than 5% of the outstanding voting securities of the company. Transactions during the period in securities of these companies were as follows:
| | | | | |
| | | | Current Period Transactions | |
| Jan. 31, 2012 | | Proceeds From | | Jan. 31, 2013 |
| | Market | Purchases | Securities | Dividend | Market |
| | Value | at Cost | Sold | Income | Value |
| | ($000) | ($000) | ($000) | ($000) | ($000) |
| Acadia Realty Trust | 51,097 | 31,390 | 7,589 | 1,131 | 88,862 |
| Alexandria Real Estate Equities Inc. | 255,999 | 90,168 | 30,944 | 7,086 | 315,127 |
| American Campus Communities Inc. | 169,885 | 175,552 | 28,357 | 4,558 | 338,049 |
| Apartment Investment & | | | | | |
| Management Co. Class A | 169,368 | 111,291 | 25,711 | — | 274,916 |
| Ashford Hospitality Trust Inc. | NA1 | 15,605 | 3,252 | 168 | 51,967 |
| Associated Estates Realty Corp. | 39,638 | 20,482 | 4,348 | 1,875 | 55,343 |
| AvalonBay Communities Inc. | 730,160 | 409,200 | 83,204 | 11,474 | 1,008,381 |
| BioMed Realty Trust Inc. | 163,067 | 58,702 | 22,237 | 6,504 | 217,255 |
| Boston Properties Inc. | 872,582 | 325,109 | 103,216 | 20,942 | 1,099,015 |
| Brandywine Realty Trust | 82,324 | 37,693 | 11,640 | 3,575 | 126,405 |
| BRE Properties Inc. | 221,085 | 79,797 | 26,639 | 2,901 | 270,564 |
| Camden Property Trust | 286,927 | 120,953 | 30,734 | 4,873 | 401,599 |
| Campus Crest Communities Inc. | 18,730 | 12,044 | 2,097 | 174 | 32,253 |
| CapLease Inc. | 15,361 | 7,401 | 2,238 | — | 27,523 |
| CBL & Associates Properties Inc. | 139,759 | 68,158 | 18,963 | 7,973 | 224,140 |
| Cedar Realty Trust Inc. | NA1 | 6,345 | 1,485 | 358 | 23,254 |
| Chesapeake Lodging Trust | 29,717 | 22,334 | 4,623 | 1,831 | 57,111 |
| Cogdell Spencer Inc. | 11,770 | 623 | 12,394 | — | — |
| Colonial Properties Trust | 100,689 | 36,313 | 12,664 | 3,786 | 126,868 |
| Coresite Realty Corp. | 22,717 | 11,520 | 3,002 | 1,066 | 43,153 |
| Corporate Office Properties Trust | 99,468 | 48,461 | 13,697 | 2,671 | 145,959 |
| Cousins Properties Inc. | 39,291 | 14,512 | 5,274 | 706 | 57,791 |
| CubeSmart | 73,791 | 31,422 | 10,821 | 2,188 | 123,618 |
| DCT Industrial Trust Inc. | 77,573 | 39,393 | 11,584 | 1,284 | 130,337 |
| DDR Corp. | NA1 | 84,667 | 20,640 | 940 | 279,488 |
| DiamondRock Hospitality Co. | 100,713 | 50,382 | 11,412 | 2,869 | 123,227 |
| Digital Realty Trust Inc. | 401,986 | 250,725 | 50,337 | 19,253 | 573,635 |
| Douglas Emmett Inc. | 144,724 | 73,093 | 21,629 | 2,162 | 214,347 |
| Duke Realty Corp. | 193,225 | 128,826 | 22,236 | 1,547 | 335,614 |
| DuPont Fabros Technology Inc. | 90,899 | 31,721 | 10,881 | 2,500 | 103,611 |
| EastGroup Properties Inc. | 73,381 | 33,247 | 8,361 | 2,920 | 113,225 |
| Education Realty Trust Inc. | 55,041 | 36,201 | 8,502 | 994 | 82,448 |
| Entertainment Properties Trust | 118,450 | 30,973 | 10,116 | 3,368 | NA2 |
28
| | | | | |
| REIT Index Fund | | | | | |
| |
| |
| |
| |
| | | | Current Period Transactions | |
| | Jan. 31, 2012 | | Proceeds From | | Jan. 31, 2013 |
| | Market | Purchases | Securities | Dividend | Market |
| | Value | at Cost | Sold | Income | Value |
| | ($000) | ($000) | ($000) | ($000) | ($000) |
| EPR Properties | NA2 | 11,337 | 5,701 | 2,315 | 151,972 |
| Equity Lifestyle Properties Inc. | 154,795 | 54,545 | 18,936 | 3,101 | 194,671 |
| Equity Residential | 1,007,899 | 421,871 | 106,227 | 27,131 | 1,233,700 |
| Essex Property Trust Inc. | 277,977 | 118,614 | 29,654 | 7,105 | 387,732 |
| Excel Trust Inc. | 21,309 | 19,128 | 3,135 | 995 | 37,766 |
| Extra Space Storage Inc. | 134,550 | 90,995 | 23,539 | 5,241 | 287,018 |
| Federal Realty Investment Trust | 338,666 | 134,734 | 47,014 | 11,348 | 469,888 |
| FelCor Lodging Trust Inc. | 25,751 | 10,336 | 3,756 | — | 43,963 |
| First Industrial Realty Trust Inc. | 53,925 | 31,796 | 8,886 | — | 101,333 |
| First Potomac Realty Trust | 42,540 | 12,814 | 4,075 | — | 48,444 |
| Franklin Street Properties Corp. | 42,644 | 17,056 | 6,022 | 1,593 | 67,189 |
| Getty Realty Corp. | NA1 | 8,923 | 3,210 | 165 | 34,898 |
| Glimcher Realty Trust | 59,069 | 46,106 | 9,610 | 592 | 107,903 |
| HCP Inc. | 976,956 | 485,397 | 127,579 | 54,492 | 1,454,683 |
| Health Care REIT Inc. | 619,795 | 493,432 | 101,895 | 22,739 | 1,110,067 |
| Healthcare Realty Trust Inc. | 93,613 | 49,509 | 14,439 | 3,132 | 151,739 |
| Hersha Hospitality Trust Class A | 47,394 | 26,177 | 6,504 | 229 | 65,325 |
| Highwoods Properties Inc. | 136,758 | 52,528 | 14,483 | 5,835 | 189,621 |
| Home Properties Inc. | 162,439 | 63,027 | 17,978 | 6,037 | 212,371 |
| Host Hotels & Resorts Inc. | 661,904 | 232,899 | 75,959 | 13,631 | 840,039 |
| Hudson Pacific Properties Inc. | NA1 | 24,891 | 3,560 | 470 | 52,550 |
| Inland Real Estate Corp. | 43,369 | 14,821 | 5,243 | 3,226 | 56,094 |
| Investors Real Estate Trust | 34,434 | 17,652 | 3,686 | 979 | 59,445 |
| Kilroy Realty Corp. | 138,935 | 106,156 | 24,331 | 2,923 | 255,449 |
| Kimco Realty Corp. | 424,002 | 158,484 | 61,674 | 14,984 | 585,251 |
| Kite Realty Group Trust | 17,237 | 10,623 | 2,218 | 85 | 30,295 |
| LaSalle Hotel Properties | 131,385 | 61,617 | 17,432 | 3,974 | 178,179 |
| Lexington Realty Trust | 69,756 | 35,793 | 11,379 | 4,892 | 117,318 |
| Liberty Property Trust | 219,807 | 84,758 | 28,743 | 11,817 | 318,803 |
| LTC Properties Inc. | 55,337 | 20,257 | 7,426 | 2,994 | 78,514 |
| Macerich Co. | 408,910 | 154,020 | 55,433 | 6,149 | 550,468 |
| Mack-Cali Realty Corp. | 142,918 | 47,837 | 16,917 | 7,589 | 165,215 |
| Medical Properties Trust Inc. | 68,359 | 40,613 | 10,169 | 5,233 | 126,256 |
| Mid-America Apartment | | | | | |
| Communities Inc. | 135,528 | 65,447 | 17,016 | 5,729 | 186,049 |
| Monmouth Real Estate | | | | | |
| Investment Corp. Class A | NA1 | 7,740 | 1,599 | 347 | 24,302 |
29
| | | | | |
| REIT Index Fund | | | | | |
| |
| |
| |
| |
| | | | Current Period Transactions | |
| Jan. 31, 2012 | | Proceeds From | | Jan. 31, 2013 |
| | Market | Purchases | Securities | Dividend | Market |
| | Value | at Cost | Sold | Income | Value |
| | ($000) | ($000) | ($000) | ($000) | ($000) |
| National Health Investors Inc. | NA1 | 24,939 | 9,325 | 4,275 | 104,258 |
| National Retail Properties Inc. | 159,430 | 67,873 | 20,529 | 8,499 | 239,868 |
| Omega Healthcare Investors Inc. | 122,651 | 51,499 | 13,520 | 7,731 | 192,333 |
| Parkway Properties Inc. | 12,200 | 17,147 | 1,430 | — | NA3 |
| Pebblebrook Hotel Trust | 64,445 | 35,234 | 8,230 | 1,543 | 101,678 |
| Pennsylvania REIT | 37,104 | 16,385 | 5,890 | — | 67,938 |
| Piedmont Office Realty Trust Inc. | | | | | |
| Class A | 182,718 | 60,602 | 27,922 | 6,848 | 226,058 |
| Post Properties Inc. | 128,765 | 59,377 | 17,078 | 1,978 | 182,038 |
| Prologis Inc. | 830,882 | 321,637 | 119,436 | 16,542 | 1,272,712 |
| PS Business Parks Inc. | NA1 | 25,932 | 11,250 | 2,132 | 95,846 |
| Public Storage | NA1 | 415,096 | 155,329 | 40,127 | 1,554,285 |
| Ramco-Gershenson Properties Trust | 25,476 | 16,144 | 3,148 | 953 | 48,952 |
| Realty Income Corp. | 276,781 | 110,256 | 41,560 | 12,452 | 541,372 |
| Regency Centers Corp. | 212,068 | 84,152 | 32,788 | 7,366 | 310,317 |
| Retail Opportunity Investments Corp. | 32,989 | 12,684 | 3,132 | 1,037 | 46,279 |
| RLJ Lodging Trust | 97,453 | 35,606 | 13,222 | 4,246 | 138,950 |
| Sabra Health Care REIT Inc. | 29,943 | 13,669 | 4,952 | 1,844 | 64,368 |
| Simon Property Group Inc. | 2,276,966 | 963,120 | 310,119 | 75,894 | 3,364,241 |
| SL Green Realty Corp. | 358,736 | 157,623 | 49,347 | 5,648 | 501,752 |
| Sovran Self Storage Inc. | 73,570 | 35,059 | 9,931 | 3,384 | 133,031 |
| STAG Industrial Inc. | — | 54,539 | 731 | 610 | 56,540 |
| Strategic Hotels & Resorts Inc. | NA1 | 25,534 | 7,102 | — | 82,729 |
| Summit Hotel Properties Inc. | 14,567 | 26,563 | 1,853 | 395 | 40,173 |
| Sun Communities Inc. | 56,230 | 32,254 | 8,032 | 2,681 | 84,004 |
| Sunstone Hotel Investors Inc. | 62,766 | 56,136 | 9,506 | — | 127,199 |
| Tanger Factory Outlet Centers | 144,685 | 68,519 | 17,001 | 4,945 | 230,253 |
| Taubman Centers Inc. | 221,511 | 109,305 | 34,947 | 4,863 | 348,170 |
| UDR Inc. | 325,415 | 187,589 | 63,728 | 3,586 | 413,878 |
| Universal Health Realty | | | | | |
| Income Trust | 27,415 | 10,408 | 3,755 | 980 | 46,002 |
| Ventas Inc. | 958,394 | 374,479 | 124,778 | 40,608 | 1,355,759 |
30
| | | | | |
| REIT Index Fund | | | | | |
| |
| |
| |
| |
| | | | Current Period Transactions | |
| | Jan. 31, 2012 | | Proceeds From | | Jan. 31, 2013 |
| | Market | Purchases | Securities | Dividend | Market |
| | Value | at Cost | Sold | Income | Value |
| | ($000) | ($000) | ($000) | ($000) | ($000) |
| Vornado Realty Trust | 766,367 | 275,388 | 99,453 | 26,187 | 977,994 |
| Washington REIT | 112,317 | 36,752 | 13,323 | 4,389 | 130,785 |
| Weingarten Realty Investors | 159,043 | 61,765 | 23,414 | 7,698 | 230,036 |
| Whitestone REIT | — | 15,862 | 145 | 208 | 15,919 |
| Winthrop Realty Trust | 20,230 | 6,298 | 2,111 | 1,222 | 24,604 |
| | 19,388,495 | | | 661,620 | 30,389,916 |
1 Not applicable—At January 31, 2012, the issuer was not an affiliated company of the fund.
2 Not applicable—In November 2012, Entertainment Properties changed its name to EPR Properties.
3 Not applicable—At January 31, 2013, the security was still held, but the issuer was no longer an affiliated company of the fund.
I. In preparing the financial statements as of January 31, 2013, management considered the impact of subsequent events for potential recognition or disclosure in these financial statements.
31
Report of Independent Registered
Public Accounting Firm
To the Trustees of Vanguard Specialized Funds and the Shareholders of Vanguard REIT Index Fund:
In our opinion, the accompanying statement of net assets and statement of assets and liabilities and the related statements of operations and of changes in net assets and the financial highlights present fairly, in all material respects, the financial position of Vanguard REIT Index Fund (constituting a separate portfolio of Vanguard Specialized Funds, hereafter referred to as the “Fund”) at January 31, 2013, the results of its operations for the year then ended, the changes in its net assets for each of the two years in the period then ended and the financial highlights for each of the five years in the period then ended, in conformity with accounting principles generally accepted in the United States of America. These financial statements and financial highlights (hereafter referred to as “financial statements”) are the responsibility of the Fund’s management; our responsibility is to express an opinion on these financial statements based on our audits. We conducted our audits of these financial statements in accordance with the standards of the Public Company Accounting Oversight Board (United States). Those standards require that we plan and perform the audit to obtain reasonable assurance about whether the financial statements are free of material misstatement.
An audit includes examining, on a test basis, evidence supporting the amounts and disclosures in the financial statements, assessing the accounting principles used and significant estimates made by management, and evaluating the overall financial statement presentation. We believe that our audits, which included confirmation of securities at January 31, 2013 by correspondence with the custodian and broker and by agreement to the underlying ownership records of the transfer agent, provide a reasonable basis for our opinion.
PricewaterhouseCoopers LLP
Philadelphia, Pennsylvania
March 15, 2013
| |
| Special 2012 tax information (unaudited) for Vanguard REIT Index Fund |
This information for the fiscal year ended January 31, 2013, is included pursuant to provisions of the Internal Revenue Code.
The fund distributed $8,958,000 of qualified dividend income to shareholders during the fiscal year.
32
Your Fund’s After-Tax Returns
This table presents returns for your fund both before and after taxes. The after-tax returns are shown in two ways: (1) assuming that an investor owned the fund during the entire period and paid taxes on the fund’s distributions, and (2) assuming that an investor paid taxes on the fund’s distributions and sold all shares at the end of each period.
Calculations are based on the highest individual federal income tax and capital gains tax rates in effect at the times of the distributions and the hypothetical sales. State and local taxes were not considered. After-tax returns reflect any qualified dividend income, using actual prior-year figures and estimates for 2013. (In the example, returns after the sale of fund shares may be higher than those assuming no sale. This occurs when the sale would have produced a capital loss. The calculation assumes that the investor received a tax deduction for the loss.)
The table shows returns for Investor Shares only; returns for other share classes will differ. Please note that your actual after-tax returns will depend on your tax situation and may differ from those shown. Also note that if you own the fund in a tax-deferred account, such as an individual retirement account or a 401(k) plan, this information does not apply to you. Such accounts are not subject to current taxes.
Finally, keep in mind that a fund’s performance—whether before or after taxes—does not guarantee future results.
Average Annual Total Returns: REIT Index Fund Investor Shares
Periods Ended January 31, 2013
| | | |
| | One | Five | Ten |
| | Year | Years | Years |
| Returns Before Taxes | 14.45% | 6.78% | 12.28% |
| Returns After Taxes on Distributions | 13.51 | 5.57 | 10.89 |
| Returns After Taxes on Distributions and Sale of | | | |
| Fund Shares | 8.36 | 4.73 | 9.60 |
33
About Your Fund’s Expenses
As a shareholder of the fund, you incur ongoing costs, which include costs for portfolio management, administrative services, and shareholder reports (like this one), among others. Operating expenses, which are deducted from a fund’s gross income, directly reduce the investment return of the fund.
A fund’s expenses are expressed as a percentage of its average net assets. This figure is known as the expense ratio. The following examples are intended to help you understand the ongoing costs (in dollars) of investing in your fund and to compare these costs with those of other mutual funds. The examples are based on an investment of $1,000 made at the beginning of the period shown and held for the entire period.
The accompanying table illustrates your fund’s costs in two ways:
• Based on actual fund return. This section helps you to estimate the actual expenses that you paid over the period. The ”Ending Account Value“ shown is derived from the fund‘s actual return, and the third column shows the dollar amount that would have been paid by an investor who started with $1,000 in the fund. You may use the information here, together with the amount you invested, to estimate the expenses that you paid over the period.
To do so, simply divide your account value by $1,000 (for example, an $8,600 account value divided by $1,000 = 8.6), then multiply the result by the number given for your fund under the heading ”Expenses Paid During Period.“
• Based on hypothetical 5% yearly return. This section is intended to help you compare your fund‘s costs with those of other mutual funds. It assumes that the fund had a yearly return of 5% before expenses, but that the expense ratio is unchanged. In this case—because the return used is not the fund’s actual return—the results do not apply to your investment. The example is useful in making comparisons because the Securities and Exchange Commission requires all mutual funds to calculate expenses based on a 5% return. You can assess your fund’s costs by comparing this hypothetical example with the hypothetical examples that appear in shareholder reports of other funds.
Note that the expenses shown in the table are meant to highlight and help you compare ongoing costs only and do not reflect transaction costs incurred by the fund for buying and selling securities. Further, the expenses do not include any purchase, redemption, or account service fees described in the fund prospectus. If such fees were applied to your account, your costs would be higher. Your fund does not carry a “sales load.”
The calculations assume no shares were bought or sold during the period. Your actual costs may have been higher or lower, depending on the amount of your investment and the timing of any purchases or redemptions.
You can find more information about the fund’s expenses, including annual expense ratios, in the Financial Statements section of this report. For additional information on operating expenses and other shareholder costs, please refer to your fund’s current prospectus.
34
| | | |
| Six Months Ended January 31, 2013 | | | |
| | Beginning | Ending | Expenses |
| | Account Value | Account Value | Paid During |
| REIT Index Fund | 7/31/2012 | 1/31/2013 | Period |
| Based on Actual Fund Return | | | |
| Investor Shares | $1,000.00 | $1,041.55 | $1.23 |
| Admiral Shares | 1,000.00 | 1,042.32 | 0.51 |
| Signal Shares | 1,000.00 | 1,042.39 | 0.51 |
| Institutional Shares | 1,000.00 | 1,042.59 | 0.41 |
| ETF Shares | 1,000.00 | 1,042.37 | 0.51 |
| Based on Hypothetical 5% Yearly Return | | | |
| Investor Shares | $1,000.00 | $1,024.00 | $1.22 |
| Admiral Shares | 1,000.00 | 1,024.70 | 0.51 |
| Signal Shares | 1,000.00 | 1,024.70 | 0.51 |
| Institutional Shares | 1,000.00 | 1,024.80 | 0.41 |
| ETF Shares | 1,000.00 | 1,024.70 | 0.51 |
The calculations are based on expenses incurred in the most recent six-month period. The fund’s annualized six-month expense ratios for that period are 0.24% for Investor Shares, 0.10% for Admiral Shares, 0.10% for Signal Shares, 0.08% for Institutional Shares, and 0.10% for ETF Shares. The dollar amounts shown as “Expenses Paid” are equal to the annualized expense ratio multiplied by the average account value over the period, multiplied by the number of days in the most recent six-month period, then divided by the number of days in the most recent 12-month period.
35
Glossary
Beta. A measure of the magnitude of a fund’s past share-price fluctuations in relation to the ups and downs of a given market index. The index is assigned a beta of 1.00. Compared with a given index, a fund with a beta of 1.20 typically would have seen its share price rise or fall by 12% when the index rose or fell by 10%. For this report, beta is based on returns over the past 36 months for both the fund and the index. Note that a fund’s beta should be reviewed in conjunction with its R-squared (see definition). The lower the R-squared, the less correlation there is between the fund and the index, and the less reliable beta is as an indicator of volatility.
Dividend Yield. Dividend income earned by stocks, expressed as a percentage of the aggregate market value (or of net asset value, for a fund). The yield is determined by dividing the amount of the annual dividends by the aggregate value (or net asset value) at the end of the period. For a fund, the dividend yield is based solely on stock holdings and does not include any income produced by other investments. This yield may include some payments that represent a return of capital, capital gains distributions, or both by the underlying stocks.
Earnings Growth Rate. The average annual rate of growth in earnings over the past five years for the stocks now in a fund.
Expense Ratio. A fund’s total annual operating expenses expressed as a percentage of the fund’s average net assets. The expense ratio includes management and administrative expenses, but does not include the transaction costs of buying and selling portfolio securities.
Foreign Holdings. The percentage of a fund represented by securities or depositary receipts of companies based outside the United States.
Inception Date. The date on which the assets of a fund (or one of its share classes) are first invested in accordance with the fund’s investment objective. For funds with a subscription period, the inception date is the day after that period ends. Investment performance is measured from the inception date.
Median Market Cap. An indicator of the size of companies in which a fund invests; the midpoint of market capitalization (market price x shares outstanding) of a fund’s stocks, weighted by the proportion of the fund’s assets invested in each stock. Stocks representing half of the fund’s assets have market capitalizations above the median, and the rest are below it.
Price/Book Ratio. The share price of a stock divided by its net worth, or book value, per share. For a fund, the weighted average price/book ratio of the stocks it holds.
Price/Earnings Ratio. The ratio of a stock’s current price to its per-share earnings over the past year. For a fund, the weighted average P/E of the stocks it holds. P/E is an indicator of market expectations about corporate prospects; the higher the P/E, the greater the expectations for a company’s future growth.
R-Squared. A measure of how much of a fund’s past returns can be explained by the returns from the market in general, as measured by a given index. If a fund’s total returns were precisely synchronized with an index’s returns, its R-squared would be 1.00. If the fund’s returns bore no relationship to the index’s returns, its R-squared would be 0. For this report, R-squared is based on returns over the past 36 months for both the fund and the index.
36
Return on Equity. The annual average rate of return generated by a company during the past five years for each dollar of shareholder’s equity (net income divided by shareholder’s equity). For a fund, the weighted average return on equity for the companies whose stocks it holds.
Short-Term Reserves. The percentage of a fund invested in highly liquid, short-term securities that can be readily converted to cash.
Turnover Rate. An indication of the fund’s trading activity. Funds with high turnover rates incur higher transaction costs and may be more likely to distribute capital gains (which may be taxable to investors). The turnover rate excludes in-kind transactions, which have minimal impact on costs.
Benchmark Information
REIT Spliced Index: MSCI US REIT Index adjusted to include a 2% cash position (Lipper Money Market Average) through April 30, 2009; MSCI US REIT Index thereafter.
37
This page intentionally left blank.
This page intentionally left blank.
The People Who Govern Your Fund
The trustees of your mutual fund are there to see that the fund is operated and managed in your best interests since, as a shareholder, you are a part owner of the fund. Your fund’s trustees also serve on the board of directors of The Vanguard Group, Inc., which is owned by the Vanguard funds and provides services to them on an at-cost basis.
A majority of Vanguard’s board members are independent, meaning that they have no affiliation with Vanguard or the funds they oversee, apart from the sizable personal investments they have made as private individuals. The independent board members have distinguished backgrounds in business, academia, and public service. Each of the trustees and executive officers oversees 180 Vanguard funds.
The following table provides information for each trustee and executive officer of the fund. More information about the trustees is in the Statement of Additional Information, which can be obtained, without charge, by contacting Vanguard at 800-662-7447, or online at vanguard.com.
| |
| InterestedTrustee1 | and Delphi Automotive LLP (automotive components); |
| | Senior Advisor at New Mountain Capital; Trustee of |
| F. William McNabb III | The Conference Board. |
| Born 1957. Trustee Since July 2009. Chairman of the | |
| Board. Principal Occupation(s) During the Past Five | Amy Gutmann |
| Years: Chairman of the Board of The Vanguard Group, | Born 1949. Trustee Since June 2006. Principal |
| Inc., and of each of the investment companies served | Occupation(s) During the Past Five Years: President |
| by The Vanguard Group, since January 2010; Director | of the University of Pennsylvania; Christopher H. |
| of The Vanguard Group since 2008; Chief Executive | Browne Distinguished Professor of Political Science |
| Officer and President of The Vanguard Group and of | in the School of Arts and Sciences with secondary |
| each of the investment companies served by The | appointments at the Annenberg School for |
| Vanguard Group since 2008; Director of Vanguard | Communication and the Graduate School of Education |
| Marketing Corporation; Managing Director of The | of the University of Pennsylvania; Member of the |
| Vanguard Group (1995–2008). | National Commission on the Humanities and Social |
| | Sciences; Trustee of Carnegie Corporation of New |
| IndependentTrustees | York and of the National Constitution Center; Chair |
| | of the U. S. Presidential Commission for the Study |
| Emerson U. Fullwood | of Bioethical Issues. |
| Born 1948. Trustee Since January 2008. Principal | |
| Occupation(s) During the Past Five Years: Executive | JoAnn Heffernan Heisen |
| Chief Staff and Marketing Officer for North America | Born 1950. Trustee Since July 1998. Principal |
| and Corporate Vice President (retired 2008) of Xerox | Occupation(s) During the Past Five Years: Corporate |
| Corporation (document management products and | Vice President and Chief Global Diversity Officer |
| services); Executive in Residence and 2010 | (retired 2008) and Member of the Executive |
| Distinguished Minett Professor at the Rochester | Committee (1997–2008) of Johnson & Johnson |
| Institute of Technology; Director of SPX Corporation | (pharmaceuticals/medical devices/consumer |
| (multi-industry manufacturing), the United Way of | products); Director of Skytop Lodge Corporation |
| Rochester, Amerigroup Corporation (managed health | (hotels), the University Medical Center at Princeton, |
| care), the University of Rochester Medical Center, | the Robert Wood Johnson Foundation, and the Center |
| Monroe Community College Foundation, and North | for Talent Innovation; Member of the Advisory Board |
| Carolina A&T University. | of the Maxwell School of Citizenship and Public Affairs |
| at Syracuse University. |
| Rajiv L. Gupta | |
| Born 1945. Trustee Since December 2001.2 | F. Joseph Loughrey |
| Principal Occupation(s) During the Past Five Years: | Born 1949. Trustee Since October 2009. Principal |
| Chairman and Chief Executive Officer (retired 2009) | Occupation(s) During the Past Five Years: President |
| and President (2006–2008) of Rohm and Haas Co. | and Chief Operating Officer (retired 2009) of Cummins |
| (chemicals); Director of Tyco International, Ltd. | Inc. (industrial machinery); Director of SKF AB |
| (diversified manufacturing and services), Hewlett- | (industrial machinery), Hillenbrand, Inc. (specialized |
| Packard Co. (electronic computer manufacturing), | consumer services), the Lumina Foundation for |
| |
| | |
| Education, and Oxfam America; Chairman of the | Executive Officers | |
| Advisory Council for the College of Arts and Letters | | |
| and Member of the Advisory Board to the Kellogg | Glenn Booraem | |
| Institute for International Studies at the University | Born 1967. Controller Since July 2010. Principal |
| of Notre Dame. | Occupation(s) During the Past Five Years: Principal |
| | of The Vanguard Group, Inc.; Controller of each of |
| Mark Loughridge | the investment companies served by The Vanguard |
| Born 1953. Trustee Since March 2012. Principal | Group; Assistant Controller of each of the investment |
| Occupation(s) During the Past Five Years: Senior Vice | companies served by The Vanguard Group (2001–2010). |
| President and Chief Financial Officer at IBM (information | | |
| technology services); Fiduciary Member of IBM’s | Thomas J. Higgins | |
| Retirement Plan Committee. | Born 1957. Chief Financial Officer Since September |
| | 2008. Principal Occupation(s) During the Past Five |
| Scott C. Malpass | Years: Principal of The Vanguard Group, Inc.; Chief |
| Born 1962. Trustee Since March 2012. Principal | Financial Officer of each of the investment companies |
| Occupation(s) During the Past Five Years: Chief | served by The Vanguard Group; Treasurer of each of |
| Investment Officer and Vice President at the University | the investment companies served by The Vanguard |
| of Notre Dame; Assistant Professor of Finance at the | Group (1998–2008). | |
| Mendoza College of Business at Notre Dame; Member | | |
| of the Notre Dame 403(b) Investment Committee; | Kathryn J. Hyatt | |
| Director of TIFF Advisory Services, Inc. (investment | Born 1955. Treasurer Since November 2008. Principal |
| advisor); Member of the Investment Advisory | Occupation(s) During the Past Five Years: Principal of |
| Committees of the Financial Industry Regulatory | The Vanguard Group, Inc.; Treasurer of each of the |
| Authority (FINRA) and of Major League Baseball. | investment companies served by The Vanguard |
| | Group; Assistant Treasurer of each of the investment |
| André F. Perold | companies served by The Vanguard Group (1988–2008). |
| Born 1952. Trustee Since December 2004. Principal | | |
| Occupation(s) During the Past Five Years: George | Heidi Stam | |
| Gund Professor of Finance and Banking at the Harvard | Born 1956. Secretary Since July 2005. Principal |
| Business School (retired 2011); Chief Investment | Occupation(s) During the Past Five Years: Managing |
| Officer and Managing Partner of HighVista Strategies | Director of The Vanguard Group, Inc.; General Counsel |
| LLC (private investment firm); Director of Rand | of The Vanguard Group; Secretary of The Vanguard |
| Merchant Bank; Overseer of the Museum of Fine | Group and of each of the investment companies |
| Arts Boston. | served by The Vanguard Group; Director and Senior |
| | Vice President of Vanguard Marketing Corporation. |
| Alfred M. Rankin, Jr. | | |
| Born 1941. Trustee Since January 1993. Principal | Vanguard Senior ManagementTeam | |
| Occupation(s) During the Past Five Years: Chairman, | | |
| President, and Chief Executive Officer of NACCO | Mortimer J. Buckley | Chris D. McIsaac |
| Industries, Inc. (housewares/lignite) and of Hyster-Yale | Kathleen C. Gubanich | Michael S. Miller |
| Materials Handling, Inc. (forklift trucks); Director of | Paul A. Heller | James M. Norris |
| the National Association of Manufacturers; Chairman | Martha G. King | Glenn W. Reed |
| of the Board of University Hospitals of Cleveland; | | |
| Advisory Chairman of the Board of The Cleveland | Chairman Emeritus and Senior Advisor | |
| Museum of Art. | | |
| | John J. Brennan | |
| Peter F. Volanakis | Chairman, 1996–2009 | |
| Born 1955. Trustee Since July 2009. Principal | Chief Executive Officer and President, 1996–2008 | |
| Occupation(s) During the Past Five Years: President | | |
| and Chief Operating Officer (retired 2010) of Corning | Founder | |
| Incorporated (communications equipment); Director | | |
| of SPX Corporation (multi-industry manufacturing); | John C. Bogle | |
| Overseer of the Amos Tuck School of Business | Chairman and Chief Executive Officer, 1974–1996 | |
| Administration at Dartmouth College; Advisor to the | | |
| Norris Cotton Cancer Center. | | |
1 Mr. McNabb is considered an “interested person,” as defined in the Investment Company Act of 1940, because he is an officer of the Vanguard funds.
2 December 2002 for Vanguard Equity Income Fund, Vanguard Growth Equity Fund, the Vanguard Municipal Bond Funds, and the Vanguard State Tax-Exempt Funds.
|  |
| P.O. Box 2600 |
| Valley Forge, PA 19482-2600 |
Connect with Vanguard® > vanguard.com
| |
| Fund Information > 800-662-7447 | The funds or securities referred to herein are not |
| Direct Investor Account Services > 800-662-2739 | sponsored, endorsed, or promoted by MSCI, and MSCI |
| | bears no liability with respect to any such funds or |
| Institutional Investor Services > 800-523-1036 | securities. The prospectus or the Statement of |
| Text Telephone for People | Additional Information contains a more detailed |
| With Hearing Impairment > 800-749-7273 | description of the limited relationship MSCI has with |
| | Vanguard and any related funds. |
| This material may be used in conjunction | |
| with the offering of shares of any Vanguard | |
| fund only if preceded or accompanied by | |
| the fund’s current prospectus. | |
| |
| All comparative mutual fund data are from Lipper Inc. or | |
| Morningstar, Inc., unless otherwise noted. | |
| |
| You can obtain a free copy of Vanguard’s proxy voting | |
| guidelines by visiting vanguard.com/proxyreporting or by | |
| calling Vanguard at 800-662-2739. The guidelines are | |
| also available from the SEC’s website, sec.gov. In | |
| addition, you may obtain a free report on how your fund | |
| voted the proxies for securities it owned during the 12 | |
| months ended June 30. To get the report, visit either | |
| vanguard.com/proxyreporting or sec.gov. | |
| |
| You can review and copy information about your fund at | |
| the SEC’s Public Reference Room in Washington, D.C. To | |
| find out more about this public service, call the SEC at | |
| 202-551-8090. Information about your fund is also | |
| available on the SEC’s website, and you can receive | |
| copies of this information, for a fee, by sending a | |
| request in either of two ways: via e-mail addressed to | |
| publicinfo@sec.gov or via regular mail addressed to the | |
| Public Reference Section, Securities and Exchange | |
| Commission, Washington, DC 20549-1520. | |
| |
| |
| | © 2013 The Vanguard Group, Inc. |
| | All rights reserved. |
| | Vanguard Marketing Corporation, Distributor. |
| |
| | Q1230 032013 |
| | 
|
| Annual Report | | January 31, 2013 | |
| Vanguard Dividend Growth Fund |
|
 |
> Vanguard Dividend Growth Fund returned about 13% for the fiscal year ended January 31, 2013, lagging the result for its benchmark index and the average return of peer funds.
> The broad U.S. stock market returned nearly 17% as the economy grew modestly and the Federal Reserve extended its stimulus efforts.
> Holdings in the energy sector detracted the most from the fund’s performance relative to the benchmark.
| |
| Contents | |
| Your Fund’s Total Returns. | 1 |
| Chairman’s Letter. | 2 |
| Advisor’s Report. | 8 |
| Fund Profile. | 10 |
| Performance Summary. | 11 |
| Financial Statements. | 13 |
| Your Fund’s After-Tax Returns. | 22 |
| About Your Fund’s Expenses. | 23 |
| Trustees Approve Advisory Agreement. | 25 |
| Glossary. | 26 |
Please note: The opinions expressed in this report are just that—informed opinions. They should not be considered promises or advice.
Also, please keep in mind that the information and opinions cover the period through the date on the front of this report. Of course, the risks of investing in your fund are spelled out in the prospectus.
See the Glossary for definitions of investment terms used in this report.
About the cover: Our cover photograph shows rigging on the HMSSurprise, a replica of an 18th-century Royal Navy frigate. It was featured in the 2003 movie Master and Commander: The Far Side of the World, which was based on Patrick O’Brian’s sea novels, set amid the Napoleonic Wars. Vanguard was named for another ship of that era, the HMSVanguard, which was the flagship of British Admiral Horatio Nelson at the Battle of the Nile.
| |
| Your Fund’s Total Returns | |
| |
| |
| |
| |
| Fiscal Year Ended January 31, 2013 | |
| |
| | Total |
| | Returns |
| Vanguard Dividend Growth Fund | 13.36% |
| Dividend Achievers Select Index | 15.34 |
| Large-Cap Core Funds Average | 15.47 |
| Large-Cap Core Funds Average: Derived from data provided by Lipper Inc | |
Your Fund’s Performance at a Glance
January 31, 2012, Through January 31, 2013
| | | | |
| | | | Distributions Per Share |
| | Starting | Ending | | |
| | Share | Share | Income | Capital |
| | Price | Price | Dividends | Gains |
| Vanguard Dividend Growth Fund | $15.81 | $17.52 | $0.368 | $0.000 |
1

Chairman’s Letter
Dear Shareholder,
Stocks of companies with growing dividends provided solid returns over the past 12 months. However, they weren’t always the first choice for investors, who seemed more open to risk as the economy showed signs of progress—albeit uneven—and the broad market advanced strongly.
The Dividend Growth Fund, which focuses on large, high-quality companies with a history of increasing dividends, had much less exposure to the surging financial sector than the broader market did. Its performance was further restrained by certain energy holdings.
For the fiscal year ended January 31, 2013, the fund returned about 13%, trailing its benchmark, the Dividend Achievers Select Index, and its large-capitalization core fund peers.
The fund’s 30-day SEC yield rose from 2.19% at the beginning of the fiscal year to 2.24% at the end. Its dividend distributions increased from about 31 cents per share to nearly 37 cents. More than 95% of the fund’s holdings at year-end had higher dividends than they did 12 months earlier.
Led by European shares, stocks saw double-digit returns
Global stock markets rose sharply in the 12 months ended January 31, with European equities delivering the most robust results. Investors seemed buoyed by progress in addressing fiscal challenges in Europe and elsewhere.
2
European stocks gained about 20% even as economic woes persisted for many countries in the region. This disparity is less unusual than it may appear. Vanguard research has found that the relationship between a country’s economic growth and its stock market returns has typically been weak over time.
In the United States, attention to federal budget challenges intensified as 2012 drew to a close. The focus on the “fiscal cliff” led to investor anxiety before policymakers reached a limited tax-rate agreement on the cusp of the new year. Although a credible long-term deficit-reduction strategy had yet to be crafted, investors propelled U.S. stocks to a gain of nearly 17% for the fund’s fiscal year.
Bonds’ advance slowed; challenges may lie ahead
The broad U.S. taxable bond market returned a little more than 2.5% for the fiscal year. That modest result contrasts with the strong returns to which bond investors may have grown accustomed.
Bonds have been in a long-running bull market, as prices climbed and yields tumbled over many years. (Bond prices and yields move in opposite directions.) The yield of the 10-year U.S. Treasury note slipped to a record low in July, closing below 1.5%. Recently, however, that trend reversed, and the 10-year yield broke 2% in late January.
| | | |
| Market Barometer | | | |
| |
| | | Average Annual Total Returns |
| | | Periods Ended January 31, 2013 |
| | One | Three | Five |
| | Year | Years | Years |
| Stocks | | | |
| Russell 1000 Index (Large-caps) | 17.03% | 14.48% | 4.28% |
| Russell 2000 Index (Small-caps) | 15.47 | 15.98 | 6.31 |
| Russell 3000 Index (Broad U.S. market) | 16.90 | 14.60 | 4.44 |
| MSCI All Country World Index ex USA (International) | 13.86 | 7.03 | -0.10 |
| |
| Bonds | | | |
| Barclays U.S. Aggregate Bond Index (Broad taxable market) | 2.59% | 5.41% | 5.45% |
| Barclays Municipal Bond Index (Broad tax-exempt market) | 4.80 | 6.53 | 5.73 |
| Citigroup Three-Month U.S. Treasury Bill Index | 0.08 | 0.09 | 0.38 |
| |
| CPI | | | |
| Consumer Price Index | 1.59% | 2.05% | 1.76% |
3
Bonds can provide critical diversification benefits to a portfolio, but their return prospects look much less promising than they have in recent years. As yields have dropped, the opportunity for price appreciation has greatly diminished.
(You can read more about our expectations for bond and stock returns in Vanguard’s Economic and Investment Outlook, available at vanguard.com/research.)
As for money market funds and savings accounts, their returns barely budged as the Federal Reserve held short-term interest rates between 0% and 0.25%, a policy in place since late 2008.
Companies’ payouts were strong, especially late in calendar 2012
Dividend payments remained on the upswing over the 12 months as U.S. corporations channeled rising earnings back to shareholders in recurring and special distributions. The Dividend Growth Fund, despite trailing the large-cap core pack in returns over the last 12 months, has benefited from this environment over the past few years.
In the final months of calendar 2012, many companies issued special payouts, anticipating that tax rates on dividends would go up. Special dividends late in the year, in fact, were almost double their average level since 2005. Ultimately, the tax rate on qualified dividends was raised
Expense Ratios
Your Fund Compared With Its Peer Group
| | |
| | | Peer Group |
| | Fund | Average |
| Dividend Growth Fund | 0.31% | 1.15% |
The fund expense ratio shown is from the prospectus dated May 29, 2012, and represents estimated costs for the current fiscal year. For the fiscal year ended January 31, 2013, the fund’s expense ratio was 0.29%. The peer-group expense ratio is derived from data provided by Lipper Inc. and captures information through year-end 2012.
Peer group: Large-Cap Core Funds.
4
from 15% to 20% only for people earning more than $400,000 a year (or $450,000 if married).
The fund came up short as energy selections lagged
Seven of the fund’s nine industry sectors posted double-digit returns, and all nine had gains, but the advisor’s energy choices weighed on performance. The fund’s energy selections returned less than 1%, compared with about 13% for their benchmark counterparts.
The trouble was that two integrated oil and gas companies overestimated oil-field production and paid for the missteps with declining stock prices. Some of the advisor’s other energy choices helped alleviate the shortfall, but the fund’s energy holdings overall were restrained by weak demand and by deflated oil and gas prices amid a glut of natural gas. The fund’s information technology and materials sectors also underperformed because of subpar stock selection.
The fund’s top performer was the consumer discretionary sector, its second-largest by market allocation. Media companies, primarily movie and entertainment powerhouses and cable corporations, thrived as advertising and subscription revenue increased thanks to the improved economy. The health care sector was also productive for Dividend Growth as several pharmaceutical giants benefited from streamlined operations, diversification of business lines, and improved pipelines of new medicines.
Total Returns
Ten Years Ended January 31, 2013
| |
| | Average |
| | Annual Return |
| Dividend Growth Fund | 9.80% |
| Dividend Growth Spliced Index | 8.20 |
| Dividend Growth Spliced Average | 6.48 |
For a benchmark description, see the Glossary.
Dividend Growth Spliced Average: Derived from data provided by Lipper Inc.
The figures shown represent past performance, which is not a guarantee of future results. (Current performance may be lower or higher than the performance data cited. For performance data current to the most recent month-end, visit our website at vanguard.com/performance.) Note, too, that both investment returns and principal value can fluctuate widely, so an investor’s shares, when sold, could be worth more or less than their original cost.
5
While returns for the fund’s financial holdings were not significantly shy of the benchmark’s, both Dividend Growth and its benchmark had less exposure to this robustly performing sector than the broader market. This difference is a legacy of the 2008–2009 financial crisis, when some of the sector’s strongest dividend-payers were forced to abandon their distributions. The episode raised doubts about the sector’s dividend-paying power.
Over ten years, the fund remained squarely ahead of its standards
Although the Dividend Growth Fund has trailed its benchmark index and its peer group in three of the last four years, evaluating performance over longer periods can provide more insight into the advisor’s degree of success. Indeed, the fund outperformed both of those comparative standards over the past decade. For the ten years ended January 31, 2013, the fund recorded an average annual return of 9.80%, appreciably ahead of both its benchmark’s 8.20% average return and the 6.48% average return of its peers.
Wellington Management Company, llp, the fund’s advisor, has built its reputation on the expertise of its investment professionals and the sophistication and patience of its investment process. Wellington’s approach is backed by Vanguard’s low costs, which allow you to keep more of the fund’s returns.
Following four principles can help investors succeed
Our clients often ask what they should do to cope with uncertainties in the market. How should they react? Should they do something different with their money?
The first point to keep in mind is that investing has always involved uncertainties. The financier J.P. Morgan, when asked what he thought the stock market would do, had a standard response: “It will fluctuate.”
In our view, the most sensible approach is to focus on what’s within your control. In short, we believe investors can give themselves a greater chance for success by acting on four key points:
• Goals. What are you investing for? Each goal should be measurable and attainable. Getting there shouldn’t depend on outsize returns, or on impractical budgeting requirements.
• Balance. After identifying your goals, pursue them through a balanced asset allocation using broadly diversified funds.
• Cost. You won’t be surprised to hear that we place a big emphasis on controlling cost. The lower your costs, the greater the share of an investment’s return that you keep.
• Discipline. All the rest depends on this: In the face of market turmoil, discipline and long-term perspective can help you stay on track toward your goals.
6
Successful investing doesn’t have to be complicated, but that’s not to say it’s easy. Investing can provoke strong emotions, and it’s hard to stay levelheaded during times of volatility. If you’re getting pulled off course, try to redirect your attention to the principles I’ve outlined. These principles—which reflect the core philosophy Vanguard has held for decades—can be the answer to uncertainty.
As always, thank you for investing with Vanguard.
Sincerely,

F. William McNabb III
Chairman and Chief Executive Officer
February 15, 2013
7
Advisor’s Report
Vanguard Dividend Growth Fund returned 13.36% for the 12 months ended January 31, 2013, trailing the 15.34% gain of the benchmark Dividend Achievers Select Index.
The investment environment
The investment environment continues to be defined by uncertainty. But the U.S. equity markets seem comfortable with that, given their strong recent performance. As we look behind the numbers, however, it’s clear to us that large global corporations are increasingly concerned about the business environment.
A recent poll of U.S. chief financial officers offered some interesting insights. The officers believe that their companies’ earnings growth will strengthen in the next 12 months; nonetheless, they are tightening their purse strings. Capital, technology, and research spending are all set to decelerate in 2013. Employment growth is likely to grind to a standstill. Dollars spent on marketing and share repurchases will slow, as will productivity gains. This slowdown in business spending reflects uncertainty in the executive offices of America’s biggest companies.
With that as a backdrop, the risks and imbalances we have discussed in previous letters keep building, which, in our view, makes for a very tricky investment environment.
The fund’s successes
All sectors contributed positively to the fund’s absolute performance during the fiscal year, with holdings in the consumer staples, health care, and consumer discretionary sectors helping the most. Stock selection in those sectors was also the strongest relative to the benchmark. Target, Walt Disney, and Amgen were among the portfolio’s top absolute contributors.
On a “run-rate” basis, the portfolio is expected to produce asset-weighted dividend growth of 1.1% for calendar 2013. The 2012 figure was roughly 28.3%. Our run-rate calculation is a rough estimate of potential dividend growth; it simply takes a company’s declared dividend rate, annualizes it, and compares it with the previous calendar year’s actual dividend rate. This calculation does not accurately reflect dividend increases that may be announced later in the year, nor does it factor in the dollar size of the increases. Therefore, companies in the early stages of dividend growth tend to show large percentage increases, yet the absolute cash dividend may be small. Despite these shortcomings, we view this estimate as a reasonable report card.
The 1.1% we expect for 2013 is likely to be lower than actual results, but there will still be a major deceleration from 2012. Many companies in the fund accelerated their planned 2013 dividend payments into 2012 to try to protect shareholders from the higher dividend tax rates that were anticipated for this year. Oracle, for example, moved up its second-, third-, and fourth-quarter 2013 payments to December 2012. As a result, its dividends grew more than 80% in 2012 and are likely to decline by 40% or more in 2013.
8
Among the more notable dividend run-rate increases thus far in 2013 were those of CVS Caremark (38.5%) and Amgen (30.6%).
The fund’s shortfalls
The fund’s holdings in the materials and energy sectors failed to produce positive returns relative to our benchmark during the fiscal year, though they did boost absolute performance. Energy holdings Occidental Petroleum and BG Holdings detracted significantly from performance, but perhaps the most noteworthy detractor was Western Union, in information technology.
Although we would prefer that all stocks in the fund always perform well, it is inevitable that some will not over a given period. We assess a stock’s contribution to performance over a longer time period and with an eye consistently focused on dividend action. Through that lens, we concluded that Western Union was no longer a suitable investment for the fund, and we sold it.
The fund’s positioning and investment strategy
Our primary objective is to identify companies that we believe will steadily and reliably grow their dividend payments. We seek to fulfill this objective by carefully building the portfolio one stock at a time, giving central consideration to each company’s dividend growth prospects. Our industry and sector weightings are an output of this process. At the fiscal year-end, the fund had significant positions in health care, consumer discretionary, technology, energy, and industrials and was less exposed to utilities, telecommunication services, and materials.
Much of our time and energy in calendar 2012 was spent preparing the fund for a potential change in federal tax rates on dividends. We considered many potential outcomes and tested many scenarios. The government’s ultimate decision to raise rates from 15% to 20% for higher-income taxpayers proved relatively benign. Our exercise, however, was very useful. No matter how severe the scenario (the highest one implied a 43.6% tax rate on dividends), we kept concluding there was no need to change how we managed the fund. The process reinforced the virtue of an investment strategy focused on long-term dividend growth. We will maintain that path.
Donald J. Kilbride
Senior Vice President and Equity Portfolio Manager
Wellington Management Company, LLP
February 12, 2013
9
Dividend Growth Fund
Fund Profile
As of January 31, 2013
| | | |
| Portfolio Characteristics | | |
| | | | DJ U.S. |
| | | Dividend | Total |
| | | Achievers | Market |
| | | Select | FA |
| | Fund | Index | Index |
| Number of Stocks | 50 | 147 | 3,595 |
| Median Market Cap | $60.4B | $51.2B | $37.6B |
| Price/Earnings Ratio | 16.1x | 15.3x | 17.2x |
| Price/Book Ratio | 2.8x | 2.9x | 2.2x |
| Return on Equity | 21.8% | 23.0% | 16.8% |
| Earnings Growth Rate | 8.0% | 8.0% | 9.1% |
| Dividend Yield | 2.6% | 2.2% | 2.0% |
| Foreign Holdings | 8.0% | 0.0% | 0.0% |
| Turnover Rate | 11% | — | — |
| Ticker Symbol | VDIGX | — | — |
| Expense Ratio1 | 0.31% | — | — |
| 30-Day SEC Yield | 2.24% | — | — |
| Short-Term Reserves | 4.5% | — | — |
| | | |
| Sector Diversification (% of equity exposure) |
| | | | DJ U.S. |
| | | Dividend | Total |
| | | Achievers | Market |
| | | Select | FA |
| | Fund | Index | Index |
| Consumer Discretionary 16.0% | 12.6% | 12.2% |
| Consumer Staples | 12.8 | 23.0 | 9.3 |
| Energy | 12.2 | 13.0 | 10.4 |
| Financials | 10.6 | 7.6 | 17.2 |
| Health Care | 18.8 | 8.4 | 11.9 |
| Industrials | 13.9 | 19.3 | 11.2 |
| Information Technology 10.9 | 6.4 | 17.7 |
| Materials | 3.3 | 8.4 | 4.0 |
| Telecommunication | | | |
| Services | 0.0 | 0.1 | 2.6 |
| Utilities | 1.5 | 1.2 | 3.5 |
| | |
| Volatility Measures | | |
| | | DJ U.S. |
| | Dividend | Total |
| | Achievers | Market |
| | Select | FA |
| | Index | Index |
| R-Squared | 0.96 | 0.94 |
| Beta | 0.92 | 0.75 |
These measures show the degree and timing of the fund’s fluctuations compared with the indexes over 36 months.
| | |
| Ten Largest Holdings (% of total net assets) |
| Johnson & Johnson | Pharmaceuticals | 3.7% |
| Occidental Petroleum | | |
| Corp. | Integrated Oil & Gas | 3.3 |
| PepsiCo Inc. | Soft Drinks | 3.1 |
| Exxon Mobil Corp. | Integrated Oil & Gas | 2.8 |
| Roche Holding AG | Pharmaceuticals | 2.6 |
| Target Corp. | General Merchandise | |
| | Stores | 2.6 |
| Medtronic Inc. | Health Care | |
| | Equipment | 2.6 |
| Procter & Gamble Co. | Household Products | 2.6 |
| McDonald's Corp. | Restaurants | 2.4 |
| United Parcel Service | Air Freight & | |
| Inc. | Logistics | 2.4 |
| Top Ten | | 28.1% |
The holdings listed exclude any temporary cash investments and equity index products.
Investment Focus
1 The expense ratio shown is from the prospectus dated May 29, 2012, and represents estimated costs for the current fiscal year. For the fiscal year ended January 31, 2013, the expense ratio was 0.29%.
10
Dividend Growth Fund
Performance Summary
All of the returns in this report represent past performance, which is not a guarantee of future results that may be achieved by the fund. (Current performance may be lower or higher than the performance data cited. For performance data current to the most recent month-end, visit our website at vanguard.com/performance.) Note, too, that both investment returns and principal value can fluctuate widely, so an investor’s shares, when sold, could be worth more or less than their original cost. The returns shown do not reflect taxes that a shareholder would pay on fund distributions or on the sale of fund shares.
Cumulative Performance: January 31, 2003, Through January 31, 2013
Initial Investment of $10,000
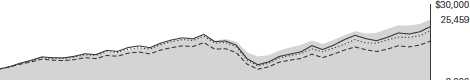
| | | | |
| | | Average Annual Total Returns | |
| | Periods Ended January 31, 2013 | |
| | | | | Final Value |
| | One | Five | Ten | of a $10,000 |
| | Year | Years | Years | Investment |
| Dividend Growth Fund | 13.36% | 6.31% | 9.80% | $25,459 |
| Dividend Growth Spliced Index | 15.34 | 3.97 | 8.20 | 21,983 |
| Dividend Growth Spliced Average | 15.47 | 2.92 | 6.48 | 18,738 |
| Dow Jones U.S. Total Stock Market | | | | |
| Float Adjusted Index | 16.88 | 4.61 | 8.80 | 23,250 |
For a benchmark description, see the Glossary.
Dividend Growth Spliced Average: Derived from data provided by Lipper Inc.
See Financial Highlights for dividend and capital gains information.
11
Dividend Growth Fund
Fiscal-Year Total Returns (%): January 31, 2003, Through January 31, 2013
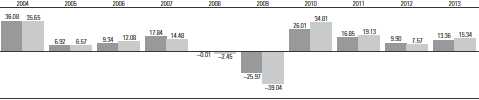
|
| Dividend Growth Fund |
| Dividend Growth Spliced Index |
For a benchmark description, see the Glossary.
Average Annual Total Returns: Periods Ended December 31, 2012
This table presents returns through the latest calendar quarter—rather than through the end of the fiscal period.
Securities and Exchange Commission rules require that we provide this information.
| | | | |
| | Inception | One | Five | Ten |
| | Date | Year | Years | Years |
| Dividend Growth Fund | 5/15/1992 | 10.39% | 4.05% | 8.84% |
12
Dividend Growth Fund
Financial Statements
Statement of Net Assets
As of January 31, 2013
The fund reports a complete list of its holdings in regulatory filings four times in each fiscal year, at the quarter-ends. For the second and fourth fiscal quarters, the lists appear in the fund’s semiannual and annual reports to shareholders. For the first and third fiscal quarters, the fund files the lists with the Securities and Exchange Commission on Form N-Q. Shareholders can look up the fund’s Forms N-Q on the SEC’s website at sec.gov. Forms N-Q may also be reviewed and copied at the SEC’s Public Reference Room (see the back cover of this report for further information).
| | |
| | | Market |
| | | Value |
| | Shares | ($000) |
| Common Stocks (95.5%) | | |
| Consumer Discretionary (15.3%) | |
| Target Corp. | 5,452,562 | 329,389 |
| McDonald’s Corp. | 3,223,170 | 307,136 |
| Lowe’s Cos. Inc. | 7,546,699 | 288,208 |
| Omnicom Group Inc. | 4,766,857 | 258,745 |
| NIKE Inc. Class B | 4,362,492 | 235,793 |
| Mattel Inc. | 5,762,615 | 216,847 |
| Walt Disney Co. | 3,354,955 | 180,765 |
| Comcast Corp. Class A | 3,328,802 | 126,761 |
| | | 1,943,644 |
| Consumer Staples (12.2%) | | |
| PepsiCo Inc. | 5,436,526 | 396,051 |
| Procter & Gamble Co. | 4,316,702 | 324,443 |
| CVS Caremark Corp. | 4,746,635 | 243,028 |
| Colgate-Palmolive Co. | 2,016,991 | 216,564 |
| Wal-Mart Stores Inc. | 2,688,429 | 188,056 |
| Coca-Cola Co. | 4,943,160 | 184,083 |
| | | 1,552,225 |
| Energy (11.7%) | | |
| Occidental | | |
| Petroleum Corp. | 4,796,735 | 423,408 |
| Exxon Mobil Corp. | 3,906,283 | 351,448 |
| BG Group plc | 14,504,134 | 257,435 |
| Enbridge Inc. | 5,470,132 | 239,264 |
| Chevron Corp. | 1,847,939 | 212,790 |
| | | 1,484,345 |
| Financials (10.1%) | | |
| ACE Ltd. | 2,959,589 | 252,542 |
| PNC Financial Services | | |
| Group Inc. | 3,885,059 | 240,097 |
| BlackRock Inc. | 958,429 | 226,457 |
| Wells Fargo & Co. | 5,907,642 | 205,763 |
| Chubb Corp. | 1,718,177 | 137,987 |
| Marsh & McLennan | | |
| Cos. Inc. | 3,786,585 | 134,348 |
| Public Storage | 541,531 | 83,358 |
| | | 1,280,552 |
| | |
| | | Market |
| | | Value |
| | Shares | ($000) |
| Health Care (18.0%) | | |
| Johnson & Johnson | 6,314,182 | 466,744 |
| Roche Holding AG | 1,495,320 | 330,524 |
| Medtronic Inc. | 7,037,041 | 327,926 |
| Pfizer Inc. | 10,712,777 | 292,245 |
| Cardinal Health Inc. | 6,471,077 | 283,498 |
| Amgen Inc. | 2,668,984 | 228,091 |
| Teva Pharmaceutical | | |
| Industries Ltd. ADR | 5,130,800 | 194,919 |
| UnitedHealth Group Inc. | 2,913,630 | 160,862 |
| | | 2,284,809 |
| Industrials (13.3%) | | |
| United Parcel Service Inc. | | |
| Class B | 3,823,155 | 303,138 |
| United Technologies | | |
| Corp. | 2,919,200 | 255,634 |
| CH Robinson | | |
| Worldwide Inc. | 3,207,210 | 212,157 |
| Honeywell International | | |
| Inc. | 3,089,362 | 210,818 |
| Lockheed Martin Corp. | 2,330,166 | 202,422 |
| General Dynamics Corp. | 3,003,802 | 199,152 |
| Emerson Electric Co. | 2,791,635 | 159,821 |
| Northrop Grumman Corp. | 2,229,004 | 144,975 |
| | | 1,688,117 |
| Information Technology (10.4%) | |
| Automatic Data | | |
| Processing Inc. | 5,038,076 | 298,707 |
| Oracle Corp. | 8,183,265 | 290,588 |
| International Business | | |
| Machines Corp. | 1,358,732 | 275,918 |
| Microsoft Corp. | 9,081,077 | 249,457 |
| Accenture plc Class A | 2,833,575 | 203,706 |
| | | 1,318,376 |
| Materials (3.1%) | | |
| Ecolab Inc. | 3,021,226 | 218,737 |
| Praxair Inc. | 1,643,176 | 181,357 |
| | | 400,094 |
13
| | |
| Dividend Growth Fund | | |
| |
| |
| |
| | | Market |
| | | Value |
| | Shares | ($000) |
| Utilities (1.4%) | | |
| Dominion Resources Inc. 3,326,816 | 180,014 |
| Total Common Stocks | | |
| (Cost $9,770,234) | | 12,132,176 |
| |
| | Face | |
| | Amount | |
| | ($000) | |
| Temporary Cash Investments (4.4%) | |
| Repurchase Agreements (4.4%) | |
| RBS Securities, Inc. | | |
| 0.130%, 2/1/13 (Dated | | |
| 1/31/13, Repurchase | | |
| Value $301,101,000, | | |
| collaterized by U.S. | | |
| Treasury Note/Bond, | | |
| 0.250%–4.250%, | | |
| 1/15/15–8/15/15) | 301,100 | 301,100 |
| Morgan Stanley & Co., | | |
| Inc. 0.160%, 2/1/13 | | |
| (Dated 1/31/13, Repurchase | | |
| Value $264,101,000, | | |
| collaterized by Federal | | |
| Home Loan Mortgage | | |
| Corp. 3.500%–6.00%, | | |
| 4/1/26–1/1/43) | 264,100 | 264,100 |
| | | 565,200 |
| Total Temporary Cash Investments | |
| (Cost $565,200) | | 565,200 |
| Total Investments (99.9%) | | |
| (Cost $10,335,434) | | 12,697,376 |
| Other Assets and Liabilities (0.1%) | |
| Other Assets | | 42,908 |
| Liabilities | | (36,476) |
| | | 6,432 |
| Net Assets (100%) | | |
| Applicable to 725,249,676 outstanding | |
| $.001 par value shares of beneficial | |
| interest (unlimited authorization) | 12,703,808 |
| Net Asset Value Per Share | | $17.52 |
| |
| At January 31, 2013, net assets consisted of: |
| | Amount |
| | ($000) |
| Paid-in Capital | 10,439,721 |
| Undistributed Net Investment Income | 1,023 |
| Accumulated Net Realized Losses | (98,897) |
| Unrealized Appreciation (Depreciation) | |
| Investment Securities | 2,361,942 |
| Foreign Currencies | 19 |
| Net Assets | 12,703,808 |
See Note A in Notes to Financial Statements.
ADR—American Depositary Receipt.
See accompanying Notes, which are an integral part of the Financial Statements.
14
| |
| Dividend Growth Fund | |
| |
| |
| Statement of Operations | |
| |
| | Year Ended |
| | January 31, 2013 |
| | ($000) |
| Investment Income | |
| Income | |
| Dividends1 | 271,162 |
| Interest | 634 |
| Security Lending | 642 |
| Total Income | 272,438 |
| Expenses | |
| Investment Advisory Fees—Note B | |
| Basic Fee | 11,108 |
| Performance Adjustment | (277) |
| The Vanguard Group—Note C | |
| Management and Administrative | 17,521 |
| Marketing and Distribution | 2,709 |
| Custodian Fees | 137 |
| Auditing Fees | 27 |
| Shareholders’ Reports | 158 |
| Trustees’ Fees and Expenses | 27 |
| Total Expenses | 31,410 |
| Net Investment Income | 241,028 |
| Realized Net Gain (Loss) | |
| Investment Securities Sold | (32,146) |
| Foreign Currencies | 8 |
| Realized Net Gain (Loss) | (32,138) |
| Change in Unrealized Appreciation (Depreciation) | |
| Investment Securities | 1,166,447 |
| Foreign Currencies | 19 |
| Change in Unrealized Appreciation (Depreciation) | 1,166,466 |
| Net Increase (Decrease) in Net Assets Resulting from Operations | 1,375,356 |
| 1 Dividends are net of foreign withholding taxes of $2,183,000. |
See accompanying Notes, which are an integral part of the Financial Statements.
15
| | |
| Dividend Growth Fund | | |
| |
| |
| Statement of Changes in Net Assets | | |
| |
| | Year Ended January 31, |
| | 2013 | 2012 |
| | ($000) | ($000) |
| Increase (Decrease) in Net Assets | | |
| Operations | | |
| Net Investment Income | 241,028 | 139,217 |
| Realized Net Gain (Loss) | (32,138) | 43,067 |
| Change in Unrealized Appreciation (Depreciation) | 1,166,466 | 483,727 |
| Net Increase (Decrease) in Net Assets Resulting from Operations | 1,375,356 | 666,011 |
| Distributions | | |
| Net Investment Income | (246,574) | (135,265) |
| Realized Capital Gain | — | — |
| Total Distributions | (246,574) | (135,265) |
| Capital Share Transactions | | |
| Issued | 4,594,475 | 4,174,976 |
| Issued in Lieu of Cash Distributions | 216,370 | 117,021 |
| Redeemed | (2,064,522) | (989,177) |
| Net Increase (Decrease) from Capital Share Transactions | 2,746,323 | 3,302,820 |
| Total Increase (Decrease) | 3,875,105 | 3,833,566 |
| Net Assets | | |
| Beginning of Period | 8,828,703 | 4,995,137 |
| End of Period1 | 12,703,808 | 8,828,703 |
| 1 Net Assets—End of Period includes undistributed (overdistributed) net investment income of $1,023,000 and $6,561,000. |
See accompanying Notes, which are an integral part of the Financial Statements.
16
| | | | | |
| Dividend Growth Fund | | | | | |
| |
| |
| Financial Highlights | | | | | |
| |
| |
| For a Share Outstanding | | | Year Ended January 31, |
| Throughout Each Period | 2013 | 2012 | 2011 | 2010 | 2009 |
| Net Asset Value, Beginning of Period | $15.81 | $14.68 | $12.82 | $10.42 | $14.38 |
| Investment Operations | | | | | |
| Net Investment Income | .357 | .317 | .283 | .291 | .264 |
| Net Realized and Unrealized Gain (Loss) | | | | | |
| on Investments | 1.721 | 1.126 | 1.850 | 2.401 | (3.960) |
| Total from Investment Operations | 2.078 | 1.443 | 2.133 | 2.692 | (3.696) |
| Distributions | | | | | |
| Dividends from Net Investment Income | (.368) | (.313) | (.273) | (.292) | (.264) |
| Distributions from Realized Capital Gains | — | — | — | — | — |
| Total Distributions | (.368) | (.313) | (.273) | (.292) | (.264) |
| Net Asset Value, End of Period | $17.52 | $15.81 | $14.68 | $12.82 | $10.42 |
| |
| Total Return1 | 13.36% | 9.90% | 16.85% | 26.01% | -25.97% |
| |
| Ratios/Supplemental Data | | | | | |
| Net Assets, End of Period (Millions) | $12,704 | $8,829 | $4,995 | $2,814 | $1,745 |
| Ratio of Total Expenses to Average | | | | | |
| Net Assets2 | 0.29% | 0.31% | 0.34% | 0.38% | 0.36% |
| Ratio of Net Investment Income to | | | | | |
| Average Net Assets | 2.22% | 2.28% | 2.25% | 2.59% | 2.25% |
| Portfolio Turnover Rate | 11% | 13% | 17% | 24% | 28% |
1 Total returns do not include account service fees that may have applied in the periods shown. Fund prospectuses provide information about any applicable account service fees.
2 Includes performance-based investment advisory fee increases (decreases) of 0.00%, 0.00%, 0.03%, 0.03%, and 0.03%.
See accompanying Notes, which are an integral part of the Financial Statements.
17
Dividend Growth Fund
Notes to Financial Statements
Vanguard Dividend Growth Fund is registered under the Investment Company Act of 1940 as an open-end investment company, or mutual fund.
A. The following significant accounting policies conform to generally accepted accounting principles for U.S. mutual funds. The fund consistently follows such policies in preparing its financial statements.
1. Security Valuation: Securities are valued as of the close of trading on the New York Stock Exchange (generally 4 p.m., Eastern time) on the valuation date. Equity securities are valued at the latest quoted sales prices or official closing prices taken from the primary market in which each security trades; such securities not traded on the valuation date are valued at the mean of the latest quoted bid and asked prices. Securities for which market quotations are not readily available, or whose values have been affected by events occurring before the fund’s pricing time but after the close of the securities’ primary markets, are valued at their fair values calculated according to procedures adopted by the board of trustees. These procedures include obtaining quotations from an independent pricing service, monitoring news to identify significant market- or security-specific events, and evaluating changes in the values of foreign market proxies (for example, ADRs, futures contracts, or exchange-traded funds), between the time the foreign markets close and the fund’s pricing time. When fair-value pricing is employed, the prices of securities used by a fund to calculate its net asset value may differ from quoted or published prices for the same securities. Temporary cash investments acquired over 60 days to maturity are valued using the latest bid prices or using valuations based on a matrix system (which considers such factors as security prices, yields, maturities, and ratings), both as furnished by independent pricing services. Other temporary cash investments are valued at amortized cost, which approximates market value.
2. Foreign Currency: Securities and other assets and liabilities denominated in foreign currencies are translated into U.S. dollars using exchange rates obtained from an independent third party as of the fund’s pricing time on the valuation date. Realized gains (losses) and unrealized appreciation (depreciation) on investment securities include the effects of changes in exchange rates since the securities were purchased, combined with the effects of changes in security prices. Fluctuations in the value of other assets and liabilities resulting from changes in exchange rates are recorded as unrealized foreign currency gains (losses) until the assets or liabilities are settled in cash, at which time they are recorded as realized foreign currency gains (losses).
3. Repurchase Agreements: The fund may enter into repurchase agreements. Securities pledged as collateral for repurchase agreements are held by a custodian bank until the agreements mature. Each agreement requires that the market value of the collateral be sufficient to cover payments of interest and principal. In the event of default or bankruptcy by the other party to the agreement, the fund may sell or retain the collateral; however, such action may be subject to legal proceedings.
4. Federal Income Taxes: The fund intends to continue to qualify as a regulated investment company and distribute all of its taxable income. Management has analyzed the fund’s tax positions taken for all open federal income tax years (January 31, 2010–2013), and has concluded that no provision for federal income tax is required in the fund’s financial statements.
5. Distributions: Distributions to shareholders are recorded on the ex-dividend date.
6. Security Lending: The fund may lend its securities to qualified institutional borrowers to earn additional income. Security loans are required to be secured at all times by collateral at least equal to the market value of securities loaned. The fund invests cash collateral received in Vanguard Market Liquidity Fund, and records a liability for the return of the collateral, during the period the securities are on loan. Security lending income represents fees charged to borrowers plus income earned on investing cash collateral, less expenses associated with the loan.
18
Dividend Growth Fund
7. Other: Dividend income is recorded on the ex-dividend date. Interest income is accrued daily. Security transactions are accounted for on the date securities are bought or sold. Costs used to determine realized gains (losses) on the sale of investment securities are those of the specific securities sold.
B. Wellington Management Company, LLP, provides investment advisory services to the fund for a fee calculated at an annual percentage rate of average net assets. The basic fee is subject to quarterly adjustments based on the fund’s performance for the preceding three years relative to the Russell 1000 Index for periods prior to February 1, 2010, and the current benchmark, the Dividend Achievers Select Index, beginning February 1, 2010. The benchmark change was fully phased in on January 31, 2013. For the year ended January 31, 2013, the investment advisory fee represented an effective annual basic rate of 0.10% of the fund’s average net assets before a decrease of $277,000 (0.00%) based on performance.
C. The Vanguard Group furnishes at cost corporate management, administrative, marketing, and distribution services. The costs of such services are allocated to the fund under methods approved by the board of trustees. The fund has committed to provide up to 0.40% of its net assets in capital contributions to Vanguard. At January 31, 2013, the fund had contributed capital of $1,590,000 to Vanguard (included in Other Assets), representing 0.01% of the fund’s net assets and 0.64% of Vanguard’s capitalization. The fund’s trustees and officers are also directors and officers of Vanguard.
D. Various inputs may be used to determine the value of the fund’s investments. These inputs are summarized in three broad levels for financial statement purposes. The inputs or methodologies used to value securities are not necessarily an indication of the risk associated with investing in those securities.
Level 1—Quoted prices in active markets for identical securities.
Level 2—Other significant observable inputs (including quoted prices for similar securities, interest rates, prepayment speeds, credit risk, etc.).
Level 3—Significant unobservable inputs (including the fund’s own assumptions used to determine the fair value of investments).
The following table summarizes the market value of the fund’s investments as of January 31, 2013, based on the inputs used to value them:
| | | |
| | Level 1 | Level 2 | Level 3 |
| Investments | ($000) | ($000) | ($000) |
| Common Stocks | 11,544,216 | 587,960 | — |
| Temporary Cash Investments | — | 565,200 | — |
| Total | 11,544,216 | 1,153,160 | — |
E. Distributions are determined on a tax basis and may differ from net investment income and realized capital gains for financial reporting purposes. Differences may be permanent or temporary. Permanent differences are reclassified among capital accounts in the financial statements to reflect their tax character. Temporary differences arise when certain items of income, expense, gain, or loss are recognized in different periods for financial statement and tax purposes; these differences will reverse at some time in the future. Differences in classification may also result from the treatment of short-term gains as ordinary income for tax purposes.
19
Dividend Growth Fund
During the year ended January 31, 2013, the fund realized net foreign currency gains of $8,000, which increased distributable net income for tax purposes; accordingly, such gains have been reclassified from accumulated net realized losses to undistributed net investment income.
For tax purposes, at January 31, 2013, the fund had $10,102,000 of ordinary income available for distribution. The fund used capital loss carryforwards of $17,413,000 to offset taxable capital gains realized during the year ended January 31, 2013. At January 31, 2013, the fund had available capital losses totaling $98,481,000 to offset future net capital gains. Of this amount, $45,895,000 is subject to expiration on January 31, 2018. Capital losses of $52,586,000 realized beginning in fiscal 2012 may be carried forward indefinitely under the Regulated Investment Company Modernization Act of 2010, but must be used before any expiring loss carryforwards.
At January 31, 2013, the cost of investment securities for tax purposes was $10,335,434,000. Net unrealized appreciation of investment securities for tax purposes was $2,361,942,000, consisting of unrealized gains of $2,395,390,000 on securities that had risen in value since their purchase and $33,448,000 in unrealized losses on securities that had fallen in value since their purchase.
F. During the year ended January 31, 2013, the fund purchased $3,943,314,000 of investment securities and sold $1,145,731,000 of investment securities, other than temporary cash investments.
G. Capital shares issued and redeemed were:
| | |
| | Year Ended January 31, |
| | 2013 | 2012 |
| | Shares | Shares |
| | (000) | (000) |
| Issued | 278,157 | 276,882 |
| Issued in Lieu of Cash Distributions | 13,395 | 7,601 |
| Redeemed | (124,792) | (66,333) |
| Net Increase (Decrease) in Shares Outstanding | 166,760 | 218,150 |
H. In preparing the financial statements as of January 31, 2013, management considered the impact of subsequent events for potential recognition or disclosure in these financial statements.
20
Report of Independent Registered
Public Accounting Firm
To the Trustees of Vanguard Specialized Funds and the Shareholders of Vanguard Dividend Growth Fund:
In our opinion, the accompanying statement of net assets and the related statements of operations and of changes in net assets and the financial highlights present fairly, in all material respects, the financial position of Vanguard Dividend Growth Fund (constituting a separate portfolio of Vanguard Specialized Funds, hereafter referred to as the “Fund”) at January 31, 2013, the results of its operations for the year then ended, the changes in its net assets for each of the two years in the period then ended and the financial highlights for each of the five years in the period then ended, in conformity with accounting principles generally accepted in the United States of America. These financial statements and financial highlights (hereafter referred to as “financial statements”) are the responsibility of the Fund’s management; our responsibility is to express an opinion on these financial statements based on our audits. We conducted our audits of these financial statements in accordance with the standards of the Public Company Accounting Oversight Board (United States). Those standards require that we plan and perform the audit to obtain reasonable assurance about whether the financial statements are free of material misstatement. An audit includes examining, on a test basis, evidence supporting the amounts and disclosures in the financial statements, assessing the accounting principles used and significant estimates made by management, and evaluating the overall financial statement presentation. We believe that our audits, which included confirmation of securities at January 31, 2013 by correspondence with the custodians and brokers, provide a reasonable basis for our opinion.
PricewaterhouseCoopers LLP
Philadelphia, Pennsylvania
March 15, 2013
| |
| Special 2012 tax information (unaudited) for Vanguard Dividend Growth Fund |
This information for the fiscal year ended January 31, 2013, is included pursuant to provisions of the Internal Revenue Code.
The fund distributed $246,574,000 of qualified dividend income to shareholders during the fiscal year.
For corporate shareholders, 100% of investment income (dividend income plus short-term gains, if any) qualifies for the dividends-received deduction.
21
Your Fund’s After-Tax Returns
This table presents returns for your fund both before and after taxes. The after-tax returns are shown in two ways: (1) assuming that an investor owned the fund during the entire period and paid taxes on the fund’s distributions, and (2) assuming that an investor paid taxes on the fund’s distributions and sold all shares at the end of each period.
Calculations are based on the highest individual federal income tax and capital gains tax rates in effect at the times of the distributions and the hypothetical sales. State and local taxes were not considered. After-tax returns reflect any qualified dividend income, using actual prior-year figures and estimates for 2013. (In the example, returns after the sale of fund shares may be higher than those assuming no sale. This occurs when the sale would have produced a capital loss. The calculation assumes that the investor received a tax deduction for the loss.)
Please note that your actual after-tax returns will depend on your tax situation and may differ from those shown. Also note that if you own the fund in a tax-deferred account, such as an individual retirement account or a 401(k) plan, this information does not apply to you. Such accounts are not subject to current taxes.
Finally, keep in mind that a fund’s performance—whether before or after taxes—does not guarantee future results.
Average Annual Total Returns: Dividend Growth Fund
Periods Ended January 31, 2013
| | | |
| | One | Five | Ten |
| | Year | Years | Years |
| Returns Before Taxes | 13.36% | 6.31% | 9.80% |
| Returns After Taxes on Distributions | 12.97 | 5.97 | 9.45 |
| Returns After Taxes on Distributions and Sale of Fund Shares | 8.21 | 5.03 | 8.16 |
22
About Your Fund’s Expenses
As a shareholder of the fund, you incur ongoing costs, which include costs for portfolio management, administrative services, and shareholder reports (like this one), among others. Operating expenses, which are deducted from a fund’s gross income, directly reduce the investment return of the fund.
A fund’s expenses are expressed as a percentage of its average net assets. This figure is known as the expense ratio. The following examples are intended to help you understand the ongoing costs (in dollars) of investing in your fund and to compare these costs with those of other mutual funds. The examples are based on an investment of $1,000 made at the beginning of the period shown and held for the entire period.
The accompanying table illustrates your fund’s costs in two ways:
• Based on actual fund return. This section helps you to estimate the actual expenses that you paid over the period. The ”Ending Account Value“ shown is derived from the fund‘s actual return, and the third column shows the dollar amount that would have been paid by an investor who started with $1,000 in the fund. You may use the information here, together with the amount you invested, to estimate the expenses that you paid over the period.
To do so, simply divide your account value by $1,000 (for example, an $8,600 account value divided by $1,000 = 8.6), then multiply the result by the number given for your fund under the heading ”Expenses Paid During Period.“
• Based on hypothetical 5% yearly return. This section is intended to help you compare your fund‘s costs with those of other mutual funds. It assumes that the fund had a yearly return of 5% before expenses, but that the expense ratio is unchanged. In this case—because the return used is not the fund’s actual return—the results do not apply to your investment. The example is useful in making comparisons because the Securities and Exchange Commission requires all mutual funds to calculate expenses based on a 5% return. You can assess your fund’s costs by comparing this hypothetical example with the hypothetical examples that appear in shareholder reports of other funds.
Note that the expenses shown in the table are meant to highlight and help you compare ongoing costs only and do not reflect transaction costs incurred by the fund for buying and selling securities. Further, the expenses do not include any purchase, redemption, or account service fees described in the fund prospectus. If such fees were applied to your account, your costs would be higher. Your fund does not carry a “sales load.”
The calculations assume no shares were bought or sold during the period. Your actual costs may have been higher or lower, depending on the amount of your investment and the timing of any purchases or redemptions.
You can find more information about the fund’s expenses, including annual expense ratios, in the Financial Statements section of this report. For additional information on operating expenses and other shareholder costs, please refer to your fund’s current prospectus.
23
| | | |
| Six Months Ended January 31, 2013 | | | |
| | Beginning | Ending | Expenses |
| | Account Value | Account Value | Paid During |
| Dividend Growth Fund | 7/31/2012 | 1/31/2013 | Period |
| Based on Actual Fund Return | $1,000.00 | $1,082.62 | $1.52 |
| Based on Hypothetical 5% Yearly Return | 1,000.00 | 1,023.74 | 1.48 |
The calculations are based on expenses incurred in the most recent six-month period. The fund’s annualized six-month expense ratio for that period is 0.29%. The dollar amounts shown as “Expenses Paid” are equal to the annualized expense ratio multiplied by the average account value over the period, multiplied by the number of days in the most recent six-month period, then divided by the number of days in the most recent 12-month period.
24
Trustees Approve Advisory Agreement
The board of trustees of Vanguard Dividend Growth Fund has renewed the fund’s investment advisory agreement with Wellington Management Company, LLP. The board determined that the retention of the advisor was in the best interests of the fund and its shareholders.
The board based its decision upon an evaluation of the advisor’s investment staff, portfolio management process, and performance. The trustees considered the factors discussed below, among others. However, no single factor determined whether the board approved the agreement. Rather, it was the totality of the circumstances that drove the board’s decision.
Nature, extent, and quality of services
The board considered the quality of the fund’s investment management over both the short and long term, and took into account the organizational depth and stability of the advisor. The board noted that Wellington Management, founded in 1928, is among the nation’s oldest and most respected institutional managers. The portfolio manager is backed by a well-tenured team of research analysts who conduct detailed fundamental analysis of their respective industries and companies. Wellington Management has provided high-quality advisory services to the fund. The firm has advised the fund since its inception in 1992.
The board concluded that Wellington Management’s experience, stability, depth, and performance, among other factors, warranted continuation of the advisory agreement.
Investment performance
The board considered the short- and long-term performance of the fund, including any periods of outperformance or underperformance of a relevant benchmark and peer group. The board noted that since the fund’s reconstituted dividend growth mandate, which began in 2002, long-term performance has been strong. Information about the fund’s most recent performance can be found in the Performance Summary section of this report.
Cost
The board concluded that the fund’s expense ratio was well below the average expense ratio charged by funds in its peer group and that the fund’s advisory fee rate was also well below its peer-group average. Information about the fund’s expenses appears in the About Your Fund’s Expenses section of this report as well as in the Financial Statements section, which also includes information about the advisory fee rate.
The board did not consider profitability of Wellington Management in determining whether to approve the advisory fee, because Wellington Management is independent of Vanguard and the advisory fee is the result of arm’s-length negotiations.
The benefit of economies of scale
The board concluded that the fund’s shareholders benefit from economies of scale because of breakpoints in the fund’s advisory fee schedule. The breakpoints reduce the effective rate of the fee as the fund’s assets increase.
The board will consider whether to renew the advisory agreement again after a one-year period.
25
Glossary
30-Day SEC Yield. A fund’s 30-day SEC yield is derived using a formula specified by the U.S. Securities and Exchange Commission. Under the formula, data related to the fund’s security holdings in the previous 30 days are used to calculate the fund’s hypothetical net income for that period, which is then annualized and divided by the fund’s estimated average net assets over the calculation period. For the purposes of this calculation, a security’s income is based on its current market yield to maturity (for bonds), its actual income (for asset-backed securities), or its projected dividend yield (for stocks). Because the SEC yield represents hypothetical annualized income, it will differ—at times significantly—from the fund’s actual experience. As a result, the fund’s income distributions may be higher or lower than implied by the SEC yield.
Beta. A measure of the magnitude of a fund’s past share-price fluctuations in relation to the ups and downs of a given market index. The index is assigned a beta of 1.00. Compared with a given index, a fund with a beta of 1.20 typically would have seen its share price rise or fall by 12% when the index rose or fell by 10%. For this report, beta is based on returns over the past 36 months for both the fund and the index. Note that a fund’s beta should be reviewed in conjunction with its R-squared (see definition). The lower the R-squared, the less correlation there is between the fund and the index, and the less reliable beta is as an indicator of volatility.
Dividend Yield. Dividend income earned by stocks, expressed as a percentage of the aggregate market value (or of net asset value, for a fund). The yield is determined by dividing the amount of the annual dividends by the aggregate value (or net asset value) at the end of the period. For a fund, the dividend yield is based solely on stock holdings and does not include any income produced by other investments.
Earnings Growth Rate. The average annual rate of growth in earnings over the past five years for the stocks now in a fund.
Equity Exposure. A measure that reflects a fund’s investments in stocks and stock futures. Any holdings in short-term reserves are excluded.
Expense Ratio. A fund’s total annual operating expenses expressed as a percentage of the fund’s average net assets. The expense ratio includes management and administrative expenses, but does not include the transaction costs of buying and selling portfolio securities.
Foreign Holdings. The percentage of a fund represented by securities or depositary receipts of companies based outside the United States.
Inception Date. The date on which the assets of a fund (or one of its share classes) are first invested in accordance with the fund’s investment objective. For funds with a subscription period, the inception date is the day after that period ends. Investment performance is measured from the inception date.
Median Market Cap. An indicator of the size of companies in which a fund invests; the midpoint of market capitalization (market price x shares outstanding) of a fund’s stocks, weighted by the proportion of the fund’s assets invested in each stock. Stocks representing half of the fund’s assets have market capitalizations above the median, and the rest are below it.
Price/Book Ratio. The share price of a stock divided by its net worth, or book value, per share. For a fund, the weighted average price/book ratio of the stocks it holds.
26
Price/Earnings Ratio. The ratio of a stock’s current price to its per-share earnings over the past year. For a fund, the weighted average P/E of the stocks it holds. P/E is an indicator of market expectations about corporate prospects; the higher the P/E, the greater the expectations for a company’s future growth.
R-Squared. A measure of how much of a fund’s past returns can be explained by the returns from the market in general, as measured by a given index. If a fund’s total returns were precisely synchronized with an index’s returns, its R-squared would be 1.00. If the fund’s returns bore no relationship to the index’s returns, its R-squared would be 0. For this report, R-squared is based on returns over the past 36 months for both the fund and the index.
Return on Equity. The annual average rate of return generated by a company during the past five years for each dollar of shareholder’s equity (net income divided by shareholder’s equity). For a fund, the weighted average return on equity for the companies whose stocks it holds.
Short-Term Reserves. The percentage of a fund invested in highly liquid, short-term securities that can be readily converted to cash.
Turnover Rate. An indication of the fund’s trading activity. Funds with high turnover rates incur higher transaction costs and may be more likely to distribute capital gains (which may be taxable to investors). The turnover rate excludes in-kind transactions, which have minimal impact on costs.
Benchmark Information
Dividend Growth Spliced Average: Based on the Utility Funds Average through December 6, 2002, and the Large-Cap Core Funds Average thereafter.
Dividend Growth Spliced Index: Prior to December 6, 2002, the comparative benchmark was known as the Utilities Composite Index. The index weightings were: 40% S&P Utilities Index, 40% S&P Telephone Index, and 20% Lehman Brothers Utility Bond Index through April 30, 1999; 63.75% S&P Utilities Index, 21.25% S&P Telephone Index, and 15% Lehman Brothers Utility Bond Index through March 31, 2000; 75% S&P Utilities Index and 25% S&P Telephone Index through December 31, 2001; and 75% S&P Utilities Index and 25% S&P Integrated Telecommunication Services Index through December 6, 2002. The fund’s benchmark was the Russell 1000 Index through January 31, 2010, after which it was changed to the Dividend Achievers Select Index. The Dividend Achievers Select Index is administered exclusively for Vanguard by Mergent, Inc.
27
The People Who Govern Your Fund
The trustees of your mutual fund are there to see that the fund is operated and managed in your best interests since, as a shareholder, you are a part owner of the fund. Your fund’s trustees also serve on the board of directors of The Vanguard Group, Inc., which is owned by the Vanguard funds and provides services to them on an at-cost basis.
A majority of Vanguard’s board members are independent, meaning that they have no affiliation with Vanguard or the funds they oversee, apart from the sizable personal investments they have made as private individuals. The independent board members have distinguished backgrounds in business, academia, and public service. Each of the trustees and executive officers oversees 180 Vanguard funds.
The following table provides information for each trustee and executive officer of the fund. More information about the trustees is in the Statement of Additional Information, which can be obtained, without charge, by contacting Vanguard at 800-662-7447, or online at vanguard.com.
| |
| InterestedTrustee1 | and Delphi Automotive LLP (automotive components); |
| | Senior Advisor at New Mountain Capital; Trustee of |
| F. William McNabb III | The Conference Board. |
| Born 1957. Trustee Since July 2009. Chairman of the | |
| Board. Principal Occupation(s) During the Past Five | Amy Gutmann |
| Years: Chairman of the Board of The Vanguard Group, | Born 1949. Trustee Since June 2006. Principal |
| Inc., and of each of the investment companies served | Occupation(s) During the Past Five Years: President |
| by The Vanguard Group, since January 2010; Director | of the University of Pennsylvania; Christopher H. |
| of The Vanguard Group since 2008; Chief Executive | Browne Distinguished Professor of Political Science |
| Officer and President of The Vanguard Group and of | in the School of Arts and Sciences with secondary |
| each of the investment companies served by The | appointments at the Annenberg School for |
| Vanguard Group since 2008; Director of Vanguard | Communication and the Graduate School of Education |
| Marketing Corporation; Managing Director of The | of the University of Pennsylvania; Member of the |
| Vanguard Group (1995–2008). | National Commission on the Humanities and Social |
| | Sciences; Trustee of Carnegie Corporation of New |
| IndependentTrustees | York and of the National Constitution Center; Chair |
| | of the U. S. Presidential Commission for the Study |
| Emerson U. Fullwood | of Bioethical Issues. |
| Born 1948. Trustee Since January 2008. Principal | |
| Occupation(s) During the Past Five Years: Executive | JoAnn Heffernan Heisen |
| Chief Staff and Marketing Officer for North America | Born 1950. Trustee Since July 1998. Principal |
| and Corporate Vice President (retired 2008) of Xerox | Occupation(s) During the Past Five Years: Corporate |
| Corporation (document management products and | Vice President and Chief Global Diversity Officer |
| services); Executive in Residence and 2010 | (retired 2008) and Member of the Executive |
| Distinguished Minett Professor at the Rochester | Committee (1997–2008) of Johnson & Johnson |
| Institute of Technology; Director of SPX Corporation | (pharmaceuticals/medical devices/consumer |
| (multi-industry manufacturing), the United Way of | products); Director of Skytop Lodge Corporation |
| Rochester, Amerigroup Corporation (managed health | (hotels), the University Medical Center at Princeton, |
| care), the University of Rochester Medical Center, | the Robert Wood Johnson Foundation, and the Center |
| Monroe Community College Foundation, and North | for Talent Innovation; Member of the Advisory Board |
| Carolina A&T University. | of the Maxwell School of Citizenship and Public Affairs |
| at Syracuse University. |
| Rajiv L. Gupta | |
| Born 1945. Trustee Since December 2001.2 | F. Joseph Loughrey |
| Principal Occupation(s) During the Past Five Years: | Born 1949. Trustee Since October 2009. Principal |
| Chairman and Chief Executive Officer (retired 2009) | Occupation(s) During the Past Five Years: President |
| and President (2006–2008) of Rohm and Haas Co. | and Chief Operating Officer (retired 2009) of Cummins |
| (chemicals); Director of Tyco International, Ltd. | Inc. (industrial machinery); Director of SKF AB |
| (diversified manufacturing and services), Hewlett- | (industrial machinery), Hillenbrand, Inc. (specialized |
| Packard Co. (electronic computer manufacturing), | consumer services), the Lumina Foundation for |
| |
| | |
| Education, and Oxfam America; Chairman of the | Executive Officers | |
| Advisory Council for the College of Arts and Letters | | |
| and Member of the Advisory Board to the Kellogg | Glenn Booraem | |
| Institute for International Studies at the University | Born 1967. Controller Since July 2010. Principal |
| of Notre Dame. | Occupation(s) During the Past Five Years: Principal |
| | of The Vanguard Group, Inc.; Controller of each of |
| Mark Loughridge | the investment companies served by The Vanguard |
| Born 1953. Trustee Since March 2012. Principal | Group; Assistant Controller of each of the investment |
| Occupation(s) During the Past Five Years: Senior Vice | companies served by The Vanguard Group (2001–2010). |
| President and Chief Financial Officer at IBM (information | | |
| technology services); Fiduciary Member of IBM’s | Thomas J. Higgins | |
| Retirement Plan Committee. | Born 1957. Chief Financial Officer Since September |
| | 2008. Principal Occupation(s) During the Past Five |
| Scott C. Malpass | Years: Principal of The Vanguard Group, Inc.; Chief |
| Born 1962. Trustee Since March 2012. Principal | Financial Officer of each of the investment companies |
| Occupation(s) During the Past Five Years: Chief | served by The Vanguard Group; Treasurer of each of |
| Investment Officer and Vice President at the University | the investment companies served by The Vanguard |
| of Notre Dame; Assistant Professor of Finance at the | Group (1998–2008). | |
| Mendoza College of Business at Notre Dame; Member | | |
| of the Notre Dame 403(b) Investment Committee; | Kathryn J. Hyatt | |
| Director of TIFF Advisory Services, Inc. (investment | Born 1955. Treasurer Since November 2008. Principal |
| advisor); Member of the Investment Advisory | Occupation(s) During the Past Five Years: Principal of |
| Committees of the Financial Industry Regulatory | The Vanguard Group, Inc.; Treasurer of each of the |
| Authority (FINRA) and of Major League Baseball. | investment companies served by The Vanguard |
| | Group; Assistant Treasurer of each of the investment |
| André F. Perold | companies served by The Vanguard Group (1988–2008). |
| Born 1952. Trustee Since December 2004. Principal | | |
| Occupation(s) During the Past Five Years: George | Heidi Stam | |
| Gund Professor of Finance and Banking at the Harvard | Born 1956. Secretary Since July 2005. Principal |
| Business School (retired 2011); Chief Investment | Occupation(s) During the Past Five Years: Managing |
| Officer and Managing Partner of HighVista Strategies | Director of The Vanguard Group, Inc.; General Counsel |
| LLC (private investment firm); Director of Rand | of The Vanguard Group; Secretary of The Vanguard |
| Merchant Bank; Overseer of the Museum of Fine | Group and of each of the investment companies |
| Arts Boston. | served by The Vanguard Group; Director and Senior |
| | Vice President of Vanguard Marketing Corporation. |
| Alfred M. Rankin, Jr. | | |
| Born 1941. Trustee Since January 1993. Principal | Vanguard Senior ManagementTeam | |
| Occupation(s) During the Past Five Years: Chairman, | | |
| President, and Chief Executive Officer of NACCO | Mortimer J. Buckley | Chris D. McIsaac |
| Industries, Inc. (housewares/lignite) and of Hyster-Yale | Kathleen C. Gubanich | Michael S. Miller |
| Materials Handling, Inc. (forklift trucks); Director of | Paul A. Heller | James M. Norris |
| the National Association of Manufacturers; Chairman | Martha G. King | Glenn W. Reed |
| of the Board of University Hospitals of Cleveland; | | |
| Advisory Chairman of the Board of The Cleveland | Chairman Emeritus and Senior Advisor | |
| Museum of Art. | | |
| | John J. Brennan | |
| Peter F. Volanakis | Chairman, 1996–2009 | |
| Born 1955. Trustee Since July 2009. Principal | Chief Executive Officer and President, 1996–2008 | |
| Occupation(s) During the Past Five Years: President | | |
| and Chief Operating Officer (retired 2010) of Corning | Founder | |
| Incorporated (communications equipment); Director | | |
| of SPX Corporation (multi-industry manufacturing); | John C. Bogle | |
| Overseer of the Amos Tuck School of Business | Chairman and Chief Executive Officer, 1974–1996 | |
| Administration at Dartmouth College; Advisor to the | | |
| Norris Cotton Cancer Center. | | |
1 Mr. McNabb is considered an “interested person,” as defined in the Investment Company Act of 1940, because he is an officer of the Vanguard funds.
2 December 2002 for Vanguard Equity Income Fund, Vanguard Growth Equity Fund, the Vanguard Municipal Bond Funds, and the Vanguard State Tax-Exempt Funds.
|  |
| P.O. Box 2600 |
| Valley Forge, PA 19482-2600 |
Connect with Vanguard® > vanguard.com
| |
| Fund Information > 800-662-7447 | |
| Direct Investor Account Services > 800-662-2739 | |
| Institutional Investor Services > 800-523-1036 | |
| Text Telephone for People | |
| With Hearing Impairment > 800-749-7273 | |
| |
| This material may be used in conjunction | |
| with the offering of shares of any Vanguard | |
| fund only if preceded or accompanied by | |
| the fund’s current prospectus. | |
| |
| All comparative mutual fund data are from Lipper Inc. or | |
| Morningstar, Inc., unless otherwise noted. | |
| |
| You can obtain a free copy of Vanguard’s proxy voting | |
| guidelines by visiting vanguard.com/proxyreporting or by | |
| calling Vanguard at 800-662-2739. The guidelines are | |
| also available from the SEC’s website, sec.gov. In | |
| addition, you may obtain a free report on how your fund | |
| voted the proxies for securities it owned during the 12 | |
| months ended June 30. To get the report, visit either | |
| vanguard.com/proxyreporting or sec.gov. | |
| |
| You can review and copy information about your fund at | |
| the SEC’s Public Reference Room in Washington, D.C. To | |
| find out more about this public service, call the SEC at | |
| 202-551-8090. Information about your fund is also | |
| available on the SEC’s website, and you can receive | |
| copies of this information, for a fee, by sending a | |
| request in either of two ways: via e-mail addressed to | |
| publicinfo@sec.gov or via regular mail addressed to the | |
| Public Reference Section, Securities and Exchange | |
| Commission, Washington, DC 20549-1520. | |
| |
| |
| | © 2013 The Vanguard Group, Inc. |
| | All rights reserved. |
| | Vanguard Marketing Corporation, Distributor. |
| |
| | Q570 032013 |
| | 
|
| Annual Report | | January 31, 2013 | |
| Vanguard Dividend Appreciation Index Fund |
|
 |
> Vanguard Dividend Appreciation Index Fund returned about 15% for the fiscal year ended January 31, 2013, in line with the return of its benchmark and just shy of the average return of its large-capitalization core peers.
> The broad U.S. stock market returned nearly 17% as the economy displayed modest growth and the Federal Reserve continued its stimulus programs.
> All ten of the index’s market sectors rose, with consumer staples adding the most to return.
| |
| Contents | |
| Your Fund’s Total Returns. | 1 |
| Chairman’s Letter. | 2 |
| Fund Profile. | 9 |
| Performance Summary. | 11 |
| Financial Statements. | 13 |
| Your Fund’s After-Tax Returns. | 25 |
| About Your Fund’s Expenses. | 26 |
| Glossary. | 28 |
Please note: The opinions expressed in this report are just that—informed opinions. They should not be considered promises or advice.
Also, please keep in mind that the information and opinions cover the period through the date on the front of this report. Of course, the risks of investing in your fund are spelled out in the prospectus.
See the Glossary for definitions of investment terms used in this report.
About the cover: Our cover photograph shows rigging on the HMSSurprise, a replica of an 18th-century Royal Navy frigate. It was featured in the 2003 movie Master and Commander: The Far Side of the World, which was based on Patrick O’Brian’s sea novels, set amid the Napoleonic Wars. Vanguard was named for another ship of that era, the HMSVanguard, which was the flagship of British Admiral Horatio Nelson at the Battle of the Nile.
| |
| Your Fund’s Total Returns | |
| |
| |
| |
| |
| Fiscal Year Ended January 31, 2013 | |
| |
| | Total |
| | Returns |
| Vanguard Dividend Appreciation Index Fund | |
| Investor Shares | 15.15% |
| ETF Shares | |
| Market Price | 15.20 |
| Net Asset Value | 15.29 |
| Dividend Achievers Select Index | 15.34 |
| Large-Cap Core Funds Average | 15.47 |
| Large-Cap Core Funds Average: Derived from data provided by Lipper Inc. | |
The Vanguard ETF® Shares shown are traded on the NYSE Arca exchange and are available only through brokers. The table provides ETF returns based on both the NYSE Arca market price and the net asset value for a share. U.S. Pat. No. 6,879,964 B2; 7,337,138; 7,720,749; 7,925,573; 8,090,646.
For the ETF Shares, the market price is determined by the midpoint of the bid-offer spread as of the closing time of the New York Stock Exchange (generally 4 p.m., Eastern time). The net asset value is also determined as of the NYSE closing time. For more information about how the ETF Shares' market prices have compared with their net asset value, visit vanguard.com, select your ETF, and then select the Price and Performance tab. The ETF premium/discount analysis there shows the percentages of days on which the ETF Shares' market price was above or below the NAV.
Your Fund’s Performance at a Glance
January 31, 2012, Through January 31, 2013
| | | | |
| | | | Distributions Per Share |
| | Starting | Ending | Income | Capital |
| | Share Price | Share Price | Dividends | Gains |
| Vanguard Dividend Appreciation Index Fund | | | | |
| Investor Shares | $22.42 | $25.23 | $0.540 | $0.000 |
| ETF Shares | 56.04 | 63.08 | 1.410 | 0.000 |
1

Chairman’s Letter
Dear Shareholder,
The stocks of companies that have increased their dividends remained attractive over your fund’s fiscal year, but other corners of the market also proved enticing for investors as the economy slowly expanded and stocks climbed. For the 12 months ended January 31, 2013, Vanguard Dividend Appreciation Index Fund returned about 15%. The fund’s return was in line with that of its benchmark, the Dividend Achievers Select Index, and just behind the average return of large-capitalization core funds.
The Dividend Appreciation Index Fund focuses on large, high-quality companies with a history of increasing dividends. The securities in the index it seeks to track tended to lag the broad market’s pacesetters over the year. It had much less exposure to the surging financial sector, for example, than the broader market did.
Partly because of the fund’s rising share price, the 30-day SEC yield for the fund’s Investor Shares declined from 2.15% at the beginning of the fiscal year to 2.06% at the end. The fund’s per-share distributions increased from 44.4 cents to 54.0 cents over the past year, a gain of about 22% in dividend distributions. Over 95% of the fund’s holdings at year-end 2012 had increased their dividend in the prior year.
2
Led by European shares, stocks saw double-digit returns
Global stock markets rose sharply in the 12 months ended January 31, with European equities delivering the most robust results. Investors seemed buoyed by progress in addressing fiscal challenges there and elsewhere.
European stocks gained about 20% even as many countries in the region continued to struggle with economic woes. This disparity isn’t as unusual as it may appear. Vanguard research has found that the relationship between a country’s economic growth and its stock market returns has typically been weak over time.
In the United States, attention to federal budget challenges intensified as 2012 drew to a close. The focus on the “fiscal cliff” led to investor anxiety before policymakers reached a limited tax-rate agreement on the cusp of the new year. Although a credible long-term deficit-reduction strategy has yet to be crafted, investors propelled U.S. stocks to a gain of nearly 17% for the fund’s fiscal year.
Bonds’ advance slowed; challenges may lie ahead
The broad U.S. taxable bond market returned a little more than 2.5% for the fiscal year. That modest result contrasts with the strong returns to which bond investors may have grown accustomed.
| | | |
| Market Barometer | | | |
| |
| | | Average Annual Total Returns |
| | | Periods Ended January 31, 2013 |
| | One | Three | Five |
| | Year | Years | Years |
| Stocks | | | |
| Russell 1000 Index (Large-caps) | 17.03% | 14.48% | 4.28% |
| Russell 2000 Index (Small-caps) | 15.47 | 15.98 | 6.31 |
| Russell 3000 Index (Broad U.S. market) | 16.90 | 14.60 | 4.44 |
| MSCI All Country World Index ex USA (International) | 13.86 | 7.03 | -0.10 |
| |
| Bonds | | | |
| Barclays U.S. Aggregate Bond Index (Broad taxable market) | 2.59% | 5.41% | 5.45% |
| Barclays Municipal Bond Index (Broad tax-exempt market) | 4.80 | 6.53 | 5.73 |
| Citigroup Three-Month U.S. Treasury Bill Index | 0.08 | 0.09 | 0.38 |
| |
| CPI | | | |
| Consumer Price Index | 1.59% | 2.05% | 1.76% |
3
Bonds have been in a long-running bull market, as prices climbed and yields tumbled over many years. (Bond prices and yields move in opposite directions.) Indeed, the yield of the 10-year U.S. Treasury note slipped to a record low in July, closing below 1.5%. Recently, however, that trend reversed, and the 10-year yield broke 2% in late January.
Bonds can provide critical diversification benefits to a portfolio, but their return prospects look much less promising than in recent years. As yields have dropped, the opportunity for price appreciation has greatly diminished. (You can read more about our expectations for bond and stock returns in Vanguard’s Economic and Investment Outlook, available at vanguard.com/research.)
As for money market funds and savings accounts, their returns barely budged as the Federal Reserve held short-term interest rates between 0% and 0.25%, a policy in place since late 2008.
Investors found other options, but dividends were still darlings
Dividend payments are alive and well as many U.S. corporations continue to funnel rising earnings back to shareholders in the form of both recurring and special cash distributions. During the financial crisis, strapped companies reduced or even eliminated dividend payments. But improved profits, large cash positions, and favorable tax rates have helped put the focus back on dividends, to the benefit of the Dividend Appreciation Index Fund.
Expense Ratios
Your Fund Compared With Its Peer Group
| | | |
| | Investor | ETF | Peer Group |
| | Shares | Shares | Average |
| Dividend Appreciation Index Fund | 0.25% | 0.13% | 1.15% |
The fund expense ratios shown are from the prospectus dated May 29, 2012, and represent estimated costs for the current fiscal year. For the fiscal year ended January 31, 2013, the fund’s expense ratios were 0.20% for Investor Shares and 0.10% for ETF Shares. The peer-group expense ratio is derived from data provided by Lipper Inc. and captures information through year-end 2012.
Peer group: Large-Cap Core Funds.
4
In the final months of calendar year 2012, many companies issued special payouts in anticipation of rising tax rates for dividends. Ultimately, the tax rate on qualified dividends rose from 15% to 20% only for upper-income individuals and households.
All ten industry sectors advanced during the period, with the fund’s largest allocation––consumer staples––contributing the most to return. Nearly one-quarter of the fund’s holdings, on average during the period, were in the consumer staples sector, a bastion for dividend-paying stocks. Giant household product corporations, major soft drink companies, supercenters, and drugstores were among the top producers. Many distributed hefty payouts and controlled significant market share in their industries. In some cases, international sales also boosted their bottom lines.
Although the financial sector isn’t one of the fund’s largest, its return of nearly 25% lifted performance. The improved investment climate helped asset managers, while several insurance firms performed well even as they grappled with costs related to Hurricane Sandy. Still, the fund’s allocation to this robust sector was significantly less than its representation in the broader market. Some of the sector’s strongest dividend-payers were forced to abandon their distributions during the financial crisis and didn’t qualify for inclusion in the fund’s universe of potential stocks because they haven’t increased their dividends for ten straight years.
Total Returns
Inception Through January 31, 2013
| |
| | Average |
| | Annual Return |
| Dividend Appreciation Index Fund Investor Shares (Returns since inception: 4/27/2006) | 5.49% |
| Dividend Achievers Select Index | 5.77 |
| Large-Cap Core Funds Average | 3.02 |
| Large-Cap Core Funds Average: Derived from data provided by Lipper Inc. | |
The figures shown represent past performance, which is not a guarantee of future results. (Current performance may be lower or higher than the performance data cited. For performance data current to the most recent month-end, visit our website at vanguard.com/performance.) Note, too, that both investment returns and principal value can fluctuate widely, so an investor’s shares, when sold, could be worth more or less than their original cost.
5
The fund also received double-digit returns from consumer discretionary, materials, energy, utilities, and health care stocks as overall economic expansion and increased spending by consumers and corporations bolstered profits. Long-awaited, if modest, improvement in the housing market has invigorated multiple industries within several of those sectors—homebuilders, home improvement stores, and chemical companies among them.
Dividend-payers have been stock market stalwarts
The Dividend Appreciation Index Fund has recorded an average annual return of 5.49% for Investor Shares since their inception on April 27, 2006, closely tracking its expense-free benchmark.
Although the fund struggled during the financial crisis, its high-quality, dividend-paying stocks helped it weather the extreme volatility better than the broader stock market, which notched an average annual return of 4.37% over the same period (as measured by the Russell 3000 Index). The fund also surpassed the 3.02% showing of its large-cap core fund peers.
Vanguard Equity Investment Group, the investment advisor, is responsible for the fund’s index-tracking success. The group seeks to capture the returns of an index composed of stocks with a long-term record of increasing dividends, a mission backed by its experienced professionals and sophisticated indexing strategies, and Vanguard’s low costs.
Following four principles can help investors succeed
Our clients often ask what they should do to cope with uncertainties in the market. How should they react? Should they do something different with their money?
The first point to keep in mind is that investing has always involved uncertainties. The financier J.P. Morgan, when asked what he thought the stock market would do, had a standard response: “It will fluctuate.”
In our view at Vanguard, the most sensible approach is to focus on what’s within an investor’s control. In short, we believe investors can give themselves a greater chance for success by acting on four key points:
• Goals. What are you investing for? Each goal should be measurable and attainable. Getting there shouldn’t depend on outsize returns, or on impractical budgeting requirements.
• Balance. After identifying your goals, pursue them through a balanced asset allocation using broadly diversified funds.• Cost. You won’t be surprised to hear that we place a big emphasis on controlling cost. The lower your costs, the greater the share of an investment’s return that you keep.
6
• Discipline. All the rest depends on this: In the face of market turmoil, discipline and a long-term perspective can help you stay on track toward reaching your goals.Successful investing doesn’t have to be complicated, but that’s not to say it’s easy. Investing can provoke strong emotions, and it’s hard to stay level-
|
| Investment insight |
| Dividend-growth focus leads to divergence from the broad market |
| As an investor in Vanguard Dividend Appreciation Index Fund, you should be aware |
| that its holdings differ notably from the broad stock market’s, and that its results may |
| too. Your fund seeks to track the Dividend Achievers Select Index, which excludes |
| the stocks of companies that haven’t consistently increased dividends. By contrast, |
| broad market indexes, such as the Russell 3000 Index, include all stocks, those that |
| pay dividends and those that don’t. |
| |
| The difference in approaches is reflected in the weightings of various industry sectors |
| in the indexes (see the accompanying chart). Vanguard generally advises that funds |
| that have a relatively narrow focus, such as the Dividend Appreciation Index Fund, |
| play a supporting—rather than a lead—role in a balanced, diversified portfolio. |
| Dividend Achievers Select Index (sector diversification as of 1/31/2013) |
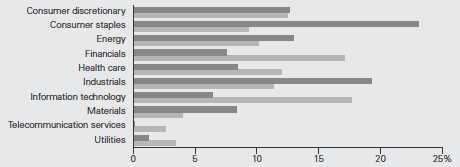
|
| Dividend Achievers Select Index |
| Russell 3000 Index |
Source: Vanguard.
7
headed during times of volatility. If you’re getting pulled off course, try to redirect your attention to the principles I’ve outlined. These principles—which reflect the core philosophy Vanguard has held for decades—can be the answer to uncertainty.
As always, thank you for investing with Vanguard.
Sincerely,

F. William McNabb III
Chairman and Chief Executive Officer
February 13, 2013
8
Dividend Appreciation Index Fund
Fund Profile
As of January 31, 2013
| | |
| Share-Class Characteristics | |
| |
| | Investor | ETF |
| | Shares | Shares |
| Ticker Symbol | VDAIX | VIG |
| Expense Ratio1 | 0.25% | 0.13% |
| 30-Day SEC Yield | 2.06% | 2.12% |
| | | |
| Portfolio Characteristics | | |
| | | | DJ U.S. |
| | | Dividend | Total |
| | | Achievers | Market |
| | | Select | FA |
| | Fund | Index | Index |
| Number of Stocks | 154 | 147 | 3,595 |
| Median Market Cap | $51.2B | $51.2B | $37.6B |
| Price/Earnings Ratio | 15.6x | 15.3x | 17.2x |
| Price/Book Ratio | 3.0x | 2.9x | 2.2x |
| Return on Equity | 23.0% | 23.0% | 16.8% |
| Earnings Growth Rate | 7.9% | 8.0% | 9.1% |
| Dividend Yield | 2.2% | 2.2% | 2.0% |
| Foreign Holdings | 0.0% | 0.0% | 0.0% |
| Turnover Rate | 15% | — | — |
| Short-Term Reserves | 0.2% | — | — |
| | |
| Volatility Measures | | |
| | | DJ U.S. |
| | Dividend | Total |
| | Achievers | Market |
| | Select | FA |
| | Index | Index |
| R-Squared | 1.00 | 0.95 |
| Beta | 1.00 | 0.80 |
These measures show the degree and timing of the fund’s fluctuations compared with the indexes over 36 months.
| | |
| Ten Largest Holdings (% of total net assets) |
| Procter & Gamble Co. | Household Products | 4.3% |
| Wal-Mart Stores Inc. | Hypermarkets & | |
| | Super Centers | 4.1 |
| PepsiCo Inc. | Soft Drinks | 4.1 |
| Coca-Cola Co. | Soft Drinks | 4.0 |
| Chevron Corp. | Integrated Oil & Gas | 4.0 |
| International Business | IT Consulting & | |
| Machines Corp. | Other Services | 4.0 |
| Exxon Mobil Corp. | Integrated Oil & Gas | 3.9 |
| McDonald's Corp. | Restaurants | 3.7 |
| United Technologies | Aerospace & | |
| Corp. | Defense | 3.2 |
| Abbott Laboratories | Health Care | |
| | Equipment | 2.9 |
| Top Ten | | 38.2% |
The holdings listed exclude any temporary cash investments and equity index products.
Investment Focus
1 The expense ratios shown are from the prospectus dated May 29, 2012, and represent estimated costs for the current fiscal year. For the fiscal year ended January 31, 2013, the expense ratios were 0.20% for Investor Shares and 0.10% for ETF Shares.
9
Dividend Appreciation Index Fund
| | | |
| Sector Diversification (% of equity exposure) |
| | | | DJ U.S. |
| | | Dividend | Total |
| | | Achievers | Market |
| | | Select | FA |
| | Fund | Index | Index |
| Consumer Discretionary 13.6% | 12.6% | 12.2% |
| Consumer Staples | 23.2 | 23.0 | 9.3 |
| Energy | 12.5 | 13.0 | 10.4 |
| Financials | 6.8 | 7.6 | 17.2 |
| Health Care | 7.4 | 8.4 | 11.9 |
| Industrials | 19.9 | 19.3 | 11.2 |
| Information Technology | 6.6 | 6.4 | 17.7 |
| Materials | 8.6 | 8.4 | 4.0 |
| Telecommunication | | | |
| Services | 0.1 | 0.1 | 2.6 |
| Utilities | 1.3 | 1.2 | 3.5 |
10
Dividend Appreciation Index Fund
Performance Summary
All of the returns in this report represent past performance, which is not a guarantee of future results that may be achieved by the fund. (Current performance may be lower or higher than the performance data cited. For performance data current to the most recent month-end, visit our website at vanguard.com/performance.) Note, too, that both investment returns and principal value can fluctuate widely, so an investor’s shares, when sold, could be worth more or less than their original cost. The returns shown do not reflect taxes that a shareholder would pay on fund distributions or on the sale of fund shares.
Cumulative Performance: April 27, 2006, Through January 31, 2013
Initial Investment of $10,000
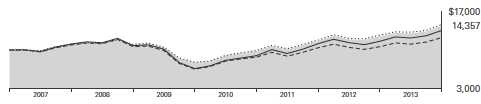
| | | | |
| | | Average Annual Total Returns | |
| | Periods Ended January 31, 2013 | |
| |
| | | | Since | Final Value |
| | One | Five | Inception | of a $10,000 |
| | Year | Years | (4/27/2006) | Investment |
| |
| Dividend Appreciation Index Fund | | | | |
| Investor Shares | 15.15% | 5.59% | 5.49% | $14,357 |
| |
| Dividend Achievers Select Index | 15.34 | 5.86 | 5.77 | 14,615 |
| |
| Large-Cap Core Funds Average | 15.47 | 2.92 | 3.02 | 12,232 |
| Dow Jones U.S. Total Stock Market | | | | |
| Float Adjusted Index | 16.88 | 4.61 | 4.55 | 13,516 |
Large-Cap Core Funds Average: Derived from data provided by Lipper Inc.
"Since Inception" performance is calculated from the Investor Shares’ inception date for both the fund and its comparative standards.
| | | | |
| | | | Since | Final Value |
| | One | Five | Inception | of a $10,000 |
| | Year | Years | (4/21/2006) | Investment |
| Dividend Appreciation Index Fund | | | | |
| ETF Shares Net Asset Value | 15.29% | 5.72% | 5.65% | $14,513 |
| Dividend Achievers Select Index | 15.34 | 5.86 | 5.80 | 14,657 |
| Dow Jones U.S. Total Stock Market Float | | | | |
| Adjusted Index | 16.88 | 4.61 | 4.50 | 13,479 |
"Since Inception" performance is calculated from the ETF Shares’ inception date for both the fund and its comparative standards.
See Financial Highlights for dividend and capital gains information.
11
Dividend Appreciation Index Fund
| | | |
| Cumulative Returns of ETF Shares: April 21, 2006, Through January 31, 2013 | | |
| |
| | | | Since |
| | One | Five | Inception |
| | Year | Years | (4/21/2006) |
| Dividend Appreciation Index Fund ETF | | | |
| Shares Market Price | 15.20% | 32.74% | 45.14% |
| Dividend Appreciation Index Fund ETF | | | |
| Shares Net Asset Value | 15.29 | 32.08 | 45.13 |
| Dividend Achievers Select Index | 15.34 | 32.95 | 46.57 |
"Since Inception" performance is calculated from the ETF Shares’ inception date for both the fund and its comparative standards.
Fiscal-Year Total Returns (%): April 27, 2006, Through January 31, 2013
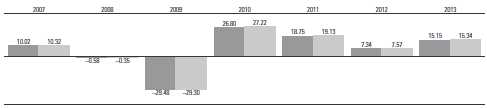
|
| Dividend Appreciation Index Fund Investor Shares |
| Dividend Achievers Select Index |
Average Annual Total Returns: Periods Ended December 31, 2012
This table presents returns through the latest calendar quarter—rather than through the end of the fiscal period.
Securities and Exchange Commission rules require that we provide this information.
| | | | |
| | Inception | One | Five | Since |
| | Date | Year | Years | Inception |
| Investor Shares | 4/27/2006 | 11.50% | 3.46% | 4.66% |
| ETF Shares | 4/21/2006 | | | |
| Market Price | | 11.58 | 3.60 | 4.81 |
| Net Asset Value | | 11.61 | 3.58 | 4.81 |
12
Dividend Appreciation Index Fund
Financial Statements
Statement of Net Assets
As of January 31, 2013
The fund reports a complete list of its holdings in regulatory filings four times in each fiscal year, at the quarter-ends. For the second and fourth fiscal quarters, the lists appear in the fund’s semiannual and annual reports to shareholders. For the first and third fiscal quarters, the fund files the lists with the Securities and Exchange Commission on Form N-Q. Shareholders can look up the fund’s Forms N-Q on the SEC’s website at sec.gov. Forms N-Q may also be reviewed and copied at the SEC’s Public Reference Room (see the back cover of this report for further information).
| | |
| | | Market |
| | | Value• |
| | Shares | ($000) |
| Common Stocks (99.4%)1 | | |
| Consumer Discretionary (13.5%) | |
| McDonald’s Corp. | 6,186,617 | 589,523 |
| Lowe’s Cos. Inc. | 7,173,223 | 273,945 |
| Target Corp. | 4,367,827 | 263,860 |
| NIKE Inc. Class B | 4,758,430 | 257,193 |
| TJX Cos. Inc. | 4,745,876 | 214,419 |
| VF Corp. | 813,354 | 120,035 |
| McGraw-Hill Cos. Inc. | 1,834,403 | 105,515 |
| Ross Stores Inc. | 1,362,570 | 81,345 |
| Genuine Parts Co. | 993,440 | 67,584 |
| Family Dollar Stores Inc. | 913,567 | 51,799 |
| Tiffany & Co. | 777,182 | 51,100 |
| Polaris Industries Inc. | 424,225 | 36,946 |
| John Wiley & Sons Inc. | | |
| Class A | 362,156 | 13,870 |
| Cracker Barrel Old | | |
| Country Store Inc. | 154,547 | 10,018 |
| Matthews International | | |
| Corp. Class A | 185,076 | 6,063 |
| NACCO Industries Inc. | | |
| Class A | 42,045 | 2,740 |
| | | 2,145,955 |
| Consumer Staples (23.3%) | | |
| Procter & Gamble Co. | 9,036,197 | 679,161 |
| Wal-Mart Stores Inc. | 9,385,698 | 656,530 |
| PepsiCo Inc. | 8,869,842 | 646,168 |
| Coca-Cola Co. | 17,188,584 | 640,103 |
| Colgate-Palmolive Co. | 3,100,546 | 332,906 |
| Walgreen Co. | 5,949,481 | 237,741 |
| Archer-Daniels- | | |
| Midland Co. | 4,314,651 | 123,097 |
| JM Smucker Co. | 725,369 | 64,289 |
| Hormel Foods Corp. | 1,607,344 | 55,630 |
| Brown-Forman Corp. | | |
| Class B | 849,135 | 54,939 |
| Church & Dwight Co. Inc. | 920,317 | 53,185 |
| Bunge Ltd. | 660,702 | 52,632 |
| McCormick & Co. Inc. | 841,505 | 52,468 |
| | |
| | | Market |
| | | Value• |
| | Shares | ($000) |
| Nu Skin Enterprises Inc. | | |
| Class A | 415,871 | 17,616 |
| Casey’s General Stores Inc. | 269,386 | 14,743 |
| Lancaster Colony Corp. | 181,170 | 12,946 |
| ^ Tootsie Roll Industries Inc. | 252,536 | 6,844 |
| Andersons Inc. | 115,908 | 5,465 |
| Sanderson Farms Inc. | 402 | 20 |
| | | 3,706,483 |
| Energy (12.4%) | | |
| Chevron Corp. | 5,513,363 | 634,864 |
| Exxon Mobil Corp. | 6,966,140 | 626,744 |
| Occidental | | |
| Petroleum Corp. | 3,697,110 | 326,344 |
| EOG Resources Inc. | 1,795,364 | 224,384 |
| Murphy Oil Corp. | 1,287,856 | 76,653 |
| Helmerich & Payne Inc. | 720,752 | 46,373 |
| Energen Corp. | 465,623 | 22,415 |
| CARBO Ceramics Inc. | 171,099 | 13,707 |
| | | 1,971,484 |
| Financials (6.7%) | | |
| Franklin Resources Inc. | 1,394,060 | 190,819 |
| Aflac Inc. | 3,268,146 | 173,408 |
| ACE Ltd. | 1,589,004 | 135,590 |
| Chubb Corp. | 1,683,034 | 135,164 |
| T. Rowe Price Group Inc. | 1,554,831 | 111,093 |
| WR Berkley Corp. | 865,586 | 35,636 |
| SEI Investments Co. | 1,179,857 | 31,809 |
| HCC Insurance | | |
| Holdings Inc. | 672,426 | 26,009 |
| Eaton Vance Corp. | 718,137 | 25,997 |
| Brown & Brown Inc. | 933,813 | 25,530 |
| PartnerRe Ltd. | 288,288 | 25,280 |
| Erie Indemnity Co. | | |
| Class A | 314,788 | 22,457 |
| Commerce Bancshares Inc. | 578,559 | 21,725 |
| RenaissanceRe | | |
| Holdings Ltd. | 232,016 | 19,870 |
| Prosperity Bancshares Inc. | 352,935 | 15,921 |
13
| | |
| Dividend Appreciation Index Fund | |
| |
| |
| |
| | | Market |
| | | Value |
| | Shares | ($000) |
| AlterraCapital | | |
| Holdings Ltd. | 492,984 | 15,021 |
| UMB Financial Corp. | 279,804 | 12,387 |
| StanCorp Financial | | |
| Group Inc. | 289,572 | 11,261 |
| RLI Corp. | 132,775 | 9,163 |
| Bank of the Ozarks Inc. | 236,747 | 8,599 |
| Bancfirst Corp. | 114,349 | 4,677 |
| 1stSource Corp. | 182,391 | 4,122 |
| Republic Bancorp Inc. | | |
| Class A | 141,160 | 3,172 |
| First Financial Corp. | 104,283 | 3,146 |
| Southside Bancshares Inc. | 15,679 | 331 |
| Westamerica | | |
| Bancorporation | 516 | 23 |
| | | 1,068,210 |
| Health Care (7.3%) | | |
| AbbottLaboratories | 13,721,164 | 464,873 |
| Medtronic Inc. | 5,990,488 | 279,157 |
| Stryker Corp. | 2,261,756 | 141,699 |
| Becton Dickinson and Co. | 1,272,489 | 106,940 |
| Cardinal Health Inc. | 2,184,956 | 95,723 |
| CRBard Inc. | 542,193 | 55,342 |
| Owens& Minor Inc. | 427,364 | 13,081 |
| West Pharmaceutical | | |
| Services Inc. | 214,833 | 12,720 |
| | | 1,169,535 |
| Industrials (19.8%) | | |
| United | | |
| Technologies Corp. | 5,850,660 | 512,342 |
| 3MCo. | 4,323,825 | 434,761 |
| Caterpillar Inc. | 4,264,920 | 419,625 |
| EmersonElectric Co. | 4,858,408 | 278,144 |
| IllinoisTool Works Inc. | 2,986,234 | 187,625 |
| General Dynamics Corp. | 2,322,613 | 153,989 |
| Norfolk Southern Corp. | 1,976,609 | 136,129 |
| WW Grainger Inc. | 452,116 | 98,480 |
| Fastenal Co. | 1,963,795 | 97,561 |
| Parker Hannifin Corp. | 941,686 | 87,548 |
| Stanley Black & | | |
| Decker Inc. | 1,118,196 | 85,911 |
| Dover Corp. | 1,218,107 | 84,269 |
| Roper Industries Inc. | 635,046 | 74,586 |
| CHRobinson | | |
| Worldwide Inc. | 1,066,074 | 70,521 |
| Pentair Ltd. | 1,212,902 | 61,470 |
| Expeditors International | | |
| of Washington Inc. | 1,329,906 | 57,053 |
| Donaldson Co. Inc. | 912,225 | 34,309 |
| Cintas Corp. | 797,884 | 33,719 |
| Lincoln Electric | | |
| Holdings Inc. | 514,030 | 27,722 |
| Nordson Corp. | 406,317 | 27,475 |
| Valmont Industries Inc. | 176,764 | 25,758 |
| | | |
| | | | Market |
| | | | Value |
| | | Shares | ($000) |
| | Carlisle Cos. Inc. | 392,754 | 25,195 |
| | Graco Inc. | 386,816 | 22,126 |
| | AO Smith Corp. | 251,147 | 17,399 |
| | CLARCORInc. | 321,817 | 16,239 |
| | Rollins Inc. | 628,095 | 15,526 |
| | Mine Safety Appliances Co. | 242,386 | 11,203 |
| | Brady Corp. Class A | 319,316 | 11,141 |
| | Franklin Electric Co. Inc. | 155,902 | 10,371 |
| | ABMIndustries Inc. | 339,591 | 7,444 |
| | Lindsay Corp. | 73,891 | 6,875 |
| | Raven Industries Inc. | 231,398 | 6,232 |
| | Tennant Co. | 126,558 | 5,827 |
| | McGrath RentCorp | 173,377 | 5,182 |
| | Gorman-Rupp Co. | 149,021 | 4,529 |
| | | | 3,154,286 |
| Information Technology (6.5%) | |
| | International Business | | |
| | Machines Corp. | 3,112,900 | 632,137 |
| | Automatic Data | | |
| | Processing Inc. | 3,201,474 | 189,815 |
| | Maxim Integrated | | |
| | Products Inc. | 1,857,400 | 58,415 |
| | Linear Technology Corp. | 1,570,017 | 57,494 |
| | Harris Corp. | 770,738 | 35,608 |
| | FactSet Research | | |
| | Systems Inc. | 289,687 | 26,802 |
| | Jack Henry & | | |
| | Associates Inc. | 543,670 | 22,552 |
| | Badger Meter Inc. | 97,560 | 4,828 |
| | Cass Information | | |
| | Systems Inc. | 91,562 | 3,553 |
| | | | 1,031,204 |
| Materials (8.5%) | | |
| | Monsanto Co. | 3,357,971 | 340,330 |
| | Praxair Inc. | 1,963,204 | 216,679 |
| | Ecolab Inc. | 1,976,731 | 143,115 |
| ^ | PPG Industries Inc. | 965,644 | 133,133 |
| | Air Products & | | |
| | Chemicals Inc. | 1,374,685 | 120,189 |
| | Sherwin-WilliamsCo. | 657,331 | 106,580 |
| | Sigma-Aldrich Corp. | 773,916 | 59,847 |
| | Valspar Corp. | 570,097 | 37,786 |
| | AlbemarleCorp. | 609,257 | 37,354 |
| | International Flavors & | | |
| | Fragrances Inc. | 515,000 | 36,271 |
| | Royal Gold Inc. | 442,613 | 33,050 |
| | RPM International Inc. | 821,589 | 25,642 |
| | Bemis Co. Inc. | 675,296 | 24,095 |
| | Aptargroup Inc. | 413,008 | 21,282 |
| | HB Fuller Co. | 310,333 | 12,128 |
| | Stepan Co. | 144,090 | 8,452 |
| | Axiall Corp. | 23,904 | 1,343 |
| | | | 1,357,276 |
14
| | |
| Dividend Appreciation Index Fund | |
| |
| |
| |
| | | Market |
| | | Value• |
| | Shares | ($000) |
| Telecommunication Services (0.1%) | |
| Telephone & Data | | |
| Systems Inc. | 611,924 | 15,475 |
| Atlantic Tele-Network Inc. | 106,646 | 4,616 |
| | | 20,091 |
| Utilities (1.3%) | | |
| ONEOK Inc. | 1,240,451 | 58,314 |
| National Fuel Gas Co. | 560,198 | 30,475 |
| MDU Resources | | |
| Group Inc. | 1,189,873 | 27,748 |
| Aqua America Inc. | 916,238 | 24,949 |
| UGI Corp. | 638,969 | 22,517 |
| South Jersey | | |
| Industries Inc. | 196,576 | 10,670 |
| MGE Energy Inc. | 151,094 | 7,916 |
| American States Water Co. | 128,688 | 6,505 |
| SJW Corp. | 124,384 | 3,373 |
| Northeast Utilities | 66,513 | 2,709 |
| Connecticut Water | | |
| Service Inc. | 59,793 | 1,772 |
| York Water Co. | 83,300 | 1,575 |
| Questar Corp. | 36,620 | 851 |
| New Jersey | | |
| Resources Corp. | 792 | 33 |
| | | 199,407 |
| Total Common Stocks | | |
| (Cost $13,342,328) | | 15,823,931 |
| Temporary Cash Investment (0.5%)1 | |
| Money Market Fund (0.5%) | | |
| 2,3 Vanguard Market | | |
| Liquidity Fund, 0.143% | | |
| (Cost $89,342) | 89,342,216 | 89,342 |
| Total Investments (99.9%) | | |
| (Cost $13,431,670) | | 15,913,273 |
| Other Assets and Liabilities (0.1%) | |
| Other Assets | | 1,540,782 |
| Liabilities3 | | (1,531,532) |
| | | 9,250 |
| Net Assets (100%) | | 15,922,523 |
| |
| | Market |
| | Value• |
| | ($000) |
| Statement of Assets and Liabilities | |
| Assets | |
| Investments in Securities, at Value | |
| Unaffiliated Issuers | 15,823,931 |
| Affiliated Vanguard Funds | 89,342 |
| Total Investments in Securities | 15,913,273 |
| Receivables for Investment | |
| Securities Sold | 1,518,030 |
| Receivables for Capital Shares Issued | 4,573 |
| Other Assets | 18,179 |
| Total Assets | 17,454,055 |
| Liabilities | |
| Payables for Investment | |
| Securities Purchased | 1,425,957 |
| Security Lending Collateral | |
| Payable to Brokers | 84,536 |
| Other Liabilities | 21,039 |
| Total Liabilities | 1,531,532 |
| Net Assets | 15,922,523 |
15
Dividend Appreciation Index Fund
| |
| At January 31, 2013, net assets consisted of: |
| | Amount |
| | ($000) |
| Paid-in Capital | 13,680,779 |
| Undistributed Net Investment Income | 7,013 |
| Accumulated Net Realized Losses | (246,770) |
| Unrealized Appreciation (Depreciation) | |
| Investment Securities | 2,481,603 |
| Futures Contracts | (102) |
| Net Assets | 15,922,523 |
| |
| |
| Investor Shares—Net Assets | |
| Applicable to 111,111,256 outstanding | |
| $.001 par value shares of beneficial | |
| interest (unlimited authorization) | 2,803,797 |
| Net Asset Value Per Share— | |
| Investor Shares | $25.23 |
| |
| |
| ETF Shares—Net Assets | |
| Applicable to 207,985,114 outstanding | |
| $.001 par value shares of beneficial | |
| interest (unlimited authorization) | 13,118,726 |
| Net Asset Value Per Share— | |
| ETF Shares | $63.08 |
See Note A in Notes to Financial Statements.
^ Part of security position is on loan to broker-dealers. The total value of securities on loan is $80,967,000.
1 The fund invests a portion of its cash reserves in equity markets through the use of index futures contracts. After giving effect to futures investments, the fund’s effective common stock and temporary cash investment positions represent 99.8% and 0.1%, respectively, of net assets.
2 Affiliated money market fund available only to Vanguard funds and certain trusts and accounts managed by Vanguard. Rate shown is the 7-day yield.
3 Includes $84,536,000 of collateral received for securities on loan.
See accompanying Notes, which are an integral part of the Financial Statements.
16
| |
| Dividend Appreciation Index Fund | |
| |
| |
| Statement of Operations | |
| |
| | Year Ended |
| | January 31, 2013 |
| | ($000) |
| Investment Income | |
| Income | |
| Dividends | 347,782 |
| Interest1 | 8 |
| Security Lending | 622 |
| Total Income | 348,412 |
| Expenses | |
| The Vanguard Group—Note B | |
| Investment Advisory Services | 845 |
| Management and Administrative—Investor Shares | 4,010 |
| Management and Administrative—ETF Shares | 7,242 |
| Marketing and Distribution—Investor Shares | 652 |
| Marketing and Distribution—ETF Shares | 3,021 |
| Custodian Fees | 109 |
| Auditing Fees | 27 |
| Shareholders’ Reports—Investor Shares | 27 |
| Shareholders’ Reports—ETF Shares | 314 |
| Trustees’ Fees and Expenses | 14 |
| Total Expenses | 16,261 |
| Net Investment Income | 332,151 |
| Realized Net Gain (Loss) on Investment Securities Sold | 481,383 |
| Change in Unrealized Appreciation (Depreciation) | |
| Investment Securities | 1,192,563 |
| Futures Contracts | (102) |
| Change in Unrealized Appreciation (Depreciation) | 1,192,461 |
| Net Increase (Decrease) in Net Assets Resulting from Operations | 2,005,995 |
| 1 Interest income from an affiliated company of the fund was $8,000. | |
See accompanying Notes, which are an integral part of the Financial Statements.
17
| | |
| Dividend Appreciation Index Fund | | |
| |
| |
| Statement of Changes in Net Assets | | |
| |
| | Year Ended January 31, |
| | 2013 | 2012 |
| | ($000) | ($000) |
| Increase (Decrease) in Net Assets | | |
| Operations | | |
| Net Investment Income | 332,151 | 195,210 |
| Realized Net Gain (Loss) | 481,383 | (953) |
| Change in Unrealized Appreciation (Depreciation) | 1,192,461 | 547,378 |
| Net Increase (Decrease) in Net Assets Resulting from Operations | 2,005,995 | 741,635 |
| Distributions | | |
| Net Investment Income | | |
| Investor Shares | (56,344) | (35,636) |
| ETFShares | (276,499) | (156,111) |
| Realized Capital Gain | | |
| Investor Shares | — | — |
| ETFShares | — | — |
| Total Distributions | (332,843) | (191,747) |
| Capital Share Transactions | | |
| Investor Shares | 295,165 | 687,152 |
| ETFShares | 2,071,585 | 4,240,039 |
| Net Increase (Decrease) from Capital Share Transactions | 2,366,750 | 4,927,191 |
| Total Increase (Decrease) | 4,039,902 | 5,477,079 |
| Net Assets | | |
| Beginning of Period | 11,882,621 | 6,405,542 |
| End of Period1 | 15,922,523 | 11,882,621 |
| 1 Net Assets—End of Period includes undistributed net investment income of $7,013,000 and $7,705,000. | |
See accompanying Notes, which are an integral part of the Financial Statements.
18
| | | | | |
| Dividend Appreciation Index Fund | | | | | |
| |
| |
| Financial Highlights | | | | | |
| |
| |
| Investor Shares | | | | | |
| |
| |
| For a Share Outstanding | | | Year Ended January 31, |
| Throughout Each Period | 2013 | 2012 | 2011 | 2010 | 2009 |
| Net Asset Value, Beginning of Period | $22.42 | $21.33 | $18.33 | $14.79 | $21.40 |
| Investment Operations | | | | | |
| Net Investment Income | .538 | .445 | .392 | .369 | .387 |
| Net Realized and Unrealized Gain (Loss) | | | | | |
| on Investments | 2.812 | 1.089 | 3.006 | 3.543 | (6.614) |
| Total from Investment Operations | 3.350 | 1.534 | 3.398 | 3.912 | (6.227) |
| Distributions | | | | | |
| Dividends from Net Investment Income | (.540) | (.444) | (.398) | (.372) | (.383) |
| Distributions from Realized Capital Gains | — | — | — | — | — |
| Total Distributions | (.540) | (.444) | (.398) | (.372) | (.383) |
| Net Asset Value, End of Period | $25.23 | $22.42 | $21.33 | $18.33 | $14.79 |
| |
| Total Return1 | 15.15% | 7.34% | 18.75% | 26.80% | -29.48% |
| |
| Ratios/Supplemental Data | | | | | |
| Net Assets, End of Period (Millions) | $2,804 | $2,206 | $1,421 | $613 | $386 |
| Ratio of Total Expenses to | | | | | |
| Average Net Assets | 0.20% | 0.25% | 0.30% | 0.35% | 0.36% |
| Ratio of Net Investment Income to | | | | | |
| Average Net Assets | 2.32% | 2.14% | 2.13% | 2.24% | 2.25% |
| Portfolio Turnover Rate2 | 15% | 14% | 15% | 20% | 34% |
1 Total returns do not include account service fees that may have applied in the periods shown. Fund prospectuses provide information about any applicable account service fees.
2 Excludes the value of portfolio securities received or delivered as a result of in-kind purchases or redemptions of the fund’s capital shares, including ETF Creation Units.
See accompanying Notes, which are an integral part of the Financial Statements.
19
| | | | | |
| Dividend Appreciation Index Fund | | | | | |
| |
| |
| Financial Highlights | | | | | |
| |
| |
| ETF Shares | | | | | |
| |
| |
| For a Share Outstanding | | | Year Ended January 31, |
| Throughout Each Period | 2013 | 2012 | 2011 | 2010 | 2009 |
| Net Asset Value, Beginning of Period | $56.04 | $53.32 | $45.81 | $36.96 | $53.48 |
| Investment Operations | | | | | |
| Net Investment Income | 1.401 | 1.173 | 1.034 | .973 | 1.032 |
| Net Realized and Unrealized Gain (Loss) | | | | | |
| on Investments | 7.049 | 2.719 | 7.524 | 8.856 | (16.526) |
| Total from Investment Operations | 8.450 | 3.892 | 8.558 | 9.829 | (15.494) |
| Distributions | | | | | |
| Dividends from Net Investment Income | (1.410) | (1.172) | (1.048) | (.979) | (1.026) |
| Distributions from Realized Capital Gains | — | — | — | — | — |
| Total Distributions | (1.410) | (1.172) | (1.048) | (.979) | (1.026) |
| Net Asset Value, End of Period | $63.08 | $56.04 | $53.32 | $45.81 | $36.96 |
| |
| Total Return | 15.29% | 7.46% | 18.91% | 26.95% | -29.38% |
| |
| Ratios/Supplemental Data | | | | | |
| Net Assets, End of Period (Millions) | $13,119 | $9,677 | $4,985 | $1,918 | $805 |
| Ratio of Total Expenses to | | | | | |
| Average Net Assets | 0.10% | 0.13% | 0.18% | 0.23% | 0.24% |
| Ratio of Net Investment Income to | | | | | |
| Average Net Assets | 2.42% | 2.26% | 2.25% | 2.36% | 2.37% |
| Portfolio Turnover Rate1 | 15% | 14% | 15% | 20% | 34% |
1 Excludes the value of portfolio securities received or delivered as a result of in-kind purchases or redemptions of the fund’s capital shares, including ETF Creation Units.
See accompanying Notes, which are an integral part of the Financial Statements.
20
Dividend Appreciation Index Fund
Notes to Financial Statements
Vanguard Dividend Appreciation Index Fund is registered under the Investment Company Act of 1940 as an open-end investment company, or mutual fund. The fund offers two classes of shares: Investor Shares and ETF Shares. Investor Shares are available to any investor who meets the fund’s minimum purchase requirements. ETF Shares are listed for trading on NYSE Arca; they can be purchased and sold through a broker.
A. The following significant accounting policies conform to generally accepted accounting principles for U.S. mutual funds. The fund consistently follows such policies in preparing its financial statements.
1. Security Valuation: Securities are valued as of the close of trading on the New York Stock Exchange (generally 4 p.m., Eastern time) on the valuation date. Equity securities are valued at the latest quoted sales prices or official closing prices taken from the primary market in which each security trades; such securities not traded on the valuation date are valued at the mean of the latest quoted bid and asked prices. Securities for which market quotations are not readily available, or whose values have been materially affected by events occurring before the fund’s pricing time but after the close of the securities’ primary markets, are valued by methods deemed by the board of trustees to represent fair value. Investments in Vanguard Market Liquidity Fund are valued at that fund’s net asset value.
2. Futures Contracts: The fund uses index futures contracts to a limited extent, with the objectives of maintaining full exposure to the stock market, enhancing returns, maintaining liquidity, and minimizing transaction costs. The fund may purchase futures contracts to immediately invest incoming cash in the market, or sell futures in response to cash outflows, thereby simulating a fully invested position in the underlying index while maintaining a cash balance for liquidity. The fund may seek to enhance returns by using futures contracts instead of the underlying securities when futures are believed to be priced more attractively than the underlying securities. The primary risks associated with the use of futures contracts are imperfect correlation between changes in market values of stocks held by the fund and the prices of futures contracts, and the possibility of an illiquid market.
Futures contracts are valued at their quoted daily settlement prices. The aggregate principal amounts of the contracts are not recorded in the Statement of Net Assets. Fluctuations in the value of the contracts are recorded in the Statement of Net Assets as an asset (liability) and in the Statement of Operations as unrealized appreciation (depreciation) until the contracts are closed, when they are recorded as realized futures gains (losses).
During the year ended January 31, 2013, the fund’s average investment in futures contracts represented less than 1% of net assets, based on quarterly average aggregate settlement values.
3. Federal Income Taxes: The fund intends to continue to qualify as a regulated investment company and distribute all of its taxable income. Management has analyzed the fund’s tax positions taken for all open federal income tax years (January 31, 2010–2013), and has concluded that no provision for federal income tax is required in the fund’s financial statements.
4. Distributions: Distributions to shareholders are recorded on the ex-dividend date.
5. Security Lending: The fund may lend its securities to qualified institutional borrowers to earn additional income. Security loans are required to be secured at all times by collateral at least equal to the market value of securities loaned. The fund invests cash collateral received in Vanguard Market Liquidity Fund, and records a liability for the return of the collateral, during the period the securities are on loan. Security lending income represents fees charged to borrowers plus income earned on investing cash collateral, less expenses associated with the loan.
21
Dividend Appreciation Index Fund
6. Other: Dividend income is recorded on the ex-dividend date. Interest income includes income distributions received from Vanguard Market Liquidity Fund and is accrued daily. Security transactions are accounted for on the date securities are bought or sold. Costs used to determine realized gains (losses) on the sale of investment securities are those of the specific securities sold.
Each class of shares has equal rights as to assets and earnings, except that each class separately bears certain class-specific expenses related to maintenance of shareholder accounts (included in Management and Administrative expenses) and shareholder reporting. Marketing and distribution expenses are allocated to each class of shares based on a method approved by the board of trustees. Income, other non-class-specific expenses, and gains and losses on investments are allocated to each class of shares based on its relative net assets.
B. The Vanguard Group furnishes at cost investment advisory, corporate management, administrative, marketing, and distribution services. The costs of such services are allocated to the fund under methods approved by the board of trustees. The fund has committed to provide up to 0.40% of its net assets in capital contributions to Vanguard. At January 31, 2013, the fund had contributed capital of $1,978,000 to Vanguard (included in Other Assets), representing 0.01% of the fund’s net assets and 0.79% of Vanguard’s capitalization. The fund’s trustees and officers are also directors and officers of Vanguard.
C. Various inputs may be used to determine the value of the fund’s investments. These inputs are summarized in three broad levels for financial statement purposes. The inputs or methodologies used to value securities are not necessarily an indication of the risk associated with investing in those securities.
Level 1—Quoted prices in active markets for identical securities.
Level 2—Other significant observable inputs (including quoted prices for similar securities, interest rates, prepayment speeds, credit risk, etc.).
Level 3—Significant unobservable inputs (including the fund’s own assumptions used to determine the fair value of investments).
At January 31, 2013, 100% of the market value of the fund’s investments was determined based on Level 1 inputs.
D. At January 31, 2013, the aggregate settlement value of open futures contracts and the related unrealized appreciation (depreciation) were:
| | | | |
| | | | | ($000) |
| | | | Aggregate | |
| | | Number of | Settlement | Unrealized |
| | | Long (Short) | Value | Appreciation |
| Futures Contracts | Expiration | Contracts | Long (Short) | (Depreciation) |
| E-mini S&P 500 Index | March 2013 | 1,000 | 74,665 | (102) |
Unrealized appreciation (depreciation) on open futures contracts is required to be treated as realized gain (loss) for tax purposes.
E. Distributions are determined on a tax basis and may differ from net investment income and realized capital gains for financial reporting purposes. Differences may be permanent or temporary. Permanent differences are reclassified among capital accounts in the financial statements to reflect their tax character. Temporary differences arise when certain items of income, expense, gain, or loss
22
Dividend Appreciation Index Fund
are recognized in different periods for financial statement and tax purposes; these differences will reverse at some time in the future. Differences in classification may also result from the treatment of short-term gains as ordinary income for tax purposes.
During the year ended January 31, 2013, the fund realized $425,345,000 of net capital gains resulting from in-kind redemptions—in which shareholders exchanged fund shares for securities held by the fund rather than for cash. Because such gains are not taxable to the fund, and are not distributed to shareholders, they have been reclassified from accumulated net realized losses to paid-in capital.
For tax purposes, at January 31, 2013, the fund had $12,380,000 of ordinary income available for distribution. The fund used capital loss carryforwards of $37,303,000 to offset taxable capital gains realized during the year ended January 31, 2013. At January 31, 2013, the fund had available capital losses totaling $246,844,000 to offset future net capital gains. Of this amount, $191,649,000 is subject to expiration dates; $609,000 may be used to offset future net capital gains through January 31, 2016, $22,242,000 through January 31, 2017, $146,149,000 through January 31, 2018, and $22,649,000 through January 31, 2019. Capital losses of $55,195,000 realized beginning in fiscal 2012 may be carried forward indefinitely under the Regulated Investment Company Modernization Act of 2010, but must be used before any expiring loss carryforwards.
At January 31, 2013, the cost of investment securities for tax purposes was $13,431,698,000. Net unrealized appreciation of investment securities for tax purposes was $2,481,575,000, consisting of unrealized gains of $2,526,715,000 on securities that had risen in value since their purchase and $45,140,000 in unrealized losses on securities that had fallen in value since their purchase.
F. During the year ended January 31, 2013, the fund purchased $5,629,072,000 of investment securities and sold $3,364,163,000 of investment securities, other than temporary cash investments. Purchases and sales include $3,343,152,000 and $1,269,889,000, respectively, in connection with in-kind purchases and redemptions of the fund’s capital shares.
G. Capital share transactions for each class of shares were:
| | | | |
| | | | Year Ended January 31, |
| | | 2013 | | 2012 |
| | Amount | Shares | Amount | Shares |
| | ($000) | (000) | ($000) | (000) |
| Investor Shares | | | | |
| Issued | 952,479 | 40,707 | 1,067,783 | 49,431 |
| Issued in Lieu of Cash Distributions | 46,434 | 1,980 | 30,641 | 1,454 |
| Redeemed | (703,748) | (29,978) | (411,272) | (19,093) |
| Net Increase (Decrease)—Investor Shares | 295,165 | 12,709 | 687,152 | 31,792 |
| ETF Shares | | | | |
| Issued | 3,350,319 | 56,407 | 4,439,908 | 82,895 |
| Issued in Lieu of Cash Distributions | — | — | — | — |
| Redeemed | (1,278,734) | (21,100) | (199,869) | (3,700) |
| Net Increase (Decrease)—ETF Shares | 2,071,585 | 35,307 | 4,240,039 | 79,195 |
H. In preparing the financial statements as of January 31, 2013, management considered the impact of subsequent events for potential recognition or disclosure in these financial statements.
23
Report of Independent Registered
Public Accounting Firm
To the Trustees of Vanguard Specialized Funds and the Shareholders of Vanguard Dividend Appreciation Index Fund:
In our opinion, the accompanying statement of net assets and statement of assets and liabilities and the related statements of operations and of changes in net assets and the financial highlights present fairly, in all material respects, the financial position of Vanguard Dividend Appreciation Index Fund (constituting a separate portfolio of Vanguard Specialized Funds, hereafter referred to as the “Fund”) at January 31, 2013, the results of its operations for the year then ended, the changes in its net assets for each of the two years in the period then ended and the financial highlights for each of the five years in the period then ended, in conformity with accounting principles generally accepted in the United States of America. These financial statements and financial highlights (hereafter referred to as “financial statements”) are the responsibility of the Fund’s management; our responsibility is to express an opinion on these financial statements based on our audits. We conducted our audits of these financial statements in accordance with the standards of the Public Company Accounting Oversight Board (United States). Those standards require that we plan and perform the audit to obtain reasonable assurance about whether the financial statements are free of material misstatement. An audit includes examining, on a test basis, evidence supporting the amounts and disclosures in the financial statements, assessing the accounting principles used and significant estimates made by management, and evaluating the overall financial statement presentation. We believe that our audits, which included confirmation of securities at January 31, 2013 by correspondence with the custodian and broker and by agreement to the underlying ownership records of the transfer agent, provide a reasonable basis for our opinion.
PricewaterhouseCoopers LLP
Philadelphia, Pennsylvania
March 13, 2013
| |
| Special 2012 tax information (unaudited) for Vanguard Dividend Appreciation Index Fund |
This information for the fiscal year ended January 31, 2013, is included pursuant to provisions of the Internal Revenue Code.
The fund distributed $332,843,000 of qualified dividend income to shareholders during the fiscal year.
For corporate shareholders, 100% of investment income (dividend income plus short-term gains, if any) qualifies for the dividends-received deduction.
24
Your Fund’s After-Tax Returns
This table presents returns for your fund both before and after taxes. The after-tax returns are shown in two ways: (1) assuming that an investor owned the fund during the entire period and paid taxes on the fund’s distributions, and (2) assuming that an investor paid taxes on the fund’s distributions and sold all shares at the end of each period.
Calculations are based on the highest individual federal income tax and capital gains tax rates in effect at the times of the distributions and the hypothetical sales. State and local taxes were not considered. After-tax returns reflect any qualified dividend income, using actual prior-year figures and estimates for 2013. (In the example, returns after the sale of fund shares may be higher than those assuming no sale. This occurs when the sale would have produced a capital loss. The calculation assumes that the investor received a tax deduction for the loss.)
The table shows returns for Investor Shares only; returns for other share classes will differ. Please note that your actual after-tax returns will depend on your tax situation and may differ from those shown. Also note that if you own the fund in a tax-deferred account, such as an individual retirement account or a 401(k) plan, this information does not apply to you. Such accounts are not subject to current taxes.
Finally, keep in mind that a fund’s performance—whether before or after taxes—does not guarantee future results.
Average Annual Total Returns: Dividend Appreciation Index Fund Investor Shares
Periods Ended January 31, 2013
| | | |
| | | | Since |
| | One | Five | Inception |
| | Year | Years | (4/27/2006) |
| Returns Before Taxes | 15.15% | 5.59% | 5.49% |
| Returns After Taxes on Distributions | 14.75 | 5.25 | 5.18 |
| Returns After Taxes on Distributions and Sale of | | | |
| Fund Shares | 9.25 | 4.45 | 4.41 |
25
About Your Fund’s Expenses
As a shareholder of the fund, you incur ongoing costs, which include costs for portfolio management, administrative services, and shareholder reports (like this one), among others. Operating expenses, which are deducted from a fund’s gross income, directly reduce the investment return of the fund.
A fund’s expenses are expressed as a percentage of its average net assets. This figure is known as the expense ratio. The following examples are intended to help you understand the ongoing costs (in dollars) of investing in your fund and to compare these costs with those of other mutual funds. The examples are based on an investment of $1,000 made at the beginning of the period shown and held for the entire period.
The accompanying table illustrates your fund’s costs in two ways:
• Based on actual fund return. This section helps you to estimate the actual expenses that you paid over the period. The ”Ending Account Value“ shown is derived from the fund‘s actual return, and the third column shows the dollar amount that would have been paid by an investor who started with $1,000 in the fund. You may use the information here, together with the amount you invested, to estimate the expenses that you paid over the period.
To do so, simply divide your account value by $1,000 (for example, an $8,600 account value divided by $1,000 = 8.6), then multiply the result by the number given for your fund under the heading ”Expenses Paid During Period.“
• Based on hypothetical 5% yearly return. This section is intended to help you compare your fund‘s costs with those of other mutual funds. It assumes that the fund had a yearly return of 5% before expenses, but that the expense ratio is unchanged. In this case—because the return used is not the fund’s actual return—the results do not apply to your investment. The example is useful in making comparisons because the Securities and Exchange Commission requires all mutual funds to calculate expenses based on a 5% return. You can assess your fund’s costs by comparing this hypothetical example with the hypothetical examples that appear in shareholder reports of other funds.
Note that the expenses shown in the table are meant to highlight and help you compare ongoing costs only and do not reflect transaction costs incurred by the fund for buying and selling securities. Further, the expenses do not include any purchase, redemption, or account service fees described in the fund prospectus. If such fees were applied to your account, your costs would be higher. Your fund does not carry a “sales load.”
The calculations assume no shares were bought or sold during the period. Your actual costs may have been higher or lower, depending on the amount of your investment and the timing of any purchases or redemptions.
You can find more information about the fund’s expenses, including annual expense ratios, in the Financial Statements section of this report. For additional information on operating expenses and other shareholder costs, please refer to your fund’s current prospectus.
26
| | | |
| Six Months Ended January 31, 2013 | | | |
| | Beginning | Ending | Expenses |
| | Account Value | Account Value | Paid During |
| Dividend Appreciation Index Fund | 7/31/2012 | 1/31/2013 | Period |
| Based on Actual Fund Return | | | |
| Investor Shares | $1,000.00 | $1,105.27 | $0.90 |
| ETF Shares | 1,000.00 | 1,106.08 | 0.53 |
| Based on Hypothetical 5% Yearly Return | | | |
| Investor Shares | $1,000.00 | $1,024.35 | $0.87 |
| ETF Shares | 1,000.00 | 1,024.70 | 0.51 |
The calculations are based on expenses incurred in the most recent six-month period. The fund’s annualized six-month expense ratios for that period are 0.17% for Investor Shares and 0.10% for ETF Shares. The dollar amounts shown as “Expenses Paid” are equal to the annualized expense ratio multiplied by the average account value over the period, multiplied by the number of days in the most recent six-month period, then divided by the number of days in the most recent 12-month period.
27
Glossary
30-Day SEC Yield. A fund’s 30-day SEC yield is derived using a formula specified by the U.S. Securities and Exchange Commission. Under the formula, data related to the fund’s security holdings in the previous 30 days are used to calculate the fund’s hypothetical net income for that period, which is then annualized and divided by the fund’s estimated average net assets over the calculation period. For the purposes of this calculation, a security’s income is based on its current market yield to maturity (for bonds), its actual income (for asset-backed securities), or its projected dividend yield (for stocks). Because the SEC yield represents hypothetical annualized income, it will differ—at times significantly—from the fund’s actual experience. As a result, the fund’s income distributions may be higher or lower than implied by the SEC yield.
Beta. A measure of the magnitude of a fund’s past share-price fluctuations in relation to the ups and downs of a given market index. The index is assigned a beta of 1.00. Compared with a given index, a fund with a beta of 1.20 typically would have seen its share price rise or fall by 12% when the index rose or fell by 10%. For this report, beta is based on returns over the past 36 months for both the fund and the index. Note that a fund’s beta should be reviewed in conjunction with its R-squared (see definition). The lower the R-squared, the less correlation there is between the fund and the index, and the less reliable beta is as an indicator of volatility.
Dividend Yield. Dividend income earned by stocks, expressed as a percentage of the aggregate market value (or of net asset value, for a fund). The yield is determined by dividing the amount of the annual dividends by the aggregate value (or net asset value) at the end of the period. For a fund, the dividend yield is based solely on stock holdings and does not include any income produced by other investments.
Earnings Growth Rate. The average annual rate of growth in earnings over the past five years for the stocks now in a fund.
Equity Exposure. A measure that reflects a fund’s investments in stocks and stock futures. Any holdings in short-term reserves are excluded.
Expense Ratio. A fund’s total annual operating expenses expressed as a percentage of the fund’s average net assets. The expense ratio includes management and administrative expenses, but does not include the transaction costs of buying and selling portfolio securities.
Foreign Holdings. The percentage of a fund represented by securities or depositary receipts of companies based outside the United States.
Inception Date. The date on which the assets of a fund (or one of its share classes) are first invested in accordance with the fund’s investment objective. For funds with a subscription period, the inception date is the day after that period ends. Investment performance is measured from the inception date.
Median Market Cap. An indicator of the size of companies in which a fund invests; the midpoint of market capitalization (market price x shares outstanding) of a fund’s stocks, weighted by the proportion of the fund’s assets invested in each stock. Stocks representing half of the fund’s assets have market capitalizations above the median, and the rest are below it.
Price/Book Ratio. The share price of a stock divided by its net worth, or book value, per share. For a fund, the weighted average price/book ratio of the stocks it holds.
28
Price/Earnings Ratio. The ratio of a stock’s current price to its per-share earnings over the past year. For a fund, the weighted average P/E of the stocks it holds. P/E is an indicator of market expectations about corporate prospects; the higher the P/E, the greater the expectations for a company’s future growth.
R-Squared. A measure of how much of a fund’s past returns can be explained by the returns from the market in general, as measured by a given index. If a fund’s total returns were precisely synchronized with an index’s returns, its R-squared would be 1.00. If the fund’s returns bore no relationship to the index’s returns, its R-squared would be 0. For this report, R-squared is based on returns over the past 36 months for both the fund and the index.
Return on Equity. The annual average rate of return generated by a company during the past five years for each dollar of shareholder’s equity (net income divided by shareholder’s equity). For a fund, the weighted average return on equity for the companies whose stocks it holds.
Short-Term Reserves. The percentage of a fund invested in highly liquid, short-term securities that can be readily converted to cash.
Turnover Rate. An indication of the fund’s trading activity. Funds with high turnover rates incur higher transaction costs and may be more likely to distribute capital gains (which may be taxable to investors). The turnover rate excludes in-kind transactions, which have minimal impact on costs.
29
This page intentionally left blank.
This page intentionally left blank.
The People Who Govern Your Fund
The trustees of your mutual fund are there to see that the fund is operated and managed in your best interests since, as a shareholder, you are a part owner of the fund. Your fund’s trustees also serve on the board of directors of The Vanguard Group, Inc., which is owned by the Vanguard funds and provides services to them on an at-cost basis.
A majority of Vanguard’s board members are independent, meaning that they have no affiliation with Vanguard or the funds they oversee, apart from the sizable personal investments they have made as private individuals. The independent board members have distinguished backgrounds in business, academia, and public service. Each of the trustees and executive officers oversees 180 Vanguard funds.
The following table provides information for each trustee and executive officer of the fund. More information about the trustees is in the Statement of Additional Information, which can be obtained, without charge, by contacting Vanguard at 800-662-7447, or online at vanguard.com.
| |
| InterestedTrustee1 | and Delphi Automotive LLP (automotive components); |
| | Senior Advisor at New Mountain Capital; Trustee of |
| F. William McNabb III | The Conference Board. |
| Born 1957. Trustee Since July 2009. Chairman of the | |
| Board. Principal Occupation(s) During the Past Five | Amy Gutmann |
| Years: Chairman of the Board of The Vanguard Group, | Born 1949. Trustee Since June 2006. Principal |
| Inc., and of each of the investment companies served | Occupation(s) During the Past Five Years: President |
| by The Vanguard Group, since January 2010; Director | of the University of Pennsylvania; Christopher H. |
| of The Vanguard Group since 2008; Chief Executive | Browne Distinguished Professor of Political Science |
| Officer and President of The Vanguard Group and of | in the School of Arts and Sciences with secondary |
| each of the investment companies served by The | appointments at the Annenberg School for |
| Vanguard Group since 2008; Director of Vanguard | Communication and the Graduate School of Education |
| Marketing Corporation; Managing Director of The | of the University of Pennsylvania; Member of the |
| Vanguard Group (1995–2008). | National Commission on the Humanities and Social |
| | Sciences; Trustee of Carnegie Corporation of New |
| Independent Trustees | York and of the National Constitution Center; Chair |
| | of the U.S. Presidential Commission for the Study |
| Emerson U. Fullwood | of Bioethical Issues. |
| Born 1948. Trustee Since January 2008. Principal | |
| Occupation(s) During the Past Five Years: Executive | JoAnn Heffernan Heisen |
| Chief Staff and Marketing Officer for North America | Born 1950. Trustee Since July 1998. Principal |
| and Corporate Vice President (retired 2008) of Xerox | Occupation(s) During the Past Five Years: Corporate |
| Corporation (document management products and | Vice President and Chief Global Diversity Officer |
| services); Executive in Residence and 2010 | (retired 2008) and Member of the Executive |
| Distinguished Minett Professor at the Rochester | Committee (1997–2008) of Johnson & Johnson |
| Institute of Technology; Director of SPX Corporation | (pharmaceuticals/medical devices/consumer |
| (multi-industry manufacturing), the United Way of | products); Director of Skytop Lodge Corporation |
| Rochester, Amerigroup Corporation (managed health | (hotels), the University Medical Center at Princeton, |
| care), the University of Rochester Medical Center, | the Robert Wood Johnson Foundation, and the Center |
| Monroe Community College Foundation, and North | for Talent Innovation; Member of the Advisory Board |
| Carolina A&T University. | of the Maxwell School of Citizenship and Public Affairs |
| at Syracuse University. |
| Rajiv L. Gupta | |
| Born 1945. Trustee Since December 2001. 2 | F. Joseph Loughrey |
| Principal Occupation(s) During the Past Five Years: | Born 1949. Trustee Since October 2009. Principal |
| Chairman and Chief Executive Officer (retired 2009) | Occupation(s) During the Past Five Years: President |
| and President (2006–2008) of Rohm and Haas Co. | and Chief Operating Officer (retired 2009) of Cummins |
| (chemicals); Director of Tyco International, Ltd. | Inc. (industrial machinery); Director of SKF AB |
| (diversified manufacturing and services), Hewlett- | (industrial machinery), Hillenbrand, Inc. (specialized |
| Packard Co. (electronic computer manufacturing), | consumer services), the Lumina Foundation for |
| |
| | |
| Education, and Oxfam America; Chairman of the | Executive Officers | |
| Advisory Council for the College of Arts and Letters | | |
| and Member of the Advisory Board to the Kellogg | Glenn Booraem | |
| Institute for International Studies at the University | Born 1967. Controller Since July 2010. Principal |
| of Notre Dame. | Occupation(s) During the Past Five Years: Principal |
| | of The Vanguard Group, Inc.; Controller of each of |
| Mark Loughridge | the investment companies served by The Vanguard |
| Born 1953. Trustee Since March 2012. Principal | Group; Assistant Controller of each of the investment |
| Occupation(s) During the Past Five Years: Senior Vice | companies served by The Vanguard Group (2001–2010). |
| President and Chief Financial Officer at IBM (information | | |
| technology services); Fiduciary Member of IBM’s | Thomas J. Higgins | |
| Retirement Plan Committee. | Born 1957. Chief Financial Officer Since September |
| | 2008. Principal Occupation(s) During the Past Five |
| Scott C. Malpass | Years: Principal of The Vanguard Group, Inc.; Chief |
| Born 1962. Trustee Since March 2012. Principal | Financial Officer of each of the investment companies |
| Occupation(s) During the Past Five Years: Chief | served by The Vanguard Group; Treasurer of each of |
| Investment Officer and Vice President at the University | the investment companies served by The Vanguard |
| of Notre Dame; Assistant Professor of Finance at the | Group (1998–2008). | |
| Mendoza College of Business at Notre Dame; Member | | |
| of the Notre Dame 403(b) Investment Committee; | Kathryn J. Hyatt | |
| Director of TIFF Advisory Services, Inc. (investment | Born 1955. Treasurer Since November 2008. Principal |
| advisor); Member of the Investment Advisory | Occupation(s) During the Past Five Years: Principal of |
| Committees of the Financial Industry Regulatory | The Vanguard Group, Inc.; Treasurer of each of the |
| Authority (FINRA) and of Major League Baseball. | investment companies served by The Vanguard |
| | Group; Assistant Treasurer of each of the investment |
| André F. Perold | companies served by The Vanguard Group (1988–2008). |
| Born 1952. Trustee Since December 2004. Principal | | |
| Occupation(s) During the Past Five Years: George | Heidi Stam | |
| Gund Professor of Finance and Banking at the Harvard | Born 1956. Secretary Since July 2005. Principal |
| Business School (retired 2011); Chief Investment | Occupation(s) During the Past Five Years: Managing |
| Officer and Managing Partner of HighVista Strategies | Director of The Vanguard Group, Inc.; General Counsel |
| LLC (private investment firm); Director of Rand | of The Vanguard Group; Secretary of The Vanguard |
| Merchant Bank; Overseer of the Museum of Fine | Group and of each of the investment companies |
| Arts Boston. | served by The Vanguard Group; Director and Senior |
| | Vice President of Vanguard Marketing Corporation. |
| Alfred M. Rankin, Jr. | | |
| Born 1941. Trustee Since January 1993. Principal | Vanguard Senior ManagementTeam | |
| Occupation(s) During the Past Five Years: Chairman, | | |
| President, and Chief Executive Officer of NACCO | Mortimer J. Buckley | Chris D. McIsaac |
| Industries, Inc. (housewares/lignite) and of Hyster-Yale | Kathleen C. Gubanich | Michael S. Miller |
| Materials Handling, Inc. (forklift trucks); Director of | Paul A. Heller | James M. Norris |
| the National Association of Manufacturers; Chairman | Martha G. King | Glenn W. Reed |
| of the Board of University Hospitals of Cleveland; | | |
| Advisory Chairman of the Board of The Cleveland | Chairman Emeritus and Senior Advisor | |
| Museum of Art. | |
| | John J. Brennan | |
| Peter F. Volanakis | Chairman, 1996–2009 | |
| Born 1955. Trustee Since July 2009. Principal | Chief Executive Officer and President, 1996–2008 | |
| Occupation(s) During the Past Five Years: President | | |
| and Chief Operating Officer (retired 2010) of Corning | Founder | |
| Incorporated (communications equipment); Director | | |
| of SPX Corporation (multi-industry manufacturing); | John C. Bogle | |
| Overseer of the Amos Tuck School of Business | Chairman and Chief Executive Officer, 1974–1996 | |
| Administration at Dartmouth College; Advisor to the | |
| Norris Cotton Cancer Center. | | |
1 Mr. McNabb is considered an “interested person,” as defined in the Investment Company Act of 1940, because he is an officer of the Vanguard funds.
2 December 2002 for Vanguard Equity Income Fund, Vanguard Growth Equity Fund, the Vanguard Municipal Bond Funds, and the Vanguard State Tax-Exempt Funds.
|  |
| P.O. Box 2600 |
| Valley Forge, PA 19482-2600 |
Connect with Vanguard® > vanguard.com
| |
| Fund Information > 800-662-7447 | “Dividend Achievers” is a trademark of Mergent, Inc., |
| Direct Investor Account Services > 800-662-2739 | and has been licensed for use by The Vanguard Group, |
| | Inc. Vanguard mutual funds are not sponsored, |
| Institutional Investor Services > 800-523-1036 | endorsed, sold, or promoted by Mergent, and Mergent |
| Text Telephone for People | makes no representation regarding the advisability of |
| With Hearing Impairment > 800-749-7273 | investing in the funds. |
| |
| This material may be used in conjunction | |
| with the offering of shares of any Vanguard | |
| fund only if preceded or accompanied by | |
| the fund’s current prospectus. | |
| |
| All comparative mutual fund data are from Lipper Inc. or | |
| Morningstar, Inc., unless otherwise noted. | |
| |
| You can obtain a free copy of Vanguard’s proxy voting | |
| guidelines by visiting vanguard.com/proxyreporting or by | |
| calling Vanguard at 800-662-2739. The guidelines are | |
| also available from the SEC’s website, sec.gov. In | |
| addition, you may obtain a free report on how your fund | |
| voted the proxies for securities it owned during the 12 | |
| months ended June 30. To get the report, visit either | |
| vanguard.com/proxyreporting or sec.gov. | |
| |
| You can review and copy information about your fund at | |
| the SEC’s Public Reference Room in Washington, D.C. To | |
| find out more about this public service, call the SEC at | |
| 202-551-8090. Information about your fund is also | |
| available on the SEC’s website, and you can receive | |
| copies of this information, for a fee, by sending a | |
| request in either of two ways: via e-mail addressed to | |
| publicinfo@sec.gov or via regular mail addressed to the | |
| Public Reference Section, Securities and Exchange | |
| Commission, Washington, DC 20549-1520. | |
| |
| |
| | © 2013 The Vanguard Group, Inc. |
| | All rights reserved. |
| | Vanguard Marketing Corporation, Distributor. |
| |
| | Q6020 032013 |
Item 2: Code of Ethics. The Registrant has adopted a code of ethics that applies to the Registrant’s principal executive officer, principal financial officer, principal accounting officer or controller or persons performing similar functions. The Code of Ethics was amended during the reporting period covered by this report to make certain technical, non-material changes.
Item 3: Audit Committee Financial Expert. The following members of the Audit Committee have been determined by the Registrant’s Board of Trustees to be Audit Committee Financial Experts serving on its Audit Committee, and to be independent: Rajiv L. Gupta, Amy Gutmann, JoAnn Heffernan Heisen, F. Joseph Loughrey, Mark Loughridge, Scott C. Malpass, André F. Perold, and Alfred M. Rankin, Jr.
Item 4: Principal Accountant Fees and Services.
(a) Audit Fees.
Audit Fees of the Registrant
Fiscal Year Ended January 31, 2013: $173,000
Fiscal Year Ended January 31, 2012: $172,000
Aggregate Audit Fees of Registered Investment Companies in the Vanguard Group.
Fiscal Year Ended January 31, 2013: $4,809,780
Fiscal Year Ended January 31, 2012: $3,978,540
(b) Audit-Related Fees.
Fiscal Year Ended January 31, 2013: $1,812,565
Fiscal Year Ended January 31, 2012: $1,341,750
Includes fees billed in connection with assurance and related services provided to the Registrant, The Vanguard Group, Inc., Vanguard Marketing Corporation, and other registered investment companies in the Vanguard Group.
(c) Tax Fees.
Fiscal Year Ended January 31, 2013: $490,518
Fiscal Year Ended January 31, 2012: $373,830
Includes fees billed in connection with tax compliance, planning and advice services provided to the Registrant, The Vanguard Group, Inc., Vanguard Marketing Corporation, and other registered investment companies in the Vanguard Group and related to income and excise taxes.
(d) All Other Fees.
Fiscal Year Ended January 31, 2013: $16,000
Fiscal Year Ended January 31, 2012: $16,000
Includes fees billed for services related to risk management and privacy matters. Services were provided to the Registrant, The Vanguard Group, Inc., Vanguard Marketing Corporation, and other registered investment companies in the Vanguard Group.
(e) (1) Pre-Approval Policies. The policy of the Registrant’s Audit Committee is to consider and, if appropriate, approve before the principal accountant is engaged for such services, all specific audit and non-audit services provided to: (1) the Registrant; (2) The Vanguard Group, Inc.; (3) other entities
controlled by The Vanguard Group, Inc. that provide ongoing services to the Registrant; and (4) other registered investment companies in the Vanguard Group. In making a determination, the Audit Committee considers whether the services are consistent with maintaining the principal accountant’s independence.
In the event of a contingency situation in which the principal accountant is needed to provide services in between scheduled Audit Committee meetings, the Chairman of the Audit Committee would be called on to consider and, if appropriate, pre-approve audit or permitted non-audit services in an amount sufficient to complete services through the next Audit Committee meeting, and to determine if such services would be consistent with maintaining the accountant’s independence. At the next scheduled Audit Committee meeting, services and fees would be presented to the Audit Committee for formal consideration, and, if appropriate, approval by the entire Audit Committee. The Audit Committee would again consider whether such services and fees are consistent with maintaining the principal accountant’s independence.
The Registrant’s Audit Committee is informed at least annually of all audit and non-audit services provided by the principal accountant to the Vanguard complex, whether such services are provided to: (1) the Registrant; (2) The Vanguard Group, Inc.; (3) other entities controlled by The Vanguard Group, Inc. that provide ongoing services to the Registrant; or (4) other registered investment companies in the Vanguard Group.
(2) No percentage of the principal accountant’s fees or services were approved pursuant to the waiver provision of paragraph (c)(7)(i)(C) of Rule 2-01 of Regulation S-X.
(f) For the most recent fiscal year, over 50% of the hours worked under the principal accountant’s engagement were not performed by persons other than full-time, permanent employees of the principal accountant.
(g) Aggregate Non-Audit Fees.
Fiscal Year Ended January 31, 2013: $506,518
Fiscal Year Ended January 31, 2012: $389,830
Includes fees billed for non-audit services provided to the Registrant, The Vanguard Group, Inc., Vanguard Marketing Corporation, and other registered investment companies in the Vanguard Group.
(h) For the most recent fiscal year, the Audit Committee has determined that the provision of all non-audit services was consistent with maintaining the principal accountant’s independence.
Item 5: Audit Committee of Listed Registrants.
The Registrant is a listed issuer as defined in rule 10A-3 under the Securities Exchange Act of 1934 (“Exchange Act”). The Registrant has a separately-designated standing audit committee established in accordance with Section 3(a)(58)(A) of the Exchange Act. The Registrant’s audit committee members are: Emerson U. Fullwood, Rajiv L. Gupta, Amy Gutmann, JoAnn Heffernan Heisen, F. Joseph Loughrey, Mark Loughridge, Scott C. Malpass, André F. Perold, Alfred M. Rankin, Jr., and Peter F. Volanakis.
Item 6: Investments.
Not Applicable.
Item 7: Disclosure of Proxy Voting Policies and Procedures for Closed-End Management Investment Companies.
Not Applicable.
Item 8: Portfolio Managers of Closed-End Management Investment Companies.
Not Applicable.
Item 9: Purchase of Equity Securities by Closed-End Management Investment Company and Affiliated Purchasers.
Not Applicable.
Item 10: Submission of Matters to a Vote of Security Holders.
Not Applicable.
Item 11: Controls and Procedures.
(a) Disclosure Controls and Procedures. The Principal Executive and Financial Officers concluded that the Registrant’s Disclosure Controls and Procedures are effective based on their evaluation of the Disclosure Controls and Procedures as of a date within 90 days of the filing date of this report.
(b) Internal Control Over Financial Reporting. There were no significant changes in Registrant’s Internal Control Over Financial Reporting or in other factors that could significantly affect this control subsequent to the date of the evaluation, including any corrective actions with regard to significant deficiencies and material weaknesses.
Item 12: Exhibits.
(a) Code of Ethics.
(b) Certifications.
Pursuant to the requirements of the Securities Exchange Act of 1934 and the Investment Company Act of 1940, the registrant has duly caused this report to be signed on its behalf by the undersigned, thereunto duly authorized.
| |
| | VANGUARD SPECIALIZED FUNDS |
| |
| By: | /s/ F. WILLIAM MCNABB III* |
| | F. WILLIAM MCNABB III |
| | CHIEF EXECUTIVE OFFICER |
| |
| Date: March 20, 2013 |
Pursuant to the requirements of the Securities Exchange Act of 1934 and the Investment Company Act of 1940, this report has been signed below by the following persons on behalf of the registrant and in the capacities and on the dates indicated.
| |
| | VANGUARD SPECIALIZED FUNDS |
| |
| By: | /s/ F. WILLIAM MCNABB III* |
| | F. WILLIAM MCNABB III |
| | CHIEF EXECUTIVE OFFICER |
| |
| Date: March 20, 2013 |
| |
| | VANGUARD SPECIALIZED FUNDS |
| |
| By: | /s/ THOMAS J. HIGGINS* |
| | THOMAS J. HIGGINS |
| | CHIEF FINANCIAL OFFICER |
| |
| Date: March 20, 2013 |
* By: /s/ Heidi Stam
Heidi Stam, pursuant to a Power of Attorney filed on March 27, 2012 see file Number 2-11444, Incorporated by Reference.