UNITED STATES
SECURITIES AND EXCHANGE COMMISSION
Washington, D.C. 20549
FORM N-CSR
CERTIFIED SHAREHOLDER REPORT
OF
REGISTERED MANAGEMENT INVESTMENT COMPANIES
Investment Company Act file number: 811-3919
Name of Registrant: Vanguard STAR Funds
Address of Registrant: | P.O. Box 2600 |
| Valley Forge, PA 19482 |
Name and address of agent for service: | Heidi Stam, Esquire |
| P.O. Box 876 |
| Valley Forge, PA 19482 |
Registrant’s telephone number, including area code: (610) 669-1000
Date of fiscal year end: October 1
Date of reporting period: November 1, 2006–October 31, 2007
Item 1: Reports to Shareholders |
> Vanguard STAR Fund returned 13.1% for the fiscal year ended October 31, 2007, beating its benchmark and peer group.
> All of STAR’s underlying funds contributed to the fund’s positive performance, with particularly strong returns coming from its two international funds.
> Domestically, the growth funds in STAR’s portfolio outperformed its value funds, although the value funds also produced excellent returns.
Contents | |
| |
Your Fund’s Total Returns | 1 |
Chairman’s Letter | 2 |
Fund Profile | 8 |
Performance Summary | 10 |
Financial Statements | 12 |
Your Fund’s After-Tax Returns | 20 |
About Your Fund’s Expenses | 21 |
Glossary | 23 |
Please note: The opinions expressed in this report are just that—informed opinions. They should not be considered promises or advice. Also, please keep in mind that the information and opinions cover the period through the date on the cover of this report. Of course, the risks of investing in your fund are spelled out in the prospectus.
Your Fund’s Total Returns
Fiscal Year Ended October 31, 2007 | | |
| Ticker | Total |
| Symbol | Returns |
Vanguard STAR Fund | VGSTX | 13.1% |
STAR Composite Index1 | | 12.6 |
STAR Composite Average2 | | 13.0 |
Your Fund’s Performance at a Glance |
October 31, 2006–October 31, 2007 |
| | | Distributions Per Share |
| Starting | Ending | Income | Capital |
| Share Price | Share Price | Dividends | Gains |
Vanguard STAR Fund | $21.04 | $22.80 | $0.600 | $0.327 |
1 The STAR Composite Index is weighted 50% Morgan Stanley Capital International (MSCI) US Broad Market Index, 25% Lehman Brothers U.S. Aggregate Bond Index, 12.5% Lehman 1–5 Year U.S. Credit Index, and 12.5% MSCI Europe, Australasia, Far East (EAFE) Index.
2 The STAR Composite Average, which is derived from data provided by Lipper Inc., is weighted 50% average general equity fund, 25% average fixed income fund, 12.5% average 1–5 year investment-grade fund, and 12.5% average international fund.
1

Chairman’s Letter
Dear Shareholder,
Vanguard STAR Fund produced a 13.1% return for the fiscal year ended October 31, 2007, coincidentally the same return as in the previous fiscal year. The fund’s return outpaced that of its benchmark and edged past the average return of its composite peer group, an approximation of STAR’s asset allocation made up of the relevant Lipper fund groups.
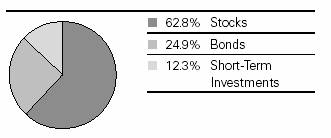
STAR is a “fund of funds,” meaning that it invests in other mutual funds. STAR holds a portfolio that is balanced between a diversified group of domestic and international stocks (60% to 65% of fund assets) and fixed income investments that cover all maturity categories (35% to 40%). During the fiscal year, each of the funds in these asset classes made significant contributions to STAR’s return on an absolute basis, and nine of STAR’s 11 underlying funds bested or came close to their respective benchmarks.
If you own the STAR Fund in a taxable account, you may wish to review a report on the fund’s after-tax returns on page 20.
Stocks rode a bumpy path to impressive results
Despite some volatility, the U.S. stock market produced strong results during the fund’s fiscal year. Ongoing problems with low-quality mortgage loans (an unpleasant postscript to the housing downturn) rattled financial markets in the spring and summer, and continued to make investors skittish through the close of the fiscal period. At the end of October, crude oil prices touched historic highs, while the U.S. dollar dipped to record lows versus other major currencies.
Still, the broad U.S. stock market returned an impressive 15.3%. Large-capitalization stocks outperformed small-caps, and growth stocks outperformed value stocks—both continuing recent months’ reversals of longer-term trends.
International companies performed even better than domestic issues. Stocks in emerging markets fared particularly well, followed by European and Pacific region stocks (Japan was a notable laggard). The weak U.S. dollar boosted foreign stock returns for U.S.-based investors.
Bond investors converged on high-quality issues
As troubles in the subprime credit markets rippled across the financial markets, bond investors sought the relative safety of U.S. Treasury bonds. This “flight to quality” drove prices for Treasuries higher and yields lower, and widened the spread between Treasury yields and the much higher yields demanded by investors for riskier bonds.
Declines in Treasury yields were steepest at the short end of the maturity spectrum, aided by the actions of the Federal Reserve Board. The central bank lowered the target for short-term interest rates to 4.50% in two separate rate cuts (a half-percentage-point in September and a quarter-point on October 31). The yield of the 3-month Treasury bill finished the fiscal period at 3.92%, after spending much of the year near 5%; the 10-year Treasury note ended at 4.47%.
2
Market Barometer | | | |
| Average Annual Total Returns |
| Periods Ended October 31, 2007 |
| One Year | Three Years | Five Years |
Stocks | | | |
Russell 1000 Index (Large-caps) | 15.0% | 13.8% | 14.5% |
Russell 2000 Index (Small-caps) | 9.3 | 13.7 | 18.7 |
Dow Jones Wilshire 5000 Index (Entire market) | 15.3 | 14.2 | 15.3 |
MSCI All Country World Index ex USA (International) | 33.0 | 27.4 | 26.4 |
| | | |
| | | |
Bonds | | | |
Lehman U.S. Aggregate Bond Index (Broad taxable market) | 5.4% | 3.9% | 4.4% |
Lehman Municipal Bond Index | 2.9 | 3.7 | 4.5 |
Citigroup 3-Month Treasury Bill Index | 5.0 | 4.1 | 2.9 |
| | | |
| | | |
CPI | | | |
Consumer Price Index | 3.5% | 3.1% | 2.9% |
3
For the year, the broad taxable bond market returned 5.4%. Returns from tax-exempt bonds were lower, as these issues did not benefit from the late-summer rally in Treasuries.
STAR’s international funds continued their impressive showing
The returns of each of the 11 actively managed funds in STAR’s portfolio contributed significantly to its 13.1% return during the fiscal year, allowing STAR to outshine both its benchmark and peer group.
The most impressive returns came from STAR’s international stock investments, as the long rally in international stock markets continued. For U.S.-based investors, international returns were also helped by the declining U.S. dollar.
Vanguard International Growth Fund earned a 30.0% return, beating its benchmark by five percentage points primarily because of exceptional performance in emerging markets and good stock picks in Asia. Vanguard International Value Fund, helped along by its holdings in developing Latin American markets, outperformed its benchmark by almost three percentage points to deliver a 27.6% return.
Expense Ratios | | |
Your fund compared with its peer group | | |
| Aquired | Composite |
| Fund Fees | Benchmark |
| and Expenses1 | Expense Ratio2 |
STAR Fund | 0.32% | 1.29% |
1 This figure represents a weighted average of the annualized expense ratios and any fees charged by the underlying mutual funds in which the STAR Fund invests. The fund does not charge any expenses or fees of its own. Acquired is a term that the Securities and Exchange Commission applies to any mutual fund whose shares are owned by another fund.
2 Based on the STAR Composite Average, which is weighted 50% average general equity fund, 25% average fixed income fund, 12.5% average 1–5 year investment-grade fund, and 12.5% average international fund. The figure is derived from data provided by Lipper Inc. and captures information through year-end 2006.
4
Among STAR’s domestic holdings, growth funds provided strong returns. Vanguard Morgan™ Growth Fund returned 20.6%, followed by Vanguard PRIMECAP Fund (+18.0%), and Vanguard U.S. Growth Fund (+17.1%). Vanguard Explorer™ Fund earned 15.3%, a solid return on an absolute basis but significantly below that of its benchmark, primarily because of disappointing stock selection.
Although value stocks trailed growth stocks during the past year, STAR’s U.S.-based value funds brought home respectable returns. Vanguard Windsor™ II Fund, STAR’s largest holding, returned 14.6% and significantly outperformed its benchmark. Contributing to Windsor II’s outperformance was its below-benchmark exposure to the financials sector, which took the brunt of the subprime mortgage-related stresses. Vanguard Windsor Fund, STAR’s other domestic value stock fund, earned 11.2%.
The total returns of STAR’s three bond funds bested, matched, or came close to those of their respective benchmarks despite a summer of fears over the potential impact of subprime-mortgage-market lending that spread through the global financial markets. The ripple effect sent our GNMA and long-term bond funds into negative territory in the third quarter even though Vanguard’s funds have virtually no exposure to these types of securities. All three funds ended the fiscal year on a positive note.
| | Total Returns |
Vanguard Fund | Percentage of | 12 Months Ended |
(Investor Shares) | STAR’s Assets1 | October 31, 2007 |
Stock Funds | | |
Windsor II | 16.1% | 14.6% |
Windsor | 8.7 | 11.2 |
PRIMECAP | 7.0 | 18.0 |
Morgan Growth | 7.0 | 20.6 |
U.S. Growth | 6.9 | 17.1 |
Explorer Fund | 4.2 | 15.3 |
International Growth | 6.5 | 30.0 |
International Value | 6.4 | 27.6 |
Bond Funds | | |
Long-Term Investment-Grade | 12.5% | 2.7% |
GNMA | 12.4 | 5.6 |
Short-Term Investments | | |
Short-Term Investment-Grade | 12.3% | 5.4% |
Combined | 100.0% | 13.1% |
1 As of October 31, 2007.
5
STAR’s long-term results underscore balance’s benefits
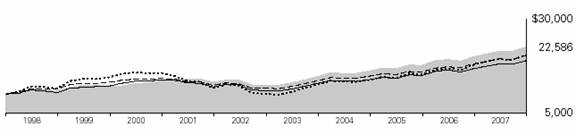
Over the ten-year period ended October 31, 2007, STAR produced an average annual return of 8.5%, outpacing the returns of its benchmark, its composite peer group, and the broad U.S. stock market. (See the table below.)
A hypothetical investment of $10,000 made ten years ago in the stock-and-bond STAR Fund would have grown to $22,586, almost $2,100 more than the same hypothetical investment would have generated in the stock-only Dow Jones Wilshire 5000 Composite Index.
These results reflect STAR’s balanced approach—bonds can at times outperform stocks and also provide ballast to help counteract stocks’ volatility. STAR’s balanced approach also applies within asset classes. Its three bond funds cover the maturity spectrum. And each of its eight stock funds offers a different investment approach, providing STAR with diversified exposure to world stock markets.
Funds of funds bring simplicity to investors
A properly designed fund of funds, such as the STAR Fund, can effectively address a fundamental problem in investing: We can’t know for sure in advance which investment types will do well at any given time. STAR harnesses some fundamental investment principles to address this uncertainty. These include diversification among and within asset classes, costs that provide a performance tailwind because they’re among the lowest in the industry, and a long-term orientation.
Total Returns | |
Ten Years Ended October 31, 2007 | |
| Average |
| Annual Return |
STAR Fund | 8.5% |
STAR Composite Index1 | 7.4 |
STAR Composite Average2 | 6.6 |
Dow Jones Wilshire 5000 Index | 7.4 |
The figures shown represent past performance, which is not a guarantee of future results. (Current performance may be lower or higher than the performance data cited. For performance data current to the most recent month-end, visit our website at www.vanguard.com/performance.) Note, too, that both investment returns and principal value can fluctuate widely, so an investor’s shares, when sold, could be worth more or less than their original cost.
1 The STAR Composite Index is weighted 62.5% Dow Jones Wilshire 5000 Index, 25% Lehman U.S. Aggregate Bond Index, and 12.5% Citigroup 3-Month Treasury Bill Index through December 31, 2002; 50% Dow Jones Wilshire 5000 Index, 25% Lehman U.S. Aggregate Bond Index, 12.5% Lehman 1–5 Year U.S. Credit Index, and 12.5% MSCI EAFE Index through April 22, 2005; and 50% MSCI US Broad Market Index, 25% Lehman U.S. Aggregate Bond Index, 12.5% Lehman 1–5 Year U.S. Credit Index, and 12.5% MSCI EAFE Index thereafter.
2 The STAR Composite Average, which is derived from data provided by Lipper Inc., is weighted 62.5% average general equity fund, 25% average fixed income fund, and 12.5% average money market fund through December 31, 2002; and 50% average general equity fund, 25% average fixed income fund, 12.5% average 1–5 year investment-grade fund, and 12.5% average international fund thereafter.
6
A fund of funds can also simplify investing by effectively reducing the number of funds in your personal portfolio to one, no matter how many underlying funds make up its portfolio. This simplicity makes for easier recordkeeping, and it can give you a clearer picture of your investment portfolio. And your fund of funds takes onto itself the important task of periodically rebalancing to restore its original asset allocation and maintain its risk and return characteristics.
Thank you for entrusting your assets to Vanguard.
Sincerely,

John J. Brennan
Chairman and Chief Executive Officer
November 13, 2007
7
Fund Profile
As of October 31, 2007
Financial Attributes | |
| |
Yield | 2.8% |
Acquired Fund Fees and Expenses1 | 0.32% |
Allocation to Underlying Vanguard Funds | |
| |
Stock Funds | |
Windsor II | 16.1% |
Windsor | 8.7 |
PRIMECAP | 7.0 |
Morgan Growth | 7.0 |
U.S. Growth | 6.9 |
Explorer Fund | 4.2 |
International Growth | 6.5 |
International Value | 6.4 |
Bond Funds | |
Long-Term Investment-Grade | 12.5% |
GNMA | 12.4 |
Short-Term Investments | |
Short-Term Investment-Grade | 12.3% |
Volatility Measures2 | |
| Fund Versus |
| Composite Index3 |
R-Squared | 0.98 |
Beta | 1.03 |
8
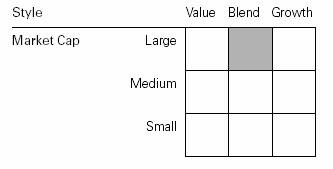
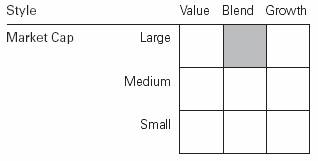
Equity Investment Focus
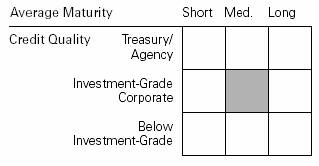
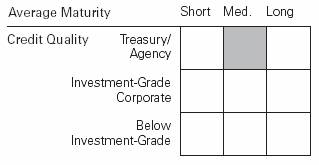
Fixed Income Investment Focus
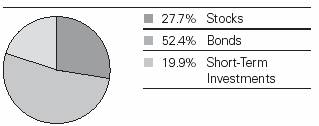
Fund Asset Allocation
1 This figure represents a weighted average of the expense ratios and any fees charged by the underlying mutual funds in which STAR Fund invests. The fund does not charge any expenses or fees of its own. Acquired is a term that the Securities and Exchange Commission applies to any mutual fund whose shares are owned by another fund.
2 For an explanation of R-squared, beta, and other terms used here, see the Glossary on page 23.
3 The STAR Composite Index is weighted 50% Dow Jones Wilshire 5000 Index, 25% Lehman U.S. Aggregate Bond Index, 12.5% Lehman 1–5 Year U.S. Credit Index, and 12.5% MSCI EAFE Index through April 22, 2005; and 50% MSCI US Broad Market Index, 25% Lehman U.S. Aggregate Bond Index, 12.5% Lehman 1–5 Year U.S. Credit Index, and 12.5% MSCI EAFE Index thereafter.
9
Performance Summary
All of the returns in this report represent past performance, which is not a guarantee of future results that may be achieved by the fund. (Current performance may be lower or higher than the performance data cited. For performance data current to the most recent month-end, visit our website at www.vanguard.com/performance.) Note, too, that both investment returns and principal value can fluctuate widely, so an investor’s shares, when sold, could be worth more or less than their original cost. The returns shown do not reflect taxes that a shareholder would pay on fund distributions or on the sale of fund shares.
Cumulative Performance: October 31, 1997–October 31, 2007
Initial Investment of $10,000
| Average Annual Total Returns | Final Value |
| Periods Ended October 31, 2007 | of a $10,000 |
| One Year | Five Years | Ten Years | Investment |
STAR Fund1 | 13.14% | 12.89% | 8.49% | $22,586 |
Dow Jones Wilshire 5000 Index | 15.28 | 15.31 | 7.44 | 20,495 |
STAR Composite Index2 | 12.59 | 12.02 | 7.37 | 20,358 |
STAR Composite Average3 | 13.05 | 11.70 | 6.61 | 18,970 |
1 Total returns do not include the account service fee that may be applicable to certain accounts with balances below $10,000.
2 The STAR Composite Index is weighted 62.5% Dow Jones Wilshire 5000 Index, 25% Lehman U.S. Aggregate Bond Index, and 12.5% Citigroup 3-Month Treasury Bill Index through December 31, 2002; 50% Dow Jones Wilshire 5000 Index, 25% Lehman U.S. Aggregate Bond Index, 12.5% Lehman 1–5 Year U.S. Credit Index, and 12.5% MSCI EAFE Index through April 22, 2005; and 50% MSCI US Broad Market Index, 25% Lehman U.S. Aggregate Bond Index, 12.5% Lehman 1–5 Year U.S. Credit Index, and 12.5% MSCI EAFE Index thereafter.
3 The STAR Composite Average, which is derived from data provided by Lipper Inc., is weighted 62.5% average general equity fund, 25% average fixed income fund, and 12.5% average money market fund through December 31, 2002; and 50% average general equity fund, 25% average fixed income fund, 12.5% average 1–5 year investment-grade fund, and 12.5% average international fund thereafter.
10
Fiscal-Year Total Returns (%): October 31, 1997–October 31, 2007 |
| | | | |
| | | | |
| STAR Fund | Composite |
Fiscal | Capital | Income | Total | Index1 Total |
Year | Return | Return | Return | Return |
1998 | 5.8% | 3.4% | 9.2% | 12.8% |
1999 | 7.3 | 3.4 | 10.7 | 16.4 |
2000 | 8.6 | 3.9 | 12.5 | 7.9 |
2001 | –6.4 | 3.3 | –3.1 | –12.9 |
2002 | –9.4 | 2.9 | –6.5 | –6.5 |
2003 | 15.7 | 3.3 | 19.0 | 17.3 |
2004 | 7.5 | 2.6 | 10.1 | 9.2 |
2005 | 6.8 | 2.5 | 9.3 | 7.8 |
2006 | 10.2 | 2.9 | 13.1 | 13.5 |
2007 | 10.1 | 3.0 | 13.1 | 12.6 |
Average Annual Total Returns: Periods Ended September 30, 2007
This table presents average annual total returns through the latest calendar quarter—rather than through the end of the fiscal period. Securities and Exchange Commission rules require that we provide this information.
| | | | | | Ten Years |
| Inception Date | One Year | Five Years | Capital | Income | Total |
STAR Fund2 | 3/29/1985 | 13.54% | 13.22% | 4.97% | 3.12% | 8.09% |
1 The STAR Composite Index is weighted 62.5% Dow Jones Wilshire 5000 Index, 25% Lehman U.S. Aggregate Bond Index, and 12.5% Citigroup 3-Month Treasury Bill Index through December 31, 2002; 50% Dow Jones Wilshire 5000 Index, 25% Lehman U.S. Aggregate Bond Index, 12.5% Lehman 1–5 Year U.S. Credit Index, and 12.5% MSCI EAFE Index through April 22, 2005; and 50% MSCI US Broad Market Index, 25% Lehman U.S. Aggregate Bond Index, 12.5% Lehman 1–5 Year U.S. Credit Index, and 12.5% MSCI EAFE Index thereafter.
2 Total returns do not include the account service fee that may be applicable to certain accounts with balances below $10,000.
Note: See Financial Highlights table on page 16 for dividend and capital gains information.
11
Financial Statements
Statement of Net Assets
As of October 31, 2007
The fund provides a complete list of its holdings four times in each fiscal year, at the quarter-ends. For the second and fourth fiscal quarters, the lists appear in the fund’s semiannual and annual reports to shareholders. For the first and third fiscal quarters, the fund files the lists with the Securities and Exchange Commission on Form N-Q. Shareholders can look up the fund’s Forms N-Q on the SEC’s website at www.sec.gov. Forms N-Q may also be reviewed and copied at the SEC’s Public Reference Room (see the back cover of this report for further information).
| | | Market |
| | | Value• |
| | Shares | ($000) |
Investment Companies (100.0%) | | |
U.S. Stock Funds (49.8%) | | |
| Vanguard Windsor II Fund Investor Shares | 64,416,944 | 2,437,537 |
| Vanguard Windsor Fund Investor Shares | 67,679,887 | 1,321,111 |
| Vanguard PRIMECAP Fund Investor Shares | 13,353,206 | 1,067,055 |
| Vanguard Morgan Growth Fund Investor Shares | 47,870,993 | 1,057,470 |
| Vanguard U.S. Growth Fund Investor Shares | 50,607,442 | 1,054,659 |
| Vanguard Explorer Fund Investor Shares | 7,616,732 | 639,272 |
| | | 7,577,104 |
International Stock Funds (12.9%) | | |
| Vanguard International Growth Fund Investor Shares | 33,596,625 | 981,357 |
| Vanguard International Value Fund | 20,106,933 | 972,975 |
| | | 1,954,332 |
Bond Funds (24.9%) | | |
| Vanguard Long-Term Investment-Grade Fund Investor Shares | 209,989,844 | 1,900,408 |
| Vanguard GNMA Fund Investor Shares | 184,730,939 | 1,889,798 |
| | | 3,790,206 |
Short-Term Bond Fund (12.3%) | | |
| Vanguard Short-Term Investment-Grade Fund Investor Shares | 176,203,349 | 1,869,518 |
| | | |
Money Market Fund (0.1%) | | |
1 | Vanguard Market Liquidity Fund, 4.955% | 17,808,867 | 17,809 |
Total Investment Companies (Cost $10,737,447) | | 15,208,969 |
Other Assets and Liabilities (0.0%) | | |
Other Assets | | 30,372 |
Liabilities | | (29,406) |
| | | 966 |
Net Assets (100%) | | |
Applicable to 667,048,646 outstanding $.001 par value shares of | | |
beneficial interest (unlimited authorization) | | 15,209,935 |
Net Asset Value Per Share | | $22.80 |
12
At October 31, 2007, net assets consisted of:2 | | |
| Amount | Per |
| ($000) | Share |
Paid-in Capital | 10,185,961 | $15.27 |
Undistributed Net Investment Income | 111,051 | .17 |
Accumulated Net Realized Gains | 441,401 | .66 |
Unrealized Appreciation | 4,471,522 | 6.70 |
Net Assets | 15,209,935 | $22.80 |
• See Note A in Notes to Financial Statements.
1 Affiliated money market fund available only to Vanguard funds and certain trusts and accounts managed by Vanguard. Rate shown is the 7-day yield.
2 See Note C in Notes to Financial Statements for the tax-basis components of net assets.
13
Statement of Operations
| Year Ended |
| October 31, 2007 |
| ($000) |
Investment Income | |
Income | |
Income Distributions Received | 409,893 |
Net Investment Income—Note B | 409,893 |
Realized Net Gain (Loss) | |
Capital Gain Distributions Received | 442,595 |
Investment Securities Sold | 40,429 |
Realized Net Gain (Loss) | 483,024 |
Change in Unrealized Appreciation (Depreciation) of Investment Securities | 880,955 |
Net Increase (Decrease) in Net Assets Resulting from Operations | 1,773,872 |
14
Statement of Changes in Net Assets
| Year Ended October 31, |
| 2007 | 2006 |
| ($000) | ($000) |
Increase (Decrease) in Net Assets | | |
Operations | | |
Net Investment Income | 409,893 | 334,697 |
Realized Net Gain (Loss) | 483,024 | 275,478 |
Change in Unrealized Appreciation (Depreciation) | 880,955 | 937,240 |
Net Increase (Decrease) in Net Assets Resulting from Operations | 1,773,872 | 1,547,415 |
Distributions | | |
Net Investment Income | (390,425) | (316,401) |
Realized Capital Gain1 | (209,760) | (33,279) |
Total Distributions | (600,185) | (349,680) |
Capital Share Transactions—Note E | | |
Issued | 1,450,174 | 1,768,850 |
Issued in Lieu of Cash Distributions | 583,135 | 338,007 |
Redeemed | (1,519,392) | (1,329,304) |
Net Increase (Decrease) from Capital Share Transactions | 513,917 | 777,553 |
Total Increase (Decrease) | 1,687,604 | 1,975,288 |
Net Assets | | |
Beginning of Period | 13,522,331 | 11,547,043 |
End of Period2 | 15,209,935 | 13,522,331 |
1 Includes fiscal 2007 and 2006 short-term gain distributions totaling $39,771,000 and $33,279,000, respectively. Short-term gain distributions are treated as ordinary income dividends for tax purposes.
2 Net Assets—End of Period includes undistributed (overdistributed) net investment income of $111,051,000 and $91,583,000.
15
Financial Highlights
For a Share Outstanding | Year Ended October 31, |
Throughout Each Period | 2007 | 2006 | 2005 | 2004 | 2003 |
Net Asset Value, Beginning of Period | $21.04 | $19.14 | $17.92 | $16.67 | $14.41 |
Investment Operations | | | | | |
Net Investment Income | .626 | .533 | .46 | .41 | .40 |
Capital Gain Distributions Received | .669 | .378 | .01 | — | — |
Net Realized and Unrealized Gain (Loss) | | | | | |
on Investments | 1.392 | 1.554 | 1.19 | 1.26 | 2.28 |
Total from Investment Operations | 2.687 | 2.465 | 1.66 | 1.67 | 2.68 |
Distributions | | | | | |
Dividends from Net Investment Income | (.600) | (.510) | (.44) | (.42) | (.42) |
Distributions from Realized Capital Gains | (.327) | (.055) | — | — | — |
Total Distributions | (.927) | (.565) | (.44) | (.42) | (.42) |
Net Asset Value, End of Period | $22.80 | $21.04 | $19.14 | $17.92 | $16.67 |
| | | | | |
| | | | | |
Total Return1 | 13.14% | 13.13% | 9.33% | 10.14% | 18.96% |
| | | | | |
| | | | | |
Ratios/Supplemental Data | | | | | |
Net Assets, End of Period (Millions) | $15,210 | $13,522 | $11,547 | $10,083 | $8,671 |
Ratio of Total Expenses to | | | | | |
Average Net Assets—Note B | 0%2 | 0% | 0% | 0% | 0% |
Ratio of Net Investment Income to | | | | | |
Average Net Assets | 2.85% | 2.64% | 2.44% | 2.39% | 2.60% |
Portfolio Turnover Rate | 8% | 9% | 6% | 6% | 15% |
1 Total returns do not include the account service fee that may be applicable to certain accounts with balances below $10,000.
2 The acquired fund fees and expenses were 0.32%.
See accompanying Notes, which are an integral part of the Financial Statements.
16
Notes to Financial Statements
Vanguard STAR Fund is registered under the Investment Company Act of 1940 as an open-end investment company, or mutual fund. The fund follows a balanced investment strategy by investing in selected Vanguard funds. The fund invests 60% to 70% of its net assets in stock funds (predominantly large-capitalization U.S. stock funds), 20% to 30% in intermediate- to long-term bond funds, and 10% to 20% in a short-term bond fund.
A. The following significant accounting policies conform to generally accepted accounting principles for U.S. mutual funds. The fund consistently follows such policies in preparing its financial statements.
1. Valuation: Investments are valued at the net asset value of each underlying Vanguard fund determined as of the close of the New York Stock Exchange (generally 4 p.m., Eastern time) on the valuation date.
2. Federal Income Taxes: The fund intends to continue to qualify as a regulated investment company and distribute all of its taxable income. Accordingly, no provision for federal income taxes is required in the financial statements.
3. Distributions: Distributions to shareholders are recorded on the ex-dividend date.
4. Other: Income and capital gain distributions received are recorded on the ex-dividend date. Security transactions are accounted for on the date securities are bought or sold. Costs used to determine realized gains (losses) on the sale of investment securities are those of the specific securities sold.
B. Under a service agreement, The Vanguard Group furnishes corporate management, administrative, marketing, and distribution services to the fund. The service agreement provides that Vanguard will reimburse the fund’s expenses to the extent of savings in administrative and marketing costs realized by Vanguard in the operation of the fund. Accordingly, all expenses incurred by the fund during the year ended October 31, 2007, were reimbursed by Vanguard. The fund’s trustees and officers are also directors and officers of Vanguard.
C. Distributions are determined on a tax basis and may differ from net investment income and realized capital gains for financial reporting purposes. Differences may be permanent or temporary. Permanent differences are reclassified among capital accounts in the financial statements to reflect their tax character. Temporary differences arise when certain items of income, expense, gain, or loss are recognized in different periods for financial statement and tax purposes; these differences will reverse at some time in the future. Differences in classification may also result from the treatment of short-term gains as ordinary income for tax purposes.
For tax purposes, at October 31, 2007, the fund had $157,517,000 of ordinary income and $395,129,000 of long-term capital gains available for distribution.
At October 31, 2007, the cost of investment securities for tax purposes was $10,737,641,000. Net unrealized appreciation of investment securities for tax purposes was $4,471,328,000, consisting of unrealized gains of $4,471,768,000 on securities that had risen in value since their purchase and $440,000 in unrealized losses on securities that had fallen in value since their purchase.
D. During the year ended October 31, 2007, the fund purchased $1,867,070,000 of investment securities and sold $1,090,857,000 of investment securities other than temporary cash investments.
17
E. Capital shares issued and redeemed were:
| Year Ended October 31, |
| 2007 | 2006 |
| Shares | Shares |
| (000) | (000) |
Issued | 67,082 | 88,228 |
Issued in Lieu of Cash Distributions | 27,479 | 17,291 |
Redeemed | (70,107) | (66,266) |
Net Increase (Decrease) in Shares Outstanding | 24,454 | 39,253 |
F. In June 2006, the Financial Accounting Standards Board issued Interpretation No. 48 (“FIN 48”), “Accounting for Uncertainty in Income Taxes.” FIN 48 establishes the minimum threshold for recognizing, and a system for measuring, the benefits of tax-return positions in financial statements, and is effective for the fund’s fiscal year beginning November 1, 2007. Management has analyzed the fund’s tax positions taken on federal income tax returns for all open tax years (tax years ended October 31, 2004–2007) for purposes of implementing FIN 48, and has concluded that as of October 31, 2007, no provision for income tax would be required in the fund’s financial statements.
18
Report of Independent Registered
Public Accounting Firm
To the Trustees of Vanguard STAR Funds and the Shareholders of Vanguard STAR Fund:
In our opinion, the accompanying statement of net assets and the related statements of operations and of changes in net assets and the financial highlights present fairly, in all material respects, the financial position of Vanguard STAR Fund (the “Fund”) at October 31, 2007, the results of its operations for the year then ended, the changes in its net assets for each of the two years in the period then ended and the financial highlights for each of the five years in the period then ended, in conformity with accounting principles generally accepted in the United States of America. These financial statements and financial highlights (hereafter referred to as “financial statements”) are the responsibility of the Fund’s management; our responsibility is to express an opinion on these financial statements based on our audits. We conducted our audits of these financial statements in accordance with the standards of the Public Company Accounting Oversight Board (United States). Those standards require that we plan and perform the audit to obtain reasonable assurance about whether the financial statements are free of material misstatement. An audit includes examining, on a test basis, evidence supporting the amounts and disclosures in the financial statements, assessing the accounting principles used and significant estimates made by management, and evaluating the overall financial statement presentation. We believe that our audits, which included confirmation of securities at October 31, 2007 by agreement to the underlying ownership records for the Vanguard funds, provide a reasonable basis for our opinion.
PricewaterhouseCoopers LLP
Philadelphia, Pennsylvania
December 6, 2007
Special 2007 tax information (unaudited) for Vanguard STAR Fund
This information for the fiscal year ended October 31, 2007, is included pursuant to provisions of the Internal Revenue Code.
The fund distributed $169,989,000 as capital gain dividends (from net long-term capital gains) to shareholders during the fiscal year.
The fund distributed $117,584,000 of qualified dividend income to shareholders during the fiscal year.
For corporate shareholders, 11.0% of investment income (dividend income plus short-term gains, if any) qualifies for the dividends-received deduction.
19
Your Fund’s After-Tax Returns
This table presents returns for your fund both before and after taxes. The after-tax returns are shown in two ways: (1) assuming that an investor owned the fund during the entire period and paid taxes on the fund’s distributions, and (2) assuming that an investor paid taxes on the fund’s distributions and sold all shares at the end of each period.
Calculations are based on the highest individual federal income tax and capital gains tax rates in effect at the times of the distributions and the hypothetical sales. State and local taxes were not considered. After-tax returns reflect any qualified dividend income, using actual prior-year figures and estimates for 2007. (In the example, returns after the sale of fund shares may be higher than those assuming no sale. This occurs when the sale would have produced a capital loss. The calculation assumes that the investor received a tax deduction for the loss.)
Please note that your actual after-tax returns will depend on your tax situation and may differ from those shown. Also note that if you own the fund in a tax-deferred account, such as an individual retirement account or a 401(k) plan, this information does not apply to you. Such accounts are not subject to current taxes.
Finally, keep in mind that a fund’s performance—whether before or after taxes—does not guarantee future results.
Average Annual Total Returns: STAR Fund1 | | | |
Periods Ended October 31, 2007 | | | |
| One | Five | Ten |
| Year | Years | Years |
Returns Before Taxes | 13.14% | 12.89% | 8.49% |
Returns After Taxes on Distributions | 11.92 | 11.92 | 6.61 |
Returns After Taxes on Distributions and Sale of Fund Shares | 8.91 | 10.72 | 6.27 |
1 Total returns do not include the account service fee that may be applicable to certain accounts with balances below $10,000.
20
About Your Fund’s Expenses
As a shareholder of the fund, you incur ongoing costs, which include costs for portfolio management, administrative services, and shareholder reports (like this one), among others. Operating expenses, which are deducted from a fund’s gross income, directly reduce the investment return of the fund.
A typical fund’s expenses are expressed as a percentage of its average net assets. The STAR Fund has no direct expenses, but bears its proportionate share of the costs for the underlying funds in which it invests. These indirect expenses make up the acquired fund fees and expenses, also expressed as a percentage of average net assets.
The following examples are intended to help you understand the ongoing costs (in dollars) of investing in your fund and to compare these costs with those of other mutual funds. The examples are based on an investment of $1,000 made at the beginning of the period shown and held for the entire period. The costs were calculated using the acquired fund fees and expenses for STAR Fund.
The table below illustrates your fund’s costs in two ways:
• Based on actual fund return. This section helps you to estimate the actual expenses that you paid over the period. The “Ending Account Value” shown is derived from the fund’s actual return, and the third column shows the dollar amount that would have been paid by an investor who started with $1,000 in the fund. You may use the information here, together with the amount you invested, to estimate the expenses that you paid over the period.
To do so, simply divide your account value by $1,000 (for example, an $8,600 account value divided by $1,000 = 8.6), then multiply the result by the number given for your fund under the heading “Expenses Paid During Period.”
• Based on hypothetical 5% yearly return. This section is intended to help you compare your fund’s costs with those of other mutual funds. It assumes that the fund had a yearly return of 5% before expenses, but that the expense ratio is unchanged. In this case—because the return used is not the fund’s actual return—the results do not apply to your investment. The example is useful in making comparisons because the Securities and Exchange Commission requires all mutual funds to calculate expenses based on a 5% return. You can assess your fund’s costs by comparing this hypothetical example with the hypothetical examples that appear in shareholder reports of other funds.
Six Months Ended October 31, 2007 | | | |
| Beginning | Ending | Expenses |
| Account Value | Account Value | Paid During |
STAR Fund | 4/30/2007 | 10/31/2007 | Period1 |
Based on Actual Fund Return | $1,000.00 | $1,054.45 | $1.66 |
Hypothetical 5% Yearly Return | 1,000.00 | 1,023.59 | 1.63 |
Note that the expenses shown in the table are meant to highlight and help you compare ongoing costs only and do not reflect transaction costs incurred by the fund for buying and selling securities. Further, the expenses do not include the account service fee described in the prospectus. If such a fee were applied to your account, your costs would be higher. Your fund does not charge transaction fees, such as purchase or redemption fees, nor does it carry a “sales load.”
1 The calculations are based on the acquired fund fees and expenses for the most recent six-month period of each underlying fund. STAR Fund’s acquired fund fees and expenses figure as of October 31, 2007, was 0.32%. The dollar amounts shown as “Expenses Paid” are equal to the expense figure multiplied by the average account value over the period, multiplied by the number of days in the most recent six-month period, then divided by the number of days in the most recent 12-month period.
21
The calculations assume no shares were bought or sold during the period. Your actual costs may have been higher or lower, depending on the amount of your investment and the timing of any purchases or redemptions.
You can find more information about the fund’s expenses, including annual expense ratios, in the Financial Statements section of this report. For additional information on operating expenses and other shareholder costs, please refer to your fund’s current prospectus.
22
Glossary
Acquired Fund Fees and Expenses. Funds that invest in other Vanguard funds incur no direct expenses, but they do bear proportionate shares of the operating, administrative, and advisory expenses of the underlying funds, and they must pay any fees charged by those funds. The figure for acquired fund fees and expenses represents a weighted average of these underlying costs. Acquired is a term that the Securities and Exchange Commission applies to any mutual fund whose shares are owned by another fund.
Beta. A measure of the magnitude of a fund’s past share-price fluctuations in relation to the ups and downs of a given market index. The index is assigned a beta of 1.00. Compared with a given index, a fund with a beta of 1.20 typically would have seen its share price rise or fall by 12% when the index rose or fell by 10%. A fund’s beta should be reviewed in conjunction with its R-squared (see definition below). The lower the R-squared, the less correlation there is between the fund and the index, and the less reliable beta is as an indicator of volatility.
Expense Ratio. The percentage of a fund’s average net assets used to pay its annual administrative and advisory expenses. These expenses directly reduce returns to investors.
Inception Date. The date on which the assets of a fund (or one of its share classes) are first invested in accordance with the fund’s investment objective. For funds with a subscription period, the inception date is the day after that period ends. Investment performance is measured from the inception date.
R-Squared. A measure of how much of a fund’s past returns can be explained by the returns from the market in general, as measured by a given index. If a fund’s total returns were precisely synchronized with an index’s returns, its R-squared would be 1.00. If the fund’s returns bore no relationship to the index’s returns, its R-squared would be 0.
Yield. A snapshot of a fund’s income from interest and dividends. The yield, expressed as a percentage of the fund’s net asset value, is based on income earned over the past 30 days and is annualized, or projected forward for the coming year.
23
This page intentionally left blank.
The People Who Govern Your Fund
The trustees of your mutual fund are there to see that the fund is operated and managed in your best interests since, as a shareholder, you are a part owner of the fund. Your fund’s trustees also serve on the board of directors of The Vanguard Group, Inc., which is owned by the Vanguard funds and provides services to them on an at-cost basis.
A majority of Vanguard’s board members are independent, meaning that they have no affiliation with Vanguard or the funds they oversee, apart from the sizable personal investments they have made as private individuals.
Our independent board members bring distinguished backgrounds in business, academia, and public service to their task of working with Vanguard officers to establish the policies and oversee the activities of the funds. Among board members’ responsibilities are selecting investment advisors for the funds; monitoring fund operations, performance, and costs; reviewing contracts; nominating and selecting new trustees/directors; and electing Vanguard officers.
Each trustee serves a fund until its termination; or until the trustee’s retirement, resignation, or death; or otherwise as specified in the fund’s organizational documents. Any trustee may be removed at a shareholders’ meeting by a vote representing two-thirds of the net asset value of all shares of the fund together with shares of other Vanguard funds organized within the same trust. The table on these two pages shows information for each trustee and executive officer of the fund. The mailing address of the trustees and officers is P.O. Box 876, Valley Forge, PA 19482.
Chairman of the Board, Chief Executive Officer, and Trustee |
| |
John J. Brennan1 | |
Born 1954 | Principal Occupation(s) During the Past Five Years: Chairman of the Board, Chief Executive |
Trustee since May 1987; | Officer, and Director/Trustee of The Vanguard Group, Inc., and of each of the investment |
Chairman of the Board and | companies served by The Vanguard Group. |
Chief Executive Officer | |
148 Vanguard Funds Overseen | |
| |
Independent Trustees | |
| |
Charles D. Ellis | |
Born 1937 | Principal Occupation(s) During the Past Five Years: Applecore Partners (pro bono ventures |
Trustee since January 2001 | in education); Senior Advisor to Greenwich Associates (international business strategy |
148 Vanguard Funds Overseen | consulting); Successor Trustee of Yale University; Overseer of the Stern School of Business |
| at New York University; Trustee of the Whitehead Institute for Biomedical Research. |
| |
Rajiv L. Gupta | |
Born 1945 | Principal Occupation(s) During the Past Five Years: Chairman, President, and |
Trustee since December 20012 | Chief Executive Officer of Rohm and Haas Co. (chemicals); Board Member of |
148 Vanguard Funds Overseen | the American Chemistry Council; Director of Tyco International, Ltd. (diversified |
| manufacturing and services) since 2005; Trustee of Drexel University and of the |
| Chemical Heritage Foundation. |
| |
Amy Gutmann | |
Born 1949 | Principal Occupation(s) During the Past Five Years: President of the University of |
Trustee since June 2006 | Pennsylvania since 2004; Professor in the School of Arts and Sciences, Annenberg School |
148 Vanguard Funds Overseen | for Communication, and Graduate School of Education of the University of Pennsylvania |
| since 2004; Provost (2001–2004) and Laurance S. Rockefeller Professor of Politics and |
| the University Center for Human Values (1990–2004), Princeton University; Director of |
| Carnegie Corporation of New York since 2005 and of Schuylkill River Development |
| Corporation and Greater Philadelphia Chamber of Commerce since 2004. |
JoAnn Heffernan Heisen | |
Born 1950 | Principal Occupation(s) During the Past Five Years: Corporate Vice President and |
Trustee since July 1998 | Chief Global Diversity Officer since 2006, Vice President and Chief Information |
148 Vanguard Funds Overseen | Officer (1997–2005), and Member of the Executive Committee of Johnson & |
| Johnson (pharmaceuticals/consumer products); Director of the University Medical |
| Center at Princeton and Women’s Research and Education Institute. |
| |
André F. Perold | |
Born 1952 | Principal Occupation(s) During the Past Five Years: George Gund Professor of Finance |
Trustee since December 2004 | and Banking, Harvard Business School; Senior Associate Dean, Director of Faculty |
148 Vanguard Funds Overseen | Recruiting, and Chair of Finance Faculty, Harvard Business School; Director and Chairman |
| of UNX, Inc. (equities trading firm) since 2003; Chair of the Investment Committee of |
| HighVista Strategies LLC (private investment firm) since 2005. |
| |
Alfred M. Rankin, Jr. | |
Born 1941 | Principal Occupation(s) During the Past Five Years: Chairman, President, Chief Executive |
Trustee since January 1993 | Officer, and Director of NACCO Industries, Inc. (forklift trucks/housewares/lignite); Director |
148 Vanguard Funds Overseen | of Goodrich Corporation (industrial products/aircraft systems and services). |
| |
| |
J. Lawrence Wilson | |
Born 1936 | Principal Occupation(s) During the Past Five Years: Retired Chairman and Chief Executive |
Trustee since April 1985 | Officer of Rohm and Haas Co. (chemicals); Director of Cummins Inc. (diesel engines) and |
148 Vanguard Funds Overseen | AmerisourceBergen Corp. (pharmaceutical distribution); Trustee of Vanderbilt University |
| and of Culver Educational Foundation. |
| |
Executive Officers1 | |
| |
Thomas J. Higgins | |
Born 1957 | Principal Occupation(s) During the Past Five Years: Principal of The Vanguard Group, Inc.; |
Treasurer since July 1998 | Treasurer of each of the investment companies served by The Vanguard Group. |
148 Vanguard Funds Overseen | |
| |
| |
Heidi Stam | |
Born 1956 | Principal Occupation(s) During the Past Five Years: Managing Director of The Vanguard |
Secretary since July 2005 | Group, Inc., since 2006; General Counsel of The Vanguard Group since 2005; Secretary of |
148 Vanguard Funds Overseen | The Vanguard Group, and of each of the investment companies served by The Vanguard |
| Group, since 2005; Principal of The Vanguard Group (1997–2006). |
Vanguard Senior Management Team | | |
| | | |
R. Gregory Barton | Kathleen C. Gubanich | F. William McNabb, III | Ralph K. Packard |
Mortimer J. Buckley | Paul A. Heller | Michael S. Miller | George U. Sauter |
Founder |
|
John C. Bogle |
Chairman and Chief Executive Officer, 1974–1996 |
1 Officers of the funds are “interested persons” as defined in the Investment Company Act of 1940.
2 December 2002 for Vanguard Equity Income Fund, Vanguard Growth Equity Fund, the Vanguard Municipal Bond Funds, and the Vanguard State Tax-Exempt Funds.
More information about the trustees is in the Statement of Additional Information, available from The Vanguard Group.

P.O. Box 2600
Valley Forge, PA 19482-2600
Connect with Vanguard® > www.vanguard.com
Fund Information > 800-662-7447 | Vanguard, STAR, Connect with Vanguard, Windsor, |
| Explorer, Morgan, and the ship logo are trademarks |
Direct Investor Account Services > 800-662-2739 | of The Vanguard Group, Inc. |
| |
Institutional Investor Services > 800-523-1036 | |
| All other marks are the exclusive property of their |
Text Telephone for People | respective owners. |
With Hearing Impairment > 800-952-3335 | |
| All comparative mutual fund data are from Lipper Inc. |
| or Morningstar, Inc., unless otherwise noted. |
| |
| You can obtain a free copy of Vanguard’s proxy voting |
This material may be used in conjunction | guidelines by visiting our website, www.vanguard.com, |
with the offering of shares of any Vanguard | and searching for “proxy voting guidelines,” or by |
fund only if preceded or accompanied by | calling Vanguard at 800-662-2739. The guidelines are |
the fund’s current prospectus. | also available from the SEC’s website, www.sec.gov. |
| In addition, you may obtain a free report on how your |
| fund voted the proxies for securities it owned during |
| the 12 months ended June 30. To get the report, visit |
| either www.vanguard.com or www.sec.gov. |
| |
| You can review and copy information about your fund |
| at the SEC’s Public Reference Room in Washington, D.C. |
| To find out more about this public service, call the SEC |
| at 202-551-8090. Information about your fund is also |
| available on the SEC’s website, and you can receive |
| copies of this information, for a fee, by sending a |
| request in either of two ways: via e-mail addressed to |
| publicinfo@sec.gov or via regular mail addressed to the |
| Public Reference Section, Securities and Exchange |
| Commission, Washington, DC 20549-0102. |
| |
| |
| |
| |
| © 2007 The Vanguard Group, Inc. |
| All rights reserved. |
| Vanguard Marketing Corporation, Distributor. |
| |
| Q560 122007 |
> For the fiscal year ended October 31, 2007, returns for the Vanguard LifeStrategy Funds ranged from 8.1% for the most conservative fund to 16.3% for the fund with the most aggressive asset allocation.
> The Total International Stock Index Fund, a component of three of the four funds, gained 32.5% for the 12 months.
> The performance of each LifeStrategy Fund surpassed that of its corresponding benchmark index and the average result of peer funds with similar asset allocations. A higher-than-target stock allocation for each fund was the most significant factor in this outperformance.
Contents | |
| |
Your Fund’s Total Returns | 1 |
Chairman’s Letter | 2 |
LifeStrategy Income Fund | 7 |
LifeStrategy Conservative Growth Fund | 17 |
LifeStrategy Moderate Growth Fund | 27 |
LifeStrategy Growth Fund | 37 |
Your Fund’s After-Tax Returns | 49 |
About Your Fund’s Expenses | 50 |
Glossary | 52 |
Please note: The opinions expressed in this report are just that—informed opinions. They should not be considered promises or advice. Also, please keep in mind that the information and opinions cover the period through the date on the cover of this report. Of course, the risks of investing in your fund are spelled out in the prospectus.
Your Fund’s Total Returns
Fiscal Year Ended October 31, 2007 | | |
| Ticker | Total |
| Symbol | Returns |
Vanguard LifeStrategy Income Fund | VASIX | 8.1% |
Income Composite Index1 | | 7.3 |
Income Composite Average2 | | 6.9 |
| | |
| | |
Vanguard LifeStrategy Conservative Growth Fund | VSCGX | 10.8% |
Conservative Growth Composite Index1 | | 9.7 |
Conservative Growth Composite Average2 | | 9.7 |
| | |
| | |
Vanguard LifeStrategy Moderate Growth Fund | VSMGX | 13.6% |
Moderate Growth Composite Index1 | | 12.1 |
Moderate Growth Composite Average2 | | 12.5 |
| | |
| | |
Vanguard LifeStrategy Growth Fund | VASGX | 16.3% |
Growth Composite Index1 | | 14.5 |
Growth Composite Average2 | | 15.4 |
Your Fund’s Performance at a Glance |
October 31, 2006–October 31, 2007 |
| | | | | |
| | | | |
| Starting | Ending | Distributions Per Share | |
| Share | Share | Income | Capital | SEC |
| Price | Price | Dividends | Gains | Yield3 |
LifeStrategy Income Fund | $13.97 | $14.44 | $0.570 | $0.068 | 4.03% |
LifeStrategy Conservative Growth Fund | 16.43 | 17.61 | 0.570 | 0.000 | 3.36 |
LifeStrategy Moderate Growth Fund | 20.09 | 22.21 | 0.560 | 0.000 | 2.72 |
LifeStrategy Growth Fund | 23.32 | 26.56 | 0.520 | 0.000 | 2.05 |
1 Total returns for the composite indexes are derived by applying the funds’ target allocations to the results of the following benchmarks: for U.S. stocks, the Morgan Stanley Capital International (MSCI) US Broad Market Index; for international stocks, the MSCI Europe, Australasia, Far East (EAFE) Index; for bonds, the Lehman Brothers U.S. Aggregate Bond Index; and for short-term investments, the Lehman 1–3 Year U.S. Credit Index.
2 Each average is a blended composite that weights the return of the average comparable mutual fund for each asset class in proportion to the target weighting of the appropriate LifeStrategy Fund. All average returns for funds are derived from data provided by Lipper Inc. The Income Composite Average is weighted 60% average fixed income fund, 20% average general equity fund, and 20% average money market fund. The Conservative Growth Composite Average is weighted 40% average fixed income fund, 35% average general equity fund, 20% average money market fund, and 5% average international fund. The Moderate Growth Composite Average is weighted 50% average general equity fund, 40% average fixed income fund, and 10% average international fund. The Growth Composite Average is weighted 65% average general equity fund, 20% average fixed income fund, and 15% average international fund.
3 Thirty-day advertised yield net of expenses at month-end.
1

Chairman’s Letter
Dear Shareholder,
Despite an unsettling summer in stock and bond markets, returns were solid across asset classes for the year ended October 31, 2007. The well-diversified Vanguard LifeStrategy Funds captured these gains, with returns ranging from 8.1% for the most conservative fund in the series (the LifeStrategy Income Fund) to 16.3% for the most aggressive (the LifeStrategy Growth Fund).
The funds enjoyed a performance advantage both over their composite benchmarks and the returns that could have been earned from a composite of equity and fixed income mutual funds allocated in similar proportions. Each fund’s 25% exposure to Vanguard Asset Allocation Fund helped to sharpen that performance edge. The manager of the Asset Allocation Fund has continued to heavily favor stocks over bonds, which in turn boosted the LifeStrategy Funds’ stock exposure and performance.
Yields for the two more conservative funds, LifeStrategy Income and LifeStrategy Conservative Growth, were 4.03% and 3.36%, respectively, at the end of the fiscal year.
Stocks rode a bumpy path to impressive results
Despite some volatility, the U.S. stock market produced strong results during the fund’s fiscal year. Ongoing problems with low-quality mortgage loans (an unpleasant postscript to the housing downturn) rattled financial markets in the spring and summer, and continued to make investors skittish through the close of the fiscal period. At the end of October, crude oil prices touched historic highs, while the U.S. dollar dipped to record lows versus other major currencies.
Still, the broad U.S. stock market returned an impressive 15.3%. Large-capitalization stocks outperformed small-caps, and growth stocks outperformed value stocks—both continuing recent months’ reversals of longer-term trends.
International companies performed even better than domestic issues. Stocks in emerging markets fared particularly well, followed by European and Pacific region stocks (Japan was a notable laggard). The weak U.S. dollar boosted foreign stock returns for U.S.-based investors.
2
Bond investors converged on high-quality issues
As troubles in the subprime credit market rippled across the financial markets, bond investors sought the relative safety of U.S. Treasury bonds. This “flight to quality” drove prices for Treasuries higher and yields lower, and widened the spread between Treasury yields and the much higher yields demanded by investors for riskier bonds. Declines in Treasury yields were steepest at the short end of the maturity spectrum, aided by the actions of the Federal Reserve Board. The central bank lowered the target for short-term interest rates to 4.50% in two separate rate cuts (a half-percentage-point in September and a quarter-point on October 31). The yield of the 3-month Treasury bill finished the fiscal period at 3.92%, after spending much of the year near 5%; the 10-year Treasury note ended at 4.47%.
Market Barometer | | | |
| Average Annual Total Returns |
| Periods Ended October 31, 2007 |
| One Year | Three Years | Five Years |
Stocks | | | |
Russell 1000 Index (Large-caps) | 15.0% | 13.8% | 14.5% |
Russell 2000 Index (Small-caps) | 9.3 | 13.7 | 18.7 |
Dow Jones Wilshire 5000 Index (Entire market) | 15.3 | 14.2 | 15.3 |
MSCI All Country World Index ex USA (International) | 33.0 | 27.4 | 26.4 |
| | | |
| | | |
Bonds | | | |
Lehman U.S. Aggregate Bond Index (Broad taxable market) | 5.4% | 3.9% | 4.4% |
Lehman Municipal Bond Index | 2.9 | 3.7 | 4.5 |
Citigroup 3-Month Treasury Bill Index | 5.0 | 4.1 | 2.9 |
| | | |
| | | |
CPI | | | |
Consumer Price Index | 3.5% | 3.1% | 2.9% |
3
For the year, the broad taxable bond market returned 5.4%. Returns from tax-exempt bonds were lower, as these issues did not benefit from the late-summer rally in Treasuries.
Elevated stock exposure benefited all four funds
The four LifeStrategy portfolios are “funds of funds” that invest in up to five other Vanguard mutual funds, primarily index portfolios that track the broad U.S. stock or bond markets, or international equity markets. For the 12-month period, the underlying funds performed as follows:
Total International Stock Index Fund: 32.5% Total Stock Market Index Fund: 14.9% Asset Allocation Fund: 14.1% Short-Term Investment-Grade Fund: 5.4% Total Bond Market Index Fund: 5.3%
The return for each LifeStrategy Fund reflected its exposure to each of these asset classes. LifeStrategy Growth had the heaviest weighting in domestic and international stocks, which boosted its return to 16.3%. LifeStrategy Income’s 8.1% gain reflected its more-modest exposure to stocks and the fact that it holds no international stocks, in accordance with its more-conservative mandate. (See your fund’s respective Fund Profile page for a breakdown of its underlying holdings.)
Expense Ratios | | |
Your fund compared with its peer group | | |
| Acquired | Peer-Group |
| Fund Fees | Expense |
| and Expenses1 | Ratio2 |
LifeStrategy Income Fund | 0.24% | 1.10% |
LifeStrategy Conservative Growth Fund | 0.24 | 1.18 |
LifeStrategy Moderate Growth Fund | 0.23 | 1.29 |
LifeStrategy Growth Fund | 0.23 | 1.38 |
1 This figure represents a weighted average of the annualized expense ratios and any fees charged by the underlying mutual funds in which the LifeStrategy Funds invest. The LifeStrategy Funds do not charge any expenses or fees of their own. Acquired is a term that the Securities and Exchange Commission applies to any mutual fund whose shares are owned by another fund.
2 Peer groups are (from top to bottom) the Income Composite Average, the Conservative Growth Composite Average, the Moderate Growth Composite Average, and the Growth Composite Average. Each average is a blended composite that weights the expense of the average comparable mutual fund for each asset class in proportion to the target weighting of the appropriate LifeStrategy Fund. Peer-group expense ratios are derived from data provided by Lipper Inc. and capture information through year-end 2006.
4
Each LifeStrategy Fund invests about 25% of its assets in Vanguard Asset Allocation Fund, which tacks toward stocks, bonds, or cash, depending on signals from the advisor’s quantitative model. Over the 12 months, the Asset Allocation Fund’s stock allocation dropped from 100% to 80% as
the model predicted lower, but still relatively generous, prospective returns for stocks compared with those for bonds and cash. Even with the decline in stock exposure, the fund outdistanced its comparative benchmark, which maintains a static 65%/35% split between stocks and bonds. That performance edge filtered through all four LifeStrategy Funds.(At the end of the period, the Asset Allocation Fund held 90% of its assets in stocks.)
Three factors drive funds’ excellent long-term records
Most investors select LifeStrategy Funds as a long-term investment that provides both broad diversification and a stable risk profile. As this goal suggests, a longer-term perspective is in order. For the past decade, each of the funds has produced returns that surpassed those of their comparative measures.
Several factors play into the funds’ outperformance. First, the indexing expertise of Vanguard’s Quantitative Equity and Fixed Income Groups, which have honed their indexing methods in an effort to tightly track the performance of the funds’ benchmarks. Second, the exceptionally low costs of each of the underlying funds help them to post higher net returns. Also, Vanguard does not charge an additional fee for the fund-of-funds structure, an atypical approach that benefits investors. Finally, Vanguard Asset Allocation Fund has been successful in making rewarding tactical shifts between stocks and bonds over the past decade.
Target and Actual Asset Allocations |
Percentages as of October 31, 2007 |
| | | | | | | Short-Term |
| | Stocks1 | | | Bonds | | Investments |
| Target | Actual | | Target | Actual | | Target | Actual |
LifeStrategy Income Fund | 20% | 28% | | 60% | 52% | | 20% | 20% |
LifeStrategy Conservative Growth Fund | 40 | 48 | | 40 | 32 | | 20 | 20 |
LifeStrategy Moderate Growth Fund | 60 | 68 | | 40 | 32 | | 0 | 0 |
LifeStrategy Growth Fund | 80 | 88 | | 20 | 12 | | 0 | 0 |
1 Actual international stock positions for the Income, Conservative Growth, Moderate Growth, and Growth Funds equaled 0%, 5%, 10%, and 16% of assets, respectively.
5
In volatile markets, diversification and long-term perspective are key
The sharp increase in stock market volatility in recent months was a jolt to many investors. We at Vanguard always encourage shareholders to invest with a long-term view, to diversify within and across asset classes, and to pay attention to costs—bedrock principles that are even more important during periods of market turbulence.
The LifeStrategy Funds embody many of these key principles. They can give you the opportunity to take part in some of the rewards that each asset class offers while helping to dampen the effects of downturns. They offer diversification within a single fund at a low cost, due to their largely indexed strategy. And the four-fund lineup allows you to choose the fund whose risk profile best matches your own tolerance for market volatility.
Thank you for your ongoing confidence in Vanguard.
Sincerely,

John J. Brennan
Chairman and Chief Executive Officer
November 13, 2007
Total Returns | |
Ten Years Ended October 31, 2007 | |
| Average |
| Annual Return |
LifeStrategy Income Fund | 6.5% |
Income Composite Index | 6.0 |
Income Composite Average1 | 5.0 |
LifeStrategy Conservative Growth Fund | 7.1 |
Conservative Growth Composite Index | 6.5 |
Conservative Growth Composite Average1 | 5.6 |
LifeStrategy Moderate Growth Fund | 7.7 |
Moderate Growth Composite Index | 7.3 |
Moderate Growth Composite Average1 | 6.5 |
LifeStrategy Growth Fund | 8.0 |
Growth Composite Index | 7.6 |
Growth Composite Average1 | 6.9 |
The figures shown represent past performance, which is not a guarantee of future results. (Current performance may be lower or higher than the performance data cited. For performance data current to the most recent month-end, visit our website at www.vanguard.com/performance.) Note, too, that both investment returns and principal value can fluctuate widely, so an investor’s shares, when sold, could be worth more or less than their original cost.
1 Each average is a blended composite that weights the return of the average comparable mutual fund for each asset class in proportion to the target weighting of the appropriate LifeStrategy Fund. All together, the composites use returns for the average fixed income fund, the average general equity fund, the average international fund (except for the LifeStrategy Income Fund, which holds no international stocks), and the average money market fund. These returns are derived from data provided by Lipper Inc.
6
LifeStrategy Income Fund
Fund Profile
As of October 31, 2007
Financial Attributes | |
| |
Yield | 4.03% |
Acquired Fund Fees and Expenses1 | 0.24% |
Volatility Measures2 | |
| Fund Versus |
| Composite Index3 |
R-Squared | 0.95 |
Beta | 1.08 |
Allocation to Underlying Vanguard Funds | |
| |
Total Bond Market Index Fund | 49.9% |
Asset Allocation Fund | 25.2 |
Short-Term Investment-Grade Fund | 19.9 |
Total Stock Market Index Fund | 5.0 |
7
Equity Investment Focus
Fixed Income Investment Focus
Fund Asset Allocation
1 This figure represents a weighted average of the annualized expense ratios and any fees charged by the underlying mutual funds in which the fund invests. The fund does not charge any expenses or fees of its own. Acquired is a term that the Securities and Exchange Commission applies to any mutual fund whose shares are owned by another fund.
2 For an explanation of R-squared, beta, and other terms used here, see the Glossary on page 52.
3 60% Lehman U.S. Aggregate Bond Index, 20% Dow Jones Wilshire 5000 Index, and 20% Citigroup 3-Month Treasury Index through August 31, 2003; 60% Lehman U.S. Aggregate Bond Index, 20% Dow Jones Wilshire 5000 Index, and 20% Lehman 1–3 Year U.S. Credit Index through April 22, 2005; and 60% Lehman U.S. Aggregate Bond Index, 20% MSCI US Broad Market Index, and 20% Lehman 1–3 Year U.S. Credit Index thereafter.
8
LifeStrategy Income Fund
Performance Summary
All of the returns in this report represent past performance, which is not a guarantee of future results that may be achieved by the fund. (Current performance may be lower or higher than the performance data cited. For performance data current to the most recent month-end, visit our website at www.vanguard.com/performance.) Note, too, that both investment returns and principal value can fluctuate widely, so an investor’s shares, when sold, could be worth more or less than their original cost. The returns shown do not reflect taxes that a shareholder would pay on fund distributions or on the sale of fund shares.
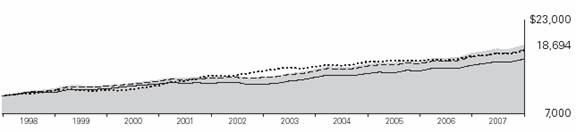
Cumulative Performance: October 31, 1997–October 31, 2007
Initial Investment of $10,000
| Average Annual Total Returns | Final Value |
| Periods Ended October 31, 2007 | of a $10,000 |
| One Year | Five Years | Ten Years | Investment |
LifeStrategy Income Fund1 | 8.14% | 7.20% | 6.46% | $18,694 |
Lehman U.S. Aggregate Bond Index | 5.38 | 4.41 | 5.91 | 17,756 |
Income Composite Index2 | 7.32 | 6.33 | 6.00 | 17,901 |
Income Composite Average3 | 6.87 | 6.37 | 5.01 | 16,299 |
1 Total return figures do not include the account service fee that may be applicable to certain accounts with balances below $10,000.
2 60% Lehman U.S. Aggregate Bond Index, 20% Dow Jones Wilshire 5000 Index, and 20% Citigroup 3-Month Treasury Index through August 31, 2003; 60% Lehman U.S. Aggregate Bond Index, 20% Dow Jones Wilshire 5000 Index, and 20% Lehman 1–3 Year U.S. Credit Index through April 22, 2005; and 60% Lehman U.S. Aggregate Bond Index, 20% MSCI US Broad Market Index, and 20% Lehman 1–3 Year U.S. Credit Index thereafter.
| 3 | A composite fund average weighted 60% average fixed income fund, 20% average general equity fund, and 20% average money market fund. Derived from data provided by Lipper Inc. |
9
LifeStrategy Income Fund
Fiscal-Year Total Returns (%): October 31, 1997–October 31, 2007 |
| | | | Income |
Fiscal | Capital | Income | Total | Composite |
Year | Return | Return | Return | Index1 |
1998 | 6.8% | 5.4% | 12.2% | 10.0% |
1999 | 0.1 | 5.2 | 5.3 | 6.1 |
2000 | 1.7 | 5.8 | 7.5 | 7.4 |
2001 | –0.7 | 5.5 | 4.8 | 3.7 |
2002 | –5.3 | 4.5 | –0.8 | 1.3 |
2003 | 6.1 | 3.8 | 9.9 | 8.2 |
2004 | 2.8 | 3.4 | 6.2 | 5.9 |
2005 | –0.1 | 3.5 | 3.4 | 3.0 |
2006 | 4.4 | 4.1 | 8.5 | 7.3 |
2007 | 3.9 | 4.2 | 8.1 | 7.3 |
Average Annual Total Returns: Periods Ended September 30, 2007
This table presents average annual total returns through the latest calendar quarter—rather than through the end of the fiscal period. Securities and Exchange Commission rules require that we provide this information.
| | | | | | Ten Years |
| Inception Date | One Year | Five Years | Capital | Income | Total |
LifeStrategy Income Fund2 | 9/30/1994 | 8.42% | 7.41% | 1.86% | 4.55% | 6.41% |
1 60% Lehman U.S. Aggregate Bond Index, 20% Dow Jones Wilshire 5000 Index, and 20% Citigroup 3-Month Treasury Index through August 31, 2003; 60% Lehman U.S. Aggregate Bond Index, 20% Dow Jones Wilshire 5000 Index, and 20% Lehman 1–3 Year U.S. Credit Index through April 22, 2005; and 60% Lehman U.S. Aggregate Bond Index, 20% MSCI US Broad Market Index, and 20% Lehman 1–3 Year U.S. Credit Index thereafter.
2 Total return figures do not include the account service fee that may be applicable to certain accounts with balances below $10,000.
Note: See Financial Highlights table on page 14 for dividend and capital gains information.
10
LifeStrategy Income Fund
Financial Statements
Statement of Net Assets
As of October 31, 2007
The fund provides a complete list of its holdings four times in each fiscal year, at the quarter-ends. For the second and fourth fiscal quarters, the lists appear in the fund’s semiannual and annual reports to shareholders. For the first and third fiscal quarters, the fund files the lists with the Securities and Exchange Commission on Form N-Q. Shareholders can look up the fund’s Forms N-Q on the SEC’s website at www.sec.gov. Forms N-Q may also be reviewed and copied at the SEC’s Public Reference Room (see the back cover of this report for further information).
| | Market |
| | Value• |
| Shares | ($000) |
Investment Companies (100.1%) | | |
U.S. Stock Fund (5.0%) | | |
Vanguard Total Stock Market Index Fund Investor Shares | 2,536,832 | 94,979 |
| | |
Balanced Fund (25.2%) | | |
Vanguard Asset Allocation Fund Investor Shares | 15,112,845 | 475,601 |
| | |
Bond Fund (50.0%) | | |
Vanguard Total Bond Market Index Fund Investor Shares | 93,884,100 | 941,658 |
| | |
Short-Term Bond Fund (19.9%) | | |
Vanguard Short-Term Investment-Grade Fund Investor Shares | 35,426,131 | 375,871 |
Total Investments (Cost $1,688,581) | | 1,888,109 |
Other Assets and Liabilities (–0.1%) | | |
Other Assets | | 9,645 |
Liabilities | | (12,718) |
| | (3,073) |
Net Assets (100%) | | |
Applicable to 130,584,928 outstanding $.001 par value shares of | | |
beneficial interest (unlimited authorization) | | 1,885,036 |
Net Asset Value Per Share | | $14.44 |
At October 31, 2007, net assets consisted of:1 | | |
| Amount | Per |
| ($000) | Share |
Paid-in Capital | 1,673,936 | $12.82 |
Undistributed Net Investment Income | 8,036 | .06 |
Accumulated Net Realized Gains | 3,536 | .03 |
Unrealized Appreciation | 199,528 | 1.53 |
Net Assets | 1,885,036 | $14.44 |
• See Note A in Notes to Financial Statements.
1 See Note C in Notes to Financial Statements for the tax-basis components of net assets.
11
LifeStrategy Income Fund
Statement of Operations
| Year Ended |
| October 31, 2007 |
| ($000) |
Investment Income | |
Income | |
Income Distributions Received | 71,760 |
Net Investment Income—Note B | 71,760 |
Realized Net Gain (Loss) | |
Capital Gain Distributions Received | — |
Investment Securities Sold | 4,081 |
Realized Net Gain (Loss) | 4,081 |
Change in Unrealized Appreciation (Depreciation) of Investment Securities | 61,643 |
Net Increase (Decrease) in Net Assets Resulting from Operations | 137,484 |
12
LifeStrategy Income Fund
Statement of Changes in Net Assets
| Year Ended October 31, |
| 2007 | 2006 |
| ($000) | ($000) |
Increase (Decrease) in Net Assets | | |
Operations | | |
Net Investment Income | 71,760 | 63,568 |
Realized Net Gain (Loss) | 4,081 | 8,495 |
Change in Unrealized Appreciation (Depreciation) | 61,643 | 64,199 |
Net Increase (Decrease) in Net Assets Resulting from Operations | 137,484 | 136,262 |
Distributions | | |
Net Investment Income | (70,696) | (63,294) |
Realized Capital Gain1 | (8,121) | — |
Total Distributions | (78,817) | (63,294) |
Capital Share Transactions—Note E | | |
Issued | 479,041 | 336,154 |
Issued in Lieu of Cash Distributions | 73,744 | 58,819 |
Redeemed | (392,021) | (553,945) |
Net Increase (Decrease) from Capital Share Transactions | 160,764 | (158,972) |
Total Increase (Decrease) | 219,431 | (86,004) |
Net Assets | | |
Beginning of Period | 1,665,605 | 1,751,609 |
End of Period2 | 1,885,036 | 1,665,605 |
1 Includes fiscal 2007 short-term gain distributions totaling $3,344,000. Short-term gain distributions are treated as ordinary income dividends for tax purposes.
2 Net Assets—End of Period includes undistributed net investment income of $8,036,000 and $6,972,000.
13
LifeStrategy Income Fund
Financial Highlights
| Year Ended October 31, |
For a Share Outstanding Throughout Each Period | 2007 | 2006 | 2005 | 2004 | 2003 |
Net Asset Value, Beginning of Period | $13.97 | $13.38 | $13.39 | $13.03 | $12.28 |
Investment Operations | | | | | |
Net Investment Income | .570 | .53 | .47 | .43 | .44 |
Capital Gain Distributions Received | — | — | — | .01 | — |
Net Realized and Unrealized Gain (Loss) | | | | | |
on Investments | .538 | .58 | (.02) | .35 | .76 |
Total from Investment Operations | 1.108 | 1.11 | .45 | .79 | 1.20 |
Distributions | | | | | |
Dividends from Net Investment Income | (.570) | (.52) | (.46) | (.43) | (.45) |
Distributions from Realized Capital Gains | (.068) | — | — | — | — |
Total Distributions | (.638) | (.52) | (.46) | (.43) | (.45) |
Net Asset Value, End of Period | $14.44 | $13.97 | $13.38 | $13.39 | $13.03 |
| | | | | |
| | | | | |
Total Return1 | 8.14% | 8.49% | 3.39% | 6.15% | 9.95% |
| | | | | |
| | | | | |
Ratios/Supplemental Data | | | | | |
Net Assets, End of Period (Millions) | $1,885 | $1,666 | $1,752 | $1,611 | $1,305 |
Ratio of Expenses to | | | | | |
Average Net Assets—Note B | 0%2 | 0% | 0% | 0% | 0% |
Ratio of Net Investment Income to | | | | | |
Average Net Assets | 4.07% | 3.85% | 3.47% | 3.31% | 3.53% |
Portfolio Turnover Rate | 8% | 14% | 6% | 4% | 4% |
1 Total returns do not include the account service fee that may be applicable to certain accounts with balances below $10,000.
2 The acquired fund fees and expenses were 0.24%.
See accompanying Notes, which are an integral part of the Financial Statements.
14
LifeStrategy Income Fund
Notes to Financial Statements
Vanguard LifeStrategy Income Fund is registered under the Investment Company Act of 1940 as an open-end investment company, or mutual fund. The fund files reports with the SEC under the company name Vanguard STAR® Funds. The fund follows a balanced investment strategy by investing in selected Vanguard funds to achieve its targeted allocation of assets to U.S. stocks, bonds, and short-term reserves.
A. The following significant accounting policies conform to generally accepted accounting principles for U.S. mutual funds. The fund consistently follows such policies in preparing its financial statements.
1. Valuation: Investments are valued at the net asset value of each underlying Vanguard fund determined as of the close of the New York Stock Exchange (generally 4 p.m., Eastern time) on the valuation date.
2. Federal Income Taxes: The fund intends to continue to qualify as a regulated investment company and distribute all of its taxable income. Accordingly, no provision for federal income taxes is required in the financial statements.
3. Distributions: Distributions to shareholders are recorded on the ex-dividend date.
4. Other: Income and capital gain distributions received are recorded on the ex-dividend date. Security transactions are accounted for on the date securities are bought or sold. Costs used to determine realized gains (losses) on the sale of investment securities are those of the specific securities sold.
B. Under a service agreement, The Vanguard Group furnishes corporate management, administrative, marketing, and distribution services to the fund. The service agreement provides that Vanguard will reimburse the fund’s expenses to the extent of savings in administrative and marketing costs realized by Vanguard in the operation of the fund. Accordingly, all expenses incurred by the fund during the year ended October 31, 2007, were reimbursed by Vanguard. The fund’s trustees and officers are also directors and officers of Vanguard and the funds in which the fund invests.
C. Distributions are determined on a tax basis and may differ from net investment income and realized capital gains for financial reporting purposes. Differences may be permanent or temporary. Permanent differences are reclassified among capital accounts in the financial statements to reflect their tax character. Temporary differences arise when certain items of income, expense, gain, or loss are recognized in different periods for financial statement and tax purposes; these differences will reverse at some time in the future. Differences in classification may also result from the treatment of short-term gains as ordinary income for tax purposes.
For tax purposes, at October 31, 2007, the fund had $9,940,000 of ordinary income and $1,804,000 of long-term capital gains available for distribution.
At October 31, 2007, the cost of investment securities for tax purposes was $1,688,752,000. Net unrealized appreciation of investment securities for tax purposes was $199,357,000, consisting of unrealized gains of $210,086,000 on securities that had risen in value since their purchase and $10,729,000 in unrealized losses on securities that had fallen in value since their purchase.
D. During the year ended October 31, 2007, the fund purchased $304,494,000 of investment securities and sold $143,225,000 of investment securities other than temporary cash investments.
15
LifeStrategy Income Fund
E. Capital shares issued and redeemed were:
| Year Ended October 31, |
| 2007 | 2006 |
| Shares | Shares |
| (000) | (000) |
Issued | 33,884 | 24,760 |
Issued in Lieu of Cash Distributions | 5,255 | 4,362 |
Redeemed | (27,763) | (40,824) |
Net Increase (Decrease) in Shares Outstanding | 11,376 | (11,702) |
F. In June 2006, the Financial Accounting Standards Board issued Interpretation No. 48 (“FIN 48”), “Accounting for Uncertainty in Income Taxes.” FIN 48 establishes the minimum threshold for recognizing, and a system for measuring, the benefits of tax-return positions in financial statements, and is effective for the fund’s fiscal year beginning November 1, 2007. Management has analyzed the fund’s tax positions taken on federal income tax returns for all open tax years (tax years ended October 31, 2004–2007) for purposes of implementing FIN 48, and has concluded that as of October 31, 2007, no provision for income tax would be required in the fund’s financial statements.
16
LifeStrategy Conservative Growth Fund
Fund Profile
As of October 31, 2007
Financial Attributes | |
| |
Yield | 3.36% |
Acquired Fund Fees and Expenses1 | 0.24% |
Volatility Measures2 | |
| Fund Versus |
| Composite Index3 |
R-Squared | 0.98 |
Beta | 1.13 |
Allocation to Underlying Vanguard Funds | |
| |
Total Bond Market Index Fund | 29.8% |
Asset Allocation Fund | 25.0 |
Total Stock Market Index Fund | 20.1 |
Short-Term Investment-Grade Fund | 19.9 |
Total International Stock Index Fund | 5.2 |
17
Equity Investment Focus
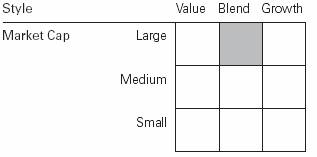
Fixed Income Investment Focus
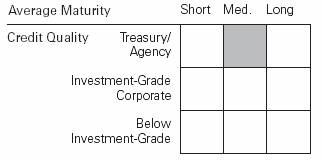
Fund Asset Allocation
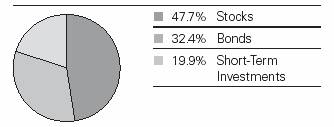
1 This figure represents a weighted average of the annualized expense ratios and any fees charged by the underlying mutual funds in which the fund invests. The fund does not charge any expenses or fees of its own. Acquired is a term that the Securities and Exchange Commission applies to any mutual fund whose shares are owned by another fund.
2 For an explanation of R-squared, beta, and other terms used here, see the Glossary on page 52.
3 40% Lehman U.S. Aggregate Bond Index, 35% Dow Jones Wilshire 5000 Index, 20% Citigroup 3-Month Treasury Index, and 5% MSCI EAFE Index through August 31, 2003; 40% Lehman U.S. Aggregate Bond Index, 35% Dow Jones Wilshire 5000 Index, 20% Lehman 1–3 Year U.S. Credit Index, and 5% MSCI EAFE Index through April 22, 2005; and 40% Lehman U.S. Aggregate Bond Index, 35% MSCI US Broad Market Index, 20% Lehman 1–3 Year U.S. Credit Index, and 5% MSCI EAFE Index thereafter.
18
LifeStrategy Conservative Growth Fund
Performance Summary
All of the returns in this report represent past performance, which is not a guarantee of future results that may be achieved by the fund. (Current performance may be lower or higher than the performance data cited. For performance data current to the most recent month-end, visit our website at www.vanguard.com/performance.) Note, too, that both investment returns and principal value can fluctuate widely, so an investor’s shares, when sold, could be worth more or less than their original cost. The returns shown do not reflect taxes that a shareholder would pay on fund distributions or on the sale of fund shares.
Cumulative Performance: October 31, 1997–October 31, 2007
Initial Investment of $10,000
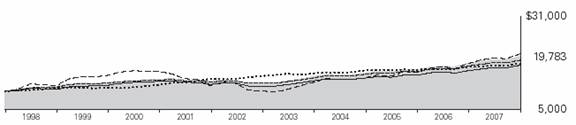
| Average Annual Total Returns | Final Value |
| Periods Ended October 31, 2007 | of a $10,000 |
| One Year | Five Years | Ten Years | Investment |
LifeStrategy Conservative Growth Fund1 | 10.84% | 9.83% | 7.06% | $19,783 |
Lehman U.S. Aggregate Bond Index | 5.38 | 4.41 | 5.91 | 17,756 |
Dow Jones Wilshire 5000 Index | 15.28 | 15.31 | 7.44 | 20,495 |
Conservative Growth Composite Index2 | 9.71 | 8.85 | 6.49 | 18,751 |
Conservative Growth Composite Average3 | 9.67 | 8.69 | 5.64 | 17,313 |
1 Total return figures do not include the account service fee that may be applicable to certain accounts with balances below $10,000.
2 40% Lehman U.S. Aggregate Bond Index, 35% Dow Jones Wilshire 5000 Index, 20% Citigroup 3-Month Treasury Index, and 5% MSCI EAFE Index through August 31, 2003; 40% Lehman U.S. Aggregate Bond Index, 35% Dow Jones Wilshire 5000 Index, 20% Lehman 1–3 Year U.S. Credit Index, and 5% MSCI EAFE Index through April 22, 2005; and 40% Lehman U.S. Aggregate Bond Index, 35% MSCI US Broad Market Index, 20% Lehman 1–3 Year U.S. Credit Index, and 5% MSCI EAFE Index thereafter.
3 A composite fund average weighted 40% average fixed income fund, 35% average general equity fund, 20% average money market fund, and 5% average international fund. Derived from data provided by Lipper Inc.
19
LifeStrategy Conservative Growth Fund
Fiscal-Year Total Returns (%): October 31, 1997–October 31, 2007 |
| | | | Conservative |
| | | | Growth |
Fiscal | Capital | Income | Total | Composite |
Year | Return | Return | Return | Index1 |
1998 | 8.5% | 4.5% | 13.0% | 11.0% |
1999 | 5.5 | 4.5 | 10.0 | 11.0 |
2000 | 2.5 | 4.8 | 7.3 | 7.0 |
2001 | –7.6 | 4.3 | –3.3 | –4.6 |
2002 | –7.7 | 3.6 | –4.1 | –2.5 |
2003 | 10.6 | 3.4 | 14.0 | 12.2 |
2004 | 4.7 | 2.8 | 7.5 | 7.2 |
2005 | 2.8 | 3.0 | 5.8 | 5.2 |
2006 | 7.8 | 3.4 | 11.2 | 10.1 |
2007 | 7.2 | 3.6 | 10.8 | 9.7 |
Average Annual Total Returns: Periods Ended September 30, 2007
This table presents average annual total returns through the latest calendar quarter—rather than through the end of the fiscal period. Securities and Exchange Commission rules require that we provide this information.
| | | | | | Ten Years |
| Inception Date | One Year | Five Years | Capital | Income | Total |
LifeStrategy Conservative | | | | | | |
Growth Fund2 | 9/30/1994 | 11.31% | 10.29% | 3.04% | 3.80% | 6.84% |
1 40% Lehman U.S. Aggregate Bond Index, 35% Dow Jones Wilshire 5000 Index, 20% Citigroup 3-Month Treasury Index, and 5% MSCI EAFE Index through August 31, 2003; 40% Lehman U.S. Aggregate Bond Index, 35% Dow Jones Wilshire 5000 Index, 20% Lehman 1–3 Year U.S. Credit Index, and 5% MSCI EAFE Index through April 22, 2005; and 40% Lehman U.S. Aggregate Bond Index, 35% MSCI US Broad Market Index, 20% Lehman 1–3 Year U.S. Credit Index, and 5% MSCI EAFE Index thereafter.
2 Total return figures do not include the account service fee that may be applicable to certain accounts with balances below $10,000.
Note: See Financial Highlights table on page 24 for dividend and capital gains information.
20
LifeStrategy Conservative Growth Fund
Financial Statements
Statement of Net Assets
As of October 31, 2007
The fund provides a complete list of its holdings four times in each fiscal year, at the quarter-ends. For the second and fourth fiscal quarters, the lists appear in the fund’s semiannual and annual reports to shareholders. For the first and third fiscal quarters, the fund files the lists with the Securities and Exchange Commission on Form N-Q. Shareholders can look up the fund’s Forms N-Q on the SEC’s website at www.sec.gov. Forms N-Q may also be reviewed and copied at the SEC’s Public Reference Room (see the back cover of this report for further information).
| | Market |
| | Value• |
| Shares | ($000) |
Investment Companies (100.1%) | | |
U.S. Stock Fund (20.1%) | | |
Vanguard Total Stock Market Index Fund Investor Shares | 37,797,644 | 1,415,144 |
| | |
International Stock Fund (5.2%) | | |
Vanguard Total International Stock Index Fund | 16,674,731 | 365,010 |
| | |
Balanced Fund (25.0%) | | |
Vanguard Asset Allocation Fund Investor Shares | 56,102,246 | 1,765,537 |
| | |
Bond Fund (29.9%) | | |
Vanguard Total Bond Market Index Fund Investor Shares | 210,215,845 | 2,108,465 |
| | |
Short-Term Bond Fund (19.9%) | | |
Vanguard Short-Term Investment-Grade Fund Investor Shares | 132,064,278 | 1,401,202 |
Total Investments (Cost $5,908,777) | | 7,055,358 |
Other Assets and Liabilities (–0.1%) | | |
Other Assets | | 19,917 |
Liabilities | | (31,655) |
| | (11,738) |
Net Assets (100%) | | |
Applicable to 399,996,611 outstanding $.001 par value shares of | | |
beneficial interest (unlimited authorization) | | 7,043,620 |
Net Asset Value Per Share | | $17.61 |
At October 31, 2007, net assets consisted of:1 | | |
| Amount | Per |
| ($000) | Share |
Paid-in Capital | 5,870,599 | $14.67 |
Undistributed Net Investment Income | 22,889 | .06 |
Accumulated Net Realized Gains | 3,551 | .01 |
Unrealized Appreciation | 1,146,581 | 2.87 |
Net Assets | 7,043,620 | $17.61 |
• See Note A in Notes to Financial Statements.
1 See Note C in Notes to Financial Statements for the tax-basis components of net assets.
21
LifeStrategy Conservative Growth Fund
Statement of Operations
| Year Ended |
| October 31, 2007 |
| ($000) |
Investment Income | |
Income | |
Income Distributions Received | 219,319 |
Net Investment Income—Note B | 219,319 |
Realized Net Gain (Loss) | |
Capital Gain Distributions Received | — |
Investment Securities Sold | 8,734 |
Realized Net Gain (Loss) | 8,734 |
Change in Unrealized Appreciation (Depreciation) of Investment Securities | 424,584 |
Net Increase (Decrease) in Net Assets Resulting from Operations | 652,637 |
22
LifeStrategy Conservative Growth Fund
Statement of Changes in Net Assets
| Year Ended October 31, |
| 2007 | 2006 |
| ($000) | ($000) |
Increase (Decrease) in Net Assets | | |
Operations | | |
Net Investment Income | 219,319 | 148,299 |
Realized Net Gain (Loss) | 8,734 | 6,680 |
Change in Unrealized Appreciation (Depreciation) | 424,584 | 347,065 |
Net Increase (Decrease) in Net Assets Resulting from Operations | 652,637 | 502,044 |
Distributions | | |
Net Investment Income | (213,606) | (142,715) |
Realized Capital Gain | — | — |
Total Distributions | (213,606) | (142,715) |
Capital Share Transactions—Note E | | |
Issued | 2,532,740 | 1,570,776 |
Issued in Lieu of Cash Distributions | 208,599 | 138,928 |
Redeemed | (1,463,169) | (821,888) |
Net Increase (Decrease) from Capital Share Transactions | 1,278,170 | 887,816 |
Total Increase (Decrease) | 1,717,201 | 1,247,145 |
Net Assets | | |
Beginning of Period | 5,326,419 | 4,079,274 |
End of Period1 | 7,043,620 | 5,326,419 |
1 Net Assets—End of Period includes undistributed net investment income of $22,889,000 and $17,176,000.
23
LifeStrategy Conservative Growth Fund
Financial Highlights
| Year Ended October 31, |
For a Share Outstanding Throughout Each Period | 2007 | 2006 | 2005 | 2004 | 2003 |
Net Asset Value, Beginning of Period | $16.43 | $15.24 | $14.83 | $14.17 | $12.81 |
Investment Operations | | | | | |
Net Investment Income | .58 | .50 | .44 | .40 | .39 |
Capital Gain Distributions Received | — | — | — | .01 | — |
Net Realized and Unrealized Gain (Loss) | | | | | |
on Investments | 1.17 | 1.18 | .41 | .64 | 1.37 |
Total from Investment Operations | 1.75 | 1.68 | .85 | 1.05 | 1.76 |
Distributions | | | | | |
Dividends from Net Investment Income | (.57) | (.49) | (.44) | (.39) | (.40) |
Distributions from Realized Capital Gains | — | — | — | — | — |
Total Distributions | (.57) | (.49) | (.44) | (.39) | (.40) |
Net Asset Value, End of Period | $17.61 | $16.43 | $15.24 | $14.83 | $14.17 |
| | | | | |
| | | | | |
Total Return1 | 10.84% | 11.23% | 5.77% | 7.49% | 13.99% |
| | | | | |
| | | | | |
Ratios/Supplemental Data | | | | | |
Net Assets, End of Period (Millions) | $7,044 | $5,326 | $4,079 | $3,463 | $2,795 |
Ratio of Expenses to | | | | | |
Average Net Assets—Note B | 0%2 | 0% | 0% | 0% | 0% |
Ratio of Net Investment Income to | | | | | |
Average Net Assets | 3.40% | 3.21% | 2.95% | 2.74% | 2.92% |
Portfolio Turnover Rate | 10% | 4% | 7% | 5% | 5% |
1 Total returns do not include the account service fee that may be applicable to certain accounts with balances below $10,000.
2 The acquired fund fees and expenses were 0.24%.
See accompanying Notes, which are an integral part of the Financial Statements.
24
LifeStrategy Conservative Growth Fund
Notes to Financial Statements
Vanguard LifeStrategy Conservative Growth Fund is registered under the Investment Company Act of 1940 as an open-end investment company, or mutual fund. The fund files reports with the SEC under the company name Vanguard STAR Funds. The fund follows a balanced investment strategy by investing in selected Vanguard funds to achieve its targeted allocation of assets to U.S. stocks, international stocks, bonds, and short-term reserves.
A. The following significant accounting policies conform to generally accepted accounting principles for U.S. mutual funds. The fund consistently follows such policies in preparing its financial statements.
1. Valuation: Investments are valued at the net asset value of each underlying Vanguard fund determined as of the close of the New York Stock Exchange (generally 4 p.m., Eastern time) on the valuation date.
2. Federal Income Taxes: The fund intends to continue to qualify as a regulated investment company and distribute all of its taxable income. Accordingly, no provision for federal income taxes is required in the financial statements.
3. Distributions: Distributions to shareholders are recorded on the ex-dividend date.
4. Other: Income and capital gain distributions received are recorded on the ex-dividend date. Security transactions are accounted for on the date securities are bought or sold. Costs used to determine realized gains (losses) on the sale of investment securities are those of the specific securities sold.
B. Under a service agreement, The Vanguard Group furnishes corporate management, administrative, marketing, and distribution services to the fund. The service agreement provides that Vanguard will reimburse the fund’s expenses to the extent of savings in administrative and marketing costs realized by Vanguard in the operation of the fund. Accordingly, all expenses incurred by the fund during the year ended October 31, 2007, were reimbursed by Vanguard. The fund’s trustees and officers are also directors and officers of Vanguard and the funds in which the fund invests.
C. Distributions are determined on a tax basis and may differ from net investment income and realized capital gains for financial reporting purposes. Differences may be permanent or temporary. Permanent differences are reclassified among capital accounts in the financial statements to reflect their tax character. Temporary differences arise when certain items of income, expense, gain, or loss are recognized in different periods for financial statement and tax purposes; these differences will reverse at some time in the future. Differences in classification may also result from the treatment of short-term gains as ordinary income for tax purposes.
The fund used a capital loss carryforward of $5,607,000 to offset taxable capital gains realized during the year ended October 31, 2007, reducing the amount of capital gains that would otherwise be available to distribute to shareholders. For tax purposes, at October 31, 2007, the fund had $26,748,000 of ordinary income and no long-term capital gains available for distribution.
At October 31, 2007, the cost of investment securities for tax purposes was $5,909,085,000. Net unrealized appreciation of investment securities for tax purposes was $1,146,273,000, consisting of unrealized gains of $1,153,287,000 on securities that had risen in value since their purchase and $7,014,000 in unrealized losses on securities that had fallen in value since their purchase.
D. During the year ended October 31, 2007, the fund purchased $1,945,702,000 of investment securities and sold $636,097,000 of investment securities other than temporary cash investments.
25
LifeStrategy Conservative Growth Fund
E. Capital shares issued and redeemed were:
| Year Ended October 31, |
| 2007 | 2006 |
| Shares | Shares |
| (000) | (000) |
Issued | 149,769 | 99,714 |
Issued in Lieu of Cash Distributions | 12,327 | 8,898 |
Redeemed | (86,238) | (52,170) |
Net Increase (Decrease) in Shares Outstanding | 75,858 | 56,442 |
F. In June 2006, the Financial Accounting Standards Board issued Interpretation No. 48 (“FIN 48”), “Accounting for Uncertainty in Income Taxes.” FIN 48 establishes the minimum threshold for recognizing, and a system for measuring, the benefits of tax-return positions in financial statements, and is effective for the fund’s fiscal year beginning November 1, 2007. Management has analyzed the fund’s tax positions taken on federal income tax returns for all open tax years (tax years ended October 31, 2004–2007) for purposes of implementing FIN 48, and has concluded that as of October 31, 2007, no provision for income tax would be required in the fund’s financial statements.
26
LifeStrategy Moderate Growth Fund
Fund Profile
As of October 31, 2007
Financial Attributes | |
| |
Yield | 2.72% |
Acquired Fund Fees and Expenses1 | 0.23% |
Volatility Measures2 | |
| Fund Versus |
| Composite Index3 |
R-Squared | 0.99 |
Beta | 1.10 |
Allocation to Underlying Vanguard Funds | |
| |
Total Stock Market Index Fund | 34.8% |
Total Bond Market Index Fund | 29.9 |
Asset Allocation Fund | 25.0 |
Total International Stock Index Fund | 10.3 |
27
Equity Investment Focus

Fixed Income Investment Focus
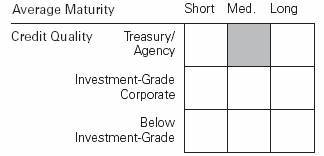
Fund Asset Allocation
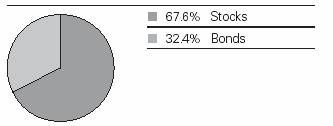
1 This figure represents a weighted average of the annualized expense ratios and any fees charged by the underlying mutual funds in which the fund invests. The fund does not charge any expenses or fees of its own. Acquired is a term that the Securities and Exchange Commission applies to any mutual fund whose shares are owned by another fund.
2 For an explanation of R-squared, beta, and other terms used here, see the Glossary on page 52.
3 50% Dow Jones Wilshire 5000 Index, 40% Lehman U.S. Aggregate Bond Index, and 10% MSCI EAFE Index through April 22, 2005; and 50% MSCI US Broad Market Index, 40% Lehman U.S. Aggregate Bond Index, and 10% MSCI EAFE Index thereafter.
28
LifeStrategy Moderate Growth Fund
Performance Summary
All of the returns in this report represent past performance, which is not a guarantee of future results that may be achieved by the fund. (Current performance may be lower or higher than the performance data cited. For performance data current to the most recent month-end, visit our website at www.vanguard.com/performance.) Note, too, that both investment returns and principal value can fluctuate widely, so an investor’s shares, when sold, could be worth more or less than their original cost. The returns shown do not reflect taxes that a shareholder would pay on fund distributions or on the sale of fund shares.
Cumulative Performance: October 31, 1997–October 31, 2007
Initial Investment of $10,000
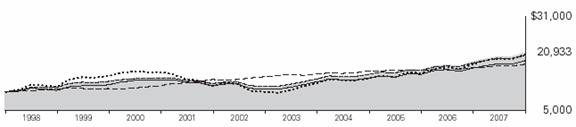
| Average Annual Total Returns | Final Value |
| Periods Ended October 31, 2007 | of a $10,000 |
| One Year | Five Years | Ten Years | Investment |
LifeStrategy Moderate Growth Fund1 | 13.55% | 12.55% | 7.67% | $20,933 |
Dow Jones Wilshire 5000 Index | 15.28 | 15.31 | 7.44 | 20,495 |
Lehman U.S. Aggregate Bond Index | 5.38 | 4.41 | 5.91 | 17,756 |
Moderate Growth Composite Index2 | 12.11 | 11.67 | 7.33 | 20,287 |
Moderate Growth Composite Average3 | 12.54 | 11.58 | 6.49 | 18,755 |
1 Total return figures do not include the account service fee that may be applicable to certain accounts with balances below $10,000.
2 50% Dow Jones Wilshire 5000 Index, 40% Lehman U.S. Aggregate Bond Index, and 10% MSCI EAFE Index through April 22, 2005; and 50% MSCI US Broad Market Index, 40% Lehman U.S. Aggregate Bond Index, and 10% MSCI EAFE Index thereafter.
3 A composite fund average weighted 50% average general equity fund, 40% average fixed income fund, and 10% average international fund. Derived from data provided by Lipper Inc.
29
LifeStrategy Moderate Growth Fund
Fiscal-Year Total Returns (%): October 31, 1997–October 31, 2007 |
| | | | Moderate |
| | | | Growth |
Fiscal | Capital | Income | Total | Composite |
Year | Return | Return | Return | Index1 |
1998 | 10.8% | 3.5% | 14.3% | 12.8% |
1999 | 10.7 | 3.6 | 14.3 | 15.0 |
2000 | 3.8 | 3.4 | 7.2 | 6.9 |
2001 | –13.7 | 3.0 | –10.7 | –10.9 |
2002 | –10.1 | 2.8 | –7.3 | –5.5 |
2003 | 15.0 | 3.1 | 18.1 | 16.9 |
2004 | 6.9 | 2.5 | 9.4 | 9.1 |
2005 | 5.4 | 2.6 | 8.0 | 7.5 |
2006 | 11.1 | 3.0 | 14.1 | 13.0 |
2007 | 10.6 | 3.0 | 13.6 | 12.1 |
Average Annual Total Returns: Periods Ended September 30, 2007
This table presents average annual total returns through the latest calendar quarter—rather than through the end of the fiscal period. Securities and Exchange Commission rules require that we provide this information.
| | | | | | Ten Years |
| Inception Date | One Year | Five Years | Capital | Income | Total |
LifeStrategy Moderate Growth Fund2 | 9/30/1994 | 14.31% | 13.29% | 4.24% | 3.04% | 7.28% |
1 50% Dow Jones Wilshire 5000 Index, 40% Lehman U.S. Aggregate Bond Index, and 10% MSCI EAFE Index through April 22, 2005; and 50% MSCI US Broad Market Index, 40% Lehman U.S. Aggregate Bond Index, and 10% MSCI EAFE Index thereafter.
2 Total return figures do not include the account service fee that may be applicable to certain accounts with balances below $10,000.
Note: See Financial Highlights table on page 34 for dividend and capital gains information.
30
LifeStrategy Moderate Growth Fund
Financial Statements
Statement of Net Assets
As of October 31, 2007
The fund provides a complete list of its holdings four times in each fiscal year, at the quarter-ends. For the second and fourth fiscal quarters, the lists appear in the fund’s semiannual and annual reports to shareholders. For the first and third fiscal quarters, the fund files the lists with the Securities and Exchange Commission on Form N-Q. Shareholders can look up the fund’s Forms N-Q on the SEC’s website at www.sec.gov. Forms N-Q may also be reviewed and copied at the SEC’s Public Reference Room (see the back cover of this report for further information).
| | Market |
| | Value• |
| Shares | ($000) |
Investment Companies (100.1%) | | |
U.S. Stock Fund (34.9%) | | |
Vanguard Total Stock Market Index Fund Investor Shares | 105,175,282 | 3,937,763 |
| | |
International Stock Fund (10.3%) | | |
Vanguard Total International Stock Index Fund | 52,938,740 | 1,158,829 |
| | |
Balanced Fund (25.0%) | | |
Vanguard Asset Allocation Fund Investor Shares | 89,507,292 | 2,816,794 |
| | |
Bond Fund (29.9%) | | |
Vanguard Total Bond Market Index Fund Investor Shares | 335,858,379 | 3,368,660 |
Total Investment Companies (Cost $8,453,030) | | 11,282,046 |
Other Assets and Liabilities (–0.1%) | | |
Other Assets | | 27,752 |
Liabilities | | (37,529) |
| | (9,777) |
Net Assets (100%) | | |
Applicable to 507,514,634 outstanding $.001 par value shares of | | |
beneficial interest (unlimited authorization) | | 11,272,269 |
Net Asset Value Per Share | | $22.21 |
At October 31, 2007, net assets consisted of:1 | | |
| Amount | Per |
| ($000) | Share |
Paid-in Capital | 8,352,900 | $16.47 |
Undistributed Net Investment Income | 78,328 | .15 |
Accumulated Net Realized Gains | 12,025 | .02 |
Unrealized Appreciation | 2,829,016 | 5.57 |
Net Assets | 11,272,269 | $22.21 |
• See Note A in Notes to Financial Statements.
1 See Note C in Notes to Financial Statements for the tax-basis components of net assets.
31
LifeStrategy Moderate Growth Fund
Statement of Operations
| Year Ended |
| October 31, 2007 |
| ($000) |
Investment Income | |
Income | |
Income Distributions Received | 293,198 |
Net Investment Income—Note B | 293,198 |
Realized Net Gain (Loss) | |
Capital Gain Distributions Received | — |
Investment Securities Sold | 18,635 |
Realized Net Gain (Loss) | 18,635 |
Change in Unrealized Appreciation (Depreciation) of Investment Securities | 1,006,051 |
Net Increase (Decrease) in Net Assets Resulting from Operations | 1,317,884 |
32
LifeStrategy Moderate Growth Fund
Statement of Changes in Net Assets
| Year Ended October 31, |
| 2007 | 2006 |
| ($000) | ($000) |
Increase (Decrease) in Net Assets | | |
Operations | | |
Net Investment Income | 293,198 | 230,205 |
Realized Net Gain (Loss) | 18,635 | 17,599 |
Change in Unrealized Appreciation (Depreciation) | 1,006,051 | 882,180 |
Net Increase (Decrease) in Net Assets Resulting from Operations | 1,317,884 | 1,129,984 |
Distributions | | |
Net Investment Income | (274,151) | (221,290) |
Realized Capital Gain | — | — |
Total Distributions | (274,151) | (221,290) |
Capital Share Transactions—Note E | | |
Issued | 2,350,057 | 2,000,890 |
Issued in Lieu of Cash Distributions | 270,796 | 218,740 |
Redeemed | (1,855,708) | (1,443,071) |
Net Increase (Decrease) from Capital Share Transactions | 765,145 | 776,559 |
Total Increase (Decrease) | 1,808,878 | 1,685,253 |
Net Assets | | |
Beginning of Period | 9,463,391 | 7,778,138 |
End of Period1 | 11,272,269 | 9,463,391 |
1 Net Assets—End of Period includes undistributed net investment income of $78,328,000 and $59,281,000.
33
LifeStrategy Moderate Growth Fund
Financial Highlights
| Year Ended October 31, |
For a Share Outstanding Throughout Each Period | 2007 | 2006 | 2005 | 2004 | 2003 |
Net Asset Value, Beginning of Period | $20.09 | $18.09 | $17.17 | $16.06 | $13.96 |
Investment Operations | | | | | |
Net Investment Income | .58 | .51 | .47 | .39 | .345 |
Capital Gain Distributions Received | — | — | — | .03 | — |
Net Realized and Unrealized Gain (Loss) | | | | | |
on Investments | 2.10 | 1.99 | .89 | 1.07 | 2.130 |
Total from Investment Operations | 2.68 | 2.50 | 1.36 | 1.49 | 2.475 |
Distributions | | | | | |
Dividends from Net Investment Income | (.56) | (.50) | (.44) | (.38) | (.375) |
Distributions from Realized Capital Gains | — | — | — | — | — |
Total Distributions | (.56) | (.50) | (.44) | (.38) | (.375) |
Net Asset Value, End of Period | $22.21 | $20.09 | $18.09 | $17.17 | $16.06 |
| | | | | |
| | | | | |
Total Return1 | 13.55% | 14.09% | 7.97% | 9.37% | 18.06% |
| | | | | |
| | | | | |
Ratios/Supplemental Data | | | | | |
Net Assets, End of Period (Millions) | $11,272 | $9,463 | $7,778 | $6,596 | $5,246 |
Ratio of Expenses to | | | | | |
Average Net Assets—Note B | 0%2 | 0% | 0% | 0% | 0% |
Ratio of Net Investment Income to | | | | | |
Average Net Assets | 2.81% | 2.70% | 2.61% | 2.36% | 2.39% |
Portfolio Turnover Rate | 7% | 8% | 8% | 6% | 5% |
1 Total returns do not include the account service fee that may be applicable to certain accounts with balances below $10,000.
2 The acquired fund fees and expenses were 0.23%.
See accompanying Notes, which are an integral part of the Financial Statements.
34
LifeStrategy Moderate Growth Fund
Notes to Financial Statements
Vanguard LifeStrategy Moderate Growth Fund is registered under the Investment Company Act of 1940 as an open-end investment company, or mutual fund. The fund files reports with the SEC under the company name Vanguard STAR Funds. The fund follows a balanced investment strategy by investing in selected Vanguard funds to achieve its targeted allocation of assets to U.S. stocks, international stocks, bonds, and short-term reserves.
A. The following significant accounting policies conform to generally accepted accounting principles for U.S. mutual funds. The fund consistently follows such policies in preparing its financial statements.
1. Valuation: Investments are valued at the net asset value of each underlying Vanguard fund determined as of the close of the New York Stock Exchange (generally 4 p.m., Eastern time) on the valuation date.
2. Federal Income Taxes: The fund intends to continue to qualify as a regulated investment company and distribute all of its taxable income. Accordingly, no provision for federal income taxes is required in the financial statements.
3. Distributions: Distributions to shareholders are recorded on the ex-dividend date.
4. Other: Income and capital gain distributions received are recorded on the ex-dividend date. Security transactions are accounted for on the date securities are bought or sold. Costs used to determine realized gains (losses) on the sale of investment securities are those of the specific securities sold.
B. Under a service agreement, The Vanguard Group furnishes corporate management, administrative, marketing, and distribution services to the fund. The service agreement provides that Vanguard will reimburse the fund’s expenses to the extent of savings in administrative and marketing costs realized by Vanguard in the operation of the fund. Accordingly, all expenses incurred by the fund during the year ended October 31, 2007, were reimbursed by Vanguard. The fund’s trustees and officers are also directors and officers of Vanguard and the funds in which the fund invests.
C. Distributions are determined on a tax basis and may differ from net investment income and realized capital gains for financial reporting purposes. Differences may be permanent or temporary. Permanent differences are reclassified among capital accounts in the financial statements to reflect their tax character. Temporary differences arise when certain items of income, expense, gain, or loss are recognized in different periods for financial statement and tax purposes; these differences will reverse at some time in the future. Differences in classification may also result from the treatment of short-term gains as ordinary income for tax purposes.
The fund used a capital loss carryforward of $5,204,000 to offset taxable capital gains realized during the year ended October 31, 2007, reducing the amount of capital gains that would otherwise be available to distribute to shareholders. For tax purposes, at October 31, 2007, the fund had $83,075,000 of ordinary income and $7,277,000 of long-term capital gains available for distribution.
At October 31, 2007, the cost of investment securities for tax purposes was $8,453,030,000. Net unrealized appreciation of investment securities for tax purposes was $2,829,016,000, consisting entirely of unrealized gains on securities that had risen in value since their purchase.
D. During the year ended October 31, 2007, the fund purchased $1,593,334,000 of investment securities and sold $779,134,000 of investment securities, other than temporary cash investments.
35
LifeStrategy Moderate Growth Fund
E. Capital shares issued and redeemed were:
| Year Ended October 31, |
| 2007 | 2006 |
| Shares | Shares |
| (000) | (000) |
Issued | 111,993 | 105,376 |
Issued in Lieu of Cash Distributions | 13,031 | 11,859 |
Redeemed | (88,517) | (76,272) |
Net Increase (Decrease) in Shares Outstanding | 36,507 | 40,963 |
F. In June 2006, the Financial Accounting Standards Board issued Interpretation No. 48 (“FIN 48”), “Accounting for Uncertainty in Income Taxes.” FIN 48 establishes the minimum threshold for recognizing, and a system for measuring, the benefits of tax-return positions in financial statements, and is effective for the fund’s fiscal year beginning November 1, 2007. Management has analyzed the fund’s tax positions taken on federal income tax returns for all open tax years (tax years ended October 31, 2004–2007) for purposes of implementing FIN 48, and has concluded that as of October 31, 2007, no provision for income tax would be required in the fund’s financial statements.
36
LifeStrategy Growth Fund
Fund Profile
As of October 31, 2007
Financial Attributes | |
| |
Yield | 2.05% |
Acquired Fund Fees and Expenses1 | 0.23% |
Volatility Measures2 | |
| Fund Versus |
| Composite Index3 |
R-Squared | 1.00 |
Beta | 1.09 |
Allocation to Underlying Vanguard Funds | |
| |
Total Stock Market Index Fund | 49.7% |
Asset Allocation Fund | 24.9 |
Total International Stock Index Fund | 15.6 |
Total Bond Market Index Fund | 9.8 |
37
Equity Investment Focus
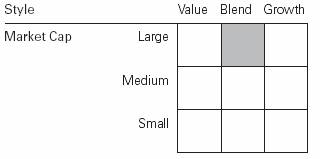
Fixed Income Investment Focus
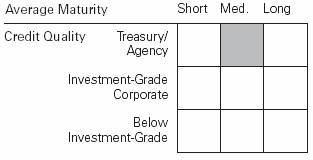
Fund Asset Allocation
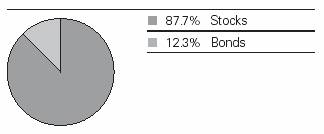
1 This figure represents a weighted average of the annualized expense ratios and any fees charged by the underlying mutual funds in which the fund invests. The fund does not charge any expenses or fees of its own. Acquired is a term that the Securities and Exchange Commission applies to any mutual fund whose shares are owned by another fund.
2 For an explanation of R-squared, beta, and other terms used here, see the Glossary on page 52.
3 65% Dow Jones Wilshire 5000 Index, 20% Lehman U.S. Aggregate Bond Index, and 15% MSCI EAFE Index through April 22, 2005; and 65% MSCI US Broad Market Index, 20% Lehman U.S. Aggregate Bond Index, and 15% MSCI EAFE Index thereafter.
38
LifeStrategy Growth Fund
Performance Summary
All of the returns in this report represent past performance, which is not a guarantee of future results that may be achieved by the fund. (Current performance may be lower or higher than the performance data cited. For performance data current to the most recent month-end, visit our website at www.vanguard.com/performance.) Note, too, that both investment returns and principal value can fluctuate widely, so an investor’s shares, when sold, could be worth more or less than their original cost. The returns shown do not reflect taxes that a shareholder would pay on fund distributions or on the sale of fund shares.
Cumulative Performance: October 31, 1997–October 31, 2007
Initial Investment of $10,000
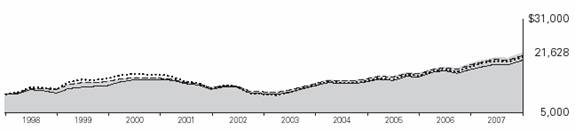
| Average Annual Total Returns | Final Value |
| Periods Ended October 31, 2007 | of a $10,000 |
| One Year | Five Years | Ten Years | Investment |
LifeStrategy Growth Fund1 | 16.32% | 15.19% | 8.02% | $21,628 |
Dow Jones Wilshire 5000 Index | 15.28 | 15.31 | 7.44 | 20,495 |
Growth Composite Index2 | 14.54 | 14.22 | 7.63 | 20,853 |
Growth Composite Average3 | 15.44 | 13.92 | 6.94 | 19,564 |
1 Total return figures do not include the account service fee that may be applicable to certain accounts with balances below $10,000.
2 65% Dow Jones Wilshire 5000 Index, 20% Lehman U.S. Aggregate Bond Index, and 15% MSCI EAFE Index through April 22, 2005; and 65% MSCI US Broad Market Index, 20% Lehman U.S. Aggregate Bond Index, and 15% MSCI EAFE Index thereafter.
3 A composite fund average weighted 65% average general equity fund, 20% average fixed income fund, and 15% average international fund. Derived from data provided by Lipper Inc.
39
LifeStrategy Growth Fund
Fiscal-Year Total Returns (%): October 31, 1997–October 31, 2007 |
| | | | Growth |
Fiscal | Capital | Income | Total | Composite |
Year | Return | Return | Return | Index1 |
1998 | 12.2% | 2.6% | 14.8% | 13.5% |
1999 | 16.6 | 2.8 | 19.4 | 20.0 |
2000 | 4.3 | 2.5 | 6.8 | 6.4 |
2001 | –20.1 | 1.9 | –18.2 | –18.4 |
2002 | –12.7 | 1.8 | –10.9 | –9.4 |
2003 | 19.9 | 2.2 | 22.1 | 20.9 |
2004 | 8.8 | 1.9 | 10.7 | 10.4 |
2005 | 8.1 | 2.2 | 10.3 | 9.8 |
2006 | 14.5 | 2.4 | 16.9 | 15.8 |
2007 | 13.9 | 2.4 | 16.3 | 14.5 |
Average Annual Total Returns: Periods Ended September 30, 2007
This table presents average annual total returns through the latest calendar quarter—rather than through the end of the fiscal period. Securities and Exchange Commission rules require that we provide this information.
| | | | Ten Years |
| Inception Date | One Year | Five Years | Capital | Income | Total |
LifeStrategy Growth Fund2 | 9/30/1994 | 17.28% | 16.17% | 5.19% | 2.26% | 7.45% |
1 65% Dow Jones Wilshire 5000 Index, 20% Lehman U.S. Aggregate Bond Index, and 15% MSCI EAFE Index through April 22, 2005; and 65% MSCI US Broad Market Index, 20% Lehman U.S. Aggregate Bond Index, and 15% MSCI EAFE Index thereafter.
2 Total return figures do not include the account service fee that may be applicable to certain accounts with balances below $10,000.
Note: See Financial Highlights table on page 44 for dividend and capital gains information.
40
LifeStrategy Growth Fund
Financial Statements
Statement of Net Assets
As of October 31, 2007
The fund provides a complete list of its holdings four times in each fiscal year, at the quarter-ends. For the second and fourth fiscal quarters, the lists appear in the fund’s semiannual and annual reports to shareholders. For the first and third fiscal quarters, the fund files the lists with the Securities and Exchange Commission on Form N-Q. Shareholders can look up the fund’s Forms N-Q on the SEC’s website at www.sec.gov. Forms N-Q may also be reviewed and copied at the SEC’s Public Reference Room (see the back cover of this report for further information).
| | Market |
| | Value• |
| Shares | ($000) |
Investment Companies (100.0%) | | |
U.S. Stock Fund (49.7%) | | |
Vanguard Total Stock Market Index Fund Investor Shares | 137,691,873 | 5,155,184 |
| | |
International Stock Fund (15.6%) | | |
Vanguard Total International Stock Index Fund | 73,875,910 | 1,617,144 |
| | |
Balanced Fund (24.9%) | | |
Vanguard Asset Allocation Fund Investor Shares | 81,897,244 | 2,577,306 |
| | |
Bond Fund (9.8%) | | |
Vanguard Total Bond Market Index Fund Investor Shares | 101,809,090 | 1,021,145 |
Total Investment Companies (Cost $7,204,666) | | 10,370,779 |
Other Assets and Liabilities (0.0%) | | |
Other Assets | | 14,986 |
Liabilities | | (13,702) |
| | 1,284 |
Net Assets (100%) | | |
Applicable to 390,575,176 outstanding $.001 par value shares of | | |
beneficial interest (unlimited authorization) | | 10,372,063 |
Net Asset Value Per Share | | $26.56 |
At October 31, 2007, net assets consisted of:1 | | |
| Amount | Per |
| ($000) | Share |
Paid-in Capital | 7,180,744 | $18.38 |
Undistributed Net Investment Income | 38,553 | .10 |
Accumulated Net Realized Losses | (13,347) | (.03) |
Unrealized Appreciation | 3,166,113 | 8.11 |
Net Assets | 10,372,063 | $26.56 |
• See Note A in Notes to Financial Statements.
1 See Note C in Notes to Financial Statements for the tax-basis components of net assets.
41
LifeStrategy Growth Fund
Statement of Operations
| Year Ended |
| October 31, 2007 |
| ($000) |
Investment Income | |
Income | |
Income Distributions Received | 203,521 |
Net Investment Income—Note B | 203,521 |
Realized Net Gain (Loss) | |
Capital Gain Distributions Received | — |
Investment Securities Sold | 7,256 |
Realized Net Gain (Loss) | 7,256 |
Change in Unrealized Appreciation (Depreciation) of Investment Securities | 1,205,218 |
Net Increase (Decrease) in Net Assets Resulting from Operations | 1,415,995 |
42
LifeStrategy Growth Fund
Statement of Changes in Net Assets
| Year Ended October 31, |
| 2007 | 2006 |
| ($000) | ($000) |
Increase (Decrease) in Net Assets | | |
Operations | | |
Net Investment Income | 203,521 | 155,467 |
Realized Net Gain (Loss) | 7,256 | 9,757 |
Change in Unrealized Appreciation (Depreciation) | 1,205,218 | 1,003,198 |
Net Increase (Decrease) in Net Assets Resulting from Operations | 1,415,995 | 1,168,422 |
Distributions | | |
Net Investment Income | (194,349) | (152,028) |
Realized Capital Gain | — | — |
Total Distributions | (194,349) | (152,028) |
Capital Share Transactions—Note E | | |
Issued | 1,973,518 | 1,689,483 |
Issued in Lieu of Cash Distributions | 192,075 | 150,342 |
Redeemed | (1,437,481) | (1,038,605) |
Net Increase (Decrease) from Capital Share Transactions | 728,112 | 801,220 |
Total Increase (Decrease) | 1,949,758 | 1,817,614 |
Net Assets | | |
Beginning of Period | 8,422,305 | 6,604,691 |
End of Period1 | 10,372,063 | 8,422,305 |
1 Net Assets—End of Period includes undistributed net investment income of $38,553,000 and $29,381,000.
43
LifeStrategy Growth Fund
Financial Highlights
| Year Ended October 31, |
For a Share Outstanding Throughout Each Period | 2007 | 2006 | 2005 | 2004 | 2003 |
Net Asset Value, Beginning of Period | $23.32 | $20.37 | $18.84 | $17.32 | $14.45 |
Investment Operations | | | | | |
Net Investment Income | .54 | .45 | .42 | .32 | .28 |
Capital Gain Distributions Received | — | — | — | .16 | — |
Net Realized and Unrealized Gain (Loss) | | | | | |
on Investments | 3.22 | 2.95 | 1.51 | 1.36 | 2.87 |
Total from Investment Operations | 3.76 | 3.40 | 1.93 | 1.84 | 3.15 |
Distributions | | | | | |
Dividends from Net Investment Income | (.52) | (.45) | (.40) | (.32) | (.28) |
Distributions from Realized Capital Gains | — | — | — | — | — |
Total Distributions | (.52) | (.45) | (.40) | (.32) | (.28) |
Net Asset Value, End of Period | $26.56 | $23.32 | $20.37 | $18.84 | $17.32 |
| | | | | |
| | | | | |
Total Return1 | 16.32% | 16.94% | 10.30% | 10.70% | 22.12% |
| | | | | |
| | | | | |
Ratios/Supplemental Data | | | | | |
Net Assets, End of Period (Millions) | $10,372 | $8,422 | $6,605 | $5,535 | $4,422 |
Ratio of Expenses to | | | | | |
Average Net Assets—Note B | 0%2 | 0% | 0% | 0% | 0% |
Ratio of Net Investment Income to | | | | | |
Average Net Assets | 2.15% | 2.07% | 2.09% | 1.79% | 1.79% |
Portfolio Turnover Rate | 4% | 3% | 4% | 5% | 2% |
1 Total returns do not include the account service fee that may be applicable to certain accounts with balances below $10,000.
2 The acquired fund fees and expenses were 0.23%.
See accompanying Notes, which are an integral part of the Financial Statements.
44
LifeStrategy Growth Fund
Notes to Financial Statements
Vanguard LifeStrategy Growth Fund is registered under the Investment Company Act of 1940 as an open-end investment company, or mutual fund. The fund files reports with the SEC under the company name Vanguard STAR Funds. The fund follows a balanced investment strategy by investing in selected Vanguard funds to achieve its targeted allocation of assets to U.S. stocks, international stocks, bonds, and short-term reserves.
A. The following significant accounting policies conform to generally accepted accounting principles for U.S. mutual funds. The fund consistently follows such policies in preparing its financial statements.
1. Valuation: Investments are valued at the net asset value of each underlying Vanguard fund determined as of the close of the New York Stock Exchange (generally 4 p.m., Eastern time) on the valuation date.
2. Federal Income Taxes: The fund intends to continue to qualify as a regulated investment company and distribute all of its taxable income. Accordingly, no provision for federal income taxes is required in the financial statements.
3. Distributions: Distributions to shareholders are recorded on the ex-dividend date.
4. Other: Income and capital gain distributions received are recorded on the ex-dividend date. Security transactions are accounted for on the date securities are bought or sold. Costs used to determine realized gains (losses) on the sale of investment securities are those of the specific securities sold.
B. Under a service agreement, The Vanguard Group furnishes corporate management, administrative, marketing, and distribution services to the fund. The service agreement provides that Vanguard will reimburse the fund’s expenses to the extent of savings in administrative and marketing costs realized by Vanguard in the operation of the fund. Accordingly, all expenses incurred by the fund during the year ended October 31, 2007, were reimbursed by Vanguard. The fund’s trustees and officers are also directors and officers of Vanguard and the funds in which the fund invests.
C. Distributions are determined on a tax basis and may differ from net investment income and realized capital gains for financial reporting purposes. Differences may be permanent or temporary. Permanent differences are reclassified among capital accounts in the financial statements to reflect their tax character. Temporary differences arise when certain items of income, expense, gain, or loss are recognized in different periods for financial statement and tax purposes; these differences will reverse at some time in the future. Differences in classification may also result from the treatment of short-term gains as ordinary income for tax purposes.
For tax purposes, at October 31, 2007, the fund had $37,344,000 of ordinary income available for distribution. The fund had available realized losses of $12,138,000 to offset future net capital gains of $9,185,000 through October 31, 2010, and $2,953,000 through October 31, 2011.
At October 31, 2007, the cost of investment securities for tax purposes was $7,204,666,000. Net unrealized appreciation of investment securities for tax purposes was $3,166,113,000, consisting entirely of unrealized gains on securities that had risen in value since their purchase.
D. During the year ended October 31, 2007, the fund purchased $1,084,396,000 of investment securities and sold $329,474,000 of investment securities, other than temporary cash investments.
45
LifeStrategy Growth Fund
E. Capital shares issued and redeemed were:
| Year Ended October 31, |
| 2007 | 2006 |
| Shares | Shares |
| (000) | (000) |
Issued | 79,793 | 77,515 |
Issued in Lieu of Cash Distributions | 7,827 | 7,132 |
Redeemed | (58,141) | (47,727) |
Net Increase (Decrease) in Shares Outstanding | 29,479 | 36,920 |
F. In June 2006, the Financial Accounting Standards Board issued Interpretation No. 48 (“FIN 48”), “Accounting for Uncertainty in Income Taxes.” FIN 48 establishes the minimum threshold for recognizing, and a system for measuring, the benefits of tax-return positions in financial statements, and is effective for the fund’s fiscal year beginning November 1, 2007. Management has analyzed the fund’s tax positions taken on federal income tax returns for all open tax years (tax years ended October 31, 2004–2007) for purposes of implementing FIN 48, and has concluded that as of October 31, 2007, no provision for income tax would be required in the fund’s financial statements.
46
Report of Independent Registered
Public Accounting Firm
To the Trustees of Vanguard STAR Funds and the Shareholders of Vanguard LifeStrategy Income Fund, Vanguard LifeStrategy Conservative Growth Fund, Vanguard LifeStrategy Moderate Growth Fund and Vanguard LifeStrategy Growth Fund:
In our opinion, the accompanying statements of net assets and the related statements of operations and of changes in net assets and the financial highlights present fairly, in all material respects, the financial position of Vanguard LifeStrategy Income Fund, Vanguard LifeStrategy Conservative Growth Fund, Vanguard LifeStrategy Moderate Growth Fund and Vanguard LifeStrategy Growth Fund (separate portfolios of Vanguard STAR Funds, hereafter referred to as the “Funds”) at October 31, 2007, the results of each of their operations for the year then ended, the changes in each of their net assets for each of the two years in the period then ended and the financial highlights for each of the five years in the period then ended, in conformity with accounting principles generally accepted in the United States of America. These financial statements and financial highlights (hereafter referred to as “financial statements”) are the responsibility of the Funds’ management; our responsibility is to express an opinion on these financial statements based on our audits. We conducted our audits of these financial statements in accordance with the standards of the Public Company Accounting Oversight Board (United States). Those standards require that we plan and perform the audit to obtain reasonable assurance about whether the financial statements are free of material misstatement. An audit includes examining, on a test basis, evidence supporting the amounts and disclosures in the financial statements, assessing the accounting principles used and significant estimates made by management, and evaluating the overall financial statement presentation. We believe that our audits, which included confirmation of securities at October 31, 2007 by agreement to the underlying ownership records for the Vanguard funds, provide a reasonable basis for our opinion.
PricewaterhouseCoopers LLP
Philadelphia, Pennsylvania
December 6, 2007
47
Special 2007 tax information (unaudited) for Vanguard LifeStrategy Funds
This information for the fiscal year ended October 31, 2007, is included pursuant to provisions of the Internal Revenue Code.
The funds distributed qualified dividend income to shareholders during the fiscal year as follows:
| Qualified Dividend Income |
LifeStrategy Fund | ($000) |
Income | 7,346 |
Conservative Growth | 47,487 |
Moderate Growth | 107,366 |
Growth | 127,500 |
The funds distributed capital gain dividends (from net long-term capital gains) to shareholders during the fiscal year as follows:
| Capital Gains |
LifeStrategy Fund | ($000) |
Income | 4,777 |
Conservative Growth | — |
Moderate Growth | — |
Growth | — |
For corporate shareholders, the percentage of investment income (dividend income plus short-term gains, if any) that qualifies for the dividends-received deduction is as follows:
LifeStrategy Fund | Percentage |
Income | 10.0% |
Conservative Growth | 18.7 |
Moderate Growth | 31.1 |
Growth | 52.2 |
48
Your Fund’s After-Tax Returns
This table presents returns for your fund both before and after taxes. The after-tax returns are shown in two ways: (1) assuming that an investor owned the fund during the entire period and paid taxes on the fund’s distributions, and (2) assuming that an investor paid taxes on the fund’s distributions and sold all shares at the end of each period.
Calculations are based on the highest individual federal income tax and capital gains tax rates in effect at the times of the distributions and the hypothetical sales. State and local taxes were not considered. After-tax returns reflect any qualified dividend income, using actual prior-year figures and estimates for 2007. (In the example, returns after the sale of fund shares may be higher than those assuming no sale. This occurs when the sale would have produced a capital loss. The calculation assumes that the investor received a tax deduction for the loss.)
Please note that your actual after-tax returns will depend on your tax situation and may differ from those shown. Also note that if you own the fund in a tax-deferred account, such as an individual retirement account or a 401(k) plan, this information does not apply to you. Such accounts are not subject to current taxes.
Finally, keep in mind that a fund’s performance—whether before or after taxes—does not guarantee future results.
Average Annual Total Returns: Vanguard LifeStrategy Funds1 |
Periods Ended October 31, 2007 | | | |
| One | Five | Ten |
| Year | Years | Years |
LifeStrategy Income Fund | | | |
Returns Before Taxes | 8.14% | 7.20% | 6.46% |
Returns After Taxes on Distributions | 6.60 | 5.91 | 4.64 |
Returns After Taxes on Distributions and Sale of Fund Shares | 5.39 | 5.46 | 4.44 |
| | | |
| | | |
LifeStrategy Conservative Growth Fund | | | |
Returns Before Taxes | 10.84% | 9.83% | 7.06% |
Returns After Taxes on Distributions | 9.71 | 8.82 | 5.54 |
Returns After Taxes on Distributions and Sale of Fund Shares | 7.17 | 7.96 | 5.18 |
| | | |
| | | |
LifeStrategy Moderate Growth Fund | | | |
Returns Before Taxes | 13.55% | 12.55% | 7.67% |
Returns After Taxes on Distributions | 12.73 | 11.75 | 6.47 |
Returns After Taxes on Distributions and Sale of Fund Shares | 8.99 | 10.52 | 5.95 |
| | | |
| | | |
LifeStrategy Growth Fund | | | |
Returns Before Taxes | 16.32% | 15.19% | 8.02% |
Returns After Taxes on Distributions | 15.79 | 14.66 | 7.13 |
Returns After Taxes on Distributions and Sale of Fund Shares | 10.87 | 13.10 | 6.51 |
1 Total return figures do not include the account service fee that may be applicable to certain accounts with balances below $10,000.
49
About Your Fund’s Expenses
As a shareholder of the fund, you incur ongoing costs, which include costs for portfolio management, administrative services, and shareholder reports (like this one), among others. Operating expenses, which are deducted from a fund’s gross income, directly reduce the investment return of the fund.
A typical fund’s expenses are expressed as a percentage of its average net assets. The LifeStrategy Funds have no direct expenses, but each fund bears its proportionate share of the expenses of the underlying funds in which it invests. These indirect expenses make up the fund’s acquired fund fees and expenses, also expressed as a percentage of average net assets.
The following examples are intended to help you understand the ongoing costs (in dollars) of investing in your fund and to compare these costs with those of other mutual funds. The examples are based on an investment of $1,000 made at the beginning of the period shown and held for the entire period. The costs are calculated using each fund’s acquired fund fees and expenses.
The table on page 51 illustrates your fund’s costs in two ways:
• Based on actual fund return. This section helps you to estimate the actual expenses that you paid over the period. The “Ending Account Value” shown is derived from the fund’s actual return, and the third column shows the dollar amount that would have been paid by an investor who started with $1,000 in the fund. You may use the information here, together with the amount you invested, to estimate the expenses that you paid over the period.
To do so, simply divide your account value by $1,000 (for example, an $8,600 account value divided by $1,000 = 8.6), then multiply the result by the number given for your fund under the heading “Expenses Paid During Period.”
• Based on hypothetical 5% yearly return. This section is intended to help you compare your fund’s costs with those of other mutual funds. It assumes that the fund had a yearly return of 5% before expenses, but that the expense ratio is unchanged. In this case—because the return used is not the fund’s actual return—the results do not apply to your investment. The example is useful in making comparisons because the Securities and Exchange Commission requires all mutual funds to calculate expenses based on a 5% return. You can assess your fund’s costs by comparing this hypothetical example with the hypothetical examples that appear in shareholder reports of other funds.
50
Six Months Ended October 31, 2007 | | | |
| Beginning | Ending | Expenses |
| Account Value | Account Value | Paid During |
| 4/30/2007 | 10/31/2007 | Period1 |
Based on Actual Fund Return | | | |
LifeStrategy Income Fund | $1,000.00 | $1,035.73 | $1.23 |
LifeStrategy Conservative Growth Fund | 1,000.00 | 1,046.11 | 1.24 |
LifeStrategy Moderate Growth Fund | 1,000.00 | 1,056.00 | 1.19 |
LifeStrategy Growth Fund | 1,000.00 | 1,066.08 | 1.20 |
Based on Hypothetical 5% Yearly Return | | | |
LifeStrategy Income Fund | $1,000.00 | $1,024.00 | $1.22 |
LifeStrategy Conservative Growth Fund | 1,000.00 | 1,024.00 | 1.22 |
LifeStrategy Moderate Growth Fund | 1,000.00 | 1,024.05 | 1.17 |
LifeStrategy Growth Fund | 1,000.00 | 1,024.05 | 1.17 |
Note that the expenses shown in the table are meant to highlight and help you compare ongoing costs only and do not reflect transaction costs incurred by the fund for buying and selling securities. Further, the expenses do not include the account service fee described in the prospectus. If such a fee were applied to your account, your costs would be higher. Your fund does not charge transaction fees, such as purchase or redemption fees, nor does it carry a “sales load.”
The calculations assume no shares were bought or sold during the period. Your actual costs may have been higher or lower, depending on the amount of your investment and the timing of any purchases or redemptions.
You can find more information about the fund’s expenses, including annual expense ratios, in the Financial Statements section of this report. For additional information on operating expenses and other shareholder costs, please refer to your fund’s current prospectus.
1 The calculations are based on the acquired fund fees and expenses for the most recent six-month period. The LifeStrategy Funds’ acquired fund fees and expenses as of October 31, 2007, are (in order as listed from top to bottom above) 0.24%, 0.24%, 0.23%, and 0.23%. The dollar amounts shown as “Expenses Paid” are equal to the annualized average weighted expense ratio for the underlying funds, multiplied by the average account value over the period, multiplied by the number of days in the most recent six-month period, then divided by the number of days in the most recent 12-month period.
51
Glossary
Acquired Fund Fees and Expenses. Funds that invest in other Vanguard funds incur no direct expenses, but they do bear proportionate shares of the operating, administrative, and advisory expenses of the underlying funds, and they must pay any fees charged by those funds. The figure for acquired fund fees and expenses represents a weighted average of these underlying costs. Acquired is a term that the Securities and Exchange Commission applies to any mutual fund whose shares are owned by another fund.
Beta. A measure of the magnitude of a fund’s past share-price fluctuations in relation to the ups and downs of a given market index. The index is assigned a beta of 1.00. Compared with a given index, a fund with a beta of 1.20 typically would have seen its share price rise or fall by 12% when the index rose or fell by 10%. A fund’s beta should be reviewed in conjunction with its R-squared (see definition below). The lower the R-squared, the less correlation there is between the fund and the index, and the less reliable beta is as an indicator of volatility.
Equity Exposure. A measure that reflects a fund’s investments in stocks and stock futures. Any holdings in short-term reserves are excluded.
Expense Ratio. The percentage of a fund’s average net assets used to pay its annual administrative and advisory expenses. These expenses directly reduce returns to investors.
Inception Date. The date on which the assets of a fund (or one of its share classes) are first invested in accordance with the fund’s investment objective. For funds with a subscription period, the inception date is the day after that period ends. Investment performance is measured from the inception date.
R-Squared. A measure of how much of a fund’s past returns can be explained by the returns from the market in general, as measured by a given index. If a fund’s total returns were precisely synchronized with an index’s returns, its R-squared would be 1.00. If the fund’s returns bore no relationship to the index’s returns, its R-squared would be 0.
Yield. A snapshot of a fund’s income from interest and dividends. The yield, expressed as a percentage of the fund’s net asset value, is based on income earned over the past 30 days and is annualized, or projected forward for the coming year.
52
This page intentionally left blank.
This page intentionally left blank.
This page intentionally left blank.
The People Who Govern Your Fund
The trustees of your mutual fund are there to see that the fund is operated and managed in your best interests since, as a shareholder, you are a part owner of the fund. Your fund’s trustees also serve on the board of directors of The Vanguard Group, Inc., which is owned by the Vanguard funds and provides services to them on an at-cost basis.
A majority of Vanguard’s board members are independent, meaning that they have no affiliation with Vanguard or the funds they oversee, apart from the sizable personal investments they have made as private individuals.
Our independent board members bring distinguished backgrounds in business, academia, and public service to their task of working with Vanguard officers to establish the policies and oversee the activities of the funds. Among board members’ responsibilities are selecting investment advisors for the funds; monitoring fund operations, performance, and costs; reviewing contracts; nominating and selecting new trustees/directors; and electing Vanguard officers.
Each trustee serves a fund until its termination; or until the trustee’s retirement, resignation, or death; or otherwise as specified in the fund’s organizational documents. Any trustee may be removed at a shareholders’ meeting by a vote representing two-thirds of the net asset value of all shares of the fund together with shares of other Vanguard funds organized within the same trust. The table on these two pages shows information for each trustee and executive officer of the fund. The mailing address of the trustees and officers is P.O. Box 876, Valley Forge, PA 19482.
Chairman of the Board, Chief Executive Officer, and Trustee |
| |
John J. Brennan1 | |
Born 1954 | Principal Occupation(s) During the Past Five Years: Chairman of the Board, Chief Executive |
Trustee since May 1987; | Officer, and Director/Trustee of The Vanguard Group, Inc., and of each of the investment |
Chairman of the Board and | companies served by The Vanguard Group. |
Chief Executive Officer | |
148 Vanguard Funds Overseen | |
| |
Independent Trustees | |
| |
Charles D. Ellis | |
Born 1937 | Principal Occupation(s) During the Past Five Years: Applecore Partners (pro bono ventures |
Trustee since January 2001 | in education); Senior Advisor to Greenwich Associates (international business strategy |
148 Vanguard Funds Overseen | consulting); Successor Trustee of Yale University; Overseer of the Stern School of Business |
| at New York University; Trustee of the Whitehead Institute for Biomedical Research. |
| |
Rajiv L. Gupta | |
Born 1945 | Principal Occupation(s) During the Past Five Years: Chairman, President, and |
Trustee since December 20012 | Chief Executive Officer of Rohm and Haas Co. (chemicals); Board Member of |
148 Vanguard Funds Overseen | the American Chemistry Council; Director of Tyco International, Ltd. (diversified |
| manufacturing and services) since 2005; Trustee of Drexel University and of the |
| Chemical Heritage Foundation. |
| |
Amy Gutmann | |
Born 1949 | Principal Occupation(s) During the Past Five Years: President of the University of |
Trustee since June 2006 | Pennsylvania since 2004; Professor in the School of Arts and Sciences, Annenberg School |
148 Vanguard Funds Overseen | for Communication, and Graduate School of Education of the University of Pennsylvania |
| since 2004; Provost (2001–2004) and Laurance S. Rockefeller Professor of Politics and |
| the University Center for Human Values (1990–2004), Princeton University; Director of |
| Carnegie Corporation of New York since 2005 and of Schuylkill River Development |
| Corporation and Greater Philadelphia Chamber of Commerce since 2004. |
JoAnn Heffernan Heisen | |
Born 1950 | Principal Occupation(s) During the Past Five Years: Corporate Vice President and |
Trustee since July 1998 | Chief Global Diversity Officer since 2006, Vice President and Chief Information |
148 Vanguard Funds Overseen | Officer (1997–2005), and Member of the Executive Committee of Johnson & |
| Johnson (pharmaceuticals/consumer products); Director of the University Medical |
| Center at Princeton and Women’s Research and Education Institute. |
| |
André F. Perold | |
Born 1952 | Principal Occupation(s) During the Past Five Years: George Gund Professor of Finance |
Trustee since December 2004 | and Banking, Harvard Business School; Senior Associate Dean, Director of Faculty |
148 Vanguard Funds Overseen | Recruiting, and Chair of Finance Faculty, Harvard Business School; Director and Chairman |
| of UNX, Inc. (equities trading firm) since 2003; Chair of the Investment Committee of |
| HighVista Strategies LLC (private investment firm) since 2005. |
| |
Alfred M. Rankin, Jr. | |
Born 1941 | Principal Occupation(s) During the Past Five Years: Chairman, President, Chief Executive |
Trustee since January 1993 | Officer, and Director of NACCO Industries, Inc. (forklift trucks/housewares/lignite); Director |
148 Vanguard Funds Overseen | of Goodrich Corporation (industrial products/aircraft systems and services). |
| |
| |
J. Lawrence Wilson | |
Born 1936 | Principal Occupation(s) During the Past Five Years: Retired Chairman and Chief Executive |
Trustee since April 1985 | Officer of Rohm and Haas Co. (chemicals); Director of Cummins Inc. (diesel engines) and |
148 Vanguard Funds Overseen | AmerisourceBergen Corp. (pharmaceutical distribution); Trustee of Vanderbilt University |
| and of Culver Educational Foundation. |
| |
Executive Officers1 | |
| |
Thomas J. Higgins | |
Born 1957 | Principal Occupation(s) During the Past Five Years: Principal of The Vanguard Group, Inc.; |
Treasurer since July 1998 | Treasurer of each of the investment companies served by The Vanguard Group. |
148 Vanguard Funds Overseen | |
| |
| |
Heidi Stam | |
Born 1956 | Principal Occupation(s) During the Past Five Years: Managing Director of The Vanguard |
Secretary since July 2005 | Group, Inc., since 2006; General Counsel of The Vanguard Group since 2005; Secretary of |
148 Vanguard Funds Overseen | The Vanguard Group, and of each of the investment companies served by The Vanguard |
| Group, since 2005; Principal of The Vanguard Group (1997–2006). |
Vanguard Senior Management Team | | |
| | | |
R. Gregory Barton | Kathleen C. Gubanich | F. William McNabb, III | Ralph K. Packard |
Mortimer J. Buckley | Paul A. Heller | Michael S. Miller | George U. Sauter |
Founder |
|
John C. Bogle |
Chairman and Chief Executive Officer, 1974–1996 |
1 Officers of the funds are “interested persons” as defined in the Investment Company Act of 1940.
2 December 2002 for Vanguard Equity Income Fund, Vanguard Growth Equity Fund, the Vanguard Municipal Bond Funds, and the Vanguard State Tax-Exempt Funds.
More information about the trustees is in the Statement of Additional Information, available from The Vanguard Group.

P.O. Box 2600
Valley Forge, PA 19482-2600
Connect with Vanguard® > www.vanguard.com
Fund Information > 800-662-7447 | Vanguard, LifeStrategy, STAR, Connect with Vanguard, and |
| the ship logo are trademarks of The Vanguard Group, Inc. |
Direct Investor Account Services > 800-662-2739 | |
| All other marks are the exclusive property of their |
Institutional Investor Services > 800-523-1036 | respective owners. |
| |
Text Telephone for People | |
With Hearing Impairment > 800-952-3335 | All comparative mutual fund data are from Lipper Inc. |
| or Morningstar, Inc., unless otherwise noted. |
| |
| |
| You can obtain a free copy of Vanguard’s proxy voting |
| guidelines by visiting our website, www.vanguard.com, |
This material may be used in conjunction | and searching for “proxy voting guidelines,” or by |
with the offering of shares of any Vanguard | calling Vanguard at 800-662-2739. The guidelines are |
fund only if preceded or accompanied by | also available from the SEC’s website, www.sec.gov. |
the fund’s current prospectus. | In addition, you may obtain a free report on how your |
| fund voted the proxies for securities it owned during |
| the 12 months ended June 30. To get the report, visit |
| either www.vanguard.com or www.sec.gov. |
| |
| |
| |
| You can review and copy information about your fund |
| at the SEC’s Public Reference Room in Washington, D.C. |
| To find out more about this public service, call the SEC |
| at 202-551-8090. Information about your fund is also |
| available on the SEC’s website, and you can receive |
| copies of this information, for a fee, by sending a |
| request in either of two ways: via e-mail addressed to |
| publicinfo@sec.gov or via regular mail addressed to the |
| Public Reference Section, Securities and Exchange |
| Commission, Washington, DC 20549-0102. |
| |
| |
| |
| |
| |
| © 2007 The Vanguard Group, Inc. |
| All rights reserved. |
| Vanguard Marketing Corporation, Distributor. |
| |
| Q880 122007 |
> For the fiscal year ended October 31, 2007, returns for the Vanguard International Stock Index Funds were excellent across the board. A falling U.S. dollar boosted returns for U.S. investors.
> The funds tracked their benchmarks, though adjustments for fair-value pricing provided a temporary performance advantage. All but two delivered returns that surpassed the average return for their mutual fund peers.
> The rapid industrialization of emerging market economies and a high level of mergers and acquisitions were among the factors driving international gains.
Contents | |
| |
Your Fund’s Total Returns | 1 |
Chairman’s Letter | 4 |
European Stock Index Fund | 11 |
Pacific Stock Index Fund | 48 |
Emerging Markets Stock Index Fund | 82 |
Total International Stock Index Fund | 128 |
Developed Markets Index Fund | 138 |
Institutional Developed Markets Index Fund | 148 |
Your Fund’s After-Tax Returns | 160 |
About Your Fund’s Expenses | 162 |
Glossary | 165 |

| European Stock Index Fund |
Pacific Stock Index Fund |
Emerging Markets Stock Index Fund |
Developed Markets Index Fund |
Institutional Developed Markets Index Fund |
Please note: The opinions expressed in this report are just that—informed opinions. They should not be considered promises or advice. Also, please keep in mind that the information and opinions cover the period through the date on the cover of this report. Of course, the risks of investing in your fund are spelled out in the prospectus.
Your Fund’s Total Returns
Fiscal Year Ended October 31, 2007 | | |
| Ticker | Total |
| Symbol | Returns |
Vanguard European Stock Index Fund | | |
Investor Shares | VEURX | 28.5% |
Admiral™ Shares1 | VEUSX | 28.6 |
Signal™ Shares2 | VESSX | 28.6 |
Institutional Shares3 | VESIX | 28.6 |
ETF Shares4 | VGK | |
Market Price | | 28.4 |
Net Asset Value | | 28.6 |
MSCI Europe Index | | 28.0 |
Average European Region Fund5 | | 27.5 |
| | |
| | |
Vanguard Pacific Stock Index Fund | | |
Investor Shares | VPACX | 19.5% |
Admiral Shares1 | VPADX | 19.6 |
Signal Shares2 | VPASX | 5.76 |
Institutional Shares3 | VPKIX | 19.7 |
ETF Shares4 | VPL | |
Market Price | | 19.1 |
Net Asset Value | | 19.7 |
MSCI Pacific Index | | 18.3 |
Average Japan/Pacific Region Fund5 | | 13.9 |
1 A lower-cost class of shares available to many longtime shareholders and to those with significant investments in the fund.
2 Signal Shares also carry lower costs and are available to certain institutional shareholders who meet specific administrative, service, and account-size criteria.
3 This class of shares carries low expenses and is available for a minimum initial investment of $5 million.
4 Vanguard ETF™ Shares are traded on the American Stock Exchange and are available only through brokers. The table shows the ETF returnsbased on both the AMEX market price and the net asset value for a share. U.S. Pat. No. 6,879,964 B2.
5 Derived from data provided by Lipper Inc.
6 Since inception: June 4, 2007.
1
Your Fund’s Total Returns
Fiscal Year Ended October 31, 2007 | | |
| Ticker | Total |
| Symbol | Returns |
Vanguard Emerging Markets Stock Index Fund | | |
Investor Shares | VEIEX | 69.6% |
Admiral Shares1 | VEMAX | 69.8 |
Signal Shares2 | VERSX | 53.43 |
Institutional Shares4 | VEMIX | 69.9 |
ETF Shares5 | VWO | |
Market Price | | 68.7 |
Net Asset Value | | 69.8 |
MSCI Emerging Markets Index | | 67.8 |
Average Emerging Markets Fund6 | | 63.3 |
| | |
| | |
Vanguard Total International Stock Index Fund | VGTSX | 32.5% |
Total International Composite Index7 | | 31.6 |
Average International Fund6 | | 27.8 |
| | |
| | |
Vanguard Developed Markets Index Fund | VDMIX | 25.7% |
MSCI EAFE Index | | 24.9 |
Average International Fund6 | | 27.8 |
| | |
| | |
Vanguard Institutional Developed Markets Index Fund | VIDMX | 25.8% |
MSCI EAFE Index | | 24.9 |
Average International Fund6 | | 27.8 |
1 A lower-cost class of shares available to many longtime shareholders and to those with significant investments in the fund.
2 Signal Shares also carry lower costs and are available to certain institutional shareholders who meet specific administrative, service, and account-size criteria.
3 Since inception: January 19, 2007.
4 This class of shares carries low expenses and is available for a minimum initial investment of $5 million.
5 Vanguard ETF Shares are traded on the American Stock Exchange and are available only through brokers. The table shows the ETF returns based on both the AMEX market price and the net asset value for a share. U.S. Pat. No. 6,879,964 B2.
6 Derived from data provided by Lipper Inc.
7 Consists of the MSCI Europe Index (56%), the MSCI Pacific Index (24%), and the MSCI Emerging Markets Index (20%) as of October 31, 2007.
2
Your Fund’s Performance at a Glance
October 31, 2006–October 31, 2007 |
| | | Distributions Per Share |
| Starting | Ending | Income | Capital |
| Share Price | Share Price | Dividends | Gains |
European Stock | | | | |
Investor Shares | $34.67 | $43.43 | $0.924 | $0.000 |
Admiral Shares | 81.50 | 102.09 | 2.242 | 0.000 |
Signal Shares | 31.51 | 39.50 | 0.842 | 0.000 |
Institutional Shares | 34.74 | 43.51 | 0.970 | 0.000 |
ETF Shares | 65.21 | 81.66 | 1.809 | 0.000 |
Pacific Stock | | | | |
Investor Shares | $12.13 | $14.19 | $0.267 | $0.000 |
Admiral Shares | 79.43 | 92.94 | 1.817 | 0.000 |
Signal Shares | 30.531 | 32.28 | 0.000 | 0.000 |
Institutional Shares | 12.15 | 14.22 | 0.283 | 0.000 |
ETF Shares | 64.24 | 75.17 | 1.473 | 0.000 |
Emerging Markets Stock | | | | |
Investor Shares | $22.05 | $36.78 | $0.396 | $0.000 |
Admiral Shares | 29.03 | 48.47 | 0.534 | 0.000 |
Signal Shares | 30.382 | 46.61 | 0.000 | 0.000 |
Institutional Shares | 22.11 | 36.90 | 0.429 | 0.000 |
ETF Shares | 69.91 | 116.62 | 1.339 | 0.000 |
Total International Stock | $16.90 | $21.89 | $0.402 | $0.000 |
Developed Markets | $12.15 | $14.91 | $0.299 | $0.005 |
Institutional Developed Markets | $12.05 | $14.79 | $0.316 | $0.000 |
1 Share price at inception: June 4, 2007.
2 Share price at inception: January 19, 2007.
3

Chairman’s Letter
Dear Shareholder,
Like their U.S. counterpart, international stock markets experienced sharp declines during the summer; however, the growth juggernaut in developing countries was not to be stopped. Vanguard Emerging Markets Stock Index Fund returned an eye-popping 69.6% for Investor Shares. Gains in Europe and the Pacific region were more modest, but remained well ahead of the U.S. broad market.
Results for the Vanguard International Stock Index Funds exceeded those for their respective benchmark indexes and the average returns for their peer groups, with the exception of the Vanguard Developed Markets Index Fund and its institutional counterpart, which is available at a minimum initial investment of $5 million. The funds’ outperformance relative to the benchmarks was an anomaly driven by short-term discrepancies that arose from fair-value pricing, which is described more fully below.
If you own one or more of the funds in a taxable account, you may wish to review the details of the funds’ after-tax returns on page 120.
Stocks rode a bumpy path to impressive results
The turmoil that hit stock markets during the summer arose in the arena of U.S. housing finance. Years of extending home loans to U.S. buyers with weak credit came home to roost, ruffling balance sheets across the United States and Europe, where many financial institutions invested heavily in income-oriented products based on these mortgages. Skittish investors also had to contend with soaring crude oil prices, which touched historic highs at the end of the fiscal year, and a U.S. dollar that dipped to record lows versus other major currencies.
4
Still, the broad U.S. stock market returned an impressive 15.3%, while gains were significantly larger in Europe and emerging markets, which also benefited from a falling dollar. In the United States, large capitalization stocks outperformed small-caps, and growth stocks outperformed value stocks—both continuing the recent months’ reversals of longer-term trends. In most markets around the globe, top performances came from stocks in the energy, materials, and industrials sectors, which have benefited from rapid industrialization in emerging market economies.
Bond investors converged on high-quality issues
As troubles in the subprime credit markets rippled across the financial markets, bond investors sought the relative safety of U.S. Treasury bonds. This “flight to quality” drove prices for Treasuries higher and yields lower, and widened the spread between Treasury yields and the much higher yields demanded by investors for riskier bonds. Declines in Treasury yields were steepest at the short end of the maturity spectrum, aided by the actions of the Federal Reserve Board. The central bank lowered the target for short-term interest rates to 4.5% in two separate rate cuts (a half-percentage-point in September and a quarter-point on October 31). The yield of the 3-month Treasury bill finished the fiscal period at 3.92% after spending much of the year near 5%; the 10-year Treasury note ended at 4.47%.
Market Barometer | | | |
| Average Annual Total Returns |
| Periods Ended October 31, 2007 |
| One Year | Three Years | Five Years |
Stocks | | | |
MSCI All Country World Index ex USA (International) | 33.0% | 27.4% | 26.4% |
Russell 1000 Index (Large-caps) | 15.0 | 13.8 | 14.5 |
Russell 2000 Index (Small-caps) | 9.3 | 13.7 | 18.7 |
Dow Jones Wilshire 5000 Index (Entire market) | 15.3 | 14.2 | 15.3 |
| | | |
| | | |
Bonds | | | |
Lehman U.S. Aggregate Bond Index (Broad taxable market) | 5.4% | 3.9% | 4.4% |
Lehman Municipal Bond Index | 2.9 | 3.7 | 4.5 |
Citigroup 3-Month Treasury Bill Index | 5.0 | 4.1 | 2.9 |
| | | |
| | | |
CPI | | | |
Consumer Price Index | 3.5% | 3.1% | 2.9% |
5
For the year, the broad taxable U.S. bond market returned 5.4%. Returns from tax-exempt bonds were lower, as these issues did not benefit from the late-summer rally in Treasuries.
Expense Ratios1 | | | |
Your fund compared with its peer group | | | |
| Fund | Acquired | Peer-Group |
| Expense | Fund Fees and | Expense |
| Ratio | Expenses2 | Ratio |
European Stock Index Fund | | | |
Investor Shares | 0.22% | — | 1.44% |
Admiral Shares | 0.12 | — | 1.44 |
Signal Shares | 0.12 | — | 1.44 |
Institutional Shares | 0.09 | — | 1.44 |
ETF Shares | 0.12 | — | 1.44 |
Pacific Stock Index Fund | | | |
Investor Shares | 0.22% | — | 1.65% |
Admiral Shares | 0.12 | — | 1.65 |
Signal Shares | 0.123 | — | 1.65 |
Institutional Shares | 0.09 | — | 1.65 |
ETF Shares | 0.12 | — | 1.65 |
Emerging Markets Stock Index Fund | | | |
Investor Shares | 0.37% | — | 1.88% |
Admiral Shares | 0.25 | — | 1.88 |
Signal Shares | 0.253 | — | 1.88 |
Institutional Shares | 0.20 | — | 1.88 |
ETF Shares | 0.25 | — | 1.88 |
Total International Stock Index Fund | — | 0.27% | 1.57% |
Developed Markets Index Fund | — | 0.22% | 1.57% |
Institutional Developed Markets Index Fund | — | 0.09% | 1.57% |
1 Fund expense ratios reflect the 12 months ended October 31, 2007. Peer groups are: for the European Stock Index Fund, the Average European Region Fund; for the Pacific Stock Index Fund, the Average Japan/Pacific Region Fund; for the Emerging Markets Stock Index Fund, the Average Emerging Markets Fund; for the other funds, the Average International Fund. Peer-group expense ratios are derived from data provided by Lipper Inc. and capture information through year-end 2006.
2 This figure represents a weighted average of the annualized expense ratios and any fees charged by the underlying mutual funds in which the fund invests. The fund does not have any expenses or fees of its own. Acquired is a term that the Securities and Exchange Commission applies to any mutual fund whose shares are owned by another fund.
3 Annualized.
6
Strong returns from markets around the globe
The Vanguard International Stock Index Fund lineup includes three distinct regional index funds (European, Pacific, and Emerging Markets) and three funds-of-funds that contain combinations of those regional funds.
The European Stock Index Fund’s Investor Shares posted a 28.5% return for the fiscal period. All three of the fund’s most heavily weighted countries (the United Kingdom, France, and Germany, which, on average, represented more than half of the index) posted stellar gains. The strongest results came from industrials, utilities, telecommunication services, and materials companies—with returns in these sectors ranging from 43% to 55%.
Exports to rapidly growing emerging markets fed the gains, which were also buoyed by an active mergers-and-acquisitions market. The weakest-performing sector was health care, which gained less than 2%. Negative returns from AstraZeneca and Novartis restrained performance for the fiscal year.
The Pacific Stock Index Fund’s Investor Shares returned 19.5% for the period. The gains here were lopsided: The 56.6% and 63.4% returns of Australia and Hong Kong, which together represented roughly 25% of the index on average, gave heft to returns that were otherwise restrained by a 4.9% performance from Japan, which represented 70% of the index. Japanese banks were particularly weak during the year, partly because of the impact of subprime mortgages. The Pacific Stock Index’s brightest sectors were energy, materials, and industrials. No sectors produced negative returns; however, utilities were flat and consumer discretionary stocks gained less than 4%, with Toyota Motor—Japan’s largest stock—falling 2%.
Total Returns | | | |
Ten Years Ended October 31, 20071 | | | |
| | | Average |
| | | Annual Return |
| | | Average |
| Vanguard | Target | Competing |
Index Fund | Fund | Index | Fund2 |
European Stock Investor Shares | 10.8% | 10.7% | 10.7% |
Pacific Stock Investor Shares | 6.4 | 6.4 | 6.0 |
Emerging Markets Stock Investor Shares | 16.1 | 16.1 | 14.3 |
Total International Stock | 10.2 | 10.1 | 8.8 |
Developed Markets | 7.5 | 7.4 | 6.8 |
Institutional Developed Markets | 7.5 | 7.5 | 6.7 |
The figures shown represent past performance, which is not a guarantee of future results. (Current performance may be lower or higher than the performance data cited. For performance data current to the most recent month-end, visit our website at www.vanguard.com/performance.) Note, too, that both investment returns and principal value can fluctuate widely, so an investor’s shares, when sold, could be worth more or less than their original cost.
1 Since inception for the Developed Markets Index Fund (May 8, 2000) and the Institutional Developed Markets Index Fund (June 1, 2000).
2 Derived from data provided by Lipper Inc.
7
The Emerging Markets Stock Index Fund’s Investor Shares delivered a 69.6% return, with supercharged results coming from throughout the developing world. Brazil, for example, gained 111.5% for the year, largely on the strength of its energy, metals, and mining companies. South Korea gained 56.3%, with shipping, construction, and engineering firms leading the way. The two countries accounted, on average, for just over 25% of the index. The Chinese stock market, home to a series of meteoric initial public offerings, soared 167.1%. China represented about 17% of the index at the end of the period. Among sectors, industrials and materials clocked triple-digit gains for the year, while energy, financials, and telecommunications stocks each gained in excess of 65%. The “weakest” sector was information technology, which gained 24.8%.
The Total International Stock Index Fund, the Developed Markets Index Fund, and the Institutional Developed Markets Index Fund are “funds of funds” that hold other Vanguard index funds; as such, their returns are a composite of results from different regions. The Total International Stock Index Fund—which holds market-based weightings in European, Pacific, and emerging market securities—returned 32.5% over the 12 months. The Developed Markets Index Fund and the Institutional Developed Markets Index Fund, which include only European and Pacific markets, returned 25.7% and 25.8%, respectively, for the period.
Fair-value pricing gave funds a slight performance advantage
As noted earlier, the returns of the funds exceeded those of their target indexes for the period. These gaps were largely a fleeting artifact of fair-value pricing, which allows the funds to calculate their net asset values based on real-time developments not reflected in closing market prices overseas. When fair-value pricing is used at the open or close of a reporting period, it may cause a seeming divergence between the return of a fund and that of its index. This discrepancy corrects itself when market prices reflect fair value, usually the next day.
The funds’ long-term results are more than respectable
As the table on page 12 shows, the Vanguard International Stock Index Funds have met their objective of tracking their respective benchmarks over the past decade. Their returns have also surpassed the average annual returns of their respective peer groups since inception or for the ten years ended October 31, 2007.
Vanguard’s Quantitative Equity Group has been managing index funds for more than 30 years. Its disciplined execution of the funds’ indexing mandates, combined with the funds’ extremely low costs, can help you capture as much of the respective markets’ return as possible.
8
International exposure helps to diversify your holdings
While investors in international stocks have come to expect lofty returns, there is no guarantee that these securities will continue to soar. That is why it is important to have a well-thought-out investment strategy based on a diversified mix of stock, bond, and money market mutual funds that fits your goals, time horizon, and risk tolerance. The extended period of outperformance for international markets may mean it is time to rebalance your portfolio to make sure your asset allocations have not gotten out of sync.
By combining domestic stock funds with international funds, as well as bond and money market funds, you can do much to insulate your portfolio from markets that can frown on one asset class and smile on another at the same time.
The International Stock Index Funds can add diversification to your portfolio and help you move toward your long-term investment goals.
Thank you for your ongoing confidence in Vanguard.
Sincerely,

John J. Brennan
Chairman and Chief Executive Officer
November 14, 2007
9
Vanguard European Stock Index ETF |
Premium/Discount: March 4, 20051–October 31, 2007 |
| | | | |
| Market Price Above or | | Market Price Below |
| Equal to Net Asset Value | | Net Asset Value |
| Number | Percentage | | Number | Percentage |
Basis Point Differential2 | of Days | of Total Days | | of Days | of Total Days |
0–24.9 | 158 | 23.51% | | 28 | 4.16% |
25–49.9 | 206 | 30.66 | | 3 | 0.45 |
50–74.9 | 145 | 21.58 | | 1 | 0.15 |
75–100.0 | 80 | 11.90 | | 0 | 0.00 |
>100.0 | 50 | 7.44 | | 1 | 0.15 |
Total | 639 | 95.09% | | 33 | 4.91% |
Vanguard Pacific Stock Index ETF |
Premium/Discount: March 4, 20051–October 31, 2007 |
| | | | | |
| Market Price Above or | | Market Price Below |
| Equal to Net Asset Value | | Net Asset Value |
| Number | Percentage | | Number | Percentage |
Basis Point Differential2 | of Days | of Total Days | | of Days | of Total Days |
0–24.9 | 163 | 24.26% | | 41 | 6.10% |
25–49.9 | 179 | 26.64 | | 15 | 2.23 |
50–74.9 | 132 | 19.64 | | 0 | 0.00 |
75–100.0 | 76 | 11.31 | | 1 | 0.15 |
>100.0 | 65 | 9.67 | | 0 | 0.00 |
Total | 615 | 91.52% | | 57 | 8.48% |
Vanguard Emerging Markets Stock Index ETF |
Premium/Discount: March 4, 20051–October 31, 2007 |
| | | | | |
| Market Price Above or | | Market Price Below |
| Equal to Net Asset Value | | Net Asset Value |
| Number | Percentage | | Number | Percentage |
Basis Point Differential2 | of Days | of Total Days | | of Days | of Total Days |
0–24.9 | 107 | 15.92% | | 66 | 9.82% |
25–49.9 | 141 | 20.98 | | 29 | 4.32 |
50–74.9 | 137 | 20.39 | | 18 | 2.68 |
75–100.0 | 84 | 12.50 | | 13 | 1.93 |
>100.0 | 56 | 8.33 | | 21 | 3.13 |
Total | 525 | 78.12% | | 147 | 21.88% |
1 Inception.
2 One basis point equals 1/100 of a percentage point.
10
European Stock Index Fund
Fund Profile
As of October 31, 2007
Portfolio Characteristics | | |
| | Target | Broad |
| Fund | Index1 | Index2 |
Number of Stocks | 593 | 579 | 2,067 |
Turnover Rate | 9% | — | — |
Expense Ratio | | — | — |
Investor Shares | 0.22% | | |
Admiral Shares | 0.12% | | |
Signal Shares | 0.12% | | |
Institutional Shares | 0.09% | | |
ETF Shares | 0.12% | | |
Short-Term Reserves | –0.1%3 | — | — |
Sector Diversification (% of equity exposure) |
| | Target | Broad |
| Fund | Index1 | Index2 |
Consumer Discretionary | 10.0% | 10.2% | 9.8% |
Consumer Staples | 9.5 | 9.5 | 7.6 |
Energy | 10.1 | 9.9 | 10.7 |
Financials | 27.0 | 27.0 | 24.8 |
Health Care | 6.9 | 6.9 | 6.6 |
Industrials | 9.9 | 10.1 | 11.3 |
Information Technology | 3.8 | 3.8 | 9.6 |
Materials | 9.0 | 8.9 | 9.2 |
Telecommunication | | | |
Services | 7.5 | 7.5 | 6.1 |
Utilities | 6.3 | 6.2 | 4.3 |
Volatility Measures4 | |
| Fund Versus | Fund Versus |
| Target Index1 | Broad Index2 |
R-Squared | 0.98 | 0.87 |
Beta | 0.99 | 0.88 |
11
Ten Largest Holdings5 (% of total net assets) |
| | |
Royal Dutch Shell PLC | integrated | |
| oil and gas | 2.8% |
BP PLC | integrated | |
| oil and gas | 2.5 |
HSBC Holdings PLC | diversified banks | 2.3 |
Vodafone Group PLC | wireless | |
| telecommunication | |
| services | 2.1 |
Nestle SA (Registered) | packaged foods | |
| and meats | 1.8 |
Total SA | integrated | |
| oil and gas | 1.7 |
Nokia Oyj | communications | |
| equipment | 1.6 |
Telefonica SA | integrated | |
| telecommunication | |
| services | 1.5 |
GlaxoSmithKline PLC | pharmaceuticals | 1.5 |
Banco Santander | | |
Central Hispano SA | diversified banks | 1.4 |
Top Ten | | 19.2% |
1 MSCI Europe Index.
2 MSCI All Country World Index ex USA.
3 The fund invested a portion of its cash reserves in equity markets through the use of index futures contracts. After the effect of the futures investments, the fund’s temporary cash position was negative.
4 For an explanation of R-squared, beta, and other terms used here, see the Glossary on page 165.
5 “Ten Largest Holdings” excludes any temporary cash investments and equity index products.
12
European Stock Index Fund
Market Diversification (% of equity exposure) |
| | Target |
| Fund | Index1 |
United Kingdom | 32.9% | 33.0% |
France | 14.2 | 14.0 |
Germany | 12.5 | 12.4 |
Switzerland | 9.4 | 9.4 |
Spain | 6.1 | 6.1 |
Italy | 5.5 | 5.4 |
Netherlands | 4.1 | 4.3 |
Sweden | 3.5 | 3.5 |
Finland | 2.8 | 2.8 |
Belgium | 1.9 | 1.9 |
Norway | 1.5 | 1.5 |
Denmark | 1.3 | 1.3 |
Greece | 1.2 | 1.2 |
Ireland | 1.0 | 1.0 |
Other European Countries | 2.1 | 2.2 |
1 MSCI Europe Index.
13
European Stock Index Fund
Performance Summary
All of the returns in this report represent past performance, which is not a guarantee of future results that may be achieved by the fund. (Current performance may be lower or higher than the performance data cited. For performance data current to the most recent month-end, visit our website at www.vanguard.com/performance.) Note, too, that both investment returns and principal value can fluctuate widely, so an investor’s shares, when sold, could be worth more or less than their original cost. The returns shown do not reflect taxes that a shareholder would pay on fund distributions or on the sale of fund shares.
Cumulative Performance: October 31, 1997–October 31, 2007
Initial Investment of $10,000
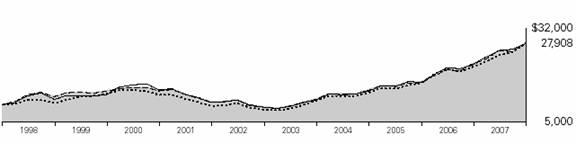
| Average Annual Total Returns | Final Value of |
| Periods Ended October 31, 2007 | a $10,000 |
| One Year | Five Years | Ten Years | Investment |
European Stock Index Fund Investor Shares1 | 28.49% | 24.38% | 10.81% | $27,908 |
MSCI All Country World Index ex USA | 32.97 | 26.39 | 10.75 | 27,762 |
MSCI Europe Index | 27.96 | 24.29 | 10.66 | 27,547 |
Average European Region Fund2 | 27.48 | 24.55 | 10.73 | 27,702 |
| | | | Final Value of |
| | | Since | a $100,000 |
| One Year | Five Years | Inception3 | Investment |
European Stock Index Fund Admiral Shares1 | 28.59% | 24.50% | 14.83% | $236,182 |
MSCI All Country World Index ex USA | 32.97 | 26.39 | 16.65 | 260,425 |
MSCI Europe Index | 27.96 | 24.29 | 14.66 | 234,005 |
| | | Final Value of |
| | Since | a $10,000,000 |
| One Year | Inception3 | Investment |
European Stock Index Fund Signal Shares1 | 28.59% | 30.81% | $13,324,326 |
MSCI All Country World Index ex USA | 32.97 | 34.43 | 13,718,637 |
MSCI Europe Index | 27.96 | 30.41 | 13,280,035 |
1 Returns do not reflect the 0.5% transaction fee on purchases through March 31, 2000; the 2% fee assessed on redemptions of shares purchased on or after June 27, 2003, and held for less than two months; or, for the Investor Shares, the account service fee that may be applicable to certain accounts with balances below $10,000.
2 Derived from data provided by Lipper Inc.
3 Performance for the fund and its comparative standards is calculated since the following inception dates: August 13, 2001, for the Admiral Shares and October 6, 2006, for the Signal Shares.
14
European Stock Index Fund
| | | | Final Value of |
| | | Since | a $5,000,000 |
| One Year | Five Years | Inception2 | Investment |
European Stock Index Fund Institutional Shares1 | 28.63% | 24.56% | 8.89% | $9,442,202 |
MSCI All Country World Index ex USA | 32.97 | 26.39 | 9.85 | 10,076,044 |
MSCI Europe Index | 27.96 | 24.29 | 8.71 | 9,326,061 |
| | | Final Value |
| | Since | of a $10,000 |
| One Year | Inception2 | Investment |
European Stock Index Fund ETF Shares | 28.60% | 21.78% | $16,890 |
MSCI All Country World Index ex USA | 32.97 | 24.00 | 17,723 |
MSCI Europe Index | 27.96 | 21.51 | 16,791 |
Cumulative Returns: ETF Shares, March 4, 2005–October 31, 2007 |
| | |
| | Since |
| One Year | Inception2 |
European Stock Index Fund ETF Shares Market Price | 28.36% | 69.14% |
European Stock Index Fund ETF Shares Net Asset Value | 28.60 | 68.90 |
MSCI Europe Index | 27.96 | 67.91 |
1 Returns do not reflect the 0.5% transaction fee on purchases through March 31, 2000, or the 2% fee assessed on redemptions of shares purchased on or after June 27, 2003, and held for less than two months.
2 Performance for the fund and its comparative standards is calculated since the following inception dates: May 15, 2000, for the Institutional Shares and March 4, 2005, for the ETF Shares.
15
European Stock Index Fund
Fiscal-Year Total Returns (%): October 31, 1997–October 31, 2007
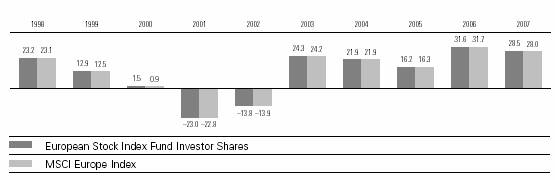
Average Annual Total Returns: Periods Ended September 30, 2007
This table presents average annual total returns through the latest calendar quarter—rather than through the end of the fiscal period. Securities and Exchange Commission rules require that we provide this information.
| Inception Date | One Year | Five Years | Ten Years |
European Stock Index Fund | | | | |
Investor Shares1 | 6/18/1990 | 27.82% | 25.49% | 9.73% |
Admiral Shares1 | 8/13/2001 | 27.96 | 25.61 | 14.162 |
Signal Shares1 | 10/6/2006 | 27.072 | | |
Institutional Shares1 | 5/15/2000 | 27.99 | 25.69 | 8.302 |
ETF Shares | 3/4/2005 | | | |
Market Price | | 26.92 | 20.352 | — |
Net Asset Value | | 27.96 | 20.342 | — |
1 Returns do not reflect the 0.5% transaction fee on purchases through March 31, 2000; the 2% fee assessed on redemptions of shares purchased on or after June 27, 2003, and held for less than two months; or, for the Investor Shares, the account service fee that may be applicable to certain accounts with balances below $10,000.
2 Returns since inception.
Note: See Financial Highlights tables on pages 37-41 for dividend and capital gains information.
16
European Stock Index Fund
Financial Statements
Statement of Net Assets
As of October 31, 2007
The fund provides a complete list of its holdings four times in each fiscal year, at the quarter-ends. For the second and fourth fiscal quarters, the lists appear in the fund’s semiannual and annual reports to shareholders. For the first and third fiscal quarters, the fund files the lists with the Securities and Exchange Commission on Form N-Q. Shareholders can look up the fund’s Forms N-Q on the SEC’s website at www.sec.gov. Forms N-Q may also be reviewed and copied at the SEC’s Public Reference Room (see the back cover of this report for further information).
| | | Market |
| | | Value• |
| | Shares | ($000) |
Common Stocks (99.4%)1 | | |
Austria (0.8%) | | |
| Erste Bank der | | |
| Oesterreichischen | | |
| Sparkassen AG | 711,755 | 57,945 |
| OMV AG | 620,828 | 46,614 |
| Telekom Austria AG | 1,349,672 | 38,863 |
| Voestalpine AG | 416,844 | 37,664 |
| Raiffeisen International | | |
| Bank–Holding AG | 134,183 | 22,323 |
| Oesterreichische | | |
| Elektrizitaetswirtschafts | | |
| AG Class A | 331,933 | 21,996 |
| Wienerberger AG | 300,150 | 18,752 |
* | Meinl European Land Ltd. | 1,129,021 | 15,891 |
| Immofinanz Immobilien | | |
| Anlagen AG | 1,164,846 | 13,905 |
| Andritz AG | 146,617 | 10,844 |
* | IMMOEAST Immobilien | | |
| Anlagen AG | 799,999 | 9,779 |
| Wiener Staedtische | | |
| Allgemeine | | |
| Versicherung AG | 120,373 | 8,888 |
* | RHI AG | 97,147 | 4,978 |
| Flughafen Wien AG | 39,697 | 4,711 |
| Mayr-Melnhof Karton AG | 32,007 | 3,814 |
* | BETandWIN.com Interactive | |
| Entertainment AG | 18,459 | 629 |
| | | 317,596 |
Belgium (1.9%) | | |
| Fortis | 7,764,519 | 249,359 |
| KBC Bank & Verzekerings | | |
| Holding | 682,968 | 95,992 |
| InBev | 689,925 | 65,299 |
| Dexia | 1,969,027 | 63,395 |
17
| | | Market |
| | | Value• |
| | Shares | ($000) |
| Groupe Bruxelles | | |
| Lambert SA | 313,016 | 40,104 |
| Solvay SA | 239,024 | 36,395 |
| Belgacom SA | 635,817 | 30,469 |
| Delhaize Group | 291,998 | 27,843 |
| Umicore | 93,241 | 23,313 |
| UCB SA | 235,821 | 13,857 |
| Colruyt NV | 62,515 | 13,396 |
| Mobistar SA | 120,984 | 10,960 |
| Bekaert NV | 46,015 | 6,352 |
| Cofinimmo | 31,989 | 6,015 |
| Compagnie Maritime | | |
| Belge SA | 52,632 | 4,843 |
| Omega Pharma SA | 68,807 | 4,618 |
| D’Ieteren SA | 10,572 | 4,588 |
| Euronav SA | 89,099 | 2,653 |
| Barco NV | 31,774 | 2,616 |
* | Fortis Strip--VVPR | 2,988,696 | 43 |
| Agfa Gevaert NV | 2,050 | 29 |
| | | 702,139 |
Denmark (1.3%) | | |
| Novo Nordisk A/S B Shares | 905,669 | 112,872 |
| Danske Bank A/S | 1,708,953 | 75,641 |
* | Vestas Wind Systems A/S | 696,922 | 62,523 |
| AP Moller-Maersk A/S | | |
| B Shares | 4,134 | 57,243 |
| FLS Industries A/S B Shares | 200,027 | 21,802 |
| DSV A/S | 758,496 | 20,153 |
| Novozymes A/S | 173,363 | 18,946 |
* | Jyske Bank A/S | 221,703 | 18,346 |
| Carlsberg A/S B Shares | 128,070 | 17,323 |
| Danisco A/S | 190,187 | 14,679 |
* | Topdanmark A/S | 64,756 | 11,099 |
| Sydbank A/S | 236,843 | 10,944 |
| NKT Holding A/S | 88,873 | 9,736 |
| Coloplast A/S B Shares | 100,147 | 9,727 |
* | William Demant A/S | 95,195 | 8,769 |
| Trygvesta A/S | 102,260 | 8,146 |
* | GN Store Nord A/S | 629,765 | 6,718 |
| H. Lundbeck A/S | 199,884 | 5,749 |
18
| | | Market |
| | | Value• |
| | Shares | ($000) |
| East Asiatic Co. A/S | 62,775 | 5,083 |
| Bang & Olufsen A/S | | |
| B Shares | 39,570 | 4,659 |
| Dampskibsselskabet | | |
| Torm A/S | 109,452 | 4,598 |
| | | 504,756 |
Finland (2.8%) | | |
| Nokia Oyj | 15,404,668 | 611,800 |
| Fortum Oyj | 1,677,094 | 72,926 |
| Sampo Oyj A Shares | 1,629,179 | 51,174 |
| UPM-Kymmene Oyj | 2,077,174 | 46,660 |
| Stora Enso Oyj R Shares | 1,756,151 | 32,394 |
| Metso Oyj | 480,073 | 29,311 |
| Kone Oyj | 287,394 | 23,861 |
| Wartsila Oyj B Shares | 244,305 | 20,026 |
| Rautaruuki Oyj | 315,923 | 18,207 |
| Neste Oil Oyj | 482,570 | 17,390 |
| Elisa Oyj Class A | 562,469 | 16,734 |
| Outokumpu Oyj A Shares | 444,172 | 16,666 |
| Kesko Oyj | 248,088 | 14,902 |
| Nokian Renkaat Oyj | 392,995 | 14,881 |
| YIT Oyj | 476,880 | 14,755 |
| KCI Konecranes Oyj | 226,696 | 10,209 |
| SanomaWSOY Oyj | 310,181 | 8,972 |
| Cargotec Corp. | 144,545 | 8,965 |
| Orion Oyj | 328,716 | 8,453 |
| OKO Bank (Osuuspankkien | | |
| Keskuspankki Oyj) | 359,666 | 7,748 |
| Amer Sports Oyj A Shares | 270,999 | 7,212 |
| TietoEnator Oyj B Shares | 224,372 | 5,524 |
| Uponor Oyj | 206,431 | 5,417 |
| | | 1,064,187 |
France (14.1%) | | |
| Total SA | 8,101,031 | 653,721 |
| BNP Paribas SA | 3,158,341 | 350,043 |
| Sanofi-Aventis | 3,835,509 | 337,386 |
| AXA | 5,987,429 | 268,933 |
| France Telecom SA | 6,864,035 | 253,832 |
| Suez SA | 3,853,646 | 251,418 |
| Societe Generale Class A | 1,388,621 | 234,594 |
| Vivendi SA | 4,347,416 | 196,457 |
| Carrefour SA | 2,253,915 | 162,869 |
| Groupe Danone | 1,668,336 | 143,588 |
| Cie. de St. Gobain SA | 1,252,512 | 134,985 |
| Air Liquide SA | 904,024 | 124,858 |
* | Vinci SA | 1,483,928 | 122,450 |
| L’Oreal SA | 929,537 | 122,368 |
| LVMH Louis Vuitton | | |
| Moet Hennessy | 912,364 | 117,862 |
| Renault SA | 693,731 | 117,171 |
19
| | | Market |
| | | Value• |
| | Shares | ($000) |
| Veolia Environnement | 1,285,662 | 115,103 |
| Schneider Electric SA | 806,502 | 111,563 |
| Credit Agricole SA | 2,545,238 | 100,839 |
| Alstom | 385,804 | 91,499 |
| Lafarge SA | 555,876 | 90,867 |
| Alcatel-Lucent | 8,558,148 | 83,194 |
| Bouygues SA | 824,470 | 79,570 |
| Pernod Ricard SA | 335,273 | 77,640 |
| Compagnie Generale des | | |
| Etablissements Michelin SA | 533,560 | 71,858 |
| Unibail Co. | 277,836 | 69,387 |
| Accor SA | 709,335 | 67,958 |
| Pinault-Printemps- | | |
| Redoute SA | 298,678 | 59,398 |
| Vallourec SA | 184,735 | 53,795 |
| PSA Peugeot Citroen | 565,454 | 52,704 |
| Essilor International SA | 733,482 | 46,868 |
| STMicroelectronics NV | 2,568,077 | 43,998 |
| Gaz de France | 737,284 | 41,999 |
| Lagardere S.C.A. | 486,415 | 41,249 |
| Hermes International | 281,322 | 37,080 |
| Technip SA | 376,866 | 33,876 |
| Cap Gemini SA | 516,109 | 33,054 |
| Sodexho Alliance SA | 371,863 | 26,922 |
* | Business Objects SA | 440,573 | 26,499 |
| SCOR SA | 806,093 | 22,047 |
| Publicis Groupe SA | 539,419 | 21,982 |
| CNP Assurances | 167,458 | 21,396 |
| Dassault Systemes SA | 342,623 | 21,302 |
| Thales SA | 329,848 | 20,619 |
| Safran SA | 742,907 | 18,910 |
| Casino Guichard- | | |
| Perrachon SA | 161,958 | 18,135 |
| Thomson SA | 927,530 | 16,257 |
* | Atos Origin SA | 259,296 | 15,810 |
| Neopost SA | 130,731 | 15,204 |
| Aeroports de Paris (ADP) | 128,328 | 14,715 |
| Valeo SA | 260,001 | 14,314 |
| Air France | 343,461 | 13,106 |
| Imerys SA | 117,328 | 11,431 |
| Zodiac SA | 155,502 | 10,795 |
| Klepierre | 189,219 | 10,297 |
| Icade | 123,184 | 9,126 |
| Societe des Autoroutes | | |
| Paris-Rhin-Rhone | 83,345 | 8,869 |
| M6 Metropole Television | 268,892 | 7,980 |
| Gecina SA | 46,405 | 7,957 |
| Societe BIC SA | 101,356 | 7,881 |
| Societe Television Francaise 1 | 265,680 | 7,391 |
| PagesJaunes SA | 93,088 | 2,060 |
| | | 5,367,039 |
20
| | | Market |
| | | Value• |
| | Shares | ($000) |
Germany (12.5%) | | |
| E.On AG | 2,342,844 | 458,025 |
| Siemens AG | 3,201,998 | 434,178 |
| Allianz AG | 1,689,494 | 380,437 |
| DaimlerChrysler AG | | |
| (Registered) | 3,157,345 | 345,420 |
| BASF AG | 1,879,730 | 260,221 |
| Deutsche Bank AG | 1,908,330 | 253,735 |
| RWE AG | 1,673,660 | 228,637 |
| Bayer AG | 2,731,444 | 228,027 |
| Deutsche Telekom AG | 10,663,632 | 218,928 |
| SAP AG | 3,369,415 | 182,195 |
| Volkswagen AG | 594,580 | 169,965 |
| Muenchener | | |
| Rueckversicherungs- | | |
| Gesellschaft AG | | |
| (Registered) | 748,187 | 143,622 |
| Deutsche Boerse AG | 752,314 | 118,512 |
| Commerzbank AG | 2,348,704 | 99,511 |
| ThyssenKrupp AG | 1,354,911 | 90,245 |
| Porsche AG | 32,916 | 87,725 |
| Man AG | 424,312 | 75,873 |
| Continental AG | 496,218 | 75,049 |
| Volkswagen AG Pfd. | 395,951 | 74,922 |
| Deutsche Post AG | 2,324,544 | 70,439 |
| Linde AG | 453,916 | 57,518 |
| Metro AG | 609,627 | 55,328 |
| Adidas AG | 765,824 | 51,081 |
* | Infineon Technologies AG | 3,299,591 | 48,456 |
| Hypo Real Estate | | |
| Holding AG | 757,459 | 44,842 |
| Fresenius Medical Care AG | 712,723 | 37,729 |
| DaimlerChrysler AG | 327,337 | 36,056 |
| Henkel KGaA Pfd. | 670,373 | 34,251 |
| Salzgitter AG | 154,572 | 30,425 |
| Merck KGaA | 243,068 | 30,418 |
| Beiersdorf AG | 331,673 | 26,297 |
| Deutsche Lufthansa AG | 861,552 | 25,436 |
* | TUI AG | 802,883 | 23,779 |
| Hochtief AG | 158,081 | 21,835 |
| Solarworld AG | 315,001 | 21,383 |
| Henkel KGaA | 396,944 | 18,375 |
| Celesio AG | 319,996 | 18,183 |
| RWE AG Pfd. | 146,617 | 17,923 |
| IVG Immobilien AG | 385,300 | 17,526 |
| Wincor Nixdorf AG | 130,769 | 13,028 |
| Bilfinger Berger AG | 140,758 | 12,551 |
* | Qiagen NV | 523,803 | 12,331 |
| Rheinmetall AG | 135,339 | 12,078 |
21
| | | Market |
| | | Value• |
| | Shares | ($000) |
| Puma AG | 26,119 | 11,238 |
| Deutsche Postbank AG | 150,852 | 11,010 |
| Suedzucker AG | 445,249 | 10,113 |
* | Arcandor AG | 291,629 | 9,389 |
| ProSieben Sat.1 Media AG | 310,146 | 9,105 |
| Heidelberger | | |
| Druckmaschinen AG | 212,130 | 8,664 |
| Douglas Holding AG | 118,328 | 7,551 |
| Altana AG | 264,427 | 6,409 |
| MLP AG | 204,477 | 2,716 |
* | Premier AG | 69,490 | 1,423 |
| | | 4,740,113 |
Greece (1.2%) | | |
| National Bank of Greece SA | 1,276,909 | 89,226 |
| Alpha Credit Bank SA | 1,457,230 | 54,105 |
| Bank of Piraeus | 1,206,233 | 48,567 |
| EFG Eurobank Ergasias | 1,175,496 | 45,869 |
| Hellenic Telecommunications | | |
| Organization SA | 1,150,837 | 42,271 |
| Greek Organization of | | |
| Football Prognostics | 839,478 | 34,370 |
| Coca-Cola Hellenic | | |
| Bottling Co. SA | 405,130 | 25,149 |
| Public Power Corp. | 443,164 | 18,005 |
| National Bank of | | |
| Greece SA ADR | 1,218,898 | 17,077 |
| Cosmote Mobile | | |
| Communications SA | 424,496 | 14,680 |
| Titan Cement Co. SA | 223,070 | 10,913 |
| Hellenic Telecommunications | | |
| Organization SA ADR | 466,250 | 8,644 |
| Hellenic Technodomiki | | |
| Tev SA | 548,152 | 8,355 |
| Hellenic Exchanges SA | 215,650 | 7,547 |
| Hellenic Petroleum SA | 477,211 | 7,461 |
22
| | | Market |
| | | Value• |
| | Shares | ($000) |
| Viohalco, Hellenic Copper & | | |
| Aluminum Industry SA | 386,220 | 6,330 |
| Folli-Follie SA | 59,190 | 2,553 |
| Motor Oil (Hellas) Corinth | | |
| Refineries SA | 58,914 | 1,460 |
| | | 442,582 |
Ireland (1.0%) | | |
| Allied Irish Banks PLC | 3,302,998 | 83,274 |
| CRH PLC | 2,052,537 | 79,188 |
| Bank of Ireland | 3,706,797 | 68,312 |
* | Elan Corp. PLC | 1,713,309 | 40,877 |
| Kerry Group PLC A Shares | 515,187 | 15,440 |
| Irish Life & Permanent PLC | 652,337 | 14,826 |
| Kingspan Group PLC | 478,718 | 11,302 |
| IAWS Group PLC | 476,133 | 11,216 |
| DCC PLC | 302,306 | 8,321 |
| Paddy Power PLC | 178,200 | 7,390 |
| Independent News & | | |
| Media PLC | 2,007,558 | 7,375 |
* | Ryanair Holdings PLC | 868,762 | 7,270 |
* | Ryanair Holdings PLC ADR | 116,373 | 5,724 |
| C&C Group PLC | 688,976 | 5,514 |
| Grafton Group PLC | 410,002 | 4,580 |
| Greencore Group PLC | 611,566 | 4,164 |
| | | 374,773 |
Italy (5.4%) | | |
| Eni SpA | 9,793,705 | 357,598 |
| Unicredito Italiano SpA | 32,545,486 | 279,969 |
| Intesa Sanpaolo SpA | 28,972,726 | 229,841 |
| Enel SpA | 16,278,092 | 195,180 |
| Assicurazioni Generali SpA | 3,966,960 | 189,055 |
| Telecom Italia SpA | 40,665,704 | 127,428 |
| Fiat SpA | 2,670,719 | 86,597 |
| Telecom Italia SpA RNC | 24,954,739 | 64,630 |
| Unione Di Banche | | |
| Italiane ScpA | 2,284,363 | 63,685 |
* | Banco Popolare SpA | 2,521,216 | 60,515 |
| Mediobanca Banca di | | |
| Credito Finanziaria SpA | 1,845,547 | 43,887 |
| Atlantia SpA | 969,218 | 38,116 |
| Finmeccanica SpA | 1,119,316 | 33,295 |
| Mediaset SpA | 2,888,656 | 29,962 |
| Intesa Sanpaolo SpA Non | | |
| Convertible Risp. | 3,509,185 | 26,644 |
| Banca Monte dei Paschi | | |
| di Siena SpA | 4,155,471 | 26,608 |
| Banca Popolare di | | |
| Milano SpA | 1,561,809 | 24,606 |
| Parmalat SpA | 5,892,162 | 21,827 |
| Alleanza Assicurazioni SpA | 1,592,505 | 21,587 |
23
| | | Market |
| | | Value• |
| | Shares | ($000) |
| Snam Rete Gas SpA | 3,309,521 | 21,425 |
| Luxottica Group SpA | 520,718 | 18,345 |
* | Pirelli & C. Accomandita | | |
| per Azioni SpA | 14,156,357 | 18,140 |
| Terna SpA | 4,515,789 | 17,700 |
| Fondiaria–Sai SpA | 258,814 | 12,602 |
| Compagnia Assicuratrice | | |
| Unipol SpA | 3,382,042 | 12,131 |
| Lottomatica SpA | 329,277 | 11,785 |
| Bulgari SpA | 563,111 | 8,826 |
| Autogrill SpA | 382,558 | 7,654 |
| Italcementi SpA | 272,877 | 6,286 |
| Mondadori (Arnoldo) | | |
| Editore SpA | 443,576 | 4,393 |
| Seat Pagine Gialle SpA | 6,998,895 | 4,073 |
| Mediolanum SpA | 432,982 | 3,228 |
| | | 2,067,618 |
Luxembourg (0.7%) | |
* | ArcelorMittal | 3,414,006 | 275,482 |
| | | |
Netherlands (4.1%) | | |
| ING Groep NV | 7,068,477 | 319,486 |
| Unilever NV | 6,450,787 | 209,959 |
| Koninklijke (Royal) Philips | | |
| Electronics NV | 4,299,291 | 177,872 |
| Koninklijke KPN NV | 7,255,374 | 136,990 |
| Aegon NV | 5,491,743 | 113,844 |
| Akzo Nobel NV | 1,022,726 | 82,430 |
| Heineken NV | 921,707 | 64,701 |
| TNT NV | 1,511,081 | 62,008 |
| Koninklijke Ahold NV | 3,808,423 | 57,382 |
| ASML Holding NV | 1,553,038 | 54,075 |
| Reed Elsevier NV | 2,698,894 | 52,455 |
| European Aeronautic | | |
| Defence and Space Co. | 1,413,336 | 48,178 |
| Koninklijke DSM NV | 551,052 | 31,300 |
| Wolters Kluwer NV | 903,193 | 28,368 |
| SBM Offshore NV | 530,701 | 20,480 |
| Fugro NV | 218,205 | 19,181 |
| Hagemeyer NV | 2,608,849 | 17,788 |
| Vedior NV | 680,114 | 15,500 |
| Corio NV | 156,140 | 13,711 |
| Wereldhave NV | 78,171 | 9,338 |
| Randstad Holding NV | 146,674 | 8,172 |
| Oce NV | 373,161 | 7,518 |
| Corporate Express | 241,720 | 2,706 |
| ASML Holding N.V. | | |
| (New York Shares) | 34,293 | 1,197 |
| Koninklijke Numico NV | 7,366 | 583 |
| Aegon NV (New York) ARS | 3,320 | 69 |
| | | 1,555,291 |
Norway (1.5%) | | | |
24
| | | Market |
| | | Value• |
| | Shares | ($000) |
| Statoil ASA | 4,828,271 | 164,482 |
| Telenor ASA | 3,160,511 | 74,416 |
| Orkla ASA | 3,134,898 | 58,611 |
| DnB NOR ASA | 2,766,804 | 45,852 |
* | Renewable Energy Corp. AS | 650,400 | 33,407 |
| Yara International ASA | 684,165 | 26,666 |
* | SeaDrill Ltd. | 937,309 | 22,440 |
| Aker Kvaerner ASA | 621,155 | 21,785 |
| Acergy SA | 733,853 | 21,269 |
| Petroleum Geo- | | |
| Services ASA | 643,655 | 19,109 |
| Norsk Hydro ASA | 1,234,543 | 18,149 |
| Prosafe ASA | 691,550 | 12,323 |
| Storebrand ASA | 846,433 | 12,134 |
| Tandberg ASA | 431,750 | 11,049 |
| Schibsted ASA | 176,002 | 10,027 |
| Frontline Ltd. | 196,934 | 8,906 |
* | Marine Harvest | 7,891,205 | 8,056 |
* | Ocean Rig ASA | 643,326 | 5,149 |
| Tomra Systems ASA | 667,333 | 4,860 |
| Stolt-Nielsen SA | 138,755 | 4,072 |
* | Det Norske Oljeselskap | | |
| (DNO) ASA | 513,224 | 963 |
* | TGS Nopec | | |
| Geophysical Co. ASA | 13,586 | 229 |
| Norske Skogindustrier ASA | 852 | 9 |
| | | 583,963 |
Portugal (0.5%) | | |
| Electricidade de | | |
| Portugal SA | 7,566,871 | 48,754 |
| Portugal Telecom | | |
| SGPS SA | 2,973,263 | 39,839 |
| Banco Comercial | | |
| Portugues SA | 8,153,407 | 39,808 |
| Banco Espirito Santo SA | 845,868 | 20,580 |
| Brisa-Auto Estradas | | |
| de Portugal SA | 1,127,824 | 16,038 |
| PT Multimedia-Servicos | | |
| de Telecomunicacoes | | |
| e Multimedia, SGPS, SA | 829,981 | 11,304 |
| Sonae SGPS SA | 2,992,862 | 8,793 |
| Banco BPI SA | 857,146 | 7,570 |
| Cimpor-Cimento | | |
| de Portugal SA | 758,273 | 6,907 |
| Jeronimo Martins, SGPS, SA | 709,732 | 5,285 |
* | Sonae Industria–SGPS SA | 234,208 | 2,853 |
| | | 207,731 |
Spain (6.1%) | | |
| Telefonica SA | 16,516,684 | 546,886 |
| Banco Santander Central | | |
| Hispano SA | 23,527,099 | 514,530 |
| Banco Bilbao Vizcaya | | |
25
| | | Market |
| | | Value• |
| | Shares | ($000) |
| Argentaria SA | 14,099,398 | 356,812 |
| Iberdrola SA | 14,088,923 | 227,278 |
| Repsol YPF SA | 2,985,427 | 117,946 |
| Altadis SA | 963,592 | 68,718 |
| Industria de Diseno | | |
| Textil SA | 820,786 | 61,369 |
| Banco Popular Espanol SA | 3,200,678 | 56,173 |
| ACS, Actividades de | | |
| Construccion y Servicios, SA | 796,479 | 49,449 |
| Acciona SA | 107,609 | 33,304 |
| Gamesa Corporacion | | |
| Tecnologica, SA | 640,715 | 32,609 |
| Abertis Infraestructuras SA | 902,183 | 30,167 |
| Union Fenosa SA | 402,854 | 26,832 |
| Gas Natural SDG SA | 421,255 | 25,971 |
| Acerinox SA | 585,976 | 17,322 |
| Sacyr Vallehermoso SA | 364,819 | 17,217 |
| Grupo Ferrovial, SA | 168,714 | 14,743 |
| Indra Sistemas, SA | 502,570 | 14,621 |
| Cintra Concesiones | | |
| de Infraestructuras | | |
| de Transport SA | 776,508 | 13,621 |
| Fomento de Construc y | | |
| Contra SA | 127,466 | 11,137 |
| Corporacion Mapfre SA | 2,225,489 | 10,497 |
| Zardoya Otis SA | 285,070 | 9,654 |
| Iberia (Linea Aerea Espana) | 1,800,433 | 9,185 |
| Sociedad General de Aguas | |
| de Barcelona SA | 226,419 | 9,057 |
| Telefonica SA ADR | 87,308 | 8,683 |
* | Sogecable SA | 205,690 | 8,321 |
| Zeltia SA | 611,435 | 7,210 |
| Ebro Puleva SA | 345,011 | 7,137 |
| Antena 3 Television | 388,374 | 6,914 |
| Promotora de | | |
| Informaciones SA | 291,660 | 5,734 |
| Gestevision Telecinco SA | 3,903 | 113 |
| Endesa SA | 1,114 | 58 |
| | | 2,319,268 |
Sweden (3.5%) | | |
| Telefonaktiebolaget LM | | |
| Ericsson AB Class B | 49,080,941 | 146,850 |
| Nordea Bank AB | 7,806,862 | 139,832 |
| Hennes & Mauritz AB | | |
| B Shares | 1,785,850 | 119,329 |
| TeliaSonera AB | 8,445,346 | 83,320 |
* | Volvo AB B Shares | 3,657,420 | 71,924 |
* | Sandvik AB | 3,570,473 | 67,846 |
| Svenska Handelsbanken | | |
| AB A Shares | 1,855,744 | 61,708 |
| Skandinaviska Enskilda | | |
| Banken AB A Shares | 1,746,057 | 53,763 |
26
| | | Market |
| | | Value• |
| | Shares | ($000) |
* | Atlas Copco AB–A Shares | 2,526,364 | 42,465 |
| Svenska Cellulosa AB-B | 2,116,624 | 37,399 |
* | Scania AB–B Shares | 1,354,606 | 37,191 |
* | Volvo AB A Shares | 1,784,720 | 34,797 |
* | SKF AB–B Shares | 1,526,889 | 29,788 |
| Alfa Laval AB | 356,876 | 28,433 |
| Skanska AB B Shares | 1,415,704 | 28,149 |
| Tele2 AB B Shares | 1,146,803 | 27,087 |
| Assa Abloy AB | 1,174,103 | 24,670 |
* | Atlas Copco AB–B Shares | 1,573,875 | 24,666 |
| SSAB Svenskt Stal | | |
| AB Series A | 711,119 | 23,183 |
| Swedish Match AB | 1,004,663 | 22,514 |
| Boliden AB | 1,119,829 | 19,849 |
| Electrolux AB Series B | 956,765 | 18,586 |
| Getinge AB B Shares | 638,031 | 16,907 |
| Modern Times Group | | |
| AB B Shares | 193,653 | 13,695 |
| OMX AB | 317,443 | 13,374 |
| Husqvarna AB B Shares | 1,058,089 | 12,786 |
* | Lundin Petroleum AB | 998,254 | 12,039 |
| SSAB Svenskt Stal | | |
| AB Series B | 312,737 | 9,251 |
| Oriflame Cosmetics SA | 151,758 | 9,193 |
| Eniro AB | 668,177 | 8,578 |
| Trelleborg AB B Shares | 329,044 | 8,415 |
| Kungsleden AB | 538,182 | 7,706 |
| Castellum AB | 582,004 | 7,406 |
| Fabege AB | 618,004 | 7,382 |
| D. Carnegie & Co. AB | 328,940 | 7,303 |
| Elekta AB B Shares | 326,755 | 6,322 |
* | SAS AB | 278,733 | 4,892 |
| Securitas Systems | | |
| AB B Shares | 1,181,965 | 4,752 |
| Holmen AB | 116,838 | 4,609 |
| Securitas AB B Shares | 316,355 | 4,002 |
| Axfood AB | 109,214 | 3,861 |
* | Securitas Direct | | |
| AB B Shares | 1,209,804 | 3,622 |
| Billerud Aktiebolag | 226,802 | 2,739 |
| Wihlborgs Fastigheter AB | 128,454 | 2,484 |
| Hoganas AB B Shares | 93,774 | 2,260 |
* | Eniro AB | | |
| Rights Exp. 11/19/07 | 663,753 | 191 |
| | | 1,317,118 |
Switzerland (9.4%) | | |
| Nestle SA (Registered) | 1,507,482 | 696,279 |
| Novartis AG (Registered) | 8,725,822 | 464,164 |
| Roche Holdings AG | 2,642,888 | 451,414 |
| UBS AG | 7,452,452 | 399,543 |
| Credit Suisse Group | | |
| (Registered) | 4,115,453 | 278,110 |
27
| | | Market |
| | | Value• |
| | Shares | ($000) |
| ABB Ltd. | 7,900,339 | 238,830 |
| Cie. Financiere | | |
| Richemont AG | 1,963,700 | 140,430 |
| Zurich Financial Services AG | 460,864 | 139,150 |
| Swiss Re (Registered) | 1,338,124 | 125,808 |
| Syngenta AG | 391,427 | 94,684 |
| Holcim Ltd. (Registered) | 754,915 | 86,302 |
| Swatch Group AG (Bearer) | 121,784 | 38,988 |
| Swiss Life Holding | 127,028 | 35,164 |
| Swisscom AG | 85,330 | 31,583 |
| Adecco SA (Registered) | 497,091 | 29,970 |
| Synthes, Inc. | 223,205 | 27,870 |
* | Logitech International SA | 706,737 | 24,609 |
| Givaudan SA | 24,623 | 24,221 |
| SGS Societe Generale de | | |
| Surveillance Holding SA | | |
| (Registered) | 17,662 | 23,201 |
| Kuehne & Nagel | | |
| International AG | 203,161 | 21,833 |
| Lonza AG (Registered) | 170,729 | 19,917 |
| Sonova Holding AG | 174,673 | 19,663 |
| Nobel Biocare Holding AG | 66,178 | 19,320 |
* | OC Oerlikon Corp AG | 38,433 | 18,324 |
| Sulzer AG (Registered) | 10,941 | 17,585 |
| Geberit AG | 126,215 | 17,072 |
| Schindler Holding AG | | |
| (Bearer Participation | | |
| Certificates) | 191,491 | 13,426 |
| CIBA Specialty | | |
| Chemicals AG (Registered) | 266,581 | 13,279 |
| Swatch Group AG | | |
| (Registered) | 197,790 | 12,447 |
| Rieter Holding AG | 17,095 | 9,943 |
| PSP Swiss Property AG | 180,592 | 9,789 |
| Straumann Holding AG | 29,171 | 8,154 |
| Kuoni Reisen Holding AG | | |
| (Registered) | 13,512 | 6,765 |
| UBS AG (New York Shares) | 70,740 | 3,798 |
| Kudelski SA | 133,163 | 3,760 |
| Clariant AG | 135,005 | 1,729 |
| | | 3,567,124 |
United Kingdom (32.6%) | | |
| BP PLC | 68,536,539 | 891,662 |
| HSBC Holdings PLC | 44,054,589 | 873,457 |
| Vodafone Group PLC | 188,571,796 | 743,076 |
| GlaxoSmithKline PLC | 21,507,908 | 552,452 |
| Royal Dutch Shell PLC | | |
| Class B | 10,380,109 | 452,882 |
| Royal Bank of Scotland | | |
| Group PLC | 37,665,107 | 406,784 |
| Royal Dutch Shell PLC | | |
| Class A | | |
28
| | | Market |
| | | Value• |
| | Shares | ($000) |
| (Amsterdam Shares) | 8,492,604 | 372,615 |
| Rio Tinto PLC | 3,766,908 | 353,242 |
| Anglo American PLC | 5,059,177 | 351,906 |
| BHP Billiton PLC | 8,688,824 | 333,695 |
| Barclays PLC | 24,618,259 | 311,580 |
| Tesco PLC | 29,827,896 | 303,428 |
| AstraZeneca Group PLC | 5,627,965 | 277,150 |
| HBOS PLC | 14,097,588 | 256,972 |
| Lloyds TSB Group PLC | 21,214,394 | 240,986 |
| BG Group PLC | 12,772,456 | 236,812 |
| Royal Dutch Shell PLC | | |
| Class A | 5,314,307 | 233,087 |
| Diageo PLC | 10,012,617 | 229,726 |
| British American | | |
| Tobacco PLC | 5,775,746 | 220,042 |
| BT Group PLC | 26,427,922 | 179,637 |
| Xstrata PLC | 2,375,952 | 171,320 |
| National Grid Transco PLC | 10,149,501 | 167,883 |
| Unilever PLC | 4,928,301 | 167,116 |
| Aviva PLC | 9,771,439 | 153,954 |
| Prudential PLC | 9,253,511 | 151,170 |
| Reckitt Benckiser | | |
| Group PLC | 2,293,634 | 133,238 |
| BAE Systems PLC | 12,682,682 | 131,762 |
| Imperial Tobacco | | |
| Group PLC | 2,548,576 | 129,364 |
| Centrica PLC | 13,805,811 | 106,112 |
| Cadbury Schweppes PLC | 7,909,268 | 105,211 |
| Scottish & Southern | | |
| Energy PLC | 3,242,683 | 105,153 |
| SABMiller PLC | 3,392,062 | 102,173 |
| Marks & Spencer | | |
| Group PLC | 6,405,120 | 87,077 |
| Man Group PLC | 6,798,093 | 83,543 |
| Old Mutual PLC | 20,296,525 | 77,907 |
| Rolls-Royce Group PLC | 6,795,270 | 76,235 |
| Legal & General | | |
| Group PLC | 24,580,770 | 71,761 |
| J. Sainsbury PLC | 5,880,675 | 67,036 |
| Reed Elsevier PLC | 4,813,772 | 63,147 |
| Land Securities Group PLC | 1,810,815 | 62,086 |
29
| | | Market |
| | | Value• |
| | Shares | ($000) |
| Imperial Chemical | | |
| Industries PLC | 4,496,869 | 61,671 |
| British Sky Broadcasting | | |
| Group PLC | 4,285,618 | 60,694 |
| Reuters Group PLC | 4,243,382 | 58,505 |
| International Power PLC | 5,643,102 | 57,536 |
| WPP Group PLC | 3,977,722 | 54,420 |
| Compass Group PLC | 7,492,827 | 54,052 |
| United Utilities PLC | 3,310,496 | 50,332 |
| Scottish & Newcastle PLC | 3,021,582 | 49,298 |
| Smith & Nephew PLC | 3,509,432 | 47,527 |
| Invesco PLC | 3,005,500 | 46,005 |
| British Land Co., PLC | 2,001,648 | 45,284 |
| BP PLC ADR | 575,360 | 44,872 |
| British Energy Group PLC | 3,861,558 | 42,892 |
| Vodafone Group PLC ADR | 1,030,225 | 40,457 |
| Experian Group Ltd. | 3,845,957 | 40,441 |
| Resolution PLC | 2,579,749 | 39,222 |
| Next PLC | 845,550 | 38,959 |
| Pearson PLC | 2,213,298 | 36,911 |
| Standard Life PLC | 6,206,621 | 36,827 |
| Kingfisher PLC | 8,810,802 | 36,263 |
| Capita Group PLC | 2,275,321 | 35,532 |
| Smiths Group PLC | 1,447,646 | 34,051 |
* | 3i Group PLC | 1,475,359 | 33,381 |
| Carnival PLC | 697,861 | 32,666 |
| ITV PLC | 15,276,022 | 31,578 |
| Home Retail Group | 3,461,877 | 31,474 |
| Johnson Matthey PLC | 816,816 | 30,406 |
| Royal & Sun Alliance | | |
| Insurance Group PLC | 8,984,598 | 29,604 |
| Rexam PLC | 2,531,860 | 28,613 |
| Whitbread PLC | 742,034 | 27,409 |
| FirstGroup PLC | 1,636,700 | 27,175 |
| Severn Trent PLC | 892,852 | 26,978 |
| Enterprise Inns PLC | 2,026,953 | 26,625 |
| Rentokil Initial PLC | 6,826,648 | 24,501 |
| ICAP PLC | 2,005,172 | 24,484 |
| Cable and Wireless PLC | 6,017,202 | 24,451 |
| Amec PLC | 1,256,954 | 21,903 |
| Burberry Group PLC | 1,646,645 | 21,128 |
| London Stock | | |
| Exchange PLC | 596,022 | 20,888 |
| Ladbrokes PLC | 2,369,162 | 20,357 |
| GKN PLC | 2,650,448 | 20,287 |
| Yell Group PLC | 2,080,508 | 19,728 |
| LogicaCMG PLC | 5,788,691 | 19,652 |
| Liberty International PLC | 781,301 | 19,485 |
| Bunzl PLC | 1,271,215 | 19,170 |
| Group 4 Securicor PLC | 4,336,207 | 19,167 |
30
| | | Market |
| | | Value• |
| | Shares | ($000) |
| Cobham PLC | 4,274,818 | 18,773 |
| DSG International PLC | 6,940,379 | 18,745 |
| Friends Provident PLC | 4,842,359 | 18,589 |
| Investec PLC | 1,523,370 | 18,498 |
| Inchcape PLC | 1,834,373 | 18,022 |
| Meggitt PLC | 2,462,707 | 17,536 |
| Kelda Group PLC | 881,148 | 17,430 |
| William Hill PLC | 1,328,330 | 17,158 |
| Serco Group PLC | 1,801,664 | 16,946 |
| Balfour Beatty PLC | 1,622,689 | 16,808 |
| Hammerson PLC | 715,641 | 16,592 |
| Wolseley PLC | 952,524 | 16,567 |
* | British Airways PLC | 1,780,681 | 16,559 |
| Mitchells & Butlers PLC | 1,146,622 | 15,926 |
| Punch Taverns PLC | 758,268 | 15,899 |
| InterContinental | | |
| Hotels Group PLC | 673,837 | 15,734 |
| Hays PLC | 5,472,242 | 15,674 |
| ARM Holdings PLC | 5,008,293 | 15,454 |
* | Invensys PLC | 2,211,811 | 15,100 |
| EMAP PLC | 812,236 | 14,855 |
| Kesa Electricals PLC | 2,231,557 | 14,816 |
| IMI PLC | 1,252,268 | 14,685 |
| United Business Media PLC | 955,256 | 14,530 |
* | Charter PLC | 626,652 | 14,179 |
| Cookson Group PLC | 797,395 | 13,868 |
| The Sage Group PLC | 2,743,452 | 13,844 |
| Schroders PLC | 424,841 | 13,654 |
| National Express Group PLC | 494,329 | 13,596 |
| Persimmon PLC | 617,155 | 13,505 |
| Arriva PLC | 746,020 | 13,055 |
| Mondi PLC | 1,396,563 | 12,944 |
| Intertek Testing | | |
| Services PLC | 590,911 | 12,674 |
* | TUI Travel PLC | 2,261,278 | 12,672 |
| Aggreko PLC | 963,405 | 12,606 |
| Carphone Warehouse PLC | 1,683,627 | 12,340 |
* | Thomas Cook Group PLC | 1,839,057 | 11,472 |
| Michael Page | | |
| International PLC | 1,246,643 | 11,395 |
| The Berkeley Group | | |
| Holdings PLC | 318,139 | 11,305 |
| Stagecoach Group PLC | 2,000,734 | 11,300 |
| De La Rue PLC Group | 564,382 | 9,648 |
| Aegis Group PLC | 3,635,496 | 9,572 |
| Misys PLC | 1,890,424 | 9,566 |
| Tate & Lyle PLC | 1,031,424 | 9,360 |
| Taylor Wimpey PLC | 1,757,810 | 9,093 |
| Signet Group PLC | 4,666,405 | 8,801 |
| Daily Mail and | | |
31
| | | Market |
| | | Value• |
| | Shares | ($000) |
| General Trust PLC | 682,484 | 8,721 |
| Biffa PLC | 1,426,499 | 7,741 |
| SSL International PLC | 717,410 | 7,706 |
| The Davis | | |
| Service Group PLC | 643,410 | 7,310 |
| Barratt Developments PLC | 511,570 | 6,966 |
* | CSR PLC | 493,603 | 6,657 |
| Bellway PLC | 288,404 | 6,475 |
| Segro PLC | 647,764 | 6,306 |
| Tullett Prebon PLC | 678,527 | 6,264 |
| Cattles PLC | 835,387 | 5,954 |
| WPP Group PLC ADR | 78,406 | 5,394 |
| Great Portland Estates PLC | 441,870 | 5,269 |
| Tomkins PLC | 1,066,213 | 4,941 |
| Close Brothers Group PLC | 287,841 | 4,614 |
| Brixton PLC | 556,177 | 4,302 |
| Bovis Homes Group PLC | 270,784 | 3,750 |
| Electrocomponents PLC | 662,188 | 3,456 |
| Rank Group PLC | 1,474,288 | 3,152 |
* | PartyGaming PLC | 4,468,698 | 2,910 |
| BBA Aviation PLC | 540,730 | 2,723 |
* | Galiform PLC | 1,115,133 | 2,675 |
| Travis Perkins PLC | 53,544 | 1,625 |
| FKI PLC | 618,919 | 1,198 |
| Premier Farnell PLC | 255,646 | 863 |
| Trinity Mirror PLC | 37,479 | 314 |
| | | 12,405,931 |
Total Common Stocks | | |
(Cost $24,365,475) | | 37,812,711 |
Temporary Cash Investments (0.3%)1 | |
Money Market Fund (0.3%) | | |
2 Vanguard Market Liquidity | |
Fund, 4.955% | 139,256,337 | 139,256 |
| | |
| Face | |
| Amount | |
| ($000) | |
U.S. Agency Obligations (0.0%) | |
3 Federal Home Loan Bank | | |
4 4.656%, 1/29/08 | 7,000 | 6,922 |
Total Temporary Cash Investments | |
(Cost $146,177) | | 146,178 |
Total Investments (99.7%) | | |
(Cost $24,511,652) | | 37,958,889 |
Other Assets and Liabilities (0.3%) | |
Other Assets—Note B | | 965,133 |
Liabilities | | (867,613) |
| | 97,520 |
Net Assets (100%) | | 38,056,409 |
32
At October 31, 2007, net assets consisted of:5 |
| |
| Amount |
| ($000) |
Paid-in Capital | 23,674,255 |
Undistributed Net Investment Income | 954,677 |
Accumulated Net Realized Losses | (29,788) |
Unrealized Appreciation | | |
Investment Securities | | 13,447,237 |
Futures Contracts | | 4,563 |
Foreign Currencies and | | |
Forward Currency Contracts | 5,465 |
Net Assets | | 38,056,409 |
| Amount |
| ($000) |
Investor Shares—Net Assets | |
Applicable to 603,003,373 outstanding | |
$.001 par value shares of beneficial | |
interest (unlimited authorization) | 26,187,542 |
Net Asset Value Per Share— | |
Investor Shares | $43.43 |
| |
| |
Admiral Shares—Net Assets | |
Applicable to 28,941,744 outstanding | |
$.001 par value shares of beneficial | |
interest (unlimited authorization) | 2,954,761 |
Net Asset Value Per Share— | |
Admiral Shares | $102.09 |
| |
| |
Signal Shares—Net Assets | |
Applicable to 12,720,759 outstanding | |
$.001 par value shares of beneficial | |
interest (unlimited authorization) | 502,496 |
Net Asset Value Per Share— | |
Signal Shares | $39.50 |
| |
| |
Institutional Shares—Net Assets | |
Applicable to 120,956,241 outstanding | |
$.001 par value shares of beneficial | |
interest (unlimited authorization) | 5,263,265 |
Net Asset Value Per Share— | |
Institutional Shares | $43.51 |
| |
| |
ETF Shares—Net Assets | |
Applicable to 38,556,342 outstanding | |
$.001 par value shares of beneficial | |
interest (unlimited authorization) | 3,148,345 |
Net Asset Value Per Share— | |
ETF Shares | $81.66 |
33
• See Note A in Notes to Financial Statements.
* Non-income-producing security.
1 The fund invests a portion of its cash reserves in equity markets through the use of index futures contracts. After giving effect to futures investments, the fund’s effective common stock and temporary cash investment positions represent 99.8% and –0.1%, respectively, of net assets. See Note D in Notes to Financial Statements.
2 Affiliated money market fund available only to Vanguard funds and certain trusts and accounts managed by Vanguard. Rate shown is the 7-day yield.
3 The issuer operates under a congressional charter; its securities are neither issued nor guaranteed by the U.S. government. If needed, access to additional funding from the U.S. Treasury (beyond the issuer’s line of credit) would require congressional action.
4 Securities with a value of $6,922,000 have been segregated as initial margin for open futures contracts.
5 See Note D in Notes to Financial Statements for the tax-basis components of net assets.
ADR—American Depositary Receipt.
34
European Stock Index Fund
Statement of Operations
| Year Ended |
| October 31, 2007 |
| ($000) |
Investment Income | |
Income | |
Dividends1 | 1,059,481 |
Interest2 | 6,871 |
Security Lending | 28,608 |
Total Income | 1,094,960 |
Expenses | |
The Vanguard Group—Note B | |
Investment Advisory Services | 757 |
Management and Administrative—Investor Shares | 35,972 |
Management and Administrative—Admiral Shares | 2,204 |
Management and Administrative—Signal Shares | 57 |
Management and Administrative—Institutional Shares | 1,673 |
Management and Administrative—ETF Shares | 1,469 |
Marketing and Distribution—Investor Shares | 5,036 |
Marketing and Distribution—Admiral Shares | 401 |
Marketing and Distribution—Signal Shares | 1 |
Marketing and Distribution—Institutional Shares | 1,019 |
Marketing and Distribution—ETF Shares | 497 |
Custodian Fees | 7,159 |
Auditing Fees | 40 |
Shareholders’ Reports—Investor Shares | 179 |
Shareholders’ Reports—Admiral Shares | 11 |
Shareholders’ Reports—Signal Shares | 1 |
Shareholders’ Reports—Institutional Shares | 1 |
Shareholders’ Reports—ETF Shares | 54 |
Trustees’ Fees and Expenses | 32 |
Total Expenses | 56,563 |
Expenses Paid Indirectly—Note C | (602) |
Net Expenses | 55,961 |
Net Investment Income | 1,038,999 |
Realized Net Gain (Loss) | |
Investment Securities Sold | 71,281 |
Futures Contracts | 8,670 |
Foreign Currencies and Forward Currency Contracts | 17,392 |
Realized Net Gain (Loss) | 97,343 |
Change in Unrealized Appreciation (Depreciation) | |
Investment Securities | 6,488,532 |
Futures Contracts | 382 |
Foreign Currencies and Forward Currency Contracts | 4,850 |
Change in Unrealized Appreciation (Depreciation) | 6,493,764 |
Net Increase (Decrease) in Net Assets Resulting from Operations | 7,630,106 |
1 Dividends are net of foreign withholding taxes of $58,163,000.
2 Interest income from an affiliated company of the fund was $6,174,000.
35
European Stock Index Fund
Statement of Changes in Net Assets
| Year Ended October 31, |
| 2007 | 2006 |
| ($000) | ($000) |
Increase (Decrease) in Net Assets | | |
Operations | | |
Net Investment Income | 1,038,999 | 618,399 |
Realized Net Gain (Loss) | 97,343 | 436,790 |
Change in Unrealized Appreciation (Depreciation) | 6,493,764 | 3,893,796 |
Net Increase (Decrease) in Net Assets Resulting from Operations | 7,630,106 | 4,948,985 |
Distributions | | |
Net Investment Income | | |
Investor Shares | (460,764) | (283,561) |
Admiral Shares | (62,628) | (37,265) |
Signal Shares | (341) | — |
Institutional Shares | (90,854) | (50,291) |
ETF Shares | (39,981) | (7,061) |
Realized Capital Gain | | |
Investor Shares | — | — |
Admiral Shares | — | — |
Signal Shares | — | — |
Institutional Shares | — | — |
ETF Shares | — | — |
Total Distributions | (654,568) | (378,178) |
Capital Share Transactions—Note F | | |
Investor Shares | 4,446,099 | 2,675,066 |
Admiral Shares | 162,740 | 374,593 |
Signal Shares | 467,826 | 11,714 |
Institutional Shares | 1,192,242 | 708,374 |
ETF Shares | 1,456,669 | 890,919 |
Net Increase (Decrease) from Capital Share Transactions | 7,725,576 | 4,660,666 |
Total Increase (Decrease) | 14,701,114 | 9,231,473 |
Net Assets | | |
Beginning of Period | 23,355,295 | 14,123,822 |
End of Period1 | 38,056,409 | 23,355,295 |
1 Net Assets—End of Period includes undistributed net investment income of $954,677,000 and $554,797,000.
36
European Stock Index Fund
Financial Highlights
Investor Shares | | | | | |
| | | | | |
| | | | | |
| Year Ended October 31, |
For a Share Outstanding Throughout Each Period | 2007 | 2006 | 2005 | 2004 | 2003 |
Net Asset Value, Beginning of Period | $34.67 | $27.00 | $23.77 | $19.93 | $16.44 |
Investment Operations | | | | | |
Net Investment Income | 1.2981 | .92 | .67 | .54 | .44 |
Net Realized and Unrealized Gain (Loss) | | | | | |
on Investments | 8.386 | 7.45 | 3.14 | 3.76 | 3.45 |
Total from Investment Operations | 9.684 | 8.37 | 3.81 | 4.30 | 3.89 |
Distributions | | | | | |
Dividends from Net Investment Income | (.924) | (.70) | (.58) | (.46) | (.40) |
Distributions from Realized Capital Gains | — | — | — | — | — |
Total Distributions | (.924) | (.70) | (.58) | (.46) | (.40) |
Net Asset Value, End of Period | $43.43 | $34.67 | $27.00 | $23.77 | $19.93 |
| | | | | |
| | | | | |
Total Return2 | 28.49% | 31.63% | 16.21% | 21.89% | 24.27% |
| | | | | |
| | | | | |
Ratios/Supplemental Data | | | | | |
Net Assets, End of Period (Millions) | $26,188 | $16,850 | $10,759 | $7,904 | $5,339 |
Ratio of Total Expenses to | | | | | |
Average Net Assets | 0.22% | 0.27% | 0.27% | 0.27% | 0.32% |
Ratio of Net Investment Income to | | | | | |
Average Net Assets | 3.35% | 3.35% | 2.84% | 2.67% | 2.76% |
Portfolio Turnover Rate3 | 9% | 6% | 5% | 5% | 6% |
1 Calculated based on average shares outstanding.
2 Total returns do not reflect the 2% fee assessed on redemptions of shares purchased on or after June 27, 2003, and held for less than two months or the account service fee that may be applicable to certain accounts with balances below $10,000.
3 Excludes the value of portfolio securities received or delivered as a result of in-kind purchases or redemptions of the fund’s capital shares, including ETF Creation Units.
37
European Stock Index Fund
Admiral Shares | | | | | |
| | | | | |
| | | | | |
| Year Ended October 31, |
For a Share Outstanding Throughout Each Period | 2007 | 2006 | 2005 | 2004 | 2003 |
Net Asset Value, Beginning of Period | $81.50 | $63.44 | $55.84 | $46.82 | $38.61 |
Investment Operations | | | | | |
Net Investment Income | 3.1401 | 2.23 | 1.611 | 1.308 | 1.070 |
Net Realized and Unrealized Gain (Loss) | | | | | |
on Investments | 19.692 | 17.51 | 7.396 | 8.830 | 8.115 |
Total from Investment Operations | 22.832 | 19.74 | 9.007 | 10.138 | 9.185 |
Distributions | | | | | |
Dividends from Net Investment Income | (2.242) | (1.68) | (1.407) | (1.118) | (.975) |
Distributions from Realized Capital Gains | — | — | — | — | — |
Total Distributions | (2.242) | (1.68) | (1.407) | (1.118) | (.975) |
Net Asset Value, End of Period | $102.09 | $81.50 | $63.44 | $55.84 | $46.82 |
| | | | | |
| | | | | |
Total Return2 | 28.59% | 31.77% | 16.32% | 21.98% | 24.42% |
| | | | | |
| | | | | |
Ratios/Supplemental Data | | | | | |
Net Assets, End of Period (Millions) | $2,955 | $2,175 | $1,360 | $628 | $447 |
Ratio of Total Expenses to | | | | | |
Average Net Assets | 0.12% | 0.17% | 0.18% | 0.18% | 0.23% |
Ratio of Net Investment Income to | | | | | |
Average Net Assets | 3.45% | 3.45% | 2.93% | 2.76% | 2.84% |
Portfolio Turnover Rate3 | 9% | 6% | 5% | 5% | 6% |
1 Calculated based on average shares outstanding.
2 Total returns do not reflect the 2% fee assessed on redemptions of shares purchased on or after June 27, 2003, and held for less than two months.
3 Excludes the value of portfolio securities received or delivered as a result of in-kind purchases or redemptions of the fund’s capital shares, including ETF Creation Units.
38
European Stock Index Fund
Signal Shares | | |
| Year | Oct. 6, |
| Ended | 20061 to |
| October 31, | Oct. 31, |
For a Share Outstanding Throughout Each Period | 2007 | 2006 |
Net Asset Value, Beginning of Period | $31.51 | $30.41 |
Investment Operations | | |
Net Investment Income | 1.1512 | .012 |
Net Realized and Unrealized Gain (Loss) on Investments | 7.681 | 1.09 |
Total from Investment Operations | 8.832 | 1.10 |
Distributions | | |
Dividends from Net Investment Income | (.842) | — |
Distributions from Realized Capital Gains | — | — |
Total Distributions | (.842) | — |
Net Asset Value, End of Period | $39.50 | $31.51 |
| | |
| | |
Total Return3 | 28.59% | 3.62% |
| | |
| | |
Ratios/Supplemental Data | | |
Net Assets, End of Period (Millions) | $502 | $12 |
Ratio of Total Expenses to Average Net Assets | 0.12% | 0.17%* |
Ratio of Net Investment Income to Average Net Assets | 3.45% | 3.45%* |
Portfolio Turnover Rate4 | 9% | 6% |
1 Inception.
2 Calculated based on average shares outstanding.
3 Total returns do not reflect the 2% fee assessed on redemptions of shares held for less than two months.
4 Excludes the value of portfolio securities received or delivered as a result of in-kind purchases or redemptions of the fund’s capital shares, including ETF Creation Units.
* Annualized.
39
European Stock Index Fund
Institutional Shares | | | | | |
| | | | | |
| | | | | |
| Year Ended October 31, |
For a Share Outstanding Throughout Each Period | 2007 | 2006 | 2005 | 2004 | 2003 |
Net Asset Value, Beginning of Period | $34.74 | $27.05 | $23.80 | $19.96 | $16.46 |
Investment Operations | | | | | |
Net Investment Income | 1.351 | .978 | .721 | .57 | .471 |
Net Realized and Unrealized Gain (Loss) | | | | | |
on Investments | 8.39 | 7.450 | 3.140 | 3.76 | 3.454 |
Total from Investment Operations | 9.74 | 8.428 | 3.861 | 4.33 | 3.925 |
Distributions | | | | | |
Dividends from Net Investment Income | (.97) | (.738) | (.611) | (.49) | (.425) |
Distributions from Realized Capital Gains | — | — | — | — | — |
Total Distributions | (.97) | (.738) | (.611) | (.49) | (.425) |
Net Asset Value, End of Period | $43.51 | $34.74 | $27.05 | $23.80 | $19.96 |
| | | | | |
| | | | | |
Total Return2 | 28.63% | 31.83% | 16.42% | 22.03% | 24.49% |
| | | | | |
| | | | | |
Ratios/Supplemental Data | | | | | |
Net Assets, End of Period (Millions) | $5,263 | $3,113 | $1,827 | $988 | $649 |
Ratio of Total Expenses to | | | | | |
Average Net Assets | 0.09% | 0.12% | 0.12% | 0.12% | 0.17% |
Ratio of Net Investment Income to | | | | | |
Average Net Assets | 3.48% | 3.50% | 2.99% | 2.77% | 2.96% |
Portfolio Turnover Rate3 | 9% | 6% | 5% | 5% | 6% |
1 Calculated based on average shares outstanding.
2 Total returns do not reflect the 2% fee assessed on redemptions of shares purchased on or after June 27, 2003, and held for less than two months.
3 Excludes the value of portfolio securities received or delivered as a result of in-kind purchases or redemptions of the fund’s capital shares, including ETF Creation Units.
40
European Stock Index Fund
ETF Shares | | | | |
| | | | |
| | | | March 4, |
| | Year Ended | | 20051 to |
| | October 31, | | Oct. 31, |
For a Share Outstanding Throughout Each Period | 2007 | 2006 | | 2005 |
Net Asset Value, Beginning of Period | $65.21 | $50.80 | | $50.96 |
Investment Operations | | | | |
Net Investment Income | 2.5762 | 1.80 | | 1.04 |
Net Realized and Unrealized Gain (Loss) on Investments | 15.683 | 13.99 | | (1.20) |
Total from Investment Operations | 18.259 | 15.79 | | (.16) |
Distributions | | | | |
Dividends from Net Investment Income | (1.809) | (1.38) | | — |
Distributions from Realized Capital Gains | — | — | | — |
Total Distributions | (1.809) | (1.38) | | — |
Net Asset Value, End of Period | $81.66 | $65.21 | | $50.80 |
| | | | |
| | | | |
Total Return | 28.60% | 31.75% | | –0.31% |
| | | | |
| | | | |
Ratios/Supplemental Data | | | | |
Net Assets, End of Period (Millions) | $3,148 | $1,205 | | $178 |
Ratio of Total Expenses to Average Net Assets | 0.12% | 0.18% | | 0.18%* |
Ratio of Net Investment Income to Average Net Assets | 3.45% | 3.44% | | 2.93%* |
Portfolio Turnover Rate3 | 9% | 6% | | 5% |
1 Inception.
2 Calculated based on average shares outstanding.
3 Excludes the value of portfolio securities received or delivered as a result of in-kind purchases or redemptions of the fund’s capital shares, including ETF Creation Units.
* Annualized.
See accompanying Notes, which are an integral part of the Financial Statements.
41
European Stock Index Fund
Notes to Financial Statements
Vanguard European Stock Index Fund is registered under the Investment Company Act of 1940 as an open-end investment company, or mutual fund. The fund files reports with the SEC under the company name Vanguard International Equity Index Funds. The fund invests in securities of foreign issuers, which may subject it to investment risks not normally associated with investing in securities of U.S. corporations. The fund offers five classes of shares: Investor Shares, Admiral Shares, Signal Shares, Institutional Shares, and ETF Shares. Investor Shares are available to any investor who meets the fund’s minimum purchase requirements. Admiral Shares are designed for investors who meet certain administrative, service, tenure, and account-size criteria. Signal Shares are designed for institutional investors who meet certain administrative, service, and account-size criteria. Institutional Shares are designed for investors who meet certain administrative and service criteria and invest a minimum of $5 million. ETF Shares are listed for trading on the American Stock Exchange; they can be purchased and sold through a broker.
A. The following significant accounting policies conform to generally accepted accounting principles for U.S. mutual funds. The fund consistently follows such policies in preparing its financial statements.
1. Security Valuation: Securities are valued as of the close of trading on the New York Stock Exchange (generally 4 p.m., Eastern time) on the valuation date. Equity securities are valued at the latest quoted sales prices or official closing prices taken from the primary market in which each security trades; such securities not traded on the valuation date are valued at the mean of the latest quoted bid and asked prices. Securities for which market quotations are not readily available, or whose values have been affected by events occurring before the fund’s pricing time but after the close of the securities’ primary markets, are valued at their fair values calculated according to procedures adopted by the board of trustees. These procedures include obtaining quotations from an independent pricing service, monitoring news to identify significant market- or security-specific events, and evaluating changes in the values of foreign market proxies (for example, ADRs, futures contracts, or exchange-traded funds), between the time the foreign markets close and the fund’s pricing time. When fair-value pricing is employed, the prices of securities used by a fund to calculate its net asset value may differ from quoted or published prices for the same securities. Investments in Vanguard Market Liquidity Fund are valued at that fund’s net asset value. Temporary cash investments acquired over 60 days to maturity are valued using the latest bid prices or using valuations based on a matrix system (which considers such factors as security prices, yields, maturities, and ratings), both as furnished by independent pricing services. Other temporary cash investments are valued at amortized cost, which approximates market value.
2. Foreign Currency: Securities and other assets and liabilities denominated in foreign currencies are translated into U.S. dollars using exchange rates obtained from an independent third party as of the fund’s pricing time on the valuation date. Realized gains (losses) and unrealized appreciation (depreciation) on investment securities include the effects of changes in exchange rates since the securities were purchased, combined with the effects of changes in security prices. Fluctuations in the value of other assets and liabilities resulting from changes in exchange rates are recorded as unrealized foreign currency gains (losses) until the assets or liabilities are settled in cash, at which time they are recorded as realized foreign currency gains (losses).
3. Futures and Forward Currency Contracts: The fund uses index futures contracts to a limited extent, with the objectives of maintaining full exposure to the stock market, enhancing returns, maintaining liquidity, and minimizing transaction costs. The fund may purchase futures contracts to immediately invest incoming cash in the market, or sell futures in response to cash outflows, thereby simulating a fully invested position in the underlying index while maintaining a
42
European Stock Index Fund
cash balance for liquidity. The fund may seek to enhance returns by using futures contracts instead of the underlying securities when futures are believed to be priced more attractively than the
underlying securities. The primary risks associated with the use of futures contracts are imperfect correlation between changes in market values of stocks held by the fund and the prices of futures contracts, and the possibility of an illiquid market.
The fund also may enter into forward currency contracts to provide the appropriate currency exposure related to any open futures contracts. The fund’s risks in using these contracts include movement in the values of the foreign currencies relative to the U.S. dollar and the ability of the counterparties to fulfill their obligations under the contracts.
Futures and forward currency contracts are valued at their quoted daily settlement prices. The aggregate principal amounts of the contracts are not recorded in the Statement of Net Assets. Fluctuations in the value of the contracts are recorded in the Statement of Net Assets as an asset (liability) and in the Statement of Operations as unrealized appreciation (depreciation) until the contracts are closed, when they are recorded as realized gains (losses) on futures or forward currency contracts.
4. Federal Income Taxes: The fund intends to continue to qualify as a regulated investment company and distribute all of its taxable income. Accordingly, no provision for federal income taxes is required in the financial statements.
5. Distributions: Distributions to shareholders are recorded on the ex-dividend date.
6. Security Lending: The fund may lend its securities to qualified institutional borrowers to earn additional income. Security loans are required to be secured at all times by collateral at least equal to the market value of securities loaned. The fund invests cash collateral received in Vanguard Market Liquidity Fund, and records a liability for the return of the collateral, during the period the securities are on loan. Security lending income represents the income earned on investing cash collateral, less expenses associated with the loan.
7. Other: Dividend income is recorded on the ex-dividend date. Interest income includes income distributions received from Vanguard Market Liquidity Fund and is accrued daily. Security transactions are accounted for on the date securities are bought or sold. Costs used to determine realized gains (losses) on the sale of investment securities are those of the specific securities sold. Fees assessed on redemptions of capital shares are credited to paid-in capital.
Each class of shares has equal rights as to assets and earnings, except that each class separately bears certain class-specific expenses related to maintenance of shareholder accounts (included in Management and Administrative expenses) and shareholder reporting. Marketing and distribution expenses are allocated to each class of shares based on a method approved by the board of trustees. Income, other non-class-specific expenses, and gains and losses on investments are allocated to each class of shares based on its relative net assets.
B. The Vanguard Group furnishes at cost investment advisory, corporate management, administrative, marketing, and distribution services. The costs of such services are allocated to the fund under methods approved by the board of trustees. The fund has committed to provide up to 0.40% of its net assets in capital contributions to Vanguard. At October 31, 2007, the fund had contributed capital of $3,021,000 to Vanguard (included in Other Assets), representing 0.01% of the fund’s net assets and 3.02% of Vanguard’s capitalization. The fund’s trustees and officers are also directors and officers of Vanguard.
43
European Stock Index Fund
C. The fund’s custodian bank has agreed to reduce its fees when the fund maintains cash on deposit in the non-interest-bearing custody account. For the year ended October 31, 2007, custodian fee offset arrangements reduced the fund’s expenses by $602,000.
D. Distributions are determined on a tax basis and may differ from net investment income and realized capital gains for financial reporting purposes. Differences may be permanent or temporary. Permanent differences are reclassified among capital accounts in the financial statements to reflect their tax character. Temporary differences arise when certain items of income, expense, gain, or loss are recognized in different periods for financial statement and tax purposes; these differences will reverse at some time in the future. Differences in classification may also result from the treatment of short-term gains as ordinary income for tax purposes.
During the year ended October 31, 2007, the fund realized net foreign currency gains of $7,800,000, which increased distributable net income for tax purposes; accordingly, such gains have been reclassified from accumulated net realized losses to undistributed net investment income. Certain of the fund’s investments are in securities considered to be “passive foreign investment companies,” for which any unrealized appreciation and/or realized gains are required to be included in distributable net income for tax purposes. During the year ended October 31, 2007, the fund realized gains on the sale of passive foreign investment companies of $7,649,000, which have been included in current and prior periods’ taxable income; accordingly, such gains have been reclassified from accumulated net realized losses to undistributed net investment income. Unrealized appreciation on the fund’s passive foreign investment company holdings at October 31, 2007, was $19,314,000, of which $17,126,000 has been distributed and is reflected in the balance of undistributed net income.
During the year ended October 31, 2007, the fund realized $33,426,000 of net capital gains resulting from in-kind redemptions—in which shareholders exchanged fund shares for securities held by the fund rather than for cash. Because such gains are not taxable to the fund, and are not distributed to shareholders, they have been reclassified from accumulated net realized losses to paid-in capital.
For tax purposes, at October 31, 2007, the fund had $997,169,000 of ordinary income available for distribution. The fund had available realized losses of $13,739,000 to offset future net capital gains through October 31, 2011.
At October 31, 2007, the cost of investment securities for tax purposes was $24,541,847,000. Net unrealized appreciation of investment securities for tax purposes was $13,417,042,000, consisting of unrealized gains of $13,471,347,000 on securities that had risen in value since their purchase and $54,305,000 in unrealized losses on securities that had fallen in value since their purchase.
44
European Stock Index Fund
At October 31, 2007, the aggregate settlement value of open futures contracts expiring in December 2007 and the related unrealized appreciation (depreciation) were:
| | | ($000) |
| | Aggregate | Unrealized |
| Number of | Settlement | Appreciation |
Futures Contracts | Long Contracts | Value | (Depreciation) |
MSCI Pan-Euro Index | 4,425 | 167,217 | 4,563 |
At October 31, 2007, the fund had open forward currency contracts to receive and deliver currencies as follows:
| | | | | Unrealized |
| | | | | Appreciation |
| Contract Amount (000) | (Depreciation) |
Contract Settlement Date | | Receive | | Deliver | ($000) |
12/28/2007 | EUR | 112,427 | USD | 162,774 | 4,080 |
| | | | | |
EUR—Euro. | | | | | |
USD—U.S. dollar. | | | | | |
Unrealized appreciation (depreciation) on open forward currency contracts is treated as realized gain (loss) for tax purposes.
The fund had net unrealized foreign currency gains of $1,385,000 resulting from the translation of other assets and liabilities at October 31, 2007.
E. During the year ended October 31, 2007, the fund purchased $10,603,812,000 of investment securities and sold $2,698,456,000 of investment securities, other than temporary cash investments.
45
European Stock Index Fund
F. Capital share transactions for each class of shares were:
| Year Ended October 31, |
| | 2007 | | | 2006 |
| Amount | Shares | | Amount | Shares |
| ($000) | (000) | | ($000) | (000) |
Investor Shares | | | | | |
Issued | 5,660,208 | 147,210 | | 3,520,497 | 114,339 |
Issued in Lieu of Cash Distributions | 454,609 | 12,663 | | 277,433 | 9,958 |
Redeemed1 | (1,668,718) | (42,810) | | (1,122,864) | (36,806) |
Net Increase (Decrease)—Investor Shares | 4,446,099 | 117,063 | | 2,675,066 | 87,491 |
Admiral Shares | | | | | |
Issued | 919,141 | 10,184 | | 575,431 | 8,005 |
Issued in Lieu of Cash Distributions | 51,856 | 615 | | 31,004 | 474 |
Redeemed1 | (808,257) | (8,547) | | (231,842) | (3,224) |
Net Increase (Decrease)—Admiral Shares | 162,740 | 2,252 | | 374,593 | 5,255 |
Signal Shares | | | | | |
Issued | 477,278 | 12,591 | | 11,828 | 389 |
Issued in Lieu of Cash Distributions | 341 | 10 | | — | — |
Redeemed1 | (9,793) | (265) | | (114) | (4) |
Net Increase (Decrease)—Signal Shares | 467,826 | 12,336 | | 11,714 | 385 |
Institutional Shares | | | | | |
Issued | 2,139,740 | 55,266 | | 1,421,711 | 45,135 |
Issued in Lieu of Cash Distributions | 80,880 | 2,251 | | 43,746 | 1,569 |
Redeemed1 | (1,028,378) | (26,180) | | (757,083) | (24,631) |
Net Increase (Decrease)—Institutional Shares | 1,192,242 | 31,337 | | 708,374 | 22,073 |
ETF Shares | | | | | |
Issued | 1,456,669 | 20,084 | | 890,919 | 14,968 |
Issued in Lieu of Cash Distributions | — | — | | — | — |
Redeemed | — | — | | — | — |
Net Increase (Decrease)—ETF Shares | 1,456,669 | 20,084 | | 890,919 | 14,968 |
G. In June 2006, the Financial Accounting Standards Board issued Interpretation No. 48 (“FIN 48”), “Accounting for Uncertainty in Income Taxes.” FIN 48 establishes the minimum threshold for recognizing, and a system for measuring, the benefits of tax-return positions in financial statements, and is effective for the fund’s fiscal year beginning November 1, 2007. Management has analyzed the fund’s tax positions taken on federal income tax returns for all open tax years (tax years ended October 31, 2004–2007) for purposes of implementing FIN 48, and has concluded that as of October 31, 2007, no provision for income tax would be required in the fund’s financial statements.
1 Net of redemption fees of $1,200,000 and $712,000 (fund totals).
46
Pacific Stock Index Fund
Fund Profile
As of October 31, 2007
Portfolio Characteristics | | |
| | Target | Broad |
| Fund | Index1 | Index2 |
Number of Stocks | 560 | 558 | 2,067 |
Turnover Rate | 3% | — | — |
Expense Ratio | | — | — |
Investor Shares | 0.22% | | |
Admiral Shares | 0.12% | | |
Signal Shares | 0.12%3 | | |
Institutional Shares | 0.09% | | |
ETF Shares | 0.12% | | |
Short-Term Reserves | –0.3%4 | — | — |
Sector Diversification (% of equity exposure) |
| | Target | Broad |
| Fund | Index1 | Index2 |
Consumer Discretionary | 14.3% | 14.4% | 9.8% |
Consumer Staples | 5.0 | 5.0 | 7.6 |
Energy | 2.0 | 2.0 | 10.7 |
Financials | 29.1 | 29.0 | 24.8 |
Health Care | 4.1 | 4.1 | 6.6 |
Industrials | 17.1 | 17.1 | 11.3 |
Information Technology | 10.0 | 10.0 | 9.6 |
Materials | 12.1 | 12.1 | 9.2 |
Telecommunication | | | |
Services | 3.0 | 3.0 | 6.1 |
Utilities | 3.3 | 3.3 | 4.3 |
Volatility Measures5 | |
| Fund Versus | Fund Versus |
| Target Index1 | Broad Index2 |
R-Squared | 0.97 | 0.72 |
Beta | 0.99 | 0.88 |
47
Ten Largest Holdings6 (% of total net assets) |
| | |
Toyota Motor Corp. | automobile | |
| manufacturers | 3.4% |
BHP Billiton Ltd. | diversified | |
| metals and mining | 3.2 |
Mitsubishi UFJ | | |
Financial Group | diversified banks | 1.9 |
Commonwealth | | |
Bank of Australia | diversified banks | 1.7 |
National | | |
Australia Bank Ltd. | diversified banks | 1.5 |
Nintendo Co. | home entertainment | |
| software | 1.4 |
Honda Motor Co., Ltd. | automobile | |
| manufacturers | 1.3 |
Mizuho | | |
Financial Group, Inc. | diversified banks | 1.2 |
Canon, Inc. | office electronics | 1.2 |
Sumitomo Mitsui | | |
Financial Group, Inc. | diversified banks | 1.2 |
Top Ten | | 18.0% |
Market Diversification (% of equity exposure) |
| | Target |
| Fund | Index1 |
Japan | 65.5% | 65.6% |
Australia | 22.8 | 22.7 |
Hong Kong | 7.4 | 7.2 |
Singapore | 3.8 | 3.8 |
Other Pacific Countries | 0.5 | 0.7 |
1 MSCI Pacific Index.
2 MSCI All Country World Index ex USA.
3 Annualized.
4 The fund invested a portion of its cash reserves in equity markets through the use of index futures contracts. After the effect of the futures investments, the fund’s temporary cash position was negative.
5 For an explanation of R-squared, beta, and other terms used here, see the Glossary on page 165.
6 “Ten Largest Holdings” excludes any temporary cash investments and equity index products.
48
Pacific Stock Index Fund
Performance Summary
All of the returns in this report represent past performance, which is not a guarantee of future results that may be achieved by the fund. (Current performance may be lower or higher than the performance data cited. For performance data current to the most recent month-end, visit our website at www.vanguard.com/performance.) Note, too, that both investment returns and principal value can fluctuate widely, so an investor’s shares, when sold, could be worth more or less than their original cost. The returns shown do not reflect taxes that a shareholder would pay on fund distributions or on the sale of fund shares.
Cumulative Performance: October 31, 1997–October 31, 2007
Initial Investment of $10,000
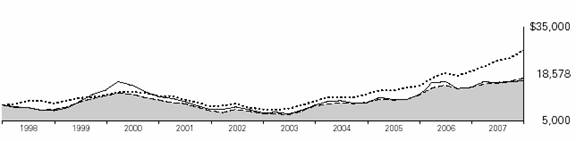
| Average Annual Total Returns | Final Value of |
| Periods Ended October 31, 2007 | a $10,000 |
| One Year | Five Years | Ten Years | Investment |
Pacific Stock Index Fund Investor Shares1 | 19.52% | 21.05% | 6.39% | $18,578 |
MSCI All Country World Index ex USA | 32.97 | 26.39 | 10.75 | 27,762 |
MSCI Pacific Index | 18.32 | 20.88 | 6.44 | 18,666 |
Average Japan/Pacific Region Fund2 | 13.91 | 18.99 | 5.97 | 17,851 |
| | | | Final Value of |
| | | Since | a $100,000 |
| One Year | Five Years | Inception3 | Investment |
Pacific Stock Index Fund Admiral Shares1 | 19.64% | 21.16% | 12.04% | $202,788 |
MSCI All Country World Index ex USA | 32.97 | 26.39 | 16.54 | 258,999 |
MSCI Pacific Index | 18.32 | 20.88 | 12.03 | 202,597 |
| | Final Value of |
| Since | a $10,000,000 |
| Inception3 | Investment |
Pacific Stock Index Fund Signal Shares1 | 5.73% | $10,573,207 |
MSCI All Country World Index ex USA | 9.62 | 10,962,418 |
MSCI Pacific Index | 4.79 | 10,478,656 |
1 Returns do not reflect the 0.5% transaction fee on purchases through March 31, 2000; the 2% fee assessed on redemptions of shares purchased on or after June 27, 2003, and held for less than two months; or, for the Investor Shares, the account service fee that may be applicable to certain accounts with balances below $10,000.
2 Derived from data provided by Lipper Inc.
3 Performance for the fund and its comparative standards is calculated since the following inception dates: August 13, 2001, for the Admiral Shares and June 4, 2007, for the Signal Shares.
49
Pacific Stock Index Fund
| | | | Final Value of |
| | | Since | a $5,000,000 |
| One Year | Five Years | Inception1 | Investment |
Pacific Stock Index Fund Institutional Shares2 | 19.72% | 21.23% | 4.84% | $7,116,172 |
MSCI All Country World Index ex USA | 32.97 | 26.39 | 9.19 | 9,633,086 |
MSCI Pacific Index | 18.32 | 20.88 | 4.80 | 7,093,402 |
| | | Final Value |
| | Since | of a $10,000 |
| One Year | Inception1 | Investment |
Pacific Stock Index Fund ETF Shares | 19.65% | 17.61% | $15,394 |
MSCI All Country World Index ex USA | 32.97 | 24.00 | 17,723 |
MSCI Pacific Index | 18.32 | 17.31 | 15,293 |
Cumulative Returns: ETF Shares, March 4, 2005–October 31, 2007 |
| | |
| | Since |
| One Year | Inception1 |
Pacific Stock Index Fund ETF Shares Market Price | 19.12% | 53.87% |
Pacific Stock Index Fund ETF Shares Net Asset Value | 19.65 | 53.94 |
MSCI Pacific Index | 18.32 | 52.93 |
1 Performance for the fund and its comparative standards is calculated since the following inception dates: May 15, 2000, for the Institutional Shares and March 4, 2005, for the ETF Shares.
2 Returns do not reflect the 0.5% transaction fee on purchases through March 31, 2000, or the 2% fee assessed on redemptions of shares purchased on or after June 27, 2003, and held for less than two months.
50
Pacific Stock Index Fund
Fiscal-Year Total Returns (%): October 31, 1997–October 31, 2007

Average Annual Total Returns: Periods Ended September 30, 2007
This table presents average annual total returns through the latest calendar quarter—rather than through the end of the fiscal period. Securities and Exchange Commission rules require that we provide this information.
| Inception Date | One Year | Five Years | Ten Years |
Pacific Stock Index Fund | | | | |
Investor Shares1 | 6/18/1990 | 18.82% | 19.41% | 4.65% |
Admiral Shares1 | 8/13/2001 | 18.95 | 19.55 | 11.592 |
Signal Shares1 | 6/04/2007 | 2.132 | — | — |
Institutional Shares1 | 5/15/2000 | 19.02 | 19.63 | 4.402 |
ETF Shares | 3/4/2005 | | | |
Market Price | | 18.66 | 16.682 | — |
Net Asset Value | | 18.95 | 16.652 | — |
1 Returns do not reflect the 0.5% transaction fee on purchases through March 31, 2000; the 2% fee assessed on redemptions of shares purchased on or after June 27, 2003, and held for less than two months; or, for the Investor Shares, the account service fee that may be applicable to certain accounts with balances below $10,000.
2 Returns since inception.
Note: See Financial Highlights tables on pages 71-75 for dividend and capital gains information.
51
Pacific Stock Index Fund
Financial Statements
Statement of Net Assets
As of October 31, 2007
The fund provides a complete list of its holdings four times in each fiscal year, at the quarter-ends. For the second and fourth fiscal quarters, the lists appear in the fund’s semiannual and annual reports to shareholders. For the first and third fiscal quarters, the fund files the lists with the Securities and Exchange Commission on Form N-Q. Shareholders can look up the fund’s Forms N-Q on the SEC’s website at www.sec.gov. Forms N-Q may also be reviewed and copied at the SEC’s Public Reference Room (see the back cover of this report for further information).
| | Market |
| | Value• |
| Shares | ($000) |
Common Stocks (99.2%)1 | | |
Australia (22.5%) | | |
BHP Billiton Ltd. | 12,646,494 | 550,689 |
Commonwealth | | |
Bank of Australia | 4,900,818 | 282,259 |
National Australia | | |
Bank Ltd. | 6,150,214 | 248,825 |
Australia & New Zealand | | |
Bank Group Ltd. | 6,970,123 | 196,782 |
Westpac | | |
Banking Corp., Ltd. | 6,972,074 | 195,693 |
Woolworths Ltd. | 4,549,368 | 142,585 |
Westfield Group | 6,585,985 | 134,663 |
^Rio Tinto Ltd. | 1,076,000 | 111,688 |
QBE Insurance Group Ltd. | 3,249,668 | 99,448 |
Woodside Petroleum Ltd. | 1,795,542 | 87,871 |
Macquarie Bank Ltd. | 991,526 | 79,189 |
Brambles Ltd. | 5,342,730 | 71,117 |
CSL, Ltd. | 2,065,512 | 70,220 |
AMP Ltd. | 7,057,964 | 67,579 |
Suncorp-Metway Ltd. | 3,484,094 | 66,194 |
Coles Group Ltd. | 4,287,463 | 64,701 |
^Wesfarmers Ltd. | 1,461,882 | 60,155 |
Newcrest Mining Ltd. | 1,706,429 | 52,018 |
Telstra Corp. Ltd. | 10,790,141 | 47,226 |
Foster’s Group Ltd. | 7,437,984 | 44,410 |
Stockland | 5,240,010 | 44,018 |
Macquarie | | |
Goodman Group | 5,424,488 | 35,163 |
Australian Stock | | |
Exchange Ltd. | 644,620 | 34,760 |
Orica Ltd. | 1,174,886 | 34,132 |
GPT Group | 7,735,537 | 33,469 |
Publishing & | | |
Broadcasting Ltd. | 1,684,396 | 32,881 |
^Leighton Holdings Ltd. | 525,205 | 30,747 |
52
| | Market |
| | Value• |
| Shares | ($000) |
Santos Ltd. | 2,272,910 | 30,001 |
Macquarie | | |
Infrastructure Group | 10,019,339 | 29,742 |
Insurance Australia | | |
Group Ltd. | 6,750,059 | 29,693 |
Zinifex Ltd. | 1,837,050 | 29,072 |
Tabcorp Holdings Ltd. | 1,981,357 | 28,833 |
Origin Energy Ltd. | 3,291,354 | 28,246 |
BlueScope Steel Ltd. | 2,768,094 | 27,609 |
Transurban Group | 4,019,640 | 27,360 |
Alumina Ltd. | 4,261,442 | 26,781 |
Lend Lease Corp. | 1,362,337 | 25,548 |
Toll Holdings Ltd. | 2,038,778 | 25,479 |
WorleyParsons Ltd. | 561,477 | 25,381 |
^Babcock & Brown Ltd. | 873,307 | 25,287 |
AXA Asia Pacific | | |
Holdings Ltd. | 3,240,304 | 24,789 |
^Fortescue Metals | | |
Group Ltd. | 474,341 | 22,386 |
Amcor Ltd. | 3,384,297 | 22,222 |
DB RREEF Trust | 10,945,791 | 21,442 |
Centro Properties Group | 3,183,478 | 20,956 |
Mirvac Group | 3,830,005 | 20,770 |
Qantas Airways Ltd. | 3,673,658 | 20,317 |
John Fairfax Holdings Ltd. | 4,470,361 | 19,853 |
Sonic Healthcare Ltd. | 1,179,429 | 19,021 |
Coca-Cola Amatil Ltd. | 1,988,655 | 19,005 |
AGL Energy Ltd. | 1,636,281 | 18,446 |
OneSteel Ltd. | 2,814,794 | 18,188 |
Telstra Corp. Installment | | |
Receipt Exp. 3/31/08 | 5,623,728 | 16,749 |
*^Paladin Resources Ltd. | 2,045,590 | 15,926 |
Tattersall’s Ltd. | 4,061,538 | 15,925 |
Asciano Group | 2,018,514 | 15,835 |
Computershare Ltd. | 1,908,307 | 15,387 |
Boral Ltd. | 2,262,276 | 14,377 |
Cochlear Ltd. | 207,500 | 13,343 |
^Aristocrat Leisure Ltd. | 1,317,434 | 12,886 |
Harvey Norman | | |
Holdings Ltd. | 2,000,317 | 12,711 |
CFS Gandel Retail Trust | 5,180,655 | 11,833 |
Macquarie Office Trust | 7,568,073 | 11,612 |
CSR Ltd. | 3,497,613 | 11,164 |
James Hardie | | |
Industries NV | 1,771,010 | 10,782 |
Macquarie Airports Group | 2,600,105 | 10,686 |
Caltex Australia Ltd. | 509,922 | 10,259 |
^Perpetual Trustees | | |
Australia Ltd. | 140,517 | 9,775 |
Lion Nathan Ltd. | 1,110,254 | 9,656 |
| | | |
53
| | Market |
| | Value• |
| Shares | ($000) |
ING Industrial Fund | 3,418,564 | 8,958 |
Billabong International Ltd. | 629,409 | 8,889 |
Symbion Health Ltd. | 2,290,349 | 8,674 |
^ABC Learning Centres Ltd. | 1,401,868 | 8,656 |
Challenger Financial | | |
Services Group Ltd. | 1,364,196 | 8,152 |
Goodman Fielder Ltd. | 4,020,931 | 7,918 |
Commonwealth | | |
Property Office Fund | 5,250,140 | 7,770 |
Macquarie Communications | | |
Infrastructure Group | 1,378,206 | 7,436 |
Downer EDI Ltd. | 1,057,972 | 6,597 |
Centro Retail Trust | 4,157,111 | 6,233 |
Ansell Ltd. | 511,708 | 5,932 |
Pacific Brands Ltd. | 1,764,169 | 5,706 |
APN News & Media Ltd. | 1,127,537 | 5,645 |
Paperlinx Ltd. | 1,573,468 | 4,073 |
Futuris Corp., Ltd. | 2,036,654 | 4,047 |
Iluka Resources Ltd. | 834,564 | 3,415 |
| | 3,851,916 |
Hong Kong (7.4%) | | |
Hong Kong Exchanges & | | |
Clearing Ltd. | 4,025,500 | 134,381 |
Cheung Kong Holdings Ltd. | 5,675,228 | 111,322 |
Hutchison Whampoa Ltd. | 8,016,360 | 100,755 |
Sun Hung Kai | | |
Properties Ltd. | 5,160,104 | 98,614 |
Esprit Holdings Ltd. | 3,948,178 | 65,940 |
Hang Seng Bank Ltd. | 2,885,166 | 58,944 |
Swire Pacific Ltd. A Shares | 3,157,500 | 45,095 |
Li & Fung Ltd. | 8,369,450 | 39,716 |
Boc Hong Kong | | |
Holdings Ltd. | 13,953,800 | 39,517 |
Hang Lung Properties Ltd. | 7,811,720 | 37,583 |
Hong Kong & | | |
China Gas Co., Ltd. | 13,714,438 | 36,899 |
Bank of East Asia Ltd. | 5,320,273 | 36,199 |
CLP Holdings Ltd. | 4,997,063 | 33,771 |
New World | | |
Development Co., Ltd. | 9,057,146 | 32,644 |
Henderson Land | | |
Development Co. Ltd. | 3,295,324 | 29,541 |
Tencent Holdings Ltd. | 3,352,600 | 28,740 |
Wharf Holdings Ltd. | 4,621,914 | 27,868 |
Hong Kong Electric | | |
Holdings Ltd. | 5,238,350 | 26,932 |
* Foxconn International | | |
Holdings Ltd. | 7,920,238 | 22,085 |
Kerry Properties Ltd. | 2,381,313 | 20,713 |
Link REIT | 8,031,000 | 18,221 |
54
| | Market |
| | Value• |
| Shares | ($000) |
MTR Corp. | 5,209,200 | 18,060 |
Sino Land Co. | 5,142,400 | 16,120 |
Cathay Pacific Airways Ltd. | 5,149,500 | 15,361 |
Kingboard Chemical | | |
Holdings Ltd. | 2,195,500 | 14,421 |
Shangri-La Asia Ltd. | 4,386,068 | 13,998 |
Belle International | | |
Holdings Ltd. | 7,767,000 | 12,600 |
Hopewell Holdings Ltd. | 2,346,800 | 12,161 |
Shui On Land Ltd. | 7,111,243 | 9,899 |
PCCW Ltd. | 15,129,769 | 9,770 |
Tingyi Holding Corp. | 6,333,350 | 9,692 |
Orient Overseas | | |
International Ltd. | 815,224 | 8,416 |
Wing Hang Bank Ltd. | 665,509 | 7,842 |
Hutchison | | |
Telecommunications | | |
International Ltd. | 5,403,673 | 7,713 |
Hysan | | |
Development Co., Ltd. | 2,391,811 | 7,227 |
Television Broadcasts Ltd. | 1,077,424 | 6,979 |
Shun Tak Holdings Ltd. | 4,391,382 | 6,933 |
Yue Yuen Industrial | | |
(Holdings) Ltd. | 2,189,900 | 6,758 |
Cheung Kong Infrastructure | | |
Holdings Ltd. | 1,706,600 | 6,686 |
ASM Pacific Technology Ltd. | 733,000 | 5,747 |
Melco International | | |
Development Corp. | 2,781,000 | 5,273 |
Techtronic | | |
Industries Co., Ltd. | 4,165,000 | 4,501 |
Johnson Electric | | |
Holdings Ltd. | 5,546,600 | 3,113 |
Giordano International Ltd. | 5,141,600 | 2,404 |
| | 1,257,154 |
Japan (65.0%) | | |
Toyota Motor Corp. | 10,203,865 | 584,112 |
Mitsubishi UFJ | | |
Financial Group | 32,732,040 | 327,521 |
Nintendo Co. | 373,620 | 237,278 |
Honda Motor Co., Ltd. | 5,876,904 | 220,072 |
Mizuho Financial | | |
Group, Inc. | 37,197 | 209,064 |
Canon, Inc. | 4,018,249 | 203,321 |
Sumitomo Mitsui | | |
Financial Group, Inc. | 24,765 | 202,858 |
Takeda | | |
Pharmaceutical Co. Ltd. | 3,183,847 | 198,877 |
Sony Corp. | 3,778,864 | 186,625 |
Mitsui & Co., Ltd. | 6,410,600 | 166,279 |
55
| | Market |
| | Value• |
| Shares | ($000) |
Mitsubishi Corp. | 5,094,900 | 158,632 |
Nippon Steel Corp. | 21,806,343 | 144,936 |
Matsushita Electric | | |
Industrial Co., Ltd. | 7,403,563 | 141,376 |
Mitsubishi Estate Co., Ltd. | 4,424,000 | 132,624 |
JFE Holdings, Inc. | 2,191,700 | 128,299 |
Nomura Holdings Inc. | 6,665,000 | 118,765 |
Tokyo Electric Power Co. | 4,586,510 | 116,382 |
Komatsu Ltd. | 3,383,768 | 113,446 |
Millea Holdings, Inc. | 2,795,000 | 109,999 |
East Japan Railway Co. | 12,807 | 105,496 |
Shin-Etsu | | |
Chemical Co., Ltd. | 1,546,000 | 99,170 |
Japan Tobacco, Inc. | 16,977 | 98,953 |
Toshiba Corp. | 11,537,000 | 97,699 |
Nissan Motor Co., Ltd. | 8,511,920 | 97,655 |
Astellas Pharma Inc. | 2,021,298 | 89,728 |
Nippon Telegraph and | | |
Telephone Corp. | 19,557 | 89,505 |
Mitsubishi Electric Corp. | 7,291,000 | 88,891 |
Fuji Photo Film Co., Ltd. | 1,842,066 | 88,115 |
NTT DoCoMo, Inc. | 60,444 | 87,940 |
Mitsui Fudosan Co., Ltd. | 3,152,557 | 87,212 |
Hitachi Ltd. | 12,707,000 | 85,096 |
Seven and I | | |
Holdings Co., Ltd. | 3,097,140 | 79,973 |
Fanuc Co., Ltd. | 722,200 | 79,167 |
Sumitomo Metal | | |
Industries Ltd. | 15,412,000 | 76,283 |
Daiichi Sankyo Co., Ltd. | 2,634,336 | 74,915 |
Denso Corp. | 1,830,400 | 74,360 |
Itochu Corp. | 5,680,000 | 71,775 |
Orix Corp. | 344,806 | 70,729 |
Mitsubishi Heavy | | |
Industries Ltd. | 12,093,000 | 70,427 |
KDDI Corp. | 9,283 | 70,111 |
Sumitomo Corp. | 4,003,000 | 69,748 |
Mitsui OSK Lines Ltd. | 4,088,000 | 67,565 |
Kansai Electric | | |
Power Co., Inc. | 2,900,400 | 65,317 |
Softbank Corp. | 2,788,818 | 65,132 |
Chubu Electric Power Co. | 2,505,500 | 64,201 |
Central Japan Railway Co. | 5,918 | 61,223 |
Sharp Corp. | 3,764,000 | 59,373 |
Hoya Corp. | 1,560,094 | 56,809 |
Kao Corp. | 1,966,661 | 56,403 |
Fujitsu Ltd. | 7,034,000 | 55,229 |
Marubeni Corp. | 6,223,000 | 53,434 |
Sumitomo Chemical Co. | 5,934,000 | 52,754 |
Mitsui Sumitomo | | |
56
| | Market |
| | Value• |
| Shares | ($000) |
Insurance Co. | 4,568,552 | 52,396 |
Kyocera Corp. | 612,800 | 52,087 |
Bridgestone Corp. | 2,300,859 | 50,931 |
Sumitomo Realty & | | |
Development Co. | 1,434,272 | 50,623 |
Ricoh Co. | 2,524,386 | 49,896 |
Daikin Industries Ltd. | 983,089 | 49,514 |
Asahi Glass Co., Ltd. | 3,572,200 | 49,195 |
Murata | | |
Manufacturing Co., Ltd. | 807,755 | 49,158 |
Daiwa Securities | | |
Group Inc. | 5,037,850 | 48,550 |
Sumitomo Metal | | |
Mining Co. | 2,070,000 | 46,192 |
Sumitomo Electric | | |
Industries Ltd. | 2,829,700 | 45,814 |
T & D Holdings, Inc. | 743,810 | 44,767 |
Nippon Yusen Kabushiki | | |
Kaisha Co. | 4,179,000 | 43,145 |
Kirin Brewery Co., Ltd. | 2,973,048 | 41,546 |
Nippon Oil Corp. | 4,683,479 | 41,480 |
Ibiden Co., Ltd. | 482,539 | 40,902 |
Secom Co., Ltd. | 792,600 | 40,780 |
Eisai Co., Ltd. | 951,600 | 39,956 |
TDK Corp. | 477,600 | 39,196 |
Toray Industries, Inc. | 5,024,740 | 38,790 |
Nikon Corp. | 1,204,718 | 38,662 |
Resona Holdings Inc. | 21,518 | 38,559 |
NEC Corp. | 7,664,812 | 38,114 |
Aeon Co., Ltd. | 2,417,100 | 38,049 |
Tokyo Electron Ltd. | 647,730 | 38,039 |
Tokyo Gas Co., Ltd. | 8,472,000 | 37,769 |
Sompo Japan | | |
Insurance Inc. | 3,168,000 | 37,259 |
Mitsubishi Chemical | | |
Holdings Corp. | 4,433,000 | 36,679 |
Olympus Corp. | 870,464 | 36,250 |
Kobe Steel Ltd. | 9,995,095 | 35,988 |
NGK Insulators Ltd. | 1,010,534 | 35,825 |
Sumitomo Trust & | | |
Banking Co., Ltd. | 4,742,959 | 35,364 |
Kyushu Electric | | |
Power Co., Inc. | 1,432,600 | 34,930 |
Kubota Corp. | 4,134,000 | 34,706 |
Asahi Kasei Corp. | 4,502,000 | 34,465 |
Tohoku Electric Power Co. | 1,612,700 | 34,078 |
Dai-Nippon | | |
Printing Co., Ltd. | 2,338,741 | 33,951 |
Yamada Denki Co., Ltd. | 326,736 | 33,687 |
Inpex Holdings, Inc. | 3,109 | 33,516 |
57
| | Market |
| | Value• |
| Shares | ($000) |
Rohm Co., Ltd. | 381,100 | 33,388 |
West Japan Railway Co. | 6,416 | 32,108 |
Bank of Yokohama Ltd. | 4,472,000 | 31,733 |
Konica Minolta | | |
Holdings, Inc. | 1,806,000 | 31,615 |
Nippon Mining | | |
Holdings Inc. | 3,332,000 | 31,515 |
Terumo Corp. | 636,459 | 31,151 |
Shiseido Co., Ltd. | 1,277,524 | 30,756 |
Nidec Corp. | 408,600 | 30,701 |
Keyence Corp. | 132,419 | 30,516 |
Nitto Denko Corp. | 623,100 | 30,420 |
Aisin Seiki Co., Ltd. | 723,238 | 29,718 |
Osaka Gas Co., Ltd. | 7,597,000 | 29,556 |
Kawasaki Kisen Kaisha Ltd. | 2,121,000 | 29,440 |
SMC Corp. | 217,077 | 29,078 |
Toyoda Automatic | | |
Loom Works Ltd. | 676,800 | 28,983 |
Sumitomo Heavy | | |
Industries Ltd. | 2,172,000 | 28,694 |
Ajinomoto Co., Inc. | 2,512,000 | 28,373 |
Daiwa House | | |
Industry Co., Ltd. | 1,926,000 | 27,485 |
Tokyu Corp. | 4,151,000 | 26,978 |
Asahi Breweries Ltd. | 1,552,700 | 25,679 |
Yahoo Japan Corp. | 57,090 | 25,414 |
Office Building Fund of | | |
Japan Inc. | 1,725 | 25,023 |
Mitsubishi Materials Corp. | 4,254,000 | 24,905 |
Sekisui House Ltd. | 1,876,858 | 24,011 |
Chiba Bank Ltd. | 2,861,000 | 22,963 |
Shizuoka Bank Ltd. | 2,162,000 | 22,699 |
Electric Power | | |
Development Co., Ltd. | 565,940 | 22,526 |
Mitsui Chemicals, Inc. | 2,393,000 | 22,507 |
Toyota Tsusho Corp. | 803,004 | 22,502 |
Mitsui Trust Holding Inc. | 2,743,400 | 21,951 |
Japan Steel Works Ltd. | 1,333,832 | 21,818 |
NTT Data Corp. | 4,765 | 21,729 |
Nippon Electric | | |
Glass Co., Ltd. | 1,267,097 | 21,536 |
Yamato Holdings Co., Ltd. | 1,460,000 | 21,535 |
Hankyu Corp. | 4,563,958 | 21,413 |
Nikko Securities Co., Ltd. | 1,475,253 | 21,241 |
Makita Corp. | 435,300 | 20,971 |
Toppan Printing Co., Ltd. | 2,112,000 | 20,605 |
Yamaha Motor Co., Ltd. | 702,800 | 20,069 |
Omron Corp. | 800,100 | 19,678 |
Credit Saison Co., Ltd. | 616,052 | 19,644 |
Kawasaki Heavy | | |
58
| | Market |
| | Value• |
| Shares | ($000) |
Industries Ltd. | 5,338,000 | 19,340 |
Dentsu Inc. | 7,364 | 19,313 |
Shionogi & Co., Ltd. | 1,127,362 | 19,213 |
Kintetsu Corp. | 6,134,150 | 18,648 |
Japan Real Estate | | |
Investment Corp. | 1,472 | 18,307 |
Chugai | | |
Pharmaceutical Co., Ltd. | 1,056,200 | 18,296 |
Fukuoka Financial | | |
Group, Inc. | 2,836,600 | 18,282 |
Kuraray Co., Ltd. | 1,373,000 | 17,928 |
Sojitz Holdings Corp. | 3,835,400 | 17,606 |
JSR Corp. | 677,700 | 17,597 |
Advantest Corp. | 603,236 | 17,501 |
Trend Micro Inc. | 387,000 | 17,280 |
Shinsei Bank, Ltd. | 5,297,046 | 17,169 |
Tokyu Land Corp. | 1,614,000 | 16,721 |
Hitachi Construction | | |
Machinery Co. | 405,878 | 16,647 |
Showa Denko K.K. | 4,231,000 | 16,596 |
Odakyu Electric | | |
Railway Co. | 2,370,000 | 16,573 |
Mitsui Engineering & | | |
Shipbuilding Co., Ltd. | 2,813,000 | 16,564 |
JS Group Corp. | 1,004,808 | 16,277 |
Teijin Ltd. | 3,328,000 | 16,058 |
Sumco Corp. | 433,016 | 15,804 |
Matsushita Electric | | |
Works, Ltd. | 1,409,000 | 15,683 |
Joyo Bank Ltd. | 2,528,000 | 15,677 |
JGC Corp. | 782,000 | 15,660 |
Yamaha Corp. | 663,900 | 15,442 |
Leopalace21 Corp. | 481,700 | 15,377 |
Nippon Express Co., Ltd. | 3,014,000 | 15,158 |
Nomura Research | | |
Institute, Ltd. | 425,780 | 15,050 |
Hokkaido Electric | | |
Power Co., Ltd. | 691,861 | 14,930 |
NSK Ltd. | 1,668,000 | 14,789 |
OJI Paper Co., Ltd. | 3,213,740 | 14,680 |
Mitsubishi Gas | | |
Chemical Co. | 1,464,000 | 14,658 |
J. Front Retailing Co., Ltd. | 1,623,400 | 14,564 |
Tobu Railway Co., Ltd. | 3,085,000 | 14,560 |
Hirose Electric Co., Ltd. | 120,800 | 14,486 |
NTN Corp. | 1,497,000 | 14,232 |
Mitsumi Electric Co., Ltd. | 307,600 | 14,174 |
Kurita Water Industries Ltd. | 422,900 | 14,127 |
Daito Trust | | |
Construction Co., Ltd. | 304,184 | 14,104 |
59
| | Market |
| | Value• |
| Shares | ($000) |
Amada Co., Ltd. | 1,385,000 | 14,014 |
JTEKT Corp. | 726,923 | 13,975 |
Citizen Watch Co., Ltd. | 1,295,400 | 13,955 |
Nippon Sheet | | |
Glass Co., Ltd. | 2,276,000 | 13,895 |
Hokuhoku Financial | | |
Group, Inc. | 4,477,400 | 13,831 |
Tokyo Tatemono Co., Ltd. | 1,075,000 | 13,830 |
^Bank of Kyoto Ltd. | 1,072,000 | 13,695 |
Takashimaya Co. | 1,118,972 | 13,588 |
Keio Electric | | |
Railway Co., Ltd. | 2,169,000 | 13,192 |
^Kyowa Hakko Kogyo Co. | 1,196,000 | 13,057 |
Ube Industries Ltd. | 3,595,000 | 12,909 |
Stanley Electric Co. | 568,600 | 12,645 |
*^Elpida Memory Inc. | 366,300 | 12,636 |
Namco Bandai | | |
Holdings Inc. | 788,100 | 12,151 |
Rakuten, Inc. | 24,725 | 12,092 |
Dowa Mining Co., Ltd. | 1,032,000 | 12,090 |
Kajima Corp. | 3,398,000 | 12,035 |
IHI Corp. | 4,990,000 | 11,961 |
Sekisui Chemical Co. | 1,737,000 | 11,888 |
Sony Financial | | |
Holdings, Inc. | 3,275 | 11,781 |
Ohbayashi Corp. | 2,321,000 | 11,696 |
Sapporo Hokuyo | | |
Holdings, Inc. | 1,135 | 11,682 |
Shimizu Corp. | 2,217,000 | 11,604 |
Marui Co., Ltd. | 1,116,400 | 11,581 |
Nisshin Steel Co. | 3,003,000 | 11,560 |
Tokuyama Corp. | 827,000 | 11,551 |
Tosoh Corp. | 1,803,000 | 11,540 |
Fast Retailing Co., Ltd. | 200,300 | 11,530 |
Furukawa Electric Co. | 2,399,000 | 11,523 |
Mitsubishi Rayon Co., Ltd. | 2,028,000 | 11,509 |
The Hachijuni Bank Ltd. | 1,506,550 | 11,508 |
Seiko Epson Corp. | 481,900 | 11,387 |
Dai-Nippon Ink & | | |
Chemicals, Inc. | 2,373,000 | 11,386 |
Oriental Land Co., Ltd. | 189,500 | 11,250 |
SBI Holdings, Inc. | 35,230 | 11,177 |
Toyo Seikan Kaisha Ltd. | 613,600 | 11,092 |
Yaskawa Electric Corp. | 823,380 | 11,077 |
^TonenGeneral Sekiyu K.K. | 1,091,000 | 10,991 |
NGK Spark Plug Co. | 650,682 | 10,947 |
Taisei Corp. | 3,618,000 | 10,885 |
Taiheiyo Cement Corp. | 3,409,000 | 10,741 |
Takefuji Corp. | 418,940 | 10,720 |
^Nissin Food | | |
60
| | Market |
| | Value• |
| Shares | ($000) |
Products Co., Ltd. | 337,000 | 10,604 |
THK Co., Inc. | 477,600 | 10,532 |
Taisho Pharmaceutical Co. | 545,000 | 10,477 |
Konami Corp. | 352,849 | 10,417 |
Sega Sammy Holdings Inc. | 749,032 | 10,342 |
The Hiroshima Bank, Ltd. | 1,896,650 | 10,305 |
Denki Kagaku Kogyo K.K. | 1,751,000 | 10,301 |
Kaneka Corp. | 1,151,982 | 10,238 |
Yokogawa Electric Corp. | 811,997 | 10,231 |
Shinko Securities Co., Ltd. | 1,973,000 | 10,218 |
Chiyoda Corp. | 545,000 | 10,121 |
Gunma Bank Ltd. | 1,418,000 | 10,073 |
Nippon Paper Group, Inc. | 3,340 | 10,001 |
*^Sanyo Electric Co., Ltd. | 6,018,000 | 9,962 |
^Keihin Electric Express | | |
Railway Co., Ltd. | 1,612,000 | 9,888 |
NTT Urban | | |
Development Corp. | 4,352 | 9,817 |
Isetan Co. | 724,500 | 9,789 |
Benesse Corp. | 261,457 | 9,786 |
Japan Retail Fund | | |
Investment Corp. | 1,315 | 9,765 |
The Suruga Bank, Ltd. | 743,000 | 9,754 |
* Haseko Corp. | 4,000,155 | 9,635 |
Asics Corp. | 604,139 | 9,634 |
Hitachi Chemical Co., Ltd. | 391,400 | 9,595 |
Shimano, Inc. | 258,100 | 9,421 |
NOK Corp. | 421,400 | 9,414 |
Nippon Sanso Corp. | 1,056,000 | 9,381 |
^All Nippon | | |
Airways Co., Ltd. | 2,428,000 | 9,362 |
Uni-Charm Corp. | 156,500 | 9,336 |
CSK Corp. | 237,700 | 9,313 |
Tanabe Seiyaku Co., Ltd. | 808,000 | 9,310 |
Minebea Co., Ltd. | 1,343,000 | 9,297 |
^Yakult Honsha Co., Ltd. | 398,800 | 9,259 |
Nomura Real Estate | | |
Office Fund, Inc. | 905 | 9,192 |
Mitsui Mining & | | |
Smelting Co., Ltd. | 2,169,000 | 9,132 |
Toyoda Gosei Co., Ltd. | 246,200 | 8,843 |
77 Bank Ltd. | 1,307,000 | 8,827 |
Idemitsu Kosan Co. Ltd. | 75,747 | 8,821 |
Ushio Inc. | 421,500 | 8,699 |
Sankyo Co., Ltd. | 203,200 | 8,675 |
Fujikura Ltd. | 1,338,000 | 8,627 |
Toho Co., Ltd. | 429,100 | 8,585 |
Japan Prime Realty | | |
Investment Corp. | 2,128 | 8,562 |
Casio Computer Co. | 899,800 | 8,484 |
61
| | Market |
| | Value• |
| Shares | ($000) |
^Promise Co., Ltd. | 281,250 | 8,460 |
Showa Shell Sekiyu K.K. | 714,000 | 8,406 |
Daido Steel Co., Ltd. | 1,220,000 | 8,326 |
Japan Petroleum | | |
Exploration Co., Ltd. | 108,485 | 8,266 |
Toyota Boshoku Corp. | 248,800 | 8,178 |
Alps Electric Co., Ltd. | 651,900 | 8,162 |
Lawson Inc. | 234,700 | 8,114 |
Fuji Electric | | |
Holdings Co., Ltd. | 2,125,000 | 8,101 |
Shimamura Co., Ltd. | 82,800 | 8,062 |
Susuken Co., Ltd. | 248,720 | 8,030 |
MEDICEO | | |
Holdings Co., Ltd. | 551,961 | 8,022 |
Kamigumi Co., Ltd. | 984,000 | 8,012 |
Sumitomo Rubber | | |
Industries Ltd. | 647,000 | 7,924 |
*^Japan Airlines System Co. | 3,409,000 | 7,687 |
^Toto Ltd. | 1,058,000 | 7,657 |
The Nishi-Nippon | | |
City Bank, Ltd. | 2,564,307 | 7,636 |
Okuma Corp. | 541,711 | 7,633 |
Daicel Chemical | | |
Industries Ltd. | 1,034,000 | 7,615 |
Nissan Chemical | | |
Industries, Ltd. | 553,000 | 7,604 |
Nisshinbo Industries, Inc. | 557,000 | 7,602 |
Glory Ltd. | 221,600 | 7,359 |
^Sapporo Holdings Ltd. | 972,000 | 7,317 |
^Mitsukoshi, Ltd. | 1,555,000 | 7,206 |
Mabuchi Motor Co. | 105,900 | 7,152 |
^Kikkoman Corp. | 560,000 | 7,105 |
Hino Motors, Ltd. | 980,000 | 7,065 |
^Aiful Corp. | 297,500 | 7,020 |
Nippon Meat Packers, Inc. | 693,000 | 6,984 |
Jupiter Telecommunications | | |
Co., Ltd. | 8,496 | 6,849 |
Ebara Corp. | 1,438,000 | 6,786 |
^Oracle Corp. Japan | 144,200 | 6,622 |
Santen | | |
Pharmaceutical Co., Ltd. | 280,100 | 6,584 |
Nisshin Seifun Group Inc. | 727,100 | 6,557 |
FamilyMart Co., Ltd. | 222,600 | 6,487 |
Pioneer Corp. | 577,500 | 6,435 |
Taiyo Yuden Co., Ltd. | 387,000 | 6,420 |
Hakuhodo DY Holdings Inc. | 88,200 | 6,389 |
Nitori Co., Ltd. | 139,568 | 6,378 |
Mitsubishi Logistics Corp. | 433,000 | 6,259 |
AEON Mall Co., Ltd. | 239,800 | 6,236 |
Kansai Paint Co., Ltd. | 826,000 | 6,201 |
62
| | Market |
| | Value• |
| Shares | ($000) |
Alfresa Holdings Corp. | 106,600 | 6,196 |
^Osaka Titanium | | |
Technologies Co. | 69,726 | 6,139 |
Keisei Electric | | |
Railway Co., Ltd. | 1,110,000 | 6,116 |
USS Co., Ltd. | 92,390 | 6,052 |
ZEON Corp. | 639,527 | 6,039 |
Uny Co., Ltd. | 682,000 | 5,913 |
Shinko Electric | | |
Industries Co., Ltd. | 255,553 | 5,907 |
Hitachi | | |
High-Technologies Corp. | 260,275 | 5,865 |
Toyo Suisan Kaisha, Ltd. | 336,000 | 5,841 |
Tokai Rika Co., Ltd. | 197,124 | 5,830 |
^SBI E*Trade | | |
Securities Co., Ltd. | 5,420 | 5,819 |
^Acom Co., Ltd. | 241,650 | 5,787 |
Otsuka Corp. | 60,064 | 5,756 |
Nomura Real Estate | | |
Holdings Inc. | 198,200 | 5,739 |
Tokyo Steel | | |
Manufacturing Co. | 411,000 | 5,699 |
Aoyama Trading Co., Ltd. | 216,300 | 5,654 |
^Toyobo Ltd. | 2,394,000 | 5,638 |
Canon Sales Co. Inc. | 284,000 | 5,565 |
Ryohin Keikaku Co., Ltd. | 87,200 | 5,488 |
Onward Kashiyama Co., Ltd. | 524,000 | 5,402 |
Komori Corp. | 203,000 | 5,369 |
Obic Co., Ltd. | 26,350 | 5,293 |
Meiji Dairies Corp. | 1,001,000 | 5,288 |
Diamond Lease Co., Ltd. | 152,170 | 5,272 |
^Meiji Seika Kaisha Ltd. | 1,185,000 | 5,214 |
Aeon Credit | | |
Service Co. Ltd. | 327,990 | 5,046 |
JAFCO Co., Ltd. | 118,700 | 4,892 |
Coca-Cola West | | |
Japan Co., Ltd. | 210,700 | 4,878 |
Dai-Nippon Screen | | |
Manufacturing Co., Ltd. | 816,000 | 4,851 |
NHK Spring Co. | 554,000 | 4,758 |
Nippon Shokubai Co., Ltd. | 481,000 | 4,754 |
Ito En, Ltd. | 223,900 | 4,732 |
Sumitomo Bakelite Co. Ltd. | 756,000 | 4,636 |
Shimachu Co. | 156,836 | 4,515 |
Nippon Kayaku Co., Ltd. | 545,000 | 4,400 |
Seino | | |
Transportation Co., Ltd. | 507,000 | 4,353 |
Hitachi Cable Ltd. | 637,000 | 4,259 |
Itochu Techno-Science Corp. | 117,400 | 4,191 |
^Rinnai Corp. | 133,300 | 4,150 |
63
| | Market |
| | Value• |
| Shares | ($000) |
Hankyu Department | | |
Stores, Inc. | 494,000 | 4,123 |
House Foods Industry Corp. | 259,900 | 4,116 |
Kinden Corp. | 456,000 | 4,054 |
Comsys Holdings Corp. | 410,000 | 4,020 |
* K.K. DaVinci Advisors | 3,851 | 4,018 |
^Wacoal Corp. | 329,000 | 4,011 |
Sanwa Shutter Corp. | 760,000 | 4,008 |
Asatsu-DK Inc. | 119,200 | 3,983 |
*^Access Co., Ltd. | 825 | 3,964 |
Nichirei Corp. | 907,000 | 3,878 |
Tokyo Broadcasting | | |
System, Inc. | 144,800 | 3,865 |
Toda Corp. | 737,000 | 3,862 |
*^NEC Electronics Corp. | 140,800 | 3,858 |
Nippon Light Metal Co. | 1,834,000 | 3,784 |
^Toho Titanium Co., Ltd. | 103,342 | 3,777 |
*^Oki Electric | | |
Industry Co. Ltd. | 2,163,000 | 3,681 |
^Matsui Securities Co., Ltd. | 461,800 | 3,669 |
Yamazaki Baking Co., Ltd. | 417,000 | 3,651 |
^Park24 Co., Ltd. | 366,374 | 3,647 |
^Meitec Corp. | 122,900 | 3,622 |
Fuji Television Network, Inc. | 1,786 | 3,607 |
^Takara Holdings Inc. | 612,000 | 3,597 |
Daifuku Co., Ltd. | 299,427 | 3,577 |
^OSG Corp. | 278,011 | 3,517 |
Q.P. Corp. | 349,200 | 3,447 |
Sumitomo Osaka | | |
Cement Co., Ltd. | 1,351,000 | 3,386 |
EDION Corp. | 277,045 | 3,182 |
Gunze Ltd. | 640,000 | 3,096 |
Hikari Tsushin, Inc. | 100,100 | 3,057 |
^Tokyo Seimitsu Co., Ltd. | 126,966 | 2,995 |
^Okumura Corp. | 561,000 | 2,969 |
Kose Corp. | 114,770 | 2,946 |
^Nishimatsu | | |
Construction Co. | 952,000 | 2,933 |
Central Glass Co., Ltd. | 604,000 | 2,855 |
^eAccess Ltd. | 4,498 | 2,851 |
Round One Corp. | 1,184 | 2,812 |
Kokuyo Co., Ltd. | 293,900 | 2,591 |
Circle K Sunkus Co., Ltd. | 166,500 | 2,547 |
^Autobacs Seven Co., Ltd. | 106,800 | 2,482 |
Matsumotokiyoshi | | |
Holdings Co., Ltd. | 131,700 | 2,335 |
TIS Inc. | 127,400 | 2,220 |
Hitachi Capital Corp. | 165,700 | 2,202 |
^Sanken Electric Co., Ltd. | 375,000 | 2,147 |
Fuji Soft ABC Inc. | 105,500 | 2,090 |
64
| | Market |
| | Value• |
| Shares | ($000) |
^Aderans Co. Ltd. | 117,200 | 1,887 |
^The Goodwill Group, Inc. | 4,472 | 1,026 |
* Dowa Mining Co., Ltd. | | |
Rights Exp. 1/29/10 | 805,000 | 465 |
| | 11,088,156 |
New Zealand (0.5%) | | |
Telecom Corp. of | | |
New Zealand Ltd. | 6,733,646 | 22,619 |
Fletcher Building Ltd. | 1,881,499 | 17,287 |
Auckland International | | |
Airport Ltd. | 3,701,499 | 8,238 |
Contact Energy Ltd. | 1,092,522 | 7,659 |
Sky City Entertainment | | |
Group Ltd. | 1,770,631 | 7,359 |
Fisher & Paykel | | |
Healthcare Corp. Ltd. | 1,817,144 | 4,566 |
Sky Network Television Ltd. | 670,915 | 2,990 |
Kiwi Income Property Trust | 2,507,899 | 2,827 |
Fisher & Paykel | | |
Appliances Holdings Ltd. | 939,413 | 2,552 |
Vector Ltd. | 853,124 | 1,576 |
| | 77,673 |
Singapore (3.8%) | | |
Singapore | | |
Telecommunications Ltd. | 30,004,290 | 85,323 |
United Overseas | | |
Bank Ltd. | 4,598,567 | 68,984 |
DBS Group Holdings Ltd. | 4,288,161 | 67,117 |
Oversea–Chinese | | |
Banking Corp., Ltd. | 9,437,068 | 60,587 |
Keppel Corp., Ltd. | 4,147,500 | 42,633 |
Singapore Exchange Ltd. | 3,005,000 | 32,928 |
Capitaland Ltd. | 5,821,895 | 32,780 |
Singapore Airlines Ltd. | 1,984,010 | 27,083 |
City Developments Ltd. | 1,870,412 | 20,652 |
Singapore Press | | |
Holdings Ltd. | 5,691,833 | 18,117 |
Cosco Corp. | | |
Singapore Ltd. | 2,924,000 | 15,880 |
Sembcorp Industries Ltd. | 3,332,393 | 13,764 |
Singapore Technologies | | |
Engineering Ltd. | 5,049,407 | 13,358 |
Fraser & Neave Ltd. | 3,139,500 | 13,148 |
CapitaMall Trust | 3,837,148 | 9,794 |
SembCorp Marine Ltd. | 3,107,800 | 9,649 |
ComfortDelGro Corp. Ltd. | 7,083,586 | 9,514 |
Venture Corp. Ltd. | 878,250 | 8,520 |
Keppel Land Ltd. | 1,364,000 | 7,890 |
Jardine Cycle N | | |
Carriage Ltd. | 515,128 | 7,552 |
65
| | Market | |
| | Value• | |
| Shares | ($000) | |
United Overseas Land Ltd. | 1,952,556 | 7,165 | |
Capitacommercial Trust | 3,667,365 | 6,867 | |
Ascendas REIT | 3,774,000 | 6,806 | |
Parkway Holdings Ltd. | 2,339,072 | 6,784 | |
Noble Group Ltd. | 3,887,000 | 6,404 | |
Neptune Orient Lines Ltd. | 1,670,000 | 5,982 | |
| Olam International Ltd. | 2,351,000 | 5,741 | |
| Suntec REIT | 3,771,142 | 4,753 | |
| Singapore Post Ltd. | 5,052,800 | 4,285 | |
| Wing Tai Holdings Ltd. | 1,608,000 | 3,887 | |
| Singapore | | | |
| Petroleum Co. Ltd. | 635,000 | 3,626 | |
| Singapore Land Ltd. | 470,000 | 3,179 | |
* | Chartered Semiconductor | | | |
| Manufacturing Ltd. | 3,861,000 | 3,072 | |
| Allgreen Properties Ltd. | 2,714,500 | 2,994 | |
| SMRT Corp. Ltd. | 2,390,000 | 2,931 | |
| Haw Par Brothers | | | |
| International Ltd. | 358,193 | 1,970 | |
| | | 641,719 | |
Total Common Stocks | | | |
(Cost $12,571,799) | | 16,916,618 | |
Temporary Cash Investments (2.3%)1 | | |
Money Market Fund (2.2%) | | | |
2 | Vanguard Market | | | |
| Liquidity Fund, | | | |
| 4.955%—Note E | 323,074,624 | 323,075 | |
2 | Vanguard Market | | | |
| Liquidity Fund, 4.955% | 50,950,165 | 50,950 | |
| | | 374,025 | |
| | Face | | |
| | Amount | | |
| | ($000) | | |
U.S. Agency Obligations (0.1%) | | | |
3 | Federal Home Loan Bank | | | |
4 | 4.923%, 1/25/08 | 6,000 | 5,936 | |
3 | Federal National Mortgage Assn. | | |
4 | 4.917%, 1/18/08 | 3,000 | 2,971 | |
| | | 8,907 | |
Total Temporary Cash Investments | | | |
(Cost $382,925) | | 382,932 | |
Total Investments (101.5%) | | | |
(Cost $12,954,724) | | 17,299,550 | |
Other Assets and Liabilities (–1.5%) | | |
Other Assets—Note B | | 281,149 | |
Security Lending Collateral | | | |
| Payable to Brokers—Note E | | (323,075) | |
Other Liabilities | | (214,712) | |
| | | (256,638) | |
Net Assets (100%) | | 17,042,912 | |
| | | | | | | |
66
Pacific Stock Index Fund
At October 31, 2007, net assets consisted of:5 |
| Amount |
| ($000) |
Paid-in Capital | 12,643,831 |
Undistributed Net Investment Income | 131,063 |
Accumulated Net Realized Losses | (81,056) |
Unrealized Appreciation | |
Investment Securities | 4,344,826 |
Futures Contracts | 3,464 |
Foreign Currencies and | |
Forward Currency Contracts | 784 |
Net Assets | 17,042,912 |
| |
Investor Shares—Net Assets | |
Applicable to 795,174,867 outstanding | |
$.001 par value shares of beneficial | |
interest (unlimited authorization) | 11,280,720 |
Net Asset Value Per Share— | |
Investor Shares | $14.19 |
| |
Admiral Shares—Net Assets | |
Applicable to 13,902,735 outstanding | |
$.001 par value shares of beneficial | |
interest (unlimited authorization) | 1,292,183 |
Net Asset Value Per Share— | |
Admiral Shares | $92.94 |
67
| Amount |
| ($000) |
Signal Shares—Net Assets | |
Applicable to 7,655,056 outstanding | |
$.001 par value shares of beneficial | |
interest (unlimited authorization) | 247,087 |
Net Asset Value Per Share— | |
Signal Shares | $32.28 |
| |
Institutional Shares—Net Assets | |
Applicable to 191,310,711 outstanding | |
$.001 par value shares of beneficial | |
interest (unlimited authorization) | 2,720,091 |
Net Asset Value Per Share— | |
Institutional Shares | $14.22 |
| |
ETF Shares—Net Assets | |
Applicable to 19,992,596 outstanding | |
$.001 par value shares of beneficial | |
interest (unlimited authorization) | 1,502,831 |
Net Asset Value Per Share— | |
ETF Shares | $75.17 |
• See Note A in Notes to Financial Statements.
* Non-income-producing security.
^ Part of security position is on loan to broker-dealers. See Note E in Notes to Financial Statements.
1 The fund invests a portion of its cash reserves in equity markets through the use of index futures contracts. After giving effect to futures investments, the fund’s effective common stock and temporary cash investment positions represent 99.9% and 1.6%, respectively, of net assets. See Note C in Notes to Financial Statements.
2 Affiliated money market fund available only to Vanguard funds and certain trusts and accounts managed by Vanguard. Rate shown is the 7-day yield.
3 The issuer operates under a congressional charter; its securities are neither issued nor guaranteed by the U.S. government. If needed, access to additional funding from the U.S. Treasury (beyond the issuer’s line of credit) would require congressional action.
4 Securities with a value of $8,907,000 have been segregated as initial margin for open futures contracts.
5 See Note C in Notes to Financial Statements for the tax-basis components of net assets.
REIT—Real Estate Investment Trust.
68
Pacific Stock Index Fund
Statement of Operations
| Year Ended |
| October 31, 2007 |
| ($000) |
Investment Income | |
Income | |
Dividends1 | 278,796 |
Interest2 | 3,839 |
Security Lending | 3,889 |
Total Income | 286,524 |
Expenses | |
The Vanguard Group—Note B | |
Investment Advisory Services | 401 |
Management and Administrative—Investor Shares | 16,241 |
Management and Administrative—Admiral Shares | 1,054 |
Management and Administrative—Signal Shares | 23 |
Management and Administrative—Institutional Shares | 960 |
Management and Administrative—ETF Shares | 775 |
Marketing and Distribution—Investor Shares | 2,363 |
Marketing and Distribution—Admiral Shares | 211 |
Marketing and Distribution—Signal Shares | — |
Marketing and Distribution—Institutional Shares | 558 |
Marketing and Distribution—ETF Shares | 260 |
Custodian Fees | 2,561 |
Auditing Fees | 38 |
Shareholders’ Reports—Investor Shares | 135 |
Shareholders’ Reports—Admiral Shares | 5 |
Shareholders’ Reports—Signal Shares | 1 |
Shareholders’ Reports—Institutional Shares | 1 |
Shareholders’ Reports—ETF Shares | 31 |
Trustees’ Fees and Expenses | 15 |
Total Expenses | 25,633 |
Net Investment Income | 260,891 |
Realized Net Gain (Loss) | |
Investment Securities Sold | 26,144 |
Futures Contracts | (3,371) |
Foreign Currencies and Forward Currency Contracts | 7,554 |
Realized Net Gain (Loss) | 30,327 |
Change in Unrealized Appreciation (Depreciation) | |
Investment Securities | 2,248,333 |
Futures Contracts | 3,506 |
Foreign Currencies and Forward Currency Contracts | 536 |
Change in Unrealized Appreciation (Depreciation) | 2,252,375 |
Net Increase (Decrease) in Net Assets Resulting from Operations | 2,543,593 |
1 Dividends are net of foreign withholding taxes of $11,775,000.
2 Interest income from an affiliated company of the fund was $3,621,000.
69
Pacific Stock Index Fund
Statement of Changes in Net Assets
| Year Ended October 31, |
| 2007 | 2006 |
| ($000) | ($000) |
Increase (Decrease) in Net Assets | | |
Operations | | |
Net Investment Income | 260,891 | 172,443 |
Realized Net Gain (Loss) | 30,327 | 386,020 |
Change in Unrealized Appreciation (Depreciation) | 2,252,375 | 899,705 |
Net Increase (Decrease) in Net Assets Resulting from Operations | 2,543,593 | 1,458,168 |
Distributions | | |
Net Investment Income | | |
Investor Shares | (176,611) | (82,959) |
Admiral Shares | (25,966) | (13,155) |
Signal Shares | — | — |
Institutional Shares | (42,679) | (22,834) |
ETF Shares | (18,129) | (4,454) |
Realized Capital Gain | | |
Investor Shares | — | — |
Admiral Shares | — | — |
Signal Shares | — | — |
Institutional Shares | — | — |
ETF Shares | — | — |
Total Distributions | (263,385) | (123,402) |
Capital Share Transactions—Note F | | |
Investor Shares | 1,937,377 | 1,678,857 |
Admiral Shares | (42,070) | 272,087 |
Signal Shares | 242,515 | — |
Institutional Shares | 573,669 | 289,594 |
ETF Shares | 628,365 | 481,727 |
Net Increase (Decrease) from Capital Share Transactions | 3,339,856 | 2,722,265 |
Total Increase (Decrease) | 5,620,064 | 4,057,031 |
Net Assets | | |
Beginning of Period | 11,422,848 | 7,365,817 |
End of Period1 | 17,042,912 | 11,422,848 |
1 Net Assets—End of Period includes undistributed net investment income of $131,063,000 and $127,047,000.
70
Pacific Stock Index Fund
Financial Highlights
Investor Shares | | | | | |
| | | | | |
| | | | | |
| Year Ended October 31, |
For a Share Outstanding Throughout Each Period | 2007 | 2006 | 2005 | 2004 | 2003 |
Net Asset Value, Beginning of Period | $12.13 | $10.39 | $8.63 | $7.80 | $5.90 |
Investment Operations | | | | | |
Net Investment Income | .236 | .19 | .156 | .121 | .082 |
Net Realized and Unrealized Gain (Loss) | | | | | |
on Investments | 2.091 | 1.71 | 1.761 | .814 | 1.885 |
Total from Investment Operations | 2.327 | 1.90 | 1.917 | .935 | 1.967 |
Distributions | | | | | |
Dividends from Net Investment Income | (.267) | (.16) | (.157) | (.105) | (.067) |
Distributions from Realized Capital Gains | — | — | — | — | — |
Total Distributions | (.267) | (.16) | (.157) | (.105) | (.067) |
Net Asset Value, End of Period | $14.19 | $12.13 | $10.39 | $8.63 | $7.80 |
| | | | | |
| | | | | |
Total Return1 | 19.52% | 18.39% | 22.48% | 12.15% | 33.75% |
| | | | | |
| | | | | |
Ratios/Supplemental Data | | | | | |
Net Assets, End of Period (Millions) | $11,281 | $7,814 | $5,202 | $3,471 | $2,265 |
Ratio of Total Expenses to | | | | | |
Average Net Assets | 0.22% | 0.27% | 0.32% | 0.34% | 0.39% |
Ratio of Net Investment Income to | | | | | |
Average Net Assets | 1.80% | 1.73% | 1.76% | 1.57% | 1.49% |
Portfolio Turnover Rate2 | 3% | 2% | 7% | 3% | 3% |
1 Total returns do not reflect the 2% fee assessed on redemptions of shares purchased on or after June 27, 2003, and held for less than two months or the account service fee that may be applicable to certain accounts with balances below $10,000.
2 Excludes the value of portfolio securities received or delivered as a result of in-kind purchases or redemptions of the fund’s capital shares, including ETF Creation Units.
71
Pacific Stock Index Fund
Admiral Shares | | | | | |
| | | | | |
| | | | | |
| | | Year Ended October 31, |
For a Share Outstanding Throughout Each Period | 2007 | 2006 | 2005 | 2004 | 2003 |
Net Asset Value, Beginning of Period | $79.43 | $68.05 | $56.47 | $51.05 | $38.63 |
Investment Operations | | | | | |
Net Investment Income | 1.613 | 1.302 | 1.069 | .835 | .575 |
Net Realized and Unrealized Gain (Loss) | | | | | |
on Investments | 13.714 | 11.185 | 11.583 | 5.318 | 12.318 |
Total from Investment Operations | 15.327 | 12.487 | 12.652 | 6.153 | 12.893 |
Distributions | | | | | |
Dividends from Net Investment Income | (1.817) | (1.107) | (1.072) | (.733) | (.473) |
Distributions from Realized Capital Gains | — | — | — | — | — |
Total Distributions | (1.817) | (1.107) | (1.072) | (.733) | (.473) |
Net Asset Value, End of Period | $92.94 | $79.43 | $68.05 | $56.47 | $51.05 |
| | | | | |
| | | | | |
Total Return1 | 19.64% | 18.46% | 22.68% | 12.23% | 33.82% |
| | | | | |
| | | | | |
Ratios/Supplemental Data | | | | | |
Net Assets, End of Period (Millions) | $1,292 | $1,128 | $720 | $314 | $198 |
Ratio of Total Expenses to | | | | | |
Average Net Assets | 0.12% | 0.17% | 0.20% | 0.25% | 0.30% |
Ratio of Net Investment Income to | | | | | |
Average Net Assets | 1.90% | 1.83% | 1.90% | 1.69% | 1.59% |
Portfolio Turnover Rate2 | 3% | 2% | 7% | 3% | 3% |
1 Total returns do not reflect the 2% fee assessed on redemptions of shares purchased on or after June 27, 2003, and held for less than two months.
2 Excludes the value of portfolio securities received or delivered as a result of in-kind purchases or redemptions of the fund’s capital shares, including ETF Creation Units.
72
Pacific Stock Index Fund
Signal Shares | |
| June 4, |
| 20071 to |
| Oct. 31, |
For a Share Outstanding Throughout the Period | 2007 |
Net Asset Value, Beginning of Period | $30.53 |
Investment Operations | |
Net Investment Income | .25 |
Net Realized and Unrealized Gain (Loss) on Investments | 1.50 |
Total from Investment Operations | 1.75 |
Distributions | |
Dividends from Net Investment Income | — |
Distributions from Realized Capital Gains | — |
Total Distributions | — |
Net Asset Value, End of Period | $32.28 |
| |
| |
Total Return2 | 5.73% |
| |
| |
Ratios/Supplemental Data | |
Net Assets, End of Period (Millions) | $247 |
Ratio of Total Expenses to Average Net Assets | 0.12%* |
Ratio of Net Investment Income to Average Net Assets | 1.90%* |
Portfolio Turnover Rate3 | 3% |
1 Inception.
2 Total returns do not reflect the 2% fee assessed on redemptions of shares held for less than two months.
3 Excludes the value of portfolio securities received or delivered as a result of in-kind purchases or redemptions of the fund’s capital shares, including ETF Creation Units.
* Annualized.
73
Pacific Stock Index Fund
Institutional Shares | | | | | |
| | | | | |
| | | | | |
| Year Ended October 31, |
For a Share Outstanding Throughout Each Period | 2007 | 2006 | 2005 | 2004 | 2003 |
Net Asset Value, Beginning of Period | $12.15 | $10.41 | $8.64 | $7.81 | $5.91 |
Investment Operations | | | | | |
Net Investment Income | .251 | .206 | .18 | .134 | .090 |
Net Realized and Unrealized Gain (Loss) | | | | | |
on Investments | 2.102 | 1.710 | 1.76 | .814 | 1.885 |
Total from Investment Operations | 2.353 | 1.916 | 1.94 | .948 | 1.975 |
Distributions | | | | | |
Dividends from Net Investment Income | (.283) | (.176) | (.17) | (.118) | (.075) |
Distributions from Realized Capital Gains | — | — | — | — | — |
Total Distributions | (.283) | (.176) | (.17) | (.118) | (.075) |
Net Asset Value, End of Period | $14.22 | $12.15 | $10.41 | $8.64 | $7.81 |
| | | | | |
| | | | | |
Total Return1 | 19.72% | 18.52% | 22.74% | 12.32% | 33.88% |
| | | | | |
| | | | | |
Ratios/Supplemental Data | | | | | |
Net Assets, End of Period (Millions) | $2,720 | $1,788 | $1,280 | $754 | $369 |
Ratio of Total Expenses to | | | | | |
Average Net Assets | 0.09% | 0.12% | 0.14% | 0.17% | 0.22% |
Ratio of Net Investment Income to | | | | | |
Average Net Assets | 1.93% | 1.88% | 1.95% | 1.76% | 1.70% |
Portfolio Turnover Rate2 | 3% | 2% | 7% | 3% | 3% |
1 Total returns do not reflect the 2% fee assessed on redemptions of shares purchased on or after June 27, 2003, and held for less than two months.
2 Excludes the value of portfolio securities received or delivered as a result of in-kind purchases or redemptions of the fund’s capital shares, including ETF Creation Units.
74
Pacific Stock Index Fund
ETF Shares | | | |
| | | |
| | March 4, |
| Year Ended | 20051 to |
| October 31, | Oct. 31, |
For a Share Outstanding Throughout Each Period | 2007 | 2006 | 2005 |
Net Asset Value, Beginning of Period | $64.24 | $55.09 | $50.71 |
Investment Operations | | | |
Net Investment Income | 1.314 | 1.06 | .75 |
Net Realized and Unrealized Gain (Loss) on Investments | 11.089 | 9.02 | 3.63 |
Total from Investment Operations | 12.403 | 10.08 | 4.38 |
Distributions | | | |
Dividends from Net Investment Income | (1.473) | (.93) | — |
Distributions from Realized Capital Gains | — | — | — |
Total Distributions | (1.473) | (.93) | — |
Net Asset Value, End of Period | $75.17 | $64.24 | $55.09 |
| | | |
| | | |
Total Return | 19.65% | 18.43% | 8.64% |
| | | |
| | | |
Ratios/Supplemental Data | | | |
Net Assets, End of Period (Millions) | $1,503 | $693 | $164 |
Ratio of Total Expenses to Average Net Assets | 0.12% | 0.18% | 0.18%* |
Ratio of Net Investment Income to Average Net Assets | 1.90% | 1.82% | 1.89%* |
Portfolio Turnover Rate2 | 3% | 2% | 7% |
1 Inception.
2 Excludes the value of portfolio securities received or delivered as a result of in-kind purchases or redemptions of the fund’s capital shares, including ETF Creation Units.
* Annualized.
See accompanying Notes, which are an integral part of the Financial Statements.
75
Pacific Stock Index Fund
Notes to Financial Statements
Vanguard Pacific Stock Index Fund is registered under the Investment Company Act of 1940 as an open-end investment company, or mutual fund. The fund files reports with the SEC under the company name Vanguard International Equity Index Funds. The fund invests in securities of foreign issuers, which may subject it to investment risks not normally associated with investing in securities of U.S. corporations. The fund offers five classes of shares: Investor Shares, Admiral Shares, Signal Shares, Institutional Shares, and ETF Shares. Investor Shares are available to any investor who meets the fund’s minimum purchase requirements. Admiral Shares are designed for investors who meet certain administrative, service, tenure, and account-size criteria. Signal Shares are designed for institutional investors who meet certain administrative, service, and account-size criteria. Signal Shares were first issued on June 4, 2007. Institutional Shares are designed for investors who meet certain administrative and service criteria and invest a minimum of $5 million. ETF Shares are listed for trading on the American Stock Exchange; they can be purchased and sold through a broker.
A. The following significant accounting policies conform to generally accepted accounting principles for U.S. mutual funds. The fund consistently follows such policies in preparing its financial statements.
1 Security Valuation: Securities are valued as of the close of trading on the New York Stock Exchange (generally 4 p.m., Eastern time) on the valuation date. Equity securities are valued at the latest quoted sales prices or official closing prices taken from the primary market in which each security trades; such securities not traded on the valuation date are valued at the mean of the latest quoted bid and asked prices. Securities for which market quotations are not readily available, or whose values have been affected by events occurring before the fund’s pricing time but after the close of the securities’ primary markets, are valued at their fair values calculated according to procedures adopted by the board of trustees. These procedures include obtaining quotations from an independent pricing service, monitoring news to identify significant market- or security-specific events, and evaluating changes in the values of foreign market proxies (for example, ADRs, futures contracts, or exchange-traded funds), between the time the foreign markets close and the fund’s pricing time. When fair-value pricing is employed, the prices of securities used by a fund to calculate its net asset value may differ from quoted or published prices for the same securities. Investments in Vanguard Market Liquidity Fund are valued at that fund’s net asset value. Temporary cash investments acquired over 60 days to maturity are valued using the latest bid prices or using valuations based on a matrix system (which considers such factors as security prices, yields, maturities, and ratings), both as furnished by independent pricing services. Other temporary cash investments are valued at amortized cost, which approximates market value.
2. Foreign Currency: Securities and other assets and liabilities denominated in foreign currencies are translated into U.S. dollars using exchange rates obtained from an independent third party as of the fund’s pricing time on the valuation date. Realized gains (losses) and unrealized appreciation (depreciation) on investment securities include the effects of changes in exchange rates since the securities were purchased, combined with the effects of changes in security prices. Fluctuations in the value of other assets and liabilities resulting from changes in exchange rates are recorded as unrealized foreign currency gains (losses) until the assets or liabilities are settled in cash, at which time they are recorded as realized foreign currency gains (losses).
3. Futures and Forward Currency Contracts: The fund uses index futures contracts to a limited extent, with the objectives of maintaining full exposure to the stock market, enhancing returns, maintaining liquidity, and minimizing transaction costs. The fund may purchase futures contracts to immediately invest incoming cash in the market, or sell futures in response to cash outflows, thereby simulating a fully invested position in the underlying index while maintaining a
76
Pacific Stock Index Fund
cash balance for liquidity. The fund
may seek to enhance returns by using futures contracts instead of the underlying securities when futures are believed to be priced more attractively than the underlying securities. The primary risks associated with the use of futures contracts are imperfect correlation between changes in market values of stocks held by the fund and the prices of futures contracts, and the possibility of an illiquid market.
The fund also may enter into forward currency contracts to provide the appropriate currency exposure related to any open futures contracts. The fund’s risks in using these contracts include movement in the values of the foreign currencies relative to the U.S. dollar and the ability of the counterparties to fulfill their obligations under the contracts.
Futures and forward currency contracts are valued at their quoted daily settlement prices. The aggregate principal amounts of the contracts are not recorded in the Statement of Net Assets. Fluctuations in the value of the contracts are recorded in the Statement of Net Assets as an asset (liability) and in the Statement of Operations as unrealized appreciation (depreciation) until the contracts are closed, when they are recorded as realized gains (losses) on futures or forward currency contracts.
4. Federal Income Taxes: The fund intends to continue to qualify as a regulated investment company and distribute all of its taxable income. Accordingly, no provision for federal income taxes is required in the financial statements.
5. Distributions: Distributions to shareholders are recorded on the ex-dividend date.
6. Security Lending: The fund may lend its securities to qualified institutional borrowers to earn additional income. Security loans are required to be secured at all times by collateral at least equal to the market value of securities loaned. The fund invests cash collateral received in Vanguard Market Liquidity Fund, and records a liability for the return of the collateral, during the period the securities are on loan. Security lending income represents the income earned on investing cash collateral, less expenses associated with the loan.
7. Other: Dividend income is recorded on the ex-dividend date. Interest income includes income distributions received from Vanguard Market Liquidity Fund and is accrued daily. Security transactions are accounted for on the date securities are bought or sold. Costs used to determine realized gains (losses) on the sale of investment securities are those of the specific securities sold. Fees assessed on redemptions of capital shares are credited to paid-in capital.
Each class of shares has equal rights as to assets and earnings, except that each class separately bears certain class-specific expenses related to maintenance of shareholder accounts (included in Management and Administrative expenses) and shareholder reporting. Marketing and distribution expenses are allocated to each class of shares based on a method approved by the board of trustees. Income, other non-class-specific expenses, and gains and losses on investments are allocated to each class of shares based on its relative net assets.
B. The Vanguard Group furnishes at cost investment advisory, corporate management, administrative, marketing, and distribution services. The costs of such services are allocated to the fund under methods approved by the board of trustees. The fund has committed to provide up to 0.40% of its net assets in capital contributions to Vanguard. At October 31, 2007, the fund had contributed capital of $1,375,000 to Vanguard (included in Other Assets), representing 0.01% of the fund’s net assets and 1.37% of Vanguard’s capitalization. The fund’s trustees and officers are also directors and officers of Vanguard.
77
Pacific Stock Index Fund
C. Distributions are determined on a tax basis and may differ from net investment income and realized capital gains for financial reporting purposes. Differences may be permanent or temporary. Permanent differences are reclassified among capital accounts in the financial statements to reflect their tax character. Temporary differences arise when certain items of income, expense, gain, or loss are recognized in different periods for financial statement and tax purposes; these differences will reverse at some time in the future. Differences in classification may also result from the treatment of short-term gains as ordinary income for tax purposes.
During the year ended October 31, 2007, the fund realized net foreign currency gains of $1,097,000, which increased distributable net income for tax purposes; accordingly, such gains have been reclassified from accumulated net realized losses to undistributed net investment income. Certain of the fund’s investments are in securities considered to be “passive foreign investment companies,” for which any unrealized appreciation and/or realized gains are required to be included in distributable net income for tax purposes. During the year ended October 31, 2007, the fund realized gains on the sale of passive foreign investment companies of $5,344,000, which have been included in current and prior periods’ taxable income; accordingly, such gains have been reclassified from accumulated net realized losses to undistributed net investment income. Unrealized appreciation on the fund’s passive foreign investment company holdings at October 31, 2007, was $194,526,000, of which $104,173,000 has been distributed and is reflected in the balance of undistributed net income.
During the year ended October 31, 2007, the fund realized $10,913,000 of net capital gains resulting from in-kind redemptions—in which shareholders exchanged fund shares for securities held by the fund rather than for cash. Because such gains are not taxable to the fund, and are not distributed to shareholders, they have been reclassified from accumulated net realized losses to paid-in capital.
For tax purposes, at October 31, 2007, the fund had $337,040,000 of ordinary income available for distribution. The fund had available realized losses of $79,725,000 to offset future net capital gains of $1,920,000 through October 31, 2009, $68,660,000 through October 31, 2010, $4,471,000 through October 31, 2011, and $4,674,000 through October 31, 2013.
At October 31, 2007, the cost of investment securities for tax purposes was $13,149,250,000. Net unrealized appreciation of investment securities for tax purposes was $4,150,300,000, consisting of unrealized gains of $4,757,661,000 on securities that had risen in value since their purchase and $607,361,000 in unrealized losses on securities that had fallen in value since their purchase.
At October 31, 2007, the aggregate settlement value of open futures contracts expiring in December 2007 and the related unrealized appreciation (depreciation) were:
| | | ($000) |
| | Aggregate | Unrealized |
| Number of | Settlement | Appreciation |
Futures Contracts | Long Contracts | Value | (Depreciation) |
Topix Index | 530 | 74,315 | 2,456 |
ASX 200 Index | 174 | 27,389 | 1,008 |
78
Pacific Stock Index Fund
At October 31, 2007, the fund had open forward currency contracts to receive and deliver currencies as follows:
| | | | | Unrealized |
| | | | | Appreciation |
| | Contract Amount (000) | (Depreciation) |
Contract Settlement Date | | Receive | | Deliver | ($000) |
12/28/2007 | AUD | 29,571 | USD | 27,315 | 1,333 |
12/19/2007 | JPY | 2,898,091 | USD | 25,286 | (3) |
| | | | | |
AUD—Australian dollar. | | | | | |
JPY—Japanese yen. | | | | | |
USD—U.S. dollar. | | | | | |
Unrealized appreciation (depreciation) on open forward currency contracts is treated as realized gain (loss) for tax purposes.
The fund had net unrealized foreign currency losses of $546,000 resulting from the translation of other assets and liabilities at October 31, 2007.
D. During the year ended October 31, 2007, the fund purchased $3,698,629,000 of investment securities and sold $411,782,000 of investment securities, other than temporary cash investments.
E. The market value of securities on loan to broker-dealers at October 31, 2007, was $307,796,000, for which the fund received cash collateral of $323,075,000.
79
Pacific Stock Index Fund
F. Capital share transactions for each class of shares were:
| Year Ended October 31, |
| | 2007 | | | 2006 |
| Amount | Shares | | Amount | Shares |
| ($000) | (000) | | ($000) | (000) |
Investor Shares | | | | | |
Issued | 2,509,485 | 193,872 | | 2,349,884 | 201,048 |
Issued in Lieu of Cash Distributions | 174,133 | 14,134 | | 80,759 | 7,090 |
Redeemed1 | (746,241) | (57,211) | | (751,786) | (64,382) |
Net Increase (Decrease)—Investor Shares | 1,937,377 | 150,795 | | 1,678,857 | 143,756 |
Admiral Shares | | | | | |
Issued | 364,227 | 4,302 | | 465,655 | 6,139 |
Issued in Lieu of Cash Distributions | 22,198 | 275 | | 11,005 | 148 |
Redeemed1 | (428,495) | (4,870) | | (204,573) | (2,672) |
Net Increase (Decrease)—Admiral Shares | (42,070) | (293) | | 272,087 | 3,615 |
Signal Shares | | | | | |
Issued | 249,314 | 7,875 | | — | — |
Issued in Lieu of Cash Distributions | — | — | | — | — |
Redeemed1 | (6,799) | (220) | | — | — |
Net Increase (Decrease)—Signal Shares | 242,515 | 7,655 | | — | — |
Institutional Shares | | | | | |
Issued | 963,535 | 73,688 | | 1,168,762 | 99,284 |
Issued in Lieu of Cash Distributions | 36,590 | 2,965 | | 20,167 | 1,769 |
Redeemed1 | (426,456) | (32,512) | | (899,335) | (76,780) |
Net Increase (Decrease)—Institutional Shares | 573,669 | 44,141 | | 289,594 | 24,273 |
ETF Shares | | | | | |
Issued | 628,365 | 9,203 | | 481,727 | 7,812 |
Issued in Lieu of Cash Distributions | — | — | | — | — |
Redeemed | — | — | | — | — |
Net Increase (Decrease)—ETF Shares | 628,365 | 9,203 | | 481,727 | 7,812 |
G. In June 2006, the Financial Accounting Standards Board issued Interpretation No. 48 (“FIN 48”), “Accounting for Uncertainty in Income Taxes.” FIN 48 establishes the minimum threshold for recognizing, and a system for measuring, the benefits of tax-return positions in financial statements, and is effective for the fund’s fiscal year beginning November 1, 2007. Management has analyzed the fund’s tax positions taken on federal income tax returns for all open tax years (tax years ended October 31, 2004–2007) for purposes of implementing FIN 48, and has concluded that as of October 31, 2007, no provision for income tax would be required in the fund’s financial statements.
1 Net of redemption fees of $508,000 and $548,000 (fund totals).
80
Emerging Markets Stock Index Fund
Fund Profile
As of October 31, 2007
Portfolio Characteristics | | |
| | Target | Broad |
| Fund | Index1 | Index2 |
Number of Stocks | 859 | 826 | 2,067 |
Turnover Rate | 9% | — | — |
Expense Ratio | | — | — |
Investor Shares | 0.37% | | |
Admiral Shares | 0.25% | | |
Signal Shares | 0.25%3 | | |
Institutional Shares | 0.20% | | |
ETF Shares | 0.25% | | |
Short-Term Reserves | 0.2% | — | — |
Sector Diversification (% of equity exposure) |
| | Target | Broad |
| Fund | Index1 | Index2 |
Consumer Discretionary | 5.1% | 5.1% | 9.8% |
Consumer Staples | 4.5 | 4.5 | 7.6 |
Energy | 16.6 | 16.5 | 10.7 |
Financials | 21.8 | 21.6 | 24.8 |
Health Care | 1.5 | 1.5 | 6.6 |
Industrials | 9.9 | 10.1 �� | 11.3 |
Information Technology | 10.9 | 10.9 | 9.6 |
Materials | 15.3 | 15.3 | 9.2 |
Telecommunication | | | |
Services | 11.1 | 11.1 | 6.1 |
Utilities | 3.3 | 3.4 | 4.3 |
Volatility Measures4 | |
| Fund Versus | Fund Versus |
| Target Index1 | Broad Index2 |
R-Squared | 0.99 | 0.85 |
Beta | 0.99 | 1.59 |
81
Ten Largest Holdings5 (% of total net assets) |
| | |
China Mobile | wireless | |
(Hong Kong) Ltd. | telecommunication | |
| services | 3.3% |
Petroleo Brasileiro SA | integrated | |
| oil and gas | 3.2 |
OAO Gazprom ADR | integrated | |
| oil and gas | 3.1 |
Companhia Vale do | | |
Rio Doce Pfd. | steel | 2.7 |
Samsung | | |
Electronics Co., Ltd. | semiconductors | 2.0 |
America Movil SA de CV | wireless | |
| telecommunication | |
| services | 1.5 |
Posco | steel | 1.4 |
PetroChina Co. Ltd. | integrated | |
| oil and gas | 1.3 |
China Life | life and | |
Insurance Co., Ltd. | health insurance | 1.2 |
Reliance Industries Ltd. | oil and gas refining | |
| and marketing | 1.2 |
Top Ten | | 20.9% |
1 MSCI Emerging Markets Index.
2 MSCI All Country World Index ex USA.
3 Annualized.
4 For an explanation of R-squared, beta, and other terms used here, see the Glossary on page 165.
5 “Ten Largest Holdings” excludes any temporary cash investments and equity index products.
82
Emerging Markets Stock Index Fund
Market Diversification (% of equity exposure) |
| | Target |
| Fund | Index1 |
China | 17.2% | 17.2% |
South Korea | 15.2 | 15.0 |
Brazil | 12.3 | 12.4 |
Taiwan | 10.8 | 10.8 |
Russia | 9.0 | 8.9 |
India | 7.3 | 7.3 |
South Africa | 7.0 | 7.0 |
Mexico | 4.6 | 4.6 |
Malaysia | 2.3 | 2.3 |
Israel | 2.1 | 2.0 |
Turkey | 1.8 | 1.7 |
Indonesia | 1.7 | 1.6 |
Poland | 1.7 | 1.7 |
Thailand | 1.5 | 1.4 |
Chile | 1.4 | 1.4 |
Other Emerging Markets | 4.1 | 4.7 |
1 MSCI Emerging Markets Index.
83
Emerging Markets Stock Index Fund
Performance Summary
All of the returns in this report represent past performance, which is not a guarantee of future results that may be achieved by the fund. (Current performance may be lower or higher than the performance data cited. For performance data current to the most recent month-end, visit our website at www.vanguard.com/performance.) Note, too, that both investment returns and principal value can fluctuate widely, so an investor’s shares, when sold, could be worth more or less than their original cost. The returns shown do not reflect taxes that a shareholder would pay on fund distributions or on the sale of fund shares.
Cumulative Performance: October 31, 1997–October 31, 2007
Initial Investment of $10,000
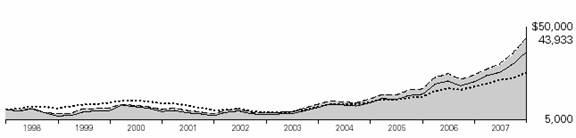
| | | |
| | | | |
| Average Annual Total Returns | Final Value of |
| Periods Ended October 31, 2007 | a $10,000 |
| One Year | Five Years | Ten Years | Investment |
Emerging Markets Stock Index Fund | | | | |
Investor Shares1 | 67.91% | 39.49% | 15.95% | $43,933 |
MSCI All Country World Index ex USA | 32.97 | 26.39 | 10.75 | 27,762 |
Spliced Emerging Markets Index2 | 67.84 | 39.93 | 16.09 | 44,467 |
Average Emerging Markets Fund3 | 63.25 | 38.54 | 14.30 | 38,071 |
| | | Final Value of |
| | Since | a $100,000 |
| One Year | Inception4 | Investment |
Emerging Markets Stock Index Fund Admiral Shares1 | 68.14% | 63.78% | $195,248 |
MSCI All Country World Index ex USA | 32.97 | 35.38 | 150,797 |
Spliced Emerging Markets Index2 | 67.84 | 63.64 | 195,008 |
1 Performance figures are adjusted for the 0.5% transaction fee on purchases and redemptions. Total returns do not reflect the 2% fee assessed until March 23, 2005, on redemptions of shares purchased on or after June 27, 2003, and held for less than two months, or, for Investor Shares, the account service fee that may be applicable to certain accounts with balances below $10,000.
2 Select Emerging Markets Index through August 23, 2006; MSCI Emerging Markets Index thereafter.
3 Derived from data provided by Lipper Inc.
4 Performance for the fund’s Admiral Shares and comparative standards is calculated since the Admiral Shares’ inception: June 23, 2006.
84
Emerging Markets Stock Index Fund
| | Final Value of |
| Since | a $10,000,000 |
| Inception1 | Investment |
Emerging Markets Stock Index Fund Signal Shares2 | 51.90% | $15,189,672 |
MSCI All Country World Index ex USA | 24.66 | 12,465,993 |
MSCI Emerging Markets Index | 51.99 | 15,199,247 |
| | | | Final Value of |
| | | Since | a $5,000,000 |
| One Year | Five Years | Inception1 | Investment |
Emerging Markets Stock Index Fund | | | | |
Institutional Shares2 | 68.23% | 39.74% | 19.74% | $18,816,427 |
MSCI All Country World Index ex USA | 32.97 | 26.39 | 9.51 | 9,757,395 |
Spliced Emerging Markets Index3 | 67.84 | 39.93 | 19.89 | 18,995,675 |
| | | Final Value |
| | Since | of a $10,000 |
| One Year | Inception1 | Investment |
Emerging Markets Stock Index Fund ETF Shares | 69.78% | 38.75% | $23,901 |
MSCI All Country World Index ex USA | 32.97 | 24.17 | 17,789 |
Spliced Emerging Markets Index3 | 67.84 | 38.45 | 23,762 |
Cumulative Returns: ETF Shares, March 4, 2005–October 31, 2007 |
| | |
| | Since |
| One Year | Inception1 |
Emerging Markets Stock Index Fund ETF Shares Market Price | 68.74% | 139.95% |
Emerging Markets Stock Index Fund Shares Net Asset Value | 69.78 | 139.01 |
Spliced Emerging Markets Index3 | 67.84 | 137.62 |
1 Performance for the fund and its comparative standards is calculated since the following inception dates: January 19, 2007, for the Signal Shares; June 22, 2000, for the Institutional Shares; and March 4, 2005, for the ETF Shares.
2 Performance figures are adjusted for the 0.5% transaction fee on purchases and redemptions. Total returns do not reflect the 2% fee assessed until March 23, 2005, on redemptions of shares purchased on or after June 27, 2003, and held for less than two months.
3 Select Emerging Markets Index through August 23, 2006; MSCI Emerging Markets Index thereafter.
85
Emerging Markets Stock Index Fund
Fiscal-Year Total Returns (%): October 31, 1997–October 31, 2007
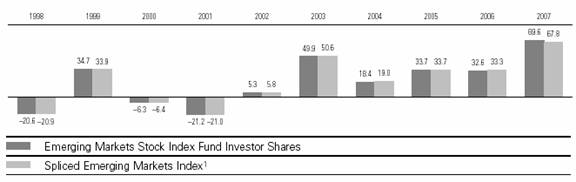
Average Annual Total Returns: Periods Ended September 30, 2007
This table presents average annual total returns through the latest calendar quarter—rather than through the end of the fiscal period. Securities and Exchange Commission rules require that we provide this information.
| Inception Date | One Year | Five Years | Ten Years |
Emerging Markets Stock Index Fund | | | | |
Investor Shares2 | 5/4/1994 | 58.18% | 38.30% | 12.45% |
Fee-Adjusted Returns3 | | 56.62 | 38.04 | 12.35 |
Admiral Shares | 6/23/2006 | 58.29 | 55.664 | — |
Fee-Adjusted Returns3 | | 56.73 | 54.454 | — |
Signal Shares | 1/19/2007 | 36.574 | — | — |
Fee-Adjusted Returns3 | | 35.214 | — | — |
Institutional Shares | 6/22/2000 | 58.37 | 38.52 | 18.234 |
Fee-Adjusted Returns3 | | 56.81 | 38.26 | 18.084 |
ETF Shares | 3/4/2005 | | | |
Market Price | | 57.20 | 33.964 | — |
Net Asset Value | | 58.30 | 34.064 | — |
1 Select Emerging Markets Index through August 23, 2006; MSCI Emerging Markets Index thereafter.
2 Returns do not reflect the account service fee that may be applicable to certain accounts with balances below $10,000.
3 Performance figures are adjusted for the 0.5% transaction fee on purchases and redemptions.
4 Returns since inception.
Note: See Financial Highlights tables on pages 118-122 for dividend and capital gains information.
86
Emerging Markets Stock Index Fund
Financial Statements
Statement of Net Assets
As of October 31, 2007
The fund provides a complete list of its holdings four times in each fiscal year, at the quarter-ends. For the second and fourth fiscal quarters, the lists appear in the fund’s semiannual and annual reports to shareholders. For the first and third fiscal quarters, the fund files the lists with the Securities and Exchange Commission on Form N-Q. Shareholders can look up the fund’s Forms N-Q on the SEC’s website at www.sec.gov. Forms N-Q may also be reviewed and copied at the SEC’s Public Reference Room (see the back cover of this report for further information).
| | | Market |
| | | Value• |
| | Shares | ($000) |
Common Stocks (99.5%) | | |
Argentina (0.6%) | | |
| Tenaris SA ADR | 870,005 | 46,806 |
| Tenaris SA | 1,531,436 | 41,440 |
| Banco Macro Bansud | | |
| SA ADR | 317,764 | 8,786 |
| Siderar SA Class A | 883,933 | 7,879 |
| Petrobras Energia | | |
| Participaciones SA ADR | 651,995 | 7,791 |
* | Telecom Argentina SA ADR | 321,157 | 7,711 |
* | Telecom Argentina SA | 1,507,786 | 7,320 |
* | Grupo Financiero | | |
| Galicia SA ADR | 639,100 | 5,094 |
| Petrobras Energia | | |
| Participaciones SA | 3,164,909 | 3,778 |
* | IRSA Inversiones y | | |
| Representaciones SA GDR | 207,075 | 3,698 |
*^ | Transportadora de | | |
| Gas del SA ADR | 481,610 | 3,419 |
| Cresud SA ADR | 106,745 | 2,634 |
| BBVA Banco | | |
| Frances SA ADR | 272,544 | 2,597 |
* | Transportadora de | | |
| Gas Sur SA | 953,920 | 1,351 |
| BBVA Banco Frances SA | 424,248 | 1,351 |
| Solvay Indupa S.A.I.C. | 782,532 | 1,044 |
* | IRSA Inversiones y | | |
| Representaciones SA | 563,918 | 1,005 |
| Cresud SA | 209,663 | 522 |
| | | 154,226 |
Brazil (12.2%) | | |
| Petroleo Brasileiro SA Pfd. | 8,542,456 | 356,131 |
| Companhia Vale do | | |
| Rio Doce Pfd. Class A | 10,463,318 | 330,106 |
| Petroleo Brasileiro SA | 6,189,448 | 295,408 |
| Companhia Vale do | | |
87
| | | Market |
| | | Value• |
| | Shares | ($000) |
| Rio Doce | 7,305,070 | 272,676 |
| Banco Bradesco SA | 5,259,800 | 178,705 |
| Banco Itau Holding | | |
| Financeira SA | 5,402,600 | 153,276 |
| Unibanco-Uniao de | | |
| Bancos Brasileiros SA | 5,802,183 | 91,794 |
| Petroleo Brasileiro | | |
| Series A ADR | 1,086,232 | 90,364 |
| Companhia de Bebidas | | |
| das Americas Pfd. | 1,089,009 | 89,353 |
| Companhia Vale do | | |
| Rio Doce ADR | 2,582,642 | 81,534 |
| Petroleo Brasileiro SA ADR | 770,996 | 73,730 |
| Cia Vale do Rio Doce ADR | 1,835,880 | 69,176 |
| Usiminas-Usinas | | |
| Siderugicas de Minas | | |
| Gerais SA Pfd. | 735,925 | 57,700 |
| Gerdau SA Pfd. | 1,723,700 | 53,713 |
| Companhia Siderurgica | | |
| Nacional SA | 669,920 | 53,593 |
| All America Latina | | |
| Logistica | 2,601,913 | 41,194 |
| Banco Bradesco SA ADR | 1,186,210 | 40,509 |
| Banco Itau Holding | | |
| Financeira SA ADR | 1,241,216 | 35,437 |
| Companhia Energetica de | | |
| Minas Gerais Pfd. | 1,628,941 | 35,098 |
| Tele Norte Leste | | |
| Participacoes SA Pfd. | 1,568,763 | 34,155 |
| Lojas Americanas SA Pfd. | 2,308,360 | 26,863 |
| Empresa Brasileira de | | |
| Aeronautica SA | 2,120,449 | 25,742 |
| Centrais Electricas | | |
| Brasileiras SA | 1,621,483 | 25,297 |
| Uniao de Bancos | | |
| Brasileiros SA GDR | 154,541 | 24,424 |
| Cyrela Brazil Realty SA | 1,292,344 | 22,156 |
| Vivo Participacoes SA Pfd. | 3,639,723 | 21,599 |
| Centrais Electricas | | |
| Brasileiras SA Pfd. | | |
| B Shares | 1,382,718 | 21,093 |
* | Redecard SA | 995,192 | 21,046 |
| Votorantim Celulose e | | |
| Papel SA Pfd. | 668,295 | 21,022 |
| Companhia de Bebidas | | |
| das Americas ADR | 248,130 | 20,275 |
* | CESP–Companhia | | |
| Energetica de Sao Paulo | 1,069,508 | 20,270 |
| CPFL Energia SA | 878,300 | 19,336 |
| B2W Com Global Do Varejo | 356,653 | 19,248 |
| Lojas Renner SA | 777,348 | 19,090 |
88
| | | Market |
| | | Value• |
| | Shares | ($000) |
| Tele Norte Leste | | |
| Participacoes SA | 479,371 | 18,420 |
| Brasil Telecom | | |
| Participacoes SA Pfd. | 1,225,126 | 18,299 |
| Aracruz Celulose SA Pfd. | | |
| B Shares | 2,295,505 | 17,575 |
| Tim Participacoes SA Pfd. | 3,690,132 | 17,186 |
* | Net Servicos | | |
| de Comunicacao SA | 1,066,141 | 17,113 |
| Companhia de | | |
| Concessoes Rodoviarias | 884,165 | 16,251 |
| Companhia de | | |
| Saneamento Basico do | | |
| Estado de Sao Paulo | 622,882 | 16,239 |
| Perdigao SA | 584,279 | 15,834 |
| Souza Cruz SA | 523,115 | 14,965 |
| Duratex SA Pfd. | 444,250 | 14,860 |
| Tractebel Energia SA | 966,091 | 13,487 |
| Klabin SA | 3,154,400 | 13,160 |
| Tam SA | 442,771 | 13,045 |
| Sadia SA Pfd. | 1,842,877 | 12,565 |
^ | Companhia Siderurgica | | |
| Nacional SA ADR | 148,778 | 11,887 |
| Braskem SA | 1,227,560 | 11,633 |
| Gerdau SA | 445,810 | 11,409 |
| Electropaulo | | |
| Metropolitana SA | 147,138,437 | 11,350 |
| Brasil Telecom | | |
| Participacoes SA | 370,194 | 11,337 |
| Gerdau SA ADR | 361,319 | 11,237 |
| Embraer-Empresa | | |
| Brasileira de Aeronautica | | |
| SA ADR | 211,578 | 10,319 |
| Gol - Linhas Aereas | | |
| Inteligentes SA Pfd. | 337,967 | 9,294 |
| Companhia Paranaense | | |
| de Energia–COPEL | 558,539 | 9,214 |
| Natura Cosmeticos SA | 713,133 | 8,468 |
| Energias do Brasil SA | 521,377 | 8,432 |
| Gafisa SA | 459,162 | 8,251 |
| Aracruz Celulose SA ADR | 100,981 | 7,764 |
| Diagnosticos da America | 297,853 | 6,953 |
| Companhia Energetica | | |
| de Minas Gerais ADR | 279,516 | 6,038 |
| Tele Norte Leste | | |
| Participacoes ADR | 251,610 | 5,485 |
| Cosan SA Industria | | |
| e Comercio | 345,977 | 5,408 |
Companhia de Saneamento | |
Basico do Estado de | | |
89
| | | Market |
| | | Value• |
| | Shares | ($000) |
Sao Paulo ADR | 103,485 | 5,383 |
Brasil Telecom | | |
Participacoes ADR | 70,724 | 5,261 |
Banco Nossa Caixa SA | 293,656 | 5,218 |
^Sadia SA ADR | 65,262 | 4,453 |
Companhia Brasileira | | |
de Distribuicao Grupo | | |
Pao de Acucar Pfd. | 273,669 | 4,394 |
Companhia de Tecidos | | |
Norte de Minas Pfd. | 548,057 | 4,364 |
Tim Participacoes SA ADR | 78,696 | 3,651 |
Companhia Brasileira de | | |
Distribuicao Grupo Pao | | |
de Acucar ADR | 110,533 | 3,557 |
^Companhia Paranaense | | |
de Energia–COPEL ADR | 178,340 | 2,943 |
* Bovespa Holding SA | 144,700 | 2,755 |
Votorantim Celulose e | | |
Papel SA ADR | 2,038 | 64 |
Vivo Participacoes SA ADR | 9,939 | 59 |
Braskem SA ADR | 2,279 | 43 |
| | 3,156,736 |
Chile (1.4%) | | |
Empresas Copec SA | 2,832,115 | 50,579 |
Empresa Nacional de | | |
Electricidad SA | 16,954,457 | 26,491 |
Enersis SA | 67,237,979 | 26,472 |
Empresas CMPC SA | 634,291 | 25,487 |
Cencosud SA | 5,118,549 | 22,074 |
CAP SA | 539,543 | 17,388 |
Lan Airlines SA | 921,001 | 15,056 |
Sociedad Quimica y | | |
Minera de Chile SA | 719,057 | 13,673 |
S.A.C.I. Falabella, SA | 2,125,200 | 12,637 |
Empresa Nacional de | | |
Telecomunicaciones SA | 695,585 | 12,422 |
Colburn SA | 44,864,530 | 11,108 |
Banco Santander | | |
Chile SA | 196,905,081 | 9,990 |
Enersis SA ADR | 475,081 | 9,416 |
Empresa Nacional de | | |
Electricidad SA ADR | 196,350 | 9,193 |
Distribucion y Servicio | | |
D&S SA | 14,026,707 | 8,540 |
* Compania SudAmericana | | |
de Vapores SA | 2,867,885 | 8,323 |
Banco de Credito | | |
e Inversiones | 232,480 | 7,738 |
Compania de | | |
Telecomunicaciones | | |
90
| | | Market |
| | | Value• |
| | Shares | ($000) |
de Chile SA | 3,102,241 | 7,554 |
Banco Santander | | |
Chile SA ADR | 139,889 | 7,413 |
| Compania Cervecerias | | |
| Unidas SA | 846,858 | 6,971 |
| Vina Concha y Toro SA | 2,423,308 | 6,295 |
| Masisa SA | 24,369,868 | 5,836 |
| Corpbanca | 690,247,924 | 5,323 |
| Parque Arauco SA | 4,039,018 | 5,205 |
| Inversiones Aguas | | |
| Metropolitanas SA | 3,957,677 | 4,899 |
| Cristalerias de Chile | 333,516 | 4,670 |
| Embotelladora Andina | | |
| SA Pfd. Class B | 1,150,697 | 3,853 |
* | Madeco SA | 29,489,212 | 3,719 |
| Embotelladora Andina SA | 1,075,533 | 3,275 |
| Sociedad Quimica y | | |
| Minera de Chile ADR | 15,230 | 2,924 |
| Compania de | | |
| Telecomunicaciones | | |
| de Chile SA ADR | 226,400 | 2,212 |
| Distribucion y Servicio | | |
| SA ADR | 45,745 | 1,666 |
| Empresas Iansa SA | 7,756,599 | 749 |
| | | 359,151 |
China (17.2%) | | |
| China Mobile | | |
| (Hong Kong) Ltd. | 40,787,267 | 843,214 |
| PetroChina Co. Ltd. | 128,624,724 | 332,098 |
| China Life | | |
| Insurance Co., Ltd. | 47,912,460 | 319,816 |
| CNOOC Ltd. | 103,038,552 | 222,678 |
| China Construction Bank | 169,871,848 | 193,121 |
| Industrial and Commercial | | |
| Bank of China | 199,584,219 | 190,625 |
| China Petroleum & | | |
| Chemical Corp. | 113,973,180 | 181,472 |
| China Shenhua | | |
| Energy Co. Ltd. | | |
| H–Shares | 22,224,000 | 143,220 |
| Ping An Insurance | | |
| (Group) Co. of | | |
| China Ltd. | 9,588,536 | 134,220 |
| Bank of China | 155,975,575 | 102,838 |
| China Communications | | |
| Construction Co., Ltd. | 28,805,534 | 91,400 |
| China Telecom Corp. Ltd. | 95,098,790 | 82,227 |
| China COSCO | | |
| Holdings Co., Ltd. | 17,131,000 | 76,402 |
| Bank of Communications | | |
| Ltd. Class H | 39,757,692 | 72,542 |
91
| | | Market |
| | | Value• |
| | Shares | ($000) |
| Aluminum Corp. of | | |
| China Ltd. | 21,920,280 | 62,515 |
| China Overseas Land & | | |
| Investment Ltd. | 24,231,968 | 58,002 |
| China Merchants Holdings | | |
| International Co. Ltd. | 7,304,452 | 51,522 |
| Fujian Zijin Mining | | |
| Industry Co., Ltd. | 27,488,120 | 47,994 |
| CITIC Pacific Ltd. | 7,607,828 | 47,974 |
| China Resources Power | | |
| Holdings Co., Ltd. | 10,168,040 | 38,038 |
| China Resources | | |
| Enterprise Ltd. | 8,277,681 | 36,309 |
| Guangzhou R&F | | |
| Properties Co. Ltd. | 6,712,800 | 35,341 |
| PICC Property and | | |
| Casualty Co., Ltd. | 16,551,551 | 35,076 |
| Jiangxi Copper Co. Ltd. | 9,837,502 | 34,795 |
* | Country Garden | | |
| Holdings Co. | 20,789,307 | 34,257 |
| Shimao Property | | |
| Holdings Ltd. | 9,344,826 | 33,455 |
| Anhui Conch | | |
| Cement Co. Ltd. | 3,079,638 | 30,759 |
| China Shipping | | |
| Development Co. | 8,907,904 | 30,438 |
| China Shipping Container | | |
| Lines Co. Ltd. | 22,408,618 | 29,723 |
| Yanzhou Coal Mining Co. | | |
| Ltd. H Shares | 13,493,972 | 29,086 |
| Lenovo Group Ltd. | 23,894,762 | 27,213 |
| China Mengniu | | |
| Dairy Co., Ltd. | 6,290,036 | 26,721 |
| China Resources | | |
| Land Ltd. | 10,470,000 | 26,489 |
* | China Citic Bank | 32,015,100 | 26,050 |
| Agile Property | | |
| Holdings, Inc. | 10,667,670 | 25,891 |
| Air China Ltd. | 16,716,243 | 25,507 |
| Angang Steel Co., Ltd. | 6,848,976 | 25,217 |
| Huaneng Power | | |
| International, Inc. | | |
| H Shares | 21,228,252 | 24,944 |
| Nine Dragons Paper | | |
| Holdings Ltd. | 9,196,150 | 24,911 |
| Beijing Datang Power | | |
| Generation Co., Ltd. | 21,841,406 | 24,859 |
| Denway Motors Ltd. | 34,140,443 | 24,092 |
| Cosco Pacific Ltd. | 7,661,752 | 23,876 |
* | China Everbright Ltd. | 5,148,220 | 23,155 |
92
| | | Market |
| | | Value• |
| | Shares | ($000) |
| GOME Electrical | | |
| Appliances Holdings Ltd. | 10,017,960 | 22,530 |
| Shanghai Industrial | | |
| Holding Ltd. | 3,739,145 | 22,059 |
| Beijing Capital International | | |
| Airport Co., Ltd. | 10,253,604 | 20,421 |
| Shanghai Electric | | |
| Group Co., Ltd. Class H | 20,424,492 | 20,282 |
| Li Ning Co., Ltd. | 4,950,568 | 18,605 |
| Beijing Enterprises | | |
| Holdings Ltd. | 2,788,000 | 17,342 |
| China Travel International | 21,366,200 | 17,166 |
| Hopson Development | | |
| Holdings Ltd. | 4,222,211 | 16,359 |
| Dongfeng Motor Corp. | 16,781,522 | 15,474 |
| Sinofert Holdings, Ltd. | 16,244,000 | 15,323 |
| Hengan International | | |
| Group Co. Ltd. | 3,824,000 | 14,914 |
| Zhejiang | | |
| Expressway Co., Ltd. | 10,025,088 | 14,478 |
| Sinopec Shanghai | | |
| Petrochemical Co. Ltd. | 16,117,528 | 13,175 |
| Shenzhen Investment Ltd. | 13,181,784 | 12,743 |
| China International | | |
| Marine Containers | | |
| (Group) Co.,Ltd. | 5,957,532 | 12,340 |
| Guangdong | | |
| Investment Ltd. | 17,380,384 | 11,946 |
* | China Southern | | |
| Airlines Co. Ltd. | 8,343,658 | 11,636 |
| Maanshan Iron and | | |
| Steel Co. Ltd. | 12,843,612 | 11,446 |
| Chaoda Modern | | |
| Agriculture Holdings Ltd. | 12,342,890 | 11,265 |
* | China Eastern | | |
| Airlines Corp. Ltd. | 10,292,936 | 11,203 |
| BYD Co. Ltd. | 1,142,650 | 10,775 |
* | Semiconductor | | |
| Manufacturing | | |
| International Corp. | 87,977,340 | 10,038 |
| Hunan Non-Ferrous | | |
| Metal Corp., Ltd. | 10,862,000 | 9,961 |
| Jiangsu Expressway Co. | | |
| Ltd. H Shares | 8,215,342 | 9,504 |
| Weichai Power Co., Ltd. | | |
| Class H | 865,920 | 8,918 |
| Xinao Gas Holdings Ltd. | 4,538,695 | 8,639 |
| Tsingtao | | |
| Brewery Co., Ltd. | 2,414,228 | 8,617 |
| The Guangshen | | |
| Railway Co., Ltd. | 10,004,035 | 8,540 |
93
| | | Market |
| | | Value• |
| | Shares | ($000) |
| Guangzhou | | |
| Investment Co. Ltd. | 19,830,000 | 8,448 |
| ZTE Corp. | 1,179,148 | 7,207 |
| Huadian Power | | |
| International Corp. Ltd. | 10,362,428 | 7,179 |
| TPV Technology Ltd. | 10,179,354 | 6,855 |
| Sinotrans Ltd. | 10,707,580 | 6,851 |
| Zhejiang Southeast | | |
| Electric Power Co., Ltd. | 4,690,591 | 5,845 |
| Weiqiao Textile Co. Ltd. | 3,004,887 | 5,662 |
* | Brilliance China Automotive | | |
| Holdings Ltd. | 19,139,402 | 5,179 |
| Shenzhen | | |
| Expressway Co. Ltd. | 4,975,298 | 5,173 |
* | China Agri-Industries | | |
| Holdings Ltd. | 6,934,534 | 5,117 |
| Shanghai Forte | | |
| Land Co., Ltd. | 6,424,000 | 5,017 |
| TravelSky Technology Ltd. | 3,965,608 | 4,748 |
| FU JI Food & | | |
| Catering Services | 1,812,000 | 4,590 |
| Guangdong Electric Power | | |
| Development Co., Ltd. | 4,358,567 | 4,565 |
* | Sinopec Yizheng Chemical | | |
| Fibre Co., Ltd. | 8,454,000 | 4,409 |
| Global Bio-chem | | |
| Technology Group | | |
| Co. Ltd. | 11,659,986 | 4,323 |
* | China Foods Ltd. | 5,232,750 | 4,004 |
* | Longtop Financial | | |
| Technologies, Ltd. ADR | 48,500 | 1,377 |
* | Alibaba.com, Ltd. | 36,187 | 63 |
| | | 4,432,393 |
Colombia (0.1%) | | |
| Bancolombia SA ADR | 1,042,402 | 38,308 |
| | | |
Czech Republic (0.7%) | | |
| Ceske Energeticke | | |
| Zavody a.s. | 1,414,443 | 102,665 |
| Komercni Banka a.s. | 112,302 | 25,911 |
| Cesky Telecom a.s. | 788,769 | 24,414 |
* | Central European | | |
| Media Enterprises Ltd. | 200,071 | 23,470 |
| Zentiva NV | 159,218 | 8,524 |
* | Unipetrol a.s. | 344,984 | 6,174 |
| Philip Morris CR a.s. | 110 | 57 |
| | | 191,215 |
Egypt (0.5%) | | |
| Orascom Construction | | |
| Industries GDR | 407,017 | 74,948 |
| Orascom Telecom | | |
| Holding SAE GDR | 897,379 | 64,368 |
94
| | | Market |
| | | Value• |
| | Shares | ($000) |
| | | 139,316 |
Hungary (0.8%) | | |
| OTP Bank Rt. | 1,838,088 | 100,002 |
| MOL Hungarian Oil and | | |
| Gas Nyrt. | 417,969 | 64,718 |
| Richter Gedeon Rt. | 105,326 | 22,955 |
| Magyar Tavkozlesi Rt. | 3,440,915 | 18,555 |
| | | 206,230 |
India (7.3%) | | |
| Reliance Industries Ltd. | 4,230,322 | 300,974 |
| Infosys Technologies Ltd. | 3,051,073 | 144,311 |
| ICICI Bank Ltd. | 3,388,981 | 109,923 |
| Housing Development | | |
| Finance Corp. Ltd. | 1,296,311 | 92,137 |
| Reliance Communication | | |
| Ventures | 4,237,441 | 83,806 |
| Larsen & Toubro Ltd. | 701,295 | 76,425 |
| ICICI Bank Ltd. ADR | 951,625 | 66,081 |
| Oil and Natural | | |
| Gas Corp. Ltd. | 1,793,788 | 57,155 |
| HDFC Bank Ltd. | 1,219,450 | 52,904 |
| Bharat Heavy | | |
| Electricals Ltd. | 783,732 | 52,287 |
| Reliance Capital Ltd. | 786,781 | 42,853 |
| ITC Ltd. | 7,593,459 | 34,815 |
| Reliance Energy Ltd. | 719,197 | 34,415 |
| Satyam Computer | | |
| Services Ltd. | 2,631,209 | 32,235 |
| Axis Bank Ltd. | 1,362,377 | 32,008 |
| Hindustan Lever Ltd. | 5,551,487 | 29,340 |
| Jindal Steel & Power Ltd. | 91,355 | 27,834 |
| Tata Iron and Steel Co. Ltd. | 1,003,948 | 25,764 |
| Tata Motors Ltd. | 1,284,692 | 25,063 |
| Infrastructure Development | | |
| Finance Co., Ltd. | 4,615,981 | 22,845 |
| Tata Consultancy | | |
| Services Ltd. | 859,196 | 22,834 |
| Grasim Industries Ltd. | 237,255 | 22,524 |
| Jaiprakash Associates Ltd. | 587,018 | 21,963 |
| Wipro Ltd. | 1,645,860 | 21,226 |
| Unitech, Ltd. | 2,101,657 | 20,725 |
* | Indiabulls Real Estate Ltd. | 1,198,610 | 20,022 |
| Kotak Mahindra Bank | 748,767 | 19,168 |
| Mahindra & Mahindra Ltd. | 955,411 | 18,440 |
| Indiabulls Financial | | |
| Services Ltd. | 992,876 | 17,197 |
| Gail India Ltd. | 1,608,003 | 16,965 |
| Hindalco Industries Ltd. | 3,347,617 | 16,854 |
| Ambuja Cements Ltd. | 4,447,408 | 16,457 |
| Tata Power Co. Ltd. | 489,743 | 15,252 |
| Zee Entertainment | | |
95
| | | Market |
| | | Value• |
| | Shares | ($000) |
| Enterprises | 1,591,839 | 13,504 |
| Siemens India Ltd. | 267,075 | 13,470 |
| Asea Brown Boveri | | |
| India Ltd. | 329,154 | 13,275 |
| HDFC Bank Ltd. ADR | 95,451 | 13,268 |
| Bajaj Auto Ltd. | 207,524 | 13,160 |
| Maruti Udyog Ltd. | 466,081 | 12,814 |
| Ranbaxy Laboratories Ltd. | 1,111,466 | 12,120 |
| State Bank of India | 222,262 | 11,780 |
| Cipla Ltd. | 2,436,163 | 11,136 |
| Dr. Reddy’s | | |
| Laboratories Ltd. | 687,942 | 10,873 |
| Sun Pharmaceutical | | |
| Industries Ltd. | 384,560 | 10,391 |
| Hero Honda Motors Ltd. | 551,063 | 10,224 |
| Glenmark | | |
| Pharmaceuticals Ltd. | 759,425 | 9,552 |
| Associated | | |
| Cement Cos. Ltd. | 342,509 | 9,456 |
| Aditya Birla Nuvo Ltd. | 223,965 | 9,267 |
| Satyam Computer | | |
| Services Ltd. ADR | 305,110 | 9,260 |
Indian Hotels Co. Ltd. | 2,057,351 | 7,674 |
Nestle India Ltd. | 185,909 | 7,423 |
Bharat Forge Ltd. | 699,102 | 6,742 |
Mahanagar Telephone | | |
Nigam Ltd. | 1,462,662 | 6,718 |
Bharat Petroleum Corp. Ltd. | 733,231 | 6,437 |
State Bank of India GDR | 49,983 | 6,316 |
Ultratech Cemco Ltd. | 237,480 | 6,085 |
Videsh Sanchar Nigam Ltd. | 377,375 | 5,341 |
Asian Paints (India) Ltd. | 201,867 | 5,338 |
GlaxoSmithKline | | |
Pharmaceuticals (India) Ltd. | 190,332 | 5,303 |
Videocon Industries Ltd. | 534,289 | 5,044 |
Bharat Electronics Ltd. | 101,046 | 4,742 |
Tata Tea Ltd. | 221,463 | 4,666 |
Hindustan | | |
Petroleum Corp., Ltd. | 617,025 | 3,773 |
^Wipro Ltd. ADR | 225,257 | 3,710 |
^Dr. Reddy’s | | |
Laboratories Ltd. ADR | 182,906 | 2,899 |
Ashok Leyland Ltd. | 2,398,268 | 2,465 |
* Dish TV India Ltd. | 999,109 | 1,550 |
^Videsh Sanchar | | |
Nigam Ltd. ADR | 54,182 | 1,490 |
Tata Iron and | | |
Steel Co. Ltd. | | |
Rights Exp. 12/21/07 | 201,077 | 623 |
Mahanagar Telephone | | |
Nigam Ltd. ADR | 58,134 | 535 |
Infosys | | |
96
| | | Market | |
| | | Value• | |
| | Shares | ($000) | |
Technologies Ltd. ADR | 5,765 | 294 | |
Reliance | | | |
Industries Ltd. GDR | 1,795 | 258 | |
| | 1,871,778 | |
Indonesia (1.7%) | | | |
PT Telekomunikasi | | | |
Indonesia Tbk | 69,005,979 | 82,846 | |
PT Bumi Resources Tbk | 121,766,000 | 65,273 | |
PT Astra International Tbk | 14,380,468 | 40,951 | |
PT Bank Central Asia Tbk | 43,370,288 | 35,233 | |
PT Bank Rakyat | | | |
Indonesia Tbk | 38,950,592 | 33,633 | |
PT Perusahaan Gas | | | |
Negara Tbk | 14,759,504 | 23,024 | |
PT Bank Mandiri Tbk | 46,999,968 | 19,820 | |
PT Indonesian | | | |
Satellite Corp. Tbk | 18,112,033 | 17,457 | |
PT International Nickel | | | |
Indonesia Tbk | 1,505,760 | 15,112 | |
PT Bank Danamon Tbk | 13,133,678 | 12,637 | |
PT United Tractors Tbk | 9,881,592 | 12,050 | |
PT Aneka Tambang Tbk | 26,346,075 | 9,872 | |
PT Semen Gresik Tbk | 12,100,820 | 8,332 | |
PT Unilever Indonesia Tbk | 11,207,010 | 8,277 | |
PT Indofood Sukses | | | |
Makmur Tbk | 31,333,208 | 7,673 | |
| PT Indocement Tunggal | | | |
| Prakarsa Tbk (Local) | 7,759,754 | 7,062 | |
| PT Kalbe Farma Tbk | 42,951,838 | 6,477 | |
| PT Astra Agro Lestari Tbk | 2,414,180 | 6,042 | |
* | PT Energi Mega | | | |
| Persada Tbk | 39,545,905 | 5,524 | |
| PT Bank International | | | |
| Indonesia Tbk | 176,471,500 | 5,115 | |
| PT Gudang Garam Tbk | 4,561,100 | 5,061 | |
* | PT Bank Indonesia Tbk | 57,076,119 | 4,660 | |
| PT Berlian Laju Tanker Tbk | 12,934,574 | 3,129 | |
| PT Ramayana Lestari | | | |
| Sentosa Tbk | 30,396,620 | 2,970 | |
* | PT Bank Pan | | | |
| Indonesia Tbk | | | |
| Warrants Exp. 7/10/09 | 7,066,431 | 249 | |
| | | 438,479 | |
Israel (2.1%) | | |
| Teva Pharmaceutical | | | |
| Industries Ltd. | 4,956,329 | 218,050 | |
| Israel Chemicals Ltd. | 3,594,810 | 39,778 | |
| Bank Hapoalim Ltd. | 6,608,209 | 36,586 | |
* | Check Point Software | | | |
| Technologies Ltd. | 1,278,793 | 32,302 | |
| Bank Leumi Le-Israel | 5,991,327 | 28,830 | |
97
| | | Market |
| | | Value• |
| | Shares | ($000) |
* | Makhteshim–Agan | | |
| Industries Ltd. | 2,054,995 | 19,778 |
| The Israel Corp. Ltd. | 16,594 | 16,954 |
* | NICE Systems Ltd. | 365,270 | 14,478 |
| Bezeq Israeli | | |
| Telecommunication | | |
| Corp., Ltd. | 7,734,686 | 13,777 |
| Partner Communications | | |
| Co. Ltd. | 596,228 | 11,313 |
| Africa–Israel | | |
| Investments Ltd. | 95,945 | 9,946 |
| Elbit Systems Ltd. | 180,090 | 9,599 |
* | Israel Discount Bank Ltd. | 3,439,268 | 8,781 |
| United Mizrahi Bank Ltd. | 969,209 | 7,572 |
*^ | Alvarion Ltd. | 517,890 | 6,515 |
| Discount | | |
| Investment Corp. Ltd. | 195,187 | 6,105 |
| IDB Development Corp. Ltd. | 148,737 | 5,954 |
| Clal Insurance Enterprise | | |
| Holdings Ltd. | 168,325 | 5,271 |
| Migdal Insurance | | |
| Holdings Ltd. | 2,500,561 | 4,743 |
* | Orbotech Ltd. | 227,661 | 4,713 |
| Koor Industries Ltd. | 54,213 | 4,705 |
| Harel Insurance | | |
| Investments Ltd. | 71,118 | 4,196 |
* | Aladdin | | |
| Knowledge Systems | 171,646 | 4,111 |
* | Given Imaging Ltd. | 140,286 | 4,002 |
* | Super Sol Ltd. | 884,025 | 3,513 |
* | Radware Ltd. | 195,213 | 3,303 |
* | Retalix Ltd. | 136,463 | 2,769 |
* | Audiocodes Ltd. | 422,168 | 2,748 |
* | Syneron Medical Ltd. | 148,243 | 2,711 |
| Clal Industries and | | |
| Investments Ltd. | 383,946 | 2,345 |
* | Strauss Group Ltd. | 91,542 | 1,264 |
| | | 536,712 |
Malaysia (2.3%) | | |
| Bumiputra–Commerce | | |
| Holdings Bhd. | 15,228,432 | 52,961 |
| IOI Corp. Bhd. | 23,047,255 | 52,581 |
| Malayan Banking Bhd. | 13,182,674 | 44,556 |
| Sime Darby Bhd. | 10,253,700 | 34,435 |
| Genting Bhd. | 12,198,090 | 30,361 |
| Public Bank Bhd. | 6,989,760 | 24,036 |
| Malaysia International | | |
| Shipping Corp., Bhd. | | |
| (Foreign) | 7,838,268 | 23,125 |
| Telekom Malaysia Bhd. | 6,909,340 | 21,224 |
| Tenaga Nasional Bhd. | 7,301,146 | 20,596 |
98
| | | Market |
| | | Value• |
| | Shares | ($000) |
| Resorts World Bhd. | 17,209,610 | 19,939 |
| British American | | |
| Tobacco Bhd. | 1,085,692 | 13,134 |
| Kuala Lumpur | | |
| Kepong Bhd. | 2,911,508 | 12,894 |
| PPB Group Bhd. | 4,231,944 | 12,320 |
| AMMB Holdings Bhd. | 9,313,858 | 11,862 |
| Petronas Gas Bhd. | 3,482,628 | 11,757 |
| PLUS Expressways Bhd. | 10,733,582 | 10,787 |
| YTL Corp., Bhd. | 4,493,162 | 10,178 |
| Gamuda Bhd. | 7,380,888 | 10,177 |
| Golden Hope | | |
| Plantations Bhd. | 3,582,000 | 9,774 |
| Bursa Malaysia Bhd. | 2,040,152 | 9,702 |
| IJM Corp. Bhd. | 3,489,550 | 9,167 |
| Tanjong Public Ltd. Co. | 1,641,236 | 8,648 |
| SP Setia Bhd. | 3,223,968 | 7,589 |
| RHB Capital Bhd. | 3,956,400 | 7,585 |
| Berjaya Sports Toto Bhd. | 4,851,156 | 7,450 |
| UMW Holdings | | |
| Malaysia Bhd. | 1,594,080 | 7,105 |
| Hong Leong Bank Bhd. | 3,313,436 | 6,537 |
| Petronas Dagangan Bhd. | 2,425,200 | 6,489 |
| Magnum Corp., Bhd. | 5,872,042 | 5,202 |
| Highlands & | | |
| Lowlands Bhd. | 2,027,800 | 5,108 |
| Malaysia | | |
| Mining Corp., Bhd. | 1,917,700 | 4,994 |
| Shell Refining Co. | | |
| Malaysia Bhd. | 1,402,648 | 4,854 |
| Lafarge Malayan | | |
| Cement Bhd. | 8,314,400 | 4,573 |
| UEM World Bhd. | 3,445,783 | 4,505 |
| Star Publications Bhd. | 4,212,226 | 4,254 |
* | Malaysian | | |
| Resources Corp., Bhd. | 4,550,900 | 4,010 |
| Astro All Asia | | |
| Networks PLC | 3,806,490 | 3,871 |
* | Airasia Bhd. | 6,300,748 | 3,702 |
| Media Prima Bhd. | 4,187,900 | 3,366 |
| IGB Corp., Bhd. | 4,274,500 | 3,331 |
| IOI Properties Bhd. | 751,800 | 3,189 |
| Scomi Group Bhd. | 6,092,400 | 3,051 |
* | Proton Holdings Bhd. | 1,922,500 | 3,049 |
| Malaysian Bulk | | |
| Carriers Bhd. | 1,798,475 | 2,933 |
| KLCC Property | | |
| Holdings Bhd. | 2,701,300 | 2,883 |
| Guinness Anchor Bhd. | 1,588,900 | 2,824 |
| Multi-Purpose | | |
| Holdings Bhd. | 3,769,100 | 2,623 |
99
| | | Market |
| | | Value• |
| | Shares | ($000) |
| DRB–Hicom Bhd. | 4,381,600 | 2,575 |
* | Malaysian Airline | | |
| System Bhd. | 1,530,200 | 2,491 |
| Hong Leong | | |
| Financial Group Bhd. | 1,354,600 | 2,436 |
| TA Enterprise Bhd. | 4,608,900 | 2,111 |
* | Mulpha International Bhd. | 4,627,200 | 2,001 |
| Pos Malaysia & Services | | |
| Holding Bhd. | 2,065,100 | 1,704 |
| Malaysian Pacific | | |
| Industries Bhd. | 550,000 | 1,515 |
| | | 584,124 |
Mexico (4.6%) | | |
| America Movil SA de CV | 124,505,983 | 395,266 |
| Cemex SA CPO | 48,080,080 | 147,453 |
| Telefonos de Mexico SA | 51,756,165 | 94,654 |
| Wal-Mart de Mexico SA | 21,154,960 | 85,909 |
| Grupo Televisa SA CPO | 16,494,405 | 81,617 |
| Grupo Mexico SA de CV | 7,878,077 | 71,669 |
| Fomento Economico | | |
| Mexicano UBD | 15,166,498 | 53,910 |
| Grupo Financerio | | |
| Banorte SA de CV | 9,335,407 | 43,864 |
| Grupo Carso SA de CV | | |
| Series A1 | 4,634,454 | 20,124 |
* | Empresas ICA SA de CV | 2,697,514 | 18,944 |
| Industrias Penoles SA | | |
| Series CP | 797,916 | 18,918 |
| Grupo Modelo SA | 4,021,880 | 18,766 |
| Alfa SA de CV Series A | 2,620,517 | 17,693 |
| Kimberly Clark de Mexico | | |
| SA de CV Series A | 3,712,473 | 16,156 |
| Grupo Bimbo SA | 2,462,888 | 14,021 |
* | Corporacion GEO, | | |
| SA de CV | 2,960,101 | 10,910 |
| Coca-Cola Femsa | | |
| SA de CV | 2,349,545 | 10,908 |
| Grupo Aeroportuario | | |
| del Pacifico SA ADR | 200,593 | 10,521 |
* | Desarrolladora Homex | | |
| SA de CV | 1,002,380 | 9,470 |
| Controladora Comercial | | |
| Mexicana SA de | | |
| CV (Units) | 3,022,983 | 9,438 |
* | URBI Desarrollos Urbanos | | |
| SA de CV | 1,754,189 | 6,777 |
| Consorcio ARA SA de CV | 5,835,824 | 6,754 |
* | Carso Infraestructura y | | |
| Construccion, SA | 5,746,392 | 6,192 |
| Grupo Aeroportuario | | |
| del Pacifico SA | 1,110,807 | 5,848 |
| Grupo Aeroportuario | | |
100
| | | Market |
| | | Value• |
| | Shares | ($000) |
| del Sureste SA de CV | 443,990 | 2,661 |
* | Cemex SAB de CV ADR | 12,499 | 383 |
| | | 1,178,826 |
Peru (0.7%) | | |
| Southern Copper Corp. | | |
| (U.S. Shares) | 336,692 | 47,036 |
| Southern Copper Corp. | 276,269 | 38,691 |
| Credicorp Ltd. | 459,113 | 34,066 |
| Compania de Minas | | |
| Buenaventura SA | 471,947 | 28,044 |
| Volcan Compania | | |
| Minera SA | 2,796,943 | 13,143 |
| Minsur SA | 2,955,977 | 9,950 |
| Compania de Minas | | |
| Buenaventura S.A.u. ADR | 165,751 | 9,516 |
| | | 180,446 |
Philippines (0.6%) | | |
| Philippine Long Distance | | |
| Telephone Co. | 402,424 | 28,057 |
| Ayala Corp. | 1,087,742 | 15,636 |
| Ayala Land, Inc. | 38,763,909 | 13,548 |
| Bank of Philippine Islands | 8,403,955 | 12,726 |
| SM Investments Corp. | 1,230,043 | 10,833 |
| SM Prime Holdings, Inc. | 33,586,606 | 9,406 |
| Globe Telecom, Inc. | 211,789 | 8,295 |
| Megaworld Corp. | 71,817,573 | 7,395 |
| PNOC Energy | | |
| Development Corp. | 41,392,000 | 7,316 |
| Metropolitan Bank & | | |
| Trust Co. | 4,594,341 | 6,625 |
| Manila Electric Co. | 3,266,032 | 6,251 |
| Banco De Oro | 4,101,491 | 5,930 |
| San Miguel Corp. Class B | 4,069,089 | 5,825 |
| Jollibee Foods Corp. | 4,043,843 | 4,777 |
| Petron Corp. | 25,962,950 | 4,222 |
| First Philippine | | |
| Holdings Corp. | 1,831,003 | 3,644 |
* | Filinvest Land, Inc. | 81,209,058 | 3,564 |
| | | 154,050 |
Poland (1.7%) | | |
| Powszechna Kasa | | |
| Oszczednosci Bank | | |
| Polski SA | 3,376,752 | 75,111 |
| Bank Polska Kasa Opieki | | |
| Grupa Pekao SA | 530,677 | 56,418 |
| Polski Koncern Naftowy SA | 2,079,934 | 48,187 |
| Telekomunikacja Polska SA | 4,767,218 | 45,165 |
| KGHM Polska Miedz SA | 773,740 | 42,213 |
| Bank Przemyslowo | | |
| Handlowy PBK SA | 58,806 | 23,013 |
* | Globe Trade Centre SA | 924,108 | 19,159 |
101
| | | Market |
| | | Value• |
| | Shares | ($000) |
| Bank Zachodni WBK SA | 169,311 | 18,865 |
| Polish Oil & Gas | 7,425,581 | 16,861 |
* | Bank Rozwoju Eksportu SA | 69,808 | 16,035 |
| TVN SA | 1,012,015 | 10,130 |
| Grupa Kety SA | 96,986 | 7,318 |
* | Echo Investment S.A. | 153,933 | 6,123 |
* | PBG S.A. | 42,684 | 5,825 |
| Asseco Poland SA | 177,330 | 5,658 |
| Orbis SA | 188,775 | 5,309 |
| Polska Grupa | | |
| Farmaceutyczna | 120,392 | 4,964 |
| Agora SA | 198,089 | 4,433 |
| Prokom Software SA | 73,068 | 4,221 |
| Mondi Packaging Paper | | |
| Swieci SA | 122,506 | 4,081 |
* | Budimex SA | 117,653 | 3,496 |
| Debica SA | 63,449 | 2,650 |
* | Bioton S.A. | 3,180,742 | 1,434 |
| Sygnity SA | 49,782 | 1,014 |
* | Boryszew SA | 42,582 | 303 |
| | | 427,986 |
Russia (9.0%) | | |
| OAO Gazprom ADR | 16,213,989 | 810,622 |
| LUKOIL Sponsored ADR | 3,263,721 | 299,494 |
| Sberbank | 59,042,085 | 255,259 |
| Mining and Metallurgical | | |
| Co. Norilsk Nickel ADR | 605,022 | 186,952 |
| Mobile TeleSystems ADR | 1,361,664 | 113,018 |
| OAO Vimpel– | | |
| Communications | | |
| Sponsored ADR | 3,177,102 | 105,067 |
* | RAO Unified Energy | | |
| System GDR | 693,594 | 90,306 |
| Surgutneftegaz | | |
| OJSC ADR | 1,193,097 | 78,293 |
| Tatneft GDR | 498,240 | 62,362 |
* | VTB Bank OJSC GDR | 6,343,204 | 61,096 |
| Cherepovets MK | | |
| Severstal GDR | 1,633,566 | 38,879 |
| NovaTek OAO GDR | 535,329 | 30,853 |
| ^Rostelecom ADR | 508,649 | 30,366 |
| Polyus Gold ADR | 653,452 | 29,895 |
| Sistema JSFC GDR | 692,719 | 27,749 |
| Novolipetsk Steel GDR | 559,199 | 23,131 |
| Transneft OAO | 11,300 | 22,051 |
| ^Mechel OAO ADR | 249,003 | 20,954 |
| Comstar United | | |
| Telesystems GDR | 1,244,161 | 15,286 |
| Wimm-Bill-Dann | | |
| Foods ADR | 115,603 | 13,843 |
| | | 2,315,476 |
102
| | | Market |
| | | Value• |
| | Shares | ($000) |
South Africa (7.0%) | | |
| Sasol Ltd. | 4,014,601 | 205,174 |
| MTN Group Ltd. | 10,019,537 | 195,292 |
| Standard Bank Group Ltd. | 8,384,181 | 152,107 |
| Impala Platinum | | |
| Holdings Ltd. | 3,587,964 | 135,532 |
| Anglo Platinum Ltd. | 475,963 | 81,962 |
| FirstRand Ltd. | 19,293,194 | 76,761 |
| Gold Fields Ltd. | 4,088,689 | 73,821 |
| Naspers Ltd. | 2,296,311 | 73,002 |
| Sanlan Ltd. | 15,773,526 | 57,888 |
| Telkom South Africa Ltd. | 2,060,657 | 56,385 |
| AngloGold Ltd. | 985,216 | 46,075 |
| Bidvest Group Ltd. | 1,659,979 | 34,952 |
| ArcelorMittal | | |
| South Africa, Ltd. | 1,457,372 | 32,853 |
| Murray & Roberts | | |
| Holdings Ltd. | 2,106,499 | 32,413 |
| Nedbank Group Ltd. | 1,447,682 | 31,919 |
| Tiger Brands Ltd. | 1,024,524 | 29,668 |
* | Pretoria Portland | | |
| Cement Co. Ltd. | 3,954,583 | 28,858 |
| Aveng Ltd. | 2,918,907 | 28,811 |
| Barloworld Ltd. | 1,433,653 | 27,891 |
* | Harmony Gold | | |
| Mining Co., Ltd. | 2,446,178 | 27,645 |
| Imperial Holdings Ltd. | 1,193,046 | 24,200 |
| Sappi Ltd. | 1,529,530 | 23,391 |
| Steinhoff International | | |
| Holdings Ltd. | 6,791,874 | 21,136 |
| Kumba Iron Ore Ltd. | 527,783 | 20,688 |
| Shoprite Holdings Ltd. | 3,108,981 | 19,438 |
| Network Healthcare | | |
| Holdings Ltd. | 9,263,865 | 18,734 |
| African Bank | | |
| Investments Ltd. | 3,277,726 | 18,334 |
| Investec Ltd. | 1,349,240 | 16,903 |
| Massmart Holdings Ltd. | 1,337,088 | 16,773 |
| Reunert Ltd. | 1,357,423 | 16,249 |
| Truworths International Ltd. | 2,929,231 | 14,800 |
| Woolworths Holdings Ltd. | 4,949,627 | 14,403 |
| Liberty Group Ltd. | 927,596 | 13,635 |
| JD Group Ltd. | 1,394,827 | 13,386 |
| Foschini Ltd. | 1,550,741 | 12,759 |
| Nampak Ltd. | 3,590,757 | 12,006 |
| Aspen Pharmacare | | |
| Holdings Ltd. | 1,825,172 | 10,673 |
| Spar Group Ltd. | 1,128,066 | 10,101 |
| Grindrod Ltd. | 2,523,650 | 9,787 |
| AVI Ltd. | 2,687,593 | 9,158 |
| Metropolitan Holdings Ltd. | 3,658,384 | 8,972 |
103
| | | Market |
| | | Value• |
| | Shares | ($000) |
| Mondi Ltd. | 845,282 | 8,568 |
| Ellerine Holdings Ltd. | 636,375 | 8,533 |
| Fountainhead | | |
| Property Trust | 6,681,303 | 7,488 |
| Pick’n Pay Stores Ltd. | 1,113,503 | 6,277 |
| Lewis Group Ltd. | 593,954 | 5,175 |
| Super Group Ltd. | 2,112,745 | 4,195 |
| | | 1,794,771 |
South Korea (15.1%) | | |
| Samsung | | |
| Electronics Co., Ltd. | 608,534 | 375,221 |
| POSCO | 371,799 | 271,128 |
| Hyundai Heavy | | |
| Industries Co., Inc. | 279,136 | 156,944 |
| Kookmin Bank | 1,863,551 | 152,392 |
| Shinhan Financial | | |
| Group Ltd. | 1,871,109 | 122,247 |
| POSCO ADR | 521,758 | 95,873 |
* | SK Energy Co., Ltd. | 405,549 | 93,204 |
1 | Samsung Electronics | | |
| Co., Ltd. GDR | 278,731 | 85,279 |
* | NHN Corp. | 261,091 | 83,952 |
| Samsung Corp. | 905,062 | 83,763 |
| Hyundai Motor Co., Ltd. | 1,049,772 | 83,422 |
| Shinsegae Co., Ltd. | 96,722 | 76,208 |
| Samsung Heavy | | |
| Industries Co., Ltd. | 1,181,250 | 71,316 |
| Samsung Fire & Marine | | |
| Insurance Co. | 247,063 | 68,733 |
| LG Electronics Inc. | 644,925 | 67,814 |
| Samsung | | |
| Electronics Co., Ltd. Pfd. | 140,846 | 67,080 |
| Korea Electric Power Corp. | 1,398,931 | 61,842 |
| KT & G Corp. | 759,304 | 61,252 |
| GS Engineering & | | |
| Construction Corp. | 245,621 | 52,038 |
| SK Holdings Co Ltd | 167,948 | 50,448 |
| Hyundai Development Co. | 441,514 | 49,461 |
| Samsung Securities Co. Ltd. | 368,615 | 46,147 |
| SK Telecom Co., Ltd. | 184,678 | 43,328 |
| Daelim Industrial Co. | 192,648 | 42,334 |
| Daewoo Shipbuilding & | | |
| Marine Engineering | | |
| Co., Ltd. | 660,812 | 41,974 |
* | LG. Philips LCD Co., Ltd. | 746,198 | 41,223 |
| Hana Financial Group Inc. | 807,600 | 40,875 |
* | Doosan Heavy | | |
| Industries and | | |
| Construction Co., Ltd. | 218,869 | 40,414 |
| Hyundai Mobis | 382,376 | 38,485 |
| Hyundai Mipo | | |
104
| | | Market |
| | | Value• |
| | Shares | ($000) |
| Dockyard Co., Ltd. | 83,546 | 37,120 |
| KT Corp. | 775,754 | 36,849 |
| LG Chem Ltd. | 290,608 | 36,315 |
| Hyundai Steel Co. | 353,925 | 35,293 |
| Kookmin Bank– | | |
| Sponsored ADR | 422,914 | 34,548 |
* | Hyundai Engineering & | | |
| Construction Co., Ltd. | 308,794 | 31,618 |
| Hanwha Corp. | 316,234 | 31,387 |
| Daewoo Engineering & | | |
| Construction Co., Ltd. | 1,065,515 | 30,874 |
| Samsung | | |
| Engineering Co., Ltd. | 222,968 | 30,032 |
| Korea Exchange Bank | 1,803,250 | 29,825 |
| S-Oil Corp. | 316,494 | 28,745 |
| Lotte Shopping Co., Ltd. | 60,888 | 28,565 |
| Mirae Asset | | |
| Securities Co., Ltd. | 145,629 | 27,799 |
| Samsung Electro- | | |
| Mechanics Co. | 417,528 | 27,637 |
| Kumkang Korea | | |
| Chemical Co., Ltd. | 37,112 | 27,473 |
| Korea Investment | | |
| Holdings Co., Ltd. | 280,724 | 25,181 |
| SK Telecom Co. Ltd. ADR | 783,594 | 24,143 |
| Daewoo Securities Co., Ltd. | 804,060 | 23,959 |
* | Hanjin Heavy Industries & | | |
| Construction Co., Ltd. | 218,567 | 23,951 |
| Hyundai Securities Co. | 992,711 | 23,793 |
| Samsung Techwin Co., Ltd. | 379,684 | 23,297 |
| Doosan Infracore Co., Ltd. | 533,142 | 22,688 |
| Korean Air Co. Ltd. | 256,392 | 22,549 |
| Hanjin Shipping Co., Ltd. | 381,350 | 22,299 |
| Amorepacific Corp. | 23,226 | 22,190 |
| ^Shinhan Financial | | |
| Group Co., Ltd. ADR | 168,758 | 22,102 |
| LS Cable Ltd. | 137,240 | 21,199 |
| Cheil Industrial, Inc. | 319,076 | 21,141 |
| Korea Telecom Freetel | 560,349 | 20,652 |
| Kangwon Land Inc. | 762,288 | 20,440 |
| Samsung SDI Co. Ltd. | 243,791 | 19,660 |
| Woori Investment & | | |
| Securities Co., Ltd. | 622,161 | 19,179 |
| LG Household & | | |
| Health Care Ltd. | 79,816 | 17,793 |
| Dongkuk Steel Mill Co., Ltd. | 269,922 | 16,233 |
| Pusan Bank | 902,079 | 16,192 |
* | CJ CheilJedang Corp. | 48,552 | 16,091 |
| Daegu Bank | 907,765 | 16,089 |
| Korea Electric | | |
| Power Corp. ADR | 722,842 | 16,083 |
* | Kia Motors | 1,364,474 | 15,830 |
105
| | | Market |
| | | Value• |
| | Shares | ($000) |
| Honam Petrochemical Corp. | 103,676 | 15,826 |
| Hyundai Merchant | | |
| Marine Co., Ltd. | 289,500 | 15,706 |
| Korea Zinc Co., Ltd. | 75,935 | 15,336 |
| Hyundai Department | | |
| Store Co., Ltd. | 108,442 | 15,170 |
| Daewoo International Corp. | 347,187 | 14,751 |
| Dongbu Insurance Co., Ltd. | 239,565 | 14,574 |
| Hankook Tire Co. Ltd. | 672,636 | 14,233 |
| Hyundai Marine & Fire | | |
| Insurance Co., Ltd. | 490,546 | 14,216 |
| Woongjin Coway Co., Ltd. | 338,259 | 12,964 |
| Hite Brewery Co., Ltd. | 85,077 | 12,740 |
| Hyosung Corp. | 169,333 | 12,704 |
| Yuhan Corp. | 57,545 | 12,315 |
| Tong Yang Investment Bank | 531,788 | 12,232 |
| Hanwha Chemical Corp. | 408,480 | 12,069 |
| LG Petrochemical Co., Ltd. | 201,840 | 11,932 |
| Hyundai Motor Co., Ltd. | | |
| 2nd Pfd. | 272,677 | 10,472 |
| S1 Corp. | 148,142 | 9,892 |
| Samsung Fine | | |
| Chemicals Co., Ltd. | 129,486 | 9,832 |
| Daishin Securities Co. | 311,491 | 9,774 |
| Lotte Confectionery Co., Ltd. | 5,586 | 9,198 |
| ORION Corp. | 27,798 | 8,882 |
| Korean Reinsurance Co. | 472,781 | 8,433 |
| Cheil Communications Inc. | 28,797 | 8,311 |
| KT Corp. ADR | 348,201 | 8,190 |
| Asiana Airlines | 699,604 | 7,860 |
| LG International Corp. | 246,496 | 7,750 |
| LG Electronics Inc. Pfd. | 136,859 | 7,618 |
* | Daum Communications Corp. | 81,839 | 7,471 |
| LG Fashion Corp. | 188,243 | 7,435 |
| Hanmi Pharm Co., Ltd. | 47,148 | 7,206 |
* | NCsoft Corp. | 111,979 | 6,955 |
| Lotte Chilsung | | |
| Beverage Co., Ltd. | 4,731 | 6,698 |
| Poongsan Corp. | 201,580 | 5,694 |
| Pacific Corp. | 24,631 | 5,603 |
| Nong Shim Co. Ltd. | 24,918 | 5,527 |
| Hyundai Autonet Co., Ltd. | 711,082 | 4,702 |
* | Hyundai Securities | | |
| Rights Exp. 11/2/07 | 105,647 | 557 |
| | | 3,902,039 |
Taiwan (10.7%) | | |
| Hon Hai Precision | | |
| Industry Co., Ltd. | 33,826,663 | 259,335 |
| Taiwan Semiconductor | | |
| Manufacturing Co., Ltd. | 119,306,650 | 238,402 |
| MediaTek Inc. | 5,399,502 | 106,849 |
106
| | | Market |
| | | Value• |
| | Shares | ($000) |
| Nan Ya Plastic Corp. | 33,256,291 | 99,997 |
| Cathay Financial | | |
| Holding Co. | 36,856,431 | 96,401 |
| Formosa Plastic Corp. | 26,972,289 | 83,720 |
| China Steel Corp. | 57,495,126 | 81,620 |
| AU Optronics Corp. | 36,279,874 | 78,487 |
| Asustek Computer Inc. | 21,120,157 | 74,987 |
| Innolux Display Corp. | 13,434,263 | 62,977 |
| High Tech Computer Corp. | 2,939,336 | 60,559 |
| Chunghwa | | |
| Telecom Co., Ltd. | 31,048,212 | 59,763 |
| Formosa Chemicals & | | |
| Fibre Corp. | 19,138,276 | 51,770 |
| Taiwan Semiconductor | | |
| Manufacturing Co., | | |
| Ltd. ADR | 4,559,009 | 48,553 |
| United | | |
| Microelectronics Corp. | 69,873,843 | 45,828 |
| Formosa | | |
| Petrochemical Corp. | 12,981,000 | 42,370 |
| Delta Electronics Inc. | 9,641,937 | 39,032 |
| Mega Financial | | |
| Holding Co. Ltd. | 58,267,224 | 38,118 |
| Acer Inc. | 15,913,229 | 37,848 |
| Chi Mei | | |
| Optoelectronics Corp. | 25,713,666 | 37,243 |
| Foxconn | | |
| Technology Co., Ltd. | 2,924,103 | 35,587 |
| Siliconware Precision | | |
| Industries Co. | 15,393,228 | 32,311 |
* | Chinatrust Financial | | |
| Holding | 43,270,185 | 31,743 |
| Taiwan Cement Corp. | 17,435,627 | 30,036 |
* | Fuhwa Financial | | |
| Holdings Co., Ltd. | 38,634,773 | 28,726 |
| Advanced Semiconductor | | |
| Engineering Inc. | 22,688,670 | 27,456 |
| Compal Electronics Inc. | 21,165,191 | 27,037 |
| China Development | | |
| Financial Holding Corp. | 62,831,522 | 26,287 |
| Uni-President | | |
| Enterprises Co. | 18,009,485 | 26,111 |
| First Financial | | |
| Holding Co., Ltd. | 30,711,081 | 25,352 |
| Catcher | | |
| Technology Co., Ltd. | 3,423,747 | 23,663 |
| Lite-On Technology Corp. | 12,688,254 | 23,525 |
| Fubon Financial | | |
| Holding Co., Ltd. | 23,125,100 | 22,542 |
| Far Eastern Textile Ltd. | 16,450,208 | 21,928 |
| Taiwan Cellular Corp. | 15,586,360 | 21,032 |
107
| | | Market |
| | | Value• |
| | Shares | ($000) |
| Inotera Memories, Inc. | 21,489,620 | 20,608 |
| Powerchip | | |
| Semiconductor Corp. | 43,924,716 | 20,437 |
* | Taishin Financial Holdings | 40,555,678 | 20,052 |
| Shin Kong Financial | | |
| Holdings Co. | 20,559,663 | 19,281 |
| Quanta Computer Inc. | 11,324,943 | 19,049 |
| Synnex Technology | | |
| International Corp. | 5,468,729 | 18,393 |
| Hau Nan Financial | | |
| Holdings Co., Ltd. | 24,174,695 | 18,189 |
| Chang Hwa | | |
| Commercial Bank | 26,334,094 | 17,727 |
* | Chunghwa Picture | | |
| Tubes, Ltd. | 40,009,331 | 16,806 |
| SinoPac Holdings | 35,913,214 | 16,759 |
| Asia Cement Corp. | 9,637,375 | 15,748 |
| Novatek Microelectronics | | |
| Corp., Ltd. | 3,162,185 | 14,684 |
* | Qisda Corp. | 9,094,415 | 12,952 |
* | HannStar Display Corp. | 27,470,665 | 12,805 |
| AU Optronics Corp. ADR | 579,538 | 12,593 |
* | Tatung Co., Ltd. | 22,727,000 | 12,520 |
| Taiwan Fertilizer Co., Ltd. | 4,821,000 | 12,447 |
| Macronix | | |
| International Co., Ltd. | 18,903,962 | 12,400 |
* | E.Sun Financial | | |
| Holding Co., Ltd. | 21,406,637 | 12,298 |
| Nanya Technology Corp. | 18,989,397 | 12,033 |
| Pou Chen Corp. | 12,500,733 | 11,981 |
| Wistron Corp. | 5,743,275 | 11,568 |
| Epistar Corp. | 2,509,192 | 11,356 |
| U-Ming Marine | | |
| Transport Corp. | 3,263,600 | 10,728 |
| ^United Microelectronics | | |
| Corp. ADR | 2,714,121 | 10,232 |
| Chunghwa | | |
| Telecom Co., Ltd. ADR | 531,828 | 10,211 |
| President Chain | | |
| Store Corp. | 3,313,985 | 9,871 |
| D-Link Corp. | 4,289,458 | 9,715 |
| Unimicron | | |
| Technology Corp. | 4,570,440 | 9,317 |
| Cheng Shin Rubber | | |
| Industry Co., Ltd. | 4,690,033 | 9,280 |
| Mitac International Corp. | 7,072,772 | 9,239 |
| Realtek | | |
| Semiconductor Corp. | 2,368,853 | 9,175 |
| ProMOS | | |
| Technologies Inc. | 32,005,000 | 9,130 |
| Powertech | | |
108
| | | Market |
| | | Value• |
| | Shares | ($000) |
| Technology Inc. | 2,233,000 | 9,124 |
| Walsin Lihwa Corp. | 16,553,970 | 8,997 |
* | CMC Magnetics Corp. | 20,760,700 | 8,963 |
| Wintek Corp. | 6,059,607 | 8,738 |
* | Polaris Securities Co., Ltd. | 15,077,457 | 8,252 |
| Nan Ya Printed Circuit | | |
| Board Corp. | 1,246,670 | 8,248 |
| Largan Precision Co., Ltd. | 669,328 | 8,228 |
| Evergreen Marine Corp. | 8,096,879 | 7,986 |
| Tripod Technology Corp. | 1,939,179 | 7,905 |
| Formosa Taffeta Co., Ltd. | 6,847,868 | 7,813 |
| Mosel Vitelic Inc. | 6,575,910 | 7,462 |
| Winbond | | |
| Electronics Corp. | 21,504,000 | 7,228 |
| Wan Hai Lines Ltd. | 6,562,370 | 6,664 |
| Phoenix Precision | | |
| Technology Corp. | 4,880,900 | 6,215 |
| Inventec Co., Ltd. | 9,665,711 | 6,172 |
| Yageo Corp. | 15,626,520 | 6,154 |
| Taiwan Glass | | |
| Industrial Corp. | 4,426,594 | 6,086 |
| Yulon Motor Co., Ltd. | 5,115,763 | 6,022 |
| Teco Electric & | | |
| Machinery Co., Ltd. | 10,111,000 | 5,628 |
| Micro-Star | | |
| International Co., Ltd. | 4,979,972 | 5,334 |
| Vanguard International | | |
| Semiconductor Corp. | 6,104,265 | 5,262 |
| Yang Ming Marine | | |
| Transport | 6,371,479 | 5,250 |
| China Airlines | 11,348,246 | 5,245 |
| ^Siliconware Precision | | |
| Industries Co. ADR | 450,409 | 5,216 |
| Compal | | |
| Communications, Inc. | 1,971,690 | 5,035 |
| Motech Industries Inc. | 474,901 | 5,023 |
| Yuen Foong Yu Paper | | |
| Manufacturing Co., Ltd. | 10,656,193 | 4,980 |
* | EVA Airways Corp. | 11,825,879 | 4,793 |
| Zyxel | | |
| Communications Corp. | 2,568,085 | 4,728 |
| Advantech Co., Ltd. | 1,736,810 | 4,727 |
| Oriental Union | | |
| Chemical Corp. | 3,319,576 | 4,722 |
* | Via Technologies Inc. | 6,560,379 | 4,671 |
| Kinsus Interconnect | | |
| Technology Corp. | 1,148,600 | 4,581 |
| ^Advanced Semiconductor | | |
| Engineering Inc. ADR | 750,906 | 4,520 |
| Gigabyte | | |
| Technology Co., Ltd. | 5,376,626 | 4,497 |
109
| | | Market |
| | | Value• |
| | Shares | ($000) |
| Cheng Uei Precision | | |
| Industry Co., Ltd. | 1,579,304 | 4,429 |
| Inventec Appliances Corp. | 1,964,645 | 4,395 |
| Eternal Chemical Co., Ltd. | 3,389,815 | 4,363 |
* | Ritek Corp. | 14,292,194 | 4,271 |
| Asia Optical Co., Inc. | 1,202,853 | 4,225 |
| China Motor Co., Ltd. | 4,414,588 | 4,088 |
| Yieh Phui Enterprise | 9,492,861 | 4,061 |
| Cathay Construction Corp. | 6,017,779 | 3,364 |
| Waterland | | |
| Financial Holdings | 9,327,100 | 3,098 |
| Compeq | | |
| Manufacturing Co., Ltd. | 6,177,750 | 2,772 |
| Kinpo Electronics, Inc. | 6,845,506 | 2,726 |
| Taiwan Secom Corp., Ltd. | 1,499,846 | 2,303 |
* | Ya Hsin Industrial Co., Ltd. | 5,306,018 | 976 |
| | | 2,762,319 |
Thailand (1.4%) | | |
* | PTT Chemical | | |
| Public Co. Ltd. (Foreign) | 5,511,332 | 67,463 |
* | PTT Exploration & | | |
| Production Public Co. Ltd. | | |
| (Foreign) | 8,355,662 | 39,830 |
| Kasikornbank | | |
| Public Co. Ltd. (Foreign) | 10,685,852 | 28,408 |
| Bangkok Bank | | |
| Public Co., Ltd. (Foreign) | 6,726,182 | 25,369 |
| Siam Cement | | |
| Public Co. Ltd. (Foreign) | 2,539,326 | 19,681 |
| Advanced Info Service | | |
| Public Co. Ltd. (Foreign) | 6,248,908 | 16,570 |
* | Siam Commercial Bank | | |
| Public Co. Ltd. (Foreign) | 5,851,215 | 16,356 |
* | IRPC Public Co. Ltd. | | |
| (Foreign) | 68,244,960 | 13,454 |
| Banpu Public Co. Ltd. | | |
| (Foreign) | 876,443 | 11,615 |
* | Bangkok Bank | | |
| Public Co. Ltd. (Local) | 3,089,644 | 11,455 |
| Rayong Refinery | | |
| Public Co. Ltd. (Foreign) | 11,354,590 | 8,436 |
* | PTT Chemical | | |
| Public Co. Ltd. (Foreign) | 2,076,267 | 8,370 |
| Krung Thai Bank | | |
| Public Co. Ltd. (Foreign) | 19,837,064 | 6,813 |
* | Siam Cement | | |
| Public Co. Ltd. (Local) | 724,008 | 5,569 |
* | Airports of Thailand | | |
| Public Co. Ltd. (Foreign) | 3,087,304 | 5,541 |
| BEC World Public Co. Ltd. | | |
| (Foreign) | 7,886,130 | 5,430 |
110
| | | Market |
| | | Value• |
| | Shares | ($000) |
| C.P. 7-Eleven | | |
| Public Co. Ltd. (Foreign) | 17,879,900 | 5,314 |
* | Charoen Pokphand Foods | | |
| Public Co., Ltd. (Foreign) | 35,458,635 | 5,217 |
| Land and Houses | | |
| Public Co. Ltd. (Foreign) | 19,577,999 | 4,830 |
* | Kasikornbank Public Co., | | |
| Ltd. (Local) | 1,770,270 | 4,701 |
| Central Pattana Public Co. | | |
| Ltd. (Foreign) | 6,087,800 | 4,613 |
* | Siam City Cement | | |
| Public Co. Ltd. (Foreign) | 513,940 | 4,325 |
* | Land and Houses | | |
| Public Co. Ltd. (Local) | 19,142,100 | 4,206 |
* | Thai Airways International | | |
| Public Co. Ltd. | 3,502,312 | 4,071 |
| Glow Energy | | |
| Public Co. Ltd. (Foreign) | 3,867,000 | 4,039 |
* | Siam Commercial Bank | | |
| Public Co. Ltd. (Local) | 1,422,328 | 4,010 |
* | The Aromatics (Thailand) | | |
| Public Co. Ltd. (Foreign) | 1,849,589 | 3,837 |
| Ratchaburi Electricity | | |
| Generating Holding | | |
| Public Co. Ltd. | 2,418,200 | 3,558 |
* | Banpu Public Co. Ltd. | | |
| (Local) | 262,560 | 3,457 |
* | Precious Shipping | | |
| Public Co. Ltd. (Foreign) | 3,781,452 | 3,366 |
| Hana Microelectronics | | |
| Public Co. Ltd. (Foreign) | 4,434,100 | 3,262 |
* | True Corp. Public Co. Ltd. | | |
| (Foreign) | 14,648,360 | 3,254 |
* | PTT Chemical Public Co. | | |
| Ltd. (Local) | 698,044 | 2,838 |
| Electricity Generating | | |
| Public Co. Ltd. (Foreign) | 767,548 | 2,713 |
* | Thanachart Capital | | |
| Public Co. Ltd. (Foreign) | 4,753,114 | 2,308 |
| Siam Makro | | |
| Public Co. Ltd. (Foreign) | 705,300 | 2,044 |
| Bangkok Expressway | | |
| Public Co. Ltd. (Foreign) | 2,216,300 | 1,617 |
* | Thanachart Capital | | |
| Public Co. Ltd. (Local) | 2,427,598 | 1,188 |
* | Electricity Generating | | |
| Public Co. Ltd. (Local) | 336,000 | 1,173 |
* | Krung Thai Bank | | |
| Public Co. Ltd. (Local) | 3,128,118 | 1,058 |
* | True Corp. | | |
| Public Co. Ltd. (Local) | 3,808,170 | 856 |
111
| | | Market |
| | | Value• |
| | Shares | ($000) |
* | PTT Public Co., Ltd. (Local) | 64,570 | 796 |
* | IRPC Public Co. Ltd. (Local) | 3,365,400 | 668 |
* | The Aromatics | | |
| (Thailand) Public Co. Ltd. | | |
| (Local) | 275,089 | 575 |
* | Siam City Cement | | |
| Public Co. Ltd. (Local) | 62,258 | 526 |
* | PTT Exploration and | | |
| Production Public Co. Ltd. | | |
| (Local) | 98,054 | 471 |
* | Advanced Info Service | | |
| Public Co., Ltd. (Local) | 97,146 | 256 |
* | Charoen Pokphand Foods | | |
| Public Co. Ltd. (Local) | 756,351 | 112 |
* | Precious Shipping | | |
| Public Co., Ltd. (Local) | 95,568 | 86 |
* | Airports of Thailand | | |
| Public Co. Ltd. (Local) | 46,838 | 84 |
* | Thai Airways International | | |
| Public Co. Ltd. (Local) | 44,264 | 52 |
* | True Corp. Public Co. Ltd. | | |
| Warrants Exp. 4/30/10 | 1,020,789 | — |
| | | 375,841 |
Turkey (1.8%) | | |
| Turkiye Garanti | | |
| Bankasi A.S. | 7,318,827 | 68,009 |
| Akbank T.A.S. | 6,295,548 | 57,956 |
| Turkiye Is Bankasi | | |
| A.S. C Shares | 6,825,237 | 47,016 |
| Turkcell Iletisim | | |
| Hizmetleri A.S. | 3,895,889 | 38,139 |
| Eregli Demir ve Celik | | |
| Fabrikalari A.S. | 3,019,385 | 29,571 |
| Tupras-Turkiye Petrol | | |
| Rafinerileri A.S. | 901,591 | 25,741 |
| Haci Omer Sabanci | | |
| Holding A.S. | 3,394,071 | 23,347 |
| Anadolu Efes Biracilik ve | | |
| Malt Sanayii A.S. | 1,714,717 | 21,158 |
| Turkiye Vakiflar | | |
| Bankasi TAO | 5,476,574 | 21,034 |
* | Yapi ve Kredi | | |
| Bankasi A.S. | 4,641,461 | 18,189 |
* | KOC Holding A.S. | 2,626,708 | 14,476 |
| Migros Turk A.S. | 787,357 | 13,881 |
* | Dogan Sirketler | | |
| Grubu Holding A.S. | 4,206,030 | 9,373 |
* | Dogan Yayin Holding A.S. | 1,732,287 | 8,819 |
| Aksigorta A.S. | 1,126,956 | 8,435 |
| Arcelik A.S. | 858,095 | 6,613 |
| Tofas Turk Otomobil | | |
112
| | | Market |
| | | Value• |
| | Shares | ($000) |
| Fabrikasi A.S. | 1,231,323 | 6,590 |
| Turk Sise ve Cam | | |
| Fabrikalari A.S. | 2,885,237 | 6,384 |
* | Petkim Petrokimya | | |
| Holding A.S. | 712,468 | 5,932 |
* | Hurriyet Azteccilik ve | | |
| Matbaacillik A.S. | 1,396,191 | 5,051 |
| Adana Cimento | | |
| Sanayii T.A.S. | 557,214 | 4,291 |
| Trakya Cam Sanayii A.S. | 1,626,937 | 4,249 |
| Aygaz A.S. | 895,626 | 4,217 |
* | Is Gayrimenkul Yatirim | | |
| Ortakligi A.S. | 2,473,150 | 4,166 |
| Cimsa Cemento | | |
| Sanayi ve Ticaret A.S. | 471,573 | 4,043 |
| Akcansa Cimento A.S. | 503,911 | 3,705 |
| Ford Otomotiv Sanayi A.S. | 270,441 | 3,193 |
* | Vestel Elektronik | | |
| Sanayi ve Ticaret A.S. | 966,220 | 2,881 |
| Ulker Gida Sanayi ve | | |
| Ticaret A.S. | 447,092 | 2,058 |
* | Turk Hava Yollari | | |
| Anonim Ortakligi | 174,278 | 1,255 |
| | | 469,772 |
Total Common Stocks | | |
(Cost $13,448,998) | | 25,670,194 |
Temporary Cash Investments (0.6%) | | |
2 | Vanguard Market Liquidity | | |
| Fund, 4.955% | 44,941,610 | 44,942 |
2 | Vanguard Market Liquidity | | |
| Fund, 4.955%—Note F | 95,394,300 | 95,394 |
Total Temporary Cash Investments | | |
(Cost $140,336) | | 140,336 |
Total Investments (100.1%) | | |
(Cost $13,589,334) | | 25,810,530 |
Other Assets and Liabilities (–0.1%) | | |
Other Assets—Note B | | 395,693 |
Liabilities—Note F | | (419,832) |
| | | (24,139) |
Net Assets (100%) | | 25,786,391 |
| | | | |
113
Emerging Markets Stock Index Fund
At October 31, 2007, net assets consisted of:3 |
| Amount |
| ($000) |
Paid-in Capital | 13,406,294 |
Undistributed Net Investment Income | 344,566 |
Accumulated Net Realized Losses | (186,710) |
Unrealized Appreciation | |
Investment Securities | 12,221,196 |
Foreign Currencies | 1,045 |
Net Assets | 25,786,391 |
| |
Investor Shares—Net Assets | |
Applicable to 384,663,904 outstanding | |
$.001 par value shares of beneficial | |
interest (unlimited authorization) | 14,149,814 |
Net Asset Value Per Share— | |
Investor Shares | $36.78 |
| |
Admiral Shares—Net Assets | |
Applicable to 72,503,459 outstanding | |
$.001 par value shares of beneficial | |
interest (unlimited authorization) | 3,513,896 |
Net Asset Value Per Share— | |
Admiral Shares | $48.47 |
| |
Signal Shares—Net Assets | |
Applicable to 8,263,104 outstanding | |
$.001 par value shares of beneficial | |
interest (unlimited authorization) | 385,120 |
Net Asset Value Per Share— | |
Signal Shares | $46.61 |
| |
Institutional Shares—Net Assets | |
Applicable to 39,641,306 outstanding | |
$.001 par value shares of beneficial | |
interest (unlimited authorization) | 1,462,737 |
Net Asset Value Per Share— | |
Institutional Shares | $36.90 |
| |
ETF Shares—Net Assets | |
Applicable to 53,805,371 outstanding | |
$.001 par value shares of beneficial | |
interest (unlimited authorization) | 6,274,824 |
Net Asset Value Per Share— | |
ETF Shares | $116.62 |
114
• See Note A in Notes to Financial Statements.
* Non-income-producing security.
^ Part of security position is on loan to broker-dealers. See Note F in Notes to Financial Statements.
1 Security exempt from registration under Rule 144A of the Securities Act of 1933. Such securities may be sold in transactions exempt from registration, normally to qualified institutional buyers. At October 31, 2007, the value of this security represented 0.3% of net assets.
2 Affiliated money market fund available only to Vanguard funds and certain trusts and accounts managed by Vanguard. Rate shown is the 7-day yield.
3 See Note D in Notes to Financial Statements for the tax-basis components of net assets.
ADR—American Depositary Receipt.
GDR—Global Depositary Receipt.
115
Emerging Markets Stock Index Fund
Statement of Operations
| Year Ended |
| October 31, 2007 |
| ($000) |
Investment Income | |
Income | |
Dividends1 | 419,477 |
Interest2 | 1,870 |
Security Lending | 2,170 |
Total Income | 423,517 |
Expenses | |
The Vanguard Group—Note B | |
Investment Advisory Services | 408 |
Management and Administrative—Investor Shares | 23,539 |
Management and Administrative—Admiral Shares | 3,140 |
Management and Administrative—Signal Shares | 108 |
Management and Administrative—Institutional Shares | 810 |
Management and Administrative—ETF Shares | 4,497 |
Marketing and Distribution—Investor Shares | 2,265 |
Marketing and Distribution—Admiral Shares | 275 |
Marketing and Distribution—Signal Shares | 1 |
Marketing and Distribution—Institutional Shares | 177 |
Marketing and Distribution—ETF Shares | 715 |
Custodian Fees | 14,752 |
Auditing Fees | 37 |
Shareholders’ Reports | |
Investor Shares | 246 |
Admiral Shares | 11 |
Signal Shares | 1 |
Institutional Shares | — |
ETF Shares | 113 |
Trustees’ Fees and Expenses | 18 |
Total Expenses | 51,113 |
Expenses Paid Indirectly—Note C | (296) |
Net Expenses | 50,817 |
Net Investment Income | 372,700 |
Realized Net Gain (Loss) | |
Investment Securities Sold | 168,809 |
Foreign Currencies | (622) |
Swap Contracts | 5,960 |
Realized Net Gain (Loss) | 174,147 |
Change in Unrealized Appreciation (Depreciation) | |
Investment Securities | 8,817,859 |
Foreign Currencies | 970 |
Swap Contracts | (891) |
Change in Unrealized Appreciation (Depreciation) | 8,817,938 |
Net Increase (Decrease) in Net Assets Resulting from Operations | 9,364,785 |
1 Dividends are net of foreign withholding taxes of $42,509,000.
2 Interest income from an affiliated company of the fund was $1,828,000.
116
Emerging Markets Stock Index Fund
Statement of Changes in Net Assets
| Year Ended October 31, |
| 2007 | 2006 |
| ($000) | ($000) |
Increase (Decrease) in Net Assets | | |
Operations | | |
Net Investment Income | 372,700 | 199,880 |
Realized Net Gain (Loss) | 174,147 | (148,471) |
Change in Unrealized Appreciation (Depreciation) | 8,817,938 | 1,974,410 |
Net Increase (Decrease) in Net Assets Resulting from Operations | 9,364,785 | 2,025,819 |
Distributions | | |
Net Investment Income | | |
Investor Shares | (130,073) | (96,914) |
Admiral Shares | (30,176) | — |
Signal Shares | — | — |
Institutional Shares | (11,028) | (9,315) |
ETF Shares | (34,662) | (9,827) |
Realized Capital Gain | | |
Investor Shares | — | — |
Admiral Shares | — | — |
Signal Shares | — | — |
Institutional Shares | — | — |
ETF Shares | — | — |
Total Distributions | (205,939) | (116,056) |
Capital Share Transactions—Note G | | |
Investor Shares | 1,679,248 | 746,446 |
Admiral Shares | 699,959 | 1,395,891 |
Signal Shares | 330,912 | — |
Institutional Shares | 356,607 | (42,144) |
ETF Shares | 2,727,702 | 1,042,686 |
Net Increase (Decrease) from Capital Share Transactions | 5,794,428 | 3,142,879 |
Total Increase (Decrease) | 14,953,274 | 5,052,642 |
Net Assets | | |
Beginning of Period | 10,833,117 | 5,780,475 |
End of Period1 | 25,786,391 | 10,833,117 |
1 Net Assets—End of Period includes undistributed net investment income of $344,566,000 and $178,233,000.
117
Emerging Markets Stock Index Fund
Financial Highlights
Investor Shares | | | | | |
| | | | | |
| | | | | |
| Year Ended October 31, |
For a Share Outstanding Throughout Each Period | 2007 | 2006 | 2005 | 2004 | 2003 |
Net Asset Value, Beginning of Period | $22.05 | $16.91 | $12.88 | $11.04 | $7.48 |
Investment Operations | | | | | |
Net Investment Income | .6041 | .396 | .307 | .263 | .170 |
Net Realized and Unrealized Gain (Loss) | | | | | |
on Investments2 | 14.522 | 5.059 | 3.982 | 1.749 | 3.512 |
Total from Investment Operations | 15.126 | 5.455 | 4.289 | 2.012 | 3.682 |
Distributions | | | | | |
Dividends from Net Investment Income | (.396) | (.315) | (.259) | (.172) | (.122) |
Distributions from Realized Capital Gains | — | — | — | — | — |
Total Distributions | (.396) | (.315) | (.259) | (.172) | (.122) |
Net Asset Value, End of Period | $36.78 | $22.05 | $16.91 | $12.88 | $11.04 |
| | | | | |
| | | | | |
Total Return3 | 69.59% | 32.55% | 33.66% | 18.43% | 49.88% |
| | | | | |
| | | | | |
Ratios/Supplemental Data | | | | | |
Net Assets, End of Period (Millions) | $14,150 | $7,202 | $4,937 | $2,556 | $1,589 |
Ratio of Total Expenses to | | | | | |
Average Net Assets | 0.37% | 0.42% | 0.45% | 0.48% | 0.53% |
Ratio of Net Investment Income to | | | | | |
Average Net Assets | 2.24% | 2.20% | 2.48% | 2.44% | 2.26% |
Portfolio Turnover Rate4 | 9% | 26% | 15% | 11% | 16% |
1 Calculated based on average shares outstanding.
2 Includes increases from redemption fees of $.01, $.01, $.00, $.00, and $.00.
3 Total returns do not reflect the 0.5% transaction fee on purchases; the 2% fee assessed until March 23, 2005, on redemptions of shares purchased on or after June 27, 2003, and held for less than two months; the 0.5% fee on all other redemptions; or the account service fee that may be applicable to certain accounts with balances below $10,000.
4 Excludes the value of portfolio securities received or delivered as a result of in-kind purchases or redemptions of the fund’s capital shares, including ETF Creation Units.
118
Emerging Markets Stock Index Fund
Admiral Shares | | |
| Year | June 23, |
| Ended | 20061 to |
| Oct. 31, | Oct. 31, |
For a Share Outstanding Throughout Each Period | 2007 | 2006 |
Net Asset Value, Beginning of Period | $29.03 | $25.00 |
Investment Operations | | |
Net Investment Income | .8532 | .222 |
Net Realized and Unrealized Gain (Loss) on Investments3 | 19.121 | 3.808 |
Total from Investment Operations | 19.974 | 4.030 |
Distributions | | |
Dividends from Net Investment Income | (.534) | — |
Distributions from Realized Capital Gains | — | — |
Total Distributions | (.534) | — |
Net Asset Value, End of Period | $48.47 | $29.03 |
| | |
| | |
Total Return4 | 69.82% | 16.12% |
| | |
| | |
Ratios/Supplemental Data | | |
Net Assets, End of Period (Millions) | $3,514 | $1,491 |
Ratio of Total Expenses to Average Net Assets | 0.25% | 0.30%* |
Ratio of Net Investment Income to Average Net Assets | 2.36% | 2.32%* |
Portfolio Turnover Rate5 | 9% | 26% |
1 Inception.
2 Calculated based on average shares outstanding.
3 Includes increases from redemption fees of $.01 and $.01.
4 Total returns do not reflect the 0.5% transaction fee on purchases and redemptions.
5 Excludes the value of portfolio securities received or delivered as a result of in-kind purchases or redemptions of the fund’s capital shares, including ETF Creation Units.
* Annualized.
119
Emerging Markets Stock Index Fund
Signal Shares | |
| |
| Jan. 19, |
| 20071 to |
| Oct. 31, |
For a Share Outstanding Throughout the Period | 2007 |
Net Asset Value, Beginning of Period | $30.38 |
Investment Operations | |
Net Investment Income | .582 |
Net Realized and Unrealized Gain (Loss) on Investments | 15.65 |
Total from Investment Operations | 16.23 |
Distributions | |
Dividends from Net Investment Income | — |
Distributions from Realized Capital Gains | — |
Total Distributions | — |
Net Asset Value, End of Period | $46.61 |
| |
| |
Total Return3 | 53.42% |
| |
| |
Ratios/Supplemental Data | |
Net Assets, End of Period (Millions) | $385 |
Ratio of Total Expenses to Average Net Assets | 0.25%* |
Ratio of Net Investment Income to Average Net Assets | 2.36%* |
Portfolio Turnover Rate4 | 9% |
1 Inception.
2 Calculated based on average shares outstanding.
3 Total returns do not reflect the 0.5% transaction fee on purchases and redemptions.
4 Excludes the value of portfolio securities received or delivered as a result of in-kind purchases or redemptions of the fund’s capital shares, including ETF Creation Units.
* Annualized.
120
Emerging Markets Stock Index Fund
Institutional Shares | | | | | |
| | | | | |
| | | | | |
| Year Ended October 31, |
For a Share Outstanding Throughout Each Period | 2007 | 2006 | 2005 | 2004 | 2003 |
Net Asset Value, Beginning of Period | $22.11 | $16.95 | $12.90 | $11.05 | $7.49 |
Investment Operations | | | | | |
Net Investment Income | .6861 | .443 | .344 | .287 | .183 |
Net Realized and Unrealized Gain (Loss) | | | | | |
on Investments2 | 14.533 | 5.059 | 3.982 | 1.749 | 3.512 |
Total from Investment Operations | 15.219 | 5.502 | 4.326 | 2.036 | 3.695 |
Distributions | | | | | |
Dividends from Net Investment Income | (.429) | (.342) | (.276) | (.186) | (.135) |
Distributions from Realized Capital Gains | — | — | — | — | — |
Total Distributions | (.429) | (.342) | (.276) | (.186) | (.135) |
Net Asset Value, End of Period | $36.90 | $22.11 | $16.95 | $12.90 | $11.05 |
| | | | | |
| | | | | |
Total Return3 | 69.90% | 32.78% | 33.92% | 18.64% | 50.06% |
| | | | | |
| | | | | |
Ratios/Supplemental Data | | | | | |
Net Assets, End of Period (Millions) | $1,463 | $559 | $468 | $245 | $137 |
Ratio of Total Expenses to | | | | | |
Average Net Assets | 0.20% | 0.25% | 0.25% | 0.33% | 0.38% |
Ratio of Net Investment Income to | | | | | |
Average Net Assets | 2.41% | 2.37% | 2.64% | 2.61% | 2.41% |
Portfolio Turnover Rate4 | 9% | 26% | 15% | 11% | 16% |
1 Calculated based on average shares outstanding.
2 Includes increases from redemption fees of $.01, $.01, $.00, $.00, and $.00.
3 Total returns do not reflect the 0.5% transaction fee on purchases; the 2% fee assessed until March 23, 2005, on redemptions of shares purchased on or after June 27, 2003, and held for less than two months; or the 0.5% fee on all other redemptions.
4 Excludes the value of portfolio securities received or delivered as a result of in-kind purchases or redemptions of the fund’s capital shares, including ETF Creation Units.
121
Emerging Markets Stock Index Fund
ETF Shares | | | |
| | | |
| | March 4, |
| Year Ended | 20051 to |
| October 31, | Oct. 31, |
For a Share Outstanding Throughout Each Period | 2007 | 2006 | 2005 |
Net Asset Value, Beginning of Period | $69.91 | $53.61 | $50.55 |
Investment Operations | | | |
Net Investment Income | 2.1302 | 1.333 | .87 |
Net Realized and Unrealized Gain (Loss) on Investments3 | 45.919 | 16.044 | 2.19 |
Total from Investment Operations | 48.049 | 17.377 | 3.06 |
Distributions | | | |
Dividends from Net Investment Income | (1.339) | (1.077) | — |
Distributions from Realized Capital Gains | — | — | — |
Total Distributions | (1.339) | (1.077) | — |
Net Asset Value, End of Period | $116.62 | $69.91 | $53.61 |
| | | |
| | | |
Total Return | 69.78% | 32.74% | 6.05% |
| | | |
| | | |
Ratios/Supplemental Data | | | |
Net Assets, End of Period (Millions) | $6,275 | $1,582 | $375 |
Ratio of Total Expenses to Average Net Assets | 0.25% | 0.30% | 0.30%* |
Ratio of Net Investment Income to Average Net Assets | 2.36% | 2.32% | 2.59%* |
Portfolio Turnover Rate4 | 9% | 26% | 15% |
1 Inception.
2 Calculated based on average shares outstanding.
3 Includes increases from redemption fees of $.03, $.03, and $.00.
4 Excludes the value of portfolio securities received or delivered as a result of in-kind purchases or redemptions of the fund’s capital shares, including ETF Creation Units.
* Annualized.
See accompanying Notes, which are an integral part of the Financial Statements.
122
Emerging Markets Stock Index Fund
Notes to Financial Statements
Vanguard Emerging Markets Stock Index Fund is registered under the Investment Company Act of 1940 as an open-end investment company, or mutual fund. The fund files reports with the SEC under the company name Vanguard International Equity Index Funds. The fund invests in securities of foreign issuers, which may subject it to investment risks not normally associated with investing in securities of U.S. corporations. The fund offers five classes of shares: Investor Shares, Admiral Shares, Signal Shares, Institutional Shares, and ETF Shares. Investor Shares are available to any investor who meets the fund’s minimum purchase requirements. Admiral Shares are designed for investors who meet certain administrative, service, tenure, and account-size criteria. Signal Shares are designed for institutional investors who meet certain administrative, service, and account-size criteria. Signal Shares were first issued on January 19, 2007. Institutional Shares are designed for investors who meet certain administrative and service criteria and invest a minimum of $5 million. ETF Shares are listed for trading on the American Stock Exchange; they can be purchased and sold through a broker.
A. The following significant accounting policies conform to generally accepted accounting principles for U.S. mutual funds. The fund consistently follows such policies in preparing its financial statements.
1. Security Valuation: Securities are valued as of the close of trading on the New York Stock Exchange (generally 4 p.m., Eastern time) on the valuation date. Equity securities are valued at the latest quoted sales prices or official closing prices taken from the primary market in which each security trades; such securities not traded on the valuation date are valued at the mean of the latest quoted bid and asked prices. Securities for which market quotations are not readily available, or whose values have been affected by events occurring before the fund’s pricing time but after the close of the securities’ primary markets, are valued at their fair values calculated according to procedures adopted by the board of trustees. These procedures include obtaining quotations from an independent pricing service, monitoring news to identify significant market- or security-specific events, and evaluating changes in the values of foreign market proxies (for example, ADRs, futures contracts, or exchange-traded funds), between the time the foreign markets close and the fund’s pricing time. When fair-value pricing is employed, the prices of securities used by a fund to calculate its net asset value may differ from quoted or published prices for the same securities. Investments in Vanguard Market Liquidity Fund are valued at that fund’s net asset value.
2. Foreign Currency: Securities and other assets and liabilities denominated in foreign currencies are translated into U.S. dollars using exchange rates obtained from an independent third party as of the fund’s pricing time on the valuation date. Realized gains (losses) and unrealized appreciation (depreciation) on investment securities include the effects of changes in exchange rates since the securities were purchased, combined with the effects of changes in security prices. Fluctuations in the value of other assets and liabilities resulting from changes in exchange rates are recorded as unrealized foreign currency gains (losses) until the assets or liabilities are settled in cash, at which time they are recorded as realized foreign currency gains (losses).
3. Swap Contracts: The fund has entered into equity swap contracts to earn the total return on selected stocks in the fund’s target index, when investing through a swap provides a return advantage over buying the individual stocks. Under the terms of each swap, the fund receives the total return (either receiving the increase or paying the decrease) on a reference stock, applied to a notional amount that is the value of a designated number of shares of the stock at the beginning of the swap. The fund agrees to pay the counterparty a floating rate that is reset periodically based on short-term interest rates, less a specified interest rate spread, applied to the notional amount. The primary risks associated with the swaps are that a counterparty will default on its obligation to pay net amounts due to the fund, or that the fund will incur fees in the
123
Emerging Markets Stock Index Fund
event it terminates a swap prior to the scheduled termination date.
The notional amounts of swap contracts are not recorded in the Statement of Net Assets. Swaps are valued daily and the change in value is recorded as unrealized appreciation (depreciation) until the termination of the swap, at which time realized gain (loss) is recorded.
4. Federal Income Taxes: The fund intends to continue to qualify as a regulated investment company and distribute all of its taxable income. Accordingly, no provision for federal income taxes is required in the financial statements.
5. Distributions: Distributions to shareholders are recorded on the ex-dividend date.
6. Security Lending: The fund may lend its securities to qualified institutional borrowers to earn additional income. Security loans are required to be secured at all times by collateral at least equal to the market value of securities loaned. The fund invests cash collateral received in Vanguard Market Liquidity Fund, and records a liability for the return of the collateral, during the period the securities are on loan. Security lending income represents the income earned on investing cash collateral, less expenses associated with the loan.
7. Other: Dividend income is recorded on the ex-dividend date. Interest income includes income distributions received from Vanguard Market Liquidity Fund and is accrued daily. Security transactions are accounted for on the date securities are bought or sold. Costs used to determine realized gains (losses) on the sale of investment securities are those of the specific securities sold. Fees assessed on capital share transactions are credited to paid-in capital.
Each class of shares has equal rights as to assets and earnings, except that each class separately bears certain class-specific expenses related to maintenance of shareholder accounts (included in Management and Administrative expenses) and shareholder reporting. Marketing and distribution expenses are allocated to each class of shares based on a method approved by the board of trustees. Income, other non-class-specific expenses, and gains and losses on investments are allocated to each class of shares based on its relative net assets.
B. The Vanguard Group furnishes at cost investment advisory, corporate management, administrative, marketing, and distribution services. The costs of such services are allocated to the fund under methods approved by the board of trustees. The fund has committed to provide up to 0.40% of its net assets in capital contributions to Vanguard. At October 31, 2007, the fund had contributed capital of $1,855,000 to Vanguard (included in Other Assets), representing 0.01% of the fund’s net assets and 1.85% of Vanguard’s capitalization. The fund’s trustees and officers are also directors and officers of Vanguard.
C. The fund’s custodian bank has agreed to reduce its fees when the fund maintains cash on deposit in the non-interest-bearing custody account. For the year ended October 31, 2007, custodian fee offset arrangements reduced the fund’s expenses by $296,000.
D. Distributions are determined on a tax basis and may differ from net investment income and realized capital gains for financial reporting purposes. Differences may be permanent or temporary. Permanent differences are reclassified among capital accounts in the financial statements to reflect their tax character. Temporary differences arise when certain items of income, expense, gain, or loss are recognized in different periods for financial statement and tax purposes; these differences will reverse at some time in the future. Differences in classification may also result from the treatment of short-term gains as ordinary income for tax purposes.
124
Emerging Markets Stock Index Fund
During the year ended October 31, 2007, the fund realized net foreign currency losses of $622,000, which decreased distributable net income for tax purposes; accordingly such losses have been reclassified from accumulated net realized losses to undistributed net investment income. The fund’s realized losses for the year ended October 31, 2007, include realized losses on swaps of $52,000, and taxes paid on realized capital gains on Indian securities of $17,000, which are treated as decreases to taxable income; accordingly these amounts have been reclassified from accumulated net realized losses to undistributed net investment income.
Certain of the fund’s investments are in securities considered to be ”passive foreign investment companies,” for which any unrealized appreciation and/or realized gains are required to be included in distributable net income for tax purposes. During the year ended October 31, 2007, the fund realized gains on the sale of passive foreign investment companies of $263,000, which have been included in current and prior periods’ taxable income; accordingly, such gains have been reclassified from accumulated net realized losses to undistributed net investment income. Unrealized appreciation on the fund’s passive foreign investment company holdings at October 31, 2007, was $41,815,000, of which $5,764,000 has been distributed and is reflected in the balance of undistributed net investment income.
During the year ended October 31, 2007, the fund realized $16,815,000 of net capital gains resulting from in-kind redemptions—in which shareholders exchanged fund shares for securities held by the fund rather than for cash. Because such gains are not taxable to the fund, and are not distributed to shareholders, they have been reclassified from accumulated net realized losses to paid-in capital. For tax purposes, at October 31, 2007, the fund had $397,625,000 of ordinary income available for distribution. The fund had available realized losses of $182,474,000 to offset future net capital gains of $15,143,000 through October 31, 2012, and $167,331,000 through October 31, 2014.
At October 31, 2007, the cost of investment securities for tax purposes was $13,635,382,000. Net unrealized appreciation of investment securities for tax purposes was $12,175,148,000, consisting of unrealized gains of $12,275,312,000 on securities that had risen in value since their purchase and $100,164,000 in unrealized losses on securities that had fallen in value since their purchase.
E. During the year ended October 31, 2007, the fund purchased $7,437,186,000 of investment securities and sold $1,528,669,000 of investment securities, other than temporary cash investments.
F. The market value of securities on loan to broker-dealers at October 31, 2007, was $93,017,000, for which the fund received cash collateral of $95,394,000.
125
Emerging Markets Stock Index Fund
G. Capital share transactions for each class of shares were:
| Year Ended October 31, |
| | 2007 | | | 2006 |
| Amount | Shares | | Amount | Shares |
| ($000) | (000) | | ($000) | (000) |
Investor Shares | | | | | |
Issued | 3,408,393 | 122,527 | | 3,240,704 | 156,096 |
Issued in Lieu of Cash Distributions | 123,741 | 5,215 | | 89,932 | 4,718 |
Redeemed1 | (1,852,886) | (69,648) | | (2,584,190) | (126,252) |
Net Increase (Decrease)—Investor Shares | 1,679,248 | 58,094 | | 746,446 | 34,562 |
Admiral Shares | | | | | |
Issued | 1,276,261 | 35,934 | | 1,441,290 | 53,000 |
Issued in Lieu of Cash Distributions | 26,534 | 849 | | — | — |
Redeemed1 | (602,836) | (15,634) | | (45,399) | (1,645) |
Net Increase (Decrease)—Admiral Shares | 699,959 | 21,149 | | 1,395,891 | 51,355 |
Signal Shares | | | | | |
Issued | 340,696 | 8,511 | | — | — |
Issued in Lieu of Cash Distributions | — | — | | — | — |
Redeemed1 | (9,784) | (248) | | — | — |
Net Increase (Decrease)—Signal Shares | 330,912 | 8,263 | | — | — |
Institutional Shares | | | | | |
Issued | 515,085 | 20,056 | | 105,839 | 5,028 |
Issued in Lieu of Cash Distributions | 9,287 | 391 | | 7,301 | 382 |
Redeemed1 | (167,765) | (6,075) | | (155,284) | (7,780) |
Net Increase (Decrease)—Institutional Shares | 356,607 | 14,372 | | (42,144) | (2,370) |
ETF Shares | | | | | |
Issued | 2,751,033 | 31,381 | | 1,139,196 | 17,234 |
Issued in Lieu of Cash Distributions | — | — | | — | — |
Redeemed | (23,331) | (200) | | (96,510) | (1,600) |
Net Increase (Decrease)—ETF Shares | 2,727,702 | 31,181 | | 1,042,686 | 15,634 |
H. In June 2006, the Financial Accounting Standards Board issued Interpretation No. 48 (“FIN 48”), “Accounting for Uncertainty in Income Taxes.” FIN 48 establishes the minimum threshold for recognizing, and a system for measuring, the benefits of tax-return positions in financial statements, and is effective for the fund’s fiscal year beginning November 1, 2007. Management has analyzed the fund’s tax positions taken on federal income tax returns for all open tax years (tax years ended October 31, 2004–2007) for purposes of implementing FIN 48, and has concluded that as of October 31, 2007, no provision for income tax would be required in the fund’s financial statements.
1 Net of redemption fees of $7,194,000 and $6,249,000 (fund totals).
126
Total International Stock Index Fund
Fund Profile
As of October 31, 2007
Portfolio Characteristics | |
| Fund |
Acquired Fund Fees and Expenses1 | 0.27% |
Sector Diversification (% of equity exposure) |
| | Target | Broad |
| Fund2 | Index3 | Index4 |
Consumer Discretionary | 10.0% | 10.2% | 9.8% |
Consumer Staples | 7.5 | 7.4 | 7.6 |
Energy | 9.4 | 9.3 | 10.7 |
Financials | 26.6 | 26.5 | 24.8 |
Health Care | 5.0 | 5.1 | 6.6 |
Industrials | 11.6 | 11.8 | 11.3 |
Information Technology | 6.8 | 6.7 | 9.6 |
Materials | 11.0 | 11.0 | 9.2 |
Telecommunication | | | |
Services | 7.1 | 7.1 | 6.1 |
Utilities | 5.0 | 4.9 | 4.3 |
Volatility Measures5 | |
| Fund Versus | Fund Versus |
| Target Index3 | Broad Index4 |
R-Squared | 0.98 | 0.98 |
Beta | 0.99 | 0.98 |
Allocation to Underlying Vanguard Funds | |
| |
European Stock Index Fund Investor Shares | 55.5% |
Pacific Stock Index Fund Investor Shares | 24.2% |
Emerging Markets Stock Index Fund | |
Investor Shares | 20.3% |
1 This figure represents a weighted average of the annualized expense ratios and any fees charged by the underlying mutual funds in which the fund invests. The fund does not charge any expenses or fees of its own. Acquired is a term that the Securities and Exchange Commission applies to any mutual fund whose shares are owned by another fund.
2 Reflects holdings of underlying funds.
3 Total International Composite Index.
4 MSCI All Country World Index ex USA.
5 For an explanation of R-squared, beta, and other terms used here, see the Glossary on page 165.
128
Total International Stock Index Fund
Market Diversification (% of equity exposure) |
| | Target |
| Fund1 | Index2 |
Europe | | |
United Kingdom | 18.3% | 18.6% |
France | 8.2 | 8.2 |
Germany | 6.9 | 6.9 |
Switzerland | 5.2 | 5.2 |
Spain | 3.4 | 3.4 |
Italy | 3.0 | 3.0 |
Netherlands | 2.3 | 2.3 |
Sweden | 2.0 | 2.0 |
Finland | 1.6 | 1.5 |
Belgium | 1.0 | 1.0 |
Other European Markets | 3.6 | 3.6 |
Subtotal | 55.5% | 55.7% |
Pacific | | |
Japan | 15.9% | 15.9% |
Australia | 5.5 | 5.5 |
Hong Kong | 1.8 | 1.8 |
Other Pacific Markets | 1.0 | 1.0 |
Subtotal | 24.2% | 24.2% |
Emerging Markets | | |
China | 3.5% | 3.5% |
South Korea | 3.1 | 3.0 |
Brazil | 2.5 | 2.5 |
Taiwan | 2.2 | 2.2 |
Russia | 1.8 | 1.8 |
India | 1.5 | 1.5 |
South Africa | 1.4 | 1.4 |
Other Emerging Markets | 4.3 | 4.2 |
Subtotal | 20.3% | 20.1% |
1 Reflects holdings of underlying funds.
2 Total International Composite Index.
129
Total International Stock Index Fund
Performance Summary
All of the returns in this report represent past performance, which is not a guarantee of future results that may be achieved by the fund. (Current performance may be lower or higher than the performance data cited. For performance data current to the most recent month-end, visit our website at www.vanguard.com/performance.) Note, too, that both investment returns and principal value can fluctuate widely, so an investor’s shares, when sold, could be worth more or less than their original cost. The returns shown do not reflect taxes that a shareholder would pay on fund distributions or on the sale of fund shares.
Cumulative Performance: October 31, 1997–October 31, 2007
Initial Investment of $10,000
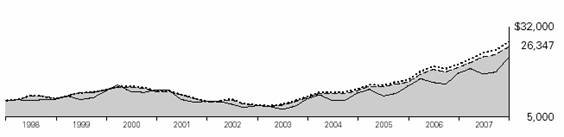
| Average Annual Total Returns | Final Value |
| Periods Ended October 31, 2007 | of a $10,000 |
| One Year | Five Years | Ten Years | Investment |
Total International Stock Index Fund1 | 32.47% | 25.48% | 10.17% | $26,347 |
MSCI All Country World Index ex USA | 32.97 | 26.39 | 10.75 | 27,762 |
Total International Composite Index2 | 31.61 | 25.42 | 10.09 | 26,147 |
Average International Fund3 | 27.80 | 22.41 | 8.82 | 23,287 |
1 Returns do not reflect the 0.5% transaction fee on purchases through March 31, 2000; the 2% fee assessed on redemptions of shares purchased on or after June 27, 2003, and held for less than two months; or the account service fee that may be applicable to certain accounts with balances below $10,000.
2 Consists of the MSCI Europe Index (56%), the MSCI Pacific Index (24%), and the MSCI Emerging Markets Index (20%) as of October 31, 2007.
3 Derived from data provided by Lipper Inc.
130
Total International Stock Index Fund
Fiscal-Year Total Returns (%): October 31, 1997–October 31, 2007
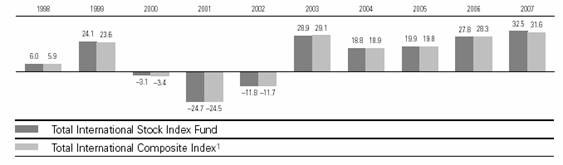
Average Annual Total Returns: Periods Ended September 30, 2007
This table presents average annual total returns through the latest calendar quarter—rather than through the end of the fiscal period. Securities and Exchange Commission rules require that we provide this information.
| Inception Date | One Year | Five Years | Ten Years |
Total International Stock Index Fund2 | 4/29/1996 | 30.09% | 25.43% | 8.50% |
1 Consists of the MSCI Europe Index (55.4%), the MSCI Pacific Index (24.3%), and the MSCI Emerging Markets Index (20.3%) as of October 31, 2007.
2 Returns do not reflect the 0.5% transaction fee on purchases through March 31, 2000; the 2% fee assessed on redemptions of shares purchased on or after June 27, 2003, and held for less than two months; or the account service fee that may be applicable to certain accounts with balances below $10,000.
Note: See Financial Highlights table on page 135 for dividend and capital gains information.
131
Total International Stock Index Fund
Financial Statements
Statement of Net Assets
As of October 31, 2007
The fund provides a complete list of its holdings four times in each fiscal year, at the quarter-ends. For the second and fourth fiscal quarters, the lists appear in the fund’s semiannual and annual reports to shareholders. For the first and third fiscal quarters, the fund files the lists with the Securities and Exchange Commission on Form N-Q. Shareholders can look up the fund’s Forms N-Q on the SEC’s website at www.sec.gov. Forms N-Q may also be reviewed and copied at the SEC’s Public Reference Room (see the back cover of this report for further information).
| | Market |
| | Value• |
| Shares | ($000) |
Investment Companies (100.0%) | | |
International Stock Funds (100.0%) | | |
Vanguard European Stock Index Fund Investor Shares | 380,732,016 | 16,535,191 |
Vanguard Pacific Stock Index Fund Investor Shares | 505,607,948 | 7,174,577 |
Vanguard Emerging Markets Stock Index Fund Investor Shares | 163,544,487 | 6,015,166 |
| | |
Money Market Fund (0.0%) | | |
1 Vanguard Market Liquidity Fund, 4.955% | 2,951,230 | 2,951 |
Total Investment Companies (Cost $18,193,033) | | 29,727,885 |
Other Assets and Liabilities (0.0%) | | |
Other Assets | | 49,485 |
Liabilities | | (52,750) |
| | (3,265) |
Net Assets (100%) | | |
Applicable to 1,357,613,589 outstanding $.001 par value shares of | | |
beneficial interest (unlimited authorization) | | 29,724,620 |
Net Asset Value Per Share | | $21.89 |
| | |
| | |
| | |
| | |
At October 31, 2007, net assets consisted of:2 | | |
| Amount | Per |
| ($000) | Share |
Paid-in Capital | 18,230,955 | $13.42 |
Undistributed Net Investment Income | 8,965 | .01 |
Accumulated Net Realized Losses | (50,152) | (.04) |
Unrealized Appreciation | 11,534,852 | 8.50 |
Net Assets | 29,724,620 | $21.89 |
• See Note A in Notes to Financial Statements.
1 Affiliated money market fund available only to Vanguard funds and certain trusts and accounts managed by Vanguard. Rate shown is the 7-day yield.
2 See Note C in Notes to Financial Statements for the tax-basis components of net assets.
132
Total International Stock Index Fund
Statement of Operations
| Year Ended |
| October 31, 2007 |
| ($000) |
Investment Income | |
Income | |
Income Distributions Received | 452,034 |
Net Investment Income—Note B | 452,034 |
Realized Net Gain (Loss) | |
Capital Gain Distributions Received | — |
Investment Securities Sold | 67,347 |
Realized Net Gain (Loss) | 67,347 |
Change in Unrealized Appreciation (Depreciation) | 6,193,030 |
Net Increase (Decrease) in Net Assets Resulting from Operations | 6,712,411 |
133
Total International Stock Index Fund
Statement of Changes in Net Assets
| Year Ended October 31, |
| 2007 | 2006 |
| ($000) | ($000) |
Increase (Decrease) in Net Assets | | |
Operations | | |
Net Investment Income | 452,034 | 256,922 |
Realized Net Gain (Loss) | 67,347 | 1,573 |
Change in Unrealized Appreciation (Depreciation) | 6,193,030 | 3,233,656 |
Net Increase (Decrease) in Net Assets Resulting from Operations | 6,712,411 | 3,492,151 |
Distributions | | |
Net Investment Income | (446,154) | (254,606) |
Realized Capital Gain | — | — |
Total Distributions | (446,154) | (254,606) |
Capital Share Transactions—Note E | | |
Issued | 8,204,059 | 5,216,842 |
Issued in Lieu of Cash Distributions | 410,001 | 232,227 |
Redeemed1 | (3,355,766) | (1,817,473) |
Net Increase (Decrease) from Capital Share Transactions | 5,258,294 | 3,631,596 |
Total Increase (Decrease) | 11,524,551 | 6,869,141 |
Net Assets | | |
Beginning of Period | 18,200,069 | 11,330,928 |
End of Period2 | 29,724,620 | 18,200,069 |
1 The fund collected redemption fees of $907,000 and $719,000, which were reallocated proportionately to the funds in which it invests.
2 Net Assets—End of Period includes undistributed net investment income of $8,965,000 and $3,085,000.
134
Total International Stock Index Fund
Financial Highlights
| Year Ended October 31, |
For a Share Outstanding Throughout Each Period | 2007 | 2006 | 2005 | 2004 | 2003 |
Net Asset Value, Beginning of Period | $16.90 | $13.49 | $11.48 | $9.84 | $7.79 |
Investment Operations | | | | | |
Net Investment Income | .412 | .294 | .255 | .19 | .157 |
Capital Gain Distributions Received | — | — | — | — | — |
Net Realized and Unrealized Gain (Loss) | | | | | |
on Investments | 4.980 | 3.410 | 2.010 | 1.64 | 2.050 |
Total from Investment Operations | 5.392 | 3.704 | 2.265 | 1.83 | 2.207 |
Distributions | | | | | |
Dividends from Net Investment Income | (.402) | (.294) | (.255) | (.19) | (.157) |
Distributions from Realized Capital Gains | — | — | — | — | — |
Total Distributions | (.402) | (.294) | (.255) | (.19) | (.157) |
Net Asset Value, End of Period | $21.89 | $16.90 | $13.49 | $11.48 | $9.84 |
| | | | | |
| | | | | |
Total Return1 | 32.47% | 27.84% | 19.91% | 18.80% | 28.94% |
| | | | | |
| | | | | |
Ratios/Supplemental Data | | | | | |
Net Assets, End of Period (Millions) | $29,725 | $18,200 | $11,331 | $7,317 | $4,538 |
Ratio of Expenses to | | | | | |
Average Net Assets—Note B | 0%2 | 0% | 0% | 0% | 0% |
Ratio of Net Investment Income to | | | | | |
Average Net Assets | 1.93% | 1.71% | 1.76% | 1.54% | 1.75% |
Portfolio Turnover Rate | 2% | 2% | 3% | 3% | 2% |
1 Total returns do not reflect the 2% fee assessed on redemptions of shares purchased on or after June 27, 2003, and held for less than two months; or the account service fee that may be applicable to certain accounts with balances below $10,000.
2 The acquired fund fees and expenses were 0.27%.
See accompanying Notes, which are an integral part of the Financial Statements.
135
Total International Stock Index Fund
Notes to Financial Statements
Vanguard Total International Stock Index Fund is registered under the Investment Company Act of 1940 as an open-end investment company, or mutual fund. The fund files reports with the SEC under the company name Vanguard STAR® Funds. The fund seeks to match the performance of its target index by investing in the European, Pacific, and Emerging Markets Stock Index Funds. The fund’s indirect investments in foreign securities involve investment risks not normally associated with investing in securities of U.S. corporations.
A. The following significant accounting policies conform to generally accepted accounting principles for U.S. mutual funds. The fund consistently follows such policies in preparing its financial statements.
1. Valuation: Investments are valued at the net asset value of each underlying Vanguard fund determined as of the close of the New York Stock Exchange (generally 4 p.m., Eastern time) on the valuation date.
2. Federal Income Taxes: The fund intends to continue to qualify as a regulated investment company and distribute all of its taxable income. Accordingly, no provision for federal income taxes is required in the financial statements.
3. Distributions: Distributions to shareholders are recorded on the ex-dividend date.
4. Other: Income and capital gain distributions received are recorded on the ex-dividend date. Security transactions are accounted for on the date securities are bought or sold. Costs used to determine realized gains (losses) on the sale of investment securities are those of the specific securities sold.
B. Under a service agreement, The Vanguard Group furnishes corporate management, administrative, marketing, and distribution services to the fund. The service agreement provides that Vanguard will reimburse the fund’s expenses to the extent of savings in administrative and marketing costs realized by Vanguard in the operation of the fund. Accordingly, all expenses incurred by the fund during the year ended October 31, 2007, were reimbursed by Vanguard. The fund’s trustees and officers are also directors and officers of Vanguard, and the funds in which the fund invests.
C. Distributions are determined on a tax basis and may differ from net investment income and realized capital gains for financial reporting purposes. Differences may be permanent or temporary. Permanent differences are reclassified among capital accounts in the financial statements to reflect their tax character. Temporary differences arise when certain items of income, expense, gain, or loss are recognized in different periods for financial statement and tax purposes; these differences will reverse at some time in the future. Differences in classification may also result from the treatment of short-term gains as ordinary income for tax purposes.
During the year ended October 31, 2007, the fund realized $67,347,000 of net capital gains resulting from in-kind redemptions—in which shareholders exchanged fund shares for securities held by the fund rather than for cash. Because such gains are not taxable to the fund, and are not distributed to shareholders, they have been reclassified from accumulated net realized losses to paid-in capital.
For tax purposes, at October 31, 2007, the fund had $8,839,000 of ordinary income available for distribution. The fund had available realized losses of $48,186,000 to offset future net capital gains of $4,316,000 through October 31, 2009, and $43,870,000 through October 31, 2010.
136
Total International Stock Index Fund
At October 31, 2007, the cost of investment securities for tax purposes was $18,194,871,000. Net unrealized appreciation of investment securities for tax purposes was $11,533,014,000, consisting entirely of unrealized gains on securities that had risen in value since their purchase.
D. During the year ended October 31, 2007, the fund purchased $5,823,633,000 of investment securities and sold $555,008,000 of investment securities, other than temporary cash investments.
E. Capital shares issued and redeemed were:
| Year Ended October 31, |
| 2007 | 2006 |
| Shares | Shares |
| (000) | (000) |
Issued | 433,657 | 338,604 |
Issued in Lieu of Cash Distributions | 23,151 | 16,161 |
Redeemed | (176,014) | (118,102) |
Net Increase (Decrease) in Shares Outstanding | 280,794 | 236,663 |
F. In June 2006, the Financial Accounting Standards Board issued Interpretation No. 48 (“FIN 48”), “Accounting for Uncertainty in Income Taxes.” FIN 48 establishes the minimum threshold for recognizing, and a system for measuring, the benefits of tax-return positions in financial statements, and is effective for the fund’s fiscal year beginning November 1, 2007. Management has analyzed the fund’s tax positions taken on federal income tax returns for all open tax years (tax years ended October 31, 2004–2007) for purposes of implementing FIN 48, and has concluded that as of October 31, 2007, no provision for income tax would be required in the fund’s financial statements.
137
Developed Markets Index Fund
Fund Profile
As of October 31, 2007
Portfolio Characteristics | |
| Fund |
Acquired Fund Fees and Expenses1 | 0.22% |
Sector Diversification (% of equity exposure) |
| | Target | Broad |
| Fund2 | Index3 | Index4 |
Consumer Discretionary | 11.0% | 11.1% | 9.8% |
Consumer Staples | 8.3 | 8.3 | 7.6 |
Energy | 7.6 | 7.5 | 10.7 |
Financials | 27.7 | 27.7 | 24.8 |
Health Care | 6.0 | 6.1 | 6.6 |
Industrials | 12.3 | 12.4 | 11.3 |
Information Technology | 5.7 | 5.7 | 9.6 |
Materials | 9.9 | 9.8 | 9.2 |
Telecommunication | | | |
Services | 6.1 | 6.1 | 6.1 |
Utilities | 5.4 | 5.3 | 4.3 |
Volatility Measures5 | |
| Fund Versus | Fund Versus |
| Target Index3 | Broad Index4 |
R-Squared | 0.98 | 0.95 |
Beta | 0.99 | 0.88 |
Allocation to Underlying Vanguard Funds | |
| |
European Stock Index Fund Investor Shares | 69.7% |
Pacific Stock Index Fund Investor Shares | 30.3% |
138
Market Diversification (% of equity exposure) |
| | Target |
| Fund2 | Index3 |
United Kingdom | 22.7% | 22.9% |
Japan | 20.0 | 20.0 |
France | 9.9 | 10.3 |
Germany | 8.7 | 8.7 |
Australia | 6.8 | 6.9 |
Switzerland | 6.6 | 6.5 |
Spain | 4.3 | 4.2 |
Italy | 3.8 | 3.8 |
Netherlands | 3.5 | 2.9 |
Sweden | 2.4 | 2.5 |
Hong Kong | 2.2 | 2.3 |
Finland | 2.0 | 1.9 |
Belgium | 1.3 | 1.3 |
Norway | 1.1 | 1.1 |
Singapore | 1.1 | 1.2 |
Other Developed Markets | 3.6 | 3.5 |
1 This figure represents a weighted average of the annualized expense ratios and any fees charged by the underlying mutual funds in which the fund invests. The fund does not charge any expenses or fees of its own. Acquired is a term that the Securities and Exchange Commission applies to any mutual fund whose shares are owned by another fund.
2 Reflects holdings of underlying funds.
3 MSCI EAFE Index.
4 MSCI All Country World Index ex USA.
5 For an explanation of R-squared, beta, and other terms used here, see the Glossary on page 165.
139
Developed Markets Index Fund
Performance Summary
All of the returns in this report represent past performance, which is not a guarantee of future results that may be achieved by the fund. (Current performance may be lower or higher than the performance data cited. For performance data current to the most recent month-end, visit our website at www.vanguard.com/performance.) Note, too, that both investment returns and principal value can fluctuate widely, so an investor’s shares, when sold, could be worth more or less than their original cost. The returns shown do not reflect taxes that a shareholder would pay on fund distributions or on the sale of fund shares.
Cumulative Performance: May 8, 2000–October 31, 2007
Initial Investment of $10,000
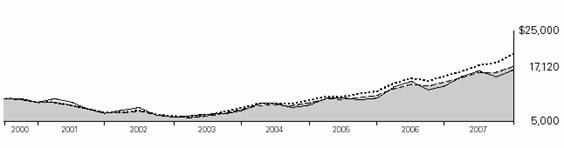
| Average Annual Total Returns | Final Value |
| Periods Ended October 31, 2007 | of a $10,000 |
| One Year | Five Years | Since Inception1 | Investment |
Developed Markets Index Fund2 | 25.67% | 23.33% | 7.45% | $17,120 |
MSCI All Country World Index ex USA | 32.97 | 26.39 | 9.60 | 19,845 |
MSCI EAFE Index | 24.91 | 23.21 | 7.38 | 17,033 |
Average International Fund3 | 27.80 | 22.41 | 6.76 | 16,313 |
1 Performance for the fund and its comparative standards is calculated since the fund’s inception: May 8, 2000.
2 Total returns do not reflect the 2% fee assessed on redemptions of shares purchased on or after June 27, 2003, and held for less than two months; or the account service fee that may be applicable to certain accounts with balances below $10,000.
3 Derived from data provided by Lipper Inc.
140
Developed Markets Index Fund
Fiscal-Year Total Returns (%): May 8, 2000–October 31, 2007
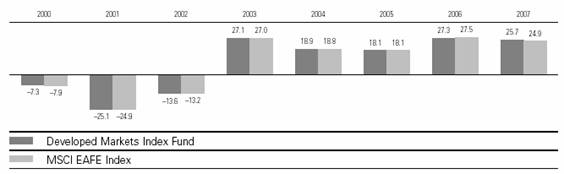
Average Annual Total Returns: Periods Ended September 30, 2007
This table presents average annual total returns through the latest calendar quarter—rather than through the end of the fiscal period. Securities and Exchange Commission rules require that we provide this information.
| | | | Since |
| Inception Date | One Year | Five Years | Inception |
Developed Markets Index Fund1 | 5/8/2000 | 24.99% | 23.58% | 6.91% |
1 Total returns do not reflect the 2% fee assessed on redemptions of shares purchased on or after June 27, 2003, and held for less than two months; or the account service fee that may be applicable to certain accounts with balances below $10,000.
Note: See Financial Highlights table on page 145 for dividend and capital gains information.
141
Developed Markets Index Fund
Financial Statements
Statement of Net Assets
As of October 31, 2007
The fund provides a complete list of its holdings four times in each fiscal year, at the quarter-ends. For the second and fourth fiscal quarters, the lists appear in the fund’s semiannual and annual reports to shareholders. For the first and third fiscal quarters, the fund files the lists with the Securities and Exchange Commission on Form N-Q. Shareholders can look up the fund’s Forms N-Q on the SEC’s website at www.sec.gov. Forms N-Q may also be reviewed and copied at the SEC’s Public Reference Room (see the back cover of this report for further information).
| | Market |
| | Value• |
| Shares | ($000) |
Investment Companies (100.1%) | | |
Vanguard European Stock Index Fund Investor Shares | 63,917,617 | 2,775,942 |
Vanguard Pacific Stock Index Fund Investor Shares | 84,882,215 | 1,204,479 |
Total Investment Companies (Cost $2,526,709) | | 3,980,421 |
Other Assets and Liabilities (–0.1%) | | |
Other Assets | | 8,851 |
Liabilities | | (12,883) |
| | (4,032) |
Net Assets (100%) | | |
Applicable to 266,648,147 outstanding $.001 par value shares of | | |
beneficial interest (unlimited authorization) | | 3,976,389 |
Net Asset Value Per Share | | $14.91 |
| | |
| | |
| | |
| | |
At October 31, 2007, net assets consisted of:1 | | |
| Amount | Per |
| ($000) | Share |
Paid-in Capital | 2,520,214 | $9.45 |
Undistributed Net Investment Income | 1,437 | .01 |
Accumulated Net Realized Gains | 1,026 | — |
Unrealized Appreciation | 1,453,712 | 5.45 |
Net Assets | 3,976,389 | $14.91 |
• See Note A in Notes to Financial Statements.
1 See Note C in Notes to Financial Statements for the tax-basis components of net assets.
142
Developed Markets Index Fund
Statement of Operations
| Year Ended |
| October 31, 2007 |
| ($000) |
Investment Income | |
Income | |
Income Distributions Received | 67,803 |
Net Investment Income—Note B | 67,803 |
Realized Net Gain (Loss) | |
Capital Gain Distributions Received | — |
Investment Securities Sold | 1,415 |
Realized Net Gain (Loss) | 1,415 |
Change in Unrealized Appreciation (Depreciation) of Investment Securities | 681,973 |
Net Increase (Decrease) in Net Assets Resulting from Operations | 751,191 |
143
Developed Markets Index Fund
Statement of Changes in Net Assets
| Year Ended October 31, |
| 2007 | 2006 |
| ($000) | ($000) |
Increase (Decrease) in Net Assets | | |
Operations | | |
Net Investment Income | 67,803 | 37,273 |
Realized Net Gain (Loss) | 1,415 | 1,323 |
Change in Unrealized Appreciation (Depreciation) | 681,973 | 440,326 |
Net Increase (Decrease) in Net Assets Resulting from Operations | 751,191 | 478,922 |
Distributions | | |
Net Investment Income | (66,258) | (37,455) |
Realized Capital Gain1 | (1,108) | — |
Total Distributions | (67,366) | (37,455) |
Capital Share Transactions—Note E | | |
Issued | 1,375,081 | 949,160 |
Issued in Lieu of Cash Distributions | 60,616 | 31,783 |
Redeemed2 | (715,040) | (473,513) |
Net Increase (Decrease) from Capital Share Transactions | 720,657 | 507,430 |
Total Increase (Decrease) | 1,404,482 | 948,897 |
Net Assets | | |
Beginning of Period | 2,571,907 | 1,623,010 |
End of Period3 | 3,976,389 | 2,571,907 |
1 Includes fiscal 2007 short-term gain distributions totaling $1,108,000. Short-term gain distributions are treated as ordinary income dividends for tax purposes.
2 The fund collected redemption fees of $202,000 and $22,000, which were reallocated proportionately to the funds in which it invests.
3 Net Assets—End of Period includes undistributed (overdistributed) net investment income of $1,437,000 and ($108,000).
144
Developed Markets Index Fund
Financial Highlights
| Year Ended October 31, |
For a Share Outstanding Throughout Each Period | 2007 | 2006 | 2005 | 2004 | 2003 |
Net Asset Value, Beginning of Period | $12.15 | $9.75 | $8.43 | $7.22 | $5.80 |
Investment Operations | | | | | |
Net Investment Income | .305 | .219 | .19 | .143 | .116 |
Capital Gain Distributions Received | — | — | — | — | — |
Net Realized and Unrealized Gain (Loss) | | | | | |
on Investments | 2.759 | 2.400 | 1.32 | 1.210 | 1.420 |
Total from Investment Operations | 3.064 | 2.619 | 1.51 | 1.353 | 1.536 |
Distributions | | | | | |
Dividends from Net Investment Income | (.299) | (.219) | (.19) | (.143) | (.116) |
Distributions from Realized Capital Gains | (.005) | — | — | — | — |
Total Distributions | (.304) | (.219) | (.19) | (.143) | (.116) |
Net Asset Value, End of Period | $14.91 | $12.15 | $9.75 | $8.43 | $7.22 |
| | | | | |
| | | | | |
Total Return1 | 25.67% | 27.27% | 18.07% | 18.94% | 27.06% |
| | | | | |
| | | | | |
Ratios/Supplemental Data | | | | | |
Net Assets, End of Period (Millions) | $3,976 | $2,572 | $1,623 | $1,038 | $597 |
Ratio of Expenses to | | | | | |
Average Net Assets—Note B | 0%2 | 0% | 0% | 0% | 0% |
Ratio of Net Investment Income to | | | | | |
Average Net Assets | 2.05% | 1.82% | 1.77% | 1.52% | 1.48% |
Portfolio Turnover Rate | 7% | 9% | 10% | 4% | 7% |
1 Total returns do not reflect the 2% fee assessed on redemptions of shares purchased on or after June 27, 2003, and held for less than two months; or the account service fee that may be applicable to certain accounts with balances below $10,000.
2 The acquired fund fees and expenses were 0.22%.
See accompanying Notes, which are an integral part of the Financial Statements.
145
Developed Markets Index Fund
Notes to Financial Statements
Vanguard Developed Markets Index Fund is registered under the Investment Company Act of 1940 as an open-end investment company, or mutual fund. The fund files reports with the SEC under the company name Vanguard STAR Funds. The fund seeks to match the performance of its target index by investing in the European and Pacific Stock Index Funds. The fund’s indirect investments in foreign securities involve investment risks not normally associated with investing in securities of U.S. corporations.
A. The following significant accounting policies conform to generally accepted accounting principles for U.S. mutual funds. The fund consistently follows such policies in preparing its financial statements.
1. Valuation: Investments are valued at the net asset value of each underlying Vanguard fund determined as of the close of the New York Stock Exchange (generally 4 p.m., Eastern time) on the valuation date.
2. Federal Income Taxes: The fund intends to continue to qualify as a regulated investment company and distribute all of its taxable income. Accordingly, no provision for federal income taxes is required in the financial statements.
3. Distributions: Distributions to shareholders are recorded on the ex-dividend date.
4. Other: Income and capital gain distributions received are recorded on the ex-dividend date. Security transactions are accounted for on the date securities are bought or sold. Costs used to determine realized gains (losses) on the sale of investment securities are those of the specific securities sold.
B. Under a service agreement, The Vanguard Group furnishes corporate management, administrative, marketing, and distribution services to the fund. The service agreement provides that Vanguard will reimburse the fund’s expenses to the extent of savings in administrative and marketing costs realized by Vanguard in the operation of the fund. Accordingly, all expenses incurred by the fund during the year ended October 31, 2007, were reimbursed by Vanguard. The fund’s trustees and officers are also directors and officers of Vanguard, and the funds in which the fund invests.
C. Distributions are determined on a tax basis and may differ from net investment income and realized capital gains for financial reporting purposes. Differences may be permanent or temporary. Permanent differences are reclassified among capital accounts in the financial statements to reflect their tax character. Temporary differences arise when certain items of income, expense, gain, or loss are recognized in different periods for financial statement and tax purposes; these differences will reverse at some time in the future. Differences in classification may also result from the treatment of short-term gains as ordinary income for tax purposes.
For tax purposes, at October 31, 2007, the fund had $2,767,000 of ordinary income and $7,000 of long-term capital gains available for distribution.
At October 31, 2007, the cost of investment securities for tax purposes was $2,527,020,000. Net unrealized appreciation of investment securities for tax purposes was $1,453,401,000, consisting entirely of unrealized gains on securities that had risen in value since their purchase.
D. During the year ended October 31, 2007, the fund purchased $950,504,000 of investment securities and sold $225,312,000 of investment securities, other than temporary cash investments.
146
Developed Markets Index Fund
E. Capital shares issued and redeemed were:
| Year Ended October 31, |
| 2007 | 2006 |
| Shares | Shares |
| (000) | (000) |
Issued | 103,370 | 85,083 |
Issued in Lieu of Cash Distributions | 4,803 | 3,089 |
Redeemed | (53,150) | (42,944) |
Net Increase (Decrease) in Shares Outstanding | 55,023 | 45,228 |
F. In June 2006, the Financial Accounting Standards Board issued Interpretation No. 48 (“FIN 48”), “Accounting for Uncertainty in Income Taxes.” FIN 48 establishes the minimum threshold for recognizing, and a system for measuring, the benefits of tax-return positions in financial statements, and is effective for the fund’s fiscal year beginning November 1, 2007. Management has analyzed the fund’s tax positions taken on federal income tax returns for all open tax years (tax years ended October 31, 2004–2007) for purposes of implementing FIN 48, and has concluded that as of October 31, 2007, no provision for income tax would be required in the fund’s financial statements.
147
Institutional Developed Markets Index Fund
Fund Profile
As of October 31, 2007
Portfolio Characteristics | |
| | Fund |
Acquired Fund Fees and Expenses1 | 0.09% |
| | |
Sector Diversification (% of equity exposure) |
| | Target | Broad |
| Fund2 | Index3 | Index4 |
Consumer Discretionary | 11.0% | 11.1% | 9.8% |
Consumer Staples | 8.3 | 8.3 | 7.6 |
Energy | 7.6 | 7.5 | 10.7 |
Financials | 27.7 | 27.7 | 24.8 |
Health Care | 6.0 | 6.1 | 6.6 |
Industrials | 12.3 | 12.4 | 11.3 |
Information Technology | 5.7 | 5.7 | 9.6 |
Materials | 9.9 | 9.8 | 9.2 |
Telecommunication | | | |
Services | 6.1 | 6.1 | 6.1 |
Utilities | 5.4 | 5.3 | 4.3 |
Volatility Measures5 | |
| Fund Versus | Fund Versus |
| Target Index3 | Broad Index4 |
R-Squared | 0.98 | 0.95 |
Beta | 0.99 | 0.88 |
Allocation to Underlying Vanguard Funds |
| |
European Stock Index Fund Investor Shares | 69.7% |
Pacific Stock Index Fund Investor Shares | 30.3% |
148
Market Diversification (% of equity exposure) |
| | Target |
| Fund2 | Index3 |
United Kingdom | 22.7% | 22.9% |
Japan | 20.0 | 20.0 |
France | 9.9 | 10.3 |
Germany | 8.7 | 8.7 |
Australia | 6.8 | 6.9 |
Switzerland | 6.6 | 6.5 |
Spain | 4.3 | 4.2 |
Italy | 3.8 | 3.8 |
Netherlands | 3.5 | 2.9 |
Sweden | 2.4 | 2.5 |
Hong Kong | 2.2 | 2.3 |
Finland | 2.0 | 1.9 |
Belgium | 1.3 | 1.3 |
Norway | 1.1 | 1.1 |
Singapore | 1.1 | 1.2 |
Other Developed Markets | 3.6 | 3.5 |
1 This figure represents a weighted average of the annualized expense ratios and any fees charged by the underlying mutual funds in which the fund invests. The fund does not charge any expenses or fees of its own. Acquired is a term that the Securities and Exchange Commission applies to any mutual fund whose shares are owned by another fund.
2 Reflects holdings of underlying funds.
3 MSCI EAFE Index.
4 MSCI All Country World Index ex USA.
5 For an explanation of R-squared, beta, and other terms used here, see the Glossary on page 165.
149
Institutional Developed Markets Index Fund
Performance Summary
All of the returns in this report represent past performance, which is not a guarantee of future results that may be achieved by the fund. (Current performance may be lower or higher than the performance data cited. For performance data current to the most recent month-end, visit our website at www.vanguard.com/performance.) Note, too, that both investment returns and principal value can fluctuate widely, so an investor’s shares, when sold, could be worth more or less than their original cost. The returns shown do not reflect taxes that a shareholder would pay on fund distributions or on the sale of fund shares.
Cumulative Performance: June 1, 2000–October 31, 2007
Initial Investment of $5,000,000
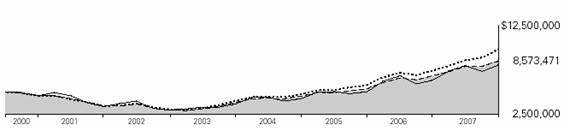
| Average Annual Total Returns | Final Value of |
| Periods Ended October 31, 2007 | a $5,000,000 |
| One Year | Five Years | Since Inception1 | Investment |
Institutional Developed Markets Index Fund2 | 25.84% | 23.49% | 7.54% | $8,573,471 |
MSCI All Country World Index ex USA | 32.97 | 26.39 | 9.58 | 9,853,095 |
MSCI EAFE Index | 24.91 | 23.21 | 7.46 | 8,523,444 |
Average International Fund3 | 27.80 | 22.41 | 6.70 | 8,086,543 |
1 Performance for the fund and its comparative standards is calculated since the fund’s inception: June 1, 2000.
2 Returns do not reflect the 2% fee assessed on redemptions of shares purchased on or after June 27, 2003, and held for less than two months.
3 Derived from data provided by Lipper Inc.
150
Institutional Developed Markets Index Fund
Fiscal-Year Total Returns (%): June 1, 2000–October 31, 2007
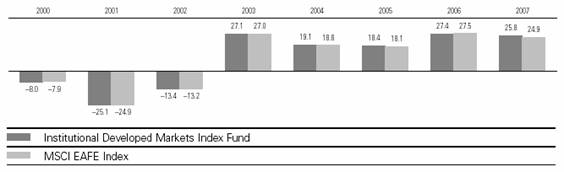
Average Annual Total Returns: Periods Ended September 30, 2007
This table presents average annual total returns through the latest calendar quarter—rather than through the end of the fiscal period. Securities and Exchange Commission rules require that we provide this information.
| | | | Since |
| Inception Date | One Year | Five Years | Inception |
Institutional Developed Markets Index Fund1 | 6/1/2000 | 25.15% | 23.79% | 7.00% |
1 Total returns do not reflect the 2% fee assessed on redemptions of shares purchased on or after June 27, 2003, and held for less than two months.
Note: See Financial Highlights table on page 155 for dividend and capital gains information.
151
Institutional Developed Markets Index Fund
Financial Statements
Statement of Net Assets
As of October 31, 2007
The fund provides a complete list of its holdings four times in each fiscal year, at the quarter-ends. For the second and fourth fiscal quarters, the lists appear in the fund’s semiannual and annual reports to shareholders. For the first and third fiscal quarters, the fund files the lists with the Securities and Exchange Commission on Form N-Q. Shareholders can look up the fund’s Forms N-Q on the SEC’s website at www.sec.gov. Forms N-Q may also be reviewed and copied at the SEC’s Public Reference Room (see the back cover of this report for further information).
| | Market |
| | Value• |
| Shares | ($000) |
Investment Companies (100.0%) | | |
Vanguard European Stock Index Fund Institutional Shares | 81,921,978 | 3,564,425 |
Vanguard Pacific Stock Index Fund Institutional Shares | 108,762,040 | 1,546,596 |
Total Investment Companies (Cost $3,591,516) | | 5,111,021 |
Other Assets and Liabilities (0.0%) | | |
Other Assets | | 7,186 |
Liabilities | | (6,775) |
| | 411 |
Net Assets (100%) | | |
Applicable to 345,559,339 outstanding $.001 par value shares of | | |
beneficial interest (unlimited authorization) | | 5,111,432 |
Net Asset Value Per Share | | $14.79 |
| | |
| | |
| | |
At October 31, 2007, net assets consisted of:1 | | |
| Amount | Per |
| ($000) | Share |
Paid-in Capital | 3,600,207 | $10.41 |
Undistributed Net Investment Income | 1,959 | .01 |
Accumulated Net Realized Losses | (10,239) | (.03) |
Unrealized Appreciation | 1,519,505 | 4.40 |
Net Assets | 5,111,432 | $14.79 |
• See Note A in Notes to Financial Statements.
1 See Note C in Notes to Financial Statements for the tax-basis components of net assets.
152
Institutional Developed Markets Index Fund
Statement of Operations
| Year Ended |
| October 31, 2007 |
| ($000) |
Investment Income | |
Income | |
Income Distributions Received | 98,306 |
Net Investment Income—Note B | 98,306 |
Realized Net Gain (Loss) | |
Capital Gain Distributions Received | — |
Investment Securities Sold | 224,995 |
Realized Net Gain (Loss) | 224,995 |
Change in Unrealized Appreciation (Depreciation) of Investment Securities | 690,223 |
Net Increase (Decrease) in Net Assets Resulting from Operations | 1,013,524 |
153
Institutional Developed Markets Index Fund
Statement of Changes in Net Assets
| Year Ended October 31, |
| 2007 | 2006 |
| ($000) | ($000) |
Increase (Decrease) in Net Assets | | |
Operations | | |
Net Investment Income | 98,306 | 42,789 |
Realized Net Gain (Loss) | 224,995 | 736 |
Change in Unrealized Appreciation (Depreciation) | 690,223 | 523,353 |
Net Increase (Decrease) in Net Assets Resulting from Operations | 1,013,524 | 566,878 |
Distributions | | |
Net Investment Income | (97,353) | (41,783) |
Realized Capital Gain | — | — |
Total Distributions | (97,353) | (41,783) |
Capital Share Transactions—Note E | | |
Issued | 1,605,380 | 1,734,502 |
Issued in Lieu of Cash Distributions | 79,390 | 29,979 |
Redeemed1 | (1,096,395) | (430,784) |
Net Increase (Decrease) from Capital Share Transactions | 588,375 | 1,333,697 |
Total Increase (Decrease) | 1,504,546 | 1,858,792 |
Net Assets | | |
Beginning of Period | 3,606,886 | 1,748,094 |
End of Period2 | 5,111,432 | 3,606,886 |
1 The fund collected redemption fees of $14,000 and $119,000, which were reallocated proportionately to the funds in which it invests.
2 Net Assets—End of Period includes undistributed net investment income of $1,959,000 and $1,006,000.
154
Institutional Developed Markets Index Fund
Financial Highlights
| Year Ended October 31, |
For a Share Outstanding Throughout Each Period | 2007 | 2006 | 2005 | 2004 | 2003 |
Net Asset Value, Beginning of Period | $12.05 | $9.67 | $8.35 | $7.16 | $5.76 |
Investment Operations | | | | | |
Net Investment Income | .323 | .229 | .20 | .158 | .126 |
Capital Gain Distributions Received | — | — | — | — | — |
Net Realized and Unrealized Gain (Loss) | | | | | |
on Investments | 2.733 | 2.380 | 1.32 | 1.190 | 1.400 |
Total from Investment Operations | 3.056 | 2.609 | 1.52 | 1.348 | 1.526 |
Distributions | | | | | |
Dividends from Net Investment Income | (.316) | (.229) | (.20) | (.158) | (.126) |
Distributions from Realized Capital Gains | — | — | — | — | — |
Total Distributions | (.316) | (.229) | (.20) | (.158) | (.126) |
Net Asset Value, End of Period | $14.79 | $12.05 | $9.67 | $8.35 | $7.16 |
| | | | | |
| | | | | |
Total Return1 | 25.84% | 27.41% | 18.37% | 19.05% | 27.13% |
| | | | | |
| | | | | |
Ratios/Supplemental Data | | | | | |
Net Assets, End of Period (Millions) | $5,111 | $3,607 | $1,748 | $911 | $567 |
Ratio of Expenses to | | | | | |
Average Net Assets—Note B | 0%2 | 0% | 0% | 0% | 0% |
Ratio of Net Investment Income to | | | | | |
Average Net Assets | 2.25% | 1.72% | 1.86% | 1.81% | 1.80% |
Portfolio Turnover Rate | 11%3 | 14% | 6% | 19% | 11% |
1 Total returns do not reflect the 2% fee assessed on redemptions of shares purchased on or after June 27, 2003, and held for less than two months.
2 The acquired fund fees and expenses were 0.09%.
3 Excludes the value of portfolio securities received or delivered as a result of in-kind purchases or redemptions of the fund’s capital shares.
See accompanying Notes, which are an integral part of the Financial Statements.
155
Institutional Developed Markets Index Fund
Notes to Financial Statements
Vanguard Institutional Developed Markets Index Fund is registered under the Investment Company Act of 1940 as an open-end investment company, or mutual fund. The fund files reports with the SEC under the company name Vanguard STAR Funds. The fund seeks to match the performance of its target index by investing in the European and Pacific Stock Index Funds. The fund’s indirect investments in foreign securities involve investment risks not normally associated with investing in securities of U.S. corporations.
A. The following significant accounting policies conform to generally accepted accounting principles for U.S. mutual funds. The fund consistently follows such policies in preparing its financial statements.
1. Valuation: Investments are valued at the net asset value of each underlying Vanguard fund determined as of the close of the New York Stock Exchange (generally 4 p.m., Eastern time) on the valuation date.
2. Federal Income Taxes: The fund intends to continue to qualify as a regulated investment company and distribute all of its taxable income. Accordingly, no provision for federal income taxes is required in the financial statements.
3. Distributions: Distributions to shareholders are recorded on the ex-dividend date.
4. Other: Income and capital gain distributions received are recorded on the ex-dividend date. Security transactions are accounted for on the date securities are bought or sold. Costs used to determine realized gains (losses) on the sale of investment securities are those of the specific securities sold.
B. Under a service agreement, The Vanguard Group furnishes corporate management, administrative, marketing, and distribution services to the fund. The service agreement provides that Vanguard will reimburse the fund’s expenses to the extent of savings in administrative and marketing costs realized by Vanguard in the operation of the fund. Accordingly, all expenses incurred by the fund during the year ended October 31, 2007, were reimbursed by Vanguard. The fund’s trustees and officers are also directors and officers of Vanguard, and the funds in which the fund invests.
C. Distributions are determined on a tax basis and may differ from net investment income and realized capital gains for financial reporting purposes. Differences may be permanent or temporary. Permanent differences are reclassified among capital accounts in the financial statements to reflect their tax character. Temporary differences arise when certain items of income, expense, gain, or loss are recognized in different periods for financial statement and tax purposes; these differences will reverse at some time in the future. Differences in classification may also result from the treatment of short-term gains as ordinary income for tax purposes.
During the year ended October 31, 2007, the fund realized $225,992,000 of net capital gains resulting from in-kind redemptions—in which shareholders exchanged fund shares for securities held by the fund rather than for cash. Because such gains are not taxable to the fund, and are not distributed to shareholders, they have been reclassified from accumulated net realized gains to paid-in capital.
For tax purposes, at October 31, 2007, the fund had $1,959,000 of ordinary income available for distribution. The fund had available realized losses of $8,167,000 to offset future net capital gains through October 31, 2011.
At October 31, 2007, the cost of investment securities for tax purposes was $3,593,588,000. Net unrealized appreciation of investment securities for tax purposes was $1,517,433,000, consisting entirely of unrealized gains on securities that had risen in value since their purchase.
156
Institutional Developed Markets Index Fund
D. During the year ended October 31, 2007, the fund purchased $1,442,776,000 of investment securities and sold $852,649,000 of investment securities, other than temporary cash investments.
E. Capital shares issued and redeemed were:
| Year Ended October 31, |
| 2007 | 2006 |
| Shares | Shares |
| (000) | (000) |
Issued | 121,169 | 155,289 |
Issued in Lieu of Cash Distributions | 6,351 | 2,939 |
Redeemed | (81,220) | (39,690) |
Net Increase (Decrease) in Shares Outstanding | 46,300 | 118,538 |
F. In June 2006, the Financial Accounting Standards Board issued Interpretation No. 48 (“FIN 48”), “Accounting for Uncertainty in Income Taxes.” FIN 48 establishes the minimum threshold for recognizing, and a system for measuring, the benefits of tax-return positions in financial statements, and is effective for the fund’s fiscal year beginning November 1, 2007. Management has analyzed the fund’s tax positions taken on federal income tax returns for all open tax years (tax years ended October 31, 2004–2007) for purposes of implementing FIN 48, and has concluded that as of October 31, 2007, no provision for income tax would be required in the fund’s financial statements.
157
Report of Independent Registered
Public Accounting Firm
To the Trustees of Vanguard International Equity Index Funds and the Shareholders of Vanguard European Stock Index Fund, Vanguard Pacific Stock Index Fund, Vanguard Emerging Markets Stock Index Fund, Vanguard Total International Stock Index Fund, Vanguard Developed Markets Index Fund and Vanguard Institutional Developed Markets Index Fund:
In our opinion, the accompanying statements of net assets and the related statements of operations and of changes in net assets and the financial highlights present fairly, in all material respects, the financial position of Vanguard European Stock Index Fund, Vanguard Pacific Stock Index Fund, Vanguard Emerging Markets Stock Index Fund, Vanguard Total International Stock Index Fund, Vanguard Developed Markets Index Fund and Vanguard Institutional Developed Markets Index Fund (separate portfolios of Vanguard International Equity Index Funds, hereafter referred to as the “Funds”) at October 31, 2007, the results of each of their operations for the year then ended, the changes in each of their net assets for each of the two years in the period then ended and the financial highlights for each of the periods indicated, in conformity with accounting principles generally accepted in the United States of America. These financial statements and financial highlights (hereafter referred to as “financial statements”) are the responsibility of the Funds’ management; our responsibility is to express an opinion on these financial statements based on our audits. We conducted our audits of these financial statements in accordance with the standards of the Public Company Accounting Oversight Board (United States). Those standards require that we plan and perform the audit to obtain reasonable assurance about whether the financial statements are free of material misstatement. An audit includes examining, on a test basis, evidence supporting the amounts and disclosures in the financial statements, assessing the accounting principles used and significant estimates made by management, and evaluating the overall financial statement presentation. We believe that our audits, which included confirmation of securities at October 31, 2007 by correspondence with the custodians and brokers, and by agreement to the underlying ownership records for the Vanguard Funds, provide a reasonable basis for our opinion.
PricewaterhouseCoopers LLP
Philadelphia, Pennsylvania
December 7, 2007
Special 2007 tax information (unaudited) for Vanguard European Stock Index Fund
This information for the fiscal year ended October 31, 2007, is included pursuant to provisions of the Internal Revenue Code.
The fund distributed $501,137,000 of qualified dividend income to shareholders during the fiscal year.
The fund will pass through to shareholders foreign source income of $1,112,014,000 and foreign taxes paid of $58,203,000. The pass-through of foreign taxes paid will affect only shareholders on the dividend record date in December 2007. Shareholders will receive more detailed information along with their Form 1099-DIV in January 2008.
158
Special 2007 tax information (unaudited) for Vanguard Pacific Stock Index Fund
This information for the fiscal year ended October 31, 2007, is included pursuant to provisions of the Internal Revenue Code.
The fund distributed $149,129,000 of qualified dividend income to shareholders during the fiscal year.
The fund will pass through to shareholders foreign source income of $289,019,000 and foreign taxes paid of $10,223,000. The pass-through of foreign taxes paid will affect only shareholders on the dividend record date in December 2007. Shareholders will receive more detailed information along with their Form 1099-DIV in January 2008.
Special 2007 tax information (unaudited) for Vanguard Emerging Markets Stock Index Fund
This information for the fiscal year ended October 31, 2007, is included pursuant to provisions of the Internal Revenue Code.
The fund distributed $121,916,000 of qualified dividend income to shareholders during the fiscal year.
The fund will pass through to shareholders foreign source income of $459,007,000 and foreign taxes paid of $41,436,000. The pass-through of foreign taxes paid will affect only shareholders on the dividend record date in December 2007. Shareholders will receive more detailed information along with their Form 1099-DIV in January 2008.
Special 2007 tax information (unaudited) for Vanguard Total International Stock Index Fund
This information for the fiscal year ended October 31, 2007, is included pursuant to provisions of the Internal Revenue Code.
The fund distributed $310,478,000 of qualified dividend income to shareholders during the fiscal year.
Special 2007 tax information (unaudited) for Vanguard Developed Markets Index Fund
This information for the fiscal year ended October 31, 2007, is included pursuant to provisions of the Internal Revenue Code.
The fund distributed $18,000 as capital gain dividends (from net long-term capital gains) to shareholders during the fiscal year.
The fund distributed $47,156,000 of qualified dividend income to shareholders during the fiscal year.
Special 2007 tax information (unaudited) for Vanguard Institutional Developed Markets Index Fund
This information for the fiscal year ended October 31, 2007, is included pursuant to provisions of the Internal Revenue Code.
The fund distributed $68,166,000 of qualified dividend income to shareholders during the fiscal year.
159
Your Fund’s After-Tax Returns
This table presents returns for your fund both before and after taxes. The after-tax returns are shown in two ways: (1) assuming that an investor owned the fund during the entire period and paid taxes on the fund’s distributions, and (2) assuming that an investor paid taxes on the fund’s distributions and sold all shares at the end of each period.
Calculations are based on the highest individual federal income tax and capital gains tax rates in effect at the times of the distributions and the hypothetical sales. State and local taxes were not considered. After-tax returns reflect any qualified dividend income, using actual prior-year figures and estimates for 2007. (In the example, returns after the sale of fund shares may be higher than those assuming no sale. This occurs when the sale would have produced a capital loss. The calculation assumes that the investor received a tax deduction for the loss.)
The table shows returns for Investor Shares only; returns for other share classes will differ. Please note that your actual after-tax returns will depend on your tax situation and may differ from those shown. Also note that if you own the fund in a tax-deferred account, such as an individual retirement account or a 401(k) plan, this information does not apply to you. Such accounts are not subject to current taxes.
Finally, keep in mind that a fund’s performance—whether before or after taxes—does not guarantee future results.
Average Annual Total Returns: International Stock Index Funds |
Periods Ended October 31, 2007 | | | |
| One | Five | Ten |
| Year | Years | Years |
European Stock Index Fund Investor Shares1 | | | |
Returns Before Taxes | 28.49% | 24.38% | 10.81% |
Returns After Taxes on Distributions | 27.95 | 23.79 | 10.16 |
Returns After Taxes on Distributions and Sale of Fund Shares | 18.94 | 21.45 | 9.25 |
| | | |
| | | |
Pacific Stock Index Fund Investor Shares1 | | | |
Returns Before Taxes | 19.52% | 21.05% | 6.39% |
Returns After Taxes on Distributions | 18.97 | 20.63 | 6.05 |
Returns After Taxes on Distributions and Sale of Fund Shares | 12.93 | 18.49 | 5.41 |
| | | |
| | | |
Emerging Markets Stock Index Fund Investor Shares2 | | | |
Returns Before Taxes | 67.91% | 39.49% | 15.95% |
Returns After Taxes on Distributions | 67.50 | 39.12 | 15.28 |
Returns After Taxes on Distributions and Sale of Fund Shares | 44.41 | 35.67 | 13.98 |
1 Total returns do not reflect the 0.5% transaction fee on purchases through March 31, 2000; the 2% fee assessed on redemptions of shares purchased on or after June 27, 2003, and held for less than two months; or the account service fee that may be applicable to certain accounts with balances below $10,000.
2 Performance figures are adjusted for the 0.5% transaction fee on purchases and redemptions. Returns do not reflect the 2% fee assessed until March 23, 2005, on redemptions of shares purchased on or after June 27, 2003, and held for less than two months, or the account service fee that may be applicable to certain accounts with balances below $10,000.
160
Average Annual Total Returns: International Stock Index Funds |
Periods Ended October 31, 2007 | | | |
| One | Five | Ten |
| Year | Years | Years |
Total International Stock Index Fund1 | | | |
Returns Before Taxes | 32.47% | 25.48% | 10.17% |
Returns After Taxes on Distributions | 31.85 | 24.86 | 9.51 |
Returns After Taxes on Distributions and Sale of Fund Shares | 21.36 | 22.40 | 8.60 |
| | | |
| | | |
Developed Markets Index Fund2 | | | |
Returns Before Taxes | 25.67% | 23.33% | 7.45%3 |
Returns After Taxes on Distributions | 25.05 | 22.71 | 6.903 |
Returns After Taxes on Distributions and Sale of Fund Shares | 16.98 | 20.44 | 6.163 |
| | | |
| | | |
Institutional Developed Markets Index Fund2 | | | |
Returns Before Taxes | 25.84% | 23.49% | 7.54%3 |
Returns After Taxes on Distributions | 25.19 | 22.82 | 6.953 |
Returns After Taxes on Distributions and Sale of Fund Shares | 17.10 | 20.55 | 6.213 |
1 Total returns do not reflect the 0.5% transaction fee on purchases through March 31, 2000; the 2% fee assessed on redemptions of shares purchased on or after June 27, 2003, and held for less than two months; or the account service fee that may be applicable to certain accounts with balances below $10,000.
2 Total returns do not reflect the 2% fee assessed on redemptions of shares purchased on or after June 27, 2003, and held for less than two months, or for the Developed Markets Index Fund, the account service fee that may be applicable to certain accounts with balances below $10,000.
3 Returns since inception. Inception dates are May 8, 2000, for the Developed Markets Index Fund and June 1, 2000, for the Institutional Developed Markets Index Fund.
161
About Your Fund’s Expenses
As a shareholder of the fund, you incur ongoing costs, which include costs for portfolio management, administrative services, and shareholder reports (like this one), among others. Operating expenses, which are deducted from a fund’s gross income, directly reduce the investment return of the fund.
A typical fund’s expenses are expressed as a percentage of its average net assets. This figure is known as the expense ratio. “Funds of funds,” such as the Developed Markets Index Fund, Institutional Developed Markets Index Fund, and Total International Stock Index Fund, have no direct expenses, but each fund bears its proportionate share of the expenses of the underlying funds in which it invests. These indirect expenses make up the fund’s acquired fund fees and expenses, also expressed as a percentage of average net assets.
The following examples are intended to help you understand the ongoing costs (in dollars) of investing in your fund and to compare these costs with those of other mutual funds. The examples are based on an investment of $1,000 made at the beginning of the period shown and held for the entire period. The costs are calculated using each fund’s acquired fund fees and expenses.
The table on pages 123 and 124 illustrates your fund’s costs in two ways:
• Based on actual fund return. This section helps you to estimate the actual expenses that you paid over the period. The “Ending Account Value” shown is derived from the fund’s actual return, and the third column shows the dollar amount that would have been paid by an investor who started with $1,000 in the fund. You may use the information here, together with the amount you invested, to estimate the expenses that you paid over the period.
To do so, simply divide your account value by $1,000 (for example, an $8,600 account value divided by $1,000 = 8.6), then multiply the result by the number given for your fund under the heading “Expenses Paid During Period.”
• Based on hypothetical 5% yearly return. This section is intended to help you compare your fund’s costs with those of other mutual funds. It assumes that the fund had a yearly return of 5% before expenses, but that the expense ratio is unchanged. In this case—because the return used is not the fund’s actual return—the results do not apply to your investment. The example is useful in making comparisons because the Securities and Exchange Commission requires all mutual funds to calculate expenses based on a 5% return. You can assess your fund’s costs by comparing this hypothetical example with the hypothetical examples that appear in shareholder reports of other funds.
Note that the expenses shown in the table are meant to highlight and help you compare ongoing costs only and do not reflect transaction costs incurred by the fund for buying and selling securities. Further, the expenses do not include the transaction fees or the account service fee described in the prospectus. If such fees were applied to your account, your costs would be higher. Your fund does not carry a “sales load.”
The calculations assume no shares were bought or sold during the period. Your actual costs may have been higher or lower, depending on the amount of your investment and the timing of any purchases or redemptions.
You can find more information about the fund’s expenses, including annual expense ratios, in the Financial Statements section of this report. For additional information on operating expenses and other shareholder costs, please refer to your fund’s current prospectus.
162
Six Months Ended October 31, 20071 | | | |
| Beginning | Ending | Expenses |
| Account Value | Account Value | Paid During |
International Stock Index Fund | 4/30/2007 | 10/31/2007 | Period2 |
Based on Actual Fund Return | | | |
European | | | |
Investor Shares | $1,000.00 | $1,095.06 | $1.06 |
Admiral Shares | 1,000.00 | 1,095.39 | 0.53 |
Signal Shares | 1,000.00 | 1,095.40 | 0.53 |
Institutional Shares | 1,000.00 | 1,095.42 | 0.37 |
ETF Shares | 1,000.00 | 1,095.52 | 0.53 |
Pacific | | | |
Investor Shares | $1,000.00 | $1,097.45 | $1.22 |
Admiral Shares | 1,000.00 | 1,097.93 | 0.53 |
Institutional Shares | 1,000.00 | 1,098.07 | 0.42 |
ETF Shares | 1,000.00 | 1,098.01 | 0.69 |
Emerging Markets | | | |
Investor Shares3 | $1,000.00 | $1,422.82 | $2.14 |
Admiral Shares3 | 1,000.00 | 1,424.33 | 1.28 |
Signal Shares3 | 1,000.00 | 1,423.64 | 1.53 |
Institutional Shares3 | 1,000.00 | 1,424.16 | 1.04 |
ETF Shares | 1,000.00 | 1,423.93 | 1.34 |
Total International | $1,000.00 | $1,147.88 | $1.41 |
Developed Markets | $1,000.00 | $1,095.52 | $1.16 |
Institutional Developed Markets | $1,000.00 | $1,096.37 | $0.48 |
1 This table does not include data for funds or share classes of funds with fewer than six months of history.
2 The calculations are based on expenses incurred in the most recent six-month period. Annualized six-month expense ratios for the European, Pacific, and Emerging Markets funds are as follows: European Stock Index Fund—0.20% for Investor Shares, 0.10% for Admiral Shares, 0.10% for Signal Shares, 0.07% for Institutional Shares, and 0.10% for ETF Shares; Pacific Stock Index Fund—0.23% for Investor Shares, 0.10% for Admiral Shares, 0.08% for Institutional Shares, and 0.13% for ETF Shares; Emerging Markets Stock Index Fund—0.35% for Investor Shares, 0.21% for Admiral Shares, 0.25% for Signal Shares, 0.17% for Institutional Shares, and 0.22% for ETF Shares. The other funds’ annualized acquired fund fees and expenses as of October 31, 2007, were (in top-to-bottom order as listed above) 0.26%, 0.22%, and 0.09%. The dollar amounts shown as “Expenses Paid” are equal to the annualized expense ratio multiplied by the average account value over the period, multiplied by the number of days in the most recent six-month period, then divided by the number of days in the most recent 12-month period.
3 Calculations do not reflect the fund’s 0.5% purchase fee, which is deducted from all purchases (including exchanges from other Vanguard funds) but not from reinvested dividends and capital gains.
163
Six Months Ended October 31, 20071 | | | |
| Beginning | Ending | Expenses |
| Account Value | Account Value | Paid During |
International Stock Index Fund | 4/30/2007 | 10/31/2007 | Period2 |
Based on Hypothetical 5% Yearly Return | | | |
European | | | |
Investor Shares | $1,000.00 | $1,024.20 | $1.02 |
Admiral Shares | 1,000.00 | 1,024.70 | 0.51 |
Signal Shares | 1,000.00 | 1,024.70 | 0.51 |
Institutional Shares | 1,000.00 | 1,024.85 | 0.36 |
ETF Shares | 1,000.00 | 1,024.70 | 0.51 |
Pacific | | | |
Investor Shares | $1,000.00 | $1,024.05 | $1.17 |
Admiral Shares | 1,000.00 | 1,024.70 | 0.51 |
Institutional Shares | 1,000.00 | 1,024.80 | 0.41 |
ETF Shares | 1,000.00 | 1,024.55 | 0.66 |
Emerging Markets | | | |
Investor Shares3 | $1,000.00 | $1,023.44 | $1.79 |
Admiral Shares3 | 1,000.00 | 1,024.15 | 1.07 |
Signal Shares3 | 1,000.00 | 1,023.95 | 1.28 |
Institutional Shares3 | 1,000.00 | 1,024.35 | 0.87 |
ETF Shares | 1,000.00 | 1,024.10 | 1.12 |
Total International | $1,000.00 | $1,023.89 | $1.33 |
Developed Markets | $1,000.00 | $1,024.10 | $1.12 |
Institutional Developed Markets | $1,000.00 | $1,024.75 | $0.46 |
1 This table does not include data for funds or share classes of funds with fewer than six months of history.
2 The calculations are based on expenses incurred in the most recent six-month period. Annualized six-month expense ratios for the European, Pacific, and Emerging Markets funds are as follows: European Stock Index Fund—0.20% for Investor Shares, 0.10% for Admiral Shares, 0.10% for Signal Shares, 0.07% for Institutional Shares, and 0.10% for ETF Shares; Pacific Stock Index Fund—0.23% for Investor Shares, 0.10% for Admiral Shares, 0.08% for Institutional Shares, and 0.13% for ETF Shares; Emerging Markets Stock Index Fund—0.35% for Investor Shares, 0.21% for Admiral Shares, 0.25% for Signal Shares, 0.17% for Institutional Shares, and 0.22% for ETF Shares. The other funds’ annualized acquired fund fees and expenses as of October 31, 2007, were (in top-to-bottom order as listed above) 0.26%, 0.22%, and 0.09%. The dollar amounts shown as “Expenses Paid” are equal to the annualized expense ratio multiplied by the average account value over the period, multiplied by the number of days in the most recent six-month period, then divided by the number of days in the most recent 12-month period.
3 Calculations do not reflect the fund’s 0.5% purchase fee, which is deducted from all purchases (including exchanges from other Vanguard funds) but not from reinvested dividends and capital gains.
164
Glossary
Acquired Fund Fees and Expenses. Funds that invest in other Vanguard funds incur no direct expenses, but they do bear proportionate shares of the operating, administrative, and advisory expenses of the underlying funds, and they must pay any fees charged by those funds. The figure for acquired fund fees and expenses represents a weighted average of these underlying costs. Acquired is a term that the Securities and Exchange Commission applies to any mutual fund whose shares are owned by another fund.
Beta. A measure of the magnitude of a fund’s past share-price fluctuations in relation to the ups and downs of a given market index. The index is assigned a beta of 1.00. Compared with a given index, a fund with a beta of 1.20 typically would have seen its share price rise or fall by 12% when the index rose or fell by 10%. A fund’s beta should be reviewed in conjunction with its R-squared (see definition below). The lower the R-squared, the less correlation there is between the fund and the index, and the less reliable beta is as an indicator of volatility.
Equity Exposure. A measure that reflects a fund’s investments in stocks and stock futures. Any holdings in short-term reserves are excluded.
Expense Ratio. The percentage of a fund’s average net assets used to pay its annual administrative and advisory expenses. These expenses directly reduce returns to investors.
Inception Date. The date on which the assets of a fund (or one of its share classes) are first invested in accordance with the fund’s investment objective. For funds with a subscription period, the inception date is the day after that period ends. Investment performance is measured from the inception date.
R-Squared. A measure of how much of a fund’s past returns can be explained by the returns from the market in general, as measured by a given index. If a fund’s total returns were precisely synchronized with an index’s returns, its R-squared would be 1.00. If the fund’s returns bore no relationship to the index’s returns, its R-squared would be 0.
Short-Term Reserves. The percentage of a fund invested in highly liquid, short-term securities that can be readily converted to cash.
Turnover Rate. An indication of the fund’s trading activity. Funds with high turnover rates incur higher transaction costs and may be more likely to distribute capital gains (which may be taxable to investors). The turnover rate excludes in-kind transactions, which have minimal impact on costs.
165
This page intentionally left blank.
This page intentionally left blank.
The People Who Govern Your Fund
The trustees of your mutual fund are there to see that the fund is operated and managed in your best interests since, as a shareholder, you are a part owner of the fund. Your fund’s trustees also serve on the board of directors of The Vanguard Group, Inc., which is owned by the Vanguard funds and provides services to them on an at-cost basis.
A majority of Vanguard’s board members are independent, meaning that they have no affiliation with Vanguard or the funds they oversee, apart from the sizable personal investments they have made as private individuals.
Our independent board members bring distinguished backgrounds in business, academia, and public service to their task of working with Vanguard officers to establish the policies and oversee the activities of the funds. Among board members’ responsibilities are selecting investment advisors for the funds; monitoring fund operations, performance, and costs; reviewing contracts; nominating and selecting new trustees/directors; and electing Vanguard officers.
Each trustee serves a fund until its termination; or until the trustee’s retirement, resignation, or death; or otherwise as specified in the fund’s organizational documents. Any trustee may be removed at a shareholders’ meeting by a vote representing two-thirds of the net asset value of all shares of the fund together with shares of other Vanguard funds organized within the same trust. The table on these two pages shows information for each trustee and executive officer of the fund. The mailing address of the trustees and officers is P.O. Box 876, Valley Forge, PA 19482.
Chairman of the Board, Chief Executive Officer, and Trustee |
| |
John J. Brennan1 | |
Born 1954 | Principal Occupation(s) During the Past Five Years: Chairman of the Board, Chief Executive |
Trustee since May 1987; | Officer, and Director/Trustee of The Vanguard Group, Inc., and of each of the investment |
Chairman of the Board and | companies served by The Vanguard Group. |
Chief Executive Officer | |
148 Vanguard Funds Overseen | |
| |
Independent Trustees | |
| |
Charles D. Ellis | |
Born 1937 | Principal Occupation(s) During the Past Five Years: Applecore Partners (pro bono ventures |
Trustee since January 2001 | in education); Senior Advisor to Greenwich Associates (international business strategy |
148 Vanguard Funds Overseen | consulting); Successor Trustee of Yale University; Overseer of the Stern School of Business |
| at New York University; Trustee of the Whitehead Institute for Biomedical Research. |
| |
Rajiv L. Gupta | |
Born 1945 | Principal Occupation(s) During the Past Five Years: Chairman, President, and |
Trustee since December 20012 | Chief Executive Officer of Rohm and Haas Co. (chemicals); Board Member of |
148 Vanguard Funds Overseen | the American Chemistry Council; Director of Tyco International, Ltd. (diversified |
| manufacturing and services) since 2005; Trustee of Drexel University and of the |
| Chemical Heritage Foundation. |
| |
Amy Gutmann | |
Born 1949 | Principal Occupation(s) During the Past Five Years: President of the University of |
Trustee since June 2006 | Pennsylvania since 2004; Professor in the School of Arts and Sciences, Annenberg School |
148 Vanguard Funds Overseen | for Communication, and Graduate School of Education of the University of Pennsylvania |
| since 2004; Provost (2001–2004) and Laurance S. Rockefeller Professor of Politics and |
| the University Center for Human Values (1990–2004), Princeton University; Director of |
| Carnegie Corporation of New York since 2005 and of Schuylkill River Development |
| Corporation and Greater Philadelphia Chamber of Commerce since 2004. |
JoAnn Heffernan Heisen | |
Born 1950 | Principal Occupation(s) During the Past Five Years: Corporate Vice President and |
Trustee since July 1998 | Chief Global Diversity Officer since 2006, Vice President and Chief Information |
148 Vanguard Funds Overseen | Officer (1997–2005), and Member of the Executive Committee of Johnson & |
| Johnson (pharmaceuticals/consumer products); Director of the University Medical |
| Center at Princeton and Women’s Research and Education Institute. |
| |
André F. Perold | |
Born 1952 | Principal Occupation(s) During the Past Five Years: George Gund Professor of Finance |
Trustee since December 2004 | and Banking, Harvard Business School; Senior Associate Dean, Director of Faculty |
148 Vanguard Funds Overseen | Recruiting, and Chair of Finance Faculty, Harvard Business School; Director and Chairman |
| of UNX, Inc. (equities trading firm) since 2003; Chair of the Investment Committee of |
| HighVista Strategies LLC (private investment firm) since 2005. |
| |
Alfred M. Rankin, Jr. | |
Born 1941 | Principal Occupation(s) During the Past Five Years: Chairman, President, Chief Executive |
Trustee since January 1993 | Officer, and Director of NACCO Industries, Inc. (forklift trucks/housewares/lignite); Director |
148 Vanguard Funds Overseen | of Goodrich Corporation (industrial products/aircraft systems and services). |
| |
| |
J. Lawrence Wilson | |
Born 1936 | Principal Occupation(s) During the Past Five Years: Retired Chairman and Chief Executive |
Trustee since April 1985 | Officer of Rohm and Haas Co. (chemicals); Director of Cummins Inc. (diesel engines) and |
148 Vanguard Funds Overseen | AmerisourceBergen Corp. (pharmaceutical distribution); Trustee of Vanderbilt University |
| and of Culver Educational Foundation. |
| |
Executive Officers1 | |
| |
Thomas J. Higgins | |
Born 1957 | Principal Occupation(s) During the Past Five Years: Principal of The Vanguard Group, Inc.; |
Treasurer since July 1998 | Treasurer of each of the investment companies served by The Vanguard Group. |
148 Vanguard Funds Overseen | |
| |
| |
Heidi Stam | |
Born 1956 | Principal Occupation(s) During the Past Five Years: Managing Director of The Vanguard |
Secretary since July 2005 | Group, Inc., since 2006; General Counsel of The Vanguard Group since 2005; Secretary of |
148 Vanguard Funds Overseen | The Vanguard Group, and of each of the investment companies served by The Vanguard |
| Group, since 2005; Principal of The Vanguard Group (1997–2006). |
Vanguard Senior Management Team | | |
| | | |
R. Gregory Barton | Kathleen C. Gubanich | F. William McNabb, III | Ralph K. Packard |
Mortimer J. Buckley | Paul A. Heller | Michael S. Miller | George U. Sauter |
Founder |
|
John C. Bogle |
Chairman and Chief Executive Officer, 1974–1996 |
1 Officers of the funds are “interested persons” as defined in the Investment Company Act of 1940.
2 December 2002 for Vanguard Equity Income Fund, Vanguard Growth Equity Fund, the Vanguard Municipal Bond Funds, and the Vanguard State Tax-Exempt Funds.
More information about the trustees is in the Statement of Additional Information, available from The Vanguard Group.

P.O. Box 2600
Valley Forge, PA 19482-2600
Connect with Vanguard® > www.vanguard.com
Fund Information > 800-662-7447 | Vanguard, Admiral, Vanguard ETF, Signal, STAR, |
| Connect with Vanguard, and the ship logo are |
Direct Investor Account Services > 800-662-2739 | trademarks of The Vanguard Group, Inc. |
| |
Institutional Investor Services > 800-523-1036 | |
| All other marks are the exclusive property of their |
Text Telephone for People | respective owners. |
With Hearing Impairment > 800-952-3335 | |
| All comparative mutual fund data are from Lipper Inc. |
| or Morningstar, Inc., unless otherwise noted. |
| |
| You can obtain a free copy of Vanguard’s proxy voting |
This material may be used in conjunction | guidelines by visiting our website, www.vanguard.com, |
with the offering of shares of any Vanguard | and searching for “proxy voting guidelines,” or by calling |
fund only if preceded or accompanied by | Vanguard at 800-662-2739. The guidelines are also |
the fund’s current prospectus. | available from the SEC’s website, www.sec.gov. In |
| addition, you may obtain a free report on how your fund |
| voted the proxies for securities it owned during the 12 |
| months ended June 30. To get the report, visit either |
| www.vanguard.com or www.sec.gov. |
| |
The funds or securities referred to herein are not | |
sponsored, endorsed, or promoted by MSCI, and | |
MSCI bears no liability with respect to any such funds | |
or securities. For any such funds or securities, the | |
prospectus or the Statement of Additional Information | |
contains a more detailed description of the limited | You can review and copy information about your fund |
relationship MSCI has with The Vanguard Group and | at the SEC’s Public Reference Room in Washington, D.C. |
any related funds. | To find out more about this public service, call the SEC |
| at 202-551-8090. Information about your fund is also |
| available on the SEC’s website, and you can receive |
| copies of this information, for a fee, by sending a |
| request in either of two ways: via e-mail addressed to |
| publicinfo@sec.gov or via regular mail addressed to the |
| Public Reference Section, Securities and Exchange |
| Commission, Washington, DC 20549-0102. |
| |
| |
| |
| |
| © 2007 The Vanguard Group, Inc. |
| All rights reserved. |
| Vanguard Marketing Corporation, Distributor. |
| |
| Q720 122007 |
Item 2: Code of Ethics. The Registrant has adopted a code of ethics that applies to the Registrant’s principal executive officer, principal financial officer, principal accounting officer or controller or persons performing similar functions. The Code of Ethics was amended during the reporting period covered by this report to make certain technical, non-material changes.
Item 3: Audit Committee Financial Expert. The following members of the Audit Committee have been determined by the Registrant’s Board of Trustees to be Audit Committee Financial Experts serving on its Audit Committee, and to be independent: Charles D. Ellis, Rajiv L. Gupta, JoAnn Heffernan Heisen, André F. Perold, Alfred M. Rankin, Jr., and J. Lawrence Wilson.
Item 4: Principal Accountant Fees and Services.
(a) Audit Fees.
Audit Fees of the Registrant
Fiscal Year Ended October 31, 2007: $108,100
Fiscal Year Ended October 31, 2006: $110,700
Aggregate Audit Fees of Registered Investment Companies in the Vanguard Group.
Fiscal Year Ended October 31, 2007: $2,835,320
Fiscal Year Ended October 31, 2006: $2,347,620
(b) Audit-Related Fees.
Fiscal Year Ended October 31, 2007: $630,400
Fiscal Year Ended October 31, 2006: $530,000
Includes fees billed in connection with assurance and related services provided to the Registrant, The Vanguard Group, Inc., Vanguard Marketing Corporation, and other registered investment companies in the Vanguard Group.
(c) Tax Fees.
Fiscal Year Ended October 31, 2007: $215,900
Fiscal Year Ended October 31, 2006: $101,300
Includes fees billed in connection with tax compliance, planning and advice services provided to the Registrant, The Vanguard Group, Inc., Vanguard Marketing Corporation, and other registered investment companies in the Vanguard Group and related to income and excise taxes.
(d) All Other Fees.
Fiscal Year Ended October 31, 2007: $0
Fiscal Year Ended October 31, 2006: $0
Includes fees billed for services related to risk management and privacy matters. Services were provided to the Registrant, The Vanguard Group, Inc., Vanguard Marketing Corporation, and other registered investment companies in the Vanguard Group.
(e) (1) Pre-Approval Policies. The policy of the Registrant’s Audit Committee is to consider and, if appropriate, approve before the principal accountant is engaged for such services, all specific audit and non-audit services provided to: (1) the Registrant; (2) The Vanguard Group, Inc.; (3) other entities controlled by The Vanguard Group, Inc. that provide ongoing services to the Registrant; and (4) other
registered investment companies in the Vanguard Group. In making a determination, the Audit Committee considers whether the services are consistent with maintaining the principal accountant’s independence.
In the event of a contingency situation in which the principal accountant is needed to provide services in between scheduled Audit Committee meetings, the Chairman of the Audit Committee would be called on to consider and, if appropriate, pre-approve audit or permitted non-audit services in an amount sufficient to complete services through the next Audit Committee meeting, and to determine if such services would be consistent with maintaining the accountant’s independence. At the next scheduled Audit Committee meeting, services and fees would be presented to the Audit Committee for formal consideration, and, if appropriate, approval by the entire Audit Committee. The Audit Committee would again consider whether such services and fees are consistent with maintaining the principal accountant’s independence.
The Registrant’s Audit Committee is informed at least annually of all audit and non-audit services provided by the principal accountant to the Vanguard complex, whether such services are provided to: (1) the Registrant; (2) The Vanguard Group, Inc.; (3) other entities controlled by The Vanguard Group, Inc. that provide ongoing services to the Registrant; or (4) other registered investment companies in the Vanguard Group.
(2) No percentage of the principal accountant’s fees or services were approved pursuant to the waiver provision of paragraph (c)(7)(i)(C) of Rule 2-01 of Regulation S-X.
(f) For the most recent fiscal year, over 50% of the hours worked under the principal accountant’s engagement were not performed by persons other than full-time, permanent employees of the principal accountant.
(g) Aggregate Non-Audit Fees.
Fiscal Year Ended October 31, 2007: $215,900
Fiscal Year Ended October 31, 2006: $101,300
Includes fees billed for non-audit services provided to the Registrant, The Vanguard Group, Inc., Vanguard Marketing Corporation, and other registered investment companies in the Vanguard Group.
(h) For the most recent fiscal year, the Audit Committee has determined that the provision of all non-audit services was consistent with maintaining the principal accountant’s independence.
Item 5: Not Applicable.
Item 6: Not Applicable.
Item 7: Not Applicable.
Item 8: Not Applicable.
Item 9: Not Applicable.
Item 10: Not Applicable.
Item 11: Controls and Procedures.
(a) Disclosure Controls and Procedures. The Principal Executive and Financial Officers concluded that the Registrant's Disclosure Controls and Procedures are effective based on their evaluation of the Disclosure Controls and Procedures as of a date within 90 days of the filing date of this report.
(b) Internal Control Over Financial Reporting. There were no significant changes in Registrant’s Internal Control Over Financial Reporting or in other factors that could significantly affect this control subsequent to the date of the evaluation, including any corrective actions with regard to significant deficiencies and material weaknesses.
Item 12: Exhibits.
(a) Code of Ethics.
(b) Certifications.
Pursuant to the requirements of the Securities Exchange Act of 1934 and the Investment Company Act of 1940, the registrant has duly caused this report to be signed on its behalf by the undersigned, thereunto duly authorized.
VANGUARD STAR FUNDS |
BY: | (signature) |
| (HEIDI STAM) |
| JOHN J. BRENNAN* |
| CHIEF EXECUTIVE OFFICER |
Date: December 11, 2007
Pursuant to the requirements of the Securities Exchange Act of 1934 and the Investment Company Act of 1940, this report has been signed below by the following persons on behalf of the registrant and in the capacities and on the dates indicated.
VANGUARD STAR FUNDS |
BY: | (signature) |
| (HEIDI STAM) |
| JOHN J. BRENNAN* |
| CHIEF EXECUTIVE OFFICER |
Date: December 11, 2007
VANGUARD STAR FUNDS |
BY: | (signature) |
| (HEIDI STAM) |
| THOMAS J. HIGGINS* |
| TREASURER |
Date: December 11, 2007
*By Power of Attorney. See File Number 333-145624, filed on August 22, 2007. Incorporated by Reference.