UNITED STATES
SECURITIES AND EXCHANGE COMMISSION
Washington, D.C. 20549
FORM N-CSR
CERTIFIED SHAREHOLDER REPORT
OF
REGISTERED MANAGEMENT INVESTMENT COMPANIES
Investment Company Act file number: 811-3919
Name of Registrant: Vanguard STAR Funds
Address of Registrant: | P.O. Box 2600 |
| Valley Forge, PA 19482 |
| |
Name and address of agent for service: | Heidi Stam, Esquire |
| P.O. Box 876 |
| Valley Forge, PA 19482 |
| |
Registrant’s telephone number, including area code: (610) 669-1000
Date of fiscal year end: October 31
Date of reporting period: November 1, 2007–October 31, 2008
Item 1: Reports to Shareholders |
> | For the fiscal year ended October 31, 2008, Vanguard STAR Fund returned –27.94%. |
> | The fund’s return was lower than that of its benchmark, the STAR Composite Index, which returned –25.94%, but higher than the average return for its peers. |
> | The STAR Fund invests in 11 underlying funds. Vanguard GNMA Fund, a fixed income portfolio, was the only one to produce a positive result over the 12-month period. |
Contents | |
| |
Your Fund’s Total Returns | 1 |
President’s Letter | 2 |
Fund Profile | 8 |
Performance Summary | 9 |
Financial Statements | 11 |
Your Fund’s After-Tax Returns | 19 |
About Your Fund’s Expenses | 20 |
Glossary | 22 |
Please note: The opinions expressed in this report are just that—informed opinions. They should not be considered promises or advice. Also, please keep in mind that the information and opinions cover the period through the date on the front of this report. Of course, the risks of investing in your fund are spelled out in the prospectus.
Your Fund’s Total Returns
Fiscal Year Ended October 31, 2008 | | |
| Ticker | Total |
| Symbol | Returns |
Vanguard STAR Fund | VGSTX | –27.94% |
STAR Composite Index1 | | –25.94 |
STAR Composite Average2 | | –29.20 |
Your Fund’s Performance at a Glance | | |
October 31, 2007–October 31, 2008 | | |
| | | Distributions Per Share |
| Starting | Ending | Income | Capital |
| Share Price | Share Price | Dividends | Gains |
Vanguard STAR Fund | $22.80 | $15.33 | $0.634 | $0.825 |
1 The STAR Composite Index is weighted 50% Morgan Stanley Capital International (MSCI) US Broad Market Index, 25% Lehman U.S. Aggregate Bond Index, 12.5% Lehman 1–5 Year U.S. Credit Index, and 12.5% MSCI Europe, Australasia, Far East (EAFE) Index.
2 The STAR Composite Average, which is derived from data provided by Lipper Inc., is weighted 50% average general equity fund, 25% average fixed income fund, 12.5% average 1–5 year investment-grade fund, and 12.5% average international fund.
1

President’s Letter
Dear Shareholder,
For the fiscal year ended October 31, 2008, Vanguard STAR Fund returned –27.94%. The fund’s decline was a bit worse than that of its benchmark, the STAR Composite Index, which returned –25.94% for the 12-month period. The fund moderately outpaced its peer group, for which the average return was –29.20%.
As you know, the STAR Fund is a “fund of funds” that invests in 11 actively managed Vanguard mutual funds. These underlying funds provide the STAR Fund with a balanced mix of domestic and international stocks, as well as fixed income holdings. During the fund’s fiscal year, its bond holdings significantly outperformed its stock holdings.
If you own the STAR Fund in a taxable account, you may wish to review a report on the fund’s after-tax returns on page 19.
Stock prices fell sharply in global upheaval
Global stock markets started the 12-month period near all-time highs, but then declined sharply, laid low by the financial crisis that originated in the fixed income markets. The descent traced a series of jagged ups and downs. During the week ended October 10, for example, the U.S. stock market returned about –18%. When Wall Street opened the following Monday, stocks surged, returning more than 10% over the next 61/2 hours.
2
For the full 12 months, the broad U.S. stock market returned –36.43%; international stocks returned –48.27%. The pain was especially acute in emerging markets—among the strongest performers in recent years—as investors became increasingly averse to risk.
Bond market averages masked disparate returns
The broad U.S. taxable bond market registered an unremarkable return of 0.30% for the 12 months, but by its own typically sedate standards, the dislocations were extreme. The strong performance of U.S. Treasury and government securities was offset by double-digit declines in the corporate bond market. These dynamics led to unusually large differences between the yields of Treasuries and their corresponding private sector securities—both a reflection and a cause of the credit market’s distress. Despite their generally high creditworthiness, municipal bonds also fell in price, with the broad tax-exempt market registering a 12-month return of –3.30%.
The U.S. Federal Reserve Board responded to the volatile conditions with new lending programs and a dramatic easing of monetary policy. Over the full 12 months, the Fed reduced its target for the federal funds rate from 4.50% to 1.00%.
Market Barometer | |
| Average Annual Total Returns |
| Periods Ended October 31, 2008 |
| One Year | Three Years | Five Years |
Stocks | | | |
Russell 1000 Index (Large-caps) | –36.80% | –5.51% | 0.37% |
Russell 2000 Index (Small-caps) | –34.16 | –4.79 | 1.57 |
Dow Jones Wilshire 5000 Index (Entire market) | –36.43 | –5.10 | 0.81 |
MSCI All Country World Index ex USA (International) | –48.27 | –3.93 | 5.05 |
| | | |
Bonds | | | |
Lehman U.S. Aggregate Bond Index (Broad taxable market) | 0.30% | 3.60% | 3.48% |
Lehman Municipal Bond Index | –3.30 | 1.71 | 2.73 |
Citigroup 3-Month Treasury Bill Index | 2.31 | 3.93 | 3.10 |
| | | |
CPI | | | |
Consumer Price Index | 3.66% | 2.83% | 3.20% |
3
Domestic and international stocks hindered the fund’s return
The STAR Fund’s return of –27.94% for the 12 months ended October 31, 2008, resulted from negative performances by 10 of the fund’s 11 underlying mutual funds. As in the broad market, the fund’s bond holdings outperformed stocks, while domestic stocks performed better than their international counterparts.
STAR’s only holding to post a positive result for the fiscal year was Vanguard GNMA Fund, which returned 3.8%. The fund, which invests in mortgage-backed securities that are fully backed by the U.S. government, benefited from investors’ flight to safety during the period. The fund’s other bond holdings, Vanguard Short-Term Investment-Grade Fund and Vanguard Long-Term Investment-Grade Fund, returned –4.4% and –15.5%, respectively.
The fund’s domestic stock holdings produced negative returns across the board. Financial companies, in particular, weakened STAR’s underlying stock funds, especially the value funds. For example, Vanguard WindsorTM II Fund, STAR’s most heavily weighted underlying investment, had, on average, more than 20% of its assets invested in financials and returned –38.0% for the period. Vanguard Windsor Fund—also weighted heavily in financials—returned –43.9% for the 12 months.
Expense Ratios | | |
Your Fund Compared With Its Peer Group | | |
| Acquired | Composite |
| Fund Fees | Benchmark |
| and Expenses1 | Expense Ratio2 |
STAR Fund | 0.32% | 1.24% |
1 This figure—drawn from the prospectus dated February 27, 2008—represents a weighted average of the annualized expense ratios and any transaction fees charged by the underlying mutual funds (the “acquired” funds) in which the STAR Fund invests. The STAR Fund does not charge any expenses or fees of its own. For the fiscal year ended October 31, 2008, the acquired fund fees and expenses were 0.32%.
2 Based on the STAR Composite Average, which is weighted 50% average general equity fund, 25% average fixed income fund, 12.5% average 1–5 year investment-grade fund, and 12.5% average international fund. The figure is derived from data provided by Lipper Inc. and captures information through year-end 2007.
4
The underlying funds’ energy holdings hurt STAR’s performance, too, as the price of oil fell significantly during the second half of the period. Information technology stocks also weighed on performance in the underlying growth funds, including Vanguard ExplorerTM Fund (–40.2%) and Vanguard MorganTM Growth Fund (–39.6%).
The fund’s international holdings were among its worst performers, as the U.S. credit crisis reverberated globally. This was a big change from the previous fiscal year, when international stocks were the fund’s top performers. This time around, Vanguard International Value Fund returned –45.5% and Vanguard International Growth Fund returned –47.6%.
Long-term performance is key despite market conditions
Over the ten-year period ended October 31, 2008, the STAR Fund had an average annual return of 4.07%. The fund outperformed its benchmark, its peers, and the broad U.S. stock market during the same period. (See the table on page 6.)
A hypothetical investment of $10,000 made ten years ago in the balanced STAR Fund would have grown to $14,899, over $3,000 more than the same hypothetical investment would have earned in an all-stock portfolio, as measured by the Dow Jones Wilshire 5000 Index.
| | Total Returns for |
Vanguard Fund | Percentage of | 12 Months Ended |
(Investor Shares) | STAR’s Assets1 | October 31, 2008 |
Stock Funds | | |
Windsor II | 16.6% | –38.0% |
Windsor | 9.1 | –43.9 |
PRIMECAP | 7.1 | –29.9 |
Morgan Growth | 7.1 | –39.6 |
U.S. Growth | 7.1 | –35.5 |
International Growth | 6.5 | –47.6 |
International Value | 6.4 | –45.5 |
Explorer | 4.4 | –40.2 |
Bond Funds | | |
GNMA | 12.0% | 3.8% |
Long-Term Investment-Grade | 11.9 | –15.5 |
Short-Term Investments | | |
Short-Term Investment-Grade | 11.8% | –4.4% |
Combined | 100.0% | –27.9% |
1 As of October 31, 2008.
5
The fund’s long-term results are a tribute to its balanced approach. Financial theory and experience suggest that over time, stocks can be expected to produce higher returns than bonds, though not without occasional periods of severe under-performance, as we have experienced during the past 12 months. By investing 60% to 70% in stocks and 30% to 40% in bonds, the STAR Fund is positioned to benefit from stocks’ long-term potential, while securing some protection from the stock market’s occasional downturns through an allocation to bonds.
Fund’s balanced mandate helps during market uncertainty
The past 12 months have been a tumultuous time for all investors. Balanced portfolios consisting of both stocks and bonds have not avoided the turmoil. However, many of these funds have managed to outperform the broad market, as well as most all-stock portfolios. Vanguard STAR Fund is a good example of such a fund.
During difficult times in the market, a balanced fund of funds, such as the STAR Fund, can help to simplify investing. The mix of domestic stocks, international stocks, and bonds can make it easier for your portfolio to endure the ups and downs of the market. In addition to its exposure to multiple asset classes, the STAR Fund boasts an extremely low expense ratio, which enables you to keep more of the fund’s returns. Finally, the fund is periodically rebalanced to ensure that it maintains its 30% to 40% allocation in bonds and reserves and its 60% to 70%
Total Returns | |
Ten Years Ended October 31, 2008 | |
| Average |
| Annual Return |
STAR Fund | 4.07% |
STAR Composite Index1 | 2.94 |
STAR Composite Average2 | 2.55 |
The figures shown represent past performance, which is not a guarantee of future results. (Current performance may be lower or higher than the performance data cited. For performance data current to the most recent month-end, visit our website at www.vanguard.com/performance.) Note, too, that both investment returns and principal value can fluctuate widely, so an investor’s shares, when sold, could be worth more or less than their original cost.
1 The STAR Composite Index is weighted 62.5% Dow Jones Wilshire 5000 Index, 25% Lehman U.S. Aggregate Bond Index, and 12.5% Citigroup 3-month Treasury Bill Index through December 31, 2002; 50% Dow Jones Wilshire 5000 Index, 25% Lehman U.S. Aggregate Bond Index, 12.5% Lehman 1–5 Year U.S. Credit Index, and 12.5% MSCI EAFE Index through April 22, 2005; and 50% MSCI US Broad Market Index, 25% Lehman U.S. Aggregate Bond Index, 12.5% Lehman 1–5 Year U.S. Credit Index, and 12.5% MSCI EAFE Index thereafter.
2 The STAR Composite Average, which is derived from data provided by Lipper Inc., is weighted 62.5% average general equity fund, 25% average fixed income fund, and 12.5% average money market fund through December 31, 2002, and 50% average general equity fund, 25% average fixed income fund, 12.5% average 1–5 year investment-grade fund, and 12.5% average international fund thereafter.
6
allocation to stocks—a necessary risk-control discipline, but one that can be difficult to practice outside of a dedicated balanced fund.
For these reasons, we believe that Vanguard STAR Fund is an excellent choice to help balance your investment portfolio, or as a well-balanced portfolio all on its own.
Thank you for entrusting your assets to Vanguard.
Sincerely,

F. William McNabb III
President and Chief Executive Officer
November 12, 2008
7
STAR Fund
Fund Profile
As of October 31, 2008
Financial Attributes | |
| |
Yield1 | 3.3% |
Acquired Fund Fees and Expenses | |
(10/31/2007)2 | 0.32% |
Allocation to Underlying Vanguard Funds | |
| |
Stock Funds | |
Windsor II | 16.6% |
Windsor | 9.1 |
PRIMECAP | 7.1 |
Morgan Growth | 7.1 |
U.S. Growth | 7.1 |
International Growth | 6.5 |
International Value | 6.4 |
Explorer | 4.4 |
Bond Funds | |
GNMA | 12.0% |
Long-Term Investment-Grade | 11.9 |
Short-Term Investments | |
Short-Term Investment-Grade | 11.8% |
Volatility Measures3 | |
| Fund Versus |
| Composite Index4 |
R-Squared | 0.99 |
Beta | 1.05 |
Equity Investment Focus

Fixed Income Investment Focus

Fund Asset Allocation

1 30-day SEC yield for the fund. See the Glossary.
2 This figure—drawn from the prospctus dated February 27, 2008—represents a weighted average of the annualized expense ratio and any transaction fees charged by the underlying mutual funds (the “acquired” funds) in which the STAR Fund invests. The STAR Fund does not charge any expenses or fees of its own. For the fiscal year ended October 31, 2008, the acquired fund fees and expenses figure was 0.32%.
3 For an explanation of R-squared, beta, and other terms used here, see the Glossary.
4 The STAR Composite Index is weighted 50% MSCI US Broad Market Index, 25% Lehman U.S. Aggregate Bond Index, 12.5% Lehman 1–5 Year U.S. Credit Index, and 12.5% MSCI EAFE Index thereafter.
8
STAR Fund
Performance Summary
All of the returns in this report represent past performance, which is not a guarantee of future results that may be achieved by the fund. (Current performance may be lower or higher than the performance data cited. For performance data current to the most recent month-end, visit our website at www.vanguard.com/performance.) Note, too, that both investment returns and principal value can fluctuate widely, so an investor’s shares, when sold, could be worth more or less than their original cost. The returns shown do not reflect taxes that a shareholder would pay on fund distributions or on the sale of fund shares.
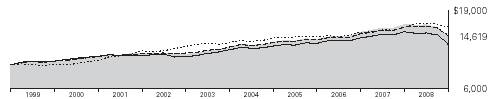
Cumulative Performance: October 31, 1998–October 31, 2008
Initial Investment of $10,000

| Average Annual Total Returns | Final Value |
| Periods Ended October 31, 2008 | of a $10,000 |
| One Year | Five Years | Ten Years | Investment |
STAR Fund1 | –27.94% | 2.12% | 4.07% | $14,899 |
Dow Jones Wilshire 5000 Index | –36.43 | 0.81 | 1.27 | 11,350 |
STAR Composite Index2 | –25.94 | 2.18 | 2.94 | 13,361 |
STAR Composite Average3 | –29.20 | 0.84 | 2.55 | 12,863 |
1 Total returns do not include the account service fee that may be applicable to certain accounts with balances below $10,000.
2 The STAR Composite Index is weighted 62.5% Dow Jones Wilshire 5000 Index, 25% Lehman U.S. Aggregate Bond Index, and 12.5% Citigroup 3-month Treasury Bill Index through December 31, 2002; 50% Dow Jones Wilshire 5000 Index, 25% Lehman U.S. Aggregate Bond Index, 12.5% Lehman 1–5 Year U.S. Credit Index, and 12.5% MSCI EAFE Index through April 22, 2005; and 50% MSCI US Broad Market Index, 25% Lehman U.S. Aggregate Bond Index, 12.5% Lehman 1–5 Year U.S. Credit Index, and 12.5% MSCI EAFE Index thereafter.
3 The STAR Composite Average, which is derived from data provided by Lipper Inc., is weighted 62.5% average general equity fund, 25% average fixed income fund, and 12.5% average money market fund through December 31, 2002, and 50% average general equity fund, 25% average fixed income fund, 12.5% average 1–5 year investment-grade fund, and 12.5% average international fund thereafter.
Note: See Financial Highlights table for dividend and capital gains information.
9
STAR Fund
Fiscal-Year Total Returns (%): October 31, 1998–October 31, 2008 |
| STAR Fund | Composite |
Fiscal | Capital | Income | Total | Index1 Total |
Year | Return | Return | Return | Return |
1999 | 7.3% | 3.4% | 10.7% | 16.4% |
2000 | 8.6 | 3.9 | 12.5 | 7.9 |
2001 | –6.4 | 3.3 | –3.1 | –12.9 |
2002 | –9.4 | 2.9 | –6.5 | –6.5 |
2003 | 15.7 | 3.3 | 19.0 | 17.3 |
2004 | 7.5 | 2.6 | 10.1 | 9.2 |
2005 | 6.8 | 2.5 | 9.3 | 7.8 |
2006 | 10.2 | 2.9 | 13.1 | 13.5 |
2007 | 10.1 | 3.0 | 13.1 | 12.6 |
2008 | –30.1 | 2.2 | –27.9 | –25.9 |
Average Annual Total Returns: Periods Ended September 30, 2008
This table presents average annual total returns through the latest calendar quarter—rather than through the end of the fiscal period. Securities and Exchange Commission rules require that we provide this information.
| | | | | | Ten Years |
| Inception Date | One Year | Five Years | Capital | Income | Total |
STAR Fund2 | 3/29/1985 | –15.59% | 5.76% | 2.99% | 3.04% | 6.03% |
1 The STAR Composite Index is weighted 62.5% Dow Jones Wilshire 5000 Index, 25% Lehman U.S. Aggregate Bond Index, and 12.5% Citigroup 3-month Treasury Bill Index through December 31, 2002; 50% Dow Jones Wilshire 5000 Index, 25% Lehman U.S. Aggregate Bond Index, 12.5% Lehman 1–5 Year U.S. Credit Index, and 12.5% MSCI EAFE Index through April 22, 2005; and 50% MSCI US Broad Market Index, 25% Lehman U.S. Aggregate Bond Index, 12.5% Lehman 1–5 Year U.S. Credit Index, and 12.5% MSCI EAFE Index thereafter.
2 Total returns do not include the account service fee that may be applicable to certain accounts with balances below $10,000.
Note: See Financial Highlights table for dividend and capital gains information.
10
STAR Fund
Financial Statements
Statement of Net Assets
As of October 31, 2008
The fund provides a complete list of its holdings four times in each fiscal year, at the quarter-ends. For the second and fourth fiscal quarters, the lists appear in the fund’s semiannual and annual reports to shareholders. For the first and third fiscal quarters, the fund files the lists with the Securities and Exchange Commission on Form N-Q. Shareholders can look up the fund’s Forms N-Q on the SEC’s website at www.sec.gov. Forms N-Q may also be reviewed and copied at the SEC’s Public Reference Room (see the back cover of this report for further information).
| | Market |
| | Value• |
| Shares | ($000) |
Investment Companies (100.0%) | | |
U.S. Stock Funds (51.3%) | | |
Vanguard Windsor II Fund Investor Shares | 83,697,197 | 1,720,814 |
Vanguard Windsor Fund Investor Shares | 100,016,853 | 951,160 |
Vanguard PRIMECAP Fund Investor Shares | 14,137,731 | 742,796 |
Vanguard Morgan Growth Fund Investor Shares | 59,990,452 | 740,882 |
Vanguard U.S. Growth Fund Investor Shares | 55,070,992 | 736,299 |
Vanguard Explorer Fund Investor Shares | 10,142,987 | 461,912 |
| | 5,353,863 |
International Stock Funds (12.9%) | | |
Vanguard International Growth Fund Investor Shares | 49,019,027 | 673,521 |
Vanguard International Value Fund | 27,531,219 | 670,936 |
| | 1,344,457 |
Bond Funds (23.9%) | | |
Vanguard GNMA Fund Investor Shares | 123,798,661 | 1,250,367 |
Vanguard Long-Term Investment-Grade Fund Investor Shares | 172,052,350 | 1,238,777 |
| | 2,489,144 |
Short-Term Bond Fund (11.8%) | | |
Vanguard Short-Term Investment-Grade Fund Investor Shares | 126,913,632 | 1,227,255 |
| | |
Money Market Fund (0.1%) | | |
1 Vanguard Market Liquidity Fund, 2.217% | 14,265,734 | 14,266 |
Total Investment Companies (Cost $11,032,407) | | 10,428,985 |
Other Assets and Liabilities (0.0%) | | |
Other Assets | | 39,437 |
Liabilities | | (40,863) |
| | (1,426) |
Net Assets (100%) | | |
Applicable to 679,993,080 outstanding $.001 par value shares of | | |
beneficial interest (unlimited authorization) | | 10,427,559 |
Net Asset Value Per Share | | $15.33 |
11
STAR Fund
At October 31, 2008, net assets consisted of: | |
| Amount |
| ($000) |
Paid-in Capital | 10,617,560 |
Undistributed Net Investment Income | 89,927 |
Accumulated Net Realized Gains | 323,494 |
Unrealized Appreciation (Depreciation) | (603,422) |
Net Assets | 10,427,559 |
• | See Note A in Notes to Financial Statements. |
1 Affiliated money market fund available only to Vanguard funds and certain trusts and accounts managed by Vanguard. Rate shown is the 7-day yield.
See accompanying Notes, which are an integral part of the Financial Statements.
12
STAR Fund
Statement of Operations
| Year Ended |
| October 31, 2008 |
| ($000) |
Investment Income | |
Income | |
Income Distributions Received | 408,314 |
Net Investment Income—Note B | 408,314 |
Realized Net Gain (Loss) | |
Capital Gain Distributions Received | 669,117 |
Investment Securities Sold | (169,369) |
Realized Net Gain (Loss) | 499,748 |
Change in Unrealized Appreciation (Depreciation) on Investment Securities | (5,074,944) |
Net Increase (Decrease) in Net Assets Resulting from Operations | (4,166,882) |
See accompanying Notes, which are an integral part of the Financial Statements.
13
STAR Fund
Statement of Changes in Net Assets
| Year Ended October 31, |
| 2008 | 2007 |
| ($000) | ($000) |
Increase (Decrease) in Net Assets | | |
Operations | | |
Net Investment Income | 408,314 | 409,893 |
Realized Net Gain (Loss) | 499,748 | 483,024 |
Change in Unrealized Appreciation (Depreciation) | (5,074,944) | 880,955 |
Net Increase (Decrease) in Net Assets Resulting from Operations | (4,166,882) | 1,773,872 |
Distributions | | |
Net Investment Income | (429,438) | (390,425) |
Realized Capital Gain1 | (548,222) | (209,760) |
Total Distributions | (977,660) | (600,185) |
Capital Share Transactions | | |
Issued | 1,122,273 | 1,450,174 |
Issued in Lieu of Cash Distributions | 950,772 | 583,135 |
Redeemed | (1,710,879) | (1,519,392) |
Net Increase (Decrease) from Capital Share Transactions | 362,166 | 513,917 |
Total Increase (Decrease) | (4,782,376) | 1,687,604 |
Net Assets | | |
Beginning of Period | 15,209,935 | 13,522,331 |
End of Period2 | 10,427,559 | 15,209,935 |
1 Includes fiscal 2008 and 2007 short-term gain distributions totaling $152,838,000 and $39,771,000, respectively. Short-term gain distributions are treated as ordinary income dividends for tax purposes.
2 Net Assets—End of Period includes undistributed net investment income of $89,927,000 and $111,051,000.
See accompanying Notes, which are an integral part of the Financial Statements.
14
STAR Fund
Financial Highlights
For a Share Outstanding | Year Ended October 31, |
Throughout Each Period | 2008 | 2007 | 2006 | 2005 | 2004 |
Net Asset Value, Beginning of Period | $22.80 | $21.04 | $19.14 | $17.92 | $16.67 |
Investment Operations | | | | | |
Net Investment Income | .600 | .626 | .533 | .460 | .410 |
Capital Gain Distributions Received | .967 | .669 | .378 | .010 | — |
Net Realized and Unrealized Gain (Loss) | | | | | |
on Investments | (7.578) | 1.392 | 1.554 | 1.190 | 1.260 |
Total from Investment Operations | (6.011) | 2.687 | 2.465 | 1.660 | 1.670 |
Distributions | | | | | |
Dividends from Net Investment Income | (.634) | (.600) | (.510) | (.440) | (.420) |
Distributions from Realized Capital Gains | (.825) | (.327) | (.055) | — | — |
Total Distributions | (1.459) | (.927) | (.565) | (.440) | (.420) |
Net Asset Value, End of Period | $15.33 | $22.80 | $21.04 | $19.14 | $17.92 |
| | | | | |
Total Return1 | –27.94% | 13.14% | 13.13% | 9.33% | 10.14% |
| | | | | |
Ratios/Supplemental Data | | | | | |
Net Assets, End of Period (Millions) | $10,428 | $15,210 | $13,522 | $11,547 | $10,083 |
Ratio of Total Expenses to | | | | | |
Average Net Assets | 0%2 | 0% | 0% | 0% | 0% |
Ratio of Net Investment Income to | | | | | |
Average Net Assets | 3.00% | 2.85% | 2.64% | 2.44% | 2.39% |
Portfolio Turnover Rate | 24% | 8% | 9% | 6% | 6% |
1 Total returns do not include the account service fee that may be applicable to certain accounts with balances below $10,000.
2 The acquired fund fees and expenses were 0.32%.
See accompanying Notes, which are an integral part of the Financial Statements.
15
STAR Fund
Notes to Financial Statements
Vanguard STAR Fund is registered under the Investment Company Act of 1940 as an open-end investment company, or mutual fund. The fund follows a balanced investment strategy by investing in selected Vanguard funds. The fund invests 60% to 70% of its net assets in stock funds (predominantly large-capitalization U.S. stock funds), 20% to 30% in intermediate- to long-term bond funds, and 10% to 20% in a short-term bond fund.
A. The following significant accounting policies conform to generally accepted accounting principles for U.S. mutual funds. The fund consistently follows such policies in preparing its financial statements.
1. Valuation: Investments are valued at the net asset value of each underlying Vanguard fund determined as of the close of the New York Stock Exchange (generally 4 p.m., Eastern time) on the valuation date.
2. Federal Income Taxes: The fund intends to continue to qualify as a regulated investment company and distribute all of its taxable income. Management has analyzed the fund’s tax positions taken on federal income tax returns for all open tax years (tax years ended October 31, 2005–2008), and has concluded that no provision for federal income tax is required in the fund’s financial statements.
3. Distributions: Distributions to shareholders are recorded on the ex-dividend date.
4. Other: Income and capital gain distributions received are recorded on the ex-dividend date. Security transactions are accounted for on the date securities are bought or sold. Costs used to determine realized gains (losses) on the sale of investment securities are those of the specific securities sold.
B. Under a service agreement, The Vanguard Group furnishes investment advisory, corporate management, administrative, marketing, and distribution services to the fund. The service agreement provides that the fund’s expenses may be reduced or eliminated to the extent of savings realized by the Vanguard funds by the operation of the fund. Accordingly, all incremental expenses for services provided by Vanguard and all other expenses incurred by the fund during the year ended October 31, 2008, were borne by the funds in which the fund invests. The fund’s trustees and officers are also directors and officers of Vanguard and the funds in which the fund invests.
C. Distributions are determined on a tax basis and may differ from net investment income and realized capital gains for financial reporting purposes. Differences may be permanent or temporary. Permanent differences are reclassified among capital accounts in the financial statements to reflect their tax character. Temporary differences arise when certain items of income, expense, gain, or loss are recognized in different periods for financial statement and tax purposes; these differences will reverse at some time in the future. Differences in classification may also result from the treatment of short-term gains as ordinary income for tax purposes.
The fund used a tax accounting practice to treat a portion of the price of capital shares redeemed during the year as distributions from realized capital gains. Accordingly, the fund has reclassified $69,433,000 from accumulated net realized gains to paid-in capital.
For tax purposes, at October 31, 2008, the fund had $89,808,000 of ordinary income and $420,794,000 of long-term capital gains available for distribution.
At October 31, 2008, the cost of investment securities for tax purposes was $11,129,588,000. Net unrealized depreciation of investment securities for tax purposes was $700,603,000, consisting of unrealized gains of $450,422,000 on securities that had risen in value since their purchase and $1,151,025,000 in unrealized losses on securities that had fallen in value since their purchase.
16
STAR Fund
D. During the year ended October 31, 2008, the fund purchased $3,806,983,000 of investment securities and sold $3,339,111,000 of investment securities other than temporary cash investments.
E. Capital shares issued and redeemed were:
| Year Ended October 31, |
| 2008 | 2007 |
| Shares | Shares |
| (000) | (000) |
Issued | 56,993 | 67,082 |
Issued in Lieu of Cash Distributions | 46,267 | 27,479 |
Redeemed | (90,316) | (70,107) |
Net Increase (Decrease) in Shares Outstanding | 12,944 | 24,454 |
F. In September 2006, the Financial Accounting Standards Board issued Statement of Financial Accounting Standards No. 157 (“FAS 157”), “Fair Value Measurements.” FAS 157 establishes a framework for measuring fair value and expands disclosures about fair value measurements in financial statements.
The various inputs that may be used to determine the value of the fund’s investments are summarized in three broad levels. The inputs or methodologies used for valuing securities are not necessarily an indication of the risk associated with investing in those securities.
Level 1—Quoted prices in active markets for identical securities.
Level 2—Other significant observable inputs (including quoted prices for similar securities, interest rates, prepayment speeds, credit risk, etc.).
Level 3—Significant unobservable inputs (including the fund’s own assumptions used to determine the fair value of investments).
At October 31, 2008, 100% of the fund’s investments were valued based on Level 1 inputs.
17
Report of Independent Registered Public Accounting Firm
To the Trustees of Vanguard STAR Funds and the Shareholders of Vanguard STAR Fund:
In our opinion, the accompanying statement of net assets and the related statements of operations and of changes in net assets and the financial highlights present fairly, in all material respects, the financial position of Vanguard STAR Fund (the “Fund”) at October 31, 2008, the results of its operations for the year then ended, the changes in its net assets for each of the two years in the period then ended and the financial highlights for each of the five years in the period then ended, in conformity with accounting principles generally accepted in the United States of America. These financial statements and financial highlights (hereafter referred to as “financial statements”) are the responsibility of the Fund’s management; our responsibility is to express an opinion on these financial statements based on our audits. We conducted our audits of these financial statements in accordance with the standards of the Public Company Accounting Oversight Board (United States). Those standards require that we plan and perform the audit to obtain reasonable assurance about whether the financial statements are free of material misstatement. An audit includes examining, on a test basis, evidence supporting the amounts and disclosures in the financial statements, assessing the accounting principles used and significant estimates made by management, and evaluating the overall financial statement presentation. We believe that our audits, which included confirmation of securities at October 31, 2008 by agreement to the underlying ownership records of the Vanguard funds, provide a reasonable basis for our opinion.
PricewaterhouseCoopers LLP
Philadelphia, Pennsylvania
December 19, 2008
Special 2008 tax information (unaudited) for Vanguard STAR Fund |
This information for the fiscal year ended October 31, 2008, is included pursuant to provisions of the Internal Revenue Code.
The fund distributed $464,817,000 as capital gain dividends (from net long-term capital gains) to shareholders during the fiscal year.
For nonresident alien shareholders, 100% of short-term capital gain dividends distributed by the fund are qualified short-term capital gains.
The fund distributed $128,638,000 of qualified dividend income to shareholders during the fiscal year.
For corporate shareholders, 24.3% of investment income (dividend income plus short-term gains, if any) qualifies for the dividends-received deduction.
18
Your Fund’s After-Tax Returns
This table presents returns for your fund both before and after taxes. The after-tax returns are shown in two ways: (1) assuming that an investor owned the fund during the entire period and paid taxes on the fund’s distributions, and (2) assuming that an investor paid taxes on the fund’s distributions and sold all shares at the end of each period.
Calculations are based on the highest individual federal income tax and capital gains tax rates in effect at the times of the distributions and the hypothetical sales. State and local taxes were not considered. After-tax returns reflect any qualified dividend income, using actual prior-year figures and estimates for 2008. (In the example, returns after the sale of fund shares may be higher than those assuming no sale. This occurs when the sale would have produced a capital loss. The calculation assumes that the investor received a tax deduction for the loss.)
Please note that your actual after-tax returns will depend on your tax situation and may differ from those shown. Also note that if you own the fund in a tax-deferred account, such as an individual retirement account or a 401(k) plan, this information does not apply to you. Such accounts are not subject to current taxes.
Finally, keep in mind that a fund’s performance—whether before or after taxes—does not guarantee future results.
Average Annual Total Returns: STAR Fund1 | | | |
Periods Ended October 31, 2008 | | | |
| One | Five | Ten |
| Year | Years | Years |
Returns Before Taxes | –27.94% | 2.12% | 4.07% |
Returns After Taxes on Distributions | –29.13 | 1.11 | 2.41 |
Returns After Taxes on Distributions and Sale of Fund Shares | –17.22 | 1.53 | 2.73 |
1 Total returns do not include the account service fee that may be applicable to certain accounts with balances below $10,000.
19
About Your Fund’s Expenses
As a shareholder of the fund, you incur ongoing costs, which include costs for portfolio management, administrative services, and shareholder reports (like this one), among others. Operating expenses, which are deducted from a fund’s gross income, directly reduce the investment return of the fund.
A typical fund’s expenses are expressed as a percentage of its average net assets. The STAR Fund has no direct expenses, but bears its proportionate share of the costs for the underlying funds in which it invests. These indirect expenses make up the acquired fund fees and expenses, also expressed as a percentage of average net assets.
The following examples are intended to help you understand the ongoing costs (in dollars) of investing in your fund and to compare these costs with those of other mutual funds. The examples are based on an investment of $1,000 made at the beginning of the period shown and held for the entire period. The costs were calculated using the acquired fund fees and expenses for the STAR Fund.
The accompanying table illustrates your fund’s costs in two ways:
• Based on actual fund return. This section helps you to estimate the actual expenses that you paid over the period. The “Ending Account Value” shown is derived from the fund’s actual return, and the third column shows the dollar amount that would have been paid by an investor who started with $1,000 in the fund. You may use the information here, together with the amount you invested, to estimate the expenses that you paid over the period.
To do so, simply divide your account value by $1,000 (for example, an $8,600 account value divided by $1,000 = 8.6), then multiply the result by the number given for your fund under the heading “Expenses Paid During Period.”
• Based on hypothetical 5% yearly return. This section is intended to help you compare your fund’s costs with those of other mutual funds. It assumes that the fund had a yearly return of 5% before expenses, but that the expense ratio is unchanged. In this case—because the return used is not the fund’s actual return—the results do not apply to your investment. The example is useful in making comparisons because the Securities and Exchange Commission requires all mutual funds to calculate expenses based on a 5% return. You can assess your fund’s costs by comparing this hypothetical example with the hypothetical examples that appear in shareholder reports of other funds.
Six Months Ended October 31, 2008 | | | |
| Beginning | Ending | Expenses |
| Account Value | Account Value | Paid During |
STAR Fund | 4/30/2008 | 10/31/2008 | Period1 |
Based on Actual Fund Return | $1,000.00 | $765.53 | $1.42 |
Hypothetical 5% Yearly Return | $1,000.00 | 1,023.59 | 1.63 |
1 These calculations are based on the acquired fund fees and expenses shown for the STAR Fund. The STAR Fund’s annualized expense figure for the period is 0.32%. The dollar amounts shown as “Expenses Paid” are equal to the annualized average expense figure, multiplied by the average account value over the period, multiplied by the number of days in the most recent six-month period, then divided by the number of days in the most recent 12-month period.
20
Note that the expenses shown in the table are meant to highlight and help you compare ongoing costs only and do not reflect transaction costs incurred by the fund for buying and selling securities. Further, the expenses do not include the account service fee described in the prospectus. If such a fee were applied to your account, your costs would be higher. Your fund does not charge transaction fees, such as purchase or redemption fees, nor does it carry a “sales load.”
The calculations assume no shares were bought or sold during the period. Your actual costs may have been higher or lower, depending on the amount of your investment and the timing of any purchases or redemptions.
You can find more information about the fund’s expenses, including annual expense ratios, in the Financial Statements section of this report. For additional information on operating expenses and other shareholder costs, please refer to your fund’s current prospectus.
21
Glossary
Acquired Fund Fees and Expenses. Funds that invest in other Vanguard funds incur no direct expenses, but they do bear proportionate shares of the operating, administrative, and advisory expenses of the underlying funds, and they must pay any fees charged by those funds. The figure for acquired fund fees and expenses represents a weighted average of these underlying costs. Acquired is a term that the Securities and Exchange Commission applies to any mutual fund whose shares are owned by another fund.
Beta. A measure of the magnitude of a fund’s past share-price fluctuations in relation to the ups and downs of a given market index. The index is assigned a beta of 1.00. Compared with a given index, a fund with a beta of 1.20 typically would have seen its share price rise or fall by 12% when the index rose or fell by 10%. For this report, beta is based on returns over the past 36 months for both the fund and the index. Note that a fund’s beta should be reviewed in conjunction with its R-squared (see definition). The lower the R-squared, the less correlation there is between the fund and the index, and the less reliable beta is as an indicator of volatility.
Expense Ratio. The percentage of a fund’s average net assets used to pay its annual administrative and advisory expenses. These expenses directly reduce returns to investors.
Inception Date. The date on which the assets of a fund (or one of its share classes) are first invested in accordance with the fund’s investment objective. For funds with a subscription period, the inception date is the day after that period ends. Investment performance is measured from the inception date.
R-Squared. A measure of how much of a fund’s past returns can be explained by the returns from the market in general, as measured by a given index. If a fund’s total returns were precisely synchronized with an index’s returns, its R-squared would be 1.00. If the fund’s returns bore no relationship to the index’s returns, its R-squared would be 0. For this report, R-squared is based on returns over the past 36 months for both the fund and the index.
Yield. A fund’s 30-day SEC yield is derived using a formula specified by the U.S. Securities and Exchange Commission. Under the formula, data related to the fund’s security holdings in the previous 30 days are used to calculate the fund’s hypothetical net income for that period, which is then annualized and divided by the fund’s estimated average net assets over the calculation period. For the purposes of this calculation, a security’s income is based on its current market yield to maturity (in the case of bonds) or its projected dividend yield (for stocks). Because the SEC yield represents hypothetical annualized income, it will differ—at times significantly—from the fund’s actual experience. As a result, the fund’s income distributions may be higher or lower than implied by the SEC yield.
22
This page intentionally left blank.
The People Who Govern Your Fund
The trustees of your mutual fund are there to see that the fund is operated and managed in your best interests since, as a shareholder, you are a part owner of the fund. Your fund’s trustees also serve on the board of directors of The Vanguard Group, Inc., which is owned by the Vanguard funds and provides services to them on an at-cost basis.
A majority of Vanguard’s board members are independent, meaning that they have no affiliation with Vanguard or the funds they oversee, apart from the sizable personal investments they have made as private individuals.
Our independent board members bring distinguished backgrounds in business, academia, and public service to their task of working with Vanguard officers to establish the policies and oversee the activities of the funds. Among board members’ responsibilities are selecting investment advisors for the funds; monitoring fund operations, performance, and costs; reviewing contracts; nominating and selecting new trustees/directors; and electing Vanguard officers.
Each trustee serves a fund until its termination; or until the trustee’s retirement, resignation, or death; or otherwise as specified in the fund’s organizational documents. Any trustee may be removed at a shareholders’ meeting by a vote representing two-thirds of the net asset value of all shares of the fund together with shares of other Vanguard funds organized within the same trust. The table on these two pages shows information for each trustee and executive officer of the fund. The mailing address of the trustees and officers is P.O. Box 876, Valley Forge, PA 19482.
Chairman of the Board and Trustee |
| |
John J. Brennan1 | |
Born 1954 | Principal Occupation(s) During the Past Five Years: Chairman of the Board and Director/ |
Trustee Since May 1987; | Trustee of The Vanguard Group, Inc., and of each of the investment companies served |
Chairman of the Board | by The Vanguard Group; Chief Executive Officer and President of The Vanguard Group |
156 Vanguard Funds Overseen | and of each of the investment companies served by The Vanguard Group (1996–2008). |
| |
Independent Trustees | |
| |
Charles D. Ellis | |
Born 1937 | Principal Occupation(s) During the Past Five Years: Applecore Partners (pro bono ventures |
Trustee Since January 2001 | in education); Senior Advisor to Greenwich Associates (international business strategy |
156 Vanguard Funds Overseen | consulting); Successor Trustee of Yale University; Overseer of the Stern School of Business |
| at New York University; Trustee of the Whitehead Institute for Biomedical Research. |
| |
Emerson U. Fullwood | |
Born 1948 | Principal Occupation(s) During the Past Five Years: Executive Chief Staff and Marketing |
Trustee Since January 2008 | Officer for North America since 2004 and Corporate Vice President of Xerox Corporation |
156 Vanguard Funds Overseen | (photocopiers and printers); Director of SPX Corporation (multi-industry manufacturing), |
| of the United Way of Rochester, and of the Boy Scouts of America. |
| |
Rajiv L. Gupta | |
Born 1945 | Principal Occupation(s) During the Past Five Years: Chairman, President, and |
Trustee Since December 20012 | Chief Executive Officer of Rohm and Haas Co. (chemicals); Board Member of |
156 Vanguard Funds Overseen | the American Chemistry Council; Director of Tyco International, Ltd. (diversified |
| manufacturing and services), since 2005. |
| |
Amy Gutmann | |
Born 1949 | Principal Occupation(s) During the Past Five Years: President of the University of |
Trustee Since June 2006 | Pennsylvania since 2004; Professor in the School of Arts and Sciences, Annenberg School |
156 Vanguard Funds Overseen | for Communication, and Graduate School of Education of the University of Pennsylvania |
| since 2004; Provost (2001–2004) and Laurance S. Rockefeller Professor of Politics and |
| the University Center for Human Values (1990–2004), Princeton University; Director of |
| Carnegie Corporation of New York since 2005 and of Schuylkill River Development |
| Corporation and Greater Philadelphia Chamber of Commerce since 2004; Trustee of |
| the National Constitution Center since 2007. |
JoAnn Heffernan Heisen | |
Born 1950 | Principal Occupation(s) During the Past Five Years: Corporate Vice President and |
Trustee Since July 1998 | Chief Global Diversity Officer since 2006, Vice President and Chief Information |
156 Vanguard Funds Overseen | Officer (1997–2005), and Member of the Executive Committee of Johnson & |
| Johnson (pharmaceuticals/consumer products); Director of the University Medical |
| Center at Princeton and Women’s Research and Education Institute. |
| |
André F. Perold | |
Born 1952 | Principal Occupation(s) During the Past Five Years: George Gund Professor of Finance |
Trustee Since December 2004 | and Banking, Harvard Business School; Senior Associate Dean and Director of Faculty |
156 Vanguard Funds Overseen | Recruiting, Harvard Business School; Director and Chairman of UNX, Inc. (equities |
| trading firm); Chair of the Investment Committee of HighVista Strategies LLC (private |
| investment firm) since 2005. |
| |
Alfred M. Rankin, Jr. | |
Born 1941 | Principal Occupation(s) During the Past Five Years: Chairman, President, Chief Executive |
Trustee Since January 1993 | Officer, and Director of NACCO Industries, Inc. (forklift trucks/housewares/lignite); Director |
156 Vanguard Funds Overseen | of Goodrich Corporation (industrial products/aircraft systems and services). |
| |
J. Lawrence Wilson | |
Born 1936 | Principal Occupation(s) During the Past Five Years: Retired Chairman and Chief Executive |
Trustee Since April 1985 | Officer of Rohm and Haas Co. (chemicals); Director of Cummins Inc. (diesel engines) and |
156 Vanguard Funds Overseen | AmerisourceBergen Corp. (pharmaceutical distribution); Trustee of Vanderbilt University |
| and of Culver Educational Foundation. |
| |
Executive Officers1 | |
| |
Thomas J. Higgins | |
Born 1957 | Principal Occupation(s) During the Past Five Years: Principal of The Vanguard Group, Inc.; |
Chief Financial Officer | Treasurer of each of the investment companies served by The Vanguard Group; Chief |
Since September 2008 | Financial Officer of each of the investment companies served by The Vanguard |
Treasurer Since July 1998 | Group since 2008. |
156 Vanguard Funds Overseen | |
| |
F. William McNabb III | |
Born 1957 | Principal Occupation(s) During the Past Five Years: Chief Executive Officer, Director, |
Chief Executive Officer | and President of The Vanguard Group, Inc., since 2008; Chief Executive Officer and |
Since August 31, 2008 | President of each of the investment companies served by The Vanguard Group since |
President Since March 2008 | 2008; Director of Vanguard Marketing Corporation; Managing Director of The Vanguard |
156 Vanguard Funds Overseen | Group (1995–2008). |
| |
Heidi Stam | |
Born 1956 | Principal Occupation(s) During the Past Five Years: Managing Director of The Vanguard |
Secretary Since July 2005 | Group, Inc., since 2006; General Counsel of The Vanguard Group since 2005; Secretary of |
156 Vanguard Funds Overseen | The Vanguard Group and of each of the investment companies served by The Vanguard |
| Group since 2005; Director and Senior Vice President of Vanguard Marketing Corporation |
| since 2005; Principal of The Vanguard Group (1997–2006). |
Vanguard Senior Management Team | | | |
| | | | |
R. Gregory Barton | Kathleen C. Gubanich | Michael S. Miller | Ralph K. Packard | George U. Sauter |
Mortimer J. Buckley | Paul A. Heller | James M. Norris | Glenn W. Reed | |
Founder |
|
John C. Bogle |
Chairman and Chief Executive Officer, 1974–1996 |
1 | These individuals are “interested persons” as defined in the Investment Company Act of 1940. |
2 | December 2002 for Vanguard Equity Income Fund, Vanguard Growth Equity Fund, the Vanguard Municipal Bond Funds, and the Vanguard State Tax-Exempt Funds. |
More information about the trustees is in the Statement of Additional Information, available from The Vanguard Group.
| 
|
| P.O. Box 2600 |
| Valley Forge, PA 19482-2600 |
Connect with Vanguard® > www.vanguard.com
Fund Information > 800-662-7447 | All comparative mutual fund data are from Lipper Inc. |
| or Morningstar, Inc., unless otherwise noted. |
Direct Investor Account Services > 800-662-2739 | |
| |
Institutional Investor Services > 800-523-1036 | You can obtain a free copy of Vanguard’s proxy voting |
| guidelines by visiting our website, www.vanguard.com, |
Text Telephone for People | and searching for “proxy voting guidelines,” or by |
With Hearing Impairment > 800-952-3335 | calling Vanguard at 800-662-2739. The guidelines are |
| also available from the SEC’s website, www.sec.gov. |
| In addition, you may obtain a free report on how your |
| fund voted the proxies for securities it owned during |
This material may be used in conjunction | the 12 months ended June 30. To get the report, visit |
with the offering of shares of any Vanguard | either www.vanguard.com or www.sec.gov. |
fund only if preceded or accompanied by | You can review and copy information about your fund |
the fund’s current prospectus. | |
| |
| at the SEC’s Public Reference Room in Washington, D.C. |
The funds or securities referred to herein are not | To find out more about this public service, call the SEC |
sponsored, endorsed, or promoted by MSCI, and MSCI | at 202-551-8090. Information about your fund is also |
bears no liability with respect to any such funds or | available on the SEC’s website, and you can receive |
securities. For any such funds or securities, the | copies of this information, for a fee, by sending a |
prospectus or the Statement of Additional Information | request in either of two ways: via e-mail addressed to |
contains a more detailed description of the limited | publicinfo@sec.gov or via regular mail addressed to the |
relationship MSCI has with The Vanguard Group and | Public Reference Section, Securities and Exchange |
any related funds. | Commission, Washington, DC 20549-0102. |
| |
Russell is a trademark of The Frank Russell Company. | |
| |
| |
| |
| |
| |
| |
| |
| |
| |
| © 2008 The Vanguard Group, Inc. |
| All rights reserved. |
| Vanguard Marketing Corporation, Distributor. |
| |
| Q560 122008 |

> | For the fiscal year ended October 31, 2008, returns for the Vanguard LifeStrategy Funds ranged from –12.29% for the most conservative fund to –34.98% for the fund with the most aggressive asset allocation. |
> | Each of the four LifeStrategy Funds trailed the return of its corresponding benchmark index, largely because of weakness in Vanguard Asset Allocation Fund; two of the funds lagged the average return of their peer funds. |
> | Vanguard Asset Allocation Fund, which makes up a quarter of each LifeStrategy Fund, returned –35.43% for the 12 months. |
Contents | |
| |
Your Fund’s Total Returns | 1 |
President’s Letter | 2 |
LifeStrategy Income Fund | 7 |
LifeStrategy Conservative Growth Fund | 16 |
LifeStrategy Moderate Growth Fund | 25 |
LifeStrategy Growth Fund | 34 |
Your Fund’s After-Tax Returns | 45 |
About Your Fund’s Expenses | 46 |
Glossary | 48 |
Please note: The opinions expressed in this report are just that—informed opinions. They should not be considered promises or advice. Also, please keep in mind that the information and opinions cover the period through the date on the front of this report. Of course, the risks of investing in your fund are spelled out in the prospectus.
Your Fund’s Total Returns
Fiscal Year Ended October 31, 2008 | | |
| Ticker | Total |
| Symbol | Returns |
Vanguard LifeStrategy Income Fund | VASIX | –12.29% |
Income Composite Index1 | | –8.31 |
Income Composite Average2 | | –13.28 |
| | |
Vanguard LifeStrategy Conservative Growth Fund | VSCGX | –20.71% |
Conservative Growth Composite Index1 | | –16.75 |
Conservative Growth Composite Average2 | | –20.24 |
| | |
Vanguard LifeStrategy Moderate Growth Fund | VSMGX | –27.69% |
Moderate Growth Composite Index1 | | –24.33 |
Moderate Growth Composite Average2 | | –28.64 |
| | |
Vanguard LifeStrategy Growth Fund | VASGX | –34.98% |
Growth Composite Index1 | | –31.65 |
Growth Composite Average2 | | –34.68 |
Your Fund’s Performance at a Glance | | | | | |
October 31, 2007–October 31, 2008 | | | | | |
| Starting | Ending | Distributions Per Share | |
| Share | Share | Income | Capital | 30-Day |
| Price | Price | Dividends | Gains | SEC Yield |
Vanguard LifeStrategy Income Fund | $14.44 | $12.13 | $0.570 | $0.029 | 4.57% |
Vanguard LifeStrategy Conservative | | | | | |
Growth Fund | 17.61 | 13.46 | 0.592 | 0.010 | 4.18 |
Vanguard LifeStrategy Moderate | | | | | |
Growth Fund | 22.21 | 15.56 | 0.627 | 0.024 | 3.76 |
Vanguard LifeStrategy Growth Fund | 26.56 | 16.86 | 0.581 | 0.000 | 3.36 |
1 Total returns for the composite indexes are derived by applying the funds’ target allocations to the results of the following benchmarks: for U.S. stocks, the Morgan Stanley Capital International (MSCI) US Broad Market Index; for international stocks, the MSCI Europe, Australasia, Far East (MSCI EAFE) Index; for bonds, the Lehman Brothers U.S. Aggregate Bond Index; and for short-term investments, the Lehman 1–3 Year U.S. Credit Index.
2 Each average is a blended composite that weights the return of the average comparable mutual fund for each asset class in proportion to the target weighting of the appropriate LifeStrategy Fund. All average returns for funds are derived from data provided by Lipper Inc. The Income Composite Average is weighted 60% average fixed income fund, 20% average general equity fund, and 20% average money market fund. The Conservative Growth Composite Average is weighted 40% average fixed income fund, 35% average general equity fund, 20% average money market fund, and 5% average international fund. The Moderate Growth Composite Average is weighted 50% average general equity fund, 40% average fixed income fund, and 10% average international fund. The Growth Composite Average is weighted 65% average general equity fund, 20% average fixed income fund, and 15% average international fund.
1

President’s Letter
Dear Shareholder,
The four Vanguard LifeStrategy Funds posted disappointing returns for the fiscal year ended October 31, 2008. The funds’ returns, ranging from –12.29% for the conservative LifeStrategy Income Fund to –34.98% for the aggressive LifeStrategy Growth Fund, reflected a very volatile period in global markets.
Overall returns were weakened by each fund’s 25% investment in Vanguard Asset Allocation Fund, which invested exclusively in stocks for most of the 12-month period. Each fund lagged its respective benchmark. Only two funds, LifeStrategy Income Fund and LifeStrategy Moderate Growth Fund, outpaced the average returns of their peer mutual funds.
If you own a LifeStrategy Fund in a taxable account, you may wish to review the funds’ after-tax returns on page 45.
Stock prices fell sharply in global upheaval
Global stock markets started the 12-month period near all-time highs, but then declined sharply, laid low by the financial crisis that originated in the fixed income markets. The descent traced a series of jagged ups and downs. During the week ended October 10, for example, the U.S. stock market returned about –18%. When Wall Street opened the following Monday, stocks surged, returning more than 10% over the next six and a half hours.
2
For the full 12 months, the broad U.S. stock market returned –36.43%; international stocks returned –48.27%. The pain was especially acute in emerging markets—among the strongest performers in recent years—as investors became increasingly risk-averse.
Bond market averages masked disparate returns
The broad U.S. taxable bond market registered an unremarkable return of 0.30% for the 12 months, but by its own typically sedate standards, the dislocations were extreme. The strong performance of U.S. Treasury and government securities was offset by double-digit declines in the corporate bond market. These dynamics led to unusually large differences between the yields of Treasuries and their corresponding private sector securities—both a reflection and a cause of the credit market’s distress. Despite their generally high creditworthiness, municipal bonds also fell in price, with the broad tax-exempt market registering a 12-month return of –3.30%.
The U.S. Federal Reserve Board responded to the turmoil with new lending programs and a dramatic easing of monetary policy. Over the full 12 months, the Fed reduced its target for the federal funds rate from 4.50% to 1.00%.
Heavy stock exposure hurt all four funds
Each LifeStrategy Fund is a “fund of funds” designed for long-term investors seeking a diversified portfolio with varying
Market Barometer | |
| Average Annual Total Returns |
| Periods Ended October 31, 2008 |
| One Year | Three Years | Five Years |
Stocks | | | |
Russell 1000 Index (Large-caps) | –36.80% | –5.51% | 0.37% |
Russell 2000 Index (Small-caps) | –34.16 | –4.79 | 1.57 |
Dow Jones Wilshire 5000 Index (Entire market) | –36.43 | –5.10 | 0.81 |
MSCI All Country World Index ex USA (International) | –48.27 | –3.93 | 5.05 |
| | | |
Bonds | | | |
Lehman U.S. Aggregate Bond Index (Broad taxable market) | 0.30% | 3.60% | 3.48% |
Lehman Municipal Bond Index | –3.30 | 1.71 | 2.73 |
Citigroup 3-Month Treasury Bill Index | 2.31 | 3.93 | 3.10 |
| | | |
CPI | | | |
Consumer Price Index | 3.66% | 2.83% | 3.20% |
3
degrees of risk. The four funds invest in up to five Vanguard mutual funds, primarily broad index portfolios that track U.S. bond or stock markets, or international equity markets. Each fund also invests a quarter of its holdings in Vanguard Asset Allocation Fund, which relies on a quantitative model to determine an optimal allocation among bonds, stocks, and short-term reserves.
The LifeStrategy Funds maintain varying degrees of exposure to the stock and bond markets depending on their mandates. For example, at the end of the fiscal period, the LifeStrategy Income Fund’s portfolio consisted of 69% bonds and short-term reserves and 31% stocks, while the LifeStrategy Growth Fund recorded an allocation of 91% stocks and 9% bonds.
During the 12-month period, as the U.S. credit crisis worsened and fears of a global recession spread, the LifeStrategy Funds with the highest exposure to domestic and international stocks delivered the weakest results. The three worst-performing underlying stock funds were Vanguard Total International Stock Index Fund (–48.57%), Vanguard Total Stock Market Index Fund (–36.28%), and the Asset Allocation Fund (–35.43%). (See your fund’s respective Fund Profile page for the breakdown of its underlying holdings.)
While the LifeStrategy Funds’ underlying index funds have historically tracked their indexes very closely, the funds have often kept a step ahead of their composite benchmarks thanks to the performance of
Expense Ratios | | |
Your Fund Compared With Its Peer Group | | |
| Acquired | Peer-Group |
| Fund Fees | Expense |
| and Expenses1 | Ratio2 |
LifeStrategy Income Fund | 0.24% | 1.07% |
LifeStrategy Conservative Growth Fund | 0.24 | 1.15 |
LifeStrategy Moderate Growth Fund | 0.23 | 1.25 |
LifeStrategy Growth Fund | 0.23 | 1.32 |
1 This figure—drawn from the prospectus dated February 27, 2008—represents a weighted average of the annualized expense ratios and any transaction fees charged by the underlying mutual funds (the “acquired” funds) in which the LifeStrategy Funds invest. The LifeStrategy Funds do not charge any expenses or fees of their own. For the fiscal year ended October 31, 2008, the acquired fund fees and expenses were 0.22% for the Income Fund, 0.22% for the Conservative Growth Fund, 0.22% for the Moderate Growth Fund, and 0.21% for the Growth Fund.
2 Peer groups are (from top to bottom) the Income Composite Average, the Conservative Growth Composite Average, the Moderate Growth Composite Average, and the Growth Composite Average. Each average is a blended composite that weights the expense ratio of the average comparable mutual fund for each asset class in proportion to the target weighting of the appropriate LifeStrategy Fund. The peer-group expense ratios are derived from data provided by Lipper Inc. and capture information through year-end 2007.
4
the Asset Allocation Fund. During the past fiscal year, however, the Asset Allocation Fund had the opposite effect because it was invested mostly in an all-stock portfolio during a time in which stock markets were pummeled.
In the funds’ composite benchmarks, by contrast, the Asset Allocation Fund is assumed to maintain a static allocation of 65% stocks and 35% bonds. During the past year, as stock prices tumbled, the benchmarks’ static allocation outperformed the funds’ actively managed allocation.
The LifeStrategy Funds have an impressive long-term record
Over the past ten years, each of the four LifeStrategy Funds has offered a diversified portfolio with a recognizable risk profile that can help investors reach some of their long-term investment goals. For a decade, the funds have kept pace with or surpassed the results of their respective mutual fund peers. The funds also have closely tracked the returns of their respective benchmark indexes.
The success of these funds largely reflects the indexing expertise of Vanguard’s Quantitative Equity and Fixed Income Groups, which have been able to closely track the funds’ benchmarks. The funds’ long-term success also stems from the skill of the Asset Allocation Fund’s advisor, Mellon Capital Management. In addition, the funds’ exceptionally low expense ratios, compared with those of competing funds, have helped investors to retain a larger proportion of their returns.
Target and Actual Asset Allocations | | | | | | |
Percentages as of October 31, 2008 | | | | | | |
| | | | | Short-Term |
| | Stocks1 | | Bonds | Investments |
| Target | Actual | Target | Actual | Target | Actual |
LifeStrategy Income Fund | 20% | 31% | 60% | 49% | 20% | 20% |
LifeStrategy Conservative Growth Fund | 40 | 51 | 40 | 29 | 20 | 20 |
LifeStrategy Moderate Growth Fund | 60 | 71 | 40 | 29 | 0 | 0 |
LifeStrategy Growth Fund | 80 | 91 | 20 | 9 | 0 | 0 |
1 Actual international stock positions for the Income, Conservative Growth, Moderate Growth, and Growth Funds equaled 0%, 5%, 10%, and 15% of assets, respectively.
5
In uncertain times, diversification and long-term perspective are key
The past year’s turbulent market has left many investors anxious and concerned about their investments. That’s to be expected. But although such volatility can be jarring, it’s important for investors to maintain a long-term perspective. Sometimes, these unpredictable movements in the stock market are an unavoidable trade-off for the potential to earn long-term returns superior to those of lower-risk assets.
We have always counseled our investors to choose a broadly diversified portfolio of stocks and bonds in proportions consistent with their goals, risk tolerance, and time horizon, and then to try to stick with it. The LifeStrategy Funds can play an important role in such a portfolio by enhancing its diversification while helping to manage its risk.
Thank you for your ongoing confidence in Vanguard.
Sincerely,

F. William McNabb III
President and Chief Executive Officer
November 13, 2008
Total Returns | |
Ten Years Ended October 31, 2008 | |
| Average |
| Annual Return |
LifeStrategy Income Fund | 3.87% |
Income Composite Index | 4.08 |
Income Composite Average1 | 2.99 |
LifeStrategy Conservative Growth Fund | 3.33 |
Conservative Growth Composite Index | 3.46 |
Conservative Growth Composite Average1 | 2.77 |
LifeStrategy Moderate Growth Fund | 2.85 |
Moderate Growth Composite Index | 3.13 |
Moderate Growth Composite Average1 | 2.49 |
LifeStrategy Growth Fund | 2.05 |
Growth Composite Index | 2.31 |
Growth Composite Average1 | 2.08 |
The figures shown represent past performance, which is not a guarantee of future results. (Current performance may be lower or higher than the performance data cited. For performance data current to the most recent month-end, visit our website at www.vanguard.com/performance.) Note, too, that both investment returns and principal value can fluctuate widely, so an investor’s shares, when sold, could be worth more or less than their original cost.
1 Each average is a blended composite that weights the return of the average comparable mutual fund for each asset class in proportion to the target weighting of the appropriate LifeStrategy Fund. All together, the composites use returns for the average fixed income fund, the average general equity fund, the average international fund, and the average money market fund. These returns are derived from data provided by Lipper Inc.
6
LifeStrategy Income Fund
Fund Profile
As of October 31, 2008
Financial Attributes | |
| |
Yield1 | 4.6% |
Acquired Fund Fees and Expenses | |
(10/31/2007)2 | 0.24% |
Volatility Measures3 | |
| Fund Versus |
| Composite Index4 |
R-Squared | 0.98 |
Beta | 1.23 |
Allocation to Underlying Vanguard Funds | |
| |
Total Bond Market Index Fund | 49.3% |
Asset Allocation Fund | 25.8 |
Short-Term Investment-Grade Fund | 19.7 |
Total Stock Market Index Fund | 5.2 |
Equity Investment Focus

Fixed Income Investment Focus
Fund Asset Allocation

1 30-day SEC yield. See the Glossary.
2 This figure—drawn from the prospectus dated February 27, 2008—represents a weighted average of the annualized expense ratios and any transaction fees charged by the underlying mutual funds (the “acquired” funds) in which the LifeStrategy Income Fund invests. The LifeStrategy Income Fund does not charge any expenses or fees of its own. For the fiscal year ended October 31, 2008, the acquired fund fees and expenses figure was 0.22%.
3 For an explanation of R-squared, beta, and other terms used here, see the Glossary.
4 60% Lehman U.S. Aggregate Bond Index, 20% MSCI US Broad Market Index, and 20% Lehman 1–3 Year U.S. Credit Index.
7
LifeStrategy Income Fund
Performance Summary
All of the returns in this report represent past performance, which is not a guarantee of future results that may be achieved by the fund. (Current performance may be lower or higher than the performance data cited. For performance data current to the most recent month-end, visit our website at www.vanguard.com/performance.) Note, too, that both investment returns and principal value can fluctuate widely, so an investor’s shares, when sold, could be worth more or less than their original cost. The returns shown do not reflect taxes that a shareholder would pay on fund distributions or on the sale of fund shares.
Cumulative Performance: October 31, 1998–October 31, 2008
Initial Investment of $10,000
| | Average Annual Total Returns | Final Value |
| Periods Ended October 31, 2008 | of a $10,000 |
| One Year | Five Years | Ten Years | Investment |
LifeStrategy Income Fund1 | –12.29% | 2.46% | 3.87% | $14,619 |
Lehman U.S. Aggregate Bond Index | 0.30 | 3.48 | 5.00 | 16,290 |
Income Composite Index2 | –8.31 | 2.87 | 4.08 | 14,922 |
Income Composite Average3 | –13.28 | 1.40 | 2.99 | 13,420 |
1 Total returns do not include the account service fee that may be applicable to certain accounts with balances below $10,000.
2 60% Lehman U.S. Aggregate Bond Index, 20% Dow Jones Wilshire 5000 Index, and 20% Citigroup 3-Month Treasury Index through August 31, 2003; 60% Lehman U.S. Aggregate Bond Index, 20% Dow Jones Wilshire 5000 Index, and 20% Lehman 1–3 Year U.S. Credit Index through April 22, 2005; and 60% Lehman U.S. Aggregate Bond Index, 20% MSCI US Broad Market Index, and 20% Lehman 1–3 Year U.S. Credit Index thereafter.
3 A composite fund average weighted 60% average fixed income fund, 20% average general equity fund, and 20% average money market fund. Derived from data provided by Lipper Inc.
Note: See Financial Highlights table for dividend and capital gains information.
8
LifeStrategy Income Fund
Fiscal-Year Total Returns (%): October 31, 1998–October 31, 2008
| | | | Income |
Fiscal | Capital | Income | Total | Composite |
Year | Return | Return | Return | Index1 |
1999 | 0.1% | 5.2% | 5.3% | 6.1% |
2000 | 1.7 | 5.8 | 7.5 | 7.4 |
2001 | –0.7 | 5.5 | 4.8 | 3.7 |
2002 | –5.3 | 4.5 | –0.8 | 1.3 |
2003 | 6.1 | 3.8 | 9.9 | 8.2 |
2004 | 2.8 | 3.4 | 6.2 | 5.9 |
2005 | –0.1 | 3.5 | 3.4 | 3.0 |
2006 | 4.4 | 4.1 | 8.5 | 7.3 |
2007 | 3.9 | 4.2 | 8.1 | 7.3 |
2008 | –15.8 | 3.5 | –12.3 | –8.3 |
Average Annual Total Returns: Periods Ended September 30, 2008
This table presents average annual total returns through the latest calendar quarter—rather than through the end of the fiscal period. Securities and Exchange Commission rules require that we provide this information.
| | | | Ten Years |
| Inception Date | One Year | Five Years | Capital | Income | Total |
LifeStrategy Income Fund2 | 9/30/1994 | –4.80% | 4.09% | 0.36% | 4.40% | 4.76% |
1 60% Lehman U.S. Aggregate Bond Index, 20% Dow Jones Wilshire 5000 Index, and 20% Citigroup 3-Month Treasury Index through August 31, 2003; 60% Lehman U.S. Aggregate Bond Index, 20% Dow Jones Wilshire 5000 Index, and 20% Lehman 1–3 Year U.S. Credit Index through April 22, 2005; and 60% Lehman U.S. Aggregate Bond Index, 20% MSCI US Broad Market Index, and 20% Lehman 1–3 Year U.S. Credit Index thereafter.
2 Total returns do not include the account service fee that may be applicable to certain accounts with balances below $10,000.
Note: See Financial Highlights table for dividend and capital gains information.
9
LifeStrategy Income Fund
Financial Statements
Statement of Net Assets
As of October 31, 2008
The fund provides a complete list of its holdings four times in each fiscal year, at the quarter-ends. For the second and fourth fiscal quarters, the lists appear in the fund’s semiannual and annual reports to shareholders. For the first and third fiscal quarters, the fund files the lists with the Securities and Exchange Commission on Form N-Q. Shareholders can look up the fund’s Forms N-Q on the SEC’s website at www.sec.gov. Forms N-Q may also be reviewed and copied at the SEC’s Public Reference Room (see the back cover of this report for further information).
| | Market |
| | Value• |
| Shares | ($000) |
Investment Companies (100.2%) | | |
U.S. Stock Fund (5.2%) | | |
Vanguard Total Stock Market Index Fund Investor Shares | 3,649,464 | 85,434 |
| | |
Balanced Fund (25.8%) | | |
Vanguard Asset Allocation Fund Investor Shares | 21,340,287 | 423,605 |
| | |
Bond Fund (49.5%) | | |
Vanguard Total Bond Market Index Fund Investor Shares | 84,801,584 | 812,399 |
| | |
Short-Term Bond Fund (19.7%) | | |
Vanguard Short-Term Investment-Grade Fund Investor Shares | 33,467,353 | 323,629 |
Total Investment Companies (Cost $1,734,314) | | 1,645,067 |
Other Assets and Liabilities (–0.2%) | | |
Other Assets | | 10,124 |
Liabilities | | (13,075) |
| | (2,951) |
Net Assets (100%) | | |
Applicable to 135,428,847 outstanding $.001 par value shares of | | |
beneficial interest (unlimited authorization) | | 1,642,116 |
Net Asset Value Per Share | | $12.13 |
At October 31, 2008, net assets consisted of: | |
| Amount |
| ($000) |
Paid-in Capital | 1,748,415 |
Undistributed Net Investment Income | 6,098 |
Accumulated Net Realized Losses | (23,150) |
Unrealized Appreciation (Depreciation) | (89,247) |
Net Assets | 1,642,116 |
• | See Note A in Notes to Financial Statements. |
See accompanying Notes, which are an integral part of the Financial Statements.
10
LifeStrategy Income Fund
Statement of Operations
| Year Ended |
| October 31, 2008 |
| ($000) |
Investment Income | |
Income | |
Income Distributions Received | 75,606 |
Net Investment Income—Note B | 75,606 |
Realized Net Gain (Loss) on Investment Securities Sold | (22,889) |
Change in Unrealized Appreciation (Depreciation) of Investment Securities | (288,775) |
Net Increase (Decrease) in Net Assets Resulting from Operations | (236,058) |
See accompanying Notes, which are an integral part of the Financial Statements.
11
LifeStrategy Income Fund
Statement of Changes in Net Assets
| Year Ended October 31, |
| 2008 | 2007 |
| ($000) | ($000) |
Increase (Decrease) in Net Assets | | |
Operations | | |
Net Investment Income | 75,606 | 71,760 |
Realized Net Gain (Loss) | (22,889) | 4,081 |
Change in Unrealized Appreciation (Depreciation) | (288,775) | 61,643 |
Net Increase (Decrease) in Net Assets Resulting from Operations | (236,058) | 137,484 |
Distributions | | |
Net Investment Income | (77,544) | (70,696) |
Realized Capital Gain1 | (3,797) | (8,121) |
Total Distributions | (81,341) | (78,817) |
Capital Share Transactions | | |
Issued | 548,650 | 479,041 |
Issued in Lieu of Cash Distributions | 76,008 | 73,744 |
Redeemed | (550,179) | (392,021) |
Net Increase (Decrease) from Capital Share Transactions | 74,479 | 160,764 |
Total Increase (Decrease) | (242,920) | 219,431 |
Net Assets | | |
Beginning of Period | 1,885,036 | 1,665,605 |
End of Period2 | 1,642,116 | 1,885,036 |
1 Includes fiscal 2008 and 2007 short-term gain distributions totaling $1,964,000 and $3,344,000, respectively. Short-term gain distributions are treated as ordinary income dividends for tax purposes.
2 Net Assets—End of Period includes undistributed net investment income of $6,098,000 and $8,036,000.
See accompanying Notes, which are an integral part of the Financial Statements.
12
LifeStrategy Income Fund
Financial Highlights
For a Share Outstanding | Year Ended October 31, |
Throughout Each Period | 2008 | 2007 | 2006 | 2005 | 2004 |
Net Asset Value, Beginning of Period | $14.44 | $13.97 | $13.38 | $13.39 | $13.03 |
Investment Operations | | | | | |
Net Investment Income | .555 | .570 | .530 | .470 | .430 |
Capital Gain Distributions Received | — | — | — | — | .010 |
Net Realized and Unrealized Gain (Loss) | | | | | |
on Investments | (2.266) | .538 | .580 | (.020) | .350 |
Total from Investment Operations | (1.711) | 1.108 | 1.110 | .450 | .790 |
Distributions | | | | | |
Dividends from Net Investment Income | (.570) | (.570) | (.520) | (.460) | (.430) |
Distributions from Realized Capital Gains | (.029) | (.068) | — | — | — |
Total Distributions | (.599) | (.638) | (.520) | (.460) | (.430) |
Net Asset Value, End of Period | $12.13 | $14.44 | $13.97 | $13.38 | $13.39 |
| | | | | |
Total Return1 | –12.29% | 8.14% | 8.49% | 3.39% | 6.15% |
| | | | | |
Ratios/Supplemental Data | | | | | |
Net Assets, End of Period (Millions) | $1,642 | $1,885 | $1,666 | $1,752 | $1,611 |
Ratio of Total Expenses to | | | | | |
Average Net Assets | 0%2 | 0% | 0% | 0% | 0% |
Ratio of Net Investment Income to | | | | | |
Average Net Assets | 4.00% | 4.07% | 3.85% | 3.47% | 3.31% |
Portfolio Turnover Rate | 22% | 8% | 14% | 6% | 4% |
1 Total returns do not include the account service fee that may be applicable to certain accounts with balances below $10,000.
2 The acquired fund fees and expenses were 0.22%.
See accompanying Notes, which are an integral part of the Financial Statements.
13
LifeStrategy Income Fund
Notes to Financial Statements
Vanguard LifeStrategy Income Fund is registered under the Investment Company Act of 1940 as an open-end investment company, or mutual fund. The fund follows a balanced investment strategy by investing in selected Vanguard funds to achieve its targeted allocation of assets to U.S. stocks, international stocks, bonds, and short-term reserves.
A. The following significant accounting policies conform to generally accepted accounting principles for U.S. mutual funds. The fund consistently follows such policies in preparing its financial statements.
1. Security Valuation: Investments are valued at the net asset value of each underlying Vanguard fund determined as of the close of the New York Stock Exchange (generally 4 p.m., Eastern time) on the valuation date.
2. Federal Income Taxes: The fund intends to continue to qualify as a regulated investment company and distribute all of its taxable income. Management has analyzed the fund’s tax positions taken on federal income tax returns for all open tax years (tax years ended October 31, 2005–2008), and has concluded that no provision for federal income tax is required in the fund’s financial statements.
3. Distributions: Distributions to shareholders are recorded on the ex-dividend date.
4. Other: Income and capital gain distributions received are recorded on the ex-dividend date. Security transactions are accounted for on the date securities are bought or sold. Costs used to determine realized gains (losses) on the sale of investment securities are those of the specific securities sold.
B. Under a service agreement, The Vanguard Group furnishes investment advisory, corporate management, administrative, marketing, and distribution services to the fund. The service agreement provides that the fund’s expenses may be reduced or eliminated to the extent of savings realized by the Vanguard funds by the operation of the fund. Accordingly, all incremental expenses for services provided by Vanguard and all other expenses incurred by the fund during the year ended October 31, 2008, were borne by the funds in which the fund invests. The fund’s trustees and officers are also directors and officers of Vanguard and the funds in which the fund invests.
C. Distributions are determined on a tax basis and may differ from net investment income and realized capital gains for financial reporting purposes. Differences may be permanent or temporary. Permanent differences are reclassified among capital accounts in the financial statements to reflect their tax character. Temporary differences arise when certain items of income, expense, gain, or loss are recognized in different periods for financial statement and tax purposes; these differences will reverse at some time in the future. Differences in classification may also result from the treatment of short-term gains as ordinary income for tax purposes.
For tax purposes, at October 31, 2008, the fund had $6,009,000 of ordinary income available for distribution. The fund had available realized losses of $9,060,000 to offset future net capital gains through October 31, 2016.
At October 31, 2008, the cost of investment securities for tax purposes was $1,748,314,000. Net unrealized depreciation of investment securities for tax purposes was $103,247,000, consisting of unrealized gains of $1,614,000 on securities that had risen in value since their purchase and $104,861,000 in unrealized losses on securities that had fallen in value since their purchase.
D. During the year ended October 31, 2008, the fund purchased $482,893,000 of investment securities and sold $414,271,000 of investment securities, other than temporary cash investments.
14
LifeStrategy Income Fund
E. Capital shares issued and redeemed were:
| Year Ended October 31, |
| 2008 | 2007 |
| Shares | Shares |
| (000) | (000) |
Issued | 39,964 | 33,884 |
Issued in Lieu of Cash Distributions | 5,521 | 5,255 |
Redeemed | (40,641) | (27,763) |
Net Increase (Decrease) in Shares Outstanding | 4,844 | 11,376 |
F. In September 2006, the Financial Accounting Standards Board issued Statement of Financial Accounting Standards No. 157 (“FAS 157”), “Fair Value Measurements.” FAS 157 establishes a framework for measuring fair value and expands disclosures about fair value measurements in financial statements.
The various inputs that may be used to determine the value of the fund’s investments are summarized in three broad levels. The inputs or methodologies used for valuing securities are not necessarily an indication of the risk associated with investing in those securities.
Level 1—Quoted prices in active markets for identical securities.
Level 2—Other significant observable inputs (including quoted prices for similar securities, interest rates, prepayment speeds, credit risk, etc.).
Level 3—Significant unobservable inputs (including the fund’s own assumptions used to determine the fair value of investments).
At October 31, 2008, 100% of the fund’s investments were valued based on Level 1 inputs.
15
LifeStrategy Conservative Growth Fund
Fund Profile
As of October 31, 2008
Financial Attributes | |
| |
Yield1 | 4.2% |
Acquired Fund Fees and Expenses | |
(10/312007)2 | 0.24% |
Volatility Measures3 | |
| Fund Versus |
| Composite Index4 |
R-Squared | 0.99 |
Beta | 1.18 |
Allocation to Underlying Vanguard Funds | |
| |
Total Bond Market Index Fund | 29.4% |
Asset Allocation Fund | 25.4 |
Total Stock Market Index Fund | 20.5 |
Short-Term Investment-Grade Fund | 19.6 |
Total International Stock Index Fund | 5.1 |
Equity Investment Focus

Fixed Income Investment Focus

Fund Asset Allocation

1 30-day SEC yield. See the Glossary.
2 This figure—drawn from the prospectus dated February 27, 2008—represents a weighted average of the annualized expense ratios and any transaction fees charged by the underlying mutual funds (the “acquired” funds) in which the LifeStrategy Conservative Growth Fund invests. The LifeStrategy Conservative Growth Fund does not charge any expenses or fees of its own. For the fiscal year ended October 31, 2008, the acquired fund fees and expenses figure was 0.22%.
3 For an explanation of R-squared, beta, and other terms used here, see the Glossary.
4 40% Lehman U.S. Aggregate Bond Index, 35% MSCI US Broad Market Index, 20% Lehman 1–3 Year U.S. Credit Index, and 5% MSCI EAFE Index.
16
LifeStrategy Conservative Growth Fund
Performance Summary
All of the returns in this report represent past performance, which is not a guarantee of future results that may be achieved by the fund. (Current performance may be lower or higher than the performance data cited. For performance data current to the most recent month-end, visit our website at www.vanguard.com/performance.) Note, too, that both investment returns and principal value can fluctuate widely, so an investor’s shares, when sold, could be worth more or less than their original cost. The returns shown do not reflect taxes that a shareholder would pay on fund distributions or on the sale of fund shares.
Cumulative Performance: October 31, 1998–October 31, 2008
Initial Investment of $10,000
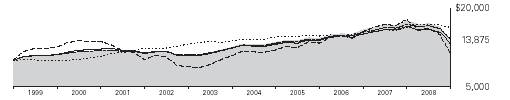
| Average Annual Total Returns | Final Value |
| Periods Ended October 31, 2008 | of a $10,000 |
| One Year | Five Years | Ten Years | Investment |
LifeStrategy Conservative Growth Fund1 | –20.71% | 2.14% | 3.33% | $13,875 |
Lehman U.S. Aggregate Bond Index | 0.30 | 3.48 | 5.00 | 16,290 |
Dow Jones Wilshire 5000 Index | –36.43 | 0.81 | 1.27 | 11,350 |
Conservative Growth Composite Index2 | –16.75 | 2.55 | 3.46 | 14,057 |
Conservative Growth Composite Average3 | –20.24 | 1.29 | 2.77 | 13,146 |
1 Total returns do not include the account service fee that may be applicable to certain accounts with balances below $10,000.
2 40% Lehman U.S. Aggregate Bond Index, 35% Dow Jones Wilshire 5000 Index, 20% Citigroup 3-Month Treasury Index, and 5% MSCI EAFE Index through August 31, 2003; 40% Lehman U.S. Aggregate Bond Index, 35% Dow Jones Wilshire 5000 Index, 20% Lehman 1–3 Year U.S. Credit Index, and 5% MSCI EAFE Index through April 22, 2005; and 40% Lehman U.S. Aggregate Bond Index, 35% MSCI US Broad Market Index, 20% Lehman 1–3 Year U.S. Credit Index, and 5% MSCI EAFE Index thereafter.
3 A composite fund average weighted 40% average fixed income fund, 35% average general equity fund, 20% average money market fund, and 5% average international fund. Derived from data provided by Lipper Inc.
Note: See Financial Highlights table for dividend and capital gains information.
17
LifeStrategy Conservative Growth Fund
Fiscal-Year Total Returns (%): October 31, 1998–October 31, 2008 |
| | | | Conservative |
| | | | Growth |
Fiscal | Capital | Income | Total | Composite |
Year | Return | Return | Return | Index1 |
1999 | 5.5% | 4.5% | 10.0% | 11.0% |
2000 | 2.5 | 4.8 | 7.3 | 7.0 |
2001 | –7.6 | 4.3 | –3.3 | –4.6 |
2002 | –7.7 | 3.6 | –4.1 | –2.5 |
2003 | 10.6 | 3.4 | 14.0 | 12.2 |
2004 | 4.7 | 2.8 | 7.5 | 7.2 |
2005 | 2.8 | 3.0 | 5.8 | 5.2 |
2006 | 7.8 | 3.4 | 11.2 | 10.1 |
2007 | 7.2 | 3.6 | 10.8 | 9.7 |
2008 | –23.5 | 2.8 | –20.7 | –16.8 |
Average Annual Total Returns: Periods Ended September 30, 2008
This table presents average annual total returns through the latest calendar quarter—rather than through the end of the fiscal period. Securities and Exchange Commission rules require that we provide this information.
| | | | Ten Years |
| Inception Date | One Year | Five Years | Capital | Income | Total |
LifeStrategy Conservative | | | | | | |
Growth Fund2 | 9/30/1994 | –10.44% | 4.81% | 1.09% | 3.68% | 4.77% |
1 40% Lehman U.S. Aggregate Bond Index, 35% Dow Jones Wilshire 5000 Index, 20% Citigroup 3-Month Treasury Index, and 5% MSCI EAFE Index through August 31, 2003; 40% Lehman U.S. Aggregate Bond Index, 35% Dow Jones Wilshire 5000 Index, 20% Lehman 1-3 Year U.S. Credit Index, and 5% MSCI EAFE Index through April 22, 2005; and 40% Lehman U.S. Aggregate Bond Index, 35% MSCI US Broad Market Index, 20% Lehman 1–3 Year U.S. Credit Index, and 5% MSCI EAFE Index thereafter.
2 Total returns do not include the account service fee that may be applicable to certain accounts with balances below $10,000.
Note: See Financial Highlights table for dividend and capital gains information.
18
LifeStrategy Conservative Growth Fund
Financial Statements
Statement of Net Assets
As of October 31, 2008
The fund provides a complete list of its holdings four times in each fiscal year, at the quarter-ends. For the second and fourth fiscal quarters, the lists appear in the fund’s semiannual and annual reports to shareholders. For the first and third fiscal quarters, the fund files the lists with the Securities and Exchange Commission on Form N-Q. Shareholders can look up the fund’s Forms N-Q on the SEC’s website at www.sec.gov. Forms N-Q may also be reviewed and copied at the SEC’s Public Reference Room (see the back cover of this report for further information).
| | Market |
| | Value• |
| Shares | ($000) |
Investment Companies (100.2%) | | |
U.S. Stock Fund (20.5%) | | |
Vanguard Total Stock Market Index Fund Investor Shares | 42,397,675 | 992,530 |
| | |
International Stock Fund (5.1%) | | |
Vanguard Total International Stock Index Fund | 22,639,653 | 248,357 |
| | |
Balanced Fund (25.5%) | | |
Vanguard Asset Allocation Fund Investor Shares | 62,131,595 | 1,233,312 |
| | |
Bond Fund (29.4%) | | |
Vanguard Total Bond Market Index Fund Investor Shares | 148,772,049 | 1,425,236 |
| | |
Short-Term Bond Fund (19.7%) | | |
Vanguard Short-Term Investment-Grade Fund Investor Shares | 98,363,116 | 951,171 |
Total Investment Companies (Cost $5,183,424) | | 4,850,606 |
Other Assets and Liabilities (–0.2%) | | |
Other Assets | | 32,071 |
Liabilities | | (39,616) |
| | (7,545) |
Net Assets (100%) | | |
Applicable to 359,805,795 outstanding $.001 par value shares of | | |
beneficial interest (unlimited authorization) | | 4,843,061 |
Net Asset Value Per Share | | $13.46 |
At October 31, 2008, net assets consisted of: | |
| Amount |
| ($000) |
Paid-in Capital | 5,265,854 |
Undistributed Net Investment Income | 12,983 |
Accumulated Net Realized Losses | (102,958) |
Unrealized Appreciation (Depreciation) | (332,818) |
Net Assets | 4,843,061 |
• | See Note A in Notes to Financial Statements. |
See accompanying Notes, which are an integral part of the Financial Statements.
19
LifeStrategy Conservative Growth Fund
Statement of Operations
| Year Ended |
| October 31, 2008 |
| ($000) |
Investment Income | |
Income | |
Income Distributions Received | 225,599 |
Net Investment Income—Note B | 225,599 |
Realized Net Gain (Loss) on Investment Securities Sold | (102,510) |
Change in Unrealized Appreciation (Depreciation) of Investment Securities | (1,479,399) |
Net Increase (Decrease) in Net Assets Resulting from Operations | (1,356,310) |
See accompanying Notes, which are an integral part of the Financial Statements.
20
LifeStrategy Conservative Growth Fund
Statement of Changes in Net Assets
| Year Ended October 31, |
| 2008 | 2007 |
| ($000) | ($000) |
Increase (Decrease) in Net Assets | | |
Operations | | |
Net Investment Income | 225,599 | 219,319 |
Realized Net Gain (Loss) | (102,510) | 8,734 |
Change in Unrealized Appreciation (Depreciation) | (1,479,399) | 424,584 |
Net Increase (Decrease) in Net Assets Resulting from Operations | (1,356,310) | 652,637 |
Distributions | | |
Net Investment Income | (235,505) | (213,606) |
Realized Capital Gain1 | (3,999) | — |
Total Distributions | (239,504) | (213,606) |
Capital Share Transactions | | |
Issued | 1,301,965 | 2,532,740 |
Issued in Lieu of Cash Distributions | 233,406 | 208,599 |
Redeemed | (2,140,116) | (1,463,169) |
Net Increase (Decrease) from Capital Share Transactions | (604,745) | 1,278,170 |
Total Increase (Decrease) | (2,200,559) | 1,717,201 |
Net Assets | | |
Beginning of Period | 7,043,620 | 5,326,419 |
End of Period2 | 4,843,061 | 7,043,620 |
1 Includes fiscal 2008 short-term gain distributions totaling $3,999,000. Short-term gain distributions are treated as ordinary income dividends for tax purposes.
2 Net Assets—End of Period includes undistributed net investment income of $12,983,000 and $22,889,000.
See accompanying Notes, which are an integral part of the Financial Statements.
21
LifeStrategy Conservative Growth Fund
Financial Highlights
For a Share Outstanding | Year Ended October 31, |
Throughout Each Period | 2008 | 2007 | 2006 | 2005 | 2004 |
Net Asset Value, Beginning of Period | $17.61 | $16.43 | $15.24 | $14.83 | $14.17 |
Investment Operations | | | | | |
Net Investment Income | .568 | .580 | .500 | .440 | .400 |
Capital Gain Distributions Received | — | — | — | — | .010 |
Net Realized and Unrealized Gain (Loss) | | | | | |
on Investments | (4.116) | 1.170 | 1.180 | .410 | .640 |
Total from Investment Operations | (3.548) | 1.750 | 1.680 | .850 | 1.050 |
Distributions | | | | | |
Dividends from Net Investment Income | (.592) | (.570) | (.490) | (.440) | (.390) |
Distributions from Realized Capital Gains | (.010) | — | — | — | — |
Total Distributions | (.602) | (.570) | (.490) | (.440) | (.390) |
Net Asset Value, End of Period | $13.46 | $17.61 | $16.43 | $15.24 | $14.83 |
| | | | | |
Total Return1 | –20.71% | 10.84% | 11.23% | 5.77% | 7.49% |
| | | | | |
Ratios/Supplemental Data | | | | | |
Net Assets, End of Period (Millions) | $4,843 | $7,044 | $5,326 | $4,079 | $3,463 |
Ratio of Total Expenses to | | | | | |
Average Net Assets | 0%2 | 0% | 0% | 0% | 0% |
Ratio of Net Investment Income to | | | | | |
Average Net Assets | 3.52% | 3.40% | 3.21% | 2.95% | 2.74% |
Portfolio Turnover Rate | 22% | 10% | 4% | 7% | 5% |
1 Total returns do not include the account service fee that may be applicable to certain accounts with balances below $10,000.
2 The acquired fund fees and expenses were 0.22%.
See accompanying Notes, which are an integral part of the Financial Statements.
22
LifeStrategy Conservative Growth Fund
Notes to Financial Statements
Vanguard LifeStrategy Conservative Growth Fund is registered under the Investment Company Act of 1940 as an open-end investment company, or mutual fund. The fund follows a balanced investment strategy by investing in selected Vanguard funds to achieve its targeted allocation of assets to U.S. stocks, international stocks, bonds, and short-term reserves.
A. The following significant accounting policies conform to generally accepted accounting principles for U.S. mutual funds. The fund consistently follows such policies in preparing its financial statements.
1. Security Valuation: Investments are valued at the net asset value of each underlying Vanguard fund determined as of the close of the New York Stock Exchange (generally 4 p.m., Eastern time) on the valuation date.
2. Federal Income Taxes: The fund intends to continue to qualify as a regulated investment company and distribute all of its taxable income. Management has analyzed the fund’s tax positions taken on federal income tax returns for all open tax years (tax years ended October 31, 2005–2008), and has concluded that no provision for federal income tax is required in the fund’s financial statements.
3. Distributions: Distributions to shareholders are recorded on the ex-dividend date.
4. Other: Income and capital gain distributions received are recorded on the ex-dividend date. Security transactions are accounted for on the date securities are bought or sold. Costs used to determine realized gains (losses) on the sale of investment securities are those of the specific securities sold.
B. Under a service agreement, The Vanguard Group furnishes investment advisory, corporate management, administrative, marketing, and distribution services to the fund. The service agreement provides that the fund’s expenses may be reduced or eliminated to the extent of savings realized by the Vanguard funds by the operation of the fund. Accordingly, all incremental expenses for services provided by Vanguard and all other expenses incurred by the fund during the year ended October 31, 2008, were borne by the funds in which the fund invests. The fund’s trustees and officers are also directors and officers of Vanguard and the funds in which the fund invests.
C. Distributions are determined on a tax basis and may differ from net investment income and realized capital gains for financial reporting purposes. Differences may be permanent or temporary. Permanent differences are reclassified among capital accounts in the financial statements to reflect their tax character. Temporary differences arise when certain items of income, expense, gain, or loss are recognized in different periods for financial statement and tax purposes; these differences will reverse at some time in the future. Differences in classification may also result from the treatment of short-term gains as ordinary income for tax purposes.
For tax purposes, at October 31, 2008, the fund had $12,843,000 of ordinary income available for distribution. The fund had available realized losses of $58,575,000 to offset future net capital gains through October 31, 2016.
At October 31, 2008, the cost of investment securities for tax purposes was $5,227,667,000. Net unrealized depreciation of investment securities for tax purposes was $377,061,000, consisting entirely of unrealized losses on securities that had fallen in value since their purchase.
D. During the year ended October 31, 2008, the fund purchased $1,404,758,000 of investment securities and sold $2,027,601,000 of investment securities, other than temporary cash investments.
23
LifeStrategy Conservative Growth Fund
E. Capital shares issued and redeemed were:
| Year Ended October 31, |
| 2008 | 2007 |
| Shares | Shares |
| (000) | (000) |
Issued | 80,105 | 149,769 |
Issued in Lieu of Cash Distributions | 14,274 | 12,327 |
Redeemed | (134,570) | (86,238) |
Net Increase (Decrease) in Shares Outstanding | (40,191) | 75,858 |
F. In September 2006, the Financial Accounting Standards Board issued Statement of Financial Accounting Standards No. 157 (“FAS 157”), “Fair Value Measurements.” FAS 157 establishes a framework for measuring fair value and expands disclosures about fair value measurements in financial statements.
The various inputs that may be used to determine the value of the fund’s investments are summarized in three broad levels. The inputs or methodologies used for valuing securities are not necessarily an indication of the risk associated with investing in those securities.
Level 1—Quoted prices in active markets for identical securities.
Level 2—Other significant observable inputs (including quoted prices for similar securities, interest rates, prepayment speeds, credit risk, etc.).
Level 3—Significant unobservable inputs (including the fund’s own assumptions used to determine the fair value of investments).
At October 31, 2008, 100% of the fund’s investments were valued based on Level 1 inputs.
24
LifeStrategy Moderate Growth Fund
Fund Profile
As of October 31, 2008
Financial Attributes | |
| |
Yield1 | 3.8% |
Acquired Fund Fees and Expenses | |
(10/31/2007)2 | 0.23% |
Volatility Measures3 | |
| Fund Versus |
| Composite Index4 |
R-Squared | 1.00 |
Beta | 1.12 |
Allocation to Underlying Vanguard Funds | |
| |
Total Stock Market Index Fund | 35.5% |
Total Bond Market Index Fund | 29.2 |
Asset Allocation Fund | 25.2 |
Total International Stock Index Fund | 10.1 |
Equity Investment Focus

Fixed Income Investment Focus

Fund Asset Allocation

1 30-day SEC yield. See the Glossary.
2 This figure—drawn from the prospectus dated February 27, 2008—represents a weighted average of the annualized expense ratios and any transaction fees charged by the underlying mutual funds (the “acquired” funds) in which the LifeStrategy Moderate Growth Fund invests. The LifeStrategy Moderate Growth Fund does not charge any expenses or fees of its own. For the fiscal year ended October 31, 2008, the acquired fund fees and expense figure was 0.22%.
3 For an explanation of R-squared, beta, and other terms used here, see the Glossary.
4 50% MSCI US Broad Market Index, 40% Lehman U.S. Aggregate Bond Index, and 10% MSCI EAFE Index.
25
LifeStrategy Moderate Growth Fund
Performance Summary
All of the returns in this report represent past performance, which is not a guarantee of future results that may be achieved by the fund. (Current performance may be lower or higher than the performance data cited. For performance data current to the most recent month-end, visit our website at www.vanguard.com/performance.) Note, too, that both investment returns and principal value can fluctuate widely, so an investor’s shares, when sold, could be worth more or less than their original cost. The returns shown do not reflect taxes that a shareholder would pay on fund distributions or on the sale of fund shares.
Cumulative Performance: October 31, 1998–October 31, 2008
Initial Investment of $10,000

| Average Annual Total Returns | Final Value |
| Periods Ended October 31, 2008 | of a $10,000 |
| One Year | Five Years | Ten Years | Investment |
LifeStrategy Moderate Growth Fund1 | –27.69% | 2.04% | 2.85% | $13,239 |
Dow Jones Wilshire 5000 Index | –36.43 | 0.81 | 1.27 | 11,350 |
Lehman U.S. Aggregate Bond Index | 0.30 | 3.48 | 5.00 | 16,290 |
Moderate Growth Composite Index2 | –24.33 | 2.37 | 3.13 | 13,609 |
Moderate Growth Composite Average3 | –28.64 | 0.80 | 2.49 | 12,783 |
1 Total returns do not include the account service fee that may be applicable to certain accounts with balances below $10,000.
2 50% Dow Jones Wilshire 5000 Index, 40% Lehman U.S. Aggregate Bond Index, and 10% MSCI EAFE Index through April 22, 2005; and 50% MSCI US Broad Market Index, 40% Lehman U.S. Aggregate Bond Index, and 10% MSCI EAFE Index thereafter.
3 A composite fund average weighted 50% average general equity fund, 40% average fixed income fund, and 10% average international fund. Derived from data provided by Lipper Inc.
Note: See Financial Highlights table for dividend and capital gains information.
26
LifeStrategy Moderate Growth Fund
Fiscal-Year Total Returns (%): October 31, 1998–October 31, 2008 |
| | | | Moderate |
| | | | Growth |
Fiscal | Capital | Income | Total | Composite |
Year | Return | Return | Return | Index1 |
1999 | 10.7% | 3.6% | 14.3% | 15.0% |
2000 | 3.8 | 3.4 | 7.2 | 6.9 |
2001 | –13.7 | 3.0 | –10.7 | –10.9 |
2002 | –10.1 | 2.8 | –7.3 | –5.5 |
2003 | 15.0 | 3.1 | 18.1 | 16.9 |
2004 | 6.9 | 2.5 | 9.4 | 9.1 |
2005 | 5.4 | 2.6 | 8.0 | 7.5 |
2006 | 11.1 | 3.0 | 14.1 | 13.0 |
2007 | 10.6 | 3.0 | 13.6 | 12.1 |
2008 | –29.9 | 2.2 | –27.7 | –24.3 |
Average Annual Total Returns: Periods Ended September 30, 2008
This table presents average annual total returns through the latest calendar quarter—rather than through the end of the fiscal period. Securities and Exchange Commission rules require that we provide this information.
| | | | Ten Years |
| Inception Date | One Year | Five Years | Capital | Income | Total |
LifeStrategy Moderate Growth Fund2 | 9/30/1994 | –15.04% | 5.72% | 1.87% | 2.96% | 4.83% |
1 50% Dow Jones Wilshire 5000 Index, 40% Lehman U.S. Aggregate Bond Index, and 10% MSCI EAFE Index through April 22, 2005; and 50% MSCI US Broad Market Index, 40% Lehman U.S. Aggregate Bond Index, and 10% MSCI EAFE Index thereafter.
2 Total returns do not include the account service fee that may be applicable to certain accounts with balances below $10,000.
Note: See Financial Highlights table for dividend and capital gains information.
27
LifeStrategy Moderate Growth Fund
Financial Statements
Statement of Net Assets
As of October 31, 2008
The fund provides a complete list of its holdings four times in each fiscal year, at the quarter-ends. For the second and fourth fiscal quarters, the lists appear in the fund’s semiannual and annual reports to shareholders. For the first and third fiscal quarters, the fund files the lists with the Securities and Exchange Commission on Form N-Q. Shareholders can look up the fund’s Forms N-Q on the SEC’s website at www.sec.gov. Forms N-Q may also be reviewed and copied at the SEC’s Public Reference Room (see the back cover of this report for further information).
| | Market |
| | Value• |
| Shares | ($000) |
Investment Companies (100.0%) | | |
U.S. Stock Fund (35.5%) | | |
Vanguard Total Stock Market Index Fund Investor Shares | 112,204,235 | 2,626,701 |
| | |
International Stock Fund (10.1%) | | |
Vanguard Total International Stock Index Fund | 68,194,267 | 748,091 |
| | |
Balanced Fund (25.2%) | | |
Vanguard Asset Allocation Fund Investor Shares | 94,175,452 | 1,869,383 |
| | |
Bond Fund (29.2%) | | |
Vanguard Total Bond Market Index Fund Investor Shares | 226,104,611 | 2,166,082 |
Total Investment Companies (Cost $7,743,843) | | 7,410,257 |
Other Assets and Liabilities (0.0%) | | |
Other Assets | | 59,396 |
Liabilities | | (62,074) |
| | (2,678) |
Net Assets (100%) | | |
Applicable to 475,933,059 outstanding $.001 par value shares of | | |
beneficial interest (unlimited authorization) | | 7,407,579 |
Net Asset Value Per Share | | $15.56 |
At October 31, 2008, net assets consisted of: | |
| Amount |
| ($000) |
Paid-in Capital | 7,816,138 |
Undistributed Net Investment Income | 60,912 |
Accumulated Net Realized Losses | (135,885) |
Unrealized Appreciation (Depreciation) | (333,586) |
Net Assets | 7,407,579 |
• | See Note A in Notes to Financial Statements. |
See accompanying Notes, which are an integral part of the Financial Statements.
28
LifeStrategy Moderate Growth Fund
Statement of Operations
| Year Ended |
| October 31, 2008 |
| ($000) |
Investment Income | |
Income | |
Income Distributions Received | 300,354 |
Net Investment Income—Note B | 300,354 |
Realized Net Gain (Loss) on Investment Securities Sold | (135,696) |
Change in Unrealized Appreciation (Depreciation) of Investment Securities | (3,162,602) |
Net Increase (Decrease) in Net Assets Resulting from Operations | (2,997,944) |
See accompanying Notes, which are an integral part of the Financial Statements.
29
LifeStrategy Moderate Growth Fund
Statement of Changes in Net Assets
| Year Ended October 31, |
| 2008 | 2007 |
| ($000) | ($000) |
Increase (Decrease) in Net Assets | | |
Operations | | |
Net Investment Income | 300,354 | 293,198 |
Realized Net Gain (Loss) | (135,696) | 18,635 |
Change in Unrealized Appreciation (Depreciation) | (3,162,602) | 1,006,051 |
Net Increase (Decrease) in Net Assets Resulting from Operations | (2,997,944) | 1,317,884 |
Distributions | | |
Net Investment Income | (317,770) | (274,151) |
Realized Capital Gain1 | (12,214) | — |
Total Distributions | (329,984) | (274,151) |
Capital Share Transactions | | |
Issued | 1,751,499 | 2,350,057 |
Issued in Lieu of Cash Distributions | 325,407 | 270,796 |
Redeemed | (2,613,668) | (1,855,708) |
Net Increase (Decrease) from Capital Share Transactions | (536,762) | 765,145 |
Total Increase (Decrease) | (3,864,690) | 1,808,878 |
Net Assets | | |
Beginning of Period | 11,272,269 | 9,463,391 |
End of Period2 | 7,407,579 | 11,272,269 |
1 Includes fiscal 2008 short-term gain distributions totaling $4,580,000. Short-term gain distributions are treated as ordinary income dividends for tax purposes.
2 Net Assets—End of Period includes undistributed net investment income of $60,912,000 and $78,328,000.
See accompanying Notes, which are an integral part of the Financial Statements.
30
LifeStrategy Moderate Growth Fund
Financial Highlights
For a Share Outstanding | Year Ended October 31, |
Throughout Each Period | 2008 | 2007 | 2006 | 2005 | 2004 |
Net Asset Value, Beginning of Period | $22.21 | $20.09 | $18.09 | $17.17 | $16.06 |
Investment Operations | | | | | |
Net Investment Income | .607 | .580 | .510 | .470 | .390 |
Capital Gain Distributions Received | — | — | — | — | .030 |
Net Realized and Unrealized Gain (Loss) | | | | | |
on Investments | (6.606) | 2.100 | 1.990 | .890 | 1.070 |
Total from Investment Operations | (5.999) | 2.680 | 2.500 | 1.360 | 1.490 |
Distributions | | | | | |
Dividends from Net Investment Income | (.627) | (.560) | (.500) | (.440) | (.380) |
Distributions from Realized Capital Gains | (.024) | — | — | — | — |
Total Distributions | (.651) | (.560) | (.500) | (.440) | (.380) |
Net Asset Value, End of Period | $15.56 | $22.21 | $20.09 | $18.09 | $17.17 |
| | | | | |
Total Return1 | –27.69% | 13.55% | 14.09% | 7.97% | 9.37% |
| | | | | |
Ratios/Supplemental Data | | | | | |
Net Assets, End of Period (Millions) | $7,408 | $11,272 | $9,463 | $7,778 | $6,596 |
Ratio of Total Expenses to | | | | | |
Average Net Assets | 0%2 | 0% | 0% | 0% | 0% |
Ratio of Net Investment Income to | | | | | |
Average Net Assets | 2.98% | 2.81% | 2.70% | 2.61% | 2.36% |
Portfolio Turnover Rate | 18% | 7% | 8% | 8% | 6% |
1 Total returns do not include the account service fee that may be applicable to certain accounts with balances below $10,000.
2 The acquired fund fees and expenses were 0.22%.
See accompanying Notes, which are an integral part of the Financial Statements.
31
LifeStrategy Moderate Growth Fund
Notes to Financial Statements
Vanguard LifeStrategy Moderate Growth Fund is registered under the Investment Company Act of 1940 as an open-end investment company, or mutual fund. The fund follows a balanced investment strategy by investing in selected Vanguard funds to achieve its targeted allocation of assets to U.S. stocks, international stocks, bonds, and short-term reserves.
A. The following significant accounting policies conform to generally accepted accounting principles for U.S. mutual funds. The fund consistently follows such policies in preparing its financial statements.
1. Security Valuation: Investments are valued at the net asset value of each underlying Vanguard fund determined as of the close of the New York Stock Exchange (generally 4 p.m., Eastern time) on the valuation date.
2. Federal Income Taxes: The fund intends to continue to qualify as a regulated investment company and distribute all of its taxable income. Management has analyzed the fund’s tax positions taken on federal income tax returns for all open tax years (tax years ended October 31, 2005–2008), and has concluded that no provision for federal income tax is required in the fund’s financial statements.
3. Distributions: Distributions to shareholders are recorded on the ex-dividend date.
4. Other: Income and capital gain distributions received are recorded on the ex-dividend date. Security transactions are accounted for on the date securities are bought or sold. Costs used to determine realized gains (losses) on the sale of investment securities are those of the specific securities sold.
B. Under a service agreement, The Vanguard Group furnishes investment advisory, corporate management, administrative, marketing, and distribution services to the fund. The service agreement provides that the fund’s expenses may be reduced or eliminated to the extent of savings realized by the Vanguard funds by the operation of the fund. Accordingly, all incremental expenses for services provided by Vanguard and all other expenses incurred by the fund during the year ended October 31, 2008, were borne by the funds in which the fund invests. The fund’s trustees and officers are also directors and officers of Vanguard and the funds in which the fund invests.
C. Distributions are determined on a tax basis and may differ from net investment income and realized capital gains for financial reporting purposes. Differences may be permanent or temporary. Permanent differences are reclassified among capital accounts in the financial statements to reflect their tax character. Temporary differences arise when certain items of income, expense, gain, or loss are recognized in different periods for financial statement and tax purposes; these differences will reverse at some time in the future. Differences in classification may also result from the treatment of short-term gains as ordinary income for tax purposes.
For tax purposes, at October 31, 2008, the fund had $60,723,000 of ordinary income available for distribution. The fund had available realized losses of $45,187,000 to offset future net capital gains through October 31, 2016.
At October 31, 2008, the cost of investment securities for tax purposes was $7,834,352,000. Net unrealized depreciation of investment securities for tax purposes was $424,095,000, consisting of unrealized gains of $34,183,000 on securities that had risen in value since their purchase and $458,278,000 in unrealized losses on securities that had fallen in value since their purchase.
D. During the year ended October 31, 2008, the fund purchased $1,854,179,000 of investment securities and sold $2,427,669,000 of investment securities, other than temporary cash investments.
32
LifeStrategy Moderate Growth Fund
E. Capital shares issued and redeemed were:
| Year Ended October 31, |
| 2008 | 2007 |
| Shares | Shares |
| (000) | (000) |
Issued | 87,414 | 111,993 |
Issued in Lieu of Cash Distributions | 15,908 | 13,031 |
Redeemed | (134,904) | (88,517) |
Net Increase (Decrease) in Shares Outstanding | (31,582) | 36,507 |
F. In September 2006, the Financial Accounting Standards Board issued Statement of Financial Accounting Standards No. 157 (“FAS 157”), “Fair Value Measurements.” FAS 157 establishes a framework for measuring fair value and expands disclosures about fair value measurements in financial statements.
The various inputs that may be used to determine the value of the fund’s investments are summarized in three broad levels. The inputs or methodologies used for valuing securities are not necessarily an indication of the risk associated with investing in those securities.
Level 1—Quoted prices in active markets for identical securities.
Level 2—Other significant observable inputs (including quoted prices for similar securities, interest rates, prepayment speeds, credit risk, etc.).
Level 3—Significant unobservable inputs (including the fund’s own assumptions used to determine the fair value of investments).
At October 31, 2008, 100% of the fund’s investments were valued based on Level 1 inputs.
33
LifeStrategy Growth Fund
Fund Profile
As of October 31, 2008
Financial Attributes | |
| |
Yield1 | 3.4% |
Acquired Fund Fees and Expenses | |
(10/31/2007)2 | 0.23% |
Volatility Measures3 | |
| Fund Versus |
| Composite Index4 |
R-Squared | 1.00 |
Beta | 1.10 |
Allocation to Underlying Vanguard Funds | |
| |
Total Stock Market Index Fund | 50.6% |
Asset Allocation Fund | 25.2 |
Total International Stock Index Fund | 14.7 |
Total Bond Market Index Fund | 9.5 |
Equity Investment Focus

Fixed Income Investment Focus

Fund Asset Allocation

1 30-day SEC yield. See the Glossary.
2 This figure—drawn from the prospectus dated February 27, 2008—represents a weighted average of the annualized expense ratios and any transaction fees charged by the underlying mutual funds (the “acquired” funds) in which the LifeStrategy Growth Fund invests. The LifeStrategy Growth Fund does not charge any expenses or fees of its own. For the fiscal year ended October 31, 2008, the acquired fund fees and expense figure was 0.21%.
3 For an explanation of R-squared, beta, and other terms used here, see the Glossary.
4 65% MSCI US Broad Market Index, 20% Lehman U.S. Aggregate Bond Index, and 15% MSCI EAFE Index.
34
LifeStrategy Growth Fund
Performance Summary
All of the returns in this report represent past performance, which is not a guarantee of future results that may be achieved by the fund. (Current performance may be lower or higher than the performance data cited. For performance data current to the most recent month-end, visit our website at www.vanguard.com/performance.) Note, too, that both investment returns and principal value can fluctuate widely, so an investor’s shares, when sold, could be worth more or less than their original cost. The returns shown do not reflect taxes that a shareholder would pay on fund distributions or on the sale of fund shares.
Cumulative Performance: October 31, 1998–October 31, 2008
Initial Investment of $10,000

| Average Annual Total Returns | Final Value |
| Periods Ended October 31, 2008 | of a $10,000 |
| One Year | Five Years | Ten Years | Investment |
LifeStrategy Growth Fund1 | –34.98% | 1.55% | 2.05% | $12,252 |
Dow Jones Wilshire 5000 Index | –36.43 | 0.81 | 1.27 | 11,350 |
Growth Composite Index2 | –31.65 | 1.90 | 2.31 | 12,562 |
Growth Composite Average3 | –34.68 | 0.54 | 2.08 | 12,284 |
1 Total returns do not include the account service fee that may be applicable to certain accounts with balances below $10,000.
2 65% Dow Jones Wilshire 5000 Index, 20% Lehman U.S. Aggregate Bond Index, and 15% MSCI EAFE Index through April 22, 2005; and 65% MSCI US Broad Market Index, 20% Lehman U.S. Aggregate Bond Index, and 15% MSCI EAFE Index thereafter.
3 A composite fund average weighted 65% average general equity fund, 20% average fixed income fund, and 15% average international fund. Derived from data provided by Lipper Inc.
Note: See Financial Highlights table for dividend and capital gains information.
35
LifeStrategy Growth Fund
Fiscal-Year Total Returns (%): October 31, 1998–October 31, 2008 |
| | | | Moderate |
| | | | Growth |
Fiscal | Capital | Income | Total | Composite |
Year | Return | Return | Return | Index1 |
1999 | 16.6% | 2.8% | 19.4% | 20.0% |
2000 | 4.3 | 2.5 | 6.8 | 6.4 |
2001 | –20.1 | 1.9 | –18.2 | –18.4 |
2002 | –12.7 | 1.8 | –10.9 | –9.4 |
2003 | 19.9 | 2.2 | 22.1 | 20.9 |
2004 | 8.8 | 1.9 | 10.7 | 10.4 |
2005 | 8.1 | 2.2 | 10.3 | 9.8 |
2006 | 14.5 | 2.4 | 16.9 | 15.8 |
2007 | 13.9 | 2.4 | 16.3 | 14.5 |
2008 | –36.5 | 1.5 | –35.0 | –31.7 |
Average Annual Total Returns: Periods Ended September 30, 2008
This table presents average annual total returns through the latest calendar quarter—rather than through the end of the fiscal period. Securities and Exchange Commission rules require that we provide this information.
| | | | | | Ten Years |
| Inception Date | One Year | Five Years | Capital | Income | Total |
LifeStrategy Growth Fund2 | 9/30/1994 | –20.15% | 6.35% | 2.40% | 2.21% | 4.61% |
1 65% Dow Jones Wilshire 5000 Index, 20% Lehman U.S Aggregate Bond Index, and 15% MSCI EAFE Index through
April 22, 2005; and 65% MSCI US Broad Market Index, 20% Lehman U.S. Aggregate Bond Index, and 15% MSCI EAFE Index thereafter.
2 Total returns do not include the account service fee that may be applicable to certain accounts with balances below $10,000.
Note: See Financial Highlights table for dividend and capital gains information.
36
LifeStrategy Growth Fund
Financial Statements
Statement of Net Assets
As of October 31, 2008
The fund provides a complete list of its holdings four times in each fiscal year, at the quarter-ends. For the second and fourth fiscal quarters, the lists appear in the fund’s semiannual and annual reports to shareholders. For the first and third fiscal quarters, the fund files the lists with the Securities and Exchange Commission on Form N-Q. Shareholders can look up the fund’s Forms N-Q on the SEC’s website at www.sec.gov. Forms N-Q may also be reviewed and copied at the SEC’s Public Reference Room (see the back cover of this report for further information).
| | Market |
| | Value• |
| Shares | ($000) |
Investment Companies (99.9%) | | |
U.S. Stock Fund (50.5%) | | |
Vanguard Total Stock Market Index Fund Investor Shares | 135,243,034 | 3,166,039 |
| | |
International Stock Fund (14.7%) | | |
Vanguard Total International Stock Index Fund | 83,816,416 | 919,466 |
| | |
Balanced Fund (25.2%) | | |
Vanguard Asset Allocation Fund Investor Shares | 79,545,468 | 1,578,977 |
| | |
Bond Fund (9.5%) | | |
Vanguard Total Bond Market Index Fund Investor Shares | 62,333,882 | 597,159 |
| | |
Money Market Fund (0.0%) | | |
1 Vanguard Market Liquidity Fund, 2.217% | 576,775 | 577 |
Total Investment Companies (Cost $6,732,964) | | 6,262,218 |
Other Assets and Liabilities (0.1%) | | |
Other Assets | | 22,439 |
Liabilities | | (18,118) |
| | 4,321 |
Net Assets (100%) | | |
Applicable to 371,644,748 outstanding $.001 par value shares of | | |
beneficial interest (unlimited authorization) | | 6,266,539 |
Net Asset Value Per Share | | $16.86 |
At October 31, 2008, net assets consisted of: | |
| Amount |
| ($000) |
Paid-in Capital | 6,797,493 |
Undistributed Net Investment Income | 32,082 |
Accumulated Net Realized Losses | (92,290) |
Unrealized Appreciation (Depreciation) | (470,746) |
Net Assets | 6,266,539 |
• | See Note A in Notes to Financial Statements. |
1 Affiliated money market fund available only to Vanguard funds and certain trusts and accounts managed by Vanguard. Rate shown is the 7-day yield.
See accompanying Notes, which are an integral part of the Financial Statements.
37
LifeStrategy Growth Fund
Statement of Operations
| Year Ended |
| October 31, 2008 |
| ($000) |
Investment Income | |
Income | |
Income Distributions Received | 219,594 |
Net Investment Income—Note B | 219,594 |
Realized Net Gain (Loss) on Investment Securities Sold | (78,943) |
Change in Unrealized Appreciation (Depreciation) of Investment Securities | (3,636,859) |
Net Increase (Decrease) in Net Assets Resulting from Operations | (3,496,208) |
See accompanying Notes, which are an integral part of the Financial Statements.
38
LifeStrategy Growth Fund
Statement of Changes in Net Assets
| Year Ended October 31, |
| 2008 | 2007 |
| ($000) | ($000) |
Increase (Decrease) in Net Assets | | |
Operations | | |
Net Investment Income | 219,594 | 203,521 |
Realized Net Gain (Loss) | (78,943) | 7,256 |
Change in Unrealized Appreciation (Depreciation) | (3,636,859) | 1,205,218 |
Net Increase (Decrease) in Net Assets Resulting from Operations | (3,496,208) | 1,415,995 |
Distributions | | |
Net Investment Income | (226,065) | (194,349) |
Realized Capital Gain | — | — |
Total Distributions | (226,065) | (194,349) |
Capital Share Transactions | | |
Issued | 1,375,071 | 1,973,518 |
Issued in Lieu of Cash Distributions | 223,367 | 192,075 |
Redeemed | (1,981,689) | (1,437,481) |
Net Increase (Decrease) from Capital Share Transactions | (383,251) | 728,112 |
Total Increase (Decrease) | (4,105,524) | 1,949,758 |
Net Assets | | |
Beginning of Period | 10,372,063 | 8,422,305 |
End of Period1 | 6,266,539 | 10,372,063 |
1 Net Assets—End of Period includes undistributed net investment income of $32,082,000 and $38,553,000.
See accompanying Notes, which are an integral part of the Financial Statements.
39
LifeStrategy Growth Fund
Financial Highlights
For a Share Outstanding | Year Ended October 31, |
Throughout Each Period | 2008 | 2007 | 2006 | 2005 | 2004 |
Net Asset Value, Beginning of Period | $26.56 | $23.32 | $20.37 | $18.84 | $17.32 |
Investment Operations | | | | | |
Net Investment Income | .571 | .540 | .450 | .420 | .320 |
Capital Gain Distributions Received | — | — | — | — | .160 |
Net Realized and Unrealized Gain (Loss) | | | | | |
on Investments | (9.690) | 3.220 | 2.950 | 1.510 | 1.360 |
Total from Investment Operations | (9.119) | 3.760 | 3.400 | 1.930 | 1.840 |
Distributions | | | | | |
Dividends from Net Investment Income | (.581) | (.520) | (.450) | (.400) | (.320) |
Distributions from Realized Capital Gains | — | — | — | — | — |
Total Distributions | (.581) | (.520) | (.450) | (.400) | (.320) |
Net Asset Value, End of Period | $16.86 | $26.56 | $23.32 | $20.37 | $18.84 |
| | | | | |
Total Return1 | –34.98% | 16.32% | 16.94% | 10.30% | 10.70% |
| | | | | |
Ratios/Supplemental Data | | | | | |
Net Assets, End of Period (Millions) | $6,267 | $10,372 | $8,422 | $6,605 | $5,535 |
Ratio of Total Expenses to Average Net Assets | 0%2 | 0% | 0% | 0% | 0% |
Ratio of Net Investment Income to | | | | | |
Average Net Assets | 2.47% | 2.15% | 2.07% | 2.09% | 1.79% |
Portfolio Turnover Rate | 10% | 4% | 3% | 4% | 5% |
1 Total returns do not include the account service fee that may be applicable to certain accounts with balances below $10,000.
2 The acquired fund fees and expenses were 0.21%.
See accompanying Notes, which are an integral part of the Financial Statements.
40
LifeStrategy Growth Fund
Notes to Financial Statements
Vanguard LifeStrategy Growth Fund is registered under the Investment Company Act of 1940 as an open-end investment company, or mutual fund. The fund follows a balanced investment strategy by investing in selected Vanguard funds to achieve its targeted allocation of assets to U.S. stocks, international stocks, bonds, and short-term reserves.
A. The following significant accounting policies conform to generally accepted accounting principles for U.S. mutual funds. The fund consistently follows such policies in preparing its financial statements.
1. Security Valuation: Investments are valued at the net asset value of each underlying Vanguard fund determined as of the close of the New York Stock Exchange (generally 4 p.m., Eastern time) on the valuation date.
2. Federal Income Taxes: The fund intends to continue to qualify as a regulated investment company and distribute all of its taxable income. Management has analyzed the fund’s tax positions taken on federal income tax returns for all open tax years (tax years ended October 31, 2005–2008), and has concluded that no provision for federal income tax is required in the fund’s financial statements.
3. Distributions: Distributions to shareholders are recorded on the ex-dividend date.
4. Other: Income and capital gain distributions received are recorded on the ex-dividend date. Security transactions are accounted for on the date securities are bought or sold. Costs used to determine realized gains (losses) on the sale of investment securities are those of the specific securities sold.
B. Under a service agreement, The Vanguard Group furnishes investment advisory, corporate management, administrative, marketing, and distribution services to the fund. The service agreement provides that the fund’s expenses may be reduced or eliminated to the extent of savings realized by the Vanguard funds by the operation of the fund. Accordingly, all incremental expenses for services provided by Vanguard and all other expenses incurred by the fund during the year ended October 31, 2008, were borne by the funds in which the fund invests. The fund’s trustees and officers are also directors and officers of Vanguard and the funds in which the fund invests.
C. Distributions are determined on a tax basis and may differ from net investment income and realized capital gains for financial reporting purposes. Differences may be permanent or temporary. Permanent differences are reclassified among capital accounts in the financial statements to reflect their tax character. Temporary differences arise when certain items of income, expense, gain, or loss are recognized in different periods for financial statement and tax purposes; these differences will reverse at some time in the future. Differences in classification may also result from the treatment of short-term gains as ordinary income for tax purposes.
For tax purposes, at October 31, 2008, the fund had $30,872,000 of ordinary income available for distribution. The fund had available realized losses of $58,877,000 to offset future net capital gains of $9,185,000 through October 31, 2010, $2,953,000 through October 31, 2011, and $46,739,000 through October 31, 2016.
At October 31, 2008, the cost of investment securities for tax purposes was $6,765,168,000. Net unrealized depreciation of investment securities for tax purposes was $502,950,000, consisting of unrealized gains of $15,250,000 on securities that had risen in value since their purchase and $518,200,000 in unrealized losses on securities that had fallen in value since their purchase.
D. During the year ended October 31, 2008, the fund purchased $880,355,000 of investment securities and sold $1,273,691,000 of investment securities, other than temporary cash investments.
41
LifeStrategy Growth Fund
E. Capital shares issued and redeemed were:
| Year Ended October 31, |
| 2008 | 2007 |
| Shares | Shares |
| (000) | (000) |
Issued | 60,151 | 79,793 |
Issued in Lieu of Cash Distributions | 9,297 | 7,827 |
Redeemed | (88,378) | (58,141) |
Net Increase (Decrease) in Shares Outstanding | (18,930) | 29,479 |
F. In September 2006, the Financial Accounting Standards Board issued Statement of Financial Accounting Standards No. 157 (“FAS 157”), “Fair Value Measurements.” FAS 157 establishes a framework for measuring fair value and expands disclosures about fair value measurements in financial statements.
The various inputs that may be used to determine the value of the fund’s investments are summarized in three broad levels. The inputs or methodologies used for valuing securities are not necessarily an indication of the risk associated with investing in those securities.
Level 1—Quoted prices in active markets for identical securities.
Level 2—Other significant observable inputs (including quoted prices for similar securities, interest rates, prepayment speeds, credit risk, etc.).
Level 3—Significant unobservable inputs (including the fund’s own assumptions used to determine the fair value of investments).
At October 31, 2008, 100% of the fund’s investments were valued based on Level 1 inputs.
42
Report of Independent Registered Public Accounting Firm
To the Trustees of Vanguard STAR Funds and the Shareholders of Vanguard LifeStrategy Income Fund, Vanguard LifeStrategy Conservative Growth Fund, Vanguard LifeStrategy Moderate Growth Fund and Vanguard LifeStrategy Growth Fund:
In our opinion, the accompanying statements of net assets and the related statements of operations and of changes in net assets and the financial highlights present fairly, in all material respects, the financial position of Vanguard LifeStrategy Income Fund, Vanguard LifeStrategy Conservative Growth Fund, Vanguard LifeStrategy Moderate Growth Fund and Vanguard LifeStrategy Growth Fund (separate portfolios of Vanguard STAR Funds, hereafter referred to as the “Funds”) at October 31, 2008, the results of each of their operations for the year then ended, the changes in each of their net assets for each of the two years in the period then ended and the financial highlights for each of the five years in the period then ended, in conformity with accounting principles generally accepted in the United States of America. These financial statements and financial highlights (hereafter referred to as “financial statements”) are the responsibility of the Funds’ management; our responsibility is to express an opinion on these financial statements based on our audits. We conducted our audits of these financial statements in accordance with the standards of the Public Company Accounting Oversight Board (United States). Those standards require that we plan and perform the audit to obtain reasonable assurance about whether the financial statements are free of material misstatement. An audit includes examining, on a test basis, evidence supporting the amounts and disclosures in the financial statements, assessing the accounting principles used and significant estimates made by management, and evaluating the overall financial statement presentation. We believe that our audits, which included confirmation of securities at October 31, 2008 by agreement to the underlying ownership records for the Vanguard funds, provide a reasonable basis for our opinion.
PricewaterhouseCoopers LLP
Philadelphia, Pennsylvania
December 19, 2008
43
Special 2008 tax information (unaudited) for Vanguard LifeStrategy Funds |
This information for the fiscal year ended October 31, 2008, is included pursuant to provisions of the Internal Revenue Code.
The funds distributed capital gain dividends (from net long-term capital gains) to shareholders during the fiscal year as follows:
| Capital Gains |
LifeStrategy Fund | ($000) |
Income | 1,833 |
Conservative Growth | — |
Moderate Growth | 7,634 |
Growth | — |
For nonresident alien shareholders, 100% of short-term capital gain dividends distributed by the LifeStrategy Income Fund, the LifeStrategy Conservative Growth Fund, and the LifeStrategy Moderate Growth Fund are qualified short-term capital gains.
The funds distributed qualified dividend income to shareholders during the fiscal year as follows:
| Qualified Dividend Income |
LifeStrategy Fund | ($000) |
Income | 9,728 |
Conservative Growth | 60,099 |
Moderate Growth | 134,115 |
Growth | 154,936 |
For corporate shareholders, the percentage of investment income (dividend income plus short-term gains, if any) that qualifies for the dividends-received deduction is as follows:
LifeStrategy Fund | Percentage |
Income | 12.6% |
Conservative Growth | 22.9 |
Moderate Growth | 36.0 |
Growth | 54.9 |
44
Your Fund’s After-Tax Returns
This table presents returns for your fund both before and after taxes. The after-tax returns are shown in two ways: (1) assuming that an investor owned the fund during the entire period and paid taxes on the fund’s distributions, and (2) assuming that an investor paid taxes on the fund’s distributions and sold all shares at the end of each period.
Calculations are based on the highest individual federal income tax and capital gains tax rates in effect at the times of the distributions and the hypothetical sales. State and local taxes were not considered. After-tax returns reflect any qualified dividend income, using actual prior-year figures and estimates for 2008. (In the example, returns after the sale of fund shares may be higher than those assuming no sale. This occurs when the sale would have produced a capital loss. The calculation assumes that the investor received a tax deduction for the loss.)
Please note that your actual after-tax returns will depend on your tax situation and may differ from those shown. Also note that if you own the fund in a tax-deferred account, such as an individual retirement account or a 401(k) plan, this information does not apply to you. Such accounts are not subject to current taxes.
Finally, keep in mind that a fund’s performance—whether before or after taxes—does not guarantee future results.
Average Annual Total Returns: Vanguard LifeStrategy Funds1 |
Periods Ended October 31, 2008 | | | |
| One | Five | Ten |
| Year | Years | Years |
LifeStrategy Income Fund | | | |
Returns Before Taxes | –12.29% | 2.46% | 3.87% |
Returns After Taxes on Distributions | –13.49 | 1.20 | 2.19 |
Returns After Taxes on Distributions and Sale of Fund Shares | –7.77 | 1.46 | 2.33 |
| | | |
LifeStrategy Conservative Growth Fund | | | |
Returns Before Taxes | –20.71% | 2.14% | 3.33% |
Returns After Taxes on Distributions | –21.58 | 1.18 | 1.96 |
Returns After Taxes on Distributions and Sale of Fund Shares | –13.18 | 1.40 | 2.09 |
| | | |
LifeStrategy Moderate Growth Fund | | | |
Returns Before Taxes | –27.69% | 2.04% | 2.85% |
Returns After Taxes on Distributions | –28.29 | 1.32 | 1.78 |
Returns After Taxes on Distributions and Sale of Fund Shares | –17.63 | 1.50 | 1.89 |
| | | |
LifeStrategy Growth Fund | | | |
Returns Before Taxes | –34.98% | 1.55% | 2.05% |
Returns After Taxes on Distributions | –35.31 | 1.10 | 1.31 |
Returns After Taxes on Distributions and Sale of Fund Shares | –22.34 | 1.28 | 1.43 |
1 Total returns do not include the account service fee that may be applicable to certain accounts with balances below $10,000.
45
About Your Fund’s Expenses
As a shareholder of the fund, you incur ongoing costs, which include costs for portfolio management, administrative services, and shareholder reports (like this one), among others. Operating expenses, which are deducted from a fund’s gross income, directly reduce the investment return of the fund.
A typical fund’s expenses are expressed as a percentage of its average net assets. The LifeStrategy Funds have no direct expenses, but each fund bears its proportionate share of the expenses of the underlying funds in which it invests. These indirect expenses make up the fund’s acquired fund fees and expenses, also expressed as a percentage of average net assets.
The following examples are intended to help you understand the ongoing costs (in dollars) of investing in your fund and to compare these costs with those of other mutual funds. The examples are based on an investment of $1,000 made at the beginning of the period shown and held for the entire period. The costs are calculated using each fund’s acquired fund fees and expenses.
The accompanying table illustrates your fund’s costs in two ways:
• Based on actual fund return. This section helps you to estimate the actual expenses that you paid over the period. The “Ending Account Value” shown is derived from the fund’s actual return, and the third column shows the dollar amount that would have been paid by an investor who started with $1,000 in the fund. You may use the information here, together with the amount you invested, to estimate the expenses that you paid over the period.
To do so, simply divide your account value by $1,000 (for example, an $8,600 account value divided by $1,000 = 8.6), then multiply the result by the number given for your fund under the heading “Expenses Paid During Period.”
• Based on hypothetical 5% yearly return. This section is intended to help you compare your fund’s costs with those of other mutual funds. It assumes that the fund had a yearly return of 5% before expenses, but that the expense ratio is unchanged. In this case—because the return used is not the fund’s actual return—the results do not apply to your investment. The example is useful in making comparisons because the Securities and Exchange Commission requires all mutual funds to calculate expenses based on a 5% return. You can assess your fund’s costs by comparing this hypothetical example with the hypothetical examples that appear in shareholder reports of other funds.
46
Six Months Ended October 31, 2008 | | | |
| Beginning | Ending | Expenses |
| Account Value | Account Value | Paid During |
| 4/30/2008 | 10/31/2008 | Period1 |
Based on Actual Fund Return | | | |
LifeStrategy Income Fund | $1,000.00 | $878.94 | $1.04 |
LifeStrategy Conservative Growth Fund | 1,000.00 | 817.05 | 1.01 |
LifeStrategy Moderate Growth Fund | 1,000.00 | 763.88 | 0.98 |
LifeStrategy Growth Fund | 1,000.00 | 707.67 | 0.90 |
Based on Hypothetical 5% Yearly Return | | | |
LifeStrategy Income Fund | $1,000.00 | $1,024.10 | $1.12 |
LifeStrategy Conservative Growth Fund | 1,000.00 | 1,024.10 | 1.12 |
LifeStrategy Moderate Growth Fund | 1,000.00 | 1,024.10 | 1.12 |
LifeStrategy Growth Fund | 1,000.00 | 1,024.15 | 1.07 |
Note that the expenses shown in the table are meant to highlight and help you compare ongoing costs only and do not reflect transaction costs incurred by the fund for buying and selling securities. Further, the expenses do not include the account service fee described in the prospectus. If such a fee were applied to your account, your costs would be higher. Your fund does not charge transaction fees, such as purchase or redemption fees, nor does it carry a “sales load.”
The calculations assume no shares were bought or sold during the period. Your actual costs may have been higher or lower, depending on the amount of your investment and the timing of any purchases or redemptions.
You can find more information about the fund’s expenses, including annual expense ratios, in the Financial Statements section of this report. For additional information on operating expenses and other shareholder costs, please refer to your fund’s current prospectus.
1 These calculations are based on acquired fund fees and expenses for the LifeStrategy Funds. The LifeStrategy Funds’ annualized expense figures for the period shown are (in order as listed from top to bottom above) 0.22%, 0.22%, 0.22%, and 0.21%. The dollar amounts shown as “Expenses Paid” are equal to the annualized expense figures, multiplied by the average account value over the period, multiplied by the number of days in the most recent six-month period, then divided by the number of days in the most recent 12-month period.
47
Glossary
Acquired Fund Fees and Expenses. Funds that invest in other Vanguard funds incur no direct expenses, but they do bear proportionate shares of the operating, administrative, and advisory expenses of the underlying funds, and they must pay any fees charged by those funds. The figure for acquired fund fees and expenses represents a weighted average of these underlying costs. Acquired is a term that the Securities and Exchange Commission applies to any mutual fund whose shares are owned by another fund.
Beta. A measure of the magnitude of a fund’s past share-price fluctuations in relation to the ups and downs of a given market index. The index is assigned a beta of 1.00. Compared with a given index, a fund with a beta of 1.20 typically would have seen its share price rise or fall by 12% when the index rose or fell by 10%. For this report, beta is based on returns over the past 36 months for both the fund and the index. Note that a fund’s beta should be reviewed in conjunction with its R-squared (see definition). The lower the R-squared, the less correlation there is between the fund and the index, and the less reliable beta is as an indicator of volatility.
Expense Ratio. The percentage of a fund’s average net assets used to pay its annual administrative and advisory expenses. These expenses directly reduce returns to investors.
Inception Date. The date on which the assets of a fund (or one of its share classes) are first invested in accordance with the fund’s investment objective. For funds with a subscription period, the inception date is the day after that period ends. Investment performance is measured from the inception date.
R-Squared. A measure of how much of a fund’s past returns can be explained by the returns from the market in general, as measured by a given index. If a fund’s total returns were precisely synchronized with an index’s returns, its R-squared would be 1.00. If the fund’s returns bore no relationship to the index’s returns, its R-squared would be 0. For this report, R-squared is based on returns over the past 36 months for both the fund and the index.
Yield. A fund’s 30-day SEC yield is derived using a formula specified by the U.S. Securities and Exchange Commission. Under the formula, data related to the fund’s security holdings in the previous 30 days are used to calculate the fund’s hypothetical net income for that period, which is then annualized and divided by the fund’s estimated average net assets over the calculation period. For the purposes of this calculation, a security’s income is based on its current market yield to maturity (in the case of bonds) or its projected dividend yield (for stocks). Because the SEC yield represents hypothetical annualized income, it will differ—at times significantly—from the fund’s actual experience. As a result, the fund’s income distributions may be higher or lower than implied by the SEC yield.
48
This page intentionally left blank.
This page intentionally left blank.
This page intentionally left blank.
The People Who Govern Your Fund
The trustees of your mutual fund are there to see that the fund is operated and managed in your best interests since, as a shareholder, you are a part owner of the fund. Your fund’s trustees also serve on the board of directors of The Vanguard Group, Inc., which is owned by the Vanguard funds and provides services to them on an at-cost basis.
A majority of Vanguard’s board members are independent, meaning that they have no affiliation with Vanguard or the funds they oversee, apart from the sizable personal investments they have made as private individuals.
Our independent board members bring distinguished backgrounds in business, academia, and public service to their task of working with Vanguard officers to establish the policies and oversee the activities of the funds. Among board members’ responsibilities are selecting investment advisors for the funds; monitoring fund operations, performance, and costs; reviewing contracts; nominating and selecting new trustees/directors; and electing Vanguard officers.
Each trustee serves a fund until its termination; or until the trustee’s retirement, resignation, or death; or otherwise as specified in the fund’s organizational documents. Any trustee may be removed at a shareholders’ meeting by a vote representing two-thirds of the net asset value of all shares of the fund together with shares of other Vanguard funds organized within the same trust. The table on these two pages shows information for each trustee and executive officer of the fund. The mailing address of the trustees and officers is P.O. Box 876, Valley Forge, PA 19482.
Chairman of the Board and Trustee |
| |
John J. Brennan1 | |
Born 1954 | Principal Occupation(s) During the Past Five Years: Chairman of the Board and Director/ |
Trustee Since May 1987; | Trustee of The Vanguard Group, Inc., and of each of the investment companies served |
Chairman of the Board | by The Vanguard Group; Chief Executive Officer and President of The Vanguard Group |
156 Vanguard Funds Overseen | and of each of the investment companies served by The Vanguard Group (1996–2008). |
| |
Independent Trustees | |
| |
Charles D. Ellis | |
Born 1937 | Principal Occupation(s) During the Past Five Years: Applecore Partners (pro bono ventures |
Trustee Since January 2001 | in education); Senior Advisor to Greenwich Associates (international business strategy |
156 Vanguard Funds Overseen | consulting); Successor Trustee of Yale University; Overseer of the Stern School of Business |
| at New York University; Trustee of the Whitehead Institute for Biomedical Research. |
| |
Emerson U. Fullwood | |
Born 1948 | Principal Occupation(s) During the Past Five Years: Executive Chief Staff and Marketing |
Trustee Since January 2008 | Officer for North America since 2004 and Corporate Vice President of Xerox Corporation |
156 Vanguard Funds Overseen | (photocopiers and printers); Director of SPX Corporation (multi-industry manufacturing), |
| of the United Way of Rochester, and of the Boy Scouts of America. |
| |
Rajiv L. Gupta | |
Born 1945 | Principal Occupation(s) During the Past Five Years: Chairman, President, and |
Trustee Since December 20012 | Chief Executive Officer of Rohm and Haas Co. (chemicals); Board Member of |
156 Vanguard Funds Overseen | the American Chemistry Council; Director of Tyco International, Ltd. (diversified |
| manufacturing and services), since 2005. |
| |
Amy Gutmann | |
Born 1949 | Principal Occupation(s) During the Past Five Years: President of the University of |
Trustee Since June 2006 | Pennsylvania since 2004; Professor in the School of Arts and Sciences, Annenberg School |
156 Vanguard Funds Overseen | for Communication, and Graduate School of Education of the University of Pennsylvania |
| since 2004; Provost (2001–2004) and Laurance S. Rockefeller Professor of Politics and |
| the University Center for Human Values (1990–2004), Princeton University; Director of |
| Carnegie Corporation of New York since 2005 and of Schuylkill River Development |
| Corporation and Greater Philadelphia Chamber of Commerce since 2004; Trustee of |
| the National Constitution Center since 2007. |
JoAnn Heffernan Heisen | |
Born 1950 | Principal Occupation(s) During the Past Five Years: Corporate Vice President and |
Trustee Since July 1998 | Chief Global Diversity Officer since 2006, Vice President and Chief Information |
156 Vanguard Funds Overseen | Officer (1997–2005), and Member of the Executive Committee of Johnson & |
| Johnson (pharmaceuticals/consumer products); Director of the University Medical |
| Center at Princeton and Women’s Research and Education Institute. |
| |
André F. Perold | |
Born 1952 | Principal Occupation(s) During the Past Five Years: George Gund Professor of Finance |
Trustee Since December 2004 | and Banking, Harvard Business School; Senior Associate Dean and Director of Faculty |
156 Vanguard Funds Overseen | Recruiting, Harvard Business School; Director and Chairman of UNX, Inc. (equities |
| trading firm); Chair of the Investment Committee of HighVista Strategies LLC (private |
| investment firm) since 2005. |
| |
Alfred M. Rankin, Jr. | |
Born 1941 | Principal Occupation(s) During the Past Five Years: Chairman, President, Chief Executive |
Trustee Since January 1993 | Officer, and Director of NACCO Industries, Inc. (forklift trucks/housewares/lignite); Director |
156 Vanguard Funds Overseen | of Goodrich Corporation (industrial products/aircraft systems and services). |
| |
J. Lawrence Wilson | |
Born 1936 | Principal Occupation(s) During the Past Five Years: Retired Chairman and Chief Executive |
Trustee Since April 1985 | Officer of Rohm and Haas Co. (chemicals); Director of Cummins Inc. (diesel engines) and |
156 Vanguard Funds Overseen | AmerisourceBergen Corp. (pharmaceutical distribution); Trustee of Vanderbilt University |
| and of Culver Educational Foundation. |
| |
Executive Officers1 | |
| |
Thomas J. Higgins | |
Born 1957 | Principal Occupation(s) During the Past Five Years: Principal of The Vanguard Group, Inc.; |
Chief Financial Officer | Treasurer of each of the investment companies served by The Vanguard Group; Chief |
Since September 2008 | Financial Officer of each of the investment companies served by The Vanguard |
Treasurer Since July 1998 | Group since 2008. |
156 Vanguard Funds Overseen | |
| |
F. William McNabb III | |
Born 1957 | Principal Occupation(s) During the Past Five Years: Chief Executive Officer, Director, |
Chief Executive Officer | and President of The Vanguard Group, Inc., since 2008; Chief Executive Officer and |
Since August 31, 2008 | President of each of the investment companies served by The Vanguard Group since |
President Since March 2008 | 2008; Director of Vanguard Marketing Corporation; Managing Director of The Vanguard |
156 Vanguard Funds Overseen | Group (1995–2008). |
| |
Heidi Stam | |
Born 1956 | Principal Occupation(s) During the Past Five Years: Managing Director of The Vanguard |
Secretary Since July 2005 | Group, Inc., since 2006; General Counsel of The Vanguard Group since 2005; Secretary of |
156 Vanguard Funds Overseen | The Vanguard Group and of each of the investment companies served by The Vanguard |
| Group since 2005; Director and Senior Vice President of Vanguard Marketing Corporation |
| since 2005; Principal of The Vanguard Group (1997–2006). |
Vanguard Senior Management Team | | | |
| | | | |
R. Gregory Barton | Kathleen C. Gubanich | Michael S. Miller | Ralph K. Packard | George U. Sauter |
Mortimer J. Buckley | Paul A. Heller | James M. Norris | Glenn W. Reed | |
Founder |
|
John C. Bogle |
Chairman and Chief Executive Officer, 1974–1996 |
1 | These individuals are “interested persons” as defined in the Investment Company Act of 1940. |
2 | December 2002 for Vanguard Equity Income Fund, Vanguard Growth Equity Fund, the Vanguard Municipal Bond Funds, and the Vanguard State Tax-Exempt Funds. |
More information about the trustees is in the Statement of Additional Information, available from The Vanguard Group.
| 
|
| P.O. Box 2600 |
| Valley Forge, PA 19482-2600 |
Connect with Vanguard® > www.vanguard.com
Fund Information > 800-662-7447 | All comparative mutual fund data are from Lipper Inc. |
| or Morningstar, Inc., unless otherwise noted. |
Direct Investor Account Services > 800-662-2739 | |
| |
Institutional Investor Services > 800-523-1036 | You can obtain a free copy of Vanguard’s proxy voting |
| guidelines by visiting our website, www.vanguard.com, |
Text Telephone for People | and searching for “proxy voting guidelines,” or by |
With Hearing Impairment > 800-952-3335 | calling Vanguard at 800-662-2739. The guidelines are |
| also available from the SEC’s website, www.sec.gov. |
| In addition, you may obtain a free report on how your |
| fund voted the proxies for securities it owned during |
This material may be used in conjunction | the 12 months ended June 30. To get the report, visit |
with the offering of shares of any Vanguard | either www.vanguard.com or www.sec.gov. |
fund only if preceded or accompanied by | |
the fund’s current prospectus. | |
| You can review and copy information about your fund |
| at the SEC’s Public Reference Room in Washington, D.C. |
The funds or securities referred to herein are not | To find out more about this public service, call the SEC |
sponsored, endorsed, or promoted by MSCI, and MSCI | at 202-551-8090. Information about your fund is also |
bears no liability with respect to any such funds or | available on the SEC’s website, and you can receive |
securities. For any such funds or securities, the | copies of this information, for a fee, by sending a |
prospectus or the Statement of Additional Information | request in either of two ways: via e-mail addressed to |
contains a more detailed description of the limited | publicinfo@sec.gov or via regular mail addressed to the |
relationship MSCI has with The Vanguard Group and | Public Reference Section, Securities and Exchange |
any related funds. | Commission, Washington, DC 20549-0102. |
| |
Russell is a trademark of The Frank Russell Company. | |
| |
| |
| |
| |
| |
| |
| |
| |
| |
| © 2008 The Vanguard Group, Inc. |
| All rights reserved. |
| Vanguard Marketing Corporation, Distributor. |
| |
| Q880 122008 |

> | For the fiscal year ended October 31, 2008, the Total International Stock Index Fund posted a –48.57% return. |
> | The fund closely tracked its benchmark, and its return was near the average for its mutual fund peers. |
> | A spreading credit crisis and fears of a global economic slowdown drove down stock values worldwide. The U.S. dollar’s rise against most currencies further lowered returns for U.S. investors. |
Contents | |
| |
Your Fund’s Total Returns | 1 |
President’s Letter | 2 |
Fund Profile | 8 |
Performance Summary | 9 |
Financial Statements | 11 |
Your Fund’s After-Tax Returns | 43 |
About Your Fund’s Expenses | 44 |
Trustees Approve Advisory Arrangement | 46 |
Glossary | 47 |

Please note: The opinions expressed in this report are just that—informed opinions. They should not be considered promises or advice. Also, please keep in mind that the information and opinions cover the period through the date on the front of this report. Of course, the risks of investing in your fund are spelled out in the prospectus.
Your Fund’s Total Returns
Fiscal Year Ended October 31, 2008 | | |
| Ticker | Total |
| Symbol | Returns |
Vanguard Total International Stock Index Fund | VGTSX | –48.57% |
Total International Composite Index1 | | –48.72 |
Average International Fund2 | | –47.97 |
Your Fund’s Performance at a Glance | | | | |
October 31, 2007–October 31, 2008 | | | | |
| | | Distributions Per Share |
| Starting | Ending | Income | Capital |
| Share Price | Share Price | Dividends | Gains |
Vanguard Total International Stock Index Fund | $21.89 | $10.97 | $0.522 | $0.000 |
1 Consists of the MSCI Europe Index (55%), the MSCI Pacific Index (27%), and the MSCI Emerging Markets Index (18%) as of October 31, 2008.
2 Derived from data provided by Lipper Inc.
1

President’s Letter
Dear Shareholder,
After several years of generous returns, international markets dropped sharply during the past 12 months as the global credit crisis caused investors to pull back from riskier securities such as stocks. The bear market spared no country, sending the Total International Stock Index Fund down –48.57%.
The fund, which previously was included in shareholder reports encompassing other Vanguard international equity index funds, is now issuing its own report because it modified its investment policies in August. As a result of the change, the Total International Stock Index Fund can invest both directly in securities of European, Pacific, and emerging markets and in the three Vanguard index funds that track those markets.
This policy change gives Vanguard greater flexibility in managing the portfolio, but it does not alter the fund’s objective and risks. The fund will continue seeking to track the performance of the Total International Composite Index.
During the 2008 fiscal year, the fund’s return slightly exceeded that of its target benchmark. This was a result of short-term discrepancies that arose from fair-value pricing, which is described more fully later in this letter. The fund’s return was slightly lower than the average for its peer group.
2
For global markets, the year started well but ended dismally
Global stock markets started the 12-month period near all-time highs but then declined sharply, laid low by the financial crisis that originated in the fixed income markets. The descent traced a series of jagged ups and downs. During the week ended October 10, for example, the U.S. stock market returned about –18%. When Wall Street opened the following Monday, stocks surged, returning more than 10% over the next six-and-a-half hours.
For the full 12 months, the broad U.S. stock market returned –36.43%; international stocks returned –48.27%. The pain was especially acute in emerging markets—among the strongest performers in recent years—as investors became increasingly risk-averse.
Bond market averages masked disparate returns
The broad U.S. taxable bond market registered an unremarkable return of 0.30% for the 12 months, but by its own typically sedate standards, the dislocations were extreme. The strong performance of U.S. Treasury and government securities was offset by double-digit declines in the corporate bond market. These dynamics led to unusually large differences between the yields of Treasuries and their corresponding private-sector securities—both a reflection and a cause of the credit market’s distress. Despite their generally high creditworthiness, municipal bonds also fell in price, with the broad tax-exempt market registering a 12-month return of –3.30%.
Market Barometer | |
| Average Annual Total Returns |
| Periods Ended October 31, 2008 |
| One Year | Three Years | Five Years |
Stocks | | | |
MSCI All Country World Index ex USA (International) | –48.27% | –3.93% | 5.05% |
Russell 1000 Index (Large-caps) | –36.80 | –5.51 | 0.37 |
Russell 2000 Index (Small-caps) | –34.16 | –4.79 | 1.57 |
Dow Jones Wilshire 5000 Index (Entire market) | –36.43 | –5.10 | 0.81 |
| | | |
Bonds | | | |
Lehman U.S. Aggregate Bond Index (Broad taxable market) | 0.30% | 3.60% | 3.48% |
Lehman Municipal Bond Index | –3.30 | 1.71 | 2.73 |
Citigroup 3-Month Treasury Bill Index | 2.31 | 3.93 | 3.10 |
| | | |
CPI | | | |
Consumer Price Index | 3.66% | 2.83% | 3.20% |
3
The U.S. Federal Reserve Board responded to the turmoil with new lending programs and a dramatic easing of monetary policy. Over the full 12 months, the Fed reduced its target for the federal funds rate from 4.50% to 1.00%.
Investors turned bearish in every corner of the globe
The fund’s holdings in the developed European markets returned –47.80% for the fiscal period. Each of the region’s three largest markets, the United Kingdom, France, and Germany, which together represent more than half of the index, posted similar losses. Switzerland (–31.5%) was the only market that didn’t fall by at least a third.
Owing to the distress in credit markets, the worst damage came from financials (–60%), the largest European sector, which represented, on average, about a quarter of the region’s market value. As in the United States, banks suffered from exposure to problematic debt securities linked to falling U.S. home values.
Most other industries in the region fell between –33% (consumer staples) and –56% (industrials). The sector that suffered least was health care (–19%). For U.S.-based investors, losses were amplified by the 10% decline of the euro and the 25% decline of the British pound against the U.S. dollar during the fiscal year.
Expense Ratios1 | | |
Your Fund Compared With Its Peer Group | | |
| | Average |
| | International |
| Fund | Fund2 |
Total International Stock Index Fund | 0.27% | 1.48% |
1 This figure—drawn from the prospectus dated October 14, 2008—represents the fund’s total operating expenses, which include a weighted average of the annualized expense ratios and any transaction fees charged by the mutual funds in which the Total International Stock Index Fund invests (“acquired fund fees and expenses”). For the fiscal year ended October 31, 2008, the fund’s total operating expenses represented 0.28% of average net assets.
2 Derived from data provided by Lipper Inc.
4
Declines were also severe for the Pacific-region markets
The developed markets in the Pacific region returned –42.71% for the period. The Japanese market, by far the largest in this group, retreated about –37% in U.S. dollar terms (and the news was even worse for Japanese investors, as the yen rose nearly 17% against the dollar during the period).
The other major Pacific markets—Australia, Hong Kong, and Singapore—lost more than half their value. As with other markets around the world, financial stocks (–50%), the region’s largest sector, were the leading cause of the losses.
Other sectors in the region faced similar headwinds. In terms of a negative impact on the fund, industrials (–47%) and materials (–54%) were most prominent. Consumer staples (–27%), typically less volatile during bear markets, and health care (–21%) were least affected by the downdraft.
Emerging markets suffered the steepest declines of all
True to their more-volatile reputation, emerging markets lost the most among international stocks during the fiscal year. It might be said that they had farther to fall, given their stellar gains in recent years. The fund’s emerging-markets
Total Returns | |
Ten Years Ended October 31, 2008 | |
| Average |
| Annual Return |
Total International Stock Index Fund | 2.49% |
Total International Composite Index1 | 2.39 |
Average International Fund2 | 1.55 |
The figures shown represent past performance, which is not a guarantee of future results. (Current performance may be lower or higher than the performance data cited. For performance data current to the most recent month-end, visit our website at www.vanguard.com/performance.) Note, too, that both investment returns and principal value can fluctuate widely, so an investor’s shares, when sold, could be worth more or less than their original cost.
1 Consists of the MSCI Europe Index (55%), the MSCI Pacific Index (27%), and the MSCI Emerging Markets Index (18%) as of October 31, 2008.
2 Derived from data provided by Lipper Inc.
5
holdings returned –56.66%, with South Korea (–60%) and China (–68%) exerting the steepest downward pull. But no country was spared outsized losses; other examples include Brazil (–54%), Taiwan (–49%), India (–62%), and Russia (–61%).
A quarter of the fund’s loss in emerging markets came from troubled financial stocks, as commercial banks, brokerages, and other financial firms grappled with the unprecedented credit squeeze. The energy sector (–57%), including coal companies and those active in oil and gas exploration and refining in Brazil, China, and Russia, was hit by rapidly falling energy prices as commodity markets anticipated slowing energy demand worldwide.
The fund’s long-term performance is in line with that of its target
As the table on page 5 shows, the Total International Stock Index Fund has met its objective of tracking its benchmark over the past decade. Its returns have also surpassed the average annual return for competing international funds.
Like the fund’s fiscal 2008 return, its ten-year average is slightly above that of the target index. These differences are largely the result of fair-value pricing, a practice that allows the fund to calculate its net asset value based on real-time developments not yet reflected in the closing prices of markets in different time zones. When fair-value pricing is used at the beginning or end of a reporting period, it may cause a temporary divergence between the fund’s return and that of its target index. This discrepancy corrects itself when market prices reflect fair value, usually the next day.
Other factors can also affect the fund’s tracking of its benchmark. The most significant one, of course, is cost: An index fund incurs operating costs, which are reflected in its return—and are absent from the return of a benchmark.
Vanguard’s Quantitative Equity Group has managed index funds for more than three decades. Its disciplined execution of your fund’s indexing mandate, combined with the fund’s extremely low costs, can help you execute a long-term strategy of seeking to capture nearly all of the return from international markets.
6
International investing still offers useful diversification
After enjoying several years of strong returns with few bumps along the way, investors in international stocks were harshly reminded in the past year that a bear market can come at any time—and once in a while it can come with unusual severity. Such was the case with the credit crisis of 2008, with repercussions that unsettled even the most seasoned investors.
Nevertheless, the dramatic increase of international commerce in recent years, particularly in less-developed nations, continues to offer long-term growth possibilities for patient investors.
That is why it is important to have a well-thought-out investment strategy based on a diversified mix of stock, bond, and money market mutual funds that fits your goals, time horizon, and risk tolerance. For those who can tolerate the extra volatility that sometimes comes with investing abroad, the Total International Stock Index Fund remains a cost-effective way to add an extra element of diversification to your portfolio and thus help you maintain a durable long-term investment plan.
Thank you for your confidence in Vanguard.
Sincerely,

F. William McNabb III
President and Chief Executive Officer
November 19, 2008
7
Total International Stock Index Fund
Fund Profile
As of October 31, 2008
Portfolio Characteristics | |
| Fund |
Acquired Fund Fees and Expenses | |
(10/31/2007)1 | 0.27% |
Sector Diversification (% of equity exposure) |
| | Target | Broad |
| Fund2 | Index3 | Index4 |
Consumer Discretionary | 9.7% | 9.6% | 9.0% |
Consumer Staples | 9.2 | 9.2 | 9.9 |
Energy | 10.2 | 10.2 | 12.0 |
Financials | 23.1 | 23.2 | 21.4 |
Health Care | 8.4 | 8.4 | 9.7 |
Industrials | 10.1 | 10.1 | 10.0 |
Information Technology | 6.4 | 6.3 | 9.1 |
Materials | 8.9 | 8.9 | 7.4 |
Telecommunication | | | |
Services | 7.4 | 7.5 | 6.0 |
Utilities | 6.6 | 6.6 | 5.5 |
Volatility Measures5 | |
| Fund Versus | Fund Versus |
| Target Index3 | Broad Index4 |
R-Squared | 0.99 | 0.99 |
Beta | 0.97 | 0.96 |
Allocation by Region (% of equity exposure)

Market Diversification (% of equity exposure) |
| | Target |
| Fund2 | Index3 |
Europe | | |
United Kingdom | 17.6% | 18.0% |
France | 8.4 | 8.4 |
Germany | 7.2 | 7.1 |
Switzerland | 6.9 | 7.0 |
Spain | 3.2 | 3.3 |
Italy | 2.9 | 2.9 |
Netherlands | 2.4 | 2.0 |
Sweden | 1.6 | 1.6 |
Finland | 1.2 | 1.2 |
Other European Markets | 3.4 | 3.4 |
Subtotal | 54.8% | 54.9% |
Pacific | | |
Japan | 19.6% | 19.4% |
Australia | 4.8 | 4.8 |
Hong Kong | 2.9 | 2.9 |
Other Pacific Markets | 0.9 | 0.9 |
Subtotal | 28.2% | 28.0% |
Emerging Markets | | |
Brazil | 2.6% | 2.6 |
South Korea | 2.5 | 2.5 |
Taiwan | 2.2 | 2.2 |
China | 1.6 | 1.6 |
Russia | 1.4 | 1.4 |
South Africa | 1.3 | 1.3 |
India | 1.2 | 1.2 |
Mexico | 1.0 | 1.0 |
Other Emerging Markets | 3.2 | 3.3 |
Subtotal | 17.0% | 17.1% |
1 This figure—drawn from the prospectus dated October 14, 2008—represents the fund’s total operating expenses, which include a weighted average of the annualized expense ratios and any transaction fees charged by the mutual funds in which the Total International Stock Index Fund invests (“acquired fund fees and expenses”). For the fiscal year ended October 31, 2008, the fund’s total operating expenses represented 0.28% of average net assets.
2 Reflects holdings of underlying funds and direct-held securities.
3 Total International Composite Index.
4 MSCI All Country World Index ex USA.
5 For an explanation of R-squared, beta, and other terms used here, see the Glossary.
8
Total International Stock Index Fund
Performance Summary
All of the returns in this report represent past performance, which is not a guarantee of future results that may be achieved by the fund. (Current performance may be lower or higher than the performance data cited. For performance data current to the most recent month-end, visit our website at www.vanguard.com/performance.) Note, too, that both investment returns and principal value can fluctuate widely, so an investor’s shares, when sold, could be worth more or less than their original cost. The returns shown do not reflect taxes that a shareholder would pay on fund distributions or on the sale of fund shares.
Cumulative Performance: October 31, 1998–October 31, 2008
Initial Investment of $10,000

| Average Annual Total Returns | Final Value of |
| Periods Ended October 31, 2008 | a $10,000 |
| One Year | Five Years | Ten Years | Investment |
Total International Stock Index Fund1 | –48.57% | 4.41% | 2.49% | $12,786 |
MSCI All Country World Index ex USA | –48.27 | 5.05 | 3.19 | 13,692 |
Total International Composite Index2 | –48.72 | 4.27 | 2.39 | 12,661 |
Average International Fund3 | –47.97 | 2.81 | 1.55 | 11,666 |
1 Total returns do not reflect the 0.5% transaction fee on purchases through March 31, 2000; the 2% fee assessed on redemptions of shares purchased on or after June 27, 2003, and held for less than two months; or the account service fee that may be applicable to certain accounts with balances below $10,000.
2 Consists of the MSCI Europe Index (55%), the MSCI Pacific Index (27%), and the MSCI Emerging Markets (18%) as of October 31, 2008.
3 Derived from data provided by Lipper Inc.
9
Total International Stock Index Fund
Fiscal-Year Total Returns (%): October 31, 1998–October 31, 2008

Average Annual Total Returns: Periods Ended September 30, 2008
This table presents average annual total returns through the latest calendar quarter—rather than through the end of the fiscal period. Securities and Exchange Commission rules require that we provide this information.
| Inception Date | One Year | Five Years | Ten Years |
Total International Stock Index Fund2 | 4/29/1996 | –30.09% | 11.14% | 6.16% |
1 Consists of the MSCI Europe Index (55%), the MSCI Pacific Index (27%), and the MSCI Emerging Markets (18%) as of October 31, 2008.
2 Total returns do not reflect the 0.5% transaction fee on purchases through March 31, 2000; the 2% fee assessed on redemptions of shares purchased on or after June 27, 2003, and held for less than two months; or the account service fee that may be applicable to certain accounts with balances below $10,000.
Note: See Financial Highlights table for dividend and capital gains information.
10
Total International Stock Index Fund
Financial Statements
Statement of Net Assets
As of October 31, 2008
The fund provides a complete list of its holdings four times in each fiscal year, at the quarter-ends. For the second and fourth fiscal quarters, the lists appear in the fund’s semiannual and annual reports to shareholders. For the first and third fiscal quarters, the fund files the lists with the Securities and Exchange Commission on Form N-Q. Shareholders can look up the fund’s Forms N-Q on the SEC’s website at www.sec.gov. Forms N-Q may also be reviewed and copied at the SEC’s Public Reference Room (see the back cover of this report for further information).
| | | Market |
| | | Value• |
| | Shares | ($000) |
Investment Companies (47.7%) | | |
1 | Vanguard European Stock | | |
| Index Fund | | |
| Investor Shares | 202,798,425 | 4,459,537 |
1 | Vanguard Pacific Stock | | |
| Index Fund | | |
| Investor Shares | 277,174,647 | 2,200,767 |
1 | Vanguard Emerging | | |
| Markets Stock | | |
| Index Fund | | |
| Investor Shares | 96,650,963 | 1,513,554 |
Total Investment Companies | | |
(Cost $7,897,899) | | 8,173,858 |
Common Stocks (52.3%) | | |
Argentina (0.0%) | | |
| Tenaris SA ADR | 139,938 | 2,881 |
| Tenaris SA | 179,609 | 2,031 |
| Siderar SA Class A | 103,669 | 520 |
| Petrobras Energia | | |
| Participaciones SA ADR | 65,722 | 408 |
| Banco Macro Bansud SA | | |
| ADR | 47,713 | 336 |
| Petrobras Energia | | |
| Participaciones SA | 371,186 | 258 |
* | Telecom Argentina SA ADR | 43,227 | 252 |
* | Telecom Argentina SA | 176,836 | 230 |
| | | 6,916 |
Australia (2.6%) | | |
| BHP Billiton Ltd. | 3,139,995 | 60,323 |
| Commonwealth Bank | | |
| of Australia | 1,240,746 | 33,917 |
| National Australia | | |
| Bank Ltd. | 1,526,925 | 24,776 |
| Westpac Banking | | |
| Corp., Ltd. | 1,757,498 | 24,114 |
| Woolworths Ltd. | 1,141,613 | 21,282 |
| Australia & New Zealand | | |
| Bank Group Ltd. | 1,800,337 | 21,104 |
| Westfield Group | 1,635,780 | 18,067 |
| | | Market |
| | | Value• |
| | Shares | ($000) |
| QBE Insurance Group Ltd. | 830,630 | 14,171 |
| Rio Tinto Ltd. | 268,592 | 13,895 |
| CSL Ltd. | 561,494 | 13,655 |
| Woodside Petroleum Ltd. | 454,376 | 12,838 |
| Telstra Corp. Ltd. | 4,094,320 | 11,270 |
| St. George Bank Ltd. | 526,299 | 9,847 |
| Wesfarmers Ltd. | 612,869 | 8,808 |
| Origin Energy Ltd. | 824,668 | 8,649 |
| Brambles Ltd. | 1,310,208 | 6,989 |
| Foster's Group Ltd. | 1,791,303 | 6,848 |
| AMP Ltd. | 1,777,142 | 6,464 |
| Newcrest Mining Ltd. | 432,129 | 5,940 |
| Macquarie Group, Ltd. | 255,679 | 5,072 |
| Santos Ltd. | 551,823 | 4,996 |
| Suncorp-Metway Ltd. | 890,972 | 4,796 |
| Insurance Australia | | |
| Group Ltd. | 1,796,910 | 4,552 |
| Orica Ltd. | 326,011 | 4,238 |
| Transurban Group | 1,069,118 | 3,839 |
| AGL Energy Ltd. | 408,761 | 3,839 |
| Stockland | 1,364,730 | 3,670 |
| Australian Stock | | |
| Exchange Ltd. | 158,607 | 3,185 |
| Incitec Pivot Ltd. | 1,119,504 | 3,001 |
| Amcor Ltd. | 776,663 | 2,998 |
| Macquarie | | |
| Infrastructure Group | 2,224,314 | 2,915 |
| Coca-Cola Amatil Ltd. | 517,511 | 2,794 |
| Sonic Healthcare Ltd. | 296,786 | 2,712 |
| Computershare Ltd. | 432,048 | 2,443 |
| Bendigo Bank Ltd. | 261,463 | 2,307 |
* | Fortescue Metals | | |
| Group Ltd. | 1,165,417 | 2,305 |
| Toll Holdings Ltd. | 575,326 | 2,297 |
| AXA Asia Pacific | | |
| Holdings Ltd. | 775,430 | 2,288 |
| Leighton Holdings Ltd. | 137,179 | 2,281 |
| Tabcorp Holdings Ltd. | 496,611 | 2,277 |
| CFS Gandel Retail Trust | 1,578,841 | 2,124 |
| BlueScope Steel Ltd. | 699,998 | 2,059 |
| GPT Group | 4,109,884 | 2,057 |
11
Total International Stock Index Fund
| | | | Market |
| | | | Value• |
| | | Shares | ($000) |
| | Wesfarmers, Ltd. Price | | |
| | Protected Shares | 137,559 | 1,986 |
| | Cochlear Ltd. | 51,666 | 1,960 |
| | Metcash Ltd. | 725,265 | 1,958 |
| | Alumina Ltd. | 1,346,431 | 1,916 |
| | Crown Ltd. | 409,709 | 1,834 |
| | OneSteel Ltd. | 775,373 | 1,781 |
| | Tatt’s Group, Ltd. | 1,054,212 | 1,765 |
| | OZ Minerals Ltd. | 2,720,434 | 1,709 |
| | Boral Ltd. | 538,398 | 1,620 |
| | Lion Nathan Ltd. | 272,321 | 1,609 |
| ^ | John Fairfax Holdings Ltd. | 1,246,994 | 1,599 |
| | Lend Lease Corp. | 332,305 | 1,538 |
| | Macquarie | | |
| | Goodman Group | 2,338,468 | 1,475 |
| | WorleyParsons Ltd. | 139,224 | 1,399 |
| | Qantas Airways Ltd. | 860,497 | 1,398 |
| | CSR Ltd. | 942,940 | 1,371 |
| | Goodman Fielder Ltd. | 1,225,844 | 1,360 |
| | Sims Group Ltd. | 140,671 | 1,349 |
| | Dexus Property Group | | |
| | NPV | 2,680,778 | 1,336 |
| | Billabong International Ltd. | 154,504 | 1,235 |
| | James Hardie Industries | | |
| | NV | 399,917 | 1,137 |
| | Macquarie Airports Group | 649,956 | 924 |
| | Harvey Norman | | |
| | Holdings Ltd. | 494,474 | 854 |
| | Caltex Australia Ltd. | 130,349 | 821 |
| ^ | Perpetual Trustees | | |
| | Australia Ltd. | 34,047 | 793 |
* | | Paladin Resources Ltd. | 506,947 | 777 |
| | Aristocrat Leisure Ltd. | 305,377 | 769 |
| | Asciano Group | 507,482 | 709 |
| | Mirvac Group | 954,812 | 625 |
| | Boart Longyear Group | 1,295,821 | 376 |
| | Macquarie Office Trust | 1,838,747 | 354 |
| | Babcock & Brown Ltd. | 257,391 | 225 |
| | | | 438,564 |
Austria (0.2%) | | |
| | OMV AG | 154,154 | 4,934 |
| ^ | Erste Bank der | | |
| | Oesterreichischen | | |
| | Sparkassen AG | 176,643 | 4,709 |
| | Telekom Austria AG | 320,782 | 3,941 |
| | Oesterreichische | | |
| | Elektrizitaetswirtschafts | | |
| | AG Class A | 74,980 | 3,547 |
| | Voestalpine AG | 106,517 | 2,599 |
| | Raiffeisen International | | |
| | Bank-Holding AG | 50,256 | 1,581 |
| | Wienerberger AG | 79,636 | 1,322 |
* | | Atrium European | | |
| | Real Estate | 282,041 | 1,282 |
| | Andritz AG | 35,433 | 1,009 |
| | Vienna Insurance Group | 34,716 | 937 |
| | | Market |
| | | Value• |
| | Shares | ($000) |
| Strabag SE | 47,695 | 934 |
* | IMMOFINANZ AG | 428,021 | 477 |
* | IMMOEAST Immobilien | | |
| Anlagen AG | 395,466 | 477 |
| | | 27,749 |
Belgium (0.3%) | | |
| InBev NV | 172,274 | 6,948 |
| KBC Bank & | | |
| Verzekerings Holding | 148,748 | 6,395 |
| Groupe Bruxelles Lambert | | |
| SA | 75,461 | 5,544 |
| Belgacom SA | 158,376 | 5,419 |
| Delhaize Group | 92,668 | 5,212 |
| Solvay SA | 55,192 | 5,134 |
| Colruyt NV | 15,548 | 3,495 |
| Dexia | 512,087 | 2,724 |
| Fortis | 2,079,591 | 2,409 |
| UCB SA | 92,522 | 2,355 |
| Umicore | 115,945 | 2,073 |
| Mobistar SA | 30,413 | 2,018 |
| Compagnie Nationale | | |
| a Portefeuille | 36,372 | 1,967 |
| KBC Ancora | 29,747 | 884 |
| | | 52,577 |
Brazil (1.3%) | | |
| Petroleo Brasileiro SA Pfd. | 2,450,000 | 26,394 |
| Petroleo Brasileiro SA | 1,770,300 | 23,435 |
| Companhia Vale do | | |
| Rio Doce Pfd. Class A | 1,493,900 | 17,328 |
| Companhia Vale do | | |
| Rio Doce | 1,037,900 | 13,318 |
| Banco Bradesco SA | 1,130,100 | 12,962 |
| Banco Itau Holding | | |
| Financeira SA | 889,100 | 9,603 |
| Itausa-Investimentos Itau | | |
| SA | 1,926,800 | 6,145 |
| Companhia de Bebidas | | |
| das Americas Pfd. | 137,100 | 5,828 |
| Petroleo Brasileiro SA | | |
| Series A ADR | 246,547 | 5,441 |
| Companhia Vale do Rio | | |
| Doce Sponsored ADR | 434,242 | 5,085 |
| Petroleo Brasileiro SA ADR | 183,156 | 4,925 |
| Unibanco-Uniao de Bancos | | |
| Brasileiros SA | 743,300 | 4,597 |
| Companhia Vale do Rio | | |
| Doce ADR | 306,143 | 4,017 |
| Companhia Siderurgica | | |
| Nacional SA | 255,900 | 3,404 |
| Companhia Energetica | | |
| de Minas Gerais Pfd. | 219,400 | 3,335 |
| Usiminas-Usinas | | |
| Siderugicas de | | |
| Minas Gerais SA Pfd. | 248,000 | 3,171 |
| Gerdau SA Pfd. | 487,500 | 3,101 |
12
Total International Stock Index Fund
| | | Market |
| | | Value• |
| | Shares | ($000) |
| BM&F BOVESPA SA | 1,160,169 | 3,079 |
| Banco Itau Holding | | |
| Financeira SA ADR | 267,130 | 2,954 |
| Tele Norte Leste | | |
| Participacoes SA Pfd. | 208,600 | 2,821 |
| Banco Bradesco SA ADR | 240,636 | 2,815 |
| Redecard SA | 248,520 | 2,697 |
| Centrais Electricas | | |
| Brasileiras SA | 207,800 | 2,491 |
| Metalurgica Gerdau SA | 254,500 | 2,271 |
| Centrais Electricas | | |
| Brasileiras SA Pfd. | | |
| B Shares | 188,400 | 2,039 |
| Banco do Brasil SA | 304,100 | 2,007 |
| Empresa Brasileira | | |
| de Aeronautica SA | 377,100 | 1,932 |
| Bradespar SA Pfd. | 209,600 | 1,842 |
| All America | | |
| Latina Logistica | 357,200 | 1,645 |
| CPFL Energia SA | 113,400 | 1,643 |
| Uniao de Bancos | | |
| Brasileiros SA GDR | 25,895 | 1,633 |
* | Ironx Mineracao SA | 114,664 | 1,508 |
| Perdigao SA | 103,500 | 1,504 |
* | OGX Petroleo e | | |
| Gas Participacoes SA | 11,600 | 1,454 |
| Brasil Telecom | | |
| Participacoes SA | 68,200 | 1,432 |
| Ultrapar Participacoes S.A. | 72,857 | 1,345 |
| Vivo Participacoes SA Pfd. | 118,025 | 1,285 |
| Souza Cruz SA | 69,400 | 1,203 |
| Companhia Siderurgica | | |
| Nacional SA ADR | 88,406 | 1,202 |
| Telmar Norte Leste SA | 42,300 | 1,063 |
| Companhia de | | |
| Concessoes Rodoviarias | 108,600 | 1,043 |
* | Net Servicos de | | |
| Comunicacao SA | 163,500 | 1,039 |
| Electropaulo Metropolitana | | |
| SA | 84,200 | 1,034 |
| Natura Cosmeticos SA | 117,800 | 990 |
| Cyrela Brazil Realty SA | 201,706 | 961 |
| Tractebel Energia SA | 118,300 | 928 |
| Embraer-Empresa Brasileira | | |
| de Aeronautica SA ADR | 42,378 | 887 |
| Tele Norte Leste | | |
| Participacoes SA | 58,900 | 884 |
| Companhia de Bebidas | | |
| das Americas ADR | 20,720 | 881 |
| Companhia de Saneamento | | |
| Basico do Estado de | | |
| Sao Paulo | 75,500 | 864 |
| Gerdau SA | 157,000 | 830 |
| Votorantim Celulose e | | |
| Papel SA Pfd. | 83,800 | 824 |
| Lojas Renner SA | 108,800 | 804 |
| | | Market |
| | | Value• |
| | Shares | ($000) |
| Lojas Americanas SA Pfd. | 288,300 | 797 |
| Gerdau SA ADR | 122,398 | 785 |
| Gafisa SA | 107,800 | 764 |
| Companhia Energetica | | |
| de Minas Gerais ADR | 50,244 | 764 |
* | GVT Holding SA | 69,200 | 752 |
| Suzano Papel e Celulose SA | 120,100 | 712 |
| Brasil Telecom | | |
| Participacoes SA Pfd. | 100,000 | 701 |
| Tam SA | 66,600 | 695 |
| Companhia Paranaense | | |
| de Energia-COPEL | 62,800 | 690 |
| Companhia Brasileira de | | |
| Distribuicao Grupo Pao | | |
| de Acucar ADR | 22,631 | 677 |
| Tim Participacoes SA Pfd. | 469,700 | 670 |
| Braskem SA | 154,400 | 661 |
| Brasil Telecom SA Pfd. | 110,700 | 659 |
| Klabin SA | 380,100 | 656 |
| B2W Com Global Do Varejo | 51,000 | 654 |
| Energias do Brasil SA | 60,300 | 649 |
| Usinas Siderurgicas de | | |
| Minas Gerais SA | 56,300 | 644 |
| CESP - Companhia | | |
| Energetica de Sao Paulo | 141,000 | 631 |
| Fertilizantes Fosfatados | | |
| S.A. | 114,800 | 596 |
| JBS SA | 329,400 | 594 |
| Duratex SA Pfd. | 68,300 | 571 |
| Tele Norte Leste | | |
| Participacoes ADR | 35,254 | 479 |
| Companhia Brasileira de | | |
| Distribuicao Grupo Pao | | |
| de Acucar Pfd. | 28,800 | 432 |
| Sadia SA Pfd. | 212,600 | 424 |
| Banco do Estado do Rio | | |
| Grande do Sul SA | 182,900 | 423 |
* | Cosan SA Industria | | |
| e Comercio | 82,200 | 405 |
| Companhia Paranaense | | |
| de Energia-COPEL ADR | 32,836 | 365 |
| Localiza Rent a Car SA | 92,800 | 360 |
| Companhia de Saneamento | | |
| Basico do Estado de | | |
| Sao Paulo ADR | 15,375 | 354 |
| Brasil Telecom | | |
| Participacoes SA ADR | 9,923 | 340 |
| Aracruz Celulose SA Pfd. | | |
| B Shares | 270,600 | 332 |
| MRV Engenharia | | |
| e Participacoes SA | 61,400 | 318 |
| Aracruz Celulose SA ADR | 18,602 | 247 |
| Gol - Linhas Aereas | | |
| Inteligentes SA Pfd. | 54,500 | 235 |
| Sadia SA ADR | 34,409 | 209 |
13
Total International Stock Index Fund
| | | Market |
| | | Value• |
| | Shares | ($000) |
| MMX Mineracao e | | |
| Metalicos SA | 108,100 | 207 |
| Tim Participacoes SA ADR | 10,171 | 147 |
* | LLX Logistica SA | 108,100 | 38 |
* | Vivo Participacoes SA ADR | 291 | 3 |
| Braskem SA ADR | 267 | 2 |
| Votorantim Celulose | | |
| e Papel SA ADR | 239 | 2 |
| | | 227,567 |
Chile (0.1%) | | |
| Empresas Copec SA | 359,780 | 2,947 |
| Empresa Nacional | | |
| de Electricidad SA | 2,310,307 | 2,697 |
| Enersis SA | 8,639,404 | 2,344 |
| Empresas CMPC SA | 93,125 | 1,715 |
| Sociedad Quimica y | | |
| Minera de Chile SA | 62,535 | 1,315 |
| Lan Airlines SA | 122,782 | 1,111 |
| Empresa Nacional de | | |
| Electricidad SA ADR | 28,135 | 1,047 |
| Cencosud SA | 712,128 | 1,042 |
| Empresa Nacional | | |
| de Telecomunicaciones | | |
| SA | 96,263 | 997 |
| Enersis SA ADR | 67,315 | 969 |
| Banco Santander Chile | | |
| SA ADR | 23,255 | 833 |
| CAP SA | 67,369 | 811 |
* | Colburn SA | 5,248,184 | 787 |
| Banco Santander Chile | | |
| SA | 23,577,864 | 721 |
| S.A.C.I. Falabella SA | 258,845 | 681 |
| Compania Cervecerias | | |
| Unidas SA | 118,485 | 636 |
| Distribucion y Servicio | | |
| D&S SA | 2,083,860 | 584 |
| Sociedad Quimica y | | |
| Minera de Chile SA ADR | 22,526 | 516 |
| Banco de Credito | | |
| e Inversiones | 27,425 | 460 |
| Masisa SA | 2,656,583 | 202 |
| Compania de | | |
| Telecomunicaciones | | |
| de Chile SA ADR | 25,033 | 170 |
| Distribucion y Servicio | | |
| D&S SA ADR | 5,365 | 96 |
| | | 22,681 |
China (1.2%) | | |
| China Mobile | | |
| (Hong Kong) Ltd. | 5,625,000 | 49,519 |
| China Life | | |
| Insurance Co., Ltd. | 6,654,000 | 17,782 |
| China Construction Bank | 31,695,000 | 15,723 |
| PetroChina Co. Ltd. | 19,812,000 | 14,896 |
| CNOOC Ltd. | 14,805,000 | 12,156 |
| | | | Market |
| | | | Value• |
| | | Shares | ($000) |
| | China Petroleum & | | |
| | Chemical Corp. | 15,854,000 | 10,411 |
| | China Unicom Ltd. | 5,591,694 | 7,983 |
| | Bank of China | 24,789,000 | 7,238 |
| | China Shenhua | | |
| | Energy Co. Ltd. | | |
| | H Shares | 3,014,000 | 5,722 |
| | Ping An Insurance | | |
| | (Group) Co. of China Ltd. | 1,200,000 | 5,132 |
| | China Telecom Corp. Ltd. | 13,162,000 | 4,684 |
| | China Merchants | | |
| | Bank Co., Ltd. Class H | 2,530,000 | 3,876 |
| ^ | Bank of | | |
| | Communications Ltd. | | |
| | Class H | 5,303,000 | 3,125 |
| | China Communications | | |
| | Construction Co., Ltd. | 3,901,000 | 2,763 |
| | China Resources | | |
| | Power Holdings Co., Ltd. | 1,336,000 | 2,611 |
| | China Merchants Holdings | | |
| | International Co. Ltd. | 990,000 | 2,359 |
| | China Resources | | |
| | Enterprise Ltd. | 1,098,000 | 2,186 |
* | | China Railway | | |
| | Construction Corp. | 1,617,000 | 1,998 |
| | China Coal Energy Co. | 3,119,000 | 1,892 |
| | Beijing Enterprises | | |
| | Holdings Ltd. | 368,500 | 1,455 |
| | Huaneng Power | | |
| | International, Inc. | | |
| | H Shares | 2,840,000 | 1,382 |
| | Aluminum Corp. | | |
| | of China Ltd. | 3,642,000 | 1,323 |
* | | Anhui Conch | | |
| | Cement Co. Ltd. | 402,000 | 1,280 |
| ^ | Chaoda Modern | | |
| | Agriculture Holdings Ltd. | 1,810,000 | 1,275 |
| | China COSCO | | |
| | Holdings Co., Ltd. | 2,351,500 | 1,267 |
| | GOME Electrical | | |
| | Appliances Holdings Ltd. | 6,073,000 | 1,213 |
| | Beijing Datang Power | | |
| | Generation Co., Ltd. | 3,052,000 | 1,149 |
| | Denway Motors Ltd. | 4,532,000 | 1,130 |
| | Fujian Zijin Mining | | |
| | Industry Co., Ltd. | 3,734,000 | 1,129 |
| ^ | Lenovo Group Ltd. | 3,666,000 | 1,112 |
| | China Shipping | | |
| | Development Co. | 1,120,000 | 1,104 |
| | Yanzhou Coal | | |
| | Mining Co. Ltd. | | |
| | H Shares | 1,714,000 | 1,059 |
| | Beijing Capital | | |
| | International Airport | | |
| | Co., Ltd. | 1,722,000 | 971 |
| | Parkson Retail Group Ltd. | 1,025,500 | 952 |
14
Total International Stock Index Fund
| | | Market |
| | | Value• |
| | Shares | ($000) |
| China Mengniu | | |
| Dairy Co., Ltd. | 987,000 | 949 |
| China Resources Land Ltd. | 918,000 | 929 |
| BYD Co. Ltd. | 533,500 | 907 |
*,^ | Shanghai Electric | | |
| Group Co., Ltd. | | |
| Class H | 2,864,000 | 867 |
| China Communication | | |
| Services Corp. Ltd. | 1,636,000 | 860 |
| CITIC Pacific Ltd. | 1,009,000 | 821 |
| Jiangsu | | |
| Expressway Co. Ltd. | | |
| H Shares | 1,156,000 | 809 |
| Shanghai Industrial | | |
| Holding Ltd. | 492,000 | 782 |
| Li Ning Co., Ltd. | 623,500 | 772 |
| China Oilfield | | |
| Services Ltd. | 1,374,000 | 755 |
| Cosco Pacific Ltd. | 1,034,000 | 753 |
| Guangdong | | |
| Investment Ltd. | 2,322,000 | 711 |
| Dongfeng Motor Corp. | 2,412,000 | 683 |
| Zhejiang | | |
| Expressway Co., Ltd. | 1,346,000 | 645 |
| China Vanke Co., Ltd. | 1,076,300 | 636 |
| Air China Ltd. | 2,252,000 | 629 |
| China Everbright Ltd. | 668,000 | 627 |
* | PICC Property and | | |
| Casualty Co., Ltd. | 2,254,000 | 624 |
^ | Angang Steel Co., Ltd. | 1,008,000 | 618 |
| Jiangxi Copper Co. Ltd. | 1,196,000 | 588 |
* | Alibaba.com, Ltd. | 929,500 | 561 |
| The Guangshen | | |
| Railway Co., Ltd. | 1,336,000 | 520 |
| Inner Mongolia | | |
| Yitai Coal Co., Ltd. | 298,900 | 505 |
| Yantai Changyu Pioneer | | |
| Wine Co., Ltd. | 160,600 | 499 |
| China Bluechemical, Ltd. | 1,222,000 | 464 |
| Guangzhou R&F | | |
| Properties Co. Ltd. | 941,600 | 452 |
* | Soho China | 1,458,000 | 433 |
| Sinopec Shanghai | | |
| Petrochemical Co. Ltd. | 2,242,000 | 420 |
| ZTE Corp. | 185,800 | 420 |
| China Travel International | 2,684,000 | 381 |
| Shanghai Zhenhua Port | | |
| Machinery Co., Ltd. | | |
| Class B | 601,700 | 379 |
^ | China Shipping | | |
| Container Lines Co. Ltd. | 3,256,000 | 375 |
| China International | | |
| Marine Containers | | |
| (Group) Co., Ltd. | 722,800 | 365 |
| Harbin Power | | |
| Equipment Co., Ltd. | 618,000 | 344 |
| | | | Market |
| | | | Value• |
| | | Shares | ($000) |
| | Shanghai Lujiazui Finance | | |
| | & Trade Zone | | |
| | Development Co., Ltd. | | |
| | Class B | 464,000 | 334 |
| ^ | Maanshan Iron and | | |
| | Steel Co. Ltd. | 1,658,000 | 309 |
| | Dongfang | | |
| | Electrical Corp Ltd. | 154,400 | 301 |
| | Guangzhou | | |
| | Investment Co. Ltd. | 3,702,000 | 275 |
* | | China Southern | | |
| | Airlines Co. Ltd. | 1,623,000 | 253 |
| | Nine Dragons Paper | | |
| | Holdings Ltd. | 1,346,000 | 232 |
* | | China Eastern | | |
| | Airlines Corp. Ltd. | 1,468,000 | 186 |
| | Hidili Industry Int’l | | |
| | Development Ltd. | 832,000 | 176 |
| | KWG Property | | |
| | Holding, Ltd. | 743,000 | 159 |
| | | | 213,165 |
Colombia (0.0%) | | |
| | Bancolombia SA ADR | 141,072 | 2,755 |
| | | | |
Czech Republic (0.1%) | | |
| | Ceske Energeticke | | |
| | Zavody a.s. | 192,946 | 8,439 |
| | Komercni Banka a.s. | 15,128 | 2,303 |
| | Cesky Telecom a.s. | 104,153 | 2,226 |
| | Zentiva NV | 24,000 | 1,400 |
* | | Central European | | |
| | Media Enterprises Ltd. | 28,393 | 702 |
| | Unipetrol a.s. | 60,000 | 450 |
| | | | 15,520 |
Denmark (0.4%) | | |
| | Novo Nordisk A/S B Shares | 430,000 | 23,049 |
* | | Vestas Wind Systems A/S | 172,400 | 7,062 |
| | Danske Bank A/S | 423,700 | 6,272 |
| | AP Moller-Maersk A/S | | |
| | B Shares | 1,023 | 5,887 |
| | Novozymes A/S | 43,200 | 3,050 |
| | AP Moller-Maersk A/S | | |
| | A Shares | 511 | 2,979 |
| | Carlsberg A/S B Shares | 65,750 | 2,588 |
| | DSV A/S | 178,200 | 2,141 |
| | Danisco A/S | 44,950 | 1,947 |
| | FLS Industries A/S | | |
| | B Shares | 49,200 | 1,835 |
| | Coloplast A/S B Shares | 22,425 | 1,626 |
* | | Topdanmark A/S | 15,000 | 1,621 |
| | Trygvesta A/S | 25,950 | 1,560 |
* | | Jyske Bank A/S | 47,750 | 1,410 |
| | Sydbank A/S | 59,896 | 931 |
*,^ | William Demant A/S | 22,800 | 872 |
| | Rockwool International A/S | 7,273 | 489 |
| | | | 65,319 |
15
Total International Stock Index Fund
| | | Market |
| | | Value• |
| | Shares | ($000) |
Egypt (0.0%) | | |
| Orascom Construction | | |
| Industries GDR | 55,000 | 3,710 |
| Orascom Telecom | | |
| Holding SAE GDR | 103,400 | 3,212 |
| | | 6,922 |
Finland (0.6%) | | |
| Nokia Oyj | 3,555,450 | 54,463 |
| Fortum Oyj | 417,200 | 10,253 |
| Sampo Oyj A Shares | 406,000 | 8,136 |
| UPM-Kymmene Oyj | 484,900 | 6,857 |
| Stora Enso Oyj R Shares | 540,000 | 5,022 |
| Kone Oyj | 141,920 | 3,176 |
| Wartsila Oyj B Shares | 79,700 | 2,019 |
| Elisa Oyj Class A | 128,450 | 1,932 |
| Neste Oil Oyj | 119,100 | 1,884 |
| Metso Oyj | 117,600 | 1,563 |
| Kesko Oyj | 60,800 | 1,423 |
| Pohjola Bank PLC | 104,255 | 1,403 |
| Nokian Renkaat Oyj | 99,150 | 1,296 |
| Orion Oyj | 84,500 | 1,242 |
| Rautaruuki Oyj | 76,000 | 1,240 |
^ | Sanoma Oyj | 76,550 | 1,172 |
| Outokumpu Oyj A Shares | 108,000 | 1,119 |
| YIT Oyj | 119,000 | 741 |
| Cargotec Corp. | 35,500 | 491 |
| | | 105,432 |
France (4.4%) | | |
| Total SA | 2,021,264 | 111,197 |
| Sanofi-Aventis | 984,038 | 62,346 |
| BNP Paribas SA | 762,643 | 55,064 |
| Gaz de France | 1,025,214 | 45,636 |
| France Telecom SA | 1,712,214 | 43,175 |
| Vivendi SA | 1,090,255 | 28,498 |
| AXA | 1,447,906 | 27,661 |
| Carrefour SA | 594,153 | 25,100 |
| Societe Generale Class A | 436,716 | 23,803 |
| Groupe Danone | 408,932 | 22,770 |
| Air Liquide SA | 232,227 | 20,040 |
| L’Oreal SA | 229,855 | 17,406 |
| LVMH Louis Vuitton | | |
| Moet Hennessy | 229,397 | 15,265 |
| Vinci SA | 390,288 | 14,045 |
| Schneider Electric SA | 208,111 | 12,474 |
| Credit Agricole SA | 839,350 | 12,143 |
| Unibail Co. | 77,109 | 11,565 |
| Electricite de France | 189,008 | 11,356 |
| Cie. de St. Gobain SA | 268,263 | 10,351 |
| Pernod Ricard SA | 155,650 | 10,136 |
| Alstom | 197,721 | 9,800 |
| Bouygues SA | 229,771 | 9,784 |
| Lafarge SA | 136,268 | 9,008 |
| Veolia Environnement | 351,265 | 8,705 |
| Essilor International SA | 189,116 | 8,483 |
| Hermes International | 64,434 | 8,316 |
| Accor SA | 181,518 | 7,062 |
| | | | Market |
| | | | Value• |
| | | Shares | ($000) |
| | Compagnie Generale des | | |
| | Etablissements Michelin | | |
| | SA | 133,765 | 6,885 |
| | Vallourec SA | 49,770 | 5,567 |
* | | Alcatel-Lucent | 2,147,531 | 5,545 |
| | Renault SA | 171,285 | 5,250 |
| | STMicroelectronics NV | 631,821 | 5,194 |
* | | Suez Environnement SA | 252,382 | 4,825 |
| | Pinault-Printemps-Redoute | | |
| | SA | 70,651 | 4,503 |
| | Lagardere S.C.A. | 111,679 | 4,440 |
| | Sodexho Alliance SA | 88,058 | 4,228 |
| | Cap Gemini SA | 129,700 | 4,179 |
| | PSA Peugeot Citroen | 140,712 | 3,755 |
| | Thales SA | 82,684 | 3,318 |
| | Christian Dior SA | 50,287 | 3,047 |
| | Technip SA | 96,464 | 2,889 |
| | Casino Guichard-Perrachon | | |
| | SA | 41,118 | 2,874 |
| | CNP Assurances | 35,108 | 2,829 |
| | Publicis Groupe SA | 117,228 | 2,649 |
| | SCOR SA | 158,320 | 2,594 |
| | Neopost SA | 29,337 | 2,456 |
| | Dassault Systemes SA | 58,785 | 2,434 |
| | Safran SA | 173,267 | 2,199 |
| | Natixis | 898,311 | 1,989 |
* | | Compagnie Generale | | |
| | de Geophysique SA | 120,276 | 1,945 |
* | | Eutelsat Communications | 82,702 | 1,775 |
| | Air France | 122,970 | 1,772 |
| | Aeroports de Paris (ADP) | 26,992 | 1,607 |
| | Klepierre | 66,640 | 1,535 |
| | Zodiac SA | 38,766 | 1,516 |
| | Atos Origin SA | 63,951 | 1,485 |
| | Eurazeo | 23,921 | 1,440 |
| | Legrand SA | 86,364 | 1,437 |
| | Societe | | |
| | Television Francaise 1 | 108,372 | 1,389 |
| | Bureau Veritas SA | 37,042 | 1,321 |
| | Eiffage SA | 33,688 | 1,294 |
| | Societe BIC SA | 24,361 | 1,287 |
| | Wendel Investissement | 25,782 | 1,232 |
| | Imerys SA | 26,596 | 1,211 |
| | Valeo SA | 66,946 | 1,166 |
| | PagesJaunes SA | 118,696 | 1,125 |
| | ICADE | 18,152 | 1,085 |
| | JCDecaux SA | 60,740 | 1,056 |
| | Gecina SA | 14,465 | 1,005 |
| | Eramet SLN | 4,863 | 986 |
| | M6 Metropole Television | 57,893 | 912 |
| | | | 754,419 |
Germany (3.7%) | | |
| ^ | Volkswagen AG | 136,290 | 86,730 |
| | E.On AG | 1,778,554 | 66,651 |
| | Siemens AG | 812,574 | 47,784 |
| | Bayer AG | 715,129 | 39,147 |
16
Total International Stock Index Fund
| | | | Market |
| | | | Value• |
| | | Shares | ($000) |
| | Deutsche Telekom AG | 2,652,331 | 38,913 |
| | RWE AG | 416,249 | 34,125 |
| | Allianz AG | 423,225 | 31,061 |
| | BASF AG | 885,118 | 29,221 |
| | SAP AG | 816,425 | 28,584 |
| | Daimler AG (Registered) | 812,126 | 27,531 |
| | Muenchener | | |
| | Rueckversicherungs- | | |
| | Gesellschaft AG | | |
| | (Registered) | 193,305 | 25,095 |
| | Deutsche Bank AG | 508,566 | 18,998 |
| | Deutsche Boerse AG | 183,674 | 14,364 |
| | Linde AG | 126,572 | 10,473 |
* | | Continental AG | 141,756 | 10,136 |
| | Deutsche Post AG | 786,785 | 8,627 |
| | Fresenius Medical Care AG | 180,459 | 7,995 |
| | Bayerische Motoren Werke | | |
| | AG | 307,818 | 7,806 |
| | Porsche AG | 80,780 | 7,060 |
| | Commerzbank AG | 650,920 | 6,928 |
| | Adidas AG | 189,410 | 6,579 |
| | ThyssenKrupp AG | 339,794 | 6,436 |
| | Volkswagen AG Pfd. | 97,756 | 6,028 |
| | K+S AG | 141,176 | 5,469 |
| | Merck KGaA | 60,588 | 5,352 |
| | Henkel AG & Co. KGaA | 170,096 | 4,861 |
| | Man AG | 98,689 | 4,825 |
| | Fresenius AG Pfd. | 75,743 | 4,808 |
| | Beiersdorf AG | 82,754 | 4,319 |
| | Metro AG | 105,179 | 3,354 |
| | Henkel KGaA | 121,091 | 2,961 |
| | Deutsche Lufthansa AG | 212,730 | 2,946 |
| | Salzgitter AG | 38,084 | 2,452 |
| ^ | TUI AG | 196,274 | 2,371 |
| | Celesio AG | 78,502 | 2,308 |
| | RWE AG Pfd. | 36,098 | 2,254 |
* | | Q-Cells AG | 56,796 | 2,249 |
* | | Infineon Technologies AG | 689,608 | 2,136 |
| | Solarworld AG | 77,152 | 1,899 |
| | HeidelbergCement AG | 22,812 | 1,694 |
| | Wacker Chemie AG | 14,297 | 1,545 |
| | Bilfinger Berger AG | 34,229 | 1,542 |
| ^ | Deutsche Postbank AG | 76,185 | 1,534 |
| | Fresenius AS | 25,633 | 1,500 |
| | Hannover | | |
| | Rueckversicherung AG | 55,420 | 1,372 |
| | Hochtief AG | 38,696 | 1,188 |
| | Fraport AG | 33,446 | 1,071 |
| | Rheinmetall AG | 33,392 | 1,017 |
* | | United Internet AG | 113,432 | 1,004 |
| | Puma AG | 5,951 | 991 |
| ^ | Hypo Real Estate Holding | | |
| | AG | 150,424 | 980 |
| | Bayerische Motoren Werke | | |
| | (BMW) | 48,460 | 969 |
| | | Market |
| | | Value• |
| | Shares | ($000) |
| Hamburger Hafen | | |
| und Logistik AG | 21,983 | 746 |
| IVG Immobilien AG | 86,495 | 566 |
*,^ | Arcandor AG | 156,079 | 365 |
| ProSieben Sat.1 Media AG | 78,743 | 233 |
| | | 639,153 |
Greece (0.2%) | | |
| National Bank of Greece | | |
| SA | 461,980 | 10,149 |
| Alpha Credit Bank SA | 354,060 | 5,169 |
| Greek Organization of | | |
| Football Prognostics | 212,340 | 4,636 |
| Bank of Piraeus | 289,800 | 3,676 |
| Hellenic | | |
| Telecommunications | | |
| Organization SA | 247,050 | 3,487 |
| EFG Eurobank Ergasias | 293,980 | 3,195 |
| Marfin Financial Group SA | 593,460 | 2,613 |
| Coca-Cola Hellenic | | |
| Bottling Co. SA | 152,710 | 2,131 |
| GEA Group AG | 137,872 | 1,980 |
| Public Power Corp. | 95,880 | 1,186 |
| Titan Cement Co. SA | 53,340 | 911 |
| Hellenic Petroleum SA | 108,940 | 903 |
| | | 40,036 |
Hong Kong (1.1%) | | |
| Industrial and Commercial | | |
| Bank of China Ltd. | | |
| Class H | 39,140,000 | 18,416 |
| CLP Holdings Ltd. | 1,925,000 | 12,982 |
| Cheung Kong | | |
| Holdings Ltd. | 1,310,000 | 12,578 |
| Sun Hung Kai | | |
| Properties Ltd. | 1,332,000 | 11,670 |
| Hutchison Whampoa Ltd. | 2,014,000 | 10,883 |
| Hong Kong Exchanges | | |
| & Clearing Ltd. | 949,200 | 9,626 |
| Hang Seng Bank Ltd. | 712,500 | 8,890 |
| Hong Kong Electric | | |
| Holdings Ltd. | 1,294,000 | 6,975 |
| Hong Kong & | | |
| China Gas Co., Ltd. | 3,772,000 | 6,645 |
^ | Tencent Holdings Ltd. | 833,400 | 6,067 |
| Esprit Holdings Ltd. | 984,700 | 5,595 |
| Swire Pacific Ltd. | | |
| A Shares | 777,000 | 5,472 |
| Hang Lung Properties Ltd. | 1,938,000 | 4,735 |
| Li & Fung Ltd. | 2,080,000 | 4,175 |
| China Overseas Land | | |
| & Investment Ltd. | 3,596,000 | 4,061 |
| Boc Hong Kong | | |
| Holdings Ltd. | 3,460,000 | 3,961 |
| Henderson Land | | |
| Development Co. Ltd. | 1,004,000 | 3,631 |
| Link REIT | 1,982,500 | 3,545 |
| MTR Corp. | 1,320,000 | 2,925 |
17
Total International Stock Index Fund
| | | Market |
| | | Value• |
| | Shares | ($000) |
| Bank of East Asia Ltd. | 1,322,400 | 2,668 |
| Hang Lung | | |
| Development Co., Ltd. | 799,000 | 2,571 |
| Wharf Holdings Ltd. | 1,269,000 | 2,532 |
*,^ | China Railway Group, Ltd. | 3,619,000 | 2,113 |
| New World | | |
| Development Co., Ltd. | 2,284,000 | 1,901 |
| Hopewell Holdings Ltd. | 570,000 | 1,772 |
| Hengan International | | |
| Group Co. Ltd. | 629,000 | 1,754 |
| Shangri-La Asia Ltd. | 1,200,000 | 1,699 |
* | Hutchison | | |
| Telecommunications | | |
| International Ltd. | 1,563,000 | 1,689 |
| Tingyi Holding Corp. | 1,546,000 | 1,638 |
| Cheung Kong | | |
| Infrastructure | | |
| Holdings Ltd. | 425,000 | 1,557 |
| China Insurance | | |
| International | | |
| Holdings Co., Ltd. | 638,000 | 1,487 |
| Kerry Properties Ltd. | 590,500 | 1,483 |
| Sino Land Co. | 1,564,000 | 1,375 |
* | Mongolia | | |
| Energy Corp. Ltd. | 3,168,000 | 1,359 |
^ | Cathay Pacific | | |
| Airways Ltd. | 1,096,000 | 1,337 |
| PCCW Ltd. | 3,498,000 | 1,309 |
| Wheelock and Co. Ltd. | 830,000 | 1,243 |
^ | China Citic Bank | 3,993,000 | 1,233 |
| Yue Yuen Industrial | | |
| (Holdings) Ltd. | 614,000 | 1,228 |
* | CITIC International | | |
| Financial Holdings Ltd. | 1,884,000 | 1,191 |
| Belle International | | |
| Holdings Ltd. | 2,320,000 | 1,114 |
| Sinofert Holdings, Ltd. | 1,974,000 | 1,102 |
| Kingboard Chemical | | |
| Holdings Ltd. | 512,000 | 1,022 |
| China Yurun | | |
| Food Group Ltd. | 827,000 | 983 |
| Hysan Development | | |
| Co., Ltd. | 528,000 | 828 |
| Pacific Basin Shipping Ltd. | 1,515,000 | 811 |
| NWS Holdings Ltd. | 753,000 | 786 |
| Television Broadcasts Ltd. | 273,000 | 759 |
| Sino-Ocean Land | | |
| Holdings Ltd. | 2,817,000 | 757 |
| Wing Hang Bank Ltd. | 160,500 | 753 |
* | Foxconn International | | |
| Holdings Ltd. | 2,008,000 | 739 |
| CNPC Hong Kong Ltd. | 2,230,000 | 684 |
| Chinese Estates Holdings | 879,000 | 675 |
*,^ | Genting International PLC | 2,572,000 | 634 |
| Shimao Property | | |
| Holdings Ltd. | 1,161,500 | 630 |
| | | | Market |
| | | | Value• |
| | | Shares | ($000) |
| | ASM Pacific | | |
| | Technology Ltd. | 180,700 | 604 |
| | China High Speed | | |
| | Transmission Equipment | | |
| | Group Co., Ltd. | 737,000 | 585 |
| | Country Garden | | |
| | Holdings Co. | 2,943,000 | 523 |
| | Agile Property | | |
| | Holdings, Inc. | 1,542,000 | 512 |
| ^ | China National Building | | |
| | Material Co., Ltd. | 836,000 | 487 |
* | | China Agri-Industries | | |
| | Holdings Ltd. | 1,324,000 | 472 |
| | Hong Kong Aircraft & | | |
| | Engineering Co., Ltd. | 58,400 | 460 |
| | Lifestyle International | | |
| | Holdings, Ltd. | 601,000 | 401 |
| | Shui On Land Ltd. | 1,711,500 | 388 |
| | Orient Overseas | | |
| | International Ltd. | 214,500 | 383 |
| | Fosun International | 1,450,500 | 299 |
| | Shougang Concord | | |
| | International Enterprises | | |
| | Company Ltd. | 2,882,000 | 239 |
| ^ | Shun Tak Holdings Ltd. | 1,078,000 | 215 |
* | | CITIC Resources | | |
| | Holdings Ltd. | 2,532,000 | 193 |
| | Hopson Development | | |
| | Holdings Ltd. | 548,000 | 183 |
| ^ | C C Land Holdings Ltd. | 864,000 | 157 |
| | Lee & Man Paper | | |
| | Manufacturing Ltd. | 393,200 | 129 |
| | | | 196,478 |
Hungary (0.1%) | | |
* | | OTP Bank Nyrt. | 261,844 | 4,337 |
| | MOL Hungarian Oil and | | |
| | Gas Nyrt. | 55,840 | 3,021 |
| | Richter Gedeon Nyrt. | 14,171 | 1,958 |
| | Magyar Tavkozlesi Nyrt. | 431,536 | 1,365 |
| | | | 10,681 |
India (0.7%) | | |
| | Reliance Industries Ltd. | 610,888 | 17,317 |
| | Infosys Technologies Ltd. | 426,526 | 12,399 |
| | Housing Development | | |
| | Finance Corp. Ltd. | 200,129 | 7,265 |
| | HDFC Bank Ltd. | 202,681 | 4,308 |
| | ICICI Bank Ltd. | 467,654 | 3,883 |
| | Hindustan Lever Ltd. | 812,188 | 3,689 |
| | Oil and Natural | | |
| | Gas Corp. Ltd. | 258,023 | 3,547 |
| | ITC Ltd. | 1,054,238 | 3,356 |
| | Larsen & Toubro Ltd. | 184,438 | 3,074 |
| | Bharat Heavy | | |
| | Electricals Ltd. | 109,931 | 2,921 |
| | Reliance Communication | | |
| | Ventures | 604,842 | 2,758 |
18
Total International Stock Index Fund
| | | Market |
| | | Value• |
| | Shares | ($000) |
| NTPC Ltd. | 764,005 | 2,217 |
| Satyam Computer | | |
| Services Ltd. | 349,090 | 2,201 |
| Axis Bank Ltd. | 183,571 | 2,126 |
| ICICI Bank Ltd. ADR | 124,019 | 2,119 |
| Tata Consultancy | | |
| Services Ltd. | 179,361 | 2,001 |
| Gail India Ltd. | 382,862 | 1,698 |
| Reliance Capital Ltd. | 107,587 | 1,461 |
| Sterlite Industries | | |
| (India) Ltd. | 224,459 | 1,336 |
| Sun Pharmaceutical | | |
| Industries Ltd. | 57,479 | 1,330 |
| Wipro Ltd. | 230,480 | 1,292 |
| Hero Honda Motors Ltd. | 80,389 | 1,231 |
| HDFC Bank Ltd. ADR | 17,566 | 1,152 |
| State Bank of India | 47,974 | 1,098 |
| Cipla Ltd. | 290,922 | 1,058 |
| Tata Power Co. Ltd. | 69,211 | 985 |
| Mahindra & Mahindra Ltd. | 126,523 | 980 |
| Jindal Steel & Power Ltd. | 55,634 | 914 |
| Reliance Energy Ltd. | 96,008 | 910 |
* | Reliance Petroleum Ltd. | 489,025 | 869 |
* | United Spirits Ltd. | 45,524 | 838 |
| Hindalco Industries Ltd. | 666,531 | 834 |
| DLF Ltd. | 184,494 | 832 |
| Kotak Mahindra Bank | 109,520 | 771 |
| Tata Motors Ltd. | 207,605 | 751 |
| Jaiprakash Associates Ltd. | 483,520 | 728 |
| Maruti Udyog Ltd. | 62,361 | 728 |
| Steel Authority of India Ltd. | 415,235 | 726 |
| Tata Iron and Steel Co. Ltd. | 165,309 | 721 |
| Satyam Computer | | |
| Services Ltd. ADR | 45,776 | 720 |
| Infrastructure Development | | |
| Finance Co., Ltd. | 586,661 | 707 |
| Ambuja Cements Ltd. | 556,173 | 700 |
* | Cairn India Ltd. | 257,407 | 695 |
| Grasim Industries Ltd. | 32,544 | 690 |
| Zee Entertainment | | |
| Enterprises | 191,630 | 608 |
| Dr. Reddy’s | | |
| Laboratories Ltd. | 67,179 | 595 |
| Asea Brown Boveri | | |
| India Ltd. | 48,852 | 551 |
| Glenmark | | |
| Pharmaceuticals Ltd. | 90,381 | 535 |
| HCL Technologies Ltd. | 147,559 | 528 |
| JSW Steel Ltd. | 78,864 | 502 |
| Associated | | |
| Cement Cos. Ltd. | 49,357 | 501 |
* | Reliance Natural | | |
| Resources, Ltd. | 541,706 | 487 |
| Bharat | | |
| Petroleum Corp. Ltd. | 82,431 | 483 |
| Tata Communications Ltd. | 45,898 | 464 |
| | | Market |
| | | Value• |
| | Shares | ($000) |
* | Essar Oil Ltd. | 250,769 | 445 |
| Indiabulls Real Estate Ltd. | 175,186 | 435 |
| Siemens India Ltd. | 73,575 | 401 |
* | GMR Infrastructure Ltd. | 379,879 | 398 |
| Ranbaxy Laboratories Ltd. | 104,762 | 364 |
| Aditya Birla Nuvo Ltd. | 31,338 | 353 |
| Wipro Ltd. ADR | 42,946 | 332 |
| State Bank of India GDR | 7,050 | 327 |
| Unitech, Ltd. | 295,602 | 301 |
| Indiabulls Financial | | |
| Services Ltd. | 129,210 | 297 |
| Indian Hotels Co. Ltd. | 271,862 | 259 |
| Ultratech Cemco Ltd. | 33,628 | 247 |
| Dr. Reddy’s | | |
| Laboratories Ltd. ADR | 24,527 | 208 |
| Tata Communications Ltd. | 4,426 | 106 |
| Infosys Technologies Ltd. | | |
| ADR | 676 | 20 |
| | | 111,683 |
Indonesia (0.1%) | | |
| PT Telekomunikasi | | |
| Indonesia Tbk | 9,387,500 | 4,696 |
| PT Bumi Resources Tbk | 16,411,000 | 3,275 |
| PT Bank Central Asia Tbk | 12,077,500 | 2,927 |
| PT Astra International | | |
| Tbk | 1,908,000 | 1,588 |
| PT Bank Rakyat | | |
| Indonesia Tbk | 5,048,000 | 1,545 |
| PT Perusahaan | | |
| Gas Negara Tbk | 9,435,500 | 1,188 |
| PT Indonesian | | |
| Satellite Corp. Tbk | 2,262,000 | 1,085 |
| PT Unilever Indonesia | | |
| Tbk | 1,456,500 | 994 |
| PT Bank Mandiri Tbk | 6,716,000 | 963 |
| PT Bank International | | |
| Indonesia Tbk | 19,874,000 | 866 |
| PT United Tractors Tbk | 1,372,000 | 400 |
| PT Indofood Sukses | | |
| Makmur Tbk | 3,968,500 | 390 |
| PT Bank Danamon Tbk | 1,646,500 | 390 |
| PT Semen Gresik Tbk | 1,392,000 | 376 |
| PT Tambang Batubara | | |
| Bukit Asam Tbk | 736,000 | 370 |
| PT Indocement Tunggal | | |
| Prakarsa Tbk (Local) | 919,500 | 301 |
| PT International Nickel | | |
| Indonesia Tbk | 1,848,000 | 294 |
| PT Aneka Tambang Tbk | 3,085,000 | 290 |
| PT Astra Agro Lestari Tbk | 366,500 | 203 |
* | PT Indah Kiat Pulp & | | |
| Paper Corp. | 2,516,500 | 192 |
* | PT Truba | | |
| Alam Manunggal | | |
| Engineering Tbk | 6,412,500 | 33 |
| | | 22,366 |
19
Total International Stock Index Fund
| | | Market |
| | | Value• |
| | Shares | ($000) |
Ireland (0.2%) | | |
| CRH PLC | 507,720 | 11,156 |
| Allied Irish Banks PLC | 815,128 | 4,342 |
* | Elan Corp. PLC | 440,174 | 3,321 |
| Kerry Group PLC A Shares | 131,529 | 2,931 |
| Bank of Ireland | 923,606 | 2,727 |
| Anglo Irish Bank Corp. PLC | 698,992 | 2,244 |
* | Ryanair Holdings PLC | 340,967 | 1,188 |
| Irish Life & Permanent PLC | 260,781 | 892 |
| | | 28,801 |
Israel (0.3%) | | |
| Teva Pharmaceutical | | |
| Industries Ltd. | 717,646 | 30,604 |
| Israel Chemicals Ltd. | 472,219 | 4,763 |
* | Check Point Software | | |
| Technologies Ltd. | 162,898 | 3,294 |
| Bank Leumi Le-Israel | 956,462 | 2,509 |
| Bank Hapoalim Ltd. | 872,157 | 1,975 |
| Partner | | |
| Communications Co. Ltd. | 78,274 | 1,434 |
| Bezeq Israeli | | |
| Telecommunication | | |
| Corp., Ltd. | 951,674 | 1,421 |
* | NICE Systems Ltd. | 57,404 | 1,270 |
| Cellcom Israel Ltd. | 38,983 | 1,148 |
| Elbit Systems Ltd. | 23,421 | 1,120 |
| Makhteshim-Agan | | |
| Industries Ltd. | 264,185 | 1,000 |
| The Israel Corp. Ltd. | 2,071 | 977 |
| United Mizrahi Bank Ltd. | 111,922 | 586 |
| Ormat Industries Ltd. | 75,432 | 537 |
| Oil Refineries Ltd. | 909,669 | 460 |
| Israel Discount Bank Ltd. | 451,047 | 443 |
| Discount Investment | | |
| Corp. Ltd. | 26,471 | 309 |
| Gazit-Globe (1982) Ltd. | 52,875 | 288 |
| Koor Industries Ltd. | 8,317 | 283 |
| Delek Group, Ltd. | 4,298 | 281 |
| IDB Development | | |
| Corp. Ltd. | 20,990 | 248 |
| Africa-Israel | | |
| Investments Ltd. | 11,479 | 171 |
| | | 55,121 |
Italy (1.5%) | | |
| Eni SpA | 2,435,854 | 58,139 |
| Enel SpA | 4,051,036 | 27,102 |
| Intesa Sanpaolo SpA | 7,207,074 | 26,377 |
| UniCredit SpA | 10,612,469 | 25,980 |
| Assicurazioni Generali | | |
| SpA | 989,422 | 24,987 |
| Telecom Italia SpA | 9,399,887 | 10,798 |
| Unione Di Banche Italiane | | |
| ScpA | 573,776 | 9,680 |
| Banco Popolare SpA | 594,990 | 7,422 |
| Mediobanca Banca di | | |
| Credito Finanziaria SpA | 467,768 | 5,340 |
| | | Market |
| | | Value• |
| | Shares | ($000) |
| Fiat SpA | 670,661 | 5,322 |
| Telecom Italia SpA RNC | 5,742,208 | 4,832 |
| Saipem SpA | 245,553 | 4,615 |
| Atlantia SpA | 244,580 | 4,477 |
| Banca Monte dei Paschi | | |
| di Siena SpA | 2,273,015 | 4,413 |
| Mediaset SpA | 713,930 | 3,879 |
| Snam Rete Gas SpA | 735,204 | 3,722 |
| Terna SpA | 1,124,621 | 3,627 |
| Finmeccanica SpA | 281,826 | 3,495 |
| Parmalat SpA | 1,545,112 | 2,713 |
| Alleanza Assicurazioni | | |
| SpA | 393,452 | 2,623 |
| Luxottica Group SpA | 129,291 | 2,613 |
| Intesa Sanpaolo SpA | | |
| Non Convertible Risp. | 814,720 | 2,418 |
| Banca Popolare di Milano | | |
| SpA | 361,246 | 2,114 |
| A2A SpA | 1,148,664 | 2,094 |
| Banca Carige SpA | 666,719 | 1,425 |
| Lottomatica SpA | 56,096 | 1,310 |
| Prysmian SpA | 100,343 | 1,217 |
| Fondiari-Sai SpA | 62,919 | 1,182 |
| Unipol Gruppo | | |
| Finanziario SpA | 624,197 | 1,107 |
| Bulgari SpA | 142,938 | 1,069 |
| Unipol Gruppo | | |
| Finanziario SpA Pfd. | 863,429 | 948 |
| IFIL Investments SpA | 288,614 | 895 |
| Pirelli & C. Accomandita | | |
| per Azioni SpA | 2,445,994 | 862 |
| Mediolanum SpA | 198,370 | 778 |
| Italcementi SpA | 63,966 | 746 |
| Autogrill SpA | 90,695 | 725 |
| Italcementi SpA Risp. | 94,232 | 656 |
* | IFI-Istituto Finanziario | | |
| Industriale SpA | 58,347 | 509 |
* | Finmeccanica SpA | | |
| Rights Exp. 11/07/08 | 269,682 | 110 |
| | | 262,321 |
Japan (10.2%) | | |
| Toyota Motor Corp. | 2,580,800 | 100,783 |
| Mitsubishi UFJ | | |
| Financial Group | 9,654,200 | 60,669 |
| Takeda Pharmaceutical | | |
| Co. Ltd. | 778,600 | 38,685 |
| Honda Motor Co., Ltd. | 1,545,000 | 38,417 |
| Canon, Inc. | 998,200 | 34,929 |
| Tokyo Electric Power Co. | 1,139,200 | 32,263 |
| Nintendo Co. | 92,800 | 29,817 |
| Matsushita Electric | | |
| Industrial Co., Ltd. | 1,721,000 | 27,715 |
| Sumitomo Mitsui | | |
| Financial Group, Inc. | 6,275 | 25,156 |
| NTT DoCoMo, Inc. | 14,693 | 23,302 |
| East Japan Railway Co. | 3,181 | 22,636 |
20
Total International Stock Index Fund
| | Market |
| | Value• |
| Shares | ($000) |
Seven and I | | |
Holdings Co., Ltd. | 806,100 | 22,634 |
Sony Corp. | 941,100 | 22,304 |
Mizuho Financial | | |
Group, Inc. | 9,063 | 22,130 |
Mitsubishi Corp. | 1,271,200 | 21,308 |
Shin-Etsu | | |
Chemical Co., Ltd. | 383,700 | 20,396 |
Nippon Telegraph and | | |
Telephone Corp. | 4,871 | 19,877 |
Millea Holdings, Inc. | 642,200 | 19,809 |
Mitsubishi | | |
Estate Co., Ltd. | 1,101,000 | 19,668 |
Astellas Pharma Inc. | 463,800 | 18,681 |
Kansai Electric | | |
Power Co., Inc. | 718,600 | 18,019 |
KDDI Corp. | 2,736 | 16,393 |
Chubu Electric Power Co. | 619,500 | 16,222 |
Nippon Steel Corp. | 4,774,000 | 16,069 |
Nomura Holdings Inc. | 1,661,500 | 15,742 |
Mitsui & Co., Ltd. | 1,616,000 | 15,658 |
Japan Tobacco, Inc. | 4,226 | 14,992 |
Hitachi Ltd. | 3,149,000 | 14,785 |
Kao Corp. | 491,000 | 14,358 |
Mitsui Fudosan Co., Ltd. | 786,000 | 13,710 |
Daiichi Sankyo Co., Ltd. | 656,800 | 13,468 |
JFE Holdings, Inc. | 492,500 | 12,566 |
Central Japan Railway Co. | 1,477 | 12,133 |
Fanuc Co., Ltd. | 180,700 | 12,040 |
Mitsubishi Electric Corp. | 1,822,000 | 11,295 |
Fuji Photo Film Co., Ltd. | 460,000 | 10,589 |
Nissan Motor Co., Ltd. | 2,126,700 | 10,562 |
Toshiba Corp. | 2,893,000 | 10,457 |
Bridgestone Corp. | 571,300 | 9,988 |
Mitsui Sumitomo | | |
Insurance Group | | |
Holdings, Inc. | 358,000 | 9,948 |
Mitsubishi Heavy | | |
Industries Ltd. | 3,016,000 | 9,670 |
Tokyo Gas Co., Ltd. | 2,194,000 | 9,434 |
Komatsu Ltd. | 850,500 | 9,350 |
Sumitomo Corp. | 1,057,100 | 9,300 |
Sumitomo Metal | | |
Industries Ltd. | 3,612,000 | 9,290 |
Tohoku Electric | | |
Power Co. | 402,300 | 9,036 |
Kyocera Corp. | 153,700 | 9,028 |
Denso Corp. | 459,800 | 8,962 |
Orix Corp. | 86,030 | 8,839 |
Kyushu Electric | | |
Power Co., Inc. | 356,500 | 8,173 |
Kirin Brewery Co., Ltd. | 732,000 | 8,096 |
Eisai Co., Ltd. | 234,400 | 7,605 |
Secom Co., Ltd. | 199,000 | 7,590 |
Itochu Corp. | 1,417,000 | 7,488 |
| | | Market |
| | | Value• |
| | Shares | ($000) |
| Daiwa Securities | | |
| Group Inc. | 1,251,000 | 7,073 |
| West Japan Railway Co. | 1,605 | 7,063 |
| Hoya Corp. | 385,600 | 7,041 |
| T & D Holdings, Inc. | 182,700 | 6,979 |
| Fujitsu Ltd. | 1,766,000 | 6,944 |
| Softbank Corp. | 701,100 | 6,904 |
| Murata Manufacturing | | |
| Co., Ltd. | 199,600 | 6,879 |
| Ricoh Co. | 632,000 | 6,802 |
| Keyence Corp. | 34,900 | 6,688 |
| Dai-Nippon Printing | | |
| Co., Ltd. | 565,000 | 6,676 |
| Sharp Corp. | 928,000 | 6,623 |
| Terumo Corp. | 156,900 | 6,539 |
| Osaka Gas Co., Ltd. | 1,844,000 | 6,523 |
| Chugoku Electric | | |
| Power Co., Ltd. | 262,800 | 6,361 |
| Shiseido Co., Ltd. | 305,000 | 6,275 |
| Sumitomo Trust & | | |
| Banking Co., Ltd. | 1,340,000 | 6,206 |
| Marubeni Corp. | 1,535,000 | 5,964 |
| Asahi Breweries Ltd. | 360,000 | 5,942 |
| Asahi Glass Co., Ltd. | 940,000 | 5,907 |
^ | Toray Industries, Inc. | 1,261,000 | 5,855 |
^ | Kintetsu Corp. | 1,507,000 | 5,768 |
| Sumitomo Realty & | | |
| Development Co. | 354,000 | 5,768 |
| Sumitomo Electric | | |
| Industries Ltd. | 707,900 | 5,732 |
| Aeon Co., Ltd. | 594,600 | 5,702 |
| Mitsui OSK Lines Ltd. | 1,071,000 | 5,593 |
| Bank of Yokohama Ltd. | 1,148,000 | 5,568 |
| Daikin Industries Ltd. | 246,000 | 5,533 |
| Sompo Japan | | |
| Insurance Inc. | 785,000 | 5,502 |
| Hankyu Corp. | 1,148,000 | 5,416 |
| Nidec Corp. | 100,600 | 5,411 |
| NEC Corp. | 1,820,000 | 5,396 |
| Ajinomoto Co., Inc. | 620,000 | 5,353 |
| Tokyo Electron Ltd. | 159,700 | 5,325 |
| Kubota Corp. | 1,045,000 | 5,245 |
| SMC Corp. | 54,700 | 5,164 |
| Nippon Oil Corp. | 1,257,000 | 5,160 |
^ | Resona Holdings Inc. | 4,905 | 5,144 |
| Shizuoka Bank Ltd. | 575,000 | 5,078 |
| Shikoku Electric Power | 169,600 | 4,977 |
| Nippon Yusen | | |
| Kabushiki Kaisha Co. | 1,022,000 | 4,942 |
| Suzuki Motor Corp. | 334,400 | 4,907 |
| Mitsubishi Chemical | | |
| Holdings Corp. | 1,184,000 | 4,787 |
| Yahoo Japan Corp. | 14,437 | 4,777 |
| Shionogi & Co., Ltd. | 279,000 | 4,748 |
| Fast Retailing Co., Ltd. | 44,500 | 4,744 |
| Rohm Co., Ltd. | 96,800 | 4,664 |
21
Total International Stock Index Fund
| | | Market |
| | | Value• |
| | Shares | ($000) |
*,^ | Mitsubishi Motors Corp. | 3,342,000 | 4,620 |
| Office Building Fund | | |
| of Japan Inc. | 475 | 4,564 |
| Sumitomo Chemical Co. | 1,489,000 | 4,556 |
| Nikon Corp. | 318,000 | 4,482 |
| Inpex Holdings, Inc. | 769 | 4,464 |
| Yamada Denki Co., Ltd. | 81,100 | 4,414 |
| Hokuriku Electric | | |
| Power Co. | 167,400 | 4,412 |
| Asahi Kasei Corp. | 1,143,000 | 4,299 |
| Odakyu Electric | | |
| Railway Co. | 586,000 | 4,297 |
| Tokyu Corp. | 1,088,000 | 4,274 |
| Daiwa House | | |
| Industry Co., Ltd. | 477,000 | 4,240 |
| Sekisui House Ltd. | 414,000 | 4,151 |
| Olympus Corp. | 213,000 | 4,105 |
| Yamato Holdings Co., Ltd. | 366,000 | 4,043 |
| Hokkaido Electric | | |
| Power Co., Ltd. | 180,100 | 4,039 |
| Kobe Steel Ltd. | 2,487,000 | 4,034 |
| Ono Pharmaceutical | | |
| Co., Ltd. | 90,000 | 4,012 |
| Tobu Railway Co., Ltd. | 779,000 | 3,958 |
| Sumitomo Metal | | |
| Mining Co. | 518,000 | 3,885 |
| TDK Corp. | 114,000 | 3,852 |
| NTT Data Corp. | 1,164 | 3,846 |
| Toyoda Automatic | | |
| Loom Works Ltd. | 165,500 | 3,736 |
| Electric Power | | |
| Development Co., Ltd. | 124,700 | 3,713 |
| Nipponkoa Insurance | | |
| Co., Ltd. | 604,000 | 3,620 |
| Mitsui Trust Holding Inc. | 913,000 | 3,602 |
| Toppan Printing Co., Ltd. | 488,000 | 3,588 |
| Chiba Bank Ltd. | 708,000 | 3,499 |
| Oriental Land Co., Ltd. | 49,100 | 3,482 |
| Japan Real Estate | | |
| Investment Corp. | 391 | 3,462 |
| Nitto Denko Corp. | 152,800 | 3,384 |
| JS Group Corp. | 256,800 | 3,325 |
| Lawson Inc. | 66,800 | 3,265 |
^ | Keihin Electric Express | | |
| Railway Co., Ltd. | 412,000 | 3,180 |
| OJI Paper Co., Ltd. | 822,000 | 3,138 |
| Aisin Seiki Co., Ltd. | 177,300 | 3,137 |
| Daito Trust Construction | | |
| Co., Ltd. | 74,200 | 3,130 |
| Rakuten, Inc. | 6,288 | 3,117 |
| Chugai Pharmaceutical | | |
| Co., Ltd. | 216,100 | 3,073 |
| Matsushita | | |
| Electric Works, Ltd. | 346,000 | 3,020 |
| Dentsu Inc. | 1,837 | 3,014 |
| Joyo Bank Ltd. | 640,000 | 3,011 |
| | | Market |
| | | Value• |
| | Shares | ($000) |
| Bank of Kyoto Ltd. | 283,000 | 2,977 |
| Nippon Express Co., Ltd. | 731,000 | 2,951 |
| Benesse Corp. | 68,600 | 2,881 |
| Konica Minolta | | |
| Holdings, Inc. | 438,500 | 2,880 |
* | Isetan Mitsukoshi | | |
| Holdings Ltd. | 304,500 | 2,868 |
| Uni-Charm Corp. | 38,800 | 2,783 |
| Ohbayashi Corp. | 567,000 | 2,774 |
| Keio Electric Railway | | |
| Co., Ltd. | 533,000 | 2,760 |
| Shimizu Corp. | 547,000 | 2,684 |
| Omron Corp. | 187,200 | 2,673 |
| Sony Financial | | |
| Holdings, Inc. | 809 | 2,631 |
| Hisamitsu | | |
| Pharmaceutical Co. Inc. | 62,200 | 2,592 |
| Hirose Electric Co., Ltd. | 29,500 | 2,555 |
| Toho Gas Co., Ltd. | 437,000 | 2,522 |
| Nippon Mining | | |
| Holdings Inc. | 819,500 | 2,509 |
| Kawasaki Heavy | | |
| Industries Ltd. | 1,367,000 | 2,477 |
| Kuraray Co., Ltd. | 317,500 | 2,430 |
| The Iyo Bank, Ltd. | 224,000 | 2,417 |
| NGK Insulators Ltd. | 232,000 | 2,410 |
| All Nippon Airways | | |
| Co., Ltd. | 627,000 | 2,395 |
| Fukuoka Financial | | |
| Group, Inc. | 724,000 | 2,395 |
| Kurita Water | | |
| Industries Ltd. | 104,000 | 2,373 |
| Mitsubishi | | |
| Materials Corp. | 1,050,000 | 2,371 |
| Trend Micro Inc. | 96,000 | 2,348 |
* | Sanyo Electric Co., Ltd. | 1,542,000 | 2,341 |
| TonenGeneral Sekiyu K.K. | 276,000 | 2,334 |
| Sekisui Chemical Co. | 399,000 | 2,331 |
| Nitori Co., Ltd. | 37,000 | 2,318 |
| Ibiden Co., Ltd. | 123,800 | 2,316 |
| Japan Steel Works Ltd. | 326,000 | 2,309 |
| Nippon Meat Packers, Inc. | 168,000 | 2,304 |
| Kajima Corp. | 782,000 | 2,262 |
| Nippon Paper Group, Inc. | 834 | 2,229 |
| Yakult Honsha Co., Ltd. | 89,300 | 2,225 |
| Sankyo Co., Ltd. | 49,800 | 2,216 |
| Tanabe Seiyaku Co., Ltd. | 210,000 | 2,210 |
| Kawasaki Kisen | | |
| Kaisha Ltd. | 554,000 | 2,195 |
| Nissin Food Products | | |
| Co., Ltd. | 76,600 | 2,190 |
| Shinsei Bank, Ltd. | 1,425,000 | 2,186 |
| Takashimaya Co. | 283,000 | 2,181 |
| JGC Corp. | 203,000 | 2,176 |
| FamilyMart Co., Ltd. | 54,500 | 2,159 |
| J. Front Retailing Co., Ltd. | 484,000 | 2,158 |
22
Total International Stock Index Fund
| | | | Market |
| | | | Value• |
| | | Shares | ($000) |
| | Hokuhoku Financial | | |
| | Group, Inc. | 1,087,000 | 2,151 |
| | Teijin Ltd. | 816,000 | 2,122 |
| | Toyo Suisan Kaisha, Ltd. | 82,000 | 2,114 |
| | Taisho Pharmaceutical Co. | 117,000 | 2,107 |
| | Taisei Corp. | 905,000 | 2,086 |
| | The Chugoku Bank, Ltd. | 149,000 | 2,050 |
| | Isuzu Motors Ltd. | 1,163,000 | 2,043 |
| | Yamaha Motor Co., Ltd. | 184,600 | 2,041 |
| | Mitsui Chemicals, Inc. | 583,000 | 2,036 |
| | Kyowa Hakko Kogyo Co. | 244,000 | 2,033 |
| | Makita Corp. | 111,700 | 2,025 |
| | The Suruga Bank, Ltd. | 214,000 | 2,014 |
| | Toho Co., Ltd. | 105,100 | 2,004 |
| | Advantest Corp. | 137,400 | 1,974 |
| | Ube Industries Ltd. | 923,000 | 1,942 |
| | Namco Bandai | | |
| | Holdings Inc. | 188,700 | 1,940 |
| | Fuji Heavy Industries Ltd. | 546,000 | 1,921 |
| | Nippon Electric Glass | | |
| | Co., Ltd. | 318,000 | 1,913 |
| | Kamigumi Co., Ltd. | 240,000 | 1,909 |
| | The Hachijuni Bank Ltd. | 389,000 | 1,909 |
* | | Japan Airlines System Co. | 831,000 | 1,891 |
| | SBI Holdings, Inc. | 15,721 | 1,887 |
| | Sojitz Holdings Corp. | 1,122,800 | 1,876 |
| | Mazda Motor Corp. | 844,000 | 1,872 |
| | Toyota Tsusho Corp. | 193,300 | 1,865 |
| | JSR Corp. | 165,200 | 1,863 |
| | Toyo Seikan Kaisha Ltd. | 149,500 | 1,844 |
| | Gunma Bank Ltd. | 361,000 | 1,843 |
| | Yamaguchi Financial | | |
| | Group, Inc. | 192,000 | 1,836 |
| | Acom Co., Ltd. | 47,670 | 1,821 |
| | Nippon Sheet Glass | | |
| | Co., Ltd. | 554,000 | 1,812 |
| | Shimano, Inc. | 62,500 | 1,788 |
| | Santen Pharmaceutical | | |
| | Co., Ltd. | 69,500 | 1,777 |
| | Nisshin Seifun Group Inc. | 163,000 | 1,767 |
| | Furukawa Electric Co. | 582,000 | 1,758 |
| | Seiko Epson Corp. | 117,000 | 1,757 |
| | Stanley Electric Co. | 138,900 | 1,746 |
| | The Hiroshima Bank, Ltd. | 458,000 | 1,702 |
| | Aioi Insurance Co., Ltd. | 414,000 | 1,700 |
| | Nomura Research | | |
| | Institute, Ltd. | 102,400 | 1,691 |
| | Konami Corp. | 93,400 | 1,690 |
| | NSK Ltd. | 412,000 | 1,682 |
| | Citizen Watch Co., Ltd. | 301,600 | 1,669 |
| ^ | Toto Ltd. | 239,000 | 1,668 |
| | Showa Denko K.K. | 1,088,000 | 1,653 |
| | Mizuho Trust & Banking | | |
| | Co., Ltd. | 1,376,000 | 1,617 |
| | Nippon Sanso Corp. | 257,000 | 1,616 |
| | Credit Saison Co., Ltd. | 148,900 | 1,580 |
| | | Market |
| | | Value• |
| | Shares | ($000) |
| Sumitomo Heavy | | |
| Industries Ltd. | 531,000 | 1,576 |
| Shimadzu Corp. | 229,000 | 1,567 |
| Yamaha Corp. | 161,600 | 1,566 |
^ | Oracle Corp. Japan | 36,000 | 1,565 |
| 77 Bank Ltd. | 332,000 | 1,564 |
| Amada Co., Ltd. | 340,000 | 1,561 |
| Yamazaki Baking Co., Ltd. | 117,000 | 1,555 |
| Brother Industries Ltd. | 225,900 | 1,541 |
| THK Co., Inc. | 111,800 | 1,531 |
| Jupiter | | |
| Telecommunications | | |
| Co., Ltd. | 2,234 | 1,509 |
| IHI Corp. | 1,225,000 | 1,486 |
| NGK Spark Plug Co. | 157,000 | 1,480 |
| Mediceo Paltac | | |
| Holdings Co., Ltd. | 136,600 | 1,480 |
| The Nishi-Nippon | | |
| City Bank, Ltd. | 679,000 | 1,479 |
| Ushio Inc. | 109,200 | 1,475 |
| NTN Corp. | 395,000 | 1,472 |
| Kikkoman Corp. | 145,000 | 1,462 |
| Square Enix Co., Ltd. | 58,000 | 1,461 |
| Shimamura Co., Ltd. | 21,000 | 1,455 |
| AEON Mall Co., Ltd. | 58,800 | 1,452 |
| Nomura Real Estate | | |
| Office Fund, Inc. | 253 | 1,438 |
| Sumitomo Rubber | | |
| Industries Ltd. | 162,900 | 1,437 |
| Showa Shell Sekiyu K.K. | 175,100 | 1,430 |
| Marui Co., Ltd. | 231,100 | 1,413 |
| Casio Computer Co. | 219,000 | 1,407 |
| Susuken Co., Ltd. | 65,600 | 1,402 |
| USS Co., Ltd. | 21,990 | 1,347 |
| JTEKT Corp. | 174,300 | 1,337 |
| Mitsubishi Gas | | |
| Chemical Co. | 363,000 | 1,336 |
| Sega Sammy | | |
| Holdings Inc. | 173,900 | 1,315 |
| Daihatsu Motor Co., Ltd. | 176,000 | 1,303 |
| Kaneka Corp. | 278,000 | 1,297 |
| Sumco Corp. | 119,500 | 1,294 |
| Sapporo Holdings Ltd. | 235,000 | 1,293 |
| Uny Co., Ltd. | 164,000 | 1,278 |
| Keisei Electric Railway | | |
| Co., Ltd. | 259,000 | 1,272 |
| Mitsubishi UFJ Lease | | |
| & Finance Company Ltd. | 53,080 | 1,271 |
| Shinko Securities Co., Ltd. | 497,000 | 1,232 |
| Tokyu Land Corp. | 427,000 | 1,208 |
| Sapporo Hokuyo | | |
| Holdings, Inc. | 277 | 1,195 |
| Japan Retail Fund | | |
| Investment Corp. | 331 | 1,195 |
| Dai Nippon | | |
| Pharmaceutical Co., Ltd. | 151,000 | 1,193 |
23
Total International Stock Index Fund
| | | Market |
| | | Value• |
| | Shares | ($000) |
| Alfresa Holdings Corp. | 27,400 | 1,192 |
| Idemitsu Kosan Co. Ltd. | 20,300 | 1,184 |
| Hitachi Construction | | |
| Machinery Co. | 99,600 | 1,156 |
| Kansai Paint Co., Ltd. | 205,000 | 1,144 |
| Hitachi Metals Ltd. | 152,000 | 1,143 |
| Mabuchi Motor Co. | 28,800 | 1,139 |
| Meiji Dairies Corp. | 246,000 | 1,122 |
| Canon Sales Co. Inc. | 65,900 | 1,102 |
| NTT Urban | | |
| Development Corp. | 1,071 | 1,099 |
| Mitsubishi Rayon Co., Ltd. | 510,000 | 1,095 |
| Cosmo Oil Co., Ltd. | 513,000 | 1,091 |
| Haseko Corp. | 1,205,000 | 1,090 |
| Nissan Chemical | | |
| Industries, Ltd. | 134,000 | 1,083 |
| Coca-Cola West Japan | | |
| Co., Ltd. | 53,900 | 1,081 |
| Hitachi | | |
| High-Technologies Corp. | 65,900 | 1,069 |
| Kinden Corp. | 127,000 | 1,060 |
| Tokyo Tatemono Co., Ltd. | 254,000 | 1,046 |
| Tokuyama Corp. | 205,000 | 1,038 |
| NOK Corp. | 107,500 | 1,024 |
| Hitachi Chemical Co., Ltd. | 98,900 | 1,011 |
| Denki Kagaku Kogyo K.K. | 454,000 | 1,006 |
| Japan Petroleum | | |
| Exploration Co., Ltd. | 26,300 | 1,002 |
| Yokogawa Electric Corp. | 215,900 | 1,000 |
| Taiheiyo Cement Corp. | 857,000 | 998 |
| Mitsumi Electric Co., Ltd. | 75,600 | 994 |
| Mitsubishi Logistics Corp. | 109,000 | 992 |
| Promise Co., Ltd. | 55,000 | 987 |
| Mitsui Mining & | | |
| Smelting Co., Ltd. | 535,000 | 978 |
^ | Ito En, Ltd. | 60,900 | 970 |
^ | Nomura Real Estate | | |
| Holdings Inc. | 49,400 | 968 |
| Yaskawa Electric Corp. | 219,000 | 961 |
| Hakuhodo DY Holdings Inc. | 20,970 | 955 |
| Tosoh Corp. | 476,000 | 949 |
| Nisshin Steel Co. | 706,000 | 945 |
| Japan Prime Realty | | |
| Investment Corp. | 529 | 940 |
| Mitsui Engineering & | | |
| Shipbuilding Co., Ltd. | 671,000 | 939 |
| Asics Corp. | 149,000 | 934 |
| Dai-Nippon Ink & | | |
| Chemicals, Inc. | 562,000 | 908 |
| Daido Steel Co., Ltd. | 286,000 | 906 |
| Leopalace21 Corp. | 121,700 | 906 |
| Onward Kashiyama | | |
| Co., Ltd. | 122,000 | 892 |
| Alps Electric Co., Ltd. | 160,700 | 884 |
| Yamato Kogyo Co., Ltd. | 37,100 | 877 |
| | | | Market |
| | | | Value• |
| | | Shares | ($000) |
| | Daicel Chemical | | |
| | Industries Ltd. | 243,000 | 876 |
| | Minebea Co., Ltd. | 321,000 | 866 |
| | Toyoda Gosei Co., Ltd. | 61,300 | 861 |
| | Takefuji Corp. | 103,610 | 833 |
| ^ | JAFCO Co., Ltd. | 30,100 | 810 |
| | Obic Co., Ltd. | 6,620 | 810 |
| | Tokyo Steel | | |
| | Manufacturing Co. | 104,300 | 806 |
| | Aeon Credit Service | | |
| | Co. Ltd. | 74,400 | 793 |
| | Fuji Electric Holdings | | |
| | Co., Ltd. | 543,000 | 792 |
| | Maruichi Steel Tube Ltd. | 34,600 | 787 |
| | Otsuka Corp. | 14,900 | 749 |
| | Dowa Mining Co., Ltd. | 245,000 | 738 |
| | Nisshinbo Industries, Inc. | 122,000 | 709 |
| | Itochu Techno-Science Corp. | 27,100 | 635 |
| | NHK Spring Co. | 153,000 | 617 |
* | | DeNA Co., Ltd. | 273 | 611 |
| | Tokyo Broadcasting | | |
| | System, Inc. | 32,700 | 579 |
| | Toyota Boshoku Corp. | 63,700 | 568 |
| | Okuma Corp. | 125,000 | 550 |
* | ^ | Elpida Memory Inc. | 102,200 | 545 |
| | CSK Corp. | 64,500 | 539 |
| | Hino Motors, Ltd. | 229,000 | 529 |
| | Aozora Bank, Ltd. | 622,000 | 519 |
| | Tokai Rika Co., Ltd. | 50,900 | 515 |
| | Fuji Television | | |
| | Network, Inc. | 415 | 497 |
| | Osaka Titanium | | |
| | Technologies Co. | 15,900 | 415 |
| | Pioneer Corp. | 139,100 | 413 |
| | Hikari Tsushin, Inc. | 26,000 | 388 |
| | Shinko Electric Industries | | |
| | Co., Ltd. | 58,700 | 378 |
* | ^ | NEC Electronics Corp. | 36,000 | 363 |
| ^ | Toho Titanium Co., Ltd. | 26,900 | 315 |
| | Aiful Corp. | 64,700 | 300 |
| | | | 1,752,322 |
Luxembourg (0.2%) | | |
| | ArcelorMittal (Paris Shares) | 816,594 | 21,239 |
| | SES Global Fiduciary | | |
| | Depositary Receipts | 281,322 | 5,061 |
| | Millicom International | | |
| | Cellular SA | 65,223 | 2,412 |
| | Acergy SA | 181,400 | 1,227 |
| | Reinet Investments SCA | 272,349 | 346 |
| | | | 30,285 |
Malaysia (0.3%) | | |
| | Bumiputra-Commerce | | |
| | Holdings Bhd. | 2,359,200 | 4,111 |
| | Sime Darby Bhd. | 2,250,100 | 3,974 |
| | Malayan Banking Bhd. | 2,280,500 | 3,474 |
| | Genting Bhd. | 2,046,000 | 2,640 |
24
Total International Stock Index Fund
| | | Market |
| | | Value• |
| | Shares | ($000) |
| IOI Corp. Bhd. | 3,126,100 | 2,478 |
| Malaysia International | | |
| Shipping Corp., Bhd. | | |
| (Foreign) | 1,036,500 | 2,387 |
| Public Bank Bhd. | 980,900 | 2,323 |
| Tenaga Nasional Bhd. | 1,207,100 | 2,052 |
| Resorts World Bhd. | 2,855,000 | 2,016 |
| British American | | |
| Tobacco Bhd. | 128,800 | 1,491 |
| Digi.com Bhd. | 285,300 | 1,484 |
| YTL Corp., Bhd. | 748,900 | 1,321 |
* | TM International Bhd. | 987,600 | 1,264 |
| Petronas Gas Bhd. | 451,400 | 1,248 |
| PPB Group Bhd. | 481,400 | 1,056 |
| PLUS Expressways Bhd. | 1,359,400 | 1,021 |
| Kuala Lumpur Kepong | | |
| Bhd. | 434,000 | 1,015 |
| AMMB Holdings Bhd. | 1,608,900 | 981 |
| UMW Holdings Malaysia | | |
| Bhd. | 630,100 | 974 |
| YTL Power International | | |
| Bhd. | 2,052,357 | 967 |
| Telekom Malaysia Bhd. | 943,200 | 892 |
| Berjaya Sports Toto Bhd. | 682,200 | 846 |
| Tanjong Public Ltd. Co. | 204,900 | 688 |
| Hong Leong Bank Bhd. | 438,700 | 652 |
| Gamuda Bhd. | 1,433,700 | 613 |
| SP Setia Bhd. | 758,700 | 601 |
| IJM Corp. Bhd. | 698,000 | 507 |
| Malaysia Mining Corp., | | |
| Bhd. | 882,900 | 495 |
| Petronas Dagangan Bhd. | 233,200 | 442 |
| Bursa Malaysia Bhd. | 293,600 | 432 |
| KNM Group Bhd. | 2,493,400 | 423 |
| Alliance Financial Group | | |
| Bhd. | 791,400 | 411 |
| RHB Capital Bhd. | 407,800 | 355 |
| KLCC Property Holdings | | |
| Bhd. | 445,900 | 342 |
| Malaysian Airline System | | |
| Bhd. | 411,300 | 331 |
* | Airasia Bhd. | 1,024,200 | 330 |
* | UEM World Bhd. | 571,000 | 314 |
| IGB Corp., Bhd. | 861,300 | 313 |
| Hong Leong Financial | | |
| Group Bhd. | 259,400 | 282 |
| Lafarge Malayan Cement | | |
| Bhd. | 327,700 | 265 |
| Parkson Holdings, Bhd. | 279,100 | 265 |
| Astro All Asia Networks | | |
| PLC | 372,600 | 222 |
| Asiatic Development Bhd. | 212,000 | 189 |
* | IJM Land Corp. Bhd. | | |
| Warrants Exp. 9/11/13 | 55,190 | 3 |
| | | 48,490 |
| | | Market |
| | | Value• |
| | Shares | ($000) |
Mexico (0.5%) | | |
| America Movil SA de CV | 16,848,000 | 26,095 |
| Grupo Televisa SA CPO | 2,304,400 | 8,084 |
| Wal-Mart de Mexico SA | 2,762,500 | 7,428 |
| Telefonos de Mexico SA | 5,952,500 | 5,343 |
| Fomento Economico | | |
| Mexicano UBD | 2,012,700 | 5,099 |
| Cemex SA CPO | 6,557,400 | 4,923 |
| Telmex Internacional | | |
| SAB de CV | 6,346,417 | 3,334 |
| Grupo Mexico SA de CV | 3,560,920 | 2,781 |
* | Carso Global Telecom | | |
| SAB de CV | 649,900 | 2,485 |
| Grupo Financerio Banorte | | |
| SA de CV | 1,227,400 | 2,248 |
| Grupo Financiero Inbursa, | | |
| SA de CV | 825,291 | 2,190 |
| Grupo Elektra SA de CV | 66,785 | 1,801 |
| Kimberly Clark de Mexico | | |
| SA de CV Series A | 510,200 | 1,677 |
| Grupo Modelo SA | 484,100 | 1,493 |
| Grupo Carso SA de CV | | |
| Series A1 | 530,100 | 1,450 |
| Grupo Bimbo SA | 272,300 | 1,307 |
| Industrias Penoles | | |
| SA Series CP | 91,495 | 821 |
| Coca-Cola Femsa | | |
| SA de CV | 249,900 | 792 |
* | Desarrolladora Homex | | |
| SA de CV | 182,900 | 703 |
* | URBI Desarrollos Urbanos | | |
| SA de CV | 408,700 | 613 |
* | Empresas ICA SA de CV | 423,114 | 608 |
| Alfa SA de CV Series A | 285,700 | 592 |
* | Corporacion GEO, | | |
| SA de CV | 397,100 | 551 |
| Grupo Aeroportuario | | |
| del Pacifico SA ADR | 23,526 | 430 |
| Banco Conpartamos | | |
| SA de CV | 217,900 | 371 |
| Grupo Aeroportuario del | | |
| Pacifico SA | 188,900 | 345 |
* | Axtel, SAB de CV | 457,000 | 238 |
| Controladora Comercial | | |
| Mexicana SA | | |
| de CV (Units) | 322,700 | 89 |
| Cemex SAB de CV ADR | 1,466 | 11 |
| | | 83,902 |
Netherlands (1.1%) | | |
| Unilever NV | 1,524,106 | 36,730 |
| Koninklijke KPN NV | 1,687,532 | 23,766 |
| Koninklijke (Royal) Philips | | |
| Electronics NV | 960,231 | 17,745 |
| ING Groep NV | 1,795,268 | 16,840 |
| Koninklijke Ahold NV | 1,114,572 | 11,965 |
| Akzo Nobel NV | 256,004 | 10,641 |
25
Total International Stock Index Fund
| | | | Market |
| | | | Value• |
| | | Shares | ($000) |
| | Reed Elsevier NV | 587,815 | 7,857 |
| | Heineken NV | 227,585 | 7,677 |
| | TNT NV | 351,650 | 7,421 |
| | ASML Holding NV | 405,914 | 7,106 |
| | Aegon NV | 1,293,773 | 5,376 |
| | European Aeronautic | | |
| | Defence and Space Co. | 311,011 | 5,173 |
| | Wolters Kluwer NV | 273,808 | 4,847 |
| | Koninklijke DSM NV | 130,317 | 3,629 |
| | Heineken Holding NV | 102,654 | 3,116 |
| | SBM Offshore NV | 131,287 | 2,309 |
| | Corio NV | 39,753 | 2,124 |
| | Fugro NV | 53,999 | 1,930 |
| | Randstad Holding NV | 90,769 | 1,764 |
| | Koninklijke Boskalis | | |
| | Westminster NV | 51,108 | 1,687 |
| | SNS REAAL | 119,855 | 879 |
* | | TomTom NV | 58,659 | 447 |
| | | | 181,029 |
New Zealand (0.0%) | | |
| | Telecom Corp. of | | |
| | New Zealand Ltd. | 1,685,893 | 2,285 |
| | Fletcher Building Ltd. | 467,059 | 1,586 |
| | Contact Energy Ltd. | 278,630 | 1,181 |
| | Sky City Entertainment | | |
| | Group Ltd. | 518,094 | 1,000 |
| | Auckland International | | |
| | Airport Ltd. | 929,943 | 995 |
| | | | 7,047 |
Norway (0.3%) | | |
| | StatoilHydro ASA | 1,204,100 | 24,219 |
| | Orkla ASA | 774,900 | 5,159 |
| | Telenor ASA | 784,400 | 4,681 |
| | DnB NOR ASA | 684,800 | 3,969 |
| | Yara International ASA | 175,900 | 3,675 |
| | Norsk Hydro ASA | 638,460 | 2,668 |
| | Seadrill Ltd. | 260,600 | 2,509 |
| ^ | Frontline Ltd. | 49,350 | 1,535 |
* | | Renewable Energy Corp. | | |
| | AS | 135,600 | 1,279 |
| | Storebrand ASA | 355,200 | 842 |
| | Aker Solutions ASA | 151,110 | 826 |
* | | Petroleum Geo-Services | | |
| | ASA | 157,000 | 782 |
| | | | 52,144 |
Peru (0.1%) | | |
| | Credicorp Ltd. | 63,155 | 2,441 |
| | Southern Copper Corp. | | |
| | (U.S. Shares) | 145,500 | 2,118 |
| | Southern Copper Corp. | 102,235 | 1,482 |
| | Compania de Minas | | |
| | Buenaventura SA | 113,540 | 1,431 |
| | Compania Minera Milpo | | |
| | SA | 509,777 | 721 |
| | | Market |
| | | Value• |
| | Shares | ($000) |
| Compania de Minas | | |
| Buenaventura SA ADR | 40,215 | 508 |
| Minsur SA | 343,080 | 406 |
| Volcan Compania Minera | | |
| SA | 455,661 | 216 |
| | | 9,323 |
Philippines (0.1%) | | |
| Philippine Long Distance | | |
| Telephone Co. | 51,110 | 2,091 |
| Bank of Philippine Islands | 1,298,600 | 1,075 |
| Ayala Corp. | 174,270 | 838 |
| SM Investments Corp. | 160,390 | 650 |
| SM Prime Holdings, Inc. | 3,570,000 | 614 |
| Ayala Land, Inc. | 4,924,700 | 597 |
| Globe Telecom, Inc. | 30,490 | 566 |
| Manila Electric Co. | 426,200 | 515 |
| Banco De Oro | 743,600 | 413 |
| Jollibee Foods Corp. | 404,300 | 382 |
| PNOC Energy | | |
| Development Corp. | 5,618,000 | 341 |
| Metropolitan Bank | | |
| & Trust Co. | 523,100 | 277 |
| International Container | | |
| Terminal Services, Inc. | 779,600 | 226 |
| Megaworld Corp. | 8,762,000 | 142 |
| | | 8,727 |
Poland (0.2%) | | |
| Powszechna Kasa | | |
| Oszczednosci | | |
| Bank Polski SA | 476,043 | 5,378 |
| Bank Polska Kasa | | |
| Opieki Grupa Pekao SA | 109,851 | 4,996 |
| Telekomunikacja Polska SA | 640,252 | 4,838 |
| Polski Koncern Naftowy | | |
| SA | 296,281 | 3,021 |
| Polish Oil & Gas | 1,085,280 | 1,301 |
| KGHM Polska Miedz SA | 111,059 | 1,233 |
| Asseco Poland SA | 54,983 | 928 |
| Bank Zachodni WBK SA | 20,674 | 912 |
| TVN SA | 147,143 | 736 |
* | Globe Trade Centre SA | 114,482 | 676 |
* | Getin Holding SA | 290,808 | 606 |
* | PBG SA | 7,956 | 561 |
* | Bank Rozwoju Eksportu SA | 8,084 | 545 |
| Polimex Mostostal SA | 387,830 | 430 |
| BIG Bank Gdanski SA | 273,517 | 389 |
| Orbis SA | 25,869 | 354 |
* | Grupa Lotos SA | 47,812 | 338 |
* | Cersanit-Krasnystaw SA | 67,579 | 317 |
| Agora SA | 39,133 | 276 |
* | Echo Investment SA | 261,026 | 232 |
* | Bioton SA | 1,629,316 | 231 |
| Bank Przemyslowo | | |
| Handlowy PBK SA | 8,586 | 154 |
| | | 28,452 |
26
Total International Stock Index Fund
| | | Market |
| | | Value• |
| | Shares | ($000) |
Portugal (0.1%) | | |
| Electricidade de Portugal | | |
| SA | 1,732,582 | 5,901 |
| Portugal Telecom SGPS | | |
| SA | 594,167 | 3,908 |
| Banco Comercial | | |
| Portugues SA | 2,184,811 | 2,539 |
| Brisa-Auto Estradas de | | |
| Portugal SA | 269,227 | 2,066 |
| Banco Espirito Santo SA | 205,471 | 1,956 |
| Cimpor-Cimento de | | |
| Portugal SA | 239,531 | 1,093 |
| Jeronimo Martins, | | |
| SGPS, SA | 193,768 | 989 |
| Zon Multimedia Servicos | | |
| de Telecomunicacoes e | | |
| Multimedia SGPS SA | 150,222 | 762 |
| Banco BPI SA | 324,389 | 669 |
| Sonae SGPS SA | 837,787 | 509 |
| | | 20,392 |
Russia (0.7%) | | |
| OAO Gazprom Sponsored | | |
| ADR | 2,216,636 | 44,140 |
| LUKOIL Sponsored ADR | 435,500 | 16,719 |
| Sberbank | 8,120,173 | 8,881 |
| MMC Norilsk Nickel ADR | 798,400 | 8,012 |
| Mobile TeleSystems ADR | 186,177 | 7,289 |
| OAO | | |
| Vimpel-Communications | | |
| Sponsored ADR | 435,037 | 6,308 |
| Rosneft Oil Co. GDR | 1,172,937 | 5,383 |
| Surgutneftegaz OJSC | | |
| ADR | 711,400 | 4,599 |
| Uralkali | 675,869 | 2,953 |
| NovaTek OAO GDR | 70,528 | 2,789 |
| Tatneft GDR | 63,100 | 2,764 |
| VTB Bank OJSC GDR | 798,900 | 2,522 |
| Rostelecom ADR | 55,772 | 2,078 |
| Polyus Gold ADR | 137,200 | 1,523 |
| Surgutneftegaz Pfd. | 6,192,037 | 1,452 |
| Mechel OAO ADR | 136,475 | 1,251 |
* | Pharmstandard-GDR | 73,890 | 1,176 |
| Novolipetsk Steel GDR | 87,620 | 825 |
* | Hydro OGK | 44,186,824 | 816 |
| Gazprom Neft | 298,494 | 681 |
| Cherepovets | | |
| MK Severstal GDR | 185,450 | 644 |
* | Wimm-Bill-Dann Foods | | |
| ADR | 12,680 | 557 |
* | PIK Group-GDR | 88,600 | 532 |
| OAO TMK-GDR | 49,100 | 531 |
| Sistema JSFC GDR | 69,983 | 528 |
| OAO Transneft | 1,401 | 460 |
| Comstar United | | |
| Telesystems GDR | 154,337 | 432 |
| | | Market |
| | | Value• |
| | Shares | ($000) |
| Magnitogorsk Iron & | | |
| Steel Works GDR | 121,400 | 359 |
| Sberbank Pfd. | 222,031 | 100 |
| | | 126,304 |
Singapore (0.5%) | | |
| Singapore | | |
| Telecommunications | | |
| Ltd. | 7,459,000 | 12,553 |
| United Overseas | | |
| Bank Ltd. | 1,144,000 | 10,343 |
| DBS Group Holdings Ltd. | 1,059,000 | 8,084 |
| Oversea-Chinese Banking | | |
| Corp., Ltd. | 2,370,000 | 8,013 |
| Singapore Airlines Ltd. | 502,000 | 3,846 |
| Keppel Corp., Ltd. | 1,183,000 | 3,688 |
| Capitaland Ltd. | 1,586,000 | 3,179 |
| Singapore Press | | |
| Holdings Ltd. | 1,409,000 | 3,078 |
| Singapore Exchange Ltd. | 803,000 | 2,874 |
| City Developments Ltd. | 474,000 | 2,096 |
| Singapore Technologies | | |
| Engineering Ltd. | 1,230,000 | 1,942 |
| Fraser & Neave Ltd. | 895,000 | 1,689 |
| Sembcorp Industries Ltd. | 901,000 | 1,514 |
| ComfortDelGro Corp. Ltd. | 1,759,000 | 1,443 |
| CapitaMall Trust | 1,082,000 | 1,435 |
| Wilmar International Ltd. | 755,000 | 1,306 |
| Noble Group Ltd. | 1,426,000 | 1,038 |
| Ascendas REIT | 919,000 | 1,023 |
| SembCorp Marine Ltd. | 788,000 | 979 |
^ | Olam International Ltd. | 1,099,000 | 967 |
| Parkway Holdings Ltd. | 845,000 | 906 |
| Jardine Cycle N | | |
| Carriage Ltd. | 129,000 | 827 |
| Venture Corp. Ltd. | 197,000 | 720 |
| Golden | | |
| Agri-Resources Ltd. | 4,675,000 | 624 |
| United Overseas | | |
| Land Ltd. | 474,000 | 620 |
| Capitacommercial Trust | 876,000 | 602 |
| Cosco Corp. | | |
| Singapore Ltd. | 838,000 | 459 |
| Keppel Land Ltd. | 357,000 | 459 |
| Neptune Orient Lines Ltd. | 516,000 | 436 |
| Yanlord Land Group Ltd. | 382,000 | 196 |
| | | 76,939 |
South Africa (0.7%) | | |
| MTN Group Ltd. | 1,493,446 | 16,770 |
| Sasol Ltd. | 564,104 | 16,651 |
| Standard Bank Group Ltd. | 1,065,764 | 8,462 |
| Naspers Ltd. | 359,424 | 5,984 |
| Impala Platinum | | |
| Holdings Ltd. | 503,119 | 5,251 |
| AngloGold Ltd. | 256,725 | 4,879 |
| Gold Fields Ltd. | 598,854 | 4,169 |
| FirstRand Ltd. | 2,588,240 | 3,760 |
27
Total International Stock Index Fund
| | | Market |
| | | Value• |
| | Shares | ($000) |
| Sanlan Ltd. | 1,950,308 | 3,201 |
| Remgro Ltd. | 427,565 | 3,144 |
| Telkom South Africa Ltd. | 273,735 | 2,971 |
| ABSA Group Ltd. | 281,962 | 2,950 |
| Anglo Platinum Ltd. | 68,162 | 2,816 |
| Bidvest Group Ltd. | 237,432 | 2,532 |
* | Harmony Gold | | |
| Mining Co., Ltd. | 313,009 | 2,289 |
| Tiger Brands Ltd. | 151,512 | 2,197 |
| Shoprite Holdings Ltd. | 399,862 | 2,111 |
| African Bank | | |
| Investments Ltd. | 750,075 | 2,057 |
| Nedbank Group Ltd. | 193,172 | 1,875 |
| Murray & Roberts | | |
| Holdings Ltd. | 275,794 | 1,867 |
| Aveng Ltd. | 368,514 | 1,822 |
| ArcelorMittal | | |
| South Africa, Ltd. | 184,262 | 1,742 |
| Massmart Holdings Ltd. | 188,191 | 1,688 |
| RMB Holdings Ltd. | 684,564 | 1,595 |
| Pretoria Portland | | |
| Cement Co. Ltd. | 494,802 | 1,523 |
| Steinhoff International | | |
| Holdings Ltd. | 976,847 | 1,424 |
| Truworths International Ltd. | 415,252 | 1,411 |
| Sappi Ltd. | 201,405 | 1,242 |
| Barloworld Ltd. | 190,450 | 1,113 |
| African Rainbow | | |
| Minerals Ltd. | 108,286 | 1,108 |
| Kumba Iron Ore Ltd. | 73,006 | 961 |
| Imperial Holdings Ltd. | 164,892 | 942 |
| Woolworths Holdings Ltd. | 745,907 | 861 |
| Investec Ltd. | 174,319 | 860 |
| Reunert Ltd. | 166,011 | 838 |
* | Aspen Pharmacare | | |
| Holdings Ltd. | 237,989 | 832 |
| Network Healthcare | | |
| Holdings Ltd. | 1,179,837 | 829 |
| Foschini Ltd. | 198,385 | 816 |
| Exxaro Resources Ltd. | 107,979 | 713 |
| Liberty Group Ltd. | 106,315 | 669 |
| Pick’n Pay Stores Ltd. | 204,434 | 646 |
| Northam Platinum Ltd. | 109,074 | 343 |
| | | 119,914 |
South Korea (1.3%) | | |
| Samsung | | |
| Electronics Co., Ltd. | 88,796 | 37,437 |
| POSCO | 37,391 | 10,299 |
| KT & G Corp. | 107,390 | 6,893 |
| Hyundai Motor Co., Ltd. | 144,398 | 6,672 |
| LG Electronics Inc. | 87,908 | 6,563 |
| Shinhan Financial | | |
| Group Co. Ltd. | 259,060 | 6,303 |
| Samsung | | |
| Electronics Co., Ltd. GDR | 29,130 | 6,014 |
* | KB Financial Group, Inc. | 229,087 | 5,679 |
| | | Market |
| | | Value• |
| | Shares | ($000) |
| POSCO ADR | 80,156 | 5,386 |
| Hyundai Heavy | | |
| Industries Co., Inc. | 39,366 | 5,201 |
| Samsung Electronics | | |
| Co., Ltd. Pfd. | 19,268 | 5,060 |
| Samsung Fire & | | |
| Marine Insurance Co. | 35,504 | 4,702 |
| Shinsegae Co., Ltd. | 13,261 | 4,654 |
| Samsung Corp. | 129,738 | 4,157 |
| SK Telecom Co., Ltd. | 24,299 | 3,857 |
* | NHN Corp. | 35,532 | 3,781 |
| LG Corp. | 90,788 | 3,634 |
| Korea Electric Power Corp. | 173,370 | 3,445 |
| SK Energy Co., Ltd. | 54,981 | 3,163 |
| Hyundai Mobis | 52,669 | 3,093 |
| LG. Philips LCD Co., Ltd. | 165,300 | 3,065 |
| LG Chem Ltd. | 48,524 | 2,946 |
| KT Corp. | 102,550 | 2,610 |
* | Hynix Semiconductor Inc. | 296,420 | 2,540 |
| Samsung | | |
| Securities Co. Ltd. | 46,121 | 2,346 |
| Samsung Heavy | | |
| Industries Co., Ltd. | 150,540 | 2,318 |
| SK Holdings Co Ltd | 32,327 | 2,168 |
| S-Oil Corp. | 42,182 | 2,137 |
| SK Telecom Co., Ltd. ADR | 118,738 | 2,043 |
| Hana Financial Group Inc. | 125,140 | 1,987 |
* | KB Financial Group, Inc. | 79,188 | 1,949 |
| Hyundai Engineering & | | |
| Construction Co., Ltd. | 46,720 | 1,918 |
| DC Chemical Co., Ltd. | 11,149 | 1,823 |
* | Samsung SDI Co. Ltd. | 31,908 | 1,792 |
| Samsung | | |
| Electro-Mechanics Co. | 59,120 | 1,741 |
| Hyundai Development Co. | 56,210 | 1,521 |
| Hyundai Steel Co. | 51,284 | 1,488 |
| Shinhan Financial | | |
| Group Co., Ltd. ADR | 29,793 | 1,482 |
* | Kia Motors | 175,790 | 1,481 |
* | Korea Telecom Freetel | 69,950 | 1,467 |
| GS Engineering & | | |
| Construction Corp. | 30,360 | 1,442 |
| Cheil Industrial, Inc. | 42,844 | 1,398 |
| Korea Exchange Bank | 240,290 | 1,337 |
| Korea Electric Power Corp. | | |
| ADR | 133,112 | 1,318 |
| Lotte Shopping Co., Ltd. | 9,491 | 1,299 |
| Amorepacific Corp. | 2,936 | 1,291 |
| Doosan Heavy Industries | | |
| and Construction Co., Ltd. | 28,712 | 1,265 |
| LG Household & | | |
| Health Care Ltd. | 8,634 | 1,233 |
| Woori Finance | | |
| Holdings Co., Ltd. | 225,490 | 1,210 |
| Samsung | | |
| Engineering Co., Ltd. | 30,193 | 1,208 |
28
Total International Stock Index Fund
| | | Market |
| | | Value• |
| | Shares | ($000) |
| Daewoo Engineering & | | |
| Construction Co., Ltd. | 165,330 | 1,148 |
| Samsung Techwin Co., Ltd. | 51,530 | 1,092 |
| Daewoo Securities Co., Ltd. | 111,470 | 1,060 |
| Mirae Asset | | |
| Securities Co., Ltd. | 20,721 | 1,035 |
| Kangwon Land Inc. | 96,620 | 989 |
| Industrial Bank of Korea | 170,550 | 980 |
| Hyundai Mipo | | |
| Dockyard Co., Ltd. | 11,273 | 968 |
| Kumkang Korea | | |
| Chemical Co., Ltd. | 4,944 | 965 |
| Korean Air Co. Ltd. | 32,620 | 923 |
| GS Holdings Corp. | 46,190 | 922 |
| Woongjin Coway Co., Ltd. | 43,900 | 903 |
| LG Telecom Ltd. | 123,770 | 882 |
| Hankook Tire Co. Ltd. | 85,720 | 830 |
| Samsung Card Co. Ltd. | 35,070 | 828 |
| Daewoo Shipbuilding & | | |
| Marine Engineering | | |
| Co., Ltd. | 86,610 | 816 |
| Korea Gas Corp. | 20,997 | 791 |
| Hyundai Securities Co. | 128,390 | 788 |
* | CJ Cheiljedang Corp. | 6,697 | 780 |
| Daelim Industrial Co. | 26,099 | 754 |
| Korea Investment | | |
| Holdings Co., Ltd. | 35,810 | 735 |
| Woori Investment & | | |
| Securities Co., Ltd. | 77,870 | 727 |
| LS Cable Ltd. | 16,751 | 708 |
| Hanjin Shipping Co., Ltd. | 53,810 | 708 |
| KT Corp. ADR | 55,567 | 697 |
* | STX Pan Ocean Co., Ltd. | 926,800 | 655 |
| Hyundai Department | | |
| Store Co., Ltd. | 13,398 | 655 |
* | Hite Brewery Co., Ltd. | 4,853 | 648 |
| Hanwha Corp. | 40,550 | 635 |
* | Doosan Corp. | 8,751 | 635 |
| Doosan Infracore Co., Ltd. | 72,000 | 613 |
| Lotte Confectionery | | |
| Co., Ltd. | 694 | 592 |
| Pusan Bank | 113,610 | 580 |
| Daegu Bank | 114,080 | 580 |
| Hyundai Motor Co., Ltd. | | |
| 2nd Pfd. | 36,660 | 553 |
| Dongkuk Steel Mill Co., Ltd. | 33,470 | 544 |
| LG Dacom Corp. | 38,410 | 543 |
| Honam Petrochemical Corp. | 13,091 | 536 |
| S1 Corp. | 15,430 | 525 |
| Hyosung Corp. | 20,849 | 497 |
| Daewoo International Corp. | 43,000 | 477 |
| STX Shipbuilding Co., Ltd. | 40,550 | 469 |
* | SK Networks Co., Ltd. | 69,410 | 442 |
| LG Electronics Inc. Pfd. | 15,900 | 425 |
| | | Market |
| | | Value• |
| | Shares | ($000) |
| Korea Zinc Co., Ltd. | 7,812 | 391 |
| Hanjin Heavy Industries & | | |
| Construction Co., Ltd. | 26,850 | 382 |
| Korea Line Corp. | 6,361 | 341 |
| Dongbu Insurance Co., Ltd. | 32,200 | 328 |
| Taihan Electric Wire Co., Ltd. | 22,310 | 318 |
| Hanwha Chemical Corp. | 67,130 | 291 |
| Tong Yang Investment Bank | 69,430 | 286 |
| Kumho Industrial Co., Ltd. | 25,400 | 232 |
| | | 224,018 |
Spain (1.7%) | | |
| Telefonica SA | 4,019,533 | 74,421 |
| Banco Santander | | |
| Central Hispano SA | 5,865,573 | 63,437 |
| Banco Bilbao Vizcaya | | |
| Argentaria SA | 3,331,318 | 38,664 |
| Iberdrola SA | 3,272,596 | 23,685 |
| Repsol YPF SA | 689,559 | 13,113 |
* | Union Fenosa, SA | 339,434 | 7,202 |
| Industria de Diseno | | |
| Textil SA | 205,291 | 6,939 |
| ACS, Actividades de | | |
| Contruccion y Servisios, | | |
| SA | 183,394 | 6,809 |
| Banco Popular Espanol SA | 732,694 | 6,668 |
| Banco de Sabadell SA | 853,924 | 5,824 |
| Red Electrica de Espana SA | 103,498 | 4,536 |
| Abertis Infraestructuras SA | 251,107 | 4,312 |
| Enagas SA | 166,640 | 3,256 |
| Gas Natural SDG SA | 105,136 | 3,236 |
| Gamesa Corporacion | | |
| Tecnologica SA | 168,392 | 2,761 |
| Bankinter SA | 245,773 | 2,652 |
| Criteria Caixacorp SA | 780,727 | 2,526 |
| Acciona SA | 26,496 | 2,506 |
* | Iberdrola Renovables | 777,154 | 2,364 |
| Grifols SA | 117,371 | 2,336 |
| Zardoya Otis SA | 120,187 | 2,277 |
| Corporacion Mapfre SA | 638,637 | 2,032 |
| Cintra Concesiones de | | |
| Infraestructuras de | | |
| Transport SA | 205,036 | 1,824 |
| Grupo Ferrovial SA | 58,205 | 1,794 |
| Indra Sistemas, SA | 91,312 | 1,774 |
| Fomento de Construc | | |
| y Contra SA | 42,230 | 1,679 |
| Acerinox SA | 129,350 | 1,626 |
* | Banco Santander SA | 120,176 | 1,320 |
| Iberia (Linea Aerea Espana) | 424,542 | 1,002 |
| Gestevision Telecinco SA | 102,732 | 825 |
| Sacyr Vallehermoso SA | 72,902 | 672 |
| Promotora de | | |
| Informaciones SA | 81,026 | 317 |
| | | 294,389 |
29
Total International Stock Index Fund
| | | Market |
| | | Value• |
| | Shares | ($000) |
Sweden (0.8%) | | |
| Telefonaktiebolaget LM | | |
| Ericsson AB Class B | 2,774,000 | 18,884 |
| Hennes & Mauritz AB | | |
| B Shares | 478,300 | 17,152 |
| Nordea Bank AB | 1,946,200 | 15,599 |
| TeliaSonera AB | 2,105,000 | 9,261 |
| Svenska Handelsbanken | | |
| AB A Shares | 426,100 | 7,830 |
| Investor AB B Shares | 423,200 | 6,382 |
| Sandvik AB | 957,200 | 6,212 |
| Volvo AB B Shares | 1,015,500 | 5,307 |
| Atlas Copco AB A Shares | 631,100 | 5,293 |
^ | Skandinaviska Enskilda | | |
| Banken AB A Shares | 427,000 | 4,232 |
| Svenska Cellulosa AB | | |
| B Shares | 530,200 | 3,915 |
| Swedish Match AB | 239,000 | 3,319 |
| Assa Abloy AB | 294,400 | 3,287 |
| SKF AB B Shares | 360,400 | 3,283 |
| Skanska AB B Shares | 351,000 | 3,083 |
| Securitas AB B Shares | 292,200 | 2,806 |
| Scania AB B Shares | 340,700 | 2,800 |
^ | Swedbank AB A Shares | 332,600 | 2,749 |
| Atlas Copco AB B Shares | 362,800 | 2,716 |
| Alfa Laval AB | 350,700 | 2,532 |
| Tele2 AB B Shares | 281,350 | 2,401 |
| Getinge AB B Shares | 169,600 | 2,372 |
| Electrolux AB Series B | 232,600 | 2,141 |
| SSAB Svenskt Stal | | |
| AB Series A | 172,600 | 1,745 |
| Husqvarna AB B Shares | 248,000 | 1,719 |
| Holmen AB | 50,100 | 1,412 |
| Modern Times Group | | |
| AB B Shares | 48,100 | 1,032 |
* | Lundin Petroleum AB | 202,000 | 964 |
| SSAB Svenskt Stal | | |
| AB Series B | 76,800 | 696 |
| Boliden AB | 266,100 | 640 |
| | | 141,764 |
Switzerland (3.7%) | | |
| Nestle SA (Registered) | 3,677,639 | 143,012 |
| Novartis AG (Registered) | 2,226,068 | 112,991 |
| Roche Holdings AG | 657,327 | 100,523 |
* | UBS AG | 2,749,994 | 46,660 |
| Credit Suisse Group | | |
| (Registered) | 978,858 | 36,603 |
| Zurich Financial Services | | |
| AG | 136,206 | 27,633 |
| ABB Ltd. | 2,058,809 | 27,014 |
| Syngenta AG | 97,443 | 18,215 |
| Swiss Re (Registered) | 330,799 | 13,796 |
| Holcim Ltd. (Registered) | 196,111 | 11,139 |
* | Compagnie Financiere | | |
| Richemont SA | 485,692 | 10,211 |
| Julius Baer Holding, Ltd. | 196,548 | 7,687 |
| | | Market |
| | | Value• |
| | Shares | ($000) |
| Synthes, Inc. | 55,351 | 7,143 |
| Swisscom AG | 21,482 | 6,564 |
* | Actelion Ltd. | 91,295 | 4,823 |
| Swatch Group AG (Bearer) | 29,267 | 4,567 |
| SGS Societe Generale de | | |
| Surveillance Holding SA | | |
| (Registered) | 4,498 | 4,428 |
| Givaudan SA | 6,220 | 4,238 |
| Adecco SA (Registered) | 117,221 | 4,078 |
| Geberit AG | 36,751 | 3,818 |
| Lonza AG (Registered) | 44,148 | 3,664 |
| Kuehne & | | |
| Nagel International AG | 52,104 | 3,155 |
| Swiss Life Holding | 32,558 | 2,934 |
| Baloise Holdings AG | 47,278 | 2,528 |
* | Logitech International SA | 159,099 | 2,372 |
| Schindler Holding AG | | |
| (Bearer Participation | | |
| Certificates) | 47,216 | 2,044 |
| Pargesa Holding SA | 24,917 | 1,909 |
| Nobel Biocare Holding AG | 109,719 | 1,885 |
| Sonova Holding AG | 43,356 | 1,801 |
| Lindt & Spruengli AG | 764 | 1,644 |
| Sulzer AG (Registered) | 25,539 | 1,508 |
* | Aryzta AG | 42,039 | 1,486 |
| Swatch Group AG | | |
| (Registered) | 48,179 | 1,380 |
| Straumann Holding AG | 7,080 | 1,202 |
* | Aryzta AG (Ireland Shares) | 32,890 | 1,174 |
| EFG International | 49,100 | 1,057 |
* | OC Oerlikon Corp AG | 6,649 | 516 |
| | | 627,402 |
Taiwan (1.1%) | | |
| Taiwan Semiconductor | | |
| Manufacturing Co., Ltd. | 14,901,000 | 21,682 |
| Hon Hai Precision | | |
| Industry Co., Ltd. | 5,403,900 | 13,043 |
| MediaTek Inc. | 848,000 | 7,594 |
| Chunghwa Telecom | | |
| Co., Ltd. | 4,402,120 | 7,283 |
| Taiwan Semiconductor | | |
| Manufacturing Co., Ltd. | | |
| ADR | 875,404 | 7,231 |
| High Tech | | |
| Computer Corp. | 555,000 | 6,579 |
| Nan Ya Plastic Corp. | 4,615,000 | 6,396 |
| China Steel Corp. | 8,822,000 | 6,371 |
| Formosa Plastic Corp. | 3,732,000 | 6,298 |
| Cathay Financial | | |
| Holding Co. | 5,562,000 | 5,974 |
| Asustek Computer Inc. | 3,496,099 | 5,008 |
| Formosa Chemicals & | | |
| Fibre Corp. | 2,643,000 | 4,273 |
| AU Optronics Corp. | 5,509,000 | 3,847 |
| Delta Electronics Inc. | 1,458,000 | 3,309 |
| Acer Inc. | 2,427,000 | 3,130 |
30
Total International Stock Index Fund
| | Market |
| | Value• |
| Shares | ($000) |
United | | |
Microelectronics Corp. | 9,796,175 | 2,690 |
Formosa | | |
Petrochemical Corp. | 1,123,000 | 2,566 |
Fuhwa Financial | | |
Holdings Co., Ltd. | 6,555,000 | 2,564 |
Uni-President | | |
Enterprises Co. | 2,884,250 | 2,465 |
Compal Electronics Inc. | 3,416,385 | 2,452 |
Fubon Financial | | |
Holding Co., Ltd. | 3,925,000 | 2,381 |
Taiwan Cellular Corp. | 1,692,000 | 2,339 |
Siliconware Precision | | |
Industries Co. | 2,161,000 | 2,231 |
Chinatrust | | |
Financial Holding | 7,549,795 | 2,157 |
Mega Financial | | |
Holding Co. Ltd. | 7,658,000 | 2,119 |
Quanta Computer Inc. | 1,830,000 | 1,926 |
First Financial | | |
Holding Co., Ltd. | 4,011,912 | 1,892 |
China Development | | |
Financial Holding Corp. | 8,464,625 | 1,664 |
Far EasTone | | |
Telecommunications | | |
Co., Ltd. | 1,520,000 | 1,611 |
Chunghwa | | |
Telecom Co., Ltd. | 95,280 | 1,568 |
Taiwan Cooperative Bank | 3,110,000 | 1,495 |
Far Eastern Textile Ltd. | 2,562,920 | 1,488 |
Hau Nan Financial | | |
Holdings Co., Ltd. | 2,801,860 | 1,477 |
Chi Mei | | |
Optoelectronics Corp. | 3,955,000 | 1,455 |
Advanced Semiconductor | | |
Engineering Inc. | 3,289,060 | 1,401 |
Taiwan Cement Corp. | 2,600,000 | 1,335 |
Chang Hwa | | |
Commercial Bank | 3,457,000 | 1,324 |
Innolux Display Corp. | 1,694,900 | 1,271 |
SinoPac Holdings | 5,423,000 | 1,150 |
Catcher | | |
Technology Co., Ltd. | 440,000 | 1,117 |
Lite-On Technology Corp. | 1,779,855 | 1,111 |
Foxconn Technology | | |
Co., Ltd. | 451,000 | 1,105 |
United Microelectronics | | |
Corp. ADR | 447,528 | 1,096 |
President Chain | | |
Store Corp. | 461,000 | 1,070 |
Synnex Technology | | |
International Corp. | 806,000 | 1,046 |
Shin Kong Financial | | |
Holdings Co. | 3,659,947 | 968 |
Asia Cement Corp. | 1,548,780 | 918 |
Wistron Corp. | 1,115,242 | 882 |
| | | Market |
| | | Value• |
| | Shares | ($000) |
| Largan Precision Co., Ltd. | 83,820 | 855 |
| Pou Chen Corp. | 1,869,000 | 852 |
| Taiwan Fertilizer Co., Ltd. | 652,000 | 805 |
* | Powerchip | | |
| Semiconductor Corp. | 6,592,000 | 771 |
| Cheng Shin Rubber | | |
| Industry Co., Ltd. | 673,900 | 751 |
| HannStar Display Corp. | 4,086,000 | 744 |
| Macronix International | | |
| Co., Ltd. | 2,665,375 | 744 |
| AU Optronics Corp. ADR | 106,078 | 732 |
| Powertech | | |
| Technology Inc. | 500,000 | 706 |
| Chunghwa Picture | | |
| Tubes, Ltd. | 6,377,000 | 646 |
| E.Sun Financial | | |
| Holding Co., Ltd. | 2,652,000 | 617 |
| Taishin Financial Holdings | 4,116,000 | 614 |
* | Tatung Co., Ltd. | 3,422,000 | 608 |
| Realtek | | |
| Semiconductor Corp. | 375,360 | 563 |
| Walsin Lihwa Corp. | 2,369,000 | 549 |
| Epistar Corp. | 445,408 | 521 |
| Evergreen Marine Corp. | 987,000 | 507 |
| KGI Securities Co., Ltd. | 2,177,000 | 505 |
| Siliconware Precision | | |
| Industries Co. ADR | 85,645 | 483 |
| Motech Industries Inc. | 177,000 | 482 |
| RichTek Technology Corp. | 100,100 | 472 |
| U-Ming Marine | | |
| Transport Corp. | 394,000 | 460 |
| Formosa Taffeta Co., Ltd. | 779,000 | 459 |
| Transcend Information Inc. | 264,496 | 448 |
| Tung Ho Enterprise Corp. | 683,000 | 444 |
| Inventec Co., Ltd. | 1,414,000 | 443 |
| Novatek Microelectronics | | |
| Corp., Ltd. | 397,747 | 441 |
| Unimicron | | |
| Technology Corp. | 782,750 | 434 |
| Taiwan Glass | | |
| Industrial Corp. | 882,000 | 428 |
| Wan Hai Lines Ltd. | 1,018,500 | 427 |
| Tripod Technology Corp. | 347,000 | 424 |
* | Nanya Technology Corp. | 2,345,000 | 416 |
| Polaris Securities Co., Ltd. | 1,847,040 | 412 |
| Cheng Uei Precision | | |
| Industry Co., Ltd. | 298,200 | 411 |
| Nan Ya Printed Circuit | | |
| Board Corp. | 172,000 | 406 |
| Advantech Co., Ltd. | 290,000 | 405 |
| Everlight Electronics | | |
| Co., Ltd. | 268,000 | 405 |
| Mitac International Corp. | 1,065,995 | 395 |
| Teco Electric & | | |
| Machinery Co., Ltd. | 1,573,000 | 379 |
* | EVA Airways Corp. | 1,561,000 | 379 |
31
Total International Stock Index Fund
| | | Market |
| | | Value• |
| | Shares | ($000) |
* | Taiwan Business Bank | 1,911,000 | 375 |
* | ProMOS | | |
| Technologies Inc. | 5,387,000 | 355 |
| Sino-American | | |
| Silicon Products, Inc. | 164,000 | 344 |
* | CMC Magnetics Corp. | 2,485,000 | 341 |
| Yageo Corp. | 2,146,000 | 331 |
| Yang Ming | | |
| Marine Transport | 1,185,776 | 327 |
| D-Link Corp. | 470,000 | 322 |
* | China Airlines | 1,337,000 | 320 |
| Far Eastern Department | | |
| Stores Ltd. | 697,000 | 315 |
| Wafer Works Corp. | 183,355 | 315 |
* | Winbond | | |
| Electronics Corp. | 2,978,000 | 310 |
| Eternal Chemical Co., Ltd. | 577,500 | 302 |
| Qisda Corp. | 1,226,000 | 297 |
| Taiwan Secom Corp., Ltd. | 241,000 | 296 |
| Pan-International | | |
| Industrial Co., Ltd. | 330,750 | 288 |
| Firich Enterprises Co., Ltd. | 106,842 | 277 |
| Yulon Motor Co., Ltd. | 682,015 | 273 |
| Advanced | | |
| Semiconductor | | |
| Engineering Inc. ADR | 123,780 | 269 |
| Feng Hsin Iron & | | |
| Steel Co., Ltd. | 372,000 | 261 |
| Zinwell Corporation | 236,000 | 253 |
| Kinsus Interconnect | | |
| Technology Corp. | 227,000 | 249 |
| Vanguard International | | |
| Semiconductor Corp. | 797,000 | 236 |
| Wintek Corp. | 927,000 | 235 |
| Asia Optical Co., Inc. | 177,000 | 233 |
| Inventec Appliances Corp. | 220,000 | 212 |
* | Via Technologies Inc. | 865,000 | 209 |
* | Mosel Vitelic Inc. | 870,000 | 202 |
| Cathay Construction Corp. | 837,000 | 183 |
* | Inotera Memories, Inc. | 766,000 | 183 |
| China Motor Co., Ltd. | 532,000 | 181 |
| Compal | | |
| Communications, Inc. | 273,000 | 170 |
| Farglory Land | | |
| Development Co., Ltd | 168,000 | 105 |
| | | 192,464 |
Thailand (0.1%) | | |
| PTT Public Co. Ltd. | | |
| (Foreign) | 775,600 | 3,564 |
| PTT Exploration | | |
| and Production | | |
| Public Co. Ltd. (Foreign) | 1,059,700 | 2,650 |
| Bangkok Bank | | |
| Public Co., Ltd. (Foreign) | 861,500 | 1,741 |
| Advanced Info Service | | |
| Public Co., Ltd. (Foreign) | 825,700 | 1,738 |
| | | Market |
| | | Value• |
| | Shares | ($000) |
| Kasikornbank | | |
| Public Co. Ltd. (Foreign) | 1,085,700 | 1,579 |
| Siam Commercial | | |
| Bank Public Co. Ltd. | | |
| (Foreign) | 916,700 | 1,421 |
* | Bangkok Bank | | |
| Public Co., Ltd. (Local) | 439,000 | 883 |
| Siam Cement | | |
| Public Co. Ltd. (Foreign) | 278,400 | 842 |
* | Kasikornbank | | |
| Public Co., Ltd. (Local) | 477,900 | 694 |
* | Bank of Ayudhya PLC | | |
| (Local) | 2,338,500 | 687 |
| IRPC Public Co., Ltd. | | |
| (Foreign) | 8,871,800 | 578 |
| Banpu Public Co. Ltd. | | |
| (Foreign) | 120,500 | 577 |
* | Total Access | | |
| Communication | | |
| Public Co. Ltd. | 650,700 | 465 |
| C.P. 7-Eleven | | |
| Public Co. Ltd. (Foreign) | 2,097,000 | 463 |
| Thai Oil Public Co., Ltd. | | |
| (Foreign) | 678,600 | 407 |
| BEC World Public Co. Ltd. | | |
| (Foreign) | 842,300 | 403 |
* | Siam Cement | | |
| Public Co. Ltd. (Local) | 126,900 | 373 |
| PTT Chemical | | |
| Public Co., Ltd. (Foreign) | 334,900 | 336 |
| Krung Thai Bank | | |
| Public Co. Ltd. (Foreign) | 2,722,100 | 318 |
| PTT Aromatics & | | |
| Refining Public Co. Ltd. | | |
| (Foreign) | 1,092,900 | 316 |
| Ratchaburi Electricity | | |
| Generating Holding | | |
| Public Co., Ltd. | 353,400 | 315 |
* | Thai Military Bank | | |
| Public Co., Ltd. | | |
| (Foreign) | 18,941,300 | 308 |
| Glow Energy | | |
| Public Co. Ltd. (Foreign) | 487,800 | 281 |
| Airports of Thailand | | |
| Public Co. Ltd. (Foreign) | 418,200 | 229 |
| Land and Houses | | |
| Public Co. Ltd. (Foreign) | 2,075,900 | 223 |
* | Banpu Public Co. Ltd. | | |
| (Local) | 39,300 | 185 |
| Central Pattana | | |
| Public Co. Ltd. (Foreign) | 639,700 | 172 |
* | PTT Public Co., Ltd. | | |
| (Local) | 37,000 | 170 |
| | | 21,918 |
32
Total International Stock Index Fund
| | | Market |
| | | Value• |
| | Shares | ($000) |
Turkey (0.2%) | | |
* | Turkiye Garanti Bankasi | | |
| A.S. | 1,933,424 | 3,247 |
| Turkcell Iletisim | | |
| Hizmetleri A.S. | 624,550 | 3,135 |
| Akbank T.A.S. | 828,029 | 2,844 |
| Turkiye Is Bankasi | | |
| A.S. C Shares | 894,915 | 2,544 |
| Anadolu Efes Biracilik | | |
| ve Malt Sanayii A.S. | 205,124 | 1,737 |
| Eregli Demir ve Celik | | |
| Fabrikalari A.S. | 528,883 | 1,630 |
| Tupras-Turkiye Petrol | | |
| Rafinerileri A.S. | 115,806 | 1,462 |
| Haci Omer Sabanci | | |
| Holding A.S. | 424,610 | 1,031 |
* | Turk Telekomunikasyon | | |
| A.S. | 474,082 | 1,002 |
* | Yapi ve Kredi Bankasi A.S. | 787,551 | 999 |
| Enka Insaat ve Sanayi A.S. | 223,410 | 837 |
| Turkiye Halk Bankasi A.S. | 293,183 | 802 |
* | BIM Birlesik Magazalar A.S. 35,327 | | 713 |
* | KOC Holding A.S. | 380,456 | 710 |
| Turkiye Vakiflar Bankasi | | |
| T.A.O. | 711,000 | 694 |
* | Dogan Sirketler Grubu | | |
| Holding A.S. | 490,734 | 387 |
* | Asya Katilim Bankasi AS | 375,162 | 329 |
* | Turk Sise ve Cam | | |
| Fabrikalari A.S. | 322,592 | 262 |
* | Tekfen Holding A.S. | 96,268 | 258 |
* | TAV Havalimanlari | | |
| Holding A.S. | 101,609 | 247 |
* | Coca-Cola Icecek A.S. | 51,068 | 245 |
| Aksigorta A.S. | 116,336 | 240 |
* | Petkim Petrokimya | | |
| Holding A.S. | 78,662 | 214 |
| Ford Otomotiv Sanayi A.S. | 64,790 | 204 |
| Arcelik A.S. | 114,743 | 163 |
| Tofas Turk Otomobil | | |
| Fabrikasi A.S. | 119,803 | 140 |
* | Dogan Yayin Holding A.S. | 206,889 | 119 |
| | | 26,195 |
United Kingdom (9.3%) | | |
| BP PLC | 17,620,449 | 143,633 |
| HSBC Holdings PLC | 11,232,282 | 133,037 |
| GlaxoSmithKline PLC | 5,117,550 | 98,379 |
| Vodafone Group PLC | 49,711,512 | 95,631 |
| Royal Dutch Shell PLC | | |
| Class A | 3,318,654 | 91,179 |
| Royal Dutch Shell PLC | | |
| Class B | 2,563,058 | 69,489 |
| AstraZeneca Group PLC | 1,362,446 | 57,738 |
| BG Group PLC | 3,130,305 | 46,028 |
| British American Tobacco | | |
| PLC | 1,600,559 | 43,902 |
| | | Market |
| | | Value• |
| | Shares | ($000) |
| Rio Tinto PLC | 933,773 | 43,619 |
| Tesco PLC | 7,347,691 | 40,259 |
| Diageo PLC | 2,386,517 | 36,419 |
| BHP Billiton PLC | 2,064,906 | 35,063 |
| Anglo American PLC | 1,237,004 | 31,038 |
| Unilever PLC | 1,214,534 | 27,285 |
| National Grid Transco | | |
| PLC | 2,334,826 | 26,302 |
| Imperial Tobacco Group | | |
| PLC | 950,795 | 25,483 |
| Reckitt Benckiser Group | | |
| PLC | 566,218 | 23,951 |
| Standard Chartered PLC | 1,335,835 | 22,077 |
| Barclays PLC | 7,619,895 | 21,843 |
| BAE Systems PLC | 3,285,308 | 18,467 |
| Lloyds TSB Group PLC | 5,571,312 | 18,007 |
| Royal Bank of | | |
| Scotland Group PLC | 15,432,960 | 17,000 |
| Centrica PLC | 3,438,389 | 16,896 |
| Scottish & | | |
| Southern Energy PLC | 815,162 | 15,979 |
| Aviva PLC | 2,511,201 | 14,979 |
| BT Group PLC | 7,219,389 | 13,566 |
| SABMiller PLC | 851,864 | 13,531 |
| Prudential PLC | 2,348,636 | 11,798 |
| Cadbury PLC | 1,274,162 | 11,700 |
| British Energy Group | | |
| PLC | 970,986 | 11,614 |
| Xstrata PLC | 593,272 | 10,148 |
| Morrison Supermarkets | | |
| PLC | 2,284,526 | 9,727 |
| Man Group PLC | 1,609,215 | 9,291 |
| Rolls-Royce Group PLC | 1,721,413 | 9,108 |
| Reed Elsevier PLC | 1,036,828 | 9,097 |
| HBOS PLC | 5,034,359 | 8,243 |
| Compass Group PLC | 1,757,089 | 8,171 |
| Standard Life PLC | 2,058,537 | 7,969 |
| Land Securities Group | | |
| PLC | 447,178 | 7,938 |
| Smith & Nephew PLC | 825,034 | 7,554 |
| Pearson PLC | 752,994 | 7,500 |
* | United Utilities Group PLC | 633,561 | 7,154 |
| Royal & Sun Alliance | | |
| Insurance Group PLC | 3,074,687 | 6,838 |
| Shire Ltd. | 520,544 | 6,821 |
| British Sky Broadcasting | | |
| Group PLC | 1,060,923 | 6,456 |
| Legal & General Group | | |
| PLC | 5,610,750 | 6,453 |
| WPP Group PLC | 1,044,288 | 6,247 |
| Capita Group PLC | 559,218 | 5,778 |
| Tullow Oil PLC | 670,187 | 5,692 |
| Marks & Spencer Group | | |
| PLC | 1,504,424 | 5,333 |
| Experian Group Ltd. | 956,088 | 5,273 |
| International Power PLC | 1,412,025 | 5,052 |
33
Total International Stock Index Fund
| | | Market |
| | | Value• |
| | Shares | ($000) |
| Severn Trent PLC | 220,343 | 4,870 |
| British American Tobacco | | |
| PLC | | |
| (South African Shares) | 173,614 | 4,728 |
| British Land Co., PLC | 472,006 | 4,707 |
| Smiths Group PLC | 359,181 | 4,625 |
| Cable and Wireless PLC | 2,305,225 | 4,569 |
| J. Sainsbury PLC | 983,390 | 4,492 |
| Kingfisher PLC | 2,180,652 | 4,025 |
| Old Mutual PLC | 4,651,379 | 3,767 |
| Associated British Foods | | |
| PLC | 334,724 | 3,745 |
| Rexam PLC | 605,606 | 3,649 |
| Group 4 Securicor PLC | 1,193,536 | 3,615 |
| Wolseley PLC | 641,250 | 3,509 |
| The Sage Group PLC | 1,216,371 | 3,405 |
| Carnival PLC | 150,696 | 3,314 |
* | Cairn Energy PLC | 123,877 | 3,209 |
| Cobham PLC | 1,052,674 | 3,199 |
| Bunzl PLC | 316,337 | 3,181 |
| Hammerson PLC | 273,258 | 3,149 |
| Thomson Reuters PLC | 181,064 | 3,137 |
| Next PLC | 183,752 | 3,123 |
| 3i Group PLC | 351,112 | 3,063 |
| FirstGroup PLC | 452,549 | 2,986 |
| Johnson Matthey PLC | 198,277 | 2,984 |
| Drax Group PLC | 314,135 | 2,919 |
| Lonmin PLC | 144,225 | 2,690 |
| Serco Group PLC | 444,848 | 2,653 |
| Liberty International PLC | 235,667 | 2,622 |
| Home Retail Group | 803,410 | 2,561 |
| Amec PLC | 304,625 | 2,549 |
| ICAP PLC | 506,739 | 2,525 |
| Tate & Lyle PLC | 420,430 | 2,499 |
| Friends Provident PLC | 2,122,355 | 2,434 |
| Whitbread PLC | 161,255 | 2,337 |
| Antofagasta PLC | 359,182 | 2,219 |
| InterContinental | | |
| Hotels Group PLC | 244,994 | 2,080 |
* | Invensys PLC | 765,785 | 1,920 |
| Vedanta Resources PLC | 133,031 | 1,842 |
| Segro PLC | 403,840 | 1,823 |
| Burberry Group PLC | 398,563 | 1,774 |
| Balfour Beatty PLC | 437,431 | 1,768 |
| TUI Travel PLC | 518,395 | 1,582 |
| LogicaCMG PLC | 1,367,405 | 1,522 |
| Stagecoach Group PLC | 497,775 | 1,495 |
| ITV PLC | 3,069,395 | 1,482 |
| Eurasian Natural | | |
| Resources Corp. | 295,712 | 1,479 |
| Tomkins PLC | 799,171 | 1,467 |
| Schroders PLC | 113,479 | 1,455 |
| | | Market |
| | | Value• |
| | Shares | ($000) |
| United Business | | |
| Media Ltd. | 217,939 | 1,418 |
| Ladbrokes PLC | 552,955 | 1,409 |
| Hays PLC | 1,280,439 | 1,406 |
| Investec PLC | 370,031 | 1,405 |
| Meggitt PLC | 627,898 | 1,376 |
| Persimmon PLC | 273,348 | 1,323 |
| IMI PLC | 297,521 | 1,322 |
| GKN PLC | 656,613 | 1,259 |
| London Stock Exchange | | |
| PLC | 138,805 | 1,259 |
| Mondi PLC | 344,314 | 1,250 |
| Daily Mail and | | |
| General Trust PLC | 261,117 | 1,230 |
| Thomas Cook Group PLC | 449,707 | 1,220 |
| Rentokil Initial PLC | 1,670,005 | 1,214 |
| British Airways PLC | 542,946 | 1,201 |
| National Express Group | | |
| PLC | 121,064 | 1,115 |
| William Hill PLC | 315,737 | 971 |
| Mitchells & Butlers PLC | 366,862 | 929 |
| Kazakhmys PLC | 194,099 | 910 |
| The Berkeley Group | | |
| Holdings PLC | 75,591 | 910 |
| Carphone Warehouse PLC | 367,002 | 797 |
| Enterprise Inns PLC | 474,225 | 747 |
| Inchcape PLC | 411,168 | 524 |
| | | 1,597,678 |
Total Common Stocks | | |
(Cost $13,533,913) | | 8,977,324 |
Temporary Cash Investment (1.0%) | | |
2,3 | Vanguard Market | | |
| Liquidity Fund, | | |
| 2.217% | | |
| (Cost $166,630) | 166,629,926 | 166,630 |
Total Investments (101.0%) | | |
(Cost $21,598,442) | | 17,317,812 |
Other Assets and Liabilities (–1.0%) | | |
Other Assets | | 60,658 |
Liabilities3 | | (225,991) |
| | | (165,333) |
Net Assets (100%) | | |
Applicable to 1,563,433,864 outstanding | |
$.001 par value shares of beneficial | | |
interest (unlimited authorization) | | 17,152,479 |
Net Asset Value Per Share | | $10.97 |
34
Total International Stock Index Fund
At October 31, 2008, net assets consisted of: |
| Amount |
| ($000) |
Paid-in Capital | 22,106,008 |
Undistributed Net Investment Income | 81,475 |
Accumulated Net Realized Losses | (755,711) |
Unrealized Appreciation (Depreciation) | |
Investment Securities | (4,280,630) |
Foreign Currencies | 1,337 |
Net Assets | 17,152,479 |
• | See Note A in Notes to Financial Statements. |
* | Non-income-producing security. |
^ Part of security position is on loan to broker-dealers. The total value of securities on loan is $122,377,000.
1 Considered an affiliated company of the fund as the issuer is another member of The Vanguard Group.
2 Affiliated money market fund available only to Vanguard funds and certain trusts and accounts managed by Vanguard. Rate shown is the 7-day yield.
3 Includes $129,751,000 of collateral received for securities on loan.
ADR—American Depositary Receipt.
GDR—Global Depositary Receipt.
REIT—Real Estate Investment Trust.
See accompanying Notes, which are an integral part of the Financial Statements.
35
Total International Stock Index Fund
Statement of Operations
| Year Ended |
| October 31, 2008 |
| ($000) |
Investment Income | |
Income | |
Dividends1,2 | 812,506 |
Security Lending | 183 |
Total Income | 812,689 |
Expenses | |
The Vanguard Group--Note B | |
Investment Advisory Services | 48 |
Management and Administrative | 6,219 |
Custodian Fees | 705 |
Auditing Fees | 20 |
Shareholders’ Reports | 76 |
Trustees’ Fees and Expenses | 1 |
Total Expenses | 7,069 |
Net Investment Income | 805,620 |
Realized Net Gain (Loss) | |
Investment Securities Sold2 | (705,537) |
Capital Gain Distributions Received | — |
Foreign Currencies | (3,035) |
Realized Net Gain (Loss) | (708,572) |
Change in Unrealized Appreciation (Depreciation) | |
Investment Securities | (15,815,482) |
Foreign Currencies | 1,337 |
Change in Unrealized Appreciation (Depreciation) | (15,814,145) |
Net Increase (Decrease) in Net Assets Resulting from Operations | (15,717,097) |
1 Dividends are net of foreign withholding taxes of $4,673,000.
2 Dividend income and realized net gain (loss) from affiliated companies of the fund were $728,817,000 and ($624,990,000), respectively.
See accompanying Notes, which are an integral part of the Financial Statements.
36
Total International Stock Index Fund
Statement of Changes in Net Assets
| Year Ended October 31, |
| 2008 | 2007 |
| ($000) | ($000) |
Increase (Decrease) in Net Assets | | |
Operations | | |
Net Investment Income | 805,620 | 452,034 |
Realized Net Gain (Loss) | (708,572) | 67,347 |
Change in Unrealized Appreciation (Depreciation) | (15,814,145) | 6,193,030 |
Net Increase (Decrease) in Net Assets Resulting from Operations | (15,717,097) | 6,712,411 |
Distributions | | |
Net Investment Income | (730,097) | (446,154) |
Realized Capital Gain | — | — |
Total Distributions | (730,097) | (446,154) |
Capital Share Transactions | | |
Issued | 8,100,643 | 8,204,059 |
Issued in Lieu of Cash Distributions | 669,637 | 410,001 |
Redeemed1 | (4,895,227)2 | (3,355,766) |
Net Increase (Decrease) from Capital Share Transactions | 3,875,053 | 5,258,294 |
Total Increase (Decrease) | (12,572,141) | 11,524,551 |
Net Assets | | |
Beginning of Period | 29,724,620 | 18,200,069 |
End of Period3 | 17,152,479 | 29,724,620 |
1 The fund collected redemption fees of $1,711,000 and $907,000, which were reallocated proportionately to the funds in which the fund invests.
2 Net of redemption fees of $204,000.
3 Net Assets—End of Period includes undistributed net investment income of $81,475,000 and $8,965,000.
See accompanying Notes, which are an integral part of the Financial Statements.
37
Total International Stock Index Fund
Financial Highlights
| Year Ended October 31, |
For a Share Outstanding Throughout Each Period | 2008 | 2007 | 2006 | 2005 | 2004 |
Net Asset Value, Beginning of Period | $21.89 | $16.90 | $13.49 | $11.48 | $9.84 |
Investment Operations | | | | | |
Net Investment Income | .5401 | .412 | .294 | .255 | .190 |
Capital Gain Distributions Received | — | — | — | — | — |
Net Realized and Unrealized Gain (Loss) | | | | | |
on Investments | (10.938) | 4.980 | 3.410 | 2.010 | 1.640 |
Total from Investment Operations | (10.398) | 5.392 | 3.704 | 2.265 | 1.830 |
Distributions | | | | | |
Dividends from Net Investment Income | (.522) | (.402) | (.294) | (.255) | (.190) |
Distributions from Realized Capital Gains | — | — | — | — | — |
Total Distributions | (.522) | (.402) | (.294) | (.255) | (.190) |
Net Asset Value, End of Period | $10.97 | $21.89 | $16.90 | $13.49 | $11.48 |
| | | | | |
Total Return2 | –48.57% | 32.47% | 27.84% | 19.91% | 18.80% |
| | | | | |
Ratios/Supplemental Data | | | | | |
Net Assets, End of Period (Millions) | $17,152 | $29,725 | $18,200 | $11,331 | $7,317 |
Ratio of Expenses to | | | | | |
Average Net Assets—Note B | 0.03%3 | 0% | 0% | 0% | 0% |
Ratio of Net Investment Income to | | | | | |
Average Net Assets | 3.07% | 1.93% | 1.71% | 1.76% | 1.54% |
Portfolio Turnover Rate | 15%4 | 2% | 2% | 3% | 3% |
1 Calculated based on average shares outstanding.
2 Total returns do not reflect the 2% fee assessed on redemptions of shares purchased on or after June 27, 2003, and held for less than two months; or the account service fee that may be applicable to certain accounts with balances below $10,000.
3 The acquired fund fees and expenses were 0.25%. Including the acquired fund fees and expenses, the fund’s total operating expenses represented 0.28% of average net assets.
4 Excludes the value of securities received and mutual fund shares delivered in connection with a change in the fund’s investment policy to invest directly in individual stocks and reduce the fund’s investments in Vanguard mutual funds.
See accompanying Notes, which are an integral part of the Financial Statements.
38
Total International Stock Index Fund
Notes to Financial Statements
Vanguard Total International Stock Index Fund is registered under the Investment Company Act of 1940 as an open-end investment company, or mutual fund. Through July 2008, the fund invested solely in the European, Pacific, and Emerging Markets Stock Index Funds. Beginning in August 2008, the fund also invests directly in individual stocks. The fund’s direct and indirect investments in foreign securities involve investment risks not normally associated with investing in securities of U.S. corporations.
A. The following significant accounting policies conform to generally accepted accounting principles for U.S. mutual funds. The fund consistently follows such policies in preparing its financial statements.
1. Security Valuation: Investments are valued as of the close of trading on the New York Stock Exchange (generally 4 p.m., Eastern time) on the valuation date. Investments in Vanguard funds are valued at each fund’s net asset value. Other equity securities are valued at the latest quoted sales prices or official closing prices taken from the primary market in which each security trades; such securities not traded on the valuation date are valued at the mean of the latest quoted bid and asked prices. Securities for which market quotations are not readily available, or whose values have been affected by events occurring before the fund’s pricing time but after the close of the securities’ primary markets, are valued at their fair values calculated according to procedures adopted by the board of trustees. These procedures include obtaining quotations from an independent pricing service, monitoring news to identify significant market- or security-specific events, and evaluating changes in the values of foreign market proxies (for example, ADRs, futures contracts, or exchange-traded funds), between the time the foreign markets close and the fund’s pricing time. When fair-value pricing is employed, the prices of securities used by a fund to calculate its net asset value may differ from quoted or published prices for the same securities.
2. Foreign Currency: Securities and other assets and liabilities denominated in foreign currencies are translated into U.S. dollars using exchange rates obtained from an independent third party as of the fund’s pricing time on the valuation date. Realized gains (losses) and unrealized appreciation (depreciation) on investment securities include the effects of changes in exchange rates since the securities were purchased, combined with the effects of changes in security prices. Fluctuations in the value of other assets and liabilities resulting from changes in exchange rates are recorded as unrealized foreign currency gains (losses) until the assets or liabilities are settled in cash, at which time they are recorded as realized foreign currency gains (losses).
3. Federal Income Taxes: The fund intends to continue to qualify as a regulated investment company and distribute all of its taxable income. Management has analyzed the fund’s tax positions taken on federal income tax returns for all open tax years (tax years ended October 31, 2005–2008), and has concluded that no provision for federal income tax is required in the fund’s financial statements.
4. Distributions: Distributions to shareholders are recorded on the ex-dividend date.
5. Security Lending: The fund may lend its securities to qualified institutional borrowers to earn additional income. Security loans are required to be secured at all times by collateral at least equal to the market value of securities loaned. The fund invests cash collateral received in Vanguard Market Liquidity Fund, and records a liability for the return of the collateral, during the period the securities are on loan. Security lending income represents the income earned on investing cash collateral, less expenses associated with the loan.
39
Total International Stock Index Fund
6. Other: Dividend income and capital gain distributions received are recorded on the ex-dividend date. Security transactions are accounted for on the date securities are bought or sold. Costs used to determine realized gains (losses) on the sale of investment securities are those of the specific securities sold. A portion of the fees assessed on redemptions of capital shares is reallocated proportionately to the funds in which the fund invests, and the remainder is credited to paid-in capital.
B. Under service agreements, The Vanguard Group furnishes investment advisory, corporate management, administrative, marketing, and distribution services to the fund. The costs of such services are allocated to the fund under methods approved by the board of trustees. With respect to assets invested in other Vanguard funds, the fund’s direct expenses may be reduced or eliminated to the extent of savings realized by the Vanguard funds by the operation of the fund. The fund’s trustees and officers are also directors and officers of Vanguard and the funds in which the fund invests.
C. Distributions are determined on a tax basis and may differ from net investment income and realized capital gains for financial reporting purposes. Differences may be permanent or temporary. Permanent differences are reclassified among capital accounts in the financial statements to reflect their tax character. Temporary differences arise when certain items of income, expense, gain, or loss are recognized in different periods for financial statement and tax purposes; these differences will reverse at some time in the future. Differences in classification may also result from the treatment of short-term gains as ordinary income for tax purposes.
During the year ended October 31, 2008, the fund realized net foreign currency losses of $3,035,000, which decreased distributable net income for tax purposes; accordingly, such losses have been reclassified from accumulated net realized losses to undistributed net investment income. Certain of the fund’s investments are in securities considered to be “passive foreign investment companies,” for which any unrealized appreciation and/or realized gains are required to be included in distributable net income for tax purposes. During the year ended October 31, 2008, the fund realized gains on the sale of passive foreign investment companies of $22,000, which have been included in current period taxable income; accordingly, such gains have been reclassified from accumulated net realized losses to undistributed net investment income. Unrealized appreciation on the fund’s passive foreign investment company holdings at October 31, 2008, was $128,000.
For tax purposes, at October 31, 2008, the fund had $81,475,000 of ordinary income available for distribution. The fund had available realized losses of $686,643,000 to offset future net capital gains of $4,316,000 through October 31, 2009, $43,870,000 through October 31, 2010, and $638,457,000 through October 31, 2016.
At October 31, 2008, the cost of investment securities for tax purposes was $21,667,511,000. Net unrealized depreciation of investment securities for tax purposes was $4,349,699,000, consisting of unrealized gains of $467,059,000 on securities that had risen in value since their purchase and $4,816,758,000 in unrealized losses on securities that had fallen in value since their purchase.
D. During the year ended October 31, 2008, the fund purchased $18,392,387,000 of investment securities and sold $14,450,173,000 of investment securities, other than temporary cash investments.
40
Total International Stock Index Fund
E. Capital shares issued and redeemed were:
| Year Ended October 31, |
| 2008 | 2007 |
| Shares | Shares |
| (000) | (000) |
Issued | 473,699 | 433,657 |
Issued in Lieu of Cash Distributions | 33,718 | 23,151 |
Redeemed | (301,597) | (176,014) |
Net Increase (Decrease) in Shares Outstanding | 205,820 | 280,794 |
F. In September 2006, the Financial Accounting Standards Board issued Statement of Financial Accounting Standards No. 157 (“FAS 157”), “Fair Value Measurements.” FAS 157 establishes a framework for measuring fair value and expands disclosures about fair value measurements in financial statements.
The various inputs that may be used to determine the value of the fund’s investments are summarized in three broad levels. The inputs or methodologies used for valuing securities are not necessarily an indication of the risk associated with investing in those securities.
Level 1��Quoted prices in active markets for identical securities.
Level 2—Other significant observable inputs (including quoted prices for similar securities, interest rates, prepayment speeds, credit risk, etc.).
Level 3—Significant unobservable inputs (including the fund’s own assumptions used to determine the fair value of investments).
The following table summarizes the fund’s investments as of October 31, 2008, based on the inputs used to value them:
| Investments |
| in Securities |
Valuation Inputs | ($000) |
Level 1—Quoted prices | 8,744,472 |
Level 2—Other significant observable inputs | 8,573,340 |
Level 3—Significant unobservable inputs | — |
Total | 17,317,812 |
41
Report of Independent Registered Public Accounting Firm
To the Trustees of Vanguard International Equity Index Funds and the Shareholders of Vanguard Total International Stock Index Fund:
In our opinion, the accompanying statement of net assets and the related statements of operations and of changes in net assets and the financial highlights present fairly, in all material respects, the financial position of Vanguard Total International Stock Index Fund (the “Fund”) at October 31, 2008, the results of its operations for the year then ended, the changes in its net assets for each of the two years in the period then ended and the financial highlights for each of the five years in the period then ended, in conformity with accounting principles generally accepted in the United States of America. These financial statements and financial highlights (hereafter referred to as “financial statements”) are the responsibility of the Fund’s management; our responsibility is to express an opinion on these financial statements based on our audits. We conducted our audits of these financial statements in accordance with the standards of the Public Company Accounting Oversight Board (United States). Those standards require that we plan and perform the audit to obtain reasonable assurance about whether the financial statements are free of material misstatement. An audit includes examining, on a test basis, evidence supporting the amounts and disclosures in the financial statements, assessing the accounting principles used and significant estimates made by management, and evaluating the overall financial statement presentation. We believe that our audits, which included confirmation of securities at October 31, 2008 by correspondence with the custodian, and by agreement to the underlying ownership records for the Vanguard funds, provide a reasonable basis for our opinion.
PricewaterhouseCoopers LLP
Philadelphia, Pennsylvania
December 19, 2008
Special 2008 tax information (unaudited) for Vanguard Total International Stock Index Fund |
This information for the fiscal year ended October 31, 2008, is included pursuant to provisions of the Internal Revenue Code.
The fund distributed $542,535,000 of qualified dividend income to shareholders during the fiscal year.
The fund will pass through to shareholders foreign source income of $78,536,000 and foreign taxes paid of $3,105,000. The pass-through of foreign taxes paid will affect only shareholders on the dividend record date in December 2008. Shareholders will receive more detailed information along with their Form 1099-DIV in January 2009.
42
Your Fund’s After-Tax Returns
This table presents returns for your fund both before and after taxes. The after-tax returns are shown in two ways: (1) assuming that an investor owned the fund during the entire period and paid taxes on the fund’s distributions, and (2) assuming that an investor paid taxes on the fund’s distributions and sold all shares at the end of each period.
Calculations are based on the highest individual federal income tax and capital gains tax rates in effect at the times of the distributions and the hypothetical sales. State and local taxes were not considered. After-tax returns reflect any qualified dividend income, using actual prior-year figures and estimates for 2008. (In the example, returns after the sale of fund shares may be higher than those assuming no sale. This occurs when the sale would have produced a capital loss. The calculation assumes that the investor received a tax deduction for the loss.)
Please note that your actual after-tax returns will depend on your tax situation and may differ from those shown. Also note that if you own the fund in a tax-deferred account, such as an individual retirement account or a 401(k) plan, this information does not apply to you. Such accounts are not subject to current taxes.
Finally, keep in mind that a fund’s performance—whether before or after taxes—does not guarantee future results.
Average Annual Total Returns: Total International Stock Index Fund1 |
Periods Ended October 31, 2008 | | | |
| One | Five | Ten |
| Year | Years | Years |
Returns Before Taxes | –48.57% | 4.41% | 2.49% |
Returns After Taxes on Distributions | –48.83 | 3.95 | 1.89 |
Returns After Taxes on Distributions and Sale of Fund Shares | –31.08 | 3.76 | 1.89 |
1 Total returns do not reflect the 0.5% transaction fee on purchases through March 31, 2000; the 2% fee assessed on redemptions of shares purchased on or after June 27, 2003, and held for less than two months; or the account service fee that may be applicable to certain accounts with balances below $10,000.
43
About Your Fund’s Expenses
As a shareholder of the fund, you incur ongoing costs, which include costs for portfolio management, administrative services, and shareholder reports (like this one), among others. Operating expenses, which are deducted from a fund’s gross income, directly reduce the investment return of the fund.
A fund’s expense ratio is expressed as a percentage of its average net assets. For the Total International Stock Index Fund, the expense ratio is based on both the fund’s own operating expenses and, indirectly, on the expense ratios of the other Vanguard funds in which it invests. The indirect expenses are known as “acquired fund fees and expenses.”
The following examples are intended to help you understand the ongoing costs (in dollars) of investing in your fund and to compare these costs with those of other mutual funds. The examples are based on an investment of $1,000 made at the beginning of the period shown and held for the entire period. The costs are calculated using each fund’s acquired fund fees and expenses.
The accompanying table illustrate your fund’s costs in two ways:
• Based on actual fund return. This section helps you to estimate the actual expenses that you paid over the period. The “Ending Account Value” shown is derived from the fund’s actual return, and the third column shows the dollar amount that would have been paid by an investor who started with $1,000 in the fund. You may use the information here, together with the amount you invested, to estimate the expenses that you paid over the period.
To do so, simply divide your account value by $1,000 (for example, an $8,600 account value divided by $1,000 = 8.6), then multiply the result by the number given for your fund under the heading “Expenses Paid During Period.”
• Based on hypothetical 5% yearly return. This section is intended to help you compare your fund’s costs with those of other mutual funds. It assumes that the fund had a yearly return of 5% before expenses, but that the expense ratio is unchanged. In this case—because the return used is not the fund’s actual return—the results do not apply to your investment. The example is useful in making comparisons because the Securities and Exchange Commission requires all mutual funds to calculate expenses based on a 5% return. You can assess your fund’s costs by comparing this hypothetical example with the hypothetical examples that appear in shareholder reports of other funds.
Six Months Ended October 31, 2008 | | | |
| Beginning | Ending | Expenses |
| Account Value | Account Value | Paid During |
Total International Stock Index Fund | 4/30/2008 | 10/31/2008 | Period1 |
Based on Actual Fund Return | $1,000.00 | $571.95 | $1.11 |
Based on Hypothetical 5% Yearly Return | 1,000.00 | 1,023.79 | 1.43 |
1 These calculations are based on the fund’s own operating expenses for the most recent six-month period combined with the acquired fund fees and expenses for the underlying mutual funds in which it invests. The resulting annualized expense ratio is 0.28%. The dollar amounts shown as “Expenses Paid” are equal to the annualized expense ratio multiplied by the average account value over the period, multiplied by the number of days in the most recent six-month period, then divided by the number of days in the most recent 12-month period.
44
Note that the expenses shown in the table are meant to highlight and help you compare ongoing costs only and do not reflect transaction costs incurred by the fund for buying and selling securities. Further, the expenses do not include the transaction fees or the account service fee described in the prospectus. If such fees were applied to your account, your costs would be higher. Your fund does not carry a “sales load.”
The calculations assume no shares were bought or sold during the period. Your actual costs may have been higher or lower, depending on the amount of your investment and the timing of any purchases or redemptions.
You can find more information about the fund’s expenses, including annual expense ratios, in the Financial Statements section of this report. For additional information on operating expenses and other shareholder costs, please refer to your fund’s current prospectus.
45
Trustees Approve Advisory Arrangement
The board of trustees of Vanguard Total International Stock Index Fund has approved the fund’s investment advisory arrangement with The Vanguard Group, Inc. Vanguard—through its Quantitative Equity Group—serves as the investment advisor for the fund. The board determined that the investment advisory arrangement with Vanguard was in the best interests of the fund and its shareholders.
The board based its decision upon an evaluation of the advisor’s investment staff, portfolio management process, and performance with similar mandates. The trustees considered the factors discussed below, among others. However, no single factor determined whether the board approved the arrangement. Rather, it was the totality of the circumstances that drove the board’s decision.
Nature, extent, and quality of services
The board considered the benefits to shareholders of selecting Vanguard as an advisor to the fund, particularly in light of the nature, extent, and quality of services to be provided by the advisor. The board noted that Vanguard has a track record of success in its management of other index funds as well as actively managed funds. Vanguard has been managing investments for more than 25 years. George U. Sauter, Vanguard managing director and chief investment officer, has been in the investment management business since 1985. Mr. Sauter has led the Quantitative Equity Group since 1987. The group adheres to a sound, disciplined investment management process; the team has considerable experience, stability, and depth.
The board concluded that Vanguard’s experience, stability, depth, and performance, among other factors, warranted approval of the advisory arrangement.
Investment performance
The board noted that Vanguard’s portfolio management team has depth and stability. The board determined that, in its management of other Vanguard index funds, the Quantitative Equity Group has a track record of consistent performance and disciplined investment processes. Information about the fund’s performance can be found in the Performance Summary section of this report.
Cost
The board considered the cost of services to be provided, including consideration of competitive fee rates and the fact that, after the implementation of the arrangement with Vanguard, the fund’s advisory expense ratio would be well below the average advisory expense ratio of its peer group. Information about the fund’s expense ratio appears in the About Your Fund’s Expenses section of this report as well as in the Financial Statements section.
The board does not conduct a profitability analysis of Vanguard because of Vanguard’s unique “at-cost” structure. Unlike most other mutual fund management companies, Vanguard is owned by the funds it oversees, and produces “profits” only in the form of reduced expenses for fund shareholders.
The benefit of economies of scale
The board concluded that the fund’s low-cost arrangement with Vanguard ensures that the fund will realize economies of scale as it grows, with the cost to shareholders declining as the fund’s assets increase.
The board will consider whether to renew the advisory arrangement after a one-year period.
46
Glossary
Acquired Fund Fees and Expenses. Funds that invest in other Vanguard funds bear proportionate shares of the operating, administrative, and advisory expenses of the underlying funds, and they must pay any fees charged by those funds. The figure for acquired fund fees and expenses represents a weighted average of these underlying costs. Acquired is a term that the Securities and Exchange Commission applies to any mutual fund whose shares are owned by another fund.
Beta. A measure of the magnitude of a fund’s past share-price fluctuations in relation to the ups and downs of a given market index. The index is assigned a beta of 1.00. Compared with a given index, a fund with a beta of 1.20 typically would have seen its share price rise or fall by 12% when the index rose or fell by 10%. For this report, beta is based on returns over the past 36 months for both the fund and the index. Note that a fund’s beta should be reviewed in conjunction with its R-squared (see definition). The lower the R-squared, the less correlation there is between the fund and the index, and the less reliable beta is as an indicator of volatility.
Equity Exposure. A measure that reflects a fund’s investments in stocks and stock futures. Any holdings in short-term reserves are excluded.
Inception Date. The date on which the assets of a fund (or one of its share classes) are first invested in accordance with the fund’s investment objective. For funds with a subscription period, the inception date is the day after that period ends. Investment performance is measured from the inception date.
R-Squared. A measure of how much of a fund’s past returns can be explained by the returns from the market in general, as measured by a given index. If a fund’s total returns were precisely synchronized with an index’s returns, its R-squared would be 1.00. If the fund’s returns bore no relationship to the index’s returns, its R-squared would be 0. For this report, R-squared is based on returns over the past 36 months for both the fund and the index.
47
The People Who Govern Your Fund
The trustees of your mutual fund are there to see that the fund is operated and managed in your best interests since, as a shareholder, you are a part owner of the fund. Your fund’s trustees also serve on the board of directors of The Vanguard Group, Inc., which is owned by the Vanguard funds and provides services to them on an at-cost basis.
A majority of Vanguard’s board members are independent, meaning that they have no affiliation with Vanguard or the funds they oversee, apart from the sizable personal investments they have made as private individuals.
Our independent board members bring distinguished backgrounds in business, academia, and public service to their task of working with Vanguard officers to establish the policies and oversee the activities of the funds. Among board members’ responsibilities are selecting investment advisors for the funds; monitoring fund operations, performance, and costs; reviewing contracts; nominating and selecting new trustees/directors; and electing Vanguard officers.
Each trustee serves a fund until its termination; or until the trustee’s retirement, resignation, or death; or otherwise as specified in the fund’s organizational documents. Any trustee may be removed at a shareholders’ meeting by a vote representing two-thirds of the net asset value of all shares of the fund together with shares of other Vanguard funds organized within the same trust. The table on these two pages shows information for each trustee and executive officer of the fund. The mailing address of the trustees and officers is P.O. Box 876, Valley Forge, PA 19482.
Chairman of the Board and Trustee |
| |
John J. Brennan1 | |
Born 1954 | Principal Occupation(s) During the Past Five Years: Chairman of the Board and Director/ |
Trustee Since May 1987; | Trustee of The Vanguard Group, Inc., and of each of the investment companies served |
Chairman of the Board | by The Vanguard Group; Chief Executive Officer and President of The Vanguard Group |
156 Vanguard Funds Overseen | and of each of the investment companies served by The Vanguard Group (1996–2008). |
| |
Independent Trustees | |
| |
Charles D. Ellis | |
Born 1937 | Principal Occupation(s) During the Past Five Years: Applecore Partners (pro bono ventures |
Trustee Since January 2001 | in education); Senior Advisor to Greenwich Associates (international business strategy |
156 Vanguard Funds Overseen | consulting); Successor Trustee of Yale University; Overseer of the Stern School of Business |
| at New York University; Trustee of the Whitehead Institute for Biomedical Research. |
| |
Emerson U. Fullwood | |
Born 1948 | Principal Occupation(s) During the Past Five Years: Executive Chief Staff and Marketing |
Trustee Since January 2008 | Officer for North America since 2004 and Corporate Vice President of Xerox Corporation |
156 Vanguard Funds Overseen | (photocopiers and printers); Director of SPX Corporation (multi-industry manufacturing), |
| of the United Way of Rochester, and of the Boy Scouts of America. |
| |
Rajiv L. Gupta | |
Born 1945 | Principal Occupation(s) During the Past Five Years: Chairman, President, and |
Trustee Since December 20012 | Chief Executive Officer of Rohm and Haas Co. (chemicals); Board Member of |
156 Vanguard Funds Overseen | the American Chemistry Council; Director of Tyco International, Ltd. (diversified |
| manufacturing and services), since 2005. |
| |
Amy Gutmann | |
Born 1949 | Principal Occupation(s) During the Past Five Years: President of the University of |
Trustee Since June 2006 | Pennsylvania since 2004; Professor in the School of Arts and Sciences, Annenberg School |
156 Vanguard Funds Overseen | for Communication, and Graduate School of Education of the University of Pennsylvania |
| since 2004; Provost (2001–2004) and Laurance S. Rockefeller Professor of Politics and |
| the University Center for Human Values (1990–2004), Princeton University; Director of |
| Carnegie Corporation of New York since 2005 and of Schuylkill River Development |
| Corporation and Greater Philadelphia Chamber of Commerce since 2004; Trustee of |
| the National Constitution Center since 2007. |
JoAnn Heffernan Heisen | |
Born 1950 | Principal Occupation(s) During the Past Five Years: Corporate Vice President and |
Trustee Since July 1998 | Chief Global Diversity Officer since 2006, Vice President and Chief Information |
156 Vanguard Funds Overseen | Officer (1997–2005), and Member of the Executive Committee of Johnson & |
| Johnson (pharmaceuticals/consumer products); Director of the University Medical |
| Center at Princeton and Women’s Research and Education Institute. |
| �� |
André F. Perold | |
Born 1952 | Principal Occupation(s) During the Past Five Years: George Gund Professor of Finance |
Trustee Since December 2004 | and Banking, Harvard Business School; Senior Associate Dean and Director of Faculty |
156 Vanguard Funds Overseen | Recruiting, Harvard Business School; Director and Chairman of UNX, Inc. (equities |
| trading firm); Chair of the Investment Committee of HighVista Strategies LLC (private |
| investment firm) since 2005. |
| |
Alfred M. Rankin, Jr. | |
Born 1941 | Principal Occupation(s) During the Past Five Years: Chairman, President, Chief Executive |
Trustee Since January 1993 | Officer, and Director of NACCO Industries, Inc. (forklift trucks/housewares/lignite); Director |
156 Vanguard Funds Overseen | of Goodrich Corporation (industrial products/aircraft systems and services). |
| |
J. Lawrence Wilson | |
Born 1936 | Principal Occupation(s) During the Past Five Years: Retired Chairman and Chief Executive |
Trustee Since April 1985 | Officer of Rohm and Haas Co. (chemicals); Director of Cummins Inc. (diesel engines) and |
156 Vanguard Funds Overseen | AmerisourceBergen Corp. (pharmaceutical distribution); Trustee of Vanderbilt University |
| and of Culver Educational Foundation. |
| |
Executive Officers1 | |
| |
Thomas J. Higgins | |
Born 1957 | Principal Occupation(s) During the Past Five Years: Principal of The Vanguard Group, Inc.; |
Chief Financial Officer | Treasurer of each of the investment companies served by The Vanguard Group; Chief |
Since September 2008 | Financial Officer of each of the investment companies served by The Vanguard |
Treasurer Since July 1998 | Group since 2008. |
156 Vanguard Funds Overseen | |
| |
F. William McNabb III | |
Born 1957 | Principal Occupation(s) During the Past Five Years: Chief Executive Officer, Director, |
Chief Executive Officer | and President of The Vanguard Group, Inc., since 2008; Chief Executive Officer and |
Since August 31, 2008 | President of each of the investment companies served by The Vanguard Group since |
President Since March 2008 | 2008; Director of Vanguard Marketing Corporation; Managing Director of The Vanguard |
156 Vanguard Funds Overseen | Group (1995–2008). |
| |
Heidi Stam | |
Born 1956 | Principal Occupation(s) During the Past Five Years: Managing Director of The Vanguard |
Secretary Since July 2005 | Group, Inc., since 2006; General Counsel of The Vanguard Group since 2005; Secretary of |
156 Vanguard Funds Overseen | The Vanguard Group and of each of the investment companies served by The Vanguard |
| Group since 2005; Director and Senior Vice President of Vanguard Marketing Corporation |
| since 2005; Principal of The Vanguard Group (1997–2006). |
Vanguard Senior Management Team | | | |
| | | | |
R. Gregory Barton | Kathleen C. Gubanich | Michael S. Miller | Ralph K. Packard | George U. Sauter |
Mortimer J. Buckley | Paul A. Heller | James M. Norris | Glenn W. Reed | |
Founder |
|
John C. Bogle |
Chairman and Chief Executive Officer, 1974–1996 |
1 | These individuals are “interested persons” as defined in the Investment Company Act of 1940. |
2 | December 2002 for Vanguard Equity Income Fund, Vanguard Growth Equity Fund, the Vanguard Municipal Bond Funds, and the Vanguard State Tax-Exempt Funds. |
More information about the trustees is in the Statement of Additional Information, available from The Vanguard Group.
| 
|
| P.O. Box 2600 |
| Valley Forge, PA 19482-2600 |
Connect with Vanguard® > www.vanguard.com
Fund Information > 800-662-7447 | All comparative mutual fund data are from Lipper Inc. |
| or Morningstar, Inc., unless otherwise noted. |
Direct Investor Account Services > 800-662-2739 | |
| |
Institutional Investor Services > 800-523-1036 | You can obtain a free copy of Vanguard’s proxy voting |
| guidelines by visiting our website, www.vanguard.com, |
Text Telephone for People | and searching for “proxy voting guidelines,” or by |
With Hearing Impairment > 800-952-3335 | calling Vanguard at 800-662-2739. The guidelines are |
| also available from the SEC’s website, www.sec.gov. |
| In addition, you may obtain a free report on how your |
| fund voted the proxies for securities it owned during |
This material may be used in conjunction | the 12 months ended June 30. To get the report, visit |
with the offering of shares of any Vanguard | either www.vanguard.com or www.sec.gov. |
fund only if preceded or accompanied by | |
the fund’s current prospectus. | |
| You can review and copy information about your fund |
| at the SEC’s Public Reference Room in Washington, D.C. |
The funds or securities referred to herein are not | To find out more about this public service, call the SEC |
sponsored, endorsed, or promoted by MSCI, and MSCI | at 202-551-8090. Information about your fund is also |
bears no liability with respect to any such funds or | available on the SEC’s website, and you can receive |
securities. For any such funds or securities, the | copies of this information, for a fee, by sending a |
prospectus or the Statement of Additional Information | request in either of two ways: via e-mail addressed to |
contains a more detailed description of the limited | publicinfo@sec.gov or via regular mail addressed to the |
relationship MSCI has with The Vanguard Group and | Public Reference Section, Securities and Exchange |
any related funds. | Commission, Washington, DC 20549-0102. |
| |
| |
Russell is a trademark of The Frank Russell Company. | |
| |
| |
| |
| |
| |
| |
| |
| |
| © 2008 The Vanguard Group, Inc. |
| All rights reserved. |
| Vanguard Marketing Corporation, Distributor. |
| |
| Q1130 122008 |
> | For the fiscal year ended October 31, 2008, returns for the Vanguard International Stock Index Funds were sharply lower across the board. A rising U.S. dollar against most currencies further lowered returns for U.S. investors. |
> | The funds tracked their benchmarks and delivered returns that surpassed the average returns of their mutual fund peers. |
> | A global credit crisis and fears of a global economic slowdown drove down stock values worldwide. |
Contents | |
| |
Your Fund’s Total Returns | 1 |
President’s Letter | 4 |
European Stock Index Fund | 11 |
Pacific Stock Index Fund | 36 |
Emerging Markets Stock Index Fund | 61 |
Developed Markets Index Fund | 92 |
Institutional Developed Markets Index Fund | 101 |
Your Fund’s After-Tax Returns | 112 |
About Your Fund’s Expenses | 114 |
Glossary | 117 |

European Stock Index Fund
Pacific Stock Index Fund
Emerging Markets Stock Index Fund
Developed Markets Index Fund
Institutional Developed Markets Index Fund
Please note: The opinions expressed in this report are just that—informed opinions. They should not be considered promises or advice. Also, please keep in mind that the information and opinions cover the period through the date on the front of this report. Of course, the risks of investing in your fund are spelled out in the prospectus.
Your Fund’s Total Returns
Fiscal Year Ended October 31, 2008 | | |
| Ticker | Total |
| Symbol | Returns |
Vanguard European Stock Index Fund | | |
Investor Shares | VEURX | –47.80% |
Admiral™ Shares1 | VEUSX | –47.74 |
Signal® Shares2 | VESSX | –47.74 |
Institutional Shares3 | VESIX | –47.72 |
ETF Shares4 | VGK | |
Market Price | | –47.28 |
Net Asset Value | | –47.73 |
MSCI Europe Index | | –48.02 |
Average European Region Fund5 | | –49.48 |
| | |
Vanguard Pacific Stock Index Fund | | |
Investor Shares | VPACX | –42.71% |
Admiral Shares1 | VPADX | –42.62 |
Signal Shares2 | VPASX | –42.61 |
Institutional Shares3 | VPKIX | –42.62 |
ETF Shares4 | VPL | |
Market Price | | –42.40 |
Net Asset Value | | –42.61 |
MSCI Pacific Index | | –43.49 |
Average Japan/Pacific Region Fund5 | | –46.22 |
1 A lower-cost class of shares available to many longtime shareholders and to those with significant investments in the fund.
2 Signal Shares also carry lower costs and are available to certain institutional shareholders who meet specific administrative, service, and account-size criteria.
3 This class of shares carries low expenses and is available for a minimum initial investment of $5 million.
4 Vanguard ETF™ Shares are traded on the NYSE Arca exchange and are available only through brokers. The table shows the ETF returns based on both the NYSE Arca market price and the net asset value for a share. U.S. Pat. No. 6,879,964 B2; 7,337,138.
5 Derived from data provided by Lipper Inc.
1
Your Fund’s Total Returns
Fiscal Year Ended October 31, 2008 | | |
| Ticker | Total |
| Symbol | Returns |
Vanguard Emerging Markets Stock Index Fund | | |
Investor Shares | VEIEX | –56.66% |
Admiral Shares1 | VEMAX | –56.63 |
Signal Shares2 | VERSX | –56.64 |
Institutional Shares3 | VEMIX | –56.61 |
ETF Shares4 | VWO | |
Market Price | | –56.74 |
Net Asset Value | | –56.62 |
MSCI Emerging Markets Index | | –56.35 |
Average Emerging Markets Fund5 | | –57.30 |
| | |
Vanguard Developed Markets Index Fund | VDMIX | –46.24% |
MSCI EAFE Index | | –46.62 |
Average International Fund5 | | –47.97 |
| | |
Vanguard Institutional Developed Markets Index Fund | VIDMX | –46.12% |
MSCI EAFE Index | | –46.62 |
Average International Fund5 | | –47.97 |
1 A lower-cost class of shares available to many longtime shareholders and to those with significant investments in the fund.
2 Signal Shares also carry lower costs and are available to certain institutional shareholders who meet specific administrative, service, and account-size criteria.
3 This class of shares carries low expenses and is available for a minimum initial investment of $5 million.
4 Vanguard ETF Shares are traded on the NYSE Arca exchange and are available only through brokers. The table shows the ETF returns based on both the NYSE Arca market price and the net asset value for a share. U.S. Pat. No. 6,879,964 B2; 7,337,138.
5 Derived from data provided by Lipper Inc.
2
Your Fund’s Performance at a Glance
October 31, 2007–October 31, 2008 | | | | |
| | | Distributions Per Share |
| Starting | Ending | Income | Capital |
| Share Price | Share Price | Dividends | Gains |
European Stock Index Fund | | | | |
Investor Shares | $43.43 | $21.99 | $1.215 | $0.000 |
Admiral Shares | 102.09 | 51.71 | 2.939 | 0.000 |
Signal Shares | 39.50 | 20.01 | 1.129 | 0.000 |
Institutional Shares | 43.51 | 22.04 | 1.261 | 0.000 |
ETF Shares | 81.66 | 41.37 | 2.356 | 0.000 |
Pacific Stock Index Fund | | | | |
Investor Shares | $14.19 | $7.94 | $0.303 | $0.000 |
Admiral Shares | 92.94 | 52.04 | 2.060 | 0.000 |
Signal Shares | 32.28 | 18.08 | 0.709 | 0.000 |
Institutional Shares | 14.22 | 7.96 | 0.318 | 0.000 |
ETF Shares | 75.17 | 42.10 | 1.669 | 0.000 |
Emerging Markets Stock Index Fund | | | | |
Investor Shares | $36.78 | $15.66 | $0.587 | $0.000 |
Admiral Shares | 48.47 | 20.63 | 0.820 | 0.000 |
Signal Shares | 46.61 | 19.85 | 0.760 | 0.000 |
Institutional Shares | 36.90 | 15.71 | 0.632 | 0.000 |
ETF Shares1 | 58.31 | 24.83 | 0.985 | 0.000 |
Developed Markets Index Fund | $14.91 | $7.79 | $0.387 | $0.005 |
Institutional Developed Markets Index Fund | $14.79 | $7.74 | $0.396 | $0.000 |
1 Adjusted to reflect a 2-for-1 share split as of the close of business on June 13, 2008.
3

President’s Letter
Dear Shareholder,
After several years of generous returns, international markets dropped sharply during the past 12 months as a global credit crisis caused investors to pull back from riskier investments such as stocks. The bear market spared no country, but emerging markets suffered the most, as Vanguard Emerging Markets Stock Index Fund returned –56.66% for Investor Shares.
Losses in Europe and the Pacific region were a bit less severe, but still deep, as Vanguard European Stock Index Fund lost –47.80% and Vanguard Pacific Stock Index Fund retreated –42.71% (Investor Shares). Vanguard Developed Markets Index Fund and its institutional counterpart, which invest in the European and Pacific funds in market-weighted proportions, posted similar results.
These results for the Vanguard International Stock Index Funds (the Emerging Markets Stock Index Fund excepted) slightly exceeded the returns of their respective benchmark indexes because of short-term discrepancies that arose from fair-value pricing, which is described more fully later in this letter. The funds’ performances were also slightly better than the average returns of their peer groups.
Please note that the ETF Shares of the Emerging Markets Stock Index Fund underwent a 2-for-1 split in June. If you own one or more of the funds in a taxable account, you may wish to review the details of the funds’ after-tax returns on page 112.
4
Stock prices fell sharply in global upheaval
Global stock markets started the 12-month period near all-time highs but then declined sharply, laid low by the financial crisis that originated in the fixed income markets. The descent traced a series of jagged ups and downs. During the week ended October 10, for example, the U.S. stock market returned about –18%. When Wall Street opened the following Monday, stocks surged, returning more than 10% over the next six-and-a-half hours.
For the full 12 months, the broad U.S. stock market returned –36.43%; international stocks returned –48.27%. The pain was especially acute in emerging markets—among the strongest performers in recent years—as investors became increasingly risk-averse.
Bond market averages masked disparate returns
The broad U.S. taxable bond market registered an unremarkable return of 0.30% for the 12 months, but by its own typically sedate standards, the dislocations were extreme. The strong performance of U.S. Treasury and government securities was offset by double-digit declines in the corporate bond market. These dynamics led to unusually large differences between the yields of Treasuries and their corresponding private sector securities—both a reflection and a cause of the credit market’s distress. Despite their generally high creditworthiness, municipal bonds also fell in price, with the broad tax-exempt market registering a 12-month return of –3.30%.
Market Barometer | |
| Average Annual Total Returns |
| Periods Ended October 31, 2008 |
| One Year | Three Years | Five Years |
Stocks | | | |
MSCI All Country World Index ex USA (International) | –48.27% | –3.93% | 5.05% |
Russell 1000 Index (Large-caps) | –36.80 | –5.51 | 0.37 |
Russell 2000 Index (Small-caps) | –34.16 | –4.79 | 1.57 |
Dow Jones Wilshire 5000 Index (Entire market) | –36.43 | –5.10 | 0.81 |
| | | |
Bonds | | | |
Lehman U.S. Aggregate Bond Index (Broad taxable market) | 0.30% | 3.60% | 3.48% |
Lehman Municipal Bond Index | –3.30 | 1.71 | 2.73 |
Citigroup 3-Month Treasury Bill Index | 2.31 | 3.93 | 3.10 |
| | | |
CPI | | | |
Consumer Price Index | 3.66% | 2.83% | 3.20% |
5
Expense Ratios | | | |
Your Fund Compared With Its Peer Group | | | |
| Fund | Acquired Fund | Peer-Group |
| Expense | Fees and | Expense |
| Ratio1 | Expenses2 | Ratio3 |
European Stock Index Fund | | | |
Investor Shares | 0.22% | — | 1.35% |
Admiral Shares | 0.12 | — | 1.35 |
Signal Shares | 0.12 | — | 1.35 |
Institutional Shares | 0.09 | — | 1.35 |
ETF Shares | 0.12 | — | 1.35 |
Pacific Stock Index Fund | | | |
Investor Shares | 0.22% | — | 1.58% |
Admiral Shares | 0.12 | — | 1.58 |
Signal Shares | 0.12 | — | 1.58 |
Institutional Shares | 0.09 | — | 1.58 |
ETF Shares | 0.12 | — | 1.58 |
Emerging Markets Stock Index Fund | | | |
Investor Shares | 0.37% | — | 1.80% |
Admiral Shares | 0.25 | — | 1.80 |
Signal Shares | 0.25 | — | 1.80 |
Institutional Shares | 0.20 | — | 1.80 |
ETF Shares | 0.25 | — | 1.80 |
Developed Markets Index Fund | — | 0.22% | 1.48% |
Institutional Developed Markets Index Fund | — | 0.09% | 1.48% |
1 The fund expense ratios shown are from the prospectus dated August 29, 2008. For the fiscal year ended October 31, 2008, the European Stock Index Fund’s expense ratios were 0.22% for Investor Shares, 0.12% for Admiral Shares, 0.12% for Signal Shares, 0.09% for Institutional Shares, and 0.11% for ETF Shares. The Pacific Stock Index Fund’s expense ratios were 0.22% for Investor Shares, 0.12% for Admiral Shares, 0.12% for Signal Shares, 0.09% for Institutional Shares, and 0.11% for ETF Shares. The Emerging Markets Stock Index Fund’s expense ratios were 0.32% for Investor Shares, 0.20% for Admiral Shares, 0.20% for Signal Shares, 0.15% for Institutional Shares, and 0.20% for ETF Shares.
2 This figure—drawn from the prospectus dated October 14, 2008, for the Developed Markets Index Fund and February 27, 2008, for the Institutional Developed Markets Index Fund—represents a weighted average of the annualized expense ratios and any transaction fees charged by the underlying mutual funds (the “acquired” funds) in which the funds invest. The Developed Markets Index Fund and Institutional Developed Markets Index Fund do not charge any expenses or fees of their own. For the fiscal year ended October 31, 2008, the acquired fund fees and expenses were 0.22% for the Developed Markets Index Fund and 0.09% for the Institutional Developed Markets Index Fund.
3 Peer groups are: for the European Stock Index Fund, the Average European Region Fund; for the Pacific Stock Index Fund, the Average Japan/Pacific Region Fund; for the Emerging Markets Stock Index Fund, the Average Emerging Markets Fund; and for the two other funds, the Average International Fund. The peer-group expense ratios are derived from data provided by Lipper Inc. and capture information through year-end 2007.
6
The U.S. Federal Reserve Board responded to the turmoil with new lending programs and a dramatic easing of monetary policy. Over the full 12 months, the Fed reduced its target for the federal funds rate from 4.50% to 1.00%.
Investors turned bearish in every corner of the globe
This report includes three distinct regional index funds—European, Pacific, and Emerging Markets. It also includes two funds-of-funds, the Developed Markets Index Fund and its institutional counterpart (available at a minimum initial investment of $5 million). Both invest in the European and Pacific funds in market-weighted proportions.
Vanguard Total International Stock Index Fund, which previously was included in this report and invests in European, Pacific, and emerging markets, now issues its own report.
The European Stock Index Fund’s Investor Shares lost –47.80% for the fiscal period. Each of the region’s three largest markets, the United Kingdom, France, and Germany, which together represent more than half of the index, posted similar losses. Switz-erland (–32%) was the only market that didn’t fall by at least a third.
Owing to credit woes, the worst damage came from financials (–60%), the largest European sector, which represented on average about a quarter of the region’s market value. As in the United States, banks suffered from exposure to problematic debt securities linked to falling U.S. home values.
Most other industries fell between –33% (consumer staples) and –56% (industrials). The sector that suffered the least was health care (–19%). The decline of the euro (–10%) and British pound (–25%)
Total Returns | | | |
Ten Years Ended October 31, 20081 | | | |
| | Average Annual Return |
| | | Average |
| Vanguard | Target | Competing |
Index Fund | Fund | Index | Fund2 |
European Stock Investor Shares | 1.69% | 1.53% | 1.94% |
Pacific Stock Investor Shares | 2.16 | 2.05 | 1.62 |
Emerging Markets Stock Investor Shares | 9.24 | 9.39 | 9.08 |
Developed Markets | –0.97 | –1.12 | –1.92 |
Institutional Developed Markets | –0.94 | –1.12 | –2.03 |
The figures shown represent past performance, which is not a guarantee of future results. (Current performance may be lower or higher than the performance data cited. For performance data current to the most recent month-end, visit our website at www.vanguard.com/performance.) Note, too, that both investment returns and principal value can fluctuate widely, so an investor’s shares, when sold, could be worth more or less than their original cost.
1 Since inception for the Developed Markets Index Fund (May 8, 2000) and the Institutional Developed Markets Index Fund (June 1, 2000).
2 Derived from data provided by Lipper Inc. against the U.S. dollar in currency markets during the fiscal year amplified losses for U.S.-based investors.
7
Pacific region losses were also severe
The Pacific Stock Index Fund’s Investor Shares returned –42.71% for the period. Japan, by far the largest market in the region, retreated –37% in U.S. dollar terms, a less severe loss than that experienced by Japanese investors given that the Japanese yen rose nearly 17% against the dollar during the period.
The other major Pacific markets—Australia, Hong Kong, and Singapore—lost more than half their value. As with other markets around the world, financial stocks (–50%), representing the region’s largest sector, were the leading cause of the losses.
Other sectors in the region faced similar headwinds during the global slowdown. In terms of negative impact on the fund, industrials (–47%) and materials (–54%) were most prominent. Consumer staples (–27%), typically less volatile during bear markets, and health care (–21%) were least affected by the downdraft.
Emerging markets suffered the most during the period
True to their more volatile reputation, emerging markets lost the most among international stocks during the period after stellar gains in recent years. The Emerging Markets Stock Index Fund’s Investor Shares fell –56.66%, with South Korea (–60%) and China (–68%) pulling the fund down the most. But no country was spared outsized losses, including Brazil (–54%), Taiwan (–49%), India (–62%), and Russia (–61%).
A quarter of the fund’s loss came from troubled financials, as commercial banks, brokerages, and other financial firms grappled with the unprecedented global credit squeeze. The energy sector (–57%), including coal companies and those active in oil and gas exploration and refining in Brazil, China, and Russia, was hit by rapidly falling energy prices as commodity markets anticipated slowing energy demand worldwide.
The Developed Markets Index Fund and the Institutional Developed Markets Index Fund are funds-of-funds that hold market-based weightings in the European and Pacific markets. Thus, their results were in line with proportional returns from those markets, with the two funds losing –46.24% and –46.12%, respectively.
The funds’ long-term performance is in line with the markets’
As the table on page 7 shows, the Vanguard International Stock Index Funds have met their objective of tracking their respective benchmarks over the past decade, with differences between fund and index returns of no more than 0.20 percentage point. And except for the European Stock Index Fund, their returns have also surpassed the average annual returns of their respective peer groups since inception or for the ten years ended October 31, 2008.
8
As noted earlier, the returns of the funds (except for the Emerging Markets Stock Index Fund) were slightly better than those of their target indexes for the past 12 months and, indeed, for the longer period shown on page 7. These differences were partly the result of fair-value pricing, which allows the funds to calculate their net asset values based on real-time developments not reflected in closing prices set in overseas markets that operate in different time zones. When fair-value pricing is used at the open or close of a reporting period, it may cause a temporary divergence between the return of a fund and that of its index. This discrepancy corrects itself when market prices reflect fair value, usually the next day.
An index fund’s performance may also differ slightly from the return of its target benchmark because the fund may hold a slightly different roster of securities than those listed in the benchmark. Of course, the most consistent performance divergence arises from the operating costs incurred by an index fund—costs not present in the return from a benchmark.
Vanguard’s Quantitative Equity Group has managed index funds for more than three decades. Its disciplined execution of the funds’ indexing mandates, combined with the funds’ extremely low costs, can help you execute a long-term strategy of seeking to capture nearly all of the returns from international markets.
International investing still offers valuable diversification
After enjoying several years of strong returns with few bumps along the way, investors in international stocks were harshly reminded in the past year that a bear market can come at any time—and once in a while it can come with unusual severity. Such was the case with the credit crisis of 2008, with repercussions that unsettled even the most seasoned investors.
Nevertheless, the dramatic increase of international commerce in recent years, particularly in less developed nations, continues to offer long-term growth possibilities for patient investors.
That is why it is important to have a well-thought-out investment strategy based on a diversified mix of stock, bond, and money market mutual funds that fits your goals, time horizon, and risk tolerance. For those who can tolerate the extra volatility that sometimes comes with overseas investing, the International Stock Index Funds remain a cost-effective way to add an extra element of diversification to your portfolio and thus help you maintain a durable long-term investment plan.
Thank you for your confidence in Vanguard.
Sincerely,

F. William McNabb III
President and Chief Executive Officer
November 17, 2008
9
Vanguard European ETF | | | | |
Premium/Discount: March 4, 20051–October 31, 2008 | | | |
| | | | |
| Market Price Above or | Market Price Below |
| Equal to Net Asset Value | | Net Asset Value |
| Number | Percentage | Number | Percentage |
Basis Point Differential2 | of Days | of Total Days | of Days | of Total Days |
0–24.9 | 251 | 27.14% | 80 | 8.65% |
25–49.9 | 273 | 29.51 | 11 | 1.19 |
50–74.9 | 160 | 17.30 | 5 | 0.54 |
75–100.0 | 85 | 9.19 | 1 | 0.11 |
>100.0 | 56 | 6.05 | 3 | 0.32 |
Total | 825 | 89.19% | 100 | 10.81% |
| | | | | | |
Vanguard Pacific ETF | | | | |
Premium/Discount: March 4, 20051–October 31, 2008 | | | |
| | | | |
| Market Price Above or | Market Price Below |
| Equal to Net Asset Value | | Net Asset Value |
| Number | Percentage | Number | Percentage |
Basis Point Differential2 | of Days | of Total Days | of Days | of Total Days |
0–24.9 | 250 | 27.02% | 127 | 13.73% |
25–49.9 | 217 | 23.46 | 35 | 3.78 |
50–74.9 | 140 | 15.14 | 2 | 0.22 |
75–100.0 | 76 | 8.22 | 6 | 0.65 |
>100.0 | 69 | 7.46 | 3 | 0.32 |
Total | 752 | 81.30% | 173 | 18.70% |
| | | | | | |
Vanguard Emerging Markets ETF | | | | |
Premium/Discount: March 4, 20051–October 31, 2008 | | | |
| | | | |
| Market Price Above or | Market Price Below |
| Equal to Net Asset Value | | Net Asset Value |
| Number | Percentage | Number | Percentage |
Basis Point Differential2 | of Days | of Total Days | of Days | of Total Days |
0–24.9 | 160 | 17.30% | 97 | 10.48% |
25–49.9 | 189 | 20.43 | 48 | 5.19 |
50–74.9 | 172 | 18.59 | 28 | 3.03 |
75–100.0 | 102 | 11.03 | 21 | 2.27 |
>100.0 | 80 | 8.65 | 28 | 3.03 |
Total | 703 | 76.00% | 222 | 24.00% |
| | | | | | | |
1 Inception.
2 One basis point equals 1/100 of a percentage point.
10
European Stock Index Fund
Fund Profile
As of October 31, 2008
Portfolio Characteristics | | |
| | Target | Broad |
| Fund | Index1 | Index2 |
Number of Stocks | 530 | 513 | 1,898 |
Turnover Rate | 15% | — | — |
Expense Ratio | | | |
(10/31/2007)3 | | — | — |
Investor Shares | 0.22% | | |
Admiral Shares | 0.12% | | |
Signal Shares | 0.12% | | |
Institutional Shares | 0.09% | | |
ETF Shares | 0.12% | | |
Short-Term Reserves | 0.2% | — | — |
Sector Diversification (% of equity exposure) |
| | Target | Broad |
| Fund | Index1 | Index2 |
Consumer Discretionary | 8.7% | 8.5% | 9.0% |
Consumer Staples | 11.7 | 11.8 | 9.9 |
Energy | 12.2 | 12.2 | 12.0 |
Financials | 22.3 | 22.4 | 21.4 |
Health Care | 11.7 | 11.7 | 9.7 |
Industrials | 8.6 | 8.6 | 10.0 |
Information Technology | 2.9 | 2.9 | 9.1 |
Materials | 7.2 | 7.2 | 7.4 |
Telecommunication | | | |
Services | 7.2 | 7.2 | 6.0 |
Utilities | 7.5 | 7.5 | 5.5 |
Volatility Measures4 | |
| Fund Versus | Fund Versus |
| Target Index1 | Broad Index2 |
R-Squared | 0.99 | 0.95 |
Beta | 0.98 | 0.93 |
Ten Largest Holdings5 (% of total net assets) |
| | |
Royal Dutch Shell PLC | integrated oil | |
| and gas | 3.3% |
BP PLC | integrated oil | |
| and gas | 2.9 |
Nestle SA (Registered) | packaged foods | |
| and meats | 2.9 |
HSBC Holdings PLC | diversified banks | 2.7 |
Novartis AG (Registered) | pharmaceuticals | 2.3 |
Total SA | integrated oil | |
| and gas | 2.2 |
Roche Holdings AG | pharmaceuticals | 2.0 |
GlaxoSmithKline PLC | pharmaceuticals | 2.0 |
Vodafone Group PLC | wireless | |
| telecommunication | |
| services | 1.9 |
Volkswagen AG | automobile | |
| manufacturers | 1.9 |
Top Ten | | 24.1% |
Market Diversification (% of equity exposure) |
| | Target |
| Fund | Index1 |
United Kingdom | 32.3% | 32.7% |
France | 15.4 | 15.9 |
Germany | 13.0 | 12.9 |
Switzerland | 12.8 | 12.7 |
Spain | 6.0 | 6.0 |
Italy | 5.3 | 5.3 |
Netherlands | 3.7 | 3.6 |
Sweden | 2.9 | 2.9 |
Finland | 2.1 | 2.2 |
Denmark | 1.3 | 1.3 |
Belgium | 1.1 | 1.1 |
Norway | 1.1 | 1.1 |
Other European Countries | 3.0 | 2.3 |
1 MSCI Europe Index.
2 MSCI All Country World Index ex USA.
3 The expense ratios shown are from the prospectus dated August 29, 2008. For the fiscal year ended October 31, 2008, the expense ratios were 0.22% for Investor Shares, 0.12% for Admiral Shares, 0.12% for Signal Shares, 0.09% for Institutional Shares, and 0.11% for ETF Shares.
4 For an explanation of R-squared, beta, and other terms used here, see the Glossary.
5 The holdings listed exclude any temporary cash investments and equity index products.
11
European Stock Index Fund
Performance Summary
All of the returns in this report represent past performance, which is not a guarantee of future results that may be achieved by the fund. (Current performance may be lower or higher than the performance data cited. For performance data current to the most recent month-end, visit our website at www.vanguard.com/performance.) Note, too, that both investment returns and principal value can fluctuate widely, so an investor’s shares, when sold, could be worth more or less than their original cost. The returns shown do not reflect taxes that a shareholder would pay on fund distributions or on the sale of fund shares.
Cumulative Performance: October 31, 1998–October 31, 2008
Initial Investment of $10,000

| Average Annual Total Returns | Final Value of |
| Periods Ended October 31, 2008 | a $10,000 |
| One Year | Five Years | Ten Years | Investment |
European Stock Index Fund Investor Shares1 | –47.80% | 4.57% | 1.69% | $11,824 |
MSCI All Country World Index ex USA | –48.27 | 5.05 | 3.19 | 13,692 |
MSCI Europe Index | –48.02 | 4.42 | 1.53 | 11,635 |
Average European Region Fund2 | –49.48 | 4.13 | 1.94 | 12,122 |
| | | | Final Value of |
| | | Since | a $100,000 |
| One Year | Five Years | Inception3 | Investment |
European Stock Index Fund Admiral Shares1 | –47.74% | 4.67% | 2.96% | $123,435 |
MSCI All Country World Index ex USA | –48.27 | 5.05 | 4.22 | 134,713 |
MSCI Europe Index | –48.02 | 4.42 | 2.75 | 121,628 |
| | | Final Value of |
| | Since | a $10,000,000 |
| One Year | Inception3 | Investment |
European Stock Index Fund Signal Shares1 | –47.74% | –16.05% | $6,962,972 |
MSCI All Country World Index ex USA | –48.27 | –15.28 | 7,096,378 |
MSCI Europe Index | –48.02 | 16.40 | 6,902,538 |
1 Total returns do not reflect the 0.5% transaction fee on purchases through March 31, 2000; the 2% fee assessed on redemptions of shares purchased on or after June 27, 2003, and held for less than two months; or, for the Investor Shares, the account service fee that may be applicable to certain accounts with balances below $10,000.
2 Derived from data provided by Lipper Inc.
3 Performance for the fund and its comparative standards is calculated since the following inception dates: August 13, 2001, for the Admiral Shares and October 6, 2006, for the Signal Shares.
12
European Stock Index Fund
| | | | Final Value of |
| | | Since | a $5,000,000 |
| One Year | Five Years | Inception1 | Investment |
European Stock Index Fund Institutional Shares2 | –47.72% | 4.72% | –0.15% | $4,936,145 |
MSCI All Country World Index ex USA | –48.27 | 5.05 | 0.49 | 5,212,137 |
MSCI Europe Index | –48.02 | 4.42 | –0.37 | 4,847,388 |
| | | Final Value of |
| | Since | a $10,000 |
| One Year | Inception1 | Investment |
European Stock Index Fund ETF Shares Net Asset Value | –47.73% | –3.35% | $8,828 |
MSCI All Country World Index ex USA | –48.27 | –2.35 | 9,168 |
MSCI Europe Index | –48.02 | –3.65 | 8,727 |
Cumulative Returns: ETF Shares, March 4, 2005–October 31, 2008 |
| | Since |
| One Year | Inception1 |
European Stock Index Fund ETF Shares Market Price | –47.28% | –10.83% |
European Stock Index Fund ETF Shares Net Asset Value | –47.73 | –11.72 |
MSCI Europe Index | –48.02 | –12.73 |
1 Performance for the fund and its comparative standards is calculated since the following inception dates: May 15, 2000, for the Institutional Shares and March 4, 2005, for the ETF Shares.
2 Total returns do not reflect the 0.5% transaction fee on purchases through March 31, 2000, or the 2% fee assessed on redemptions of shares purchased on or after June 27, 2003, and held for less than two months.
13
European Stock Index Fund
Fiscal-Year Total Returns (%): October 31, 1998–October 31, 2008

Average Annual Total Returns: Periods Ended September 30, 2008
This table presents average annual total returns through the latest calendar quarter—rather than through the end of the fiscal period. Securities and Exchange Commission rules require that we provide this information.
| Inception Date | One Year | Five Years | Ten Years |
European Stock Index Fund | | | | |
Investor Shares1 | 6/18/1990 | –30.04% | 11.26% | 5.01% |
Admiral Shares1 | 8/13/2001 | –29.99 | 11.36 | 6.602 |
Signal Shares1 | 10/6/2006 | –29.98 | –5.722 | — |
Institutional Shares1 | 5/15/2000 | –29.97 | 11.41 | 2.812 |
ETF Shares | 3/4/2005 | | | — |
Market Price | | –29.29 | 3.722 | — |
Net Asset Value | | –29.98 | 3.432 | — |
1 Total returns do not reflect the 0.5% transaction fee on purchases through March 31, 2000; the 2% fee assessed on redemptions of shares purchased on or after June 27, 2003, and held for less than two months; or, for the Investor Shares, the account service fee that may be applicable to certain accounts with balances below $10,000.
2 Returns since inception.
Note: See Financial Highlights tables for dividend and capital gains information.
14
European Stock Index Fund
Financial Statements
Statement of Net Assets
As of October 31, 2008
The fund provides a complete list of its holdings four times in each fiscal year, at the quarter-ends. For the second and fourth fiscal quarters, the lists appear in the fund’s semiannual and annual reports to shareholders. For the first and third fiscal quarters, the fund files the lists with the Securities and Exchange Commission on Form N-Q. Shareholders can look up the fund’s Forms N-Q on the SEC’s website at www.sec.gov. Forms N-Q may also be reviewed and copied at the SEC’s Public Reference Room (see the back cover of this report for further information).
| | | Market |
| | | Value• |
| | Shares | ($000) |
Common Stocks (99.4%)1 | | |
Austria (0.6%) | | |
| OMV AG | 541,937 | 17,347 |
^ | Erste Bank der | | |
| Oesterreichischen | | |
| Sparkassen AG | 617,659 | 16,467 |
| Telekom Austria AG | 1,133,107 | 13,923 |
| Oesterreichische | | |
| Elektrizitaetswirtschafts | | |
| AG Class A | 252,692 | 11,954 |
| Voestalpine AG | 379,871 | 9,270 |
| Raiffeisen International | | |
| Bank-Holding AG | 174,078 | 5,478 |
| Wienerberger AG | 274,945 | 4,564 |
* | Atrium European | | |
| Real Estate | 998,913 | 4,542 |
| Andritz AG | 124,822 | 3,555 |
| Vienna Insurance Group | 122,666 | 3,311 |
| Strabag SE | 163,770 | 3,206 |
* | IMMOFINANZ AG | 1,465,265 | 1,634 |
* | IMMOEAST Immobilien | | |
| Anlagen AG | 1,330,952 | 1,605 |
| | | 96,856 |
Belgium (1.1%) | | |
^ | InBev NV | 606,503 | 24,462 |
| KBC Bank & | | |
| Verzekerings Holding | 522,976 | 22,484 |
| Groupe Bruxelles | | |
| Lambert SA | 264,070 | 19,399 |
| Belgacom SA | 553,444 | 18,936 |
| Delhaize Group | 326,858 | 18,382 |
| Solvay SA | 194,250 | 18,068 |
| Colruyt NV | 54,325 | 12,210 |
^ | Dexia | 1,743,399 | 9,273 |
| UCB SA | 331,810 | 8,446 |
^ | Fortis | 7,230,107 | 8,377 |
| Umicore | 402,363 | 7,196 |
| Compagnie Nationale a | | |
| Portefeuille | 127,975 | 6,921 |
| | | Market |
| | | Value• |
| | Shares | ($000) |
| Mobistar SA | 101,710 | 6,749 |
| KBC Ancora | 99,989 | 2,972 |
| | | 183,875 |
Denmark (1.3%) | | |
| Novo Nordisk A/S | | |
| B Shares | 1,500,382 | 80,425 |
* | Vestas Wind Systems A/S | 607,475 | 24,882 |
| Danske Bank A/S | 1,479,595 | 21,903 |
| AP Moller-Maersk A/S | | |
| B Shares | 3,584 | 20,626 |
| Novozymes A/S | 151,103 | 10,667 |
| AP Moller-Maersk A/S | | |
| A Shares | 1,805 | 10,524 |
| Carlsberg A/S B Shares | 231,276 | 9,105 |
^ | DSV A/S | 631,217 | 7,584 |
| Danisco A/S | 159,675 | 6,918 |
^ | FLS Industries A/S | | |
| B Shares | 174,427 | 6,506 |
| Coloplast A/S B Shares | 80,247 | 5,819 |
* | Topdanmark A/S | 51,456 | 5,559 |
^ | Trygvesta A/S | 89,445 | 5,378 |
* | Jyske Bank A/S | 165,713 | 4,895 |
| Sydbank A/S | 204,547 | 3,179 |
^,* | William Demant A/S | 77,995 | 2,984 |
^ | Rockwool International A/S | 26,738 | 1,798 |
| | | 228,752 |
Finland (2.1%) | | |
| Nokia Oyj | 12,431,942 | 190,435 |
| Fortum Oyj | 1,451,547 | 35,673 |
| Sampo Oyj A Shares | 1,400,647 | 28,069 |
| UPM-Kymmene Oyj | 1,705,266 | 24,113 |
| Stora Enso Oyj R Shares | 1,895,807 | 17,630 |
| Kone Oyj | 500,352 | 11,196 |
| Wartsila Oyj B Shares | 273,965 | 6,941 |
| Elisa Oyj Class A | 458,033 | 6,890 |
| Neste Oil Oyj | 418,260 | 6,616 |
| Metso Oyj | 423,100 | 5,623 |
| Kesko Oyj | 217,188 | 5,084 |
| Pohjola Bank PLC | 369,044 | 4,965 |
| Nokian Renkaat Oyj | 350,245 | 4,579 |
15
European Stock Index Fund
| | | Market |
| | | Value• |
| | Shares | ($000) |
| Rautaruuki Oyj | 270,123 | 4,408 |
| Orion Oyj | 283,516 | 4,166 |
^ | Sanoma Oyj | 269,766 | 4,129 |
| Outokumpu Oyj A Shares | 376,772 | 3,904 |
^ | YIT Oyj | 420,880 | 2,621 |
| Cargotec Corp. | 112,023 | 1,551 |
| | | 368,593 |
France (15.2%) | | |
| Total SA | 7,067,224 | 388,793 |
| Sanofi-Aventis | 3,440,561 | 217,984 |
| BNP Paribas SA | 2,666,717 | 192,541 |
| Gaz de France | 3,584,919 | 159,578 |
| France Telecom SA | 5,986,774 | 150,960 |
| Vivendi SA | 3,811,913 | 99,640 |
| AXA | 5,062,423 | 96,713 |
| Carrefour SA | 2,075,118 | 87,663 |
| Societe Generale Class A | 1,526,648 | 83,210 |
| Groupe Danone | 1,428,888 | 79,562 |
| Air Liquide SA | 807,617 | 69,693 |
| L’Oreal SA | 799,359 | 60,531 |
| LVMH Louis Vuitton | | |
| Moet Hennessy | 801,325 | 53,323 |
| Vinci SA | 1,357,124 | 48,839 |
| Schneider Electric SA | 722,352 | 43,296 |
| Credit Agricole SA | 2,912,674 | 42,138 |
| Unibail Co. | 267,503 | 40,121 |
| Electricite de France | 655,483 | 39,384 |
| Cie. de St. Gobain SA | 928,653 | 35,834 |
| Pernod Ricard SA | 538,073 | 35,039 |
| Alstom | 696,026 | 34,498 |
| Bouygues SA | 797,782 | 33,970 |
| Lafarge SA | 479,870 | 31,723 |
| Veolia Environnement | 1,234,536 | 30,594 |
| Essilor International SA | 656,738 | 29,460 |
^ | Hermes International | 225,695 | 29,130 |
| Accor SA | 640,235 | 24,909 |
| Compagnie Generale | | |
| des Etablissements | | |
| Michelin SA | 472,249 | 24,307 |
* | Alcatel-Lucent | 7,595,861 | 19,614 |
| Vallourec SA | 173,276 | 19,382 |
| Renault SA | 604,441 | 18,525 |
| STMicroelectronics NV | 2,227,863 | 18,314 |
* | Suez Environnement SA | 884,230 | 16,905 |
| Pinault-Printemps-Redoute | | |
| SA | 250,907 | 15,990 |
| Lagardere S.C.A. | 393,128 | 15,631 |
| Sodexho Alliance SA | 311,912 | 14,976 |
| Cap Gemini SA | 451,488 | 14,547 |
| PSA Peugeot Citroen | 497,864 | 13,285 |
| Thales SA | 292,651 | 11,743 |
| Christian Dior SA | 178,907 | 10,839 |
| Technip SA | 336,491 | 10,076 |
| Casino Guichard-Perrachon | | |
| SA | 143,653 | 10,042 |
| CNP Assurances | 122,638 | 9,882 |
| | | Market |
| | | Value• |
| | Shares | ($000) |
| Publicis Groupe SA | 410,989 | 9,289 |
| SCOR SA | 564,904 | 9,255 |
| Neopost SA | 104,633 | 8,760 |
^ | Dassault Systemes SA | 208,336 | 8,626 |
| Safran SA | 615,472 | 7,811 |
| Natixis | 3,184,064 | 7,051 |
* | Compagnie Generale | | |
| de Geophysique SA | 426,135 | 6,890 |
| Air France | 437,379 | 6,302 |
* | Eutelsat Communications | 290,614 | 6,238 |
| Aeroports de Paris (ADP) | 95,771 | 5,700 |
| Zodiac SA | 137,836 | 5,390 |
| Klepierre | 233,888 | 5,387 |
| Atos Origin SA | 225,237 | 5,230 |
| Legrand SA | 302,866 | 5,040 |
^ | Societe Television | | |
| Francaise 1 | 391,067 | 5,014 |
| Eurazeo | 82,491 | 4,967 |
| Bureau Veritas SA | 134,243 | 4,786 |
^ | Eiffage SA | 123,396 | 4,741 |
| Societe BIC SA | 87,867 | 4,641 |
^ | Valeo SA | 245,728 | 4,280 |
| Imerys SA | 93,909 | 4,275 |
^ | Wendel Investissement | 89,296 | 4,266 |
| ICADE | 65,764 | 3,931 |
^ | PagesJaunes SA | 405,532 | 3,845 |
^ | JCDecaux SA | 212,223 | 3,688 |
| Gecina SA | 50,189 | 3,485 |
| Eramet SLN | 16,541 | 3,353 |
| M6 Metropole Television | 206,356 | 3,250 |
| | | 2,638,675 |
Germany (12.9%) | | |
^ | Volkswagen AG | 473,445 | 301,282 |
| E.On AG | 6,218,765 | 233,047 |
| Siemens AG | 2,840,980 | 167,066 |
| Bayer AG | 2,500,528 | 136,882 |
| Deutsche Telekom AG | 9,273,920 | 136,058 |
| RWE AG | 1,455,227 | 119,301 |
| Allianz AG | 1,479,714 | 108,596 |
| BASF AG | 3,095,110 | 102,181 |
| SAP AG | 2,854,837 | 99,951 |
| Muenchener | | |
| Rueckversicherungs- | | |
| Gesellschaft AG | | |
| (Registered) | 675,183 | 87,652 |
| Daimler AG (Registered) | 2,511,541 | 85,141 |
| Deutsche Bank AG | 1,772,962 | 66,232 |
| Deutsche Boerse AG | 637,973 | 49,893 |
| Linde AG | 438,696 | 36,299 |
| Continental AG | | |
| Acceptance Line | 484,850 | 34,540 |
| Deutsche Post AG | 2,766,157 | 30,330 |
| Fresenius Medical Care | | |
| AG | 623,217 | 27,610 |
| Bayerische Motoren | | |
| Werke AG | 1,083,250 | 27,470 |
16
European Stock Index Fund
| | | Market |
| | | Value• |
| | Shares | ($000) |
| Porsche AG | 285,684 | 24,968 |
| Commerzbank AG | 2,245,135 | 23,896 |
| Adidas AG | 666,554 | 23,154 |
| ThyssenKrupp AG | 1,181,415 | 22,377 |
| Volkswagen AG Pfd. | 345,289 | 21,292 |
| K&S AG | 487,570 | 18,887 |
| Merck KGaA | 211,022 | 18,641 |
| Man AG | 347,637 | 16,997 |
| Henkel AG & Co. KGaA | 585,615 | 16,736 |
| Fresenius AG Pfd. | 263,297 | 16,714 |
| Beiersdorf AG | 287,045 | 14,979 |
| Metro AG | 373,755 | 11,918 |
| DaimlerChrysler AG | 327,337 | 11,293 |
| Henkel KGaA | 426,987 | 10,441 |
| Deutsche Lufthansa AG | 749,417 | 10,380 |
| Salzgitter AG | 133,687 | 8,608 |
^ | TUI AG | 699,731 | 8,451 |
| Celesio AG | 277,931 | 8,170 |
| RWE AG Pfd. | 126,372 | 7,891 |
* | Q-Cells AG | 195,388 | 7,737 |
* | Infineon Technologies AG | 2,443,705 | 7,568 |
^ | Solarworld AG | 271,643 | 6,686 |
^ | HeidelbergCement AG | 82,364 | 6,117 |
| Wacker Chemie AG | 51,710 | 5,588 |
| Bilfinger Berger AG | 122,964 | 5,540 |
| Fresenius AS | 93,136 | 5,449 |
^ | Deutsche Postbank AG | 268,603 | 5,409 |
| Hannover | | |
| Rueckversicherung AG | 200,424 | 4,962 |
| Hochtief AG | 135,203 | 4,149 |
| Fraport AG | 121,722 | 3,899 |
* | United Internet AG | 417,737 | 3,696 |
| Rheinmetall AG | 114,951 | 3,500 |
| Puma AG | 20,402 | 3,399 |
^ | Hypo Real Estate Holding | | |
| AG | 516,566 | 3,364 |
| Bayerische Motoren Werke | | |
| (BMW) | 166,088 | 3,320 |
| Hamburger Hafen | | |
| und Logistik AG | 81,289 | 2,759 |
| IVG Immobilien AG | 296,255 | 1,940 |
^,* | Arcandor AG | 372,475 | 870 |
^ | ProSieben Sat.1 Media AG | 258,624 | 765 |
^ | Continental AG | 2,378 | 101 |
| | | 2,232,142 |
Greece (0.8%) | | |
| National Bank of Greece | | |
| SA | 1,349,401 | 29,644 |
| Alpha Credit Bank SA | 1,239,359 | 18,095 |
| Greek Organization of | | |
| Football Prognostics | 729,090 | 15,919 |
| Bank of Piraeus | 1,019,833 | 12,937 |
| EFG Eurobank Ergasias | 1,031,126 | 11,208 |
| Hellenic | | |
| Telecommunications | | |
| Organization SA | 622,527 | 8,786 |
| | | Market |
| | | Value• |
| | Shares | ($000) |
| Marfin Financial Group | | |
| SA | 1,974,640 | 8,693 |
| Coca-Cola Hellenic | | |
| Bottling Co. SA | 537,115 | 7,496 |
| GEA Group AG | 487,105 | 6,995 |
| National Bank of Greece | | |
| SA ADR | 1,379,083 | 6,027 |
| Public Power Corp. | 339,494 | 4,198 |
| Hellenic | | |
| Telecommunications | | |
| Organization SA ADR | 516,570 | 3,750 |
| Hellenic Petroleum SA | 389,295 | 3,225 |
| Titan Cement Co. SA | 184,670 | 3,154 |
| | | 140,127 |
Ireland (0.6%) | | |
| CRH PLC | 1,756,106 | 38,585 |
| Allied Irish Banks PLC | 2,867,306 | 15,273 |
* | Elan Corp. PLC | 1,550,298 | 11,697 |
| Kerry Group PLC | | |
| A Shares | 460,036 | 10,251 |
| Bank of Ireland | 3,279,465 | 9,683 |
^ | Anglo Irish Bank Corp. | | |
| PLC | 2,444,939 | 7,848 |
* | Ryanair Holdings PLC | | |
| ADR | 161,755 | 3,602 |
| Irish Life & Permanent PLC | 866,373 | 2,964 |
* | Ryanair Holdings PLC | 357,520 | 1,246 |
| | | 101,149 |
Italy (5.3%) | | |
| Eni SpA | 8,516,877 | 203,282 |
| Enel SpA | 14,165,636 | 94,772 |
| Intesa Sanpaolo SpA | 25,195,698 | 92,214 |
| UniCredit SpA | 37,105,117 | 90,834 |
| Assicurazioni Generali | | |
| SpA | 3,459,783 | 87,373 |
| Telecom Italia SpA | 32,830,147 | 37,714 |
| Unione Di | | |
| Banche Italiane ScpA | 1,986,838 | 33,518 |
| Banco Popolare SpA | 2,094,722 | 26,132 |
| Fiat SpA | 2,317,453 | 18,389 |
| Mediobanca Banca di | | |
| Credito Finanziaria SpA | 1,609,904 | 18,380 |
| Telecom Italia SpA RNC | 19,764,142 | 16,632 |
| Saipem SpA | 862,007 | 16,202 |
| Banca Monte dei Paschi | | |
| di Siena SpA | 8,089,039 | 15,705 |
| Atlantia SpA | 839,133 | 15,359 |
| Mediaset SpA | 2,509,537 | 13,634 |
| Snam Rete Gas SpA | 2,567,396 | 12,996 |
| Terna SpA | 3,935,540 | 12,693 |
| Finmeccanica SpA | 984,752 | 12,213 |
| Parmalat SpA | 5,505,962 | 9,667 |
| Alleanza Assicurazioni | | |
| SpA | 1,376,767 | 9,178 |
| Luxottica Group SpA | 453,474 | 9,164 |
17
European Stock Index Fund
| | | Market |
| | | Value• |
| | Shares | ($000) |
| Intesa Sanpaolo SpA | | |
| Non Convertible Risp. | 2,885,324 | 8,564 |
| Banca Popolare di Milano | | |
| SpA | 1,285,151 | 7,521 |
| A2A SpA | 4,070,374 | 7,419 |
| Banca Carige SpA | 2,351,971 | 5,028 |
| Lottomatica SpA | 200,992 | 4,693 |
| Prysmian SpA | 358,881 | 4,354 |
| Fondiari-Sai SpA | 227,980 | 4,283 |
| Unipol Gruppo Finanziario | | |
| SpA | 2,206,084 | 3,914 |
| Bulgari SpA | 499,865 | 3,738 |
| Unipol Gruppo Finanziario | | |
| SpA Pfd. | 3,049,854 | 3,347 |
| IFIL Investments SpA | 988,473 | 3,065 |
| Pirelli & C. Accomandita | | |
| per Azioni SpA | 8,438,712 | 2,975 |
| Mediolanum SpA | 701,564 | 2,751 |
| Italcementi SpA | 227,872 | 2,656 |
| Autogrill SpA | 324,934 | 2,597 |
| Italcementi SpA Risp. | 338,104 | 2,353 |
* | IFI-Istituto Finanziario | | |
| Industriale SpA | 226,075 | 1,974 |
* | Finmeccanica SpA | | |
| Rights Exp. 11/7/08 | 937,309 | 382 |
| | | 917,665 |
Luxembourg (0.6%) | | |
| ArcelorMittal | | |
| (Paris Shares) | 2,843,784 | 73,965 |
| SES Global Fiduciary | | |
| Depositary Receipts | 989,272 | 17,797 |
| Millicom International | | |
| Cellular SA | 231,749 | 8,571 |
| Acergy SA | 629,485 | 4,257 |
| | | 104,590 |
Netherlands (3.7%) | | |
| Unilever NV | 5,329,342 | 128,434 |
| Koninklijke KPN NV | 5,897,571 | 83,057 |
| Koninklijke (Royal) | | |
| Philips Electronics NV | 3,366,016 | 62,203 |
| ING Groep NV | 6,240,706 | 58,540 |
| Koninklijke Ahold NV | 3,899,935 | 41,867 |
| Akzo Nobel NV | 889,484 | 36,972 |
| Reed Elsevier NV | 2,052,068 | 27,428 |
| Heineken NV | 801,456 | 27,036 |
| TNT NV | 1,240,995 | 26,190 |
| ASML Holding NV | 1,378,420 | 24,131 |
| Aegon NV | 4,562,166 | 18,957 |
^ | European Aeronautic | | |
| Defence and Space Co. | 1,060,736 | 17,643 |
| Wolters Kluwer NV | 972,574 | 17,217 |
| Koninklijke DSM NV | 444,346 | 12,374 |
| Heineken Holding NV | 360,885 | 10,956 |
| SBM Offshore NV | 467,337 | 8,221 |
| Corio NV | 142,289 | 7,604 |
| Fugro NV | 191,349 | 6,838 |
| | | Market |
| | | Value• |
| | Shares | ($000) |
| Randstad Holding NV | 319,907 | 6,218 |
| Koninklijke Boskalis | | |
| Westminster NV | 179,098 | 5,913 |
| SNS REAAL | 419,765 | 3,079 |
^,* | TomTom NV | 194,425 | 1,482 |
| ASML Holding NV | | |
| (New York Shares) | 34,293 | 602 |
| Aegon NV (New York) ARS | 3,320 | 14 |
| | | 632,976 |
Norway (1.1%) | | |
| StatoilHydro ASA | 4,198,527 | 84,448 |
| Orkla ASA | 2,711,944 | 18,054 |
| Telenor ASA | 2,741,223 | 16,357 |
| DnB NOR ASA | 2,396,241 | 13,887 |
| Yara International ASA | 622,672 | 13,009 |
| Norsk Hydro ASA | 2,255,503 | 9,424 |
| Seadrill Ltd. | 909,583 | 8,757 |
^ | Frontline Ltd. | 172,000 | 5,350 |
^,* | Renewable Energy Corp. | | |
| AS | 488,200 | 4,606 |
| Storebrand ASA | 1,278,459 | 3,030 |
| Aker Solutions ASA | 527,145 | 2,883 |
* | Petroleum Geo-Services | | |
| ASA | 542,477 | 2,701 |
| | | 182,506 |
Portugal (0.4%) | | |
| Electricidade de | | |
| Portugal SA | 5,984,810 | 20,385 |
| Portugal Telecom | | |
| SGPS SA | 2,007,779 | 13,205 |
^ | Banco Comercial | | |
| Portugues SA | 7,629,963 | 8,868 |
^ | Brisa-Auto Estradas de | | |
| Portugal SA | 979,314 | 7,513 |
| Banco Espirito Santo SA | 735,978 | 7,007 |
^ | Cimpor-Cimento de | | |
| Portugal SA | 891,716 | 4,069 |
| Jeronimo Martins, | | |
| SGPS, SA | 733,322 | 3,742 |
| Zon Multimedia Servicos | | |
| de Telecomunicacoes | | |
| e Multimedia SGPS SA | 548,772 | 2,785 |
| Banco BPI SA | 874,411 | 1,802 |
| Sonae SGPS SA | 2,843,363 | 1,729 |
| | | 71,105 |
Spain (5.9%) | | |
| Telefonica SA | 13,792,445 | 255,366 |
| Banco Santander | | |
| Central Hispano SA | 20,524,656 | 221,978 |
| Banco Bilbao Vizcaya | | |
| Argentaria SA | 11,648,522 | 135,197 |
| Iberdrola SA | 11,436,717 | 82,772 |
| Repsol YPF SA | 2,396,926 | 45,580 |
* | Union Fenosa, SA | 1,196,281 | 25,382 |
18
European Stock Index Fund
| | | Market |
| | | Value• |
| | Shares | ($000) |
| Industria de Diseno Textil | | |
| SA | 713,954 | 24,133 |
^ | ACS, Actividades de | | |
| Contruccion y Servisios, | | |
| SA | 636,597 | 23,636 |
^ | Banco Popular Espanol | | |
| SA | 2,590,952 | 23,579 |
^ | Banco de Sabadell SA | 3,003,428 | 20,486 |
| Red Electrica de Espana | | |
| SA | 352,511 | 15,451 |
^ | Abertis Infraestructuras | | |
| SA | 874,466 | 15,018 |
| Enagas SA | 585,621 | 11,442 |
| Gas Natural SDG SA | 367,852 | 11,322 |
| Gamesa Corporacion | | |
| Tecnologica SA | 600,134 | 9,839 |
^ | Bankinter SA | 860,835 | 9,289 |
| Criteria Caixacorp SA | 2,768,375 | 8,959 |
| Acciona SA | 92,900 | 8,787 |
* | Iberdrola Renovables | 2,745,041 | 8,351 |
| Grifols SA | 413,082 | 8,221 |
^ | Zardoya Otis SA | 414,946 | 7,861 |
^ | Corporacion Mapfre SA | 2,229,794 | 7,096 |
^ | Grupo Ferrovial SA | 208,326 | 6,420 |
^ | Cintra Concesiones de | | |
| Infraestructuras de | | |
| Transport SA | 709,164 | 6,309 |
^ | Indra Sistemas, SA | 322,039 | 6,258 |
^ | Fomento de Construc | | |
| y Contra SA | 150,120 | 5,969 |
^ | Acerinox SA | 467,286 | 5,874 |
| Telefonica SA ADR | 87,308 | 4,846 |
^,* | Banco Santander SA | 403,252 | 4,431 |
^ | Iberia | | |
| (Linea Aerea Espana) | 1,539,517 | 3,632 |
^ | Gestevision Telecinco SA | 353,420 | 2,838 |
^ | Sacyr Vallehermoso SA | 243,285 | 2,244 |
^ | Promotora de | | |
| Informaciones SA | 287,236 | 1,125 |
| | | 1,029,691 |
Sweden (2.9%) | | |
| Telefonaktiebolaget | | |
| LM Ericsson AB | | |
| Class B | 9,699,502 | 66,028 |
^ | Hennes & Mauritz | | |
| AB B Shares | 1,672,317 | 59,968 |
| Nordea Bank AB | 6,803,694 | 54,532 |
| TeliaSonera AB | 7,348,882 | 32,333 |
| Svenska Handelsbanken | | |
| AB A Shares | 1,501,424 | 27,592 |
| Investor AB B Shares | 1,490,700 | 22,482 |
| Sandvik AB | 3,285,297 | 21,322 |
| Volvo AB B Shares | 3,553,810 | 18,571 |
| Atlas Copco AB A Shares | 2,190,072 | 18,369 |
^ | Skandinaviska Enskilda | | |
| Banken AB A Shares | 1,522,997 | 15,094 |
| | | Market |
| | | Value• |
| | Shares | ($000) |
| Svenska Cellulosa | | |
| AB B Shares | 1,839,478 | 13,583 |
| Swedish Match AB | 836,994 | 11,623 |
| SKF AB B Shares | 1,268,101 | 11,551 |
| Assa Abloy AB | 1,028,571 | 11,484 |
| Skanska AB B Shares | 1,241,678 | 10,906 |
| Securitas AB B Shares | 1,028,615 | 9,876 |
^ | Swedbank AB A Shares | 1,174,639 | 9,707 |
| Scania AB B Shares | 1,168,548 | 9,604 |
| Atlas Copco AB B Shares | 1,273,595 | 9,535 |
| Alfa Laval AB | 1,250,704 | 9,029 |
| Tele2 AB B Shares | 1,005,494 | 8,580 |
| Getinge AB B Shares | 591,918 | 8,279 |
^ | Electrolux AB Series B | 820,765 | 7,556 |
^ | Husqvarna AB B Shares | 898,089 | 6,227 |
| SSAB Svenskt Stal | | |
| AB Series A | 581,316 | 5,878 |
^ | Holmen AB | 173,838 | 4,900 |
| Modern Times Group | | |
| AB B Shares | 165,453 | 3,550 |
^,* | Lundin Petroleum AB | 703,154 | 3,357 |
| SSAB Svenskt Stal | | |
| AB Series B | 265,337 | 2,405 |
^ | Boliden AB | 921,095 | 2,215 |
| | | 496,136 |
Switzerland (12.7%) | | |
| Nestle SA (Registered) | 12,858,743 | 500,038 |
| Novartis AG (Registered) | 7,783,387 | 395,069 |
| Roche Holdings AG | 2,298,344 | 351,479 |
* | UBS AG | 9,514,695 | 161,438 |
| Credit Suisse Group | | |
| (Registered) | 3,422,814 | 127,992 |
| Zurich Financial Services | | |
| AG | 476,200 | 96,610 |
| ABB Ltd. | 7,198,007 | 94,446 |
| Syngenta AG | 340,427 | 63,637 |
| Swiss Re (Registered) | 1,151,061 | 48,004 |
| Holcim Ltd. (Registered) | 689,946 | 39,188 |
* | Compagnie Financiere | | |
| Richemont SA | 1,708,168 | 35,910 |
| Julius Baer Holding, Ltd. | 693,713 | 27,131 |
| Synthes, Inc. | 194,197 | 25,060 |
| Swisscom AG | 74,196 | 22,671 |
* | Actelion Ltd. | 321,017 | 16,959 |
| Swatch Group AG (Bearer) | 104,047 | 16,236 |
| SGS Societe Generale de | | |
| Surveillance Holding | | |
| SA (Registered) | 15,328 | 15,091 |
| Givaudan SA | 21,363 | 14,557 |
| Adecco SA (Registered) | 401,867 | 13,980 |
| Geberit AG | 129,576 | 13,462 |
| Lonza AG (Registered) | 155,862 | 12,935 |
| Kuehne & | | |
| Nagel International AG | 175,199 | 10,608 |
| Swiss Life Holding | 114,765 | 10,341 |
| Baloise Holdings AG | 165,780 | 8,863 |
19
European Stock Index Fund
| | | Market |
| | | Value• |
| | Shares | ($000) |
* | Logitech International SA | 567,817 | 8,465 |
| Schindler Holding AG | | |
| (Bearer Participation | | |
| Certificates) | 167,792 | 7,264 |
| Pargesa Holding SA | 88,661 | 6,792 |
| Nobel Biocare Holding AG | 391,223 | 6,721 |
| Sonova Holding AG | 153,643 | 6,384 |
| Lindt & Spruengli AG | 2,719 | 5,849 |
| Sulzer AG (Registered) | 88,009 | 5,196 |
| Swatch Group AG | | |
| (Registered) | 169,717 | 4,860 |
* | Aryzta AG (Ireland Shares) | 135,681 | 4,842 |
^ | Straumann Holding AG | 25,815 | 4,381 |
* | Aryzta AG | 120,510 | 4,261 |
| EFG International | 170,944 | 3,680 |
^,* | OC Oerlikon Corp AG | 22,574 | 1,751 |
* | UBS AG (New York Shares) | 100,268 | 1,695 |
| | | 2,193,846 |
United Kingdom (32.2%) | | |
| BP PLC | 58,158,406 | 474,077 |
| HSBC Holdings PLC | 39,272,586 | 465,153 |
| GlaxoSmithKline PLC | 17,893,098 | 343,976 |
| Vodafone Group PLC | 163,507,416 | 314,542 |
| Royal Dutch Shell PLC | | |
| Class B | 8,961,986 | 242,975 |
| Royal Dutch Shell PLC | | |
| Class A | | |
| (Amsterdam Shares) | 8,492,604 | 235,389 |
| AstraZeneca Group PLC | 4,763,526 | 201,871 |
| BG Group PLC | 10,945,624 | 160,944 |
| British American Tobacco | | |
| PLC | 5,624,275 | 154,270 |
| Rio Tinto PLC | 3,265,061 | 152,518 |
| Tesco PLC | 25,690,147 | 140,759 |
| Diageo PLC | 8,344,153 | 127,336 |
| BHP Billiton PLC | 7,220,395 | 122,606 |
| Anglo American PLC | 4,324,974 | 108,519 |
| Unilever PLC | 4,246,214 | 95,395 |
| National Grid Transco | | |
| PLC | 8,163,540 | 91,963 |
| Imperial Tobacco Group | | |
| PLC | 3,324,007 | 89,088 |
| Royal Dutch Shell PLC | | |
| Class A | 3,111,039 | 85,475 |
| Reckitt Benckiser Group | | |
| PLC | 1,979,431 | 83,729 |
| Standard Chartered PLC | 4,646,517 | 76,793 |
| Barclays PLC | 26,640,814 | 76,368 |
| BAE Systems PLC | 11,514,840 | 64,724 |
| Lloyds TSB Group PLC | 19,412,063 | 62,742 |
| Royal Bank of | | |
| Scotland Group PLC | 54,080,402 | 59,570 |
| Centrica PLC | 12,053,088 | 59,227 |
| Scottish & | | |
| Southern Energy PLC | 2,846,290 | 55,792 |
| Aviva PLC | 8,691,979 | 51,848 |
| | | Market |
| | | Value• |
| | Shares | ($000) |
| BT Group PLC | 25,280,961 | 47,504 |
| SABMiller PLC | 2,955,882 | 46,951 |
| Prudential PLC | 8,145,080 | 40,915 |
| Cadbury PLC | 4,431,135 | 40,688 |
| British Energy Group PLC | 3,382,598 | 40,459 |
| Xstrata PLC | 2,079,175 | 35,563 |
| Morrison Supermarkets | | |
| PLC | 7,902,909 | 33,650 |
| Man Group PLC | 5,618,518 | 32,438 |
| Reed Elsevier PLC | 3,603,325 | 31,617 |
| Rolls-Royce Group PLC | 5,957,768 | 31,522 |
| HBOS PLC | 17,679,593 | 28,949 |
| BP PLC ADR | 575,360 | 28,595 |
| Compass Group PLC | 6,066,235 | 28,209 |
| Standard Life PLC | 7,124,413 | 27,579 |
| Land Securities Group | | |
| PLC | 1,541,072 | 27,355 |
| Smith & Nephew PLC | 2,905,415 | 26,603 |
| Pearson PLC | 2,643,786 | 26,333 |
* | United Utilities Group | | |
| PLC | 2,230,852 | 25,191 |
| Shire Ltd. | 1,832,864 | 24,017 |
| Royal & Sun Alliance | | |
| Insurance Group PLC | 10,657,932 | 23,701 |
| Legal & General Group | | |
| PLC | 19,780,658 | 22,750 |
| British Sky | | |
| Broadcasting Group | | |
| PLC | 3,729,227 | 22,694 |
| Capita Group PLC | 1,971,882 | 20,375 |
| Tullow Oil PLC | 2,357,944 | 20,025 |
| Vodafone Group PLC ADR | 1,030,225 | 19,852 |
| WPP Group PLC | 3,244,313 | 19,407 |
| Experian Group Ltd. | 3,357,547 | 18,517 |
| Marks & Spencer Group | | |
| PLC | 5,181,283 | 18,368 |
| International Power PLC | 4,947,354 | 17,699 |
| Severn Trent PLC | 768,873 | 16,995 |
| British Land Co., PLC | 1,662,872 | 16,581 |
| Smiths Group PLC | 1,261,798 | 16,246 |
| Cable and Wireless PLC | 8,175,900 | 16,205 |
| J. Sainsbury PLC | 3,420,343 | 15,625 |
| Kingfisher PLC | 7,717,310 | 14,244 |
| Old Mutual PLC | 16,362,880 | 13,250 |
| Associated British Foods | | |
| PLC | 1,161,622 | 12,998 |
| Rexam PLC | 2,107,372 | 12,699 |
| Group 4 Securicor PLC | 4,151,079 | 12,572 |
| The Sage Group PLC | 4,289,767 | 12,009 |
| Wolseley PLC | 2,171,127 | 11,882 |
| Carnival PLC | 532,567 | 11,712 |
| Cobham PLC | 3,732,869 | 11,345 |
* | Cairn Energy PLC | 431,793 | 11,187 |
| Next PLC | 651,996 | 11,082 |
| 3i Group PLC | 1,261,866 | 11,007 |
| Hammerson PLC | 952,930 | 10,983 |
20
European Stock Index Fund
| | | Market |
| | | Value• |
| | Shares | ($000) |
| Bunzl PLC | 1,076,863 | 10,827 |
^ | Thomson Reuters PLC | 614,742 | 10,651 |
| Johnson Matthey PLC | 696,564 | 10,484 |
| FirstGroup PLC | 1,581,027 | 10,433 |
| Drax Group PLC | 1,112,680 | 10,339 |
| Lonmin PLC | 515,041 | 9,606 |
| Serco Group PLC | 1,591,221 | 9,489 |
| Liberty International PLC | 822,661 | 9,153 |
| Home Retail Group | 2,851,297 | 9,088 |
| Amec PLC | 1,078,670 | 9,025 |
| Tate & Lyle PLC | 1,500,202 | 8,919 |
| Friends Provident PLC | 7,541,583 | 8,648 |
| ICAP PLC | 1,692,333 | 8,433 |
| Whitbread PLC | 576,990 | 8,363 |
| Antofagasta PLC | 1,288,868 | 7,963 |
| InterContinental | | |
| Hotels Group PLC | 862,000 | 7,318 |
| Vedanta Resources PLC | 475,400 | 6,584 |
| Segro PLC | 1,441,688 | 6,509 |
* | Invensys PLC | 2,571,746 | 6,449 |
| Burberry Group PLC | 1,432,391 | 6,375 |
| Balfour Beatty PLC | 1,568,451 | 6,338 |
| TUI Travel PLC | 1,836,703 | 5,606 |
| LogicaCMG PLC | 4,775,049 | 5,316 |
| Tomkins PLC | 2,876,781 | 5,280 |
| Stagecoach Group PLC | 1,747,353 | 5,247 |
| Eurasian Natural | | |
| Resources Corp. | 1,044,573 | 5,224 |
| Schroders PLC | 406,988 | 5,217 |
| ITV PLC | 10,752,321 | 5,193 |
| Investec PLC | 1,326,697 | 5,038 |
| Hays PLC | 4,525,365 | 4,968 |
| Ladbrokes PLC | 1,938,116 | 4,939 |
| United Business | | |
| Media Ltd. | 756,774 | 4,924 |
| Meggitt PLC | 2,186,146 | 4,789 |
^ | Persimmon PLC | 962,035 | 4,657 |
| IMI PLC | 1,047,957 | 4,657 |
| London Stock Exchange | | |
| PLC | 503,273 | 4,566 |
| GKN PLC | 2,323,697 | 4,456 |
| Daily Mail and | | |
| General Trust PLC | 908,886 | 4,280 |
| Thomas Cook Group PLC | 1,575,279 | 4,273 |
| Mondi PLC | 1,174,912 | 4,264 |
| Rentokil Initial PLC | 5,793,344 | 4,211 |
| British Airways PLC | 1,857,699 | 4,111 |
| | | Market |
| | | Value• |
| | Shares | ($000) |
| National Express Group | | |
| PLC | 426,535 | 3,929 |
| William Hill PLC | 1,113,603 | 3,424 |
| Mitchells & Butlers PLC | 1,342,377 | 3,398 |
| Kazakhmys PLC | 713,165 | 3,344 |
| The Berkeley Group | | |
| Holdings PLC | 270,078 | 3,252 |
^ | Carphone Warehouse | | |
| PLC | 1,313,186 | 2,851 |
| Enterprise Inns PLC | 1,598,578 | 2,517 |
| WPP Group PLC ADR | 78,406 | 2,384 |
| Inchcape PLC | 1,381,578 | 1,762 |
| | | 5,572,868 |
Total Common Stocks | | |
(Cost $24,683,829) | | 17,191,552 |
Temporary Cash Investments (3.2%)1 | | |
Money Market Fund (3.0%) | | |
2,3 | Vanguard Market | | |
| Liquidity Fund, | | |
| 2.217% | 524,204,153 | 524,204 |
| | | |
| | Face | |
| | Amount | |
| | ($000) | |
U.S. Agency Obligations (0.2%) | | |
4 | Federal Home Loan Bank, | | |
| 2.674%, 2/27/09 | 9,000 | 8,930 |
4 | Federal Home Loan | | |
| Mortgage Corp., | | |
| 2.383%, 2/9/09 | 10,000 | 9,934 |
4,5 | Federal National | | |
| Mortgage Assn., | | |
| 2.585%, 11/17/08 | 11,000 | 10,992 |
| | | 29,856 |
Total Temporary Cash Investments | | |
(Cost $554,048) | | 554,060 |
Total Investments (102.6%) | | |
(Cost $25,237,877) | | 17,745,612 |
Other Assets and Liabilites (–2.6%) | | |
Other Assets | | 200,308 |
Liabilities3 | | (647,791) |
| | | (447,483) |
Net Assets (100%) | | 17,298,129 |
21
European Stock Index Fund
At October 31, 2008, net assets consisted of: |
| Amount |
| ($000) |
Paid-in Capital | 24,360,187 |
Undistributed Net Investment Income | 1,073,239 |
Accumulated Net Realized Losses | (616,281) |
Unrealized Appreciation (Depreciation) | |
Investment Securities | (7,492,265) |
Futures Contracts | (14,447) |
Foreign Currencies and Forward | |
Currency Contracts | (12,304) |
Net Assets | 17,298,129 |
| |
Investor Shares—Net Assets | |
Applicable to 478,999,317 outstanding | |
$.001 par value shares of beneficial | |
interest (unlimited authorization) | 10,534,353 |
Net Asset Value Per Share— | |
Investor Shares | $21.99 |
| |
Admiral Shares—Net Assets | |
Applicable to 28,466,434 outstanding | |
$.001 par value shares of beneficial | |
interest (unlimited authorization) | 1,471,904 |
Net Asset Value Per Share— | |
Admiral Shares | $51.71 |
| |
Signal Shares—Net Assets | |
Applicable to 11,130,074 outstanding | |
$.001 par value shares of beneficial | |
interest (unlimited authorization) | 222,722 |
Net Asset Value Per Share— | |
Signal Shares | $20.01 |
| |
Institutional Shares—Net Assets | |
Applicable to 150,430,711 outstanding | |
$.001 par value shares of beneficial | |
interest (unlimited authorization) | 3,315,638 |
Net Asset Value Per Share— | |
Institutional Shares | $22.04 |
| |
ETF Shares—Net Assets | |
Applicable to 42,390,728 outstanding | |
$.001 par value shares of beneficial | |
interest (unlimited authorization) | 1,753,512 |
Net Asset Value Per Share— | |
ETF Shares | $41.37 |
• | See Note A in Notes to Financial Statements. |
^ | Part of security position is on loan to broker-dealers. The total value of securities on loan is $414,364,000. |
* | Non-income-producing security. |
1 The fund invests a portion of its cash reserves in equity markets through the use of index futures contracts. After giving effect to futures investments, the fund’s effective common stock and temporary cash investment positions represent 99.9% and 2.7%, respectively, of net assets.
2 Affiliated money market fund available only to Vanguard funds and certain trusts and accounts managed by Vanguard. Rate shown is the 7-day yield.
3 Includes $434,146,000 of collateral received for securities on loan.
4 The issuer operates under a congressional charter; its securities are neither issued nor guaranteed by the U.S. government.
5 Securities with a value of $10,992,000 have been segregated as initial margin for open futures contracts.
ADR—American Depositary Receipt.
ARS—Auction Rate Security.
See accompanying Notes, which are an integral part of the Financial Statements.
22
European Stock Index Fund
Statement of Operations
| Year Ended |
| October 31, 2008 |
| ($000) |
Investment Income | |
Income | |
Dividends1 | 1,212,764 |
Interest2 | 3,604 |
Security Lending | 49,302 |
Total Income | 1,265,670 |
Expenses | |
The Vanguard Group—Note B | |
Investment Advisory Services | 765 |
Management and Administrative—Investor Shares | 37,024 |
Management and Administrative—Admiral Shares | 1,986 |
Management and Administrative—Signal Shares | 336 |
Management and Administrative—Institutional Shares | 1,825 |
Management and Administrative—ETF Shares | 1,563 |
Marketing and Distribution—Investor Shares | 5,630 |
Marketing and Distribution—Admiral Shares | 472 |
Marketing and Distribution—Signal Shares | 75 |
Marketing and Distribution—Institutional Shares | 1,183 |
Marketing and Distribution—ETF Shares | 745 |
Custodian Fees | 5,561 |
Auditing Fees | 39 |
Shareholders’ Reports—Investor Shares | 170 |
Shareholders’ Reports—Admiral Shares | 10 |
Shareholders’ Reports—Signal Shares | 2 |
Shareholders’ Reports—Institutional Shares | 1 |
Shareholders’ Reports—ETF Shares | 83 |
Trustees’ Fees and Expenses | 40 |
Total Expenses | 57,510 |
Net Investment Income | 1,208,160 |
Realized Net Gain (Loss) | |
Investment Securities Sold | 3,088,109 |
Futures Contracts | (76,194) |
Foreign Currencies and Forward Currency Contracts | (8,781) |
Realized Net Gain (Loss) | 3,003,134 |
Change in Unrealized Appreciation (Depreciation) | |
Investment Securities | (20,939,502) |
Futures Contracts | (19,010) |
Foreign Currencies and Forward Currency Contracts | (17,769) |
Change in Unrealized Appreciation (Depreciation) | (20,976,281) |
Net Increase (Decrease) in Net Assets Resulting from Operations | (16,764,987) |
1 Dividends are net of foreign withholding taxes of $75,256,000.
2 Interest income from an affiliated company of the fund was $3,179,000.
See accompanying Notes, which are an integral part of the Financial Statements.
23
European Stock Index Fund
Statement of Changes in Net Assets
| Year Ended October 31, |
| 2008 | 2007 |
| ($000) | ($000) |
Increase (Decrease) in Net Assets | | |
Operations | | |
Net Investment Income | 1,208,160 | 1,038,999 |
Realized Net Gain (Loss) | 3,003,134 | 97,343 |
Change in Unrealized Appreciation (Depreciation) | (20,976,281) | 6,493,764 |
Net Increase (Decrease) in Net Assets Resulting from Operations | (16,764,987) | 7,630,106 |
Distributions | | |
Net Investment Income | | |
Investor Shares | (743,072) | (460,764) |
Admiral Shares | (87,518) | (62,628) |
Signal Shares | (14,971) | (341) |
Institutional Shares | (139,970) | (90,854) |
ETF Shares | (97,010) | (39,981) |
Realized Capital Gain | | |
Investor Shares | — | — |
Admiral Shares | — | — |
Signal Shares | — | — |
Institutional Shares | — | — |
ETF Shares | — | — |
Total Distributions | (1,082,541) | (654,568) |
Capital Share Transactions | | |
Investor Shares | (3,934,149) | 4,446,099 |
Admiral Shares | 12,041 | 162,740 |
Signal Shares | (29,856) | 467,826 |
Institutional Shares | 815,638 | 1,192,242 |
ETF Shares | 225,574 | 1,456,669 |
Net Increase (Decrease) from Capital Share Transactions | (2,910,752) | 7,725,576 |
Total Increase (Decrease) | (20,758,280) | 14,701,114 |
Net Assets | | |
Beginning of Period | 38,056,409 | 23,355,295 |
End of Period1 | 17,298,129 | 38,056,409 |
1 Net Assets—End of Period includes undistributed net investment income of $1,073,239,000 and $954,677,000.
See accompanying Notes, which are an integral part of the Financial Statements.
24
European Stock Index Fund
Financial Highlights
Investor Shares | | | | | |
| | | | | |
For a Share Outstanding | Year Ended October 31, |
Throughout Each Period | 2008 | 2007 | 2006 | 2005 | 2004 |
Net Asset Value, Beginning of Period | $43.43 | $34.67 | $27.00 | $23.77 | $19.93 |
Investment Operations | | | | | |
Net Investment Income | 1.3721 | 1.2981 | .920 | .670 | .540 |
Net Realized and Unrealized Gain (Loss) | | | | | |
on Investments | (21.597) | 8.386 | 7.450 | 3.140 | 3.760 |
Total from Investment Operations | (20.225) | 9.684 | 8.370 | 3.810 | 4.300 |
Distributions | | | | | |
Dividends from Net Investment Income | (1.215) | (.924) | (.700) | (.580) | (.460) |
Distributions from Realized Capital Gains | — | — | — | — | — |
Total Distributions | (1.215) | (.924) | (.700) | (.580) | (.460) |
Net Asset Value, End of Period | $21.99 | $43.43 | $34.67 | $27.00 | $23.77 |
| | | | | |
Total Return2 | –47.80% | 28.49% | 31.63% | 16.21% | 21.89% |
| | | | | |
Ratios/Supplemental Data | | | | | |
Net Assets, End of Period (Millions) | $10,534 | $26,188 | $16,850 | $10,759 | $7,904 |
Ratio of Total Expenses to | | | | | |
Average Net Assets | 0.22% | 0.22% | 0.27% | 0.27% | 0.27% |
Ratio of Net Investment Income to | | | | | |
Average Net Assets | 3.82% | 3.35% | 3.35% | 2.84% | 2.67% |
Portfolio Turnover Rate3 | 15% | 9% | 6% | 5% | 5% |
1 Calculated based on average shares outstanding.
2 Total returns do not reflect the 2% fee assessed on redemptions of shares purchased on or after June 27, 2003, and held for less than two months, or the account service fee that may be applicable to certain accounts with balances below $10,000.
3 Excludes the value of portfolio securities received or delivered as a result of in-kind purchases or redemptions of the fund's capital shares, including ETF Creation Units.
See accompanying Notes, which are an integral part of the Financial Statements.
25
European Stock Index Fund
Financial Highlights
Admiral Shares | | | | | |
| | | | | |
For a Share Outstanding | Year Ended October 31, |
Throughout Each Period | 2008 | 2007 | 2006 | 2005 | 2004 |
Net Asset Value, Beginning of Period | $102.09 | $81.50 | $63.44 | $55.84 | $46.82 |
Investment Operations | | | | | |
Net Investment Income | 3.1771 | 3.1401 | 2.230 | 1.611 | 1.308 |
Net Realized and Unrealized Gain (Loss) | | | | | |
on Investments | (50.618) | 19.692 | 17.510 | 7.396 | 8.830 |
Total from Investment Operations | (47.441) | 22.832 | 19.740 | 9.007 | 10.138 |
Distributions | | | | | |
Dividends from Net Investment Income | (2.939) | (2.242) | (1.680) | (1.407) | (1.118) |
Distributions from Realized Capital Gains | — | — | — | — | — |
Total Distributions | (2.939) | (2.242) | (1.680) | (1.407) | (1.118) |
Net Asset Value, End of Period | $51.71 | $102.09 | $81.50 | $63.44 | $55.84 |
| | | | | |
Total Return2 | –47.74% | 28.59% | 31.77% | 16.32% | 21.98% |
| | | | | |
Ratios/Supplemental Data | | | | | |
Net Assets, End of Period (Millions) | $1,472 | $2,955 | $2,175 | $1,360 | $628 |
Ratio of Total Expenses to | | | | | |
Average Net Assets | 0.12% | 0.12% | 0.17% | 0.18% | 0.18% |
Ratio of Net Investment Income to | | | | | |
Average Net Assets | 3.92% | 3.45% | 3.45% | 2.93% | 2.76% |
Portfolio Turnover Rate3 | 15% | 9% | 6% | 5% | 5% |
1 Calculated based on average shares outstanding.
2 Total returns do not reflect the 2% fee assessed on redemptions of shares purchased on or after June 27, 2003, and held for less than two months.
3 Excludes the value of portfolio securities received or delivered as a result of in-kind purchases or redemptions of the fund’s capital shares, including ETF Creation Units.
See accompanying Notes, which are an integral part of the Financial Statements.
26
European Stock Index Fund
Financial Highlights
Signal Shares | | | |
| | | Oct. 6, |
| Year Ended | 20061 to |
| October 31, | Oct. 31, |
For a Share Outstanding Throughout Each Period | 2008 | 2007 | 2006 |
Net Asset Value, Beginning of Period | $39.50 | $31.51 | $30.41 |
Investment Operations | | | |
Net Investment Income | 1.2552 | 1.1512 | .0102 |
Net Realized and Unrealized Gain (Loss) on Investments | (19.616) | 7.681 | 1.090 |
Total from Investment Operations | (18.361) | 8.832 | 1.100 |
Distributions | | | |
Dividends from Net Investment Income | (1.129) | (.842) | — |
Distributions from Realized Capital Gains | — | — | — |
Total Distributions | (1.129) | (.842) | — |
Net Asset Value, End of Period | $20.01 | $39.50 | $31.51 |
| | | |
Total Return3 | –47.74% | 28.59% | 3.62% |
| | | |
Ratios/Supplemental Data | | | |
Net Assets, End of Period (Millions) | $223 | $502 | $12 |
Ratio of Total Expenses to Average Net Assets | 0.12% | 0.12% | 0.17%4 |
Ratio of Net Investment Income to Average Net Assets | 3.92% | 3.45% | 3.45%4 |
Portfolio Turnover Rate5 | 15% | 9% | 6% |
1 Inception.
2 Calculated based on average shares outstanding.
3 Total returns do not reflect the 2% fee assessed on redemptions of shares held for less than two months.
4 Annualized.
5 Excludes the value of portfolio securities received or delivered as a result of in-kind purchases or redemptions of the fund’s capital shares, including ETF Creation Units.
See accompanying Notes, which are an integral part of the Financial Statements.
27
European Stock Index Fund
Financial Highlights
Institutional Shares | | | | | |
| | | | | |
For a Share Outstanding | Year Ended October 31, |
Throughout Each Period | 2008 | 2007 | 2006 | 2005 | 2004 |
Net Asset Value, Beginning of Period | $43.51 | $34.74 | $27.05 | $23.80 | $19.96 |
Investment Operations | | | | | |
Net Investment Income | 1.3151 | 1.3501 | .978 | .721 | .570 |
Net Realized and Unrealized Gain (Loss) | | | | | |
on Investments | (21.524) | 8.390 | 7.450 | 3.140 | 3.760 |
Total from Investment Operations | (20.209) | 9.740 | 8.428 | 3.861 | 4.330 |
Distributions | | | | | |
Dividends from Net Investment Income | (1.261) | (.970) | (.738) | (.611) | (.490) |
Distributions from Realized Capital Gains | — | — | — | — | — |
Total Distributions | (1.261) | (.970) | (.738) | (.611) | (.490) |
Net Asset Value, End of Period | $22.04 | $43.51 | $34.74 | $27.05 | $23.80 |
| | | | | |
Total Return2 | –47.72% | 28.63% | 31.83% | 16.42% | 22.03% |
| | | | | |
Ratios/Supplemental Data | | | | | |
Net Assets, End of Period (Millions) | $3,316 | $5,263 | $3,113 | $1,827 | $988 |
Ratio of Total Expenses to | | | | | |
Average Net Assets | 0.09% | 0.09% | 0.12% | 0.12% | 0.12% |
Ratio of Net Investment Income to | | | | | |
Average Net Assets | 3.95% | 3.48% | 3.50% | 2.99% | 2.77% |
Portfolio Turnover Rate3 | 15% | 9% | 6% | 5% | 5% |
1 Calculated based on average shares outstanding.
2 Total returns do not reflect the 2% fee assessed on redemptions of shares purchased on or after June 27, 2003, and held for less than two months.
3 Excludes the value of portfolio securities received or delivered as a result of in-kind purchases or redemptions of the fund’s capital shares, including ETF Creation Units.
See accompanying Notes, which are an integral part of the Financial Statements.
28
European Stock Index Fund
Financial Highlights
ETF Shares | | | | |
| | | | March 4, |
| | | | 20051 to |
| Year Ended October 31, | Oct. 31, |
For a Share Outstanding Throughout Each Period | 2008 | 2007 | 2006 | 2005 |
Net Asset Value, Beginning of Period | $81.66 | $65.21 | $50.80 | $50.96 |
Investment Operations | | | | |
Net Investment Income | 2.5302 | 2.5762 | 1.800 | 1.040 |
Net Realized and Unrealized Gain (Loss) on Investments | (40.464) | 15.683 | 13.990 | (1.200) |
Total from Investment Operations | (37.934) | 18.259 | 15.790 | (.160) |
Distributions | | | | |
Dividends from Net Investment Income | (2.356) | (1.809) | (1.380) | — |
Distributions from Realized Capital Gains | — | — | — | — |
Total Distributions | (2.356) | (1.809) | (1.380) | — |
Net Asset Value, End of Period | $41.37 | $81.66 | $65.21 | $50.80 |
| | | | |
Total Return | –47.73% | 28.60% | 31.75% | –0.31% |
| | | | |
Ratios/Supplemental Data | | | | |
Net Assets, End of Period (Millions) | $1,754 | $3,148 | $1,205 | $178 |
Ratio of Total Expenses to Average Net Assets | 0.11% | 0.12% | 0.18% | 0.18%3 |
Ratio of Net Investment Income to Average Net Assets | 3.93% | 3.45% | 3.44% | 2.93%3 |
Portfolio Turnover Rate4 | 15% | 9% | 6% | 5% |
1 Inception.
2 Calculated based on average shares outstanding.
3 Annualized.
4 Excludes the value of portfolio securities received or delivered as a result of in-kind purchases or redemptions of the fund’s capital shares, including ETF Creation Units.
See accompanying Notes, which are an integral part of the Financial Statements.
29
European Stock Index Fund
Notes to Financial Statements
Vanguard European Stock Index Fund is registered under the Investment Company Act of 1940 as an open-end investment company, or mutual fund. The fund invests in securities of foreign issuers, which may subject it to investment risks not normally associated with investing in securities of U.S. corporations. The fund offers five classes of shares: Investor Shares, Admiral Shares, Signal Shares, Institutional Shares, and ETF Shares. Investor Shares are available to any investor who meets the fund’s minimum purchase requirements. Admiral Shares are designed for investors who meet certain administrative, service, tenure, and account-size criteria. Signal Shares are designed for institutional investors who meet certain administrative, service, and account-size criteria. Institutional Shares are designed for investors who meet certain administrative and service criteria and invest a minimum of $5 million. ETF Shares are listed for trading on the NYSE Arca, Inc.; they can be purchased and sold through a broker.
A. The following significant accounting policies conform to generally accepted accounting principles for U.S. mutual funds. The fund consistently follows such policies in preparing its financial statements.
1. Security Valuation: Securities are valued as of the close of trading on the New York Stock Exchange (generally 4 p.m., Eastern time) on the valuation date. Equity securities are valued at the latest quoted sales prices or official closing prices taken from the primary market in which each security trades; such securities not traded on the valuation date are valued at the mean of the latest quoted bid and asked prices. Securities for which market quotations are not readily available, or whose values have been affected by events occurring before the fund’s pricing time but after the close of the securities’ primary markets, are valued at their fair values calculated according to procedures adopted by the board of trustees. These procedures include obtaining quotations from an independent pricing service, monitoring news to identify significant market- or security-specific events, and evaluating changes in the values of foreign market proxies (for example, ADRs, futures contracts, or exchange-traded funds), between the time the foreign markets close and the fund’s pricing time. When fair-value pricing is employed, the prices of securities used by a fund to calculate its net asset value may differ from quoted or published prices for the same securities. Investments in Vanguard Market Liquidity Fund are valued at that fund’s net asset value. Temporary cash investments acquired over 60 days to maturity are valued using the latest bid prices or using valuations based on a matrix system (which considers such factors as security prices, yields, maturities, and ratings), both as furnished by independent pricing services. Other temporary cash investments are valued at amortized cost, which approximates market value.
2. Foreign Currency: Securities and other assets and liabilities denominated in foreign currencies are translated into U.S. dollars using exchange rates obtained from an independent third party as of the fund’s pricing time on the valuation date. Realized gains (losses) and unrealized appreciation (depreciation) on investment securities include the effects of changes in exchange rates since the securities were purchased, combined with the effects of changes in security prices. Fluctuations in the value of other assets and liabilities resulting from changes in exchange rates are recorded as unrealized foreign currency gains (losses) until the assets or liabilities are settled in cash, at which time they are recorded as realized foreign currency gains (losses).
30
European Stock Index Fund
3. Futures and Forward Currency Contracts: The fund uses index futures contracts to a limited extent, with the objectives of maintaining full exposure to the stock market, enhancing returns, maintaining liquidity, and minimizing transaction costs. The fund may purchase futures contracts to immediately invest incoming cash in the market, or sell futures in response to cash outflows, thereby simulating a fully invested position in the underlying index while maintaining a cash balance for liquidity. The fund may seek to enhance returns by using futures contracts instead of the underlying securities when futures are believed to be priced more attractively than the underlying securities. The primary risks associated with the use of futures contracts are imperfect correlation between changes in market values of stocks held by the fund and the prices of futures contracts, and the possibility of an illiquid market.
The fund also may enter into forward currency contracts to provide the appropriate currency exposure related to any open futures contracts. The fund’s risks in using these contracts include movement in the values of the foreign currencies relative to the U.S. dollar and the ability of the counterparties to fulfill their obligations under the contracts.
Futures and forward currency contracts are valued at their quoted daily settlement prices. The aggregate principal amounts of the contracts are not recorded in the Statement of Net Assets. Fluctuations in the value of the contracts are recorded in the Statement of Net Assets as an asset (liability) and in the Statement of Operations as unrealized appreciation (depreciation) until the contracts are closed, when they are recorded as realized gains (losses) on futures or forward currency contracts.
4. Federal Income Taxes: The fund intends to continue to qualify as a regulated investment company and distribute all of its taxable income. Management has analyzed the fund’s tax positions taken on federal income tax returns for all open tax years (tax years ended October 31, 2005–2008), and has concluded that no provision for federal income tax is required in the fund’s financial statements.
5. Distributions: Distributions to shareholders are recorded on the ex-dividend date.
6. Security Lending: The fund may lend its securities to qualified institutional borrowers to earn additional income. Security loans are required to be secured at all times by collateral at least equal to the market value of securities loaned. The fund invests cash collateral received in Vanguard Market Liquidity Fund, and records a liability for the return of the collateral, during the period the securities are on loan. Security lending income represents the income earned on investing cash collateral, less expenses associated with the loan.
7. Other: Dividend income is recorded on the ex-dividend date. Interest income includes income distributions received from Vanguard Market Liquidity Fund and is accrued daily. Security transactions are accounted for on the date securities are bought or sold. Costs used to determine realized gains (losses) on the sale of investment securities are those of the specific securities sold. Fees assessed on redemptions of capital shares are credited to paid-in capital.
Each class of shares has equal rights as to assets and earnings, except that each class separately bears certain class-specific expenses related to maintenance of shareholder accounts (included in Management and Administrative expenses) and shareholder reporting. Marketing and distribution expenses are allocated to each class of shares based on a method approved by the board of trustees. Income, other non-class-specific expenses, and gains and losses on investments are allocated to each class of shares based on its relative net assets.
31
European Stock Index Fund
B. The Vanguard Group furnishes at cost investment advisory, corporate management, administrative, marketing, and distribution services. The costs of such services are allocated to the fund under methods approved by the board of trustees. The fund has committed to provide up to 0.40% of its net assets in capital contributions to Vanguard. At October 31, 2008, the fund had contributed capital of $1,979,000 to Vanguard (included in Other Assets), representing 0.01% of the fund’s net assets and 1.98% of Vanguard’s capitalization. The fund’s trustees and officers are also directors and officers of Vanguard.
C. Distributions are determined on a tax basis and may differ from net investment income and realized capital gains for financial reporting purposes. Differences may be permanent or temporary. Permanent differences are reclassified among capital accounts in the financial statements to reflect their tax character. Temporary differences arise when certain items of income, expense, gain, or loss are recognized in different periods for financial statement and tax purposes; these differences will reverse at some time in the future. Differences in classification may also result from the treatment of short-term gains as ordinary income for tax purposes.
During the year ended October 31, 2008, the fund realized net foreign currency losses of $7,600,000, which decreased distributable net income for tax purposes; accordingly, such losses have been reclassified from accumulated net realized losses to undistributed net investment income. Certain of the fund’s investments are in securities considered to be “passive foreign investment companies,” for which any unrealized appreciation and/or realized gains are required to be included in distributable net income for tax purposes. During the year ended October 31, 2008, the fund realized gains on the sale of passive foreign investment companies of $543,000, which have been included in current and prior periods’ taxable income; accordingly, such gains have been reclassified from accumulated net realized losses to undistributed net investment income. Unrealized appreciation of $19,314,000 on the fund’s passive foreign investment company holdings at October 31, 2007, has been distributed and is reflected in the balance of undistributed net investment income. Since October 31, 2007, the fund’s passive foreign investment company holdings have depreciated in value, reducing the amount of taxable income available for distribution as of October 31, 2008 by $14,818,000. Unrealized appreciation on the fund’s passive foreign investment company holdings at October 31, 2008, was $4,496,000.
During the year ended October 31, 2008, the fund realized $3,596,684,000 of net capital gains resulting from in-kind redemptions—in which shareholders exchanged fund shares for securities held by the fund rather than for cash. Because such gains are not taxable to the fund, and are not distributed to shareholders, they have been reclassified from accumulated net realized losses to paid-in capital.
For tax purposes, at October 31, 2008, the fund had $1,109,431,000 of ordinary income available for distribution. The fund had available realized losses of $370,782,000 to offset future net capital gains of $13,739,000 through October 31, 2011, and $357,043,000 through October 31, 2016.
At October 31, 2008, the cost of investment securities for tax purposes was $25,496,864,000. Net unrealized depreciation of investment securities for tax purposes was $7,751,252,000, consisting of unrealized gains of $583,528,000 on securities that had risen in value since their purchase and $8,334,780,000 in unrealized losses on securities that had fallen in value since their purchase.
32
European Stock Index Fund
At October 31, 2008, the aggregate settlement value of open futures contracts expiring in December 2008 and the related unrealized appreciation (depreciation) were:
| | | ($000) |
| Number of | Aggregate | Unrealized |
| Long (Short) | Settlement | Appreciation |
Futures Contracts | Contracts | Value | (Depreciation) |
MSCI Pan-Euro Index | 4,433 | 85,106 | (14,447) |
At October 31, 2008, the fund had open forward currency contracts to receive and deliver currencies as follows:
| | | | | Unrealized |
| | | | | Appreciation |
| Contract Amount (000) | (Depreciation) |
Contract Settlement Date | | Receive | | Deliver | ($000) |
12/23/2008 | EUR | 58,608 | USD | 74,204 | (10,078) |
| | | | | |
EUR—Euro. | | | | | |
USD—U.S. dollar. | | | | | |
Unrealized appreciation (depreciation) on open forward currency contracts is required to be treated as realized gain (loss) for tax purposes.
The fund had net unrealized foreign currency losses of $2,226,000 resulting from the translation of other assets and liabilities at October 31, 2008.
D. During the year ended October 31, 2008, the fund purchased $8,586,185,000 of investment securities and sold $11,402,293,000 of investment securities, other than temporary cash investments.
33
European Stock Index Fund
E. Capital share transactions for each class of shares were:
| | | Year Ended October 31, |
| | 2008 | | 2007 |
| Amount | Shares | Amount | Shares |
| ($000) | (000) | ($000) | (000) |
Investor Shares | | | | |
Issued | 4,845,905 | 141,072 | 5,660,208 | 147,210 |
Issued in Lieu of Cash Distributions | 735,566 | 18,702 | 454,609 | 12,663 |
Redeemed1 | (9,515,620) | (283,778) | (1,668,718) | (42,810) |
Net Increase (Decrease)—Investor Shares | (3,934,149) | (124,004) | 4,446,099 | 117,063 |
Admiral Shares | | | | |
Issued | 414,328 | 4,886 | 919,141 | 10,184 |
Issued in Lieu of Cash Distributions | 73,521 | 796 | 51,856 | 615 |
Redeemed1 | (475,808) | (6,157) | (808,257) | (8,547) |
Net Increase (Decrease)—Admiral Shares | 12,041 | (475) | 162,740 | 2,252 |
Signal Shares | | | | |
Issued | 155,336 | 4,630 | 477,278 | 12,591 |
Issued in Lieu of Cash Distributions | 11,877 | 332 | 341 | 10 |
Redeemed1 | (197,069) | (6,553) | (9,793) | (265) |
Net Increase (Decrease)—Signal Shares | (29,856) | (1,591) | 467,826 | 12,336 |
Institutional Shares | | | | |
Issued | 2,001,811 | 62,248 | 2,139,740 | 55,266 |
Issued in Lieu of Cash Distributions | 129,816 | 3,297 | 80,880 | 2,251 |
Redeemed1 | (1,315,989) | (36,071) | (1,028,378) | (26,180) |
Net Increase (Decrease)—Institutional Shares | 815,638 | 29,474 | 1,192,242 | 31,337 |
ETF Shares | | | | |
Issued | 454,883 | 7,234 | 1,456,669 | 20,084 |
Issued in Lieu of Cash Distributions | — | �� | — | — |
Redeemed1 | (229,309) | (3,400) | — | — |
Net Increase (Decrease)—ETF Shares | 225,574 | 3,834 | 1,456,669 | 20,084 |
F. In September 2006, the Financial Accounting Standards Board issued Statement of Financial Accounting Standards No. 157 (“FAS 157”), “Fair Value Measurements.” FAS 157 establishes a framework for measuring fair value and expands disclosures about fair value measurements in financial statements.
1 Net of redemption fees of $1,724,000 and $1,200,000 (fund totals).
34
European Stock Index Fund
The various inputs that may be used to determine the value of the fund’s investments are summarized in three broad levels. The inputs or methodologies used for valuing securities are not necessarily an indication of the risk associated with investing in those securities.
Level 1—Quoted prices in active markets for identical securities.
Level 2—Other significant observable inputs (including quoted prices for similar securities, interest rates, prepayment speeds, credit risk, etc.).
Level 3—Significant unobservable inputs (including the fund’s own assumptions used to determine the fair value of investments).
The following table summarizes the fund’s investments as of October 31, 2008, based on the inputs used to value them:
| | | Forward |
| Investments | Futures | Currency |
| in Securities | Contracts | Contracts |
Valuation Inputs | ($000) | ($000) | ($000) |
Level 1—Quoted prices | 606,865 | (14,447) | (10,078) |
Level 2—Other significant observable inputs | 17,138,747 | — | — |
Level 3—Significant unobservable inputs | — | — | — |
Total | 17,745,612 | (14,447) | (10,078) |
35
Pacific Stock Index Fund
Fund Profile
As of October 31, 2008
Portfolio Characteristics | | |
| | Target | Broad |
| Fund | Index1 | Index2 |
Number of Stocks | 510 | 507 | 1,898 |
Turnover Rate | 9% | — | — |
Expense Ratio | | | |
(10/31/2007)3 | | — | — |
Investor Shares | 0.22% | | |
Admiral Shares | 0.12% | | |
Signal Shares | 0.12% | | |
Institutional Shares | 0.09% | | |
ETF Shares | 0.12% | | |
Short-Term Reserves | –0.4%4 | — | — |
Sector Diversification (% of equity exposure) |
| | Target | Broad |
| Fund | Index1 | Index2 |
Consumer Discretionary | 14.9% | 14.9% | 9.0% |
Consumer Staples | 6.6 | 6.7 | 9.9 |
Energy | 2.1 | 2.1 | 12.0 |
Financials | 26.4 | 26.1 | 21.4 |
Health Care | 5.6 | 5.7 | 9.7 |
Industrials | 14.9 | 14.9 | 10.0 |
Information Technology | 9.2 | 9.2 | 9.1 |
Materials | 9.9 | 9.8 | 7.4 |
Telecommunication | | | |
Services | 3.9 | 4.0 | 6.0 |
Utilities | 6.5 | 6.6 | 5.5 |
Volatility Measures5 | |
| Fund Versus | Fund Versus |
| Target Index1 | Broad Index2 |
R-Squared | 0.96 | 0.88 |
Beta | 0.94 | 0.78 |
Ten Largest Holdings6 (% of total net assets) |
| | |
Toyota Motor Corp. | automobile | |
| manufacturers | 4.1% |
Mitsubishi UFJ | diversified | |
Financial Group | banks | 2.5 |
BHP Billiton Ltd. | diversified metals | |
| and mining | 2.5 |
Takeda | | |
Pharmaceutical Co. Ltd. | pharmaceuticals | 1.6 |
Honda Motor Co., Ltd. | automobile | |
| manufacturers | 1.6 |
Canon, Inc. | office electronics | 1.4 |
Commonwealth Bank | diversified | |
of Australia | banks | 1.4 |
Tokyo Electric Power Co. | electric | 1.3 |
Nintendo Co. | home entertainment | |
| software | 1.2 |
Matsushita Electric | consumer | |
Industrial Co., Ltd. | electronics | 1.1 |
Top Ten | | 18.7% |
Market Diversification (% of equity exposure) |
| | Target |
| Fund | Index1 |
Japan | 72.4% | 72.2% |
Australia | 18.1 | 18.1 |
Hong Kong | 6.1 | 6.2 |
Singapore | 3.1 | 3.2 |
Other Pacific Countries | 0.3 | 0.3 |
1 MSCI Pacific Index.
2 MSCI All Country World Index ex USA.
3 The expense ratios shown are from the prospectus dated August 29, 2008. For the fiscal year ended October 31, 2008, the expense ratios were 0.22% for Investor Shares, 0.12% for Admiral Shares, 0.12% for Signal Shares, 0.09% for Institutional Shares, and 0.11% for ETF Shares.
4 The fund invested a portion of its cash reserves in equity markets through the use of index futures contracts. After the effect of the futures investments, the fund’s temporary cash position was negative.
5 For an explanation of R-squared, beta, and other terms used here, see the Glossary.
6 The holdings listed exclude any temporary cash investments and equity index products.
36
Pacific Stock Index Fund
Performance Summary
All of the returns in this report represent past performance, which is not a guarantee of future results that may be achieved by the fund. (Current performance may be lower or higher than the performance data cited. For performance data current to the most recent month-end, visit our website at www.vanguard.com/performance.) Note, too, that both investment returns and principal value can fluctuate widely, so an investor’s shares, when sold, could be worth more or less than their original cost. The returns shown do not reflect taxes that a shareholder would pay on fund distributions or on the sale of fund shares.
Cumulative Performance: October 31, 1998–October 31, 2008
Initial Investment of $10,000

| | Average Annual Total Returns | Final Value of |
| Periods Ended October 31, 2008 | a $10,000 |
| One Year | Five Years | Ten Years | Investment |
Pacific Stock Index Fund Investor Shares1 | –42.71% | 2.17% | 2.16% | $12,379 |
MSCI All Country World Index ex USA | –48.27 | 5.05 | 3.19 | 13,692 |
MSCI Pacific Index | –43.49 | 1.74 | 2.05 | 12,249 |
Average Japan/Pacific Region Fund2 | –46.22 | –0.73 | 1.62 | 11,739 |
| | | | Final Value of |
| | | Since | a $100,000 |
| One Year | Five Years | Inception3 | Investment |
Pacific Stock Index Fund Admiral Shares1 | –42.62% | 2.29% | 2.12% | $116,365 |
MSCI All Country World Index ex USA | –48.27 | 5.05 | 4.14 | 133,975 |
MSCI Pacific Index | –43.49 | 1.74 | 1.89 | 114,483 |
| | | Final Value of |
| | Since | a $10,000,000 |
| One Year | Inception3 | Investment |
Pacific Stock Index Fund Signal Shares1 | –42.61% | –29.86% | $6,067,631 |
MSCI All Country World Index ex USA | –48.27 | –33.15 | 5,670,641 |
MSCI Pacific Index | –43.49 | –31.06 | 5,921,269 |
1 Total returns do not reflect the 0.5% transaction fee on purchases through March 31, 2000; the 2% fee assessed on redemptions of shares purchased on or after June 27, 2003, and held for less than two months; or, for the Investor Shares, the account service fee that may be applicable to certain accounts with balances below $10,000.
2 Derived from data provided by Lipper Inc.
3 Performance for the fund and its comparative standards is calculated since the following inception dates: August 13, 2001, for the Admiral Shares and June 4, 2007, for the Signal Shares.
37
Pacific Stock Index Fund
| | | | Final Value of |
| | | Since | a $5,000,000 |
| One Year | Five Years | Inception1 | Investment |
Pacific Stock Index Fund Institutional Shares2 | –42.62% | 2.34% | –2.37% | $4,083,198 |
MSCI All Country World Index ex USA | –48.27 | 5.05 | –0.04 | 4,983,004 |
MSCI Pacific Index | –43.49 | 1.74 | –2.58 | 4,008,333 |
| | | Final Value of |
| | Since | a $10,000 |
| One Year | Inception1 | Investment |
Pacific Stock Index Fund ETF Shares Net Asset Value | –42.61% | –3.33% | $8,836 |
MSCI All Country World Index ex USA | –48.27 | –2.35 | 9,168 |
MSCI Pacific Index | –43.49 | –3.91 | 8,642 |
Cumulative Returns: ETF Shares, March 4, 2005–October 31, 2008 | | |
| | Since |
| One Year | Inception1 |
Pacific Stock Index Fund ETF Shares Market Price | –42.40% | –11.37% |
Pacific Stock Index Fund ETF Shares Net Asset Value | –42.61 | –11.64 |
MSCI Pacific Index | –43.49 | –13.58 |
1 Performance for the fund and its comparative standards is calculated since the following inception dates: May 15, 2000, for the Institutional Shares and March 4, 2005, for the ETF Shares.
2 Total returns do not reflect the 0.5% transaction fee on purchases through March 31, 2000, or the 2% fee assessed on redemptions of shares purchased on or after June 27, 2003, and held for less than two months.
38
Pacific Stock Index Fund
Fiscal-Year Total Returns (%): October 31, 1998–October 31, 2008

Average Annual Total Returns: Periods Ended September 30, 2008
This table presents average annual total returns through the latest calendar quarter—rather than through the end of the fiscal period. Securities and Exchange Commission rules require that we provide this information.
| Inception Date | One Year | Five Years | Ten Years |
Pacific Stock Index Fund | | | | |
Investor Shares1 | 6/18/1990 | –27.28% | 7.51% | 5.96% |
Admiral Shares1 | 8/13/2001 | –27.24 | 7.60 | 5.092 |
Signal Shares1 | 6/4/2007 | –27.25 | –20.102 | — |
Institutional Shares1 | 5/15/2000 | –27.21 | 7.67 | 0.002 |
ETF Shares | 3/4/2005 | | | |
Market Price | | –27.11 | 2.292 | — |
Net Asset Value | | –27.23 | 2.232 | — |
1 Total returns do not reflect the 0.5% transaction fee on purchases through March 31, 2000; the 2% fee assessed on redemptions of shares purchased on or after June 27, 2003, and held for less than two months; or, for the Investor Shares, the account service fee that may be applicable to certain accounts with balances below $10,000.
2 Returns since inception.
Note: See Financial Highlights tables for dividend and capital gains information.
39
Pacific Stock Index Fund
Financial Statements
Statement of Net Assets
As of October 31, 2008
The fund provides a complete list of its holdings four times in each fiscal year, at the quarter-ends. For the second and fourth fiscal quarters, the lists appear in the fund’s semiannual and annual reports to shareholders. For the first and third fiscal quarters, the fund files the lists with the Securities and Exchange Commission on Form N-Q. Shareholders can look up the fund’s Forms N-Q on the SEC’s website at www.sec.gov. Forms N-Q may also be reviewed and copied at the SEC’s Public Reference Room (see the back cover of this report for further information).
| | | Market |
| | | Value• |
| | Shares | ($000) |
Common Stocks (98.6%)1 | | |
Australia (17.8%) | | |
| BHP Billiton Ltd. | 11,162,872 | 214,452 |
| Commonwealth Bank | | |
| of Australia | 4,410,927 | 120,576 |
| National Australia | | |
| Bank Ltd. | 5,428,312 | 88,080 |
| Westpac Banking | | |
| Corp., Ltd. | 6,247,404 | 85,718 |
| Woolworths Ltd. | 4,048,458 | 75,470 |
| Australia & New Zealand | | |
| Bank Group Ltd. | 6,391,980 | 74,930 |
| Westfield Group | 5,833,414 | 64,428 |
| QBE Insurance Group Ltd. | 2,953,586 | 50,391 |
| Rio Tinto Ltd. | 950,429 | 49,168 |
| CSL Ltd. | 1,988,715 | 48,365 |
| Woodside Petroleum Ltd. | 1,602,649 | 45,283 |
| Telstra Corp. Ltd. | 14,485,690 | 39,873 |
| St. George Bank Ltd. | 1,866,177 | 34,915 |
| Wesfarmers Ltd. | 2,152,620 | 30,937 |
| Origin Energy Ltd. | 2,922,048 | 30,644 |
| Brambles Ltd. | 4,607,341 | 24,576 |
| Foster’s Group Ltd. | 6,391,148 | 24,432 |
| AMP Ltd. | 6,236,065 | 22,684 |
| Newcrest Mining Ltd. | 1,507,922 | 20,729 |
^ | Macquarie Group, Ltd. | 914,073 | 18,134 |
| Santos Ltd. | 1,980,538 | 17,932 |
| Suncorp-Metway Ltd. | 3,178,282 | 17,109 |
| Insurance Australia | | |
| Group Ltd. | 6,248,674 | 15,829 |
| Orica Ltd. | 1,179,578 | 15,333 |
| AGL Energy Ltd. | 1,475,591 | 13,857 |
| Transurban Group | 3,858,588 | 13,854 |
| Stockland | 4,879,110 | 13,120 |
| Australian Stock | | |
| Exchange Ltd. | 570,054 | 11,447 |
| Incitec Pivot Ltd. | 4,028,093 | 10,799 |
| Amcor Ltd. | 2,793,081 | 10,782 |
^ | Macquarie | | |
| Infrastructure Group | 7,980,147 | 10,460 |
| | | Market |
| | | Value• |
| | Shares | ($000) |
| Coca-Cola Amatil Ltd. | 1,836,061 | 9,911 |
| Sonic Healthcare Ltd. | 1,056,064 | 9,651 |
| Computershare Ltd. | 1,574,956 | 8,904 |
| AXA Asia Pacific | | |
| Holdings Ltd. | 2,822,087 | 8,325 |
* | Fortescue Metals | | |
| Group Ltd. | 4,208,223 | 8,323 |
^ | Leighton Holdings Ltd. | 496,793 | 8,261 |
| Toll Holdings Ltd. | 2,054,543 | 8,202 |
| Tabcorp Holdings Ltd. | 1,740,641 | 7,980 |
| Bendigo Bank Ltd. | 893,457 | 7,882 |
| CFS Gandel Retail Trust | 5,670,183 | 7,627 |
| BlueScope Steel Ltd. | 2,519,947 | 7,412 |
| GPT Group | 14,580,048 | 7,296 |
| Cochlear Ltd. | 185,731 | 7,047 |
| Wesfarmers, Ltd. Price | | |
| Protected Shares | 479,522 | 6,922 |
| Metcash Ltd. | 2,551,563 | 6,887 |
| Alumina Ltd. | 4,829,064 | 6,872 |
| Crown Ltd. | 1,494,157 | 6,687 |
| OneSteel Ltd. | 2,765,418 | 6,353 |
| Tatt’s Group, Ltd. | 3,776,286 | 6,324 |
| OZ Minerals Ltd. | 9,830,228 | 6,175 |
^ | Boral Ltd. | 1,931,184 | 5,812 |
^ | John Fairfax Holdings Ltd. | 4,516,974 | 5,791 |
| Lion Nathan Ltd. | 978,258 | 5,781 |
| Lend Lease Corp. | 1,197,105 | 5,539 |
| Macquarie | | |
| Goodman Group | 8,275,273 | 5,221 |
| Qantas Airways Ltd. | 3,103,479 | 5,041 |
| WorleyParsons Ltd. | 499,635 | 5,020 |
| Goodman Fielder Ltd. | 4,389,078 | 4,871 |
| Dexus Property Group | | |
| NPV | 9,722,627 | 4,845 |
| CSR Ltd. | 3,272,099 | 4,756 |
| Billabong International Ltd. | 555,225 | 4,439 |
| James Hardie Industries | | |
| NV | 1,435,643 | 4,083 |
| Macquarie Airports Group | 2,291,884 | 3,259 |
| Harvey Norman | | |
| Holdings Ltd. | 1,754,107 | 3,028 |
40
Pacific Stock Index Fund
| | | Market |
| | | Value• |
| | Shares | ($000) |
^ | Perpetual Trustees | | |
| Australia Ltd. | 124,537 | 2,900 |
| Caltex Australia Ltd. | 445,456 | 2,806 |
* | Paladin Resources Ltd. | 1,820,943 | 2,790 |
| Aristocrat Leisure Ltd. | 1,078,578 | 2,716 |
| Sims Group Ltd. | 272,679 | 2,615 |
| Asciano Group | 1,863,017 | 2,603 |
| Sims Group Ltd. ADR | 235,750 | 2,315 |
| Mirvac Group | 3,468,260 | 2,270 |
| Boart Longyear Group | 4,773,956 | 1,385 |
| Macquarie Office Trust | 6,807,999 | 1,310 |
^ | Babcock & Brown Ltd. | 880,995 | 770 |
| | | 1,559,314 |
Hong Kong (6.1%) | | �� |
| CLP Holdings Ltd. | 6,808,705 | 45,918 |
| Cheung Kong | | |
| Holdings Ltd. | 4,621,886 | 44,377 |
| Sun Hung Kai | | |
| Properties Ltd. | 4,691,324 | 41,101 |
| Hutchison Whampoa Ltd. | 7,090,095 | 38,314 |
| Hong Kong Exchanges | | |
| & Clearing Ltd. | 3,392,500 | 34,403 |
| Hang Seng Bank Ltd. | 2,543,666 | 31,739 |
| Hong Kong Electric | | |
| Holdings Ltd. | 4,614,050 | 24,869 |
| Hong Kong & China | | |
| Gas Co., Ltd. | 13,302,481 | 23,436 |
| Esprit Holdings Ltd. | 3,516,078 | 19,979 |
| Swire Pacific Ltd. | | |
| A Shares | 2,741,000 | 19,304 |
| Hang Lung | | |
| Properties Ltd. | 6,896,720 | 16,852 |
| Li & Fung Ltd. | 7,473,450 | 14,999 |
| Boc Hong Kong | | |
| Holdings Ltd. | 12,313,300 | 14,098 |
| Henderson Land | | |
| Development Co. Ltd. | 3,575,593 | 12,931 |
| Link REIT | 7,119,000 | 12,729 |
| MTR Corp. | 4,677,700 | 10,365 |
| Bank of East Asia Ltd. | 4,735,073 | 9,551 |
| Hang Lung | | |
| Development Co., Ltd. | 2,893,000 | 9,310 |
| Wharf Holdings Ltd. | 4,566,903 | 9,112 |
| New World | | |
| Development Co., Ltd. | 8,048,146 | 6,700 |
| Hopewell Holdings Ltd. | 2,080,800 | 6,469 |
| Shangri-La Asia Ltd. | 4,303,068 | 6,092 |
* | Hutchison | | |
| Telecommunications | | |
| International Ltd. | 5,572,673 | 6,020 |
^ | Cheung Kong | | |
| Infrastructure | | |
| Holdings Ltd. | 1,505,600 | 5,515 |
| Kerry Properties Ltd. | 2,126,013 | 5,341 |
| Sino Land Co. | 5,637,400 | 4,956 |
^ | Cathay Pacific Airways Ltd. | 3,938,500 | 4,806 |
41
| | | Market |
| | | Value• |
| | Shares | ($000) |
^,* | Mongolia Energy | | |
| Corp. Ltd. | 11,071,000 | 4,749 |
| PCCW Ltd. | 12,350,769 | 4,622 |
| Wheelock and Co. Ltd. | 3,057,000 | 4,580 |
| Yue Yuen Industrial | | |
| (Holdings) Ltd. | 2,206,900 | 4,414 |
* | CITIC International | | |
| Financial Holdings Ltd. | 6,705,000 | 4,239 |
| Kingboard Chemical | | |
| Holdings Ltd. | 1,824,500 | 3,642 |
| Hysan Development | | |
| Co., Ltd. | 1,898,811 | 2,977 |
| Pacific Basin Shipping Ltd. | 5,463,000 | 2,925 |
| NWS Holdings Ltd. | 2,697,000 | 2,815 |
| Wing Hang Bank Ltd. | 585,009 | 2,744 |
| Television Broadcasts Ltd. | 942,412 | 2,621 |
* | Foxconn International | | |
| Holdings Ltd. | 6,969,238 | 2,564 |
* | Genting International PLC | 9,557,000 | 2,357 |
| Chinese Estates Holdings | 3,032,000 | 2,330 |
^ | ASM Pacific | | |
| Technology Ltd. | 644,100 | 2,152 |
| Hong Kong Aircraft & | | |
| Engineering Co., Ltd. | 222,000 | 1,750 |
| Lifestyle International | | |
| Holdings, Ltd. | 2,267,000 | 1,513 |
| Orient Overseas | | |
| International Ltd. | 732,224 | 1,308 |
| Shun Tak Holdings Ltd. | 3,506,382 | 699 |
| C C Land Holdings Ltd. | 3,180,000 | 578 |
| Lee & Man Paper | | |
| Manufacturing Ltd. | 1,552,000 | 507 |
| | | 535,372 |
Japan (71.2%) | | |
| Toyota Motor Corp. | 9,174,865 | 358,287 |
| Mitsubishi UFJ | | |
| Financial Group | 34,321,182 | 215,680 |
| Takeda Pharmaceutical | | |
| Co. Ltd. | 2,767,847 | 137,521 |
| Honda Motor Co., Ltd. | 5,492,672 | 136,577 |
| Canon, Inc. | 3,548,649 | 124,173 |
| Tokyo Electric Power Co. | 4,049,910 | 114,696 |
| Nintendo Co. | 329,820 | 105,974 |
| Matsushita Electric | | |
| Industrial Co., Ltd. | 6,119,563 | 98,548 |
| Sumitomo Mitsui | | |
| Financial Group, Inc. | 22,309 | 89,434 |
| NTT DoCoMo, Inc. | 52,236 | 82,844 |
| East Japan Railway Co. | 11,309 | 80,475 |
| Seven and I Holdings | | |
| Co., Ltd. | 2,863,140 | 80,391 |
| Sony Corp. | 3,340,964 | 79,182 |
| Mizuho Financial | | |
| Group, Inc. | 32,220 | 78,675 |
| Mitsubishi Corp. | 4,510,000 | 75,596 |
Pacific Stock Index Fund
| | Market |
| | Value• |
| Shares | ($000) |
Shin-Etsu Chemical | | |
Co., Ltd. | 1,365,400 | 72,578 |
Nippon Telegraph and | | |
Telephone Corp. | 17,278 | 70,507 |
Millea Holdings, Inc. | 2,274,600 | 70,162 |
Mitsubishi Estate | | |
Co., Ltd. | 3,909,000 | 69,828 |
Astellas Pharma Inc. | 1,639,898 | 66,053 |
Kansai Electric Power | | |
Co., Inc. | 2,561,700 | 64,235 |
KDDI Corp. | 9,696 | 58,094 |
Chubu Electric Power Co. | 2,202,400 | 57,670 |
Nippon Steel Corp. | 16,981,343 | 57,158 |
Nomura Holdings Inc. | 5,885,100 | 55,757 |
Mitsui & Co., Ltd. | 5,753,600 | 55,750 |
Japan Tobacco, Inc. | 14,968 | 53,102 |
Hitachi Ltd. | 11,203,000 | 52,599 |
Kao Corp. | 1,736,661 | 50,783 |
Mitsui Fudosan Co., Ltd. | 2,785,557 | 48,589 |
Daiichi Sankyo Co., Ltd. | 2,322,536 | 47,623 |
JFE Holdings, Inc. | 1,737,200 | 44,325 |
Central Japan Railway Co. | 5,215 | 42,839 |
Fanuc Co., Ltd. | 637,300 | 42,462 |
Mitsubishi Electric Corp. | 6,428,000 | 39,849 |
Fuji Photo Film Co., Ltd. | 1,626,166 | 37,435 |
Nissan Motor Co., Ltd. | 7,518,320 | 37,339 |
Toshiba Corp. | 10,229,000 | 36,972 |
Bridgestone Corp. | 2,028,359 | 35,462 |
Mitsui Sumitomo | | |
Insurance Group | | |
Holdings, Inc. | 1,261,265 | 35,049 |
Mitsubishi Heavy | | |
Industries Ltd. | 10,660,000 | 34,180 |
Tokyo Gas Co., Ltd. | 7,751,000 | 33,329 |
Sumitomo Corp. | 3,743,756 | 32,938 |
Sumitomo Metal | | |
Industries Ltd. | 12,788,000 | 32,890 |
Komatsu Ltd. | 2,989,768 | 32,868 |
Tohoku Electric Power Co. | 1,421,800 | 31,936 |
Kyocera Corp. | 540,900 | 31,772 |
Denso Corp. | 1,617,300 | 31,522 |
Orix Corp. | 306,656 | 31,507 |
Kirin Brewery Co., Ltd. | 2,620,048 | 28,978 |
Kyushu Electric | | |
Power Co., Inc. | 1,261,800 | 28,927 |
Eisai Co., Ltd. | 838,500 | 27,205 |
Secom Co., Ltd. | 698,300 | 26,635 |
Itochu Corp. | 5,008,000 | 26,466 |
Hoya Corp. | 1,374,594 | 25,100 |
Daiwa Securities | | |
Group Inc. | 4,438,850 | 25,095 |
T & D Holdings, Inc. | 655,460 | 25,039 |
West Japan Railway Co. | 5,654 | 24,881 |
Softbank Corp. | 2,508,518 | 24,702 |
Murata | | |
Manufacturing Co., Ltd. | 711,755 | 24,530 |
| | | Market |
| | | Value• |
| | Shares | ($000) |
| Fujitsu Ltd. | 6,197,000 | 24,365 |
| Keyence Corp. | 125,319 | 24,015 |
| Ricoh Co. | 2,230,386 | 24,003 |
| Sharp Corp. | 3,325,000 | 23,731 |
| Dai-Nippon | | |
| Printing Co., Ltd. | 1,980,741 | 23,403 |
| Terumo Corp. | 561,159 | 23,387 |
| Osaka Gas Co., Ltd. | 6,461,000 | 22,854 |
| Shiseido Co., Ltd. | 1,090,524 | 22,438 |
| Chugoku Electric | | |
| Power Co., Ltd. | 925,690 | 22,405 |
| Sumitomo Trust & | | |
| Banking Co., Ltd. | 4,736,388 | 21,935 |
| Marubeni Corp. | 5,492,000 | 21,337 |
| Asahi Breweries Ltd. | 1,286,800 | 21,240 |
| Asahi Glass Co., Ltd. | 3,355,200 | 21,083 |
^ | Kintetsu Corp. | 5,407,150 | 20,697 |
| Sumitomo Realty & | | |
| Development Co. | 1,266,572 | 20,636 |
^ | Toray Industries, Inc. | 4,428,740 | 20,564 |
| Aeon Co., Ltd. | 2,129,900 | 20,424 |
| Sumitomo Electric | | |
| Industries Ltd. | 2,494,700 | 20,198 |
| Bank of Yokohama Ltd. | 4,104,000 | 19,906 |
| Mitsui OSK Lines Ltd. | 3,812,000 | 19,906 |
| Daikin Industries Ltd. | 877,489 | 19,737 |
| Sompo Japan | | |
| Insurance Inc. | 2,793,000 | 19,577 |
| Nidec Corp. | 361,800 | 19,459 |
| Ajinomoto Co., Inc. | 2,212,000 | 19,099 |
| Tokyo Electron Ltd. | 570,730 | 19,030 |
| NEC Corp. | 6,413,812 | 19,015 |
| Hankyu Corp. | 4,017,958 | 18,954 |
| Kubota Corp. | 3,636,000 | 18,250 |
| SMC Corp. | 191,277 | 18,057 |
| Nippon Oil Corp. | 4,384,479 | 17,997 |
^ | Resona Holdings Inc. | 17,066 | 17,896 |
| Nippon Yusen Kabushiki | | |
| Kaisha Co. | 3,683,000 | 17,810 |
| Shikoku Electric Power | 606,388 | 17,794 |
| Shizuoka Bank Ltd. | 2,009,000 | 17,743 |
| Suzuki Motor Corp. | 1,174,457 | 17,234 |
| Mitsubishi Chemical | | |
| Holdings Corp. | 4,259,000 | 17,218 |
| Fast Retailing Co., Ltd. | 158,900 | 16,940 |
| Shionogi & Co., Ltd. | 993,362 | 16,907 |
^ | Yahoo Japan Corp. | 50,312 | 16,648 |
^,* | Mitsubishi Motors Corp. | 11,977,620 | 16,559 |
| Office Building Fund of | | |
| Japan Inc. | 1,715 | 16,479 |
| Rohm Co., Ltd. | 336,200 | 16,200 |
| Sumitomo Chemical Co. | 5,233,000 | 16,010 |
| Inpex Holdings, Inc. | 2,750 | 15,965 |
| Nikon Corp. | 1,128,718 | 15,907 |
| Yamada Denki Co., Ltd. | 288,676 | 15,713 |
42
Pacific Stock Index Fund
| | | Market |
| | | Value• |
| | Shares | ($000) |
| Hokuriku Electric | | |
| Power Co. | 586,432 | 15,454 |
| Odakyu Electric | | |
| Railway Co. | 2,085,000 | 15,288 |
| Daiwa House | | |
| Industry Co., Ltd. | 1,698,000 | 15,095 |
| Asahi Kasei Corp. | 3,968,000 | 14,925 |
| Tokyu Corp. | 3,785,000 | 14,870 |
^ | Olympus Corp. | 768,464 | 14,810 |
| Sekisui House Ltd. | 1,465,858 | 14,699 |
| Hokkaido Electric | | |
| Power Co., Ltd. | 644,761 | 14,458 |
| Ono Pharmaceutical | | |
| Co., Ltd. | 321,773 | 14,344 |
| Yamato Holdings Co., Ltd. | 1,295,000 | 14,306 |
| Kobe Steel Ltd. | 8,816,095 | 14,300 |
| NTT Data Corp. | 4,203 | 13,887 |
| TDK Corp. | 409,800 | 13,847 |
| Sumitomo Metal | | |
| Mining Co. | 1,840,000 | 13,799 |
| Tobu Railway Co., Ltd. | 2,716,000 | 13,799 |
| Toyoda Automatic | | |
| Loom Works Ltd. | 596,800 | 13,473 |
| Electric Power | | |
| Development Co., Ltd. | 443,640 | 13,208 |
| Nipponkoa Insurance | | |
| Co., Ltd. | 2,176,193 | 13,043 |
| Mitsui Trust Holding Inc. | 3,279,400 | 12,938 |
| Toppan Printing Co., Ltd. | 1,747,000 | 12,846 |
| Chiba Bank Ltd. | 2,536,000 | 12,535 |
| Japan Real Estate | | |
| Investment Corp. | 1,397 | 12,371 |
^ | Oriental Land Co., Ltd. | 174,300 | 12,360 |
| Nitto Denko Corp. | 550,100 | 12,183 |
| JS Group Corp. | 886,208 | 11,476 |
| Lawson Inc. | 232,300 | 11,354 |
| Daito Trust | | |
| Construction Co., Ltd. | 268,384 | 11,322 |
| Aisin Seiki Co., Ltd. | 638,238 | 11,294 |
^ | Keihin Electric Express | | |
| Railway Co., Ltd. | 1,427,000 | 11,014 |
| Joyo Bank Ltd. | 2,330,000 | 10,961 |
| Matsushita Electric | | |
| Works, Ltd. | 1,252,000 | 10,927 |
| OJI Paper Co., Ltd. | 2,836,740 | 10,831 |
^ | Rakuten, Inc. | 21,793 | 10,804 |
| Bank of Kyoto Ltd. | 1,025,000 | 10,782 |
| Nippon Express Co., Ltd. | 2,655,000 | 10,716 |
^ | Dentsu Inc. | 6,488 | 10,646 |
| Chugai Pharmaceutical | | |
| Co., Ltd. | 745,900 | 10,608 |
| Konica Minolta | | |
| Holdings, Inc. | 1,595,000 | 10,475 |
| Benesse Corp. | 248,157 | 10,423 |
* | Isetan Mitsukoshi | | |
| Holdings Ltd. | 1,098,480 | 10,347 |
| | | Market |
| | | Value• |
| | Shares | ($000) |
| Keio Electric | | |
| Railway Co., Ltd. | 1,929,000 | 9,989 |
| Ohbayashi Corp. | 2,035,000 | 9,957 |
| Uni-Charm Corp. | 138,000 | 9,898 |
| Omron Corp. | 677,500 | 9,673 |
| Shimizu Corp. | 1,962,000 | 9,627 |
| Sony Financial | | |
| Holdings, Inc. | 2,887 | 9,389 |
| Hisamitsu | | |
| Pharmaceutical Co. Inc. | 222,145 | 9,259 |
| Hirose Electric Co., Ltd. | 106,300 | 9,205 |
| Toho Gas Co., Ltd. | 1,579,297 | 9,116 |
| Kawasaki Heavy | | |
| Industries Ltd. | 4,984,000 | 9,030 |
| Nippon Mining | | |
| Holdings Inc. | 2,942,000 | 9,006 |
| Kuraray Co., Ltd. | 1,143,000 | 8,747 |
| NGK Insulators Ltd. | 839,534 | 8,720 |
| The Iyo Bank, Ltd. | 806,331 | 8,699 |
| Mitsubishi | | |
| Materials Corp. | 3,840,000 | 8,671 |
| Kurita Water | | |
| Industries Ltd. | 376,200 | 8,583 |
| Trend Micro Inc. | 348,500 | 8,525 |
| Fukuoka Financial | | |
| Group, Inc. | 2,567,600 | 8,492 |
* | Sanyo Electric Co., Ltd. | 5,589,000 | 8,483 |
| Ibiden Co., Ltd. | 450,139 | 8,421 |
| Sekisui Chemical Co. | 1,432,000 | 8,367 |
| Nippon Meat Packers, Inc. | 607,000 | 8,326 |
| Nitori Co., Ltd. | 132,568 | 8,306 |
| Japan Steel Works Ltd. | 1,170,832 | 8,294 |
^ | All Nippon Airways | | |
| Co., Ltd. | 2,147,000 | 8,199 |
| Kajima Corp. | 2,806,000 | 8,116 |
^ | Yakult Honsha Co., Ltd. | 320,900 | 7,997 |
| Kawasaki Kisen | | |
| Kaisha Ltd. | 2,013,000 | 7,975 |
^ | Nippon Paper Group, Inc. | 2,980 | 7,964 |
| TonenGeneral Sekiyu K.K. | 938,000 | 7,934 |
| Sankyo Co., Ltd. | 178,100 | 7,924 |
| Shinsei Bank, Ltd. | 5,125,046 | 7,861 |
| Nissin Food | | |
| Products Co., Ltd. | 274,800 | 7,855 |
| Tanabe Seiyaku Co., Ltd. | 746,000 | 7,851 |
| JGC Corp. | 730,000 | 7,826 |
| Hokuhoku Financial | | |
| Group, Inc. | 3,923,400 | 7,764 |
| FamilyMart Co., Ltd. | 195,200 | 7,734 |
| Taisho Pharmaceutical Co. | 428,000 | 7,709 |
| Teijin Ltd. | 2,940,000 | 7,646 |
| Toyo Suisan Kaisha, Ltd. | 296,000 | 7,632 |
| Takashimaya Co. | 987,972 | 7,614 |
| J. Front Retailing Co., Ltd. | 1,690,400 | 7,538 |
| The Chugoku Bank, Ltd. | 542,439 | 7,462 |
| Isuzu Motors Ltd. | 4,245,728 | 7,459 |
43
Pacific Stock Index Fund
| | | Market |
| | | Value• |
| | Shares | ($000) |
| Makita Corp. | 406,000 | 7,362 |
| Yamaha Motor Co., Ltd. | 665,000 | 7,352 |
| Taisei Corp. | 3,190,000 | 7,352 |
| Mitsui Chemicals, Inc. | 2,102,000 | 7,339 |
| Kyowa Hakko Kogyo Co. | 861,589 | 7,180 |
| Toho Co., Ltd. | 376,100 | 7,170 |
^ | Advantest Corp. | 496,436 | 7,133 |
| Ube Industries Ltd. | 3,367,000 | 7,084 |
| The Suruga Bank, Ltd. | 747,000 | 7,032 |
| Namco Bandai | | |
| Holdings Inc. | 682,100 | 7,014 |
| The Hachijuni Bank Ltd. | 1,427,550 | 7,005 |
| Nippon Electric | | |
| Glass Co., Ltd. | 1,155,097 | 6,948 |
| Kamigumi Co., Ltd. | 864,000 | 6,874 |
| Fuji Heavy Industries Ltd. | 1,947,189 | 6,850 |
| Toyota Tsusho Corp. | 709,704 | 6,849 |
| Sojitz Holdings Corp. | 4,088,900 | 6,833 |
^,* | Japan Airlines | | |
| System Co. | 2,991,000 | 6,806 |
| Mazda Motor Corp. | 3,056,422 | 6,779 |
| Yamaguchi Financial | | |
| Group, Inc. | 704,473 | 6,738 |
| Gunma Bank Ltd. | 1,314,000 | 6,709 |
| JSR Corp. | 594,100 | 6,701 |
| SBI Holdings, Inc. | 55,575 | 6,669 |
| Toyo Seikan Kaisha Ltd. | 538,800 | 6,647 |
| Nippon Sheet Glass | | |
| Co., Ltd. | 1,999,000 | 6,538 |
| Shimano, Inc. | 222,900 | 6,376 |
| Furukawa Electric Co. | 2,109,000 | 6,371 |
| Seiko Epson Corp. | 423,300 | 6,357 |
| Nisshin Seifun Group Inc. | 584,600 | 6,338 |
| Santen Pharmaceutical | | |
| Co., Ltd. | 246,300 | 6,299 |
| Stanley Electric Co. | 499,100 | 6,275 |
| Aioi Insurance Co., Ltd. | 1,504,000 | 6,176 |
| The Hiroshima Bank, Ltd. | 1,657,650 | 6,160 |
| Nomura Research | | |
| Institute, Ltd. | 372,580 | 6,152 |
| Acom Co., Ltd. | 159,290 | 6,085 |
| Toto Ltd. | 867,000 | 6,050 |
| Konami Corp. | 333,149 | 6,027 |
| Showa Denko K.K. | 3,933,000 | 5,974 |
| NSK Ltd. | 1,463,000 | 5,971 |
| Citizen Watch Co., Ltd. | 1,072,200 | 5,933 |
| Nippon Sanso Corp. | 942,000 | 5,924 |
| Mizuho Trust & | | |
| Banking Co., Ltd. | 5,028,950 | 5,910 |
| Credit Saison Co., Ltd. | 541,852 | 5,750 |
| Shimadzu Corp. | 833,787 | 5,705 |
| Sumitomo Heavy | | |
| Industries Ltd. | 1,909,000 | 5,667 |
| Yamaha Corp. | 582,200 | 5,642 |
| Amada Co., Ltd. | 1,211,000 | 5,561 |
| THK Co., Inc. | 401,700 | 5,501 |
| | | Market |
| | | Value• |
| | Shares | ($000) |
^ | Oracle Corp. Japan | 126,500 | 5,499 |
| Jupiter | | |
| Telecommunications | | |
| Co., Ltd. | 8,045 | 5,432 |
| 77 Bank Ltd. | 1,151,000 | 5,423 |
| NGK Spark Plug Co. | 574,682 | 5,417 |
| IHI Corp. | 4,404,000 | 5,343 |
| Brother Industries Ltd. | 782,362 | 5,337 |
| Yamazaki Baking Co., Ltd. | 401,000 | 5,328 |
| Kikkoman Corp. | 527,000 | 5,314 |
| Ushio Inc. | 393,300 | 5,313 |
| Square Enix Co., Ltd. | 210,000 | 5,291 |
| Mediceo Paltac | | |
| Holdings Co., Ltd. | 487,361 | 5,281 |
| NTN Corp. | 1,412,000 | 5,262 |
| AEON Mall Co., Ltd. | 210,300 | 5,191 |
| The Nishi-Nippon | | |
| City Bank, Ltd. | 2,375,307 | 5,175 |
| Nomura Real Estate | | |
| Office Fund, Inc. | 910 | 5,174 |
| Marui Co., Ltd. | 845,400 | 5,168 |
| Showa Shell Sekiyu K.K. | 628,400 | 5,134 |
| Casio Computer Co. | 786,500 | 5,052 |
| Shimamura Co., Ltd. | 72,900 | 5,050 |
| Sumitomo Rubber | | |
| Industries Ltd. | 569,600 | 5,025 |
| Susuken Co., Ltd. | 233,720 | 4,994 |
| USS Co., Ltd. | 81,210 | 4,974 |
| JTEKT Corp. | 641,123 | 4,919 |
| Mitsubishi Gas | | |
| Chemical Co. | 1,291,000 | 4,750 |
| Daihatsu Motor Co., Ltd. | 637,507 | 4,720 |
^ | Sapporo Holdings Ltd. | 856,000 | 4,709 |
^ | Sumco Corp. | 430,116 | 4,658 |
| Uny Co., Ltd. | 594,000 | 4,629 |
| Mitsubishi UFJ Lease & | | |
| Finance Company Ltd. | 192,680 | 4,614 |
| Kaneka Corp. | 987,982 | 4,610 |
| Sega Sammy Holdings Inc. | 608,532 | 4,600 |
| Keisei Electric | | |
| Railway Co., Ltd. | 921,000 | 4,522 |
| Shinko Securities | | |
| Co., Ltd. | 1,753,000 | 4,347 |
| Sapporo Hokuyo | | |
| Holdings, Inc. | 1,001 | 4,317 |
| Alfresa Holdings Corp. | 99,000 | 4,306 |
| Idemitsu Kosan Co. Ltd. | 73,047 | 4,259 |
| Tokyu Land Corp. | 1,499,000 | 4,242 |
| Dai Nippon | | |
| Pharmaceutical Co., Ltd. | 531,000 | 4,195 |
| Japan Retail Fund | | |
| Investment Corp. | 1,158 | 4,182 |
^ | Hitachi Construction | | |
| Machinery Co. | 356,778 | 4,142 |
| Hitachi Metals Ltd. | 546,320 | 4,108 |
| Kansai Paint Co., Ltd. | 722,000 | 4,030 |
44
Pacific Stock Index Fund
| | | Market |
| | | Value• |
| | Shares | ($000) |
| Meiji Dairies Corp. | 882,000 | 4,023 |
| NTT Urban | | |
| Development Corp. | 3,853 | 3,953 |
| Mabuchi Motor Co. | 99,800 | 3,948 |
| Nissan Chemical | | |
| Industries, Ltd. | 485,000 | 3,922 |
| Cosmo Oil Co., Ltd. | 1,839,000 | 3,912 |
| Haseko Corp. | 4,313,655 | 3,904 |
^ | Mitsubishi Rayon Co., Ltd. | 1,803,000 | 3,871 |
| Canon Sales Co. Inc. | 225,300 | 3,769 |
| Hitachi High- | | |
| Technologies Corp. | 230,575 | 3,740 |
| Tokuyama Corp. | 737,000 | 3,732 |
| Coca-Cola West | | |
| Japan Co., Ltd. | 185,700 | 3,724 |
| Tokyo Tatemono Co., Ltd. | 902,000 | 3,716 |
| Kinden Corp. | 441,000 | 3,682 |
| Japan Petroleum | | |
| Exploration Co., Ltd. | 95,485 | 3,637 |
| Mitsumi Electric Co., Ltd. | 276,500 | 3,637 |
^ | Promise Co., Ltd. | 201,950 | 3,625 |
| Denki Kagaku Kogyo K.K. | 1,610,000 | 3,567 |
| Hitachi Chemical Co., Ltd. | 348,400 | 3,560 |
| NOK Corp. | 373,700 | 3,558 |
| Hakuhodo DY Holdings Inc. | 77,830 | 3,544 |
| Yaskawa Electric Corp. | 803,380 | 3,526 |
| Yokogawa Electric Corp. | 755,197 | 3,497 |
| Taiheiyo Cement Corp. | 3,000,000 | 3,492 |
| Mitsui Mining & | | |
| Smelting Co., Ltd. | 1,906,000 | 3,486 |
| Mitsubishi Logistics Corp. | 380,000 | 3,457 |
^ | Nomura Real Estate | | |
| Holdings Inc. | 173,200 | 3,393 |
^ | Ito En, Ltd. | 212,400 | 3,383 |
| Tosoh Corp. | 1,691,000 | 3,372 |
| Nisshin Steel Co. | 2,498,000 | 3,345 |
| Asics Corp. | 530,139 | 3,322 |
| Japan Prime Realty | | |
| Investment Corp. | 1,859 | 3,303 |
^ | Mitsui Engineering & | | |
| Shipbuilding Co., Ltd. | 2,350,000 | 3,288 |
| Daicel Chemical | | |
| Industries Ltd. | 910,000 | 3,281 |
| Minebea Co., Ltd. | 1,193,000 | 3,220 |
| Dai-Nippon Ink & | | |
| Chemicals, Inc. | 1,987,000 | 3,212 |
| Daido Steel Co., Ltd. | 1,006,000 | 3,189 |
| Leopalace21 Corp. | 425,300 | 3,166 |
| Alps Electric Co., Ltd. | 573,900 | 3,157 |
| Onward Kashiyama | | |
| Co., Ltd. | 430,000 | 3,145 |
| Yamato Kogyo Co., Ltd. | 131,900 | 3,117 |
| Toyoda Gosei Co., Ltd. | 217,900 | 3,059 |
| JAFCO Co., Ltd. | 112,000 | 3,015 |
^ | Takefuji Corp. | 367,260 | 2,953 |
| Maruichi Steel Tube Ltd. | 124,800 | 2,839 |
| | | Market |
| | | Value• |
| | Shares | ($000) |
| Obic Co., Ltd. | 23,110 | 2,829 |
| Tokyo Steel | | |
| Manufacturing Co. | 359,800 | 2,779 |
| Aeon Credit Service | | |
| Co. Ltd. | 260,790 | 2,778 |
| Dowa Mining Co., Ltd. | 908,000 | 2,737 |
| Fuji Electric Holdings | | |
| Co., Ltd. | 1,872,000 | 2,731 |
| Otsuka Corp. | 52,464 | 2,639 |
| Nisshinbo Industries, Inc. | 447,000 | 2,598 |
^ | Itochu | | |
| Techno-Science Corp. | 100,100 | 2,346 |
| Tokyo Broadcasting | | |
| System, Inc. | 127,900 | 2,266 |
^,* | DeNA Co., Ltd. | 963 | 2,155 |
| NHK Spring Co. | 527,000 | 2,124 |
| Okuma Corp. | 476,711 | 2,096 |
| Hino Motors, Ltd. | 869,000 | 2,008 |
| CSK Corp. | 237,400 | 1,984 |
| Toyota Boshoku Corp. | 217,900 | 1,944 |
^,* | Elpida Memory Inc. | 363,600 | 1,938 |
| Fuji Television | | |
| Network, Inc. | 1,580 | 1,892 |
| Aozora Bank, Ltd. | 2,165,000 | 1,808 |
| Tokai Rika Co., Ltd. | 172,724 | 1,747 |
^ | Osaka Titanium | | |
| Technologies Co. | 61,726 | 1,610 |
^ | Pioneer Corp. | 517,400 | 1,535 |
| Shinko Electric | | |
| Industries Co., Ltd. | 224,753 | 1,449 |
| Hikari Tsushin, Inc. | 87,700 | 1,309 |
^,* | NEC Electronics Corp. | 123,200 | 1,241 |
^ | Toho Titanium Co., Ltd. | 103,142 | 1,206 |
^ | Aiful Corp. | 252,400 | 1,170 |
* | Dowa Mining Co., Ltd. | | |
| Rights Exp. 1/29/10 | 425,000 | 62 |
| | | 6,230,585 |
New Zealand (0.3%) | | |
| Telecom Corp. of | | |
| New Zealand Ltd. | 6,067,847 | 8,225 |
| Fletcher Building Ltd. | 1,669,131 | 5,668 |
| Contact Energy Ltd. | 963,459 | 4,085 |
| Auckland International | | |
| Airport Ltd. | 3,257,122 | 3,486 |
| Sky City Entertainment | | |
| Group Ltd. | 1,599,910 | 3,088 |
| | | 24,552 |
Singapore (3.2%) | | |
| Singapore | | |
| Telecommunications | | |
| Ltd. | 26,478,290 | 44,561 |
| United Overseas Bank | | |
| Ltd. | 4,054,567 | 36,656 |
| DBS Group Holdings Ltd. | 3,792,161 | 28,947 |
| Oversea-Chinese Banking | | |
| Corp., Ltd. | 8,319,068 | 28,126 |
45
Pacific Stock Index Fund
| | | Market |
| | | Value• |
| | Shares | ($000) |
| Singapore Airlines Ltd. | 1,778,010 | 13,622 |
| Keppel Corp., Ltd. | 4,239,500 | 13,217 |
| Capitaland Ltd. | 5,644,895 | 11,313 |
| Singapore Press | | |
| Holdings Ltd. | 5,041,833 | 11,014 |
| Singapore Exchange Ltd. | 2,846,318 | 10,188 |
| City Developments Ltd. | 1,659,412 | 7,338 |
| Singapore Technologies | | |
| Engineering Ltd. | 4,471,407 | 7,060 |
| Fraser & Neave Ltd. | 3,224,500 | 6,084 |
| Sembcorp Industries Ltd. | 3,257,393 | 5,475 |
| ComfortDelGro Corp. Ltd. | 6,275,586 | 5,148 |
| CapitaMall Trust | 3,879,148 | 5,144 |
| Wilmar International Ltd. | 2,768,000 | 4,787 |
| Noble Group Ltd. | 5,244,600 | 3,818 |
| Ascendas REIT | 3,310,000 | 3,683 |
| Olam International Ltd. | 3,981,100 | 3,504 |
| SembCorp Marine Ltd. | 2,730,800 | 3,394 |
| Parkway Holdings Ltd. | 2,986,705 | 3,202 |
| Jardine Cycle N | | |
| Carriage Ltd. | 468,128 | 3,003 |
| Venture Corp. Ltd. | 730,250 | 2,669 |
| United Overseas | | |
| Land Ltd. | 1,731,556 | 2,267 |
| Capitacommercial Trust | 3,238,365 | 2,225 |
| Golden | | |
| Agri-Resources Ltd. | 16,432,000 | 2,193 |
| Cosco Corp. | | |
| Singapore Ltd. | 2,951,000 | 1,615 |
| Keppel Land Ltd. | 1,194,000 | 1,535 |
| Neptune Orient Lines Ltd. | 1,712,000 | 1,446 |
| Yanlord Land Group Ltd. | 1,483,000 | 761 |
| | | 273,995 |
Total Common Stocks | | |
(Cost $12,257,290) | | 8,623,818 |
Temporary Cash Investments (3.0%)1 | | |
Money Market Fund (2.7%) | | |
2,3 | Vanguard Market | | |
| Liquidity Fund, | | |
| 1.701% | 233,905,019 | 233,905 |
| | Face | Market |
| | Amount | Value• |
| | ($000) | ($000) |
U.S. Agency Obligations (0.3%) | |
4,5 | Federal Home | | |
| Loan Bank, | | |
| 2.674%, 2/27/09 | 2,000 | 1,984 |
4,5 | Federal Home Loan | | |
| Mortgage Corp., | | |
| 1.912%, 2/27/09 | 2,500 | 2,481 |
4 | Federal National | | |
| Mortgage Assn., | | |
| 2.464%, 11/5/08 | 15,000 | 14,998 |
4,5 | Federal National | | |
| Mortgage Assn., | | |
| 2.585%, 11/17/08 | 10,000 | 9,993 |
| | | 29,456 |
Total Temporary Cash Investments | |
(Cost $263,357) | | 263,361 |
Total Investments (101.6%) | | |
(Cost $12,520,647) | | 8,887,179 |
Other Assets and Liabilites (–1.6%) | |
Other Assets | | 110,944 |
Liabilities3 | | (250,869) |
| | | (139,925) |
Net Assets (100%) | | 8,747,254 |
46
Pacific Stock Index Fund
At October 31, 2008, net assets consisted of: |
| Amount |
| ($000) |
Paid-in Capital | 12,919,869 |
Undistributed Net Investment Income | 100,521 |
Accumulated Net Realized Losses | (615,831) |
Unrealized Appreciation (Depreciation) | |
Investment Securities | (3,633,468) |
Futures Contracts | (25,432) |
Foreign Currencies and Forward | |
Currency Contracts | 1,595 |
Net Assets | 8,747,254 |
| |
Investor Shares—Net Assets | |
Applicable to 637,638,547 outstanding | |
$.001 par value shares of beneficial | |
interest (unlimited authorization) | 5,064,602 |
Net Asset Value Per Share— | |
Investor Shares | $7.94 |
| |
Admiral Shares—Net Assets | |
Applicable to 14,151,536 outstanding | |
$.001 par value shares of beneficial | |
interest (unlimited authorization) | 736,509 |
Net Asset Value Per Share— | |
Admiral Shares | $52.04 |
| |
Signal Shares—Net Assets | |
Applicable to 8,285,921 outstanding | |
$.001 par value shares of beneficial | |
interest (unlimited authorization) | 149,792 |
Net Asset Value Per Share— | |
Signal Shares | $18.08 |
| Amount |
| ($000) |
Institutional Shares—Net Assets | |
Applicable to 202,207,192 outstanding | |
$.001 par value shares of beneficial | |
interest (unlimited authorization) | 1,610,027 |
Net Asset Value Per Share— | |
Institutional Shares | $7.96 |
| |
ETF Shares���Net Assets | |
Applicable to 28,180,618 outstanding | |
$.001 par value shares of beneficial | |
interest (unlimited authorization) | 1,186,324 |
Net Asset Value Per Share— | |
ETF Shares | $42.10 |
• | See Note A in Notes to Financial Statements. |
^ | Part of security position is on loan to broker-dealers. The total value of securities on loan is $163,674,000. |
* | Non-income-producing security. |
1 The fund invests a portion of its cash reserves in equity markets through the use of index futures contracts. After giving effect to futures investments, the fund’s effective common stock and temporary cash investment positions represent 100.0% and 1.6%, respectively, of net assets.
2 Affiliated money market fund available only to Vanguard funds and certain trusts and accounts managed by Vanguard. Rate shown is the 7-day yield.
3 Includes $176,426,000 of collateral received for securities on loan.
4 The issuer operates under a congressional charter; its securities are neither issued nor guaranteed by the U.S. government.
5 Securities with a value of $14,458,000 have been segregated as initial margin for open futures contracts.
ADR—American Depositary Receipt.
REIT—Real Estate Investment Trust.
See accompanying Notes, which are an integral part of the Financial Statements.
47
Pacific Stock Index Fund
Statement of Operations
| Year Ended |
| October 31, 2008 |
| ($000) |
Investment Income | |
Income | |
Dividends1 | 361,276 |
Interest2 | 2,723 |
Security Lending | 6,738 |
Total Income | 370,737 |
Expenses | |
The Vanguard Group—Note B | |
Investment Advisory Services | 390 |
Management and Administrative—Investor Shares | 15,864 |
Management and Administrative—Admiral Shares | 839 |
Management and Administrative—Signal Shares | 182 |
Management and Administrative—Institutional Shares | 873 |
Management and Administrative—ETF Shares | 870 |
Marketing and Distribution—Investor Shares | 2,713 |
Marketing and Distribution—Admiral Shares | 231 |
Marketing and Distribution—Signal Shares | 42 |
Marketing and Distribution—Institutional Shares | 620 |
Marketing and Distribution—ETF Shares | 400 |
Custodian Fees | 2,854 |
Auditing Fees | 39 |
Shareholders’ Reports—Investor Shares | 162 |
Shareholders’ Reports—Admiral Shares | 8 |
Shareholders’ Reports—Signal Shares | 3 |
Shareholders’ Reports—Institutional Shares | 1 |
Shareholders’ Reports—ETF Shares | 60 |
Trustees’ Fees and Expenses | 19 |
Total Expenses | 26,170 |
Net Investment Income | 344,567 |
Realized Net Gain (Loss) | |
Investment Securities Sold | 625,715 |
Futures Contracts | (27,279) |
Foreign Currencies and Forward Currency Contracts | (1,132) |
Realized Net Gain (Loss) | 597,304 |
Change in Unrealized Appreciation (Depreciation) | |
Investment Securities | (7,978,294) |
Futures Contracts | (28,896) |
Foreign Currencies and Forward Currency Contracts | 811 |
Change in Unrealized Appreciation (Depreciation) | (8,006,379) |
Net Increase (Decrease) in Net Assets Resulting from Operations | (7,064,508) |
1 Dividends are net of foreign withholding taxes of $16,172,000.
2 Interest income from an affiliated company of the fund was $2,397,000.
See accompanying Notes, which are an integral part of the Financial Statements.
48
Pacific Stock Index Fund
Statement of Changes in Net Assets
| Year Ended October 31, |
| 2008 | 2007 |
| ($000) | ($000) |
Increase (Decrease) in Net Assets | | |
Operations | | |
Net Investment Income | 344,567 | 260,891 |
Realized Net Gain (Loss) | 597,304 | 30,327 |
Change in Unrealized Appreciation (Depreciation) | (8,006,379) | 2,252,375 |
Net Increase (Decrease) in Net Assets Resulting from Operations | (7,064,508) | 2,543,593 |
Distributions | | |
Net Investment Income | | |
Investor Shares | (247,822) | (176,611) |
Admiral Shares | (29,349) | (25,966) |
Signal Shares | (6,128) | — |
Institutional Shares | (59,339) | (42,679) |
ETF Shares | (34,784) | (18,129) |
Realized Capital Gain | | |
Investor Shares | — | — |
Admiral Shares | — | — |
Signal Shares | — | — |
Institutional Shares | — | — |
ETF Shares | — | — |
Total Distributions | (377,422) | (263,385) |
Capital Share Transactions | | |
Investor Shares | (1,532,226) | 1,937,377 |
Admiral Shares | 34,355 | (42,070) |
Signal Shares | 31,639 | 242,515 |
Institutional Shares | 93,372 | 573,669 |
ETF Shares | 519,132 | 628,365 |
Net Increase (Decrease) from Capital Share Transactions | (853,728) | 3,339,856 |
Total Increase (Decrease) | (8,295,658) | 5,620,064 |
Net Assets | | |
Beginning of Period | 17,042,912 | 11,422,848 |
End of Period1 | 8,747,254 | 17,042,912 |
1 Net Assets—End of Period includes undistributed net investment income of $100,521,000 and $131,063,000.
See accompanying Notes, which are an integral part of the Financial Statements.
49
Pacific Stock Index Fund
Financial Highlights
Investor Shares | | | | | |
| | | | | |
For a Share Outstanding | Year Ended October 31, |
Throughout Each Period | 2008 | 2007 | 2006 | 2005 | 2004 |
Net Asset Value, Beginning of Period | $14.19 | $12.13 | $10.39 | $8.63 | $7.80 |
Investment Operations | | | | | |
Net Investment Income | .281 | .236 | .190 | .156 | .121 |
Net Realized and Unrealized Gain (Loss) | | | | | |
on Investments | (6.228) | 2.091 | 1.710 | 1.761 | .814 |
Total from Investment Operations | (5.947) | 2.327 | 1.900 | 1.917 | .935 |
Distributions | | | | | |
Dividends from Net Investment Income | (.303) | (.267) | (.160) | (.157) | (.105) |
Distributions from Realized Capital Gains | — | — | — | — | — |
Total Distributions | (.303) | (.267) | (.160) | (.157) | (.105) |
Net Asset Value, End of Period | $7.94 | $14.19 | $12.13 | $10.39 | $8.63 |
| | | | | |
Total Return1 | –42.71% | 19.52% | 18.39% | 22.48% | 12.15% |
| | | | | |
Ratios/Supplemental Data | | | | | |
Net Assets, End of Period (Millions) | $5,065 | $11,281 | $7,814 | $5,202 | $3,471 |
Ratio of Total Expenses to | | | | | |
Average Net Assets | 0.22% | 0.22% | 0.27% | 0.32% | 0.34% |
Ratio of Net Investment Income to | | | | | |
Average Net Assets | 2.32% | 1.80% | 1.73% | 1.76% | 1.57% |
Portfolio Turnover Rate2 | 9% | 3% | 2% | 7% | 3% |
1 Total returns do not reflect the 2% fee assessed on redemptions of shares purchased on or after June 27, 2003, and held for less than two months, or the account service fee that may be applicable to certain accounts with balances below $10,000.
2 Excludes the value of portfolio securities received or delivered as a result of in-kind purchases or redemptions of the fund’s capital shares, including ETF Creation Units.
See accompanying Notes, which are an integral part of the Financial Statements.
50
Pacific Stock Index Fund
Financial Highlights
Admiral Shares | | | | | |
| | | | | |
For a Share Outstanding | Year Ended October 31, |
Throughout Each Period | 2008 | 2007 | 2006 | 2005 | 2004 |
Net Asset Value, Beginning of Period | $92.94 | $79.43 | $68.05 | $56.47 | $51.05 |
Investment Operations | | | | | |
Net Investment Income | 1.933 | 1.613 | 1.302 | 1.069 | .835 |
Net Realized and Unrealized Gain (Loss) | | | | | |
on Investments | (40.773) | 13.714 | 11.185 | 11.583 | 5.318 |
Total from Investment Operations | (38.840) | 15.327 | 12.487 | 12.652 | 6.153 |
Distributions | | | | | |
Dividends from Net Investment Income | (2.060) | (1.817) | (1.107) | (1.072) | (.733) |
Distributions from Realized Capital Gains | — | — | — | — | — |
Total Distributions | (2.060) | (1.817) | (1.107) | (1.072) | (.733) |
Net Asset Value, End of Period | $52.04 | $92.94 | $79.43 | $68.05 | $56.47 |
| | | | | |
Total Return1 | –42.62% | 19.64% | 18.46% | 22.68% | 12.23% |
| | | | | |
Ratios/Supplemental Data | | | | | |
Net Assets, End of Period (Millions) | $737 | $1,292 | $1,128 | $720 | $314 |
Ratio of Total Expenses to | | | | | |
Average Net Assets | 0.12% | 0.12% | 0.17% | 0.20% | 0.25% |
Ratio of Net Investment Income to | | | | | |
Average Net Assets | 2.42% | 1.90% | 1.83% | 1.90% | 1.69% |
Portfolio Turnover Rate2 | 9% | 3% | 2% | 7% | 3% |
1 Total returns do not reflect the 2% fee assessed on redemptions of shares purchased on or after June 27, 2003, and held for less than two months.
2 Excludes the value of portfolio securities received or delivered as a result of in-kind purchases or redemptions of the fund’s capital shares, including ETF Creation Units.
See accompanying Notes, which are an integral part of the Financial Statements.
51
Pacific Stock Index Fund
Financial Highlights
Signal Shares | | |
| Year | June 4, |
| Ended | 20071 to |
| Oct. 31, | Oct. 31, |
For a Share Outstanding Throughout Each Period | 2008 | 2007 |
Net Asset Value, Beginning of Period | $32.28 | $30.53 |
Investment Operations | | |
Net Investment Income | .667 | .250 |
Net Realized and Unrealized Gain (Loss) on Investments | (14.158) | 1.500 |
Total from Investment Operations | (13.491) | 1.750 |
Distributions | | |
Dividends from Net Investment Income | (.709) | — |
Distributions from Realized Capital Gains | — | — |
Total Distributions | (.709) | — |
Net Asset Value, End of Period | $18.08 | $32.28 |
| | |
Total Return2 | –42.61% | 5.73% |
| | |
Ratios/Supplemental Data | | |
Net Assets, End of Period (Millions) | $150 | $247 |
Ratio of Total Expenses to Average Net Assets | 0.12% | 0.12%3 |
Ratio of Net Investment Income to Average Net Assets | 2.42% | 1.90%3 |
Portfolio Turnover Rate4 | 9% | 3% |
1 Inception.
2 Total returns do not reflect the 2% fee assessed on redemptions of shares held for less than two months.
3 Annualized.
4 Excludes the value of portfolio securities received or delivered as a result of in-kind purchases or redemptions of the fund’s capital shares, including ETF Creation Units.
See accompanying Notes, which are an integral part of the Financial Statements.
52
Pacific Stock Index Fund
Financial Highlights
Institutional Shares | | | | | |
| | | | | |
For a Share Outstanding | Year Ended October 31, |
Throughout Each Period | 2008 | 2007 | 2006 | 2005 | 2004 |
Net Asset Value, Beginning of Period | $14.22 | $12.15 | $10.41 | $8.64 | $7.81 |
Investment Operations | | | | | |
Net Investment Income | .300 | .251 | .206 | .180 | .134 |
Net Realized and Unrealized Gain (Loss) | | | | | |
on Investments | (6.242) | 2.102 | 1.710 | 1.760 | .814 |
Total from Investment Operations | (5.942) | 2.353 | 1.916 | 1.940 | .948 |
Distributions | | | | | |
Dividends from Net Investment Income | (.318) | (.283) | (.176) | (.170) | (.118) |
Distributions from Realized Capital Gains | — | — | — | — | — |
Total Distributions | (.318) | (.283) | (.176) | (.170) | (.118) |
Net Asset Value, End of Period | $7.96 | $14.22 | $12.15 | $10.41 | $8.64 |
| | | | | |
Total Return1 | –42.62% | 19.72% | 18.52% | 22.74% | 12.32% |
| | | | | |
Ratios/Supplemental Data | | | | | |
Net Assets, End of Period (Millions) | $1,610 | $2,720 | $1,788 | $1,280 | $754 |
Ratio of Total Expenses to | | | | | |
Average Net Assets | 0.09% | 0.09% | 0.12% | 0.14% | 0.17% |
Ratio of Net Investment Income to | | | | | |
Average Net Assets | 2.45% | 1.93% | 1.88% | 1.95% | 1.76% |
Portfolio Turnover Rate2 | 9% | 3% | 2% | 7% | 3% |
1 Total returns do not reflect the 2% fee assessed on redemptions of shares purchased on or after June 27, 2003, and held for less than two months.
2 Excludes the value of portfolio securities received or delivered as a result of in-kind purchases or redemptions of the fund’s capital shares, including ETF Creation Units.
See accompanying Notes, which are an integral part of the Financial Statements.
53
Pacific Stock Index Fund
Financial Highlights
ETF Shares | | | | |
| | | | March 4, |
| | | | 20051 to |
| Year Ended October 31, | Oct. 31, |
For a Share Outstanding Throughout Each Period | 2008 | 2007 | 2006 | 2005 |
Net Asset Value, Beginning of Period | $75.17 | $64.24 | $55.09 | $50.71 |
Investment Operations | | | | |
Net Investment Income | 1.573 | 1.314 | 1.060 | .750 |
Net Realized and Unrealized Gain (Loss) on Investments | (32.974) | 11.089 | 9.020 | 3.630 |
Total from Investment Operations | (31.401) | 12.403 | 10.080 | 4.380 |
Distributions | | | | |
Dividends from Net Investment Income | (1.669) | (1.473) | (.930) | — |
Distributions from Realized Capital Gains | — | — | — | — |
Total Distributions | (1.669) | (1.473) | (.930) | — |
Net Asset Value, End of Period | $42.10 | $75.17 | $64.24 | $55.09 |
| | | | |
Total Return | –42.61% | 19.65% | 18.43% | 8.64% |
| | | | |
Ratios/Supplemental Data | | | | |
Net Assets, End of Period (Millions) | $1,186 | $1,503 | $693 | $164 |
Ratio of Total Expenses to Average Net Assets | 0.11% | 0.12% | 0.18% | 0.18%2 |
Ratio of Net Investment Income to Average Net Assets | 2.43% | 1.90% | 1.82% | 1.89%2 |
Portfolio Turnover Rate3 | 9% | 3% | 2% | 7% |
1 Inception.
2 Annualized.
3 Excludes the value of portfolio securities received or delivered as a result of in-kind purchases or redemptions of the fund’s capital shares, including ETF Creation Units.
See accompanying Notes, which are an integral part of the Financial Statements.
54
Pacific Stock Index Fund
Notes to Financial Statements
Vanguard Pacific Stock Index Fund is registered under the Investment Company Act of 1940 as an open-end investment company, or mutual fund. The fund invests in securities of foreign issuers, which may subject it to investment risks not normally associated with investing in securities of U.S. corporations. The fund offers five classes of shares: Investor Shares, Admiral Shares, Signal Shares, Institutional Shares, and ETF Shares. Investor Shares are available to any investor who meets the fund’s minimum purchase requirements. Admiral Shares are designed for investors who meet certain administrative, service, tenure, and account-size criteria. Signal Shares are designed for institutional investors who meet certain administrative, service, and account-size criteria. Institutional Shares are designed for investors who meet certain administrative and service criteria and invest a minimum of $5 million. ETF Shares are listed for trading on the NYSE Arca, Inc.; they can be purchased and sold through a broker.
A. The following significant accounting policies conform to generally accepted accounting principles for U.S. mutual funds. The fund consistently follows such policies in preparing its financial statements.
1. Security Valuation: Securities are valued as of the close of trading on the New York Stock Exchange (generally 4 p.m., Eastern time) on the valuation date. Equity securities are valued at the latest quoted sales prices or official closing prices taken from the primary market in which each security trades; such securities not traded on the valuation date are valued at the mean of the latest quoted bid and asked prices. Securities for which market quotations are not readily available, or whose values have been affected by events occurring before the fund’s pricing time but after the close of the securities’ primary markets, are valued at their fair values calculated according to procedures adopted by the board of trustees. These procedures include obtaining quotations from an independent pricing service, monitoring news to identify significant market- or security-specific events, and evaluating changes in the values of foreign market proxies (for example, ADRs, futures contracts, or exchange-traded funds), between the time the foreign markets close and the fund’s pricing time. When fair-value pricing is employed, the prices of securities used by a fund to calculate its net asset value may differ from quoted or published prices for the same securities. Investments in Vanguard Market Liquidity Fund are valued at that fund’s net asset value. Temporary cash investments acquired over 60 days to maturity are valued using the latest bid prices or using valuations based on a matrix system (which considers such factors as security prices, yields, maturities, and ratings), both as furnished by independent pricing services. Other temporary cash investments are valued at amortized cost, which approximates market value.
2. Foreign Currency: Securities and other assets and liabilities denominated in foreign currencies are translated into U.S. dollars using exchange rates obtained from an independent third party as of the fund’s pricing time on the valuation date. Realized gains (losses) and unrealized appreciation (depreciation) on investment securities include the effects of changes in exchange rates since the securities were purchased, combined with the effects of changes in security prices. Fluctuations in the value of other assets and liabilities resulting from changes in exchange rates are recorded as unrealized foreign currency gains (losses) until the assets or liabilities are settled in cash, at which time they are recorded as realized foreign currency gains (losses).
3. Futures and Forward Currency Contracts: The fund uses index futures contracts to a limited extent, with the objective of maintaining full exposure to the stock market while maintaining liquidity. The fund may purchase or sell futures contracts to achieve a desired level of investment, whether to accommodate portfolio turnover or cash flows from capital share transactions. The primary risks associated with the use of futures contracts are imperfect correlation between changes in market values of stocks held by the fund and the prices of futures contracts, and the possibility of an illiquid market.
55
Pacific Stock Index Fund
The fund may also enter into forward currency contracts to provide the appropriate currency exposure related to any open futures contracts. The primary risk associated with the fund’s use of these contracts is that a counterparty will fail to fulfill its obligation to pay gains due to the fund under the contracts.
Futures and forward currency contracts are valued at their quoted daily settlement prices. The aggregate principal amounts of the contracts are not recorded in the Statement of Net Assets. Fluctuations in the value of the contracts are recorded in the Statement of Net Assets as an asset (liability) and in the Statement of Operations as unrealized appreciation (depreciation) until the contracts are closed, when they are recorded as realized gains (losses) on futures or forward currency contracts.
4. Federal Income Taxes: The fund intends to continue to qualify as a regulated investment company and distribute all of its taxable income. Management has analyzed the fund’s tax positions taken on federal income tax returns for all open tax years (tax years ended October 31, 2005–2008), and has concluded that no provision for federal income tax is required in the fund’s financial statements.
5. Distributions: Distributions to shareholders are recorded on the ex-dividend date.
6. Security Lending: The fund may lend its securities to qualified institutional borrowers to earn additional income. Security loans are required to be secured at all times by collateral at least equal to the market value of securities loaned. The fund invests cash collateral received in Vanguard Market Liquidity Fund, and records a liability for the return of the collateral, during the period the securities are on loan. Security lending income represents the income earned on investing cash collateral, less expenses associated with the loan.
7. Other: Dividend income is recorded on the ex-dividend date. Interest income includes income distributions received from Vanguard Market Liquidity Fund and is accrued daily. Security transactions are accounted for on the date securities are bought or sold. Costs used to determine realized gains (losses) on the sale of investment securities are those of the specific securities sold. Fees assessed on redemptions of capital shares are credited to paid-in capital.
Each class of shares has equal rights as to assets and earnings, except that each class separately bears certain class-specific expenses related to maintenance of shareholder accounts (included in Management and Administrative expenses) and shareholder reporting. Marketing and distribution expenses are allocated to each class of shares based on a method approved by the board of trustees. Income, other non-class-specific expenses, and gains and losses on investments are allocated to each class of shares based on its relative net assets.
B. The Vanguard Group furnishes at cost investment advisory, corporate management, administrative, marketing, and distribution services. The costs of such services are allocated to the fund under methods approved by the board of trustees. The fund has committed to provide up to 0.40% of its net assets in capital contributions to Vanguard. At October 31, 2008, the fund had contributed capital of $985,000 to Vanguard (included in Other Assets), representing 0.01% of the fund’s net assets and 0.98% of Vanguard’s capitalization. The fund’s trustees and officers are also directors and officers of Vanguard.
56
Pacific Stock Index Fund
C. Distributions are determined on a tax basis and may differ from net investment income and realized capital gains for financial reporting purposes. Differences may be permanent or temporary. Permanent differences are reclassified among capital accounts in the financial statements to reflect their tax character. Temporary differences arise when certain items of income, expense, gain, or loss are recognized in different periods for financial statement and tax purposes; these differences will reverse at some time in the future. Differences in classification may also result from the treatment of short-term gains as ordinary income for tax purposes.
During the year ended October 31, 2008, the fund realized net foreign currency losses of $9,327,000, which decreased distributable net income for tax purposes; accordingly, such losses have been reclassified from accumulated net realized losses to undistributed net investment income. Certain of the fund’s investments are in securities considered to be “passive foreign investment companies,” for which any unrealized appreciation and/or realized gains are required to be included in distributable net income for tax purposes. During the year ended October 31, 2008, the fund realized gains on the sale of passive foreign investment companies of $11,640,000, which have been included in current and prior periods’ taxable income; accordingly, such gains have been reclassified from accumulated net realized losses to undistributed net investment income. Unrealized appreciation of $194,526,000 on the fund’s passive foreign investment company holdings at October 31, 2007, has been distributed and is reflected in the balance of undistributed net investment income. Since October 31, 2007, the fund’s passive foreign investment company holdings have depreciated in value, reducing the amount of taxable income available for distribution as of October 31, 2008 by $185,016,000. Unrealized appreciation on the fund’s passive foreign investment company holdings at October 31, 2008, was $9,510,000.
During the year ended October 31, 2008, the fund realized $1,129,766,000 of net capital gains resulting from in-kind redemptions—in which shareholders exchanged fund shares for securities held by the fund rather than for cash. Because such gains are not taxable to the fund, and are not distributed to shareholders, they have been reclassified from accumulated net realized losses to paid-in capital.
For tax purposes, at October 31, 2008, the fund had $125,413,000 of ordinary income available for distribution. The fund had available realized losses of $532,747,000 to offset future net capital gains of $1,920,000 through October 31, 2009, $68,660,000 through October 31, 2010, $4,471,000 through October 31, 2011, $4,674,000 through October 31, 2013, and $453,022,000 through October 31, 2016.
At October 31, 2008, the cost of investment securities for tax purposes was $12,616,600,000. Net unrealized depreciation of investment securities for tax purposes was $3,729,421,000, consisting of unrealized gains of $154,068,000 on securities that had risen in value since their purchase and $3,883,489,000 in unrealized losses on securities that had fallen in value since their purchase.
57
Pacific Stock Index Fund
At October 31, 2008, the aggregate settlement value of open futures contracts expiring in December 2008 and the related unrealized appreciation (depreciation) were:
| | | ($000) |
| Number of | Aggregate | Unrealized |
| Long (Short) | Settlement | Appreciation |
Futures Contracts | Contracts | Value | (Depreciation) |
Topix Index | 1,064 | 92,390 | (22,399) |
S&P ASX 200 Index | 414 | 27,559 | (3,033) |
At October 31, 2008, the fund had open forward currency contracts to receive and deliver currencies as follows:
| | | | | Unrealized |
| | | | | Appreciation |
| | Contract Amount (000) | (Depreciation) |
Contract Settlement Date | | Receive | | Deliver | ($000) |
12/23/2008 | AUD | 36,477 | USD | 23,952 | (3,616) |
12/17/2008 | JPY | 1,237,180 | USD | 12,606 | 257 |
| | | | | |
AUD—Australian dollar. | | | | | |
JPY—Japanese yen. | | | | | |
USD—U.S. dollar. | | | | | |
Unrealized appreciation (depreciation) on open forward currency contracts is treated as realized gain (loss) for tax purposes.
The fund had net unrealized foreign currency gains of $4,954,000 resulting from the translation of other assets and liabilities at October 31, 2008.
D. During the year ended October 31, 2008, the fund purchased $3,238,517,000 of investment securities and sold $4,194,545,000 of investment securities, other than temporary cash investments.
58
Pacific Stock Index Fund
E. Capital share transactions for each class of shares were:
| | | Year Ended October 31, |
| | 2008 | | 2007 |
| Amount | Shares | Amount | Shares |
| ($000) | (000) | ($000) | (000) |
Investor Shares | | | | |
Issued | 2,411,768 | 203,868 | 2,509,485 | 193,872 |
Issued in Lieu of Cash Distributions | 244,964 | 19,319 | 174,133 | 14,134 |
Redeemed1 | (4,188,958) | (380,723) | (746,241) | (57,211) |
Net Increase (Decrease)—Investor Shares | (1,532,226) | (157,536) | 1,937,377 | 150,795 |
Admiral Shares | | | | |
Issued | 226,260 | 2,951 | 364,227 | 4,302 |
Issued in Lieu of Cash Distributions | 24,546 | 296 | 22,198 | 275 |
Redeemed1 | (216,451) | (2,998) | (428,495) | (4,870) |
Net Increase (Decrease)—Admiral Shares | 34,355 | 249 | (42,070) | (293) |
Signal Shares | | | | |
Issued | 119,279 | 4,249 | 249,314 | 7,875 |
Issued in Lieu of Cash Distributions | 5,089 | 176 | — | — |
Redeemed1 | (92,729) | (3,794) | (6,799) | (220) |
Net Increase (Decrease)—Signal Shares | 31,639 | 631 | 242,515 | 7,655 |
Institutional Shares | | | | |
Issued | 918,220 | 82,517 | 963,535 | 73,688 |
Issued in Lieu of Cash Distributions | 51,874 | 4,047 | 36,590 | 2,965 |
Redeemed1 | (876,722) | (75,668) | (426,456) | (32,512) |
Net Increase (Decrease)—Institutional Shares | 93,372 | 10,896 | 573,669 | 44,141 |
ETF Shares | | | | |
Issued | 541,682 | 8,588 | 628,365 | 9,203 |
Issued in Lieu of Cash Distributions | — | — | — | — |
Redeemed1 | (22,550) | (400) | — | — |
Net Increase (Decrease)—ETF Shares | 519,132 | 8,188 | 628,365 | 9,203 |
1 Net of redemption fees of $911,000 and $508,000 (fund totals).
59
Pacific Stock Index Fund
F. In September 2006, the Financial Accounting Standards Board issued Statement of Financial Accounting Standards No. 157 (“FAS 157”), “Fair Value Measurements.” FAS 157 establishes a framework for measuring fair value and expands disclosures about fair value measurements in financial statements.
The various inputs that may be used to determine the value of the fund’s investments are summarized in three broad levels. The inputs or methodologies used for valuing securities are not necessarily an indication of the risk associated with investing in those securities.
Level 1—Quoted prices in active markets for identical securities.
Level 2—Other significant observable inputs (including quoted prices for similar securities, interest rates, prepayment speeds, credit risk, etc.).
Level 3—Significant unobservable inputs (including the fund’s own assumptions used to determine the fair value of investments).
The following table summarizes the fund’s investments as of October 31, 2008, based on the inputs used to value them:
| | | Forward |
| Investments | Futures | Currency |
| in Securities | Contracts | Contracts |
Valuation Inputs | ($000) | ($000) | ($000) |
Level 1—Quoted prices | 236,220 | (25,432) | (3,359) |
Level 2—Other significant observable inputs | 8,650,959 | — | — |
Level 3—Significant unobservable inputs | — | — | — |
Total | 8,887,179 | (25,432) | (3,359) |
60
Emerging Markets Stock Index Fund
Fund Profile
As of October 31, 2008
Portfolio Characteristics | | |
| | Target | Broad |
| Fund | Index1 | Index2 |
Number of Stocks | 830 | 781 | 1,898 |
Turnover Rate | 20% | — | — |
Expense Ratio | | | |
(10/31/2007)3 | | — | — |
Investor Shares | 0.37% | | |
Admiral Shares | 0.25% | | |
Signal Shares | 0.25% | | |
Institutional Shares | 0.20% | | |
ETF Shares | 0.25% | | |
Short-Term Reserves | 0.4% | — | — |
Sector Diversification (% of equity exposure) |
| | Target | Broad |
| Fund | Index1 | Index2 |
Consumer Discretionary | 5.5% | 5.2% | 9.0% |
Consumer Staples | 5.3 | 5.3 | 9.9 |
Energy | 16.3 | 16.2 | 12.0 |
Financials | 21.4 | 21.5 | 21.4 |
Health Care | 2.5 | 2.4 | 9.7 |
Industrials | 7.4 | 7.4 | 10.0 |
Information Technology | 12.5 | 12.3 | 9.1 |
Materials | 12.6 | 12.8 | 7.4 |
Telecommunication | | | |
Services | 12.9 | 13.2 | 6.0 |
Utilities | 3.6 | 3.7 | 5.5 |
Volatility Measures4 | |
| Fund Versus | Fund Versus |
| Target Index1 | Broad Index2 |
R-Squared | 0.99 | 0.93 |
Beta | 0.98 | 1.32 |
Ten Largest Holdings5 (% of total net assets) |
| | |
Petróleo Brasileiro SA | integrated oil | |
| and gas | 3.6% |
China Mobile | wireless | |
(Hong Kong) Ltd. | telecommunication | |
| services | 3.0 |
Samsung | | |
Electronics Co., Ltd. | semiconductors | 2.9 |
OAO Gazprom | integrated oil | |
Sponsored ADR | and gas | 2.7 |
Companhia Vale do | diversified metals | |
Rio Doce | and mining | 2.4 |
Teva Pharmaceutical | | |
Industries Ltd. | pharmaceuticals | 1.8 |
Taiwan Semiconductor | | |
Manufacturing Co., Ltd. | semiconductors | 1.7 |
America Movil SA de CV | wireless | |
| telecommunication | |
| services | 1.6 |
Industrial and | | |
Commercial Bank of | diversified | |
China Ltd. Class H | banks | 1.1 |
China Life | life and | |
Insurance Co., Ltd. | health insurance | 1.1 |
Top Ten | | 21.9% |
1 MSCI Emerging Markets Index.
2 MSCI All Country World Index ex USA.
3 The expense ratios shown are from the prospectus dated August 29, 2008. For the fiscal year ended October 31, 2008, the expense ratios were 0.32% for Investor Shares, 0.20% for Admiral Shares, 0.20% for Signal Shares, 0.15% for Institutional Shares, and 0.20% for ETF Shares.
4 For an explanation of R-squared, beta, and other terms used here, see the Glossary.
5 The holdings listed exclude any temporary cash investments and equity index products.
61
Emerging Markets Stock Index Fund
Market Diversification (% of equity exposure) |
| | Target |
| Fund | Index1 |
China | 15.6% | 15.4% |
Brazil | 13.8 | 14.2 |
South Korea | 13.6 | 13.5 |
Taiwan | 11.8 | 11.7 |
Russia | 7.8 | 7.4 |
South Africa | 7.6 | 7.2 |
India | 6.8 | 6.6 |
Mexico | 5.1 | 5.2 |
Israel | 3.4 | 3.3 |
Malaysia | 3.0 | 2.9 |
Poland | 1.8 | 1.7 |
Turkey | 1.7 | 1.6 |
Chile | 1.4 | 1.4 |
Indonesia | 1.4 | 1.4 |
Thailand | 1.4 | 1.3 |
Other Emerging Markets | 3.8 | 5.2 |
1 MSCI Emerging Markets Index.
62
Emerging Markets Stock Index Fund
Performance Summary
All of the returns in this report represent past performance, which is not a guarantee of future results that may be achieved by the fund. (Current performance may be lower or higher than the performance data cited. For performance data current to the most recent month-end, visit our website at www.vanguard.com/performance.) Note, too, that both investment returns and principal value can fluctuate widely, so an investor’s shares, when sold, could be worth more or less than their original cost. The returns shown do not reflect taxes that a shareholder would pay on fund distributions or on the sale of fund shares.
Cumulative Performance: October 31, 1998–October 31, 2008
Initial Investment of $10,000

| | Average Annual Total Returns | Final Value of |
| Periods Ended October 31, 2008 | a $10,000 |
| One Year | Five Years | Ten Years | Investment |
Emerging Markets Stock Index Fund | | | | |
Investor Shares1 | –56.88% | 8.94% | 9.19% | $24,084 |
MSCI All Country World Index ex USA | –48.27 | 5.05 | 3.19 | 13,692 |
Spliced Emerging Markets Index2 | –56.35 | 9.22 | 9.39 | 24,536 |
Average Emerging Markets Fund3 | –57.30 | 8.20 | 9.08 | 23,847 |
| | | Final Value of |
| | Since | a $100,000 |
| One Year | Inception4 | Investment |
Emerging Markets Stock Index Fund Admiral Shares1 | –56.85% | –6.62% | $85,102 |
MSCI All Country World Index ex USA | –48.27 | –10.00 | 78,004 |
Spliced Emerging Markets Index2 | –56.35 | –6.61 | 85,121 |
1 Performance figures are adjusted for the 0.25% (0.50% prior to June 26, 2008) transaction fee on purchases and redemptions. Total returns do not reflect the 2% fee assessed until March 23, 2005, on redemptions of shares purchased on or after June 27, 2003, and held for less than two months, or, for Investor Shares, the account service fee that may be applicable to certain accounts with balances below $10,000.
2 Select Emerging Markets Index through August 23, 2006; MSCI Emerging Markets Index thereafter.
3 Derived from data provided by Lipper Inc.
4 Performance for the fund’s Admiral Shares and comparative standards is calculated since the Admiral Shares’ inception: June 23, 2006.
63
Emerging Markets Stock Index Fund
| | | | Final Value of |
| | | Since | a $10,000,000 |
| One Year | | Inception1 | Investment |
Emerging Markets Stock Index Fund Signal Shares2 | –56.85% | | –20.67% | $6,620,273 |
MSCI All Country World Index ex USA | –48.27 | | –21.83 | 6,448,410 |
MSCI Emerging Markets Index | –56.35 | | –20.57 | 6,634,489 |
| | | | |
| | | | |
| | | | Final Value of |
| | | Since | a $5,000,000 |
| One Year | Five Years | Inception1 | Investment |
Emerging Markets Stock Index Fund | | | | |
Institutional Shares2 | –56.82% | 9.13% | 6.10% | $8,203,312 |
MSCI All Country World Index ex USA | –48.27 | 5.05 | 0.11 | 5,047,306 |
Spliced Emerging Markets Index3 | –56.35 | 9.22 | 6.24 | 8,291,634 |
| | | Final Value of |
| | Since | a $10,000 |
| One Year | Inception1 | Investment |
Emerging Markets Stock Index Fund | | | |
ETF Shares Net Asset Value | –56.62% | 0.99% | $10,368 |
MSCI All Country World Index ex USA | –48.27 | –2.25 | 9,202 |
Spliced Emerging Markets Index3 | –56.35 | 1.00 | 10,372 |
Cumulative Returns: ETF Shares, March 4, 2005–October 31, 2008 | | |
| | Since |
| One Year | Inception1 |
Emerging Markets Stock Index Fund ETF Shares Market Price | –56.74% | 3.81% |
Emerging Markets Stock Index Fund ETF Shares Net Asset Value | –56.62 | 3.68 |
Spliced Emerging Markets Index3 | –56.35 | 1.00 |
1 Performance for the fund and its comparative standards is calculated since the following inception dates: January 19, 2007, for the Signal Shares; June 22, 2000, for the Institutional Shares; and March 4, 2005, for the ETF Shares.
2 Performance figures are adjusted for the 0.25% (0.50% prior to June 26, 2008) transaction fee on purchases and redemptions. Total returns do not reflect the 2% fee assessed until March 23, 2005, on redemptions of shares purchased on or after June 27, 2003, and held for less than two months.
3 Select Emerging Markets Index through August 23, 2006; MSCI Emerging Markets Index thereafter.
64
Emerging Markets Stock Index Fund
Fiscal-Year Total Returns (%): October 31, 1998–October 31, 2008

Average Annual Total Returns: Periods Ended September 30, 2008
This table presents average annual total returns through the latest calendar quarter—rather than through the end of the fiscal period. Securities and Exchange Commission rules require that we provide this information.
| Inception Date | One Year | Five Years | Ten Years |
Emerging Markets Stock Index Fund | | | | |
Investor Shares2 | 5/4/1994 | –32.71% | 18.39% | 14.46% |
Fee-Adjusted Returns3 | | –33.05 | 18.27 | 14.41 |
Admiral Shares | 6/23/2006 | –32.61 | 7.674 | — |
Fee-Adjusted Returns3 | | –32.95 | 7.434 | — |
Signal Shares | 1/19/2007 | –32.63 | –4.794 | — |
Fee-Adjusted Returns3 | | –32.96 | –5.074 | — |
Institutional Shares | 6/22/2000 | –32.59 | 18.59 | 10.474 |
Fee-Adjusted Returns3 | | –32.93 | 18.48 | 10.414 |
ETF Shares | 3/4/2005 | | | |
Market Price | | –32.01 | 10.814 | — |
Net Asset Value | | –32.62 | 10.594 | — |
1 Select Emerging Markets Index through August 23, 2006; MSCI Emerging Markets Index thereafter.
2 Returns do not reflect the account service fee that may be applicable to certain accounts with balances below $10,000.
3 Performance figures are adjusted for the 0.25% (0.50% prior to June 26, 2008) transaction fee on purchases and redemptions.
4 Return since inception.
Note: See Financial Highlights tables for dividend and capital gains information.
65
Emerging Markets Stock Index Fund
Financial Statements
Statement of Net Assets
As of October 31, 2008
The fund provides a complete list of its holdings four times in each fiscal year, at the quarter-ends. For the second and fourth fiscal quarters, the lists appear in the fund’s semiannual and annual reports to shareholders. For the first and third fiscal quarters, the fund files the lists with the Securities and Exchange Commission on Form N-Q. Shareholders can look up the fund’s Forms N-Q on the SEC’s website at www.sec.gov. Forms N-Q may also be reviewed and copied at the SEC’s Public Reference Room (see the back cover of this report for further information).
| | | Market |
| | | Value• |
| | Shares | ($000) |
Common Stocks (99.6%)1 | | |
Argentina (0.4%) | | |
| Tenaris SA ADR | 1,010,982 | 20,816 |
| Tenaris SA | 1,351,827 | 15,289 |
| Siderar SA Class A | 780,264 | 3,917 |
| Petrobras Energia | | |
| Participaciones SA ADR | 587,636 | 3,649 |
* | Telecom Argentina SA | | |
| ADR | 362,513 | 2,110 |
^ | Banco Macro Bansud SA | | |
| ADR | 282,918 | 1,994 |
| Petrobras Energia | | |
| Participaciones SA | 2,793,723 | 1,939 |
* | Telecom Argentina SA | 1,330,950 | 1,729 |
| | | 51,443 |
Brazil (13.8%) | | |
| Petroleo Brasileiro | | |
| SA Pfd. | 17,653,912 | 190,188 |
| Petroleo Brasileiro SA | 12,758,696 | 168,899 |
| Companhia Vale do Rio | | |
| Doce Pfd. Class A | 10,624,077 | 123,232 |
| Companhia Vale do | | |
| Rio Doce | 7,430,038 | 95,340 |
| Banco Bradesco SA | 8,005,600 | 91,825 |
| Banco Itau Holding | | |
| Financeira SA | 6,217,400 | 67,153 |
| Petroleo Brasileiro | | |
| SA Series A ADR | 2,300,677 | 50,776 |
| Itausa-Investimentos | | |
| Itau SA | 14,535,985 | 46,362 |
| Petroleo Brasileiro SA | | |
| ADR | 1,700,354 | 45,723 |
| Companhia Vale do Rio | | |
| Doce Sponsored ADR | 3,902,181 | 45,695 |
| Companhia de Bebidas | | |
| das Americas Pfd. | 967,909 | 41,147 |
| Companhia Vale do Rio | | |
| Doce ADR | 2,754,348 | 36,137 |
| Unibanco-Uniao de | | |
| Bancos Brasileiros SA | 5,211,883 | 32,236 |
| | | Market |
| | | Value• |
| | Shares | ($000) |
| Banco Bradesco SA ADR | 2,319,882 | 27,143 |
| Banco Itau Holding | | |
| Financeira SA ADR | 2,419,633 | 26,761 |
| Companhia Siderurgica | | |
| Nacional SA | 1,808,860 | 24,062 |
| Companhia Energetica | | |
| de Minas Gerais Pfd. | 1,569,006 | 23,848 |
| BM&F BOVESPA SA | 8,622,676 | 22,885 |
| Usiminas-Usinas | | |
| Siderugicas de | | |
| Minas Gerais SA Pfd. | 1,785,255 | 22,826 |
| Gerdau SA Pfd. | 3,504,900 | 22,293 |
| Tele Norte Leste | | |
| Participacoes SA Pfd. | 1,524,163 | 20,613 |
| Redecard SA | 1,894,997 | 20,564 |
| Centrais Electricas | | |
| Brasileiras SA | 1,591,391 | 19,076 |
| Metalurgica Gerdau SA | 1,936,562 | 17,278 |
| Banco do Brasil SA | 2,328,965 | 15,372 |
| Centrais Electricas | | |
| Brasileiras SA Pfd. | | |
| B Shares | 1,418,019 | 15,349 |
| Uniao de Bancos | | |
| Brasileiros SA GDR | 234,630 | 14,800 |
| Bradespar SA Pfd. | 1,603,511 | 14,092 |
| All America Latina | | |
| Logistica | 2,767,013 | 12,746 |
| CPFL Energia SA | 845,189 | 12,242 |
| Empresa Brasileira | | |
| de Aeronautica SA | 2,387,949 | 12,235 |
| Perdigao SA | 797,962 | 11,595 |
* | Ironx Mineracao SA | 861,125 | 11,328 |
* | OGX Petroleo e Gas | | |
| Participacoes SA | 90,386 | 11,327 |
| Companhia Siderurgica | | |
| Nacional SA ADR | 803,380 | 10,926 |
| Brasil Telecom | | |
| Participacoes SA | 484,328 | 10,172 |
| Ultrapar Participacoes S.A. | 546,123 | 10,083 |
| Vivo Participacoes SA Pfd. | 911,118 | 9,917 |
66
Emerging Markets Stock Index Fund
| | | Market |
| | | Value• |
| | Shares | ($000) |
| Companhia de Bebidas | | |
| das Americas ADR | 224,399 | 9,537 |
| Souza Cruz SA | 536,015 | 9,295 |
| Electropaulo Metropolitana | | |
| SA | 660,113 | 8,105 |
| Embraer-Empresa Brasileira | | |
| de Aeronautica SA ADR | 387,345 | 8,103 |
| Companhia de Concessoes | | |
| Rodoviarias | 842,040 | 8,084 |
| Telmar Norte Leste SA | 321,300 | 8,075 |
* | Net Servicos de | | |
| Comunicacao SA | 1,267,041 | 8,053 |
| Brasil Telecom | | |
| Participacoes SA Pfd. | 1,086,126 | 7,610 |
| Natura Cosmeticos SA | 900,089 | 7,561 |
| Gerdau SA ADR | 1,125,056 | 7,212 |
| Tractebel Energia SA | 917,109 | 7,196 |
| Cyrela Brazil Realty SA | 1,501,689 | 7,153 |
| Tele Norte Leste | | |
| Participacoes SA | 461,381 | 6,921 |
| Votorantim Celulose e | | |
| Papel SA Pfd. | 666,869 | 6,556 |
| Gerdau SA | 1,236,550 | 6,535 |
| Companhia de | | |
| Saneamento Basico | | |
| do Estado de Sao Paulo | 568,382 | 6,506 |
| Lojas Americanas SA Pfd. | 2,318,498 | 6,410 |
| Lojas Renner SA | 849,165 | 6,271 |
| Companhia Brasileira de | | |
| Distribuicao Grupo Pao | | |
| de Acucar ADR | 206,032 | 6,167 |
| Companhia Energetica | | |
| de Minas Gerais ADR | 401,689 | 6,110 |
* | GVT Holding SA | 546,499 | 5,941 |
| Gafisa SA | 832,380 | 5,898 |
| Suzano Papel e Celulose | | |
| SA | 950,803 | 5,639 |
| B2W Com Global | | |
| Do Varejo | 416,598 | 5,346 |
| Tam SA | 510,917 | 5,330 |
| Klabin SA | 3,045,753 | 5,258 |
| Usinas Siderurgicas de | | |
| Minas Gerais SA | 450,033 | 5,152 |
| Braskem SA | 1,200,724 | 5,143 |
| Brasil Telecom SA Pfd. | 855,932 | 5,097 |
| Energias do Brasil SA | 472,795 | 5,085 |
| CESP - Companhia | | |
| Energetica de Sao Paulo | 1,125,527 | 5,039 |
| Tim Participacoes SA Pfd. | 3,420,432 | 4,878 |
| Companhia Paranaense | | |
| de Energia-COPEL | 442,739 | 4,868 |
| Fertilizantes Fosfatados | | |
| S.A. | 912,776 | 4,740 |
| JBS SA | 2,478,845 | 4,474 |
| Tele Norte Leste | | |
| Participacoes ADR | 320,272 | 4,349 |
| | | Market |
| | | Value• |
| | Shares | ($000) |
| Duratex SA Pfd. | 501,492 | 4,190 |
| Companhia Paranaense | | |
| de Energia-COPEL ADR | 290,409 | 3,229 |
| Sadia SA Pfd. | 1,600,277 | 3,191 |
| Banco do Estado do | | |
| Rio Grande do Sul SA | 1,295,430 | 2,996 |
* | Cosan SA Industria e | | |
| Comercio | 584,450 | 2,881 |
| Companhia de | | |
| Saneamento Basico | | |
| do Estado de Sao | | |
| Paulo ADR | 123,449 | 2,839 |
| Companhia Brasileira | | |
| de Distribuicao Grupo | | |
| Pao de Acucar Pfd. | 183,869 | 2,755 |
| Localiza Rent a Car SA | 698,552 | 2,708 |
| MRV Engenharia e | | |
| Participacoes SA | 462,446 | 2,393 |
| Aracruz Celulose SA ADR | 176,849 | 2,352 |
| Aracruz Celulose SA Pfd. | | |
| B Shares | 1,658,905 | 2,037 |
| Sadia SA ADR | 310,387 | 1,881 |
| Gol - Linhas Aereas | | |
| Inteligentes SA Pfd. | 410,260 | 1,767 |
| MMX Mineracao e | | |
| Metalicos SA | 918,072 | 1,754 |
| Tim Participacoes SA ADR | 97,154 | 1,405 |
| Brasil Telecom | | |
| Participacoes SA ADR | 11,676 | 400 |
* | LLX Logistica SA | 813,466 | 285 |
* | Vivo Participacoes SA ADR | 2,193 | 24 |
| Votorantim Celulose | | |
| e Papel SA ADR | 1,799 | 18 |
| Braskem SA ADR | 2,012 | 17 |
| | | 1,723,065 |
Chile (1.4%) | | |
| Empresas Copec SA | 2,715,193 | 22,244 |
| Empresa Nacional de | | |
| Electricidad SA | 16,338,550 | 19,073 |
| Enersis SA | 65,024,375 | 17,645 |
| Empresas CMPC SA | 715,891 | 13,181 |
| Sociedad Quimica y | | |
| Minera de Chile SA | 444,322 | 9,340 |
| Empresa Nacional de | | |
| Electricidad SA ADR | 244,239 | 9,086 |
| Lan Airlines SA | 971,219 | 8,789 |
| Enersis SA ADR | 582,508 | 8,388 |
| Empresa Nacional de | | |
| Telecomunicaciones SA | 765,922 | 7,936 |
| Cencosud SA | 5,359,821 | 7,839 |
| Banco Santander Chile | | |
| SA ADR | 211,216 | 7,561 |
| CAP SA | 542,652 | 6,532 |
* | Colburn SA | 39,500,394 | 5,924 |
| S.A.C.I. Falabella, SA | 2,111,290 | 5,556 |
67
Emerging Markets Stock Index Fund
| | | Market |
| | | Value• |
| | Shares | ($000) |
| Banco Santander Chile | | |
| SA | 177,458,517 | 5,424 |
| Compania Cervecerias | | |
| Unidas SA | 931,173 | 4,998 |
| Sociedad Quimica y | | |
| Minera de Chile SA ADR | 213,144 | 4,881 |
| Distribucion y Servicio | | |
| D&S SA | 15,999,047 | 4,484 |
| Banco de Credito e | | |
| Inversiones | 220,261 | 3,694 |
| Masisa SA | 22,645,066 | 1,722 |
| Compania de | | |
| Telecomunicaciones | | |
| de Chile SA ADR | 228,090 | 1,549 |
| Distribucion y Servicio | | |
| D&S SA ADR | 40,380 | 719 |
| | | 176,565 |
China (15.7%) | | |
| China Mobile | | |
| (Hong Kong) Ltd. | 42,582,467 | 374,867 |
^ | Industrial and | | |
| Commercial Bank of | | |
| China Ltd. Class H | 293,692,659 | 138,188 |
^ | China Life | | |
| Insurance Co., Ltd. | 50,087,110 | 133,853 |
^ | China Construction | | |
| Bank | 238,544,163 | 118,337 |
| PetroChina Co. Ltd. | 149,630,899 | 112,506 |
| CNOOC Ltd. | 110,897,552 | 91,056 |
| China Petroleum & | | |
| Chemical Corp. | 118,586,580 | 77,872 |
| China Unicom Ltd. | 42,065,048 | 60,056 |
^ | Bank of China | 188,874,475 | 55,149 |
^ | Tencent Holdings Ltd. | 6,366,159 | 46,345 |
| China Shenhua | | |
| Energy Co. Ltd. | | |
| H-Shares | 22,998,000 | 43,664 |
^ | Ping An Insurance | | |
| (Group) Co. | | |
| of China Ltd. | 9,036,488 | 38,647 |
| China Telecom | | |
| Corp. Ltd. | 98,013,305 | 34,883 |
^ | China Overseas Land | | |
| & Investment Ltd. | 27,381,958 | 30,922 |
^ | China Merchants | | |
| Bank Co., Ltd. Class H | 18,789,500 | 28,786 |
^ | Bank of | | |
| Communications Ltd. | | |
| Class H | 40,997,902 | 24,161 |
| China Communications | | |
| Construction Co., Ltd. | 29,751,484 | 21,074 |
| China Resources Power | | |
| Holdings Co., Ltd. | 10,282,740 | 20,096 |
| China Merchants | | |
| Holdings International | | |
| Co. Ltd. | 7,656,462 | 18,241 |
| | | Market |
| | | Value• |
| | Shares | ($000) |
| China Resources | | |
| Enterprise Ltd. | 8,401,916 | 16,727 |
*,^ | China Railway | | |
| Group, Ltd. | 26,775,616 | 15,634 |
* | China Railway | | |
| Construction Corp. | 12,524,500 | 15,472 |
| China Coal Energy Co. | 23,186,000 | 14,062 |
^ | Tingyi Holding Corp. | 11,935,347 | 12,643 |
^ | Hengan International | | |
| Group Co. Ltd. | 4,501,000 | 12,554 |
| China Insurance | | |
| International Holdings | | |
| Co., Ltd. | 5,123,007 | 11,943 |
| Beijing Enterprises | | |
| Holdings Ltd. | 2,813,500 | 11,111 |
^ | Huaneng Power | | |
| International, Inc. | | |
| H Shares | 21,447,262 | 10,434 |
^ | Aluminum Corp. of | | |
| China Ltd. | 27,800,680 | 10,102 |
| China COSCO | | |
| Holdings Co., Ltd. | 18,027,500 | 9,712 |
*,^ | Anhui Conch | | |
| Cement Co. Ltd. | 3,039,828 | 9,681 |
| Chaoda Modern | | |
| Agriculture | | |
| Holdings Ltd. | 13,670,319 | 9,631 |
^ | China Citic Bank | 30,480,482 | 9,416 |
| GOME Electrical | | |
| Appliances | | |
| Holdings Ltd. | 44,554,920 | 8,900 |
| Beijing Datang | | |
| Power Generation | | |
| Co., Ltd. | 23,087,736 | 8,695 |
| Denway Motors Ltd. | 34,437,618 | 8,588 |
| China Shipping | | |
| Development Co. | 8,683,659 | 8,557 |
| Fujian Zijin Mining | | |
| Industry Co., Ltd. | 28,134,120 | 8,503 |
| Lenovo Group Ltd. | 28,021,447 | 8,496 |
| Belle International | | |
| Holdings Ltd. | 17,642,073 | 8,473 |
^ | Sinofert Holdings, Ltd. | 14,748,000 | 8,230 |
| Yanzhou Coal Mining | | |
| Co. Ltd. H Shares | 13,100,582 | 8,091 |
| CHINA YURUN FOOD | | |
| GROUP LTD. | 6,473,000 | 7,694 |
^ | China Resources | | |
| Land Ltd. | 7,340,000 | 7,430 |
| Beijing Capital | | |
| International Airport | | |
| Co., Ltd. | 13,173,654 | 7,428 |
^ | Parkson Retail | | |
| Group Ltd. | 7,787,975 | 7,229 |
| China Mengniu | | |
| Dairy Co., Ltd. | 7,442,836 | 7,156 |
68
Emerging Markets Stock Index Fund
| | | Market |
| | | Value• |
| | Shares | ($000) |
^ | BYD Co. Ltd. | 4,031,755 | 6,853 |
| China Communication | | |
| Services Corp. Ltd. | 12,562,000 | 6,606 |
* | Shanghai Electric Group | | |
| Co., Ltd. Class H | 20,971,178 | 6,346 |
| CITIC Pacific Ltd. | 7,652,218 | 6,223 |
| Jiangsu Expressway | | |
| Co. Ltd. H Shares | 8,685,777 | 6,075 |
| Shanghai Industrial | | |
| Holding Ltd. | 3,776,645 | 6,005 |
| Sino-Ocean Land | | |
| Holdings Ltd. | 21,982,365 | 5,909 |
| China Oilfield | | |
| Services Ltd. | 10,740,000 | 5,902 |
^ | Li Ning Co., Ltd. | 4,741,068 | 5,867 |
| Cosco Pacific Ltd. | 7,928,492 | 5,774 |
| Dongfeng Motor Corp. | 19,297,832 | 5,463 |
| Guangdong | | |
| Investment Ltd. | 17,697,304 | 5,417 |
| CNPC Hong Kong Ltd. | 17,594,330 | 5,395 |
^ | Shimao Property | | |
| Holdings Ltd. | 9,602,862 | 5,207 |
| China Everbright Ltd. | 5,276,570 | 4,954 |
| China Vanke Co., Ltd. | 8,271,480 | 4,888 |
| Zhejiang Expressway | | |
| Co., Ltd. | 10,184,528 | 4,879 |
^ | Air China Ltd. | 17,135,068 | 4,786 |
*,^ | PICC Property and | | |
| Casualty Co., Ltd. | 17,173,551 | 4,755 |
^ | Angang Steel Co., Ltd. | 7,711,306 | 4,732 |
^ | Jiangxi Copper Co. Ltd. | 9,315,637 | 4,580 |
^ | China High Speed | | |
| Transmission Equipment | | |
| Group Co., Ltd. | 5,759,872 | 4,576 |
*,^ | Alibaba.com, Ltd. | 7,544,687 | 4,556 |
^ | Country Garden | | |
| Holdings Co. | 22,728,307 | 4,037 |
| Agile Property | | |
| Holdings, Inc. | 11,751,177 | 3,905 |
| Inner Mongolia Yitai | | |
| Coal Co., Ltd. | 2,297,800 | 3,884 |
| Yantai Changyu Pioneer | | |
| Wine Co., Ltd. | 1,249,940 | 3,884 |
| The Guangshen | | |
| Railway Co., Ltd. | 9,789,345 | 3,811 |
^ | China National Building | | |
| Material Co., Ltd. | 6,284,359 | 3,660 |
*,^ | China Agri-Industries | | |
| Holdings Ltd. | 9,963,534 | 3,552 |
^ | China Bluechemical, Ltd. | 9,204,000 | 3,491 |
^ | Guangzhou R&F | | |
| Properties Co. Ltd. | 7,189,600 | 3,455 |
^ | ZTE Corp. | 1,449,423 | 3,277 |
* | Soho China | 10,973,068 | 3,262 |
| Sinopec Shanghai | | |
| Petrochemical Co. Ltd. | 16,747,668 | 3,135 |
| | | Market |
| | | Value• |
| | Shares | ($000) |
| Shui On Land Ltd. | 12,882,464 | 2,918 |
| China Travel | | |
| International | 20,448,049 | 2,900 |
^ | China Shipping Container | | |
| Lines Co. Ltd. | 24,776,618 | 2,853 |
| Shanghai Zhenhua Port | | |
| Machinery Co., Ltd. | | |
| Class B | 4,528,999 | 2,851 |
| China International | | |
| Marine Containers | | |
| (Group) Co.,Ltd. | 5,440,259 | 2,750 |
| Harbin Power Equipment | | |
| Co., Ltd. | 4,645,867 | 2,583 |
| Shanghai Lujiazui Finance | | |
| & Trade Zone | | |
| DevelopmentCo., Ltd. | | |
| Class B | 3,375,400 | 2,429 |
| Maanshan Iron and | | |
| Steel Co. Ltd. | 12,534,922 | 2,336 |
^ | Dongfang Electrical | | |
| Corp. Ltd. | 1,161,600 | 2,261 |
| Fosun International | 10,918,630 | 2,248 |
| Guangzhou Investment | | |
| Co. Ltd. | 27,856,000 | 2,071 |
*,^ | China Southern Airlines | | |
| Co. Ltd. | 12,283,924 | 1,913 |
^ | Nine Dragons Paper | | |
| Holdings Ltd. | 10,132,150 | 1,747 |
| Shougang Concord | | |
| International | | |
| Enterprises | | |
| Company Ltd. | 20,663,469 | 1,711 |
*,^ | CITIC Resources | | |
| Holdings Ltd. | 18,452,300 | 1,404 |
^ | Hopson Development | | |
| Holdings Ltd. | 4,126,211 | 1,379 |
| Hidili Industry Int’l | | |
| Development Ltd. | 6,260,424 | 1,325 |
*,^ | China Eastern Airlines | | |
| Corp. Ltd. | 10,403,782 | 1,320 |
| KWG Property | | |
| Holding, Ltd. | 5,591,500 | 1,197 |
| | | 1,960,592 |
Colombia (0.2%) | | |
| Bancolombia SA ADR | 1,183,037 | 23,105 |
| | | |
Czech Republic (0.9%) | | |
| Ceske Energeticke | | |
| Zavody a.s. | 1,470,303 | 64,306 |
| Cesky Telecom a.s. | 819,877 | 17,520 |
| Komercni Banka a.s. | 109,207 | 16,628 |
| Zentiva NV | 193,052 | 11,262 |
* | Central European | | |
| Media Enterprises Ltd. | 219,616 | 5,432 |
| Unipetrol a.s. | 517,362 | 3,877 |
| | | 119,025 |
69
Emerging Markets Stock Index Fund
| | | Market |
| | | Value• |
| | Shares | ($000) |
Egypt (0.4%) | | |
| Orascom Construction | | |
| Industries GDR | 440,725 | 29,727 |
| Orascom Telecom Holding | | |
| SAE GDR | 834,925 | 25,938 |
| | | 55,665 |
Hungary (0.6%) | | |
*,^ | OTP Bank Nyrt. | 1,945,583 | 32,223 |
| MOL Hungarian Oil and | | |
| Gas Nyrt. | 430,528 | 23,293 |
| Richter Gedeon Nyrt. | 102,323 | 14,137 |
| Magyar Tavkozlesi Nyrt. | 3,400,554 | 10,759 |
| | | 80,412 |
India (6.8%) | | |
| Reliance Industries Ltd. | 4,625,776 | 131,129 |
| Infosys Technologies Ltd. | 3,229,800 | 93,890 |
| Housing Development | | |
| Finance Corp. Ltd. | 1,484,470 | 53,885 |
| HDFC Bank Ltd. | 1,465,139 | 31,139 |
| ICICI Bank Ltd. | 3,409,415 | 28,308 |
| Hindustan Lever Ltd. | 6,140,273 | 27,886 |
| Oil and Natural | | |
| Gas Corp. Ltd. | 1,982,723 | 27,257 |
| ITC Ltd. | 7,730,236 | 24,611 |
| Larsen & Toubro Ltd. | 1,398,237 | 23,308 |
| Bharat Heavy | | |
| Electricals Ltd. | 826,949 | 21,969 |
| Reliance Communication | | |
| Ventures | 4,354,751 | 19,859 |
| NTPC Ltd. | 5,911,251 | 17,151 |
| ICICI Bank Ltd. ADR | 1,000,672 | 17,102 |
| Axis Bank Ltd. | 1,387,263 | 16,069 |
| Satyam Computer | | |
| Services Ltd. | 2,541,913 | 16,027 |
| Tata Consultancy | | |
| Services Ltd. | 1,402,825 | 15,648 |
| Gail India Ltd. | 2,670,329 | 11,843 |
| Reliance Capital Ltd. | 793,943 | 10,778 |
| HDFC Bank Ltd. ADR | 158,255 | 10,382 |
| Sterlite Industries | | |
| (India) Ltd. | 1,735,827 | 10,333 |
| Sun Pharmaceutical | | |
| Industries Ltd. | 433,519 | 10,031 |
| Wipro Ltd. | 1,661,681 | 9,315 |
| Hero Honda Motors Ltd. | 569,710 | 8,726 |
| Cipla Ltd. | 2,250,179 | 8,185 |
| State Bank of India | 339,697 | 7,777 |
| Tata Power Co. Ltd. | 543,908 | 7,742 |
| Mahindra & Mahindra Ltd. | 945,775 | 7,323 |
| Jindal Steel & Power Ltd. | 436,669 | 7,172 |
| Reliance Energy Ltd. | 750,891 | 7,120 |
* | Reliance Petroleum Ltd. | 3,804,445 | 6,764 |
| Satyam Computer | | |
| Services Ltd. ADR | 421,377 | 6,628 |
| Hindalco Industries Ltd. | 5,213,607 | 6,521 |
| DLF Ltd. | 1,441,588 | 6,502 |
| | | Market |
| | | Value• |
| | Shares | ($000) |
* | United Spirits Ltd. | 350,383 | 6,447 |
| Kotak Mahindra Bank | 854,854 | 6,015 |
| Tata Motors Ltd. | 1,576,639 | 5,702 |
| Maruti Udyog Ltd. | 486,147 | 5,674 |
| Steel Authority of | | |
| India Ltd. | 3,227,300 | 5,641 |
* | Cairn India Ltd. | 2,061,305 | 5,568 |
| Ambuja Cements Ltd. | 4,397,113 | 5,536 |
| Infrastructure | | |
| Development | | |
| Finance Co., Ltd. | 4,575,089 | 5,510 |
| Jaiprakash | | |
| Associates Ltd. | 3,646,302 | 5,494 |
| Tata Iron and | | |
| Steel Co. Ltd. | 1,242,588 | 5,416 |
| Grasim Industries Ltd. | 254,490 | 5,394 |
| Zee Entertainment | | |
| Enterprises | 1,483,790 | 4,712 |
| Dr. Reddy’s | | |
| Laboratories Ltd. | 477,512 | 4,228 |
| Glenmark | | |
| Pharmaceuticals Ltd. | 699,504 | 4,141 |
| Asea Brown Boveri | | |
| India Ltd. | 353,858 | 3,992 |
| HCL Technologies Ltd. | 1,115,945 | 3,990 |
| JSW Steel Ltd. | 609,752 | 3,882 |
| Associated | | |
| Cement Cos. Ltd. | 377,262 | 3,831 |
* | Reliance Natural | | |
| Resources, Ltd. | 4,193,633 | 3,773 |
* | Essar Oil Ltd. | 2,082,972 | 3,696 |
| Bharat Petroleum | | |
| Corp. Ltd. | 620,460 | 3,636 |
| Indiabulls Real Estate Ltd. | 1,388,774 | 3,450 |
| Tata Communications Ltd. | 328,050 | 3,318 |
* | GMR Infrastructure Ltd. | 3,050,621 | 3,200 |
| Siemens India Ltd. | 567,689 | 3,096 |
^ | Wipro Ltd. ADR | 390,702 | 3,024 |
| Ranbaxy Laboratories Ltd. | 778,281 | 2,705 |
| Aditya Birla Nuvo Ltd. | 239,808 | 2,702 |
| State Bank of India GDR | 52,929 | 2,454 |
| Indiabulls Financial | | |
| Services Ltd. | 1,039,056 | 2,390 |
| Unitech, Ltd. | 2,325,644 | 2,369 |
| Indian Hotels Co. Ltd. | 2,152,155 | 2,048 |
| Dr. Reddy’s | | |
| Laboratories Ltd. ADR | 234,413 | 1,983 |
| Ultratech Cemco Ltd. | 262,141 | 1,922 |
| Tata Communications Ltd. | 45,952 | 1,102 |
| Infosys Technologies Ltd. | | |
| ADR | 5,089 | 149 |
| | | 846,570 |
Indonesia (1.4%) | | |
| PT Telekomunikasi | | |
| Indonesia Tbk | 72,688,179 | 36,365 |
| PT Bumi Resources Tbk | 122,337,552 | 24,411 |
70
Emerging Markets Stock Index Fund
| | | Market |
| | | Value• |
| | Shares | ($000) |
| PT Bank Central | | |
| Asia Tbk | 89,010,224 | 21,572 |
| PT Bank Rakyat | | |
| Indonesia Tbk | 39,989,552 | 12,236 |
| PT Astra | | |
| International Tbk | 14,657,694 | 12,201 |
| PT Perusahaan Gas | | |
| Negara Tbk | 74,900,210 | 9,432 |
| PT Indonesian | | |
| Satellite Corp. Tbk | 17,745,003 | 8,511 |
| PT Unilever | | |
| Indonesia Tbk | 11,451,730 | 7,815 |
| PT Bank Mandiri Tbk | 52,674,024 | 7,556 |
| PT Bank International | | |
| Indonesia Tbk | 158,038,500 | 6,886 |
| PT United Tractors Tbk | 10,921,347 | 3,183 |
| PT Tambang Batubara | | |
| Bukit Asam Tbk | 6,230,286 | 3,129 |
| PT Bank Danamon Tbk | 13,035,058 | 3,089 |
| PT Indofood Sukses | | |
| Makmur Tbk | 31,011,796 | 3,050 |
| PT Semen Gresik Tbk | 11,144,320 | 3,011 |
| PT Indocement Tunggal | | |
| Prakarsa Tbk (Local) | 7,625,149 | 2,500 |
| PT Aneka Tambang Tbk | 26,066,659 | 2,454 |
| PT International Nickel | | |
| Indonesia Tbk | 14,733,650 | 2,343 |
* | PT Indah Kiat Pulp & | | |
| Paper Corp. | 21,667,500 | 1,653 |
| PT Astra Agro Lestari Tbk | 2,970,680 | 1,649 |
* | PT Truba | | |
| Alam Manunggal | | |
| Engineering Tbk | 48,262,767 | 248 |
* | PT Bank Pan | | |
| Indonesia Tbk | | |
| Warrants Exp. 7/10/09 | 7,066,431 | 107 |
| | | 173,401 |
Israel (3.4%) | | |
| Teva Pharmaceutical | | |
| Industries Ltd. | 5,418,628 | 231,079 |
| Israel Chemicals Ltd. | 3,738,144 | 37,702 |
* | Check Point Software | | |
| Technologies Ltd. | 1,280,551 | 25,893 |
| Bank Leumi Le-Israel | 7,291,573 | 19,129 |
| Bank Hapoalim Ltd. | 6,883,479 | 15,587 |
| Partner Communications | | |
| Co. Ltd. | 634,289 | 11,618 |
| Bezeq Israeli | | |
| Telecommunication | | |
| Corp., Ltd. | 7,478,866 | 11,166 |
* | NICE Systems Ltd. | 472,711 | 10,461 |
| Elbit Systems Ltd. | 194,049 | 9,281 |
| Cellcom Israel Ltd. | 268,871 | 7,921 |
| Makhteshim-Agan | | |
| Industries Ltd. | 2,075,383 | 7,859 |
| The Israel Corp. Ltd. | 16,287 | 7,686 |
| | | Market |
| | | Value• |
| | Shares | ($000) |
| United Mizrahi Bank Ltd. | 892,781 | 4,674 |
| Ormat Industries Ltd. | 567,738 | 4,043 |
| Israel Discount Bank Ltd. | 3,609,103 | 3,546 |
| Oil Refineries Ltd. | 6,846,615 | 3,465 |
| Koor Industries Ltd. | 81,197 | 2,765 |
| Discount Investment | | |
| Corp. Ltd. | 225,942 | 2,639 |
| Gazit Globe (1982) Ltd. | 424,518 | 2,314 |
| IDB Development Corp. Ltd. | 183,705 | 2,168 |
| Africa-Israel | | |
| Investments Ltd. | 105,194 | 1,566 |
| Delek Group, Ltd. | 16,782 | 1,096 |
| | | 423,658 |
Malaysia (3.0%) | | |
| Bumiputra-Commerce | | |
| Holdings Bhd. | 17,976,832 | 31,322 |
| Sime Darby Bhd. | 16,716,813 | 29,524 |
| Malayan Banking Bhd. | 17,424,092 | 26,546 |
| Genting Bhd. | 15,884,190 | 20,492 |
| IOI Corp. Bhd. | 23,847,155 | 18,903 |
| Malaysia International | | |
| Shipping Corp., Bhd. | | |
| (Foreign) | 7,899,365 | 18,194 |
| Public Bank Bhd. | 7,562,460 | 17,909 |
| Tenaga Nasional Bhd. | 9,187,746 | 15,617 |
| Resorts World Bhd. | 21,023,710 | 14,844 |
| British American | | |
| Tobacco Bhd. | 1,016,705 | 11,771 |
| Digi.com Bhd. | 2,222,455 | 11,563 |
| YTL Corp., Bhd. | 5,863,562 | 10,342 |
| Petronas Gas Bhd. | 3,573,028 | 9,881 |
* | TM International Bhd. | 7,690,640 | 9,842 |
| PPB Group Bhd. | 3,826,544 | 8,391 |
| PLUS Expressways Bhd. | 10,756,482 | 8,082 |
| Kuala Lumpur | | |
| Kepong Bhd. | 3,434,408 | 8,035 |
| AMMB Holdings Bhd. | 12,895,658 | 7,860 |
| UMW Holdings | | |
| Malaysia Bhd. | 4,742,360 | 7,331 |
| Telekom Malaysia Bhd. | 7,506,440 | 7,101 |
| Berjaya Sports Toto Bhd. | 5,362,456 | 6,651 |
| YTL Power | | |
| International Bhd. | 13,682,527 | 6,447 |
| Hong Leong Bank Bhd. | 3,491,736 | 5,190 |
| Tanjong Public Ltd. Co. | 1,542,036 | 5,175 |
| Gamuda Bhd. | 11,467,288 | 4,903 |
| SP Setia Bhd. | 5,930,952 | 4,700 |
| IJM Corp. Bhd. | 5,486,150 | 3,982 |
| Malaysia Mining Corp., | | |
| Bhd. | 6,603,800 | 3,706 |
| Petronas Dagangan Bhd. | 1,856,200 | 3,515 |
| Bursa Malaysia Bhd. | 2,384,052 | 3,505 |
| KNM Group Bhd. | 20,323,116 | 3,446 |
| Alliance Financial Group | | |
| Bhd. | 6,409,717 | 3,330 |
| RHB Capital Bhd. | 3,281,935 | 2,858 |
71
Emerging Markets Stock Index Fund
| | | Market |
| | | Value• |
| | Shares | ($000) |
* | UEM World Bhd. | 5,154,883 | 2,831 |
| KLCC Property Holdings | | |
| Bhd. | 3,535,100 | 2,708 |
* | Airasia Bhd. | 8,028,648 | 2,586 |
| IGB Corp., Bhd. | 6,704,600 | 2,437 |
| Parkson Holdings, Bhd. | 2,449,095 | 2,323 |
| Hong Leong | | |
| Financial Group Bhd. | 2,028,700 | 2,202 |
| Lafarge Malayan Cement | | |
| Bhd. | 2,632,620 | 2,129 |
| Malaysian Airline System | | |
| Bhd. | 2,433,900 | 1,961 |
| Astro All Asia Networks | | |
| PLC | 2,937,190 | 1,751 |
| Asiatic Development Bhd. | 1,807,700 | 1,609 |
* | IJM Land Corp. Bhd. | | |
| Warrants Exp. 9/11/13 | 437,505 | 22 |
| | | 373,517 |
Mexico (5.1%) | | |
| America Movil SA de | | |
| CV | 127,323,682 | 197,207 |
| Grupo Televisa SA CPO | 17,490,186 | 61,357 |
| Wal-Mart de Mexico SA | 20,872,024 | 56,124 |
| Telefonos de Mexico SA | 44,789,714 | 40,204 |
| Fomento Economico | | |
| Mexicano UBD | 15,178,368 | 38,455 |
| Cemex SA CPO | 50,023,311 | 37,554 |
| Telmex Internacional | | |
| SAB de CV | 46,701,782 | 24,535 |
| Grupo Mexico SA de CV | 27,290,726 | 21,315 |
* | Carso Global Telecom | | |
| SAB de CV | 4,998,518 | 19,112 |
| Grupo Financerio Banorte | | |
| SA de CV | 9,415,030 | 17,246 |
| Grupo Financiero Inbursa, | | |
| SA de CV | 6,188,761 | 16,425 |
| Grupo Elektra SA de CV | 524,205 | 14,136 |
| Kimberly Clark de Mexico | | |
| SA de CV Series A | 3,962,732 | 13,027 |
| Grupo Modelo SA | 3,696,047 | 11,398 |
| Grupo Carso SA de CV | | |
| Series A1 | 4,163,766 | 11,387 |
| Grupo Bimbo SA | 2,082,788 | 9,995 |
| Industrias Penoles SA de | | |
| CV | 714,094 | 6,407 |
| Coca-Cola Femsa SA de | | |
| CV | 1,930,673 | 6,117 |
* | Desarrolladora Homex | | |
| SA de CV | 1,459,690 | 5,614 |
* | URBI Desarrollos Urbanos | | |
| SA de CV | 3,216,493 | 4,824 |
* | Empresas ICA SA de CV | 3,327,723 | 4,784 |
* | Corporacion GEO, SA de | | |
| CV | 3,140,417 | 4,357 |
| Alfa SA de CV Series A | 2,013,231 | 4,168 |
| | | Market |
| | | Value• |
| | Shares | ($000) |
| Grupo Aeroportuario | | |
| del Pacifico SA ADR | 177,067 | 3,235 |
| Grupo Aeroportuario | | |
| del Pacifico SA | 1,638,707 | 2,993 |
| Banco Conpartamos SA | | |
| de CV | 1,738,418 | 2,956 |
* | Axtel, SAB de CV | 3,885,310 | 2,023 |
| Controladora Comercial | | |
| Mexicana SA de CV | | |
| (Units) | 2,501,535 | 690 |
| Cemex SAB de CV ADR | 11,033 | 83 |
| | | 637,728 |
Peru (0.6%) | | |
| Credicorp Ltd. | 468,402 | 18,104 |
| Southern Copper Corp. | | |
| (U.S. Shares) | 1,164,836 | 16,960 |
| Southern Copper Corp. | 769,472 | 11,157 |
| Compania de Minas | | |
| Buenaventura SA | 854,554 | 10,769 |
| Compania Minera Milpo | | |
| SA | 3,702,499 | 5,238 |
| Compania de Minas | | |
| Buenaventura SA ADR | 388,691 | 4,913 |
| Minsur SA | 2,827,565 | 3,347 |
| Volcan Compania | | |
| Minera SA | 3,615,332 | 1,716 |
* | Credicorp Ltd. | 17,368 | 682 |
| | | 72,886 |
Philippines (0.6%) | | |
| Philippine Long Distance | | |
| Telephone Co. | 405,180 | 16,576 |
| Bank of Philippine Islands | 10,647,700 | 8,816 |
| Ayala Corp. | 1,441,366 | 6,935 |
| SM Investments Corp. | 1,340,166 | 5,430 |
| Ayala Land, Inc. | 40,078,550 | 4,862 |
| SM Prime Holdings, Inc. | 27,975,806 | 4,815 |
| Globe Telecom, Inc. | 244,503 | 4,540 |
| Manila Electric Co. | 3,300,832 | 3,986 |
| Banco De Oro | 6,030,291 | 3,346 |
| Jollibee Foods Corp. | 3,042,759 | 2,877 |
| PNOC Energy | | |
| Development Corp. | 42,283,503 | 2,567 |
| Metropolitan Bank & | | |
| Trust Co. | 4,300,210 | 2,276 |
| International Container | | |
| Terminal Services, Inc. | 5,867,826 | 1,703 |
| Megaworld Corp. | 73,180,739 | 1,182 |
| | | 69,911 |
Poland (1.8%) | | |
| Powszechna Kasa | | |
| Oszczednosci Bank | | |
| Polski SA | 3,593,587 | 40,600 |
| Telekomunikacja Polska | | |
| SA | 5,070,315 | 38,312 |
72
Emerging Markets Stock Index Fund
| | | Market |
| | | Value• |
| | Shares | ($000) |
| Bank Polska Kasa Opieki | | |
| Grupa Pekao SA | 839,644 | 38,188 |
| Polski Koncern Naftowy | | |
| SA | 2,355,303 | 24,017 |
| Polish Oil & Gas | 8,530,338 | 10,223 |
| KGHM Polska Miedz SA | 887,655 | 9,853 |
| Bank Zachodni WBK SA | 166,499 | 7,342 |
| Asseco Poland SA | 395,367 | 6,672 |
| TVN SA | 1,178,322 | 5,893 |
* | Globe Trade Centre SA | 926,498 | 5,470 |
* | Getin Holding SA | 2,323,002 | 4,842 |
* | PBG SA | 67,387 | 4,751 |
* | Bank Rozwoju Eksportu | | |
| SA | 66,046 | 4,449 |
| Polimex Mostostal SA | 2,919,002 | 3,234 |
| BIG Bank Gdanski SA | 2,200,950 | 3,130 |
* | Grupa Lotos SA | 388,672 | 2,751 |
* | Cersanit-Krasnystaw SA | 581,184 | 2,727 |
| Orbis SA | 194,706 | 2,662 |
| Agora SA | 319,533 | 2,257 |
* | Echo Investment SA | 2,051,301 | 1,826 |
* | Bioton SA | 12,263,028 | 1,739 |
| Bank Przemyslowo | | |
| Handlowy PBK SA | 68,120 | 1,221 |
| | | 222,159 |
Russia (7.8%) | | |
| OAO Gazprom | | |
| Sponsored ADR | 16,768,867 | 333,920 |
| LUKOIL Sponsored ADR | 3,328,960 | 127,802 |
| Sberbank | 61,310,982 | 67,057 |
| MMC Norilsk Nickel ADR | 6,301,280 | 63,238 |
| Mobile TeleSystems ADR | 1,417,800 | 55,507 |
| OAO | | |
| Vimpel-Communications | | |
| Sponsored ADR | 3,281,322 | 47,579 |
| Rosneft Oil Co. GDR | 9,032,845 | 41,456 |
| Surgutneftegaz OJSC | | |
| ADR | 5,908,325 | 38,196 |
| Uralkali | 5,295,110 | 23,135 |
| Tatneft GDR | 515,607 | 22,585 |
| NovaTek OAO GDR | 541,668 | 21,421 |
| VTB Bank OJSC GDR | 6,534,031 | 20,628 |
| Rostelecom ADR | 456,226 | 16,994 |
| Polyus Gold ADR | 1,094,052 | 12,141 |
| Surgutneftegaz Pfd. | 49,938,991 | 11,708 |
^ | Mechel OAO ADR | 1,063,677 | 9,754 |
* | Pharmstandard-GDR | 515,581 | 8,203 |
* | Hydro OGK | 383,793,137 | 7,087 |
| Sistema JSFC GDR | 740,764 | 5,591 |
| Gazprom Neft | 2,442,010 | 5,569 |
| Novolipetsk Steel GDR | 581,257 | 5,475 |
| Cherepovets MK | | |
| Severstal GDR | 1,482,811 | 5,148 |
* | Wimm-Bill-Dann Foods | | |
| ADR | 116,305 | 5,110 |
* | PIK Group-GDR | 716,976 | 4,301 |
| | | Market |
| | | Value• |
| | Shares | ($000) |
| OAO TMK-GDR | 396,987 | 4,289 |
| OAO Transneft | 11,741 | 3,856 |
| Comstar United | | |
| Telesystems GDR | 1,242,721 | 3,481 |
| Magnitogorsk Iron & | | |
| Steel Works-GDR | 913,694 | 2,705 |
| Sberbank Pfd. | 3,239,785 | 1,463 |
* | TGK-11 | 80,810,231 | 31 |
* | RAO Energy System of | | |
| East OAO Pfd. | 14,263,636 | 28 |
| | | 975,458 |
South Africa (7.6%) | | |
| MTN Group Ltd. | 11,212,054 | 125,902 |
| Sasol Ltd. | 4,250,515 | 125,466 |
| Standard Bank | | |
| Group Ltd. | 8,095,473 | 64,280 |
| Naspers Ltd. | 2,706,087 | 45,052 |
| Impala Platinum | | |
| Holdings Ltd. | 3,790,379 | 39,563 |
| AngloGold Ltd. | 1,955,266 | 37,156 |
| British American | | |
| Tobacco PLC ZAR Line | 1,296,524 | 35,309 |
| Gold Fields Ltd. | 4,389,518 | 30,558 |
| FirstRand Ltd. | 19,917,654 | 28,934 |
| Sanlan Ltd. | 15,001,046 | 24,618 |
| Remgro Ltd. | 3,215,083 | 23,641 |
| ABSA Group Ltd. | 2,158,929 | 22,588 |
| Telkom South Africa Ltd. | 2,024,179 | 21,969 |
| Anglo Platinum Ltd. | 504,539 | 20,847 |
| Bidvest Group Ltd. | 1,834,442 | 19,565 |
* | Harmony Gold | | |
| Mining Co., Ltd. | 2,419,671 | 17,697 |
| Tiger Brands Ltd. | 1,164,925 | 16,888 |
| Shoprite Holdings Ltd. | 3,073,935 | 16,226 |
| African Bank | | |
| Investments Ltd. | 5,410,902 | 14,836 |
| Nedbank Group Ltd. | 1,493,754 | 14,500 |
| Murray & Roberts | | |
| Holdings Ltd. | 2,104,377 | 14,247 |
| Aveng Ltd. | 2,841,443 | 14,048 |
| ArcelorMittal | | |
| South Africa, Ltd. | 1,426,348 | 13,482 |
| Massmart Holdings Ltd. | 1,428,607 | 12,815 |
| RMB Holdings Ltd. | 5,115,619 | 11,922 |
| Pretoria Portland | | |
| Cement Co. Ltd. | 3,851,748 | 11,857 |
| Steinhoff International | | |
| Holdings Ltd. | 7,592,727 | 11,068 |
| Truworths | | |
| International Ltd. | 3,063,899 | 10,409 |
| Sappi Ltd. | 1,552,879 | 9,573 |
| African Rainbow | | |
| Minerals Ltd. | 818,497 | 8,375 |
| Barloworld Ltd. | 1,430,713 | 8,360 |
| Kumba Iron Ore Ltd. | 568,627 | 7,488 |
| Imperial Holdings Ltd. | 1,185,254 | 6,768 |
73
Emerging Markets Stock Index Fund
| | | Market |
| | | Value• |
| | Shares | ($000) |
| Investec Ltd. | 1,366,783 | 6,743 |
| Woolworths Holdings Ltd. | 5,818,582 | 6,717 |
* | Aspen Pharmacare | | |
| Holdings Ltd. | 1,836,684 | 6,424 |
| Reunert Ltd. | 1,263,511 | 6,375 |
| Foschini Ltd. | 1,539,943 | 6,335 |
| Exxaro Resources Ltd. | 879,424 | 5,805 |
| Network Healthcare | | |
| Holdings Ltd. | 7,877,570 | 5,533 |
| Liberty Group Ltd. | 814,082 | 5,119 |
| Pick’n Pay Stores Ltd. | 1,610,718 | 5,092 |
| Northam Platinum Ltd. | 930,049 | 2,923 |
| Reinet Investments | | |
| SCA ZAR Line | 2,033,857 | 2,580 |
| | | 945,653 |
South Korea (13.6%) | | |
| Samsung | | |
| Electronics Co., Ltd. | 636,904 | 268,521 |
| POSCO | 259,043 | 71,348 |
2 | Samsung | | |
| Electronics Co., Ltd. GDR | 289,516 | 59,771 |
| KT & G Corp. | 794,870 | 51,018 |
^ | Hyundai Motor Co., Ltd. | 1,086,598 | 50,210 |
^ | LG Electronics Inc. | 663,704 | 49,553 |
| POSCO ADR | 691,188 | 46,441 |
| Shinhan Financial | | |
| Group Co. Ltd. | 1,834,459 | 44,630 |
* | KB Financial Group, Inc. | 1,670,634 | 41,412 |
^ | Hyundai Heavy | | |
| Industries Co., Inc. | 294,730 | 38,937 |
| Samsung | | |
| Electronics Co., Ltd. Pfd. | 144,894 | 38,051 |
| Samsung Fire & | | |
| Marine Insurance Co. | 269,627 | 35,711 |
| Shinsegae Co., Ltd. | 99,711 | 34,997 |
| Samsung Corp. | 935,193 | 29,966 |
* | NHN Corp. | 274,076 | 29,168 |
| SK Telecom Co., Ltd. | 169,251 | 26,863 |
| LG Corp. | 668,042 | 26,737 |
| SK Energy Co., Ltd. | 422,929 | 24,331 |
| Korea Electric Power Corp. | 1,207,311 | 23,990 |
| Hyundai Mobis | 400,387 | 23,515 |
| LG. Philips LCD Co., Ltd. | 1,258,496 | 23,333 |
| LG Chem Ltd. | 370,410 | 22,487 |
*,^ | Hynix Semiconductor Inc. | 2,261,950 | 19,379 |
^ | Samsung | | |
| Securities Co. Ltd. | 358,087 | 18,212 |
| KT Corp. | 700,674 | 17,836 |
* | KB Financial Group, Inc. | 718,877 | 17,692 |
| SK Telecom Co., Ltd. ADR | 1,022,354 | 17,595 |
^ | Samsung Heavy | | |
| Industries Co., Ltd. | 1,139,260 | 17,545 |
| SK Holdings Co Ltd | 247,241 | 16,583 |
^ | S-Oil Corp. | 321,704 | 16,299 |
^ | Hyundai Engineering & | | |
| Construction Co., Ltd. | 352,293 | 14,465 |
| | | Market |
| | | Value• |
| | Shares | ($000) |
| Hana Financial Group Inc. | 910,460 | 14,459 |
^ | DC Chemical Co., Ltd. | 86,337 | 14,120 |
| Shinhan Financial | | |
| Group Co., Ltd. ADR | 271,963 | 13,527 |
*,^ | Samsung SDI Co. Ltd. | 240,876 | 13,525 |
^ | Samsung | | |
| Electro-Mechanics Co. | 420,878 | 12,396 |
| Korea Electric Power Corp. | | |
| ADR | 1,237,534 | 12,252 |
* | Korea Telecom Freetel | 553,389 | 11,604 |
| Hyundai Steel Co. | 399,098 | 11,579 |
| Hyundai Development Co. | 424,886 | 11,498 |
*,^ | Kia Motors | 1,339,474 | 11,284 |
^ | GS Engineering & | | |
| Construction Corp. | 232,546 | 11,045 |
| Cheil Industrial, Inc. | 333,011 | 10,869 |
| Korea Exchange Bank | 1,849,560 | 10,288 |
^ | Amorepacific Corp. | 22,524 | 9,900 |
| Lotte Shopping Co., Ltd. | 71,617 | 9,798 |
^ | Doosan Heavy Industries | | |
| and Construction Co., Ltd. | 220,748 | 9,728 |
| LG Household & | | |
| Health Care Ltd. | 65,941 | 9,420 |
| Woori Finance | | |
| Holdings Co., Ltd. | 1,696,480 | 9,104 |
| Samsung Engineering | | |
| Co., Ltd. | 223,527 | 8,940 |
^ | Daewoo Engineering & | | |
| Construction Co., Ltd. | 1,265,914 | 8,787 |
| Daewoo Securities | | |
| Co., Ltd. | 893,520 | 8,498 |
^ | Mirae Asset Securities | | |
| Co., Ltd. | 160,130 | 7,998 |
^ | Samsung Techwin | | |
| Co., Ltd. | 377,084 | 7,993 |
| Kangwon Land Inc. | 757,938 | 7,757 |
| Industrial Bank of Korea | 1,328,690 | 7,638 |
| GS Holdings Corp. | 371,318 | 7,412 |
| Hyundai Mipo Dockyard | | |
| Co., Ltd. | 84,101 | 7,221 |
| Kumkang Korea Chemical | | |
| Co., Ltd. | 36,888 | 7,198 |
| Korean Air Co. Ltd. | 251,134 | 7,107 |
| LG Telecom Ltd. | 994,245 | 7,087 |
| Woongjin Coway Co., Ltd. | 341,069 | 7,018 |
| KT Corp. ADR | 524,012 | 6,576 |
^ | Samsung Card Co. Ltd. | 270,020 | 6,372 |
| Daewoo Shipbuilding & | | |
| Marine Engineering | | |
| Co., Ltd. | 670,512 | 6,317 |
| Hankook Tire Co. Ltd. | 639,586 | 6,191 |
| Korea Gas Corp. | 164,212 | 6,184 |
* | CJ Cheiljedang Corp. | 51,707 | 6,021 |
^ | Hyundai Securities Co. | 966,271 | 5,927 |
| Korea Investment Holdings | | |
| Co., Ltd. | 280,752 | 5,761 |
74
Emerging Markets Stock Index Fund
| | | Market |
| | | Value• |
| | Shares | ($000) |
| Daelim Industrial Co. | 196,093 | 5,661 |
^ | Woori Investment & | | |
| Securities Co., Ltd. | 603,191 | 5,635 |
^ | Hanjin Shipping Co., Ltd. | 417,070 | 5,486 |
| LS Cable Ltd. | 121,859 | 5,147 |
*,^ | STX Pan Ocean Co., Ltd. | 7,246,600 | 5,119 |
*,^ | Doosan Corp. | 70,318 | 5,100 |
| Hanwha Corp. | 319,826 | 5,012 |
| Hyundai Department | | |
| Store Co., Ltd. | 101,944 | 4,982 |
* | Hite Brewery Co., Ltd. | 36,109 | 4,825 |
| Pusan Bank | 887,699 | 4,535 |
| Daegu Bank | 891,295 | 4,532 |
^ | Doosan Infracore Co., Ltd. | 517,782 | 4,410 |
| Dongkuk Steel Mill | | |
| Co., Ltd. | 265,032 | 4,310 |
| Lotte Confectionery | | |
| Co., Ltd. | 5,008 | 4,274 |
| Honam Petrochemical Corp. | 103,635 | 4,242 |
| LG Dacom Corp. | 294,480 | 4,163 |
| S1 Corp. | 120,480 | 4,095 |
^ | Hyosung Corp. | 168,879 | 4,023 |
| Hyundai Motor Co., Ltd. | | |
| 2nd Pfd. | 259,077 | 3,906 |
| Daewoo International Corp. | 338,347 | 3,751 |
^ | STX Shipbuilding Co., Ltd. | 321,357 | 3,716 |
* | SK Networks Co., Ltd. | 506,680 | 3,225 |
| LG Electronics Inc. Pfd. | 119,679 | 3,198 |
^ | Hanjin Heavy Industries | | |
| & Construction Co., Ltd. | 223,327 | 3,177 |
^ | Korea Zinc Co., Ltd. | 62,079 | 3,111 |
| Korea Line Corp. | 47,877 | 2,568 |
| Dongbu Insurance Co., Ltd. | 245,292 | 2,497 |
| Taihan Electric Wire | | |
| Co., Ltd. | 173,872 | 2,478 |
| Hanwha Chemical Corp. | 536,770 | 2,329 |
| Tong Yang Investment Bank | 549,484 | 2,266 |
^ | Kumho Industrial Co., Ltd. | 167,783 | 1,535 |
| | | 1,696,303 |
Taiwan (11.5%) | | |
| Taiwan Semiconductor | | |
| Manufacturing | | |
| Co., Ltd. | 108,283,231 | 157,558 |
| Hon Hai Precision | | |
| Industry Co., Ltd. | 39,926,812 | 96,371 |
| Taiwan Semiconductor | | |
| Manufacturing Co., Ltd. | | |
| ADR | 7,086,817 | 58,537 |
| MediaTek Inc. | 6,174,057 | 55,291 |
| Chunghwa Telecom | | |
| Co., Ltd. | 30,620,142 | 50,662 |
| High Tech | | |
| Computer Corp. | 4,119,436 | 48,829 |
| Nan Ya Plastic Corp. | 34,324,291 | 47,569 |
| China Steel Corp. | 65,047,369 | 46,977 |
| Formosa Plastic Corp. | 27,743,289 | 46,820 |
| | | Market |
| | | Value• |
| | Shares | ($000) |
| Cathay Financial | | |
| Holding Co. | 40,508,202 | 43,505 |
| Asustek Computer Inc. | 25,605,898 | 36,677 |
| Formosa Chemicals & | | |
| Fibre Corp. | 19,166,276 | 30,984 |
| AU Optronics Corp. | 38,658,737 | 26,994 |
| Delta Electronics Inc. | 10,441,535 | 23,696 |
| Acer Inc. | 17,422,737 | 22,473 |
| United | | |
| Microelectronics Corp. | 71,242,970 | 19,562 |
| Fuhwa Financial | | |
| Holdings Co., Ltd. | 49,522,773 | 19,374 |
| Formosa | | |
| Petrochemical Corp. | 8,377,000 | 19,139 |
| Compal Electronics Inc. | 25,620,501 | 18,389 |
| Fubon Financial Holding | | |
| Co., Ltd. | 29,509,100 | 17,898 |
| Uni-President | | |
| Enterprises Co. | 20,631,609 | 17,636 |
| Taiwan Cellular Corp. | 12,425,485 | 17,179 |
| Chinatrust | | |
| Financial Holding | 57,044,153 | 16,295 |
| Siliconware Precision | | |
| Industries Co. | 15,584,860 | 16,087 |
| Mega Financial | | |
| Holding Co. Ltd. | 57,989,224 | 16,043 |
| Chunghwa | | |
| Telecom Co., Ltd. | 899,012 | 14,798 |
| Quanta Computer Inc. | 13,714,401 | 14,436 |
| First Financial Holding | | |
| Co., Ltd. | 30,116,597 | 14,203 |
| China Development | | |
| Financial Holding Corp. | 62,951,785 | 12,373 |
| Hau Nan Financial | | |
| Holdings Co., Ltd. | 22,593,708 | 11,906 |
| Far EasTone | | |
| Telecommunications | | |
| Co., Ltd. | 11,123,043 | 11,786 |
| Taiwan Cooperative Bank | 23,083,450 | 11,093 |
| Chi Mei | | |
| Optoelectronics Corp. | 29,767,999 | 10,951 |
| Far Eastern Textile Ltd. | 18,733,852 | 10,873 |
| Chang Hwa | | |
| Commercial Bank | 26,831,094 | 10,278 |
^ | United Microelectronics | | |
| Corp. ADR | 4,182,987 | 10,248 |
| Advanced | | |
| Semiconductor | | |
| Engineering Inc. | 23,796,400 | 10,133 |
| Taiwan Cement Corp. | 19,641,883 | 10,086 |
| Innolux Display Corp. | 12,755,689 | 9,562 |
| SinoPac Holdings | 42,462,214 | 9,002 |
| Foxconn Technology | | |
| Co., Ltd. | 3,517,313 | 8,619 |
| Lite-On | | |
| Technology Corp. | 13,780,910 | 8,605 |
75
Emerging Markets Stock Index Fund
| | | Market |
| | | Value• |
| | Shares | ($000) |
| Catcher Technology | | |
| Co., Ltd. | 3,358,821 | 8,528 |
| Synnex Technology | | |
| International Corp. | 6,289,201 | 8,164 |
| President Chain | | |
| Store Corp. | 3,475,985 | 8,070 |
| Shin Kong Financial | | |
| Holdings Co. | 28,027,822 | 7,413 |
| Asia Cement Corp. | 12,398,097 | 7,346 |
| AU Optronics Corp. ADR | 1,009,960 | 6,969 |
| Wistron Corp. | 8,651,653 | 6,842 |
| Pou Chen Corp. | 14,279,432 | 6,509 |
| Largan Precision Co., Ltd. | 627,074 | 6,396 |
* | Powerchip | | |
| Semiconductor Corp. | 52,467,716 | 6,139 |
| Taiwan Fertilizer Co., Ltd. | 4,841,000 | 5,974 |
| Cheng Shin Rubber | | |
| Industry Co., Ltd. | 5,290,987 | 5,898 |
| HannStar Display Corp. | 30,893,202 | 5,624 |
| Macronix International | | |
| Co., Ltd. | 19,631,511 | 5,478 |
| Powertech | | |
| Technology Inc. | 3,699,300 | 5,226 |
| Chunghwa Picture | | |
| Tubes, Ltd. | 50,819,331 | 5,149 |
| E.Sun Financial | | |
| Holding Co., Ltd. | 20,807,302 | 4,837 |
* | Tatung Co., Ltd. | 25,960,000 | 4,609 |
| Taishin | | |
| Financial Holdings | 30,803,678 | 4,598 |
| Siliconware Precision | | |
| Industries Co. ADR | 806,911 | 4,551 |
| Realtek | | |
| Semiconductor Corp. | 2,944,710 | 4,417 |
| Walsin Lihwa Corp. | 18,179,970 | 4,216 |
| Epistar Corp. | 3,567,414 | 4,170 |
| Evergreen Marine Corp. | 7,638,879 | 3,925 |
| KGI Securities Co., Ltd. | 16,387,000 | 3,798 |
| Motech Industries Inc. | 1,393,204 | 3,796 |
| RichTek Technology Corp. | 793,600 | 3,744 |
| Novatek | | |
| Microelectronics | | |
| Corp., Ltd. | 3,317,415 | 3,678 |
| U-Ming Marine | | |
| Transport Corp. | 3,116,600 | 3,638 |
| Tung Ho Enterprise Corp. | 5,525,000 | 3,591 |
| Transcend Information Inc. | 2,116,544 | 3,583 |
| Formosa Taffeta Co., Ltd. | 6,042,868 | 3,561 |
| Inventec Co., Ltd. | 10,985,796 | 3,443 |
| Tripod Technology Corp. | 2,807,710 | 3,431 |
| Unimicron | | |
| Technology Corp. | 6,083,754 | 3,375 |
| Wan Hai Lines Ltd. | 7,956,538 | 3,334 |
* | Nanya Technology Corp. | 18,613,397 | 3,305 |
| Polaris Securities | | |
| Co., Ltd. | 14,696,475 | 3,278 |
| | | Market |
| | | Value• |
| | Shares | ($000) |
* | EVA Airways Corp. | 13,303,879 | 3,226 |
| Nan Ya Printed Circuit | | |
| Board Corp. | 1,354,670 | 3,197 |
| Cheng Uei Precision | | |
| Industry Co., Ltd. | 2,309,319 | 3,184 |
| Advantech Co., Ltd. | 2,277,725 | 3,178 |
| Everlight Electronics | | |
| Co., Ltd. | 2,059,812 | 3,113 |
| Teco Electric & | | |
| Machinery Co., Ltd. | 12,879,000 | 3,101 |
| Mitac International Corp. | 8,363,288 | 3,095 |
* | Taiwan Business Bank | 15,175,000 | 2,975 |
| Taiwan Glass | | |
| Industrial Corp. | 6,093,361 | 2,956 |
* | China Airlines | 11,252,246 | 2,693 |
| Sino-American Silicon | | |
| Products, Inc. | 1,272,555 | 2,667 |
* | ProMOS | | |
| Technologies Inc. | 40,405,000 | 2,662 |
* | CMC Magnetics Corp. | 18,990,700 | 2,608 |
| Far Eastern Department | | |
| Stores Ltd. | 5,751,200 | 2,601 |
| Advanced Semiconductor | | |
| Engineering Inc. ADR | 1,195,195 | 2,594 |
| D-Link Corp. | 3,760,013 | 2,574 |
| Wafer Works Corp. | 1,454,067 | 2,496 |
| Yageo Corp. | 15,974,520 | 2,464 |
| Yang Ming | | |
| Marine Transport | 8,922,450 | 2,460 |
| Taiwan Secom Corp., Ltd. | 1,957,846 | 2,404 |
| Eternal Chemical Co., Ltd. | 4,533,996 | 2,368 |
| Qisda Corp. | 9,616,928 | 2,330 |
* | Winbond | | |
| Electronics Corp. | 22,139,000 | 2,303 |
| Pan-International | | |
| Industrial Co., Ltd. | 2,592,650 | 2,254 |
| Yulon Motor Co., Ltd. | 5,418,128 | 2,168 |
| Feng Hsin Iron & | | |
| Steel Co., Ltd. | 3,013,310 | 2,114 |
| Firich Enterprises Co., Ltd. | 813,395 | 2,108 |
| Kinsus Interconnect | | |
| Technology Corp. | 1,838,233 | 2,016 |
| Zinwell Corporation | 1,872,135 | 2,005 |
| Vanguard International | | |
| Semiconductor Corp. | 6,491,396 | 1,919 |
| Wintek Corp. | 7,289,607 | 1,850 |
| Asia Optical Co., Inc. | 1,339,801 | 1,760 |
* | Mosel Vitelic Inc. | 7,176,910 | 1,668 |
* | Via Technologies Inc. | 6,512,379 | 1,577 |
* | Inotera Memories, Inc. | 6,502,620 | 1,556 |
| Inventec Appliances Corp. | 1,589,909 | 1,529 |
| China Motor Co., Ltd. | 4,345,588 | 1,478 |
| Cathay Construction Corp. | 6,286,779 | 1,372 |
| Compal | | |
| Communications, Inc. | 2,051,374 | 1,279 |
76
Emerging Markets Stock Index Fund
| | | Market |
| | | Value• |
| | Shares | ($000) |
| Farglory Land | | |
| Development Co., Ltd | 1,496,000 | 934 |
* | Ya Hsin Industrial | | |
| Co., Ltd. | 5,306,018 | — |
| | | 1,442,936 |
Thailand (1.4%) | | |
| PTT Public Co. Ltd. | | |
| (Foreign) | 6,043,052 | 27,765 |
| PTT Exploration and | | |
| Production Public | | |
| Co. Ltd. (Foreign) | 8,314,873 | 20,797 |
| Kasikornbank Public | | |
| Co. Ltd. (Foreign) | 12,279,319 | 17,861 |
| Bangkok Bank Public | | |
| Co., Ltd. (Foreign) | 6,863,431 | 13,866 |
| Advanced Info Service | | |
| Public Co., Ltd. (Foreign) | 6,233,077 | 13,117 |
| Siam Commercial Bank | | |
| Public Co. Ltd. (Foreign) | 6,963,457 | 10,792 |
| Siam Cement Public | | |
| Co. Ltd. (Foreign) | 2,422,017 | 7,326 |
* | Bangkok Bank Public | | |
| Co., Ltd. (Local) | 3,549,543 | 7,141 |
* | Bank of Ayudhya PLC | | |
| (Local) | 18,940,765 | 5,566 |
| IRPC Public Co., Ltd. | | |
| (Foreign) | 67,767,960 | 4,418 |
| Banpu Public Co. Ltd. | | |
| (Foreign) | 906,575 | 4,340 |
* | Total Access | | |
| Communication Public | | |
| Co. Ltd. | 5,222,682 | 3,733 |
| Thai Oil Public Co., Ltd. | | |
| (Foreign) | 6,004,400 | 3,597 |
| C.P. 7-Eleven Public | | |
| Co. Ltd. (Foreign) | 15,782,900 | 3,484 |
| BEC World Public | | |
| Co. Ltd. (Foreign) | 6,339,530 | 3,034 |
| PTT Chemical Public | | |
| Co., Ltd. (Foreign) | 2,524,733 | 2,536 |
| Krung Thai Bank Public | | |
| Co. Ltd. (Foreign) | 21,466,731 | 2,511 |
* | Siam Cement Public | | |
| Co. Ltd. (Local) | 846,988 | 2,490 |
| PTT Aromatics & | | |
| Refining Public Co. Ltd. | | |
| (Foreign) | 8,530,659 | 2,468 |
| Ratchaburi Electricity | | |
| Generating Holding | | |
| Public Co., Ltd. | 2,757,000 | 2,455 |
* | Thai Military Bank Public | | |
| Co., Ltd. (Foreign) | 148,854,344 | 2,421 |
| Glow Energy Public | | |
| Co. Ltd. (Foreign) | 3,786,300 | 2,180 |
| Land and Houses Public | | |
| Co. Ltd. (Foreign) | 19,489,147 | 2,098 |
| | | Market |
| | | Value• |
| | Shares | ($000) |
* | Banpu Public Co. Ltd. | | |
| (Local) | 391,432 | 1,841 |
| Airports of Thailand | | |
| Public Co. Ltd. (Foreign) | 3,162,956 | 1,732 |
| Central Pattana | | |
| Public Co. Ltd. (Foreign) | 5,007,200 | 1,348 |
* | PTT Public Co., Ltd. (Local) | 108,500 | 498 |
* | Advanced Info Service | | |
| Public Co., Ltd. (Local) | 162,000 | 341 |
* | Siam Commercial Bank | | |
| Public Co. Ltd. (Local) | 146,600 | 227 |
* | Central Pattana Public | | |
| Co. Ltd. (Local) | 457,700 | 123 |
* | Airports of Thailand Public | | |
| Co. Ltd. (Local) | 220,200 | 121 |
* | Glow Energy Public | | |
| Co. Ltd. (Local) | 199,200 | 115 |
* | TMB Bank Public Co., Ltd. | 6,957,000 | 113 |
* | PTT Aromatics & Refining | | |
| Public Co. Ltd. (Local) | 370,000 | 107 |
* | BEC World Public | | |
| Co. Ltd. (Local) | 173,000 | 83 |
* | Krung Thai Bank Public | | |
| Co. Ltd. (Local) | 595,000 | 68 |
| | | 172,713 |
Turkey (1.6%) | | |
* | Turkiye Garanti Bankasi | | |
| A.S. | 15,246,880 | 25,608 |
| Turkcell Iletisim | | |
| Hizmetleri A.S. | 4,703,605 | 23,610 |
| Akbank T.A.S. | 6,573,916 | 22,579 |
| Turkiye Is Bankasi A.S. | | |
| C Shares | 7,108,407 | 20,209 |
| Anadolu Efes Biracilik ve | | |
| Malt Sanayii A.S. | 1,609,697 | 13,629 |
| Eregli Demir ve Celik | | |
| Fabrikalari A.S. | 4,169,634 | 12,853 |
| Tupras-Turkiye Petrol | | |
| Rafinerileri A.S. | 913,140 | 11,531 |
| Haci Omer Sabanci | | |
| Holding A.S. | 3,422,134 | 8,311 |
* | Yapi ve Kredi Bankasi A.S. | 6,323,430 | 8,019 |
* | Turk Telekomunikasyon | | |
| A.S. | 3,786,690 | 8,007 |
| Turkiye Halk Bankasi A.S. | 2,363,378 | 6,467 |
| Enka Insaat ve Sanayi A.S. | 1,723,687 | 6,458 |
* | KOC Holding A.S. | 3,092,397 | 5,770 |
| Turkiye Vakiflar Bankasi | | |
| T.A.O. | 5,763,603 | 5,629 |
* | BIM Birlesik Magazalar | | |
| A.S. | 268,138 | 5,415 |
* | Dogan Sirketler Grubu | | |
| Holding A.S. | 3,693,502 | 2,912 |
* | Asya Katilim Bankasi AS | 3,091,213 | 2,712 |
* | Tekfen Holding A.S. | 886,126 | 2,377 |
* | Coca-Cola Icecek A.S. | 462,467 | 2,217 |
77
Emerging Markets Stock Index Fund
| | | Market |
| | | Value• |
| | Shares | ($000) |
* | Turk Sise ve Cam | | |
| Fabrikalari A.S. | 2,427,982 | 1,974 |
| Aksigorta A.S. | 918,816 | 1,894 |
* | TAV Havalimanlari Holding | | |
| A.S. | 764,759 | 1,859 |
* | Petkim Petrokimya Holding | | |
| A.S. | 642,947 | 1,748 |
| Ford Otomotiv Sanayi A.S. | 487,644 | 1,534 |
| Arcelik A.S. | 923,671 | 1,311 |
| Tofas Turk Otomobil | | |
| Fabrikasi A.S. | 901,701 | 1,054 |
* | Dogan Yayin Holding A.S. | 1,718,602 | 991 |
| Migros Turk A.S. | 1,729 | 19 |
| | | 206,697 |
Total Common Stocks | | |
(Cost $17,143,464) | | 12,449,462 |
Temporary Cash Investments (5.7%)1 | | |
Money Market Fund (5.6%) | | |
3,4 | Vanguard Market | | |
| Liquidity Fund, | | |
| 2.217% | 707,689,488 | 707,689 |
| Face | Market |
| Amount | Value• |
| ($000) | ($000) |
U.S. Agency Obligation (0.1%) | | |
5,6 Federal Home Loan | | |
Mortgage Corp., | | |
2.585%, 11/25/08 | 7,000 | 6,992 |
Total Temporary Cash Investments | | |
(Cost $714,678) | | 714,681 |
Total Investments (105.3%) | | |
(Cost $17,858,142) | | 13,164,143 |
Other Assets and Liabilities (–5.3%) | | |
Other Assets | | 86,454 |
Liabilities4 | | (744,384) |
| | (657,930) |
Net Assets (100%) | | 12,506,213 |
78
Emerging Markets Stock Index Fund
At October 31, 2008, net assets consisted of: | |
| Amount |
| ($000) |
Paid-in Capital | 17,466,201 |
Undistributed Net Investment Income | 540,785 |
Accumulated Net Realized Losses | (807,165) |
Unrealized Appreciation (Depreciation) | |
Investment Securities | (4,693,999) |
Futures Contracts | 1,800 |
Foreign Currencies | (1,409) |
Net Assets | 12,506,213 |
| |
Investor Shares—Net Assets | |
Applicable to 341,400,537 outstanding | |
$.001 par value shares of beneficial | |
interest (unlimited authorization) | 5,345,312 |
Net Asset Value Per Share— | |
Investor Shares | $15.66 |
| |
Admiral Shares—Net Assets | |
Applicable to 73,085,578 outstanding | |
$.001 par value shares of beneficial | |
interest (unlimited authorization) | 1,507,842 |
Net Asset Value Per Share— | |
Admiral Shares | $20.63 |
| |
Signal Shares—Net Assets | |
Applicable to 13,410,668 outstanding | |
$.001 par value shares of beneficial | |
interest (unlimited authorization) | 266,252 |
Net Asset Value Per Share— | |
Signal Shares | $19.85 |
| Amount |
| ($000) |
Institutional Shares—Net Assets | |
Applicable to 56,455,422 outstanding | |
$.001 par value shares of beneficial | |
interest (unlimited authorization) | 887,021 |
Net Asset Value Per Share— | |
Institutional Shares | $15.71 |
| |
ETF Shares—Net Assets | |
Applicable to 181,235,250 outstanding | |
$.001 par value shares of beneficial | |
interest (unlimited authorization) | 4,499,786 |
Net Asset Value Per Share— | |
ETF Shares | $24.83 |
• | See Note A in Notes to Financial Statements. |
* | Non-income-producing security. |
^ | Part of security position is on loan to broker-dealers. The total value of securities on loan is $574,361,000. |
1 The fund invests a portion of its cash reserves in equity markets through the use of index futures contracts. After giving effect to futures investments, the fund’s effective common stock and temporary cash investment positions represent 99.9% and 5.4%, respectively, of net assets.
2 Security exempt from registration under Rule 144A of the Securities Act of 1933. Such securities may be sold in transactions exempt from registration, normally to qualified institutional buyers. At October 31, 2008, the value of this security represented 0.5% of net assets.
3 Affiliated money market fund available only to Vanguard funds and certain trusts and accounts managed by Vanguard. Rate shown is the 7-day yield.
4 Includes $632,927,000 of collateral received for securities on loan.
5 The issuer operates under a congressional charter; its securities are neither issued nor guaranteed by the U.S. government.
6 Securities with a value of $6,992,000 have been segregated as initial margin for open futures contracts.
ADR—American Depositary Receipt.
GDR—Global Depositary Receipt.
See accompanying Notes, which are an integral part of the Financial Statements.
79
Emerging Markets Stock Index Fund
Statement of Operations
| Year Ended |
| October 31, 2008 |
| ($000) |
Investment Income | |
Income | |
Dividends1 | 693,413 |
Interest2 | 973 |
Security Lending | 13,902 |
Total Income | 708,288 |
Expenses | |
The Vanguard Group—Note B | |
Investment Advisory Services | 543 |
Management and Administrative—Investor Shares | 22,714 |
Management and Administrative—Admiral Shares | 2,693 |
Management and Administrative—Signal Shares | 374 |
Management and Administrative—Institutional Shares | 479 |
Management and Administrative—ETF Shares | 5,157 |
Marketing and Distribution—Investor Shares | 2,943 |
Marketing and Distribution—Admiral Shares | 530 |
Marketing and Distribution—Signal Shares | 80 |
Marketing and Distribution—Institutional Shares | 310 |
Marketing and Distribution—ETF Shares | 1,649 |
Custodian Fees | 20,906 |
Auditing Fees | 41 |
Shareholders’ Reports—Investor Shares | 333 |
Shareholders’ Reports—Admiral Shares | 15 |
Shareholders’ Reports—Signal Shares | 4 |
Shareholders’ Reports—Institutional Shares | — |
Shareholders’ Reports—ETF Shares | 223 |
Trustees’ Fees and Expenses | 31 |
Total Expenses | 59,025 |
Expenses Paid Indirectly | (375) |
Net Expenses | 58,650 |
Net Investment Income | 649,638 |
Realized Net Gain (Loss) | |
Investment Securities Sold | 194,432 |
Futures Contracts | (15,502) |
Foreign Currencies | (15,685) |
Realized Net Gain (Loss) | 163,245 |
Change in Unrealized Appreciation (Depreciation) | |
Investment Securities | (16,915,195) |
Futures Contracts | 1,800 |
Foreign Currencies | (2,454) |
Change in Unrealized Appreciation (Depreciation) | (16,915,849) |
Net Increase (Decrease) in Net Assets Resulting from Operations | (16,102,966) |
1 Dividends are net of foreign withholding taxes of $61,493,000.
2 Interest income from an affiliated company of the fund was $796,000.
See accompanying Notes, which are an integral part of the Financial Statements.
80
Emerging Markets Stock Index Fund
Statement of Changes in Net Assets
| Year Ended October 31, |
| 2008 | 2007 |
| ($000) | ($000) |
Increase (Decrease) in Net Assets | | |
Operations | | |
Net Investment Income | 649,638 | 372,700 |
Realized Net Gain (Loss) | 163,245 | 174,147 |
Change in Unrealized Appreciation (Depreciation) | (16,915,849) | 8,817,938 |
Net Increase (Decrease) in Net Assets Resulting from Operations | (16,102,966) | 9,364,785 |
Distributions | | |
Net Investment Income | | |
Investor Shares | (229,894) | (130,073) |
Admiral Shares | (66,571) | (30,176) |
Signal Shares | (8,343) | — |
Institutional Shares | (24,830) | (11,028) |
ETF Shares | (111,980) | (34,662) |
Realized Capital Gain | | |
Investor Shares | — | — |
Admiral Shares | — | — |
Signal Shares | — | — |
Institutional Shares | — | — |
ETF Shares | — | — |
Total Distributions | (441,618) | (205,939) |
Capital Share Transactions | | |
Investor Shares | (954,191) | 1,679,248 |
Admiral Shares | 218,311 | 699,959 |
Signal Shares | 207,807 | 330,912 |
Institutional Shares | 471,828 | 356,607 |
ETF Shares | 3,320,651 | 2,727,702 |
Net Increase (Decrease) from Capital Share Transactions | 3,264,406 | 5,794,428 |
Total Increase (Decrease) | (13,280,178) | 14,953,274 |
Net Assets | | |
Beginning of Period | 25,786,391 | 10,833,117 |
End of Period1 | 12,506,213 | 25,786,391 |
1 Net Assets—End of Period includes undistributed net investment income of $540,785,000 and $344,566,000.
See accompanying Notes, which are an integral part of the Financial Statements.
81
Emerging Markets Stock Index Fund
Financial Highlights
Investor Shares | | | | | |
| | | | | |
For a Share Outstanding | Year Ended October 31, |
Throughout Each Period | 2008 | 2007 | 2006 | 2005 | 2004 |
Net Asset Value, Beginning of Period | $36.78 | $22.05 | $16.91 | $12.88 | $11.04 |
Investment Operations | | | | | |
Net Investment Income | .780 | .6041 | .396 | .307 | .263 |
Net Realized and Unrealized Gain (Loss) | | | | | |
on Investments2 | (21.313) | 14.522 | 5.059 | 3.982 | 1.749 |
Total from Investment Operations | (20.533) | 15.126 | 5.455 | 4.289 | 2.012 |
Distributions | | | | | |
Dividends from Net Investment Income | (.587) | (.396) | (.315) | (.259) | (.172) |
Distributions from Realized Capital Gains | — | — | — | — | — |
Total Distributions | (.587) | (.396) | (.315) | (.259) | (.172) |
Net Asset Value, End of Period | $15.66 | $36.78 | $22.05 | $16.91 | $12.88 |
| | | | | |
Total Return3 | –56.66% | 69.59% | 32.55% | 33.66% | 18.43% |
| | | | | |
Ratios/Supplemental Data | | | | | |
Net Assets, End of Period (Millions) | $5,345 | $14,150 | $7,202 | $4,937 | $2,556 |
Ratio of Total Expenses to | | | | | |
Average Net Assets | 0.32% | 0.37% | 0.42% | 0.45% | 0.48% |
Ratio of Net Investment Income to | | | | | |
Average Net Assets | 2.81% | 2.24% | 2.20% | 2.48% | 2.44% |
Portfolio Turnover Rate4 | 20% | 9% | 26% | 15% | 11% |
1 Calculated based on average shares outstanding.
2 Includes increases from redemption fees of $.02, $.01, $.01, $.00, and $.00.
3 Total returns do not reflect the 0.25% (0.50% prior to June 26, 2008) transaction fee on purchases; the 2% fee assessed until March 23, 2005, on redemptions of shares purchased on or after June 27, 2003, and held for less than two months; the 0.25% (0.50% prior to June 26, 2008) fee on all other redemptions; or the account service fee that may be applicable to certain accounts with balanced below $10,000.
4 Excludes the value of portfolio securities received or delivered as a result of in-kind purchases or redemptions of the fund’s capital shares, including ETF Creation Units.
See accompanying Notes, which are an integral part of the Financial Statements.
82
Emerging Markets Stock Index Fund
Financial Highlights
Admiral Shares | | | |
| | | June 23, |
| | Year Ended | 20061 to |
| October 31, | Oct. 31, |
For a Share Outstanding Throughout Each Period | 2008 | 2007 | 2006 |
Net Asset Value, Beginning of Period | $48.47 | $29.03 | $25.00 |
Investment Operations | | | |
Net Investment Income | 1.079 | .8532 | .222 |
Net Realized and Unrealized Gain (Loss) on Investments3 | (28.099) | 19.121 | 3.808 |
Total from Investment Operations | (27.020) | 19.974 | 4.030 |
Distributions | | | |
Dividends from Net Investment Income | (.820) | (.534) | — |
Distributions from Realized Capital Gains | — | — | — |
Total Distributions | (.820) | (.534) | — |
Net Asset Value, End of Period | $20.63 | $48.47 | $29.03 |
| | | |
Total Return4 | –56.63% | 69.82% | 16.12% |
| | | |
Ratios/Supplemental Data | | | |
Net Assets, End of Period (Millions) | $1,508 | $3,514 | $1,491 |
Ratio of Total Expenses to Average Net Assets | 0.20% | 0.25% | 0.30%5 |
Ratio of Net Investment Income to Average Net Assets | 2.93% | 2.36% | 2.32%5 |
Portfolio Turnover Rate6 | 20% | 9% | 26% |
1 Inception.
2 Calculated based on average shares outstanding.
3 Includes increases from redemption fees of $.03, $.01, and $.01.
4 Total returns do not reflect the 0.25% (0.50% prior to June 26, 2008) transaction fee on purchases and redemptions.
5 Annualized.
6 Excludes the value of portfolio securities received or delivered as a result of in-kind purchases or redemptions of the fund’s capital shares, including ETF Creation Units.
See accompanying Notes, which are an integral part of the Financial Statements.
83
Emerging Markets Stock Index Fund
Financial Highlights
Signal Shares | | |
| Year | Jan. 19, |
| Ended | 20071 to |
| Oct. 31, | Oct. 31, |
For a Share Outstanding Throughout Each Period | 2008 | 2007 |
Net Asset Value, Beginning of Period | $46.61 | $30.38 |
Investment Operations | | |
Net Investment Income | 1.029 | .5802 |
Net Realized and Unrealized Gain (Loss) on Investments3 | (27.029) | 15.650 |
Total from Investment Operations | (26.000) | 16.230 |
Distributions | | |
Dividends from Net Investment Income | (.760) | — |
Distributions from Realized Capital Gains | — | — |
Total Distributions | (.760) | — |
Net Asset Value, End of Period | $19.85 | $46.61 |
| | |
Total Return4 | –56.64% | 53.42% |
| | |
Ratios/Supplemental Data | | |
Net Assets, End of Period (Millions) | $266 | $385 |
Ratio of Total Expenses to Average Net Assets | 0.20% | 0.25%5 |
Ratio of Net Investment Income to Average Net Assets | 2.93% | 2.36%5 |
Portfolio Turnover Rate6 | 20% | 9% |
1 Inception.
2 Calculated based on average shares outstanding.
3 Includes increases from redemption fees of $.02 and $.00.
4 Total returns do not reflect the 0.25% (0.50% prior to June 26, 2008) transaction fee on purchases and redemptions.
5 Annualized.
6 Excludes the value of portfolio securities received or delivered as a result of in-kind purchases or redemptions of the fund’s capital shares, including ETF Creation Units.
See accompanying Notes, which are an integral part of the Financial Statements.
84
Emerging Markets Stock Index Fund
Financial Highlights
Institutional Shares | | | | | |
| | | | | |
For a Share Outstanding | Year Ended October 31, |
Throughout Each Period | 2008 | 2007 | 2006 | 2005 | 2004 |
Net Asset Value, Beginning of Period | $36.90 | $22.11 | $16.95 | $12.90 | $11.05 |
Investment Operations | | | | | |
Net Investment Income | .835 | .6861 | .443 | .344 | .287 |
Net Realized and Unrealized Gain (Loss) | | | | | |
on Investments2 | (21.393) | 14.533 | 5.059 | 3.982 | 1.749 |
Total from Investment Operations | (20.558) | 15.219 | 5.502 | 4.326 | 2.036 |
Distributions | | | | | |
Dividends from Net Investment Income | (.632) | (.429) | (.342) | (.276) | (.186) |
Distributions from Realized Capital Gains | — | — | — | — | — |
Total Distributions | (.632) | (.429) | (.342) | (.276) | (.186) |
Net Asset Value, End of Period | $15.71 | $36.90 | $22.11 | $16.95 | $12.90 |
| | | | | |
Total Return3 | –56.61% | 69.90% | 32.78% | 33.92% | 18.64% |
| | | | | |
Ratios/Supplemental Data | | | | | |
Net Assets, End of Period (Millions) | $887 | $1,463 | $559 | $468 | $245 |
Ratio of Total Expenses to | | | | | |
Average Net Assets | 0.15% | 0.20% | 0.25% | 0.25% | 0.33% |
Ratio of Net Investment Income to | | | | | |
Average Net Assets | 2.98% | 2.41% | 2.37% | 2.64% | 2.61% |
Portfolio Turnover Rate4 | 20% | 9% | 26% | 15% | 11% |
1 Calculated based on average shares outstanding.
2 Includes increases from redemption fees of $.01, $.01, $.01, $.00, and $.00.
3 Total returns do not reflect the 0.25% (0.50% prior to June 26, 2008) transaction fee on purchases; the 2% fee assessed until March 23, 2005, on redemptions of shares purchased on or after June 27, 2003, and held for less than two months; or the 0.25% (0.50% prior to June 26, 2008) fee on all other redemptions.
4 Excludes the value of portfolio securities received or delivered as a result of in-kind purchases or redemptions of the fund’s capital shares, including ETF Creation Units.
See accompanying Notes, which are an integral part of the Financial Statements.
85
Emerging Markets Stock Index Fund
Financial Highlights
ETF Shares | | | | |
| | | | March 4, |
| | | | 20052 to |
| Year Ended October 31, | Oct. 31, |
For a Share Outstanding Throughout Each Period1 | 2008 | 2007 | 2006 | 2005 |
Net Asset Value, Beginning of Period | $58.31 | $34.96 | $26.81 | $25.28 |
Investment Operations | | | | |
Net Investment Income | 1.303 | 1.0653 | .667 | .435 |
Net Realized and Unrealized Gain (Loss) on Investments4 | (33.798) | 22.955 | 8.022 | 1.095 |
Total from Investment Operations | (32.495) | 24.020 | 8.689 | 1.530 |
Distributions | | | | |
Dividends from Net Investment Income | (.985) | (.670) | (.539) | — |
Distributions from Realized Capital Gains | — | — | — | — |
Total Distributions | (.985) | (.670) | (.539) | — |
Net Asset Value, End of Period | $24.83 | $58.31 | $34.96 | $26.81 |
| | | | |
Total Return | –56.62% | 69.78% | 32.74% | 6.05% |
| | | | |
Ratios/Supplemental Data | | | | |
Net Assets, End of Period (Millions) | $4,500 | $6,275 | $1,582 | $375 |
Ratio of Total Expenses to Average Net Assets | 0.20% | 0.25% | 0.30% | 0.30%5 |
Ratio of Net Investment Income to Average Net Assets | 2.93% | 2.36% | 2.32% | 2.59%5 |
Portfolio Turnover Rate6 | 20% | 9% | 26% | 15% |
1 Adjusted to reflect a 2-for-1 share split as of the close of business on June 13, 2008.
2 Inception.
3 Calculated based on average shares outstanding.
4 Includes increases from redemption fees of $.02, $.03, $.03, and $.00.
5 Annualized.
6 Excludes the value of portfolio securities received or delivered as a result of in-kind purchases or redemptions of the fund’s capital shares, including ETF Creation Units.
See accompanying Notes, which are an integral part of the Financial Statements.
86
Emerging Markets Stock Index Fund
Notes to Financial Statements
Vanguard Emerging Markets Stock Index Fund is registered under the Investment Company Act of 1940 as an open-end investment company, or mutual fund. The fund invests in securities of foreign issuers, which may subject it to investment risks not normally associated with investing in securities of U.S. corporations. The fund offers five classes of shares: Investor Shares, Admiral Shares, Signal Shares, Institutional Shares, and ETF Shares. Investor Shares are available to any investor who meets the fund’s minimum purchase requirements. Admiral Shares are designed for investors who meet certain administrative, service, tenure, and account-size criteria. Signal Shares are designed for institutional investors who meet certain administrative, service, and account-size criteria. Institutional Shares are designed for investors who meet certain administrative and service criteria and invest a minimum of $5 million. ETF Shares are listed for trading on the NYSE Arca, Inc.; they can be purchased and sold through a broker.
A. The following significant accounting policies conform to generally accepted accounting principles for U.S. mutual funds. The fund consistently follows such policies in preparing its financial statements.
1. Security Valuation: Securities are valued as of the close of trading on the New York Stock Exchange (generally 4 p.m., Eastern time) on the valuation date. Equity securities are valued at the latest quoted sales prices or official closing prices taken from the primary market in which each security trades; such securities not traded on the valuation date are valued at the mean of the latest quoted bid and asked prices. Securities for which market quotations are not readily available, or whose values have been affected by events occurring before the fund’s pricing time but after the close of the securities’ primary markets, are valued at their fair values calculated according to procedures adopted by the board of trustees. These procedures include obtaining quotations from an independent pricing service, monitoring news to identify significant market- or security-specific events, and evaluating changes in the values of foreign market proxies (for example, ADRs, futures contracts, or exchange-traded funds), between the time the foreign markets close and the fund’s pricing time. When fair-value pricing is employed, the prices of securities used by a fund to calculate its net asset value may differ from quoted or published prices for the same securities. Investments in Vanguard Market Liquidity Fund are valued at that fund’s net asset value. Temporary cash investments acquired over 60 days to maturity are valued using the latest bid prices or using valuations based on a matrix system (which considers such factors as security prices, yields, maturities, and ratings), both as furnished by independent pricing services. Other temporary cash investments are valued at amortized cost, which approximates market value.
2. Foreign Currency: Securities and other assets and liabilities denominated in foreign currencies are translated into U.S. dollars using exchange rates obtained from an independent third party as of the fund’s pricing time on the valuation date. Realized gains (losses) and unrealized appreciation (depreciation) on investment securities include the effects of changes in exchange rates since the securities were purchased, combined with the effects of changes in security prices. Fluctuations in the value of other assets and liabilities resulting from changes in exchange rates are recorded as unrealized foreign currency gains (losses) until the assets or liabilities are settled in cash, at which time they are recorded as realized foreign currency gains (losses).
3. Futures Contracts: The fund uses index futures contracts to a limited extent, with the objectives of maintaining full exposure to the stock market, enhancing returns, maintaining liquidity, and minimizing transaction costs. The fund may purchase futures contracts to immediately invest incoming cash in the market, or sell futures in response to cash outflows, thereby simulating a fully invested position in the underlying index while maintaining a cash balance for liquidity. The fund may seek to enhance returns by using futures contracts instead of the underlying securities when futures are believed to be priced more attractively than the underlying securities. The primary risks associated with the use of futures contracts are imperfect correlation between changes in market values of stocks held by the fund and the prices of futures contracts, and the possibility of an illiquid market.
87
Emerging Markets Stock Index Fund
Futures contracts are valued at their quoted daily settlement prices. The aggregate principal amounts of the contracts are not recorded in the Statement of Net Assets. Fluctuations in the value of the contracts are recorded in the Statement of Net Assets as an asset (liability) and in the Statement of Operations as unrealized appreciation (depreciation) until the contracts are closed, when they are recorded as realized futures gains (losses).
4. Federal Income Taxes: The fund intends to continue to qualify as a regulated investment company and distribute all of its taxable income. Management has analyzed the fund’s tax positions taken on federal income tax returns for all open tax years (tax years ended October 31, 2005–2008), and has concluded that no provision for federal income tax is required in the fund’s financial statements.
5. Distributions: Distributions to shareholders are recorded on the ex-dividend date.
6. Security Lending: The fund may lend its securities to qualified institutional borrowers to earn additional income. Security loans are required to be secured at all times by collateral at least equal to the market value of securities loaned. The fund invests cash collateral received in Vanguard Market Liquidity Fund, and records a liability for the return of the collateral, during the period the securities are on loan. Security lending income represents the income earned on investing cash collateral, less expenses associated with the loan.
7. Other: Dividend income is recorded on the ex-dividend date. Interest income includes income distributions received from Vanguard Market Liquidity Fund and is accrued daily. Security transactions are accounted for on the date securities are bought or sold. Costs used to determine realized gains (losses) on the sale of investment securities are those of the specific securities sold. Fees assessed on capital share transactions are credited to paid-in capital.
Each class of shares has equal rights as to assets and earnings, except that each class separately bears certain class-specific expenses related to maintenance of shareholder accounts (included in Management and Administrative expenses) and shareholder reporting. Marketing and distribution expenses are allocated to each class of shares based on a method approved by the board of trustees. Income, other non-class-specific expenses, and gains and losses on investments are allocated to each class of shares based on its relative net assets.
B. The Vanguard Group furnishes at cost investment advisory, corporate management, administrative, marketing, and distribution services. The costs of such services are allocated to the fund under methods approved by the board of trustees. The fund has committed to provide up to 0.40% of its net assets in capital contributions to Vanguard. At October 31, 2008, the fund had contributed capital of $1,567,000 to Vanguard (included in Other Assets), representing 0.01% of the fund’s net assets and 1.57% of Vanguard’s capitalization. The fund’s trustees and officers are also directors and officers of Vanguard.
C. The fund’s custodian bank has agreed to reduce its fees when the fund maintains cash on deposit in the non-interest-bearing custody account. For the year ended October 31, 2008, custodian fee offset arrangements reduced the fund’s expenses by $375,000.
D. Distributions are determined on a tax basis and may differ from net investment income and realized capital gains for financial reporting purposes. Differences may be permanent or temporary. Permanent differences are reclassified among capital accounts in the financial statements to reflect their tax character. Temporary differences arise when certain items of income, expense, gain, or loss are recognized in different periods for financial statement and tax purposes; these differences will reverse at some time in the future. Differences in classification may also result from the treatment of short-term gains as ordinary income for tax purposes.
88
Emerging Markets Stock Index Fund
During the year ended October 31, 2008, the fund realized net foreign currency losses of $15,685,000, which decreased distributable net income for tax purposes; accordingly, such losses have been reclassified from accumulated net realized losses to undistributed net investment income. The fund’s realized losses for the year ended October 31, 2008, include a refund for taxes paid on Indian securities of $67,000, which is treated as an increase to taxable income; accordingly, this amount has been reclassified from accumulated net realized losses to undistributed net investment income.
Certain of the fund’s investments are in securities considered to be “passive foreign investment companies,” for which any unrealized appreciation and/or realized gains are required to be included in distributable net income for tax purposes. During the year ended October 31, 2008, the fund realized gains on the sale of passive foreign investment companies of $3,817,000, which have been included in current and prior periods’ taxable income; accordingly, such gains have been reclassified from accumulated net realized losses to undistributed net investment income. Unrealized appreciation of $41,815,000 on the fund’s passive foreign investment company holdings at October 31, 2007, has been distributed and is reflected in the balance of undistributed net investment income. Since October 31, 2007, the fund’s passive foreign investment company holdings have depreciated in value, reducing the amount of taxable income available for distribution as of October 31, 2008 by $38,708,000. Unrealized appreciation on the fund’s passive foreign investment company holdings at October 31, 2008, was $3,107,000.
During the year ended October 31, 2008, the fund realized $795,501,000 of net capital gains resulting from in-kind redemptions—in which shareholders exchanged fund shares for securities held by the fund rather than for cash. Because such gains are not taxable to the fund, and are not distributed to shareholders, they have been reclassified from accumulated net realized losses to paid-in capital.
For tax purposes, at October 31, 2008, the fund had $562,586,000 of ordinary income available for distribution. The fund had available realized losses of $643,327,000 to offset future net capital gains of $15,143,000 through October 31, 2012, $167,331,000 through October 31, 2014, and $460,853,000 through October 31, 2016.
At October 31, 2008, the cost of investment securities for tax purposes was $18,025,084,000. Net unrealized depreciation of investment securities for tax purposes was $4,860,941,000, consisting of unrealized gains of $1,104,758,000 on securities that had risen in value since their purchase and $5,965,699,000 in unrealized losses on securities that had fallen in value since their purchase.
At October 31, 2008, the aggregate settlement value of open futures contracts expiring in November 2008 and the related unrealized appreciation (depreciation) were:
| | | ($000) |
| Number of | Aggregate | Unrealized |
| Long (Short) | Settlement | Appreciation |
Futures Contracts | Contracts | Value | (Depreciation) |
MSCI Taiwan Index | 1,800 | 33,606 | 1,800 |
The fund had net unrealized foreign currency losses of $1,409,000 resulting from the translation of other assets and liabilities at October 31, 2008.
E. During the year ended October 31, 2008, the fund purchased $9,315,325,000 of investment securities and sold $5,904,943,000 of investment securities, other than temporary cash investments.
89
Emerging Markets Stock Index Fund
F. Capital share transactions for each class of shares were:
| | | Year Ended October 31, |
| | 2008 | | 2007 |
| Amount | Shares | Amount | Shares |
| ($000) | (000) | ($000) | (000) |
Investor Shares | | | | |
Issued | 3,872,977 | 135,857 | 3,408,393 | 122,527 |
Issued in Lieu of Cash Distributions | 222,748 | 6,777 | 123,741 | 5,215 |
Redeemed1 | (5,049,916) | (185,897) | (1,852,886) | (69,648) |
Net Increase (Decrease)—Investor Shares | (954,191) | (43,263) | 1,679,248 | 58,094 |
Admiral Shares | | | | |
Issued | 997,071 | 24,577 | 1,276,261 | 35,934 |
Issued in Lieu of Cash Distributions | 58,820 | 1,359 | 26,534 | 849 |
Redeemed1 | (837,580) | (25,354) | (602,836) | (15,634) |
Net Increase (Decrease)—Admiral Shares | 218,311 | 582 | 699,959 | 21,149 |
Signal Shares | | | | |
Issued | 301,803 | 8,027 | 340,696 | 8,511 |
Issued in Lieu of Cash Distributions | 7,172 | 172 | — | — |
Redeemed1 | (101,168) | (3,051) | (9,784) | (248) |
Net Increase (Decrease)—Signal Shares | 207,807 | 5,148 | 330,912 | 8,263 |
Institutional Shares | | | | |
Issued | 650,503 | 24,200 | 515,085 | 20,056 |
Issued in Lieu of Cash Distributions | 16,639 | 505 | 9,287 | 391 |
Redeemed1 | (195,314) | (7,891) | (167,765) | (6,075) |
Net Increase (Decrease)—Institutional Shares | 471,828 | 16,814 | 356,607 | 14,372 |
ETF Shares2 | | | | |
Issued | 3,410,974 | 76,025 | 2,751,033 | 62,762 |
Issued in Lieu of Cash Distributions | — | — | — | — |
Redeemed1 | (90,323) | (2,400) | (23,331) | (400) |
Net Increase (Decrease)—ETF Shares | 3,320,651 | 73,625 | 2,727,702 | 62,362 |
1 Net of redemption fees of $14,015,000 and $7,194,000 (fund totals).
2 Shares adjusted to reflect a 2-for-1 split as of the close of business on June 13, 2008.
90
Emerging Markets Stock Index Fund
G. In September 2006, the Financial Accounting Standards Board issued Statement of Financial Accounting Standards No. 157 (“FAS 157”), “Fair Value Measurements.” FAS 157 establishes a framework for measuring fair value and expands disclosures about fair value measurements in financial statements.
The various inputs that may be used to determine the value of the fund’s investments are summarized in three broad levels. The inputs or methodologies used for valuing securities are not necessarily an indication of the risk associated with investing in those securities.
Level 1—Quoted prices in active markets for identical securities.
Level 2—Other significant observable inputs (including quoted prices for similar securities, interest rates, prepayment speeds, credit risk, etc.).
Level 3—Significant unobservable inputs (including the fund’s own assumptions used to determine the fair value of investments).
The following table summarizes the fund’s investments as of October 31, 2008, based on the inputs used to value them:
| Investments | Futures |
| in Securities | Contracts |
Valuation Inputs | ($000) | ($000) |
Level 1—Quoted prices | 3,813,389 | 1,800 |
Level 2—Other significant observable inputs | 9,350,754 | — |
Level 3—Significant unobservable inputs | — | — |
Total | 13,164,143 | 1,800 |
91
Developed Markets Index Fund
Fund Profile
As of October 31, 2008
Portfolio Characteristics | |
| Fund |
Acquired Fund Fees and | |
Expenses (10/31/2007)1 | 0.22% |
Sector Diversification (% of equity exposure) |
| | Target | Broad |
| Fund2 | Index3 | Index4 |
Consumer Discretionary | 10.5% | 10.6% | 9.0% |
Consumer Staples | 10.2 | 10.1 | 9.9 |
Energy | 9.1 | 8.9 | 12.0 |
Financials | 23.4 | 23.6 | 21.4 |
Health Care | 9.9 | 9.7 | 9.7 |
Industrials | 10.5 | 10.7 | 10.0 |
Information Technology | 4.8 | 5.0 | 9.1 |
Materials | 8.0 | 8.0 | 7.4 |
Telecommunication | | | |
Services | 6.3 | 6.2 | 6.0 |
Utilities | 7.3 | 7.2 | 5.5 |
Volatility Measures5 | |
| Fund Versus | Fund Versus |
| Target Index3 | Broad Index4 |
R-Squared | 0.98 | 0.97 |
Beta | 0.97 | 0.88 |
Allocation to Underlying Vanguard Funds | |
| |
European Stock Index Fund Investor Shares | 67.0% |
Pacific Stock Index Fund Investor Shares | 33.0 |
Market Diversification (% of equity exposure) |
| | Target |
| Fund2 | Index3 |
United Kingdom | 21.9% | 22.0% |
Japan | 21.7 | 23.6 |
France | 11.1 | 10.7 |
Germany | 9.1 | 8.7 |
Switzerland | 8.9 | 8.5 |
Australia | 5.4 | 5.9 |
Spain | 4.2 | 4.0 |
Italy | 3.7 | 3.6 |
Netherlands | 3.4 | 2.4 |
Sweden | 2.0 | 2.0 |
Hong Kong | 1.9 | 2.0 |
Finland | 1.5 | 1.5 |
Singapore | 1.0 | 1.0 |
Other Developed Markets | 4.2 | 4.1 |
1 This figure—drawn from the prospectus dated October 14, 2008—represents a weighted average of the annualized expense ratios and any transaction fees charged by the underlying mutual funds (the “acquired” funds) in which the Developed Markets Index Fund invests. The Developed Markets Index Fund does not charge any expenses or fees of its own. For the fiscal year ended October 31, 2008, the acquired fund fees and expenses figure was 0.22%.
2 Reflects holdings of underlying funds.
3 MSCI EAFE Index.
4 MSCI All Country World Index ex USA.
5 For an explanation of R-squared, beta, and other terms used here, see the Glossary.
92
Developed Markets Index Fund
Performance Summary
All of the returns in this report represent past performance, which is not a guarantee of future results that may be achieved by the fund. (Current performance may be lower or higher than the performance data cited. For performance data current to the most recent month-end, visit our website at www.vanguard.com/performance.) Note, too, that both investment returns and principal value can fluctuate widely, so an investor’s shares, when sold, could be worth more or less than their original cost. The returns shown do not reflect taxes that a shareholder would pay on fund distributions or on the sale of fund shares.
Cumulative Performance: May 8, 2000–October 31, 2008
Initial Investment of $10,000

| Average Annual Total Returns | |
| Periods Ended October 31, 2008 | Final Value of |
| | | Since | a $10,000 |
| One Year | Five Years | Inception1 | Investment |
Developed Markets Index Fund2 | –46.24% | 3.84% | –0.97% | $9,204 |
MSCI All Country World Index ex USA | –48.27 | 5.05 | 0.31 | 10,265 |
MSCI EAFE Index | –46.62 | 3.60 | –1.12 | 9,092 |
Average International Fund3 | –47.97 | 2.81 | –1.92 | 8,488 |
1 Performance for the fund and its comparative standards is calculated since the fund’s inception: May 8, 2000.
2 Total returns do not reflect the 2% fee assessed on redemptions of shares purchased on or after June 27, 2003, and held for less than two months, or the account service fee that may be applicable to certain accounts with balances below $10,000.
3 Derived from data provided by Lipper Inc.
93
Developed Markets Index Fund
Fiscal-Year Total Returns (%): May 8, 2000–October 31, 2008

Average Annual Total Returns: Periods Ended September 30, 2008
This table presents average annual total returns through the latest calendar quarter—rather than through the end of the fiscal period. Securities and Exchange Commission rules require that we provide this information.
| | | | Since |
| Inception Date | One Year | Five Years | Inception |
Developed Markets Index Fund1 | 5/8/2000 | –29.17% | 10.10% | 1.80% |
1 Total returns do not reflect the 2% fee assessed on redemptions of shares purchased on or after June 27, 2003, and held for less than two months, or the account service fee that may be applicable to certain accounts with balances below $10,000.
Note: See Financial Highlights table for dividend and capital gains information.
94
Developed Markets Index Fund
Financial Statements
Statement of Net Assets
As of October 31, 2008
The fund provides a complete list of its holdings four times in each fiscal year, at the quarter-ends. For the second and fourth fiscal quarters, the lists appear in the fund’s semiannual and annual reports to shareholders. For the first and third fiscal quarters, the fund files the lists with the Securities and Exchange Commission on Form N-Q. Shareholders can look up the fund’s Forms N-Q on the SEC’s website at www.sec.gov. Forms N-Q may also be reviewed and copied at the SEC’s Public Reference Room (see the back cover of this report for further information).
| | Market |
| | Value• |
| Shares | ($000) |
Investment Companies (100.2%) | | |
International Stock Funds (99.7%) | | |
Vanguard European Stock Index Fund Investor Shares | 69,810,604 | 1,535,135 |
Vanguard Pacific Stock Index Fund Investor Shares | 95,434,290 | 757,748 |
| | 2,292,883 |
Money Market Fund (0.5%) | | |
1 Vanguard Market Liquidity Fund, 2.217% | 10,755,557 | 10,756 |
Total Investment Companies (Cost $2,842,181) | | 2,303,639 |
Other Assets and Liabilities (–0.2%) | | |
Other Assets | | 8,693 |
Liabilities | | (13,570) |
| | (4,877) |
Net Assets (100%) | | |
Applicable to 295,016,266 outstanding $.001 par value shares of | | |
beneficial interest (unlimited authorization) | | 2,298,762 |
Net Asset Value Per Share | | $7.79 |
At October 31, 2008, net assets consisted of: | |
| Amount |
| ($000) |
Paid-in Capital | 2,896,845 |
Undistributed Net Investment Income | 1,334 |
Accumulated Net Realized Losses | (60,875) |
Unrealized Appreciation (Depreciation) | (538,542) |
Net Assets | 2,298,762 |
• | See Note A in Notes to Financial Statements. |
1 Affiliated money market fund available only to Vanguard funds and certain trusts and accounts managed by Vanguard. Rate shown is the 7-day yield.
See accompanying Notes, which are an integral part of the Financial Statements.
95
Developed Markets Index Fund
Statement of Operations
| Year Ended |
| October 31, 2008 |
| ($000) |
Investment Income | |
Income | |
Income Distributions Received | 107,155 |
Net Investment Income—Note B | 107,155 |
Realized Net Gain (Loss) on Investment Securities Sold | (60,515) |
Change in Unrealized Appreciation (Depreciation) of Investment Securities | (1,992,254) |
Net Increase (Decrease) in Net Assets Resulting from Operations | (1,945,614) |
See accompanying Notes, which are an integral part of the Financial Statements.
96
Developed Markets Index Fund
Statement of Changes in Net Assets
| Year Ended October 31, |
| 2008 | 2007 |
| ($000) | ($000) |
Increase (Decrease) in Net Assets | | |
Operations | | |
Net Investment Income | 107,155 | 67,803 |
Realized Net Gain (Loss) | (60,515) | 1,415 |
Change in Unrealized Appreciation (Depreciation) | (1,992,254) | 681,973 |
Net Increase (Decrease) in Net Assets Resulting from Operations | (1,945,614) | 751,191 |
Distributions | | |
Net Investment Income | (107,258) | (66,258) |
Realized Capital Gain1 | (1,386) | (1,108) |
Total Distributions | (108,644) | (67,366) |
Capital Share Transactions | | |
Issued | 1,208,773 | 1,375,081 |
Issued in Lieu of Cash Distributions | 98,662 | 60,616 |
Redeemed2 | (930,804) | (715,040) |
Net Increase (Decrease) from Capital Share Transactions | 376,631 | 720,657 |
Total Increase (Decrease) | (1,677,627) | 1,404,482 |
Net Assets | | |
Beginning of Period | 3,976,389 | 2,571,907 |
End of Period3 | 2,298,762 | 3,976,389 |
1 Includes fiscal 2008 and 2007 short-term gain distributions totaling $1,386,000 and $1,108,000, respectively. Short-term gain distributions are treated as ordinary income dividends for tax purposes.
2 The fund collected redemption fees of $298,000 and $202,000, which were reallocated proportionately to the funds in which it invests.
3 Net Assets—End of Period includes undistributed net investment income of $1,334,000 and $1,437,000.
See accompanying Notes, which are an integral part of the Financial Statements.
97
Developed Markets Index Fund
Financial Highlights
For a Share Outstanding | Year Ended October 31, |
Throughout Each Period | 2008 | 2007 | 2006 | 2005 | 2004 |
Net Asset Value, Beginning of Period | $14.91 | $12.15 | $9.75 | $8.43 | $7.22 |
Investment Operations | | | | | |
Net Investment Income | .3691 | .305 | .219 | .190 | .143 |
Capital Gain Distributions Received | — | — | — | — | — |
Net Realized and Unrealized Gain (Loss) | | | | | |
on Investments | (7.097) | 2.759 | 2.400 | 1.320 | 1.210 |
Total from Investment Operations | (6.728) | 3.064 | 2.619 | 1.510 | 1.353 |
Distributions | | | | | |
Dividends from Net Investment Income | (.387) | (.299) | (.219) | (.190) | (.143) |
Distributions from Realized Capital Gains | (.005) | (.005) | — | — | — |
Total Distributions | (.392) | (.304) | (.219) | (.190) | (.143) |
Net Asset Value, End of Period | $7.79 | $14.91 | $12.15 | $9.75 | $8.43 |
| | | | | |
Total Return2 | –46.24% | 25.67% | 27.27% | 18.07% | 18.94% |
| | | | | |
Ratios/Supplemental Data | | | | | |
Net Assets, End of Period (Millions) | $2,299 | $3,976 | $2,572 | $1,623 | $1,038 |
Ratio of Total Expenses to | | | | | |
Average Net Assets | 0%3 | 0% | 0% | 0% | 0% |
Ratio of Net Investment Income to | | | | | |
Average Net Assets | 3.04% | 2.05% | 1.82% | 1.77% | 1.52% |
Portfolio Turnover Rate | 13% | 7% | 9% | 10% | 4% |
1 Calculated based on average shares outstanding.
2 Total returns do not reflect the 2% fee assessed on redemptions of shares purchased on or after June 27, 2003, and held for less than two months, or the account service fee that may be applicable to certain accounts with balances below $10,000.
3 The acquired fund fees and expenses were 0.22%.
See accompanying Notes, which are an integral part of the Financial Statements.
98
Developed Markets Index Fund
Notes to Financial Statements
Vanguard Developed Markets Index Fund is registered under the Investment Company Act of 1940 as an open-end investment company, or mutual fund. The fund seeks to match the performance of its target index by investing in the European and Pacific Stock Index Funds. The fund’s indirect investments in foreign securities involve investment risks not normally associated with investing in securities of U.S. corporations.
A. The following significant accounting policies conform to generally accepted accounting principles for U.S. mutual funds. The fund consistently follows such policies in preparing its financial statements.
1. Security Valuation: Investments are valued at the net asset value of each underlying Vanguard fund determined as of the close of the New York Stock Exchange (generally 4 p.m., Eastern time) on the valuation date.
2. Federal Income Taxes: The fund intends to continue to qualify as a regulated investment company and distribute all of its taxable income. Management has analyzed the fund’s tax positions taken on federal income tax returns for all open tax years (tax years ended October 31, 2005–2008), and has concluded that no provision for federal income tax is required in the fund’s financial statements.
3. Distributions: Distributions to shareholders are recorded on the ex-dividend date.
4. Other: Income and capital gain distributions received are recorded on the ex-dividend date. Security transactions are accounted for on the date securities are bought or sold. Costs used to determine realized gains (losses) on the sale of investment securities are those of the specific securities sold.
B. Under a service agreement, The Vanguard Group furnishes investment advisory, corporate management, administrative, marketing, and distribution services to the fund. The service agreement provides that the fund’s expenses may be reduced or eliminated to the extent of savings realized by the Vanguard funds by the operation of the fund. Accordingly, all incremental expenses for services provided by Vanguard and all other expenses incurred by the fund during the year ended October 31, 2008, were borne by the funds in which the fund invests. The fund’s trustees and officers are also directors and officers of Vanguard and the funds in which the fund invests.
C. Distributions are determined on a tax basis and may differ from net investment income and realized capital gains for financial reporting purposes. Differences may be permanent or temporary. Permanent differences are reclassified among capital accounts in the financial statements to reflect their tax character. Temporary differences arise when certain items of income, expense, gain, or loss are recognized in different periods for financial statement and tax purposes; these differences will reverse at some time in the future. Differences in classification may also result from the treatment of short-term gains as ordinary income for tax purposes.
For tax purposes, at October 31, 2008, the fund had $1,285,000 of ordinary income available for distribution. The fund had available realized losses of $11,015,000 to offset future net capital gains through October 31, 2016.
At October 31, 2008, the cost of investment securities for tax purposes was $2,891,993,000. Net unrealized depreciation of investment securities for tax purposes was $588,354,000, consisting entirely of unrealized losses on securities that had fallen in value since their purchase.
D. During the year ended October 31, 2008, the fund purchased $816,948,000 of investment securities and sold $451,715,000 of investment securities, other than temporary cash investments.
99
Developed Markets Index Fund
E. Capital shares issued and redeemed were:
| Year Ended October 31, |
| 2008 | 2007 |
| Shares | Shares |
| (000) | (000) |
Issued | 101,813 | 103,370 |
Issued in Lieu of Cash Distributions | 7,287 | 4,803 |
Redeemed | (80,732) | (53,150) |
Net Increase (Decrease) in Shares Outstanding | 28,368 | 55,023 |
F. In September 2006, the Financial Accounting Standards Board issued Statement of Financial Accounting Standards No. 157 (“FAS 157”), “Fair Value Measurements.” FAS 157 establishes a framework for measuring fair value and expands disclosures about fair value measurements in financial statements.
The various inputs that may be used to determine the value of the fund’s investments are summarized in three broad levels. The inputs or methodologies used for valuing securities are not necessarily an indication of the risk associated with investing in those securities.
Level 1—Quoted prices in active markets for identical securities.
Level 2—Other significant observable inputs (including quoted prices for similar securities, interest rates, prepayment speeds, credit risk, etc.).
Level 3—Significant unobservable inputs (including the fund’s own assumptions used to determine the fair value of investments).
At October 31, 2008, 100% of the fund’s investments were valued based on Level 1 inputs.
100
Institutional Developed Markets Index Fund
Fund Profile
As of October 31, 2008
Portfolio Characteristics | |
| Fund |
Acquired Fund Fees and | |
Expenses (10/31/2007)1 | 0.09% |
Sector Diversification (% of equity exposure) |
| | Target | Broad |
| Fund2 | Index3 | Index4 |
Consumer Discretionary | 10.5% | 10.6% | 9.0% |
Consumer Staples | 10.2 | 10.1 | 9.9 |
Energy | 9.1 | 8.9 | 12.0 |
Financials | 23.4 | 23.6 | 21.4 |
Health Care | 9.9 | 9.7 | 9.7 |
Industrials | 10.5 | 10.7 | 10.0 |
Information Technology | 4.8 | 5.0 | 9.1 |
Materials | 8.0 | 8.0 | 7.4 |
Telecommunication | | | |
Services | 6.3 | 6.2 | 6.0 |
Utilities | 7.3 | 7.2 | 5.5 |
Volatility Measures5 | |
| Fund Versus | Fund Versus |
| Target Index3 | Broad Index4 |
R-Squared | 0.98 | 0.97 |
Beta | 0.97 | 0.88 |
Allocation to Underlying Vanguard Funds | |
| |
European Stock Index Fund Institutional Shares | 67.0% |
Pacific Stock Index Fund Institutional Shares | 33.0 |
Market Diversification (% of equity exposure) |
| | Target |
| Fund2 | Index3 |
United Kingdom | 21.9% | 22.0% |
Japan | 21.7 | 23.6 |
France | 11.1 | 10.7 |
Germany | 9.1 | 8.7 |
Switzerland | 8.9 | 8.5 |
Australia | 5.4 | 5.9 |
Spain | 4.2 | 4.0 |
Italy | 3.7 | 3.6 |
Netherlands | 3.4 | 2.4 |
Sweden | 2.0 | 2.0 |
Hong Kong | 1.9 | 2.0 |
Finland | 1.5 | 1.5 |
Singapore | 1.0 | 1.0 |
Other Developed Markets | 4.2 | 4.1 |
1 This figure—drawn from the prospectus dated February 27, 2008—represents a weighted average of the annualized expense ratios and any transaction fees charged by the underlying mutual funds (the “acquired” funds) in which the Institutional Developed Markets Index Fund invests. The Institutional Developed Markets Index Fund does not charge any expenses or fees of its own. For the fiscal year ended October 31, 2008, the acquired fund fees and expenses figure was 0.09%.
2 Reflects holdings of underlying funds.
3 MSCI EAFE Index.
4 MSCI All Country World Index ex USA.
5 For an explanation of R-squared, beta, and other terms used here, see the Glossary.
101
Institutional Developed Markets Index Fund
Performance Summary
All of the returns in this report represent past performance, which is not a guarantee of future results that may be achieved by the fund. (Current performance may be lower or higher than the performance data cited. For performance data current to the most recent month-end, visit our website at www.vanguard.com/performance.) Note, too, that both investment returns and principal value can fluctuate widely, so an investor’s shares, when sold, could be worth more or less than their original cost. The returns shown do not reflect taxes that a shareholder would pay on fund distributions or on the sale of fund shares.
Cumulative Performance: June 1, 2000–October 31, 2008
Initial Investment of $5,000,000

| | Average Annual Total Returns | |
| Periods Ended October 31, 2008 | Final Value of |
| | | Since | a $5,000,000 |
| One Year | Five Years | Inception1 | Investment |
Institutional Developed Markets Index Fund2 | –46.12% | 4.01% | –0.94% | $4,619,022 |
MSCI All Country World Index ex USA | –48.27 | 5.05 | 0.23 | 5,096,809 |
MSCI EAFE Index | –46.62 | 3.60 | –1.12 | 4,549,517 |
Average International Fund3 | –47.97 | 2.81 | –2.03 | 4,207,428 |
1 Performance for the fund and its comparative standards is calculated since the fund’s inception: June 1, 2000.
2 Total returns do not reflect the 2% fee assessed on redemptions of shares purchased on or after June 27, 2003, and held for less than two months.
3 Derived from data provided by Lipper Inc.
102
Institutional Developed Markets Index Fund
Fiscal-Year Total Returns (%): June 1, 2000–October 31, 2008

Average Annual Total Returns: Periods Ended September 30, 2008
This table presents average annual total returns through the latest calendar quarter—rather than through the end of the fiscal period. Securities and Exchange Commission rules require that we provide this information.
| Inception Date | One Year | Five Years | Ten Years |
Institutional Developed Markets Index Fund1 | 6/1/2000 | –29.11% | 10.25% | 1.84% |
1 Total returns do not reflect the 2% fee assessed on redemptions of shares purchased on or after June 27, 2003, and held for less than two months.
Note: See Financial Highlights table for dividend and capital gains information.
103
Institutional Developed Markets Index Fund
Financial Statements
Statement of Net Assets
As of October 31, 2008
The fund provides a complete list of its holdings four times in each fiscal year, at the quarter-ends. For the second and fourth fiscal quarters, the lists appear in the fund’s semiannual and annual reports to shareholders. For the first and third fiscal quarters, the fund files the lists with the Securities and Exchange Commission on Form N-Q. Shareholders can look up the fund’s Forms N-Q on the SEC’s website at www.sec.gov. Forms N-Q may also be reviewed and copied at the SEC’s Public Reference Room (see the back cover of this report for further information).
| | Market |
| | Value• |
| Shares | ($000) |
Investment Companies (100.0%) | | |
International Stock Funds (99.9%) | | |
Vanguard European Stock Index Fund Institutional Shares | 111,125,369 | 2,449,203 |
Vanguard Pacific Stock Index Fund Institutional Shares | 151,864,763 | 1,208,844 |
| | 3,658,047 |
Money Market Fund (0.1%) | | |
1 Vanguard Market Liquidity Fund, 2.217% | 1,276,253 | 1,276 |
Total Investment Companies (Cost $4,939,454) | | 3,659,323 |
Other Assets and Liabilities (0.0%) | | |
Other Assets | | 67,822 |
Liabilities | | (66,660) |
| | 1,162 |
Net Assets (100%) | | |
Applicable to 472,820,736 outstanding $.001 par value shares of | | |
beneficial interest (unlimited authorization) | | 3,660,485 |
Net Asset Value Per Share | | $7.74 |
At October 31, 2008, net assets consisted of: | |
| Amount |
| ($000) |
Paid-in Capital | 5,001,132 |
Undistributed Net Investment Income | 1,409 |
Accumulated Net Realized Losses | (61,925) |
Unrealized Appreciation (Depreciation) | (1,280,131) |
Net Assets | 3,660,485 |
• | See Note A in Notes to Financial Statements. |
1 Affiliated money market fund available only to Vanguard funds and certain trusts and accounts managed by Vanguard. Rate shown is the 7-day yield.
See accompanying Notes, which are an integral part of the Financial Statements.
104
Institutional Developed Markets Index Fund
Statement of Operations
| Year Ended |
| October 31, 2008 |
| ($000) |
Investment Income | |
Income | |
Income Distributions Received | 137,824 |
Net Investment Income—Note B | 137,824 |
Realized Net Gain (Loss) on Investment Securities Sold | (51,686) |
Change in Unrealized Appreciation (Depreciation) of Investment Securities | (2,799,636) |
Net Increase (Decrease) in Net Assets Resulting from Operations | (2,713,498) |
See accompanying Notes, which are an integral part of the Financial Statements.
105
Institutional Developed Markets Index Fund
Statement of Changes in Net Assets
| Year Ended October 31, |
| 2008 | 2007 |
| ($000) | ($000) |
Increase (Decrease) in Net Assets | | |
Operations | | |
Net Investment Income | 137,824 | 98,306 |
Realized Net Gain (Loss) | (51,686) | 224,995 |
Change in Unrealized Appreciation (Depreciation) | (2,799,636) | 690,223 |
Net Increase (Decrease) in Net Assets Resulting from Operations | (2,713,498) | 1,013,524 |
Distributions | | |
Net Investment Income | (138,374) | (97,353) |
Realized Capital Gain | — | — |
Total Distributions | (138,374) | (97,353) |
Capital Share Transactions | | |
Issued | 2,406,003 | 1,605,380 |
Issued in Lieu of Cash Distributions | 118,333 | 79,390 |
Redeemed1 | (1,123,411) | (1,096,395) |
Net Increase (Decrease) from Capital Share Transactions | 1,400,925 | 588,375 |
Total Increase (Decrease) | (1,450,947) | 1,504,546 |
Net Assets | | |
Beginning of Period | 5,111,432 | 3,606,886 |
End of Period2 | 3,660,485 | 5,111,432 |
1 The fund collected redemption fees of $16,000 and $14,000, which were reallocated proportionately to the funds in which it invests.
2 Net Assets—End of Period includes undistributed net investment income of $1,409,000 and $1,959,000.
See accompanying Notes, which are an integral part of the Financial Statements.
106
Institutional Developed Markets Index Fund
Financial Highlights
For a Share Outstanding | Year Ended October 31, |
Throughout Each Period | 2008 | 2007 | 2006 | 2005 | 2004 |
Net Asset Value, Beginning of Period | $14.79 | $12.05 | $9.67 | $8.35 | $7.16 |
Investment Operations | | | | | |
Net Investment Income | .3571 | .323 | .229 | .200 | .158 |
Capital Gain Distributions Received | — | — | — | — | — |
Net Realized and Unrealized Gain (Loss) | | | | | |
on Investments | (7.011) | 2.733 | 2.380 | 1.320 | 1.190 |
Total from Investment Operations | (6.654) | 3.056 | 2.609 | 1.520 | 1.348 |
Distributions | | | | | |
Dividends from Net Investment Income | (.396) | (.316) | (.229) | (.200) | (.158) |
Distributions from Realized Capital Gains | — | — | — | — | — |
Total Distributions | (.396) | (.316) | (.229) | (.200) | (.158) |
Net Asset Value, End of Period | $7.74 | $14.79 | $12.05 | $9.67 | $8.35 |
| | | | | |
Total Return2 | –46.12% | 25.84% | 27.41% | 18.37% | 19.05% |
| | | | | |
Ratios/Supplemental Data | | | | | |
Net Assets, End of Period (Millions) | $3,660 | $5,111 | $3,607 | $1,748 | $911 |
Ratio of Total Expenses to | | | | | |
Average Net Assets | 0%3 | 0% | 0% | 0% | 0% |
Ratio of Net Investment Income to | | | | | |
Average Net Assets | 3.02% | 2.25% | 1.72% | 1.86% | 1.81% |
Portfolio Turnover Rate | 18% | 11%4 | 14% | 6% | 19% |
1 Calculated based on average shares outstanding.
2 Total returns do not reflect the 2% fee assessed on redemptions of shares purchased on or after June 27, 2003, and held for less than two months.
3 The acquired fund fees and expenses were 0.09%.
4 Excludes the value of portfolio securities received or delivered as a result of in-kind purchases or redemptions of the fund’s capital shares.
See accompanying Notes, which are an integral part of the Financial Statements.
107
Institutional Developed Markets Index Fund
Notes to Financial Statements
Vanguard Institutional Developed Markets Fund is registered under the Investment Company Act of 1940 as an open-end investment company, or mutual fund. The fund seeks to match the performance of its target index by investing in the European and Pacific Stock Index Funds. The fund’s indirect investments in foreign securities involve investment risks not normally associated with investing in securities of U.S. corporations.
A. The following significant accounting policies conform to generally accepted accounting principles for U.S. mutual funds. The fund consistently follows such policies in preparing its financial statements.
1. Security Valuation: Investments are valued at the net asset value of each underlying Vanguard fund determined as of the close of the New York Stock Exchange (generally 4 p.m., Eastern time) on the valuation date.
2. Federal Income Taxes: The fund intends to continue to qualify as a regulated investment company and distribute all of its taxable income. Management has analyzed the fund’s tax positions taken on federal income tax returns for all open tax years (tax years ended October 31, 2005–2008), and has concluded that no provision for federal income tax is required in the fund’s financial statements.
3. Distributions: Distributions to shareholders are recorded on the ex-dividend date.
4. Other: Income and capital gain distributions received are recorded on the ex-dividend date. Security transactions are accounted for on the date securities are bought or sold. Costs used to determine realized gains (losses) on the sale of investment securities are those of the specific securities sold.
B. Under a service agreement, The Vanguard Group furnishes investment advisory, corporate management, administrative, marketing, and distribution services to the fund. The service agreement provides that the fund’s expenses may be reduced or eliminated to the extent of savings realized by the Vanguard funds by the operation of the fund. Accordingly, all incremental expenses for services provided by Vanguard and all other expenses incurred by the fund during the year ended October 31, 2008, were borne by the funds in which the fund invests. The fund’s trustees and officers are also directors and officers of Vanguard and the funds in which the fund invests.
C. Distributions are determined on a tax basis and may differ from net investment income and realized capital gains for financial reporting purposes. Differences may be permanent or temporary. Permanent differences are reclassified among capital accounts in the financial statements to reflect their tax character. Temporary differences arise when certain items of income, expense, gain, or loss are recognized in different periods for financial statement and tax purposes; these differences will reverse at some time in the future. Differences in classification may also result from the treatment of short-term gains as ordinary income for tax purposes.
For tax purposes, at October 31, 2008, the fund had $1,409,000 of ordinary income available for distribution. The fund had available realized losses of $8,141,000 to offset future net capital gains through October 31, 2011.
At October 31, 2008, the cost of investment securities for tax purposes was $4,993,237,000. Net unrealized depreciation of investment securities for tax purposes was $1,333,914,000, consisting entirely of unrealized losses on securities that had fallen in value since their purchase.
D. During the year ended October 31, 2008, the fund purchased $2,219,370,000 of investment securities and sold $821,024,000 of investment securities, other than temporary cash investments.
108
Institutional Developed Markets Index Fund
E. Capital shares issued and redeemed were:
| Year Ended October 31, |
| 2008 | 2007 |
| Shares | Shares |
| (000) | (000) |
Issued | 213,601 | 121,169 |
Issued in Lieu of Cash Distributions | 8,811 | 6,351 |
Redeemed | (95,151) | (81,220) |
Net Increase (Decrease) in Shares Outstanding | 127,261 | 46,300 |
F. In September 2006, the Financial Accounting Standards Board issued Statement of Financial Accounting Standards No. 157 (“FAS 157”), “Fair Value Measurements.” FAS 157 establishes a framework for measuring fair value and expands disclosures about fair value measurements in financial statements.
The various inputs that may be used to determine the value of the fund’s investments are summarized in three broad levels. The inputs or methodologies used for valuing securities are not necessarily an indication of the risk associated with investing in those securities.
Level 1—Quoted prices in active markets for identical securities.
Level 2—Other significant observable inputs (including quoted prices for similar securities, interest rates, prepayment speeds, credit risk, etc.).
Level 3—Significant unobservable inputs (including the fund’s own assumptions used to determine the fair value of investments).
At October 31, 2008, 100% of the fund’s investments were valued based on Level 1 inputs.
109
Report of Independent Registered Public Accounting Firm
To the Trustees of Vanguard International Equity Index Funds and the Shareholders of Vanguard European Stock Index Fund, Vanguard Pacific Stock Index Fund, Vanguard Emerging Markets Stock Index Fund, Vanguard Developed Markets Index Fund and Vanguard Institutional Developed Markets Index Fund:
In our opinion, the accompanying statements of net assets and the related statements of operations and of changes in net assets and the financial highlights present fairly, in all material respects, the financial position of Vanguard European Stock Index Fund, Vanguard Pacific Stock Index Fund, Vanguard Emerging Markets Stock Index Fund, Vanguard Developed Markets Index Fund and Vanguard Institutional Developed Markets Index Fund (separate portfolios of Vanguard International Equity Index Funds, hereafter referred to as the “Funds”) at October 31, 2008, the results of each of their operations for the year then ended, the changes in each of their net assets for each of the two years in the period then ended and the financial highlights for each of the periods indicated, in conformity with accounting principles generally accepted in the United States of America. These financial statements and financial highlights (hereafter referred to as “financial statements”) are the responsibility of the Funds’ management; our responsibility is to express an opinion on these financial statements based on our audits. We conducted our audits of these financial statements in accordance with the standards of the Public Company Accounting Oversight Board (United States). Those standards require that we plan and perform the audit to obtain reasonable assurance about whether the financial statements are free of material misstatement. An audit includes examining, on a test basis, evidence supporting the amounts and disclosures in the financial statements, assessing the accounting principles used and significant estimates made by management, and evaluating the overall financial statement presentation. We believe that our audits, which included confirmation of securities at October 31, 2008 by correspondence with the custodians and brokers, and by agreement to the underlying ownership records of the Vanguard funds, provide a reasonable basis for our opinion.
PricewaterhouseCoopers LLP
Philadelphia, Pennsylvania
December 19, 2008
Special 2008 tax information (unaudited) for Vanguard European Stock Index Fund |
This information for the fiscal year ended October 31, 2008, is included pursuant to provisions of the Internal Revenue Code.
The fund distributed $1,082,542,000 of qualified dividend income to shareholders during the fiscal year.
The fund will pass through to shareholders foreign source income of $1,293,621,000 and foreign taxes paid of $75,188,000. The pass-through of foreign taxes paid will affect only shareholders on the dividend record date in December 2008. Shareholders will receive more detailed information along with their Form 1099-DIV in January 2009.
110
Special 2008 tax information (unaudited) for Vanguard Pacific Stock Index Fund |
This information for the fiscal year ended October 31, 2008, is included pursuant to provisions of the Internal Revenue Code.
The fund distributed $228,642,000 of qualified dividend income to shareholders during the fiscal year.
The fund will pass through to shareholders foreign source income of $377,281,000 and foreign taxes paid of $16,059,000. The pass-through of foreign taxes paid will affect only shareholders on the dividend record date in December 2008. Shareholders will receive more detailed information along with their Form 1099-DIV in January 2009.
Special 2008 tax information (unaudited) for Vanguard Emerging Markets Stock Index Fund |
This information for the fiscal year ended October 31, 2008, is included pursuant to provisions of the Internal Revenue Code.
The fund distributed $264,663,000 of qualified dividend income to shareholders during the fiscal year.
The fund will pass through to shareholders foreign source income of $712,123,000 and foreign taxes paid of $59,213,000. The pass-through of foreign taxes paid will affect only shareholders on the dividend record date in December 2008. Shareholders will receive more detailed information along with their Form 1099-DIV in January 2009.
Special 2008 tax information (unaudited) for Vanguard Developed Markets Index Fund |
This information for the fiscal year ended October 31, 2008, is included pursuant to provisions of the Internal Revenue Code.
The fund distributed $7,000 as capital gain dividends (from net long-term capital gains) to shareholders during the fiscal year.
For nonresident alien shareholders, 100% of short-term capital gain dividends distributed by the fund are qualified short-term capital gains.
The fund distributed $82,020,000 of qualified dividend income to shareholders during the fiscal year.
Special 2008 tax information (unaudited) for Vanguard Institutional Developed Markets |
Index Fund |
This information for the fiscal year ended October 31, 2008, is included pursuant to provisions of the Internal Revenue Code.
The fund distributed $105,483,000 of qualified dividend income to shareholders during the fiscal year.
111
Your Fund’s After-Tax Returns
This table presents returns for your fund both before and after taxes. The after-tax returns are shown in two ways: (1) assuming that an investor owned the fund during the entire period and paid taxes on the fund’s distributions, and (2) assuming that an investor paid taxes on the fund’s distributions and sold all shares at the end of each period.
Calculations are based on the highest individual federal income tax and capital gains tax rates in effect at the times of the distributions and the hypothetical sales. State and local taxes were not considered. After-tax returns reflect any qualified dividend income, using actual prior-year figures and estimates for 2008. (In the example, returns after the sale of fund shares may be higher than those assuming no sale. This occurs when the sale would have produced a capital loss. The calculation assumes that the investor received a tax deduction for the loss.)
The table shows returns for Investor Shares only; returns for other share classes will differ. Please note that your actual after-tax returns will depend on your tax situation and may differ from those shown. Also note that if you own the fund in a tax-deferred account, such as an individual retirement account or a 401(k) plan, this information does not apply to you. Such accounts are not subject to current taxes.
Finally, keep in mind that a fund’s performance—whether before or after taxes—does not guarantee future results.
Average Annual Total Returns: International Stock Index Funds | | | |
Periods Ended October 31, 2008 | | | |
| One | Five | Ten |
| Year | Years | Years |
European Stock Index Fund Investor Shares1 | | | |
Returns Before Taxes | –47.80% | 4.57% | 1.69% |
Returns After Taxes on Distributions | –48.04 | 4.16 | 1.12 |
Returns After Taxes on Distributions and Sale of Fund Shares | –30.39 | 4.02 | 1.32 |
| | | |
Pacific Stock Index Fund Investor Shares1 | | | |
Returns Before Taxes | –42.71% | 2.17% | 2.16% |
Returns After Taxes on Distributions | –42.99 | 1.80 | 1.82 |
Returns After Taxes on Distributions and Sale of Fund Shares | –27.35 | 1.87 | 1.76 |
| �� | | |
Emerging Markets Stock Index Fund Investor Shares2 | | | |
Returns Before Taxes | –56.88% | 8.94% | 9.19% |
Returns After Taxes on Distributions | –57.00 | 8.69 | 8.61 |
Returns After Taxes on Distributions and Sale of Fund Shares | –36.59 | 7.86 | 7.89 |
1 Total returns do not reflect the 0.25% transaction fee on purchases through March 31, 2000; the 2% fee assessed on redemptions of shares purchased on or after June 27, 2003, and held for less than two months; or the account service fee that may be applicable to certain accounts with balances below $10,000.
2 Performance figures are adjusted for the 0.25% (0.50% prior to June 26, 2008) transaction fee on purchases and redemptions. Total returns do not reflect the 2% fee assessed until March 23, 2005, on redemptions of shares purchased on or after June 27, 2003, and held for less than two months, or the account service fee that may be applicable to certain accounts with balances below $10,000.
112
Average Annual Total Returns: International Stock Index Funds | | | |
Periods Ended October 31, 2008 | | | |
| One | Five | Ten |
| Year | Years | Years |
Developed Markets Index Fund1 | | | |
Returns Before Taxes | –46.24% | 3.84% | –0.97%2 |
Returns After Taxes on Distributions | –46.54 | 3.37 | –1.492 |
Returns After Taxes on Distributions and Sale of Fund Shares | –29.51 | 3.27 | –0.962 |
| | | |
Institutional Developed Markets Index Fund1 | | | |
Returns Before Taxes | –46.12% | 4.01% | –0.94%2 |
Returns After Taxes on Distributions | –46.43 | 3.51 | –1.492 |
Returns After Taxes on Distributions and Sale of Fund Shares | –29.43 | 3.41 | –0.952 |
1 Total returns do not reflect the 2% fee assessed on redemptions of shares purchased on or after June 27, 2003, and held for less than two months, or for the Developed Markets Index Fund, the account service fee that may be applicable to certain accounts with balances below $10,000.
2 Returns since inception. Inception dates are May 8, 2000, for the Developed Markets Index Fund and June 1, 2000, for the Institutional Developed Markets Index Fund.
113
About Your Fund’s Expenses
As a shareholder of the fund, you incur ongoing costs, which include costs for portfolio management, administrative services, and shareholder reports (like this one), among others. Operating expenses, which are deducted from a fund’s gross income, directly reduce the investment return of the fund.
A typical fund’s expenses are expressed as a percentage of its average net assets. This figure is known as the expense ratio. “Funds of funds,” such as the Developed Markets Index Fund and Institutional Developed Markets Index Fund, have no direct expenses, but each fund bears its proportionate share of the expenses of the underlying funds in which it invests. These indirect expenses make up the fund’s acquired fund fees and expenses, also expressed as a percentage of average net assets.
The following examples are intended to help you understand the ongoing costs (in dollars) of investing in your fund and to compare these costs with those of other mutual funds. The examples are based on an investment of $1,000 made at the beginning of the period shown and held for the entire period. The costs are calculated using each fund’s acquired fund fees and expenses.
The accompanying tables illustrate your fund’s costs in two ways:
• Based on actual fund return. This section helps you to estimate the actual expenses that you paid over the period. The “Ending Account Value” shown is derived from the fund’s actual return, and the third column shows the dollar amount that would have been paid by an investor who started with $1,000 in the fund. You may use the information here, together with the amount you invested, to estimate the expenses that you paid over the period.
To do so, simply divide your account value by $1,000 (for example, an $8,600 account value divided by $1,000 = 8.6), then multiply the result by the number given for your fund under the heading “Expenses Paid During Period.”
• Based on hypothetical 5% yearly return. This section is intended to help you compare your fund’s costs with those of other mutual funds. It assumes that the fund had a yearly return of 5% before expenses, but that the expense ratio is unchanged. In this case—because the return used is not the fund’s actual return—the results do not apply to your investment. The example is useful in making comparisons because the Securities and Exchange Commission requires all mutual funds to calculate expenses based on a 5% return. You can assess your fund’s costs by comparing this hypothetical example with the hypothetical examples that appear in shareholder reports of other funds.
Note that the expenses shown in the table are meant to highlight and help you compare ongoing costs only and do not reflect transaction costs incurred by the fund for buying and selling securities. Further, the expenses do not include the transaction fees or the account service fee described in the prospectus. If such fees were applied to your account, your costs would be higher. Your fund does not carry a “sales load.”
The calculations assume no shares were bought or sold during the period. Your actual costs may have been higher or lower, depending on the amount of your investment and the timing of any purchases or redemptions.
You can find more information about the fund’s expenses, including annual expense ratios, in the Financial Statements section of this report. For additional information on operating expenses and other shareholder costs, please refer to your fund’s current prospectus.
114
Six Months Ended October 31, 2008 | | | |
| Beginning | Ending | Expenses |
| Account Value | Account Value | Paid During |
International Stock Index Fund | 4/30/2008 | 10/31/2008 | Period1 |
Based on Actual Fund Return | | | |
European | | | |
Investor Shares | $1,000.00 | $578.84 | $0.96 |
Admiral Shares | 1,000.00 | 579.32 | 0.52 |
Signal Shares | 1,000.00 | 579.33 | 0.52 |
Institutional Shares | 1,000.00 | 579.39 | 0.36 |
ETF Shares | 1,000.00 | 579.41 | 0.44 |
Pacific | | | |
Investor Shares | $1,000.00 | $633.68 | $0.99 |
Admiral Shares | 1,000.00 | 634.09 | 0.54 |
Signal Shares | 1,000.00 | 634.16 | 0.54 |
Institutional Shares | 1,000.00 | 634.26 | 0.37 |
ETF Shares | 1,000.00 | 634.23 | 0.45 |
Emerging Markets | | | |
Investor Shares2 | $1,000.00 | $488.61 | $1.16 |
Admiral Shares2 | 1,000.00 | 488.75 | 0.71 |
Signal Shares2 | 1,000.00 | 488.68 | 0.75 |
Institutional Shares2 | 1,000.00 | 488.80 | 0.53 |
ETF Shares | 1,000.00 | 488.78 | 0.75 |
Developed Markets | $1,000.00 | $595.57 | $0.88 |
Institutional Developed Markets | $1,000.00 | $596.76 | $0.36 |
1 These calculations are based on expenses incurred in the most recent six-month period, except for the two “funds of funds,” for which calculations are based on the acquired fund fees and expenses charged by the underlying mutual funds in which the funds of funds invest. The funds of funds’ annualized expense figures for the same period are 0.22% for the Developed Markets Index Fund and 0.09% for the Institutional Developed Markets Index Fund. The annualized six-month expense ratios for the European, Pacific, and Emerging Markets funds are as follows: European Stock Index Fund—0.24% for Investor Shares, 0.13% for Admiral Shares, 0.13% for Signal Shares, 0.09% for Institutional Shares, and 0.11% for ETF Shares; Pacific Stock Index Fund—0.24% for Investor Shares, 0.13% for Admiral Shares, 0.13% for Signal Shares, 0.09% for Institutional Shares, and 0.11% for ETF Shares and Emerging Markets Stock Index Fund—0.31% for Investor Shares, 0.19% for Admiral Shares, 0.20% for Signal Shares, 0.14% for Institutional Shares, and 0.20% for ETF Shares. The dollar amounts shown as “Expenses Paid” are equal to the annualized expense ratio multiplied by the average account value over the period, multiplied by the number of days in the most recent six-month period, then divided by the number of days in the most recent 12-month period.
2 Calculations do not reflect the fund’s 0.25% (0.50% prior to June 26, 2008) purchase fee, which is deducted from all purchases (including exchanges from other Vanguard funds) but not from reinvested dividends and capital gains.
115
Six Months Ended October 31, 2008 | | | |
| Beginning | Ending | Expenses |
| Account Value | Account Value | Paid During |
International Stock Index Fund | 4/30/2008 | 10/31/2008 | Period1 |
Based on Hypothetical 5% Yearly Return | | | |
European | | | |
Investor Shares | $1,000.00 | $1,025.08 | $0.12 |
Admiral Shares | 1,000.00 | 1,024.55 | 0.66 |
Signal Shares | 1,000.00 | 1,024.55 | 0.66 |
Institutional Shares | 1,000.00 | 1,024.75 | 0.46 |
ETF Shares | 1,000.00 | 1,024.65 | 0.56 |
Pacific | | | |
Investor Shares | $1,000.00 | $1,024.00 | $1.22 |
Admiral Shares | 1,000.00 | 1,024.55 | 0.66 |
Signal Shares | 1,000.00 | 1,024.55 | 0.66 |
Institutional Shares | 1,000.00 | 1,024.75 | 0.46 |
ETF Shares | 1,000.00 | 1,024.65 | 0.56 |
Emerging Markets | | | |
Investor Shares2 | $1,000.00 | $1,023.64 | $1.58 |
Admiral Shares2 | 1,000.00 | 1,024.25 | 0.97 |
Signal Shares2 | 1,000.00 | 1,024.20 | 1.02 |
Institutional Shares2 | 1,000.00 | 1,024.50 | 0.71 |
ETF Shares | 1,000.00 | 1,024.20 | 1.02 |
Developed Markets | $1,000.00 | $1,024.10 | $1.12 |
Institutional Developed Markets | $1,000.00 | $1,024.75 | $0.46 |
1 These calculations are based on expenses incurred in the most recent six-month period, except for the two “funds of funds,” for which calculations are based on the acquired fund fees and expenses charged by the underlying mutual funds in which the funds of funds invest. The funds of funds’ annualized expense figures for the same period are 0.22% for the Developed Markets Index Fund and 0.09% for the Institutional Developed Markets Index Fund. The annualized six-month expense ratios for the European, Pacific, and Emerging Markets funds are as follows: European Stock Index Fund—0.24% for Investor Shares, 0.13% for Admiral Shares, 0.13% for Signal Shares, 0.09% for Institutional Shares, and 0.11% for ETF Shares; Pacific Stock Index Fund—0.24% for Investor Shares, 0.13% for Admiral Shares, 0.13% for Signal Shares, 0.09% for Institutional Shares, and 0.11% for ETF Shares and Emerging Markets Stock Index Fund—0.31% for Investor Shares, 0.19% for Admiral Shares, 0.20% for Signal Shares, 0.14% for Institutional Shares, and 0.20% for ETF Shares. The dollar amounts shown as “Expenses Paid” are equal to the annualized expense ratio multiplied by the average account value over the period, multiplied by the number of days in the most recent six-month period, then divided by the number of days in the most recent 12-month period.
2 Calculations do not reflect the fund’s 0.25% (0.50% prior to June 26, 2008) purchase fee, which is deducted from all purchases (including exchanges from other Vanguard funds) but not from reinvested dividends and capital gains.
116
Glossary
Acquired Fund Fees and Expenses. Funds that invest in other Vanguard funds incur no direct expenses, but they do bear proportionate shares of the operating, administrative, and advisory expenses of the underlying funds, and they must pay any fees charged by those funds. The figure for acquired fund fees and expenses represents a weighted average of these underlying costs. Acquired is a term that the Securities and Exchange Commission applies to any mutual fund whose shares are owned by another fund.
Beta. A measure of the magnitude of a fund’s past share-price fluctuations in relation to the ups and downs of a given market index. The index is assigned a beta of 1.00. Compared with a given index, a fund with a beta of 1.20 typically would have seen its share price rise or fall by 12% when the index rose or fell by 10%. For this report, beta is based on returns over the past 36 months for both the fund and the index. Note that a fund’s beta should be reviewed in conjunction with its R-squared (see definition). The lower the R-squared, the less correlation there is between the fund and the index, and the less reliable beta is as an indicator of volatility.
Equity Exposure. A measure that reflects a fund’s investments in stocks and stock futures. Any holdings in short-term reserves are excluded.
Expense Ratio. The percentage of a fund’s average net assets used to pay its annual administrative and advisory expenses. These expenses directly reduce returns to investors.
Inception Date. The date on which the assets of a fund (or one of its share classes) are first invested in accordance with the fund’s investment objective. For funds with a subscription period, the inception date is the day after that period ends. Investment performance is measured from the inception date.
R-Squared. A measure of how much of a fund’s past returns can be explained by the returns from the market in general, as measured by a given index. If a fund’s total returns were precisely synchronized with an index’s returns, its R-squared would be 1.00. If the fund’s returns bore no relationship to the index’s returns, its R-squared would be 0. For this report, R-squared is based on returns over the past 36 months for both the fund and the index.
Short-Term Reserves. The percentage of a fund invested in highly liquid, short-term securities that can be readily converted to cash.
Turnover Rate. An indication of the fund’s trading activity. Funds with high turnover rates incur higher transaction costs and may be more likely to distribute capital gains (which may be taxable to investors). The turnover rate excludes in-kind transactions, which have minimal impact on costs.
This page intentionally left blank.
117
This page intentionally left blank.
This page intentionally left blank.
The People Who Govern Your Fund
The trustees of your mutual fund are there to see that the fund is operated and managed in your best interests since, as a shareholder, you are a part owner of the fund. Your fund’s trustees also serve on the board of directors of The Vanguard Group, Inc., which is owned by the Vanguard funds and provides services to them on an at-cost basis.
A majority of Vanguard’s board members are independent, meaning that they have no affiliation with Vanguard or the funds they oversee, apart from the sizable personal investments they have made as private individuals.
Our independent board members bring distinguished backgrounds in business, academia, and public service to their task of working with Vanguard officers to establish the policies and oversee the activities of the funds. Among board members’ responsibilities are selecting investment advisors for the funds; monitoring fund operations, performance, and costs; reviewing contracts; nominating and selecting new trustees/directors; and electing Vanguard officers.
Each trustee serves a fund until its termination; or until the trustee’s retirement, resignation, or death; or otherwise as specified in the fund’s organizational documents. Any trustee may be removed at a shareholders’ meeting by a vote representing two-thirds of the net asset value of all shares of the fund together with shares of other Vanguard funds organized within the same trust. The table on these two pages shows information for each trustee and executive officer of the fund. The mailing address of the trustees and officers is P.O. Box 876, Valley Forge, PA 19482.
Chairman of the Board and Trustee |
| |
John J. Brennan1 | |
Born 1954 | Principal Occupation(s) During the Past Five Years: Chairman of the Board and Director/ |
Trustee Since May 1987; | Trustee of The Vanguard Group, Inc., and of each of the investment companies served |
Chairman of the Board | by The Vanguard Group; Chief Executive Officer and President of The Vanguard Group |
156 Vanguard Funds Overseen | and of each of the investment companies served by The Vanguard Group (1996–2008). |
| |
Independent Trustees | |
| |
Charles D. Ellis | |
Born 1937 | Principal Occupation(s) During the Past Five Years: Applecore Partners (pro bono ventures |
Trustee Since January 2001 | in education); Senior Advisor to Greenwich Associates (international business strategy |
156 Vanguard Funds Overseen | consulting); Successor Trustee of Yale University; Overseer of the Stern School of Business |
| at New York University; Trustee of the Whitehead Institute for Biomedical Research. |
| |
Emerson U. Fullwood | |
Born 1948 | Principal Occupation(s) During the Past Five Years: Executive Chief Staff and Marketing |
Trustee Since January 2008 | Officer for North America since 2004 and Corporate Vice President of Xerox Corporation |
156 Vanguard Funds Overseen | (photocopiers and printers); Director of SPX Corporation (multi-industry manufacturing), |
| of the United Way of Rochester, and of the Boy Scouts of America. |
| |
Rajiv L. Gupta | |
Born 1945 | Principal Occupation(s) During the Past Five Years: Chairman, President, and |
Trustee Since December 20012 | Chief Executive Officer of Rohm and Haas Co. (chemicals); Board Member of |
156 Vanguard Funds Overseen | the American Chemistry Council; Director of Tyco International, Ltd. (diversified |
| manufacturing and services), since 2005. |
| |
Amy Gutmann | |
Born 1949 | Principal Occupation(s) During the Past Five Years: President of the University of |
Trustee Since June 2006 | Pennsylvania since 2004; Professor in the School of Arts and Sciences, Annenberg School |
156 Vanguard Funds Overseen | for Communication, and Graduate School of Education of the University of Pennsylvania |
| since 2004; Provost (2001–2004) and Laurance S. Rockefeller Professor of Politics and |
| the University Center for Human Values (1990–2004), Princeton University; Director of |
| Carnegie Corporation of New York since 2005 and of Schuylkill River Development |
| Corporation and Greater Philadelphia Chamber of Commerce since 2004; Trustee of |
| the National Constitution Center since 2007. |
JoAnn Heffernan Heisen | |
Born 1950 | Principal Occupation(s) During the Past Five Years: Corporate Vice President and |
Trustee Since July 1998 | Chief Global Diversity Officer since 2006, Vice President and Chief Information |
156 Vanguard Funds Overseen | Officer (1997–2005), and Member of the Executive Committee of Johnson & |
| Johnson (pharmaceuticals/consumer products); Director of the University Medical |
| Center at Princeton and Women’s Research and Education Institute. |
| |
André F. Perold | |
Born 1952 | Principal Occupation(s) During the Past Five Years: George Gund Professor of Finance |
Trustee Since December 2004 | and Banking, Harvard Business School; Senior Associate Dean and Director of Faculty |
156 Vanguard Funds Overseen | Recruiting, Harvard Business School; Director and Chairman of UNX, Inc. (equities |
| trading firm); Chair of the Investment Committee of HighVista Strategies LLC (private |
| investment firm) since 2005. |
| |
Alfred M. Rankin, Jr. | |
Born 1941 | Principal Occupation(s) During the Past Five Years: Chairman, President, Chief Executive |
Trustee Since January 1993 | Officer, and Director of NACCO Industries, Inc. (forklift trucks/housewares/lignite); Director |
156 Vanguard Funds Overseen | of Goodrich Corporation (industrial products/aircraft systems and services). |
| |
J. Lawrence Wilson | |
Born 1936 | Principal Occupation(s) During the Past Five Years: Retired Chairman and Chief Executive |
Trustee Since April 1985 | Officer of Rohm and Haas Co. (chemicals); Director of Cummins Inc. (diesel engines) and |
156 Vanguard Funds Overseen | AmerisourceBergen Corp. (pharmaceutical distribution); Trustee of Vanderbilt University |
| and of Culver Educational Foundation. |
| |
Executive Officers1 | |
| |
Thomas J. Higgins | |
Born 1957 | Principal Occupation(s) During the Past Five Years: Principal of The Vanguard Group, Inc.; |
Chief Financial Officer | Treasurer of each of the investment companies served by The Vanguard Group; Chief |
Since September 2008 | Financial Officer of each of the investment companies served by The Vanguard |
Treasurer Since July 1998 | Group since 2008. |
156 Vanguard Funds Overseen | |
| |
F. William McNabb III | |
Born 1957 | Principal Occupation(s) During the Past Five Years: Chief Executive Officer, Director, |
Chief Executive Officer | and President of The Vanguard Group, Inc., since 2008; Chief Executive Officer and |
Since August 31, 2008 | President of each of the investment companies served by The Vanguard Group since |
President Since March 2008 | 2008; Director of Vanguard Marketing Corporation; Managing Director of The Vanguard |
156 Vanguard Funds Overseen | Group (1995–2008). |
| |
Heidi Stam | |
Born 1956 | Principal Occupation(s) During the Past Five Years: Managing Director of The Vanguard |
Secretary Since July 2005 | Group, Inc., since 2006; General Counsel of The Vanguard Group since 2005; Secretary of |
156 Vanguard Funds Overseen | The Vanguard Group and of each of the investment companies served by The Vanguard |
| Group since 2005; Director and Senior Vice President of Vanguard Marketing Corporation |
| since 2005; Principal of The Vanguard Group (1997–2006). |
Vanguard Senior Management Team | | | |
| | | | |
R. Gregory Barton | Kathleen C. Gubanich | Michael S. Miller | Ralph K. Packard | George U. Sauter |
Mortimer J. Buckley | Paul A. Heller | James M. Norris | Glenn W. Reed | |
Founder |
|
John C. Bogle |
Chairman and Chief Executive Officer, 1974–1996 |
1 | These individuals are “interested persons” as defined in the Investment Company Act of 1940. |
2 | December 2002 for Vanguard Equity Income Fund, Vanguard Growth Equity Fund, the Vanguard Municipal Bond Funds, and the Vanguard State Tax-Exempt Funds. |
More information about the trustees is in the Statement of Additional Information, available from The Vanguard Group.
| 
|
| P.O. Box 2600 |
| Valley Forge, PA 19482-2600 |
Connect with Vanguard® > www.vanguard.com
Fund Information > 800-662-7447 | All comparative mutual fund data are from Lipper Inc. |
| or Morningstar, Inc., unless otherwise noted. |
Direct Investor Account Services > 800-662-2739 | |
| |
Institutional Investor Services > 800-523-1036 | You can obtain a free copy of Vanguard’s proxy voting |
| guidelines by visiting our website, www.vanguard.com, |
Text Telephone for People | and searching for “proxy voting guidelines,” or by |
With Hearing Impairment > 800-952-3335 | calling Vanguard at 800-662-2739. The guidelines are |
| also available from the SEC’s website, www.sec.gov. |
| In addition, you may obtain a free report on how your |
| fund voted the proxies for securities it owned during |
This material may be used in conjunction | the 12 months ended June 30. To get the report, visit |
with the offering of shares of any Vanguard | either www.vanguard.com or www.sec.gov. |
fund only if preceded or accompanied by | |
the fund’s current prospectus. | |
| You can review and copy information about your fund |
| at the SEC’s Public Reference Room in Washington, D.C. |
The funds or securities referred to herein are not | To find out more about this public service, call the SEC |
sponsored, endorsed, or promoted by MSCI, and MSCI | at 202-551-8090. Information about your fund is also |
bears no liability with respect to any such funds or | available on the SEC’s website, and you can receive |
securities. For any such funds or securities, the | copies of this information, for a fee, by sending a |
prospectus or the Statement of Additional Information | request in either of two ways: via e-mail addressed to |
contains a more detailed description of the limited | publicinfo@sec.gov or via regular mail addressed to the |
relationship MSCI has with The Vanguard Group and | Public Reference Section, Securities and Exchange |
any related funds. | Commission, Washington, DC 20549-0102. |
| |
Russell is a trademark of The Frank Russell Company. | |
| |
S&P ® is the trademark of The McGraw-Hill | |
Companies, Inc., and has been licensed for use | |
by The Vanguard Group, Inc. Vanguard mutual funds | |
are not sponsored, endorsed, sold, or promoted by | |
Standard & Poor’s, and Standard & Poor’s makes no | |
representation regarding the advisability of investing | |
in the funds. | |
| © 2008 The Vanguard Group, Inc. |
| All rights reserved. |
| Vanguard Marketing Corporation, Distributor. |
| |
| Q720 122008 |
Item 2: Code of Ethics. The Registrant has adopted a code of ethics that applies to the Registrant’s principal executive officer, principal financial officer, principal accounting officer or controller or persons performing similar functions. The Code of Ethics was amended during the reporting period covered by this report to make certain technical, non-material changes.
Item 3: Audit Committee Financial Expert. The following members of the Audit Committee have been determined by the Registrant’s Board of Trustees to be Audit Committee Financial Experts serving on its Audit Committee, and to be independent: Charles D. Ellis, Rajiv L. Gupta, JoAnn Heffernan Heisen, André F. Perold, Alfred M. Rankin, Jr., and J. Lawrence Wilson.
Item 4: Principal Accountant Fees and Services.
(a) Audit Fees.
Audit Fees of the Registrant
Fiscal Year Ended October 31, 2008: $111,000
Fiscal Year Ended October 31, 2007: $108,100
Aggregate Audit Fees of Registered Investment Companies in the Vanguard Group.
Fiscal Year Ended October 31, 2008: $3,055,590
Fiscal Year Ended October 31, 2007: $2,835,320
(b) Audit-Related Fees.
Fiscal Year Ended October 31, 2008: $626,240
Fiscal Year Ended October 31, 2007: $630,400
Includes fees billed in connection with assurance and related services provided to the Registrant, The Vanguard Group, Inc., Vanguard Marketing Corporation, and other registered investment companies in the Vanguard Group.
(c) Tax Fees.
Fiscal Year Ended October 31, 2008: $230,400
Fiscal Year Ended October 31, 2007: $215,900
Includes fees billed in connection with tax compliance, planning and advice services provided to the Registrant, The Vanguard Group, Inc., Vanguard Marketing Corporation, and other registered investment companies in the Vanguard Group and related to income and excise taxes.
(d) All Other Fees.
Fiscal Year Ended October 31, 2008: $0
Fiscal Year Ended October 31, 2007: $0
Includes fees billed for services related to risk management and privacy matters. Services were provided to the Registrant, The Vanguard Group, Inc., Vanguard Marketing Corporation, and other registered investment companies in the Vanguard Group.
(e) (1) Pre-Approval Policies. The policy of the Registrant’s Audit Committee is to consider and, if appropriate, approve before the principal accountant is engaged for such services, all specific audit and non-audit services provided to: (1) the Registrant; (2) The Vanguard Group, Inc.; (3) other entities controlled by The Vanguard Group, Inc. that provide ongoing services to the Registrant; and (4) other registered investment companies in the Vanguard Group. In making a determination, the Audit Committee considers whether the services are consistent with maintaining the principal accountant’s independence.
In the event of a contingency situation in which the principal accountant is needed to provide services in between scheduled Audit Committee meetings, the Chairman of the Audit Committee would be called on to consider and, if appropriate, pre-approve audit or permitted non-audit services in an amount sufficient to complete services through the next Audit Committee meeting, and to determine if such services would be consistent with maintaining the accountant’s independence. At the next scheduled Audit Committee meeting, services and fees would be presented to the Audit Committee for formal consideration, and, if appropriate, approval by the entire Audit Committee. The Audit Committee would again consider whether such services and fees are consistent with maintaining the principal accountant’s independence.
The Registrant’s Audit Committee is informed at least annually of all audit and non-audit services provided by the principal accountant to the Vanguard complex, whether such services are provided to: (1) the Registrant; (2) The Vanguard Group, Inc.; (3) other entities controlled by The Vanguard Group, Inc. that provide ongoing services to the Registrant; or (4) other registered investment companies in the Vanguard Group.
(2) No percentage of the principal accountant’s fees or services were approved pursuant to the waiver provision of paragraph (c)(7)(i)(C) of Rule 2-01 of Regulation S-X.
(f) For the most recent fiscal year, over 50% of the hours worked under the principal accountant’s engagement were not performed by persons other than full-time, permanent employees of the principal accountant.
(g) Aggregate Non-Audit Fees.
Fiscal Year Ended October 31, 2008: $230,400
Fiscal Year Ended October 31, 2007: $215,900
Includes fees billed for non-audit services provided to the Registrant, The Vanguard Group, Inc., Vanguard Marketing Corporation, and other registered investment companies in the Vanguard Group.
(h) For the most recent fiscal year, the Audit Committee has determined that the provision of all non-audit services was consistent with maintaining the principal accountant’s independence.
Item 5: Not Applicable.
Item 6: Not Applicable.
Item 7: Not Applicable.
Item 8: Not Applicable.
Item 9: Not Applicable.
Item 10: Not Applicable.
Item 11: Controls and Procedures.
(a) Disclosure Controls and Procedures. The Principal Executive and Financial Officers concluded that the Registrant's Disclosure Controls and Procedures are effective based on their evaluation of the Disclosure Controls and Procedures as of a date within 90 days of the filing date of this report.
(b) Internal Control Over Financial Reporting. There were no significant changes in Registrant’s Internal Control Over Financial Reporting or in other factors that could significantly affect this control subsequent to the date of the evaluation, including any corrective actions with regard to significant deficiencies and material weaknesses.
Item 12: Exhibits.
Pursuant to the requirements of the Securities Exchange Act of 1934 and the Investment Company Act of 1940, the registrant has duly caused this report to be signed on its behalf by the undersigned, thereunto duly authorized.
| VANGUARD STAR FUNDS |
| |
By: | /s/ F. WILLIAM MCNABB III* |
| F. WILLIAM MCNABB III |
| CHIEF EXECUTIVE OFFICER |
| |
Date: December 16, 2008 |
Pursuant to the requirements of the Securities Exchange Act of 1934 and the Investment Company Act of 1940, this report has been signed below by the following persons on behalf of the registrant and in the capacities and on the dates indicated.
| VANGUARD STAR FUNDS |
| |
By: | /s/ F. WILLIAM MCNABB III* |
| F. WILLIAM MCNABB III |
| CHIEF EXECUTIVE OFFICER |
| |
Date: December 16, 2008 |
| VANGUARD STAR FUNDS |
| |
By: | /s/ THOMAS J. HIGGINS* |
| THOMAS J. HIGGINS |
| CHIEF FINANCIAL OFFICER |
| |
Date: December 16, 2008 |
* By: /s/ Heidi Stam
Heidi Stam, pursuant to a Power of Attorney filed on January 18, 2008, see file Number 2-29601, Incorporated by Reference; and pursuant to a Power of Attorney filed on September 26, 2008, see File Number 2-47371, Incorporated by Reference.