UNITED STATES
SECURITIES AND EXCHANGE COMMISSION
Washington, D.C. 20549
FORM N-CSR
CERTIFIED SHAREHOLDER REPORT
OF
REGISTERED MANAGEMENT INVESTMENT COMPANIES
Investment Company Act file number: 811-3919
Name of Registrant: Vanguard STAR Funds
Address of Registrant:
P.O. Box 2600
Valley Forge, PA 19482
Name and address of agent for service:
Heidi Stam, Esquire
P.O. Box 876
Valley Forge, PA 19482
Registrant’s telephone number, including area code: (610) 669-1000
Date of fiscal year end: October 31
Date of reporting period: November 1, 2009 – October 31, 2010
Item 1: Reports to Shareholders
 |
| Vanguard STAR® Fund |
| Annual Report |
|
| October 31, 2010 |
|
|
 |
|
|
|
> For the fiscal year ended October 31, 2010, Vanguard STAR Fund returned 13.42%, a bit lower than the return of its composite benchmark index and the average return of a composite of peer-group funds weighted to approximate STAR’s asset allocation.
> Following a rough patch in the spring and summer, U.S. and international stock markets rallied in the final two months of the fiscal period.
> With equity growth funds setting the pace, each of STAR’s 11 underlying funds produced positive returns.
| |
| Contents | |
| Your Fund’s Total Returns. | 1 |
| Chairman’s Letter. | 2 |
| Fund Profile. | 8 |
| Performance Summary. | 9 |
| Financial Statements. | 11 |
| Your Fund’s After-Tax Returns. | 19 |
| About Your Fund’s Expenses. | 20 |
| Glossary. | 22 |
Please note: The opinions expressed in this report are just that—informed opinions. They should not be considered promises or advice. Also, please keep in mind that the information and opinions cover the period through the date on the front of this report. Of course, the risks of investing in your fund are spelled out in the prospectus.
See the Glossary for definitions of investment terms used in this report.
Cover photograph: Jean Maher.
Your Fund’s Total Returns
| |
| Fiscal Year Ended October 31, 2010 | |
| | Total |
| | Returns |
| Vanguard STAR Fund | 13.42% |
| STAR Composite Index | 13.66 |
| STAR Composite Average | 14.95 |
STAR Composite Index: 62.5% Dow Jones U.S. Total Stock Market Index, 25% Lehman U.S. Aggregate Bond Index, and 12.5% Citigroup 3-Month U.S. Treasury Bill Index through December 31, 2002; 50% Dow Jones Wilshire 5000 Composite Index, 25% Lehman U.S. Aggregate Bond Index, 12.5% Lehman 1-5 Year U.S. Credit Bond Index, and 12.5% MSCI EAFE Index through April 22, 2005; 50% MSCI US Broad Market Index, 25% Barclays Capital U.S. Aggregate Bond Index, 12.5% Barclays Capital U.S. 1-5 Year Credit Bond Index, and 12.5% MSCI EAFE Index through September 30, 2010; and 43.75% MSCI US Broad Market Index, 25% Barclays Capital U.S. Aggregate Bond Index, 12.5% Barclays Capital U.S. 1-5 Year Credit Bond Index, and 18.75% MSCI All Country World Index ex USA thereafter. Returns for the MSCI EAFE Index and MSCI All Country World Index ex USA are adjusted for withholding taxes applicable to Luxembourg holding companies.
STAR Composite Average: 62.5% general equity funds average, 25% fixed income funds average, and 12.5% money market funds average through December 31, 2002; 50% general equity funds average, 25% fixed income funds average, 12.5% 1-5 year investment-grade funds average, and 12.5% international funds average through September 30, 2010; and 43.75% general equity funds average, 25% fixed income funds average, 12.5% 1-5 year investment-grade funds average, and 18.75% international funds average thereafter. Derived from data provided by Lipper Inc.
| | | | |
| Your Fund’s Performance at a Glance | | | | |
| October 31, 2009, Through October 31, 2010 | | | | |
| | | | Distributions Per Share |
| | Starting | Ending | Income | Capital |
| | Share Price | Share Price | Dividends | Gains |
| Vanguard STAR Fund | $16.96 | $18.76 | $0.430 | $0.011 |
1

Chairman’s Letter
Dear Shareholder,
Vanguard STAR Fund returned 13.42% for the 12 months ended October 31, 2010, as the stock and bond markets continued to recover despite several challenges. The fund’s return trailed that of its benchmark index, the STAR Composite Index (13.66%), slightly; it also trailed the average return of a composite of fund peer groups (14.95%) that is weighted to approximate STAR’s asset allocation.
As a “fund of funds,” STAR invests in 11 actively managed Vanguard funds––eight stock funds and three fixed income funds––which encompass a wide range of investing styles and market capitalizations. Each of the 11 underlying funds produced positive results, and returns for seven of the eight equity funds were in the double digits.
By the end of October, we had completed our previously announced plan to increase STAR’s allocation to international stocks to 30% of equity assets from 20%. The change is consistent with our research showing that a higher international allocation can potentially provide better risk-return properties.
If you own the STAR Fund in a taxable account, you may wish to review the section on the fund’s after-tax returns, which appears later in this report.
2
Stock market performance was better than it felt
Global stock prices rallied at the start of the period, but struggled through the spring and summer, weighed down by Europe’s sovereign debt crisis and the slow pace of economic recovery in the United States. In the fiscal year’s final months, the mood turned. Stock prices climbed on continued strength in corporate earnings. In the United States, stocks also seemed to get a boost from the Federal Reserve Board’s hints that it would try to stimulate the economy with a second round of U.S. Treasury bond purchases. (In early November, the Fed announced that it would buy as much as $600 billion in Treasuries.)
For the 12 months, the broad U.S. stock market returned about 19%, a performance that was better than it felt in a year of ups and downs. Small-capitalization stocks did even better. International stocks returned about 13% on the strength of a powerful rally in emerging markets and solid single-digit gains in developed markets in Europe and the Pacific region.
Despite shrinking yields, bonds attracted investor dollars
Although fixed income yields have fallen to generational lows, investors continued to bid up bond prices. The broad U.S. bond market produced a 12-month return of about 8% as the yield of the 10-year U.S. Treasury note fell from 3.39% at the start of the period to 2.61% at the close. Tax-exempt municipal bonds also rallied.
| | | |
| Market Barometer | | | |
| |
| | | Average Annual Total Returns |
| | | Periods Ended October 31, 2010 |
| | One | Three | Five |
| | Year | Years | Years |
| Stocks | | | |
| Russell 1000 Index (Large-caps) | 17.67% | -6.14% | 1.99% |
| Russell 2000 Index (Small-caps) | 26.58 | -3.91 | 3.07 |
| Dow Jones U.S. Total Stock Market Index | 19.04 | -5.55 | 2.52 |
| MSCI All Country World Index ex USA (International) | 13.08 | -7.62 | 6.21 |
| |
| Bonds | | | |
| Barclays Capital U.S. Aggregate Bond Index (Broad | | | |
| taxable market) | 8.01% | 7.23% | 6.45% |
| Barclays Capital Municipal Bond Index (Broad | | | |
| tax-exempt market) | 7.78 | 5.79 | 5.20 |
| Citigroup Three-Month U.S. Treasury Bill Index | 0.12 | 0.89 | 2.41 |
| |
| CPI | | | |
| Consumer Price Index | 1.17% | 1.54% | 1.89% |
3
Bond prices and yields move in opposite directions, of course, so abundant returns built on rising prices could mean leaner pickings in the years ahead.
The yields of money market securities hovered near 0%, consistent with the Federal Reserve Board’s target for short-term rates.
Domestic, international growth funds lifted the STAR Fund’s returns
Although the STAR Fund did not surpass its benchmark index or peers, its fund-of-funds approach served it well over the fiscal year by enabling it to benefit from the generally strong performance of U.S. and international stocks and domestic bonds while moderating the risk that comes with focusing on specific market segments.
Seven of STAR’s 11 underlying funds outpaced their benchmarks, and both the stock and bond components of the fund made significant contributions to its performance.
Domestic growth funds make up more than 20% of STAR’s portfolio. Information technology holdings drove the performance of Vanguard ExplorerTM Fund, which returned about 28%, and Vanguard MorganTM Growth Fund, which returned about 21%. (Returns cited for STAR’s underlying funds are for Investor Shares.) Vanguard PRIMECAP Fund, which returned about 19%, was lifted by its industrial and consumer discretionary stocks.
| | |
| Expense Ratios | | |
| Your Fund Compared With Its Peer Group | | |
| | Acquired Fund Fees | Peer Group |
| | and Expenses | Average |
| STAR Fund | 0.37% | 1.22% |
The acquired fund fees and expenses—drawn from the prospectus dated February 26, 2010—represent an estimate of the weighted average of the expense ratios and any transaction fees charged by the underlying mutual funds (the ”acquired” funds) in which the STAR Fund invests. The STAR Fund does not charge any expenses or fees of its own. For the fiscal year ended October 31, 2010, the annualized acquired fund fees and expenses were 0.34%.
The peer group is the STAR Composite Average, derived by weighting the average expense ratios of the following mutual fund groups: general equity funds (43.75%), fixed income funds (25%), 1–5 year investment-grade funds (12.5%), and international funds (18.75%). Average expense ratios for these groups are derived from data provided by Lipper Inc. and capture information through year-end 2009.
4
STAR’s fourth domestic growth holding, Vanguard U.S. Growth Fund, returned about 12%. Poor stock choices in the financial sector limited the fund’s return, which trailed that of its benchmark by more than 7 percentage points.
Domestic value funds––Vanguard WindsorTM Fund and Windsor II Fund––also make up about 20% of STAR’s portfolio. Windsor II, STAR’s largest holding overall, returned about 12%, almost 4 percentage points short of its benchmark; this shortfall was mainly due to subpar stock selection in the information technology sector. Superior stock selection in the industrial sector lifted the Windsor Fund, which returned about 16%.
STAR also benefited from the performance of its two international funds, Vanguard International Growth Fund and Vanguard International Value Fund, which together account for almost 20% of the portfolio’s holdings. International Growth, buoyed by its emerging markets holdings and by its holdings in consumer staples, information technology, and materials, returned about 18%, more than twice the return of its benchmark. International Value, with help from its financial sector holdings, returned about 9%.
The three fixed income funds, which total close to 40% of STAR’s investments, all performed respectably. Vanguard Long-Term Investment-Grade Fund returned about 11%, slightly better than its benchmark, helped by an allocation of
| |
| Total Returns | |
| Ten Years Ended October 31, 2010 | |
| | Average |
| | Annual Return |
| STAR Fund | 4.98% |
| STAR Composite Index | 3.38 |
| STAR Composite Average | 2.67 |
STAR Composite Index: 62.5% Dow Jones U.S. Total Stock Market Index, 25% Lehman U.S. Aggregate Bond Index, and 12.5% Citigroup 3-Month U.S. Treasury Bill Index through December 31, 2002; 50% Dow Jones Wilshire 5000 Composite Index, 25% Lehman U.S. Aggregate Bond Index, 12.5% Lehman 1-5 Year U.S. Credit Bond Index, and 12.5% MSCI EAFE Index through April 22, 2005; 50% MSCI US Broad Market Index, 25% Barclays Capital U.S. Aggregate Bond Index, 12.5% Barclays Capital U.S. 1-5 Year Credit Bond Index, and 12.5% MSCI EAFE Index through September 30, 2010; and 43.75% MSCI US Broad Market Index, 25% Barclays Capital U.S. Aggregate Bond Index, 12.5% Barclays Capital U.S. 1-5 Year Credit Bond Index, and 18.75% MSCI All Country World Index ex USA thereafter. Returns for the MSCI EAFE Index and MSCI All Country World Index ex USA are adjusted for withholding taxes applicable to Luxembourg holding companies.
STAR Composite Average: 62.5% general equity funds average, 25% fixed income funds average, and 12.5% money market funds average through December 31, 2002; 50% general equity funds average, 25% fixed income funds average, 12.5% 1-5 year investment-grade funds average, and 12.5% international funds average through September 30, 2010; and 43.75% general equity funds average, 25% fixed income funds average, 12.5% 1-5 year investment-grade funds average, and 18.75% international funds average thereafter. Derived from data provided by Lipper Inc.
The figures shown represent past performance, which is not a guarantee of future results. (Current performance may be lower or higher than the performance data cited. For performance data current to the most recent month-end, visit our website at vanguard.com/performance.) Note, too, that both investment returns and principal value can fluctuate widely, so an investor’s shares, when sold, could be worth more or less than their original cost.
5
about 20% to Baa bonds. The benchmark contains only bonds rated A3 or higher, and the lower-quality issues did better over the past 12 months. Vanguard GNMA Fund returned about 7%, and Vanguard Short-Term Investment-Grade Fund returned about 6%.
Balanced approach brought creditable ten-year results
The past ten years have represented one of the most volatile decades in the history of the financial markets. Vanguard STAR Fund’s balanced fund-of-funds approach helped to cushion investors from the turbulence and generated solid returns in an unfavorable environment.
Over the ten years ended October 31, 2010, the STAR Fund recorded an average annual return of 4.98%, surpassing the results of its benchmark (3.38%), its peer group (2.67%), and the broad U.S. stock market (1.02%). The STAR Fund’s performance is a tribute to the skill and knowledge of the advisors who manage the 11 underlying funds. As a shareholder, you have also benefited from the fund’s low costs, which allow you to keep more of its returns.
STAR marks 25 years of growth and lessons
Vanguard STAR Fund, which celebrated its 25th anniversary this year, exemplifies the benefits of long-term, diversified, low-cost
| | |
| Underlying Funds: Allocations and Returns | | |
| Twelve Months Ended October 31, 2010 | | |
| | Percentage of | |
| Vanguard Fund | STAR Fund Assets | Total Returns |
| Vanguard Windsor II Fund Investor Shares | 14.3% | 12.05% |
| Vanguard Long-Term Investment-Grade Fund | | |
| Investor Shares | 12.5 | 11.12 |
| Vanguard GNMA Fund Investor Shares | 12.4 | 7.57 |
| Vanguard Short-Term Investment-Grade Fund | | |
| Investor Shares | 12.4 | 6.40 |
| Vanguard International Growth Fund Investor | | |
| Shares | 9.3 | 18.11 |
| Vanguard International Value Fund | 9.3 | 9.12 |
| Vanguard Windsor Fund Investor Shares | 7.7 | 16.31 |
| Vanguard Morgan Growth Fund Investor Shares | 6.1 | 21.03 |
| Vanguard U.S. Growth Fund Investor Shares | 6.1 | 12.44 |
| Vanguard PRIMECAP Fund Investor Shares | 6.1 | 18.72 |
| Vanguard Explorer Fund Investor Shares | 3.8 | 27.74 |
| Combined | 100.0% | 13.42% |
6
investing. Since it began on March 29, 1985, STAR has endured 1987’s historic stock market plunge, 1994’s fixed income turbulence, and the last decade’s two severe bear markets en route to an average annual return of 9.70%. Through the different market obstacles, STAR, Vanguard’s first fund of funds, has rewarded its investors with long-term growth and offered lessons in the importance of maintaining a balanced portfolio.
STAR is balanced among the major asset classes, and further diversified within these groups with its exposure to stocks of all types and bonds of various maturities. Constructing a well-balanced and diversified portfolio that matches your long-term
goals, risk tolerance, and time horizon can help you manage the stock market’s inevitable volatility. To that end, the STAR Fund can be an important part of a broader investment plan or can serve as a simplified, well-balanced portfolio on its own.
Thank you for investing your assets with Vanguard.
Sincerely,

F. William McNabb III
Chairman and Chief Executive Officer
November 9, 2010
7
STAR Fund
Fund Profile
As of October 31, 2010
| |
| Total Fund Characteristics | |
| Ticker Symbol | VGSTX |
| 30-Day SEC Yield | 2.87% |
| Acquired Fund Fees and Expenses1 | 0.37% |
| |
| Allocation to Underlying Vanguard Funds | |
| Vanguard Windsor II Fund Investor Shares | 14.3% |
| Vanguard Long-Term Investment-Grade | |
| Fund Investor Shares | 12.5 |
| Vanguard GNMA Fund Investor Shares | 12.4 |
| Vanguard Short-Term Investment-Grade | |
| Fund Investor Shares | 12.4 |
| Vanguard International Growth Fund | |
| Investor Shares | 9.3 |
| Vanguard International Value Fund | 9.3 |
| Vanguard Windsor Fund Investor Shares | 7.7 |
| Vanguard Morgan Growth Fund Investor | |
| Shares | 6.1 |
| Vanguard U.S. Growth Fund Investor | |
| Shares | 6.1 |
| Vanguard PRIMECAP Fund Investor | |
| Shares | 6.1 |
| Vanguard Explorer Fund Investor Shares | 3.8 |
| | |
| Total Fund Volatility Measures | |
| | | DJ |
| | STAR | U.S. Total |
| | Composite | Market |
| | Index | Index |
| R-Squared | 0.99 | 0.96 |
| Beta | 1.04 | 0.68 |
These measures show the degree and timing of the fund’s fluctuations compared with the indexes over 36 months.
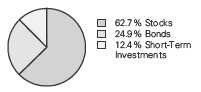
Fund Asset Allocation
1 This figure—drawn from the prospectus dated February 26, 2010—represents an estimate of the weighted average of the expense ratios and any transaction fees charged by the underlying mutual funds (the ”acquired” funds) in which the STAR Fund invests. The STAR Fund does not charge any expenses or fees of its own. For the fiscal year ended October 31, 2010, the annualized acquired fund fees and expenses were 0.34%.
8
STAR Fund
Performance Summary
All of the returns in this report represent past performance, which is not a guarantee of future results that may be achieved by the fund. (Current performance may be lower or higher than the performance data cited. For performance data current to the most recent month-end, visit our website at vanguard.com/performance.) Note, too, that both investment returns and principal value can fluctuate widely, so an investor’s shares, when sold, could be worth more or less than their original cost. The returns shown do not reflect taxes that a shareholder would pay on fund distributions or on the sale of fund shares.
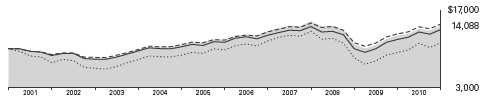
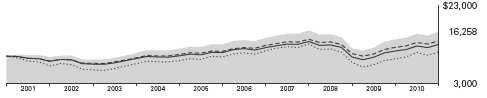
Cumulative Performance: October 31, 2000, Through October 31, 2010
Initial Investment of $10,000
| | | | |
| | Average Annual Total Returns | |
| | Periods Ended October 31, 2010 | |
| | | | | Final Value |
| | One | Five | Ten | of a $10,000 |
| | Year | Years | Years | Investment |
| STAR Fund | 13.42% | 4.61% | 4.98% | $16,258 |
| •••••••• Dow Jones U.S. Total Stock Market | | | | |
| Index | 19.04 | 2.52 | 1.02 | 11,073 |
| – – – – STAR Composite Index | 13.66 | 4.40 | 3.38 | 13,940 |
| STAR Composite Average | 14.95 | 3.61 | 2.67 | 13,016 |
STAR Composite Index: 62.5% Dow Jones U.S. Total Stock Market Index, 25% Lehman U.S. Aggregate Bond Index, and 12.5% Citigroup 3-Month U.S. Treasury Bill Index through December 31, 2002; 50% Dow Jones Wilshire 5000 Composite Index, 25% Lehman U.S. Aggregate Bond Index, 12.5% Lehman 1-5 Year U.S. Credit Bond Index, and 12.5% MSCI EAFE Index through April 22, 2005; 50% MSCI US Broad Market Index, 25% Barclays Capital U.S. Aggregate Bond Index, 12.5% Barclays Capital U.S. 1-5 Year Credit Bond Index, and 12.5% MSCI EAFE Index through September 30, 2010; and 43.75% MSCI US Broad Market Index, 25% Barclays Capital U.S. Aggregate Bond Index, 12.5% Barclays Capital U.S. 1-5 Year Credit Bond Index, and 18.75% MSCI All Country World Index ex USA thereafter. Returns for the MSCI EAFE Index and MSCI All Country World Index ex USA are adjusted for withholding taxes applicable to Luxembourg holding companies.
STAR Composite Average: 62.5% general equity funds average, 25% fixed income funds average, and 12.5% money market funds average through December 31, 2002; 50% general equity funds average, 25% fixed income funds average, 12.5% 1-5 year investment-grade funds average, and 12.5% international funds average through September 30, 2010; and 43.75% general equity funds average, 25% fixed income funds average, 12.5% 1-5 year investment-grade funds average, and 18.75% international funds average thereafter. Derived from data provided by Lipper Inc.
See Financial Highlights for dividend and capital gains information.
9
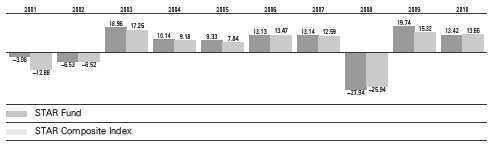
STAR Fund
Fiscal-Year Total Returns (%): October 31, 2000, Through October 31, 2010
Average Annual Total Returns: Periods Ended September 30, 2010
This table presents average annual total returns through the latest calendar quarter—rather than through the end of
the fiscal period. Securities and Exchange Commission rules require that we provide this information.
| | | | | | |
| | | | | | | Ten Years |
| | Inception Date | One Year | Five Years | Income | Capital | Total |
| STAR Fund | 3/29/1985 | 9.28% | 3.73% | 2.96% | 1.80% | 4.76% |
10
STAR Fund
Financial Statements
Statement of Net Assets
As of October 31, 2010
The fund reports a complete list of its holdings in regulatory filings four times in each fiscal year, at the quarter-ends. For the second and fourth fiscal quarters, the lists appear in the fund’s semiannual and annual reports to shareholders. For the first and third fiscal quarters, the fund files the lists with the Securities and Exchange Commission on Form N-Q. Shareholders can look up the fund’s Forms N-Q on the SEC’s website at sec.gov. Forms N-Q may also be reviewed and copied at the SEC’s Public Reference Room (see the back cover of this report for further information).
| | |
| | | Market |
| | | Value |
| | Shares | ($000) |
| Investment Companies (99.9%) | | |
| U.S. Stock Funds (44.1%) | | |
| Vanguard Windsor II Fund Investor Shares | 78,622,632 | 1,916,034 |
| Vanguard Windsor Fund Investor Shares | 83,293,737 | 1,046,169 |
| Vanguard Morgan Growth Fund Investor Shares | 49,195,079 | 829,429 |
| Vanguard U.S. Growth Fund Investor Shares | 48,166,662 | 827,022 |
| Vanguard PRIMECAP Fund Investor Shares | 13,005,512 | 824,679 |
| Vanguard Explorer Fund Investor Shares | 7,802,856 | 515,223 |
| | | 5,958,556 |
| International Stock Funds (18.5%) | | |
| Vanguard International Growth Fund Investor Shares | 66,440,557 | 1,257,720 |
| Vanguard International Value Fund | 39,166,567 | 1,250,197 |
| | | 2,507,917 |
| Bond Funds (24.9%) | | |
| Vanguard Long-Term Investment-Grade Fund Investor Shares | 175,684,818 | 1,686,574 |
| Vanguard GNMA Fund Investor Shares | 150,968,036 | 1,677,255 |
| | | 3,363,829 |
| Short-Term Bond Fund (12.4%) | | |
| Vanguard Short-Term Investment-Grade Fund Investor Shares | 153,856,606 | 1,677,037 |
| Total Investment Companies (Cost $10,894,011) | | 13,507,339 |
| Temporary Cash Investment (0.0%) | | |
| Money Market Fund (0.0%) | | |
| 1 Vanguard Market Liquidity Fund, 0.237% (Cost $1,020) | 1,020,294 | 1,020 |
| Total Investments (99.9%) (Cost $10,895,031) | | 13,508,359 |
| Other Assets and Liabilities (0.1%) | | |
| Other Assets | | 45,665 |
| Liabilities | | (33,413) |
| | | 12,252 |
| Net Assets (100%) | | |
| Applicable to 720,525,603 outstanding $.001 par value shares of | | |
| beneficial interest (unlimited authorization) | | 13,520,611 |
| Net Asset Value Per Share | | $18.76 |
11
STAR Fund
| |
| At October 31, 2010, net assets consisted of: | |
| | Amount |
| | ($000) |
| Paid-in Capital | 11,260,665 |
| Undistributed Net Investment Income | 68,508 |
| Accumulated Net Realized Losses | (421,890) |
| Unrealized Appreciation (Depreciation) | 2,613,328 |
| Net Assets | 13,520,611 |
See Note A in Notes to Financial Statements.
1 Affiliated money market fund available only to Vanguard funds and certain trusts and accounts managed by Vanguard. Rate shown is the 7-day yield.
See accompanying Notes, which are an integral part of the Financial Statements.
12
STAR Fund
| |
| Statement of Operations | |
| |
| | Year Ended |
| | October 31, 2010 |
| | ($000) |
| Investment Income | |
| Income | |
| Income Distributions Received | 308,798 |
| Net Investment Income—Note B | 308,798 |
| Realized Net Gain (Loss) | |
| Capital Gain Distributions Received | 17,220 |
| Investment Securities Sold | (124,915) |
| Realized Net Gain (Loss) | (107,695) |
| Change in Unrealized Appreciation (Depreciation) of Investment Securities | 1,411,009 |
| Net Increase (Decrease) in Net Assets Resulting from Operations | 1,612,112 |
See accompanying Notes, which are an integral part of the Financial Statements.
13
STAR Fund
| | |
| Statement of Changes in Net Assets | | |
| |
| | Year Ended October 31, |
| | 2010 | 2009 |
| | ($000) | ($000) |
| Increase (Decrease) in Net Assets | | |
| Operations | | |
| Net Investment Income | 308,798 | 354,756 |
| Realized Net Gain (Loss) | (107,695) | (209,045) |
| Change in Unrealized Appreciation (Depreciation) | 1,411,009 | 1,805,741 |
| Net Increase (Decrease) in Net Assets Resulting from Operations | 1,612,112 | 1,951,452 |
| Distributions | | |
| Net Investment Income | (308,874) | (376,099) |
| Realized Capital Gain1 | (7,840) | (420,804) |
| Total Distributions | (316,714) | (796,903) |
| Capital Share Transactions | | |
| Issued | 1,228,007 | 1,031,935 |
| Issued in Lieu of Cash Distributions | 305,898 | 772,281 |
| Redeemed | (1,384,905) | (1,310,111) |
| Net Increase (Decrease) from Capital Share Transactions | 149,000 | 494,105 |
| Total Increase (Decrease) | 1,444,398 | 1,648,654 |
| Net Assets | | |
| Beginning of Period | 12,076,213 | 10,427,559 |
| End of Period2 | 13,520,611 | 12,076,213 |
1 Includes fiscal 2010 and 2009 short-term gain distributions totaling $7,840,000 and $0, respectively. Short-term gain distributions are treated as ordinary income dividends for tax purposes.
2 Net Assets—End of Period includes undistributed net investment income of $68,508,000 and $68,584,000.
See accompanying Notes, which are an integral part of the Financial Statements.
14
STAR Fund
| | | | | |
| Financial Highlights | | | | | |
| |
| |
| For a Share Outstanding | | | Year Ended October 31, |
| Throughout Each Period | 2010 | 2009 | 2008 | 2007 | 2006 |
| Net Asset Value, Beginning of Period | $16.96 | $15.33 | $22.80 | $21.04 | $19.14 |
| Investment Operations | | | | | |
| Net Investment Income | .429 | .516 | .600 | .626 | .533 |
| Capital Gain Distributions Received | .024 | .142 | .967 | .669 | .378 |
| Net Realized and Unrealized Gain (Loss) | | | | | |
| on Investments | 1.788 | 2.150 | (7.578) | 1.392 | 1.554 |
| Total from Investment Operations | 2.241 | 2.808 | (6.011) | 2.687 | 2.465 |
| Distributions | | | | | |
| Dividends from Net Investment Income | (.430) | (.552) | (.634) | (.600) | (.510) |
| Distributions from Realized Capital Gains | (.011) | (.626) | (.825) | (.327) | (.055) |
| Total Distributions | (.441) | (1.178) | (1.459) | (.927) | (.565) |
| Net Asset Value, End of Period | $18.76 | $16.96 | $15.33 | $22.80 | $21.04 |
| |
| Total Return1 | 13.42% | 19.74% | -27.94% | 13.14% | 13.13% |
| |
| Ratios/Supplemental Data | | | | | |
| Net Assets, End of Period (Millions) | $13,521 | $12,076 | $10,428 | $15,210 | $13,522 |
| Ratio of Total Expenses to | | | | | |
| Average Net Assets | — | — | — | — | — |
| Acquired Fund Fees and Expenses | 0.34% | 0.37% | 0.32% | 0.32% | 0.35% |
| Ratio of Net Investment Income to | | | | | |
| Average Net Assets | 2.40% | 3.35% | 3.00% | 2.85% | 2.64% |
| Portfolio Turnover Rate | 22% | 21% | 24% | 8% | 9% |
1 Total returns do not include account service fees that may have applied in the periods shown. Fund prospectuses provide information about any applicable account service fees.
See accompanying Notes, which are an integral part of the Financial Statements.
15
STAR Fund
Notes to Financial Statements
Vanguard STAR Fund is registered under the Investment Company Act of 1940 as an open-end investment company, or mutual fund. The fund follows a balanced investment strategy by investing in selected Vanguard funds. The fund invests 60% to 70% of its net assets in stock funds (predominantly large-capitalization U.S. stock funds), 20% to 30% in intermediate- to long-term bond funds, and 10% to 20% in a short-term bond fund.
A. The following significant accounting policies conform to generally accepted accounting principles for U.S. mutual funds. The fund consistently follows such policies in preparing its financial statements.
1. Security Valuation: Investments are valued at the net asset value of each underlying Vanguard fund determined as of the close of the New York Stock Exchange (generally 4 p.m., Eastern time) on the valuation date.
2. Federal Income Taxes: The fund intends to continue to qualify as a regulated investment company and distribute all of its taxable income. Management has analyzed the fund’s tax positions taken for all open federal income tax years (October 31, 2007–2010), and has concluded that no provision for federal income tax is required in the fund’s financial statements.
3. Distributions: Distributions to shareholders are recorded on the ex-dividend date.
4. Other: Income and capital gain distributions received are recorded on the ex-dividend date. Security transactions are accounted for on the date securities are bought or sold. Costs used to determine realized gains (losses) on the sale of investment securities are those of the specific securities sold.
B. Under a service agreement, The Vanguard Group furnishes investment advisory, corporate management, administrative, marketing, and distribution services to the fund. The service agreement provides that the fund’s expenses may be reduced or eliminated to the extent of savings realized by the Vanguard funds by the operation of the fund. Accordingly, all incremental expenses for services provided by Vanguard and all other expenses incurred by the fund during the year ended October 31, 2010, were borne by the funds in which the fund invests. The fund’s trustees and officers are also directors and officers of Vanguard and the funds in which the fund invests.
C. Various inputs may be used to determine the value of the fund’s investments. These inputs are summarized in three broad levels for financial statement purposes. The inputs or methodologies used to value securities are not necessarily an indication of the risk associated with investing in those securities.
Level 1—Quoted prices in active markets for identical securities.
Level 2—Other significant observable inputs (including quoted prices for similar securities, interest rates, prepayment speeds, credit risk, etc.).
Level 3—Significant unobservable inputs (including the fund’s own assumptions used to determine the fair value of investments).
At October 31, 2010, 100% of the fund’s investments were valued based on Level 1 inputs.
D. Distributions are determined on a tax basis and may differ from net investment income and realized capital gains for financial reporting purposes. Differences may be permanent or temporary. Permanent differences are reclassified among capital accounts in the financial statements to reflect their tax character. Temporary differences arise when certain items of income, expense, gain, or loss are recognized in different periods for financial statement and tax purposes; these differences will reverse at some time in the future. Differences in classification may also result from the treatment of short-term gains as ordinary income for tax purposes.
16
STAR Fund
For tax purposes, at October 31, 2010, the fund had $73,310,000 of ordinary income available for distribution. The fund had available capital loss carryforwards totaling $426,531,000 to offset future net capital gains of $299,655,000 through October 31, 2017, and $126,876,000 through October 31, 2018.
At October 31, 2010, the cost of investment securities for tax purposes was $10,895,192,000. Net unrealized appreciation of investment securities for tax purposes was $2,613,167,000, consisting of unrealized gains of $2,641,958,000 on securities that had risen in value since their purchase and $28,791,000 in unrealized losses on securities that had fallen in value since their purchase.
E. During the year ended October 31, 2010, the fund purchased $2,915,642,000 of investment securities and sold $2,768,985,000 of investment securities, other than temporary cash investments.
| | |
| F. Capital shares issued and redeemed were: | | |
| | Year Ended October 31, |
| | 2010 | 2009 |
| | Shares | Shares |
| | (000) | (000) |
| Issued | 68,807 | 68,174 |
| Issued in Lieu of Cash Distributions | 17,517 | 53,393 |
| Redeemed | (77,866) | (89,493) |
| Net Increase (Decrease) in Shares Outstanding | 8,458 | 32,074 |
G. In preparing the financial statements as of October 31, 2010, management considered the impact of subsequent events for potential recognition or disclosure in these financial statements.
17
Report of Independent Registered Public Accounting Firm
To the Trustees of Vanguard STAR Funds and the Shareholders of Vanguard STAR Fund:
In our opinion, the accompanying statement of net assets and the related statements of operations and of changes in net assets and the financial highlights present fairly, in all material respects, the financial position of Vanguard STAR Fund (constituting a separate portfolio of Vanguard STAR Funds, hereafter referred to as the “Fund”) at October 31, 2010, the results of its operations for the year then ended, the changes in its net assets for each of the two years in the period then ended and the financial highlights for each of the five years in the period then ended, in conformity with accounting principles generally accepted in the United States of America. These financial statements and financial highlights (hereafter referred to as “financial statements”) are the responsibility of the Fund’s management; our responsibility is to express an opinion on these financial statements based on our au dits. We conducted our audits of these financial statements in accordance with the standards of the Public Company Accounting Oversight Board (United States). Those standards require that we plan and perform the audit to obtain reasonable assurance about whether the financial statements are free of material misstatement. An audit includes examining, on a test basis, evidence supporting the amounts and disclosures in the financial statements, assessing the accounting principles used and significant estimates made by management, and evaluating the overall financial statement presentation. We believe that our audits, which included confirmation of securities at October 31, 2010 by agreement to the underlying ownership records of the Vanguard funds, provide a reasonable basis for our opinion.
PricewaterhouseCoopers LLP
Philadelphia, Pennsylvania
December 9, 2010
|
| Special 2010 tax information (unaudited) for Vanguard STAR Fund |
This information for the fiscal year ended October 31, 2010, is included pursuant to provisions of the Internal Revenue Code.
The fund distributed $107,963,000 of qualified dividend income to shareholders during the fiscal year.
For corporate shareholders, 23.4% of investment income (dividend income plus short-term gains, if any) qualifies for the dividends-received deduction.
18
Your Fund’s After-Tax Returns
This table presents returns for your fund both before and after taxes. The after-tax returns are shown in two ways: (1) assuming that an investor owned the fund during the entire period and paid taxes on the fund’s distributions, and (2) assuming that an investor paid taxes on the fund’s distributions and sold all shares at the end of each period.
Calculations are based on the highest individual federal income tax and capital gains tax rates in effect at the times of the distributions and the hypothetical sales. State and local taxes were not considered. After-tax returns reflect any qualified dividend income , using actual prior-year figures and estimates for 2010. (In the example, returns after the sale of fund shares may be higher than those assuming no sale. This occurs when the sale would have produced a capital loss. The calculation assumes that the investor received a tax deduction for the loss.) Please note that your actual after-tax returns will depend on your tax situation and may differ from those shown. Also note that if you own the fund in a tax-deferred account, such as an individual retirement account or a 401(k) plan, this information does not apply to you. Such accounts are not subject to current taxes.
Finally, keep in mind that a fund’s performance—whether before or after taxes—does not guarantee future results.
| | | |
| Average Annual Total Returns: STAR Fund | | | |
| Periods Ended October 31, 2010 | | | |
| | One | Five | Ten |
| | Year | Years | Years |
| Returns Before Taxes | 13.42% | 4.61% | 4.98% |
| Returns After Taxes on Distributions | 12.63 | 3.38 | 3.65 |
| Returns After Taxes on Distributions and Sale of Fund Shares | 8.86 | 3.42 | 3.61 |
19
About Your Fund’s Expenses
As a shareholder of the fund, you incur ongoing costs, which include costs for portfolio management, administrative services, and shareholder reports (like this one), among others. Operating expenses, which are deducted from a fund’s gross income, directly reduce the investment return of the fund.
A typical fund’s expenses are expressed as a percentage of its average net assets. The STAR Fund has no direct expenses, but bears its proportionate share of the costs for the underlying funds in which it invests. These indirect expenses make up the acquired fund fees and expenses, also expressed as a percentage of average net assets.
The following examples are intended to help you understand the ongoing cost (in dollars) of investing in your fund and to compare these costs with those of other mutual funds. The examples are based on an investment of $1,000 made at the beginning of the period shown and held for the entire period. The costs were calculated using the acquired fund fees and expenses for the STAR Fund.
The accompanying table illustrates your fund’s costs in two ways:
• Based on actual fund return. This section helps you to estimate the actual expenses that you paid over the period. The ”Ending Account Value“ shown is derived from the fund‘s actual return, and the third column shows the dollar amount that would have been paid by an investor who started with $1,000 in the fund. You may use the information here, together with the amount you invested, to estimate the expenses that you paid over the period.
To do so, simply divide your account value by $1,000 (for example, an $8,600 account value divided by $1,000 = 8.6), then multiply the result by the number given for your fund under the heading ”Expenses Paid During Period.“
• Based on hypothetical 5% yearly return. This section is intended to help you compare your fund‘s costs with those of other mutual funds. It assumes that the fund had a yearly return of 5% before expenses, but that the expense ratio is unchanged. In this case—because the return used is not the fund’s actual return—the results do not apply to your investment. The example is useful in making comparisons because the Securities and Exchange Commission requires all mutual funds to calculate expenses based on a 5% return. You can assess your fund’s costs by comparing this hypothetical example with the hypothetical examples that appear in shareholder reports of other funds.
Note that the expenses shown in the table are meant to highlight and help you compare ongoing costs only and do not reflect transaction costs incurred by the fund for buying and selling securities. Further, the expenses do not include the account service fee described in the prospectus. If such a fee were applied to your account, your costs would be higher. Your fund does not charge transaction fees, such as purchase or redemption fees, nor does it carry a “sales load.” The calculations assume no shares were bought or sold during the period. Your actual costs may have been higher or lower, depending on the amount of your investment and the timing of any purchases or redemptions.
You can find more information about the fund’s expenses, including annual expense ratios, in the Financial Statements section of this report. For additional information on operating expenses and other shareholder costs, please refer to your fund’s current prospectus.
20
| | | |
| Six Months Ended October 31, 2010 | | | |
| | Beginning | Ending | Expenses |
| | Account Value | Account Value | Paid During |
| STAR Fund | 4/30/2010 | 10/31/2010 | Period |
| Based on Actual Fund Return | $1,000.00 | $1,032.06 | $1.74 |
| Based on Hypothetical 5% Yearly Return | 1,000.00 | 1,023.49 | 1.73 |
The calculations are based on acquired fund fees and expenses charged by the underlying mutual funds in which the STAR Fund invests. The STAR Fund’s annualized expense figure for the period is 0.34%. The dollar amounts shown as ”Expenses Paid” are equal to the annualized average weighted expense ratio for the underlying funds multiplied by the average account value over the period, multiplied by the number of days in the most recent six-month period, then divided by the number of days in the most recent 12-month period.
21
Glossary
30-Day SEC Yield. A fund’s 30-day SEC yield is derived using a formula specified by the U.S. Securities and Exchange Commission. Under the formula, data related to the fund’s security holdings in the previous 30 days are used to calculate the fund’s hypothetical net income for that period, which is then annualized and divided by the fund’s estimated average net assets over the calculation period. For the purposes of this calculation, a security’s income is based on its current market yield to maturity (in the case of bonds) or its projected dividend yield (for stocks). Because the SEC yield represents hypothetical annualized income, it will differ—at times significantly—from the fund’s actual experience. As a result, the fund’s income distributions may be higher or lower than implied by the SEC yield.
Acquired Fund Fees and Expenses. Funds that invest in other Vanguard funds incur no direct expenses, but they do bear proportionate shares of the operating, administrative, and advisory expenses of the underlying funds, and they must pay any fees charged by those funds. The figure for acquired fund fees and expenses represents a weighted average of these underlying costs. Acquired is a term that the Securities and Exchange Commission applies to any mutual fund whose shares are owned by another fund.
Beta. A measure of the magnitude of a fund’s past share-price fluctuations in relation to the ups and downs of a given market index. The index is assigned a beta of 1.00. Compared with a given index, a fund with a beta of 1.20 typically would have seen its share price rise or fall by 12% when the index rose or fell by 10%. For this report, beta is based on returns over the past 36 months for both the fund and the index. Note that a fund’s beta should be reviewed in conjunction with its R-squared (see definition). The lower the R-squared, the less correlation there is between the fund and the index, and the less reliable beta is as an indicator of volatility.
Expense Ratio. The percentage of a fund’s average net assets used to pay its annual administrative and advisory expenses. These expenses directly reduce returns to investors.
Inception Date. The date on which the assets of a fund (or one of its share classes) are first invested in accordance with the fund’s investment objective. For funds with a subscription period, the inception date is the day after that period ends. Investment performance is measured from the inception date.
R-Squared. A measure of how much of a fund’s past returns can be explained by the returns from the market in general, as measured by a given index. If a fund’s total returns were precisely synchronized with an index’s returns, its R-squared would be 1.00. If the fund’s returns bore no relationship to the index’s returns, its R-squared would be 0. For this report, R-squared is based on returns over the past 36 months for both the fund and the index.
22
This page intentionally left blank.
The People Who Govern Your Fund
The trustees of your mutual fund are there to see that the fund is operated and managed in your best interests since, as a shareholder, you are a part owner of the fund. Your fund’s trustees also serve on the board of directors of The Vanguard Group, Inc., which is owned by the Vanguard funds and provides services to them on an at-cost basis.
A majority of Vanguard’s board members are independent, meaning that they have no affiliation with Vanguard or the funds they oversee, apart from the sizable personal investments they have made as private individuals. The independent board members have distinguished backgrounds in business, academia, and public service. Each of the trustees and executive officers oversees 178 Vanguard funds.
The following table provides information for each trustee and executive officer of the fund. More information about the trustees is in the Statement of Additional Information, which can be obtained, without charge, by contacting Vanguard at 800-662-7447, or online at vanguard.com.
| |
| Interested Trustee1 | Amy Gutmann |
| | Born 1949. Trustee Since June 2006. Principal |
| F. William McNabb III | Occupation(s) During the Past Five Years: President |
| Born 1957. Trustee Since July 2009. Chairman of the | of the University of Pennsylvania; Christopher H. |
| Board. Principal Occupation(s) During the Past Five | Browne Distinguished Professor of Political Science |
| Years: Chairman of the Board of The Vanguard Group, | in the School of Arts and Sciences with secondary |
| Inc., and of each of the investment companies served | appointments at the Annenberg School for Commu- |
| by The Vanguard Group, since January 2010; Director | nication and the Graduate School of Education |
| of The Vanguard Group since 2008; Chief Executive | of the University of Pennsylvania; Director of |
| Officer and President of The Vanguard Group and of | Carnegie Corporation of New York, Schuylkill River |
| each of the investment companies served by The | Development Corporation, and Greater Philadelphia |
| Vanguard Group since 2008; Director of Vanguard | Chamber of Commerce; Trustee of the National |
| Marketing Corporation; Managing Director of The | Constitution Center; Chair of the Presidential |
| Vanguard Group (1995–2008) . | Commission for the Study of Bioethical Issues. |
| |
| | JoAnn Heffernan Heisen |
| Independent Trustees | Born 1950. Trustee Since July 1998. Principal |
| | Occupation(s) During the Past Five Years: Corporate |
| Emerson U. Fullwood | Vice President and Chief Global Diversity Officer |
| Born 1948. Trustee Since January 2008. Principal | since 2006 (retired 2008) and Member of the |
| Occupation(s) During the Past Five Years: Executive | Executive Committee (retired 2008) of Johnson & |
| Chief Staff and Marketing Officer for North America | Johnson (pharmaceuticals/consumer products); Vice |
| and Corporate Vice President (retired 2008) of Xerox | President and Chief Information Officer of Johnson & |
| Corporation (document management products and | Johnson (1997–2005); Director of the University |
| services); Director of SPX Corporation (multi-industry | Medical Center at Princeton and Women’s Research |
| manufacturing), the United Way of Rochester, | and Education Institute; Member of the Advisory |
| Amerigroup Corporation (managed health care), | Board of the Maxwell School of Citizenship and Public |
| the University of Rochester Medical Center, and | Affairs at Syracuse University. |
| Monroe Community College Foundation. | |
| | F. Joseph Loughrey |
| Rajiv L. Gupta | Born 1949. Trustee Since October 2009. Principal |
| Born 1945. Trustee Since December 2001.2 | Occupation(s) During the Past Five Years: President |
| Principal Occupation(s) During the Past Five Years: | and Chief Operating Officer since 2005 (retired 2009) |
| Chairman and Chief Executive Officer (retired 2009) | and Vice Chairman of the Board (2008–2009) of |
| and President (2006–2008) of Rohm and Haas Co. | Cummins Inc. (industrial machinery); Director of |
| (chemicals); Director of Tyco International, Ltd. | SKF AB (industrial machinery), Hillenbrand, Inc. |
| (diversified manufacturing and services) and Hewlett- | (specialized consumer services), Sauer-Danfoss Inc. |
| Packard Co. (electronic computer manufacturing); | (machinery), the Lumina Foundation for Education, |
| Trustee of The Conference Board; Member of the | and Oxfam America; Chairman of the Advisory |
| Board of Managers of Delphi Automotive LLP | Council for the College of Arts and Letters at the |
| (automotive components) . | University of Notre Dame. |
| | |
| André F. Perold | Kathryn J. Hyatt | |
| Born 1952. Trustee Since December 2004. Principal | Born 1955. Treasurer Since November 2008. Principal |
| Occupation(s) During the Past Five Years: George | Occupation(s) During the Past Five Years: Principal |
| Gund Professor of Finance and Banking at the Harvard | of The Vanguard Group, Inc.; Treasurer of each of |
| Business School; Chair of the Investment Committee | the investment companies served by The Vanguard |
| of HighVista Strategies LLC (private investment firm) . | Group since 2008; Assistant Treasurer of each of the |
| | investment companies served by The Vanguard Group |
| Alfred M. Rankin, Jr. | (1988–2008) . | |
| Born 1941. Trustee Since January 1993. Principal | | |
| Occupation(s) During the Past Five Years: Chairman, | Heidi Stam | |
| President, and Chief Executive Officer of NACCO | Born 1956. Secretary Since July 2005. Principal |
| Industries, Inc. (forklift trucks/housewares/lignite); | Occupation(s) During the Past Five Years: Managing |
| Director of Goodrich Corporation (industrial products/ | Director of The Vanguard Group, Inc., since 2006; |
| aircraft systems and services); Chairman of the | General Counsel of The Vanguard Group since 2005; |
| Federal Reserve Bank of Cleveland; Trustee of The | Secretary of The Vanguard Group and of each of the |
| Cleveland Museum of Art. | investment companies served by The Vanguard Group |
| | since 2005; Director and Senior Vice President of |
| Peter F. Volanakis | Vanguard Marketing Corporation since 2005; |
| Born 1955. Trustee Since July 2009. Principal | Principal of The Vanguard Group (1997–2006). |
| Occupation(s) During the Past Five Years: President | | |
| since 2007 and Chief Operating Officer since 2005 | | |
| of Corning Incorporated (communications equipment); | Vanguard Senior Management Team |
| President of Corning Technologies (2001–2005); | | |
| Director of Corning Incorporated and Dow Corning; | R. Gregory Barton | Michael S. Miller |
| Trustee of the Corning Incorporated Foundation and | Mortimer J. Buckley | James M. Norris |
| the Corning Museum of Glass; Overseer of the | Kathleen C. Gubanich | Glenn W. Reed |
| Amos Tuck School of Business Administration at | Paul A. Heller | George U. Sauter |
| Dartmouth College. | | |
| |
| | Chairman Emeritus and Senior Advisor |
| Executive Officers | | |
| | John J. Brennan | |
| Glenn Booraem | Chairman, 1996–2009 | |
| Born 1967. Controller Since July 2010. Principal | Chief Executive Officer and President, 1996–2008 |
| Occupation(s) During the Past Five Years: Principal | | |
| of The Vanguard Group, Inc.; Controller of each of | | |
| the investment companies served by The Vanguard | Founder | |
| Group since 2010; Assistant Controller of each of | | |
| the investment companies served by The Vanguard | John C. Bogle | |
| Group (2001–2010) . | Chairman and Chief Executive Officer, 1974–1996 |
| |
| Thomas J. Higgins | | |
| Born 1957. Chief Financial Officer Since September | | |
| 2008. Principal Occupation(s) During the Past Five | | |
| Years: Principal of The Vanguard Group, Inc.; Chief | | |
| Financial Officer of each of the investment companies | | |
| served by The Vanguard Group since 2008; Treasurer | | |
| of each of the investment companies served by The | | |
| Vanguard Group (1998–2008) . | | |
1 Mr. McNabb is considered an “interested person,” as defined in the Investment Company Act of 1940, because he is an officer of the Vanguard funds.
2 December 2002 for Vanguard Equity Income Fund, Vanguard Growth Equity Fund, the Vanguard Municipal Bond Funds, and the Vanguard State Tax-Exempt Funds.
|  |
| P.O. Box 2600 |
| Valley Forge, PA 19482-2600 |
Connect with Vanguard® > vanguard.com
| |
| Fund Information > 800-662-7447 | |
| Direct Investor Account Services > 800-662-2739 | |
| Institutional Investor Services > 800-523-1036 | |
| Text Telephone for People | |
| With Hearing Impairment > 800-749-7273 | |
| |
| This material may be used in conjunction | |
| with the offering of shares of any Vanguard | |
| fund only if preceded or accompanied by | |
| the fund’s current prospectus. | |
| |
| All comparative mutual fund data are from Lipper Inc. or | |
| Morningstar, Inc., unless otherwise noted. | |
| |
| You can obtain a free copy of Vanguard’s proxy voting | |
| guidelines by visiting vanguard.com/proxyreporting or by | |
| calling Vanguard at 800-662-2739. The guidelines are | |
| also available from the SEC’s website, sec.gov. In | |
| addition, you may obtain a free report on how your fund | |
| voted the proxies for securities it owned during the 12 | |
| months ended June 30. To get the report, visit either | |
| vanguard.com/proxyreporting or sec.gov. | |
| |
| You can review and copy information about your fund at | |
| the SEC’s Public Reference Room in Washington, D.C. To | |
| find out more about this public service, call the SEC at | |
| 202-551-8090. Information about your fund is also | |
| available on the SEC’s website, and you can receive | |
| copies of this information, for a fee, by sending a | |
| request in either of two ways: via e-mail addressed to | |
| publicinfo@sec.gov or via regular mail addressed to the | |
| Public Reference Section, Securities and Exchange | |
| Commission, Washington, DC 20549-1520. | |
| |
| |
| | © 2010 The Vanguard Group, Inc. |
| | All rights reserved. |
| | Vanguard Marketing Corporation, Distributor. |
| |
| | Q560 122010 |
 |
| Vanguard LifeStrategy® Funds |
| Annual Report |
|
|
| October 31, 2010 |
| |
 |
| |
| |
| Vanguard LifeStrategy Income Fund |
| Vanguard LifeStrategy Conservative Growth Fund |
| Vanguard LifeStrategy Moderate Growth Fund |
| Vanguard LifeStrategy Growth Fund |
|
|
> For the fiscal year ended October 31, 2010, returns for the Vanguard LifeStrategy Funds ranged from about 10% for the most conservative of the four funds to about 16% for the fund with the most aggressive asset allocation.
> Each of the LifeStrategy Funds bested the return of its corresponding benchmark composite index. Two funds also finished ahead of peer funds, as measured by a composite yardstick, while two trailed.
> Vanguard Asset Allocation Fund, which makes up about one-quarter of the assets of each LifeStrategy Fund, reinforced the positive results with solid gains.
| |
| Contents | |
| Your Fund’s Total Returns. | 1 |
| Chairman’s Letter. | 2 |
| LifeStrategy Income Fund. | 9 |
| LifeStrategy Conservative Growth Fund. | 19 |
| LifeStrategy Moderate Growth Fund. | 29 |
| LifeStrategy Growth Fund. | 39 |
| Your Fund’s After-Tax Returns. | 50 |
| About Your Fund’s Expenses. | 52 |
| Glossary. | 54 |
Please note: The opinions expressed in this report are just that—informed opinions. They should not be considered promises or advice. Also, please keep in mind that the information and opinions cover the period through the date on the front of this report. Of course, the risks of investing in your fund are spelled out in the prospectus.
See the Glossary for definitions of investment terms used in this report.
Cover photograph: Jean Maher.
Your Fund’s Total Returns
| |
| Fiscal Year Ended October 31, 2010 | |
| | Total |
| | Returns |
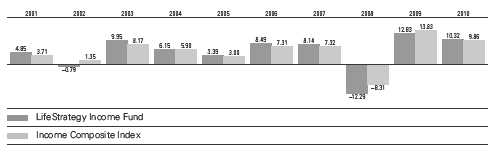
| Vanguard LifeStrategy Income Fund | 10.32% |
| Income Composite Index | 9.86 |
| Income Composite Average | 9.91 |
| Vanguard LifeStrategy Conservative Growth Fund | 12.30% |
| Conservative Growth Composite Index | 11.60 |
| Conservative Growth Composite Average | 11.67 |
| Vanguard LifeStrategy Moderate Growth Fund | 14.50% |
| Moderate Growth Composite Index | 13.84 |
| Moderate Growth Composite Average | 15.40 |
| Vanguard LifeStrategy Growth Fund | 16.21% |
| Growth Composite Index | 15.29 |
| Growth Composite Average | 16.92 |
Total returns for the composite indexes are derived by applying the funds’ target allocations to the results of the following benchmarks: for U.S. stocks, the MSCI US Broad Market Index; for international stocks, the MSCI EAFE Index; for bonds, the Barclays Capital U.S. Aggregate Bond Index through December 31, 2009, and the Barclays Capital U.S. Aggregate Float Adjusted Index thereafter; and for short-term investments, the Barclays Capital U.S. 1–3 Year Credit Index.
Each average is a blended composite that weights the return of the comparable mutual funds average for each asset class in proportion to the target weighting of the appropriate LifeStrategy Fund. All average returns for funds are derived from data provided by Lipper Inc. The Income Composite Average is weighted 60% fixed income funds average, 20% general equity funds average, and 20% money market funds average. The Conservative Growth Composite Average is weighted 40% fixed income funds average, 35% general equity funds average, 20% money market funds average, and 5% international funds average. The Moderate Growth Composite Average is weighted 50% general equity funds average, 40% fixed income funds average, and 10% international funds average. The Growth Composite Average is weighted 65% general equity funds average, 20% fixed income funds average, and 15% international funds average.
1

Chairman’s Letter
Dear Shareholder,
For the fiscal year ended October 31, 2010, the returns for the Vanguard LifeStrategy Funds ranged from 10.32% for the most conservative of the four funds to 16.21% for the fund with the most aggressive stance.
Global stock markets rose, pulled back, then rose again during the 12-month period and finished with solid gains. Each of the LifeStrategy Funds outperformed its benchmark. Two of the funds slightly outperformed their peer group composites, while two trailed.
Each of the LifeStrategy Funds pursues its investment objective by investing in other Vanguard mutual funds. The LifeStrategy Funds’ returns were bolstered by the performance of the underlying Vanguard Asset Allocation Fund, which makes up about one-fourth of each LifeStrategy Fund. The Asset Allocation Fund, which is able to shift its asset mix between stocks and bonds, finished slightly ahead of its benchmark with a stock-heavy allocation that benefited from the market’s gains.
In September, we announced plans to increase the funds’ allocations to international stocks from about 20% of equity assets to about 30%, a change that we will implement in the course of regular portfolio management. Our research suggests that a higher international allocation can potentially provide better risk-return properties.
2
Stock market performance was better than it felt
Global stock prices rallied at the start of the period, but struggled through the spring and summer, weighed down by Europe’s sovereign debt crisis and the slow pace of economic recovery in the United States. In the fiscal year’s final months, the mood turned. Stock prices climbed on continued strength in corporate earnings. In the United States, stocks also seemed to get a boost from the Federal Reserve Board’s hints that it would try to stimulate the economy with a second round of U.S. Treasury bond purchases. (In early November, the Fed announced that it would buy as much as $600 billion in Treasuries.)
For the 12 months, the broad U.S. stock market returned about 19%, a performance that was better than it felt in a year of ups and downs. Small-capitalization stocks did even better. International stocks returned about 13% on the strength of a powerful rally in emerging markets and solid single-digit gains in developed markets in Europe and the Pacific region.
Despite shrinking yields, bonds attracted investor dollars
Although fixed income yields have fallen to generational lows, investors continued to bid up bond prices. The broad U.S. bond market produced a 12-month return of about 8% as the yield of the 10-year U.S. Treasury note fell from 3.39% at the start of the period to 2.61% at the close.
| | | |
| Market Barometer | | | |
| |
| | | Average Annual Total Returns |
| | | Periods Ended October 31, 2010 |
| | One | Three | Five |
| | Year | Years | Years |
| Stocks | | | |
| Russell 1000 Index (Large-caps) | 17.67% | -6.14% | 1.99% |
| Russell 2000 Index (Small-caps) | 26.58 | -3.91 | 3.07 |
| Dow Jones U.S. Total Stock Market Index | 19.04 | -5.55 | 2.52 |
| MSCI All Country World Index ex USA (International) | 13.08 | -7.62 | 6.21 |
| |
| Bonds | | | |
| Barclays Capital U.S. Aggregate Bond Index (Broad | | | |
| taxable market) | 8.01% | 7.23% | 6.45% |
| Barclays Capital Municipal Bond Index (Broad | | | |
| tax-exempt market) | 7.78 | 5.79 | 5.20 |
| Citigroup Three-Month U.S. Treasury Bill Index | 0.12 | 0.89 | 2.41 |
| |
| CPI | | | |
| Consumer Price Index | 1.17% | 1.54% | 1.89% |
3
Tax-exempt municipal bonds also rallied. Bond prices and yields move in opposite directions, of course, so abundant returns built on rising prices could mean leaner pickings in the years ahead. The yields of money market securities hovered near 0%, consistent with the Federal Reserve Board’s target for short-term rates.
Funds recorded sizable gains as the markets finished strong
The Vanguard LifeStrategy Funds offer investors a choice of four diversified portfolios that blend stocks and bonds in allocations that range from more aggressive to more conservative. Each LifeStrategy Fund is a “fund of funds,” investing in up to five underlying Vanguard funds—primarily broad index portfolios that track the U.S. stock and bond markets and international equity markets.
As the global economy continued to recover from the Great Recession, the LifeStrategy Funds’ stock holdings gained ground during the first half of the fiscal year. After pulling back during the late spring and summer amid worries about an economic slowdown, stocks resumed their rally and finished the 12-month period on a strong note. Not surprisingly, the LifeStrategy Growth Fund, with a target stock allocation of about 85%, posted the strongest return. The LifeStrategy Income Fund, with a target stock allocation of about 25%, generated the lowest, but still very respectable, return.
| | |
| Expense Ratios | | |
| Your Fund Compared With Its Peer Group | | |
| | Acquired Fund Fees | Peer Group |
| | and Expenses | Average |
| LifeStrategy Income Fund | 0.23% | 1.02% |
| LifeStrategy Conservative Growth Fund | 0.24 | 1.10 |
| LifeStrategy Moderate Growth Fund | 0.23 | 1.22 |
| LifeStrategy Growth Fund | 0.23 | 1.30 |
The fund expense figures shown—drawn from the prospectus dated February 26, 2010—represent an estimate of the weighted average of the expense ratios and any transaction fees charged by the underlying mutual funds (the ”acquired” funds) in which the LifeStrategy Funds invest. The LifeStrategy Funds do not charge any expenses or fees of their own. For the fiscal year ended October 31, 2010, the annualized acquired fund fees and expenses were 0.18% for the LifeStrategy Income Fund, 0.19% for the LifeStrategy Conservative Growth Fund, 0.19% for the LifeStrategy Moderate Growth Fund, and 0.20% for the LifeStrategy Growth Fund.
Peer groups are the composites listed on page 1. Their expense figures are derived by applying the appropriate allocations to average expense ratios of these mutual fund peer groups: fixed income funds, general equity funds, international funds, and money market funds. Average expense ratios for these groups are derived from data provided by Lipper Inc. and capture information through year-end 2009.
4
Returns from the two other LifeStrategy Funds were predictably between the high and low figures.
The funds’ bond allocations also supported their double-digit gains, though, as the U.S. bond market turned in a performance that exceeded its historical norm. In the two years since the credit crisis hit full force and the Federal Reserve dramatically loosened monetary policies, interest rates have fallen, pushing up U.S. bond prices and contributing to the bottom line of the LifeStrategy Funds.
The funds outperformed their unmanaged benchmarks
For the fiscal year, each LifeStrategy Fund outdistanced its composite benchmark index by a small margin. The returns of the LifeStrategy Income and Conservative Growth Funds were also slightly higher than their composite peer averages. The two other LifeStrategy Funds fell just short of their peer yardsticks. It’s important to note that all of the index funds used by the LifeStrategy Funds succeeded in tracking the returns of their benchmarks, which encompass the broad U.S. stock and bond markets and stock markets worldwide.
| |
| Total Returns | |
| Ten Years Ended October 31, 2010 | |
| | Average |
| | Annual Return |
| LifeStrategy Income Fund | 4.86% |
| Income Composite Index | 5.06 |
| Income Composite Average | 3.88 |
| LifeStrategy Conservative Growth Fund | 4.15% |
| Conservative Growth Composite Index | 4.21 |
| Conservative Growth Composite Average | 3.19 |
| LifeStrategy Moderate Growth Fund | 3.49% |
| Moderate Growth Composite Index | 3.74 |
| Moderate Growth Composite Average | 3.01 |
| LifeStrategy Growth Fund | 2.42% |
| Growth Composite Index | 2.65 |
| Growth Composite Average | 2.10 |
The figures shown represent past performance, which is not a guarantee of future results. (Current performance may be lower or higher than the performance data cited. For performance data current to the most recent month-end, visit our website at vanguard.com/performance.) Note, too, that both investment returns and principal value can fluctuate widely, so an investor’s shares, when sold, could be worth more or less than their original cost.
5
The Asset Allocation Fund, which adds an actively managed element to the LifeStrategy Funds, maintained a modestly overweight position in equities relative to its benchmark’s “neutral” mix of 65% stocks and 35% bonds. The Asset Allocation Fund held a mix of 70% to 80% stocks and 20% to 30% bonds for the period. With both stocks and bonds providing solid gains, the fund slightly outperformed its benchmark and provided a beneficial contribution to the LifeStrategy Funds’ overall results.
(For information on the target percentages and actual asset allocations of the LifeStrategy Funds, see the table accompanying this letter.)
The past decade’s volatility was dampened by the funds’ balance
Over the ten-year period ended October 31, 2010, the LifeStrategy Funds’ annualized returns ranged from 2.42% for the LifeStrategy Growth Fund to 4.86% for the LifeStrategy Income Fund. Although none of the LifeStrategy Funds beat their unmanaged benchmarks for that period, their returns were all slightly better than the average annual returns of their peer-group composites for the decade.
The past ten years were an unusual period, as bonds have largely outperformed stocks. In fact, all four LifeStrategy Funds outperformed the overall U.S. stock market, which, according to most broad measures, had an average annual return of about 1% or less.
The LifeStrategy Funds’ balanced approach has served investors well during a difficult period for equities by making sure their shareholders benefited from the bond market’s prosperity while cushioning them from the sporadic volatility that swept through the stock market. In times of stock market plenty, this same strategy can put investors in a position to benefit from the long-term potential offered by equities.
The LifeStrategy approach can provide a long-term foundation
Although the past year was not as tumultuous as the previous one, periods of instability buffeted the markets. During times of volatility, it helps to remember that when you adopt a long-term perspective and maintain a diversified portfolio, month-to-month price swings don’t seem as threatening.
In practice, this means building a cost-efficient portfolio that includes a mix of stocks, bonds, and short-term reserves, one that can provide some protection against market losses while allowing you to participate in the long-term potential for accumulating returns in each asset class.
6
The LifeStrategy Funds embody this philosophy, with its comprehensive exposure to the broad U.S. stock and bond markets, further diversification in international markets in appropriate measures, and low costs that provide a consistent tailwind. With these features, each LifeStrategy Fund can play a key role in a well-balanced portfolio.
As always, we appreciate your confidence in Vanguard.
Sincerely,

F. William McNabb III
Chairman and Chief Executive Officer
November 10, 2010
7
| | | | |
| Your Fund’s Performance at a Glance | | | | |
| October 31, 2009, Through October 31, 2010 | | | | |
| | | | Distributions Per Share |
| | Starting | Ending | Income | Capital |
| | Share Price | Share Price | Dividends | Gains |
| Vanguard LifeStrategy Income Fund | $13.20 | $14.15 | $0.392 | $0.000 |
| Vanguard LifeStrategy Conservative Growth | | | | |
| Fund | $14.81 | $16.20 | $0.408 | $0.000 |
| Vanguard LifeStrategy Moderate Growth Fund | $17.16 | $19.22 | $0.394 | $0.000 |
| Vanguard LifeStrategy Growth Fund | $18.66 | $21.28 | $0.370 | $0.000 |
| | | | | | |
| Target and Actual Asset Allocations | | | | | |
| Percentages as of October 31, 2010 | | | | | | |
| | | Stocks | | Bonds | Short-Term Reserves |
| | Target | Actual | Target | Actual | Target | Actual |
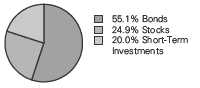
| LifeStrategy Income Fund | 22.5% | 24.9% | 57.5% | 55.1% | 20.0% | 20.0% |
| LifeStrategy Conservative | 42.5% | 45.2% | 37.5% | 34.9% | 20.0% | 19.9% |
| Growth Fund | | | | | | |
| LifeStrategy Moderate Growth | 62.5% | 65.2% | 37.5% | 34.8% | 0.0% | 0.0% |
| Fund | | | | | | |
| LifeStrategy Growth Fund | 82.5% | 85.2% | 17.5% | 14.8% | 0.0% | 0.0% |
Actual international stock positions for the Income, Conservative Growth, Moderate Growth, and Growth Funds equaled 0.0%, 5.1%, 10.1%, and 15.1% of assets, respectively.
8
LifeStrategy Income Fund
Fund Profile
As of October 31, 2010
| |
| Total Fund Characteristics | |
| Ticker Symbol | VASIX |
| 30-Day SEC Yield | 2.30% |
| Acquired Fund Fees and Expenses1 | 0.23% |
| |
| Allocation to Underlying Vanguard Funds | |
| Vanguard Total Bond Market II Index Fund | |
| Investor Shares | 50.1% |
| Vanguard Asset Allocation Fund Investor | |
| Shares | 24.9 |
| Vanguard Short-Term Investment-Grade | |
| Fund Investor Shares | 20.0 |
| Vanguard Total Stock Market Index Fund | |
| Investor Shares | 5.0 |
| | |
| Total Fund Volatility Measures | |
| | | Barclays |
| | Income | Aggregate |
| | Composite | Bond |
| | Index | Index |
| R-Squared | 0.98 | 0.35 |
| Beta | 1.18 | 1.05 |
These measures show the degree and timing of the fund’s fluctuations compared with the indexes over 36 months.
Fund Asset Allocation
1 This figure—drawn from the prospectus dated February 26, 2010—represents an estimate of the weighted average of the expense ratios and any transaction fees charged by the underlying mutual funds (the ”acquired” funds) in which the LifeStrategy Income Fund invests. The LifeStrategy Income Fund does not charge any expenses or fees of its own. For the fiscal year ended October 31, 2010, the annualized acquired fund fees and expenses were 0.18%.
9
LifeStrategy Income Fund
Performance Summary
All of the returns in this report represent past performance, which is not a guarantee of future results that may be achieved by the fund. (Current performance may be lower or higher than the performance data cited. For performance data current to the most recent month-end, visit our website at vanguard.com/performance.) Note, too, that both investment returns and principal value can fluctuate widely, so an investor’s shares, when sold, could be worth more or less than their original cost. The returns shown do not reflect taxes that a shareholder would pay on fund distributions or on the sale of fund shares.
Cumulative Performance: October 31, 2000, Through October 31, 2010
Initial Investment of $10,000
| | | | | |
| | | Average Annual Total Returns | |
| | | Periods Ended October 31, 2010 | |
| | | | | | Final Value |
| | | One | Five | Ten | of a $10,000 |
| | | Year | Years | Years | Investment |
| | LifeStrategy Income Fund | 10.32% | 5.08% | 4.86% | $16,078 |
| •••••••• | Barclays Capital U.S. Aggregate Bond | | | | |
| | Index | 8.01 | 6.45 | 6.38 | 18,560 |
| – – – – | Income Composite Index | 9.86 | 5.72 | 5.06 | 16,377 |
| | Income Composite Average | 9.91 | 4.25 | 3.88 | 14,637 |
Income Composite Index: Weighted 60% Lehman U.S. Aggregate Bond Index, 20% Dow Jones Wilshire 5000 Index, and 20% Citigroup 3-Month Treasury Index through August 31, 2003; 60% Lehman U.S. Aggregate Bond Index, 20% Dow Jones Wilshire 5000 Index, and 20% Lehman 1–3 Year U.S. Credit Index through April 22, 2005; and 60% Barclays Capital U.S. Aggregate Bond Index, 20% MSCI US Broad Market Index, and 20% Barclays Capital U.S. 1–3 Year Credit Bond Index through December 31, 2009, after which the Barclays Capital U.S. Aggregate Bond Index was replaced by the Barclays Capital U.S. Aggregate Float Adjusted Index.
Income Composite Average: Weighted 60% fixed income funds average, 20% general equity funds average, and 20% money market funds average. Derived from data provided by Lipper Inc.
See Financial Highlights for dividend and capital gains information.
10
LifeStrategy Income Fund
Fiscal-Year Total Returns (%): October 31, 2000, Through October 31, 2010
Average Annual Total Returns: Periods Ended September 30, 2010
This table presents average annual total returns through the latest calendar quarter—rather than through the end of the fiscal period. Securities and Exchange Commission rules require that we provide this information.
| | | | | | |
| | | | | | | Ten Years |
| | Inception Date | One Year | Five Years | Income | Capital | Total |
| LifeStrategy Income Fund | 9/30/1994 | 9.07% | 4.67% | 3.98% | 0.80% | 4.78% |
11
LifeStrategy Income Fund
Financial Statements
Statement of Net Assets
As of October 31, 2010
The fund reports a complete list of its holdings in regulatory filings four times in each fiscal year, at the quarter-ends. For the second and fourth fiscal quarters, the lists appear in the fund’s semiannual and annual reports to shareholders. For the first and third fiscal quarters, the fund files the lists with the Securities and Exchange Commission on Form N-Q. Shareholders can look up the fund’s Forms N-Q on the SEC’s website at sec.gov. Forms N-Q may also be reviewed and copied at the SEC’s Public Reference Room (see the back cover of this report for further information).
| | |
| | | Market |
| | | Value |
| | Shares | ($000) |
| Investment Companies (99.3%) | | |
| U.S. Stock Fund (4.9%) | | |
| Vanguard Total Stock Market Index Fund Investor Shares | 3,773,688 | 111,437 |
| |
| Balanced Fund (24.8%) | | |
| Vanguard Asset Allocation Fund Investor Shares | 23,541,405 | 557,460 |
| |
| Bond Fund (49.7%) | | |
| 1 Vanguard Total Bond Market II Index Fund Investor Shares | 103,593,676 | 1,118,812 |
| |
| Short-Term Bond Fund (19.9%) | | |
| Vanguard Short-Term Investment-Grade Fund Investor Shares | 41,027,891 | 447,204 |
| Total Investment Companies (Cost $2,031,236) | | 2,234,913 |
| Temporary Cash Investment (0.0%) | | |
| Money Market Fund (0.0%) | | |
| 1 Vanguard Market Liquidity Fund, 0.237% (Cost $572) | 571,791 | 572 |
| Total Investments (99.3%) (Cost $2,031,808) | | 2,235,485 |
| Other Assets and Liabilities (0.7%) | | |
| Other Assets | | 20,589 |
| Liabilities | | (5,068) |
| | | 15,521 |
| Net Assets (100%) | | |
| Applicable to 159,110,387 outstanding $.001 par value shares of | | |
| beneficial interest (unlimited authorization) | | 2,251,006 |
| Net Asset Value Per Share | | $14.15 |
12
LifeStrategy Income Fund
| |
| At October 31, 2010, net assets consisted of: | |
| | Amount |
| | ($000) |
| Paid-in Capital | 2,073,736 |
| Undistributed Net Investment Income | 4,847 |
| Accumulated Net Realized Losses | (31,254) |
| Unrealized Appreciation (Depreciation) | 203,677 |
| Net Assets | 2,251,006 |
See Note A in Notes to Financial Statements.
1 Affiliated fund available only to Vanguard funds and certain trusts and accounts managed by Vanguard. Rate shown for Vanguard Market Liquidity Fund is the 7-day yield.
See accompanying Notes, which are an integral part of the Financial Statements.
13
LifeStrategy Income Fund
| |
| Statement of Operations | |
| |
| | Year Ended |
| | October 31, 2010 |
| | ($000) |
| Investment Income | |
| Income | |
| Income Distributions Received | 57,632 |
| Net Investment Income—Note B | 57,632 |
| Realized Net Gain (Loss) on Investment Securities Sold | 502 |
| Change in Unrealized Appreciation (Depreciation) of Investment Securities | 138,741 |
| Net Increase (Decrease) in Net Assets Resulting from Operations | 196,875 |
See accompanying Notes, which are an integral part of the Financial Statements.
14
LifeStrategy Income Fund
| | |
| Statement of Changes in Net Assets | | |
| |
| | Year Ended October 31, |
| | 2010 | 2009 |
| | ($000) | ($000) |
| Increase (Decrease) in Net Assets | | |
| Operations | | |
| Net Investment Income | 57,632 | 59,138 |
| Realized Net Gain (Loss) | 502 | (8,606) |
| Change in Unrealized Appreciation (Depreciation) | 138,741 | 154,183 |
| Net Increase (Decrease) in Net Assets Resulting from Operations | 196,875 | 204,715 |
| Distributions | | |
| Net Investment Income | (57,384) | (60,637) |
| Realized Capital Gain | — | — |
| Total Distributions | (57,384) | (60,637) |
| Capital Share Transactions | | |
| Issued | 634,215 | 476,437 |
| Issued in Lieu of Cash Distributions | 53,652 | 56,502 |
| Redeemed | (360,822) | (534,663) |
| Net Increase (Decrease) from Capital Share Transactions | 327,045 | (1,724) |
| Total Increase (Decrease) | 466,536 | 142,354 |
| Net Assets | | |
| Beginning of Period | 1,784,470 | 1,642,116 |
| End of Period1 | 2,251,006 | 1,784,470 |
| 1 Net Assets—End of Period includes undistributed net investment income of $4,847,000 and $4,599,000. | |
See accompanying Notes, which are an integral part of the Financial Statements.
15
LifeStrategy Income Fund
| | | | | |
| Financial Highlights | | | | | |
| |
| |
| For a Share Outstanding | | | Year Ended October 31, |
| Throughout Each Period | 2010 | 2009 | 2008 | 2007 | 2006 |
| Net Asset Value, Beginning of Period | $13.20 | $12.13 | $14.44 | $13.97 | $13.38 |
| Investment Operations | | | | | |
| Net Investment Income | .388 | .440 | .555 | .570 | .530 |
| Capital Gain Distributions Received | — | — | — | — | — |
| Net Realized and Unrealized Gain (Loss) | | | | | |
| on Investments | .954 | 1.081 | (2.266) | .538 | .580 |
| Total from Investment Operations | 1.342 | 1.521 | (1.711) | 1.108 | 1.110 |
| Distributions | | | | | |
| Dividends from Net Investment Income | (.392) | (.451) | (.570) | (.570) | (.520) |
| Distributions from Realized Capital Gains | — | — | (.029) | (.068) | — |
| Total Distributions | (.392) | (.451) | (.599) | (.638) | (.520) |
| Net Asset Value, End of Period | $14.15 | $13.20 | $12.13 | $14.44 | $13.97 |
| |
| Total Return1 | 10.32% | 12.83% | -12.29% | 8.14% | 8.49% |
| |
| Ratios/Supplemental Data | | | | | |
| Net Assets, End of Period (Millions) | $2,251 | $1,784 | $1,642 | $1,885 | $1,666 |
| Ratio of Total Expenses to | | | | | |
| Average Net Assets | — | — | — | — | — |
| Acquired Fund Fees and Expenses | 0.18% | 0.23% | 0.22% | 0.24% | 0.25% |
| Ratio of Net Investment Income to | | | | | |
| Average Net Assets | 2.89% | 3.55% | 4.00% | 4.07% | 3.85% |
| Portfolio Turnover Rate | 9% | 27%2 | 22% | 8% | 14% |
1 Total returns do not include account service fees that may have applied in the periods shown. Fund prospectuses provide information about any applicable account service fees.
2 Excludes the value of mutual fund shares delivered and received in connection with a change in the fund’s bond investments from Vanguard Total Bond Market Index Fund to Vanguard Total Bond Market II Index Fund because those transactions were effected in kind and did not cause the fund to incur transaction costs.
See accompanying Notes, which are an integral part of the Financial Statements.
16
LifeStrategy Income Fund
Notes to Financial Statements
Vanguard LifeStrategy Income Fund is registered under the Investment Company Act of 1940 as an open-end investment company, or mutual fund. The fund follows a balanced investment strategy by investing in selected Vanguard funds to achieve its targeted allocation of assets to U.S. stocks, international stocks, bonds, and short-term reserves.
A. The following significant accounting policies conform to generally accepted accounting principles for U.S. mutual funds. The fund consistently follows such policies in preparing its financial statements.
1. Security Valuation: Investments are valued at the net asset value of each underlying Vanguard fund determined as of the close of the New York Stock Exchange (generally 4 p.m., Eastern time) on the valuation date.
2. Federal Income Taxes: The fund intends to continue to qualify as a regulated investment company and distribute all of its taxable income. Management has analyzed the fund’s tax positions taken for all open federal income tax years (October 31, 2007–2010), and has concluded that no provision for federal income tax is required in the fund’s financial statements.
3. Distributions: Distributions to shareholders are recorded on the ex-dividend date.
4. Other: Income and capital gain distributions received are recorded on the ex-dividend date. Security transactions are accounted for on the date securities are bought or sold. Costs used to determine realized gains (losses) on the sale of investment securities are those of the specific securities sold.
B. Under a service agreement, The Vanguard Group furnishes corporate management, administrative, marketing, and distribution services to the fund. The service agreement provides that the fund’s expenses may be reduced or eliminated to the extent of savings realized by the Vanguard funds by the operation of the fund. Accordingly, all incremental expenses for services provided by Vanguard and all other expenses incurred by the fund during the year ended October 31, 2010, were borne by the funds in which the fund invests. The fund’s trustees and officers are also directors and officers of Vanguard and the funds in which the fund invests.
C. Various inputs may be used to determine the value of the fund’s investments. These inputs are summarized in three broad levels for financial statement purposes. The inputs or methodologies used to value securities are not necessarily an indication of the risk associated with investing in those securities.
Level 1—Quoted prices in active markets for identical securities.
Level 2—Other significant observable inputs (including quoted prices for similar securities, interest rates, prepayment speeds, credit risk, etc.).
Level 3—Significant unobservable inputs (including the fund’s own assumptions used to determine the fair value of investments).
At October 31, 2010, 100% of the fund’s investments were valued based on Level 1 inputs.
D. Distributions are determined on a tax basis and may differ from net investment income and realized capital gains for financial reporting purposes. Differences may be permanent or temporary. Permanent differences are reclassified among capital accounts in the financial statements to reflect their tax character. Temporary differences arise when certain items of income, expense, gain, or loss are recognized in different periods for financial statement and tax purposes; these differences will reverse at some time in the future. Differences in classification may also result from the treatment of short-term gains as ordinary income for tax purposes.
17
LifeStrategy Income Fund
For tax purposes, at October 31, 2010, the fund had $4,758,000 of ordinary income available for distribution. The fund had available capital loss carryforwards totaling $30,136,000 to offset future net capital gains of $7,531,000 through October 31, 2016, and $22,605,000 through October 31, 2017.
At October 31, 2010, the cost of investment securities for tax purposes was $2,032,836,000. Net unrealized appreciation of investment securities for tax purposes was $202,649,000, consisting of unrealized gains of $203,677,000 on securities that had risen in value since their purchase and $1,028,000 in unrealized losses on securities that had fallen in value since their purchase.
E. During the year ended October 31, 2010, the fund purchased $483,018,000 of investment securities and sold $171,667,000 of investment securities, other than temporary cash investments.
F. Capital shares issued and redeemed were:
| | |
| | Year Ended October 31, |
| | 2010 | 2009 |
| | Shares | Shares |
| | (000) | (000) |
| Issued | 46,489 | 38,458 |
| Issued in Lieu of Cash Distributions | 3,943 | 4,554 |
| Redeemed | (26,475) | (43,288) |
| Net Increase (Decrease) in Shares Outstanding | 23,957 | (276) |
G. In preparing the financial statements as of October 31, 2010, management considered the impact of subsequent events for potential recognition or disclosure in these financial statements. In September 2010, the board of trustees approved an increase in the fund’s target international equity allocation to 30% of its total equity allocation. This change is expected to be completed in the near term.
18
LifeStrategy Conservative Growth Fund
Fund Profile
As of October 31, 2010
| |
| Total Fund Characteristics | |
| Ticker Symbol | VSCGX |
| 30-Day SEC Yield | 2.30% |
| Acquired Fund Fees and Expenses1 | 0.24% |
| |
| Allocation to Underlying Vanguard Funds | |
| Vanguard Total Bond Market II Index Fund | |
| Investor Shares | 29.8% |
| Vanguard Asset Allocation Fund Investor | |
| Shares | 25.1 |
| Vanguard Total Stock Market Index Fund | |
| Investor Shares | 20.1 |
| Vanguard Short-Term Investment-Grade | |
| Fund Investor Shares | 19.9 |
| Vanguard Total International Stock Index | |
| Fund | 5.1 |
| | |
| Total Fund Volatility Measures | |
| | Conservative | DJ |
| | Growth | U.S. Total |
| | Composite | Market |
| | Index | Index |
| R-Squared | 0.99 | 0.95 |
| Beta | 1.13 | 0.49 |
These measures show the degree and timing of the fund’s fluctuations compared with the indexes over 36 months.
Fund Asset Allocation
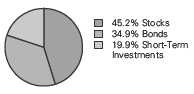
1 This figure—drawn from the prospectus dated February 26, 2010—represents an estimate of the weighted average of the expense ratios and any transaction fees charged by the underlying mutual funds (the ”acquired” funds) in which the LifeStrategy Conservative Growth Fund invests. The LifeStrategy Conservative Growth Fund does not charge any expenses or fees of its own. For the fiscal year ended October 31, 2010, the annualized acquired fund fees and expenses were 0.19%.
19
LifeStrategy Conservative Growth Fund
Performance Summary
All of the returns in this report represent past performance, which is not a guarantee of future results that may be achieved by the fund. (Current performance may be lower or higher than the performance data cited. For performance data current to the most recent month-end, visit our website at vanguard.com/performance.) Note, too, that both investment returns and principal value can fluctuate widely, so an investor’s shares, when sold, could be worth more or less than their original cost. The returns shown do not reflect taxes that a shareholder would pay on fund distributions or on the sale of fund shares.
Cumulative Performance: October 31, 2000, Through October 31, 2010
Initial Investment of $10,000

| | | | | |
| | | Average Annual Total Returns | |
| | | Periods Ended October 31, 2010 | |
| | | | | | Final Value |
| | | One | Five | Ten | of a $10,000 |
| | | Year | Years | Years | Investment |
| | LifeStrategy Conservative Growth Fund | 12.30% | 4.54% | 4.15% | $15,011 |
| •••••••• | Dow Jones U.S. Total Stock Market | | | | |
| | Index | 19.04 | 2.52 | 1.02 | 11,073 |
| – – – – | Conservative Growth Composite Index | 11.60 | 5.10 | 4.21 | 15,103 |
| | Conservative Growth Composite | | | | |
| | Average | 11.67 | 3.83 | 3.19 | 13,695 |
Conservative Growth Composite Index: Weighted 40% Lehman U.S. Aggregate Bond Index, 35% Dow Jones Wilshire 5000 Index, 20% Citigroup 3-Month Treasury Index, and 5% MSCI EAFE Index through August 31, 2003; 40% Lehman U.S. Aggregate Bond Index, 35% Dow Jones Wilshire 5000 Index, 20% Lehman 1–3 Year U.S. Credit Index, and 5% MSCI EAFE Index through April 22, 2005; and 40% Barclays Capital U.S. Aggregate Bond Index, 35% MSCI US Broad Market Index, 20% Barclays Capital U.S. 1–3 Year Credit Bond Index, and 5% MSCI EAFE Index through December 31, 2009, after which the Barclays Capital U.S. Aggregate Bond Index was replaced by the Barclays Capital U.S. Aggregate Float Adjusted Index. MSCI EAFE Index returns are adjusted for withholding taxes applicable to Luxembourg holding companies.
Conservative Growth Composite Average: Weighted 40% fixed income funds average, 35% general equity funds average, 20% money market funds average, and 5% international funds average. Derived from data provided by Lipper Inc.
See Financial Highlights for dividend and capital gains information.
20
LifeStrategy Conservative Growth Fund
Fiscal-Year Total Returns (%): October 31, 2000, Through October 31, 2010
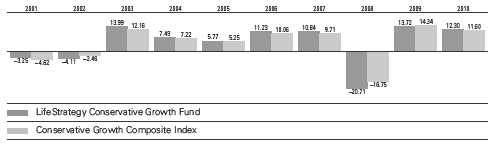
Average Annual Total Returns: Periods Ended September 30, 2010
This table presents average annual total returns through the latest calendar quarter—rather than through the end of the fiscal period. Securities and Exchange Commission rules require that we provide this information.
| | | | | | |
| | | | | | | Ten Years |
| | Inception Date | One Year | Five Years | Income | Capital | Total |
| LifeStrategy Conservative | | | | | | |
| Growth Fund | 9/30/1994 | 9.63% | 3.92% | 3.37% | 0.57% | 3.94% |
21
LifeStrategy Conservative Growth Fund
Financial Statements
Statement of Net Assets
As of October 31, 2010
The fund reports a complete list of its holdings in regulatory filings four times in each fiscal year, at the quarter-ends. For the second and fourth fiscal quarters, the lists appear in the fund’s semiannual and annual reports to shareholders. For the first and third fiscal quarters, the fund files the lists with the Securities and Exchange Commission on Form N-Q. Shareholders can look up the fund’s Forms N-Q on the SEC’s website at sec.gov. Forms N-Q may also be reviewed and copied at the SEC’s Public Reference Room (see the back cover of this report for further information).
| | |
| | | Market |
| | | Value |
| | Shares | ($000) |
| Investment Companies (99.8%) | | |
| U.S. Stock Fund (20.0%) | | |
| Vanguard Total Stock Market Index Fund Investor Shares | 42,872,003 | 1,266,010 |
| |
| International Stock Fund (5.1%) | | |
| Vanguard Total International Stock Index Fund | 20,685,630 | 320,213 |
| |
| Balanced Fund (25.0%) | | |
| Vanguard Asset Allocation Fund Investor Shares | 66,751,845 | 1,580,684 |
| |
| Bond Fund (29.8%) | | |
| 1 Vanguard Total Bond Market II Index Fund Investor Shares | 174,489,589 | 1,884,487 |
| |
| Short-Term Bond Fund (19.9%) | | |
| Vanguard Short-Term Investment-Grade Fund Investor Shares | 115,113,552 | 1,254,738 |
| Total Investment Companies (Cost $5,596,041) | | 6,306,132 |
| Temporary Cash Investment (0.0%) | | |
| Money Market Fund (0.0%) | | |
| 1 Vanguard Market Liquidity Fund, 0.237% (Cost $107) | 106,652 | 107 |
| Total Investments (99.8%) (Cost $5,596,148) | | 6,306,239 |
| Other Assets and Liabilities (0.2%) | | |
| Other Assets | | 22,595 |
| Liabilities | | (13,000) |
| | | 9,595 |
| Net Assets (100%) | | |
| Applicable to 389,973,605 outstanding $.001 par value shares of | | |
| beneficial interest (unlimited authorization) | | 6,315,834 |
| Net Asset Value Per Share | | $16.20 |
22
LifeStrategy Conservative Growth Fund
| |
| At October 31, 2010, net assets consisted of: | |
| | Amount |
| | ($000) |
| Paid-in Capital | 5,724,734 |
| Undistributed Net Investment Income | 9,768 |
| Accumulated Net Realized Losses | (128,759) |
| Unrealized Appreciation (Depreciation) | 710,091 |
| Net Assets | 6,315,834 |
See Note A in Notes to Financial Statements.
1 Affiliated fund available only to Vanguard funds and certain trusts and accounts managed by Vanguard. Rate shown for Vanguard Market Liquidity Fund is the 7-day yield.
See accompanying Notes, which are an integral part of the Financial Statements.
23
LifeStrategy Conservative Growth Fund
| |
| Statement of Operations | |
| |
| | Year Ended |
| | October 31, 2010 |
| | ($000) |
| Investment Income | |
| Income | |
| Income Distributions Received | 154,564 |
| Net Investment Income—Note B | 154,564 |
| Realized Net Gain (Loss) on Investment Securities Sold | 1,136 |
| Change in Unrealized Appreciation (Depreciation) of Investment Securities | 523,512 |
| Net Increase (Decrease) in Net Assets Resulting from Operations | 679,212 |
See accompanying Notes, which are an integral part of the Financial Statements.
24
LifeStrategy Conservative Growth Fund
| | |
| Statement of Changes in Net Assets | | |
| |
| | Year Ended October 31, |
| | 2010 | 2009 |
| | ($000) | ($000) |
| Increase (Decrease) in Net Assets | | |
| Operations | | |
| Net Investment Income | 154,564 | 158,914 |
| Realized Net Gain (Loss) | 1,136 | (26,937) |
| Change in Unrealized Appreciation (Depreciation) | 523,512 | 519,397 |
| Net Increase (Decrease) in Net Assets Resulting from Operations | 679,212 | 651,374 |
| Distributions | | |
| Net Investment Income | (154,835) | (161,858) |
| Realized Capital Gain | — | — |
| Total Distributions | (154,835) | (161,858) |
| Capital Share Transactions | | |
| Issued | 1,168,235 | 1,104,538 |
| Issued in Lieu of Cash Distributions | 150,155 | 156,702 |
| Redeemed | (1,013,845) | (1,106,905) |
| Net Increase (Decrease) from Capital Share Transactions | 304,545 | 154,335 |
| Total Increase (Decrease) | 828,922 | 643,851 |
| Net Assets | | |
| Beginning of Period | 5,486,912 | 4,843,061 |
| End of Period1 | 6,315,834 | 5,486,912 |
| 1 Net Assets—End of Period includes undistributed net investment income of $9,768,000 and $10,039,000. | |
See accompanying Notes, which are an integral part of the Financial Statements.
25
LifeStrategy Conservative Growth Fund
| | | | | |
| Financial Highlights | | | | | |
| |
| |
| For a Share Outstanding | | | Year Ended October 31, |
| Throughout Each Period | 2010 | 2009 | 2008 | 2007 | 2006 |
| Net Asset Value, Beginning of Period | $14.81 | $13.46 | $17.61 | $16.43 | $15.24 |
| Investment Operations | | | | | |
| Net Investment Income | .406 | .439 | .568 | .580 | .500 |
| Capital Gain Distributions Received | — | — | — | — | — |
| Net Realized and Unrealized Gain (Loss) | | | | | |
| on Investments | 1.392 | 1.359 | (4.116) | 1.170 | 1.180 |
| Total from Investment Operations | 1.798 | 1.798 | (3.548) | 1.750 | 1.680 |
| Distributions | | | | | |
| Dividends from Net Investment Income | (.408) | (.448) | (.592) | (.570) | (.490) |
| Distributions from Realized Capital Gains | — | — | (.010) | — | — |
| Total Distributions | (.408) | (.448) | (.602) | (.570) | (.490) |
| Net Asset Value, End of Period | $16.20 | $14.81 | $13.46 | $17.61 | $16.43 |
| |
| Total Return1 | 12.30% | 13.72% | -20.71% | 10.84% | 11.23% |
| |
| Ratios/Supplemental Data | | | | | |
| Net Assets, End of Period (Millions) | $6,316 | $5,487 | $4,843 | $7,044 | $5,326 |
| Ratio of Total Expenses to | | | | | |
| Average Net Assets | — | — | — | — | — |
| Acquired Fund Fees and Expenses | 0.19% | 0.24% | 0.22% | 0.24% | 0.26% |
| Ratio of Net Investment Income to | | | | | |
| Average Net Assets | 2.63% | 3.23% | 3.52% | 3.40% | 3.21% |
| Portfolio Turnover Rate | 15% | 29%2 | 22% | 10% | 4% |
1 Total returns do not include account service fees that may have applied in the periods shown. Fund prospectuses provide information about any applicable account service fees.
2 Excludes the value of mutual fund shares delivered and received in connection with a change in the fund’s bond investments from Vanguard Total Bond Market Index Fund to Vanguard Total Bond Market II Index Fund because those transactions were effected in kind and did not cause the fund to incur transaction costs.
See accompanying Notes, which are an integral part of the Financial Statements.
26
LifeStrategy Conservative Growth Fund
Notes to Financial Statements
Vanguard LifeStrategy Conservative Growth Fund is registered under the Investment Company Act of 1940 as an open-end investment company, or mutual fund. The fund follows a balanced investment strategy by investing in selected Vanguard funds to achieve its targeted allocation of assets to U.S. stocks, international stocks, bonds, and short-term reserves.
A. The following significant accounting policies conform to generally accepted accounting principles for U.S. mutual funds. The fund consistently follows such policies in preparing its financial statements.
1. Security Valuation: Investments are valued at the net asset value of each underlying Vanguard fund determined as of the close of the New York Stock Exchange (generally 4 p.m., Eastern time) on the valuation date.
2. Federal Income Taxes: The fund intends to continue to qualify as a regulated investment company and distribute all of its taxable income. Management has analyzed the fund’s tax positions taken for all open federal income tax years (October 31, 2007–2010), and has concluded that no provision for federal income tax is required in the fund’s financial statements.
3. Distributions: Distributions to shareholders are recorded on the ex-dividend date.
4. Other: Income and capital gain distributions received are recorded on the ex-dividend date. Security transactions are accounted for on the date securities are bought or sold. Costs used to determine realized gains (losses) on the sale of investment securities are those of the specific securities sold.
B. Under a service agreement, The Vanguard Group furnishes corporate management, administrative, marketing, and distribution services to the fund. The service agreement provides that the fund’s expenses may be reduced or eliminated to the extent of savings realized by the Vanguard funds by the operation of the fund. Accordingly, all incremental expenses for services provided by Vanguard and all other expenses incurred by the fund during the year ended October 31, 2010, were borne by the funds in which the fund invests. The fund’s trustees and officers are also directors and officers of Vanguard and the funds in which the fund invests.
C. Various inputs may be used to determine the value of the fund’s investments. These inputs are summarized in three broad levels for financial statement purposes. The inputs or methodologies used to value securities are not necessarily an indication of the risk associated with investing in those securities.
Level 1—Quoted prices in active markets for identical securities.
Level 2—Other significant observable inputs (including quoted prices for similar securities, interest rates, prepayment speeds, credit risk, etc.).
Level 3—Significant unobservable inputs (including the fund’s own assumptions used to determine the fair value of investments).
At October 31, 2010, 100% of the fund’s investments were valued based on Level 1 inputs.
D. Distributions are determined on a tax basis and may differ from net investment income and realized capital gains for financial reporting purposes. Differences may be permanent or temporary. Permanent differences are reclassified among capital accounts in the financial statements to reflect their tax character. Temporary differences arise when certain items of income, expense, gain, or loss are recognized in different periods for financial statement and tax purposes; these differences will reverse at some time in the future. Differences in classification may also result from the treatment of short-term gains as ordinary income for tax purposes.
27
LifeStrategy Conservative Growth Fund
For tax purposes, at October 31, 2010, the fund had $9,629,000 of ordinary income available for distribution. The fund had available capital loss carryforwards totaling $128,619,000 to offset future net capital gains of $58,575,000 through October 31, 2016, $69,127,000 through October 31, 2017, and $917,000 through October 31, 2018.
At October 31, 2010, the cost of investment securities for tax purposes was $5,596,148,000. Net unrealized appreciation of investment securities for tax purposes was $710,091,000, consisting entirely of unrealized gains on securities that had risen in value since their purchase.
E. During the year ended October 31, 2010, the fund purchased $1,162,856,000 of investment securities and sold $862,500,000 of investment securities, other than temporary cash investments.
F. Capital shares issued and redeemed were:
| | |
| | Year Ended October 31, |
| | 2010 | 2009 |
| | Shares | Shares |
| | (000) | (000) |
| Issued | 75,603 | 81,675 |
| Issued in Lieu of Cash Distributions | 9,717 | 11,572 |
| Redeemed | (65,788) | (82,611) |
| Net Increase (Decrease) in Shares Outstanding | 19,532 | 10,636 |
G. In preparing the financial statements as of October 31, 2010, management considered the impact of subsequent events for potential recognition or disclosure in these financial statements. In September 2010, the board of trustees approved an increase in the fund’s target international equity allocation from 20% to 30% of its total equity allocation. This change is expected to be completed in the near term.
28
LifeStrategy Moderate Growth Fund
Fund Profile
As of October 31, 2010
| |
| Total Fund Characteristics | |
| Ticker Symbol | VSMGX |
| 30-Day SEC Yield | 1.83% |
| Acquired Fund Fees and Expenses1 | 0.23% |
| |
| Allocation to Underlying Vanguard Funds | |
| Vanguard Total Stock Market Index Fund | |
| Investor Shares | 35.1% |
| Vanguard Total Bond Market II Index Fund | |
| Investor Shares | 29.8 |
| Vanguard Asset Allocation Fund Investor | |
| Shares | 25.0 |
| Vanguard Total International Stock Index | |
| Fund | 10.1 |
| | |
| Total Fund Volatility Measures | |
| | Moderate | DJ |
| | Growth | U.S. Total |
| | Composite | Market |
| | Index | Index |
| R-Squared | 1.00 | 0.97 |
| Beta | 1.09 | 0.68 |
These measures show the degree and timing of the fund’s fluctuations compared with the indexes over 36 months.
Fund Asset Allocation
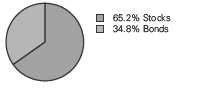
1 This figure—drawn from the prospectus dated February 26, 2010—represents an estimate of the weighted average of the expense ratios and any transaction fees charged by the underlying mutual funds (the ”acquired” funds) in which the LifeStrategy Moderate Growth Fund invests. The LifeStrategy Moderate Growth Fund does not charge any expenses or fees of its own. For the fiscal year ended October 31, 2010, the annualized acquired fund fees and expenses were 0.19%.
29
LifeStrategy Moderate Growth Fund
Performance Summary
All of the returns in this report represent past performance, which is not a guarantee of future results that may be achieved by the fund. (Current performance may be lower or higher than the performance data cited. For performance data current to the most recent month-end, visit our website at vanguard.com/performance.) Note, too, that both investment returns and principal value can fluctuate widely, so an investor’s shares, when sold, could be worth more or less than their original cost. The returns shown do not reflect taxes that a shareholder would pay on fund distributions or on the sale of fund shares.
Cumulative Performance: October 31, 2000, Through October 31, 2010
Initial Investment of $10,000
| | | | | |
| | | Average Annual Total Returns | |
| | | Periods Ended October 31, 2010 | |
| | | | | | Final Value |
| | | One | Five | Ten | of a $10,000 |
| | | Year | Years | Years | Investment |
| | LifeStrategy Moderate Growth Fund | 14.50% | 4.07% | 3.49% | $14,088 |
| •••••••• | Dow Jones U.S. Total Stock Market | | | | |
| | Index | 19.04 | 2.52 | 1.02 | 11,073 |
| – – – – | Moderate Growth Composite Index | 13.84 | 4.56 | 3.74 | 14,434 |
| | Moderate Growth Composite Average | 15.40 | 3.82 | 3.01 | 13,457 |
Moderate Growth Composite Index: Weighted 50% Dow Jones Wilshire 5000 Index, 40% Lehman U.S. Aggregate Bond Index, and 10% MSCI EAFE Index through April 22, 2005; and 50% MSCI US Broad Market Index, 40% Barclays Capital U.S. Aggregate Bond Index, and 10% MSCI EAFE Index through December 31, 2009, after which the Barclays index was replaced by the Barclays Capital U.S. Aggregate Float Adjusted Index. MSCI EAFE Index returns are adjusted for withholding taxes applicable to Luxembourg holding companies.
Moderate Growth Composite Average: Weighted 50% general equity funds average, 40% fixed income funds average, and 10% international funds average. Derived from data provided by Lipper Inc.
See Financial Highlights for dividend and capital gains information.
30
LifeStrategy Moderate Growth Fund
Fiscal-Year Total Returns (%): October 31, 2000, Through October 31, 2010
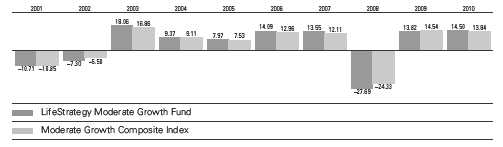
Average Annual Total Returns: Periods Ended September 30, 2010
This table presents average annual total returns through the latest calendar quarter—rather than through the end of the fiscal period. Securities and Exchange Commission rules require that we provide this information.
| | | | | | |
| | | | | | | Ten Years |
| | Inception Date | One Year | Five Years | Income | Capital | Total |
| LifeStrategy Moderate | | | | | | |
| Growth Fund | 9/30/1994 | 10.35% | 3.23% | 2.81% | 0.36% | 3.17% |
31
LifeStrategy Moderate Growth Fund
Financial Statements
Statement of Net Assets
As of October 31, 2010
The fund reports a complete list of its holdings in regulatory filings four times in each fiscal year, at the quarter-ends. For the second and fourth fiscal quarters, the lists appear in the fund’s semiannual and annual reports to shareholders. For the first and third fiscal quarters, the fund files the lists with the Securities and Exchange Commission on Form N-Q. Shareholders can look up the fund’s Forms N-Q on the SEC’s website at sec.gov. Forms N-Q may also be reviewed and copied at the SEC’s Public Reference Room (see the back cover of this report for further information).
| | |
| | | Market |
| | | Value |
| | Shares | ($000) |
| Investment Companies (99.9%) | | |
| U.S. Stock Fund (35.2%) | | |
| Vanguard Total Stock Market Index Fund Investor Shares | 95,853,102 | 2,830,542 |
| |
| International Stock Fund (10.0%) | | |
| Vanguard Total International Stock Index Fund | 52,267,134 | 809,095 |
| |
| Balanced Fund (24.9%) | | |
| Vanguard Asset Allocation Fund Investor Shares | 84,782,376 | 2,007,647 |
| |
| Bond Fund (29.8%) | | |
| 1 Vanguard Total Bond Market II Index Fund Investor Shares | 221,763,345 | 2,395,044 |
| Total Investment Companies (Cost $6,706,488) | | 8,042,328 |
| Temporary Cash Investment (0.0%) | | |
| Money Market Fund (0.0%) | | |
| 1 Vanguard Market Liquidity Fund, 0.237% (Cost $1,595) | 1,595,000 | 1,595 |
| Total Investments (99.9%) (Cost $6,708,083) | | 8,043,923 |
| Other Assets and Liabilities (0.1%) | | |
| Other Assets | | 16,621 |
| Liabilities | | (11,133) |
| | | 5,488 |
| Net Assets (100%) | | |
| Applicable to 418,894,772 outstanding $.001 par value shares of | | |
| beneficial interest (unlimited authorization) | | 8,049,411 |
| Net Asset Value Per Share | | $19.22 |
32
LifeStrategy Moderate Growth Fund
| |
| At October 31, 2010, net assets consisted of: | |
| | Amount |
| | ($000) |
| Paid-in Capital | 6,862,789 |
| Undistributed Net Investment Income | 55,556 |
| Accumulated Net Realized Losses | (204,774) |
| Unrealized Appreciation (Depreciation) | 1,335,840 |
| Net Assets | 8,049,411 |
See Note A in Notes to Financial Statements.
1 Affiliated fund available only to Vanguard funds and certain trusts and accounts managed by Vanguard. Rate shown for Vanguard Market Liquidity Fund is the 7-day yield.
See accompanying Notes, which are an integral part of the Financial Statements.
33
LifeStrategy Moderate Growth Fund
| |
| Statement of Operations | |
| |
| | Year Ended |
| | October 31, 2010 |
| | ($000) |
| Investment Income | |
| Income | |
| Income Distributions Received | 187,165 |
| Net Investment Income—Note B | 187,165 |
| Realized Net Gain (Loss) on Investment Securities Sold | (10,517) |
| Change in Unrealized Appreciation (Depreciation) of Investment Securities | 866,656 |
| Net Increase (Decrease) in Net Assets Resulting from Operations | 1,043,304 |
See accompanying Notes, which are an integral part of the Financial Statements.
34
LifeStrategy Moderate Growth Fund
| | |
| Statement of Changes in Net Assets | | |
| |
| | Year Ended October 31, |
| | 2010 | 2009 |
| | ($000) | ($000) |
| Increase (Decrease) in Net Assets | | |
| Operations | | |
| Net Investment Income | 187,165 | 207,758 |
| Realized Net Gain (Loss) | (10,517) | (58,372) |
| Change in Unrealized Appreciation (Depreciation) | 866,656 | 802,770 |
| Net Increase (Decrease) in Net Assets Resulting from Operations | 1,043,304 | 952,156 |
| Distributions | | |
| Net Investment Income | (174,437) | (225,842) |
| Realized Capital Gain | — | — |
| Total Distributions | (174,437) | (225,842) |
| Capital Share Transactions | | |
| Issued | 1,137,142 | 1,203,383 |
| Issued in Lieu of Cash Distributions | 171,558 | 222,292 |
| Redeemed | (1,754,214) | (1,933,510) |
| Net Increase (Decrease) from Capital Share Transactions | (445,514) | (507,835) |
| Total Increase (Decrease) | 423,353 | 218,479 |
| Net Assets | | |
| Beginning of Period | 7,626,058 | 7,407,579 |
| End of Period1 | 8,049,411 | 7,626,058 |
| 1 Net Assets—End of Period includes undistributed net investment income of $55,556,000 and $42,828,000. | |
See accompanying Notes, which are an integral part of the Financial Statements.
35
LifeStrategy Moderate Growth Fund
| | | | | |
| Financial Highlights | | | | | |
| |
| |
| For a Share Outstanding | | | Year Ended October 31, |
| Throughout Each Period | 2010 | 2009 | 2008 | 2007 | 2006 |
| Net Asset Value, Beginning of Period | $17.16 | $15.56 | $22.21 | $20.09 | $18.09 |
| Investment Operations | | | | | |
| Net Investment Income | .431 | .450 | .607 | .580 | .510 |
| Capital Gain Distributions Received | — | — | — | — | — |
| Net Realized and Unrealized Gain (Loss) | | | | | |
| on Investments | 2.023 | 1.632 | (6.606) | 2.100 | 1.990 |
| Total from Investment Operations | 2.454 | 2.082 | (5.999) | 2.680 | 2.500 |
| Distributions | | | | | |
| Dividends from Net Investment Income | (.394) | (.482) | (.627) | (.560) | (.500) |
| Distributions from Realized Capital Gains | — | — | (.024) | — | — |
| Total Distributions | (.394) | (.482) | (.651) | (.560) | (.500) |
| Net Asset Value, End of Period | $19.22 | $17.16 | $15.56 | $22.21 | $20.09 |
| |
| Total Return1 | 14.50% | 13.82% | -27.69% | 13.55% | 14.09% |
| |
| Ratios/Supplemental Data | | | | | |
| Net Assets, End of Period (Millions) | $8,049 | $7,626 | $7,408 | $11,272 | $9,463 |
| Ratio of Total Expenses to | | | | | |
| Average Net Assets | — | — | — | — | — |
| Acquired Fund Fees and Expenses | 0.19% | 0.23% | 0.22% | 0.23% | 0.26% |
| Ratio of Net Investment Income to | | | | | |
| Average Net Assets | 2.37% | 2.89% | 2.98% | 2.81% | 2.70% |
| Portfolio Turnover Rate | 17% | 25%2 | 18% | 7% | 8% |
1 Total returns do not include account service fees that may have applied in the periods shown. Fund prospectuses provide information about any applicable account service fees.
2 Excludes the value of mutual fund shares delivered and received in connection with a change in the fund’s bond investments from Vanguard Total Bond Market Index Fund to Vanguard Total Bond Market II Index Fund because those transactions were effected in kind and did not cause the fund to incur transaction costs.
See accompanying Notes, which are an integral part of the Financial Statements.
36
LifeStrategy Moderate Growth Fund
Notes to Financial Statements
Vanguard LifeStrategy Moderate Growth Fund is registered under the Investment Company Act of 1940 as an open-end investment company, or mutual fund. The fund follows a balanced investment strategy by investing in selected Vanguard funds to achieve its targeted allocation of assets to U.S. stocks, international stocks, bonds, and short-term reserves.
A. The following significant accounting policies conform to generally accepted accounting principles for U.S. mutual funds. The fund consistently follows such policies in preparing its financial statements.
1. Security Valuation: Investments are valued at the net asset value of each underlying Vanguard fund determined as of the close of the New York Stock Exchange (generally 4 p.m., Eastern time) on the valuation date.
2. Federal Income Taxes: The fund intends to continue to qualify as a regulated investment company and distribute all of its taxable income. Management has analyzed the fund’s tax positions taken for all open federal income tax years (October 31, 2007–2010), and has concluded that no provision for federal income tax is required in the fund’s financial statements.
3. Distributions: Distributions to shareholders are recorded on the ex-dividend date.
4. Other: Income and capital gain distributions received are recorded on the ex-dividend date. Security transactions are accounted for on the date securities are bought or sold. Costs used to determine realized gains (losses) on the sale of investment securities are those of the specific securities sold.
B. Under a service agreement, The Vanguard Group furnishes corporate management, administrative, marketing, and distribution services to the fund. The service agreement provides that the fund’s expenses may be reduced or eliminated to the extent of savings realized by the Vanguard funds by the operation of the fund. Accordingly, all incremental expenses for services provided by Vanguard and all other expenses incurred by the fund during the year ended October 31, 2010, were borne by the funds in which the fund invests. The fund’s trustees and officers are also directors and officers of Vanguard and the funds in which the fund invests.
C. Various inputs may be used to determine the value of the fund’s investments. These inputs are summarized in three broad levels for financial statement purposes. The inputs or methodologies used to value securities are not necessarily an indication of the risk associated with investing in those securities.
Level 1—Quoted prices in active markets for identical securities.
Level 2—Other significant observable inputs (including quoted prices for similar securities, interest rates, prepayment speeds, credit risk, etc.).
Level 3—Significant unobservable inputs (including the fund’s own assumptions used to determine the fair value of investments).
At October 31, 2010, 100% of the fund’s investments were valued based on Level 1 inputs.
D. Distributions are determined on a tax basis and may differ from net investment income and realized capital gains for financial reporting purposes. Differences may be permanent or temporary. Permanent differences are reclassified among capital accounts in the financial statements to reflect their tax character. Temporary differences arise when certain items of income, expense, gain, or loss are recognized in different periods for financial statement and tax purposes; these differences will reverse at some time in the future. Differences in classification may also result from the treatment of short-term gains as ordinary income for tax purposes.
37
LifeStrategy Moderate Growth Fund
For tax purposes, at October 31, 2010, the fund had $55,367,000 of ordinary income available for distribution. The fund had available capital loss carryforwards totaling $204,585,000 to offset future net capital gains of $45,187,000 through October 31, 2016, $146,638,000 through October 31, 2017, and $12,760,000 through October 31, 2018.
At October 31, 2010, the cost of investment securities for tax purposes was $6,708,083,000. Net unrealized appreciation of investment securities for tax purposes was $1,335,840,000, consisting entirely of unrealized gains on securities that had risen in value since their purchase.
E. During the year ended October 31, 2010, the fund purchased $1,316,113,000 of investment securities and sold $1,751,993,000 of investment securities, other than temporary cash investments.
F. Capital shares issued and redeemed were:
| | |
| | Year Ended October 31, |
| | 2010 | 2009 |
| | Shares | Shares |
| | (000) | (000) |
| Issued | 62,942 | 79,071 |
| Issued in Lieu of Cash Distributions | 9,670 | 14,687 |
| Redeemed | (98,056) | (125,352) |
| Net Increase (Decrease) in Shares Outstanding | (25,444) | (31,594) |
G. In preparing the financial statements as of October 31, 2010, management considered the impact of subsequent events for potential recognition or disclosure in these financial statements. In September 2010, the board of trustees approved an increase in the fund’s target international equity allocation from 20% to 30% of its total equity allocation. This change is expected to be completed in the near term.
38
LifeStrategy Growth Fund
Fund Profile
As of October 31, 2010
| |
| Total Fund Characteristics | |
| Ticker Symbol | VASGX |
| 30-Day SEC Yield | 1.83% |
| Acquired Fund Fees and Expenses1 | 0.23% |
| |
| Allocation to Underlying Vanguard Funds | |
| Vanguard Total Stock Market Index Fund | |
| Investor Shares | 50.1% |
| Vanguard Asset Allocation Fund Investor | |
| Shares | 24.9 |
| Vanguard Total International Stock Index | |
| Fund | 15.1 |
| Vanguard Total Bond Market II Index Fund | |
| Investor Shares | 9.9 |
| | |
| Total Fund Volatility Measures | |
| | | DJ |
| | Growth | U.S. Total |
| | Composite | Market |
| | Index | Index |
| R-Squared | 1.00 | 0.99 |
| Beta | 1.08 | 0.89 |
These measures show the degree and timing of the fund’s fluctuations compared with the indexes over 36 months.
Fund Asset Allocation
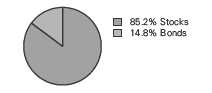
1 This figure—drawn from the prospectus dated February 26, 2010—represents an estimate of the weighted average of the expense ratios and any transaction fees charged by the underlying mutual funds (the ”acquired” funds) in which the LifeStrategy Growth Fund invests. The LifeStrategy Growth Fund does not charge any expenses or fees of its own. For the fiscal year ended October 31, 2010, the annualized acquired fund fees and expenses were 0.20%.
39
LifeStrategy Growth Fund
Performance Summary
All of the returns in this report represent past performance, which is not a guarantee of future results that may be achieved by the fund. (Current performance may be lower or higher than the performance data cited. For performance data current to the most recent month-end, visit our website at vanguard.com/performance.) Note, too, that both investment returns and principal value can fluctuate widely, so an investor’s shares, when sold, could be worth more or less than their original cost. The returns shown do not reflect taxes that a shareholder would pay on fund distributions or on the sale of fund shares.
Cumulative Performance: October 31, 2000, Through October 31, 2010
Initial Investment of $10,000
| | | | | |
| | | Average Annual Total Returns | |
| | | Periods Ended October 31, 2010 | |
| | | | | | Final Value |
| | | One | Five | Ten | of a $10,000 |
| | | Year | Years | Years | Investment |
| | LifeStrategy Growth Fund | 16.21% | 3.17% | 2.42% | $12,701 |
| •••••••• | Dow Jones U.S. Total Stock Market | | | | |
| | Index | 19.04 | 2.52 | 1.02 | 11,073 |
| – – – – | Growth Composite Index | 15.29 | 3.67 | 2.65 | 12,989 |
| | Growth Composite Average | 16.92 | 3.15 | 2.10 | 12,313 |
Growth Composite Index: Weighted 65% Dow Jones Wilshire 5000 Index, 20% Lehman U.S. Aggregate Bond Index, and 15% MSCI EAFE Index through April 22, 2005; and 65% MSCI US Broad Market Index, 20% Barclays Capital U.S. Aggregate Bond Index, and 15% MSCI EAFE Index through December 31, 2009, after which the Barclays index was replaced by the Barclays Capital U.S. Aggregate Float Adjusted Index. MSCI EAFE Index returns are adjusted for withholding taxes applicable to Luxembourg holding companies.
Growth Composite Average: Weighted 65% general equity funds average, 20% fixed income funds average, and 15% international funds average. Derived from data provided by Lipper Inc.
See Financial Highlights for dividend and capital gains information.
40
LifeStrategy Growth Fund
Fiscal-Year Total Returns (%): October 31, 2000, Through October 31, 2010

Average Annual Total Returns: Periods Ended September 30, 2010
This table presents average annual total returns through the latest calendar quarter—rather than through the end of the fiscal period. Securities and Exchange Commission rules require that we provide this information.
| | | | | | |
| | | | | | | Ten Years |
| | Inception Date | One Year | Five Years | Income | Capital | Total |
| LifeStrategy Growth Fund | 9/30/1994 | 10.53% | 2.13% | 2.15% | -0.18% | 1.97% |
41
LifeStrategy Growth Fund
Financial Statements
Statement of Net Assets
As of October 31, 2010
The fund reports a complete list of its holdings in regulatory filings four times in each fiscal year, at the quarter-ends. For the second and fourth fiscal quarters, the lists appear in the fund’s semiannual and annual reports to shareholders. For the first and third fiscal quarters, the fund files the lists with the Securities and Exchange Commission on Form N-Q. Shareholders can look up the fund’s Forms N-Q on the SEC’s website at sec.gov. Forms N-Q may also be reviewed and copied at the SEC’s Public Reference Room (see the back cover of this report for further information).
| | |
| | | Market |
| | | Value |
| | Shares | ($000) |
| Investment Companies (99.7%) | | |
| U.S. Stock Fund (50.0%) | | |
| Vanguard Total Stock Market Index Fund Investor Shares | 125,712,566 | 3,712,292 |
| |
| International Stock Fund (15.1%) | | |
| Vanguard Total International Stock Index Fund | 72,404,957 | 1,120,829 |
| |
| Balanced Fund (24.8%) | | |
| Vanguard Asset Allocation Fund Investor Shares | 77,902,204 | 1,844,724 |
| |
| Bond Fund (9.8%) | | |
| 1 Vanguard Total Bond Market II Index Fund Investor Shares | 67,657,532 | 730,701 |
| Total Investments (99.7%) (Cost $6,333,942) | | 7,408,546 |
| Other Assets and Liabilities (0.3%) | | |
| Other Assets | | 26,918 |
| Liabilities | | (4,848) |
| | | 22,070 |
| Net Assets (100%) | | |
| Applicable to 349,240,456 outstanding $.001 par value shares of | | |
| beneficial interest (unlimited authorization) | | 7,430,616 |
| Net Asset Value Per Share | | $21.28 |
| |
| At October 31, 2010, net assets consisted of: | |
| | Amount |
| | ($000) |
| Paid-in Capital | 6,386,269 |
| Undistributed Net Investment Income | 40,293 |
| Accumulated Net Realized Losses | (70,550) |
| Unrealized Appreciation (Depreciation) | 1,074,604 |
| Net Assets | 7,430,616 |
See Note A in Notes to Financial Statements.
1 Affiliated fund available only to Vanguard funds and certain trusts and accounts managed by Vanguard.
See accompanying Notes, which are an integral part of the Financial Statements.
42
LifeStrategy Growth Fund
| |
| Statement of Operations | |
| |
| | Year Ended |
| | October 31, 2010 |
| | ($000) |
| Investment Income | |
| Income | |
| Income Distributions Received | 147,564 |
| Net Investment Income—Note B | 147,564 |
| Realized Net Gain (Loss) on Investment Securities Sold | 107,354 |
| Change in Unrealized Appreciation (Depreciation) of Investment Securities | 790,461 |
| Net Increase (Decrease) in Net Assets Resulting from Operations | 1,045,379 |
See accompanying Notes, which are an integral part of the Financial Statements.
43
LifeStrategy Growth Fund
| | |
| Statement of Changes in Net Assets | | |
| |
| | Year Ended October 31, |
| | 2010 | 2009 |
| | ($000) | ($000) |
| Increase (Decrease) in Net Assets | | |
| Operations | | |
| Net Investment Income | 147,564 | 155,405 |
| Realized Net Gain (Loss) | 107,354 | (85,614) |
| Change in Unrealized Appreciation (Depreciation) | 790,461 | 754,889 |
| Net Increase (Decrease) in Net Assets Resulting from Operations | 1,045,379 | 824,680 |
| Distributions | | |
| Net Investment Income | (131,354) | (163,404) |
| Realized Capital Gain | — | — |
| Total Distributions | (131,354) | (163,404) |
| Capital Share Transactions | | |
| Issued | 944,850 | 960,129 |
| Issued in Lieu of Cash Distributions | 129,656 | 161,307 |
| Redeemed | (1,178,832) | (1,428,334) |
| Net Increase (Decrease) from Capital Share Transactions | (104,326) | (306,898) |
| Total Increase (Decrease) | 809,699 | 354,378 |
| Net Assets | | |
| Beginning of Period | 6,620,917 | 6,266,539 |
| End of Period1 | 7,430,616 | 6,620,917 |
| 1 Net Assets—End of Period includes undistributed net investment income of $40,293,000 and $24,083,000. | |
See accompanying Notes, which are an integral part of the Financial Statements.
44
LifeStrategy Growth Fund
| | | | | |
| Financial Highlights | | | | | |
| |
| |
| For a Share Outstanding | | | Year Ended October 31, |
| Throughout Each Period | 2010 | 2009 | 2008 | 2007 | 2006 |
| Net Asset Value, Beginning of Period | $18.66 | $16.86 | $26.56 | $23.32 | $20.37 |
| Investment Operations | | | | | |
| Net Investment Income | .417 | .423 | .571 | .540 | .450 |
| Capital Gain Distributions Received | — | — | — | — | — |
| Net Realized and Unrealized Gain (Loss) | | | | | |
| on Investments | 2.573 | 1.818 | (9.690) | 3.220 | 2.950 |
| Total from Investment Operations | 2.990 | 2.241 | (9.119) | 3.760 | 3.400 |
| Distributions | | | | | |
| Dividends from Net Investment Income | (.370) | (.441) | (.581) | (.520) | (.450) |
| Distributions from Realized Capital Gains | — | — | — | — | — |
| Total Distributions | (.370) | (.441) | (.581) | (.520) | (.450) |
| Net Asset Value, End of Period | $21.28 | $18.66 | $16.86 | $26.56 | $23.32 |
| |
| Total Return1 | 16.21% | 13.74% | -34.98% | 16.32% | 16.94% |
| |
| Ratios/Supplemental Data | | | | | |
| Net Assets, End of Period (Millions) | $7,431 | $6,621 | $6,267 | $10,372 | $8,422 |
| Ratio of Total Expenses to | | | | | |
| Average Net Assets | — | — | — | — | — |
| Acquired Fund Fees and Expenses | 0.20% | 0.23% | 0.21% | 0.23% | 0.27% |
| Ratio of Net Investment Income to | | | | | |
| Average Net Assets | 2.09% | 2.57% | 2.47% | 2.15% | 2.07% |
| Portfolio Turnover Rate | 11% | 12%2 | 10% | 4% | 3% |
1 Total returns do not include account service fees that may have applied in the periods shown. Fund prospectuses provide information about any applicable account service fees.
2 Excludes the value of mutual fund shares delivered and received in connection with a change in the fund’s bond investments from Vanguard Total Bond Market Index Fund to Vanguard Total Bond Market II Index Fund because those transactions were effected in kind and did not cause the fund to incur transaction costs.
See accompanying Notes, which are an integral part of the Financial Statements.
45
LifeStrategy Growth Fund
Notes to Financial Statements
Vanguard LifeStrategy Growth Fund is registered under the Investment Company Act of 1940 as an open-end investment company, or mutual fund. The fund follows a balanced investment strategy by investing in selected Vanguard funds to achieve its targeted allocation of assets to U.S. stocks, international stocks, bonds, and short-term reserves.
A. The following significant accounting policies conform to generally accepted accounting principles for U.S. mutual funds. The fund consistently follows such policies in preparing its financial statements.
1. Security Valuation: Investments are valued at the net asset value of each underlying Vanguard fund determined as of the close of the New York Stock Exchange (generally 4 p.m., Eastern time) on the valuation date.
2. Federal Income Taxes: The fund intends to continue to qualify as a regulated investment company and distribute all of its taxable income. Management has analyzed the fund’s tax positions taken for all open federal income tax years (October 31, 2007–2010), and has concluded that no provision for federal income tax is required in the fund’s financial statements.
3. Distributions: Distributions to shareholders are recorded on the ex-dividend date.
4. Other: Income and capital gain distributions received are recorded on the ex-dividend date. Security transactions are accounted for on the date securities are bought or sold. Costs used to determine realized gains (losses) on the sale of investment securities are those of the specific securities sold.
B. Under a service agreement, The Vanguard Group furnishes corporate management, administrative, marketing, and distribution services to the fund. The service agreement provides that the fund’s expenses may be reduced or eliminated to the extent of savings realized by the Vanguard funds by the operation of the fund. Accordingly, all incremental expenses for services provided by Vanguard and all other expenses incurred by the fund during the year ended October 31, 2010, were borne by the funds in which the fund invests. The fund’s trustees and officers are also directors and officers of Vanguard and the funds in which the fund invests.
C. Various inputs may be used to determine the value of the fund’s investments. These inputs are summarized in three broad levels for financial statement purposes. The inputs or methodologies used to value securities are not necessarily an indication of the risk associated with investing in those securities.
Level 1—Quoted prices in active markets for identical securities.
Level 2—Other significant observable inputs (including quoted prices for similar securities, interest rates, prepayment speeds, credit risk, etc.).
Level 3—Significant unobservable inputs (including the fund’s own assumptions used to determine the fair value of investments).
At October 31, 2010, 100% of the fund’s investments were valued based on Level 1 inputs.
D. Distributions are determined on a tax basis and may differ from net investment income and realized capital gains for financial reporting purposes. Differences may be permanent or temporary. Permanent differences are reclassified among capital accounts in the financial statements to reflect their tax character. Temporary differences arise when certain items of income, expense, gain, or loss are recognized in different periods for financial statement and tax purposes; these differences will reverse at some time in the future. Differences in classification may also result from the treatment of short-term gains as ordinary income for tax purposes.
46
LifeStrategy Growth Fund
For tax purposes, at October 31, 2010, the fund had $39,083,000 of ordinary income available for distribution. The fund had available capital loss carryforwards totaling $69,340,000 to offset future net capital gains through October 31, 2017.
At October 31, 2010, the cost of investment securities for tax purposes was $6,333,942,000. Net unrealized appreciation of investment securities for tax purposes was $1,074,604,000, consisting entirely of unrealized gains on securities that had risen in value since their purchase.
E. During the year ended October 31, 2010, the fund purchased $742,525,000 of investment securities and sold $847,837,000 of investment securities, other than temporary cash investments.
F. Capital shares issued and redeemed were:
| | |
| | Year Ended October 31, |
| | 2010 | 2009 |
| | Shares | Shares |
| | (000) | (000) |
| Issued | 47,488 | 59,731 |
| Issued in Lieu of Cash Distributions | 6,633 | 10,050 |
| Redeemed | (59,624) | (86,682) |
| Net Increase (Decrease) in Shares Outstanding | (5,503) | (16,901) |
G. In preparing the financial statements as of October 31, 2010, management considered the impact of subsequent events for potential recognition or disclosure in these financial statements. In September 2010, the board of trustees approved an increase in the fund’s target international equity allocation from 20% to 30% of its total equity allocation. This change is expected to be completed in the near term.
47
Report of Independent Registered Public Accounting Firm
To the Trustees of Vanguard STAR Funds and the Shareholders of Vanguard LifeStrategy Income Fund, Vanguard LifeStrategy Conservative Growth Fund, Vanguard LifeStrategy Moderate Growth Fund and Vanguard LifeStrategy Growth Fund:
In our opinion, the accompanying statements of net assets and the related statements of operations and of changes in net assets and the financial highlights present fairly, in all material respects, the financial position of Vanguard LifeStrategy Income Fund, Vanguard LifeStrategy Conservative Growth Fund, Vanguard LifeStrategy Moderate Growth Fund and Vanguard LifeStrategy Growth Fund (constituting four separate portfolios of Vanguard STAR Funds, hereafter referred to as the “Funds”) at October 31, 2010, the results of each of their operations for the year then ended, the changes in each of their net assets for each of the two years in the period then ended and the financial highlights for each of the five years in the period then ended, in conformity with accounting principles generally accepted in the United States of America. These financial statements and financial highlights (hereafter referred to as “ financial statements”) are the responsibility of the Funds’ management; our responsibility is to express an opinion on these financial statements based on our audits. We conducted our audits of these financial statements in accordance with the standards of the Public Company Accounting Oversight Board (United States). Those standards require that we plan and perform the audit to obtain reasonable assurance about whether the financial statements are free of material misstatement.
An audit includes examining, on a test basis, evidence supporting the amounts and disclosures in the financial statements, assessing the accounting principles used and significant estimates made by management, and evaluating the overall financial statement presentation. We believe that our audits, which included confirmation of securities at October 31, 2010 by agreement to the underlying ownership records for the Vanguard funds, provide a reasonable basis for our opinion.
PricewaterhouseCoopers LLP
Philadelphia, Pennsylvania
December 9, 2010
48
|
| Special 2010 tax information (unaudited) for Vanguard LifeStrategy Funds |
This information for the fiscal year ended October 31, 2010, is included pursuant to provisions of the Internal Revenue Code.
The funds distributed qualified dividend income to shareholders during the fiscal year as follows:
| |
| | Qualified Dividend Income |
| LifeStrategy Fund | ($000) |
| Income | 9,115 |
| Conservative Growth | 48,423 |
| Moderate Growth | 88,808 |
| Growth | 99,528 |
For corporate shareholders, the percentage of investment income (dividend income plus short-term gains, if any) that qualifies for the dividends-received deduction is as follows:
| |
| LifeStrategy Fund | Percentage |
| Income | 14.9% |
| Conservative Growth | 27.1 |
| Moderate Growth | 42.1 |
| Growth | 60.8 |
49
Your Fund’s After-Tax Returns
This table presents returns for your fund both before and after taxes. The after-tax returns are shown in two ways: (1) assuming that an investor owned the fund during the entire period and paid taxes on the fund’s distributions, and (2) assuming that an investor paid taxes on the fund’s distributions and sold all shares at the end of each period.
Calculations are based on the highest individual federal income tax and capital gains tax rates in effect at the times of the distributions and the hypothetical sales. State and local taxes were not considered. After-tax returns reflect any qualified dividend income , using actual prior-year figures and estimates for 2010. (In the example, returns after the sale of fund shares may be higher than those assuming no sale. This occurs when the sale would have produced a capital loss. The calculation assumes that the investor received a tax deduction for the loss.) Please note that your actual after-tax returns will depend on your tax situation and may differ from those shown. Also note that if you own the fund in a tax-deferred account, such as an individual retirement account or a 401(k) plan, this information does not apply to you. Such accounts are not subject to current taxes.
Finally, keep in mind that a fund’s performance—whether before or after taxes—does not guarantee future results.
| | | |
| Average Annual Total Returns: LifeStrategy Funds | | | |
| Periods Ended October 31, 2010 | | | |
| | One | Five | Ten |
| | Year | Years | Years |
| LifeStrategy Income Fund | | | |
| Returns Before Taxes | 10.32% | 5.08% | 4.86% |
| Returns After Taxes on Distributions | 9.32 | 3.80 | 3.46 |
| Returns After Taxes on Distributions and Sale of Fund Shares | 6.77 | 3.63 | 3.35 |
| |
| | One | Five | Ten |
| | Year | Years | Years |
| LifeStrategy Conservative Growth Fund | | | |
| Returns Before Taxes | 12.30% | 4.54% | 4.15% |
| Returns After Taxes on Distributions | 11.46 | 3.55 | 3.02 |
| Returns After Taxes on Distributions and Sale of Fund Shares | 8.14 | 3.37 | 2.91 |
| |
| | One | Five | Ten |
| | Year | Years | Years |
| LifeStrategy Moderate Growth Fund | | | |
| Returns Before Taxes | 14.50% | 4.07% | 3.49% |
| Returns After Taxes on Distributions | 13.88 | 3.32 | 2.62 |
| Returns After Taxes on Distributions and Sale of Fund Shares | 9.63 | 3.14 | 2.52 |
50
| | | |
| Average Annual Total Returns: LifeStrategy Funds | | | |
| Periods Ended October 31, 2010 | | | |
| |
| | One | Five | Ten |
| | Year | Years | Years |
| LifeStrategy Growth Fund | | | |
| Returns Before Taxes | 16.21% | 3.17% | 2.42% |
| Returns After Taxes on Distributions | 15.78 | 2.69 | 1.85 |
| Returns After Taxes on Distributions and Sale of Fund Shares | 10.81 | 2.56 | 1.80 |
51
About Your Fund’s Expenses
As a shareholder of the fund, you incur ongoing costs, which include costs for portfolio management, administrative services, and shareholder reports (like this one), among others. Operating expenses, which are deducted from a fund’s gross income, directly reduce the investment return of the fund.
A typical fund’s expenses are expressed as a percentage of its average net assets. The LifeStrategy Funds have no direct expenses, but each fund bears its proportionate share of the costs for the underlying funds in which it invests. These indirect expenses make up the acquired fund fees and expenses, also expressed as a percentage of average net assets.
The following examples are intended to help you understand the ongoing cost (in dollars) of investing in your fund and to compare these costs with those of other mutual funds. The examples are based on an investment of $1,000 made at the beginning of the period shown and held for the entire period. The costs were calculated using the acquired fund fees and expenses for each LifeStrategy Fund.
The accompanying table illustrates your fund’s costs in two ways:
• Based on actual fund return. This section helps you to estimate the actual expenses that you paid over the period. The ”Ending Account Value“ shown is derived from the fund‘s actual return, and the third column shows the dollar amount that would have been paid by an investor who started with $1,000 in the fund. You may use the information here, together with the amount you invested, to estimate the expenses that you paid over the period.
To do so, simply divide your account value by $1,000 (for example, an $8,600 account value divided by $1,000 = 8.6), then multiply the result by the number given for your fund under the heading ”Expenses Paid During Period.“
• Based on hypothetical 5% yearly return. This section is intended to help you compare your fund‘s costs with those of other mutual funds. It assumes that the fund had a yearly return of 5% before expenses, but that the expense ratio is unchanged. In this case—because the return used is not the fund’s actual return—the results do not apply to your investment. The example is useful in making comparisons because the Securities and Exchange Commission requires all mutual funds to calculate expenses based on a 5% return. You can assess your fund’s costs by comparing this hypothetical example with the hypothetical examples that appear in shareholder reports of other funds.
Note that the expenses shown in the table are meant to highlight and help you compare ongoing costs only and do not reflect transaction costs incurred by the fund for buying and selling securities. Further, the expenses do not include the account service fee described in the prospectus. If such a fee were applied to your account, your costs would be higher. Your fund does not charge transaction fees, such as purchase or redemption fees, nor does it carry a “sales load.” The calculations assume no shares were bought or sold during the period. Your actual costs may have been higher or lower, depending on the amount of your investment and the timing of any purchases or redemptions.
You can find more information about the fund’s expenses, including annual expense ratios, in the Financial Statements section of this report. For additional information on operating expenses and other shareholder costs, please refer to your fund’s current prospectus.
52
| | | |
| Six Months Ended October 31, 2010 | | | |
| | Beginning | Ending | Expenses |
| | Account Value | Account Value | Paid During |
| | 4/30/2010 | 10/31/2010 | Period |
| Based on Actual Fund Return | | | |
| LifeStrategy Income Fund | $1,000.00 | $1,046.34 | $0.93 |
| LifeStrategy Conservative Growth Fund | $1,000.00 | $1,041.85 | $0.98 |
| LifeStrategy Moderate Growth Fund | $1,000.00 | $1,040.65 | $0.98 |
| LifeStrategy Growth Fund | $1,000.00 | $1,032.84 | $1.02 |
| Based on Hypothetical 5% Yearly Return | | | |
| LifeStrategy Income Fund | $1,000.00 | $1,024.30 | $0.92 |
| LifeStrategy Conservative Growth Fund | $1,000.00 | $1,024.25 | $0.97 |
| LifeStrategy Moderate Growth Fund | $1,000.00 | $1,024.25 | $0.97 |
| LifeStrategy Growth Fund | $1,000.00 | $1,024.20 | $1.02 |
The calculations are based on acquired fund fees and expenses charged by the underlying mutual funds in which the LifeStrategy Funds invest. The LifeStrategy Funds’ annualized expense figures for the period are (in order as listed from top to bottom above) 0.18%, 0.19%, 0.19%, and 0.20%. The dollar amounts shown as ”Expenses Paid” are equal to the annualized average weighted expense ratio for the underlying funds multiplied by the average account value over the period, multiplied by the number of days in the most recent six-month period, then divided by the number of days in the most recent 12-month period.
53
Glossary
30-Day SEC Yield. A fund’s 30-day SEC yield is derived using a formula specified by the U.S. Securities and Exchange Commission. Under the formula, data related to the fund’s security holdings in the previous 30 days are used to calculate the fund’s hypothetical net income for that period, which is then annualized and divided by the fund’s estimated average net assets over the calculation period. For the purposes of this calculation, a security’s income is based on its current market yield to maturity (in the case of bonds) or its projected dividend yield (for stocks). Because the SEC yield represents hypothetical annualized income, it will differ—at times significantly—from the fund’s actual experience. As a result, the fund’s income distributions may be higher or lower than implied by the SEC yield.
Acquired Fund Fees and Expenses. Funds that invest in other Vanguard funds incur no direct expenses, but they do bear proportionate shares of the operating, administrative, and advisory expenses of the underlying funds, and they must pay any fees charged by those funds. The figure for acquired fund fees and expenses represents a weighted average of these underlying costs. Acquired is a term that the Securities and Exchange Commission applies to any mutual fund whose shares are owned by another fund.
Beta. A measure of the magnitude of a fund’s past share-price fluctuations in relation to the ups and downs of a given market index. The index is assigned a beta of 1.00. Compared with a given index, a fund with a beta of 1.20 typically would have seen its share price rise or fall by 12% when the index rose or fell by 10%. For this report, beta is based on returns over the past 36 months for both the fund and the index. Note that a fund’s beta should be reviewed in conjunction with its R-squared (see definition). The lower the R-squared, the less correlation there is between the fund and the index, and the less reliable beta is as an indicator of volatility.
Expense Ratio. The percentage of a fund’s average net assets used to pay its annual administrative and advisory expenses. These expenses directly reduce returns to investors.
Inception Date. The date on which the assets of a fund (or one of its share classes) are first invested in accordance with the fund’s investment objective. For funds with a subscription period, the inception date is the day after that period ends. Investment performance is measured from the inception date.
R-Squared. A measure of how much of a fund’s past returns can be explained by the returns from the market in general, as measured by a given index. If a fund’s total returns were precisely synchronized with an index’s returns, its R-squared would be 1.00. If the fund’s returns bore no relationship to the index’s returns, its R-squared would be 0. For this report, R-squared is based on returns over the past 36 months for both the fund and the index.
54
This page intentionally left blank.
The People Who Govern Your Fund
The trustees of your mutual fund are there to see that the fund is operated and managed in your best interests since, as a shareholder, you are a part owner of the fund. Your fund’s trustees also serve on the board of directors of The Vanguard Group, Inc., which is owned by the Vanguard funds and provides services to them on an at-cost basis.
A majority of Vanguard’s board members are independent, meaning that they have no affiliation with Vanguard or the funds they oversee, apart from the sizable personal investments they have made as private individuals. The independent board members have distinguished backgrounds in business, academia, and public service. Each of the trustees and executive officers oversees 178 Vanguard funds.
The following table provides information for each trustee and executive officer of the fund. More information about the trustees is in the Statement of Additional Information, which can be obtained, without charge, by contacting Vanguard at 800-662-7447, or online at vanguard.com.
| |
| Interested Trustee1 | Amy Gutmann |
| | Born 1949. Trustee Since June 2006. Principal |
| F. William McNabb III | Occupation(s) During the Past Five Years: President |
| Born 1957. Trustee Since July 2009. Chairman of the | of the University of Pennsylvania; Christopher H. |
| Board. Principal Occupation(s) During the Past Five | Browne Distinguished Professor of Political Science |
| Years: Chairman of the Board of The Vanguard Group, | in the School of Arts and Sciences with secondary |
| Inc., and of each of the investment companies served | appointments at the Annenberg School for Commu- |
| by The Vanguard Group, since January 2010; Director | nication and the Graduate School of Education |
| of The Vanguard Group since 2008; Chief Executive | of the University of Pennsylvania; Director of |
| Officer and President of The Vanguard Group and of | Carnegie Corporation of New York, Schuylkill River |
| each of the investment companies served by The | Development Corporation, and Greater Philadelphia |
| Vanguard Group since 2008; Director of Vanguard | Chamber of Commerce; Trustee of the National |
| Marketing Corporation; Managing Director of The | Constitution Center; Chair of the Presidential |
| Vanguard Group (1995–2008) . | Commission for the Study of Bioethical Issues. |
| |
| | JoAnn Heffernan Heisen |
| Independent Trustees | Born 1950. Trustee Since July 1998. Principal |
| | Occupation(s) During the Past Five Years: Corporate |
| Emerson U. Fullwood | Vice President and Chief Global Diversity Officer |
| Born 1948. Trustee Since January 2008. Principal | since 2006 (retired 2008) and Member of the |
| Occupation(s) During the Past Five Years: Executive | Executive Committee (retired 2008) of Johnson & |
| Chief Staff and Marketing Officer for North America | Johnson (pharmaceuticals/consumer products); Vice |
| and Corporate Vice President (retired 2008) of Xerox | President and Chief Information Officer of Johnson & |
| Corporation (document management products and | Johnson (1997–2005); Director of the University |
| services); Director of SPX Corporation (multi-industry | Medical Center at Princeton and Women’s Research |
| manufacturing), the United Way of Rochester, | and Education Institute; Member of the Advisory |
| Amerigroup Corporation (managed health care), | Board of the Maxwell School of Citizenship and Public |
| the University of Rochester Medical Center, and | Affairs at Syracuse University. |
| Monroe Community College Foundation. | |
| | F. Joseph Loughrey |
| Rajiv L. Gupta | Born 1949. Trustee Since October 2009. Principal |
| Born 1945. Trustee Since December 2001.2 | Occupation(s) During the Past Five Years: President |
| Principal Occupation(s) During the Past Five Years: | and Chief Operating Officer since 2005 (retired 2009) |
| Chairman and Chief Executive Officer (retired 2009) | and Vice Chairman of the Board (2008–2009) of |
| and President (2006–2008) of Rohm and Haas Co. | Cummins Inc. (industrial machinery); Director of |
| (chemicals); Director of Tyco International, Ltd. | SKF AB (industrial machinery), Hillenbrand, Inc. |
| (diversified manufacturing and services) and Hewlett- | (specialized consumer services), Sauer-Danfoss Inc. |
| Packard Co. (electronic computer manufacturing); | (machinery), the Lumina Foundation for Education, |
| Trustee of The Conference Board; Member of the | and Oxfam America; Chairman of the Advisory |
| Board of Managers of Delphi Automotive LLP | Council for the College of Arts and Letters at the |
| (automotive components) . | University of Notre Dame. |
| | |
| André F. Perold | Kathryn J. Hyatt | |
| Born 1952. Trustee Since December 2004. Principal | Born 1955. Treasurer Since November 2008. Principal |
| Occupation(s) During the Past Five Years: George | Occupation(s) During the Past Five Years: Principal |
| Gund Professor of Finance and Banking at the Harvard | of The Vanguard Group, Inc.; Treasurer of each of |
| Business School; Chair of the Investment Committee | the investment companies served by The Vanguard |
| of HighVista Strategies LLC (private investment firm) . | Group since 2008; Assistant Treasurer of each of the |
| | investment companies served by The Vanguard Group |
| Alfred M. Rankin, Jr. | (1988–2008) . | |
| Born 1941. Trustee Since January 1993. Principal | | |
| Occupation(s) During the Past Five Years: Chairman, | Heidi Stam | |
| President, and Chief Executive Officer of NACCO | Born 1956. Secretary Since July 2005. Principal |
| Industries, Inc. (forklift trucks/housewares/lignite); | Occupation(s) During the Past Five Years: Managing |
| Director of Goodrich Corporation (industrial products/ | Director of The Vanguard Group, Inc., since 2006; |
| aircraft systems and services); Chairman of the | General Counsel of The Vanguard Group since 2005; |
| Federal Reserve Bank of Cleveland; Trustee of The | Secretary of The Vanguard Group and of each of the |
| Cleveland Museum of Art. | investment companies served by The Vanguard Group |
| | since 2005; Director and Senior Vice President of |
| Peter F. Volanakis | Vanguard Marketing Corporation since 2005; |
| Born 1955. Trustee Since July 2009. Principal | Principal of The Vanguard Group (1997–2006). |
| Occupation(s) During the Past Five Years: President | | |
| since 2007 and Chief Operating Officer since 2005 | | |
| of Corning Incorporated (communications equipment); | Vanguard Senior Management Team |
| President of Corning Technologies (2001–2005); | | |
| Director of Corning Incorporated and Dow Corning; | R. Gregory Barton | Michael S. Miller |
| Trustee of the Corning Incorporated Foundation and | Mortimer J. Buckley | James M. Norris |
| the Corning Museum of Glass; Overseer of the | Kathleen C. Gubanich | Glenn W. Reed |
| Amos Tuck School of Business Administration at | Paul A. Heller | George U. Sauter |
| Dartmouth College. | | |
| |
| | Chairman Emeritus and Senior Advisor |
| Executive Officers | | |
| | John J. Brennan | |
| Glenn Booraem | Chairman, 1996–2009 | |
| Born 1967. Controller Since July 2010. Principal | Chief Executive Officer and President, 1996–2008 |
| Occupation(s) During the Past Five Years: Principal | | |
| of The Vanguard Group, Inc.; Controller of each of | | |
| the investment companies served by The Vanguard | Founder | |
| Group since 2010; Assistant Controller of each of | | |
| the investment companies served by The Vanguard | John C. Bogle | |
| Group (2001–2010) . | Chairman and Chief Executive Officer, 1974–1996 |
| |
| Thomas J. Higgins | | |
| Born 1957. Chief Financial Officer Since September | | |
| 2008. Principal Occupation(s) During the Past Five | | |
| Years: Principal of The Vanguard Group, Inc.; Chief | | |
| Financial Officer of each of the investment companies | | |
| served by The Vanguard Group since 2008; Treasurer | | |
| of each of the investment companies served by The | | |
| Vanguard Group (1998–2008) . | | |
1 Mr. McNabb is considered an “interested person,” as defined in the Investment Company Act of 1940, because he is an officer of the Vanguard funds.
2 December 2002 for Vanguard Equity Income Fund, Vanguard Growth Equity Fund, the Vanguard Municipal Bond Funds, and the Vanguard State Tax-Exempt Funds.
| |
|  |
| P.O. Box 2600 |
| Valley Forge, PA 19482-2600 |
Connect with Vanguard® > vanguard.com
| |
| Fund Information > 800-662-7447 | |
| Direct Investor Account Services > 800-662-2739 | |
| Institutional Investor Services > 800-523-1036 | |
| Text Telephone for People | |
| With Hearing Impairment > 800-749-7273 | |
| |
| This material may be used in conjunction | |
| with the offering of shares of any Vanguard | |
| fund only if preceded or accompanied by | |
| the fund’s current prospectus. | |
| |
| All comparative mutual fund data are from Lipper Inc. or | |
| Morningstar, Inc., unless otherwise noted. | |
| |
| You can obtain a free copy of Vanguard’s proxy voting | |
| guidelines by visiting vanguard.com/proxyreporting or by | |
| calling Vanguard at 800-662-2739. The guidelines are | |
| also available from the SEC’s website, sec.gov. In | |
| addition, you may obtain a free report on how your fund | |
| voted the proxies for securities it owned during the 12 | |
| months ended June 30. To get the report, visit either | |
| vanguard.com/proxyreporting or sec.gov. | |
| |
| You can review and copy information about your fund at | |
| the SEC’s Public Reference Room in Washington, D.C. To | |
| find out more about this public service, call the SEC at | |
| 202-551-8090. Information about your fund is also | |
| available on the SEC’s website, and you can receive | |
| copies of this information, for a fee, by sending a | |
| request in either of two ways: via e-mail addressed to | |
| publicinfo@sec.gov or via regular mail addressed to the | |
| Public Reference Section, Securities and Exchange | |
| Commission, Washington, DC 20549-1520. | |
| |
| | © 2010 The Vanguard Group, Inc. |
| | All rights reserved. |
| | Vanguard Marketing Corporation, Distributor. |
| |
| | Q880 122010 |
 |
| Vanguard Total International Stock |
| Index Fund Annual Report |
|
|
| October 31, 2010 |
|
 |
|
|
> Led by emerging markets, Vanguard Total International Stock Index Fund returned more than 13% for the fiscal year ended October 31, 2010, slightly ahead of the average return of peer funds.
> As the global economic recovery trend continued, the materials, industrial, and consumer-oriented sectors were among the best performers.
> For the decade ended October 31, 2010, the fund had an average annual return of more than 4%, outpacing the broad U.S. market’s return of about 1%.
| |
| Contents | |
| Your Fund’s Total Returns. | 1 |
| Chairman’s Letter. | 2 |
| Fund Profile. | 9 |
| Performance Summary. | 11 |
| Financial Statements. | 13 |
| Your Fund’s After-Tax Returns. | 48 |
| About Your Fund’s Expenses. | 49 |
| Glossary. | 51 |
The figures shown represent past performance, which is not a guarantee of future results. (Current performance may be lower or higher than the performance data cited. For performance data current to the most recent month-end, visit our website at vanguard.com/performance.)

Total International Stock Index Fund
Please note: The opinions expressed in this report are just that—informed opinions. They should not be considered promises or advice.
Also, please keep in mind that the information and opinions cover the period through the date on the front of this report. Of course, the risks of investing in your fund are spelled out in the prospectus.
See the Glossary for definitions of investment terms used in this report.
Cover photograph: Jean Maher.
Your Fund’s Total Returns
| |
| Fiscal Year Ended October 31, 2010 | |
| | Total |
| | Returns |
| Vanguard Total International Stock Index Fund | 13.28% |
| MSCI EAFE + Emerging Markets Index | 11.88 |
| International Funds Average | 12.88 |
| International Funds Average: Derived from data provided by Lipper Inc. | |
| | | | |
| Your Fund’s Performance at a Glance | | | | |
| October 31, 2009, Through October 31, 2010 | | | | |
| | | | Distributions Per Share |
| | Starting | Ending | Income | Capital |
| | Share Price | Share Price | Dividends | Gains |
| Vanguard Total International Stock Index Fund | $13.99 | $15.48 | $0.344 | $0.000 |
1

Chairman’s Letter
Dear Shareholder,
After a bumpy ride earlier in the fiscal year, strong gains in September and October helped international markets deliver a double-digit total return. Emerging markets again surpassed developed European and Pacific markets, although results were less extraordinary than those of a year ago.
Vanguard Total International Stock Index Fund returned 13.28% for the fiscal year ended October 31, 2010, ahead of the 12.88% average return of international peer funds. Temporary price differences arising from fair-value pricing policies made the fund’s reported return diverge from the 11.88% return of its target index, which is not adjusted for fair value. (Please see the text box on page 7 for more information on fair-value pricing.)
If you own the fund in a taxable account, you may wish to review the table and discussion on after-tax returns for the fiscal year, based on the highest federal income tax bracket, later in this report.
Please note the following updates and changes regarding the fund’s target index: In the April semiannual report, we mentioned that the name—but not the composition—of the benchmark had changed from the Total International
2
Composite Index to the MSCI EAFE + Emerging Markets Index. In late September, we announced that the fund would adopt a new benchmark, the MSCI All Country World ex USA Investable Market Index. Your fund’s trustees believe that the new benchmark will offer more diversification and allow the fund to better represent “total” international markets, as its name implies. We expect the fund to complete the transition to tracking the more comprehensive benchmark—which, unlike its predecessor, includes small-capitalization stocks and Canada—in the near term.
We’ve also announced plans to offer five additional share classes of the fund that will have lower expense ratios than the fund’s Investor Shares. Admiral, Signal, Institutional, and Institutional Plus Shares will become available in late November, and we expect that ETF Shares will begin trading in the first quarter of 2011. Finally, as part of our ongoing efforts to lower the cost of investing for all of our clients, we broadened the availability of our lower-cost Admiral Shares, reducing the Admiral minimums for most of our broad-market index funds from $100,000 to $10,000.
| | | |
| Market Barometer | | | |
| |
| | | Average Annual Total Returns |
| | | Periods Ended October 31, 2010 |
| | One | Three | Five |
| | Year | Years | Years |
| Stocks | | | |
| Russell 1000 Index (Large-caps) | 17.67% | -6.14% | 1.99% |
| Russell 2000 Index (Small-caps) | 26.58 | -3.91 | 3.07 |
| Dow Jones U.S. Total Stock Market Index | 19.04 | -5.55 | 2.52 |
| MSCI All Country World Index ex USA (International) | 13.08 | -7.62 | 6.21 |
| |
| Bonds | | | |
| Barclays Capital U.S. Aggregate Bond Index (Broad | | | |
| taxable market) | 8.01% | 7.23% | 6.45% |
| Barclays Capital Municipal Bond Index (Broad | | | |
| tax-exempt market) | 7.78 | 5.79 | 5.20 |
| Citigroup Three-Month U.S. Treasury Bill Index | 0.12 | 0.89 | 2.41 |
| |
| CPI | | | |
| Consumer Price Index | 1.17% | 1.54% | 1.89% |
3
Stock market performance was better than it felt
Global stock prices rallied at the start of the period, but struggled through the spring and summer, weighed down by Europe’s sovereign debt crisis and the slow pace of economic recovery in the United States. In the fiscal year’s final months, the mood turned. Stock prices climbed on continued strength in corporate earnings. In the United States, stocks also seemed to get a boost from the Federal Reserve Board’s hints that it would try to stimulate the economy with a second round of U.S. Treasury bond purchases. (In early
November, the Fed announced that it would buy as much as $600 billion in Treasuries over the next several months.)
For the 12 months, the broad U.S. stock market returned about 19%, a performance that was better than it felt in a year of ups and downs. Small-capitalization stocks did even better. International stocks returned about 13% on the strength of a powerful rally in emerging markets and solid single-digit gains in developed markets in Europe and the Pacific region. Large currency swings played a role in international returns for U.S.-based investors.
| | |
| Expense Ratios | | |
| Your Fund Compared With Its Peer Group | | |
| | | Peer Group |
| | Fund | Average |
| Total International Stock Index Fund | 0.32% | 1.44% |
The fund expense ratio shown is from the prospectus dated February 26, 2010, and represents estimated costs for the current fiscal year. For the fiscal year ended October 31, 2010, the fund’s expense ratio was 0.26%. The peer-group expense ratio is derived from data provided by Lipper Inc. and captures information through year-end 2009.
Peer group: International Funds.
4
Despite shrinking yields, bonds attracted investors
Although fixed income yields have fallen to generational lows, investors continued to bid up bond prices. The broad U.S. bond market produced a 12-month return of about 8% as the yield of the 10-year U.S. Treasury note fell from 3.39% at the start of the period to 2.61% at the close. Tax-exempt municipal bonds also rallied. Bond prices and yields move in opposite directions, of course, so abundant returns built on rising prices could mean leaner pickings in the years ahead.
The yields of money market securities hovered near 0%, consistent with the Federal Reserve Board’s target for short-term rates. While the Fed has kept target interest rates low to stimulate the economy, rates have risen elsewhere. For example, in October, China’s central bank raised interest rates for the first time in three years, while rates were lifted several times in Australia and India. All three economies have been growing faster than the U.S. economy.
| |
| Total Returns | |
| Ten Years Ended October 31, 2010 | |
| | Average |
| | Annual Return |
| Total International Stock Index Fund | 4.69% |
| Spliced EAFE + Emerging Markets Index | 4.78 |
| International Funds Average | 2.63 |
Spliced EAFE + Emerging Markets Index: Consists of the Total International Composite Index through August 31, 2006, and the MSCI EAFE + Emerging Markets Index thereafter. Returns for the MSCI EAFE + Emerging Markets Index are adjusted for withholding taxes applicable to Luxembourg holding companies.
International Funds Average: Derived from data provided by Lipper Inc.
The figures shown represent past performance, which is not a guarantee of future results. (Current performance may be lower or higher than the performance data cited. For performance data current to the most recent month-end, visit our website at vanguard.com/performance.) Note, too, that both investment returns and principal value can fluctuate widely, so an investor’s shares, when sold, could be worth more or less than their original cost.
5
Emerging markets bested developed countries again
Though their returns came back down to earth from their year-ago rebound of more than 60%, emerging markets still rewarded investors, with the MSCI Emerging Markets Index returning more than 23%. This helped developing countries make an outsized contribution to the fund’s overall return. Some of the best results came from smaller markets in Latin America, while powerhouses India (+35%), Brazil (+16%), and China (+12%) made strong contributions. Even as its government applied the brakes to try to manage inflation, China reached a milestone: Reported gross domestic product for the second calendar quarter showed that the country had surpassed Japan to become the world’s second-largest economy.
Developed markets in Europe—representing about half of the fund’s market value—and the Pacific Rim traveled different paths to reach similar returns of more than 8%, as measured in U.S. dollars. During the period, investors began to regain confidence in Europe after several steps—including unpopular cuts in public sector payrolls and services—were taken to help regain fiscal stability.
Scandinavian economies, more insulated from the market turmoil, had some of Europe’s best returns. Still, the United Kingdom, Europe’s largest market, gained more than 12%. Its economic growth was stronger than expected in the third calendar quarter, and in late October the recently elected government announced dramatic spending cuts. In contrast, peripheral countries that had become the center of the debt-default storm finished the year in the red: Greece was the outlier, losing almost half of its stock market value.
For U.S.-based investors, currency effects masked some European markets’ strength. During the height of Europe’s fiscal uncertainty, the U.S. dollar appreciated significantly against the euro and the British pound. Although these currencies recovered somewhat later in the year, their relative weakness trimmed about 4 percentage points from European returns when translated into U.S. dollars (as measured by the MSCI Europe Index).
Pacific Rim returns differed from Europe’s in two respects: Second-half results were weaker than those in the first half, and currency translation worked to the advantage of U.S.-based investors. When measured in local currencies, the MSCI Pacific Index lost value for the fiscal year, a significant swing compared with the index’s advance in U.S. dollars. Exchange rate movements were especially notable in the second half: The yen reached 15-year highs against the U.S. dollar and, in October, the Australian dollar climbed to a nearly 30-year high.
Japan and Australia represented most of the value of Pacific developed markets, on average, during the fiscal year. However, they contributed a smaller share of the region’s return as Singapore and Hong
6
|
| A note on fair-value pricing |
| The reported return of a fund that tracks an index sometimes may diverge from the index’s return a bit more than would be expected. This may be the result of a fair-value pricing adjustment. |
|
|
|
|
|
| |
These adjustments, which are required by the Securities and Exchange Commission, address pricing discrepancies that may arise because of time-zone differences among global stock markets. Foreign stocks may trade on exchanges that close many hours before a fund’s closing share price is calculated in
the United States, generally at 4 p.m., Eastern time. In the hours between the foreign close and the U.S. close, the value of these foreign securities may change—because of company-specific announcements or market-wide developments, for example. Such price changes are not immediately reflected in international index values. |
|
|
|
|
|
|
|
|
|
|
|
|
|
|
|
|
|
| |
Fair-value pricing takes such changes into account in calculating the fund’s daily net asset value, thus ensuring that the NAV doesn’t include “stale” prices. The result can be a temporary divergence between the return of the fund and that of its benchmark index—a difference that usually corrects itself when the foreign
markets reopen. |
|
|
|
|
|
|
|
|
|
Kong outperformed. Australia returned more than 12% in U.S. dollars; the economy’s growth rate accelerated, buoyed by China’s strong demand for natural resources. Japan’s market declined when measured in yen but advanced about 5% in U.S. dollars. After several years of maintaining a hands-off currency policy, in September the Bank of Japan intervened to try to rein in the rising yen, which was making Japan’s exports less competitive in the global marketplace and threatening its still-fragile economy.
Overall, all sectors gained ground
Across all regions, all ten industry sectors finished the year in positive territory. With rising prices for a wide range of commodities, from agricultural products to gold and other precious metals, the materials sector was one of the best performers. Improving economic fortunes also benefited industrial, consumer discretionary, and consumer staples companies. All four sectors had returns of at least 20%. Financials—the largest sector at about one-quarter of the index—was one of the weakest, with a low single-digit return. The sector declined in Europe, in part because of concerns about credit exposures.
Close index tracking over the long term
The hallmark of a successful index fund is close tracking of its target index, during both up and down markets. Your fund’s
7
achievement of this objective—with an average annual return of more than 4% for the decade ended October 31, 2010—is a tribute to the index-management skills, including portfolio construction and trading, of Vanguard Quantitative Equity Group.
Spread your nest egg across multiple baskets
Since late 2007, stocks have taken investors on a roller-coaster ride with painful losses and soaring gains, especially in emerging markets. Much of the time, it appeared that “news” traveled quickly around the globe, leading markets to rise and fall together—as was the case during the Greek sovereign debt crisis. But when global financial crises subside, we can expect that the economic and financial performance of various countries will differ. We may be seeing some signs of divergence: For example, while U.S. economic growth has been tepid, Britain’s economy has grown faster, and China has achieved double-digit growth rates.
Vanguard research has shown that, over longer periods, a portfolio that included both U.S. and non-U.S. stocks would have experienced lower average volatility than an all-U.S. portfolio. While this long-term risk-reduction benefit may not be as visible to you as other portfolio measures, it is no less real.
When it comes to deciding how much of your equity portfolio to invest outside the United States, there is no magic formula. As with other portfolio decisions you make, your allocation to international stocks should be based on your investment goals, time horizon, and tolerance for risk. Vanguard research suggests that a typical U.S.-based investor would benefit from allocating about 20%–40% of an equity portfolio to non-U.S. stocks.
As part of a well-balanced portfolio that includes U.S. stock, bond, and money market funds, Vanguard Total International Stock Index Fund can be an efficient, low-cost way for you to gain exposure to growth opportunities outside the United States.
Thank you for entrusting your assets to Vanguard.
Sincerely,

F. William McNabb III
Chairman and Chief Executive Officer
November 11, 2010
8
Total International Stock Index Fund
Fund Profile
As of October 31, 2010
| | | |
| Portfolio Characteristics | | |
| | | | MSCI AC |
| | | MSCI | World |
| | | EAFE + | Index |
| | Fund | EM Index | ex USA |
| Number of Stocks | 1,819 | 1,713 | 1,811 |
| Median Market Cap $30.4B | $30.4B | $29.9B |
| Price/Earnings Ratio | 16.0x | 15.9x | 16.2x |
| Price/Book Ratio | 1.7x | 1.7x | 1.7x |
| Return on Equity | 18.4% | 18.4% | 18.2% |
| Earnings Growth Rate | 4.2% | 4.3% | 4.4% |
| Dividend Yield | 2.8% | 2.8% | 2.8% |
| Turnover Rate | 6% | — | — |
| Ticker Symbol | VGTSX | — | — |
| Expense Ratio1 | 0.32% | — | — |
| Short-Term Reserves | 0.2% | — | — |
| | | |
| Sector Diversification (% of equity exposure) |
| | | | MSCI AC |
| | | MSCI | World |
| | | EAFE + | Index |
| | Fund | EM Index | ex USA |
| Consumer | | | |
| Discretionary | 9.5% | 9.5% | 8.7% |
| Consumer Staples | 9.4 | 9.4 | 8.5 |
| Energy | 9.2 | 9.2 | 10.9 |
| Financials | 24.8 | 24.9 | 25.7 |
| Health Care | 6.5 | 6.5 | 6.1 |
| Industrials | 11.0 | 10.9 | 10.3 |
| Information | | | |
| Technology | 6.7 | 6.6 | 7.1 |
| Materials | 11.6 | 11.6 | 12.1 |
| Telecommunication | | | |
| Services | 6.4 | 6.5 | 5.9 |
| Utilities | 4.9 | 4.9 | 4.7 |
| | |
| Volatility Measures | | |
| | MSCI | MSCI AC |
| | EAFE + | World Index |
| | EM Index | ex USA |
| R-Squared | 0.98 | 0.98 |
| Beta | 1.02 | 1.02 |
These measures show the degree and timing of the fund’s fluctuations compared with the indexes over 36 months.
| | |
| Ten Largest Holdings (% of total net assets) |
| BHP Billiton Ltd. | Diversified Metals | |
| | & Mining | 1.5% |
| Royal Dutch Shell plc | Integrated Oil & | |
| | Gas | 1.4 |
| Nestle SA | Packaged Foods & | |
| | Meats | 1.3 |
| HSBC Holdings plc | Diversified Banks | 1.3 |
| Vodafone Group plc | Wireless | |
| | Telecommunication | |
| | Services | 1.0 |
| BP plc | Integrated Oil & | |
| | Gas | 0.9 |
| Novartis AG | Pharmaceuticals | 0.8 |
| Banco Santander SA | Diversified Banks | 0.8 |
| Total SA | Integrated Oil & | |
| | Gas | 0.8 |
| Petroleo Brasileiro SA | Integrated Oil & | |
| | Gas | 0.8 |
| Top Ten | | 10.6% |
The holdings listed exclude any temporary cash investments and equity index products.
Allocation by Region (% of equity exposure)

1 The expense ratio shown is from the prospectus dated February 26, 2010, and represents estimated costs for the current fiscal year. For the fiscal year ended October 31, 2010, the expense ratio was 0.26%.
9
Total International Stock Index Fund
| | | |
| Market Diversification (% of equity exposure) |
| | | | MSCI AC |
| | | MSCI | World |
| | | EAFE + | Index |
| | Fund | EM Index | ex USA |
| Europe | | | |
| United Kingdom | 16.3% | 16.1% | 14.9% |
| France | 7.7 | 7.6 | 7.1 |
| Germany | 6.2 | 6.2 | 5.7 |
| Switzerland | 5.7 | 5.8 | 5.3 |
| Spain | 2.9 | 2.8 | 2.6 |
| Sweden | 2.3 | 2.3 | 2.1 |
| Italy | 2.2 | 2.2 | 2.0 |
| Netherlands | 1.9 | 1.9 | 1.8 |
| Other | 3.7 | 3.8 | 3.6 |
| Subtotal | 48.9% | 48.7% | 45.1% |
| Pacific | | | |
| Japan | 15.5% | 15.5% | 14.3% |
| Australia | 6.4 | 6.4 | 5.9 |
| Hong Kong | 2.0 | 2.0 | 1.8 |
| Singapore | 1.3 | 1.3 | 1.2 |
| Other | 0.1 | 0.1 | 0.1 |
| Subtotal | 25.3% | 25.3% | 23.3% |
| Emerging Markets | | | |
| China | 4.6% | 4.6% | 4.3% |
| Brazil | 4.1 | 4.2 | 3.8 |
| South Korea | 3.4 | 3.4 | 3.1 |
| Taiwan | 2.7 | 2.7 | 2.5 |
| India | 2.1 | 2.1 | 1.9 |
| South Africa | 1.9 | 1.9 | 1.8 |
| Russia | 1.6 | 1.6 | 1.4 |
| Mexico | 1.1 | 1.1 | 1.0 |
| Other | 3.7 | 3.8 | 3.7 |
| Subtotal | 25.2% | 25.4% | 23.5% |
| Middle East | 0.6% | 0.6% | 0.5% |
| North America | 0.0% | 0.0% | 7.6% |
10
Total International Stock Index Fund
Performance Summary
All of the returns in this report represent past performance, which is not a guarantee of future results that may be achieved by the fund. (Current performance may be lower or higher than the performance data cited. For performance data current to the most recent month-end, visit our website at vanguard.com/performance.) Note, too, that both investment returns and principal value can fluctuate widely, so an investor’s shares, when sold, could be worth more or less than their original cost. The returns shown do not reflect taxes that a shareholder would pay on fund distributions or on the sale of fund shares.
Cumulative Performance: October 31, 2000, Through October 31, 2010
Initial Investment of $10,000
| | | | | |
| | | Average Annual Total Returns | |
| | | Periods Ended October 31, 2010 | |
| | | | | | Final Value |
| | | One | Five | Ten | of a $10,000 |
| | | Year | Years | Years | Investment |
| | Total International Stock Index Fund | 13.28% | 5.33% | 4.69% | $15,820 |
| •••••••• | MSCI All Country World Index ex USA | 13.08 | 6.21 | 5.46 | 17,012 |
| – – – – | Spliced EAFE + Emerging Markets | | | | |
| | Index | 11.88 | 5.43 | 4.78 | 15,951 |
| | International Funds Average | 12.88 | 3.69 | 2.63 | 12,966 |
Spliced EAFE + Emerging Markets Index: Consists of the Total International Composite Index through August 31, 2006, and the MSCI EAFE + Emerging Markets Index thereafter. Returns for the MSCI EAFE + Emerging Markets Index are adjusted for withholding taxes applicable to Luxembourg holding companies.
International Funds Average: Derived from data provided by Lipper Inc.
Vanguard fund returns do not reflect the 2% fee on redemptions of shares held for less than two months.
See Financial Highlights for dividend and capital gains information.
11
Total International Stock Index Fund
Fiscal-Year Total Returns (%): October 31, 2000, Through October 31, 2010
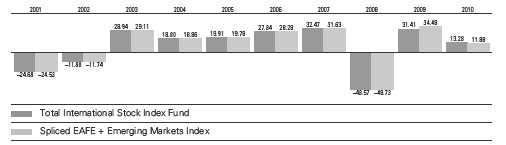
Average Annual Total Returns: Periods Ended September 30, 2010
This table presents average annual total returns through the latest calendar quarter—rather than through the end of the fiscal period. Securities and Exchange Commission rules require that we provide this information.
| | | | |
| | Inception | One | Five | Ten |
| | Date | Year | Years | Years |
| Total International Stock Index | | | | |
| Fund | 4/29/1996 | 7.03% | 3.89% | 4.01% |
Vanguard fund returns do not reflect the 2% fee on redemptions of shares held for less than two months.
12
Total International Stock Index Fund
Financial Statements
Statement of Net Assets
As of October 31, 2010
The fund reports a complete list of its holdings in regulatory filings four times in each fiscal year, at the quarter-ends. For the second and fourth fiscal quarters, the lists appear in the fund’s semiannual and annual reports to shareholders. For the first and third fiscal quarters, the fund files the lists with the Securities and Exchange Commission on Form N-Q. Shareholders can look up the fund’s Forms N-Q on the SEC’s website at sec.gov. Forms N-Q may also be reviewed and copied at the SEC’s Public Reference Room (see the back cover of this report for further information).
| | |
| | | Market |
| | | Value |
| | Shares | ($000) |
| Common Stocks (99.4%)1 | | |
| Argentina (0.0%) | | |
| Siderar SAIC Class A | 30 | — |
| |
| Australia (6.3%) | | |
| BHP Billiton Ltd. | 9,175,232 | 379,135 |
| Commonwealth Bank of | | |
| Australia | 4,234,084 | 203,548 |
| Westpac Banking Corp. | 8,139,502 | 181,243 |
| Australia & New Zealand | | |
| Banking Group Ltd. | 6,926,431 | 168,984 |
| National Australia | | |
| Bank Ltd. | 5,798,849 | 145,137 |
| Rio Tinto Ltd. | 1,189,813 | 96,830 |
| Woolworths Ltd. | 3,383,492 | 93,930 |
| Wesfarmers Ltd. | 2,741,483 | 89,199 |
| Newcrest Mining Ltd. | 1,963,705 | 77,280 |
| Westfield Group | 6,009,143 | 73,086 |
| Woodside Petroleum Ltd. | 1,491,238 | 63,770 |
| CSL Ltd. | 1,566,530 | 50,520 |
| QBE Insurance Group Ltd. | 2,823,005 | 47,485 |
| Origin Energy Ltd. | 2,409,091 | 37,715 |
| Macquarie Group Ltd. | 942,042 | 33,495 |
| Suncorp-Metway Ltd. | 3,490,790 | 31,514 |
| Telstra Corp. Ltd. | 11,934,220 | 31,274 |
| Foster’s Group Ltd. | 5,290,454 | 30,333 |
| AMP Ltd. | 5,629,210 | 29,481 |
| Santos Ltd. | 2,281,912 | 28,216 |
| Orica Ltd. | 991,315 | 24,495 |
| Brambles Ltd. | 3,870,323 | 24,204 |
| Stockland | 6,528,952 | 24,178 |
| Amcor Ltd. | 3,339,611 | 22,007 |
| Insurance Australia | | |
| Group Ltd. | 5,732,840 | 21,441 |
| * Fortescue Metals | | |
| Group Ltd. | 3,428,445 | 21,081 |
| AGL Energy Ltd. | 1,233,382 | 19,474 |
| Coca-Cola Amatil Ltd. | 1,542,146 | 18,382 |
| | | |
| | | | Market |
| | | | Value |
| | | Shares | ($000) |
| | Transurban Group | 3,514,170 | 17,979 |
| | ASX Ltd. | 472,141 | 17,202 |
| | Incitec Pivot Ltd. | 4,441,582 | 16,264 |
| | AXA Asia Pacific | | |
| | Holdings Ltd. | 2,856,938 | 15,214 |
| | Wesfarmers Ltd. Price | | |
| | Protected Shares | 419,403 | 13,738 |
| | TABCORP Holdings Ltd. | 1,856,103 | 13,428 |
| ^ | Leighton Holdings Ltd. | 371,499 | 13,369 |
| | Alumina Ltd. | 6,674,912 | 13,338 |
| | GPT Group | 4,857,640 | 13,306 |
| | OZ Minerals Ltd. | 8,554,177 | 13,193 |
| * | Asciano Group | 8,000,560 | 12,291 |
| | Computershare Ltd. | 1,224,123 | 12,155 |
| | WorleyParsons Ltd. | 527,667 | 11,892 |
| | Mirvac Group | 8,928,788 | 11,361 |
| | Toll Holdings Ltd. | 1,820,005 | 11,072 |
| | Sonic Healthcare Ltd. | 1,011,668 | 10,794 |
| | Cochlear Ltd. | 154,661 | 10,774 |
| | Dexus Property Group | 13,112,733 | 10,680 |
| | Goodman Group | 17,171,537 | 10,621 |
| | CFS Retail Property Trust | 5,718,736 | 10,412 |
| | Lend Lease Group | 1,471,823 | 10,391 |
| | Crown Ltd. | 1,245,279 | 10,198 |
| | BlueScope Steel Ltd. | 4,996,401 | 9,818 |
| | OneSteel Ltd. | 3,670,144 | 9,741 |
| | Intoll Group | 6,183,550 | 9,111 |
| | Metcash Ltd. | 2,092,864 | 8,960 |
| | Bendigo and Adelaide | | |
| | Bank Ltd. | 976,674 | 8,673 |
| * | Qantas Airways Ltd. | 3,035,542 | 8,475 |
| | Boral Ltd. | 1,965,710 | 8,464 |
| | Tatts Group Ltd. | 3,386,837 | 8,295 |
| ^ | Fairfax Media Ltd. | 5,792,724 | 8,230 |
| * | Paladin Energy Ltd. | 1,812,471 | 7,316 |
| | Sims Metal | | |
| | Management Ltd. | 445,891 | 7,161 |
| | CSR Ltd. | 4,006,569 | 7,161 |
13
Total International Stock Index Fund
| | | |
| | | | Market |
| | | | Value |
| | | Shares | ($000) |
| * | James Hardie | | |
| | Industries SE | 1,201,010 | 6,366 |
| | MacArthur Coal Ltd. | 479,339 | 5,651 |
| | Goodman Fielder Ltd. | 3,724,500 | 5,415 |
| | Newcrest Mining | | |
| | Ltd. ADR | 129,759 | 5,114 |
| | Harvey Norman | | |
| | Holdings Ltd. | 1,462,507 | 4,773 |
| | Billabong International Ltd. | 560,682 | 4,468 |
| | Caltex Australia Ltd. | 370,352 | 4,219 |
| | Aristocrat Leisure Ltd. | 1,118,717 | 3,855 |
| | SP AusNet | 3,614,460 | 3,287 |
| | MAp Group | 1,017,788 | 3,042 |
| | Energy Resources of | | |
| | Australia Ltd. | 181,365 | 2,322 |
| | Sims Metal Management | | |
| | Ltd. ADR | 87,900 | 1,402 |
| | | | 2,498,428 |
| Austria (0.3%) | | |
| | Erste Group Bank AG | 521,001 | 23,540 |
| | OMV AG | 413,720 | 15,474 |
| | Telekom Austria AG | 870,273 | 13,327 |
| | Voestalpine AG | 316,251 | 12,558 |
| * | IMMOFINANZ AG | 2,733,244 | 10,779 |
| | Raiffeisen Bank | | |
| | International AG | 147,678 | 8,340 |
| | Verbund AG | 207,342 | 8,295 |
| | Vienna Insurance | | |
| | Group AG Wiener | | |
| | Versicherung Gruppe | 104,661 | 5,627 |
| | | | 97,940 |
| Belgium (0.7%) | | |
| | Anheuser-Busch | | |
| | InBev NV | 1,968,085 | 123,604 |
| | Groupe Bruxelles | | |
| | Lambert SA | 222,394 | 19,701 |
| | Delhaize Group SA | 277,128 | 19,370 |
| * | KBC Groep NV | 444,493 | 19,355 |
| | Ageas | 6,122,194 | 18,851 |
| | Solvay SA Class A | 163,338 | 17,309 |
| | Belgacom SA | 416,806 | 16,367 |
| | Umicore | 311,912 | 14,697 |
| | Colruyt SA | 196,975 | 11,118 |
| | UCB SA | 278,133 | 10,789 |
| * | Dexia SA | 1,526,420 | 6,802 |
| | Mobistar SA | 74,490 | 4,931 |
| | Cie Nationale a Portefeuille | 74,560 | 3,990 |
| | | | 286,884 |
| Brazil (4.1%) | | |
| | Petroleo Brasileiro SA | | |
| | Prior Pfd. | 7,039,868 | 107,194 |
| | Vale SA Prior Pfd. | 3,210,200 | 90,153 |
| | | |
| | | | Market |
| | | | Value |
| | | Shares | ($000) |
| | Petroleo Brasileiro SA | 5,366,788 | 89,925 |
| | Itau Unibanco Holding | | |
| | SA Prior Pfd. | 3,206,367 | 77,505 |
| | Itau Unibanco Holding | | |
| | SA ADR | 3,031,093 | 74,444 |
| | Vale SA | 2,169,000 | 68,311 |
| | Banco Bradesco | | |
| | SA Prior Pfd. | 3,236,558 | 66,319 |
| | Petroleo Brasileiro | | |
| | SA ADR Type A | 2,107,432 | 65,731 |
| | Vale SA Class B Pfd. ADR | 2,265,907 | 65,099 |
| | Itausa - Investimentos | | |
| | Itau SA Prior Pfd. | 6,249,681 | 48,923 |
| * | OGX Petroleo e Gas | | |
| | Participacoes SA | 3,528,300 | 46,130 |
| | Petroleo Brasileiro | | |
| | SA ADR | 1,344,681 | 45,880 |
| | Vale SA Class B ADR | 1,392,218 | 44,746 |
| | BM&FBovespa SA | 5,298,878 | 44,191 |
| | Banco Bradesco SA ADR | 1,906,242 | 39,650 |
| | Cia de Bebidas das | | |
| | Americas Prior Pfd. | 259,543 | 35,569 |
| | Banco do Brasil SA | 1,558,621 | 30,177 |
| | Cia de Bebidas das | | |
| | Americas ADR | 146,465 | 20,394 |
| | Banco Santander | | |
| | Brasil SA ADR | 1,387,096 | 19,974 |
| | Cia Siderurgica | | |
| | Nacional SA | 1,174,900 | 19,451 |
| | BRF - Brasil Foods SA | 1,334,300 | 19,258 |
| | PDG Realty SA | | |
| | Empreendimentos e | | |
| | Participacoes | 1,419,286 | 17,571 |
| | Bradespar SA Prior Pfd. | 619,600 | 15,669 |
| | Usinas Siderurgicas | | |
| | de Minas Gerais | | |
| | SA Prior Pfd. | 1,244,600 | 15,606 |
| | Cia Siderurgica | | |
| | Nacional SA ADR | 889,592 | 15,016 |
| | Cielo SA | 1,675,858 | 14,439 |
| | Natura Cosmeticos SA | 470,600 | 13,451 |
| | Lojas Renner SA | 332,598 | 13,196 |
| | Gerdau SA Prior Pfd. | 1,017,800 | 13,073 |
| | Ultrapar Participacoes | | |
| | SA Prior Pfd. | 201,069 | 12,216 |
| * | Hypermarcas SA | 736,680 | 12,175 |
| | Redecard SA | 919,010 | 11,886 |
| * | All America Latina | | |
| | Logistica SA | 1,221,655 | 11,553 |
| | Metalurgica Gerdau SA | | |
| | Prior Pfd. Class A | 750,600 | 11,491 |
| | Cia Energetica de Minas | | |
| | Gerais Prior Pfd. | 653,437 | 11,452 |
14
Total International Stock Index Fund
| | | |
| | | | Market |
| | | | Value |
| | | Shares | ($000) |
| | Cia de Concessoes | | |
| | Rodoviarias | 421,553 | 11,405 |
| | Cyrela Brazil Realty SA | | |
| | Empreendimentos e | | |
| | Participacoes | 807,935 | 11,109 |
| | Souza Cruz SA | 208,500 | 10,908 |
| | Gerdau SA ADR | 771,478 | 10,060 |
| | Vivo Participacoes | | |
| | SA Prior Pfd. | 319,525 | 9,152 |
| | Lojas Americanas | | |
| | SA Prior Pfd. | 839,900 | 8,985 |
| | Centrais Eletricas | | |
| | Brasileiras SA Prior Pfd. | 518,700 | 8,331 |
| | Gafisa SA | 1,000,310 | 8,242 |
| | Duratex SA | 687,901 | 7,930 |
| | MRV Engenharia e | | |
| | Participacoes SA | 795,584 | 7,744 |
| | BR Malls Participacoes SA | 823,996 | 7,739 |
| | Cia Brasileira de Distribuicao | | |
| | Grupo Pao de Acucar ADR | 191,612 | 7,590 |
| | Cia Energetica de | | |
| | Minas Gerais ADR | 408,158 | 7,282 |
| | Usinas Siderurgicas de | | |
| | Minas Gerais SA | 485,700 | 7,056 |
| | Cia Energetica de | | |
| | Sao Paulo Prior Pfd. | 431,625 | 6,752 |
| | Tele Norte Leste | | |
| | Participacoes SA Prior Pfd. | 440,600 | 6,745 |
| | BRF - Brasil Foods SA ADR | 451,331 | 6,603 |
| | Centrais Eletricas | | |
| | Brasileiras SA | 471,400 | 6,460 |
| | CPFL Energia SA | 258,700 | 6,087 |
| | Empresa Brasileira de | | |
| | Aeronautica SA ADR | 208,998 | 6,030 |
| | Tractebel Energia SA | 359,100 | 5,407 |
| | JBS SA | 1,401,222 | 5,390 |
| | Banco do Estado do Rio | | |
| | Grande do Sul Prior Pfd. | 487,489 | 5,333 |
| | Cosan SA Industria e | | |
| | Comercio | 332,800 | 5,287 |
| | Localiza Rent a Car SA | 301,102 | 4,985 |
| * | Fibria Celulose SA | 275,175 | 4,910 |
| | TAM SA Prior Pfd. | 201,183 | 4,893 |
| | Empresa Brasileira de | | |
| | Aeronautica SA | 671,100 | 4,756 |
| | Suzano Papel e Celulose | | |
| | SA Prior Pfd. | 496,150 | 4,666 |
| | Rossi Residencial SA | 474,476 | 4,652 |
| | Porto Seguro SA | 310,400 | 4,529 |
| | Braskem SA Prior Pfd. | 438,400 | 4,461 |
| | Gol Linhas Aereas | | |
| | Inteligentes SA Prior Pfd. | 252,600 | 4,369 |
| | | |
| | | | Market |
| | | | Value |
| | | Shares | ($000) |
| | Eletropaulo Metropolitana | | |
| | Eletricidade de Sao Paulo | | |
| | SA Prior Pfd. | 244,900 | 4,249 |
| | Multiplan Empreendimentos | | |
| | Imobiliarios SA | 179,328 | 4,165 |
| * | LLX Logistica SA | 740,733 | 4,060 |
| | Cia de Saneamento Basico | | |
| | do Estado de Sao Paulo | 177,400 | 4,016 |
| | AES Tiete SA Prior Pfd. | 283,400 | 3,934 |
| | Cia Paranaense de | | |
| | Energia ADR | 164,556 | 3,823 |
| | Tele Norte Leste | | |
| | Participacoes SA ADR | 235,049 | 3,606 |
| * | MMX Mineracao e | | |
| | Metalicos SA | 448,100 | 3,605 |
| * | Sul America SA | 304,900 | 3,585 |
| * | Brasil Telecom SA Prior Pfd. | 483,220 | 3,550 |
| | Cia de Saneamento | | |
| | Basico do Estado de | | |
| | Sao Paulo ADR | 76,265 | 3,505 |
| | Vivo Participacoes SA ADR | 117,441 | 3,363 |
| * | Brasil Telecom SA ADR | 151,190 | 3,334 |
| | Marfrig Alimentos SA | 360,552 | 3,215 |
| | EDP - Energias do Brasil SA | 147,700 | 3,208 |
| | Tim Participacoes | | |
| | SA Prior Pfd. | 996,800 | 3,201 |
| | Brookfield | | |
| | Incorporacoes SA | 592,000 | 3,193 |
| * | Fibria Celulose SA ADR | 173,962 | 3,124 |
| * | Vale Fertilizantes | | |
| | SA Prior Pfd. | 267,849 | 3,018 |
| | Cia Paranaense de | | |
| | Energia Prior Pfd. | 128,600 | 2,981 |
| | Klabin SA Prior Pfd. | 1,051,200 | 2,937 |
| | Tele Norte Leste | | |
| | Participacoes SA | 142,600 | 2,855 |
| | Cia de Transmissao de | | |
| | Energia Electrica Paulista | | |
| | Prior Pfd. | 82,100 | 2,542 |
| | B2W Cia Global Do Varejo | 136,218 | 2,475 |
| | Cia Brasileira de | | |
| | Distribuicao Grupo | | |
| | Pao de Acucar Prior Pfd. | 53,691 | 2,108 |
| | Centrais Eletricas | | |
| | Brasileiras SA ADR | 147,700 | 2,063 |
| | Telemar Norte Leste | | |
| | SA Prior Pfd. | 71,800 | 2,035 |
| | Banco Santander Brasil SA | 143,700 | 2,029 |
| | Tim Participacoes SA ADR | 58,501 | 1,887 |
| * | Gol Linhas Aereas | | |
| | Inteligentes SA ADR | 16,800 | 296 |
| | Gafisa SA ADR | 14,800 | 248 |
15
Total International Stock Index Fund
| | | |
| | | | Market |
| | | | Value |
| | | Shares | ($000) |
| * | CPFL Energia SA ADR | 2,133 | 153 |
| * | Centrais Eletricas | | |
| | Brasileiras SA ADR | 8,900 | 145 |
| | TAM SA ADR | 3,640 | 90 |
| | | | 1,626,264 |
| Chile (0.4%) | | |
| | Empresas COPEC SA | 1,247,915 | 23,491 |
| | Centros Comerciales | | |
| | Sudamericanos SA | 2,444,854 | 19,047 |
| | Empresas CMPC SA | 303,182 | 16,301 |
| | Lan Airlines SA | 374,087 | 11,621 |
| | Enersis SA | 23,207,588 | 10,577 |
| | CAP SA | 205,269 | 10,486 |
| | Empresa Nacional de | | |
| | Electricidad SA | 5,768,090 | 10,271 |
| | SACI Falabella | 778,908 | 7,792 |
| | Banco Santander | | |
| | Chile ADR | 83,240 | 7,711 |
| | Sociedad Quimica y | | |
| | Minera de Chile SA | | |
| | Class B | 147,820 | 7,644 |
| | Empresa Nacional de | | |
| | Electricidad SA ADR | 110,605 | 5,902 |
| | Enersis SA ADR | 255,195 | 5,821 |
| | Sociedad Quimica y | | |
| | Minera de Chile | | |
| | SA ADR | 102,846 | 5,327 |
| | Colbun SA | 19,324,259 | 5,285 |
| | Banco de Credito e | | |
| | Inversiones | 82,801 | 5,003 |
| | ENTEL Chile SA | 297,027 | 4,720 |
| | Banco Santander Chile | 44,632,649 | 3,975 |
| | Cia Cervecerias | | |
| | Unidas SA | 351,548 | 3,931 |
| | AES Gener SA | 6,759,188 | 3,730 |
| | Vina Concha y Toro SA | 1,288,107 | 3,132 |
| | | | 171,767 |
| China (4.6%) | | |
| | China Mobile Ltd. | 16,453,500 | 168,028 |
| | Industrial & Commercial | | |
| | Bank of China | 147,587,000 | 119,235 |
| | China Construction | | |
| | Bank Corp. | 122,849,000 | 117,444 |
| | CNOOC Ltd. | 48,846,000 | 101,977 |
| | Bank of China Ltd. | 155,866,188 | 93,618 |
| | China Life | | |
| | Insurance Co. Ltd. | 20,342,000 | 89,429 |
| | PetroChina Co. Ltd. | 57,574,000 | 70,870 |
| | Tencent Holdings Ltd. | 2,745,649 | 63,115 |
| | Ping An Insurance Group | | |
| | Co. of China Ltd. | 4,678,700 | 50,585 |
| | China Shenhua | | |
| | Energy Co. Ltd. | 9,274,000 | 41,402 |
| | China Petroleum & | | |
| | Chemical Corp. | 43,502,000 | 41,391 |
| | | |
| | | | Market |
| | | | Value |
| | | Shares | ($000) |
| | China Merchants | | |
| | Bank Co. Ltd. | 10,690,551 | 30,462 |
| * | Agricultural Bank of | | |
| | China Ltd. | 46,133,870 | 24,343 |
| | China Overseas Land & | | |
| | Investment Ltd. | 11,109,680 | 23,419 |
| | China Unicom | | |
| | Hong Kong Ltd. | 16,103,694 | 22,648 |
| | Belle International | | |
| | Holdings Ltd. | 11,450,000 | 20,739 |
| | Bank of Communications | | |
| | Co. Ltd. | 18,036,500 | 19,761 |
| | China Telecom Corp. Ltd. | 37,754,000 | 19,716 |
| | Hengan International | | |
| | Group Co. Ltd. | 1,984,000 | 18,706 |
| | China Coal | | |
| | Energy Co. Ltd. | 9,476,000 | 16,476 |
| | Dongfeng Motor | | |
| | Group Co. Ltd. | 7,462,000 | 16,231 |
| | Yanzhou Coal | | |
| | Mining Co. Ltd. | 5,320,000 | 15,392 |
| | Want Want China | | |
| | Holdings Ltd. | 16,238,500 | 15,009 |
| | China Yurun Food | | |
| | Group Ltd. | 3,579,413 | 13,970 |
| | China Resources | | |
| | Enterprise Ltd. | 3,256,000 | 13,802 |
| | Tingyi Cayman Islands | | |
| | Holding Corp. | 4,572,000 | 12,464 |
| | China Citic Bank | | |
| | Corp. Ltd. | 16,981,539 | 12,382 |
| | Inner Mongolia Yitai | | |
| | Coal Co. Class B | 1,633,700 | 11,526 |
| | China Communications | | |
| | Construction Co. Ltd. | 11,592,000 | 11,116 |
| | China Resources | | |
| | Land Ltd. | 5,544,000 | 10,957 |
| | Jiangxi Copper Co. Ltd. | 3,778,000 | 10,575 |
| | China Merchants Holdings | | |
| | International Co. Ltd. | 2,972,000 | 10,451 |
| | Zijin Mining | | |
| | Group Co. Ltd. | 10,792,000 | 10,202 |
| *,^ | Aluminum Corp. of | | |
| | China Ltd. | 10,720,000 | 10,179 |
| | China Minsheng | | |
| | Banking Corp. Ltd. | 10,699,300 | 9,961 |
| * | PICC Property & | | |
| | Casualty Co. Ltd. | 6,662,000 | 9,836 |
| * | GOME | | |
| | Electrical Appliances | | |
| | Holdings Ltd. | 28,600,980 | 9,653 |
| | China National Building | | |
| | Material Co. Ltd. | 3,922,000 | 9,605 |
| | Beijing Enterprises | | |
| | Holdings Ltd. | 1,396,000 | 9,566 |
16
Total International Stock Index Fund
| | | |
| | | | Market |
| | | | Value |
| | | Shares | ($000) |
| | Anhui Conch | | |
| | Cement Co. Ltd. | 2,230,000 | 9,386 |
| | China Pacific Insurance | | |
| | Group Co. Ltd. | 2,230,338 | 9,278 |
| | Guangzhou Automobile | | |
| | Group Co. Ltd. | 5,987,883 | 9,116 |
| | China Mengniu | | |
| | Dairy Co. Ltd. | 3,083,000 | 8,833 |
| | China Railway Group Ltd. | 10,927,000 | 8,825 |
| ^ | Byd Co. Ltd. | 1,427,000 | 8,733 |
| | China Resources Power | | |
| | Holdings Co. Ltd. | 4,529,600 | 8,733 |
| | Kunlun Energy Co. Ltd. | 6,772,000 | 8,625 |
| | Lenovo Group Ltd. | 13,160,000 | 8,548 |
| *,^ | China COSCO | | |
| | Holdings Co. Ltd. | 7,042,000 | 8,252 |
| | Citic Pacific Ltd. | 3,065,000 | 8,195 |
| * | Air China Ltd. | 6,030,000 | 8,132 |
| | Kingboard Chemical | | |
| | Holdings Ltd. | 1,628,000 | 7,934 |
| * | China Taiping Insurance | | |
| | Holdings Co. Ltd. | 2,121,600 | 7,808 |
| | Shimao Property | | |
| | Holdings Ltd. | 4,447,500 | 7,369 |
| | Weichai Power Co. Ltd. | 553,400 | 7,302 |
| | Nine Dragons Paper | | |
| | Holdings Ltd. | 4,487,669 | 7,261 |
| | China Oilfield Services Ltd. | 4,278,000 | 6,964 |
| | COSCO Pacific Ltd. | 4,368,000 | 6,840 |
| | Shanghai Industrial | | |
| | Holdings Ltd. | 1,479,000 | 6,829 |
| *,^ | Alibaba.com Ltd. | 3,478,000 | 6,800 |
| | China Railway | | |
| | Construction Corp. Ltd. | 5,181,800 | 6,488 |
| | Huabao International | | |
| | Holdings Ltd. | 4,249,000 | 6,423 |
| | China High Speed | | |
| | Transmission Equipment | | |
| | Group Co. Ltd. | 3,134,000 | 6,419 |
| | Sinopharm Group Co. | 1,604,000 | 6,315 |
| | Parkson Retail Group Ltd. | 3,470,500 | 6,283 |
| ^ | China Agri-Industries | | |
| | Holdings Ltd. | 4,208,000 | 6,150 |
| | China Everbright Ltd. | 2,356,000 | 6,143 |
| | ENN Energy Holdings Ltd. | 2,010,000 | 6,069 |
| | Yantai Changyu Pioneer | | |
| | Wine Co. Class B | 463,550 | 5,985 |
| | Sino-Ocean Land | | |
| | Holdings Ltd. | 8,610,000 | 5,942 |
| ^ | Geely Automobile | | |
| | Holdings Ltd. | 10,060,000 | 5,688 |
| | Chaoda Modern | | |
| | Agriculture Holdings Ltd. | 6,945,825 | 5,677 |
| | | |
| | | | Market |
| | | | Value |
| | | Shares | ($000) |
| ^ | Poly Hong Kong | | |
| | Investments Ltd. | 5,356,000 | 5,522 |
| | CSR Corp. Ltd. | 5,415,000 | 5,513 |
| | Fushan International | | |
| | Energy Group Ltd. | 8,076,000 | 5,435 |
| | Shanghai Electric | | |
| | Group Co. Ltd. | 8,026,000 | 5,387 |
| *,^ | China Longyuan Power | | |
| | Group Corp. | 5,154,000 | 5,374 |
| ^ | Li Ning Co. Ltd. | 1,870,000 | 5,346 |
| ^ | Shandong Weigao Group | | |
| | Medical Polymer Co. Ltd. | 1,972,000 | 5,246 |
| | China Shipping | | |
| | Development Co. Ltd. | 3,574,000 | 5,225 |
| ^ | Agile Property | | |
| | Holdings Ltd. | 3,928,000 | 5,181 |
| ^ | ZTE Corp. | 1,377,718 | 5,143 |
| | Golden Eagle Retail | | |
| | Group Ltd. | 1,851,000 | 4,935 |
| | Anta Sports Products Ltd. | 2,381,000 | 4,931 |
| | China Vanke Co. Ltd. | | |
| | Class B | 3,415,000 | 4,902 |
| | Soho China Ltd. | 5,722,500 | 4,872 |
| ^ | Angang Steel Co. Ltd. | 3,066,000 | 4,841 |
| | Huaneng Power | | |
| | International Inc. | 8,418,000 | 4,816 |
| | Dongfang Electric | | |
| | Corp. Ltd. | 905,800 | 4,408 |
| | China Dongxiang | | |
| | Group Co. | 7,731,000 | 4,334 |
| | Tsingtao Brewery Co. Ltd. | 798,000 | 4,274 |
| * | Semiconductor | | |
| | Manufacturing | | |
| | International Corp. | 49,324,000 | 4,134 |
| | Renhe Commercial | | |
| | Holdings Co. Ltd. | 21,459,635 | 4,105 |
| | Country Garden | | |
| | Holdings Co. | 11,492,000 | 4,071 |
| *,^ | Longfor Properties | | |
| | Co. Ltd. | 3,407,500 | 4,059 |
| | Zhejiang Expressway | | |
| | Co. Ltd. | 3,938,000 | 3,980 |
| | China International Marine | | |
| | Containers Group Co. Ltd. | |
| | Class B | 1,955,253 | 3,963 |
| ^ | Shui On Land Ltd. | 7,834,699 | 3,938 |
| ^ | Guangzhou R&F | | |
| | Properties Co. Ltd. | 2,710,800 | 3,882 |
| | Jiangsu Expressway | | |
| | Co. Ltd. | 3,184,000 | 3,858 |
| *,^ | China Shipping Container | | |
| | Lines Co. Ltd. | 9,192,000 | 3,753 |
| | Fosun International Ltd. | 4,484,500 | 3,686 |
17
Total International Stock Index Fund
| | | |
| | | | Market |
| | | | Value |
| | | Shares | ($000) |
| | Lee & Man Paper | | |
| | Manufacturing Ltd. | 4,336,000 | 3,638 |
| | China BlueChemical Ltd. | 4,552,000 | 3,607 |
| | Guangdong | | |
| | Investment Ltd. | 7,066,000 | 3,551 |
| ^ | China Shineway | | |
| | Pharmaceutical | | |
| | Group Ltd. | 1,025,000 | 3,495 |
| ^ | Datang International Power | |
| | Generation Co. Ltd. | 8,594,000 | 3,467 |
| | BBMG Corp. | 2,394,500 | 3,405 |
| | Wumart Stores Inc. | 1,417,000 | 3,341 |
| * | Metallurgical Corp. of | | |
| | China Ltd. | 6,714,000 | 3,257 |
| ^ | Franshion Properties | | |
| | China Ltd. | 10,000,000 | 3,247 |
| | Sinopec Shanghai | | |
| | Petrochemical Co. Ltd. | 6,664,000 | 2,998 |
| ^ | Hidili Industry International | | |
| | Development Ltd. | 2,758,000 | 2,951 |
| * | Sinofert Holdings Ltd. | 5,494,000 | 2,919 |
| | China Communications | | |
| | Services Corp. Ltd. | 4,894,000 | 2,856 |
| ^ | Maanshan Iron & Steel | 4,960,000 | 2,851 |
| | Beijing Capital International | | |
| | Airport Co. Ltd. | 5,116,000 | 2,830 |
| | KWG Property | | |
| | Holding Ltd. | 3,421,000 | 2,718 |
| ^ | China Zhongwang | | |
| | Holdings Ltd. | 4,479,200 | 2,678 |
| ^ | Skyworth Digital | | |
| | Holdings Ltd. | 4,251,000 | 2,500 |
| | Sinotruk Hong Kong Ltd. | 1,993,500 | 2,300 |
| | Greentown China | | |
| | Holdings Ltd. | 1,790,500 | 2,080 |
| | Shanghai Lujiazui Finance & | |
| | Trade Zone Development | | |
| | Co. Ltd. Class B | 1,215,800 | 1,915 |
| * | China Travel International | | |
| | Inv HK | 7,830,000 | 1,873 |
| ^ | Hopson Development | | |
| | Holdings Ltd. | 1,672,000 | 1,872 |
| * | Kingboard Chemical | | |
| | Holdings Ltd. Warrants | | |
| | Exp. 10/31/2012 | 117,650 | 67 |
| | | | 1,825,116 |
| Colombia (0.1%) | | |
| | BanColombia SA ADR | 386,834 | 26,092 |
| | Ecopetrol SA | 1,592,465 | 3,818 |
| | Grupo de Inversiones | | |
| | Suramericana SA | 44,715 | 997 |
| | Cementos Argos SA | 128,080 | 884 |
| | Inversiones Argos SA | 46,452 | 556 |
| | Almacenes Exito SA | 42,086 | 549 |
| | | |
| | | | Market |
| | | | Value |
| | | Shares | ($000) |
| | Interconexion Electrica SA | 58,104 | 461 |
| | | | 33,357 |
| Czech Republic (0.1%) | | |
| | CEZ AS | 446,595 | 19,749 |
| | Komercni Banka AS | 41,047 | 9,318 |
| | Telefonica O2 Czech | | |
| | Republic AS | 306,172 | 6,730 |
| * | Central European Media | | |
| | Enterprises Ltd. Class A | 81,000 | 1,912 |
| | | | 37,709 |
| Denmark (0.8%) | | |
| | Novo Nordisk A/S Class B | 1,180,041 | 123,907 |
| * | Danske Bank A/S | 1,247,988 | 33,151 |
| | Carlsberg A/S Class B | 294,133 | 32,158 |
| | AP Moller - Maersk A/S | | |
| | Class B | 3,621 | 31,421 |
| * | Vestas Wind Systems A/S | 561,887 | 17,912 |
| | Novozymes A/S | 127,380 | 16,971 |
| | AP Moller - Maersk A/S | 1,522 | 12,792 |
| | DSV A/S | 571,527 | 11,719 |
| | Coloplast A/S Class B | 62,661 | 7,759 |
| * | William Demant | | |
| | Holding A/S | 65,102 | 4,880 |
| | Tryg A/S | 70,309 | 3,543 |
| | | | 296,213 |
| Egypt (0.1%) | | |
| | Orascom Construction | | |
| | Industries GDR | 254,863 | 11,832 |
| * | Orascom Telecom Holding | |
| | SAE GDR | 1,518,252 | 5,891 |
| | Egyptian Financial | | |
| | Group-Hermes Holding | 470,887 | 2,365 |
| * | Talaat Moustafa Group | 1,787,940 | 2,353 |
| | Commercial International | | |
| | Bank Egypt SAE | 240,937 | 1,810 |
| * | Ezz Steel | 503,430 | 1,637 |
| | Telecom Egypt | 420,433 | 1,288 |
| | Egyptian Kuwaiti | | |
| | Holding Co. | 349,080 | 582 |
| | Egyptian Co. for | | |
| | Mobile Services | 12,523 | 375 |
| * | ElSewedy Electric Co. | 39,982 | 374 |
| | | | 28,507 |
| Finland (0.8%) | | |
| | Nokia Oyj | 10,144,235 | 108,943 |
| | Fortum Oyj | 1,220,668 | 34,621 |
| | Sampo Oyj | 1,153,586 | 32,303 |
| | UPM-Kymmene Oyj | 1,437,619 | 23,887 |
| | Kone Oyj Class B | 423,411 | 22,685 |
| | Metso Oyj | 353,606 | 16,765 |
| | Stora Enso Oyj | 1,608,291 | 15,980 |
| | Wartsila Oyj | 226,605 | 15,891 |
| | Nokian Renkaat Oyj | 291,371 | 10,102 |
18
Total International Stock Index Fund
| | | |
| | | | Market |
| | | | Value |
| | | Shares | ($000) |
| | Kesko Oyj Class B | 181,451 | 9,004 |
| | Elisa Oyj | 369,104 | 7,894 |
| | Outokumpu Oyj | 330,235 | 5,932 |
| | Neste Oil Oyj | 350,536 | 5,815 |
| | Orion Oyj Class B | 246,529 | 5,244 |
| | Sanoma Oyj | 223,328 | 5,039 |
| | Pohjola Bank plc | 381,368 | 4,825 |
| | Rautaruukki Oyj | 227,488 | 4,521 |
| | | | 329,451 |
| France (7.6%) | | |
| | Total SA | 5,778,033 | 314,523 |
| | Sanofi-Aventis SA | 2,866,617 | 200,841 |
| | BNP Paribas | 2,590,914 | 189,515 |
| ^ | GDF Suez | 3,399,929 | 135,852 |
| | France Telecom SA | 5,068,594 | 121,612 |
| | LVMH Moet Hennessy | | |
| | Louis Vuitton SA | 669,337 | 105,014 |
| | Societe Generale | 1,719,087 | 103,085 |
| | Danone | 1,594,139 | 101,077 |
| | Air Liquide SA | 773,235 | 100,116 |
| | Vivendi SA | 3,360,745 | 96,034 |
| | Schneider Electric SA | 657,164 | 93,371 |
| | Carrefour SA | 1,637,983 | 88,686 |
| | AXA SA | 4,695,227 | 85,627 |
| | L’Oreal SA | 655,311 | 76,975 |
| | ArcelorMittal | 2,347,241 | 75,953 |
| | Vinci SA | 1,192,348 | 63,936 |
| | Unibail-Rodamco SE | 249,751 | 52,110 |
| | Cie de St-Gobain | 1,052,908 | 49,468 |
| | Pernod-Ricard SA | 541,727 | 48,151 |
| | Credit Agricole SA | 2,540,930 | 41,673 |
| ^ | Cie Generale des | | |
| | Etablissements Michelin | | |
| | Class B | 477,302 | 38,138 |
| | Cie Generale d’Optique | | |
| | Essilor International SA | 550,570 | 36,796 |
| | PPR | 207,245 | 34,086 |
| | EDF SA | 706,460 | 32,410 |
| | Lafarge SA | 547,174 | 31,291 |
| | Vallourec SA | 296,986 | 30,879 |
| ^ | Hermes International | 144,040 | 30,595 |
| * | European Aeronautic | | |
| | Defence and Space | | |
| | Co. NV | 1,113,498 | 29,292 |
| * | Renault SA | 524,531 | 29,283 |
| | Alstom SA | 561,890 | 28,377 |
| | Bouygues SA | 630,047 | 27,866 |
| | Veolia Environnement | 942,858 | 27,726 |
| | Christian Dior SA | 173,666 | 25,132 |
| | Technip SA | 268,540 | 22,623 |
| * | Alcatel-Lucent | 6,338,024 | 22,282 |
| | SES SA | 817,788 | 21,001 |
| | Cap Gemini SA | 401,958 | 20,519 |
| | | |
| | | | Market |
| | | | Value |
| | | Shares | ($000) |
| | Publicis Groupe SA | 338,132 | 16,844 |
| | Sodexo | 257,270 | 16,743 |
| * | Peugeot SA | 415,139 | 16,606 |
| | Accor SA | 403,469 | 16,558 |
| | STMicroelectronics NV | 1,738,863 | 15,248 |
| * | Natixis | 2,380,728 | 14,625 |
| | Safran SA | 455,300 | 14,445 |
| | Suez Environnement Co. | 733,119 | 14,345 |
| | Casino Guichard | | |
| | Perrachon SA | 151,556 | 14,259 |
| | Legrand SA | 358,971 | 13,861 |
| | Lagardere SCA | 324,098 | 13,846 |
| | Groupe Eurotunnel SA | 1,302,515 | 12,958 |
| | Dassault Systemes SA | 161,148 | 12,370 |
| | SCOR SE | 456,196 | 11,217 |
| | Eutelsat Communications | 272,813 | 10,268 |
| | Klepierre | 261,180 | 10,167 |
| | Thales SA | 244,936 | 9,995 |
| | Bureau Veritas SA | 134,189 | 9,919 |
| * | Cie Generale de | | |
| | Geophysique-Veritas | 392,127 | 9,160 |
| * | Edenred | 403,385 | 8,450 |
| | CNP Assurances | 407,597 | 8,145 |
| | Fonciere Des Regions | 66,336 | 7,583 |
| | Neopost SA | 85,255 | 7,082 |
| | ICADE | 63,801 | 7,013 |
| | Aeroports de Paris | 80,683 | 6,856 |
| * | Air France-KLM | 369,252 | 6,742 |
| | Societe BIC SA | 73,720 | 6,544 |
| | Gecina SA | 51,036 | 6,197 |
| | Imerys SA | 102,327 | 6,114 |
| | Eurazeo | 79,361 | 6,035 |
| * | Atos Origin SA | 123,360 | 5,709 |
| | Eiffage SA | 110,809 | 5,478 |
| * | JCDecaux SA | 182,546 | 5,362 |
| | Societe Television | | |
| | Francaise 1 | 323,034 | 5,295 |
| | Iliad SA | 44,380 | 4,999 |
| | Eramet | 14,382 | 4,993 |
| | Metropole Television SA | 176,852 | 4,329 |
| | PagesJaunes Groupe | 349,090 | 3,848 |
| | BioMerieux | 32,315 | 3,115 |
| | Ipsen SA | 79,852 | 2,814 |
| | | | 3,008,052 |
| Germany (6.1%) | | |
| | Siemens AG | 2,249,296 | 256,679 |
| | BASF SE | 2,510,905 | 182,572 |
| | Bayer AG | 2,260,681 | 168,618 |
| * | Daimler AG | 2,404,498 | 158,347 |
| | Allianz SE | 1,240,856 | 155,390 |
| | E.ON AG | 4,923,238 | 154,100 |
| | Deutsche Bank AG | 2,545,924 | 146,660 |
| | SAP AG | 2,346,193 | 122,235 |
19
Total International Stock Index Fund
| | | |
| | | | Market |
| | | | Value |
| | | Shares | ($000) |
| | Deutsche Telekom AG | 7,749,836 | 112,267 |
| | RWE AG | 1,144,762 | 82,034 |
| | Muenchener | | |
| | Rueckversicherungs AG | 515,272 | 80,537 |
| | Volkswagen AG Prior Pfd. | 465,322 | 69,772 |
| | Linde AG | 461,957 | 66,464 |
| | Bayerische Motoren | | |
| | Werke AG | 905,646 | 64,910 |
| | Deutsche Post AG | 2,317,356 | 43,197 |
| | Deutsche Boerse AG | 534,206 | 37,581 |
| | Adidas AG | 570,912 | 37,185 |
| | ThyssenKrupp AG | 912,563 | 33,575 |
| | Fresenius Medical Care | | |
| | AG & Co. KGaA | 524,574 | 33,386 |
| | MAN SE | 288,519 | 31,692 |
| | Henkel AG & Co. | | |
| | KGaA Prior Pfd. | 486,173 | 28,666 |
| | K&S AG | 391,721 | 27,252 |
| | Metro AG | 353,774 | 24,791 |
| * | Infineon Technologies AG 2,965,514 | 23,330 |
| | HeidelbergCement AG | 384,203 | 20,062 |
| | Fresenius SE Prior Pfd. | 219,925 | 19,712 |
| | Beiersdorf AG | 275,064 | 17,915 |
| | Henkel AG & Co. KGaA | 355,850 | 17,635 |
| * | Commerzbank AG | 1,943,669 | 17,504 |
| | Merck KGaA | 176,339 | 14,682 |
| * | Deutsche Lufthansa AG | 625,661 | 13,375 |
| | Porsche Automobil | | |
| | Holding SE Prior Pfd. | 238,055 | 12,185 |
| * | QIAGEN NV | 634,742 | 12,028 |
| | GEA Group AG | 454,287 | 11,875 |
| * | Continental AG | 136,445 | 11,846 |
| | Hochtief AG | 125,069 | 10,845 |
| | Volkswagen AG | 80,664 | 10,575 |
| | Wacker Chemie AG | 42,872 | 8,841 |
| | Hannover | | |
| | Rueckversicherung AG | 166,058 | 8,399 |
| *,^ | Deutsche Postbank AG | 238,913 | 8,310 |
| | Salzgitter AG | 114,087 | 8,186 |
| | RWE AG Prior Pfd. | 107,307 | 7,266 |
| | Bayerische Motoren | | |
| | Werke AG Prior Pfd. | 143,067 | 6,965 |
| | Fresenius SE | 77,021 | 6,792 |
| | Fraport AG Frankfurt Airport | |
| | Services Worldwide | 99,846 | 6,334 |
| | United Internet AG | 327,734 | 5,870 |
| | Celesio AG | 208,850 | 4,978 |
| | Puma AG Rudolf | | |
| | Dassler Sport | 14,611 | 4,849 |
| * | TUI AG | 384,733 | 4,486 |
| | Suedzucker AG | 182,640 | 4,312 |
| * | Daimler AG | 61,377 | 4,050 |
| | | | 2,421,117 |
| | | |
| | | | Market |
| | | | Value |
| | | Shares | ($000) |
| Greece (0.2%) | | |
| | National Bank of | | |
| | Greece SA | 2,477,815 | 27,197 |
| | Coca Cola Hellenic | | |
| | Bottling Co. SA | 500,649 | 12,933 |
| | OPAP SA | 610,713 | 11,505 |
| | Bank of Cyprus | | |
| | Public Co. Ltd. | 2,293,697 | 10,688 |
| * | Alpha Bank AE | 1,335,514 | 8,822 |
| * | EFG Eurobank Ergasias SA 894,298 | 5,520 |
| | Public Power Corp. SA | 324,175 | 5,425 |
| * | Piraeus Bank SA | 860,624 | 4,470 |
| | Hellenic Telecommunications | |
| | Organization SA | 509,812 | 4,072 |
| | National Bank of | | |
| | Greece SA ADR | 566,453 | 1,280 |
| | Hellenic Telecommunications | |
| | Organization SA ADR | 258,536 | 1,037 |
| | | | 92,949 |
| Hong Kong (2.0%) | | |
| | Sun Hung Kai | | |
| | Properties Ltd. | 3,864,000 | 66,469 |
| | Hong Kong Exchanges | | |
| | and Clearing Ltd. | 2,799,500 | 61,795 |
| | Cheung Kong Holdings Ltd. 3,800,000 | 58,042 |
| | Hutchison Whampoa Ltd. | 5,827,000 | 57,549 |
| | CLP Holdings Ltd. | 5,268,000 | 42,826 |
| | Li & Fung Ltd. | 6,242,000 | 33,050 |
| | BOC Hong Kong | | |
| | Holdings Ltd. | 10,096,500 | 31,756 |
| | Hang Seng Bank Ltd. | 2,095,000 | 30,697 |
| | Swire Pacific Ltd. Class A | 2,099,500 | 29,884 |
| | Hong Kong & | | |
| | China Gas Co. Ltd. | 11,751,800 | 28,381 |
| | Hang Lung Properties Ltd. | 5,698,000 | 27,951 |
| | Wharf Holdings Ltd. | 3,756,000 | 24,730 |
| | Hongkong Electric | | |
| | Holdings Ltd. | 3,785,500 | 24,066 |
| | Henderson Land | | |
| | Development Co. Ltd. | 2,951,000 | 21,033 |
| | Link REIT | 6,002,500 | 18,526 |
| | Bank of East Asia Ltd. | 4,165,820 | 17,860 |
| | Esprit Holdings Ltd. | 3,168,369 | 17,100 |
| | MTR Corp. | 3,905,500 | 14,905 |
| | Hang Lung Group Ltd. | 2,189,000 | 14,556 |
| * | Sands China Ltd. | 6,599,000 | 14,390 |
| | New World | | |
| | Development Ltd. | 6,930,000 | 13,735 |
| | Kerry Properties Ltd. | 1,957,000 | 10,872 |
| | Sino Land Co. Ltd. | 4,694,000 | 9,841 |
| *,^ | Wynn Macau Ltd. | 4,291,600 | 9,502 |
| | Wheelock & Co. Ltd. | 2,493,000 | 8,755 |
| | Cathay Pacific | | |
| | Airways Ltd. | 3,243,000 | 8,738 |
20
Total International Stock Index Fund
| | | | |
| | | | | Market |
| | | | | Value |
| | | | Shares | ($000) |
| | Shangri-La Asia Ltd. | | 3,556,000 | 8,018 |
| | Yue Yuen Industrial | | | |
| | Holdings Ltd. | | 2,028,500 | 7,276 |
| | Hysan Development | | | |
| | Co. Ltd. | | 1,733,000 | 6,712 |
| * | AIA Group Ltd. | | 2,232,400 | 6,639 |
| | Wing Hang Bank Ltd. | 483,500 | 5,664 |
| | NWS Holdings Ltd. | | 2,282,258 | 5,391 |
| | Cheung Kong | | | |
| | Infrastructure | | | |
| | Holdings Ltd. | | 1,253,000 | 5,240 |
| | Orient Overseas | | | |
| | International Ltd. | | 593,500 | 5,216 |
| | ASM Pacific Technology Ltd. 543,300 | 4,913 |
| | Hopewell Holdings Ltd. | 1,559,000 | 4,911 |
| *,^ | Foxconn International | | |
| | Holdings Ltd. | | 5,972,000 | 4,412 |
| | Television Broadcasts Ltd. | 794,000 | 4,244 |
| | PCCW Ltd. | 10,925,000 | 4,180 |
| | Lifestyle International | | |
| | Holdings Ltd. | | 1,636,500 | 3,809 |
| * | Mongolia Energy Co. Ltd. | 8,301,000 | 3,189 |
| * | Henderson Land | | | |
| | Development Co. Ltd. | | |
| | Warrants Exp. 06/01/2011 | 428,800 | 166 |
| | | | | 776,989 |
| Hungary (0.1%) | | | |
| *,^ | OTP Bank plc | | 651,787 | 19,357 |
| * | MOL Hungarian | | | |
| | Oil and Gas plc | | 115,112 | 12,231 |
| | Richter Gedeon Nyrt. | 38,660 | 9,213 |
| | Magyar Telekom | | | |
| | Telecommunications plc | 1,275,952 | 3,679 |
| | | | | 44,480 |
| India (2.1%) | | | |
| | Reliance Industries Ltd. | 3,576,257 | 88,320 |
| | Infosys Technologies Ltd. | 1,258,759 | 84,413 |
| | Housing Development | | |
| | Finance Corp. | | 2,921,891 | 45,283 |
| | ICICI Bank Ltd. | | 1,690,394 | 44,507 |
| | Tata Consultancy | | | |
| | Services Ltd. | | 1,282,400 | 30,461 |
| | HDFC Bank Ltd. | | 538,586 | 27,700 |
| | Larsen & Toubro Ltd. | 559,149 | 25,559 |
| | ITC Ltd. | | 6,043,069 | 23,330 |
| | Axis Bank Ltd. | | 555,233 | 18,434 |
| | Tata Motors Ltd. | | 690,909 | 18,098 |
| | Bharat Heavy | | | |
| | Electricals Ltd. | | 321,911 | 17,759 |
| | Jindal Steel & Power Ltd. | 1,022,456 | 16,098 |
| | Hindustan Unilever Ltd. | 2,379,314 | 15,830 |
| | Oil & Natural | | | |
| | Gas Corp. Ltd. | | 525,550 | 15,456 |
| | | |
| | | | Market |
| | | | Value |
| | | Shares | ($000) |
| | Hindalco Industries Ltd. | 3,035,449 | 14,435 |
| | Sterlite Industries | | |
| | India Ltd. | 3,675,605 | 14,068 |
| | ICICI Bank Ltd. ADR | 255,755 | 13,448 |
| | HDFC Bank Ltd. ADR | 70,703 | 12,229 |
| | Mahindra & Mahindra Ltd. | 710,862 | 11,753 |
| | Infrastructure Development | | |
| | Finance Co. Ltd. | 2,587,490 | 11,710 |
| | GAIL India Ltd. | 1,039,297 | 11,520 |
| | NTPC Ltd. | 2,469,549 | 10,862 |
| | Tata Steel Ltd. | 778,399 | 10,343 |
| | State Bank of India | 143,660 | 10,222 |
| | Adani Enterprises Ltd. | 630,582 | 10,027 |
| | Wipro Ltd. | 1,012,495 | 9,581 |
| | Hero Honda Motors Ltd. | 218,588 | 9,189 |
| | DLF Ltd. | 1,111,213 | 8,795 |
| | Tata Power Co. Ltd. | 266,727 | 8,402 |
| | Bajaj Auto Ltd. | 237,326 | 8,090 |
| | Sun Pharmaceutical | | |
| | Industries Ltd. | 167,975 | 7,985 |
| * | Cairn India Ltd. | 1,039,708 | 7,523 |
| | United Spirits Ltd. | 222,934 | 7,520 |
| | Kotak Mahindra Bank Ltd. | 707,204 | 7,403 |
| | Cipla Ltd. | 902,230 | 7,177 |
| | Jaiprakash Associates Ltd. | 2,586,292 | 7,024 |
| | Reliance Infrastructure Ltd. | 299,033 | 6,994 |
| | JSW Steel Ltd. | 229,689 | 6,958 |
| | Sesa Goa Ltd. | 938,387 | 6,817 |
| | Maruti Suzuki India Ltd. | 190,173 | 6,654 |
| | Unitech Ltd. | 3,324,496 | 6,521 |
| | Dr Reddy’s | | |
| | Laboratories Ltd. | 170,646 | 6,393 |
| | Reliance | | |
| | Communications Ltd. | 1,418,726 | 5,759 |
| | Steel Authority of | | |
| | India Ltd. | 1,241,514 | 5,451 |
| | Rural Electrification | | |
| | Corp. Ltd. | 650,587 | 5,437 |
| | Ambuja Cements Ltd. | 1,682,879 | 5,319 |
| | Reliance Capital Ltd. | 270,500 | 4,974 |
| ^ | Wipro Ltd. ADR | 324,393 | 4,632 |
| ^ | Dr Reddy’s Laboratories | | |
| | Ltd. ADR | 107,619 | 4,071 |
| | Siemens India Ltd. | 218,984 | 4,037 |
| | HCL Technologies Ltd. | 438,611 | 3,998 |
| | Bharat Petroleum Corp. Ltd. | 233,823 | 3,842 |
| * | Ranbaxy Laboratories Ltd. | 292,322 | 3,824 |
| | Zee Entertainment | | |
| | Enterprises Ltd. | 599,133 | 3,733 |
| * | Indiabulls Real Estate Ltd. | 861,108 | 3,720 |
| | ACC Ltd. | 143,596 | 3,192 |
| * | GMR Infrastructure Ltd. | 2,568,782 | 3,104 |
| * | Satyam Computer | | |
| | Services Ltd. | 1,604,959 | 2,856 |
21
Total International Stock Index Fund
| | | |
| | | | Market |
| | | | Value |
| | | Shares | ($000) |
| | Piramal Healthcare Ltd. | 256,661 | 2,761 |
| * | Housing Development & | | |
| | Infrastructure Ltd. | 492,424 | 2,755 |
| | United Phosphorus Ltd. | 603,505 | 2,715 |
| * | Suzlon Energy Ltd. | 1,905,118 | 2,376 |
| | State Bank of India GDR | 14,807 | 2,043 |
| | Aditya Birla Nuvo Ltd. | 101,177 | 1,869 |
| * | Reliance Natural | | |
| | Resources Ltd. | 1,874,251 | 1,628 |
| | | | 814,987 |
| Indonesia (0.6%) | | |
| | Astra International Tbk PT | 5,589,000 | 35,784 |
| | Telekomunikasi Indonesia | | |
| | Tbk PT | 27,781,500 | 28,203 |
| | Bank Central Asia Tbk PT | 33,773,500 | 26,534 |
| | Bank Rakyat Indonesia | | |
| | Persero Tbk PT | 15,261,500 | 19,539 |
| | Bank Mandiri Tbk PT | 20,151,500 | 15,841 |
| | Perusahaan Gas | | |
| | Negara PT | 30,145,500 | 13,713 |
| | Bumi Resources Tbk PT | 48,486,500 | 12,141 |
| | United Tractors Tbk PT | 4,180,500 | 10,420 |
| | Semen Gresik Persero | | |
| | Tbk PT | 8,082,000 | 8,886 |
| | Unilever Indonesia Tbk PT | 4,295,500 | 8,413 |
| | Indocement Tunggal | | |
| | Prakarsa Tbk PT | 4,096,500 | 8,411 |
| | Gudang Garam Tbk PT | 1,547,500 | 8,279 |
| | Indofood Sukses | | |
| | Makmur Tbk PT | 12,333,000 | 7,193 |
| | Bank Danamon Indonesia | | |
| | Tbk PT | 7,670,401 | 5,769 |
| | Adaro Energy Tbk PT | 23,209,000 | 5,476 |
| | Tambang Batubara Bukit | | |
| | Asam Tbk PT | 2,257,500 | 4,974 |
| | Indo Tambangraya | | |
| | Megah PT | 932,300 | 4,728 |
| | Bank Negara Indonesia | | |
| | Persero Tbk PT | 10,283,500 | 4,496 |
| | International Nickel | | |
| | Indonesia Tbk PT | 5,829,500 | 3,114 |
| | Astra Agro Lestari Tbk PT | 1,054,000 | 2,947 |
| | Indosat Tbk PT | 3,845,500 | 2,588 |
| | Aneka Tambang Tbk PT | 8,966,000 | 2,569 |
| | | | 240,018 |
| Ireland (0.2%) | | |
| | CRH plc | 1,934,801 | 33,421 |
| | Kerry Group plc Class A | 384,448 | 14,148 |
| | Ryanair Holdings plc ADR | 312,954 | 10,212 |
| * | Elan Corp. plc | 1,362,865 | 7,563 |
| * | Governor & Co. of the | | |
| | Bank of Ireland | 9,286,855 | 6,936 |
| | | | |
| | | | | Market |
| | | | | Value |
| | | | Shares | ($000) |
| | Ryanair Holdings plc | | 690,254 | 3,978 |
| | WPP plc ADR | | 14,669 | 852 |
| * | Anglo Irish Bank Corp. Ltd. | 698,992 | 211 |
| | | | | 77,321 |
| Israel (0.6%) | | | |
| | Teva Pharmaceutical | | | |
| | Industries Ltd. | | 2,501,437 | 129,728 |
| | Israel Chemicals Ltd. | | 1,223,389 | 18,671 |
| * | Bank Leumi Le-Israel BM | | 3,278,119 | 15,084 |
| | Bezeq Israeli | | | |
| | Telecommunication | | | |
| | Corp. Ltd. | | 4,780,970 | 12,569 |
| * | Bank Hapoalim BM | | 2,741,608 | 12,424 |
| * | Israel Corp. Ltd. | | 6,084 | 6,526 |
| * | NICE Systems Ltd. | | 171,543 | 5,663 |
| | Partner Communications | | | |
| | Co. Ltd. | | 220,441 | 4,477 |
| | Makhteshim-Agan | | | |
| | Industries Ltd. | | 713,508 | 3,600 |
| | Elbit Systems Ltd. | | 59,305 | 3,149 |
| | Cellcom Israel Ltd. | | 92,433 | 3,123 |
| | Mizrahi Tefahot Bank Ltd. | | 330,039 | 3,081 |
| | Delek Group Ltd. | | 10,624 | 2,964 |
| * | Israel Discount Bank Ltd. | | | |
| | Class A | | 1,370,821 | 2,781 |
| | Teva Pharmaceutical | | | |
| | Industries Ltd. ADR | | 42,703 | 2,216 |
| | Discount Investment Corp. | 74,199 | 1,703 |
| | Cellcom Israel Ltd. | | | |
| | (Registered) | | 43,474 | 1,461 |
| | Ormat Industries | | 180,611 | 1,433 |
| | | | | 230,653 |
| Italy (2.2%) | | | |
| | ENI SPA | | 7,117,312 | 160,264 |
| | Enel SPA | 17,994,600 | 102,788 |
| | UniCredit SPA | 36,882,154 | 96,154 |
| | Intesa Sanpaolo SPA | | | |
| | (Registered) | 21,059,167 | 74,069 |
| | Assicurazioni | | | |
| | Generali SPA | | 3,193,226 | 69,995 |
| | Telecom Italia | | | |
| | SPA (Registered) | 25,559,782 | 39,228 |
| | Fiat SPA | | 2,086,376 | 35,331 |
| | Saipem SPA | | 723,790 | 32,157 |
| | Tenaris SA | | 1,022,211 | 21,195 |
| | Snam Rete Gas SPA | | 3,906,332 | 21,178 |
| | Telecom Italia | | | |
| | SPA (Bearer) | 16,507,351 | 20,254 |
| | Unione di Banche | | | |
| | Italiane SCPA | | 1,656,903 | 17,495 |
| | Terna Rete Elettrica | | | |
| | Nazionale SPA | | 3,566,192 | 16,456 |
22
Total International Stock Index Fund
| | | |
| | | | Market |
| | | | Value |
| | | Shares | ($000) |
| | Finmeccanica SPA | 1,109,334 | 15,502 |
| | Atlantia SPA | 655,442 | 14,983 |
| | Mediaset SPA | 1,944,703 | 14,358 |
| * | Mediobanca SPA | 1,300,789 | 13,484 |
| | Parmalat SPA | 4,695,334 | 12,907 |
| | Prysmian SPA | 494,522 | 9,585 |
| ^ | Banco Popolare SC | 1,738,539 | 9,344 |
| | Luxottica Group SPA | 315,541 | 9,319 |
| * | Banca Monte dei Paschi | | |
| | di Siena SPA | 6,125,279 | 8,622 |
| | Intesa Sanpaolo | | |
| | SPA (Bearer) | 2,556,417 | 7,005 |
| | Tenaris SA ADR | 139,938 | 5,798 |
| | Pirelli & C SPA | 653,091 | 5,580 |
| | Banca Popolare di | | |
| | Milano Scarl | 1,073,657 | 5,020 |
| | A2A SPA | 2,976,556 | 4,853 |
| | Exor SPA | 174,069 | 4,475 |
| * | Autogrill SPA | 312,394 | 4,166 |
| | Banca Carige SPA | 1,536,236 | 3,720 |
| ^ | Mediolanum SPA | 587,168 | 2,760 |
| | | | 858,045 |
| Japan (15.4%) | | |
| | Toyota Motor Corp. | 7,541,200 | 267,111 |
| | Honda Motor Co. Ltd. | 4,514,587 | 162,745 |
| | Mitsubishi UFJ | | |
| | Financial Group Inc. | 34,813,099 | 161,568 |
| | Canon Inc. | 3,099,355 | 142,673 |
| | Sumitomo Mitsui | | |
| | Financial Group Inc. | 3,672,549 | 109,617 |
| | Takeda Pharmaceutical | | |
| | Co. Ltd. | 2,050,900 | 96,139 |
| | Tokyo Electric | | |
| | Power Co. Inc. | 3,888,600 | 92,853 |
| | Sony Corp. | 2,746,300 | 92,789 |
| | Mitsubishi Corp. | 3,710,936 | 89,135 |
| | Mizuho Financial | | |
| | Group Inc. | 54,825,629 | 79,515 |
| | Panasonic Corp. | 5,365,300 | 78,212 |
| | Fanuc Ltd. | 523,900 | 75,845 |
| | Mitsui & Co. Ltd. | 4,750,800 | 74,718 |
| | Softbank Corp. | 2,219,600 | 71,283 |
| | NTT DoCoMo Inc. | 41,896 | 70,623 |
| | Nintendo Co. Ltd. | 271,100 | 70,003 |
| | Nippon Telegraph & | | |
| | Telephone Corp. | 1,420,200 | 64,052 |
| | Komatsu Ltd. | 2,594,000 | 63,401 |
| | Nissan Motor Co. Ltd. | 6,797,700 | 59,744 |
| | East Japan Railway Co. | 929,800 | 57,418 |
| | Shin-Etsu | | |
| | Chemical Co. Ltd. | 1,122,300 | 56,750 |
| | Mitsubishi | | |
| | Estate Co. Ltd. | 3,231,000 | 56,602 |
| | | |
| | | | Market |
| | | | Value |
| | | Shares | ($000) |
| | Hitachi Ltd. | 12,354,161 | 55,836 |
| | Tokio Marine | | |
| | Holdings Inc. | 1,979,500 | 55,655 |
| | Toshiba Corp. | 11,006,000 | 55,087 |
| | Kansai Electric | | |
| | Power Co. Inc. | 2,069,800 | 52,387 |
| | Nomura Holdings Inc. | 9,659,390 | 49,638 |
| | Mitsubishi Electric Corp. | 5,277,000 | 49,457 |
| | Seven & I | | |
| | Holdings Co. Ltd. | 2,059,600 | 47,810 |
| | Astellas Pharma Inc. | 1,215,200 | 45,208 |
| | Chubu Electric | | |
| | Power Co. Inc. | 1,772,800 | 44,803 |
| | Kyocera Corp. | 444,700 | 44,320 |
| | Nippon Steel Corp. | 13,957,000 | 43,869 |
| | Mitsui Fudosan Co. Ltd. | 2,290,000 | 43,305 |
| | KDDI Corp. | 7,979 | 43,013 |
| | FUJIFILM Holdings Corp. | 1,266,248 | 42,244 |
| | Denso Corp. | 1,329,200 | 41,336 |
| | JFE Holdings Inc. | 1,260,500 | 39,308 |
| | Daiichi Sankyo Co. Ltd. | 1,839,500 | 38,982 |
| | Sumitomo Corp. | 3,073,300 | 38,910 |
| | Japan Tobacco Inc. | 12,306 | 38,231 |
| | Kao Corp. | 1,475,200 | 37,495 |
| | JX Holdings Inc. | 6,131,970 | 36,146 |
| | ITOCHU Corp. | 4,116,000 | 36,074 |
| | MS&AD Insurance | | |
| | Group Holdings | 1,471,384 | 35,250 |
| | Fujitsu Ltd. | 5,089,000 | 34,714 |
| | Tokyo Gas Co. Ltd. | 7,013,000 | 32,995 |
| | Bridgestone Corp. | 1,775,200 | 31,778 |
| | Kirin Holdings Co. Ltd. | 2,285,000 | 31,313 |
| | Central Japan Railway Co. | 4,114 | 31,117 |
| | Murata Manufacturing | | |
| | Co. Ltd. | 552,900 | 31,071 |
| | Inpex Corp. | 5,850 | 30,465 |
| | Mitsubishi Heavy | | |
| | Industries Ltd. | 8,283,000 | 30,109 |
| | Nidec Corp. | 298,100 | 29,438 |
| | Marubeni Corp. | 4,514,000 | 28,357 |
| | Keyence Corp. | 113,510 | 28,122 |
| | Kubota Corp. | 3,154,000 | 27,970 |
| | Hoya Corp. | 1,186,900 | 27,725 |
| | Sharp Corp. | 2,727,000 | 26,938 |
| | Dai-ichi Life | | |
| | Insurance Co. Ltd. | 21,917 | 26,550 |
| | Tokyo Electron Ltd. | 469,900 | 26,513 |
| * | NKSJ Holdings Inc. | 3,859,400 | 26,485 |
| | Asahi Glass Co. Ltd. | 2,750,000 | 26,380 |
| | Sumitomo Electric | | |
| | Industries Ltd. | 2,064,800 | 26,274 |
| | Tohoku Electric | | |
| | Power Co. Inc. | 1,171,200 | 26,268 |
23
Total International Stock Index Fund
| | | |
| | | | Market |
| | | | Value |
| | | Shares | ($000) |
| | Secom Co. Ltd. | 574,900 | 26,157 |
| | ORIX Corp. | 285,551 | 26,010 |
| | Ricoh Co. Ltd. | 1,834,000 | 25,655 |
| | Kyushu Electric | | |
| | Power Co. Inc. | 1,039,500 | 24,608 |
| | Eisai Co. Ltd. | 688,800 | 23,696 |
| | Terumo Corp. | 461,300 | 23,426 |
| | Toray Industries Inc. | 3,950,000 | 22,884 |
| | Sumitomo Metal | | |
| | Mining Co. Ltd. | 1,432,000 | 22,788 |
| | SMC Corp. | 146,900 | 22,426 |
| | Daikin Industries Ltd. | 642,600 | 22,357 |
| | Suzuki Motor Corp. | 911,500 | 22,247 |
| | Asahi Breweries Ltd. | 1,060,200 | 21,384 |
| | Sumitomo Metal | | |
| | Industries Ltd. | 9,186,000 | 21,321 |
| | Sumitomo Realty & | | |
| | Development Co. Ltd. | 978,000 | 21,304 |
| | Sumitomo Trust & | | |
| | Banking Co. Ltd. | 3,886,000 | 21,217 |
| | Asahi Kasei Corp. | 3,437,000 | 20,220 |
| | Osaka Gas Co. Ltd. | 5,326,000 | 20,113 |
| | Mitsui OSK Lines Ltd. | 3,121,000 | 19,960 |
| | NEC Corp. | 7,114,000 | 19,794 |
| | Shiseido Co. Ltd. | 928,800 | 19,391 |
| | Dai Nippon | | |
| | Printing Co. Ltd. | 1,535,000 | 19,363 |
| | Aeon Co. Ltd. | 1,641,700 | 19,335 |
| | TDK Corp. | 335,700 | 19,153 |
| | Fast Retailing Co. Ltd. | 145,400 | 19,046 |
| | Sumitomo | | |
| | Chemical Co. Ltd. | 4,297,000 | 18,734 |
| | Daiwa Securities | | |
| | Group Inc. | 4,546,000 | 18,535 |
| | Mitsubishi Chemical | | |
| | Holdings Corp. | 3,496,000 | 17,982 |
| | Nippon Yusen KK | 4,194,000 | 17,593 |
| | Ajinomoto Co. Inc. | 1,817,000 | 17,316 |
| | West Japan Railway Co. | 4,635 | 17,207 |
| | Nitto Denko Corp. | 450,900 | 16,872 |
| | Rohm Co. Ltd. | 268,700 | 16,757 |
| | Nikon Corp. | 877,500 | 16,572 |
| | Bank of Yokohama Ltd. | 3,353,000 | 16,440 |
| | Aisin Seiki Co. Ltd. | 524,400 | 16,431 |
| | Chugoku Electric | | |
| | Power Co. Inc. | 809,500 | 16,314 |
| ^ | Odakyu Electric | | |
| | Railway Co. Ltd. | 1,707,000 | 15,733 |
| | Olympus Corp. | 590,800 | 15,480 |
| | T&D Holdings Inc. | 745,550 | 15,224 |
| | Rakuten Inc. | 19,595 | 15,083 |
| | Hankyu Hanshin | | |
| | Holdings Inc. | 3,140,000 | 15,052 |
| | | |
| | | | Market |
| | | | Value |
| | | Shares | ($000) |
| | Kobe Steel Ltd. | 6,801,000 | 14,947 |
| | Sekisui House Ltd. | 1,567,000 | 14,727 |
| | Yamada Denki Co. Ltd. | 224,610 | 14,575 |
| | Shionogi & Co. Ltd. | 812,800 | 14,187 |
| | Daiwa House | | |
| | Industry Co. Ltd. | 1,311,000 | 14,128 |
| | Shikoku Electric | | |
| | Power Co. Inc. | 477,600 | 14,117 |
| ^ | Kintetsu Corp. | 4,421,000 | 14,000 |
| | Shizuoka Bank Ltd. | 1,633,000 | 13,982 |
| | Yahoo Japan Corp. | 39,864 | 13,915 |
| | Toyota Industries Corp. | 491,700 | 13,868 |
| | Tokyu Corp. | 3,098,000 | 13,848 |
| | Nippon Building | | |
| | Fund Inc. Class A | 1,404 | 13,757 |
| | Yamato Holdings Co. Ltd. | 1,087,400 | 13,709 |
| | JS Group Corp. | 686,000 | 13,482 |
| | Kuraray Co. Ltd. | 938,500 | 13,441 |
| | Oriental Land Co. Ltd. | 136,500 | 13,221 |
| ^ | Resona Holdings Inc. | 1,661,400 | 13,214 |
| | Unicharm Corp. | 340,900 | 13,023 |
| | Omron Corp. | 558,100 | 12,929 |
| | Chiba Bank Ltd. | 2,081,000 | 12,848 |
| | Japan Real Estate | | |
| | Investment Corp. | 1,329 | 12,794 |
| | Konica Minolta | | |
| | Holdings Inc. | 1,311,000 | 12,668 |
| | Daito Trust | | |
| | Construction Co. Ltd. | 208,700 | 12,620 |
| * | Mitsubishi Motors Corp. | 10,567,000 | 12,553 |
| | Tobu Railway Co. Ltd. | 2,234,000 | 12,545 |
| | Isuzu Motors Ltd. | 3,227,000 | 12,395 |
| | Nippon Electric | | |
| | Glass Co. Ltd. | 952,000 | 12,237 |
| | Toppan Printing Co. Ltd. | 1,520,000 | 12,210 |
| | Keikyu Corp. | 1,282,000 | 12,118 |
| | Hokuriku Electric | | |
| | Power Co. | 480,400 | 11,657 |
| | Isetan Mitsukoshi | | |
| | Holdings Ltd. | 1,024,500 | 11,304 |
| | Fuji Heavy Industries Ltd. | 1,616,000 | 11,137 |
| | Keio Corp. | 1,582,000 | 11,061 |
| * | Yamaha Motor Co. Ltd. | 717,100 | 11,003 |
| �� | JGC Corp. | 570,000 | 10,902 |
| | Chugai Pharmaceutical | | |
| | Co. Ltd. | 615,000 | 10,783 |
| | Dentsu Inc. | 454,200 | 10,703 |
| | OJI Paper Co. Ltd. | 2,318,000 | 10,693 |
| | Kawasaki Heavy | | |
| | Industries Ltd. | 3,861,000 | 10,660 |
| | Makita Corp. | 303,600 | 10,645 |
| | NTT Data Corp. | 3,455 | 10,623 |
| | Mazda Motor Corp. | 4,149,000 | 10,544 |
24
Total International Stock Index Fund
| | | |
| | | | Market |
| | | | Value |
| | | Shares | ($000) |
| | Hokkaido Electric | | |
| | Power Co. Inc. | 500,500 | 10,528 |
| | NGK Insulators Ltd. | 689,000 | 10,432 |
| | Mitsubishi Tanabe | | |
| | Pharma Corp. | 616,000 | 10,078 |
| | Chuo Mitsui Trust | | |
| | Holdings Inc. | 2,713,000 | 9,787 |
| | Ono Pharmaceutical | | |
| | Co. Ltd. | 230,300 | 9,786 |
| * | Mitsubishi Materials Corp. | 3,072,000 | 9,617 |
| | Teijin Ltd. | 2,532,000 | 9,375 |
| | Electric Power | | |
| | Development Co. Ltd. | 316,800 | 9,374 |
| | Nippon Express Co. Ltd. | 2,322,000 | 9,226 |
| | NSK Ltd. | 1,213,000 | 9,171 |
| | Shimano Inc. | 182,100 | 9,074 |
| | Toyota Tsusho Corp. | 583,300 | 9,030 |
| | Benesse Holdings Inc. | 187,400 | 8,994 |
| | Nitori Holdings Co. Ltd. | 102,200 | 8,993 |
| | Sega Sammy Holdings Inc. | 543,700 | 8,870 |
| | Hirose Electric Co. Ltd. | 87,500 | 8,795 |
| | MEIJI Holdings Co. Ltd. | 188,441 | 8,698 |
| | Ibiden Co. Ltd. | 349,300 | 8,594 |
| * | All Nippon Airways | | |
| | Co. Ltd. | 2,264,978 | 8,568 |
| | Sumitomo Heavy | | |
| | Industries Ltd. | 1,500,000 | 8,526 |
| | JSR Corp. | 490,000 | 8,452 |
| | Sony Financial Holdings Inc. | 2,387 | 8,301 |
| | Advantest Corp. | 433,600 | 8,236 |
| | Brother Industries Ltd. | 645,000 | 8,234 |
| | Fukuoka Financial | | |
| | Group Inc. | 2,116,000 | 8,207 |
| | Japan Steel Works Ltd. | 856,000 | 8,167 |
| | Kurita Water | | |
| | Industries Ltd. | 309,300 | 8,012 |
| | Joyo Bank Ltd. | 1,802,000 | 7,839 |
| | Sankyo Co. Ltd. | 146,400 | 7,800 |
| | Bank of Kyoto Ltd. | 872,000 | 7,787 |
| | Taisho Pharmaceutical | | |
| | Co. Ltd. | 369,000 | 7,770 |
| | Yakult Honsha Co. Ltd. | 265,500 | 7,769 |
| | Trend Micro Inc. | 266,200 | 7,532 |
| | Hisamitsu Pharmaceutical | | |
| | Co. Inc. | 182,000 | 7,453 |
| | Sekisui Chemical Co. Ltd. | 1,166,000 | 7,408 |
| | Lawson Inc. | 161,600 | 7,341 |
| | Kawasaki Kisen Kaisha Ltd. | 1,871,000 | 7,265 |
| | Obayashi Corp. | 1,769,000 | 7,207 |
| | Jupiter Telecommunications | | |
| | Co. Ltd. | 6,655 | 7,184 |
| | Showa Denko KK | 3,920,000 | 7,168 |
| | Toyo Seikan Kaisha Ltd. | 417,300 | 7,121 |
| | Daihatsu Motor Co. Ltd. | 527,000 | 7,119 |
| | | |
| | | | Market |
| | | | Value |
| | | Shares | ($000) |
| | Santen Pharmaceutical | | |
| | Co. Ltd. | 202,800 | 6,988 |
| | Mitsui Chemicals Inc. | 2,375,000 | 6,957 |
| | Kyowa Hakko Kirin Co. Ltd. | 705,000 | 6,913 |
| | TonenGeneral Sekiyu KK | 774,000 | 6,900 |
| | IHI Corp. | 3,632,000 | 6,898 |
| | Nippon Paper Group Inc. | 270,100 | 6,858 |
| ^ | GS Yuasa Corp. | 1,022,000 | 6,816 |
| | Japan Retail Fund | | |
| | Investment Corp. Class A | 4,357 | 6,786 |
| | J Front Retailing Co. Ltd. | 1,324,000 | 6,786 |
| | Stanley Electric Co. Ltd. | 400,500 | 6,713 |
| | SBI Holdings Inc. | 54,878 | 6,684 |
| | Furukawa Electric Co. Ltd. | 1,747,000 | 6,510 |
| | Ube Industries Ltd. | 2,644,000 | 6,487 |
| | Nissin Foods | | |
| | Holdings Co. Ltd. | 178,500 | 6,465 |
| | Mitsubishi Gas | | |
| | Chemical Co. Inc. | 1,045,000 | 6,460 |
| | Amada Co. Ltd. | 975,000 | 6,416 |
| | Nisshin Seifun Group Inc. | 515,000 | 6,376 |
| | Hokuhoku Financial | | |
| | Group Inc. | 3,392,000 | 6,273 |
| | Sojitz Corp. | 3,404,700 | 6,258 |
| | Sysmex Corp. | 91,200 | 6,253 |
| | Shimizu Corp. | 1,619,000 | 6,250 |
| | THK Co. Ltd. | 325,400 | 6,247 |
| | FamilyMart Co. Ltd. | 173,500 | 6,152 |
| | NGK Spark Plug Co. Ltd. | 440,000 | 6,121 |
| | Toho Gas Co. Ltd. | 1,160,000 | 6,111 |
| | Hachijuni Bank Ltd. | 1,174,000 | 6,025 |
| | Taisei Corp. | 2,788,000 | 5,952 |
| | NTN Corp. | 1,315,000 | 5,948 |
| | Hamamatsu Photonics KK | 182,800 | 5,913 |
| | Rinnai Corp. | 96,800 | 5,889 |
| | Shimamura Co. Ltd. | 61,000 | 5,847 |
| | Credit Saison Co. Ltd. | 409,500 | 5,808 |
| | Nippon Meat Packers Inc. | 499,000 | 5,802 |
| | Taiyo Nippon Sanso Corp. | 722,000 | 5,791 |
| | Denki Kagaku Kogyo KK | 1,310,000 | 5,765 |
| | Dena Co. Ltd. | 220,300 | 5,719 |
| | Seiko Epson Corp. | 358,200 | 5,711 |
| | Suzuken Co. Ltd. | 181,200 | 5,697 |
| | Hitachi Construction | | |
| | Machinery Co. Ltd. | 267,100 | 5,679 |
| | Tokyu Land Corp. | 1,231,000 | 5,610 |
| | Chugoku Bank Ltd. | 479,000 | 5,556 |
| | Hiroshima Bank Ltd. | 1,357,000 | 5,543 |
| | Kansai Paint Co. Ltd. | 594,000 | 5,541 |
| | Toyo Suisan Kaisha Ltd. | 257,000 | 5,507 |
| | Takashimaya Co. Ltd. | 731,000 | 5,503 |
| | Gunma Bank Ltd. | 1,086,000 | 5,447 |
| | Kajima Corp. | 2,322,000 | 5,445 |
25
Total International Stock Index Fund
| | | |
| | | | Market |
| | | | Value |
| | | Shares | ($000) |
| | Nippon Sheet | | |
| | Glass Co. Ltd. | 2,436,272 | 5,346 |
| | JTEKT Corp. | 531,900 | 5,329 |
| | Kamigumi Co. Ltd. | 679,000 | 5,304 |
| | Nomura Research | | |
| | Institute Ltd. | 280,400 | 5,290 |
| | Mitsubishi UFJ Lease & | | |
| | Finance Co. Ltd. | 157,270 | 5,244 |
| | Yamaguchi Financial | | |
| | Group Inc. | 579,000 | 5,242 |
| | Yamaha Corp. | 428,400 | 5,241 |
| | Hitachi Chemical Co. Ltd. | 281,400 | 5,220 |
| | Daicel Chemical | | |
| | Industries Ltd. | 748,000 | 5,196 |
| | Shimadzu Corp. | 692,000 | 5,195 |
| | Hitachi Metals Ltd. | 454,000 | 5,168 |
| | Aeon Mall Co. Ltd. | 219,600 | 5,148 |
| | Minebea Co. Ltd. | 934,000 | 5,129 |
| *,^ | Elpida Memory Inc. | 499,704 | 5,115 |
| | NOK Corp. | 286,500 | 5,102 |
| | Suruga Bank Ltd. | 566,000 | 5,096 |
| | TOTO Ltd. | 763,000 | 5,069 |
| | Sumitomo Rubber | | |
| | Industries Ltd. | 470,200 | 5,054 |
| | Idemitsu Kosan Co. Ltd. | 59,900 | 5,046 |
| | Nishi-Nippon | | |
| | City Bank Ltd. | 1,851,000 | 5,044 |
| | Tsumura & Co. | 163,800 | 5,035 |
| | Keisei Electric | | |
| | Railway Co. Ltd. | 753,000 | 5,028 |
| | Iyo Bank Ltd. | 672,000 | 5,003 |
| | Kaneka Corp. | 803,000 | 4,967 |
| * | Sumco Corp. | 320,500 | 4,956 |
| | Yaskawa Electric Corp. | 623,000 | 4,863 |
| | Marui Group Co. Ltd. | 611,100 | 4,802 |
| | Ushio Inc. | 288,200 | 4,790 |
| | Mitsui Mining & | | |
| | Smelting Co. Ltd. | 1,565,000 | 4,773 |
| | Namco Bandai Holdings Inc. | 517,700 | 4,770 |
| | Oracle Corp. Japan | 104,200 | 4,727 |
| | MediPal Holdings Corp. | 403,700 | 4,709 |
| | Tokuyama Corp. | 859,000 | 4,702 |
| | Kikkoman Corp. | 436,000 | 4,699 |
| | Nomura Real Estate | | |
| | Office Fund Inc. Class A | 757 | 4,656 |
| | USS Co. Ltd. | 59,900 | 4,653 |
| | Air Water Inc. | 398,124 | 4,639 |
| | Japan Prime Realty | | |
| | Investment Corp. | 1,865 | 4,636 |
| | McDonald’s Holdings Co. | | |
| | Japan Ltd. | 180,800 | 4,590 |
| | Casio Computer Co. Ltd. | 653,700 | 4,585 |
| | Alfresa Holdings Corp. | 105,800 | 4,448 |
| | | |
| | | | Market |
| | | | Value |
| | | Shares | ($000) |
| | Konami Corp. | 252,500 | 4,443 |
| | Toho Co. Ltd. | 287,000 | 4,436 |
| | Asics Corp. | 411,000 | 4,425 |
| | Showa Shell Sekiyu KK | 523,700 | 4,409 |
| | Mitsui Engineering & | | |
| | Shipbuilding Co. Ltd. | 1,951,000 | 4,406 |
| | 77 Bank Ltd. | 926,000 | 4,361 |
| | UNY Co. Ltd. | 519,800 | 4,332 |
| | Nissan Chemical | | |
| | Industries Ltd. | 375,800 | 4,315 |
| | Cosmo Oil Co. Ltd. | 1,594,000 | 4,292 |
| | Tokyo Tatemono Co. Ltd. | 1,054,000 | 4,247 |
| | Dowa Holdings Co. Ltd. | 672,000 | 4,080 |
| | Yamazaki Baking Co. Ltd. | 329,000 | 4,013 |
| | Nomura Real Estate | | |
| | Holdings Inc. | 261,297 | 4,008 |
| | Dainippon Sumitomo | | |
| | Pharma Co. Ltd. | 435,900 | 3,937 |
| | Daido Steel Co. Ltd. | 766,000 | 3,903 |
| | Yokogawa Electric Corp. | 594,200 | 3,898 |
| | Citizen Holdings Co. Ltd. | 677,000 | 3,891 |
| | Toyoda Gosei Co. Ltd. | 179,400 | 3,866 |
| | Mitsubishi Logistics Corp. | 315,000 | 3,810 |
| | Tosoh Corp. | 1,410,000 | 3,771 |
| | Hitachi High-Technologies | | |
| | Corp. | 191,500 | 3,722 |
| * | Mizuho Trust & | | |
| | Banking Co. Ltd. | 4,140,000 | 3,697 |
| | Fuji Electric | | |
| | Holdings Co. Ltd. | 1,545,000 | 3,685 |
| | Mitsumi Electric Co. Ltd. | 216,600 | 3,683 |
| | Square Enix Holdings | | |
| | Co. Ltd. | 175,000 | 3,655 |
| | Sapporo Hokuyo | | |
| | Holdings Inc. | 883,600 | 3,643 |
| | Mabuchi Motor Co. Ltd. | 68,500 | 3,626 |
| | Chiyoda Corp. | 426,191 | 3,530 |
| | Nisshinbo Holdings Inc. | 348,000 | 3,523 |
| | Nisshin Steel Co. Ltd. | 1,928,000 | 3,473 |
| | Obic Co. Ltd. | 18,740 | 3,459 |
| | NHK Spring Co. Ltd. | 401,000 | 3,400 |
| | Koito Manufacturing | | |
| | Co. Ltd. | 260,888 | 3,396 |
| | Mizuho Securities | | |
| | Co. Ltd. | 1,544,000 | 3,281 |
| | Hakuhodo DY Holdings Inc. | 64,960 | 3,244 |
| | Kinden Corp. | 370,000 | 3,181 |
| | Hino Motors Ltd. | 723,000 | 3,123 |
| | Seven Bank Ltd. | 1,667 | 3,001 |
| | Yamato Kogyo Co. Ltd. | 117,100 | 2,995 |
| | Japan Petroleum | | |
| | Exploration Co. | 78,300 | 2,988 |
| | Toyota Boshoku Corp. | 175,600 | 2,974 |
26
Total International Stock Index Fund
| | | |
| | | | Market |
| | | | Value |
| | | Shares | ($000) |
| | NTT Urban | | |
| | Development Corp. | 3,072 | 2,814 |
| | Otsuka Corp. | 44,100 | 2,800 |
| | Itochu Techno-Solutions | | |
| | Corp. | 81,400 | 2,780 |
| ^ | Sapporo Holdings Ltd. | 702,000 | 2,762 |
| | Tokyo Steel | | |
| | Manufacturing Co. Ltd. | 272,000 | 2,692 |
| | Maruichi Steel Tube Ltd. | 127,900 | 2,533 |
| | Aeon Credit | | |
| | Service Co. Ltd. | 220,300 | 2,530 |
| * | Taiheiyo Cement Corp. | 2,341,000 | 2,527 |
| | Ito En Ltd. | 150,500 | 2,416 |
| | ABC-Mart Inc. | 69,800 | 2,370 |
| ^ | Senshu Ikeda Holdings Inc. | 1,743,300 | 2,315 |
| | Coca-Cola West Co. Ltd. | 150,900 | 2,309 |
| | Aozora Bank Ltd. | 1,364,000 | 2,280 |
| | Canon Marketing Japan Inc. | 167,100 | 2,081 |
| *,^ | Shinsei Bank Ltd. | 2,536,000 | 2,010 |
| | Matsui Securities Co. Ltd. | 333,100 | 1,884 |
| | Jafco Co. Ltd. | 88,700 | 1,854 |
| | Shinko Electric | | |
| | Industries Co. Ltd. | 187,400 | 1,824 |
| | Fuji Media Holdings Inc. | 1,313 | 1,738 |
| ^ | Nissha Printing Co. Ltd. | 75,066 | 1,655 |
| ^ | Acom Co. Ltd. | 105,690 | 1,202 |
| | | | 6,074,066 |
| Malaysia (0.7%) | | |
| | CIMB Group | | |
| | Holdings Bhd. | 10,601,300 | 28,311 |
| | Malayan Banking Bhd. | 8,691,490 | 25,186 |
| | Sime Darby Bhd. | 7,379,400 | 20,978 |
| | Genting Bhd. | 6,066,600 | 20,395 |
| | IOI Corp. Bhd. | 9,124,686 | 17,091 |
| | Tenaga Nasional Bhd. | 5,352,000 | 15,163 |
| | Public Bank Bhd. (Foreign) | 2,891,394 | 11,866 |
| | Maxis Bhd. | 6,112,150 | 10,403 |
| | AMMB Holdings Bhd. | 4,968,400 | 10,102 |
| * | Axiata Group Bhd. | 6,899,400 | 9,978 |
| | Genting Malaysia Bhd. | 8,092,100 | 9,124 |
| | MISC Bhd. | 3,056,180 | 8,634 |
| | Kuala Lumpur Kepong Bhd. | 1,296,100 | 8,255 |
| | DiGi.Com Bhd. | 950,800 | 7,750 |
| | PPB Group Bhd. | 1,145,000 | 7,068 |
| | PLUS Expressways Bhd. | 4,353,200 | 6,163 |
| | IJM Corp. Bhd. | 2,915,760 | 5,282 |
| | Gamuda Bhd. | 4,315,800 | 5,280 |
| | British American Tobacco | | |
| | Malaysia Bhd. | 352,900 | 5,280 |
| | Petronas Gas Bhd. | 1,365,800 | 4,940 |
| | YTL Corp. Bhd. | 1,794,860 | 4,563 |
| | YTL Power | | |
| | International Bhd. | 5,929,758 | 4,463 |
| | Hong Leong Bank Bhd. | 1,264,200 | 3,717 |
| | | |
| | | | Market |
| | | | Value |
| | | Shares | ($000) |
| | UMW Holdings Bhd. | 1,529,800 | 3,333 |
| | Telekom Malaysia Bhd. | 2,903,400 | 3,179 |
| | RHB Capital Bhd. | 1,184,700 | 3,060 |
| * | AirAsia Bhd. | 3,493,200 | 2,780 |
| | SP Setia Bhd. | 1,663,200 | 2,774 |
| | Alliance Financial | | |
| | Group Bhd. | 2,507,500 | 2,647 |
| | Berjaya Sports Toto Bhd. | 1,873,728 | 2,515 |
| | Lafarge Malayan | | |
| | Cement Bhd. | 956,200 | 2,462 |
| | Bursa Malaysia Bhd. | 881,500 | 2,437 |
| | Parkson Holdings Bhd. | 1,257,171 | 2,401 |
| | Petronas Dagangan Bhd. | 669,100 | 2,350 |
| | MMC Corp. Bhd. | 1,965,200 | 1,948 |
| | Genting Plantations Bhd. | 648,100 | 1,790 |
| | Hong Leong Financial | | |
| | Group Bhd. | 568,100 | 1,667 |
| * | Malaysian Airline | | |
| | System Bhd. | 2,324,100 | 1,646 |
| | Berjaya Corp. Bhd. | 4,255,100 | 1,481 |
| | Public Bank Bhd. (Local) | 7,700 | 31 |
| | | | 288,493 |
| Mexico (1.1%) | | |
| | America Movil | | |
| | SAB de CV | 54,297,770 | 155,664 |
| | Wal-Mart de Mexico | | |
| | SAB de CV | 17,140,100 | 46,890 |
| | Grupo Mexico SAB de | | |
| | CV Class B | 10,370,717 | 34,107 |
| | Fomento Economico | | |
| | Mexicano SAB de CV | 5,882,900 | 32,387 |
| | Grupo Televisa SA | 6,385,400 | 28,685 |
| * | Cemex SAB de CV | 25,565,453 | 22,402 |
| | Grupo Financiero | | |
| | Banorte SAB de CV | 3,825,200 | 16,316 |
| | Telefonos de Mexico | | |
| | SAB de CV | 14,451,600 | 11,177 |
| | Grupo Financiero | | |
| | Inbursa SA | 2,279,414 | 9,863 |
| | Grupo Modelo SAB de CV | 1,734,000 | 9,712 |
| | Grupo Carso SAB de CV | 1,600,200 | 9,215 |
| | Kimberly-Clark de Mexico | | |
| | SAB de CV Class A | 1,460,300 | 9,165 |
| | Industrias Penoles | | |
| | SAB de CV | 271,595 | 7,696 |
| | Grupo Elektra SA de CV | 202,110 | 7,583 |
| | Grupo Bimbo SAB de CV | | |
| | Class A | 963,400 | 7,428 |
| | Mexichem SAB de CV | 2,222,064 | 7,029 |
| | Alfa SAB de CV Class A | 841,000 | 6,975 |
| | Coca-Cola Femsa | | |
| | SAB de CV | 729,500 | 5,833 |
| * | Desarrolladora Homex | | |
| | SAB de CV | 607,300 | 3,408 |
27
Total International Stock Index Fund
| | | |
| | | | Market |
| | | | Value |
| | | Shares | ($000) |
| | Grupo Aeroportuario del | | |
| | Pacifico SAB de CV | | |
| | Class B | 837,300 | 3,116 |
| * | Urbi Desarrollos Urbanos | | |
| | SAB de CV | 1,319,300 | 2,811 |
| | Grupo Aeroportuario del | | |
| | Pacifico SAB de CV ADR | 47,526 | 1,762 |
| | | | 439,224 |
| Morocco (0.0%) | | |
| | Douja Promotion Groupe | | |
| | Addoha SA | 81,752 | 1,091 |
| | Maroc Telecom | 46,782 | 867 |
| | Attijariwafa Bank | 14,402 | 600 |
| | | | 2,558 |
| Netherlands (1.9%) | | |
| | Unilever NV | 4,453,280 | 132,250 |
| * | ING Groep NV | 10,471,998 | 112,037 |
| | Koninklijke Philips | | |
| | Electronics NV | 2,690,823 | 82,077 |
| | Koninklijke KPN NV | 4,437,981 | 74,120 |
| | Koninklijke Ahold NV | 3,258,341 | 45,037 |
| | ASML Holding NV | 1,169,664 | 38,774 |
| | Akzo Nobel NV | 633,315 | 37,620 |
| | Heineken NV | 708,595 | 35,972 |
| * | Aegon NV | 4,303,546 | 27,275 |
| | TNT NV | 1,021,496 | 27,166 |
| | Reed Elsevier NV | 1,876,706 | 24,517 |
| | Koninklijke DSM NV | 425,794 | 22,788 |
| | Wolters Kluwer NV | 814,985 | 18,577 |
| * | Randstad Holding NV | 300,753 | 14,328 |
| | Heineken Holding NV | 314,130 | 13,549 |
| | Fugro NV | 183,236 | 12,972 |
| | Corio NV | 160,449 | 11,794 |
| | Koninklijke Vopak NV | 191,861 | 9,599 |
| | SBM Offshore NV | 450,659 | 9,198 |
| | Koninklijke Boskalis | | |
| | Westminster NV | 188,441 | 7,656 |
| | Delta Lloyd NV | 203,495 | 4,207 |
| | ASML Holding NV ADR | 6,387 | 212 |
| * | Aegon NV | 793 | 5 |
| | | | 761,730 |
| New Zealand (0.1%) | | |
| | Fletcher Building Ltd. | 1,691,004 | 10,595 |
| | Telecom Corp. of | | |
| | New Zealand Ltd. | 5,245,625 | 8,187 |
| | Auckland International | | |
| | Airport Ltd. | 2,605,949 | 4,176 |
| | Contact Energy Ltd. | 833,572 | 3,723 |
| | Sky City Entertainment | | |
| | Group Ltd. | 1,587,907 | 3,662 |
| | | | 30,343 |
| | | |
| | | | Market |
| | | | Value |
| | | Shares | ($000) |
| Norway (0.6%) | | |
| | Statoil ASA | 3,023,119 | 66,030 |
| | Telenor ASA | 2,284,642 | 36,877 |
| | DnB NOR ASA | 2,669,260 | 36,666 |
| | Yara International ASA | 522,674 | 27,559 |
| | Seadrill Ltd. | 768,425 | 23,326 |
| | Orkla ASA | 2,110,008 | 20,449 |
| | Norsk Hydro ASA | 2,453,953 | 15,063 |
| | Aker Solutions ASA | 448,955 | 6,847 |
| *,^ | Renewable Energy | | |
| | Corp. ASA | 1,347,415 | 4,693 |
| | | | 237,510 |
| Peru (0.2%) | | |
| | Credicorp Ltd. | 138,216 | 17,277 |
| | Southern Copper Corp. | | |
| | (New York Shares) | 378,285 | 16,191 |
| | Cia de Minas | | |
| | Buenaventura SA | 284,649 | 15,105 |
| | Cia de Minas | | |
| | Buenaventura SA ADR | 241,596 | 12,814 |
| | Southern Copper Corp. | 209,288 | 8,999 |
| | Credicorp Ltd. | | |
| | (New York Shares) | 47,582 | 5,990 |
| | | | 76,376 |
| Philippines (0.1%) | | |
| | Philippine Long Distance | | |
| | Telephone Co. | 131,605 | 8,182 |
| | SM Investments Corp. | 524,450 | 6,650 |
| | Manila Electric Co. | 1,232,930 | 6,342 |
| | Ayala Land Inc. | 14,435,500 | 5,628 |
| | Bank of the | | |
| | Philippine Islands | 3,985,331 | 5,437 |
| | Ayala Corp. | 500,990 | 4,684 |
| | SM Prime Holdings Inc. | 11,350,300 | 3,159 |
| | Energy | | |
| | Development Corp. | 21,579,300 | 3,012 |
| | Banco de | | |
| | Oro Unibank Inc. | 1,820,400 | 2,581 |
| | Metropolitan Bank & Trust | 1,391,600 | 2,531 |
| | Jollibee Foods Corp. | 1,213,610 | 2,500 |
| | Globe Telecom Inc. | 92,180 | 1,929 |
| | | | 52,635 |
| Poland (0.4%) | | |
| | Powszechna Kasa | | |
| | Oszczednosci Bank | | |
| | Polski SA | 1,723,033 | 27,184 |
| ^ | Bank Pekao SA | 324,666 | 21,192 |
| | KGHM Polska Miedz SA | 385,901 | 17,331 |
| | Powszechny Zaklad | | |
| | Ubezpieczen SA | 106,651 | 14,143 |
| * | Polski Koncern | | |
| | Naftowy Orlen | 884,608 | 12,473 |
28
Total International Stock Index Fund
| | | | |
| | | | | Market |
| | | | | Value |
| | | | Shares | ($000) |
| ^ | Telekomunikacja | | | |
| | Polska SA | | 1,904,026 | 12,124 |
| * | Tauron Polska Energia SA | 2,834,159 | 6,473 |
| | Polskie Gornictwo Naftowe | | |
| | i Gazownictwo SA | | 4,898,230 | 6,359 |
| | Polska Grupa | | | |
| | Energetyczna SA | | 762,449 | 5,849 |
| | Bank Zachodni WBK SA | | 60,796 | 4,494 |
| * | BRE Bank SA | | 39,729 | 4,010 |
| * | Getin Holding SA | | 939,337 | 3,522 |
| | Asseco Poland SA | | 182,054 | 3,365 |
| * | Globe Trade Centre SA | | 353,639 | 2,877 |
| | Bank Handlowy w | | | |
| | Warszawie SA | | 83,810 | 2,646 |
| * | ING Bank Slaski SA | | 8,472 | 2,580 |
| | TVN SA | | 399,309 | 2,512 |
| * | Bank Millennium SA | | 1,268,130 | 2,249 |
| * | Kernel Holding SA | | 97,981 | 2,145 |
| | PBG SA | | 25,401 | 1,933 |
| * | Grupa Lotos SA | | 178,464 | 1,895 |
| | Cyfrowy Polsat SA | | 221,458 | 1,088 |
| | | | | 158,444 |
| Portugal (0.2%) | | | |
| | Portugal Telecom | | | |
| | SGPS SA | | 1,607,415 | 23,231 |
| | EDP - Energias de | | | |
| | Portugal SA | | 4,781,761 | 18,293 |
| | Galp Energia SGPS | | | |
| | SA Class B | | 631,386 | 12,183 |
| | Jeronimo Martins SGPS SA | 604,531 | 9,079 |
| | Banco Espirito Santo SA | | 1,457,483 | 7,238 |
| ^ | Banco Comercial | | | |
| | Portugues SA | | 6,692,460 | 6,088 |
| | Cimpor Cimentos de | | | |
| | Portugal SGPS SA | | 656,197 | 4,562 |
| | Brisa Auto-Estradas de | | | |
| | Portugal SA | | 496,939 | 3,765 |
| * | EDP Renovaveis SA | | 587,058 | 3,405 |
| | | | | 87,844 |
| Russia (1.6%) | | | |
| | Gazprom OAO ADR | | 6,408,095 | 140,305 |
| | Sberbank of Russia | 23,562,686 | 77,357 |
| | Lukoil OAO ADR | | 1,276,565 | 71,187 |
| | MMC Norilsk Nickel ADR | | 2,084,523 | 38,794 |
| | Mobile Telesystems | | | |
| | OJSC ADR | | 1,351,992 | 29,271 |
| | Rosneft Oil Co. GDR | | 3,522,482 | 24,510 |
| | NovaTek OAO GDR | | 249,385 | 23,839 |
| | Tatneft ADR | | 633,327 | 19,942 |
| | Surgutneftegas | | | |
| | OJSC ADR | | 1,946,213 | 19,058 |
| | Gazprom OAO | | 3,437,871 | 18,384 |
| * | Magnit OJSC GDR | | 600,424 | 16,037 |
| * | Federal | | | |
| | Hydrogenerating Co. | 308,512,122 | 15,793 |
| | | |
| | | | Market |
| | | | Value |
| | | Shares | ($000) |
| | VTB Bank OJSC GDR | 2,096,371 | 13,858 |
| | Uralkali | 2,021,860 | 10,028 |
| * | Federal Grid Co. Unified | | |
| | Energy System JSC | 789,655,531 | 9,500 |
| | Surgutneftegas OJSC | | |
| | Prior Pfd. | 18,477,427 | 9,273 |
| | Mechel ADR | 390,475 | 9,196 |
| | Novolipetsk Steel | | |
| | OJSC GDR | 229,081 | 7,820 |
| | Polyus Gold OJSC ADR | 249,763 | 7,393 |
| | Severstal OAO GDR | 532,558 | 7,170 |
| | Sistema JSFC GDR | 261,852 | 6,743 |
| | Sberbank of Russia | | |
| | Prior Pfd. | 2,753,239 | 6,240 |
| | Rosneft Oil Co. | 788,986 | 5,525 |
| | Wimm-Bill-Dann Foods | | |
| | OJSC ADR | 177,020 | 4,489 |
| * | Polymetal JSC | 275,811 | 4,421 |
| * | OGK-4 OJSC | 42,192,657 | 3,508 |
| * | Inter Rao Ues OAO | 2,148,936,552 | 3,223 |
| * | TMK OAO GDR | 149,651 | 2,940 |
| * | Raspadskaya | 427,805 | 2,478 |
| * | Comstar United | | |
| | Telesystems OJSC GDR | 349,155 | 2,261 |
| * | Severstal OAO | 71,397 | 942 |
| | Tatneft | 184,712 | 887 |
| * | RusHydro | | |
| | Assimilation Line | 13,037,843 | 670 |
| | VTB Bank OJSC | 144,118,306 | 473 |
| | Lukoil OAO | 7,741 | 435 |
| | Polyus Gold OJSC | 7,215 | 360 |
| | MMC Norilsk Nickel | 1,252 | 224 |
| * | Surgutneftegas OJSC | 204,077 | 200 |
| | | | 614,734 |
| Singapore (1.3%) | | |
| | Singapore | | |
| | Telecommunications | | |
| | Ltd. | 21,780,000 | 52,185 |
| | DBS Group Holdings Ltd. | 4,680,999 | 50,417 |
| | United Overseas | | |
| | Bank Ltd. | 3,334,000 | 48,123 |
| | Oversea-Chinese | | |
| | Banking Corp. Ltd. | 6,653,000 | 46,474 |
| * | Genting Singapore plc | 16,682,720 | 28,068 |
| | Keppel Corp. Ltd. | 3,506,000 | 27,117 |
| | Wilmar International Ltd. | 5,244,000 | 26,057 |
| | CapitaLand Ltd. | 7,004,500 | 21,129 |
| | Singapore Airlines Ltd. | 1,461,000 | 17,918 |
| ^ | Singapore Exchange Ltd. | 2,333,000 | 15,897 |
| | City Developments Ltd. | 1,492,000 | 14,722 |
| | Singapore Press | | |
| | Holdings Ltd. | 4,158,000 | 13,360 |
| | Fraser and Neave Ltd. | 2,668,000 | 12,893 |
| | Singapore Technologies | | |
| | Engineering Ltd. | 4,579,000 | 11,740 |
29
Total International Stock Index Fund
| | | |
| | | | Market |
| | | | Value |
| | | Shares | ($000) |
| | Noble Group Ltd. | 8,100,590 | 11,697 |
| | SembCorp Industries Ltd. | 2,674,000 | 9,490 |
| | CapitaMall Trust | 6,106,300 | 9,380 |
| | Golden | | |
| | Agri-Resources Ltd. | 18,184,791 | 9,182 |
| | Jardine Cycle & | | |
| | Carriage Ltd. | 289,000 | 8,805 |
| | SembCorp Marine Ltd. | 2,266,000 | 8,080 |
| | Olam International Ltd. | 3,317,000 | 8,063 |
| * | Global Logistic | | |
| | Properties Ltd. | 4,278,000 | 7,668 |
| | Keppel Land Ltd. | 1,974,000 | 6,787 |
| | Ascendas Real Estate | | |
| | Investment Trust | 4,076,666 | 6,507 |
| | CapitaMalls Asia Ltd. | 3,740,000 | 6,205 |
| | ComfortDelGro Corp. Ltd. | 5,148,000 | 5,907 |
| ^ | Yangzijiang Shipbuilding | | |
| | Holdings Ltd. | 4,017,000 | 5,822 |
| | UOL Group Ltd. | 1,282,000 | 4,518 |
| *,^ | Neptune Orient Lines Ltd. | 2,472,750 | 4,110 |
| ^ | Cosco Corp. | | |
| | Singapore Ltd. | 2,759,000 | 3,991 |
| | StarHub Ltd. | 1,650,000 | 3,389 |
| * | Golden Agri-Resources | | |
| | Ltd. Warrants | | |
| | Exp. 07/23/2012 | 724,972 | 73 |
| | | | 505,774 |
| South Africa (1.9%) | | |
| | MTN Group Ltd. | 4,528,491 | 81,467 |
| | Sasol Ltd. | 1,571,701 | 70,777 |
| | Naspers Ltd. | 1,048,881 | 55,016 |
| | AngloGold Ashanti Ltd. | 1,036,181 | 48,597 |
| | Standard Bank Group Ltd. | 3,239,239 | 47,668 |
| | Impala Platinum | | |
| | Holdings Ltd. | 1,380,535 | 38,975 |
| | Gold Fields Ltd. | 1,925,816 | 30,236 |
| | FirstRand Ltd. | 7,682,095 | 22,522 |
| | Sanlam Ltd. | 5,259,191 | 19,691 |
| | Remgro Ltd. | 1,196,664 | 18,541 |
| * | Anglo Platinum Ltd. | 178,805 | 17,666 |
| | Bidvest Group Ltd. | 809,469 | 17,241 |
| | ABSA Group Ltd. | 881,894 | 17,085 |
| | Shoprite Holdings Ltd. | 1,130,012 | 15,979 |
| | Kumba Iron Ore Ltd. | 220,316 | 12,508 |
| | Harmony Gold Mining | | |
| | Co. Ltd. | 1,054,250 | 12,107 |
| | Tiger Brands Ltd. | 446,426 | 11,967 |
| | Truworths | | |
| | International Ltd. | 1,201,328 | 11,854 |
| | Massmart Holdings Ltd. | 522,841 | 10,647 |
| | RMB Holdings Ltd. | 2,008,536 | 10,337 |
| | African Bank | | |
| | Investments Ltd. | 1,976,939 | 10,133 |
| | Steinhoff International | | |
| | Holdings Ltd. | 3,222,279 | 10,111 |
| | | |
| | | | Market |
| | | | Value |
| | | Shares | ($000) |
| | Growthpoint | | |
| | Properties Ltd. | 4,097,522 | 10,102 |
| | Vodacom Group Ltd. | 1,030,719 | 9,901 |
| | Aspen Pharmacare | | |
| | Holdings Ltd. | 716,371 | 9,543 |
| | Nedbank Group Ltd. | 482,142 | 9,004 |
| | Woolworths Holdings Ltd. | 1,995,772 | 7,820 |
| | Redefine Properties Ltd. | 6,650,016 | 7,751 |
| | Imperial Holdings Ltd. | 467,706 | 7,645 |
| | African Rainbow | | |
| | Minerals Ltd. | 295,059 | 7,514 |
| * | Sappi Ltd. | 1,440,425 | 7,131 |
| | Foschini Group Ltd. | 561,745 | 6,814 |
| | Aveng Ltd. | 1,066,366 | 6,703 |
| | Pretoria Portland | | |
| | Cement Co. Ltd. | 1,390,569 | 6,622 |
| | Exxaro Resources Ltd. | 341,056 | 6,417 |
| | Netcare Ltd. | 2,929,387 | 6,094 |
| | ArcelorMittal South | | |
| | Africa Ltd. | 494,158 | 5,670 |
| | Murray & Roberts | | |
| | Holdings Ltd. | 872,179 | 5,405 |
| | Investec Ltd. | 607,651 | 4,997 |
| | Reunert Ltd. | 487,297 | 4,453 |
| | Discovery Holdings Ltd. | 729,241 | 4,108 |
| | Pick n Pay Stores Ltd. | 609,795 | 4,012 |
| | Telkom SA Ltd. | 730,929 | 3,776 |
| | Liberty Holdings Ltd. | 279,629 | 2,990 |
| | Northam Platinum Ltd. | 288,986 | 1,998 |
| | | | 737,595 |
| South Korea (3.4%) | | |
| | Samsung Electronics | | |
| | Co. Ltd. | 234,401 | 155,508 |
| | Hyundai Motor Co. | 421,742 | 63,845 |
| | Hyundai Mobis | 185,943 | 46,306 |
| 2 | Samsung Electronics Co. | | |
| | Ltd. GDR | 135,221 | 45,133 |
| | POSCO | 107,617 | 44,417 |
| | LG Chem Ltd. | 126,589 | 39,171 |
| | Hyundai Heavy | | |
| | Industries Co. Ltd. | 103,695 | 33,825 |
| | Shinhan Financial | | |
| | Group Co. Ltd. | 823,600 | 31,906 |
| | KB Financial Group Inc. | 679,443 | 30,252 |
| | POSCO ADR | 284,667 | 29,588 |
| * | Hynix Semiconductor Inc. | 1,373,690 | 28,291 |
| | Samsung Electronics | | |
| | Co. Ltd. Prior Pfd. | 56,077 | 27,555 |
| | Kia Motors Corp. | 642,180 | 25,695 |
| | LG Electronics Inc. | 256,566 | 22,592 |
| | SK Energy Co. Ltd. | 164,009 | 22,070 |
| | LG Display Co. Ltd. | 634,670 | 21,763 |
| | Samsung C&T Corp. | 341,710 | 20,068 |
| * | NHN Corp. | 111,632 | 19,751 |
| | Shinsegae Co. Ltd. | 38,600 | 19,568 |
30
Total International Stock Index Fund
| | | |
| | | | Market |
| | | | Value |
| | | Shares | ($000) |
| | LG Corp. | 258,982 | 18,528 |
| | KT&G Corp. | 300,260 | 18,459 |
| | Samsung Electro-Mechanics | | |
| | Co. Ltd. | 163,356 | 17,946 |
| | Samsung Fire & Marine | | |
| | Insurance Co. Ltd. | 96,808 | 16,602 |
| | Hana Financial Group Inc. | 523,420 | 14,873 |
| | Hyundai Steel Co. | 151,386 | 14,700 |
| | Samsung Engineering | | |
| | Co. Ltd. | 81,687 | 13,055 |
| | Samsung SDI Co. Ltd. | 94,252 | 12,946 |
| | Samsung Heavy | | |
| | Industries Co. Ltd. | 439,130 | 12,340 |
| | Hyundai Engineering & | | |
| | Construction Co. Ltd. | 182,813 | 12,283 |
| * | Samsung Life | | |
| | Insurance Co. Ltd. | 135,822 | 12,173 |
| | OCI Co. Ltd. | 40,850 | 12,031 |
| * | Korea Electric Power Corp. | 437,490 | 11,515 |
| | Lotte Shopping Co. Ltd. | 27,558 | 11,290 |
| | Shinhan Financial | | |
| | Group Co. Ltd. ADR | 138,153 | 10,744 |
| | Cheil Industries Inc. | 122,842 | 10,331 |
| | Woori Finance | | |
| | Holdings Co. Ltd. | 774,987 | 9,772 |
| | KB Financial | | |
| | Group Inc. ADR | 216,696 | 9,730 |
| | Samsung Techwin Co. Ltd. | 101,348 | 9,474 |
| | SK Telecom Co. Ltd. | 62,140 | 9,458 |
| | KT Corp. | 235,029 | 9,260 |
| | Doosan Heavy Industries | | |
| | and Construction Co. Ltd. | 116,245 | 9,162 |
| | Honam Petrochemical Corp. | 39,195 | 8,664 |
| | NCSoft Corp. | 38,893 | 8,567 |
| | Korea Exchange Bank | 703,730 | 8,389 |
| | GS Engineering & | | |
| | Construction Corp. | 98,056 | 8,333 |
| | Amorepacific Corp. | 8,798 | 8,140 |
| | Samsung Securities Co. Ltd. | 136,350 | 7,810 |
| | LG Household & | | |
| | Health Care Ltd. | 23,359 | 7,804 |
| | S-Oil Corp. | 124,901 | 7,712 |
| | SK Telecom Co. Ltd. ADR | 417,883 | 7,702 |
| | Daewoo Securities Co. Ltd. | 342,950 | 7,456 |
| | GS Holdings | 141,058 | 7,405 |
| | SK Holdings Co. Ltd. | 70,482 | 7,344 |
| * | Korea Electric | | |
| | Power Corp. ADR | 525,802 | 6,946 |
| | Daewoo Shipbuilding & | | |
| | Marine Engineering | | |
| | Co. Ltd. | 258,160 | 6,871 |
| | Hyosung Corp. | 61,757 | 6,864 |
| | Industrial Bank of Korea | 445,460 | 6,401 |
| | Hanwha Chem Corp. | 229,680 | 6,255 |
| * | Korean Air Lines Co. Ltd. | 98,150 | 6,252 |
| | Kangwon Land Inc. | 264,610 | 6,231 |
| | | |
| | | | Market |
| | | | Value |
| | | Shares | ($000) |
| | Daelim Industrial Co. Ltd. | 75,777 | 6,187 |
| | Korea Zinc Co. Ltd. | 23,201 | 5,872 |
| * | Doosan Infracore Co. Ltd. | 229,740 | 5,685 |
| | Hyundai Motor Co. 2nd Pfd. | 101,810 | 5,625 |
| | Samsung Card Co. | 116,819 | 5,590 |
| | Hankook Tire Co. Ltd. | 209,420 | 5,455 |
| | Busan Bank | 426,880 | 5,319 |
| | Hyundai Mipo Dockyard | 30,065 | 5,029 |
| | LS Corp. | 49,247 | 4,997 |
| | Woongjin Coway Co. Ltd. | 135,100 | 4,903 |
| | KT Corp. ADR | 231,452 | 4,789 |
| | Hanwha Corp. | 125,780 | 4,750 |
| | Daegu Bank Ltd. | 342,520 | 4,494 |
| | Hyundai Securities Co. | 339,680 | 4,452 |
| | Glovis Co. Ltd. | 31,353 | 4,446 |
| | Hyundai Department | | |
| | Store Co. Ltd. | 40,030 | 4,436 |
| | Hyundai Development Co. | 154,480 | 4,345 |
| | KCC Corp. | 13,067 | 4,333 |
| | Daewoo International Corp. | 136,467 | 4,255 |
| | CJ CheilJedang Corp. | 21,912 | 4,222 |
| | Woori Investment & | | |
| | Securities Co. Ltd. | 233,650 | 4,132 |
| | LG Uplus Corp. | 632,170 | 4,102 |
| | Dongbu Insurance Co. Ltd. | 115,920 | 4,097 |
| | Doosan Corp. | 26,604 | 3,590 |
| * | SK C&C Co. Ltd. | 41,407 | 3,554 |
| | Korea Investment | | |
| | Holdings Co. Ltd. | 108,140 | 3,416 |
| * | Celltrion Inc. | 150,376 | 3,332 |
| * | Korea Life | | |
| | Insurance Co. Ltd. | 474,250 | 3,291 |
| | Mirae Asset | | |
| | Securities Co. Ltd. | 62,192 | 3,260 |
| | LS Industrial | | |
| | Systems Co. Ltd. | 40,324 | 3,237 |
| | Hyundai Motor Co. Prior Pfd. | 61,837 | 3,201 |
| | Hanjin Heavy Industries & | | |
| | Construction Co. Ltd. | 83,579 | 3,186 |
| | LG Innotek Co. Ltd. | 26,666 | 3,091 |
| | Seoul Semiconductor Co. Ltd. | 88,442 | 3,077 |
| | Yuhan Corp. | 21,607 | 3,062 |
| | STX Pan Ocean Co. Ltd. | 279,000 | 2,971 |
| | Daewoo Engineering & | | |
| | Construction Co. Ltd. | 312,250 | 2,927 |
| | Korea Gas Corp. | 64,473 | 2,642 |
| | S1 Corp. | 46,667 | 2,573 |
| | Dongkuk Steel Mill Co. Ltd. | 105,120 | 2,422 |
| | SK Networks Co. Ltd. | 237,040 | 2,279 |
| * | SK Broadband Co. Ltd. | 414,027 | 2,076 |
| | Tong Yang Securities Inc. | 203,510 | 2,060 |
| | Lotte Confectionery Co. Ltd. | 1,875 | 2,047 |
| | LG Electronics Inc. Prior Pfd. | 48,910 | 1,696 |
| | Hite Brewery Co. Ltd. | 14,013 | 1,563 |
| | | | 1,321,190 |
31
Total International Stock Index Fund
| | | |
| | | | Market |
| | | | Value |
| | | Shares | ($000) |
| Spain (2.8%) | | |
| ^ | Telefonica SA | 11,180,038 | 302,114 |
| | Banco Santander SA | 22,501,418 | 288,819 |
| | Banco Bilbao Vizcaya | | |
| | Argentaria SA | 9,733,764 | 128,237 |
| | Iberdrola SA | 11,034,564 | 93,229 |
| | Repsol YPF SA | 1,998,904 | 55,431 |
| | Inditex SA | 595,333 | 49,723 |
| ^ | ACS Actividades de | | |
| | Construccion y | | |
| | Servicios SA | 386,397 | 20,285 |
| | Abertis | | |
| | Infraestructuras SA | 804,877 | 15,917 |
| | Banco Popular | | |
| | Espanol SA | 2,356,644 | 15,262 |
| | Red Electrica Corp. SA | 295,837 | 14,866 |
| | Ferrovial SA | 1,204,457 | 13,743 |
| | Criteria Caixacorp SA | 2,284,969 | 12,909 |
| ^ | Banco de Sabadell SA | 2,634,908 | 12,825 |
| | Enagas | 491,170 | 10,834 |
| | Gas Natural SDG SA | 635,506 | 9,309 |
| | Iberdrola Renovables SA | 2,344,232 | 7,920 |
| | Mapfre SA | 2,058,693 | 6,841 |
| | Zardoya Otis SA | 378,437 | 6,309 |
| | Acciona SA | 70,758 | 6,229 |
| ^ | Grifols SA | 374,340 | 6,068 |
| * | Iberia Lineas Aereas de | | |
| | Espana SA | 1,295,415 | 5,690 |
| ^ | Bankinter SA | 777,598 | 5,187 |
| | Indra Sistemas SA | 245,412 | 4,809 |
| | Acerinox SA | 272,028 | 4,462 |
| *,^ | Gamesa Corp. | | |
| | Tecnologica SA | 531,136 | 3,700 |
| ^ | Gestevision Telecinco SA | 272,692 | 3,480 |
| ^ | Banco de Valencia SA | 587,693 | 3,317 |
| ^ | Fomento de Construcciones | |
| | y Contratas SA | 109,507 | 2,957 |
| | Telefonica SA ADR | 16,389 | 1,330 |
| | | | 1,111,802 |
| Sweden (2.3%) | | |
| | Hennes & Mauritz | | |
| | AB Class B | 2,795,194 | 98,449 |
| | Nordea Bank AB | 8,841,090 | 97,346 |
| | Telefonaktiebolaget LM | | |
| | Ericsson Class B | 8,232,995 | 90,543 |
| | TeliaSonera AB | 6,144,893 | 51,328 |
| | Svenska Handelsbanken | | |
| | AB Class A | 1,339,988 | 43,836 |
| | Sandvik AB | 2,761,059 | 41,626 |
| * | Volvo AB Class B | 2,969,258 | 40,199 |
| | Atlas Copco AB Class A | 1,832,438 | 38,295 |
| | Skandinaviska Enskilda | | |
| | Banken AB Class A | 3,849,023 | 29,839 |
| | SKF AB | 1,066,950 | 27,580 |
| * | Swedbank AB Class A | 1,949,019 | 27,254 |
| | | |
| | | | Market |
| | | | Value |
| | | Shares | ($000) |
| | Investor AB Class B | 1,242,621 | 25,506 |
| | Svenska Cellulosa | | |
| | AB Class B | 1,563,610 | 24,241 |
| | Assa Abloy AB Class B | 851,576 | 21,836 |
| | Skanska AB Class B | 1,088,259 | 20,826 |
| | Atlas Copco AB Class B | 1,064,377 | 20,307 |
| | Millicom International | | |
| | Cellular SA | 207,575 | 19,592 |
| | Tele2 AB | 859,507 | 18,889 |
| | Scania AB Class B | 875,183 | 18,609 |
| | Swedish Match AB | 631,638 | 17,670 |
| | Alfa Laval AB | 923,670 | 16,030 |
| | Electrolux AB Class B | 657,903 | 15,936 |
| | Boliden AB | 746,634 | 12,677 |
| | Kinnevik Investment | | |
| | AB Class B | 595,571 | 12,295 |
| | Getinge AB | 545,826 | 11,557 |
| ^ | Hexagon AB Class B | 522,576 | 10,634 |
| | Modern Times Group | | |
| | AB Class B | 137,621 | 9,888 |
| | Ratos AB | 276,626 | 9,863 |
| | Securitas AB Class B | 860,791 | 9,417 |
| | Husqvarna AB | 1,121,117 | 7,889 |
| | SSAB AB Class A | 496,567 | 6,964 |
| | Holmen AB | 146,030 | 4,636 |
| | SSAB AB Class B | 227,965 | 2,820 |
| | | | 904,377 |
| Switzerland (5.7%) | | |
| | Nestle SA | 9,479,330 | 519,226 |
| | Novartis AG | 5,768,513 | 334,243 |
| | Roche Holding AG | 1,920,641 | 282,054 |
| * | UBS AG | 9,930,184 | 168,689 |
| | Credit Suisse Group AG | 3,079,434 | 127,484 |
| | ABB Ltd. | 6,049,435 | 125,306 |
| | Zurich Financial | | |
| | Services AG | 405,013 | 99,114 |
| | Syngenta AG | 258,671 | 71,623 |
| | Cie Financiere | | |
| | Richemont SA | 1,427,444 | 71,198 |
| | Swiss Reinsurance Co. Ltd. | 964,095 | 46,322 |
| | Holcim Ltd. | 669,418 | 41,702 |
| | Swatch Group AG (Bearer) | 84,157 | 32,168 |
| | Swisscom AG | 63,611 | 26,565 |
| | SGS SA | 14,946 | 23,906 |
| | Julius Baer Group Ltd. | 565,683 | 23,871 |
| | Givaudan SA | 22,677 | 23,366 |
| | Geberit AG | 106,414 | 20,396 |
| | Synthes Inc. | 161,979 | 19,320 |
| | Adecco SA | 337,190 | 18,866 |
| | Kuehne & Nagel | | |
| | International AG | 147,621 | 18,262 |
| | Sonova Holding AG | 125,538 | 14,540 |
| | Schindler Holding | | |
| | AG (Bearer) | 132,646 | 14,215 |
| * | Actelion Ltd. | 279,343 | 13,956 |
32
Total International Stock Index Fund
| | | |
| | | | Market |
| | | | Value |
| | | Shares | ($000) |
| | Baloise Holding AG | 137,469 | 12,702 |
| | Sika AG | 5,580 | 11,065 |
| | Lonza Group AG | 124,821 | 10,927 |
| | Swiss Life Holding AG | 83,527 | 10,222 |
| *,^ | Logitech International SA | 494,993 | 9,384 |
| * | GAM Holding AG | 561,239 | 8,867 |
| | Lindt & Spruengli AG | 306 | 8,772 |
| | Swatch Group | | |
| | AG (Registered) | 118,491 | 8,239 |
| | Aryzta AG | 158,849 | 7,039 |
| | Schindler Holding | | |
| | AG (Registered) | 59,467 | 6,466 |
| | Lindt & Spruengli AG | 2,354 | 6,401 |
| | Pargesa Holding SA | 73,438 | 5,822 |
| | Nobel Biocare Holding AG | 341,975 | 5,654 |
| | Straumann Holding AG | 21,039 | 4,405 |
| | Aryzta AG | 73,077 | 3,197 |
| * | UBS AG (New York Shares) | 18,676 | 318 |
| | | | 2,255,872 |
| Taiwan (2.7%) | | |
| | Taiwan Semiconductor | | |
| | Manufacturing Co. Ltd. | 49,080,063 | 100,973 |
| | Hon Hai Precision | | |
| | Industry Co. Ltd. | 23,640,191 | 89,408 |
| | HTC Corp. | 1,885,040 | 42,748 |
| | Taiwan Semiconductor | | |
| | Manufacturing | | |
| | Co. Ltd. ADR | 3,638,348 | 39,694 |
| | MediaTek Inc. | 2,533,174 | 31,868 |
| | Formosa Plastics Corp. | 10,856,780 | 31,107 |
| | Nan Ya Plastics Corp. | 12,856,780 | 28,561 |
| | China Steel Corp. | 27,684,080 | 28,040 |
| | Cathay Financial | | |
| | Holding Co. Ltd. | 18,011,100 | 27,531 |
| | Chunghwa | | |
| | Telecom Co. Ltd. | 9,517,321 | 22,262 |
| | Formosa Chemicals & | | |
| | Fibre Corp. | 7,764,500 | 22,204 |
| | Acer Inc. | 6,981,297 | 20,330 |
| | Delta Electronics Inc. | 4,879,240 | 20,157 |
| * | Chimei Innolux Corp. | 12,969,101 | 17,403 |
| | Fubon Financial | | |
| | Holding Co. Ltd. | 13,981,610 | 17,105 |
| | Chinatrust Financial | | |
| | Holding Co. Ltd. | 24,540,159 | 15,320 |
| * | AU Optronics Corp. | 15,035,640 | 15,001 |
| | Mega Financial | | |
| | Holding Co. Ltd. | 21,125,000 | 14,646 |
| | Compal Electronics Inc. | 11,332,689 | 14,459 |
| | Uni-President | | |
| | Enterprises Corp. | 9,943,892 | 12,923 |
| | Asustek Computer Inc. | 1,568,040 | 12,725 |
| | Quanta Computer Inc. | 6,781,950 | 12,455 |
| | Taiwan Mobile Co. Ltd. | 5,093,000 | 11,354 |
| | | |
| | | | Market |
| | | | Value |
| | | Shares | ($000) |
| | United | | |
| | Microelectronics Corp. | 23,591,175 | 11,316 |
| | Far Eastern New | | |
| | Century Corp. | 7,751,627 | 11,149 |
| | Wistron Corp. | 5,094,293 | 10,481 |
| | Yuanta Financial | | |
| | Holding Co. Ltd. | 16,580,000 | 10,412 |
| | First Financial | | |
| | Holding Co. Ltd. | 13,170,630 | 8,687 |
| | Taiwan Cement Corp. | 8,062,000 | 8,572 |
| | Formosa | | |
| | Petrochemical Corp. | 3,119,950 | 8,480 |
| | Advanced Semiconductor | | |
| | Engineering Inc. | 9,479,556 | 8,249 |
| | Chunghwa Telecom | | |
| | Co. Ltd. ADR | 344,864 | 8,070 |
| | Synnex Technology | | |
| | International Corp. | 3,212,463 | 7,868 |
| | Lite-On Technology Corp. | 5,559,442 | 7,343 |
| | China Development | | |
| | Financial Holding Corp. | 24,437,901 | 7,263 |
| | Hua Nan Financial | | |
| | Holdings Co. Ltd. | 10,730,997 | 7,074 |
| | Taiwan Cooperative Bank | 9,844,900 | 7,032 |
| | Taiwan Fertilizer Co. Ltd. | 2,023,000 | 6,898 |
| | Cheng Shin Rubber | | |
| | Industry Co. Ltd. | 3,071,362 | 6,846 |
| | Chang Hwa | | |
| | Commercial Bank | 10,105,000 | 6,677 |
| | Siliconware Precision | | |
| | Industries Co. | 5,838,000 | 6,421 |
| | Far EasTone | | |
| | Telecommunications | | |
| | Co. Ltd. | 4,445,000 | 6,401 |
| | United Microelectronics | | |
| | Corp. ADR | 2,047,648 | 6,327 |
| | Unimicron | | |
| | Technology Corp. | 3,402,750 | 5,778 |
| | SinoPac Financial | | |
| | Holdings Co. Ltd. | 15,280,000 | 5,757 |
| | President Chain | | |
| | Store Corp. | 1,448,536 | 5,745 |
| | Pou Chen Corp. | 5,957,517 | 5,645 |
| | Foxconn | | |
| | Technology Co. Ltd. | 1,804,913 | 5,629 |
| | Epistar Corp. | 1,748,408 | 5,596 |
| | Macronix International | 8,993,927 | 5,531 |
| * | Pegatron Corp. | 4,070,639 | 5,510 |
| * | AU Optronics Corp. ADR | 545,666 | 5,473 |
| | Powertech Technology Inc. | 1,633,050 | 5,397 |
| * | Shin Kong Financial | | |
| | Holding Co. Ltd. | 14,579,096 | 5,361 |
| | Asia Cement Corp. | 4,998,915 | 5,150 |
| | Largan Precision Co. Ltd. | 256,376 | 5,088 |
| * | Wintek Corp. | 2,998,000 | 5,054 |
33
Total International Stock Index Fund
| | | |
| | | | Market |
| | | | Value |
| | | Shares | ($000) |
| * | Taishin Financial | | |
| | Holding Co. Ltd. | 11,405,364 | 4,988 |
| | E.Sun Financial | | |
| | Holding Co. Ltd. | 8,760,432 | 4,500 |
| * | China Airlines Ltd. | 5,545,491 | 4,325 |
| * | Walsin Lihwa Corp. | 7,179,000 | 4,300 |
| | Yulon Motor Co. Ltd. | 2,151,015 | 4,213 |
| * | Eva Airways Corp. | 4,069,900 | 4,113 |
| | WPG Holdings Co. Ltd. | 2,133,801 | 3,967 |
| | Tripod Technology Corp. | 1,021,759 | 3,921 |
| | Novatek Microelectronics | | |
| | Corp. Ltd. | 1,310,275 | 3,820 |
| | Simplo | | |
| | Technology Co. Ltd. | 575,110 | 3,685 |
| | KGI Securities Co. Ltd. | 7,793,000 | 3,674 |
| | Catcher | | |
| | Technology Co. Ltd. | 1,377,800 | 3,669 |
| * | Powerchip | | |
| | Technology Corp. | 14,540,460 | 3,608 |
| * | E Ink Holdings Inc. | 2,036,000 | 3,563 |
| | Ruentex Industries Ltd. | 1,159,000 | 3,313 |
| | Advanced Semiconductor | | |
| | Engineering Inc. ADR | 743,685 | 3,295 |
| | Giant | | |
| | Manufacturing Co. Ltd. | 810,319 | 3,183 |
| | Polaris Securities Co. Ltd. | 5,617,040 | 3,120 |
| | Clevo Co. | 1,346,176 | 2,965 |
| * | Qisda Corp. | 4,244,000 | 2,962 |
| | Far Eastern Department | | |
| | Stores Co. Ltd. | 2,373,590 | 2,946 |
| | Young Fast | | |
| | Optoelectronics Co. Ltd. | 248,747 | 2,929 |
| | Inventec Co. Ltd. | 5,474,305 | 2,879 |
| | Richtek Technology Corp. | 359,105 | 2,823 |
| | Teco Electric and | | |
| | Machinery Co. Ltd. | 4,470,000 | 2,802 |
| | Motech Industries Inc. | 691,827 | 2,782 |
| | Coretronic Corp. | 1,809,000 | 2,765 |
| | Taiwan Glass | | |
| | Industrial Corp. | 2,272,526 | 2,749 |
| * | Evergreen Marine Corp. | | |
| | Taiwan Ltd. | 3,291,000 | 2,743 |
| * | Yang Ming Marine | | |
| | Transport Corp. | 3,543,776 | 2,697 |
| | China Life | | |
| | Insurance Co. Ltd. | 3,241,388 | 2,630 |
| * | Tatung Co. Ltd. | 11,152,000 | 2,629 |
| * | HannStar Display Corp. | 12,756,000 | 2,551 |
| | Realtek | | |
| | Semiconductor Corp. | 1,071,069 | 2,540 |
| | Siliconware Precision | | |
| | Industries Co. ADR | 448,075 | 2,500 |
| | Chicony | | |
| | Electronics Co. Ltd. | 1,113,599 | 2,452 |
| | | |
| | | | Market |
| | | | Value |
| | | Shares | ($000) |
| | Nan Ya Printed | | |
| | Circuit Board Corp. | 593,320 | 2,423 |
| | U-Ming Marine | | |
| | Transport Corp. | 1,163,000 | 2,395 |
| * | Inotera Memories Inc. | 4,845,002 | 2,374 |
| | TSRC Corp. | 1,289,000 | 2,343 |
| | Everlight | | |
| | Electronics Co. Ltd. | 815,497 | 2,256 |
| * | Taiwan Business Bank | 6,700,320 | 2,231 |
| | Ruentex | | |
| | Development Co. Ltd. | 1,260,000 | 2,085 |
| * | Wan Hai Lines Ltd. | 2,819,500 | 2,069 |
| | Advantech Co. Ltd. | 745,659 | 2,036 |
| | Kinsus Interconnect | | |
| | Technology Corp. | 743,000 | 2,022 |
| | Feng Hsin Iron & Steel Co. | 1,229,000 | 2,016 |
| | Eternal Chemical Co. Ltd. | 1,735,433 | 2,008 |
| | Tung Ho Steel | | |
| | Enterprise Corp. | 2,146,842 | 2,007 |
| * | Nanya Technology Corp. | 3,350,915 | 2,005 |
| | Formosa Taffeta Co. Ltd. | 2,115,000 | 1,923 |
| * | Winbond Electronics Corp. | 7,320,000 | 1,907 |
| | Cheng Uei Precision | | |
| | Industry Co. Ltd. | 919,500 | 1,885 |
| * | CMC Magnetics Corp. | 7,156,000 | 1,879 |
| | Farglory Land | | |
| | Development Co. Ltd. | 705,000 | 1,750 |
| * | Chunghwa Picture Tubes | 11,544,351 | 1,743 |
| | Phison Electronics Corp. | 330,510 | 1,673 |
| | Capital Securities Corp. | 3,188,764 | 1,454 |
| | Mitac International Corp. | 3,174,995 | 1,425 |
| | Micro-Star | | |
| | International Co. Ltd. | 2,452,517 | 1,311 |
| | Pixart Imaging Inc. | 270,719 | 1,271 |
| | Formosa International | | |
| | Hotels Corp. | 76,310 | 1,239 |
| | Transcend Information Inc. | 496,363 | 1,233 |
| | Evergreen International | | |
| | Storage & Transport Corp. | 1,324,000 | 1,175 |
| | Vanguard International | | |
| | Semiconductor Corp. | 2,315,000 | 1,007 |
| | Chinese Gamer | | |
| | International Corp. | 100,000 | 691 |
| | Compal | | |
| | Communications Inc. | 788,000 | 668 |
| * | Tatung Co. Ltd. GDR | 92,281 | 435 |
| * | Shin Kong Financial | | |
| | Holding Co. Ltd. Rights | | |
| | Exp. 11/25/2010 | 745,201 | 30 |
| | | | 1,060,124 |
| Thailand (0.4%) | | |
| | PTT PCL (Foreign) | 2,277,115 | 23,069 |
| | PTT Exploration & | | |
| | Production PCL (Foreign) | 3,203,455 | 18,324 |
34
Total International Stock Index Fund
| | | |
| | | | Market |
| | | | Value |
| | | Shares | ($000) |
| | Siam Commercial Bank | | |
| | PCL (Foreign) | 4,229,600 | 14,496 |
| | Kasikornbank | | |
| | PCL (Foreign) | 3,252,800 | 13,697 |
| | Bangkok Bank | | |
| | PCL (Foreign) | 2,601,600 | 13,437 |
| | Banpu PCL | 385,090 | 10,041 |
| | Siam Cement | | |
| | PCL (Foreign) | 841,500 | 9,258 |
| | CP ALL PCL (Foreign) | 6,015,085 | 8,930 |
| | Advanced Info Service | | |
| | PCL (Foreign) | 2,391,900 | 7,194 |
| * | Bangkok Bank PCL (Local) | 1,364,800 | 6,796 |
| | Charoen Pokphand Foods | | |
| | PCL (Foreign) | 8,013,000 | 6,240 |
| * | Kasikornbank PCL | 1,326,600 | 5,187 |
| | PTT Chemical | | |
| | PCL (Foreign) | 974,695 | 4,602 |
| | Krung Thai Bank | | |
| | PCL (Foreign) | 7,263,110 | 4,095 |
| | Bank of Ayudhya | | |
| | PCL(Local) | 5,014,079 | 4,048 |
| | Thai Oil PCL (Foreign) | 2,239,500 | 3,969 |
| | IRPC PCL (Foreign) | 27,008,800 | 3,828 |
| | PTT Aromatics & | | |
| | Refining PCL (Foreign) | 3,025,000 | 3,011 |
| | BEC World PCL (Foreign) | 2,289,505 | 2,545 |
| | Glow Energy | | |
| | PCL (Foreign) | 1,396,445 | 2,321 |
| * | Banpu PCL (Local) | 73,900 | 1,913 |
| * | PTT PCL | 69,900 | 708 |
| * | Advanced Info Service | | |
| | PCL (Local) | 68,000 | 205 |
| * | CP ALL PCL (Local) | 69,900 | 104 |
| * | Bank of Ayudhya | | |
| | PCL (Local) | 129,400 | 103 |
| * | Charoen Pokphand | | |
| | Foods PCL | 57,200 | 45 |
| * | IRPC PCL | 255,700 | 36 |
| * | Thai Oil PCL | 14,200 | 25 |
| * | Glow Energy PCL | 10,400 | 17 |
| * | PTT Aromatics & | | |
| | Refining PCL | 13,800 | 14 |
| | | | 168,258 |
| Turkey (0.5%) | | |
| | Turkiye Garanti | | |
| | Bankasi AS | 5,789,777 | 34,950 |
| | Akbank TAS | 3,279,125 | 20,327 |
| | Turkiye Is Bankasi | 4,346,559 | 19,246 |
| | Turkcell Iletisim | | |
| | Hizmet AS | 2,125,810 | 15,212 |
| | Haci Omer Sabanci | | |
| | Holding AS (Bearer) | 1,722,260 | 9,331 |
| | | | |
| | | | | Market |
| | | | | Value |
| | | | Shares | ($000) |
| | Tupras Turkiye Petrol | | | |
| | Rafinerileri AS | | 346,414 | 9,210 |
| * | Yapi ve Kredi Bankasi AS | | 2,429,988 | 9,166 |
| | Anadolu Efes Biracilik | | | |
| | Ve Malt Sanayii AS | | 556,215 | 8,769 |
| | Turkiye Halk Bankasi AS | | 868,276 | 8,625 |
| | BIM Birlesik Magazalar AS | 217,349 | 7,460 |
| | KOC Holding AS | | 1,457,650 | 6,861 |
| | Turk | | | |
| | Telekomunikasyon AS | | 1,461,167 | 6,825 |
| | Turkiye Vakiflar | | | |
| | Bankasi Tao | | 2,075,191 | 6,587 |
| * | Turk Hava Yollari | | 1,121,126 | 4,602 |
| * | Eregli Demir ve Celik | | | |
| | Fabrikalari TAS | | 1,109,066 | 4,103 |
| | Enka Insaat ve Sanayi AS | 786,596 | 3,550 |
| | Asya Katilim Bankasi AS | | 1,175,332 | 2,995 |
| | Arcelik AS | | 442,049 | 2,415 |
| | Coca-Cola Icecek AS | | 179,854 | 2,225 |
| * | Dogan Sirketler | | | |
| | Grubu Holdings | | 2,271,504 | 1,626 |
| | | | | 184,085 |
| United Kingdom (16.1%) | | | |
| | HSBC Holdings plc | 47,867,262 | 498,188 |
| | Vodafone Group plc | 142,057,875 | 388,332 |
| | BP plc | 50,717,003 | 344,734 |
| | GlaxoSmithKline plc | 14,195,188 | 277,198 |
| | Rio Tinto plc | | 3,962,860 | 257,390 |
| | Royal Dutch Shell plc | | | |
| | Class B | | 7,369,706 | 235,844 |
| | BHP Billiton plc | | 6,033,440 | 213,736 |
| | Royal Dutch Shell plc | | | |
| | Class A | | 6,430,941 | 208,706 |
| | British American | | | |
| | Tobacco plc | | 5,458,633 | 207,955 |
| | AstraZeneca plc | | 3,941,897 | 198,286 |
| | Standard Chartered plc | | 6,343,508 | 183,486 |
| | BG Group plc | | 9,243,869 | 179,943 |
| | Anglo American plc | | 3,605,146 | 167,975 |
| | Tesco plc | 21,928,846 | 150,073 |
| | Barclays plc | 31,279,352 | 137,456 |
| | Diageo plc | | 6,848,879 | 126,346 |
| * | Lloyds Banking | | | |
| | Group plc | 111,658,886 | 122,728 |
| | Xstrata plc | | 5,624,210 | 108,960 |
| ^ | Royal Dutch Shell | | | |
| | plc Class A | | | |
| | (Amsterdam Shares) | | 3,262,071 | 105,813 |
| | Unilever plc | | 3,508,676 | 101,157 |
| | Reckitt Benckiser | | | |
| | Group plc | | 1,684,443 | 94,108 |
| | National Grid plc | | 9,464,759 | 89,504 |
| | Imperial Tobacco | | | |
| | Group plc | | 2,783,552 | 89,150 |
35
Total International Stock Index Fund
| | | |
| | | | Market |
| | | | Value |
| | | Shares | ($000) |
| | SABMiller plc | 2,596,522 | 84,241 |
| | Centrica plc | 14,069,736 | 74,866 |
| | Prudential plc | 6,943,699 | 70,229 |
| | Rolls-Royce Group plc | 5,074,432 | 52,646 |
| | BT Group plc | 21,219,397 | 52,322 |
| | BAE Systems plc | 9,432,139 | 52,066 |
| | Aviva plc | 7,679,035 | 48,972 |
| | Scottish & Southern | | |
| | Energy plc | 2,527,551 | 46,710 |
| | Tullow Oil plc | 2,428,246 | 46,120 |
| | Compass Group plc | 5,151,559 | 42,217 |
| | WPP plc | 3,353,799 | 38,974 |
| | Shire plc | 1,533,920 | 35,997 |
| | British Sky Broadcasting | | |
| | Group plc | 3,109,065 | 35,199 |
| * | Royal Bank of Scotland | | |
| | Group plc | 47,454,945 | 33,954 |
| | Pearson plc | 2,214,666 | 33,920 |
| | Experian plc | 2,796,233 | 32,492 |
| | Old Mutual plc | 14,812,275 | 30,848 |
| | Marks & Spencer | | |
| | Group plc | 4,319,167 | 29,601 |
| | Reed Elsevier plc | 3,311,935 | 28,414 |
| | International Power plc | 4,156,443 | 27,733 |
| | WM Morrison | | |
| | Supermarkets plc | 5,789,526 | 27,247 |
| | Legal & General | | |
| | Group plc | 16,004,476 | 25,730 |
| | Kingfisher plc | 6,460,832 | 24,613 |
| * | Cairn Energy plc | 3,818,865 | 23,603 |
| | Randgold Resources Ltd. | 246,898 | 23,141 |
| | Antofagasta plc | 1,077,621 | 22,810 |
| | Land Securities Group plc | 2,086,613 | 22,627 |
| | Standard Life plc | 6,181,652 | 22,473 |
| | Smith & Nephew plc | 2,425,234 | 21,310 |
| | ARM Holdings plc | 3,587,055 | 20,942 |
| | Capita Group plc | 1,688,379 | 20,731 |
| * | Wolseley plc | 778,802 | 20,716 |
| | J Sainsbury plc | 3,317,006 | 20,710 |
| | Carnival plc | 472,918 | 20,433 |
| | Smiths Group plc | 1,069,439 | 20,411 |
| | Man Group plc | 4,860,887 | 20,317 |
| | RSA Insurance Group plc | 9,442,540 | 19,810 |
| | British Land Co. plc | 2,393,509 | 19,542 |
| | Burberry Group plc | 1,187,897 | 19,398 |
| | Next plc | 514,787 | 18,849 |
| | United Utilities Group plc | 1,859,783 | 18,208 |
| | Johnson Matthey plc | 588,623 | 18,051 |
| | Aggreko plc | 710,539 | 17,929 |
| | Resolution Ltd. | 3,980,976 | 16,690 |
| | Petrofac Ltd. | 707,369 | 16,576 |
| | Associated British | | |
| | Foods plc | 972,148 | 16,305 |
| | G4S plc | 3,849,258 | 16,137 |
| | | | |
| | | | | Market |
| | | | | Value |
| | | | Shares | ($000) |
| | AMEC plc | | 906,992 | 15,776 |
| | Sage Group plc | | 3,582,109 | 15,457 |
| | Intercontinental Hotels | | |
| | Group plc | | 787,864 | 15,216 |
| | Severn Trent plc | | 646,656 | 14,457 |
| | Admiral Group plc | | 549,895 | 14,350 |
| * | Autonomy Corp. plc | 597,539 | 13,991 |
| | Serco Group plc | | 1,344,603 | 13,228 |
| | Whitbread plc | | 483,608 | 13,119 |
| | Intertek Group plc | | 437,069 | 12,991 |
| | Hammerson plc | | 1,927,355 | 12,949 |
| | 3i Group plc | | 2,649,383 | 12,727 |
| | Inmarsat plc | | 1,202,105 | 12,552 |
| * | Lonmin plc | | 442,651 | 12,390 |
| | Kazakhmys plc | | 585,132 | 12,330 |
| | Rexam plc | | 2,402,410 | 12,237 |
| | Cobham plc | | 3,143,680 | 11,666 |
| | ICAP plc | | 1,521,588 | 11,116 |
| * | ITV plc | | 10,089,389 | 11,052 |
| | Vedanta Resources plc | 327,151 | 10,879 |
| | Bunzl plc | | 901,139 | 10,669 |
| | Investec plc | | 1,325,998 | 10,583 |
| | Invensys plc | | 2,207,216 | 10,197 |
| | Eurasian Natural | | | |
| | Resources Corp. plc | 702,916 | 9,806 |
| | Fresnillo plc | | 487,559 | 9,763 |
| | Segro plc | | 2,041,266 | 9,698 |
| | Babcock International | | |
| | Group plc | | 981,155 | 9,118 |
| | Firstgroup plc | | 1,323,931 | 8,658 |
| | Balfour Beatty plc | | 1,886,003 | 8,362 |
| | Home Retail Group plc | 2,357,729 | 8,268 |
| | Cable & Wireless | | | |
| | Worldwide plc | | 7,209,678 | 8,102 |
| | Capital Shopping | | | |
| | Centres Group plc | | 1,272,613 | 7,836 |
| | Schroders plc | | 304,947 | 7,709 |
| | Thomas Cook Group plc | 2,371,793 | 6,875 |
| *,^ | British Airways plc | | 1,563,995 | 6,777 |
| | Vodafone Group plc ADR | 193,070 | 5,311 |
| | TUI Travel plc | | 1,514,887 | 5,126 |
| | London Stock Exchange | | |
| | Group plc | | 404,903 | 4,759 |
| | BP plc ADR | | 107,815 | 4,402 |
| | | | | 6,340,400 |
| Total Common Stocks | | | |
| (Cost $34,767,121) | | | 39,209,681 |
| Temporary Cash Investments (2.0%)1 | |
| Money Market Fund (1.9%) | | |
| 3,4 | Vanguard Market | | | |
| | Liquidity Fund, | | | |
| | 0.237% | 750,968,315 | 750,968 |
36
Total International Stock Index Fund
| | | |
| | | Face | Market |
| | | Amount | Value |
| | | ($000) | ($000) |
| U.S. Government and Agency Obligations (0.1%) |
| 5,6 | Fannie Mae Discount Notes, | | |
| | 0.190%, 12/29/10 | 1,000 | 1,000 |
| 5,6 | Fannie Mae Discount Notes, | | |
| | 0.300%, 3/21/11 | 435 | 435 |
| 5,6 | Federal Home Loan Bank | | |
| | Discount Notes, 0.300%, | | |
| | 11/19/10 | 1,500 | 1,500 |
| 5 | Freddie Mac Discount Notes, | | |
| | 0.300%, 11/1/10 | 5,000 | 5,000 |
| 5,6 | Freddie Mac Discount Notes, | | |
| | 0.321%–0.331%, 12/15/10 | 16,000 | 15,996 |
| 5 | Freddie Mac Discount Notes, | | |
| | 0.240%, 3/7/11 | 6,000 | 5,995 |
| | | | 29,926 |
| Total Temporary Cash Investments | |
| (Cost $780,891) | | 780,894 |
| Total Investments (101.4%) | | |
| (Cost $35,548,012) | | 39,990,575 |
| Other Assets and Liabilities (-1.4%) | |
| Other Assets | | 144,618 |
| Liabilities4 | | (692,548) |
| | | | (547,930) |
| Net Assets (100%) | | |
| Applicable to 2,548,286,351 outstanding | |
| $.001 par value shares of beneficial | |
| interest (unlimited authorization) | 39,442,645 |
| Net Asset Value Per Share | | $15.48 |
| |
| At October 31, 2010, net assets consisted of: |
| | Amount |
| | ($000) |
| Paid-in Capital | 36,503,813 |
| Undistributed Net Investment Income | 532,928 |
| Accumulated Net Realized Losses | (2,047,934) |
| Unrealized Appreciation (Depreciation) | |
| Investment Securities | 4,442,563 |
| Futures Contracts | 1,083 |
| Foreign Currencies and | |
| Forward Currency Contracts | 10,192 |
| Net Assets | 39,442,645 |
See Note A in Notes to Financial Statements.
* Non-income-producing security.
^ Part of security position is on loan to broker-dealers. The total value of securities on loan is $524,102,000.
1 The fund invests a portion of its cash reserves in equity markets through the use of index futures contracts. After giving effect to futures investments, the fund’s effective common stock and temporary cash investment positions represent 99.8% and 1.6%, respectively,
of net assets.
2 Security exempt from registration under Rule 144A of the Securities Act of 1933. Such securities may be sold in transactions exempt from registration, normally to qualified institutional buyers. At October 31, 2010, the value of this security represented 0.1% of net assets.
3 Affiliated money market fund available only to Vanguard funds and certain trusts and accounts managed by Vanguard. Rate shown is the 7-day yield.
4 Includes $550,479,000 of collateral received for securities on loan.
5 The issuer operates under a congressional charter; its securities are not backed by the full faith and credit of the U.S. government.
6 Securities with a value of $10,932,000 have been segregated as initial margin for open futures contracts.
ADR—American Depositary Receipt.
GDR—Global Depositary Receipt.
REIT—Real Estate Investment Trust.
See accompanying Notes, which are an integral part of the Financial Statements.
37
Total International Stock Index Fund
| |
| Statement of Operations | |
| |
| | Year Ended |
| | October 31, 2010 |
| | ($000) |
| Investment Income | |
| Income | |
| Dividends1 | 724,062 |
| Interest2 | 240 |
| Security Lending | 18,981 |
| Total Income | 743,283 |
| Expenses | |
| The Vanguard Group—Note B | |
| Investment Advisory Services | 1,424 |
| Management and Administrative | 54,524 |
| Marketing and Distribution | 6,145 |
| Custodian Fees | 6,958 |
| Auditing Fees | 39 |
| Shareholders’ Reports | 181 |
| Trustees’ Fees and Expenses | 45 |
| Total Expenses | 69,316 |
| Net Investment Income | 673,967 |
| Realized Net Gain (Loss) | |
| Investment Securities Sold | 359,205 |
| Futures Contracts | 2,894 |
| Foreign Currencies and Forward Currency Contracts | (18,437) |
| Realized Net Gain (Loss) | 343,662 |
| Change in Unrealized Appreciation (Depreciation) | |
| Investment Securities | 2,322,804 |
| Futures Contracts | 6,272 |
| Foreign Currencies and Forward Currency Contracts | 8,636 |
| Change in Unrealized Appreciation (Depreciation) | 2,337,712 |
| Net Increase (Decrease) in Net Assets Resulting from Operations | 3,355,341 |
1 Dividends are net of foreign withholding taxes of $65,918,000.
2 Interest income from an affiliated company of the fund was $169,000.
See accompanying Notes, which are an integral part of the Financial Statements.
38
Total International Stock Index Fund
| | |
| Statement of Changes in Net Assets | | |
| |
| | Year Ended October 31, |
| | 2010 | 2009 |
| | ($000) | ($000) |
| Increase (Decrease) in Net Assets | | |
| Operations | | |
| Net Investment Income | 673,967 | 902,287 |
| Realized Net Gain (Loss) | 343,662 | (1,645,022) |
| Change in Unrealized Appreciation (Depreciation) | 2,337,712 | 6,395,419 |
| Net Increase (Decrease) in Net Assets Resulting from Operations | 3,355,341 | 5,652,684 |
| Distributions | | |
| Net Investment Income | (608,038) | (511,942) |
| Realized Capital Gain | — | — |
| Total Distributions | (608,038) | (511,942) |
| Capital Share Transactions | | |
| Issued | 15,952,930 | 5,544,277 |
| Issued in Lieu of Cash Distributions | 557,477 | 468,122 |
| Redeemed1 | (4,144,544) | (3,976,141) |
| Net Increase (Decrease) from Capital Share Transactions | 12,365,863 | 2,036,258 |
| Total Increase (Decrease) | 15,113,166 | 7,177,000 |
| Net Assets | | |
| Beginning of Period | 24,329,479 | 17,152,479 |
| End of Period2 | 39,442,645 | 24,329,479 |
1 Net of redemption fees for fiscal 2010 and 2009 of $745,000 and $1,020,000, respectively.
2 Net Assets—End of Period includes undistributed net investment income of $532,928,000 and $473,474,000.
See accompanying Notes, which are an integral part of the Financial Statements.
39
Total International Stock Index Fund
| | | | | |
| Financial Highlights | | | | | |
| |
| |
| For a Share Outstanding | | | Year Ended October 31, |
| Throughout Each Period | 2010 | 2009 | 2008 | 2007 | 2006 |
| Net Asset Value, Beginning of Period | $13.99 | $10.97 | $21.89 | $16.90 | $13.49 |
| Investment Operations | | | | | |
| Net Investment Income | .3561 | .5442 | .5401 | .412 | .294 |
| Net Realized and Unrealized Gain (Loss) | | | | | |
| on Investments | 1.478 | 2.801 | (10.938) | 4.980 | 3.410 |
| Total from Investment Operations | 1.834 | 3.345 | (10.398) | 5.392 | 3.704 |
| Distributions | | | | | |
| Dividends from Net Investment Income | (.344) | (.325) | (.522) | (.402) | (.294) |
| Distributions from Realized Capital Gains | — | — | — | — | — |
| Total Distributions | (.344) | (.325) | (.522) | (.402) | (.294) |
| Net Asset Value, End of Period | $15.48 | $13.99 | $10.97 | $21.89 | $16.90 |
| |
| Total Return3 | 13.28% | 31.41% | -48.57% | 32.47% | 27.84% |
| |
| Ratios/Supplemental Data | | | | | |
| Net Assets, End of Period (Millions) | $39,443 | $24,329 | $17,152 | $29,725 | $18,200 |
| Ratio of Total Expenses to | | | | | |
| Average Net Assets | 0.26% | 0.27% | 0.03% | — | — |
| Acquired Fund Fees and Expenses | — | 0.05% | 0.25% | 0.27% | 0.32% |
| Ratio of Net Investment Income to | | | | | |
| Average Net Assets | 2.52% | 4.73%2 | 3.07% | 1.93% | 1.71% |
| Portfolio Turnover Rate | 6% | 12%4 | 15%4 | 2% | 2% |
1 Calculated based on average shares outstanding.
2 Net investment income per share and the ratio of net investment income to average net assets include $0.249 and 2.06%, respectively, of annual dividends received from Vanguard mutual funds in December 2008. From August 2008 through February 2009, the fund invested in a combination of Vanguard mutual funds and common stocks. Effective in March 2009, the fund’s equity investments are solely in common stocks.
3 Total returns do not include transaction or account service fees that may have applied in the periods shown. Fund prospectuses provide information about any applicable transaction and account service fees.
4 Excludes the value of securities received and mutual fund shares delivered in connection with a change in the fund’s investment policy to invest directly in individual stocks and reduce the fund’s investments in Vanguard mutual funds.
See accompanying Notes, which are an integral part of the Financial Statements.
40
Total International Stock Index Fund
Notes to Financial Statements
Vanguard Total International Stock Index Fund is registered under the Investment Company Act of 1940 as an open-end investment company, or mutual fund. The fund invests in securities of foreign issuers, which may subject it to investment risks not normally associated with investing in securities of United States corporations.
A. The following significant accounting policies conform to generally accepted accounting principles for U.S. mutual funds. The fund consistently follows such policies in preparing its financial statements.
1. Security Valuation: Securities are valued as of the close of trading on the New York Stock Exchange (generally 4 p.m., Eastern time) on the valuation date. Equity securities are valued at the latest quoted sales prices or official closing prices taken from the primary market in which each security trades; such securities not traded on the valuation date are valued at the mean of the latest quoted bid and asked prices. Securities for which market quotations are not readily available, or whose values have been affected by events occurring before the fund’s pricing time but after the close of the securities’ primary markets, are valued at their fair values calculated according to procedures adopted by the board of trustees. These procedures include obtaining quotations from an independent pricing service, monitoring news to identify significant market- or security-specific events, and evaluating changes in the va lues of foreign market proxies (for example, ADRs, futures contracts, or exchange-traded funds), between the time the foreign markets close and the fund’s pricing time. When fair-value pricing is employed, the prices of securities used by a fund to calculate its net asset value may differ from quoted or published prices for the same securities. Investments in Vanguard Market Liquidity Fund are valued at that fund’s net asset value. Temporary cash investments acquired over 60 days to maturity are valued using the latest bid prices or using valuations based on a matrix system (which considers such factors as security prices, yields, maturities, and ratings), both as furnished by independent pricing services. Other temporary cash investments are valued at amortized cost, which approximates market value.
2. Foreign Currency: Securities and other assets and liabilities denominated in foreign currencies are translated into U.S. dollars using exchange rates obtained from an independent third party as of the fund’s pricing time on the valuation date. Realized gains (losses) and unrealized appreciation (depreciation) on investment securities include the effects of changes in exchange rates since the securities were purchased, combined with the effects of changes in security prices. Fluctuations in the value of other assets and liabilities resulting from changes in exchange rates are recorded as unrealized foreign currency gains (losses) until the assets or liabilities are settled in cash, at which time they are recorded as realized foreign currency gains (losses).
3. Futures and Forward Currency Contracts: The fund uses index futures contracts to a limited extent, with the objectives of maintaining full exposure to the stock market, enhancing returns, maintaining liquidity, and minimizing transaction costs. The fund may purchase futures contracts to immediately invest incoming cash in the market, or sell futures in response to cash outflows, thereby simulating a fully invested position in the underlying index while maintaining a cash balance for liquidity. The fund may seek to enhance returns by using futures contracts instead of the underlying securities when futures are believed to be priced more attractively than the underlying securities. The primary risks associated with the use of futures contracts are imperfect correlation between changes in market values of stocks held by the fund and the prices of futures contracts, and the possibility of an illiquid market.
41
Total International Stock Index Fund
The fund also enters into forward currency contracts to provide the appropriate currency exposure related to any open futures contracts. The fund’s risks in using these contracts include movement in the values of the foreign currencies relative to the U.S. dollar and the ability of the counterparties to fulfill their obligations under the contracts. Counterparty risk is mitigated by entering into forward currency contracts only with highly rated counterparties, by a master netting arrangement between the fund and the counterparty, and by the posting of collateral by the counterparty. The forward currency contracts contain provisions whereby a counterparty may terminate open contracts if the fund’s net assets decline below a certain level, triggering a payment by the fund if the fund is in a net liability position at the time of the termination. The payment amount would be reduced by any collateral the fund has po sted. Any securities posted as collateral for open contracts are noted in the Statement of Net Assets.
Futures contracts are valued at their quoted daily settlement prices. Forward currency contracts are valued at their quoted daily prices obtained from an independent third party, adjusted for currency risk based on the expiration date of each contract. The aggregate principal amounts of the contracts are not recorded in the Statement of Net Assets. Fluctuations in the value of the contracts are recorded in the Statement of Net Assets as an asset (liability) and in the Statement of Operations as unrealized appreciation (depreciation) until the contracts are closed, when they are recorded as realized gains (losses) on futures or forward currency contracts.
4. Federal Income Taxes: The fund intends to continue to qualify as a regulated investment company and distribute all of its taxable income. Management has analyzed the fund’s tax positions taken for all open federal income tax years (October 31, 2007–2010), and has concluded that no provision for federal income tax is required in the fund’s financial statements.
5. Distributions: Distributions to shareholders are recorded on the ex-dividend date.
6. Security Lending: The fund may lend its securities to qualified institutional borrowers to earn additional income. Security loans are required to be secured at all times by collateral at least equal to the market value of securities loaned. The fund invests cash collateral received in Vanguard Market Liquidity Fund, and records a liability for the return of the collateral, during the period the securities are on loan. Security lending income represents fees charged to borrowers plus income earned on investing cash collateral, less expenses associated with the loan.
7. Other: Dividend income is recorded on the ex-dividend date. Interest income includes income distributions received from Vanguard Market Liquidity Fund and is accrued daily. Security transactions are accounted for on the date securities are bought or sold. Costs used to determine realized gains (losses) on the sale of investment securities are those of the specific securities sold. Fees assessed on redemptions of capital shares are credited to paid-in capital.
B. The Vanguard Group furnishes at cost investment advisory, corporate management, administrative, marketing, and distribution services. The costs of such services are allocated to the fund under methods approved by the board of trustees. The fund has committed to provide up to 0.40% of its net assets in capital contributions to Vanguard. At October 31, 2010, the fund had contributed capital of $4,988,000 to Vanguard (included in Other Assets), representing 0.01% of the fund’s net assets and 1.99% of Vanguard’s capitalization. The fund’s trustees and officers are also directors and officers of Vanguard.
42
Total International Stock Index Fund
C. Various inputs may be used to determine the value of the fund’s investments. These inputs are summarized in three broad levels for financial statement purposes. The inputs or methodologies used to value securities are not necessarily an indication of the risk associated with investing in those securities.
Level 1—Quoted prices in active markets for identical securities.
Level 2—Other significant observable inputs (including quoted prices for similar securities, interest rates, prepayment speeds, credit risk, etc.).
Level 3—Significant unobservable inputs (including the fund’s own assumptions used to determine the fair value of investments).
The following table summarizes the fund’s investments as of October 31, 2010, based on the inputs used to value them:
| | | |
| | Level 1 | Level 2 | Level 3 |
| Investments | ($000) | ($000) | ($000) |
| Common Stocks | 2,605,843 | 36,603,627 | 211 |
| Temporary Cash Investments | 750,968 | 29,926 | — |
| Futures Contracts—Liabilities1 | (444) | — | — |
| Forward Currency Contracts—Assets | — | 6,817 | — |
| Total | 3,356,367 | 36,640,370 | 211 |
| 1 Represents variation margin on the last day of the reporting period. | | | |
The following table summarizes changes in investments valued based on Level 3 inputs during the year ended October 31, 2010:
| |
| | Investments in |
| | Common Stocks |
| Amount Valued Based on Level 3 Inputs | ($000) |
| Balance as of October 31, 2009 | 223 |
| Change in Unrealized Appreciation (Depreciation) | (12) |
| Balance as of October 31, 2010 | 211 |
D. At October 31, 2010, the fair values of derivatives were reflected in the Statement of Net Assets as follows:
| | | |
| | | Foreign | |
| | Equity | Exchange | |
| | Contracts1 | Contracts | Total |
| Statement of Net Assets Caption | ($000) | ($000) | ($000) |
| Other Assets | — | 6,817 | 6,817 |
| Liabilities | (444) | — | (444) |
| 1 Represents variation margin on the last day of the reporting period. | | | |
43
Total International Stock Index Fund
Realized net gain (loss) and the change in unrealized appreciation (depreciation) on derivatives for the year ended October 31, 2010, were:
| | | |
| | | Foreign | |
| | Equity | Exchange | |
| | Contracts | Contracts | Total |
| Realized Net Gain (Loss) on Derivatives | ($000) | ($000) | ($000) |
| Futures Contracts | 2,894 | — | 2,894 |
| Forward Currency Contracts | — | (8,478) | (8,478) |
| Realized Net Gain (Loss) on Derivatives | 2,894 | (8,478) | (5,584) |
| |
| Change in Unrealized Appreciation (Depreciation) on Derivatives | | | |
| Futures Contracts | 6,272 | — | 6,272 |
| Forward Currency Contracts | — | 6,553 | 6,553 |
| Change in Unrealized Appreciation (Depreciation) on Derivatives | 6,272 | 6,553 | 12,825 |
At October 31, 2010, the aggregate settlement value of open futures contracts and the related unrealized appreciation (depreciation) were:
| | | | |
| | | | | ($000) |
| | | | Aggregate | |
| | | Number of | Settlement | Unrealized |
| | | Long (Short) | Value | Appreciation |
| Futures Contracts | Expiration | Contracts | Long (Short) | (Depreciation) |
| Dow Jones EURO STOXX 50 Index | December 2010 | 1,765 | 69,646 | 1,163 |
| FTSE 100 Index | December 2010 | 615 | 55,662 | 1,059 |
| Topix Index | December 2010 | 380 | 38,024 | (1,139) |
Unrealized appreciation (depreciation) on open FTSE 100 Index futures contracts is required to be treated as realized gain (loss) for tax purposes.
At October 31, 2010, the fund had open forward currency contracts to receive and deliver currencies as follows. Unrealized appreciation (depreciation) on open forward currency contracts is treated as realized gain (loss) for tax purposes.
| | | | | | |
| | | | | | | Unrealized |
| | Contract | | | | | Appreciation |
| | Settlement | | | Contract Amount (000) | (Depreciation) |
| Counterparty | Date | | Receive | | Deliver | ($000) |
| Brown Brothers Harriman & Co. | 12/22/10 | EUR | 49,275 | USD | 68,581 | 4,573 |
| Brown Brothers Harriman & Co. | 12/22/10 | GBP | 34,153 | USD | 54,725 | 1,890 |
| Brown Brothers Harriman & Co. | 12/15/10 | JPY | 713,200 | USD | 8,863 | 354 |
| EUR—Euro. | | | | | | |
| GBP—British pound. | | | | | | |
| JPY—Japanese yen. | | | | | | |
| USD—U.S. dollar. | | | | | | |
44
Total International Stock Index Fund
At October 31, 2010, the counterparty had deposited in a segregated account cash with a value sufficient to cover substantially all amounts due to the fund in connection with open forward currency contracts.
The fund had net unrealized foreign currency gains of $3,375,000 resulting from the translation of other assets and liabilities at October 31, 2010.
E. Distributions are determined on a tax basis and may differ from net investment income and realized capital gains for financial reporting purposes. Differences may be permanent or temporary. Permanent differences are reclassified among capital accounts in the financial statements to reflect their tax character. Temporary differences arise when certain items of income, expense, gain, or loss are recognized in different periods for financial statement and tax purposes; these differences will reverse at some time in the future. Differences in classification may also result from the treatment of short-term gains as ordinary income for tax purposes.
During the year ended October 31, 2010, the fund realized net foreign currency losses of $9,959,000, which decreased distributable net income for tax purposes; accordingly, such losses have been reclassified from accumulated net realized losses to undistributed net investment income. Certain of the fund’s investments are in securities considered to be “passive foreign investment companies,” for which any unrealized appreciation and/or realized gains are required to be included in distributable net income for tax purposes. Unrealized appreciation of $48,890,000 on the fund’s passive foreign investment company holdings at October 31, 2009, has been distributed and is reflected in the balance of undistributed net investment income. During the year ended October 31, 2010, the fund realized gains on the sale of passive foreign investment companies of $3,484,000, which have been included in current and prior periods’ taxable income; accordingly, such gains have been reclassified from accumulated net realized losses to undistributed net investment income. Since October 31, 2009, the fund’s passive foreign investment company holdings have appreciated in value, increasing the amount of taxable income available for distribution as of October 31, 2010, by $34,140,000. Unrealized appreciation on the fund’s passive foreign investment company holdings at October 31, 2010, was $83,030,000.
For tax purposes, at October 31, 2010, the fund had $641,082,000 of ordinary income available for distribution. The fund had available capital loss carryforwards totaling $2,039,911,000 to offset future net capital gains of $324,558,000 through October 31, 2016, and $1,715,353,000 through October 31, 2017.
At October 31, 2010, the cost of investment securities for tax purposes was $35,631,062,000. Net unrealized appreciation of investment securities for tax purposes was $4,359,513,000, consisting of unrealized gains of $5,768,227,000 on securities that had risen in value since their purchase and $1,408,714,000 in unrealized losses on securities that had fallen in value since their purchase.
F. During the year ended October 31, 2010, the fund purchased $13,883,409,000 of investment securities and sold $1,560,966,000 of investment securities, other than temporary cash investments.
45
Total International Stock Index Fund
| | |
| G. Capital shares issued and redeemed were: | | |
| | Year Ended October 31, |
| | 2010 | 2009 |
| | Shares | Shares |
| | (000) | (000) |
| Issued | 1,065,936 | 493,049 |
| Issued in Lieu of Cash Distributions | 38,553 | 43,832 |
| Redeemed | (294,682) | (361,836) |
| Net Increase (Decrease) in Shares Outstanding | 809,807 | 175,045 |
H. In preparing the financial statements as of October 31, 2010, management considered the impact of subsequent events for potential recognition or disclosure in these financial statements. In November 2010, the fund began to offer Admiral, Signal, Institutional, and Institutional Plus share classes to investors who meet certain administrative, service, and account-size criteria. In 2011, the fund will offer an ETF share class. In addition, the fund will change its benchmark index from the MSCI EAFE + Emerging Markets Index to the MSCI All Country World ex USA Investable Market Index. This transition is expected to be completed in the near term.
46
Report of Independent Registered Public Accounting Firm
To the Trustees of Vanguard STAR Funds and the Shareholders of Vanguard Total International Stock Index Fund:
In our opinion, the accompanying statement of net assets and the related statements of operations and of changes in net assets and the financial highlights present fairly, in all material respects, the financial position of Vanguard Total International Stock Index Fund (constituting a separate portfolio of Vanguard STAR Funds, hereafter referred to as the “Fund”) at October 31, 2010, the results of its operations for the year then ended, the changes in its net assets for each of the two years in the period then ended and the financial highlights for each of the five years in the period then ended, in conformity with accounting principles generally accepted in the United States of America. These financial statements and financial highlights (hereafter referred to as “financial statements”) are the responsibility of the Fund’s management; our responsibility is to express an opinion on these financial statements based on our audits. We conducted our audits of these financial statements in accordance with the standards of the Public Company Accounting Oversight Board (United States). Those standards require that we plan and perform the audit to obtain reasonable assurance about whether the financial statements are free of material misstatement. An audit includes examining, on a test basis, evidence supporting the amounts and disclosures in the financial statements, assessing the accounting principles used and significant estimates made by management, and evaluating the overall financial statement presentation. We believe that our audits, which included confirmation of securities at October 31, 2010 by correspondence with the custodian and brokers and by agreement to the underlying ownership records of the Vanguard Market Liquidity Fund, provide a reasonable basis for our opinion.
PricewaterhouseCoopers LLP
Philadelphia, Pennsylvania
December 9, 2010
|
| Special 2010 tax information (unaudited) for Vanguard Total International Stock Index Fund |
This information for the fiscal year ended October 31, 2010, is included pursuant to provisions of the Internal Revenue Code.
The fund distributed $424,106,000 of qualified dividend income to shareholders during the fiscal year.
The fund designates to shareholders foreign source income of $785,286,000 and foreign taxes paid of $65,126,000. Shareholders will receive more detailed information with their Form 1099-DIV in January 2011 to determine the calendar year amounts to be included on their 2010 tax returns.
47
Your Fund’s After-Tax Returns
This table presents returns for your fund both before and after taxes. The after-tax returns are shown in two ways: (1) assuming that an investor owned the fund during the entire period and paid taxes on the fund’s distributions, and (2) assuming that an investor paid taxes on the fund’s distributions and sold all shares at the end of each period.
Calculations are based on the highest individual federal income tax and capital gains tax rates in effect at the times of the distributions and the hypothetical sales. State and local taxes were not considered. After-tax returns reflect any qualified dividend income , using actual prior-year figures and estimates for 2010. (In the example, returns after the sale of fund shares may be higher than those assuming no sale. This occurs when the sale would have produced a capital loss. The calculation assumes that the investor received a tax deduction for the loss.) Please note that your actual after-tax returns will depend on your tax situation and may differ from those shown. Also note that if you own the fund in a tax-deferred account, such as an individual retirement account or a 401(k) plan, this information does not apply to you. Such accounts are not subject to current taxes.
Finally, keep in mind that a fund’s performance—whether before or after taxes—does not guarantee future results.
| | | |
| Average Annual Total Returns: Total International Stock Index Fund | | |
| Periods Ended October 31, 2010 | | | |
| | One | Five | Ten |
| | Year | Years | Years |
| Returns Before Taxes | 13.28% | 5.33% | 4.69% |
| Returns After Taxes on Distributions | 12.84 | 4.85 | 4.14 |
| Returns After Taxes on Distributions and Sale of Fund Shares | 9.06 | 4.47 | 3.81 |
Returns do not reflect the 2% fee on redemptions of shares held for less than two months.
48
About Your Fund’s Expenses
As a shareholder of the fund, you incur ongoing costs, which include costs for portfolio management, administrative services, and shareholder reports (like this one), among others. Operating expenses, which are deducted from a fund’s gross income, directly reduce the investment return of the fund.
A fund’s expenses are expressed as a percentage of its average net assets. This figure is known as the expense ratio. The following examples are intended to help you understand the ongoing costs (in dollars) of investing in your fund and to compare these costs with those of other mutual funds. The examples are based on an investment of $1,000 made at the beginning of the period shown and held for the entire period.
The accompanying table illustrates your fund’s costs in two ways:
• Based on actual fund return. This section helps you to estimate the actual expenses that you paid over the period. The ”Ending Account Value“ shown is derived from the fund‘s actual return, and the third column shows the dollar amount that would have been paid by an investor who started with $1,000 in the fund. You may use the information here, together with the amount you invested, to estimate the expenses that you paid over the period.
To do so, simply divide your account value by $1,000 (for example, an $8,600 account value divided by $1,000 = 8.6), then multiply the result by the number given for your fund under the heading ”Expenses Paid During Period.“
• Based on hypothetical 5% yearly return. This section is intended to help you compare your fund‘s costs with those of other mutual funds. It assumes that the fund had a yearly return of 5% before expenses, but that the expense ratio is unchanged. In this case—because the return used is not the fund’s actual return—the results do not apply to your investment. The example is useful in making comparisons because the Securities and Exchange Commission requires all mutual funds to calculate expenses based on a 5% return. You can assess your fund’s costs by comparing this hypothetical example with the hypothetical examples that appear in shareholder reports of other funds.
Note that the expenses shown in the table are meant to highlight and help you compare ongoing costs only and do not reflect transaction costs incurred by the fund for buying and selling securities. Further, the expenses do not include the 2% fee on redemptions of shares held for less than two months, nor do they include the account service fee described in the prospectus. If such fees were applied to your account, your costs would be higher. Your fund does not carry a “sales load.” The calculations assume no shares were bought or sold during the period. Your actual costs may have been higher or lower, depending on the amount of your investment and the timing of any purchases or redemptions.
You can find more information about the fund’s expenses, including annual expense ratios, in the Financial Statements section of this report. For additional information on operating expenses and other shareholder costs, please refer to your fund’s current prospectus.
49
| | | |
| Six Months Ended October 31, 2010 | | | |
| | Beginning | Ending | Expenses |
| | Account Value | Account Value | Paid During |
| Total International Stock Index Fund | 4/30/2010 | 10/31/2010 | Period |
| Based on Actual Fund Return | $1,000.00 | $1,076.50 | $1.36 |
| Based on Hypothetical 5% Yearly Return | 1,000.00 | 1,023.89 | 1.33 |
The calculations are based on expenses incurred in the most recent six-month period. The fund’s annualized six-month expense ratio for that period is 0.26%. The dollar amounts shown as “Expenses Paid” are equal to the annualized expense ratio multiplied by the average account value over the period, multiplied by the number of days in the most recent six-month period, then divided by the number of days in the most recent 12-month period.
50
Glossary
Beta. A measure of the magnitude of a fund’s past share-price fluctuations in relation to the ups and downs of a given market index. The index is assigned a beta of 1.00. Compared with a given index, a fund with a beta of 1.20 typically would have seen its share price rise or fall by 12% when the index rose or fell by 10%. For this report, beta is based on returns over the past 36 months for both the fund and the index. Note that a fund’s beta should be reviewed in conjunction with its R-squared (see definition). The lower the R-squared, the less correlation there is between the fund and the index, and the less reliable beta is as an indicator of volatility.
Dividend Yield. Dividend income earned by stocks, expressed as a percentage of the aggregate market value (or of net asset value, for a fund). The yield is determined by dividing the amount of the annual dividends by the aggregate value (or net asset value) at the end of the period. For a fund, the dividend yield is based solely on stock holdings and does not include any income produced by other investments.
Earnings Growth Rate. The average annual rate of growth in earnings over the past five years for the stocks now in a fund.
Equity Exposure. A measure that reflects a fund’s investments in stocks and stock futures. Any holdings in short-term reserves are excluded.
Expense Ratio. The percentage of a fund’s average net assets used to pay its annual administrative and advisory expenses. These expenses directly reduce returns to investors.
Inception Date. The date on which the assets of a fund (or one of its share classes) are first invested in accordance with the fund’s investment objective. For funds with a subscription period, the inception date is the day after that period ends. Investment performance is measured from the inception date.
Median Market Cap. An indicator of the size of companies in which a fund invests; the midpoint of market capitalization (market price x shares outstanding) of a fund’s stocks, weighted by the proportion of the fund’s assets invested in each stock. Stocks representing half of the fund’s assets have market capitalizations above the median, and the rest are below it.
Price/Book Ratio. The share price of a stock divided by its net worth, or book value, per share. For a fund, the weighted average price/book ratio of the stocks it holds.
Price/Earnings Ratio. The ratio of a stock’s current price to its per-share earnings over the past year. For a fund, the weighted average P/E of the stocks it holds. P/E is an indicator of market expectations about corporate prospects; the higher the P/E, the greater the expectations for a company’s future growth.
R-Squared. A measure of how much of a fund’s past returns can be explained by the returns from the market in general, as measured by a given index. If a fund’s total returns were precisely synchronized with an index’s returns, its R-squared would be 1.00. If the fund’s returns bore no relationship to the index’s returns, its R-squared would be 0. For this report, R-squared is based on returns over the past 36 months for both the fund and the index.
Return on Equity. The annual average rate of return generated by a company during the past five years for each dollar of shareholder’s equity (net income divided by shareholder’s equity). For a fund, the weighted average return on equity for the companies whose stocks it holds.
51
Short-Term Reserves. The percentage of a fund invested in highly liquid, short-term securities that can be readily converted to cash.
Turnover Rate. An indication of the fund’s trading activity. Funds with high turnover rates incur higher transaction costs and may be more likely to distribute capital gains (which may be taxable to investors). The turnover rate excludes in-kind transactions, which have minimal impact on costs.
52
This page intentionally left blank.
This page intentionally left blank.
This page intentionally left blank.
The People Who Govern Your Fund
The trustees of your mutual fund are there to see that the fund is operated and managed in your best interests since, as a shareholder, you are a part owner of the fund. Your fund’s trustees also serve on the board of directors of The Vanguard Group, Inc., which is owned by the Vanguard funds and provides services to them on an at-cost basis.
A majority of Vanguard’s board members are independent, meaning that they have no affiliation with Vanguard or the funds they oversee, apart from the sizable personal investments they have made as private individuals. The independent board members have distinguished backgrounds in business, academia, and public service. Each of the trustees and executive officers oversees 178 Vanguard funds.
The following table provides information for each trustee and executive officer of the fund. More information about the trustees is in the Statement of Additional Information, which can be obtained, without charge, by contacting Vanguard at 800-662-7447, or online at vanguard.com.
| |
| Interested Trustee1 | Amy Gutmann |
| | Born 1949. Trustee Since June 2006. Principal |
| F. William McNabb III | Occupation(s) During the Past Five Years: President |
| Born 1957. Trustee Since July 2009. Chairman of the | of the University of Pennsylvania; Christopher H. |
| Board. Principal Occupation(s) During the Past Five | Browne Distinguished Professor of Political Science |
| Years: Chairman of the Board of The Vanguard Group, | in the School of Arts and Sciences with secondary |
| Inc., and of each of the investment companies served | appointments at the Annenberg School for Commu- |
| by The Vanguard Group, since January 2010; Director | nication and the Graduate School of Education |
| of The Vanguard Group since 2008; Chief Executive | of the University of Pennsylvania; Director of |
| Officer and President of The Vanguard Group and of | Carnegie Corporation of New York, Schuylkill River |
| each of the investment companies served by The | Development Corporation, and Greater Philadelphia |
| Vanguard Group since 2008; Director of Vanguard | Chamber of Commerce; Trustee of the National |
| Marketing Corporation; Managing Director of The | Constitution Center; Chair of the Presidential |
| Vanguard Group (1995–2008) . | Commission for the Study of Bioethical Issues. |
| |
| | JoAnn Heffernan Heisen |
| Independent Trustees | Born 1950. Trustee Since July 1998. Principal |
| | Occupation(s) During the Past Five Years: Corporate |
| Emerson U. Fullwood | Vice President and Chief Global Diversity Officer |
| Born 1948. Trustee Since January 2008. Principal | since 2006 (retired 2008) and Member of the |
| Occupation(s) During the Past Five Years: Executive | Executive Committee (retired 2008) of Johnson & |
| Chief Staff and Marketing Officer for North America | Johnson (pharmaceuticals/consumer products); Vice |
| and Corporate Vice President (retired 2008) of Xerox | President and Chief Information Officer of Johnson & |
| Corporation (document management products and | Johnson (1997–2005); Director of the University |
| services); Director of SPX Corporation (multi-industry | Medical Center at Princeton and Women’s Research |
| manufacturing), the United Way of Rochester, | and Education Institute; Member of the Advisory |
| Amerigroup Corporation (managed health care), | Board of the Maxwell School of Citizenship and Public |
| the University of Rochester Medical Center, and | Affairs at Syracuse University. |
| Monroe Community College Foundation. | |
| | F. Joseph Loughrey |
| Rajiv L. Gupta | Born 1949. Trustee Since October 2009. Principal |
| Born 1945. Trustee Since December 2001.2 | Occupation(s) During the Past Five Years: President |
| Principal Occupation(s) During the Past Five Years: | and Chief Operating Officer since 2005 (retired 2009) |
| Chairman and Chief Executive Officer (retired 2009) | and Vice Chairman of the Board (2008–2009) of |
| and President (2006–2008) of Rohm and Haas Co. | Cummins Inc. (industrial machinery); Director of |
| (chemicals); Director of Tyco International, Ltd. | SKF AB (industrial machinery), Hillenbrand, Inc. |
| (diversified manufacturing and services) and Hewlett- | (specialized consumer services), Sauer-Danfoss Inc. |
| Packard Co. (electronic computer manufacturing); | (machinery), the Lumina Foundation for Education, |
| Trustee of The Conference Board; Member of the | and Oxfam America; Chairman of the Advisory |
| Board of Managers of Delphi Automotive LLP | Council for the College of Arts and Letters at the |
| (automotive components) . | University of Notre Dame. |
| | |
| André F. Perold | Kathryn J. Hyatt | |
| Born 1952. Trustee Since December 2004. Principal | Born 1955. Treasurer Since November 2008. Principal |
| Occupation(s) During the Past Five Years: George | Occupation(s) During the Past Five Years: Principal |
| Gund Professor of Finance and Banking at the Harvard | of The Vanguard Group, Inc.; Treasurer of each of |
| Business School; Chair of the Investment Committee | the investment companies served by The Vanguard |
| of HighVista Strategies LLC (private investment firm) . | Group since 2008; Assistant Treasurer of each of the |
| | investment companies served by The Vanguard Group |
| Alfred M. Rankin, Jr. | (1988–2008) . | |
| Born 1941. Trustee Since January 1993. Principal | | |
| Occupation(s) During the Past Five Years: Chairman, | Heidi Stam | |
| President, and Chief Executive Officer of NACCO | Born 1956. Secretary Since July 2005. Principal |
| Industries, Inc. (forklift trucks/housewares/lignite); | Occupation(s) During the Past Five Years: Managing |
| Director of Goodrich Corporation (industrial products/ | Director of The Vanguard Group, Inc., since 2006; |
| aircraft systems and services); Chairman of the | General Counsel of The Vanguard Group since 2005; |
| Federal Reserve Bank of Cleveland; Trustee of The | Secretary of The Vanguard Group and of each of the |
| Cleveland Museum of Art. | investment companies served by The Vanguard Group |
| | since 2005; Director and Senior Vice President of |
| Peter F. Volanakis | Vanguard Marketing Corporation since 2005; |
| Born 1955. Trustee Since July 2009. Principal | Principal of The Vanguard Group (1997–2006). |
| Occupation(s) During the Past Five Years: President | | |
| since 2007 and Chief Operating Officer since 2005 | | |
| of Corning Incorporated (communications equipment); | Vanguard Senior Management Team |
| President of Corning Technologies (2001–2005); | | |
| Director of Corning Incorporated and Dow Corning; | R. Gregory Barton | Michael S. Miller |
| Trustee of the Corning Incorporated Foundation and | Mortimer J. Buckley | James M. Norris |
| the Corning Museum of Glass; Overseer of the | Kathleen C. Gubanich | Glenn W. Reed |
| Amos Tuck School of Business Administration at | Paul A. Heller | George U. Sauter |
| Dartmouth College. | | |
| |
| | Chairman Emeritus and Senior Advisor |
| Executive Officers | | |
| | John J. Brennan | |
| Glenn Booraem | Chairman, 1996–2009 | |
| Born 1967. Controller Since July 2010. Principal | Chief Executive Officer and President, 1996–2008 |
| Occupation(s) During the Past Five Years: Principal | | |
| of The Vanguard Group, Inc.; Controller of each of | | |
| the investment companies served by The Vanguard | Founder | |
| Group since 2010; Assistant Controller of each of | | |
| the investment companies served by The Vanguard | John C. Bogle | |
| Group (2001–2010) . | Chairman and Chief Executive Officer, 1974–1996 |
| |
| Thomas J. Higgins | | |
| Born 1957. Chief Financial Officer Since September | | |
| 2008. Principal Occupation(s) During the Past Five | | |
| Years: Principal of The Vanguard Group, Inc.; Chief | | |
| Financial Officer of each of the investment companies | | |
| served by The Vanguard Group since 2008; Treasurer | | |
| of each of the investment companies served by The | | |
| Vanguard Group (1998–2008) . | | |
1 Mr. McNabb is considered an “interested person,” as defined in the Investment Company Act of 1940, because he is an officer of the Vanguard funds.
2 December 2002 for Vanguard Equity Income Fund, Vanguard Growth Equity Fund, the Vanguard Municipal Bond Funds, and the Vanguard State Tax-Exempt Funds.
| |
| P.O. Box 2600 |
| Valley Forge, PA 19482-2600 |
| |
Connect with Vanguard® > vanguard.com | |
| |
| Fund Information > 800-662-7447 | The funds or securities referred to herein are not |
| Direct Investor Account Services > 800-662-2739 | sponsored, endorsed, or promoted by MSCI, and MSCI |
| Institutional Investor Services > 800-523-1036 | bears no liability with respect to any such funds or |
| Text Telephone for People | securities. For any such funds or securities, the |
| With Hearing Impairment > 800-749-7273 | prospectus or the Statement of Additional Information |
| contains a more detailed description of the limited |
| | relationship MSCI has with The Vanguard Group and |
| This material may be used in conjunction | any related funds. |
| with the offering of shares of any Vanguard | |
| fund only if preceded or accompanied by | |
| the fund’s current prospectus. | |
| |
| All comparative mutual fund data are from Lipper Inc. or | |
| Morningstar, Inc., unless otherwise noted. | |
| |
| You can obtain a free copy of Vanguard’s proxy voting | |
| guidelines by visiting vanguard.com/proxyreporting or by | |
| calling Vanguard at 800-662-2739. The guidelines are | |
| also available from the SEC’s website, sec.gov. In | |
| addition, you may obtain a free report on how your fund | |
| voted the proxies for securities it owned during the 12 | |
| months ended June 30. To get the report, visit either | |
| vanguard.com/proxyreporting or sec.gov. | |
| |
| You can review and copy information about your fund at | |
| the SEC’s Public Reference Room in Washington, D.C. To | |
| find out more about this public service, call the SEC at | |
| 202-551-8090. Information about your fund is also | |
| available on the SEC’s website, and you can receive | |
| copies of this information, for a fee, by sending a | |
| request in either of two ways: via e-mail addressed to | |
| publicinfo@sec.gov or via regular mail addressed to the | |
| Public Reference Section, Securities and Exchange | |
| Commission, Washington, DC 20549-1520. | |
| |
| |
| | © 2010 The Vanguard Group, Inc. |
| | All rights reserved. |
| | Vanguard Marketing Corporation, Distributor. |
| |
| | Q1130 122010 |
 |
| Vanguard Developed Markets |
| Index Fund Annual Report |
|
|
| October 31, 2010 |
|
 |
|
|
> Vanguard Developed Markets Index Fund returned about 10% for the fiscal year ended October 31, 2010.
> The fund’s return was in line with that of its target index, the MSCI EAFE Index (after adjustments for fair-value pricing), but lagged the average return for international funds.
> Despite some challenges, the fund’s returns reflected the global economy’s improvement—particularly in the top-performing materials, industrials, and consumer-oriented sectors.
| |
| Contents | |
| Your Fund’s Total Returns. | 1 |
| Chairman’s Letter. | 2 |
| Fund Profile. | 8 |
| Performance Summary. | 10 |
| Financial Statements. | 12 |
| Your Fund’s After-Tax Returns. | 37 |
| About Your Fund’s Expenses. | 38 |
| Glossary. | 40 |

Developed Markets Index Fund
Please note: The opinions expressed in this report are just that—informed opinions. They should not be considered promises or advice.
Also, please keep in mind that the information and opinions cover the period through the date on the front of this report. Of course, the
risks of investing in your fund are spelled out in the prospectus.
See the Glossary for definitions of investment terms used in this report.
Cover photograph: Jean Maher.
Your Fund’s Total Returns
| |
| Fiscal Year Ended October 31, 2010 | |
| | Total |
| | Returns |
| Vanguard Developed Markets Index Fund | |
| Investor Shares | 9.87% |
| Institutional Shares | 10.05 |
| MSCI EAFE Index | 8.36 |
| International Funds Average | 12.88 |
International Funds Average: Derived from data provided by Lipper Inc.
Institutional Shares are available to certain institutional investors who meet specific administrative, service, and account-size criteria.
| | | | |
| Your Fund’s Performance at a Glance | | | | |
| October 31, 2009, Through October 31, 2010 | | | | |
| | | | Distributions Per Share |
| | Starting | Ending | Income | Capital |
| | Share Price | Share Price | Dividends | Gains |
| Vanguard Developed Markets Index Fund | | | | |
| Investor Shares | $9.26 | $10.06 | $0.109 | $0.000 |
| Institutional Shares | 9.28 | 9.99 | 0.000 | 0.000 |
The inception date of the Institutional Shares is January 22, 2010. For the fiscal year ended October 31, 2010, the return for Institutional Shares shown in the Your Fund’s Total Returns table above reflects a blend of the historical performance of the fund’s Investor Shares prior to January 22, 2010, and of the Institutional Shares from then on. The starting share price for Institutional Shares in the Your Fund’s Performance at a Glance table above is from January 22, 2010.
1

Chairman’s Letter
Dear Shareholder,
Although global stock markets experienced significant volatility through the spring and summer as Europe’s sovereign debt crisis continued, international stocks rebounded in the final two months of the fiscal year and finished ahead for the period. In a reversal from fiscal-year 2009, however, their performance trailed that of the broad U.S. market.
Vanguard Developed Markets Index Fund returned about 10% for the fiscal year, behind the average return of about 13% for international peer funds. The fund’s benchmark index, the MSCI EAFE Index, returned about 8%, but the fund’s divergence from the benchmark result is explained largely by temporary price differences arising from fair-value pricing policies that are required by the Securities and Exchange Commission. Please see the text box that appears later in this letter for more on fair-value pricing.
If you own the fund in a taxable account, you may wish to review the table and discussion on after-tax returns for the fiscal year, based on the highest tax bracket, later in this report.
Also, please note that in October we announced plans to offer Institutional Plus Shares for the Developed Markets Index Fund. These shares, which require a minimum initial investment of $100 million, will be available at the end of November.
2
Stock market performance was better than it felt
Global stock prices rallied at the start of
the period but struggled through the spring and summer, weighed down by Europe’s sovereign debt crisis and the slow pace of economic recovery in the United States. In the fiscal year’s final months, the mood turned. Stock prices climbed on continued strength in corporate earnings. In the United States, stocks also seemed to get a boost from the Federal Reserve Board’s hints that it would try to stimulate the economy with a second round of U.S. Treasury bond purchases. (In early November, the Fed announced that it would buy as much as $600 billion in Treasuries.)
For the 12 months, the broad U.S. stock market returned about 19%, a performance that was better than it felt in a year of ups and downs. Small-capitalization stocks did even better. International stocks returned about 13% on the strength of a powerful rally in emerging markets and solid single-digit gains in developed markets in Europe and the Pacific region.
Despite shrinking yields, bonds attracted investor dollars
Although fixed income yields have fallen to
generational lows, investors continued to bid up bond prices. The broad U.S. bond market produced a 12-month return of about 8% as the yield of the 10-year U.S. Treasury note fell from 3.39% at the start of the period to 2.61% at the close.
| | | |
| Market Barometer | | | |
| |
| | | Average Annual Total Returns |
| | | Periods Ended October 31, 2010 |
| | One | Three | Five |
| | Year | Years | Years |
| Stocks | | | |
| Russell 1000 Index (Large-caps) | 17.67% | -6.14% | 1.99% |
| Russell 2000 Index (Small-caps) | 26.58 | -3.91 | 3.07 |
| Dow Jones U.S. Total Stock Market Index | 19.04 | -5.55 | 2.52 |
| MSCI All Country World Index ex USA (International) | 13.08 | -7.62 | 6.21 |
| |
| Bonds | | | |
| Barclays Capital U.S. Aggregate Bond Index (Broad | | | |
| taxable market) | 8.01% | 7.23% | 6.45% |
| Barclays Capital Municipal Bond Index (Broad | | | |
| tax-exempt market) | 7.78 | 5.79 | 5.20 |
| Citigroup Three-Month U.S. Treasury Bill Index | 0.12 | 0.89 | 2.41 |
| |
| CPI | | | |
| Consumer Price Index | 1.17% | 1.54% | 1.89% |
3
Tax-exempt municipal bonds also rallied. Bond prices and yields move in opposite directions, of course, so abundant returns built on rising prices could mean leaner pickings in the years ahead.
The yields of money market securities hovered near 0%, consistent with the Federal Reserve Board’s target for short-term rates.
Stocks overcome obstacles on path to positive returns
Vanguard Developed Markets Index Fund weathered a journey that was alternately stormy and sunny en route to ultimately positive results for the fiscal year. Returns were up and down as fear over the consequences of Greece’s debt problems spread to Spain, Portugal, Italy, and Ireland. Over the final two months, however, the fund advanced more than 14%.
The Developed Markets Index Fund invests about two-thirds of its assets in European stocks and about one-third in the Pacific region. Less than 1% of the fund is allocated to stocks from Israel, which made the switch to developed markets from emerging markets in May and is the lone representative from the Middle East. Pacific region stocks returned close to 9% for the fiscal year, while European stocks advanced more than 8%. During the period, the dollar appreciated against the euro and depreciated against the yen, which had the effect of lowering European returns and raising those from Japanese stocks for U.S.-based investors.
| | | |
| Expense Ratios | | | |
| Your Fund Compared With Its Peer Group | | | |
| | Investor | Institutional | Peer Group |
| | Shares | Shares | Average |
| Developed Markets Index Fund | 0.22% | 0.08% | 1.44% |
The fund expense ratios shown are from the prospectus dated February 26, 2010, and represent estimated costs for the current fiscal year.
For the fiscal year ended October 31, 2010, the Investor Shares’ expense ratio was 0.22%. The annualized expense ratio for the Institutional Shares from their inception on January 22, 2010, through October 31, 2010, was 0.07%. The peer-group expense ratio is derived from data provided by Lipper Inc. and captures information through year-end 2009.
Peer group: International Funds.
4
Stocks in the United Kingdom, Europe’s largest market, gained more than 12% and were responsible for a significant portion of the fund’s returns. Economic growth exceeded expectations in the U.K., where materials, consumer staples, and telecommunication services companies were top contributors.
Many of Europe’s best returns came from Scandinavian countries, which were farthest removed from the debt problems that plagued some of the economies to the south. Some of the region’s gains were offset by negative returns from Greek stocks––which lost nearly half their market value––as well as from equity markets in Spain, Italy, and Ireland.
The materials, industrials, and consumer-oriented sectors played prominent roles in Europe’s positive results. The only negative sector result came from financials (–5%), although the returns for energy and utilities were less than 1 percent. Of course, many financial stocks were directly affected by the debt crisis.
While the Pacific region finished the period less than 1 percentage point ahead of Europe, its road to returns was much different. In contrast to Europe, the region saw greater returns in the first half of the fiscal year than in the second. Japan, by far the largest Pacific developed market,
| |
| Total Returns | |
| Ten Years Ended October 31, 2010 | |
| | Average |
| | Annual Return |
| Developed Markets Index Fund Investor Shares | 3.17% |
| MSCI EAFE Index | 3.17 |
| International Funds Average | 2.63 |
International Funds Average: Derived from data provided by Lipper Inc.
The figures shown represent past performance, which is not a guarantee of future results. (Current performance may be lower or higher than the performance data cited. For performance data current to the most recent month-end, visit our website at vanguard.com/performance.) Note, too, that both investment returns and principal value can fluctuate widely, so an investor’s shares, when sold, could be worth more or less than their original cost.
5
|
| A note on fair-value pricing |
| The reported return of a fund that tracks an index sometimes may diverge from the index’s return a bit more than would be expected. This may be the result of a fair-value pricing adjustment. |
|
|
|
|
|
| |
| These adjustments, which are required by the Securities and Exchange Commission, address pricing discrepancies that may arise because of time-zone differences among global stock markets. Foreign stocks may trade on exchanges that close many hours before a fund’s closing share price is calculated in the United States, generally at 4 p.m., Eastern time. In the hours between the foreign close and the U.S. close, the value of these foreign securities may change—because of company-specific announcements or market-wide developments, for example. Such price changes are not immediately reflected in international index values. |
|
|
|
|
|
|
|
|
|
|
|
|
|
|
|
|
|
|
| |
| Fair-value pricing takes such changes into account in calculating the fund’s daily net asset value, thus ensuring that the NAV doesn’t include “stale” prices. The result can be a temporary divergence between the return of the fund and that of its benchmark index—a difference that usually corrects itself when the foreign markets reopen. |
|
|
|
|
|
|
|
|
|
returned about 5%. This result would have been lower if not for the rising yen, which reached a 15-year high against the U.S. dollar. Japan’s industrial stocks performed strongly, while its financial stocks were the greatest laggards.
Australia’s holdings contributed most to the Pacific region’s return, particularly its materials stocks, which rose as China’s demand for natural resources continued unabated. The Australian dollar, which reached a 30-year high against the U.S. dollar, also propped up results. Although Hong Kong and Singapore represent much smaller pieces of the Pacific market, their strong gains made a substantial contribution, especially in the financial sector.
The fund has a ten-year record of matching its benchmark
The Developed Markets Index Fund met its objective of tracking its benchmark index during the ten years ended October 31, 2010. Its average annual return of 3.17% during the decade also surpassed the average annual return of 2.63% recorded by its international funds peer group. As we noted previously, the fair-value pricing differences that can cause the fund to stray from its target index for short periods typically balance out over time.
Vanguard Quantitative Equity Group, the fund’s advisor, is responsible for the fund’s excellent tracking record. The advisor’s skill and experience are complemented by the fund’s exceptionally low expense ratio, which ensures that you keep more of the return.
6
International stocks have a place in a balanced plan
Investors in global equities have experienced a tumultuous trip over the past three years, from the plummeting returns of the financial crisis to the persistent recovery that’s now extended over 18 months from 2009’s bear-market lows. Of course, the recovery itself hasn’t been a completely smooth and straight upward climb. International stocks haven’t moved in tandem with U.S. stocks, and different countries and regions have also had divergent returns. A proven approach to this uncertainty, and the tendency for separate market segments to perform differently, is to create a diversified, well-balanced, long-term portfolio that matches your goals, risk tolerance, and time horizon.
Vanguard believes that international holdings can help diversify such a portfolio. With its low costs and long-term focus, the Developed Markets Index Fund can play an important role in providing you with exposure to developed international markets and helping you achieve diversification in your investment program.
Thank you for your confidence in Vanguard.

F. William McNabb III
Chairman and Chief Executive Officer
November 15, 2010
7
Developed Markets Index Fund
Fund Profile
As of October 31, 2010
| | |
| Share-Class Characteristics | |
| | Investor | Institutional |
| | Shares | Shares |
| Ticker Symbol | VDMIX | VIDMX |
| Expense Ratio1 | 0.22% | 0.08% |
| | | |
| Portfolio Characteristics | | |
| | | | MSCI AC |
| | | MSCI | World |
| | | EAFE | Index |
| | Fund | Index | ex USA |
| Number of Stocks | 981 | 965 | 1,811 |
| Median Market Cap | $36.1B | $36.1B | $29.9B |
| Price/Earnings Ratio | 16.1x | 16.1x | 16.2x |
| Price/Book Ratio | 1.5x | 1.5x | 1.7x |
| Return on Equity | 17.4% | 17.4% | 18.2% |
| Earnings Growth Rate | 0.6% | 0.6% | 4.4% |
| Dividend Yield | 3.0% | 3.0% | 2.8% |
| Turnover Rate | 13% | — | — |
| Short-Term Reserves | -0.3% | — | — |
| | | |
| Sector Diversification (% of equity exposure) |
| | | | MSCI AC |
| | | MSCI | World |
| | | EAFE | Index |
| | Fund | Index | ex USA |
| Consumer | | | |
| Discretionary | 10.4% | 10.4% | 9.1% |
| Consumer Staples | 10.2 | 10.2 | 8.9 |
| Energy | 7.5 | 7.5 | 10.4 |
| Financials | 24.6 | 24.6 | 25.6 |
| Health Care | 8.4 | 8.4 | 6.0 |
| Industrials | 12.2 | 12.2 | 10.5 |
| Information | | | |
| Technology | 4.7 | 4.7 | 6.3 |
| Materials | 10.7 | 10.7 | 12.4 |
| Telecommunication | | | |
| Services | 5.9 | 5.9 | 6.2 |
| Utilities | 5.4 | 5.4 | 4.6 |
| | |
| Volatility Measures | | |
| | MSCI | MSCI AC |
| | EAFE | World Index |
| | Index | ex USA |
| R-Squared | 0.98 | 0.97 |
| Beta | 1.03 | 0.97 |
These measures show the degree and timing of the fund’s fluctuations compared with the indexes over 36 months.
| | |
| Ten Largest Holdings (% of total net assets) |
| BHP Billiton | Diversified Metals | |
| | & Mining | 2.0% |
| Royal Dutch Shell plc | Integrated Oil & | |
| | Gas | 1.9 |
| Nestle SA | Packaged Foods & | |
| | Meats | 1.8 |
| HSBC Holdings plc | Diversified Banks | 1.7 |
| Vodafone Group plc | Wireless | |
| | Telecommunication | |
| | Services | 1.3 |
| Rio Tinto | Diversified Metals | |
| | & Mining | 1.2 |
| BP plc | Integrated Oil & | |
| | Gas | 1.2 |
| Novartis AG | Pharmaceuticals | 1.1 |
| Total SA | Integrated Oil & | |
| | Gas | 1.1 |
| Telefonica SA | Integrated | |
| | Telecommunication | |
| | Services | 1.0 |
| Top Ten | | 14.3% |
The holdings listed exclude any temporary cash investments and equity index products.
Allocation by Region (% of equity exposure)
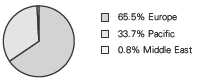
1 The expense ratios shown are from the prospectus dated February 26, 2010, and represent estimated costs for the current fiscal year. For the fiscal year ended October 31, 2010, the Investor Shares’ expense ratio was 0.22%. The annualized expense ratio for the Institutional Shares from their inception on January 22, 2010, through October 31, 2010, was 0.07%.
8
Developed Markets Index Fund
| | | |
| Market Diversification (% of equity exposure) |
| | | | MSCI AC |
| | | MSCI | World |
| | | EAFE | Index |
| | Fund | Index ex USA |
| Europe | | | |
| United Kingdom | 21.8% | 21.7% | 14.9% |
| France | 10.3 | 10.3 | 7.1 |
| Germany | 8.3 | 8.3 | 5.7 |
| Switzerland | 7.7 | 7.7 | 5.3 |
| Spain | 3.8 | 3.8 | 2.6 |
| Sweden | 3.1 | 3.1 | 2.1 |
| Italy | 2.9 | 2.9 | 2.0 |
| Netherlands | 2.6 | 2.6 | 1.8 |
| Finland | 1.1 | 1.1 | 0.8 |
| Denmark | 1.0 | 1.0 | 0.7 |
| Belgium | 1.0 | 1.0 | 0.7 |
| Other | 1.9 | 2.0 | 1.4 |
| Subtotal | 65.5% | 65.5% | 45.1% |
| Pacific | | | |
| Japan | 20.8% | 20.8% | 14.3% |
| Australia | 8.5 | 8.5 | 5.9 |
| Hong Kong | 2.6 | 2.6 | 1.8 |
| Singapore | 1.7 | 1.7 | 1.2 |
| Other | 0.1 | 0.1 | 0.1 |
| Subtotal | 33.7% | 33.7% | 23.3% |
| Middle East | 0.8% | 0.8% | 0.5% |
| Emerging Markets | | | |
| Other | 0.0% | 0.0% | 23.5% |
| North America | 0.0% | 0.0% | 7.6% |
9
Developed Markets Index Fund
Performance Summary
All of the returns in this report represent past performance, which is not a guarantee of future results that may be achieved by the fund. (Current performance may be lower or higher than the performance data cited. For performance data current to the most recent month-end, visit our website at vanguard.com/performance.) Note, too, that both investment returns and principal value can fluctuate widely, so an investor’s shares, when sold, could be worth more or less than their original cost. The returns shown do not reflect taxes that a shareholder would pay on fund distributions or on the sale of fund shares.
Cumulative Performance: October 31, 2000, Through October 31, 2010
Initial Investment of $10,000
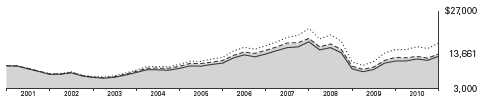
| | | | | |
| | | Average Annual Total Returns | |
| | | Periods Ended October 31, 2010 | |
| | | | | | Final Value |
| | | One | Five | Ten | of a $10,000 |
| | | Year | Years | Years | Investment |
| | Developed Markets Index Fund | | | | |
| | Investor Shares | 9.87% | 3.42% | 3.17% | $13,661 |
| •••••••• | MSCI All Country World Index ex USA | 13.08 | 6.21 | 5.46 | 17,012 |
| – – – – | MSCI EAFE Index | 8.36 | 3.31 | 3.17 | 13,666 |
| | International Funds Average | 12.88 | 3.69 | 2.63 | 12,966 |
| International Funds Average: Derived from data provided by Lipper Inc. | | | |
| | | | |
| | | | | Final Value |
| | One | Five | Ten | of a $5,000,000 |
| | Year | Years | Years | Investment |
| Developed Markets Index Fund | | | | |
| Institutional Shares | 10.05% | 3.45% | 3.19% | $6,841,326 |
| MSCI All Country World Index ex | | | | |
| USA | 13.08 | 6.21 | 5.46 | 8,506,155 |
| MSCI EAFE Index | 8.36 | 3.31 | 3.17 | 6,833,108 |
The inception date of the Institutional Shares is January 22, 2010; the returns and other data shown in the table above reflect a blend of the historical performance of the fund’s Investor Shares prior to January 22, 2010, and of the Institutional Shares from then on.
Vanguard fund returns do not reflect the 2% fee on redemptions of shares held for less than two months.
See Financial Highlights for dividend and capital gains information.
10
Developed Markets Index Fund
Fiscal-Year Total Returns (%): October 31, 2000, Through October 31, 2010

Average Annual Total Returns: Periods Ended September 30, 2010
This table presents average annual total returns through the latest calendar quarter—rather than through the end of the fiscal period. Securities and Exchange Commission rules require that we provide this information.
| | | | |
| | Inception | One | Five | Ten |
| | Date | Year | Years | Years |
| Investor Shares | 5/8/2000 | 3.38% | 2.03% | 2.53% |
| Institutional Shares | 5/8/2000 | 3.51 | 2.05 | 2.54 |
The inception date of the Institutional Shares is January 22, 2010; the returns for the Institutional Shares shown in the table above reflect a blend of the historical performance of the fund’s Investor Shares prior to January 22, 2010, and of the Institutional Shares from then on. The inception date shown in the table is that of the fund’s Investor Shares.
Vanguard fund returns do not reflect the 2% fee on redemptions of shares held for less than two months.
11
Developed Markets Index Fund
Financial Statements
Statement of Net Assets
As of October 31, 2010
The fund reports a complete list of its holdings in regulatory filings four times in each fiscal year, at the quarter-ends. For the second and fourth fiscal quarters, the lists appear in the fund’s semiannual and annual reports to shareholders. For the first and third fiscal quarters, the fund files the lists with the Securities and Exchange Commission on Form N-Q. Shareholders can look up the fund’s Forms N-Q on the SEC’s website at sec.gov. Forms N-Q may also be reviewed and copied at the SEC’s Public Reference Room (see the back cover of this report for further information).
| | |
| | | Market |
| | | Value |
| | Shares | ($000) |
| Common Stocks (99.6%)1 | | |
| Australia (8.5%) | | |
| BHP Billiton Ltd. | 3,160,355 | 130,591 |
| Commonwealth | | |
| Bank of Australia | 1,458,415 | 70,111 |
| Westpac Banking Corp. | 2,803,629 | 62,429 |
| Australia & New Zealand | | |
| Banking Group Ltd. | 2,385,789 | 58,206 |
| National Australia | | |
| Bank Ltd. | 1,997,377 | 49,991 |
| Rio Tinto Ltd. | 410,356 | 33,396 |
| Woolworths Ltd. | 1,168,355 | 32,435 |
| Wesfarmers Ltd. | 946,563 | 30,798 |
| Newcrest Mining Ltd. | 691,224 | 27,202 |
| Westfield Group | 2,064,593 | 25,111 |
| Woodside Petroleum Ltd. | 512,263 | 21,906 |
| CSL Ltd. | 541,425 | 17,461 |
| QBE Insurance Group Ltd. | 973,781 | 16,380 |
| Origin Energy Ltd. | 830,431 | 13,001 |
| Macquarie Group Ltd. | 324,646 | 11,543 |
| Suncorp-Metway Ltd. | 1,207,200 | 10,898 |
| Telstra Corp. Ltd. | 4,103,044 | 10,752 |
| Foster’s Group Ltd. | 1,818,715 | 10,428 |
| AMP Ltd. | 1,951,556 | 10,221 |
| Santos Ltd. | 784,813 | 9,704 |
| Orica Ltd. | 339,818 | 8,397 |
| Brambles Ltd. | 1,337,859 | 8,367 |
| Stockland | 2,242,536 | 8,305 |
| Amcor Ltd. | 1,148,025 | 7,565 |
| Insurance Australia | | |
| Group Ltd. | 1,954,058 | 7,308 |
| * Fortescue Metals | | |
| Group Ltd. | 1,168,158 | 7,183 |
| AGL Energy Ltd. | 422,969 | 6,678 |
| Coca-Cola Amatil Ltd. | 531,429 | 6,334 |
| Transurban Group | 1,195,681 | 6,117 |
| ASX Ltd. | 163,107 | 5,943 |
| Incitec Pivot Ltd. | 1,526,238 | 5,589 |
| | | |
| | | | Market |
| | | | Value |
| | | Shares | ($000) |
| | AXA Asia Pacific | | |
| | Holdings Ltd. | 970,106 | 5,166 |
| | TABCORP Holdings Ltd. | 646,613 | 4,678 |
| | Wesfarmers Ltd. Price | | |
| | Protected Shares | 142,605 | 4,671 |
| ^ | Leighton Holdings Ltd. | 128,036 | 4,607 |
| | Alumina Ltd. | 2,289,947 | 4,576 |
| | GPT Group | 1,655,123 | 4,534 |
| | OZ Minerals Ltd. | 2,925,477 | 4,512 |
| * | Asciano Group | 2,747,395 | 4,221 |
| | Computershare Ltd. | 420,807 | 4,178 |
| | WorleyParsons Ltd. | 181,296 | 4,086 |
| | Mirvac Group | 3,090,622 | 3,933 |
| | Toll Holdings Ltd. | 631,062 | 3,839 |
| | Goodman Group | 6,021,086 | 3,724 |
| | Sonic Healthcare Ltd. | 345,595 | 3,687 |
| | Cochlear Ltd. | 52,921 | 3,687 |
| | Dexus Property Group | 4,524,841 | 3,685 |
| | CFS Retail Property Trust | 2,001,701 | 3,645 |
| | Lend Lease Group | 508,972 | 3,593 |
| | Crown Ltd. | 428,572 | 3,510 |
| | BlueScope Steel Ltd. | 1,728,254 | 3,396 |
| | OneSteel Ltd. | 1,256,035 | 3,334 |
| | Intoll Group | 2,138,828 | 3,151 |
| | Metcash Ltd. | 723,263 | 3,096 |
| | Bendigo and Adelaide | | |
| | Bank Ltd. | 341,025 | 3,028 |
| | Boral Ltd. | 682,520 | 2,939 |
| | Tatts Group Ltd. | 1,199,743 | 2,938 |
| * | Qantas Airways Ltd. | 1,048,114 | 2,926 |
| ^ | Fairfax Media Ltd. | 1,998,222 | 2,839 |
| * | Paladin Energy Ltd. | 639,047 | 2,580 |
| | CSR Ltd. | 1,419,593 | 2,537 |
| | Sims Metal | | |
| | Management Ltd. | 153,903 | 2,472 |
| * | James Hardie Industries SE | 413,484 | 2,191 |
| | MacArthur Coal Ltd. | 166,900 | 1,968 |
| | Goodman Fielder Ltd. | 1,314,911 | 1,912 |
| | Harvey Norman | | |
| | Holdings Ltd. | 503,752 | 1,644 |
12
Developed Markets Index Fund
| | | |
| | | | Market |
| | | | Value |
| | | Shares | ($000) |
| | Billabong International Ltd. | 194,016 | 1,546 |
| | Caltex Australia Ltd. | 125,851 | 1,434 |
| | Aristocrat Leisure Ltd. | 372,735 | 1,284 |
| | SP AusNet | 1,253,751 | 1,140 |
| | Newcrest | | |
| | Mining Ltd. ADR | 28,700 | 1,131 |
| | MAp Group | 357,017 | 1,067 |
| | Energy Resources of | | |
| | Australia Ltd. | 63,440 | 812 |
| | | | 860,247 |
| Austria (0.3%) | | |
| | Erste Group Bank AG | 177,737 | 8,030 |
| | OMV AG | 140,758 | 5,265 |
| | Telekom Austria AG | 311,839 | 4,776 |
| | Voestalpine AG | 103,982 | 4,129 |
| * | IMMOFINANZ AG | 939,726 | 3,706 |
| ^ | Raiffeisen Bank | | |
| | International AG | 50,981 | 2,879 |
| ^ | Verbund AG | 71,297 | 2,852 |
| | Vienna Insurance Group | | |
| | AG Wiener | | |
| | Versicherung Gruppe | 36,270 | 1,950 |
| | | | 33,587 |
| Belgium (1.0%) | | |
| | Anheuser-Busch InBev NV | 679,726 | 42,689 |
| | Groupe Bruxelles | | |
| | Lambert SA | 75,790 | 6,714 |
| | Delhaize Group SA | 94,983 | 6,639 |
| * | KBC Groep NV | 151,327 | 6,590 |
| | Ageas | 2,114,324 | 6,510 |
| | Solvay SA Class A | 56,112 | 5,946 |
| | Belgacom SA | 144,024 | 5,656 |
| | Umicore | 107,058 | 5,045 |
| | Colruyt SA | 70,708 | 3,991 |
| | UCB SA | 95,236 | 3,694 |
| * | Dexia SA | 520,697 | 2,320 |
| | Mobistar SA | 25,806 | 1,708 |
| | Cie Nationale a Portefeuille | 25,231 | 1,350 |
| | | | 98,852 |
| Denmark (1.0%) | | |
| | Novo Nordisk A/S Class B | 410,238 | 43,076 |
| * | Danske Bank A/S | 427,986 | 11,369 |
| | Carlsberg A/S Class B | 100,790 | 11,019 |
| | AP Moller - Maersk A/S | | |
| | Class B | 1,244 | 10,795 |
| * | Vestas Wind Systems A/S | 191,463 | 6,103 |
| | Novozymes A/S | 43,305 | 5,770 |
| | AP Moller - Maersk A/S | 520 | 4,371 |
| | DSV A/S | 195,970 | 4,018 |
| | Coloplast A/S Class B | 21,416 | 2,652 |
| * | William Demant Holding A/S | 22,043 | 1,652 |
| | Tryg A/S | 24,525 | 1,236 |
| | | | 102,061 |
| | | |
| | | | Market |
| | | | Value |
| | | Shares | ($000) |
| Finland (1.1%) | | |
| | Nokia Oyj | 3,526,614 | 37,874 |
| | Fortum Oyj | 418,632 | 11,873 |
| | Sampo Oyj | 395,842 | 11,085 |
| | UPM-Kymmene Oyj | 489,330 | 8,130 |
| | Kone Oyj Class B | 146,455 | 7,847 |
| | Metso Oyj | 120,048 | 5,692 |
| | Stora Enso Oyj | 550,994 | 5,475 |
| | Wartsila Oyj | 74,119 | 5,198 |
| | Nokian Renkaat Oyj | 101,428 | 3,516 |
| | Kesko Oyj Class B | 63,100 | 3,131 |
| | Elisa Oyj | 125,831 | 2,691 |
| | Outokumpu Oyj | 121,894 | 2,190 |
| | Neste Oil Oyj | 119,480 | 1,982 |
| | Orion Oyj Class B | 86,652 | 1,843 |
| | Sanoma Oyj | 75,465 | 1,703 |
| | Pohjola Bank plc | 130,486 | 1,651 |
| | Rautaruukki Oyj | 80,587 | 1,601 |
| | | | 113,482 |
| France (10.2%) | | |
| | Total SA | 1,990,321 | 108,342 |
| | Sanofi-Aventis SA | 987,451 | 69,183 |
| | BNP Paribas | 892,482 | 65,281 |
| ^ | GDF Suez | 1,171,007 | 46,790 |
| | France Telecom SA | 1,745,973 | 41,892 |
| | LVMH Moet Hennessy | | |
| | Louis Vuitton SA | 230,568 | 36,174 |
| | Societe Generale | 592,175 | 35,510 |
| | Danone | 549,135 | 34,818 |
| | Air Liquide SA | 266,358 | 34,487 |
| | Vivendi SA | 1,157,679 | 33,081 |
| | Schneider Electric SA | 226,376 | 32,164 |
| | Carrefour SA | 564,240 | 30,550 |
| | AXA SA | 1,617,373 | 29,496 |
| | L’Oreal SA | 225,717 | 26,514 |
| | ArcelorMittal | 808,460 | 26,161 |
| | Vinci SA | 410,454 | 22,009 |
| | Unibail-Rodamco SE | 85,890 | 17,921 |
| | Cie de St-Gobain | 361,994 | 17,007 |
| | Pernod-Ricard SA | 186,216 | 16,552 |
| | Credit Agricole SA | 875,067 | 14,352 |
| ^ | Cie Generale des | | |
| | Etablissements Michelin | | |
| | Class B | 164,301 | 13,128 |
| | Cie Generale d’Optique | | |
| | Essilor International SA | 189,460 | 12,662 |
| | PPR | 71,584 | 11,774 |
| | EDF SA | 243,826 | 11,186 |
| | Lafarge SA | 188,931 | 10,804 |
| | Vallourec SA | 102,553 | 10,663 |
| | Hermes International | 49,763 | 10,570 |
| * | European Aeronautic | | |
| | Defence and Space | | |
| | Co. NV | 384,183 | 10,106 |
| * | Renault SA | 181,017 | 10,106 |
13
Developed Markets Index Fund
| | | |
| | | | Market |
| | | | Value |
| | | Shares | ($000) |
| | Alstom SA | 193,688 | 9,782 |
| | Bouygues SA | 217,299 | 9,611 |
| | Veolia Environnement | 325,240 | 9,564 |
| | Christian Dior SA | 59,855 | 8,662 |
| | Technip SA | 92,560 | 7,798 |
| * | Alcatel-Lucent | 2,180,263 | 7,665 |
| | SES SA | 281,613 | 7,232 |
| | Cap Gemini SA | 138,304 | 7,060 |
| | Publicis Groupe SA | 116,000 | 5,779 |
| | Sodexo | 88,489 | 5,759 |
| | Accor SA | 139,925 | 5,742 |
| * | Peugeot SA | 143,016 | 5,721 |
| | STMicroelectronics NV | 598,529 | 5,249 |
| * | Natixis | 819,382 | 5,033 |
| | Safran SA | 156,672 | 4,970 |
| | Suez Environnement Co. | 252,986 | 4,950 |
| | Casino Guichard | | |
| | Perrachon SA | 51,801 | 4,873 |
| | Legrand SA | 123,600 | 4,773 |
| | Lagardere SCA | 110,803 | 4,734 |
| | Groupe Eurotunnel SA | 452,271 | 4,499 |
| | Dassault Systemes SA | 55,803 | 4,284 |
| | SCOR SE | 157,630 | 3,876 |
| | Eutelsat Communications | 93,961 | 3,536 |
| | Klepierre | 89,730 | 3,493 |
| | Thales SA | 84,526 | 3,449 |
| | Bureau Veritas SA | 46,257 | 3,419 |
| * | Cie Generale de | | |
| | Geophysique-Veritas | 135,652 | 3,169 |
| * | Edenred | 138,409 | 2,899 |
| | CNP Assurances | 139,971 | 2,797 |
| | Fonciere Des Regions | 22,777 | 2,604 |
| | Neopost SA | 29,196 | 2,425 |
| | ICADE | 21,884 | 2,405 |
| | Aeroports de Paris | 27,935 | 2,374 |
| * | Air France-KLM | 126,846 | 2,316 |
| | Societe BIC SA | 25,159 | 2,233 |
| | Gecina SA | 17,691 | 2,148 |
| | Imerys SA | 35,955 | 2,148 |
| | Eurazeo | 27,343 | 2,079 |
| * | Atos Origin SA | 42,387 | 1,962 |
| | Eiffage SA | 38,130 | 1,885 |
| * | JCDecaux SA | 62,353 | 1,831 |
| | Societe Television | | |
| | Francaise 1 | 109,636 | 1,797 |
| | Eramet | 5,045 | 1,751 |
| | Iliad SA | 15,531 | 1,750 |
| | Metropole Television SA | 60,242 | 1,475 |
| | PagesJaunes Groupe | 117,545 | 1,296 |
| | BioMerieux | 11,295 | 1,089 |
| | Ipsen SA | 28,068 | 989 |
| | | | 1,036,218 |
| Germany (8.2%) | | |
| | Siemens AG | 774,803 | 88,417 |
| | BASF SE | 864,922 | 62,890 |
| | Bayer AG | 778,729 | 58,083 |
| | | | |
| | | | | Market |
| | | | | Value |
| | | | Shares | ($000) |
| | Allianz SE | | 427,435 | 53,527 |
| | E.ON AG | 1,695,892 | 53,082 |
| * | Daimler AG | | 768,136 | 50,585 |
| | Deutsche Bank AG | | 876,988 | 50,520 |
| | SAP AG | | 808,190 | 42,106 |
| | Deutsche Telekom AG | 2,669,581 | 38,673 |
| | RWE AG | | 394,317 | 28,257 |
| | Muenchener | | | |
| | Rueckversicherungs AG | 177,484 | 27,741 |
| | Volkswagen AG Prior Pfd. | 160,211 | 24,023 |
| | Linde AG | | 159,047 | 22,883 |
| | Bayerische Motoren | | | |
| | Werke AG | | 311,734 | 22,343 |
| | Deutsche Post AG | | 796,020 | 14,838 |
| | Deutsche Boerse AG | | 183,858 | 12,934 |
| | Adidas AG | | 197,259 | 12,848 |
| | ThyssenKrupp AG | | 315,178 | 11,596 |
| | Fresenius Medical Care | | |
| | AG & Co. KGaA | | 181,161 | 11,530 |
| | MAN SE | | 99,632 | 10,944 |
| | Henkel AG & Co. | | | |
| | KGaA Prior Pfd. | | 167,767 | 9,892 |
| | K&S AG | | 135,094 | 9,398 |
| | Metro AG | | 121,984 | 8,548 |
| * | Infineon Technologies AG 1,022,171 | 8,042 |
| | HeidelbergCement AG | 132,128 | 6,899 |
| | Fresenius SE Prior Pfd. | 76,274 | 6,836 |
| | Beiersdorf AG | | 94,668 | 6,166 |
| | Henkel AG & Co. KGaA | 122,014 | 6,047 |
| * | Commerzbank AG | | 665,662 | 5,995 |
| * | Daimler AG | | 81,276 | 5,363 |
| | Merck KGaA | | 60,659 | 5,050 |
| * | Deutsche Lufthansa AG | 214,891 | 4,594 |
| | Porsche Automobil | | | |
| | Holding SE Prior Pfd. | 82,312 | 4,213 |
| * | QIAGEN NV | | 219,905 | 4,167 |
| * | Continental AG | | 47,316 | 4,108 |
| | GEA Group AG | | 156,841 | 4,100 |
| | Hochtief AG | | 42,879 | 3,718 |
| | Volkswagen AG | | 27,841 | 3,650 |
| | Wacker Chemie AG | | 14,767 | 3,045 |
| | Hannover | | | |
| | Rueckversicherung AG | 56,853 | 2,876 |
| * | Deutsche Postbank AG | 82,540 | 2,871 |
| | Salzgitter AG | | 39,560 | 2,838 |
| | RWE AG Prior Pfd. | | 36,696 | 2,485 |
| | Bayerische Motoren Werke | | |
| | AG Prior Pfd. | | 49,259 | 2,398 |
| | Fresenius SE | | 26,536 | 2,340 |
| | Fraport AG Frankfurt Airport | |
| | Services Worldwide | | 34,539 | 2,191 |
| | United Internet AG | | 111,839 | 2,003 |
| | Celesio AG | | 72,987 | 1,740 |
| | Puma AG Rudolf | | | |
| | Dassler Sport | | 4,967 | 1,649 |
14
Developed Markets Index Fund
| | | |
| | | | Market |
| | | | Value |
| | | Shares | ($000) |
| * | TUI AG | 129,927 | 1,515 |
| | Suedzucker AG | 61,684 | 1,456 |
| | | | 834,013 |
| Greece (0.3%) | | |
| | National Bank of | | |
| | Greece SA | 902,248 | 9,903 |
| | Coca Cola Hellenic | | |
| | Bottling Co. SA | 171,645 | 4,434 |
| | OPAP SA | 211,304 | 3,981 |
| | Bank of Cyprus | | |
| | Public Co. Ltd. | 798,954 | 3,723 |
| * | Alpha Bank AE | 479,382 | 3,167 |
| * | EFG Eurobank Ergasias SA | 302,400 | 1,866 |
| | Public Power Corp. SA | 108,476 | 1,815 |
| * | Piraeus Bank SA | 314,184 | 1,632 |
| | Hellenic Telecommunications | |
| | Organization SA | 193,887 | 1,549 |
| | Hellenic Telecommunications | |
| | Organization SA ADR | 71,648 | 287 |
| | | | 32,357 |
| Hong Kong (2.6%) | | |
| | Sun Hung Kai | | |
| | Properties Ltd. | 1,330,553 | 22,888 |
| | Hong Kong Exchanges | | |
| | and Clearing Ltd. | 964,254 | 21,285 |
| | Cheung Kong | | |
| | Holdings Ltd. | 1,307,978 | 19,978 |
| | Hutchison Whampoa Ltd. | 2,004,491 | 19,797 |
| | CLP Holdings Ltd. | 1,810,658 | 14,720 |
| | Li & Fung Ltd. | 2,146,769 | 11,367 |
| | BOC Hong Kong | | |
| | Holdings Ltd. | 3,487,308 | 10,968 |
| | Hang Seng Bank Ltd. | 720,597 | 10,559 |
| | Swire Pacific Ltd. Class A | 722,773 | 10,288 |
| | Hong Kong & China | | |
| | Gas Co. Ltd. | 4,059,356 | 9,803 |
| | Hang Lung Properties Ltd. 1,959,478 | 9,612 |
| | Wharf Holdings Ltd. | 1,297,111 | 8,540 |
| | Hongkong Electric | | |
| | Holdings Ltd. | 1,305,385 | 8,299 |
| | Henderson Land | | |
| | Development Co. Ltd. | 1,018,559 | 7,260 |
| | Link REIT | 2,068,524 | 6,384 |
| | Bank of East Asia Ltd. | 1,430,978 | 6,135 |
| | Esprit Holdings Ltd. | 1,088,694 | 5,876 |
| | MTR Corp. | 1,345,597 | 5,135 |
| | Hang Lung Group Ltd. | 754,819 | 5,019 |
| * | Sands China Ltd. | 2,261,600 | 4,932 |
| | New World | | |
| | Development Ltd. | 2,389,601 | 4,736 |
| | Kerry Properties Ltd. | 669,273 | 3,718 |
| | Sino Land Co. Ltd. | 1,606,286 | 3,368 |
| * | Wynn Macau Ltd. | 1,461,600 | 3,236 |
| | Wheelock & Co. Ltd. | 863,353 | 3,032 |
| | Cathay Pacific | | |
| | Airways Ltd. | 1,101,280 | 2,967 |
| | | |
| | | | Market |
| | | | Value |
| | | Shares | ($000) |
| | Shangri-La Asia Ltd. | 1,214,983 | 2,739 |
| | Yue Yuen Industrial | | |
| | Holdings Ltd. | 695,683 | 2,495 |
| * | AIA Group Ltd. | 771,000 | 2,293 |
| | Hysan Development | | |
| | Co. Ltd. | 584,624 | 2,264 |
| | Wing Hang Bank Ltd. | 166,616 | 1,952 |
| | NWS Holdings Ltd. | 780,985 | 1,845 |
| | Orient Overseas | | |
| | International Ltd. | 203,659 | 1,790 |
| | Cheung Kong Infrastructure | |
| | Holdings Ltd. | 420,746 | 1,759 |
| | Hopewell Holdings Ltd. | 536,977 | 1,692 |
| | ASM Pacific | | |
| | Technology Ltd. | 182,859 | 1,653 |
| *,^ | Foxconn International | | |
| | Holdings Ltd. | 1,983,422 | 1,465 |
| | Television Broadcasts Ltd. | 265,375 | 1,419 |
| | PCCW Ltd. | 3,676,347 | 1,407 |
| | Lifestyle International | | |
| | Holdings Ltd. | 542,956 | 1,264 |
| * | Mongolia Energy Co. Ltd. | 2,808,781 | 1,079 |
| * | Henderson Land | | |
| | Development Co. Ltd. | | |
| | Warrants Exp. 06/01/2011 | 200,711 | 78 |
| | | | 267,096 |
| Ireland (0.3%) | | |
| | CRH plc | 666,885 | 11,519 |
| | Kerry Group plc Class A | 131,600 | 4,843 |
| * | Elan Corp. plc | 465,736 | 2,585 |
| * | Governor & Co. of the | | |
| | Bank of Ireland | 3,209,799 | 2,397 |
| | Ryanair Holdings | | |
| | plc ADR | 56,721 | 1,851 |
| | WPP plc ADR | 19,480 | 1,131 |
| | Ryanair Holdings plc | 70,448 | 406 |
| | | | 24,732 |
| Israel (0.8%) | | |
| | Teva Pharmaceutical | | |
| | Industries Ltd. | 877,946 | 45,531 |
| | Israel Chemicals Ltd. | 416,276 | 6,353 |
| * | Bank Leumi Le-Israel BM | 1,106,495 | 5,092 |
| | Bezeq Israeli | | |
| | Telecommunication | | |
| | Corp. Ltd. | 1,645,702 | 4,327 |
| * | Bank Hapoalim BM | 930,096 | 4,215 |
| * | Israel Corp. Ltd. | 2,165 | 2,322 |
| * | NICE Systems Ltd. | 58,800 | 1,941 |
| | Partner Communications | | |
| | Co. Ltd. | 81,251 | 1,650 |
| | Cellcom Israel Ltd. | | |
| | (Registered) | 47,323 | 1,590 |
| | Elbit Systems Ltd. | 22,131 | 1,175 |
| | Mizrahi Tefahot Bank Ltd. | 116,860 | 1,091 |
| | Makhteshim-Agan | | |
| | Industries Ltd. | 213,552 | 1,078 |
15
Developed Markets Index Fund
| | | |
| | | | Market |
| | | | Value |
| | | Shares | ($000) |
| | Delek Group Ltd. | 3,792 | 1,058 |
| * | Israel Discount Bank Ltd. | | |
| | Class A | 514,525 | 1,044 |
| | Discount Investment Corp. | 24,376 | 559 |
| | Ormat Industries | 56,604 | 449 |
| | | | 79,475 |
| Italy (2.9%) | | |
| | ENI SPA | 2,451,675 | 55,205 |
| | Enel SPA | 6,198,599 | 35,407 |
| | UniCredit SPA | 12,704,807 | 33,122 |
| | Intesa Sanpaolo SPA | | |
| | (Registered) | 7,253,105 | 25,510 |
| | Assicurazioni | | |
| | Generali SPA | 1,099,560 | 24,102 |
| | Telecom Italia SPA | | |
| | (Registered) | 8,831,339 | 13,554 |
| | Fiat SPA | 720,618 | 12,203 |
| | Saipem SPA | 249,463 | 11,083 |
| | Tenaris SA | 444,540 | 9,217 |
| | Snam Rete Gas SPA | 1,351,769 | 7,329 |
| | Telecom Italia SPA | | |
| | (Bearer) | 5,703,143 | 6,998 |
| | Unione di Banche | | |
| | Italiane SCPA | 574,953 | 6,071 |
| | Terna Rete Elettrica | | |
| | Nazionale SPA | 1,234,057 | 5,695 |
| | Finmeccanica SPA | 380,268 | 5,314 |
| | Atlantia SPA | 225,555 | 5,156 |
| | Mediaset SPA | 672,376 | 4,964 |
| * | Mediobanca SPA | 444,606 | 4,609 |
| | Parmalat SPA | 1,621,972 | 4,459 |
| | Prysmian SPA | 170,715 | 3,309 |
| | Banco Popolare SC | 606,651 | 3,260 |
| | Luxottica Group SPA | 109,255 | 3,227 |
| * | Banca Monte dei Paschi | | |
| | di Siena SPA | 2,089,205 | 2,941 |
| | Intesa Sanpaolo SPA | | |
| | (Bearer) | 876,594 | 2,402 |
| | Pirelli & C SPA | 209,816 | 1,793 |
| | Banca Popolare | | |
| | di Milano Scarl | 368,525 | 1,723 |
| | A2A SPA | 1,023,196 | 1,668 |
| | Exor SPA | 61,187 | 1,573 |
| * | Autogrill SPA | 109,161 | 1,456 |
| | Banca Carige SPA | 539,715 | 1,307 |
| ^ | Mediolanum SPA | 202,683 | 953 |
| | | | 295,610 |
| Japan (20.7%) | | |
| | Toyota Motor Corp. | 2,597,593 | 92,007 |
| | Honda Motor Co. Ltd. | 1,555,192 | 56,063 |
| | Mitsubishi UFJ Financial | | |
| | Group Inc. | 11,991,436 | 55,652 |
| | Canon Inc. | 1,067,735 | 49,151 |
| | Sumitomo Mitsui | | |
| | Financial Group Inc. | 1,264,552 | 37,744 |
| | |
| | | Market |
| | | Value |
| | Shares | ($000) |
| Takeda | | |
| Pharmaceutical Co. Ltd. | 706,030 | 33,096 |
| Tokyo Electric | | |
| Power Co. Inc. | 1,339,646 | 31,988 |
| Sony Corp. | 946,135 | 31,967 |
| Mitsubishi Corp. | 1,278,339 | 30,705 |
| Mizuho Financial | | |
| Group Inc. | 18,884,936 | 27,389 |
| Panasonic Corp. | 1,848,152 | 26,941 |
| Fanuc Ltd. | 180,561 | 26,140 |
| Mitsui & Co. Ltd. | 1,636,520 | 25,738 |
| Softbank Corp. | 764,687 | 24,558 |
| NTT DoCoMo Inc. | 14,435 | 24,333 |
| Nintendo Co. Ltd. | 93,459 | 24,133 |
| Nippon Telegraph & | | |
| Telephone Corp. | 489,277 | 22,067 |
| Komatsu Ltd. | 893,390 | 21,836 |
| Nissan Motor Co. Ltd. | 2,340,988 | 20,575 |
| East Japan Railway Co. | 320,256 | 19,777 |
| Shin-Etsu Chemical Co. Ltd. | 386,519 | 19,545 |
| Mitsubishi Estate Co. Ltd. | 1,113,995 | 19,515 |
| Hitachi Ltd. | 4,254,044 | 19,227 |
| Tokio Marine Holdings Inc. | 681,712 | 19,167 |
| Toshiba Corp. | 3,790,786 | 18,973 |
| Kansai Electric | | |
| Power Co. Inc. | 712,535 | 18,034 |
| Nomura Holdings Inc. | 3,325,163 | 17,087 |
| Mitsubishi Electric Corp. | 1,820,104 | 17,058 |
| Seven & I Holdings Co. Ltd. | 709,161 | 16,462 |
| Astellas Pharma Inc. | 418,330 | 15,563 |
| Chubu Electric | | |
| Power Co. Inc. | 609,867 | 15,413 |
| Kyocera Corp. | 153,156 | 15,264 |
| Nippon Steel Corp. | 4,804,073 | 15,100 |
| Mitsui Fudosan Co. Ltd. | 789,235 | 14,925 |
| KDDI Corp. | 2,744 | 14,792 |
| FUJIFILM Holdings Corp. | 435,572 | 14,531 |
| Denso Corp. | 457,260 | 14,220 |
| JFE Holdings Inc. | 433,274 | 13,511 |
| Daiichi Sankyo Co. Ltd. | 635,332 | 13,464 |
| Sumitomo Corp. | 1,061,749 | 13,443 |
| Japan Tobacco Inc. | 4,245 | 13,188 |
| Kao Corp. | 509,264 | 12,944 |
| JX Holdings Inc. | 2,118,372 | 12,487 |
| ITOCHU Corp. | 1,420,573 | 12,450 |
| MS&AD Insurance | | |
| Group Holdings | 507,607 | 12,161 |
| Fujitsu Ltd. | 1,757,470 | 11,989 |
| Tokyo Gas Co. Ltd. | 2,420,767 | 11,389 |
| Bridgestone Corp. | 612,827 | 10,970 |
| Kirin Holdings Co. Ltd. | 788,787 | 10,809 |
| Central Japan Railway Co. | 1,420 | 10,741 |
| Murata | | |
| Manufacturing Co. Ltd. | 191,088 | 10,738 |
| Inpex Corp. | 2,023 | 10,535 |
16
Developed Markets Index Fund
| | | |
| | | | Market |
| | | | Value |
| | | Shares | ($000) |
| | Mitsubishi Heavy | | |
| | Industries Ltd. | 2,861,383 | 10,401 |
| | Nidec Corp. | 102,469 | 10,119 |
| | Marubeni Corp. | 1,556,104 | 9,775 |
| | Keyence Corp. | 39,121 | 9,692 |
| | Kubota Corp. | 1,091,548 | 9,680 |
| | Hoya Corp. | 409,729 | 9,571 |
| | Sharp Corp. | 942,077 | 9,306 |
| * | NKSJ Holdings Inc. | 1,330,583 | 9,131 |
| | Dai-ichi Life | | |
| | Insurance Co. Ltd. | 7,536 | 9,129 |
| | Asahi Glass Co. Ltd. | 950,376 | 9,117 |
| | Tokyo Electron Ltd. | 161,545 | 9,115 |
| | Sumitomo Electric | | |
| | Industries Ltd. | 710,009 | 9,035 |
| | Tohoku Electric | | |
| | Power Co. Inc. | 402,395 | 9,025 |
| | Secom Co. Ltd. | 197,708 | 8,995 |
| | ORIX Corp. | 98,549 | 8,977 |
| | Ricoh Co. Ltd. | 632,506 | 8,848 |
| | Kyushu Electric | | |
| | Power Co. Inc. | 356,949 | 8,450 |
| | Eisai Co. Ltd. | 237,305 | 8,164 |
| | Terumo Corp. | 158,853 | 8,067 |
| | Sumitomo Metal | | |
| | Mining Co. Ltd. | 493,878 | 7,859 |
| | Toray Industries Inc. | 1,356,568 | 7,859 |
| | SMC Corp. | 50,871 | 7,766 |
| | Daikin Industries Ltd. | 220,649 | 7,677 |
| | Suzuki Motor Corp. | 314,483 | 7,675 |
| | Sumitomo Realty & | | |
| | Development Co. Ltd. | 337,152 | 7,344 |
| | Sumitomo Metal | | |
| | Industries Ltd. | 3,163,577 | 7,343 |
| | Asahi Breweries Ltd. | 363,789 | 7,337 |
| | Sumitomo Trust & | | |
| | Banking Co. Ltd. | 1,339,939 | 7,316 |
| | Asahi Kasei Corp. | 1,188,011 | 6,989 |
| | Osaka Gas Co. Ltd. | 1,825,836 | 6,895 |
| | Mitsui OSK Lines Ltd. | 1,077,692 | 6,892 |
| | NEC Corp. | 2,448,777 | 6,814 |
| | Shiseido Co. Ltd. | 319,532 | 6,671 |
| | Dai Nippon | | |
| | Printing Co. Ltd. | 528,050 | 6,661 |
| | Aeon Co. Ltd. | 564,205 | 6,645 |
| | TDK Corp. | 115,716 | 6,602 |
| | Fast Retailing Co. Ltd. | 49,979 | 6,547 |
| | Sumitomo | | |
| | Chemical Co. Ltd. | 1,478,823 | 6,447 |
| | Daiwa Securities | | |
| | Group Inc. | 1,561,452 | 6,366 |
| | Mitsubishi Chemical | | |
| | Holdings Corp. | 1,202,946 | 6,187 |
| | Nippon Yusen KK | 1,437,253 | 6,029 |
| | Ajinomoto Co. Inc. | 626,525 | 5,971 |
| | West Japan Railway Co. | 1,597 | 5,929 |
| | | |
| | | | Market |
| | | | Value |
| | | Shares | ($000) |
| | Nitto Denko Corp. | 154,979 | 5,799 |
| | Rohm Co. Ltd. | 92,020 | 5,739 |
| | Nikon Corp. | 301,058 | 5,686 |
| | Bank of Yokohama Ltd. | 1,150,600 | 5,641 |
| | Aisin Seiki Co. Ltd. | 179,724 | 5,631 |
| | Chugoku Electric | | |
| | Power Co. Inc. | 278,496 | 5,613 |
| | Odakyu Electric | | |
| | Railway Co. Ltd. | 590,085 | 5,439 |
| | Olympus Corp. | 203,677 | 5,337 |
| | T&D Holdings Inc. | 255,590 | 5,219 |
| | Rakuten Inc. | 6,768 | 5,210 |
| | Hankyu Hanshin | | |
| | Holdings Inc. | 1,082,491 | 5,189 |
| | Kobe Steel Ltd. | 2,337,070 | 5,136 |
| | Sekisui House Ltd. | 543,163 | 5,105 |
| | Yamada Denki Co. Ltd. | 77,147 | 5,006 |
| | Shionogi & Co. Ltd. | 279,899 | 4,886 |
| | Daiwa House | | |
| | Industry Co. Ltd. | 452,470 | 4,876 |
| ^ | Kintetsu Corp. | 1,538,012 | 4,870 |
| | Shikoku Electric | | |
| | Power Co. Inc. | 164,211 | 4,854 |
| | Shizuoka Bank Ltd. | 564,838 | 4,836 |
| | Tokyu Corp. | 1,076,150 | 4,811 |
| | Nippon Building | | |
| | Fund Inc. Class A | 487 | 4,772 |
| | Yahoo Japan Corp. | 13,656 | 4,767 |
| | Toyota Industries Corp. | 168,465 | 4,751 |
| | Yamato Holdings Co. Ltd. | 373,886 | 4,714 |
| | Kuraray Co. Ltd. | 325,035 | 4,655 |
| | JS Group Corp. | 235,169 | 4,622 |
| | Oriental Land Co. Ltd. | 47,298 | 4,581 |
| ^ | Resona Holdings Inc. | 569,871 | 4,533 |
| | Unicharm Corp. | 116,716 | 4,459 |
| | Japan Real Estate | | |
| | Investment Corp. | 463 | 4,457 |
| | Chiba Bank Ltd. | 717,380 | 4,429 |
| | Omron Corp. | 190,945 | 4,424 |
| | Konica Minolta | | |
| | Holdings Inc. | 452,032 | 4,368 |
| | Daito Trust | | |
| | Construction Co. Ltd. | 71,915 | 4,349 |
| | Tobu Railway Co. Ltd. | 772,012 | 4,335 |
| * | Mitsubishi Motors Corp. | 3,638,479 | 4,322 |
| | Isuzu Motors Ltd. | 1,115,999 | 4,286 |
| | Toppan Printing Co. Ltd. | 529,236 | 4,251 |
| | Nippon Electric | | |
| | Glass Co. Ltd. | 327,091 | 4,204 |
| | Keikyu Corp. | 443,807 | 4,195 |
| | Hokuriku Electric Power Co. | 165,541 | 4,017 |
| | Isetan Mitsukoshi | | |
| | Holdings Ltd. | 355,089 | 3,918 |
| * | Yamaha Motor Co. Ltd. | 248,379 | 3,811 |
| | Keio Corp. | 544,915 | 3,810 |
| | Fuji Heavy Industries Ltd. | 551,655 | 3,802 |
17
Developed Markets Index Fund
| | | | |
| | | | | Market |
| | | | | Value |
| | | | Shares | ($000) |
| | JGC Corp. | | 195,604 | 3,741 |
| | OJI Paper Co. Ltd. | | 801,400 | 3,697 |
| | Dentsu Inc. | | 156,578 | 3,690 |
| | Makita Corp. | | 104,939 | 3,679 |
| | Kawasaki Heavy | | | |
| | Industries Ltd. | 1,331,661 | 3,677 |
| | Chugai | | | |
| | Pharmaceutical Co. Ltd. | | 209,676 | 3,676 |
| | NTT Data Corp. | | 1,188 | 3,653 |
| | Mazda Motor Corp. | 1,432,940 | 3,642 |
| | NGK Insulators Ltd. | | 238,556 | 3,612 |
| | Hokkaido Electric | | | |
| | Power Co. Inc. | | 171,430 | 3,606 |
| | Mitsubishi Tanabe | | | |
| | Pharma Corp. | | 211,392 | 3,458 |
| | Ono | | | |
| | Pharmaceutical Co. Ltd. | | 79,623 | 3,383 |
| | Chuo Mitsui Trust | | | |
| | Holdings Inc. | | 934,404 | 3,371 |
| * | Mitsubishi Materials Corp. 1,054,195 | 3,300 |
| | Teijin Ltd. | | 883,519 | 3,271 |
| | Electric Power | | | |
| | Development Co. Ltd. | | 109,206 | 3,231 |
| | Nippon Express Co. Ltd. | | 796,288 | 3,164 |
| | Benesse Holdings Inc. | | 65,528 | 3,145 |
| | Shimano Inc. | | 62,980 | 3,138 |
| | NSK Ltd. | | 413,760 | 3,128 |
| | Toyota Tsusho Corp. | | 201,353 | 3,117 |
| | Nitori Holdings Co. Ltd. | | 34,816 | 3,063 |
| | Sega Sammy Holdings Inc. | | 187,634 | 3,061 |
| | Hirose Electric Co. Ltd. | | 30,078 | 3,023 |
| * | All Nippon Airways Co. Ltd. | 791,075 | 2,992 |
| | Ibiden Co. Ltd. | | 121,370 | 2,986 |
| | MEIJI Holdings Co. Ltd. | | 64,322 | 2,969 |
| | Sumitomo Heavy | | | |
| | Industries Ltd. | | 514,726 | 2,926 |
| | JSR Corp. | | 169,149 | 2,918 |
| | Advantest Corp. | | 151,209 | 2,872 |
| | Sony Financial Holdings Inc. | 818 | 2,845 |
| | Japan Steel Works Ltd. | | 297,200 | 2,836 |
| | Brother Industries Ltd. | | 221,169 | 2,823 |
| | Fukuoka Financial | | | |
| | Group Inc. | | 725,182 | 2,813 |
| | Kurita Water Industries Ltd. | 106,382 | 2,756 |
| | Sankyo Co. Ltd. | | 50,980 | 2,716 |
| | Joyo Bank Ltd. | | 621,983 | 2,706 |
| | Bank of Kyoto Ltd. | | 301,812 | 2,695 |
| | Taisho | | | |
| | Pharmaceutical Co. Ltd. | | 127,239 | 2,679 |
| | Yakult Honsha Co. Ltd. | | 91,437 | 2,676 |
| | Trend Micro Inc. | | 92,044 | 2,604 |
| | Sekisui Chemical Co. Ltd. | | 408,104 | 2,593 |
| | Hisamitsu | | | |
| | Pharmaceutical Co. Inc. | | 63,255 | 2,590 |
| | Lawson Inc. | | 56,476 | 2,566 |
| | Kawasaki Kisen Kaisha Ltd. | | 649,730 | 2,523 |
| | | |
| | | | Market |
| | | | Value |
| | | Shares | ($000) |
| | Obayashi Corp. | 611,738 | 2,492 |
| | Jupiter | | |
| | Telecommunications | | |
| | Co. Ltd. | 2,288 | 2,470 |
| | Daihatsu Motor Co. Ltd. | 180,861 | 2,443 |
| | Toyo Seikan Kaisha Ltd. | 143,062 | 2,441 |
| | Showa Denko KK | 1,332,024 | 2,436 |
| | Santen | | |
| | Pharmaceutical Co. Ltd. | 69,862 | 2,407 |
| | Kyowa Hakko Kirin Co. Ltd. | 243,735 | 2,390 |
| | Mitsui Chemicals Inc. | 813,188 | 2,382 |
| | Japan Retail Fund | | |
| | Investment Corp. | | |
| | Class A | 1,522 | 2,371 |
| | IHI Corp. | 1,245,805 | 2,366 |
| | TonenGeneral Sekiyu KK | 264,700 | 2,360 |
| | Nippon Paper Group Inc. | 92,397 | 2,346 |
| ^ | GS Yuasa Corp. | 351,002 | 2,341 |
| | J Front Retailing Co. Ltd. | 454,287 | 2,328 |
| | SBI Holdings Inc. | 18,760 | 2,285 |
| | Stanley Electric Co. Ltd. | 136,145 | 2,282 |
| | Mitsubishi Gas | | |
| | Chemical Co. Inc. | 364,907 | 2,256 |
| | Furukawa Electric Co. Ltd. | 596,843 | 2,224 |
| | Nisshin Seifun Group Inc. | 178,766 | 2,213 |
| | Amada Co. Ltd. | 335,602 | 2,208 |
| | Ube Industries Ltd. | 896,316 | 2,199 |
| | Nissin Foods | | |
| | Holdings Co. Ltd. | 60,620 | 2,195 |
| | Hokuhoku Financial | | |
| | Group Inc. | 1,175,317 | 2,173 |
| | THK Co. Ltd. | 112,984 | 2,169 |
| | Sojitz Corp. | 1,173,022 | 2,156 |
| | Shimizu Corp. | 556,133 | 2,147 |
| | Sysmex Corp. | 31,300 | 2,146 |
| | FamilyMart Co. Ltd. | 59,578 | 2,113 |
| | NGK Spark Plug Co. Ltd. | 150,719 | 2,097 |
| | Hachijuni Bank Ltd. | 404,370 | 2,075 |
| | Toho Gas Co. Ltd. | 393,466 | 2,073 |
| | Taisei Corp. | 962,361 | 2,055 |
| | Hamamatsu Photonics KK | 63,000 | 2,038 |
| | NTN Corp. | 450,099 | 2,036 |
| | Shimamura Co. Ltd. | 21,123 | 2,025 |
| | Rinnai Corp. | 33,064 | 2,012 |
| | Nippon Meat Packers Inc. | 172,574 | 2,007 |
| | Denki Kagaku Kogyo KK | 452,357 | 1,991 |
| | Dena Co. Ltd. | 76,315 | 1,981 |
| | Taiyo Nippon Sanso Corp. | 245,807 | 1,972 |
| | Credit Saison Co. Ltd. | 138,740 | 1,968 |
| | Tokyu Land Corp. | 429,460 | 1,957 |
| | Suzuken Co. Ltd. | 61,670 | 1,939 |
| | Seiko Epson Corp. | 121,406 | 1,936 |
| | Hitachi Construction | | |
| | Machinery Co. Ltd. | 90,540 | 1,925 |
18
Developed Markets Index Fund
| | | |
| | | | Market |
| | | | Value |
| | | Shares | ($000) |
| | Chugoku Bank Ltd. | 165,351 | 1,918 |
| | Hiroshima Bank Ltd. | 468,445 | 1,913 |
| | Kansai Paint Co. Ltd. | 204,336 | 1,906 |
| | Toyo Suisan Kaisha Ltd. | 88,502 | 1,896 |
| | Gunma Bank Ltd. | 372,746 | 1,869 |
| | Takashimaya Co. Ltd. | 247,991 | 1,867 |
| | Kajima Corp. | 792,827 | 1,859 |
| | Nippon Sheet | | |
| | Glass Co. Ltd. | 830,924 | 1,823 |
| | Mitsubishi UFJ Lease & | | |
| | Finance Co. Ltd. | 54,681 | 1,823 |
| | Yamaha Corp. | 148,674 | 1,819 |
| | JTEKT Corp. | 181,206 | 1,816 |
| | Hitachi Chemical Co. Ltd. | 97,643 | 1,811 |
| | Shimadzu Corp. | 239,846 | 1,800 |
| | Kamigumi Co. Ltd. | 230,452 | 1,800 |
| | Daicel Chemical | | |
| | Industries Ltd. | 258,860 | 1,798 |
| | Yamaguchi Financial | | |
| | Group Inc. | 198,421 | 1,796 |
| | Aeon Mall Co. Ltd. | 76,380 | 1,791 |
| | Nomura Research | | |
| | Institute Ltd. | 94,420 | 1,781 |
| | NOK Corp. | 99,158 | 1,766 |
| | Hitachi Metals Ltd. | 154,989 | 1,764 |
| *,^ | Elpida Memory Inc. | 171,451 | 1,755 |
| | Tsumura & Co. | 56,987 | 1,752 |
| | Suruga Bank Ltd. | 193,578 | 1,743 |
| | Minebea Co. Ltd. | 316,984 | 1,741 |
| | Nishi-Nippon City Bank Ltd. | 638,619 | 1,740 |
| | Idemitsu Kosan Co. Ltd. | 20,626 | 1,738 |
| | TOTO Ltd. | 260,262 | 1,729 |
| | Sumitomo Rubber | | |
| | Industries Ltd. | 160,555 | 1,726 |
| | Keisei Electric | | |
| | Railway Co. Ltd. | 258,050 | 1,723 |
| | Kaneka Corp. | 277,400 | 1,716 |
| | Iyo Bank Ltd. | 229,467 | 1,708 |
| * | Sumco Corp. | 108,471 | 1,677 |
| | Yaskawa Electric Corp. | 214,507 | 1,675 |
| | Marui Group Co. Ltd. | 207,713 | 1,632 |
| | Mitsui Mining & | | |
| | Smelting Co. Ltd. | 534,777 | 1,631 |
| | USS Co. Ltd. | 20,899 | 1,624 |
| | Ushio Inc. | 97,625 | 1,623 |
| | Oracle Corp. Japan | 35,713 | 1,620 |
| | Tokuyama Corp. | 294,718 | 1,613 |
| | Air Water Inc. | 138,142 | 1,610 |
| | Namco Bandai Holdings Inc. | 174,236 | 1,605 |
| | Kikkoman Corp. | 148,463 | 1,600 |
| | MediPal Holdings Corp. | 136,653 | 1,594 |
| | Nomura Real Estate Office | | |
| | Fund Inc. Class A | 259 | 1,593 |
| | Japan Prime Realty | | |
| | Investment Corp. | 632 | 1,571 |
| | | |
| | | | Market |
| | | | Value |
| | | Shares | ($000) |
| | McDonald’s Holdings Co. | | |
| | Japan Ltd. | 61,701 | 1,566 |
| | Casio Computer Co. Ltd. | 222,678 | 1,562 |
| | Alfresa Holdings Corp. | 36,621 | 1,540 |
| | 77 Bank Ltd. | 326,576 | 1,538 |
| | Toho Co. Ltd. | 99,426 | 1,537 |
| | Konami Corp. | 87,274 | 1,536 |
| | Mitsui Engineering & | | |
| | Shipbuilding Co. Ltd. | 675,648 | 1,526 |
| | Nissan Chemical | | |
| | Industries Ltd. | 132,160 | 1,518 |
| | Cosmo Oil Co. Ltd. | 562,594 | 1,515 |
| | Asics Corp. | 140,367 | 1,511 |
| | UNY Co. Ltd. | 179,800 | 1,498 |
| | Showa Shell Sekiyu KK | 177,515 | 1,494 |
| | Tokyo Tatemono Co. Ltd. | 367,268 | 1,480 |
| | Dowa Holdings Co. Ltd. | 232,155 | 1,410 |
| | Yamazaki Baking Co. Ltd. | 113,887 | 1,389 |
| | Nomura Real Estate | | |
| | Holdings Inc. | 88,985 | 1,365 |
| | Daido Steel Co. Ltd. | 267,294 | 1,362 |
| | Yokogawa Electric Corp. | 204,783 | 1,343 |
| | Toyoda Gosei Co. Ltd. | 62,125 | 1,339 |
| | Citizen Holdings Co. Ltd. | 232,673 | 1,337 |
| | Dainippon Sumitomo | | |
| | Pharma Co. Ltd. | 147,953 | 1,336 |
| | Tosoh Corp. | 481,848 | 1,289 |
| | Mitsubishi Logistics Corp. | 106,534 | 1,288 |
| | Fuji Electric | | |
| | Holdings Co. Ltd. | 537,073 | 1,281 |
| | Mitsumi Electric Co. Ltd. | 75,034 | 1,276 |
| | Sapporo Hokuyo | | |
| | Holdings Inc. | 305,095 | 1,258 |
| * | Mizuho Trust & | | |
| | Banking Co. Ltd. | 1,396,498 | 1,247 |
| | Hitachi | | |
| | High-Technologies Corp. | 64,142 | 1,247 |
| | Square Enix | | |
| | Holdings Co. Ltd. | 59,325 | 1,239 |
| | Mabuchi Motor Co. Ltd. | 23,267 | 1,232 |
| | Chiyoda Corp. | 146,000 | 1,209 |
| | Nisshinbo Holdings Inc. | 118,834 | 1,203 |
| | Obic Co. Ltd. | 6,514 | 1,202 |
| | Koito Manufacturing Co. Ltd. | 91,800 | 1,195 |
| | NHK Spring Co. Ltd. | 139,731 | 1,185 |
| | Nisshin Steel Co. Ltd. | 656,099 | 1,182 |
| | Mizuho Securities Co. Ltd. | 545,851 | 1,160 |
| | Hakuhodo DY Holdings Inc. | 22,273 | 1,112 |
| | Kinden Corp. | 126,808 | 1,090 |
| | Toyota Boshoku Corp. | 62,815 | 1,064 |
| | Hino Motors Ltd. | 244,344 | 1,056 |
| | Yamato Kogyo Co. Ltd. | 41,048 | 1,050 |
| | Seven Bank Ltd. | 583 | 1,049 |
| | Japan Petroleum | | |
| | Exploration Co. | 27,144 | 1,036 |
19
Developed Markets Index Fund
| | | | |
| | | | | Market |
| | | | | Value |
| | | | Shares | ($000) |
| | NTT Urban | | | |
| | Development Corp. | | 1,095 | 1,003 |
| | Otsuka Corp. | | 15,132 | 961 |
| | Sapporo Holdings Ltd. | | 242,883 | 956 |
| | Tokyo Steel | | | |
| | Manufacturing Co. Ltd. | | 93,499 | 925 |
| | Itochu | | | |
| | Techno-Solutions Corp. | | 26,673 | 911 |
| | Maruichi Steel Tube Ltd. | | 44,520 | 882 |
| | Aeon Credit Service Co. Ltd. | 75,487 | 867 |
| * | Taiheiyo Cement Corp. | | 792,424 | 855 |
| | Ito En Ltd. | | 52,446 | 842 |
| | Senshu Ikeda | | | |
| | Holdings Inc. | | 625,828 | 831 |
| | ABC-Mart Inc. | | 24,464 | 831 |
| | Coca-Cola West Co. Ltd. | | 53,129 | 813 |
| | Aozora Bank Ltd. | | 472,486 | 790 |
| | Canon Marketing Japan Inc. | 57,710 | 719 |
| *,^ | Shinsei Bank Ltd. | | 885,154 | 701 |
| | Matsui Securities Co. Ltd. | | 118,002 | 667 |
| | Shinko Electric | | | |
| | Industries Co. Ltd. | | 65,187 | 635 |
| | Jafco Co. Ltd. | | 30,039 | 628 |
| | Fuji Media Holdings Inc. | | 435 | 576 |
| ^ | Nissha Printing Co. Ltd. | | 25,672 | 566 |
| ^ | Acom Co. Ltd. | | 38,182 | 434 |
| | | | | 2,092,324 |
| Netherlands (2.6%) | | | |
| | Unilever NV | 1,534,012 | 45,556 |
| * | ING Groep NV | 3,607,274 | 38,593 |
| | Koninklijke Philips | | | |
| | Electronics NV | | 928,597 | 28,324 |
| | Koninklijke KPN NV | 1,523,826 | 25,450 |
| | Koninklijke Ahold NV | 1,121,091 | 15,496 |
| | ASML Holding NV | | 398,154 | 13,199 |
| | Akzo Nobel NV | | 218,459 | 12,977 |
| | Heineken NV | | 244,397 | 12,407 |
| | TNT NV | | 352,031 | 9,362 |
| * | Aegon NV | 1,470,033 | 9,317 |
| | Reed Elsevier NV | | 646,878 | 8,451 |
| | Koninklijke DSM NV | | 145,041 | 7,762 |
| | Wolters Kluwer NV | | 280,484 | 6,394 |
| * | Randstad Holding NV | | 103,589 | 4,935 |
| | Heineken Holding NV | | 109,166 | 4,709 |
| | Fugro NV | | 62,845 | 4,449 |
| | Corio NV | | 55,976 | 4,114 |
| | Koninklijke Vopak NV | | 66,043 | 3,304 |
| | SBM Offshore NV | | 158,533 | 3,236 |
| | Koninklijke Boskalis | | | |
| | Westminster NV | | 64,795 | 2,632 |
| | Delta Lloyd NV | | 71,063 | 1,469 |
| | ASML Holding NV ADR | | 8,519 | 283 |
| * | Aegon NV | | 860 | 5 |
| | | | | 262,424 |
| | | |
| | | | Market |
| | | | Value |
| | | Shares | ($000) |
| New Zealand (0.1%) | | |
| | Fletcher Building Ltd. | 566,777 | 3,551 |
| | Telecom Corp. of | | |
| | New Zealand Ltd. | 1,809,382 | 2,824 |
| | Auckland International | | |
| | Airport Ltd. | 876,183 | 1,404 |
| | Contact Energy Ltd. | 285,115 | 1,273 |
| | Sky City Entertainment | | |
| | Group Ltd. | 540,135 | 1,246 |
| | | | 10,298 |
| Norway (0.8%) | | |
| | Statoil ASA | 1,050,840 | 22,952 |
| | DnB NOR ASA | 921,374 | 12,656 |
| | Telenor ASA | 781,323 | 12,612 |
| | Yara International ASA | 178,357 | 9,404 |
| | Seadrill Ltd. | 262,769 | 7,977 |
| | Orkla ASA | 725,216 | 7,028 |
| | Norsk Hydro ASA | 835,468 | 5,129 |
| | Aker Solutions ASA | 156,798 | 2,391 |
| *,^ | Renewable | | |
| | Energy Corp. ASA | 470,992 | 1,640 |
| | | | 81,789 |
| Portugal (0.3%) | | |
| | Portugal Telecom | | |
| | SGPS SA | 548,009 | 7,920 |
| | EDP–Energias | | |
| | de Portugal SA | 1,641,961 | 6,282 |
| | Galp Energia SGPS SA | | |
| | Class B | 218,932 | 4,224 |
| | Jeronimo Martins SGPS SA | 208,073 | 3,125 |
| | Banco Espirito Santo SA | 493,823 | 2,452 |
| ^ | Banco Comercial | | |
| | Portugues SA | 2,635,005 | 2,397 |
| | Cimpor Cimentos | | |
| | de Portugal SGPS SA | 192,932 | 1,341 |
| | Brisa Auto-Estradas | | |
| | de Portugal SA | 166,943 | 1,265 |
| * | EDP Renovaveis SA | 208,072 | 1,207 |
| | | | 30,213 |
| Singapore (1.7%) | | |
| | Singapore | | |
| | Telecommunications Ltd. | 7,498,744 | 17,967 |
| | DBS Group Holdings Ltd. | 1,614,014 | 17,384 |
| | United Overseas Bank Ltd. | 1,149,172 | 16,587 |
| | Oversea-Chinese | | |
| | Banking Corp. Ltd. | 2,292,085 | 16,011 |
| * | Genting Singapore plc | 5,733,278 | 9,646 |
| | Keppel Corp. Ltd. | 1,205,377 | 9,323 |
| | Wilmar International Ltd. | 1,805,824 | 8,973 |
| | CapitaLand Ltd. | 2,406,314 | 7,259 |
| | Singapore Airlines Ltd. | 505,720 | 6,202 |
| ^ | Singapore Exchange Ltd. | 810,263 | 5,521 |
| | City Developments Ltd. | 512,861 | 5,061 |
| | Singapore Press | | |
| | Holdings Ltd. | 1,422,749 | 4,571 |
20
Developed Markets Index Fund
| | | |
| | | | Market |
| | | | Value |
| | | Shares | ($000) |
| | Fraser and Neave Ltd. | 920,729 | 4,449 |
| | Singapore Technologies | | |
| | Engineering Ltd. | 1,578,716 | 4,048 |
| | Noble Group Ltd. | 2,786,800 | 4,024 |
| | SembCorp Industries Ltd. | 930,023 | 3,301 |
| | CapitaMall Trust | 2,107,404 | 3,237 |
| | Golden Agri- | | |
| | Resources Ltd. | 6,317,260 | 3,190 |
| | Jardine Cycle & | | |
| | Carriage Ltd. | 100,899 | 3,074 |
| | SembCorp Marine Ltd. | 781,386 | 2,786 |
| | Olam International Ltd. | 1,132,974 | 2,754 |
| * | Global Logistic | | |
| | Properties Ltd. | 1,488,000 | 2,667 |
| | Keppel Land Ltd. | 669,000 | 2,300 |
| | Ascendas Real Estate | | |
| | Investment Trust | 1,412,174 | 2,254 |
| | CapitaMalls Asia Ltd. | 1,279,000 | 2,122 |
| | ComfortDelGro Corp. Ltd. | 1,772,863 | 2,034 |
| ^ | Yangzijiang Shipbuilding | | |
| | Holdings Ltd. | 1,368,000 | 1,983 |
| | UOL Group Ltd. | 439,201 | 1,548 |
| *,^ | Neptune Orient Lines Ltd. | 854,562 | 1,420 |
| ^ | Cosco Corp. Singapore Ltd. | 941,993 | 1,363 |
| | StarHub Ltd. | 562,055 | 1,155 |
| * | Golden Agri-Resources | | |
| | Ltd. Warrants Exp. | | |
| | 07/23/2012 | 296,075 | 30 |
| | | | 174,244 |
| Spain (3.8%) | | |
| ^ | Telefonica SA | 3,802,982 | 102,767 |
| | Banco Santander SA | 7,750,913 | 99,488 |
| | Banco Bilbao Vizcaya | | |
| | Argentaria SA | 3,352,421 | 44,166 |
| | Iberdrola SA | 3,801,088 | 32,115 |
| | Repsol YPF SA | 689,413 | 19,118 |
| | Inditex SA | 205,282 | 17,145 |
| ^ | ACS Actividades | | |
| | de Construccion y | | |
| | Servicios SA | 133,068 | 6,986 |
| | Abertis Infraestructuras SA | 280,116 | 5,539 |
| | Banco Popular Espanol SA | 821,116 | 5,318 |
| | Red Electrica Corp. SA | 101,644 | 5,108 |
| | Ferrovial SA | 413,066 | 4,713 |
| | Criteria Caixacorp SA | 788,724 | 4,456 |
| ^ | Banco de Sabadell SA | 901,042 | 4,386 |
| | Enagas | 169,595 | 3,741 |
| | Gas Natural SDG SA | 218,668 | 3,203 |
| | Iberdrola Renovables SA | 796,583 | 2,691 |
| | Mapfre SA | 708,705 | 2,355 |
| | Zardoya Otis SA | 131,573 | 2,193 |
| | Acciona SA | 23,798 | 2,095 |
| ^ | Grifols SA | 129,120 | 2,093 |
| * | Iberia Lineas Aereas | | |
| | de Espana SA | 448,119 | 1,968 |
| ^ | Bankinter SA | 264,560 | 1,765 |
| | | |
| | | | Market |
| | | | Value |
| | | Shares | ($000) |
| | Telefonica SA ADR | 21,689 | 1,760 |
| | Indra Sistemas SA | 86,097 | 1,687 |
| | Acerinox SA | 95,161 | 1,561 |
| * | Gamesa Corp. | | |
| | Tecnologica SA | 184,345 | 1,284 |
| ^ | Gestevision Telecinco SA | 94,932 | 1,211 |
| ^ | Banco de Valencia SA | 204,408 | 1,154 |
| ^ | Fomento de Construcciones | |
| | y Contratas SA | 35,362 | 955 |
| | | | 383,021 |
| Sweden (3.1%) | | |
| | Hennes & Mauritz | | |
| | AB Class B | 962,862 | 33,913 |
| | Nordea Bank AB | 3,045,493 | 33,533 |
| | Telefonaktiebolaget LM | | |
| | Ericsson Class B | 2,836,029 | 31,190 |
| | TeliaSonera AB | 2,112,841 | 17,648 |
| | Svenska Handelsbanken | | |
| | AB Class A | 461,801 | 15,107 |
| | Sandvik AB | 948,456 | 14,299 |
| * | Volvo AB Class B | 1,026,808 | 13,901 |
| | Atlas Copco AB Class A | 633,131 | 13,231 |
| | Skandinaviska Enskilda | | |
| | Banken AB Class A | 1,328,636 | 10,300 |
| | SKF AB | 366,652 | 9,478 |
| * | Swedbank AB Class A | 672,474 | 9,404 |
| | Investor AB Class B | 428,713 | 8,800 |
| | Svenska Cellulosa AB | | |
| | Class B | 539,181 | 8,359 |
| | Assa Abloy AB Class B | 293,408 | 7,524 |
| | Skanska AB Class B | 375,378 | 7,184 |
| | Atlas Copco AB Class B | 366,722 | 6,997 |
| | Millicom International | | |
| | Cellular SA | 71,452 | 6,744 |
| | Tele2 AB | 295,826 | 6,501 |
| | Scania AB Class B | 300,587 | 6,391 |
| | Swedish Match AB | 218,681 | 6,118 |
| | Alfa Laval AB | 319,744 | 5,549 |
| | Electrolux AB Class B | 225,281 | 5,457 |
| | Boliden AB | 259,149 | 4,400 |
| | Kinnevik Investment AB | | |
| | Class B | 203,614 | 4,203 |
| | Getinge AB | 187,867 | 3,978 |
| ^ | Hexagon AB Class B | 180,200 | 3,667 |
| | Ratos AB | 95,873 | 3,418 |
| | Modern Times Group AB | | |
| | Class B | 47,496 | 3,412 |
| | Securitas AB Class B | 295,750 | 3,235 |
| | Husqvarna AB | 383,502 | 2,699 |
| | SSAB AB Class A | 169,914 | 2,383 |
| | Holmen AB | 49,262 | 1,564 |
| | SSAB AB Class B | 77,236 | 955 |
| | | | 311,542 |
21
Developed Markets Index Fund
| | | | |
| | | | | Market |
| | | | | Value |
| | | | Shares | ($000) |
| Switzerland (7.7%) | | | |
| | Nestle SA | 3,265,269 | 178,853 |
| | Novartis AG | 1,987,040 | 115,135 |
| | Roche Holding AG | | 661,593 | 97,158 |
| * | UBS AG | 3,402,192 | 57,795 |
| | Credit Suisse Group AG | 1,060,543 | 43,905 |
| | ABB Ltd. | 2,083,639 | 43,160 |
| | Zurich Financial | | | |
| | Services AG | | 139,517 | 34,142 |
| | Syngenta AG | | 89,088 | 24,667 |
| | Cie Financiere | | | |
| | Richemont SA | | 491,575 | 24,519 |
| | Swiss Reinsurance Co. Ltd. | 331,303 | 15,918 |
| | Holcim Ltd. | | 231,494 | 14,421 |
| | Swatch Group AG (Bearer) | 29,062 | 11,108 |
| | Swisscom AG | | 21,943 | 9,164 |
| | SGS SA | | 5,153 | 8,242 |
| | Julius Baer Group Ltd. | | 194,310 | 8,200 |
| | Givaudan SA | | 7,819 | 8,057 |
| | Geberit AG | | 36,590 | 7,013 |
| | Synthes Inc. | | 55,774 | 6,653 |
| | Adecco SA | | 115,569 | 6,466 |
| | Kuehne & Nagel | | | |
| | International AG | | 51,105 | 6,322 |
| | Sonova Holding AG | | 43,038 | 4,985 |
| | Schindler Holding | | | |
| | AG (Bearer) | | 45,631 | 4,890 |
| * | Actelion Ltd. | | 95,996 | 4,796 |
| | Baloise Holding AG | | 46,896 | 4,333 |
| | Sika AG | | 1,924 | 3,815 |
| | Lonza Group AG | | 42,970 | 3,762 |
| | Swiss Life Holding AG | | 28,873 | 3,533 |
| *,^ | Logitech International SA | | 171,876 | 3,259 |
| * | GAM Holding AG | | 194,781 | 3,077 |
| | Lindt & Spruengli AG Regular | 107 | 3,067 |
| | Swatch Group AG | | | |
| | (Registered) | | 40,933 | 2,846 |
| | Aryzta AG | | 50,913 | 2,256 |
| | Schindler Holding AG | | | |
| | (Registered) | | 20,396 | 2,218 |
| | Lindt & Spruengli AG | | 812 | 2,208 |
| | Pargesa Holding SA | | 25,254 | 2,002 |
| | Nobel Biocare Holding AG | | 115,615 | 1,912 |
| | Straumann Holding AG | | 7,375 | 1,544 |
| | Aryzta AG (Ireland Shares) | | 29,041 | 1,270 |
| * | UBS AG (New York Shares) | 24,848 | 423 |
| | | | | 777,094 |
| United Kingdom (21.6%) | | | |
| | HSBC Holdings plc | 16,488,446 | 171,607 |
| | Vodafone Group plc | 47,041,048 | 128,592 |
| | BP plc | 17,692,949 | 120,263 |
| | GlaxoSmithKline plc | 4,889,724 | 95,485 |
| | Rio Tinto plc | 1,365,064 | 88,662 |
| | Royal Dutch Shell plc | | | |
| | Class B | 2,538,603 | 81,240 |
| | BHP Billiton plc | 2,078,308 | 73,624 |
| | | |
| | | | Market |
| | | | Value |
| | | Shares | ($000) |
| | British American | | |
| | Tobacco plc | 1,880,308 | 71,633 |
| | AstraZeneca plc | 1,357,847 | 68,303 |
| | Standard Chartered plc | 2,169,884 | 62,764 |
| | BG Group plc | 3,184,198 | 61,984 |
| | Anglo American plc | 1,241,851 | 57,862 |
| | Royal Dutch Shell plc | | |
| | Class A | 1,692,273 | 54,920 |
| ^ | Royal Dutch Shell plc | | |
| | Class A | | |
| | (Amsterdam Shares) | 1,646,614 | 53,412 |
| | Tesco plc | 7,553,758 | 51,695 |
| | Barclays plc | 10,774,069 | 47,346 |
| | Diageo plc | 2,358,644 | 43,511 |
| * | Lloyds Banking | | |
| | Group plc | 38,462,953 | 42,276 |
| | Xstrata plc | 1,937,365 | 37,533 |
| | Unilever plc | 1,208,635 | 34,846 |
| | Reckitt Benckiser | | |
| | Group plc | 580,244 | 32,417 |
| | National Grid plc | 3,260,342 | 30,831 |
| | Imperial Tobacco | | |
| | Group plc | 958,856 | 30,710 |
| | SABMiller plc | 894,430 | 29,019 |
| | Centrica plc | 4,845,314 | 25,782 |
| | Prudential plc | 2,390,862 | 24,181 |
| | Rolls-Royce Group plc | 1,744,675 | 18,101 |
| | BT Group plc | 7,296,581 | 17,992 |
| | BAE Systems plc | 3,243,318 | 17,903 |
| | Aviva plc | 2,639,365 | 16,832 |
| | Scottish & Southern | | |
| | Energy plc | 871,105 | 16,098 |
| | Tullow Oil plc | 834,421 | 15,848 |
| | Compass Group plc | 1,775,189 | 14,548 |
| | WPP plc | 1,086,963 | 12,632 |
| | Shire plc | 529,950 | 12,436 |
| | British Sky Broadcasting | | |
| | Group plc | 1,073,945 | 12,159 |
| * | Royal Bank of Scotland | | |
| | Group plc | 16,392,197 | 11,729 |
| | Pearson plc | 764,999 | 11,717 |
| | Experian plc | 965,432 | 11,218 |
| | Old Mutual plc | 5,114,938 | 10,652 |
| | Marks & Spencer | | |
| | Group plc | 1,490,472 | 10,215 |
| | Reed Elsevier plc | 1,143,072 | 9,807 |
| | International Power plc | 1,433,893 | 9,567 |
| | WM Morrison | | |
| | Supermarkets plc | 1,997,397 | 9,400 |
| | Legal & General | | |
| | Group plc | 5,520,906 | 8,876 |
| | Kingfisher plc | 2,222,259 | 8,466 |
| * | Cairn Energy plc | 1,316,633 | 8,137 |
| | Randgold Resources Ltd. | 85,017 | 7,968 |
| | Antofagasta plc | 370,701 | 7,847 |
| | Land Securities Group plc | 716,733 | 7,772 |
22
Developed Markets Index Fund
| | | |
| | | | Market |
| | | | Value |
| | | Shares | ($000) |
| | Standard Life plc | 2,124,865 | 7,725 |
| | Smith & Nephew plc | 835,508 | 7,341 |
| | ARM Holdings plc | 1,235,777 | 7,215 |
| | Capita Group plc | 581,476 | 7,140 |
| * | Wolseley plc | 267,283 | 7,110 |
| | J Sainsbury plc | 1,138,247 | 7,107 |
| | Vodafone Group plc ADR | 255,762 | 7,036 |
| | Carnival plc | 162,821 | 7,035 |
| | Man Group plc | 1,676,402 | 7,007 |
| | Smiths Group plc | 367,098 | 7,006 |
| | RSA Insurance Group plc | 3,236,978 | 6,791 |
| | British Land Co. plc | 820,536 | 6,699 |
| | Burberry Group plc | 408,564 | 6,672 |
| | Next plc | 178,537 | 6,537 |
| | United Utilities Group plc | 645,007 | 6,315 |
| | Johnson Matthey plc | 201,633 | 6,183 |
| | Aggreko plc | 244,541 | 6,171 |
| | Resolution Ltd. | 1,362,242 | 5,711 |
| | Petrofac Ltd. | 243,361 | 5,703 |
| | Associated British | | |
| | Foods plc | 337,355 | 5,658 |
| | G4S plc | 1,324,469 | 5,553 |
| | AMEC plc | 310,805 | 5,406 |
| | Sage Group plc | 1,245,844 | 5,376 |
| | Intercontinental | | |
| | Hotels Group plc | 270,817 | 5,230 |
| | Severn Trent plc | 222,460 | 4,973 |
| | Admiral Group plc | 190,446 | 4,970 |
| * | Autonomy Corp. plc | 205,813 | 4,819 |
| | Serco Group plc | 466,950 | 4,594 |
| | Hammerson plc | 668,561 | 4,492 |
| | Intertek Group plc | 151,045 | 4,489 |
| | Whitbread plc | 165,185 | 4,481 |
| | 3i Group plc | 911,009 | 4,376 |
| * | Lonmin plc | 153,150 | 4,287 |
| | Inmarsat plc | 410,425 | 4,285 |
| | Kazakhmys plc | 202,929 | 4,276 |
| | Rexam plc | 823,517 | 4,195 |
| | Cobham plc | 1,091,940 | 4,052 |
| | ICAP plc | 521,460 | 3,810 |
| * | ITV plc | 3,473,670 | 3,805 |
| | Vedanta Resources plc | 112,845 | 3,753 |
| | Bunzl plc | 310,375 | 3,675 |
| | Investec plc | 457,485 | 3,651 |
| | Invensys plc | 764,585 | 3,532 |
| | Eurasian Natural | | |
| | Resources Corp. plc | 244,175 | 3,406 |
| | Fresnillo plc | 169,555 | 3,395 |
| | Segro plc | 695,028 | 3,302 |
| | | | |
| | | | | Market |
| | | | | Value |
| | | | Shares | ($000) |
| | Babcock International | | |
| | Group plc | | 338,032 | 3,141 |
| | Firstgroup plc | | 452,818 | 2,961 |
| | Balfour Beatty plc | | 645,622 | 2,863 |
| | Home Retail Group plc | 805,900 | 2,826 |
| | Cable & Wireless | | | |
| | Worldwide plc | | 2,488,798 | 2,797 |
| | Capital Shopping | | | |
| | Centres Group plc | | 437,053 | 2,691 |
| | Schroders plc | | 104,642 | 2,645 |
| *,^ | British Airways plc | | 542,210 | 2,350 |
| | Thomas Cook Group plc | 806,162 | 2,337 |
| | TUI Travel plc | | 520,977 | 1,763 |
| | London Stock Exchange | | |
| | Group plc | | 140,882 | 1,656 |
| | | | | 2,182,793 |
| Total Common Stocks | | | |
| (Cost $8,259,195) | | | 10,083,472 |
| Temporary Cash Investments (2.4%)1 | |
| Money Market Fund (2.3%) | | |
| 2,3 | Vanguard Market Liquidity | | |
| | Fund, 0.237% | 231,834,995 | 231,835 |
| |
| | | | Face | |
| | | | Amount | |
| | | | ($000) | |
| U.S. Government and Agency Obligations (0.1%) |
| 4,5 | Fannie Mae Discount | | |
| | Notes, 0.180%, 12/29/10 | 3,000 | 2,999 |
| 4 | Freddie Mac Discount | | |
| | Notes, 0.321%, 12/15/10 | 3,000 | 2,999 |
| | | | | 5,998 |
| Total Temporary Cash Investments | |
| (Cost $237,833) | | | 237,833 |
| Total Investments (102.0%) | | |
| (Cost $8,497,028) | | | 10,321,305 |
| Other Assets and Liabilities (-2.0%) | |
| Other Assets | | | 50,069 |
| Liabilities3 | | | (251,813) |
| | | | | (201,744) |
| Net Assets (100%) | | | 10,119,561 |
23
Developed Markets Index Fund
| |
| At October 31, 2010, net assets consisted of: |
| | Amount |
| | ($000) |
| Paid-in Capital | 9,990,089 |
| Undistributed Net Investment Income | 224,910 |
| Accumulated Net Realized Losses | (1,920,841) |
| Unrealized Appreciation (Depreciation) | |
| Investment Securities | 1,824,277 |
| Futures Contracts | (209) |
| Foreign Currencies and | |
| Forward Currency Contracts | 1,335 |
| Net Assets | 10,119,561 |
| |
| Investor Shares—Net Assets | |
| Applicable to 317,956,595 outstanding | |
| $.001 par value shares of beneficial | |
| interest (unlimited authorization) | 3,198,057 |
| Net Asset Value Per Share— | |
| Investor Shares | $10.06 |
| |
| Institutional Shares—Net Assets | |
| Applicable to 693,082,623 outstanding | |
| $.001 par value shares of beneficial | |
| interest (unlimited authorization) | 6,921,504 |
| Net Asset Value Per Share— | |
| Institutional Shares | $9.99 |
See Note A in Notes to Financial Statements.
* Non-income-producing security.
^ Part of security position is on loan to broker-dealers. The total value of securities on loan is $220,512,000.
1 The fund invests a portion of its cash reserves in equity markets through the use of index futures contracts. After giving effect to futures investments, the fund’s effective common stock and temporary cash investment positions represent 100.0% and 2.0%, respectively, of net assets.
2 Affiliated money market fund available only to Vanguard funds and certain trusts and accounts managed by Vanguard. Rate shown is the 7-day yield.
3 Includes $229,994,000 of collateral received for securities on loan.
4 The issuer operates under a congressional charter; its securities are not backed by the full faith and credit of the U.S. government.
5 Securities with a value of $1,500,000 have been segregated as initial margin for open futures contracts.
ADR—American Depositary Receipt.
REIT—Real Estate Investment Trust.
See accompanying Notes, which are an integral part of the Financial Statements.
24
Developed Markets Index Fund
| |
| Statement of Operations | |
| |
| | Year Ended |
| | October 31, 2010 |
| | ($000) |
| Investment Income | |
| Income | |
| Dividends1 | 252,692 |
| Interest2 | 39 |
| Security Lending | 7,951 |
| Total Income | 260,682 |
| Expenses | |
| The Vanguard Group—Note B | |
| Investment Advisory Services | 438 |
| Management and Administrative—Investor Shares | 5,403 |
| Management and Administrative—Institutional Shares | 1,226 |
| Marketing and Distribution—Investor Shares | 701 |
| Marketing and Distribution—Institutional Shares | 1,004 |
| Custodian Fees | 1,379 |
| Auditing Fees | 47 |
| Shareholders’ Reports—Investor Shares | 61 |
| Shareholders’ Reports—Institutional Shares | 2 |
| Trustees’ Fees and Expenses | 11 |
| Total Expenses | 10,272 |
| Net Investment Income | 250,410 |
| Realized Net Gain (Loss) | |
| Investment Securities Sold | (57,619) |
| Futures Contracts | 933 |
| Foreign Currencies and Forward Currency Contracts | 4,307 |
| Realized Net Gain (Loss) | (52,379) |
| Change in Unrealized Appreciation (Depreciation) | |
| Investment Securities | 593,253 |
| Futures Contracts | (209) |
| Foreign Currencies and Forward Currency Contracts | 1,400 |
| Change in Unrealized Appreciation (Depreciation) | 594,444 |
| Net Increase (Decrease) in Net Assets Resulting from Operations | 792,475 |
| 1 Dividends are net of foreign withholding taxes of $12,891,000. | |
| 2 Interest income from an affiliated company of the fund was $26,000. | |
See accompanying Notes, which are an integral part of the Financial Statements.
25
Developed Markets Index Fund
| | |
| Statement of Changes in Net Assets | | |
| |
| | Year Ended October 31, |
| | 2010 | 2009 |
| | ($000) | ($000) |
| Increase (Decrease) in Net Assets | | |
| Operations | | |
| Net Investment Income | 250,410 | 139,382 |
| Realized Net Gain (Loss) | (52,379) | (526,521) |
| Change in Unrealized Appreciation (Depreciation) | 594,444 | 947,092 |
| Net Increase (Decrease) in Net Assets Resulting from Operations | 792,475 | 559,953 |
| Distributions | | |
| Net Investment Income | | |
| Investor Shares | (35,226) | (121,978) |
| Institutional Shares | — | — |
| Realized Capital Gain | | |
| Investor Shares | — | — |
| Institutional Shares | — | — |
| Total Distributions | (35,226) | (121,978) |
| Capital Share Transactions | | |
| Investor Shares | 15,292 | 199,012 |
| Institutional Shares | 6,411,271 | — |
| Net Increase (Decrease) from Capital Share Transactions | 6,426,563 | 199,012 |
| Total Increase (Decrease) | 7,183,812 | 636,987 |
| Net Assets | | |
| Beginning of Period | 2,935,749 | 2,298,762 |
| End of Period1 | 10,119,561 | 2,935,749 |
| 1 Net Assets—End of Period includes undistributed net investment income of $224,910,000 and $18,755,000. | |
See accompanying Notes, which are an integral part of the Financial Statements.
26
Developed Markets Index Fund
Financial Highlights
| | | | | |
| Investor Shares | | | | | |
| |
| For a Share Outstanding | | | Year Ended October 31, |
| Throughout Each Period | 2010 | 2009 | 2008 | 2007 | 2006 |
| Net Asset Value, Beginning of Period | $9.26 | $7.79 | $14.91 | $12.15 | $9.75 |
| Investment Operations | | | | | |
| Net Investment Income | .2651 | .4522 | .3691 | .305 | .219 |
| Net Realized and Unrealized Gain (Loss) | | | | | |
| on Investments | .644 | 1.416 | (7.097) | 2.759 | 2.400 |
| Total from Investment Operations | .909 | 1.868 | (6.728) | 3.064 | 2.619 |
| Distributions | | | | | |
| Dividends from Net Investment Income | (.109) | (.398) | (.387) | (.299) | (.219) |
| Distributions from Realized Capital Gains | — | — | (.005) | (.005) | — |
| Total Distributions | (.109) | (.398) | (.392) | (.304) | (.219) |
| Net Asset Value, End of Period | $10.06 | $9.26 | $7.79 | $14.91 | $12.15 |
| |
| Total Return3 | 9.87% | 25.23% | -46.24% | 25.67% | 27.27% |
| |
| Ratios/Supplemental Data | | | | | |
| Net Assets, End of Period (Millions) | $3,198 | $2,936 | $2,299 | $3,976 | $2,572 |
| Ratio of Total Expenses to | | | | | |
| Average Net Assets | 0.22% | 0.10% | — | — | — |
| Acquired Fund Fees and Expenses | — | 0.15% | 0.22% | 0.22% | 0.27% |
| Ratio of Net Investment Income to | | | | | |
| Average Net Assets | 3.09% | 5.93%2 | 3.04% | 2.05% | 1.82% |
| Portfolio Turnover Rate | 13% | 14%4 | 13% | 7% | 9% |
1 Calculated based on average shares outstanding.
2 Net investment income per share and the ratio of net investment income to average net assets include $.400 and 5.19%, respectively, of annual dividends received from Vanguard mutual funds in December 2008. Effective in June 2009, the fund’s equity investments are solely in common stocks.
3 Total returns do not include transaction or account service fees that may have applied in the periods shown. Fund prospectuses provide information about any applicable transaction and account service fees.
4 Excludes the value of securities received and mutual fund shares delivered in connection with a change in the fund’s investment policy to invest directly in individual stocks and reduce the fund’s investment in Vanguard mutual funds.
See accompanying Notes, which are an integral part of the Financial Statements.
27
Developed Markets Index Fund
Financial Highlights
| |
| Institutional Shares | |
| | January 22, 20101 to |
| For a Share Outstanding Throughout the Period | October 31, 2010 |
| Net Asset Value, Beginning of Period | $9.28 |
| Investment Operations | |
| Net Investment Income | .2422 |
| Net Realized and Unrealized Gain (Loss) on Investments | .468 |
| Total from Investment Operations | .710 |
| Distributions | |
| Dividends from Net Investment Income | — |
| Distributions from Realized Capital Gains | — |
| Total Distributions | — |
| Net Asset Value, End of Period | $9.99 |
| |
| Total Return3 | 7.65% |
| |
| Ratios/Supplemental Data | |
| Net Assets, End of Period (Millions) | $6,922 |
| Ratio of Total Expenses to Average Net Assets | 0.07%4 |
| Ratio of Net Investment Income to Average Net Assets | 3.24%4 |
| Portfolio Turnover Rate | 13% |
1 Inception. See Note H in Notes to Financial Statements.
2 Calculated based on average shares outstanding.
3 Total returns do not include transaction fees that may have applied in the period shown. Fund prospectuses provide information about any applicable transaction fees.
4 Annualized.
See accompanying Notes, which are an integral part of the Financial Statements.
28
Developed Markets Index Fund
Notes to Financial Statements
Vanguard Developed Markets Index Fund is registered under the Investment Company Act of 1940 as an open-end investment company, or mutual fund. The fund invests in securities of foreign issuers, which may subject it to investment risks not normally associated with investing in securities of U.S. corporations. The fund offers two classes of shares: Investor Shares and Institutional Shares. Investor Shares are available to any investor who meets the fund’s minimum purchase requirements. Institutional Shares were first issued on January 22, 2010 (in connection with the acquisition of Vanguard Institutional Developed Markets Index Fund, see Note H), and are designed for investors who meet certain administrative, service, and account-size criteria.
A. The following significant accounting policies conform to generally accepted accounting principles for U.S. mutual funds. The fund consistently follows such policies in preparing its financial statements.
1. Security Valuation: Securities are valued as of the close of trading on the New York Stock Exchange (generally 4 p.m., Eastern time) on the valuation date. Equity securities are valued at the latest quoted sales prices or official closing prices taken from the primary market in which each security trades; such securities not traded on the valuation date are valued at the mean of the latest quoted bid and asked prices. Securities for which market quotations are not readily available, or whose values have been affected by events occurring before the fund’s pricing time but after the close of the securities’ primary markets, are valued at their fair values calculated according to procedures adopted by the board of trustees. These procedures include obtaining quotations from an independent pricing service, monitoring news to identify significant market- or security-specific events, and evaluating changes in the va lues of foreign market proxies (for example, ADRs, futures contracts, or exchange-traded funds), between the time the foreign markets close and the fund’s pricing time. When fair-value pricing is employed, the prices of securities used by a fund to calculate its net asset value may differ from quoted or published prices for the same securities. Investments in Vanguard Market Liquidity Fund are valued at that fund’s net asset value. Temporary cash investments acquired over 60 days to maturity are valued using the latest bid prices or using valuations based on a matrix system (which considers such factors as security prices, yields, maturities, and ratings), both as furnished by independent pricing services. Other temporary cash investments are valued at amortized cost, which approximates market value.
2. Foreign Currency: Securities and other assets and liabilities denominated in foreign currencies are translated into U.S. dollars using exchange rates obtained from an independent third party as of the fund’s pricing time on the valuation date. Realized gains (losses) and unrealized appreciation (depreciation) on investment securities include the effects of changes in exchange rates since the securities were purchased, combined with the effects of changes in security prices. Fluctuations in the value of other assets and liabilities resulting from changes in exchange rates are recorded as unrealized foreign currency gains (losses) until the assets or liabilities are settled in cash, at which time they are recorded as realized foreign currency gains (losses).
3. Futures and Forward Currency Contracts: The fund uses index futures contracts to a limited extent, with the objectives of maintaining full exposure to the stock market, enhancing returns, maintaining liquidity, and minimizing transaction costs. The fund may purchase futures contracts to immediately invest incoming cash in the market, or sell futures in response to cash outflows, thereby simulating a fully invested position in the underlying index while maintaining a cash balance for liquidity. The fund may seek to enhance returns by using futures contracts instead of the underlying securities when futures are believed to be priced more attractively than the underlying securities. The primary risks associated with the use of futures contracts are imperfect correlation between changes in market values of stocks held by the fund and the prices of futures contracts, and the possibility of an illiquid market.
29
Developed Markets Index Fund
The fund also enters into forward currency contracts to provide the appropriate currency exposure related to any open futures contracts. The fund’s risks in using these contracts include movement in the values of the foreign currencies relative to the U.S. dollar and the ability of the counterparties to fulfill their obligations under the contracts. Counterparty risk is mitigated by entering into forward currency contracts only with highly rated counterparties, by a master netting arrangement between the fund and the counterparty, and by the posting of collateral by the counterparty. The forward currency contracts contain provisions whereby a counterparty may terminate open contracts if the fund’s net assets decline below a certain level, triggering a payment by the fund if the fund is in a net liability position at the time of the termination. The payment amount would be reduced by any collateral the fund has po sted. Any securities posted as collateral for open contracts are noted in the Statement of Net Assets.
Futures contracts are valued at their quoted daily settlement prices. Forward currency contracts are valued at their quoted daily prices obtained from an independent third party, adjusted for currency risk based on the expiration date of each contract. The aggregate principal amounts of the contracts are not recorded in the Statement of Net Assets. Fluctuations in the value of the contracts are recorded in the Statement of Net Assets as an asset (liability) and in the Statement of Operations as unrealized appreciation (depreciation) until the contracts are closed, when they are recorded as realized gains (losses) on futures or forward currency contracts.
4. Federal Income Taxes: The fund intends to continue to qualify as a regulated investment company and distribute all of its taxable income. Management has analyzed the fund’s tax positions taken for all open federal income tax years (October 31, 2007–2010), and has concluded that no provision for federal income tax is required in the fund’s financial statements.
5. Distributions: Distributions to shareholders are recorded on the ex-dividend date.
6. Security Lending: The fund may lend its securities to qualified institutional borrowers to earn additional income. Security loans are required to be secured at all times by collateral at least equal to the market value of securities loaned. The fund invests cash collateral received in Vanguard Market Liquidity Fund, and records a liability for the return of the collateral, during the period the securities are on loan. Security lending income represents fees charged to borrowers plus income earned on investing cash collateral, less expenses associated with the loan.
7. Other: Dividend income is recorded on the ex-dividend date. Interest income includes income distributions received from Vanguard Market Liquidity Fund and is accrued daily. Security transactions are accounted for on the date securities are bought or sold. Costs used to determine realized gains (losses) on the sale of investment securities are those of the specific securities sold. Through June 18, 2009, fees assessed on redemptions of capital shares were reallocated proportionately to the funds in which the fund invested; effective June, 19, 2009, such fees are credited to paid-in capital.
Each class of shares has equal rights as to assets and earnings, except that each class separately bears certain class-specific expenses related to maintenance of shareholder accounts (included in Management and Administrative expenses) and shareholder reporting. Marketing and distribution expenses are allocated to each class of shares based on a method approved by the board of trustees. Income, other non-class-specific expenses, and gains and losses on investments are allocated to each class of shares based on its relative net assets.
30
Developed Markets Index Fund
B. The Vanguard Group furnishes at cost investment advisory, corporate management, administrative, marketing, and distribution services. The costs of such services are allocated to the fund under methods approved by the board of trustees. The fund has committed to provide up to 0.40% of its net assets in capital contributions to Vanguard. At October 31, 2010, the fund had contributed capital of $1,688,000 to Vanguard (included in Other Assets), representing 0.02% of the fund’s net assets and 0.68% of Vanguard’s capitalization. The fund’s trustees and officers are also directors and officers of Vanguard.
C. Various inputs may be used to determine the value of the fund’s investments. These inputs are summarized in three broad levels for financial statement purposes. The inputs or methodologies used to value securities are not necessarily an indication of the risk associated with investing in those securities.
Level 1—Quoted prices in active markets for identical securities.
Level 2—Other significant observable inputs (including quoted prices for similar securities, interest rates, prepayment speeds, credit risk, etc.).
Level 3—Significant unobservable inputs (including the fund’s own assumptions used to determine the fair value of investments).
The following table summarizes the fund’s investments as of October 31, 2010, based on the inputs
used to value them:
| | | |
| | Level 1 | Level 2 | Level 3 |
| Investments | ($000) | ($000) | ($000) |
| Common Stocks | 19,271 | 10,064,201 | — |
| Temporary Cash Investments | 231,835 | 5,998 | — |
| Futures Contracts—Liabilities1 | (103) | — | — |
| Forward Currency Contracts—Assets | — | 249 | — |
| Forward Currency Contracts—Liabilities | — | (179) | — |
| Total | 251,003 | 10,070,269 | — |
| 1 Represents variation margin on the last day of the reporting period. | | | |
D. At October 31, 2010, the fair values of derivatives were reflected in the Statement of Net Assets as follows:
| | | |
| | | Foreign | |
| | Equity | Exchange | |
| | Contracts1 | Contracts | Total |
| Statement of Net Assets Caption | ($000) | ($000) | ($000) |
| Other Assets | — | 249 | 249 |
| Liabilities | (103) | (179) | (282) |
| 1 Represents variation margin on the last day of the reporting period. | | | |
31
Developed Markets Index Fund
Realized net gain (loss) and the change in unrealized appreciation (depreciation) on derivatives for the year ended October 31, 2010, were:
| | | |
| | | Foreign | |
| | Equity | Exchange | |
| | Contracts | Contracts | Total |
| Realized Net Gain (Loss) on Derivatives | ($000) | ($000) | ($000) |
| Futures Contracts | 933 | — | 933 |
| Forward Currency Contracts | — | 537 | 537 |
| Realized Net Gain (Loss) on Derivatives | 933 | 537 | 1,470 |
| |
| Change in Unrealized Appreciation (Depreciation) on Derivatives | | | |
| Futures Contracts | (209) | — | (209) |
| Forward Currency Contracts | — | 70 | 70 |
| Change in Unrealized Appreciation (Depreciation) on Derivatives | (209) | 70 | (139) |
At October 31, 2010, the aggregate settlement value of open futures contracts and the related unrealized appreciation (depreciation) were:
| | | | |
| | | | | ($000) |
| | | | Aggregate | |
| | | Number of | Settlement | Unrealized |
| | | Long (Short) | Value | Appreciation |
| Futures Contracts | Expiration | Contracts | Long (Short) | (Depreciation) |
| Dow Jones EURO STOXX 50 Index | December 2010 | 335 | 13,219 | 73 |
| FTSE 100 Index | December 2010 | 103 | 9,322 | (32) |
| Topix Index | December 2010 | 84 | 8,405 | (218) |
| S&P ASX 200 Index | December 2010 | 43 | 4,897 | (32) |
Unrealized appreciation (depreciation) on open FTSE 100 Index futures contracts is required to be treated as realized gain (loss) for tax purposes.
32
Developed Markets Index Fund
At October 31, 2010, the fund had open forward currency contracts to receive and deliver currencies as follows. Unrealized appreciation (depreciation) on open forward currency contracts is treated as realized gain (loss) for tax purposes.
| | | | | | |
| | | | | | | Unrealized |
| | Contract | | | | | Appreciation |
| | Settlement | | | Contract Amount (000) | (Depreciation) |
| Counterparty | Date | | Receive | | Deliver | ($000) |
| UBS AG | 12/22/10 | EUR | 9,485 | USD | 13,201 | 81 |
| UBS AG | 12/22/10 | GBP | 5,801 | USD | 9,295 | 115 |
| UBS AG | 12/22/10 | AUD | 5,010 | USD | 4,908 | 51 |
| UBS AG | 12/15/10 | USD | 6,613 | JPY | 532,171 | (177) |
AUD—Australian dollar.
EUR—Euro.
GBP—British pound.
JPY—Japanese yen.
USD—U.S. dollar.
At October 31, 2010, the counterparty had deposited in a segregated account securities with a value sufficient to cover substantially all amounts due to the fund in connection with open forward currency contracts.
The fund had net unrealized foreign currency gains of $1,265,000 resulting from the translation of other assets and liabilities at October 31, 2010.
E. Distributions are determined on a tax basis and may differ from net investment income and realized capital gains for financial reporting purposes. Differences may be permanent or temporary. Permanent differences are reclassified among capital accounts in the financial statements to reflect their tax character. Temporary differences arise when certain items of income, expense, gain, or loss are recognized in different periods for financial statement and tax purposes; these differences will reverse at some time in the future. Differences in classification may also result from the treatment of short-term gains as ordinary income for tax purposes.
During the year ended October 31, 2010, the fund realized net foreign currency gains of $3,770,000, which increased distributable net income for tax purposes; accordingly, such gains have been reclassified from accumulated net realized losses to undistributed net investment income. Certain of the fund’s investments are in securities considered to be “passive foreign investment companies,” for which any unrealized appreciation and/or realized gains are required to be included in distributable net income for tax purposes. Unrealized appreciation of $4,433,000 on the fund’s passive foreign investment company holdings at October 31, 2009, and $12,867,000 on passive foreign investment company holdings acquired from Vanguard Institutional Developed Markets Index Fund that had been distributed by Vanguard Institutional Developed Markets Index Fund prior to its acquisition by the fund (see Note H), has been dis tributed and is reflected in the balance of undistributed net investment income. During the year ended October 31, 2010, the fund realized gains on the sale of passive foreign investment companies of $68,000, which have been included in current and prior periods’ taxable income; accordingly, such gains have been reclassified from accumulated net realized losses to undistributed net investment income. Since October 31, 2009, the fund’s passive investment company holdings have appreciated in value, increasing the amount of taxable income available for distribution as of October 31, 2010, by $8,135,000. Unrealized appreciation on the fund’s passive foreign investment company holdings at October 31, 2010, was $25,435,000.
33
Developed Markets Index Fund
For tax purposes, at October 31, 2010, the fund had $255,416,000 of ordinary income available for distribution. The fund had available capital loss carryforwards totaling $1,898,814,000 to offset future net capital gains of $1,279,156,000 through October 31, 2016, $585,420,000 through October 31, 2017, and $34,238,000 through October 31, 2018.
The fund acquired additional realized losses of $1,285,352,000 to offset future net capital gains in connection with the acquisition of Vanguard Institutional Developed Markets Index Fund in January 2010 (see Note H); these losses have been reclassified from paid-in capital to accumulated net realized losses. Acquired capital loss carryforwards of $8,141,000 expired on October 31, 2010; accordingly, such losses have been reclassified from accumulated net realized losses to paid-in capital.
At October 31, 2010, the cost of investment securities for tax purposes was $8,544,403,000. Net unrealized appreciation of investment securities for tax purposes was $1,776,902,000, consisting of unrealized gains of $2,029,921,000 on securities that had risen in value since their purchase and $253,019,000 in unrealized losses on securities that had fallen in value since their purchase.
F. During the year ended October 31, 2010, the fund purchased $1,885,029,000 of investment securities and sold $993,542,000 of investment securities, other than temporary cash investments.
G. Capital share transactions for each class of shares were:
| | | | |
| | | | Year Ended October 31, |
| | | 2010 | | 2009 |
| | Amount | Shares | Amount | Shares |
| | ($000) | (000) | ($000) | (000) |
| Investor Shares | | | | |
| Issued | 891,318 | 95,563 | 865,447 | 112,058 |
| Issued in Lieu of Cash Distributions | 32,170 | 3,355 | 110,662 | 14,874 |
| Redeemed1 | (908,196) | (97,962) | (777,097)2 | (104,948) |
| Net Increase (Decrease)—Investor Shares | 15,292 | 956 | 199,012 | 21,984 |
| Institutional Shares3 | | | | |
| Issued | 1,992,336 | 220,254 | — | — |
| Issued in Connection with Acquisition of Vanguard | | | | |
| Institutional Developed Markets Index Fund | 5,729,120 | 617,209 | | |
| Issued in Lieu of Cash Distributions | — | — | — | — |
| Redeemed1 | (1,310,185) | (144,380) | — | — |
| Net Increase (Decrease)—Institutional Shares | 6,411,271 | 693,083 | — | — |
1 Net of redemption fees for fiscal 2010 and 2009 of $136,000 and $45,000, respectively (fund totals).
2 The fund collected redemption fees of $192,000, which were reallocated proportionately to the funds in which the fund invested.
3 Inception date was January 22, 2010.
34
Developed Markets Index Fund
H. On January 22, 2010, the fund acquired all the net assets of Vanguard Institutional Developed Markets Index Fund pursuant to a plan of reorganization approved by the funds’ board of trustees. The acquisition was accomplished by a tax-free exchange of 617,209,000 Institutional Shares of the fund for 617,209,000 shares of the Institutional Developed Markets Index Fund outstanding as of the close of business on January 22, 2010. The Institutional Developed Markets Index Fund’s net assets as of the close of business on January 22, 2010, of $5,729,120,000, including $822,409,000 of unrealized appreciation, were combined with the fund’s net assets. The net assets of the fund immediately before the acquisition were $3,143,852,000. The net assets of the fund immediately following the acquisition were $8,872,972,000.
Assuming that the acquisition had been completed on November 1, 2009, the beginning of the fund’s reporting period, the fund’s pro forma results of operations for the year ended October 31, 2010, would be:
| |
| | ($000) |
| Net Investment Income | 269,723 |
| Realized Net Gain (Loss) | (58,429) |
| Change in Unrealized Appreciation (Depreciation) | 685,446 |
| Net Increase (Decrease) in Net Assets Resulting from Operations | 896,740 |
Because the combined funds have been managed as a single integrated fund since the acquisition was completed, it is not practical to separate the results of operations of Vanguard Institutional Developed Markets Fund that have been included in the fund’s statement of operations since January 22, 2010.
I. In preparing the financial statements as of October 31, 2010, management considered the impact of subsequent events for potential recognition or disclosure in these financial statements.
35
Report of Independent Registered Public Accounting Firm
To the Trustees of Vanguard STAR Funds and the Shareholders of Vanguard Developed Markets Index Fund:
In our opinion, the accompanying statement of net assets and the related statements of operations and of changes in net assets and the financial highlights present fairly, in all material respects, the financial position of Vanguard Developed Markets Index Fund (constituting a separate portfolio of Vanguard STAR Funds, hereafter referred to as the “Fund”) at October 31, 2010, the results of its operations for the year then ended, the changes in its net assets for each of the two years in the period then ended and the financial highlights for each of the periods indicated, in conformity with accounting principles generally accepted in the United States of America. These financial statements and financial highlights (hereafter referred to as “financial statements”) are the responsibility of the Fund’s management; our responsibility is to express an opinion on these financial statements based on our a udits. We conducted our audits of these financial statements in accordance with the standards of the Public Company Accounting Oversight Board (United States). Those standards require that we plan and perform the audit to obtain reasonable assurance about whether the financial statements are free of material misstatement. An audit includes examining, on a test basis, evidence supporting the amounts and disclosures in the financial statements, assessing the accounting principles used and significant estimates made by management, and evaluating the overall financial statement presentation. We believe that our audits, which included confirmation of securities at October 31, 2010 by correspondence with the custodian and brokers and by agreement to the underlying ownership records of Vanguard Market Liquidity Fund, provides a reasonable basis for our opinion.
PricewaterhouseCoopers LLP
Philadelphia, Pennsylvania
December 14, 2010
|
| Special 2010 tax information (unaudited) for Vanguard Developed Markets Index Fund |
This information for the fiscal year ended October 31, 2010, is included pursuant to provisions of the Internal Revenue Code.
The fund distributed $26,282,000 of qualified dividend income to shareholders during the fiscal year.
The fund designates to shareholders foreign source income of $214,130,000 and foreign taxes paid of $12,063,000. Shareholders will receive more detailed information with their Form 1099-DIV in January 2011 to determine the calendar year amounts to be included on their 2010 tax returns.
36
Your Fund’s After-Tax Returns
This table presents returns for your fund both before and after taxes. The after-tax returns are shown in two ways: (1) assuming that an investor owned the fund during the entire period and paid taxes on the fund’s distributions, and (2) assuming that an investor paid taxes on the fund’s distributions and sold all shares at the end of each period.
Calculations are based on the highest individual federal income tax and capital gains tax rates in effect at the times of the distributions and the hypothetical sales. State and local taxes were not considered. After-tax returns reflect any qualified dividend income , using actual prior-year figures and estimates for 2010. (In the example, returns after the sale of fund shares may be higher than those assuming no sale. This occurs when the sale would have produced a capital loss. The calculation assumes that the investor received a tax deduction for the loss.) The table shows returns for Investor Shares only; returns for other share classes will differ. Please note that your actual after-tax returns will depend on your tax situation and may differ from those shown. Also note that if you own the fund in a tax-deferred account, such as an individual retirement account or a 401(k) plan, this information does not apply to you. Such accounts are not subject to current taxes.
Finally, keep in mind that a fund’s performance—whether before or after taxes—does not guarantee future results.
| | | |
| Average Annual Total Returns: Developed Markets Index Fund Investor Shares | | |
| Periods Ended October 31, 2010 | | | |
| | One | Five | Ten |
| | Year | Years | Years |
| Returns Before Taxes | 9.87% | 3.42% | 3.17% |
| Returns After Taxes on Distributions | 9.61 | 2.87 | 2.59 |
| Returns After Taxes on Distributions and Sale of Fund Shares | 6.57 | 2.79 | 2.47 |
Returns do not reflect the 2% fee on redemptions of shares held for less than two months.
37
About Your Fund’s Expenses
As a shareholder of the fund, you incur ongoing costs, which include costs for portfolio management, administrative services, and shareholder reports (like this one), among others. Operating expenses, which are deducted from a fund’s gross income, directly reduce the investment return of the fund.
A fund’s expenses are expressed as a percentage of its average net assets. This figure is known as the expense ratio. The following examples are intended to help you understand the ongoing costs (in dollars) of investing in your fund and to compare these costs with those of other mutual funds. The examples are based on an investment of $1,000 made at the beginning of the period shown and held for the entire period.
The accompanying table illustrates your fund’s costs in two ways:
• Based on actual fund return. This section helps you to estimate the actual expenses that you paid over the period. The ”Ending Account Value“ shown is derived from the fund‘s actual return, and the third column shows the dollar amount that would have been paid by an investor who started with $1,000 in the fund. You may use the information here, together with the amount you invested, to estimate the expenses that you paid over the period.
To do so, simply divide your account value by $1,000 (for example, an $8,600 account value divided by $1,000 = 8.6), then multiply the result by the number given for your fund under the heading ”Expenses Paid During Period.“
• Based on hypothetical 5% yearly return. This section is intended to help you compare your fund‘s costs with those of other mutual funds. It assumes that the fund had a yearly return of 5% before expenses, but that the expense ratio is unchanged. In this case—because the return used is not the fund’s actual return—the results do not apply to your investment. The example is useful in making comparisons because the Securities and Exchange Commission requires all mutual funds to calculate expenses based on a 5% return. You can assess your fund’s costs by comparing this hypothetical example with the hypothetical examples that appear in shareholder reports of other funds.
Note that the expenses shown in the table are meant to highlight and help you compare ongoing costs only and do not reflect transaction costs incurred by the fund for buying and selling securities. Further, the expenses do not include the 2% fee on redemptions of shares held for less than two months, nor do they include the account service fee described in the prospectus. If such fees were applied to your account, your costs would be higher. Your fund does not carry a “sales load.” The calculations assume no shares were bought or sold during the period. Your actual costs may have been higher or lower, depending on the amount of your investment and the timing of any purchases or redemptions.
You can find more information about the fund’s expenses, including annual expense ratios, in the Financial Statements section of this report. For additional information on operating expenses and other shareholder costs, please refer to your fund’s current prospectus.
38
| | | |
| Six Months Ended October 31, 2010 | | | |
| | Beginning | Ending | Expenses |
| | Account Value | Account Value | Paid During |
| Developed Markets Index Fund | 4/30/2010 | 10/31/2010 | Period |
| Based on Actual Fund Return | | | |
| Investor Shares | $1,000.00 | $1,066.81 | $1.04 |
| Institutional Shares | 1,000.00 | 1,067.31 | 0.36 |
| Based on Hypothetical 5% Yearly Return | | | |
| Investor Shares | $1,000.00 | $1,024.20 | $1.02 |
| Institutional Shares | 1,000.00 | 1,024.85 | 0.36 |
The calculations are based on expenses incurred in the most recent six-month period. The fund’s annualized six-month expense ratios for that period are 0.20% for Investor Shares and 0.07% for Institutional Shares. The dollar amounts shown as “Expenses Paid” are equal to the annualized expense ratio multiplied by the average account value over the period, multiplied by the number of days in the most recent six-month period, then divided by the number of days in the most recent 12-month period.
39
Glossary
Beta. A measure of the magnitude of a fund’s past share-price fluctuations in relation to the ups and downs of a given market index. The index is assigned a beta of 1.00. Compared with a given index, a fund with a beta of 1.20 typically would have seen its share price rise or fall by 12% when the index rose or fell by 10%. For this report, beta is based on returns over the past 36 months for both the fund and the index. Note that a fund’s beta should be reviewed in conjunction with its R-squared (see definition). The lower the R-squared, the less correlation there is between the fund and the index, and the less reliable beta is as an indicator of volatility.
Dividend Yield. Dividend income earned by stocks, expressed as a percentage of the aggregate market value (or of net asset value, for a fund). The yield is determined by dividing the amount of the annual dividends by the aggregate value (or net asset value) at the end of the period. For a fund, the dividend yield is based solely on stock holdings and does not include any income produced by other investments.
bThe average annual rate of growth in earnings over the past five years for the stocks now in a fund.
Equity Exposure. A measure that reflects a fund’s investments in stocks and stock futures. Any holdings in short-term reserves are excluded.
Expense Ratio. The percentage of a fund’s average net assets used to pay its annual administrative and advisory expenses. These expenses directly reduce returns to investors.
Inception Date. The date on which the assets of a fund (or one of its share classes) are first invested in accordance with the fund’s investment objective. For funds with a subscription period, the inception date is the day after that period ends. Investment performance is measured from the inception date.
Median Market Cap. An indicator of the size of companies in which a fund invests; the midpoint of market capitalization (market price x shares outstanding) of a fund’s stocks, weighted by the proportion of the fund’s assets invested in each stock. Stocks representing half of the fund’s assets have market capitalizations above the median, and the rest are below it.
Price/Book Ratio. The share price of a stock divided by its net worth, or book value, per share. For a fund, the weighted average price/book ratio of the stocks it holds.
Price/Earnings Ratio. The ratio of a stock’s current price to its per-share earnings over the past year. For a fund, the weighted average P/E of the stocks it holds. P/E is an indicator of market expectations about corporate prospects; the higher the P/E, the greater the expectations for a company’s future growth.
R-Squared. A measure of how much of a fund’s past returns can be explained by the returns from the market in general, as measured by a given index. If a fund’s total returns were precisely synchronized with an index’s returns, its R-squared would be 1.00. If the fund’s returns bore no relationship to the index’s returns, its R-squared would be 0. For this report, R-squared is based on returns over the past 36 months for both the fund and the index.
Return on Equity. The annual average rate of return generated by a company during the past five years for each dollar of shareholder’s equity (net income divided by shareholder’s equity). For a fund, the weighted average return on equity for the companies whose stocks it holds.
40
Short-Term Reserves. The percentage of a fund invested in highly liquid, short-term securities that can be readily converted to cash.
Turnover Rate. An indication of the fund’s trading activity. Funds with high turnover rates incur higher transaction costs and may be more likely to distribute capital gains (which may be taxable to investors). The turnover rate excludes in-kind transactions, which have minimal impact on costs.
41
This page intentionally left blank.
This page intentionally left blank.
The People Who Govern Your Fund
The trustees of your mutual fund are there to see that the fund is operated and managed in your best interests since, as a shareholder, you are a part owner of the fund. Your fund’s trustees also serve on the board of directors of The Vanguard Group, Inc., which is owned by the Vanguard funds and provides services to them on an at-cost basis.
A majority of Vanguard’s board members are independent, meaning that they have no affiliation with Vanguard or the funds they oversee, apart from the sizable personal investments they have made as private individuals. The independent board members have distinguished backgrounds in business, academia, and public service. Each of the trustees and executive officers oversees 178 Vanguard funds.
The following table provides information for each trustee and executive officer of the fund. More information about the trustees is in the Statement of Additional Information, which can be obtained, without charge, by contacting Vanguard at 800-662-7447, or online at vanguard.com.
| |
| Interested Trustee1 | Amy Gutmann |
| | Born 1949. Trustee Since June 2006. Principal |
| F. William McNabb III | Occupation(s) During the Past Five Years: President |
| Born 1957. Trustee Since July 2009. Chairman of the | of the University of Pennsylvania; Christopher H. |
| Board. Principal Occupation(s) During the Past Five | Browne Distinguished Professor of Political Science |
| Years: Chairman of the Board of The Vanguard Group, | in the School of Arts and Sciences with secondary |
| Inc., and of each of the investment companies served | appointments at the Annenberg School for Commu- |
| by The Vanguard Group, since January 2010; Director | nication and the Graduate School of Education |
| of The Vanguard Group since 2008; Chief Executive | of the University of Pennsylvania; Director of |
| Officer and President of The Vanguard Group and of | Carnegie Corporation of New York, Schuylkill River |
| each of the investment companies served by The | Development Corporation, and Greater Philadelphia |
| Vanguard Group since 2008; Director of Vanguard | Chamber of Commerce; Trustee of the National |
| Marketing Corporation; Managing Director of The | Constitution Center; Chair of the Presidential |
| Vanguard Group (1995–2008) . | Commission for the Study of Bioethical Issues. |
| |
| | JoAnn Heffernan Heisen |
| Independent Trustees | Born 1950. Trustee Since July 1998. Principal |
| | Occupation(s) During the Past Five Years: Corporate |
| Emerson U. Fullwood | Vice President and Chief Global Diversity Officer |
| Born 1948. Trustee Since January 2008. Principal | since 2006 (retired 2008) and Member of the |
| Occupation(s) During the Past Five Years: Executive | Executive Committee (retired 2008) of Johnson & |
| Chief Staff and Marketing Officer for North America | Johnson (pharmaceuticals/consumer products); Vice |
| and Corporate Vice President (retired 2008) of Xerox | President and Chief Information Officer of Johnson & |
| Corporation (document management products and | Johnson (1997–2005); Director of the University |
| services); Director of SPX Corporation (multi-industry | Medical Center at Princeton and Women’s Research |
| manufacturing), the United Way of Rochester, | and Education Institute; Member of the Advisory |
| Amerigroup Corporation (managed health care), | Board of the Maxwell School of Citizenship and Public |
| the University of Rochester Medical Center, and | Affairs at Syracuse University. |
| Monroe Community College Foundation. | |
| | F. Joseph Loughrey |
| Rajiv L. Gupta | Born 1949. Trustee Since October 2009. Principal |
| Born 1945. Trustee Since December 2001.2 | Occupation(s) During the Past Five Years: President |
| Principal Occupation(s) During the Past Five Years: | and Chief Operating Officer since 2005 (retired 2009) |
| Chairman and Chief Executive Officer (retired 2009) | and Vice Chairman of the Board (2008–2009) of |
| and President (2006–2008) of Rohm and Haas Co. | Cummins Inc. (industrial machinery); Director of |
| (chemicals); Director of Tyco International, Ltd. | SKF AB (industrial machinery), Hillenbrand, Inc. |
| (diversified manufacturing and services) and Hewlett- | (specialized consumer services), Sauer-Danfoss Inc. |
| Packard Co. (electronic computer manufacturing); | (machinery), the Lumina Foundation for Education, |
| Trustee of The Conference Board; Member of the | and Oxfam America; Chairman of the Advisory |
| Board of Managers of Delphi Automotive LLP | Council for the College of Arts and Letters at the |
| (automotive components) . | University of Notre Dame. |
| | |
| André F. Perold | Kathryn J. Hyatt | |
| Born 1952. Trustee Since December 2004. Principal | Born 1955. Treasurer Since November 2008. Principal |
| Occupation(s) During the Past Five Years: George | Occupation(s) During the Past Five Years: Principal |
| Gund Professor of Finance and Banking at the Harvard | of The Vanguard Group, Inc.; Treasurer of each of |
| Business School; Chair of the Investment Committee | the investment companies served by The Vanguard |
| of HighVista Strategies LLC (private investment firm) . | Group since 2008; Assistant Treasurer of each of the |
| | investment companies served by The Vanguard Group |
| Alfred M. Rankin, Jr. | (1988–2008) . | |
| Born 1941. Trustee Since January 1993. Principal | | |
| Occupation(s) During the Past Five Years: Chairman, | Heidi Stam | |
| President, and Chief Executive Officer of NACCO | Born 1956. Secretary Since July 2005. Principal |
| Industries, Inc. (forklift trucks/housewares/lignite); | Occupation(s) During the Past Five Years: Managing |
| Director of Goodrich Corporation (industrial products/ | Director of The Vanguard Group, Inc., since 2006; |
| aircraft systems and services); Chairman of the | General Counsel of The Vanguard Group since 2005; |
| Federal Reserve Bank of Cleveland; Trustee of The | Secretary of The Vanguard Group and of each of the |
| Cleveland Museum of Art. | investment companies served by The Vanguard Group |
| | since 2005; Director and Senior Vice President of |
| Peter F. Volanakis | Vanguard Marketing Corporation since 2005; |
| Born 1955. Trustee Since July 2009. Principal | Principal of The Vanguard Group (1997–2006). |
| Occupation(s) During the Past Five Years: President | | |
| since 2007 and Chief Operating Officer since 2005 | | |
| of Corning Incorporated (communications equipment); | Vanguard Senior Management Team |
| President of Corning Technologies (2001–2005); | | |
| Director of Corning Incorporated and Dow Corning; | R. Gregory Barton | Michael S. Miller |
| Trustee of the Corning Incorporated Foundation and | Mortimer J. Buckley | James M. Norris |
| the Corning Museum of Glass; Overseer of the | Kathleen C. Gubanich | Glenn W. Reed |
| Amos Tuck School of Business Administration at | Paul A. Heller | George U. Sauter |
| Dartmouth College. | | |
| |
| | Chairman Emeritus and Senior Advisor |
| Executive Officers | | |
| | John J. Brennan | |
| Glenn Booraem | Chairman, 1996–2009 | |
| Born 1967. Controller Since July 2010. Principal | Chief Executive Officer and President, 1996–2008 |
| Occupation(s) During the Past Five Years: Principal | | |
| of The Vanguard Group, Inc.; Controller of each of | | |
| the investment companies served by The Vanguard | Founder | |
| Group since 2010; Assistant Controller of each of | | |
| the investment companies served by The Vanguard | John C. Bogle | |
| Group (2001–2010) . | Chairman and Chief Executive Officer, 1974–1996 |
| |
| Thomas J. Higgins | | |
| Born 1957. Chief Financial Officer Since September | | |
| 2008. Principal Occupation(s) During the Past Five | | |
| Years: Principal of The Vanguard Group, Inc.; Chief | | |
| Financial Officer of each of the investment companies | | |
| served by The Vanguard Group since 2008; Treasurer | | |
| of each of the investment companies served by The | | |
| Vanguard Group (1998–2008) . | | |
1 Mr. McNabb is considered an “interested person,” as defined in the Investment Company Act of 1940, because he is an officer of the Vanguard funds.
2 December 2002 for Vanguard Equity Income Fund, Vanguard Growth Equity Fund, the Vanguard Municipal Bond Funds, and the Vanguard State Tax-Exempt Funds.
| |
|
|  |
| P.O. Box 2600 |
| Valley Forge, PA 19482-2600 |
Connect with Vanguard® > vanguard.com
| The funds or securities referred to herein are not |
| Fund Information > 800-662-7447 | sponsored, endorsed, or promoted by MSCI, and MSCI |
| Direct Investor Account Services > 800-662-2739 | bears no liability with respect to any such funds or |
| Institutional Investor Services > 800-523-1036 | securities. For any such funds or securities, the |
| Text Telephone for People | prospectus or the Statement of Additional Information |
| With Hearing Impairment > 800-749-7273 | contains a more detailed description of the limited |
| | relationship MSCI has with The Vanguard Group and |
| This material may be used in conjunction | any related funds. |
| with the offering of shares of any Vanguard | |
| fund only if preceded or accompanied by | |
| the fund’s current prospectus. | |
| |
| All comparative mutual fund data are from Lipper Inc. or | |
| Morningstar, Inc., unless otherwise noted. | |
| |
| You can obtain a free copy of Vanguard’s proxy voting | |
| guidelines by visiting vanguard.com/proxyreporting or by | |
| calling Vanguard at 800-662-2739. The guidelines are | |
| also available from the SEC’s website, sec.gov. In | |
| addition, you may obtain a free report on how your fund | |
| voted the proxies for securities it owned during the 12 | |
| months ended June 30. To get the report, visit either | |
| vanguard.com/proxyreporting or sec.gov. | |
| |
| You can review and copy information about your fund at | |
| the SEC’s Public Reference Room in Washington, D.C. To | |
| find out more about this public service, call the SEC at | |
| 202-551-8090. Information about your fund is also | |
| available on the SEC’s website, and you can receive | |
| copies of this information, for a fee, by sending a | |
| request in either of two ways: via e-mail addressed to | |
| publicinfo@sec.gov or via regular mail addressed to the | |
| Public Reference Section, Securities and Exchange | |
| Commission, Washington, DC 20549-1520. | |
| |
| |
| | © 2010 The Vanguard Group, Inc. |
| | All rights reserved. |
| | Vanguard Marketing Corporation, Distributor. |
| |
| | Q2270 122010 |
Item 2: Code of Ethics. The Registrant has adopted a code of ethics that applies to the Registrant’s principal executive officer, principal financial officer, principal accounting officer or controller or persons performing similar functions. The Code of Ethics was amended during the reporting period covered by this report to make certain technical, non-material changes.
Item 3: Audit Committee Financial Expert. The following members of the Audit Committee have been determined by the Registrant’s Board of Trustees to be Audit Committee Financial Experts serving on its Audit Committee, and to be independent: Charles D. Ellis, Rajiv L. Gupta, JoAnn Heffernan Heisen, André F. Perold, and Alfred M. Rankin, Jr.
Item 4: Principal Accountant Fees and Services.
(a) Audit Fees.
Audit Fees of the Registrant
Fiscal Year Ended October 31, 2010: $158,000
Fiscal Year Ended October 31, 2009: $178,000
Aggregate Audit Fees of Registered Investment Companies in the Vanguard Group.
Fiscal Year Ended October 31, 2010: $3,607,060
Fiscal Year Ended October 31, 2009: $3,354,640
(b) Audit-Related Fees.
Fiscal Year Ended October 31, 2010: $791,350
Fiscal Year Ended October 31, 2009: $876,210
Includes fees billed in connection with assurance and related services provided to the Registrant, The Vanguard Group, Inc., Vanguard Marketing Corporation, and other registered investment companies in the Vanguard Group.
(c) Tax Fees.
Fiscal Year Ended October 31, 2010: $336,090
Fiscal Year Ended October 31, 2009: $423,070
Includes fees billed in connection with tax compliance, planning and advice services provided to the Registrant, The Vanguard Group, Inc., Vanguard Marketing Corporation, and other registered investment companies in the Vanguard Group and related to income and excise taxes.
(d) All Other Fees.
Fiscal Year Ended October 31, 2010: $16,000
Fiscal Year Ended October 31, 2009: $0
Includes fees billed for services related to risk management and privacy matters. Services were provided to the Registrant, The Vanguard Group, Inc., Vanguard Marketing Corporation, and other registered investment companies in the Vanguard Group.
(e) (1) Pre-Approval Policies. The policy of the Registrant’s Audit Committee is to consider and, if appropriate, approve before the principal accountant is engaged for such services, all specific audit and non-audit services provided to: (1) the Registrant; (2) The Vanguard Group, Inc.; (3) other entities controlled by The Vanguard Group, Inc. that provide ongoing services to the Registrant; and (4) other registered investment companies in the Vanguard Group. In making a determination, the Audit Committee considers whether the services are consistent with maintaining the principal accountant’s independence.
In the event of a contingency situation in which the principal accountant is needed to provide services in between scheduled Audit Committee meetings, the Chairman of the Audit Committee would be called on to consider and, if appropriate, pre-approve audit or permitted non-audit services in an amount sufficient to complete services through the next Audit Committee meeting, and to determine if such services would be consistent with maintaining the accountant’s independence. At the next scheduled Audit Committee meeting, services and fees would be presented to the Audit Committee for formal consideration, and, if appropriate, approval by the entire Audit Committee. The Audit Committee would again consider whether such services and fees are consistent with maintaining the principal accountant’s independence.
The Registrant’s Audit Committee is informed at least annually of all audit and non-audit services provided by the principal accountant to the Vanguard complex, whether such services are provided to: (1) the Registrant; (2) The Vanguard Group, Inc.; (3) other entities controlled by The Vanguard Group, Inc. that provide ongoing services to the Registrant; or (4) other registered investment companies in the Vanguard Group.
(2) No percentage of the principal accountant’s fees or services were approved pursuant to the waiver provision of paragraph (c)(7)(i)(C) of Rule 2-01 of Regulation S-X.
(f) For the most recent fiscal year, over 50% of the hours worked under the principal accountant’s engagement were not performed by persons other than full-time, permanent employees of the principal accountant.
(g) Aggregate Non-Audit Fees.
Fiscal Year Ended October 31, 2010: $352,090
Fiscal Year Ended October 31, 2009: $423,070
Includes fees billed for non-audit services provided to the Registrant, The Vanguard Group, Inc., Vanguard Marketing Corporation, and other registered investment companies in the Vanguard Group.
(h) For the most recent fiscal year, the Audit Committee has determined that the provision of all non-audit services was consistent with maintaining the principal accountant’s independence.
Item 5: Audit Committee of Listed Registrants.
Not Applicable.
Item 6: Investments.
Not Applicable.
Item 7: Disclosure of Proxy Voting Policies and Procedures for Closed-End Management Investment Companies.
Not Applicable.
Item 8: Portfolio Managers of Closed-End Management Investment Companies.
Not Applicable.
Item 9: Purchase of Equity Securities by Closed-End Management Investment Company and Affiliated Purchasers.
Not Applicable.
Item 10: Submission of Matters to a Vote of Security Holders.
Not Applicable.
Item 11: Controls and Procedures.
(a) Disclosure Controls and Procedures. The Principal Executive and Financial Officers concluded that the Registrant's Disclosure Controls and Procedures are effective based on their evaluation of the Disclosure Controls and Procedures as of a date within 90 days of the filing date of this report.
(b) Internal Control Over Financial Reporting. There were no significant changes in Registrant’s Internal Control Over Financial Reporting or in other factors that could significantly affect this control subsequent to the date of the evaluation, including any corrective actions with regard to significant deficiencies and material weaknesses.
| |
| Item 12: Exhibits. |
| |
| (a) Code of Ethics. |
| (b) Certifications. |
Pursuant to the requirements of the Securities Exchange Act of 1934 and the Investment Company Act of 1940, the registrant has duly caused this report to be signed on its behalf by the undersigned, thereunto duly authorized.
| |
| | VANGUARD STAR FUNDS |
| |
| By: | /s/ F. WILLIAM MCNABB III* |
| | F. WILLIAM MCNABB III |
| | CHIEF EXECUTIVE OFFICER |
| |
| Date: December 20, 2010 |
Pursuant to the requirements of the Securities Exchange Act of 1934 and the Investment Company Act of 1940, this report has been signed below by the following persons on behalf of the registrant and in the capacities and on the dates indicated.
| |
| | VANGUARD STAR FUNDS |
| |
| By: | /s/ F. WILLIAM MCNABB III* |
| | F. WILLIAM MCNABB III |
| | CHIEF EXECUTIVE OFFICER |
| |
| Date: December 20, 2010 |
| |
| | VANGUARD STAR FUNDS |
| |
| By: | /s/ THOMAS J. HIGGINS* |
| | THOMAS J. HIGGINS |
| | CHIEF FINANCIAL OFFICER |
| |
| Date: December 20, 2010 |
*By: /s/ Heidi Stam
Heidi Stam, pursuant to a Power of Attorney filed on April 26, 2010, see file Number 33-53683,
Incorporated by Reference.