Exhibit 13


TABLE OF CONTENTS
| | |
| |
Consolidated Financial Highlights | | 1 |
| |
Message to Shareholders | | 2 |
| |
Consolidated Statements of Financial Condition | | 5 |
| |
Consolidated Statements of Income | | 6 |
| |
Consolidated Statements of Cash Flows | | 7 |
| |
Consolidated Statements of Changes in Shareholders’ Equity | | 8 |
| |
Notes to Consolidated Financial Statements | | 9 |
| |
Management’s Report on Internal Control Over Financial Reporting | | 28 |
| |
Report of Independent Registered Public Accounting Firm on Internal Control Over Financial Reporting | | 29 |
| |
Report of Independent Registered Public Accounting Firm | | 30 |
| |
Statistical Information | | 31 |
| |
Selected Financial Data - Five Year Comparison | | 33 |
| |
Management’s Discussion and Analysis of Financial Condition and Results of Operations | | 35 |
| |
Applications of Critical Accounting Policies | | 44 |
| |
Executive Management and Board of Directors | | 45 |
| |
Officers | | 46 |
| |
Shareholder Information | | 48 |
CNB Financial Corporation & Subsidiaries 2006 Annual Report
CONSOLIDATED FINANCIAL HIGHLIGHTS
(in thousands, except per share data)
| | | | | | | | | | | |
| | | 2006 | | | 2005 | | | % Change | |
For The Year | | | | | | | | | | | |
Interest Income | | $ | 49,149 | | | $ | 41,884 | | | 17.3 | % |
Interest Expense | | | 20,853 | | | | 15,955 | | | 30.7 | % |
Net Interest Income | | | 28,296 | | | | 25,929 | | | 9.1 | % |
Non-interest Income | | | 8,158 | | | | 7,145 | | | 14.2 | % |
Non-interest Expense | | | 22,111 | | | | 20,164 | | | 9.7 | % |
Net Income | | | 9,622 | | | | 9,138 | | | 5.3 | % |
Net Income Return on: | | | | | | | | | | | |
Average Assets | | | 1.26 | % | | | 1.23 | % | | 2.4 | % |
Average Equity | | | 13.51 | % | | | 13.42 | % | | 0.7 | % |
At Year End | | | | | | | | | | | |
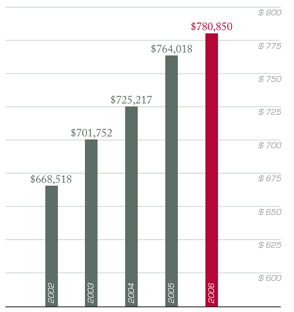
Assets | | $ | 780,850 | | | $ | 764,018 | | | 2.2 | % |
Loans, net of unearned | | | 547,020 | | | | 510,613 | | | 7.1 | % |
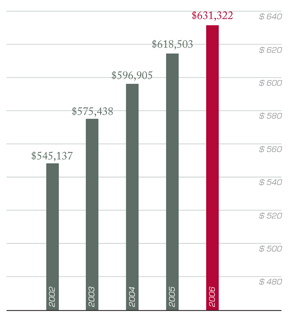
Deposits | | | 631,322 | | | | 618,503 | | | 2.1 | % |
Shareholders’ Equity | | | 72,279 | | | | 69,968 | | | 3.3 | % |
Trust Assets Under Management (at market value) | | | 206,899 | | | | 179,738 | | | 15.1 | % |
Per Share Data | | | | | | | | | | | |
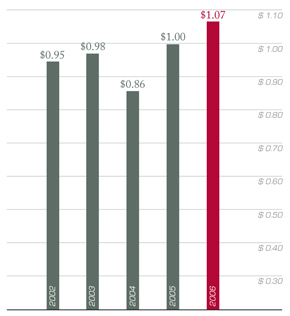
Net Income, diluted | | $ | 1.07 | | | $ | 1.00 | | | 7.0 | % |
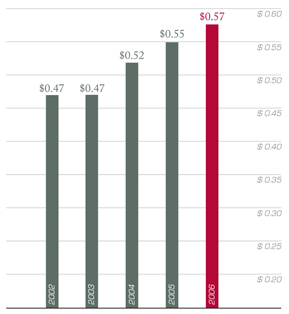
Dividends | | | 0.57 | | | | 0.55 | | | 3.6 | % |
Book Value | | | 8.15 | | | | 7.76 | | | 5.0 | % |
Market Value | | | 14.18 | | | | 14.11 | | | 0.5 | % |
| | |
1 | CNB Financial Corporation & Subsidiaries | 2006 Annual Report | | |
MESSAGE TO SHAREHOLDERS
To Our Shareholders, Customers & Friends:
We are pleased to report that 2006 was a successful year for CNB Financial Corporation as net income achieved a record level of $9.62 million representing a 5.3% increase from 2005.
Our earnings growth was the result of increases in both net interest income and non-interest income of 9.1% and 14.2% respectively. The increase in net interest income was driven primarily by the growth in loans outstanding which increased by $36.4 million or 7.1% during the year. This growth was the result of our expansion into the Erie and Warren, Pennsylvania markets coupled with the growth from the opening of three new offices of Holiday Financial Services, our consumer finance subsidiary. The increase in non-interest income resulted from increased fee income from both loans and deposits, increased income from trust and asset management fees and revenue from bank owned life insurance.
While both interest and non-interest income grew during 2006, we also experienced an increased level of non-interest expenses during the year. This was a result of increases in normal operating expenses such as salaries and benefits, occupancy expense and data processing expense which were significantly impacted with the addition of the two new banking offices and the three new consumer finance company offices during the year. The net result was an increase of $1.9 million or 9.7% in non-interest expense when compared to the prior year.
As we continue executing our growth strategy, we will be adding two new full service banking offices in the Erie market during 2007 as well as adding up to three new offices of Holiday Financial Services in other communities within west central Pennsylvania. This continued expansion into new markets will create additional opportunities to grow our earning assets resulting in corresponding revenue growth into the future.
We are also pleased to report that we have been able to maintain our asset quality as measured by several key performance indicators. First, our net loan losses for the year were $888 thousand representing 0.16% of year end loans compared to 0.15% in 2005 and 0.21% in 2004. Secondly, our level of nonperforming assets consisting of loans greater than ninety days past due, non-accrual loans and assets acquired through foreclosure were $1.9 million compared to $2.1 at year end 2005. Our nonperforming assets as a percentage of total assets at year end 2006 were 0.25% which compares favorably to our peer institutions ratio of 0.47%. We remain committed to maintaining sound asset quality in order to continue to provide the consistent level of earnings performance our Corporation has produced.
Our overall financial performance in 2006 yielded a return on average assets of 1.26% and a return on average equity of 13.51%. Our return on assets compares very favorably to the median of 1.06% for all bank holding companies in the United States between $500 million and $1 billion in assets. With this level of earnings performance, we increased our quarterly dividend in the fourth quarter to $0.15 resulting in total dividends paid for the year of $0.57 compared to $0.55 in 2005 for an annual increase of 3.6%. Also, during the year, we continued to repurchase shares of our stock with the net result that the number of shares outstanding declined by 160 thousand. We will continue to repurchase shares as deemed appropriate in the coming year.
| | |
| | CNB Financial Corporation & Subsidiaries | 2006 Annual Report |2 |
MESSAGE TO SHAREHOLDERS
| | |
 | |  |
ASSET GROWTH (in thousands) | | DEPOSIT GROWTH (in thousands) |
| |
 | |  |
EARNINGS PER SHARE (fully diluted) | | DIVIDENDS PAID PER SHARE |
| | |
3 | CNB Financial Corporation & Subsidiaries | 2006 Annual Report | | |
MESSAGE TO SHAREHOLDERS
As previously announced, the charter of our banking subsidiary was converted from a national charter to a Pennsylvania state charter effective on December 28, 2006. With this change our banking subsidiary assumed the name CNB Bank with its operating division in Erie, Pennsylvania maintaining its trade name of ERIEBANK. With this charter conversion, our Corporation will experience a significant annual reduction in examination fees which will quickly offset the costs of the conversion. This change has resulted in minimal impact on our customers primarily resulting in our previously established brand identity as “CNB”.
During 2007, we are looking forward to the opening of two new full service banking offices in order to expand our presence in the Erie, Pennsylvania market. We have been very encouraged with the acceptance of our ERIEBANK division in this market and believe we will be accelerating our rate of growth with the addition of these offices. Also, during the coming year, we are planning the addition of three new offices of Holiday Financial Services in the communities of Bradford, Ridgway and Bellefonte, Pennsylvania resulting in a total of seven offices. We are experiencing good growth in this subsidiary and are optimistic about its ability to produce meaningful earnings for our Corporation.
In closing, the Board of Directors, management and staff are proud to present this report to you as we look forward to an exciting and rewarding year in 2007.
|
 |
William F. Falger President and Chief Executive Officer |
| | |
| | CNB Financial Corporation & Subsidiaries | 2006 Annual Report |4 |
CONSOLIDATED STATEMENTS OF FINANCIAL CONDITION
| | | | | | | | |
| (in thousands, except share data) | | December 31 | |
| | | 2006 | | | 2005 | |
Assets | | | | | | | | |
Cash and due from banks | | $ | 18,530 | | | $ | 19,146 | |
Interest bearing deposits with other banks | | | 7,021 | | | | 23,871 | |
| | | | | | | | |
CASH AND CASH EQUIVALENTS | | | 25,551 | | | | 43,017 | |
Securities available for sale | | | 156,696 | | | | 161,897 | |
Loans held for sale | | | 2,420 | | | | 2,733 | |
Loans and leases | | | 547,946 | | | | 511,042 | |
Less: unearned discount | | | 926 | | | | 429 | |
Less: allowance for loan losses | | | 6,086 | | | | 5,603 | |
| | | | | | | | |
NET LOANS | | | 540,934 | | | | 505,010 | |
FHLB, FRB, and other equity interests | | | 5,321 | | | | 4,789 | |
Premises and equipment, net | | | 16,237 | | | | 13,912 | |
Bank owned life insurance | | | 14,484 | | | | 13,797 | |
Mortgage servicing rights | | | 446 | | | | 373 | |
Goodwill | | | 10,821 | | | | 10,821 | |
Other intangible assets | | | 385 | | | | 800 | |
Accrued interest and other assets | | | 7,555 | | | | 6,869 | |
| | | | | | | | |
TOTAL ASSETS | | $ | 780,850 | | | $ | 764,018 | |
| | | | | | | | |
Liabilities | | | | | | | | |
Deposits: | | | | | | | | |
Non-interest bearing deposits | | $ | 82,574 | | | $ | 80,874 | |
Interest bearing deposits | | | 548,748 | | | | 537,629 | |
| | | | | | | | |
TOTAL DEPOSITS | | | 631,322 | | | | 618,503 | |
Treasury, tax and loan borrowings | | | 2,000 | | | | 2,000 | |
FHLB and other borrowings | | | 57,885 | | | | 58,250 | |
Accrued interest and other liabilities | | | 7,054 | | | | 4,987 | |
Subordinated debentures | | | 10,310 | | | | 10,310 | |
| | | | | | | | |
TOTAL LIABILITIES | | | 708,571 | | | | 694,050 | |
| | | | | | | | |
Shareholders’ Equity | | | | | | | | |
Common stock $0 par value in 2006 and $1 par value in 2005 | | | | | | | | |
Authorized 50,000,000 shares | | | | | | | | |
Issued 9,233,750 shares for 2006 and 2005 | | | — | | | | 9,234 | |
Additional paid in capital | | | 13,250 | | | | 4,160 | |
Retained earnings | | | 62,957 | | | | 58,439 | |
Treasury stock, at cost (369,546 shares for 2006 and 209,596 shares for 2005) | | | (5,271 | ) | | | (3,031 | ) |
Accumulated other comprehensive income | | | 1,343 | | | | 1,166 | |
| | | | | | | | |
TOTAL SHAREHOLDERS’ EQUITY | | | 72,279 | | | | 69,968 | |
| | | | | | | | |
TOTAL LIABILITIES and SHAREHOLDERS’ EQUITY | | $ | 780,850 | | | $ | 764,018 | |
| | | | | | | | |
The accompanying notes are an integral part of these statements.
| | |
5 | CNB Financial Corporation & Subsidiaries | 2006 Annual Report | | |
CONSOLIDATED STATEMENTS OF INCOME
| | | | | | | | | | | |
| (in thousands, except per share data) | | Year ended December 31, | |
| | | 2006 | | 2005 | | | 2004 | |
Interest and Dividend Income | | | | | | | | | | | |
Loans including fees | | $ | 40,475 | | $ | 34,193 | | | $ | 31,005 | |
Deposits with banks | | | 437 | | | 316 | | | | 117 | |
Federal funds sold | | | 293 | | | 394 | | | | 120 | |
Securities: | | | | | | | | | | | |
Taxable | | | 5,876 | | | 4,817 | | | | 3,746 | |
Tax-exempt | | | 1,706 | | | 1,837 | | | | 2,008 | |
Dividends | | | 362 | | | 327 | | | | 477 | |
| | | | | | | | | | | |
TOTAL INTEREST AND DIVIDEND INCOME | | | 49,149 | | | 41,884 | | | | 37,473 | |
Interest Expense | | | | | | | | | | | |
Deposits | | | 17,106 | | | 12,633 | | | | 10,551 | |
Federal Home Loan Bank advances and other debt | | | 2,881 | | | 2,637 | | | | 2,075 | |
Subordinated debentures | | | 866 | | | 685 | | | | 502 | |
| | | | | | | | | | | |
TOTAL INTEREST EXPENSE | | | 20,853 | | | 15,955 | | | | 13,128 | |
| | | | | | | | | | | |
Net interest income | | | 28,296 | | | 25,929 | | | | 24,345 | |
Provision for loan losses | | | 1,371 | | | 783 | | | | 800 | |
| | | | | | | | | | | |
Net interest income after provision for loan losses | | | 26,925 | | | 25,146 | | | | 23,545 | |
Non-interest Income | | | | | | | | | | | |
Trust and asset management fees | | | 1,077 | | | 977 | | | | 1,005 | |
Service charges - deposit accounts | | | 4,160 | | | 4,060 | | | | 3,988 | |
Other service charges and fees | | | 644 | | | 512 | | | | 469 | |
Net security gains | | | 338 | | | 322 | | | | 313 | |
Loss on other-than-temporarily impaired securities | | | — | | | (240 | ) | | | (1,400 | ) |
Mortgage banking income | | | 145 | | | 76 | | | | 92 | |
Bank owned life insurance | | | 687 | | | 615 | | | | 500 | |
Wealth management | | | 519 | | | 533 | | | | 208 | |
Other | | | 588 | | | 290 | | | | 254 | |
| | | | | | | | | | | |
TOTAL NON-INTEREST INCOME | | | 8,158 | | | 7,145 | | | | 5,429 | |
Non-interest Expenses | | | | | | | | | | | |
Salaries | | | 8,106 | | | 7,052 | | | | 6,402 | |
Employee benefits | | | 2,947 | | | 2,970 | | | | 2,995 | |
Net occupancy expense | | | 2,854 | | | 2,714 | | | | 2,607 | |
Data processing | | | 2,010 | | | 1,641 | | | | 1,443 | |
State and local taxes | | | 962 | | | 911 | | | | 839 | |
Legal, professional and examination fees | | | 704 | | | 737 | | | | 811 | |
Intangible asset amortization | | | 415 | | | 330 | | | | 316 | |
Directors fees and benefits | | | 395 | | | 471 | | | | 332 | |
Other | | | 3,718 | | | 3,338 | | | | 3,394 | |
| | | | | | | | | | | |
TOTAL NON-INTEREST EXPENSES | | | 22,111 | | | 20,164 | | | | 19,139 | |
| | | | | | | | | | | |
Income before income taxes | | | 12,972 | | | 12,127 | | | | 9,835 | |
Income tax expense | | | 3,350 | | | 2,989 | | | | 1,964 | |
| | | | | | | | | | | |
Net income | | $ | 9,622 | | $ | 9,138 | | | $ | 7,871 | |
| | | | | | | | | | | |
EARNINGS PER SHARE | | | | | | | | | | | |
Basic | | $ | 1.08 | | $ | 1.01 | | | $ | 0.86 | |
Diluted | | $ | 1.07 | | $ | 1.00 | | | $ | 0.86 | |
The accompanying notes are an integral part of these statements.
| | |
| | CNB Financial Corporation & Subsidiaries | 2006 Annual Report| 6 |
CONSOLIDATED STATEMENTS OF CASH FLOWS
| | | | | | | | | | | | |
| (in thousands) | | Year ended December 31, | |
| | | 2006 | | | 2005 | | | 2004 | |
Cash Flows from Operating Activities: | | | | | | | | | | | | |
Net income | | $ | 9,622 | | | $ | 9,138 | | | $ | 7,871 | |
Adjustments to reconcile net income to net cash provided by operations: | | | | | | | | | | | | |
Provision for loan losses | | | 1,371 | | | | 783 | | | | 800 | |
Depreciation and amortization | | | 1,882 | | | | 1,856 | | | | 1,764 | |
Amortization, accretion and deferred loan fees | | | (457 | ) | | | (39 | ) | | | 49 | |
Deferred taxes | | | (150 | ) | | | (674 | ) | | | (735 | ) |
Security gains | | | (338 | ) | | | (322 | ) | | | (313 | ) |
Loss on other-than-temporarily impaired securities | | | — | | | | 240 | | | | 1,400 | |
Gain on sale of loans | | | (73 | ) | | | (113 | ) | | | (162 | ) |
Net (gains) losses on dispositions of acquired property | | | (57 | ) | | | 21 | | | | (68 | ) |
Proceeds from sales of loans | | | 12,369 | | | | 14,669 | | | | 14,481 | |
Origination of loans for sale | | | (12,246 | ) | | | (13,945 | ) | | | (14,719 | ) |
Increase in bank owned life insurance | | | (687 | ) | | | (615 | ) | | | (500 | ) |
Stock based compensation expense | | | 60 | | | | — | | | | — | |
Changes in: | | | | | | | | | | | | |
Interest receivable and other assets | | | (590 | ) | | | (460 | ) | | | (1,850 | ) |
Interest payable and other liabilities | | | 2,219 | | | | (811 | ) | | | (39 | ) |
| | | | | | | | | | | | |
Net cash provided by operating activities | | | 12,925 | | | | 9,728 | | | | 7,979 | |
Cash Flows from Investing Activities: | | | | | | | | | | | | |
Proceeds from maturities, prepayments and calls of: | | | | | | | | | | | | |
Securities available for sale | | | 43,349 | | | | 40,438 | | | | 42,090 | |
Proceeds from sales of securities available for sale | | | 105 | | | | 8,038 | | | | 6,805 | |
Purchase of securities available for sale | | | (37,757 | ) | | | (48,852 | ) | | | (39,573 | ) |
Loan origination and payments, net | | | (37,070 | ) | | | (29,055 | ) | | | (24,073 | ) |
(Purchase) Redemption of FHLB, FRB and other equity interests | | | (532 | ) | | | 3 | | | | 240 | |
Net, purchase of premises and equipment | | | (3,602 | ) | | | (1,761 | ) | | | (2,082 | ) |
Proceeds from the sale of assets | | | 210 | | | | 1,082 | | | | 529 | |
| | | | | | | | | | | | |
Net cash used in investing activities | | | (35,297 | ) | | | (30,107 | ) | | | (16,064 | ) |
Cash Flows from Financing Activities: | | | | | | | | | | | | |
Net change in: | | | | | | | | | | | | |
Checking, money market and savings accounts | | | (12,587 | ) | | | 11,160 | | | | 8,165 | |
Certificates of deposit | | | 25,406 | | | | 10,438 | | | | 13,302 | |
Purchase treasury stock | | | (3,367 | ) | | | (2,222 | ) | | | (1,261 | ) |
Proceeds from the sale of treasury stock | | | 923 | | | | 832 | | | | 798 | |
Proceeds from the exercise of stock options | | | — | | | | 72 | | | | 96 | |
Cash dividends paid | | | (5,104 | ) | | | (5,046 | ) | | | (4,771 | ) |
Advances from long-term borrowings | | | 10,000 | | | | 18,250 | | | | — | |
Repayments on long-term borrowings | | | (13,000 | ) | | | — | | | | — | |
Net change in short-term borrowings | | | 2,635 | | | | — | | | | 687 | |
| | | | | | | | | | | | |
Net cash provided by financing activities | | | 4,906 | | | | 33,484 | | | | 17,016 | |
| | | | | | | | | | | | |
Net increase (decrease) in cash and cash equivalents | | | (17,466 | ) | | | 13,105 | | | | 8,931 | |
Cash and cash equivalents at beginning of period | | | 43,017 | | | | 29,912 | | | | 20,981 | |
| | | | | | | | | | | | |
Cash and cash equivalents at end of period | | $ | 25,551 | | | $ | 43,017 | | | $ | 29,912 | |
| | | | | | | | | | | | |
Supplemental disclosures of cash flow information: | | | | | | | | | | | | |
Cash paid during the period for: | | | | | | | | | | | | |
Interest | | $ | 20,581 | | | $ | 15,618 | | | $ | 12,568 | |
Income taxes | | | 3,964 | | | | 3,178 | | | | 2,932 | |
Supplemental non cash disclosures: | | | | | | | | | | | | |
Transfers to other real estate owned | | $ | 249 | | | $ | 80 | | | $ | 1,005 | |
The accompanying notes are an integral part of these statements.
| | |
7 | CNB Financial Corporation & Subsidiaries | 2006 Annual Report | | |
CONSOLIDATED STATEMENTS OF CHANGES IN SHAREHOLDER’S EQUITY
Years ended December 31, 2006, 2005 and 2004
(in thousands, except per share data)
| | | | | | | | | | | | | | | | | | | | | | | | |
| | | Common Stock | | | Additional
Paid-In
Capital | | | Retained
Earnings | | | Treasury
Stock | | | Accumulated
Other
Comprehensive
Income | | | Total
Share-
holders’
Equity | |
Balance January 1, 2004 | | $ | 3,694 | | | $ | 4,123 | | | $ | 56,787 | | | $ | (1,309 | ) | | $ | 3,152 | | | $ | 66,447 | |
Comprehensive income: | | | | | | | | | | | | | | | | | | | | | | | | |
Net income for 2004 | | | | | | | | | | | 7,871 | | | | | | | | | | | | 7,871 | |
Other comprehensive income: | | | | | | | | | | | | | | | | | | | | | | | | |
Net change in unrealized gains on available for sale securities, net of taxes of $178 and adjustment for after tax losses of $ 707 | | | | | | | | | | | | | | | | | | | (470 | ) | | | (470 | ) |
| | | | | | | | | | | | | | | | | | | | | | | | |
Total comprehensive income | | | | | | | | | | | | | | | | | | | | | | | 7,401 | |
| | | | | | | | | | | | | | | | | | | | | | | | |
2 1/2 for 1 stock split (5,540,250 shares) | | | 5,540 | | | | | | | | (5,540 | ) | | | | | | | | | | | | |
Treasury stock: | | | | | | | | | | | | | | | | | | | | | | | | |
Purchase (91,848 shares) | | | | | | | | | | | | | | | (1,261 | ) | | | | | | | (1,261 | ) |
Reissue (62,493 shares) | | | | | | | 120 | | | | | | | | 774 | | | | | | | | 894 | |
Cash dividends declared ($0.52 per share) | | | | | | | | | | | (4,771 | ) | | | | | | | | | | | (4,771 | ) |
| | | | | | | | | | | | | | | | | | | | | | | | |
Balance December 31, 2004 | | | 9,234 | | | | 4,243 | | | | 54,347 | | | | (1,796 | ) | | | 2,682 | | | | 68,710 | |
Comprehensive income: | | | | | | | | | | | | | | | | | | | | | | | | |
Net income for 2005 | | | | | | | | | | | 9,138 | | | | | | | | | | | | 9,138 | |
Other comprehensive income: | | | | | | | | | | | | | | | | | | | | | | | | |
Net change in unrealized gains on available for sale securities, net of taxes of $820 and adjustment for after tax gains of $ 53 | | | | | | | | | | | | | | | | | | | (1,516 | ) | | | (1,516 | ) |
| | | | | | | | | | | | | | | | | | | | | | | | |
Total comprehensive income | | | | | | | | | | | | | | | | | | | | | | | 7,622 | |
| | | | | | | | | | | | | | | | | | | | | | | | |
Treasury stock: | | | | | | | | | | | | | | | | | | | | | | | | |
Purchase (150,027 shares) | | | | | | | | | | | | | | | (2,222 | ) | | | | | | | (2,222 | ) |
Reissue (63,671 shares) | | | | | | | (83 | ) | | | | | | | 987 | | | | | | | | 904 | |
Cash dividends declared ($0.55 per share) | | | | | | | | | | | (5,046 | ) | | | | | | | | | | | (5,046 | ) |
| | | | | | | | | | | | | | | | | | | | | | | | |
Balance December 31, 2005 | | | 9,234 | | | | 4,160 | | | | 58,439 | | | | (3,031 | ) | | | 1,166 | | | | 69,968 | |
Comprehensive income: | | | | | | | | | | | | | | | | | | | | | | | | |
Net income for 2006 | | | | | | | | | | | 9,622 | | | | | | | | | | | | 9,622 | |
Other comprehensive income: | | | | | | | | | | | | | | | | | | | | | | | | |
Net change in unrealized gains on available for sale securities, net of taxes of $65 and adjustment for after tax gains of $ 220 | | | | | | | | | | | | | | | | | | | 112 | | | | 112 | |
| | | | | | | | | | | | | | | | | | | | | | | | |
Total comprehensive income | | | | | | | | | | | | | | | | | | | | | | | 9,734 | |
| �� | | | | | | | | | | | | | | | | | | | | | | | |
Reclassification adjustment for conversion to no par stock | | | (9,234 | ) | | | 9,234 | | | | | | | | | | | | | | | | | |
Adjustment to initially apply FAS No. 158, net of tax | | | | | | | | | | | | | | | | | | | 65 | | | | 65 | |
Restricted stock award grants (14,654 shares) | | | | | | | (198 | ) | | | | | | | 198 | | | | | | | | | |
Stock based compensation expense | | | | | | | 60 | | | | | | | | | | | | | | | | 60 | |
Treasury stock: | | | | | | | | | | | | | | | | | | | | | | | | |
Purchase (240,763 shares) | | | | | | | | | | | | | | | (3,367 | ) | | | | | | | (3,367 | ) |
Reissue (66,159 shares) | | | | | | | (6 | ) | | | | | | | 929 | | | | | | | | 923 | |
Cash dividends declared ($0.57 per share) | | | | | | | | | | | (5,104 | ) | | | | | | | | | | | (5,104 | ) |
| | | | | | | | | | | | | | | | | | | | | | | | |
Balance December 31, 2006 | | | | | | $ | 13,250 | | | $ | 62,957 | | | $ | (5,271 | ) | | $ | 1,343 | | | $ | 72,279 | |
| | | | | | | | | | | | | | | | | | | | | | | | |
The accompanying notes are an integral part of these statements.
| | |
| | CNB Financial Corporation & Subsidiaries | 2006 Annual Report| 8 |
NOTES TO CONSOLIDATED FINANCIAL STATEMENTS
1. SUMMARYOF SIGNIFICANT ACCOUNTING POLICIES
Unless otherwise indicated, amounts are in thousands, except per share data.
Business and Organization:
CNB Financial Corporation (the “Corporation”), is headquartered in Clearfield, Pennsylvania, and provides a full range of banking and related services through its wholly owned subsidiary, CNB Bank (the “Bank”) which also began doing business as ERIEBANK during 2005 in the Erie, Pennsylvania market area. In addition, the Bank provides trust services, including the administration of trusts and estates, retirement plans, and other employee benefit plans as well as a full range of wealth management services. The Bank serves individual and corporate customers and is subject to competition from other financial institutions and intermediaries with respect to these services. In addition to the Bank, the Corporation also entered the consumer discount loan and finance business in the latter part of 2005 with its wholly owned subsidiary, Holiday Financial Services Corporation. The Corporation and its subsidiaries are subject to examination by federal and state regulators. The Corporation’s market area is primarily concentrated in the central region of the state of Pennsylvania.
Basis of Financial Presentation:
The financial statements are consolidated to include the accounts of the Corporation and its subsidiaries, CNB Bank, CNB Securities Corporation, Holiday Financial Services Corporation, County Reinsurance Company and CNB Insurance Agency. These statements have been prepared in accordance with U.S. generally accepted accounting principles. All significant intercompany accounts and transactions have been eliminated in the consolidated financial statements.
Use of Estimates:
To prepare financial statements in conformity with U.S. generally accepted accounting principles, management makes estimates and assumptions based on available information. These estimates and assumptions affect the amounts reported in the financial statements and the disclosures provided, and actual results could differ. The allowance for loan losses, mortgage servicing rights and fair values of financial instruments are particularly subject to change.
Operating Segments:
Statement of Financial Accounting Standards (“FAS”) No.131 requires disclosures about an enterprise’s operating segments. The Statement defines an operating segment as a component of an enterprise that engages in business activities that generate revenue and incur expense, and the operating results of which are reviewed by the chief operating decision maker in the determination of resource allocation and performance. While the Corporation’s chief decision makers monitor the revenue streams of the various Corporation’s products and services, the segments that could be separated from the Corporation’s primary business of community banking are not material based on revenue, net income, or total assets. Accordingly, all of the Corporation’s financial service operations are considered by management to be combined in one reportable operating segment.
Securities:
When purchased, securities are classified as held to maturity, trading or available for sale. Debt securities are classified as held to maturity when the Corporation has the positive intent and ability to hold the securities to maturity. Held to maturity securities are carried at amortized cost. Debt or equity securities are classified as trading when purchased principally for the purpose of selling them in the near term. Available for sale securities are those securities not classified as held to maturity or trading and are carried at their fair market value. Unrealized gains and losses, net of deferred tax, on securities classified as available for sale are recorded as other comprehensive income. Unrealized gains and losses on securities classified as trading are included in other income. Management has not classified any debt or equity securities as trading or held to maturity.
The amortized cost of debt securities classified as held to maturity or available for sale is adjusted for the amortization of premiums and the accretion of discounts over the period through contractual maturity or, in the case of mortgage-backed securities and collateralized mortgage obligations, over the estimated life of the security. Such amortization is included in interest income from securities. Gains and losses on securities sold are based on the specific identification method.
Declines in the fair value of securities below their cost that are other than temporary are reflected as realized losses. In estimating other-than-temporary losses, management considers: the length of time and extent that fair value has been less than cost, the financial condition and near term prospects of the issuer, and the Corporation’s ability and intent to hold the security for a period sufficient to allow for any anticipated recovery in fair value.
Loans:
Loans that management has the intent and ability to hold for the foreseeable future or until maturity or payoff are reported at the principal balance outstanding, net of unearned interest, deferred loan fees and costs, and an allowance for loan losses.
Interest income is reported on the interest method and includes amortization of net deferred loan fees and costs over the loan term. Interest income on mortgage and commercial loans is discontinued at the time the loan is 90 days delinquent unless the credit is well-secured and in process of collection. Consumer loans are typically charged off no later than 180 days past due. Past due status is based on the contractual terms of the loan. In all cases, loans are placed on nonaccrual or charged-off at an earlier date if collection of principal or interest is considered doubtful.
| | |
9 | CNB Financial Corporation & Subsidiaries | 2006 Annual Report | | |
NOTES TO CONSOLIDATED FINANCIAL STATEMENTS
All interest accrued but not received for loans placed on nonaccrual is reversed against interest income. Interest received on such loans is accounted for on the cash-basis or cost-recovery method, until qualifying for return to accrual. Loans are returned to accrual status when all the principal and interest amounts contractually due are brought current and future payments are reasonably assured.
Loans Held for Sale:
Loans originated and intended for sale in the secondary market are carried at the lower of aggregate cost or market as determined by outstanding committments from investors. Net unrealized losses, if any, are recorded as a valuation allowance and charged to earnings.
Mortgage loans held for sale are generally sold with servicing rights retained. The carrying value of the mortgage loan sold is reduced by the cost allocation to the servicing right. Gains and losses on sales of mortgage loans are based on the difference between the selling price and the carrying value of the related loan sold.
Direct Lease Financing:
Financing of equipment, principally consisting of automobiles, is provided to customers under lease arrangements accounted for as direct financing leases. These leases are reported in loans as a net amount, consisting of the aggregate of lease payments receivable and estimated residual values, less unearned income. Income is recognized in a manner which results in an approximate level yield over the lease term.
Allowance for Loan Losses:
The allowance for loan losses is a valuation allowance for probable incurred credit losses. Loans which are deemed to be uncollectible are charged against the allowance account. Subsequent recoveries, if any, are credited to the allowance account.
Management determines the adequacy of the allowance based on historical patterns of charge-offs and recoveries, information about specific borrower situations, industry experience, and other qualitative factors relevant to the collectability of the loan portfolio. While management believes that the allowance is adequate to absorb probable loan losses incurred at the balance sheet date, future adjustments may be necessary due to circumstances that differ substantially from the assumptions used in evaluating the adequacy of the allowance for loan losses.
A loan is impaired when full payment under the loan terms is not expected. Impairment is evaluated in total for smaller-balance loans of similar nature such as residential mortgage, consumer, and credit card loans, and accordingly, they are not separately identified for impairment disclosures. If a loan is impaired, a portion of the allowance is allocated so that the loan is reported, net, at the present value of estimated future cash flows using the loan’s existing rate or at the fair value of collateral if repayment is expected solely from the collateral.
Federal Home Loan Bank (FHLB) Stock:
The Bank is a member of the FHLB system. Members are required to own a certain amount of stock based on the level of borrowings and other factors, and may invest in additional amounts. FHLB stock is carried at cost, classified as a restricted security, and periodically evaluated for impairment. Because this stock is viewed as long term investment, impairment is based on ultimate recovery of par value.
Premises and Equipment:
Premises and equipment are stated at cost less accumulated depreciation. Depreciation of premises and equipment is computed principally by the straight line method. In general, useful lives range from 3 to 39 years with lives for furniture, fixtures and equipment ranging from 3 to 10 years and lives of buildings and building improvements ranging from 15 to 39 years. Amortization of leasehold improvements is computed using the straight-line method over useful lives of the leasehold improvements or the term of the lease, whichever is shorter. Maintenance, repairs and minor renewals are charged to expense as incurred.
Foreclosed Assets:
Assets acquired through or in lieu of loan foreclosure are initially recorded at fair value when acquired, establishing a new cost basis. If fair value declines, a valuation allowance is recorded through expense. Costs after acquisition are expensed.
Bank Owned Life Insurance:
The Corporation owns insurance on the lives of a certain group of key employees. The cash surrender value of these policies, or the amount that can be realized, is included on the consolidated statements of financial condition and any increase in cash surrender value is recorded as non-interest income on the consolidated statements of income.
Goodwill and Other Intangible Assets:
Goodwill results from prior business acquisitions and represents the excess of the purchase price over the fair value of acquired tangible assets and liabilities and identifiable intangible assets. Goodwill is assessed at least annually for impairment and any such impairment will be recognized in the period identified.
| | |
| | CNB Financial Corporation & Subsidiaries | 2006 Annual Report| 10 |
NOTES TO CONSOLIDATED FINANCIAL STATEMENTS
Other intangible assets consist of acquired customer relationship intangible assets arising from the purchase of customer lists on branch acquisitions and a customer relationship intangible related to our consumer discount finance company. They are initially measured at fair value and then are amortized over their useful lives which range from 5 to 10 years.
Long-term Assets:
Premises and equipment, core deposit and other intangible assets, and other long-term assets are reviewed for impairment when events indicate their carrying amount may not be recoverable from future undiscounted cash flows. If impaired, the assets are recorded at fair value.
Loan Commitments and Related Financial Instruments:
Financial instruments include off-balance sheet credit instruments, such as commitments to make loans and commercial letters of credit, issued to meet customer financing needs. The face amount for these items represents the exposure to loss, before considering customer collateral or ability to repay. Such financial instruments are recorded when they are funded.
Advertising Costs:
Advertising costs are generally expensed as incurred and amounted to $525, $405 and $390 for 2006, 2005 and 2004, respectively.
Income Taxes:
The Corporation files a consolidated U. S. income tax return that includes all subsidiaries except County Reinsurance Company which files a separate return. Deferred taxes are recognized for the expected future tax consequences of existing differences between the financial reporting and tax reporting bases of assets and liabilities using enacted tax laws and rates. Income tax expense is the total of the current year income tax due or refundable and the changes in deferred tax assets and liabilities.
Mortgage Servicing Rights (MSR’s):
Servicing rights represent the allocated value of retained servicing rights on loans sold. Servicing assets are expensed in proportion to, and over the period of, estimated net servicing revenues. Impairment is evaluated based on the fair value of the assets. Fair value is determined using prices for similar assets with similar characteristics, when available, or based upon discounted cash flows using market-based assumptions. Any impairment of a grouping is reported as a valuation allowance, to the extent that fair value is less than the capitalized amount for a grouping.
Treasury Stock:
The purchase of the Corporation’s common stock is recorded at cost. Purchases of the stock are made both in the open market and through negotiated private purchases based on market prices. At the date of subsequent reissue, the treasury stock account is reduced by the cost of such stock on a first-in-first-out basis.
Equity
On April 18, 2006, the shareholders of the Corporation voted to increase the aggregate number of authorized common shares from 10,000,000 to 50,000,000 as well as approve the change from $1.00 par value to no par stock. The changes had no effect on the dollar amount of total shareholders’ equity and simply resulted in a reclassification between the common stock and additional paid in capital.
Stock-Based Compensation:
The Corporation has a stock incentive plan for key employees and independent directors. The Stock Incentive Plan, which is administered by a committee of the Board of Directors, provides for up to 625,000 shares of common stock in the form of qualified options, nonqualified options, stock appreciation rights or restricted stock. For key employees, the plan vesting schedule is one-fourth of granted stock-based awards per year beginning one year after the grant date with 100% vested on the fourth anniversary. For independent directors, the vesting schedule is one-third of granted stock-based awards per year beginning one year after the grant date with 100% vested on the third anniversary.
During 2005, the Corporation opted to accelerate the vesting of all unvested options with an exercise price greater than $15.00, the closing price of the Corporation’s common stock on the NASDAQ on May 10, 2005. As a result of the acceleration all unvested shares granted in 2003 and 2004 became immediately exercisable.
Effective January 1, 2006, the Corporation adopted Statement of Financial Accounting Standards (“FAS”) No. 123 (R),Share-based Payment, using the modified prospective transition method. Accordingly, the Corporation has recorded stock-based employee compensation cost using the fair value method starting in 2006.
Stock Options:
For 2006, the adoption of FAS No. 123 (R) resulted in a reduction of income before income taxes of $18 and a reduction in net income of $12 as a result of stock options. Due to the insignificance of the amount, there was no measurable effect on basic and diluted earnings per share in 2006.
| | |
11 | CNB Financial Corporation & Subsidiaries | 2006 Annual Report | | |
NOTES TO CONSOLIDATED FINANCIAL STATEMENTS
Prior to January 1, 2006, compensation expense for stock options was reported using the intrinsic value method; therefore, no stock-based compensation cost is reflected in net income for the years ending December 31, 2005 and 2004, as all options granted had an exercise price equal to or greater than the market price of the underlying common stock at date of grant.
The following table illustrates the effect on net income and earnings per share if expense was measured using the fair value recognition provisions of FASB Statement No. 123,Accounting for Stock-Based Compensation, for the years ending December 31.
| | | | | | |
| | | 2005 | | 2004 |
Net income as reported | | $ | 9,138 | | $ | 7,871 |
Deduct: Stock-based compensation expense determined under fair value based method | | | 197 | | | 74 |
| | | | | | |
Pro forma net income | | $ | 8,941 | | $ | 7,797 |
| | | | | | |
Basic earnings per share as reported | | $ | 1.01 | | $ | 0.86 |
Pro forma basic earnings per share | | $ | 0.98 | | $ | 0.85 |
Diluted earnings per share as reported | | $ | 1.00 | | $ | 0.86 |
Pro forma diluted earnings per share | | $ | 0.98 | | $ | 0.85 |
The fair value of each option award was estimated on the date of grant using a closed form option valuation (Black-Scholes) model that used the weighted average assuptions in the following table:
| | | |
| | | 2004 | |
Risk-free interest rate | | 3.8 | % |
Expected term | | 6.0 years | |
Expected stock price volatility | | 23.5 | % |
Dividend yield | | 3.4 | % |
No stock options were granted during the years ended December 31, 2006 and 2005.
Restricted Stock Awards:
During 2006, the Executive Compensation and Personnel Committee of the Board of Directors granted a total of 14,654 shares of restricted common stock to certain key employees and all independent directors of the Corporation. Compensation expense for the restricted stock awards is recognized over the requisite service period based on the fair value of the shares at the date of grant. Unearned restricted stock awards are recorded as a reduction of shareholders’ equity until earned. Compensation expense resulting from these restricted stock awards was approximately $42 for the year ended December 31, 2006. There was no compensation expense related to restricted stock awards in prior periods.
Comprehensive Income:
The Corporation presents comprehensive income as part of the Statement of Changes in Shareholders’ Equity. Other comprehensive income (loss) consists of unrealized holding gains (losses) on the available for sale securities portfolio.
Earnings per Share:
Basic earnings per share is determined by dividing net income by the weighted average number of shares outstanding. Restricted stock awards are considered outstanding as they become earned. Diluted earnings per share is determined by dividing net income by the weighted average number of shares outstanding increased by the number of shares that would be issued assuming the exercise of stock options as well as the dilutive effects of restricted stock awards.
Cash and Cash Equivalents:
For purposes of the consolidated statement of cash flows, the Corporation defines cash and cash equivalents as cash and due from banks, interest bearing deposits with other banks, and Federal funds sold. Net cash flows are reported for customer loan and deposit transactions and borrowings with original maturities of 90 days or less.
Restrictions on Cash:
The Bank is required to maintain average reserve balances with the Federal Reserve Bank or in vault cash. The average amount of these non-interest bearing reserve balances for the year ended December 31, 2006 and 2005, was $50, which was maintained in vault cash.
Effect of Newly Issued But Not Yet Effective Accounting Standards:
In February 2006, the Financial Accounting Standards Board (FASB) issued Statement No. 155,Accounting for Certain Hybrid Financial Instruments-an amendment to FASB Statements No. 133 and 140. This Statement permits fair value remeasurement for any hybrid financial instruments, clarifies which instruments are subject to the requirements of Statement
| | |
| | CNB Financial Corporation & Subsidiaries | 2006 Annual Report | 12 |
NOTES TO CONSOLIDATED FINANCIAL STATEMENTS
No. 133, and establishes a requirement to evaluate interests in securitized financial assets and other items. The new standard is effective for financial assets acquired or issued after the beginning of the entity’s first fiscal year that begins after September 15, 2006. Management does not expect the adoption of this statement to have a material impact on its consolidated financial position or results of operations.
In March 2006, the FASB issued Statement No. 156,Accounting for Servicing of Financial Assets-an amendment of FASB Statement No. 140. This Statement provides the following: 1) revised guidance on when a servicing asset and servicing liability should be recognized; 2) requires all separately recognized servicing assets and servicing liabilities to be initially measured at fair value, if practicable; 3) permits an entity to elect to measure servicing assets and servicing liabilities at fair value each reporting date and report changes in fair value in earnings in the period in which the changes occur; 4) upon initial adoption, permits a onetime reclassification of available-for-sale securities to trading securities for securities which are identified as offsetting the entity’s exposure to changes in the fair value of servicing assets or liabilities that a servicer elects to subsequently measure at fair value; and 5) requires separate presentation of servicing assets and servicing liabilities subsequently measured at fair value in the statement of financial position and additional footnote disclosures. This standard is effective as of the beginning of an entity’s first fiscal year that begins after September 15, 2006 with the effects of initial adoption being reported as a cumulative-effect adjustment to retained earnings. Management does not expect the adoption of this statement will have a material impact on its consolidated financial position or results of operations.
In September 2006, the FASB issued Statement No. 157,Fair Value Measurements. This Statement defines fair value, establishes a framework for measuring fair value and expands disclosures about fair value measurements. This Statement establishes a fair value hierarchy about the assumptions used to measure fair value and clarifies assumptions about risk and the effect of a restriction on the sale or use of an asset. The standard is effective for fiscal years beginning after November 15, 2007. The Corporation has not completed its evaluation of the impact of the adoption of this standard.
In July 2006, the FASB issued FASB Interpretation No. 48,Accounting for Uncertainty in Income Taxes-an interpretation of FASB Statement No. 109(FIN 48), which prescribes a recognition threshold and measurement attribute for a tax position taken or expected to be taken in a tax return. FIN 48 also provides guidance on derecognition, classification, interest and penalties, accounting in interim periods, disclosure and transition. FIN 48 is effective for fiscal years beginning after December 15, 2006. The Corporation has determined that the adoption of FIN 48 will not have a material effect on the financial statements.
In September 2006, the FASB Emerging Issues Task Force finalized Issue No. 06-5,Accounting for Purchases of Life Insurance - Determining the Amount That Could Be Realized in Accordance with FASB Technical Bulletin No. 85-4 (Accounting for Purchases of Life Insurance). This issue requires that a policyholder consider contractual terms of a life insurance policy in determining the amount that could be realized under the insurance contract. It also requires that if the contract provides for a greater surrender value if all individual policies in a group are surrendered at the same time, that the surrender value be determined based on the assumption that policies will be surrendered on an individual basis. Lastly, the issue discusses whether the cash surrender value should be discounted when the policyholder is contractually limited in its ability to surrender a policy. This issue is effective for fiscal years beginning after December 15, 2006. The Corporation does not believe the adoption of this issue will have a material impact on the financial statements.
Loss Contingencies:
Loss contingencies, including claims and legal actions arising in the ordinary course of business, are recorded as liabilities when the likelihood of loss is probable and an amount or range of loss can be reasonably estimated. Management does not believe there now are such matters that will have a material effect on the financial statements.
Fair Value of Financial Instruments:
Fair values of financial instruments are estimated using relevant market information and other assumptions, as more fully disclosed in a separate note. Fair value estimates involve uncertainties and matters of significant judgment regarding interest rates, credit risk, prepayments, and other factors, especially in the absence of broad markets for particular items. Changes in assumptions or in market conditions could significantly affect the estimates.
Reclassifications:
Certain prior year amounts have been reclassified for comparative purposes.
2. EARNINGS PER SHARE
The computation of basic and diluted EPS is shown below (in thousands, except per share data). For the years ended December 31, 2006 and 2005, options to purchase 110,500 shares of common stock were not considered in computing diluted earnings per common share because they were anti-dilutive. For the year ended December 31, 2004, 58,918 shares under option were considered anti-dilutive.
| | |
13 | CNB Financial Corporation & Subsidiaries | 2006 Annual Report | | |
NOTES TO CONSOLIDATED FINANCIAL STATEMENTS
| | | | | | | | | |
| | | Years Ended December 31 |
| | | 2006 | | 2005 | | 2004 |
Basic earnings per share computation: | | | | | | | | | |
Net income | | $ | 9,622 | | $ | 9,138 | | $ | 7,871 |
| | | | | | | | | |
Gross weighted-average shares outstanding | | | 8,960 | | | 9,085 | | | 9,131 |
Less: Average unearned restricted stock | | | 10 | | | — | | | — |
| | | | | | | | | |
Net weighted-average shares outstanding | | | 8,950 | | | 9,085 | | | 9,131 |
| | | | | | | | | |
Basic earnings per share: | | $ | 1.08 | | $ | 1.01 | | $ | 0.86 |
| | | | | | | | | |
| |
| | | Years Ended December 31 |
| | | 2006 | | 2005 | | 2004 |
Diluted earnings per share computation: | | | | | | | | | |
Net Income | | $ | 9,622 | | $ | 9,138 | | $ | 7,871 |
| | | | | | | | | |
Weighted average shares outstanding for basic earnings per share | | | 8,950 | | | 9,085 | | | 9,131 |
Add: Dilutive effects of assumed exercises of stock options | | | 24 | | | 30 | | | 57 |
| | | | | | | | | |
Weighted average shares and potentially dilutive shares | | | 8,974 | | | 9,115 | | | 9,188 |
| | | | | | | | | |
Diluted earnings per share | | $ | 1.07 | | $ | 1.00 | | $ | 0.86 |
| | | | | | | | | |
3. SECURITIES
Securities at December 31, 2006 and 2005 were as follows:
| | | | | | | | | | | | | | | | | | | | | | | | | | |
| | | December 31, 2006 | | December 31, 2005 |
| | | Amortized | | Unrealized | | | Fair | | Amortized | | Unrealized | | | Fair |
| | | Cost | | Gains | | Losses | | | Value | | Cost | | Gains | | Losses | | | Value |
Securities available for sale: | | | | | | | | | | | | | | | | | | | | | | | | | | |
U.S. Treasury | | $ | 10,965 | | $ | 10 | | $ | (35 | ) | | $ | 10,940 | | $ | 11,961 | | $ | — | | $ | (111 | ) | | $ | 11,850 |
U.S. Government sponsored entities | | | 24,272 | | | 3 | | | (248 | ) | | | 24,027 | | | 31,378 | | | 6 | | | (415 | ) | | | 30,969 |
Obligations of States and | | | | | | | | | | | | | | | | | | | | | | | | | | |
Political Subdivisions | | | 35,046 | | | 1,016 | | | (20 | ) | | | 36,042 | | | 39,352 | | | 1,340 | | | (20 | ) | | | 40,672 |
Mortgage-backed | | | 44,030 | | | 41 | | | (444 | ) | | | 43,627 | | | 39,907 | | | 71 | | | (551 | ) | | | 39,427 |
Corporate notes and bonds | | | 31,124 | | | 634 | | | (38 | ) | | | 31,720 | | | 29,820 | | | 815 | | | (187 | ) | | | 30,448 |
Marketable equities | | | 9,291 | | | 1,126 | | | (77 | ) | | | 10,340 | | | 7,688 | | | 986 | | | (143 | ) | | | 8,531 |
| | | | | | | | | | | | | | | | | | | | | | | | | | |
Total securities available for sale | | $ | 154,728 | | $ | 2,830 | | $ | (862 | ) | | $ | 156,696 | | $ | 160,106 | | $ | 3,218 | | $ | (1,427 | ) | | $ | 161,897 |
| | | | | | | | | | | | | | | | | | | | | | | | | | |
At year end 2006 and 2005, there were no holdings of securities of any one issuer, other than the U.S. Government sponsored entities, in an amount greater than 10% of shareholders’ equity.
Securities with unrealized losses at year-end 2006 and 2005, aggregated by investment category and length of time that individual securities have been in a continuous unrealized loss position, are as follows:
| | | | | | | | | | | | | | | | | | | | | |
| 2006 | | Less than 12 Months | | | 12 Months or More | | | Total | |
Description of Securities | | Fair
Value | | Unrealized
Loss | | | Fair
Value | | Unrealized
Loss | | | Fair
Value | | Unrealized
Loss | |
U.S. Treasury | | $ | 2,969 | | $ | (6 | ) | | $ | 4,963 | | $ | (29 | ) | | $ | 7,932 | | $ | (35 | ) |
U.S. Gov’t Sponsored Entities | | | 7,574 | | | (22 | ) | | | 14,262 | | | (226 | ) | | | 21,836 | | | (248 | ) |
States & Political Subdivisions | | | 1,650 | | | (6 | ) | | | 1,542 | | | (14 | ) | | | 3,192 | | | (20 | ) |
Mortgage-Backed | | | 16,723 | | | (50 | ) | | | 20,550 | | | (394 | ) | | | 37,273 | | | (444 | ) |
Corporate Notes and Bonds | | | 1,661 | | | (4 | ) | | | 10,419 | | | (34 | ) | | | 12,080 | | | (38 | ) |
Marketable Equities | | | 178 | | | (5 | ) | | | 773 | | | (72 | ) | | | 951 | | | (77 | ) |
| | | | | | | | | | | | | | | | | | | | | |
| | $ | 30,755 | | $ | (93 | ) | | $ | 52,509 | | $ | (769 | ) | | $ | 83,264 | | $ | (862 | ) |
| | | | | | | | | | | | | | | | | | | | | |
| | |
| | CNB Financial Corporation & Subsidiaries | 2006 Annual Report | 14 |
NOTES TO CONSOLIDATED FINANCIAL STATEMENTS
| | | | | | | | | | | | | | | | | | | | | |
| 2005 | | Less than 12 Months | | | 12 Months or More | | | Total | |
Description of Securities | | Fair
Value | | Unrealized
Loss | | | Fair
Value | | Unrealized
Loss | | | Fair
Value | | Unrealized
Loss | |
U.S. Treasury | | $ | 4,940 | | $ | (39 | ) | | $ | 5,935 | | $ | (72 | ) | | $ | 10,875 | | $ | (111 | ) |
U.S. Gov’t Sponsored Entities | | | 11,056 | | | (127 | ) | | | 16,198 | | | (288 | ) | | | 27,254 | | | (415 | ) |
States & Political Subdivisions | | | 3,268 | | | (16 | ) | | | 705 | | | (4 | ) | | | 3,973 | | | (20 | ) |
Mortgage-Backed | | | 19,548 | | | (356 | ) | | | 9,789 | | | (195 | ) | | | 29,337 | | | (551 | ) |
Corporate Notes and Bonds | | | 8,906 | | | (70 | ) | | | 4,258 | | | (117 | ) | | | 13,164 | | | (187 | ) |
Marketable Equities | | | 1,036 | | | (43 | ) | | | 1,390 | | | (100 | ) | | | 2,426 | | | (143 | ) |
| | | | | | | | | | | | | | | | | | | | | |
| | $ | 48,754 | | $ | (651 | ) | | $ | 38,275 | | $ | (776 | ) | | $ | 87,029 | | $ | (1,427 | ) |
| | | | | | | | | | | | | | | | | | | | | |
The Corporation evaluates securities for other-than-temporary impairment on a quarterly basis, or more frequently when economic or market conditions warrant such an evaluation. Consideration is given to the length of time and the extent to which fair value has been less than cost, the financial condition and near term prospects of the issuer, and the intent and ability of the Corporation to retain its investment in the issuer for a period of time sufficient to allow for any anticipated recovery in fair value. In analyzing an issuer’s financial condition, the Corporation may consider whether the securities are issued by the federal government or its agencies, whether downgrades by bond rating agencies have occurred, and results of reviews of the issuer’s financial condition. The following comments relate to those securities which have been in a continuous unrealized loss position for more than twelve months.
Included in the $769 of unrealized losses at December 31, 2006 on securities that have been in a continuous unrealized loss position for 12 months or more are $697 of unrealized losses on debt securities. Management does not believe any of the individual unrealized losses on debt securities represents an other-than-temporary impairment since these losses are primarily attributable to changes in interest rates and the Corporation has both the intent and ability to hold the debt securities for the forseeable future.
Unrealized losses on equity securities, which comprise the remainder of the $769 and amount to $72, were not individually significant and are also considered to be temporary in nature.
During 2005 and 2004, the Corporation recognized impairment losses of $240 and $1,400 before tax, respectively, on preferred stock issued by U.S. Government sponsored entities that were determined to be other-than-temporarily impaired. Management did not believe the securities would recover to the Corporation’s cost basis in a reasonable period of time.
On December 31, 2006 and 2005, securities carried at $75,876 and $80,436, respectively, were pledged to secure public deposits and for other purposes as provided by law.
The following is a schedule of the contractual maturity of securities available-for-sale excluding equity securities, at December 31, 2006:
| | | |
| | | Available for Sale
Fair Value |
1 year or less | | $ | 25,194 |
1 year-5 years | | | 31,171 |
5 years-10 years | | | 11,300 |
After 10 years | | | 35,064 |
| | | |
| | | 102,729 |
Mortgage-backed securities | | | 43,627 |
| | | |
Total securities | | $ | 146,356 |
| | | |
Mortgage-backed securities are not due at a single date; periodic payments are received based on the payment patterns of the underlying collateral.
Information pertaining to security transactions is as follows:
| | | | | | | | | |
| | | Proceeds | | Gross Gains | | Gross Losses |
2006 | | $ | 105 | | $ | 343 | | $ | 5 |
2005 | | $ | 8,038 | | $ | 387 | | $ | 65 |
2004 | | $ | 6,805 | | $ | 339 | | $ | 26 |
The tax provision related to these net realized gains was $118, $113 and $109, respectively.
| | |
15 | CNB Financial Corporation & Subsidiaries | 2006 Annual Report | | |
NOTES TO CONSOLIDATED FINANCIAL STATEMENTS
During the first quarter of 2006, the issuer of a financial institution equity security held in the Corporation’s available-for-sale portfolio was acquired by another financial institution. As a result of the acquisition, the Corporation received 1.994 shares of the acquiring entities stock in exchange for each share of the equity security that it held. Following current accounting guidance in FAS No. 153,Exchanges of Nonmonetary Assets, the Corporation recorded a $341 realized gain as a result of the difference between its basis in the equity security it held and the fair market value of the shares it received at the date of the exchange.
4. LOANS
Total Loans at December 31, 2006 and 2005 are summarized as follows:
| | | | | | |
| | | 2006 | | 2005 |
Commercial, Financial and Agricultural | | $ | 214,804 | | $ | 194,044 |
Residential Mortgage | | | 160,159 | | | 153,130 |
Commercial Mortgage | | | 143,453 | | | 135,417 |
Installment | | | 29,411 | | | 27,840 |
Lease Receivables | | | 119 | | | 611 |
| | | | | | |
| | $ | 547,946 | | $ | 511,042 |
| | | | | | |
Lease receivables at December 31, 2006 and 2005 are summarized as follows:
| | | | | | | | |
| | | 2006 | | | 2005 | |
Lease payment receivable | | $ | 29 | | | $ | 198 | |
Estimated residual values | | | 90 | | | | 413 | |
| | | | | | | | |
Gross lease receivables | | | 119 | | | | 611 | |
Less unearned income | | | (3 | ) | | | (25 | ) |
| | | | | | | | |
Net lease receivables | | $ | 116 | | | $ | 586 | |
| | | | | | | | |
At December 31, 2006 and 2005, net unamortized loan costs and fees of $(43) and $(69) respectively, have been included in the carrying value of loans.
The Bank’s outstanding loans and related unfunded commitments are primarily concentrated within Central and Western Pennsylvania. The Bank attempts to limit concentrations within specific industries by utilizing dollar limitations to single industries or customers, and by entering into participation agreements with third parties. Collateral requirements are established based on management’s assessment of the customer.
Deposit accounts that have overdrawn their current balance, known as overdrafts, are reclassified to loans. Overdrafts included in year-end loans are $465 in 2006 and $2,278 in 2005.
Impaired loans were as follows:
| | | | | | |
| | | 2006 | | 2005 |
Year-end loans with no allocated allowance for loan losses | | $ | 1,360 | | $ | 788 |
Year-end loans with allocated allowance for loan losses | | | 1,581 | | | 886 |
| | | | | | |
Total | | $ | 2,941 | | $ | 1,674 |
| | | | | | |
Amount of the allowance for loan losses allocated | | $ | 653 | | $ | 446 |
| | | | | | |
| | | | | | | | | |
| | | 2006 | | 2005 | | 2004 |
Average impaired loans outstanding during the year | | $ | 2,681 | | $ | 1,939 | | $ | 2,272 |
Interest income recognized during impairment and cash basis interest income recognized was not material in any year presented.Nonperforming loans were as follows:
| | | | | | |
| | | 2006 | | 2005 |
Loans past due over 90 days still on accrual | | $ | 128 | | $ | 462 |
Nonaccrual loans | | $ | 1,619 | | $ | 1,561 |
Nonperforming loans include impaired loans and smaller balance homogeneous loans, such as residential mortgage and consumer loans, that are collectively evaluated for impairment.
| | |
| | CNB Financial Corporation & Subsidiaries | 2006 Annual Report | 16 |
NOTES TO CONSOLIDATED FINANCIAL STATEMENTS
5. ALLOWANCEFOR LOAN LOSSES
Transactions in the Allowance for Loan Losses for the three years ended December 31 were as follows:
| | | | | | | | | | | | |
| | | 2006 | | | 2005 | | | 2004 | |
Balance, Beginning of Year | | $ | 5,603 | | | $ | 5,585 | | | $ | 5,764 | |
Charge-offs | | | (1,091 | ) | | | (975 | ) | | | (1,099 | ) |
Recoveries | | | 203 | | | | 210 | | | | 120 | |
| | | | | | | | | | | | |
Net Charge-offs | | | (888 | ) | | | (765 | ) | | | (979 | ) |
Provision for Loan Losses | | | 1,371 | | | | 783 | | | | 800 | |
| | | | | | | | | | | | |
Balance, End of Year | | $ | 6,086 | | | $ | 5,603 | | | $ | 5,585 | |
| | | | | | | | | | | | |
6. SECONDARY MORTGAGE MARKET ACTIVITIES
The following summarizes secondary mortgage market activities for each year:
| | | | | | | | | |
| | | 2006 | | 2005 | | 2004 |
Activity during the year: | | | | | | | | | |
Loans originated for resale, Net of principal pay downs | | $ | 10,047 | | $ | 11,868 | | $ | 11,724 |
Proceeds from sales of loans held for sale | | | 10,222 | | | 12,308 | | | 11,866 |
Net gains on sales of loans held for sale | | | 56 | | | 95 | | | 142 |
Loan servicing fees | | | 277 | | | 263 | | | 256 |
Total loans serviced for others | | $ | 75,982 | | $ | 73,088 | | $ | 69,240 |
Activity for capitalized mortgage servicing rights was as follows:
| | | | | | | | | | | | |
| | | 2006 | | | 2005 | | | 2004 | |
Servicing rights: | | | | | | | | | | | | |
Beginning of year | | $ | 373 | | | $ | 411 | | | $ | 481 | |
Additions | | | 263 | | | | 155 | | | | 124 | |
Amortized to expense | | | (190 | ) | | | (193 | ) | | | (194 | ) |
| | | | | | | | | | | | |
End of year | | $ | 446 | | | $ | 373 | | | $ | 411 | |
| | | | | | | | | | | | |
No valuation allowance is deemed necessary as of December 31, 2006, 2005 or 2004.
7. PREMISESAND EQUIPMENT
The following summarizes Premises and Equipment at December 31:
| | | | | | |
| | | 2006 | | 2005 |
Land | | $ | 3,120 | | $ | 2,248 |
Premises and Leasehold Improvements | | | 15,135 | | | 13,697 |
Furniture and Equipment | | | 11,991 | | | 10,720 |
| | | | | | |
| | | 30,246 | | | 26,665 |
Less: Accumulated Depreciation | | | 14,009 | | | 12,753 |
| | | | | | |
Premises and Equipment, Net | | $ | 16,237 | | $ | 13,912 |
| | | | | | |
Depreciation on Premises and Equipment amounted to $1,277 in 2006, $1,333 in 2005, and $1,255 in 2004.
The Corporation is committed under nine noncancelable operating leases for facilities with initial or remaining terms in excess of one year. The minimum annual rental commitments under these leases at December 31, 2006 are as follows:
| | | |
2007 | | $ | 245 |
2008 | | | 283 |
2009 | | | 251 |
2010 | | | 227 |
2011 | | | 223 |
Thereafter | | | 1,979 |
| | | |
| | $ | 3,208 |
| | | |
| | |
17 | CNB Financial Corporation & Subsidiaries | 2006 Annual Report | | |
NOTES TO CONSOLIDATED FINANCIAL STATEMENTS
Rental expense, net of rental income, charged to occupancy expense for 2006, 2005, and 2004 was $242, $190, and $209, respectively.
8. FORECLOSED ASSETS
Foreclosed real estate is reported net of a valuation allowance. Activity was as follows:
| | | | | | | | | | | | |
| | | 2006 | | | 2005 | | | 2004 | |
Beginning of year | | $ | 85 | | | $ | 830 | | | $ | 286 | |
Additions | | | 249 | | | | 80 | | | | 1,005 | |
Direct write-downs | | | — | | | | — | | | | (40 | ) |
Sales | | | (153 | ) | | | (825 | ) | | | (421 | ) |
| | | | | | | | | | | | |
End of year | | $ | 181 | | | $ | 85 | | | $ | 830 | |
| | | | | | | | | | | | |
9. GOODWILLAND INTANGIBLE ASSETS
The change in the carrying amount of goodwill for the year is as follows:
| | | | | | |
| | | 2006 | | 2005 |
Beginning of year | | $ | 10,821 | | $ | 10,821 |
Acquired during the period | | | — | | | — |
| | | | | | |
End of year | | $ | 10,821 | | $ | 10,821 |
| | | | | | |
| | | | | | | | | | | | |
| | | 2006 | | | 2005 | | | 2004 | |
Acquired Intangible Assets | | | | | | | | | | | | |
Amortized intangibles | | $ | 3,652 | | | $ | 3,152 | | | $ | 3,152 | |
Intangible assets acquired during year | | | — | | | | 500 | | | | — | |
Accumulated amortization | | | (3,267 | ) | | | (2,852 | ) | | | (2,522 | ) |
| | | | | | | | | | | | |
Net | | $ | 385 | | | $ | 800 | | | $ | 630 | |
| | | | | | | | | | | | |
Aggregate amortization expense | | $ | 415 | | | $ | 330 | | | $ | 316 | |
In November of 2005, the Corporation acquired the assets of a consumer discount and finance company which the Corporation operates as Holiday Financial Services Corporation. The purchase price was $2,408 for the performing loans and customers of the business. The purchase resulted in the Corporation recording a $500 customer relationship intangible.
Estimated amortization expense for each of the next five years:
| | | |
2007 | | $ | 100 |
2008 | | $ | 100 |
2009 | | $ | 100 |
2010 | | $ | 85 |
10. DEPOSITS
The following table reflects time certificates of deposit accounts included in total deposits and their remaining maturities at December 31:
| | | |
| | | 2006 |
Time Deposits Maturing: | | | |
2007 | | $ | 61,957 |
2008 | | | 135,630 |
2009 | | | 104,879 |
2010 | | | 21,046 |
2011 | | | 27,337 |
Thereafter | | | 5,057 |
| | | |
| | $ | 355,906 |
| | | |
Certificates of deposit of $100 thousand or more totaled $124,501, and $99,542 at December 31, 2006 and 2005, respectively.
| | |
| | CNB Financial Corporation & Subsidiaries | 2006 Annual Report | 18 |
NOTES TO CONSOLIDATED FINANCIAL STATEMENTS
11. BORROWINGS
Borrowings include $2,000 of demand notes payable to the U.S. Treasury Department at December 31, 2006 and 2005. These notes are issued under the U.S. Treasury Department’s program of investing the treasury tax and loan account balances in interest bearing demand notes insured by depository institutions. These notes bear interest at a rate of .25 percent less than the average Federal funds rate as computed by the Federal Reserve Bank.
The Corporation has available two $5 million lines of credit with unaffiliated institutions. Terms of the lines are floating at 30 day LIBOR plus 180 basis points. The outstanding balance on the lines at year end 2006 and 2005 was $0.
FHLB Borrowings:
At year end 2006, the Bank had remaining borrowing capacity with the Federal Home Loan Bank (FHLB) of $137 million. Borrowings with the FHLB are secured by a blanket pledge of selected securities in the amount of $82,742 and certain mortgage loans with a balance of $160,434. Borrowings from the FHLB at December 31, 2006, and 2005 are as follows:
| | | | | | | | |
| | | | | December 31, |
Interest Rate | | Maturity | | 2006 | | 2005 |
(a) | | FHLB Open Repo | | $ | 2,635 | | | — |
(b) | | 05/03/06 | | | — | | $ | 1,250 |
(c) | | 11/03/06 | | | — | | | 1,750 |
(d) | | 05/03/07 | | | 2,250 | | | 2,250 |
(e) | | 05/05/08 | | | 4,000 | | | 4,000 |
(f) | | 05/04/09 | | | 4,500 | | | 4,500 |
(g) | | 03/01/10 | | | 10,000 | | | 10,000 |
(h) | | 05/03/10 | | | 4,500 | | | 4,500 |
(i) | | 01/03/11 | | | — | | | 10,000 |
(j) | | 01/24/12 | | | 20,000 | | | 20,000 |
| | | | | | | | |
Total FHLB Borrowings | | | | $ | 47,885 | | $ | 58,250 |
| | | | | | | | |
(a) - FHLB Open Repo plus lines of credit are alternatives to overnight Federal Funds from the Federal Reserve. Interest rates typically track the current Federal Fund rates. The interest rate at December 31, 2006 was 5.43%.
(b), (c), (d), (e) (f), (h) - Items (b) through (e) and (h) are fixed rate borrowings at interest rates of 3.69%, 3.83%, 4.00%, 4.14%, 4.35% and 4.43%, respectively.
(g) FHLB has option to float the interest rate based on the 3 month LIBOR +.16%, the interest rate was 6.09% at December 31, 2006 and 2005.
(i) Interest rate was fixed for one year after which time the FHLB has option to float the interest rate based on the 3 month LIBOR +.20%. The interest rate was 4.95% at December 31, 2005.
(j) Interest rate was fixed for two years after which time FHLB converted to a floating interest rate based on the 3 month LIBOR +.18% if the 3 month LIBOR is equal to or greater than 8.0%. The interest rate was 4.52% as of December 31, 2006 and 2005.
The terms of the borrowings (b) through (j) are interest only payments with principal due at maturity.
Other Borrowings:
On June 30, 2006, the Bank entered into a borrowing transaction with an unaffiliated institution. The proceeds of this borrowing were $10,000 and as part of the transaction the Bank pledged certain agency securities which had a carrying amount of $10,863 at December 31, 2006. The borrowing has a maturity date of June 30, 2016 and a fixed interest rate of 4.79%. The borrowing is callable by the issuer on June 30, 2007 and at the end of each quarter thereafter until maturity.
Subordinated Debentures:
A trust formed by the Corporation issued $10,000 of floating rate trust preferred securities in 2002 as part of a pooled offering of such securities. The interest rate is determined quarterly and floats based on the 3 month LIBOR plus 3.45% and was 8.81% at December 31, 2006 and 7.97% at December 31, 2005. The Corporation issued subordinated debentures to the trust in exchange for the proceeds of the offering, which debentures represent the sole asset of the trust. The subordinated debentures must be redeemed no later than 2032. The Corporation may redeem the debentures, in whole or in part, at face value after June 26, 2007.
| | |
19 | CNB Financial Corporation & Subsidiaries | 2006 Annual Report | | |
NOTES TO CONSOLIDATED FINANCIAL STATEMENTS
Under FASB Interpretation No. 46, as revised in December 2003, the trust is not consolidated with the Corporation. Accordingly, the Corporation does not report the securities issued by the trust as liabilities, and instead reports as liabilities the subordinated debentures issued by the Corporation and held by the trust, as these are not eliminated in consolidation.
Maturity Schedule of All Borrowed Funds
Following are maturities of all borrowed funds as of December 31, 2006:
| | | |
2007 | | $ | 6,885 |
2008 | | | 4,000 |
2009 | | | 4,500 |
2010 | | | 14,500 |
2011 | | | — |
Thereafter | | | 40,310 |
| | | |
Total Borrowed Funds | | $ | 70,195 |
| | | |
12. INCOME TAXES
The following is a summary of income tax expense:
| | | | | | | | | | | | |
| | | 2006 | | | 2005 | | | 2004 | |
Current | | $ | 3,500 | | | $ | 3,663 | | | $ | 2,699 | |
Deferred | | | (150 | ) | | | (674 | ) | | | (735 | ) |
| | | | | | | | | | | | |
Income tax expense | | $ | 3,350 | | | $ | 2,989 | | | $ | 1,964 | |
| | | | | | | | | | | | |
The components of the net deferred tax asset (liability) as of December 31, 2006 and 2005 are as follows:
| | | | | | |
| | | 2006 | | 2005 |
Deferred tax assets | | | | | | |
Allowance for loan losses | | $ | 2,130 | | $ | 1,961 |
Deferred compensation | | | 847 | | | 757 |
Impaired security valuation | | | 574 | | | 574 |
Post-retirement benefits | | | 222 | | | 237 |
Merger costs | | | 22 | | | 30 |
Other | | | 244 | | | 180 |
| | | | | | |
| | | 4,039 | | | 3,739 |
Deferred tax liabilities | | | | | | |
Unrealized gain on securities available for sale | | | 689 | | | 624 |
Premises and equipment | | | 454 | | | 514 |
Intangibles - section 197 | | | 868 | | | 593 |
Vehicle leasing | | | 5 | | | 164 |
Prepaid expenses | | | 129 | | | 116 |
Intangibles - mortgage servicing rights | | | 156 | | | 130 |
Deferred loan fees/costs | | | 52 | | | 50 |
Other | | | 201 | | | 113 |
| | | | | | |
| | | 2,554 | | | 2,304 |
| | | | | | |
Net deferred tax asset (liability) | | $ | 1,485 | | $ | 1,435 |
| | | | | | |
| | |
| | CNB Financial Corporation & Subsidiaries | 2006 Annual Report | 20 |
NOTES TO CONSOLIDATED FINANCIAL STATEMENTS
The reconciliation of income tax attributable to pre-tax income at the Federal statutory tax rates to income tax expense is as follows:
| | | | | | | | | | | | | | | | | | | | | |
| | | 2006 | | | % | | | 2005 | | | % | | | 2004 | | | % | |
Tax at statutory rate | | $ | 4,540 | | | 35.0 | | | $ | 4,244 | | | 35.0 | | | $ | 3,443 | | | 35.0 | |
Tax exempt income, net | | | (778 | ) | | (6.0 | ) | | | (881 | ) | | (7.3 | ) | | | (1,004 | ) | | (10.2 | ) |
Bank owned life insurance | | | (241 | ) | | (1.9 | ) | | | (215 | ) | | (1.8 | ) | | | (175 | ) | | (1.8 | ) |
Other | | | (171 | ) | | (1.3 | ) | | | (159 | ) | | (1.3 | ) | | | (300 | ) | | (3.0 | ) |
| | | | | | | | | | | | | | | | | | | | | |
Income tax expense | | $ | 3,350 | | | 25.8 | | | $ | 2,989 | | | 24.6 | | | $ | 1,964 | | | 20.0 | |
| | | | | | | | | | | | | | | | | | | | | |
13. EMPLOYEE BENEFIT PLANS
The Corporation provides a defined contribution retirement plan that covers all active officers and employees twenty-one years of age or older, employed by the Corporation for one year. Contributions to the plan for 2006, 2005 and 2004 based on current year compensation, are 6 percent of total compensation plus 5.7 percent of the compensation in excess of $94. The Corporation recognized expense of $422 in 2006, $377 in 2005, and $375 in 2004.
In addition, the Corporation sponsors a contributory defined contribution Section 401(k) plan in which substantially all employees participate. The plan permits employees to make pre-tax contributions which are matched by the Corporation, in 2006, 2005 and 2004, at 100% for every 1% contributed up to three percent then 50% for every 1% contributed up to four percent in total of the employee’s compensation. The Corporation’s contributions were $242, $176, and $148 in 2006, 2005, and 2004, respectively.
During 2003, the Corporation adopted a non-qualified supplemental executive retirement plan (“SERP”) for certain executives to compensate those executive participants in the Corporation’s retirement plan whose benefits are limited by compensation limitations under current tax law. The SERP is considered an unfunded plan for tax and ERISA purposes and all obligations arising under the SERP are payable from the general assets of the Corporation. At December 31, 2006 and 2005, obligations of $1,399 and $1,218, respectively, were included in other liabilities for this plan. Expenses related to this plan were $192 in 2006, $405 in 2005 and $428 in 2004.
During 2003, the Corporation established a Survivor Benefit Plan (the Plan) for the benefit of outside directors. The purpose of the plan is to provide life insurance benefits to beneficiaries of the Corporation’s board of directors who at the time of their death are participants in the plan. The plan is considered an unfunded plan for tax and ERISA purposes and all obligations arising under the plan are payable from the general assets of the Corporation. At December 31, 2006 and 2005, obligations of $446 and $328, respectively, were included in other liabilities for this plan. Expenses related to this plan were $118 in 2006, $103 in 2005 and $123 in 2004.
The Corporation has a post retirement benefits plan which provides certain health care benefits for retired employees and their qualifying dependents. In September 2006, the Financial Accounting Standards Board (FASB) issued FAS No. 158,Employers’ Accounting for Defined Benefit Pension and Other Postretirement Plans - an amendment of FASB Statements No. 87, 88, 106 and 132(R). This Statement requires an employer to recognize the overfunded or underfunded status of a defined benefit postretirement plan (other than a multiemployer plan) as an asset or liability in its balance sheet, beginning with year end 2006, and to recognize changes in the funded status in the year in which the changes occur through comprehensive income beginning in 2007.
The adoption of FAS No. 158 had the following affect on individual line items in the 2006 consolidated balance sheet:
| | | | | | | | | | | | |
| | | Before Adoption
of FAS No. 158 | | | Adjustments | | | After Adoption
of FAS No. 158 | |
Accrued postretirement liability | | $ | (707 | ) | | $ | 100 | | | $ | (607 | ) |
Deferred income taxes | | | 1,520 | | | | (35 | ) | | | 1,485 | |
Accumulated other comprehensive income | | | (1,278 | ) | | | (65 | ) | | | (1,343 | ) |
The following illustrates amounts recognized in accumulated other comprehensive income at December 31, 2006 as a result of adopting FAS 158:
| | | | |
Net unrecognized actuarial gain | | $ | (151 | ) |
Unrecognized transition obligation | | | 51 | |
| | | | |
| | $ | (100 | ) |
| | | | |
| | |
21 | CNB Financial Corporation & Subsidiaries | 2006 Annual Report | | |
NOTES TO CONSOLIDATED FINANCIAL STATEMENTS
The following table sets forth the change in the benefit obligation and funded staus of the plan:
| | | | | | | | | | | | |
December 31 | | 2006 | | | 2005 | | | 2004 | |
Benefit obligation at beginning of year | | $ | 599 | | | $ | 580 | | | $ | 654 | |
Interest cost | | | 35 | | | | 34 | | | | 42 | |
Service cost | | | 33 | | | | 31 | | | | 34 | |
Actual claim expense | | | (27 | ) | | | (16 | ) | | | (10 | ) |
Actuarial (gain)/loss | | | (33 | ) | | | (30 | ) | | | (140 | ) |
| | | | | | | | | | | | |
Benefit obligation at end of year | | $ | 607 | | | $ | 599 | | | $ | 580 | |
| | | | | | | | | | | | |
| | | |
December 31 | | 2006 | | | 2005 | | | 2004 | |
Funded status of plan | | $ | (607 | ) | | $ | (599 | ) | | $ | (580 | ) |
Unrecognized actuarial (gain)/loss | | | — | | | | (121 | ) | | | (92 | ) |
Unrecognized transition obligation | | | — | | | | 59 | | | | 66 | |
| | | | | | | | | | | | |
Accrued benefit cost | | $ | (607 | ) | | $ | (661 | ) | | $ | (606 | ) |
| | | | | | | | | | | | |
| | | |
December 31 | | 2006 | | | 2005 | | | 2004 | |
Net periodic post-retirement benefit cost: | | | | | | | | | | | | |
Service cost | | $ | 33 | | | $ | 31 | | | $ | 34 | |
Interest cost | | | 35 | | | | 34 | | | | 42 | |
Amortization of transition obligation over 21 years | | | 5 | | | | 6 | | | | 7 | |
| | | | | | | | | | | | |
| | $ | 73 | | | $ | 71 | | | $ | 83 | |
| | | | | | | | | | | | |
The weighted average discount rate used to calculate net periodic benefit cost was 6.0% in 2006, 2005 and 2004. The weighted average rate used to calculate accrued benefit obligations was 6.0% in 2006, 2005 and 2004. The health care cost trend rate used to measure the expected costs of benefits for 2007 is 7.0%, 6.0% for 2008, and 5% for 2009 and thereafter. A one percent increase in the health care trend rates would result in an increase of $83 in the benefit obligation of December 31, 2006, and would increase the service and interest costs by $12 in future periods. A similar one percent decrease in health care trend rates would result in a decrease of $70 and $10 in the benefit obligation and service and interest costs, respectively, at December 31, 2006. The presentation above for the years 2006, 2005 and 2004 reflects a policy which grants eligibility to these benefits to employees at least 60 years of age with 30 years of service.
14. DEFERRED COMPENSATION PLANS
Deferred compensation plans cover all directors and certain officers. Under the plans, the Corporation pays each participant, or their beneficiary, the amount of fees or compensation deferred plus gains or net of losses over a maximum period of 10 years, beginning with the individuals termination of service. A liability is accrued for the obligation under these plans. The expense incurred for deferred compensation for 2006, 2005 and 2004 was $82, $218 and $7, respectively, resulting in a deferred compensation liability of $975 and $941 as of year-end 2006 and 2005, respectively.
| | |
| | CNB Financial Corporation & Subsidiaries | 2006 Annual Report | 22 |
NOTES TO CONSOLIDATED FINANCIAL STATEMENTS
15. STOCK-BASED COMPENSATION
Stock Options:
A summary of the status of the stock options, adjusted retroactively for the effects of stock splits, is presented below:
| | | | | | |
| | | Stock
Options | | | Weighted-average
Exercise Price |
Outstanding, at January 1, 2004 | | 232,973 | | | $ | 12.08 |
Granted | | 54,250 | | | | 16.04 |
Exercised | | (11,017 | ) | | | 8.70 |
Forfeited | | — | | | | — |
| | | | | | |
Outstanding, at December 31, 2004 | | 276,206 | | | | 13.02 |
Granted | | — | | | | — |
Exercised | | (7,850 | ) | | | 9.10 |
Forfeited | | (313 | ) | | | 9.50 |
| | | | | | |
Outstanding, at December 31, 2005 | | 268,043 | | | $ | 13.14 |
Granted | | — | | | | — |
Exercised | | — | | | | — |
Forfeited | | (625 | ) | | | 9.50 |
| | | | | | |
Outstanding, at December 31, 2006 | | 267,418 | | | $ | 13.15 |
| | | | | | |
| | | | | | | |
| | | 2006 | | 2005 | | 2004 |
Options exercisable at year-end | | 267,418 | | 259,135 | | | 155,183 |
Fair value of options granted during the year | | — | | — | | $ | 2.69 |
Number of authorized stock-based awards remaining to grant | | 275,359 | | 289,388 | | | 289,075 |
Options outstanding at year-end 2006 were as follows:
| | | | | | | | | |
| | | Outstanding | | Exerciseable |
Range of Exercise Prices | | Number | | Weighted Average
Remaining
Contractual Life | | Number | | Weighted Average
Exercise Price |
$ 7.40 - 9.50 | | 81,644 | | 4.5 years | | 81,644 | | $ | 8.53 |
11.30 - 13.30 | | 75,274 | | 5.2 years | | 75,274 | | | 12.78 |
16.04 - 17.54 | | 110,500 | | 7.5 years | | 110,500 | | | 16.80 |
| | | | | | | | | |
| | 267,418 | | | | 267,418 | | | |
| | | | | | | | | |
The aggregate intrinsic value of all options outstanding and exercisable at December 31, 2006 was $566,633.
Additional information related to the stock option plan during each year follows:
| | | | | | | | | |
| | | 2006 | | 2005 | | 2004 |
Intrinsic value of options exercised | | $ | — | | $ | 47 | | $ | 136 |
Cash received from option exercises | | | — | | | 71 | | | 95 |
As of December 31, 2006, there was no unrecognized compensation cost related to nonvested stock options granted under the Plan.
| | |
23 | CNB Financial Corporation & Subsidiaries | 2006 Annual Report | | |
NOTES TO CONSOLIDATED FINANCIAL STATEMENTS
Restricted Stock Awards:
A summary of changes in nonvested restricted stock awards for the year follows:
| | | | | |
| | | Shares | | Weighted-Average
Grant-Date
Fair Value |
Nonvested at January 1, 2006 | | — | | $ | — |
Granted | | 14,654 | | | 13.81 |
Vested | | — | | | — |
Forfeited | | — | | | — |
| | | | | |
Nonvested at December 31, 2006 | | 14,654 | | $ | 13.81 |
| | | | | |
As of December 31, 2006, there was $160 of total unrecognized compensation cost related to nonvested shares granted under the Plan. Compensation expense for restricted stock awards was $42 in 2006.
16. RELATED PARTY TRANSACTIONS
In the ordinary course of business, the Bank has transactions, including loans, with its officers, directors and their affiliated companies. The aggregate of such loans totaled $10,838 on December 31, 2006 compared to $10,713 at December 31, 2005. During 2006, $5,127 of new loans were made and repayments totaled $5,002.
Deposits from principal officers, directors and their affiliates at year-end 2006 and 2005 were $5,221 and $2,940.
17. CAPITAL REQUIREMENTSAND RESTRICTIONSON RETAINED EARNINGS
Banks and bank holding companies are subject to regulatory capital requirements administered by federal banking agencies. Capital adequacy guidelines and, additionally for banks, prompt corrective action regulations involve quantitative measures of assets, liabilities, and certain off-balance-sheet items calculated under regulatory accounting practices. Capital amounts and classifications are also subject to qualitative judgements by regulators. Failure to meet capital requirements can initiate regulatory action.
Prompt corrective action regulations provide five classifications: well capitalized, adequately capitalized, undercapitalized, significantly undercapitalized, and critically undercapitalized, although these terms are not used to represent overall financial condition. If adequately capitalized, regulatory approval is required to accept brokered deposits. If undercapitalized, capital distributions are limited, as is asset growth and expansion, and capital restoration plans are required. As of December 31, 2006 and 2005, the most recent regulatory notifications categorized the Bank as well capitalized under the regulatory framework for prompt corrective action. There are no events or conditions since this notification that management believes have changed the Bank’s category.
Actual and required capital amounts and ratios are presented below at year-end:
| | | | | | | | | | | | | | | | | | |
| | | Actual | | | For Capital
Adequacy Purposes | | | To be Well
Capitalized Under
Prompt Corrective
Action Provisions | |
| | | Amount | | Ratio | | | Amount | | Ratio | | | Amount | | Ratio | |
2006 | | | | | | | | | | | | | | | | | | |
Total Capital to risk weighted assets | | | | | | | | | | | | | | | | | | |
Consolidated | | $ | 76,332 | | 12.75 | % | | $ | 47,900 | | 8.0 | % | | | NA | | | |
Bank | | $ | 62,594 | | 10.69 | % | | $ | 46,826 | | 8.0 | % | | $ | 58,533 | | 10.0 | % |
Tier 1 (Core) Capital to risk weighted assets | | | | | | | | | | | | | | | | | | |
Consolidated | | $ | 70,070 | | 11.70 | % | | $ | 23,950 | | 4.0 | % | | | NA | | | |
Bank | | $ | 56,279 | | 9.61 | % | | $ | 23,413 | | 4.0 | % | | $ | 35,120 | | 6.0 | % |
Tier 1 (Core) Capital to average assets | | | | | | | | | | | | | | | | | | |
Consolidated | | $ | 70,070 | | 9.22 | % | | $ | 30,386 | | 4.0 | % | | | NA | | | |
Bank | | $ | 56,279 | | 7.47 | % | | $ | 30,119 | | 4.0 | % | | $ | 37,649 | | 5.0 | % |
| | |
| | CNB Financial Corporation & Subsidiaries | 2006 Annual Report | 24 |
NOTES TO CONSOLIDATED FINANCIAL STATEMENTS
| | | | | | | | | | | | | | | | | | |
| | | Actual | | | For Capital
Adequacy Purposes | | | To be Well
Capitalized Under
Prompt Corrective
Action Provisions | |
| | | Amount | | Ratio | | | Amount | | Ratio | | | Amount | | Ratio | |
2005 | | | | | | | | | | | | | | | | | | |
Total Capital to risk weighted assets | | | | | | | | | | | | | | | | | | |
Consolidated | | $ | 73,606 | | 12.76 | % | | $ | 46,156 | | 8.0 | % | | | N/A | | | |
Bank | | $ | 57,952 | | 10.31 | % | | $ | 44,962 | | 8.0 | % | | $ | 56,203 | | 10.0 | % |
Tier 1 (Core) Capital to risk weighted assets | | | | | | | | | | | | | | | | | | |
Consolidated | | $ | 67,629 | | 11.72 | % | | $ | 23,078 | | 4.0 | % | | | N/A | | | |
Bank | | $ | 52,168 | | 9.28 | % | | $ | 22,481 | | 4.0 | % | | $ | 33,722 | | 6.0 | % |
Tier 1 (Core) Capital to average assets | | | | | | | | | | | | | | | | | | |
Consolidated | | $ | 67,629 | | 9.18 | % | | $ | 29,455 | | 4.0 | % | | | N/A | | | |
Bank | | $ | 52,168 | | 7.19 | % | | $ | 29,005 | | 4.0 | % | | $ | 36,257 | | 5.0 | % |
Certain restrictions exist regarding the ability of the Bank to transfer funds to the Corporation in the form of cash dividends, loans or advances. At December 31, 2006, approximately $30.9 million of accumulated net earnings of the Bank, included in the consolidated stockholders’ equity, was available for distribution to the Corporation as dividends without prior regulatory approval, subject to regulatory capital requirements above.
18. OFF-BALANCE SHEET ACTIVITIES
Some financial instruments, such as loan commitments, credit lines, letters of credit, and overdraft protection, are issued to meet customer financing needs. These are agreements to provide credit or to support the credit of others, as long as conditions established in the contract are met, and usually have expiration dates. Commitments may expire without being used. Off-balance-sheet risk to credit loss exists up to the face amount of these instruments, although material losses are not anticipated. The same credit policies are used to make such commitments as are used for loans, including obtaining collateral at exercise of the commitment.
The contractual amount of financial instruments with off-balance-sheet risk was as follows at year end:
| | | | | | | | | | | | |
| | | 2006 | | 2005 |
| | | Fixed
Rate | | Variable
Rate | | Fixed
Rate | | Variable
Rate |
Commitments to make loans | | $ | 8,963 | | $ | 111,827 | | $ | 8,522 | | $ | 99,185 |
Unused lines of credit | | | — | | | 35,295 | | | — | | | 33,056 |
Standby letters of credit | | | — | | | 16,517 | | | — | | | 13,971 |
Commitments to make loans are generally made for periods of 60 days or less. The fixed rate loan commitments at December 31, 2006 have interest rates ranging from 4.20% to 16.00% and maturities ranging from 3 months to 20 years.
19. FAIR VALUEOF FINANCIAL INSTRUMENTS
Carrying amount is the estimated fair value for cash and cash equivalents, Federal Home Loan Bank stock, accrued interest receivable and payable, demand deposits, other borrowings, and variable rate loans, deposits or borrowings that reprice frequently and fully. Security fair values are based on market prices or dealer quotes and, if no such information is available, on the rate and term of the security and information about the issuer. For fixed rate loans or deposits and for variable rate loans or deposits with infrequent repricing or repricing limits, fair value is based on discounted cash flows using current market rates applied to the estimated life and credit risk. Fair values for impaired loans are estimated using discounted cash flow analysis or underlying collateral values. Fair value of loans held for sale is based on market quotes. Fair value of debt is based on current rates for similar financing. The fair value of off-balance-sheet items is based on the current fees or cost that would be charged to enter into or terminate such arrangements. The fair value of off balance sheet items is not material.
| | |
25 | CNB Financial Corporation & Subsidiaries | 2006 Annual Report | | |
NOTES TO CONSOLIDATED FINANCIAL STATEMENTS
While these estimates of fair value are based on management’s judgment of the most appropriate factors as of the balance sheet date, there is no assurance that the estimated fair values would have been realized if the assets had been disposed of or the liabilities settled at that date, since market values may differ depending on various circumstances. The estimated fair values would also not apply to subsequent dates.
In addition, other assets and liabilities that are not financial instruments, such as premises and equipment, are not included in the disclosures. Also, non-financial instruments typically not recognized on the balance sheet may have value but are not included in the above disclosures. These include, among other items, the estimated earnings power of core deposits, the earnings potential of trust accounts, the trained workforce, customer goodwill and similar items.
| | | | | | | | | | | | | | | | |
| | | December 31, 2006 | | | December 31, 2005 | |
| | | Carrying Amount | | | Fair Value | | | Carrying
Amount | | | Fair Value | |
ASSETS | | | | | | | | | | | | | | | | |
Cash and cash equivalents | | $ | 25,551 | | | $ | 25,551 | | | $ | 43,017 | | | $ | 43,017 | |
Securities available for sale | | | 156,696 | | | | 156,696 | | | | 161,897 | | | | 161,897 | |
Loans held for sale | | | 2,420 | | | | 2,577 | | | | 2,733 | | | | 2,493 | |
Net loans | | | 540,934 | | | | 573,288 | | | | 505,010 | | | | 493,167 | |
FHLB, FRB and other equity interests | | | 5,321 | | | | 5,321 | | | | 4,789 | | | | 4,789 | |
Accrued interest receivable | | | 4,281 | | | | 4,281 | | | | 3,871 | | | | 3,871 | |
| | | | |
LIABILITIES | | | | | | | | | | | | | | | | |
Deposits | | $ | (631,322 | ) | | $ | (649,399 | ) | | $ | (618,503 | ) | | $ | (596,558 | ) |
Borrowings | | | (70,195 | ) | | | (82,146 | ) | | | (70,560 | ) | | | (72,290 | ) |
Accrued interest payable | | | (2,295 | ) | | | (2,295 | ) | | | (2,023 | ) | | | (2,023 | ) |
20. PARENT COMPANY ONLY FINANCIAL INFORMATION
CONDENSED BALANCE SHEETS
| | | | | | |
| | | December 31, |
| | | 2006 | | 2005 |
ASSETS | | | | | | |
Cash | | $ | 57 | | $ | 942 |
Investment in bank subsidiary | | | 60,660 | | | 56,571 |
Investment in non-bank subsidiaries | | | 21,933 | | | 21,629 |
Other assets | | | 1,321 | | | 1,251 |
| | | | | | |
TOTAL ASSETS | | $ | 83,971 | | $ | 80,393 |
| | | | | | |
LIABILITIES | | | | | | |
Deferred tax liability | | $ | 29 | | $ | 26 |
Subordinated debentures | | | 10,310 | | | 10,310 |
Other liabilities | | | 1,353 | | | 89 |
| | | | | | |
TOTAL LIABILITIES | | | 11,692 | | | 10,425 |
TOTAL SHAREHOLDERS’ EQUITY | | | 72,279 | | | 69,968 |
| | | | | | |
TOTAL LIABILITIES AND SHAREHOLDERS’ EQUITY | | $ | 83,971 | | $ | 80,393 |
| | | | | | |
CONDENSED STATEMENTS OF INCOME
| | | | | | | | | | | | |
| | | Year ended December 31, | |
| | | 2006 | | | 2005 | | | 2004 | |
INCOME | | | | | | | | | | | | |
Dividends from: | | | | | | | | | | | | |
Bank subsidiary | | $ | 5,495 | | | $ | 15,849 | | | $ | 4,982 | |
Non bank subsidiaries | | | 811 | | | | 3,125 | | | | — | |
Other | | | 82 | | | | 118 | | | | 120 | |
| | | | | | | | | | | | |
TOTAL INCOME | | | 6,388 | | | | 19,092 | | | | 5,102 | |
EXPENSES | | | (1,141 | ) | | | (1,014 | ) | | | (824 | ) |
| | | | | | | | | | | | |
INCOME BEFORE INCOME TAXES AND EQUITY IN UNDISTRIBUTED NET | | | | | | | | | | | | |
INCOME OF SUBSIDIARIES | | | 5,247 | | | | 18,078 | | | | 4,278 | |
Income tax benefit | | | 360 | | | | 305 | | | | 246 | |
Equity in undistributed net income of bank subsidiary | | | 3,803 | | | | (7,063 | ) | | | 2,702 | |
Equity in undistributed net income of non-bank subsidiaries | | | 212 | | | | (2,182 | ) | | | 645 | |
| | | | | | | | | | | | |
NET INCOME | | $ | 9,622 | | | $ | 9,138 | | | $ | 7,871 | |
| | | | | | | | | | | | |
| | |
| | CNB Financial Corporation & Subsidiaries | 2006 Annual Report | 26 |
NOTES TO CONSOLIDATED FINANCIAL STATEMENTS
CONDENSED STATEMENTS OF CASH FLOWS
| | | | | | | | | | | | |
| | | Year ended December 31, | |
| | | 2006 | | | 2005 | | | 2004 | |
Cash flows from operating activities: | | | | | | | | | | | | |
Net income | | $ | 9,622 | | | $ | 9,138 | | | $ | 7,871 | |
Adjustments to reconcile net income to net cash provided by operating activities: | | | | | | | | | | | | |
Equity in undistributed net income of bank subsidiary | | | (3,803 | ) | | | 7,063 | | | | (2,702 | ) |
Equity in undistributed net income of non-bank subsidiaries | | | (212 | ) | | | 2,182 | | | | (645 | ) |
Decrease (Increase) in other assets | | | (69 | ) | | | 30 | | | | 74 | |
Increase (Decrease) in other liabilities | | | 125 | | | | 1 | | | | (33 | ) |
| | | | | | | | | | | | |
Net cash provided by operating activities | | | 5,663 | | | | 18,414 | | | | 4,565 | |
| | | | | | | | | | | | |
Cash flows from investing activities: | | | | | | | | | | | | |
Capital transfer to subsidiaries | | | (200 | ) | | | (10,406 | ) | | | — | |
| | | | | | | | | | | | |
Net cash used in investing activities | | | (200 | ) | | | (10,406 | ) | | | — | |
Cash flows from financing activities: | | | | | | | | | | | | |
Dividends paid | | | (5,104 | ) | | | (5,046 | ) | | | (4,771 | ) |
Purchase of treasury stock | | | (3,367 | ) | | | (2,222 | ) | | | (1,261 | ) |
Proceeds from sale of treasury stock | | | 923 | | | | 904 | | | | 894 | |
Net advance (to) from subsidiary | | | 1,200 | | | | (800 | ) | | | 700 | |
Other financing activities | | | — | | | | — | | | | (50 | ) |
| | | | | | | | | | | | |
Net cash used in financing activities | | | (6,348 | ) | | | (7,164 | ) | | | (4,488 | ) |
| | | | | | | | | | | | |
Net increase (decrease) in cash | | | (885 | ) | | | 844 | | | | 77 | |
Cash beginning of year | | | 942 | | | | 98 | | | | 21 | |
| | | | | | | | | | | | |
Cash end of year | | $ | 57 | | | $ | 942 | | | $ | 98 | |
| | | | | | | | | | | | |
21. OTHER COMPREHENSIVE INCOME (LOSS)
Other comprehensive income (loss) components and related taxes were as follows:
| | | | | | | | | | | |
| | | 2006 | | 2005 | | | 2004 | |
Unrealized holding gains (losses) on available for sale securities | | $ | 515 | | $ | (2,254 | ) | | $ | (1,735 | ) |
Less reclassification adjustment due to recognition of other-than-temporary impairment of securities | | | — | | | (240 | ) | | | (1,400 | ) |
Less reclassification adjustment for gains and losses recognized in income | | | 338 | | | 322 | | | | 313 | |
| | | | | | | | | | | |
Net unrealized gains (losses) | | | 177 | | | (2,336 | ) | | | (648 | ) |
Tax effect | | | 65 | | | (820 | ) | | | (178 | ) |
| | | | | | | | | | | |
Other comprehensive income (loss) | | $ | 112 | | $ | (1,516 | ) | | $ | (470 | ) |
| | | | | | | | | | | |
22. QUARTERLY FINANCIAL DATA (UNAUDITED)
The unaudited quarterly results of operations for the years ended December 2006 and 2005 are as follows (in thousands, except per share data):
| | | | | | | | | | | | | | | | | | | | | | | | |
| | | Quarters Ended |
| | | 2006 | | 2005 |
| | | March 31 | | June 30 | | Sept. 30 | | Dec. 31 | | March 31 | | June 30 | | Sept. 30 | | Dec. 31 |
Total interest and dividend income | | $ | 11,508 | | $ | 12,295 | | $ | 12,424 | | $ | 12,922 | | $ | 9,796 | | $ | 10,317 | | $ | 10,676 | | $ | 11,095 |
Net interest income | | | 6,822 | | | 7,176 | | | 7,006 | | | 7,292 | | | 6,266 | | | 6,515 | | | 6,525 | | | 6,623 |
Provision for loan losses | | | 365 | | | 390 | | | 324 | | | 292 | | | 167 | | | 172 | | | 207 | | | 237 |
Non-interest income | | | 2,163 | | | 1,933 | | | 2,020 | | | 2,042 | | | 1,526 | | | 1,682 | | | 1,861 | | | 2,076 |
Non-interest expense | | | 5,442 | | | 5,515 | | | 5,515 | | | 5,639 | | | 5,060 | | | 4,865 | | | 5,113 | | | 5,126 |
Net income | | | 2,431 | | | 2,335 | | | 2,343 | | | 2,513 | | | 2,047 | | | 2,344 | | | 2,285 | | | 2,462 |
Net income per share, basic | | | 0.27 | | | 0.27 | | | 0.26 | | | 0.28 | | | 0.22 | | | 0.26 | | | 0.25 | | | 0.28 |
Net income per share, diluted | | | 0.27 | | | 0.26 | | | 0.26 | | | 0.28 | | | 0.22 | | | 0.26 | | | 0.25 | | | 0.27 |
| | |
27 | CNB Financial Corporation & Subsidiaries | 2006 Annual Report | | |
MANAGEMENT’S REPORT ON INTERNAL CONTROL OVER
\FINANCIAL REPORTING
The management of the Corporation is responsible for establishing and maintaining adequate internal control over financial reporting as defined in Rules 13a-15(f) and 15d-15(f) under the Securities and Exchange Act of 1934. The Corporation’s internal control over financial reporting is designed to provide reasonable assurance regarding the reliability of financial reporting and the preparation of financial statements for external purposes in accordance with generally accepted accounting principles.
The Corporation’s internal control over financial reporting includes those policies and procedures that: (i) pertain to the maintenance of records that, in reasonable detail, accurately and fairly reflect the transactions and dispositions of the assets of the Corporation; (ii) provide reasonable assurance that transactions are recorded as necessary to permit preparation of financial statements in accordance with generally accepted accounting principles, and that receipts and expenditures of the Corporation are being made only in accordance with authorizations of management and directors of the Corporation; and (iii) provide reasonable assurance regarding prevention or timely detection of unauthorized acquisition, use or disposition of the Corporation’s assets that could have a material effect on the financial statements.
Because of its inherent limitations, internal control over financial reporting may not prevent or detect misstatements. Also, projections of any evaluation of effectiveness to future periods are subject to the risk that controls may become inadequate because of changes in conditions, or that the degree of compliance with the policies or procedures may deteriorate.
Management assessed the effectiveness of the Corporation’s internal control over financial reporting as of December 31, 2006. In making this assessment, management used the criteria set forth by the Committee of Sponsoring Organizations of the Treadway Commission (COSO) in Internal Control-Integrated Framework. Based on our assessment and those criteria, management concluded that the Corporation maintained effective internal control over financial reporting as of December 31, 2006.
The Corporation’s independent registered public accounting firm has issued their report on management’s assessment of the Corporation’s internal control over financial reporting. That report follows under the heading, Report of Independent Registered Public Accounting Firm on Internal Control Over Financial Reporting.
| | | | |
| | |
 | | | |  |
William F. Falger | | | | Charles R. Guarino |
President and Chief Executive Officer | | | | Treasurer and Principal Financial Officer |
| | |
Date: February 28, 2007 | | | | Date: February 28, 2007 |
| | |
| | CNB Financial Corporation & Subsidiaries | 2006 Annual Report | 28 |

REPORT OF INDEPENDENT REGISTERED PUBLIC ACCOUNTING FIRM
ON INTERNAL CONTROL OVER FINANCIAL REPORTING
We have audited management’s assessment, included in the accompanying Management’s Report on Internal Control over Financial Reporting, that CNB Financial Corporation maintained effective internal control over financial reporting as of December 31, 2006, based on Internal Control - Integrated Framework issued by the Committee of Sponsoring Organizations of the Treadway Commission. CNB Financial Corporation’s management is responsible for maintaining effective internal control over financial reporting and for its assessment of the effectiveness of internal control over financial reporting. Our responsibility is to express an opinion on management’s assessment and an opinion on the effectiveness of the Corporation’s internal control over financial reporting based on our audit.
We conducted our audit in accordance with the standards of the Public Company Accounting Oversight Board (United States). Those standards require that we plan and perform the audit to obtain reasonable assurance about whether effective internal control over financial reporting was maintained in all material respects. Our audit included obtaining an understanding of internal control over financial reporting, evaluating management’s assessment, testing and evaluating the design and operating effectiveness of internal control, and performing such other procedures as we considered necessary in the circumstances. We believe that our audit provides a reasonable basis for our opinion.
A company’s internal control over financial reporting is a process designed to provide reasonable assurance regarding the reliability of financial reporting and the preparation of financial statements for external purposes in accordance with generally accepted accounting principles. A company’s internal control over financial reporting includes those policies and procedures that (1) pertain to the maintenance of records that, in reasonable detail, accurately and fairly reflect the transactions and dispositions of the assets of the company; (2) provide reasonable assurance that transactions are recorded as necessary to permit preparation of financial statements in accordance with generally accepted accounting principles, and that receipts and expenditures of the company are being made only in accordance with authorizations of management and directors of the company; and (3) provide reasonable assurance regarding prevention or timely detection of unauthorized acquisition, use, or disposition of the company’s assets that could have a material effect on the financial statements.
Because of its inherent limitations, internal control over financial reporting may not prevent or detect misstatements. Also, projections of any evaluation of effectiveness to future periods are subject to the risk that controls may become inadequate because of changes in conditions, or that the degree of compliance with the policies or procedures may deteriorate.
In our opinion, management’s assessment that CNB Financial Corporation maintained effective internal control over financial reporting as of December 31, 2006, is fairly stated, in all material respects, based on Internal Control - Integrated Framework issued by the Committee of Sponsoring Organizations of the Treadway Commission. Also in our opinion, CNB Financial Corporation maintained, in all material respects, effective internal control over financial reporting as of December 31, 2006, based on Internal Control - Integrated Framework issued by the Committee of Sponsoring Organizations of the Treadway Commission.
We have also audited, in accordance with the standards of the Public Company Accounting Oversight Board (United States), the consolidated statements of financial condition of CNB Financial Corporation as of December 31, 2006 and 2005, and the related consolidated statements of income, cash flows and changes in shareholders’ equity for each of the three years in the period ended December 31, 2006 and our report dated February 28, 2007 expressed an unqualified opinion on those consolidated financial statements.
|
|
 |
Crowe Chizek and Company LLC |
Cleveland, Ohio
February 28, 2007
| | |
29 | CNB Financial Corporation & Subsidiaries | 2006 Annual Report | | |
REPORT OF INDEPENDENT REGISTERED PUBLIC ACCOUNTING FIRM

Board of Directors and Shareholders
CNB Financial Corporation
Clearfield, Pennsylvania
We have audited the accompanying consolidated statements of financial condition of CNB Financial Corporation as of December 31, 2006 and 2005, and the related consolidated statements of income, cash flows and changes in shareholders’ equity for each of the three years in the period ended December 31, 2006. These financial statements are the responsibility of the Corporation’s management. Our responsibility is to express an opinion on these financial statements based on our audits.
We conducted our audits in accordance with the standards of the Public Company Accounting Oversight Board (United States). Those standards require that we plan and perform the audit to obtain reasonable assurance about whether the financial statements are free of material misstatement. An audit includes examining, on a test basis, evidence supporting the amounts and disclosures in the financial statements. An audit also includes assessing the accounting principles used and significant estimates made by management, as well as evaluating the overall financial statement presentation. We believe that our audits provide a reasonable basis for our opinion.
In our opinion, the consolidated financial statements referred to above present fairly, in all material respects, the financial position of CNB Financial Corporation as of December 31, 2006 and 2005, and the results of its operations and its cash flows for each of the three years in the period ended December 31, 2006, in conformity with U.S. generally accepted accounting principles.
We have also audited, in accordance with the standards of the Public Company Accounting Oversight Board (United States), the effectiveness of the CNB Financial Corporation’s internal control over financial reporting as of December 31, 2006, based on the criteria established in Internal Control – Integrated Framework issued by the Committee of Sponsoring Organizations of the Treadway Commission and our report dated February 28, 2007 expressed an unqualified opinion thereon.
|
|
 |
Crowe Chizek and Company LLC |
Cleveland, Ohio
February 28, 2007
| | |
| | 30 | CNB Financial Corporation & Subsidiaries | 2006 Annual Report |
STATISTICAL INFORMATION
Quarterly Share Data
The following table sets forth, for the periods indicated, the quarterly high and low bid price of the Corporation’s common stock as reported through the National Quotation Bureau and actual cash dividends paid per share. The stock is traded on the NASDAQ Stock Market under the symbol, CCNE. As of December 31, 2006, the approximate number of shareholders of record of the Corporation’s common stock was 2,600.
Price Range of Common Stock
| | | | | | | | | | | | |
| | | 2006 | | 2005 |
| | | High | | | Low | | | High | | | Low |
First Quarter | | $ | 14.49 | | $ | 13.25 | | $ | 15.98 | | $ | 14.77 |
Second Quarter | | | 14.20 | | | 13.40 | | | 16.08 | | | 14.80 |
Third Quarter | | | 14.36 | | | 13.65 | | | 15.69 | | | 14.18 |
Fourth Quarter | | | 14.25 | | | 13.73 | | | 15.15 | | | 13.30 |
Cash Dividends Paid
| | | | | | |
| | | 2006 | | 2005 |
First Quarter | | $ | 0.14 | | $ | 0.13 |
Second Quarter | | | 0.14 | | | 0.14 |
Third Quarter | | | 0.14 | | | 0.14 |
Fourth Quarter | | | 0.15 | | | 0.14 |
| | | | | | |
| | $ | 0.57 | | $ | 0.55 |
| | | | | | |
| | |
31 | CNB Financial Corporation & Subsidiaries | 2006 Annual Report | | |
STATISTICAL INFORMATION
Total Return Performance
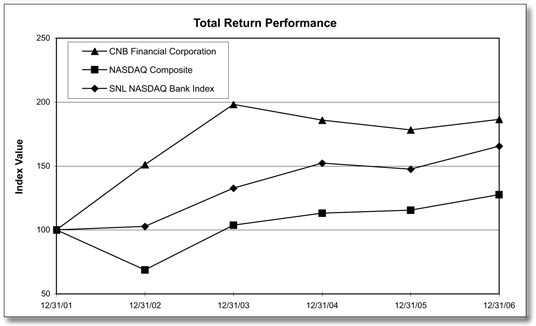
| | | | | | | | | | | | |
| | | Period Ending |
Index | | 12/31/01 | | 12/31/02 | | 12/31/03 | | 12/31/04 | | 12/31/05 | | 12/31/06 |
CNB Financial Corporation | | 100.00 | | 151.07 | | 198.10 | | 185.95 | | 178.19 | | 186.48 |
NASDAQ Composite | | 100.00 | | 68.76 | | 103.67 | | 113.16 | | 115.57 | | 127.58 |
SNL NASDAQ Bank Index | | 100.00 | | 102.85 | | 132.76 | | 152.16 | | 147.52 | | 165.62 |
| | |
Source : SNL Financial LC, Charlottesville, VA | | (434)977-1600 |
© 2007 | | www.snl.com |
| | |
| | CNB Financial Corporation & Subsidiaries | 2006 Annual Report | 32 |
SELECTED FINANCIAL DATA
| | | | |
| | | Year Ended December 31 | |
| (dollars in thousands, except per share data) | | 2006 | |
Interest Income | | | | |
Loans including fees | | $ | 40,475 | |
Deposits with banks | | | 437 | |
Federal funds sold | | | 293 | |
Investment securities: | | | | |
U.S. treasury securities | | | 430 | |
Securities of U.S. government agencies and corporations | | | 3,026 | |
Obligations of states and political subdivisions | | | 1,706 | |
Other securities | | | 2,782 | |
| | | | |
Total interest and dividend income | | | 49,149 | |
Interest expense | | | | |
Deposits | | | 17,106 | |
Other borrowings | | | 3,747 | |
| | | | |
Total interest expense | | | 20,853 | |
Net interest income | | | 28,296 | |
Provision for loan losses | | | 1,371 | |
| | | | |
Net interest income after provision for loan losses | | | 26,925 | |
Non-interest income | | | 8,158 | |
Non-interest expenses | | | 22,111 | |
| | | | |
Income before income taxes | | | 12,972 | |
Income tax expense | | | 3,350 | |
| | | | |
Net income | | $ | 9,622 | |
| | | | |
Per share data | | | | |
Basic | | $ | 1.08 | |
Fully diluted | | $ | 1.07 | |
Dividends declared | | $ | 0.57 | |
Book value per share at year end | | $ | 8.15 | |
At end of period | | | | |
Total assets | | $ | 780,850 | |
Securities | | | 156,696 | |
Loans, net of unearned discount | | | 547,020 | |
Allowance for loan losses | | | 6,086 | |
Deposits | | | 631,322 | |
Shareholders’ equity | | | 72,279 | |
Key ratios | | | | |
Return on average assets | | | 1.26 | % |
Return on average equity | | | 13.51 | % |
Loan to deposit ratio | | | 85.68 | % |
Dividend payout ratio | | | 53.05 | % |
Average equity to average assets ratio | | | 9.31 | % |
| | |
33 | CNB Financial Corporation & Subsidiaries | 2006 Annual Report | | |
FIVE YEAR COMPARISON
| | | | | | | | | | | | | | |
| 2005 | | | 2004 | | | 2003 | | | 2002 | |
| $ | 34,193 | | | $ | 31,005 | | | $ | 30,328 | | | $ | 30,294 | |
| | 316 | | | | 117 | | | | 44 | | | | 84 | |
| | 394 | | | | 120 | | | | 180 | | | | 267 | |
| | 297 | | | | 259 | | | | 311 | | | | 528 | |
| | 2,410 | | | | 1,998 | | | | 2,081 | | | | 3,140 | |
| | 1,837 | | | | 2,008 | | | | 2,178 | | | | 2,136 | |
| | 2,437 | | | | 1,966 | | | | 2,464 | | | | 3,287 | |
| | | | | | | | | | | | | | | |
| | 41,884 | | | | 37,473 | | | | 37,586 | | | | 39,736 | |
| | 12,633 | | | | 10,551 | | | | 10,882 | | | | 12,908 | |
| | 3,322 | | | | 2,577 | | | | 2,518 | | | | 2,293 | |
| | | | | | | | | | | | | | | |
| | 15,955 | | | | 13,128 | | | | 13,400 | | | | 15,201 | |
| | 25,929 | | | | 24,345 | | | | 24,186 | | | | 24,535 | |
| | 783 | | | | 800 | | | | 1,535 | | | | 1,800 | |
| | | | | | | | | | | | | | | |
| | 25,146 | | | | 23,545 | | | | 22,651 | | | | 22,735 | |
| | 7,145 | | | | 5,429 | | | | 7,136 | | | | 6,038 | |
| | 20,164 | | | | 19,139 | | | | 17,925 | | | | 17,307 | |
| | | | | | | | | | | | | | | |
| | 12,127 | | | | 9,835 | | | | 11,862 | | | | 11,466 | |
| | 2,989 | | | | 1,964 | | | | 2,805 | | | | 2,800 | |
| | | | | | | | | | | | | | | |
| $ | 9,138 | | | $ | 7,871 | | | $ | 9,057 | | | $ | 8,666 | |
| | | | | | | | | | | | | | | |
| $ | 1.01 | | | $ | 0.86 | | | $ | 0.99 | | | $ | 0.95 | |
| $ | 1.00 | | | $ | 0.86 | | | $ | 0.98 | | | $ | 0.95 | |
| $ | 0.55 | | | $ | 0.52 | | | $ | 0.47 | | | $ | 0.47 | |
| $ | 7.76 | | | $ | 7.54 | | | $ | 7.27 | | | $ | 6.80 | |
| $ | 764,018 | | | $ | 725,217 | | | $ | 701,752 | | | $ | 668,518 | |
| | 161,897 | | | | 164,202 | | | | 175,903 | | | | 185,025 | |
| | 510,613 | | | | 481,937 | | | | 458,249 | | | | 420,364 | |
| | 5,603 | | | | 5,585 | | | | 5,764 | | | | 5,036 | |
| | 618,503 | | | | 596,905 | | | | 575,438 | | | | 545,137 | |
| | 69,968 | | | | 68,710 | | | | 66,447 | | | | 62,033 | |
| | 1.23 | % | | | 1.11 | % | | | 1.31 | % | | | 1.35 | % |
| | 13.42 | % | | | 12.04 | % | | | 14.79 | % | | | 14.83 | % |
| | 81.65 | % | | | 79.80 | % | | | 78.63 | % | | | 76.19 | % |
| | 55.22 | % | | | 60.61 | % | | | 47.86 | % | | | 49.58 | % |
| | 9.18 | % | | | 9.20 | % | | | 8.87 | % | | | 9.07 | % |
| | |
| | CNB Financial Corporation & Subsidiaries | 2006 Annual Report| 34 |
MANAGEMENT’S DISCUSSION AND ANALYSIS OF
FINANCIAL CONDITION AND RESULTS OF OPERATIONS
GENERAL
The following discussion and analysis of the consolidated financial statements of CNB Financial Corporation (the “Corporation”) is presented to provide insight into management’s assessment of financial results. The Corporation’s subsidiary CNB Bank (the “Bank”) provides financial services to individuals and businesses within the Bank’s market area which is primarily made up of the west central Pennsylvania counties of Cambria, Clearfield, Centre, Elk, Jefferson and McKean. During 2005 the Bank entered the northwestern Pennsylvania county of Erie and began doing business as ERIEBANK. The Bank is subject to regulation, supervision and examination by the Pennsylvania State Department of Banking as well as the Federal Deposit Insurance Company. The financial condition and results of operations are not intended to be indicative of future performance. One of the Corporation’s subsidiaries, CNB Securities Corporation, is incorporated in Delaware and currently maintains investments in debt and equity securities. County Reinsurance Company, also a subsidiary, is a Corporation of Arizona, and provides credit life and disability for customers of CNB Bank. CNB Insurance Agency, incorporated in Pennsylvania, provides for the sale of nonproprietary annuities and other insurance products. Finally, Holiday Financial Services Corporation was formed in the fourth quarter of 2005 to facilitate the Corporation’s entry into the consumer discount loan and finance business. Management’s discussion and analysis should be read in conjunction with the audited consolidated financial statements and related notes.
Risk identification and management are essential elements for the successful management of the Corporation. In the normal course of business, the Corporation is subject to various types of risk, including interest rate, credit, and liquidity risk. These risks are controlled through policies and procedures established throughout the Corporation.
Interest rate risk is the sensitivity of net interest income and the market value of financial instruments to the direction and frequency of changes in interest rates. Interest rate risk results from various repricing frequencies and the maturity structure of the financial instruments owned by the Corporation. The Corporation uses its asset/liability management policy and systems to control, monitor and manage interest rate risk.
Credit risk represents the possibility that a customer may not perform in accordance to contractual terms. Credit risk results from loans with customers and the purchase of securities. The Corporation’s primary credit risk is in the loan portfolio. The Corporation manages credit risk by following an established credit policy and through a disciplined evaluation of the adequacy of the allowance for loan losses. Also, the investment policy limits the amount of credit risk that may be taken in the securities portfolio.
Liquidity risk represents the inability to generate or otherwise obtain funds at reasonable rates to satisfy commitments to borrowers and obligations to depositors. The Corporation has established guidelines within its asset liability management policy to manage liquidity risk. These guidelines include contingent funding alternatives.
FINANCIAL CONDITION
The following table presents ending balances ($’s in millions), growth (reduction) and the percentage change during the past two years:
| | | | | | | | | | | | | | | | | | | | | | | |
| | | 2006
Balance | | Increase
(Decrease) | | | %
Change | | | 2005
Balance | | Increase
(Decrease) | | | %
Change | | | 2004
Balance |
Total assets | | $ | 780.9 | | $ | 16.9 | | | 2.2 | | | $ | 764.0 | | $ | 38.8 | | | 5.4 | | | $ | 725.2 |
Total loans, net | | | 540.9 | | | 35.9 | | | 7.1 | | | | 505.0 | | | 28.6 | | | 6.0 | | | | 476.4 |
Total securities | | | 156.7 | | | (5.2 | ) | | (3.2 | ) | | | 161.9 | | | (2.3 | ) | | (1.4 | ) | | | 164.2 |
Total deposits | | | 631.3 | | | 12.8 | | | 2.1 | | | | 618.5 | | | 21.6 | | | 3.6 | | | | 596.9 |
Total shareholders’ equity | | | 72.3 | | | 2.3 | | | 3.3 | | | | 70.0 | | | 1.3 | | | 1.9 | | | | 68.7 |
The above table is referenced for the discussion in this section of the report.
OVERVIEW OF BALANCE SHEET
The increase in assets during 2006 was almost entirely the result of continued growth in the loan portfolio. This growth occurred in the commercial loan area and was primarily the result of increases in our commercial loan portfolio. The specific effects to each area are described in the following sections.
CASH AND CASH EQUIVALENTS
Cash and cash equivalents totaled $25.6 million at December 31, 2006 compared to $43.0 million on December 31, 2005. No liquidity issues were caused by this reduction in cash which was primarily used to fund planned loan growth during 2006. The year end balance is considered reasonable to support the expected funding needs in the short term.
| | |
35 | CNB Financial Corporation & Subsidiaries | 2006 Annual Report | | |
MANAGEMENT’S DISCUSSION AND ANALYSIS OF
FINANCIAL CONDITION AND RESULTS OF OPERATIONS
We believe the liquidity needs of the Corporation are satisfied by the current balance of cash and cash equivalents, readily available access to traditional funding sources, Federal Home Loan Bank financing, and the portion of the securities and loan portfolios that matures within one year. These sources of funds will enable the Corporation to meet cash obligations and off-balance sheet commitments as they come due.
SECURITIES
Securities decreased 3.2% since December 31, 2005. A large part of the decrease resulted from maturities of municipal and U.S. government agency securities. These proceeds were not reinvested in the securities portfolio as they were needed to fund the growth that occurred in the loan portfolio. As previously mentioned, securities are considered as part of the liquidity planning for funding needs and the Corporation used normal investment run-off during 2006 to fund loan growth. This strategy essentially shifted dollars from lower yielding investments into higher yielding loan products thus increasing the yield on earning assets while managing our investment portfolio to a level that we believe still maintains adequate levels of liquidity within the balance sheet.
The Corporation generally buys into the market over time and does not attempt to “time” its transactions. In doing this, the highs and lows of the market are averaged into the portfolio attempting to minimize the overall effect of different rate environments. The portfolio mix has remained relatively consistent and the Corporation’s overall investment strategy has not changed from the prior year.
We monitor the earnings performance and the effectiveness of the liquidity of the securities portfolio on a regular basis through Asset/Liability Committee (“ALCO”) meetings. The ALCO also reviews and manages interest rate risk for the Corporation. Through active balance sheet management and analysis of the securities portfolio, we maintain a sufficient level of liquidity to satisfy depositor requirements and various credit needs of our customers.
LOANS
The Corporation’s loan volume was strong throughout 2006. Our lending is focused in the west central Pennsylvania market and consists principally of commercial and retail lending, which includes single family residential mortgages and other consumer loans.
At December 31, 2006, the Corporation had $547.0 million in loans outstanding, net of unearned discount, an increase of $36.4 million (or 7.1%) since December 31, 2005. As detailed in the following table, the increase was primarily the result of demand for our commercial loan products including commercial mortgages. The Corporation sees commercial lending as its competitive advantage and continues to focus on this area by hiring and retaining experienced loan officers and supporting them with quality credit analysis. During the third quarter of 2005 the Corporation opened a loan production office (LPO) in Erie, Pennsylvania as part of the previously mentioned ERIEBANK project. During the third quarter of 2006, the Corporation opened its first full-service ERIEBANK branch. At December 31, 2006, the ERIEBANK venture had generated $25.4 million in loans outstanding.
Total loans, net of unearned, at December 31, 2006 and 2005 are summarized as follows ($ in thousands):
| | | | | | |
| | | 2006 | | 2005 |
Commercial, Financial and Agricultural | | $ | 214,804 | | $ | 194,044 |
Residential Mortgage | | | 160,159 | | | 153,130 |
Commercial Mortgage | | | 143,453 | | | 135,417 |
Installment | | | 28,488 | | | 27,436 |
Lease Receivables | | | 116 | | | 586 |
| | | | | | |
| | $ | 547,020 | | $ | 510,613 |
| | | | | | |
LOAN CONCENTRATION
The Corporation monitors loan concentrations by individual industries in order to track potential risk exposures resulting from industry related downturns. At December 31, 2006, no concentration exists within our commercial or real estate loan portfolio as related to a concentration of 10% of the total loans.
LOAN QUALITY
The Corporation has established written lending policies and procedures that require underwriting standards, loan documentation, and credit analysis standards to be met prior to funding a loan. Subsequent to the funding of a loan, ongoing review of credits is required. Credit reviews are performed annually on a minimum of 60% of the commercial loan portfolio by an outsourced loan review partner. In addition, classified assets, past due loans and nonaccrual loans are reviewed by the loan review partner semiannually and monthly by our credit administration staff. See “Allowance for Loan Losses” for further discussion of credit review procedures.
| | |
| | CNB Financial Corporation & Subsidiaries | 2006 Annual Report | 36 |
MANAGEMENT’S DISCUSSION AND ANALYSIS OF
FINANCIAL CONDITION AND RESULTS OF OPERATIONS
The following table sets forth information concerning loan delinquency and other non-performing assets ($ in thousands):
| | | | | | | | | | | | |
| | | 2006 | | | 2005 | | | 2004 | |
at December 31, | | | | | | | | | | | | |
Nonperforming assets: | | | | | | | | | | | | |
Non-accrual loans | | $ | 1,619 | | | $ | 1,561 | | | $ | 1,683 | |
Accrual loans greater than 89 days past due | | | 128 | | | | 462 | | | | 177 | |
| | | | | | | | | | | | |
Total nonperforming loans | | | 1,747 | | | | 2,023 | | | | 1,860 | |
Other real estate owned | | | 181 | | | | 85 | | | | 830 | |
| | | | | | | | | | | | |
Total nonperforming assets | | $ | 1,928 | | | $ | 2,108 | | | $ | 2,690 | |
| | | | | | | | | | | | |
Total loans, net of unearned income | | $ | 547,020 | | | $ | 510,613 | | | $ | 481,937 | |
Nonperforming loans as a percent of loans, net | | | 0.32 | % | | | 0.40 | % | | | 0.39 | % |
Total assets | | $ | 780,850 | | | $ | 764,018 | | | $ | 725,217 | |
Nonperforming assets as a percent of total assets | | | 0.25 | % | | | 0.28 | % | | | 0.37 | % |
Management continues to closely monitor nonperforming loans. As noted in the table above, this focus resulted in a favorable decrease in the ratio of nonperforming loans to total net loans which decreased from 0.40% in 2005 to 0.32% in 2006.
ALLOWANCE FOR LOAN LOSSES
The allowance for loan losses is established by provisions for losses in the loan portfolio as well as overdrafts in deposit accounts. These provisions are charged against current income. Loans, leases and overdrafts deemed not collectible are charged-off against the allowance while any subsequent collections are recorded as recoveries and increase the allowance.
The table below shows activity within the allowance account over the past three years:
Allowance for Loan Losses
($’s in thousands)
| | | | | | | | | | | | |
| | | Years Ended December 31, | |
| | 2006 | | | 2005 | | | 2004 | |
Balance at beginning of Period Charge-offs: | | $ | 5,603 | | | $ | 5,585 | | | $ | 5,764 | |
Commercial, financial, and agricultural | | | — | | | | 16 | | | | 51 | |
Commercial mortgages | | | 144 | | | | 135 | | | | 226 | |
Residential mortgages | | | 203 | | | | 152 | | | | 147 | |
Installment | | | 451 | | | | 372 | | | | 409 | |
Lease receivables | | | 21 | | | | — | | | | 30 | |
Overdraft deposit accounts | | | 272 | | | | 300 | | | | 236 | |
| | | | | | | | | | | | |
| | | 1,091 | | | | 975 | | | | 1,099 | |
Recoveries: | | | | | | | | | | | | |
Commercial, financial, and agricultural | | | 3 | | | | 1 | | | | 1 | |
Commercial mortgages | | | 3 | | | | 18 | | | | 13 | |
Residential mortgages | | | 4 | | | | — | | | | 20 | |
Installment | | | 89 | | | | 99 | | | | 56 | |
Lease receivables | | | 11 | | | | 1 | | | | 9 | |
Overdraft deposit accounts | | | 93 | | | | 91 | | | | 21 | |
| | | | | | | | | | | | |
| | | 203 | | | | 210 | | | | 120 | |
| | | | | | | | | | | | |
Net charge-offs: | | | (888 | ) | | | (765 | ) | | | (979 | ) |
Provision for loan losses | | | 1,371 | | | | 783 | | | | 800 | |
| | | | | | | | | | | | |
Balance at end-of-period | | $ | 6,086 | | | $ | 5,603 | | | $ | 5,585 | |
| | | | | | | | | | | | |
Loans, net of unearned | | $ | 547,020 | | | $ | 510,613 | | | $ | 481,937 | |
Allowance to net loans | | | 1.11 | % | | | 1.10 | % | | | 1.16 | % |
| | |
37 | CNB Financial Corporation & Subsidiaries | 2006 Annual Report | | |
MANAGEMENT’S DISCUSSION AND ANALYSIS OF
FINANCIAL CONDITION AND RESULTS OF OPERATIONS
The adequacy of the allowance for loan losses is subject to a formal analysis by the credit administrator of the Bank. As part of the formal analysis, delinquencies and losses are monitored monthly. The loan portfolio is divided into several categories in order to better analyze the entire pool. First is a selection of criticized loans that is given a specific reserve. The remaining loans are pooled, by category, into these segments:
Reviewed
• Commercial, financial, and agricultural
• Commercial mortgages
Homogeneous
• Residential real estate
• Installment
• Lease receivables
• Credit cards
• Overdrafts
The reviewed loan pools are further segregated into four categories: special mention, substandard, doubtful and unclassified. Historical loss factors are calculated for each pool excluding overdrafts based on the previous eight quarters of experience. The homogeneous pools are evaluated by analyzing the historical loss factors from the most previous quarter end and the two most recent year ends. The historical loss factors for both the reviewed and homogeneous pools are adjusted based on these six qualitative factors:
• Levels of and trends in delinquencies, non-accruals and classified loans
• Trends in volume and terms of loans
• Effects of any changes in lending policies and procedures
• Experience, ability and depth of management
• National and local economic trends and conditions
• Concentrations of credit
The methodology described above was created using the experience of our credit administrator, guidance from the regulatory agencies, expertise of our loan review partner, and discussions with our peers. The resulting factors are applied to the pool balances in order to estimate the inherent risk of loss within each pool. The results of these procedures are listed in the following chart:
Allocation of the Allowance for Loan Losses
| | | | | | |
| | | 2006 | | 2005 |
Balance at end of period | | | | | | |
Commercial and industrial | | $ | 2,553 | | $ | 2,365 |
Commercial mortgages | | | 2,066 | | | 1,827 |
Residential mortgages | | | 646 | | | 607 |
Installment | | | 549 | | | 426 |
Lease receivables | | | 2 | | | 16 |
Credit cards | | | 66 | | | 60 |
Overdraft deposit accounts | | | 199 | | | 261 |
Unallocated | | | 5 | | | 41 |
| | | | | | |
Total | | $ | 6,086 | | $ | 5,603 |
| | | | | | |
As noted in the Loan Quality section of this analysis, both the level of nonperforming loans and nonperforming assets has improved slightly since December 31, 2005. However, over the same time period, the coverage percentage of the allowance to net loans has remained relatively constant increasing by only one basis point from 1.10% at December 31, 2005 to 1.11% at December 31, 2006.
Prudent business practices dictate that the level of the allowance, as well as corresponding charges to the provision for loan losses, should be commensurate with identified areas of risk within the loan portfolio and the attendant risks inherent therein. The quality of the credit risk management function and the overall administration of this vital segment of the Corporation’s assets are critical to the ongoing success of the Corporation.
The previously mentioned analysis considered numerous historical and other factors to analyze the adequacy of the allowance and current period charges against the provision for loan losses. Management paid special attention to a section of the analysis that compared and plotted the actual level of the allowance against the aggregate amount of loans adversely
| | |
| | CNB Financial Corporation & Subsidiaries | 2006 Annual Report | 38 |
MANAGEMENT’S DISCUSSION AND ANALYSIS OF
FINANCIAL CONDITION AND RESULTS OF OPERATIONS
classified in order to compute the estimated potential losses associated with those loans. By noting the “spread” at the present time, as well as prior periods, management can determine the current adequacy of the allowance as well as evaluate trends that may be developing. The volume and composition of the Corporation’s loan portfolio continue to reflect growth in commercial credits including commercial real estate loans. As mentioned in the Loans section of this analysis, management considers commercial lending a competitive advantage and continues to focus on this area as part of its strategic growth initiatives. However, management must also consider the fact that the inherent risk is more pronounced in these types of credits and is also driven by the economic environment of its market areas.
During the year ended December 31, 2006 the Corporation increased its provision for loan losses and allowance as compared to the same period in 2005. This increase was deemed necessary based on the evaluation described above and included consideration of two new ventures as well as other factors which did not exist in 2005. First, the Corporation entered the Erie, Pennsylvania market and began doing business as ERIEBANK. The fact that this is a new market along with a heavy emphasis on commercial loans was considered and certain factors were adjusted that increased the provision and allowance in the current year based on the growth of our ERIEBANK loan portfolio. Secondly, the Corporation entered the consumer finance and discount loan industry during the fourth quarter of 2005 with the formation of Holiday Financial Services Corporation. During 2006, the Corporation began to grow a portfolio of consumer finance and discount loans with different risk characteristics than its consumer loan portfolio in its banking subsidiary. Although this loan portfolio is not currently significant in terms of the overall loan portfolio, it was nevertheless considered in our analysis resulting in increases in our provision during the year ended December 31, 2006. Lastly, our analysis considered the effects on our customers of the rising cost of doing business as a result of general increases in production costs and rising interest rates as compared to 2005.
Based on the methodology described above, management believes that the charges to the provision are reasonable for the periods presented and the allowance is adequate to absorb probable incurred losses in the loan portfolio at December 31, 2006.
BANK OWNED LIFE INSURANCE
During 2003 and prior years, the Corporation purchased $12.0 million of Bank Owned Life Insurance (BOLI). The policies cover executive officers and a select group of other employees with the Bank being named as beneficiary. Earnings from the BOLI assist the Corporation in offsetting its benefit costs.
FUNDING SOURCES
Although the Corporation considers short-term borrowings and long term debt when evaluating funding sources, traditional deposits continue to be the main focus for funding. As noted in the table below, traditional deposits increased only 2.1% during 2006. As detailed in the table below, this growth was primarily focused in checking accounts and certificates of deposit which increased 7.7% over 2005. The growth in certificates of deposit was entirely the result of a 36 month CD product which allows no penalty withdrawals and add-ons to principal during the term of the CD. The growth of this product was expected and planned for since it allows our customers flexibility in their investments at an attractive rate while providing the Corporation with a competitively priced funding source.
The Corporation utilizes term borrowings from the Federal Home Loan Bank (FHLB) and other non-affiliated institutions to meet funding needs not accommodated by deposit growth and other traditional funding sources. The terms of these borrowings are detailed at Note 11 to the consolidated financial statements. Management plans to maintain access to short and long-term borrowings as an available funding source when deemed appropriate.
On January 3, 2005, the Bank introduced a new internal sweep product which offers our commercial customers an attractive rate while providing the Corporation with funding which had previously been swept off the balance sheet. At December 31, 2006 this new product added approximately $38.5 million to the Corporation’s interest bearing deposit balances.
| | | | | | | | | | | | |
($ in thousands) | | % Change 2006 vs. 2005 | | | 2006 | | 2005 | | 2004 |
Checking, Non-Interest Bearing | | 2.1 | % | | $ | 82,574 | | $ | 80,874 | | $ | 71,968 |
Checking, Interest Bearing | | (0.8 | %) | | | 140,490 | | | 141,646 | | | 130,989 |
Savings Accounts | | (20.1 | %) | | | 52,352 | | | 65,483 | | | 73,886 |
Certificates of Deposit | | 7.7 | % | | | 355,906 | | | 330,500 | | | 320,062 |
| | | | | | | | | | | | |
| | 2.1 | % | | $ | 631,322 | | $ | 618,503 | | $ | 596,905 |
| | | | | | | | | | | | |
| | |
39 | CNB Financial Corporation & Subsidiaries | 2006 Annual Report | | |
MANAGEMENT’S DISCUSSION AND ANALYSIS OF
FINANCIAL CONDITION AND RESULTS OF OPERATIONS
SHAREHOLDERS’ EQUITY
The Corporation’s capital continues to provide a base for profitable growth. Total shareholders’ equity increased $2.3 million or 3.3% during 2006 as the Corporation earned $9.6 million and declared dividends of $5.1 million resulting in a dividend payout ratio of 53.0% of net income. This growth was offset by an increase in treasury stock as discussed below.
During 2006, the Corporation continued to repurchase shares of its own stock under a publicly announced plan. This strategy is the primary reason for the net increase in treasury stock of 159,950 shares or $2.2 million since December 31, 2005.
The Corporation has complied with the standards of capital adequacy mandated by the banking industry. Bank regulators have established “risk-based” capital requirements designed to measure capital adequacy. Risk-based capital ratios reflect the relative risks of various assets banks hold in their portfolios. A weight category of either 0% (lowest risk assets), 20%, 50%, or 100% (highest risk assets), is assigned to each asset on the balance sheet. The total risk-based capital ratio of 12.75% as of December 31, 2006 is well above the minimum standard of 8%. The Tier 1 capital ratio of 11.70% also is above the regulatory minimum of 4%. The leverage ratio, 9.22%, was also above the minimum standard of 4%. The Corporation is deemed to be well capitalized under regulatory industry standards as the noted ratios are above the regulatory requirements of 10%, 6% and 5%, respectively. The ratios provide quantitative data demonstrating the strength and future opportunities for use of the Corporation’s capital base. An evaluation of risk-based capital ratios and the capital position of the Corporation is a part of its strategic decision making process.
LIQUIDITY
Liquidity measures an organizations’ ability to meet cash obligations as they come due. The Consolidated Statements of Cash Flows presented on page 7 of the accompanying financial statements provide analysis of the Corporation’s cash and cash equivalents and the sources and uses of cash. Additionally, the portion of the loan portfolio that matures within one year and maturities within one year in the investment portfolio are considered part of the liquid assets. Liquidity is monitored by the ALCO which establishes and monitors ranges of acceptable liquidity. Also, the Bank is a member of FHLB. This relationship provides the Bank with a total borrowing line of approximately $182 million with only $47.9 million outstanding at year end 2006. Management feels the Corporation’s current liquidity position is acceptable.
YEAR ENDED DECEMBER 31, 2006
OVERVIEW OF THE INCOME STATEMENT
During 2006, management continued to apply various strategies to continue increasing earnings in an environment where the yield curve remained in a sustained inversion. These strategies paid off as the Corporation experienced record annual earnings as net income increased approximately 5.3% from $9.1 million in 2005 to $9.6 million in 2006. Although non-interest expenses increased approximately $1.9 million as a result of our continued growth, the Corporation was able to achieve the above-mentioned higher earnings through increased average earning assets and an improved net interest margin as well as higher levels of non-interest income.
INTEREST INCOME AND EXPENSE
Net interest income increased $2.4 million from $25.9 million in 2005 to $28.3 million in 2006, an increase of 9.1%. This increase is primarily the result of an increasing level of average earning assets combined with an improved net interest margin. In 2006 the Corporation’s average earning assets increased approximately $21 million from $687 million during 2005 to $708 million during 2006, while the net interest margin increased from 3.97% to 4.17% over the same time period.
PROVISION FOR LOAN LOSSES
The Corporation recorded a provision for loan losses of approximately $1.4 million in 2006 compared to $783 thousand during 2005. As discussed in more detail in the Allowance for Loan Losses section of this analysis, Management believes the increased provision in the current year is necessary to provide adequate coverage of its current loan balances based on its most recent analysis.
NON-INTEREST INCOME
Total non-interest income for 2005 was negatively effected by a non-cash charge for a writedown of an other-than-temporarily impaired security which before tax amounted to $240 thousand. However, excluding the effects of this prior year
| | |
| | CNB Financial Corporation & Subsidiaries | 2006 Annual Report | 40 |
MANAGEMENT’S DISCUSSION AND ANALYSIS OF
FINANCIAL CONDITION AND RESULTS OF OPERATIONS
non-cash charge, the Corporation grew its non-interest income in 2006 by $773 thousand, or 10.5%, as compared to 2005. The primary reason for the increase over the prior year were improved trust and asset management fees as well as service charges and fees. A positive enhancement to our “other” non-interest income line has been revenue from increased transactions on our VISA check card product which accounted for the majority of the increase in the “other” category as it increased by $298 thousand over the same period in 2005. During 2007, the Bank is introducing a new points reward program which it believes will increase VISA check card transaction volume in 2007 and beyond.
NON-INTEREST EXPENSE
Non-interest expense increased by 9.7% to $22.1 million in 2006 compared to $20.2 million in 2005. The majority (approximately 80%) of the increase was a result of the Corporation’s increasing costs for salaries and wages, occupancy costs and technology related expenditures. Like many growing entities, the Corporation is faced with increasing employee related costs in order to support its growth. Although the average cost per FTE (full-time equivalent) has remained relatively constant over the past year, the total FTE’s have increased by 27 from 229 at December 31, 2005 to 256 at December 31, 2006
As mentioned in the future outlook section of this analysis, the Corporation is beginning the process of expanding its banking franchise into the Erie, Pennsylvania market and has opened three new offices of its consumer finance subsidiary Holiday Financial Services Corporation. During 2007, we plan to begin building ERIEBANK branches and open additional offices of Holiday Financial Services Corporation. The Corporation realizes that expenses related to these new ventures may outpace related revenues in the near term but believes the long-term growth potential is more than worth the near term cost. As such, the Corporation will strive to manage expenses while recognizing some, such as increasing costs for salaries, occupancy, outside services and technology, are the result of continued growth.
YEAR ENDED DECEMBER 31, 2005
OVERVIEW OF THE INCOME STATEMENT
During 2005, management applied various strategies to increase earnings in an environment where yield spreads narrowed as the yield curve went from flat to inverted. These strategies paid off as the Corporation experienced record annual earnings as GAAP basis net income increased approximately 16.1% from $7.9 million in 2004 to $9.1 million in 2005. During the same time period operating earnings, as adjusted for after-tax non-cash charges for other-than-temporarily impaired securities of $910 thousand in 2004 and $156 thousand in 2005, increased approximately 5.8% from $8.8 million in 2004 to $9.3 million in 2005. Although non-interest expenses increased approximately $1 million as a result of our continued growth, the Corporation was able to achieve the above-mentioned higher earnings through increased average earning assets and an improved net interest margin as well as higher levels of non-interest income.
INTEREST INCOME AND EXPENSE
Net interest income increased $1.6 million from $24.3 million in 2004 to $25.9 million in 2005, an increase of 6.5%. This increase is primarily the result of an increasing level of average earning assets combined with an improved net interest margin. In 2005 the Corporation’s average earning assets increased approximately $36 million from $651 million during 2004 to $687 million during 2005, while the net interest margin increased from 3.74% to 3.82% over the same time period.
PROVISION FOR LOAN LOSSES
The Corporation recorded a provision for loan losses of $783 thousand in 2005 compared to $800 thousand during 2004. The Corporation has experienced a consistent and relatively low level of charge-offs over the past 3 years. In addition, based on managements detailed evaluation of problem loans, criticized assets, charge-offs and the overall effects of the economy in our markets, it appears that the credit quality of our existing assets has improved slightly and management believes the 2005 provision is reasonable and adequate. Although our provision in 2005 has resulted in a slight decrease in the allowance for loan and lease losses as a percent of total loans, management believes the allowance provides coverage of our current loan balances and is adequate to absorb probable incurred losses in our portfolio as of December 31, 2005.
NON-INTEREST INCOME
Total non-interest income in both 2005 and 2004 was negatively effected by non-cash charges for writedowns of other-than-temporarily impaired securities which before tax amounted to $240 thousand in 2005 and $1.4 million in 2004. However, excluding the effects of these non-cash charges, the Corporation grew its non-interest income in 2005 by $556 thousand, or 8.1%, as compared to 2004. The primary driver for this increase was improved wealth management fees which accounted for $325 thousand (or 58.5%) of the $556 thousand increase. During 2004, the Corporation hired a full-time
| | |
41 | CNB Financial Corporation & Subsidiaries | 2006 Annual Report | | |
MANAGEMENT’S DISCUSSION AND ANALYSIS OF
FINANCIAL CONDITION AND RESULTS OF OPERATIONS
wealth manager and in the second half of the year began to focus on growing this line of business. The results for 2005 reflect a full year of this improved focus on wealth management products and services and management plans to continue this focus throughout 2006. A second and less significant source of our improved non-interest income was higher earnings on bank owned life insurance which accounted for $115 thousand (or 20.7%) of the $556 thousand increase.
NON-INTEREST EXPENSE
Non-interest expense increased by 5.4% to $20.2 million in 2005 compared to $19.1 million for 2004. The majority (approximately 83%) of the increase was a result of the Corporation increasing costs for salaries as well as technology. Like many growing entities, the Corporation is faced with increasing employee related costs to attract and retain quality personnel to support its growth. Likewise, current investments in technology and technology-related costs are also considered to be critical to the future success of the Corporation. As such, the Corporation will strive to manage expenses while recognizing some such as increasing costs for salaries, occupancy, outside services and technology are simply the result of continued growth. As mentioned in the future outlook section of this analysis, the Corporation is beginning the process of expanding its banking franchise into the Erie, Pennsylvania market. The Corporation realizes that expenses related to this new venture may outpace related revenues in the near term but believes the long-term growth potential is more than worth the near term cost.
One of the tools the Corporation uses to monitor expenses is the efficiency ratio, calculated according to the following: non interest expense (less amortization of intangibles) as a percentage of fully tax equivalent net interest income and non interest income (less non recurring income). For the year ended December 31, 2005, the Corporation’s efficiency ratio was 57.17% compared to 57.47% for the same period of 2004.
FEDERAL INCOME TAX EXPENSE
Federal income taxes were $3.4 million in 2006 compared to $3.0 million in 2005. The effective tax rates were 25.8%, 24.6% and 20.0% for 2006, 2005 and 2004, respectively. The effective tax rate for the periods differed from the federal statutory rate of 35.0% principally as a result of tax exempt income from securities and loans as well as earnings from bank owned life insurance.
MARKET RISK MANAGEMENT
Market risk is the risk of loss arising from adverse changes in the fair value of financial instruments due to changes in interest rates, exchange rates, and equity prices. As a financial institution, the Corporation is primarily sensitive to the interest rate risk component. Changes in interest rates will affect the levels of income and expense recorded on a large portion of the Bank’s assets and liabilities. Additionally, such fluctuations in interest rates will impact the market value of all interest sensitive assets. The Asset/Liability Committee (ALCO) is responsible for reviewing the interest rate sensitivity position and establishing policies to control exposure to interest rate fluctuations. The primary goal established by this policy is to increase total income within acceptable risk limits.
The Corporation monitors interest rate risk through the use of two models: earnings simulation and static gap. Each model standing alone has limitations, however taken together they represent a reasonable view of the Corporation’s interest rate risk position.
STATIC GAP:Gap analysis is intended to provide an approximation of projected repricing of assets and liabilities at a point in time on the basis of stated maturities, prepayments, and scheduled interest rate adjustments within selected time intervals. A gap is defined as the difference between the principal amount of assets and liabilities which reprice within those time intervals. The cumulative one year gap at December 31, 2006 was (2.59)% of total earning assets compared to policy guidelines of plus or minus 15.0%. The ratio was 2.84% at December 31, 2005.
Fixed rate securities, loans and CDs are included in the gap repricing based on time remaining until maturity. Mortgage prepayments are included in the time frame in which they are expected to be received.
Certain shortcomings are inherent in the method of analysis presented in Static Gap. For example, although certain assets and liabilities may have similar maturities or periods to repricing, they may not react correspondingly to changes in market interest rates. Also, the interest rates on certain types of assets and liabilities may fluctuate with changes in market interest rates, while interest rates on other types of assets may lag behind changes in market rates. Additionally, certain assets, such as adjustable-rate loans, have features, like annual and lifetime rate caps, which restrict changes in interest rates both on a short-term basis and over the life of the asset. Further, in the event of a change in interest rates, prepayment and early withdrawal levels would likely deviate from those assumed in the table. Finally, the ability of certain borrowers to make scheduled payments on their adjustable-rate loans may decrease in the event of an interest rate increase.
| | |
| | CNB Financial Corporation & Subsidiaries | 2006 Annual Report | 42 |
MANAGEMENT’S DISCUSSION AND ANALYSIS OF
FINANCIAL CONDITION AND RESULTS OF OPERATIONS
EARNINGS SIMULATION:This model forecasts the projected change in net income resulting from an increase or decrease in the level of interest rates. The model assumes a one time shock of plus or minus 200 basis points or 2%.
The model makes various assumptions about cash flows and reinvestments of these cash flows in the different rate environments. Generally, repayments, maturities and calls are assumed to be reinvested in like instruments and no significant change in the balance sheet mix is assumed. Actual results could differ significantly from these estimates which would produce significant differences in the calculated projected change in income. The limits stated above do not necessarily represent measures that would be taken by management in order to stabilize income results. The instruments on the balance sheet do react at different speeds to various changes in interest rates as discussed under Static Gap. In addition, there are strategies available to management that minimize the decline in income caused by a rapid rise in interest rates.
The following table below summarizes the information from the interest rate risk measures reflecting rate sensitive assets to rate sensitive liabilities at December 31, 2006 and 2005:
| | | | | | |
| | | 2006 | | | 2005 | |
Static 1-Yr. Cumulative Gap | | (2.59 | )% | | 2.84 | % |
Earnings Simulation | | | | | | |
- 200 bps vs. Stable Rate | | 5.16 | % | | 4.65 | % |
+200 bps vs. Stable Rate | | (2.77 | )% | | (2.66 | )% |
The interest rate sensitivity position at December 31, 2006 was liability sensitive in the short-term. Management measures the potential impact of significant changes in interest rates on both earnings and equity. By the use of computer generated models, the potential impact of these changes has been determined to be acceptable with modest affects on net income and equity given an interest rate shock of an increase or decrease in rates of 2.0%. We continue to monitor the interest rate sensitivity through the ALCO and use the data to make strategic decisions.
FUTURE OUTLOOK
During 2005, the Bank established a loan production office in Erie, Pennsylvania in order to begin offering commercial loan service to businesses located within Erie and Erie County. During the third quarter of 2006, management opened its first full service branch in the Erie market at a temporary location and has begun the process of growing the ERIEBANK franchise. In 2007, we plan to build three full service branches in Erie. While our business plan is to focus on commercial business and their owners, we will now offer a full service approach to high net worth individuals through our private banking group. Management believes that our ERIEBANK division, along with our traditional CNB Bank market areas, should provide the Bank with favorable loan growth during 2007.
In the fourth quarter of 2005, the Corporation formed a new subsidiary and entered the consumer discount loan and finance business as Holiday Financial Services Corporation. In 2006 we opened three new offices in the communities of Hollidaysburg, Northern Cambria and Clearfield, Pennsylvania. Three additional offices are slated for 2007 which will bring our total to seven by the end of the third quarter. Although the consumer discount loan business is relatively new to the Corporation, management is making the necessary investments in experienced personnel and technology which we believe will facilitate the growth of Holiday Financial Services into a successful and profitable subsidiary of the Corporation in future years.
The interest rate environment will continue to play an important rule in the future earnings of the Corporation. Our net interest margin improved in 2006 compared to 2005 even with the sustained inverted yield curve which negatively affected the earnings of many financial institutions. In addition to our improved net interest margin, we continue to grow earnings assets which has increased our net interest income and improved profitability. Management will closely monitor our net interest margin in 2007, as well as continue to apply a disciplined approach to managing our balance sheet, as the majority of the earnings of the Corporation continue to be derived from interest income.
Non-interest income should be enhanced in several areas including improved service charge and fee income as we enter new markets and grow transaction accounts. A known area of increased non-interest expenses will be the personnel, occupancy and technology costs related to the previously mentioned growth plans for our ERIEBANK division and Holiday Financial Services Corporation. While non-interest costs are expected to increase with the growth of these new ventures, they should provide growth in earning assets as well as enhanced non-interest income to more than offset these costs in 2008 and beyond.
Management concentrates on return on average equity and earnings per share evaluations, plus other methods to measure and direct the performance of the Corporation. While past results are not an indication of future earnings, we feel the Corporation is positioned to enhance performance of normal operations through the remainder of 2007.
| | |
43 | CNB Financial Corporation & Subsidiaries | 2006 Annual Report | | |
MANAGEMENT’S DISCUSSION AND ANALYSIS OF
FINANCIAL CONDITION AND RESULTS OF OPERATIONS
CONTRACTUAL OBLIGATIONS AND COMMITMENTS
The Corporation has various financial obligations, including contractual obligations and commitments, that may require future cash payments.
Contractual Obligations: The following table presents, as of December 31, 2006, significant fixed and determinable contractual obligations to third parties by payment date. Further discussion of the nature of each obligation is included in the referenced note to the consolidated financial statements.
| | | | | | | | | | | | | | | | | |
| | | | | Payments Due In | | |
(In thousands) | | Note
Reference | | One Year
or Less | | One to
Three
Years | | Three to
Five
Years | | Over
Five
Years | | Total |
Deposits without a stated maturity | | | | $ | 275,416 | | $ | — | | $ | — | | $ | — | | $ | 275,416 |
Certificates of deposits | | 10 | | | 61,957 | | | 240,509 | | | 48,383 | | | 5,057 | | | 355,906 |
Treasury, tax and loan borrowings | | 11 | | | 2,000 | | | — | | | — | | | — | | | 2,000 |
FHLB and other borrowings | | 11 | | | 4,885 | | | 8,500 | | | 14,500 | | | 30,000 | | | 57,885 |
Operating fees | | 7 | | | 245 | | | 534 | | | 450 | | | 1,979 | | | 3,208 |
Subordinated debentures | | 11 | | | — | | | — | | | — | | | 10,310 | | | 10,310 |
The Corporation’s operating lease obligations represent short and long-term lease and rental payments for facilities.
The Corporation also has obligations under its postretirement plan as described in Note 13 to the consolidated financial statements. The postretirement benefit payments represent actuarially determined future benefit payments to eligible plan participants. The Corporation reserves the right to terminate the postretirement benefit plan at any time.
Commitments to extend credit, including loan commitments, standby letters of credit, and commercial letters of credit do not necessarily represent future cash requirements, in that these commitments often expire without being drawn upon. Further discussion of these commitments is included in Note 18 to the consolidated financial statements.
APPLICATIONS OF CRITICAL ACCOUNTING POLICIES
The Corporation’s consolidated financial statements are prepared in accordance with U.S. generally accepted accounting principles and follow general practices within the industries in which it operates. Application of these principles requires management to make estimates or judgments that affect the amounts reported in the financial statements and accompanying notes. These estimates are based on information available as of the date of the financial statements; accordingly, as this information changes, the financial statements could reflect different estimates or judgments. Certain policies inherently have a greater reliance on the use of estimates, and as such have a greater possibility of producing results that could be materially different than originally reported. Estimates or judgments are necessary when assets and liabilities are required to be recorded at fair value, when a decline in the value of an asset not carried on the financial statements at fair value warrants an impairment write-down or valuation reserve to be established, or when an asset or liability needs to be recorded contingent upon a future event. Carrying assets and liabilities at fair value inherently results in more financial statement volatility. The fair values and the information used to record valuation adjustments for certain assets and liabilities are based either on quoted market prices or are provided by other third party sources, when available. When third-party information is not available, valuation adjustments are estimated in good faith by management primarily through the use of internal cash flow modeling techniques.
The most significant accounting policies followed by the Corporation are presented in Note 1 to the consolidated financial statements. These policies, along with the disclosures presented in the other financial statement notes and in this financial review, provide information on how significant assets and liabilities are valued in the financial statements and how those values are determined. Management views critical accounting policies to be those which are highly dependent on subjective or complex judgments, estimates and assumptions, and where changes in those estimates and assumptions could have a significant impact on the financial statements. Management currently views the determination of the allowance for loan losses and fair value of securities to be critical accounting policies.
“SAFE HARBOR” STATEMENT UNDER THE PRIVATE SECURITIES LITIGATION REFORM ACT OF 1995
The statements above which are not historical fact are forward looking statements that involve risks and uncertainties, including, but not limited to, the interest rate environment, the effect of federal and state banking and tax regulations, the effect of economic conditions, the impact of competitive products and pricing, and other risks detailed in the Corporation’s Securities and Exchange Commission filings.
| | |
| | CNB Financial Corporation & Subsidiaries | 2006 Annual Report | 44 |
EXECUTIVE MANAGEMENT AND BOARD OF DIRECTORS
Corporate Officers, CNB Financial Corporation
William F. Falger
President & Chief Executive Officer
Joseph B. Bower, Jr.
Secretary
Charles R. Guarino
Treasurer & Principal Financial Officer
Executive Officers, CNB Bank
William F. Falger
President & Chief Executive Officer
Joseph B. Bower, Jr.
Executive Vice President & Chief
Operating Officer
Mark D. Breakey
Senior Vice President & Credit Risk
Manager
Richard L. Sloppy
Senior Vice President & Senior Loan
Officer
Donald E. Shawley
Senior Vice President & Senior Trust
Officer
Board of Directors
CNB Financial Corporation and CNB Bank
William R. Owens
Chairman of the Board
Retired, Formerly Vice President,
Secretary and Treasurer, CNB Financial
Corporation and President & Chief
Executive Officer, CNB Bank
Joseph B. Bower, Jr.
Secretary, CNB Financial Corporation;
Executive Vice President, and Chief
Operating Officer, CNB Bank
Robert E. Brown
Vice President, E. M. Brown, Inc. (Coal
Producer, Auto Dealer and Concrete
Supplier)
William F. Falger
President and Chief Executive Officer,
CNB Financial Corporation;
President and Chief Executive Officer,
CNB Bank
James J. Leitzinger
Retired, Formerly President, Leitzinger
Realty (Real Estate Investments)
Michael F. Lezzer
President, Lezzer Holdings, Inc.
(Lumber and Building Supplies
Retailer)
Dennis L. Merrey
Retired, Formerly President, Clearfield
Powdered Metals, Inc. (Manufacturer)
Robert W. Montler
President & Chief Executive Officer,
Lee Industries and Keystone Process
Equipment (Manufacturers)
Deborah Dick Pontzer
Economic Development and Workforce
Specialist, Office of Congressman
John E. Peterson
Jeffrey S. Powell
President, J.J. Powell, Inc. (Petroleum
Distributor)
Charles H. Reams
President, C.H. Reams & Associates,
Inc. (Insurance)
James B. Ryan
Retired, Formerly Vice President of
Sales, Marketing, Windfall Products,
Inc. (Manufacturer)
Peter F. Smith
Attorney at Law
DIRECTOR EMERITUS
L. E. Soult, Jr.
| | |
45 | CNB Financial Corporation & Subsidiaries | 2006 Annual Report | | |
OFFICERS
Administrative Services
Mary Ann Conaway
Vice President, Human Resources
Charles R. Guarino
Vice President, Chief Financial Officer
Helen G. Kolar
Vice President, Marketing & Sales
Edward H. Proud
Vice President, Information Systems
Thomas J. Ammerman, Jr.
Bank Security Officer
Donna J. Collins
Compliance Officer
Richard L. Greslick, Jr.
Controller
Thomas W. Grice
Network Administration Officer
Leanne D. Kassab
Marketing Officer
Susan B. Kurtz
Customer Service Officer
Dennis J. Sloppy
Information Systems Officer
Carolyn B. Smeal
Operations Officer
BJ Sterndale
Training Officer
Brenda L. Terry
Banking Officer
Susan M. Warrick
Operations Officer
Branch Division
Michael C. Sutika
Vice President, Retail Banking
Vickie L. Baker
Assistant Vice President, Regional Branch
Administration, Bradford Main Street
Office
Ruth Anne Ryan-Catalano
Assistant Vice President, Regional Branch
Administration, Downtown Office,
Clearfield
Mary A. Baker
Assistant Vice President, Northern
Cambria Office
Deborah M. Young
Assistant Vice President, Washington
Street Office, St. Marys
Denise J. Greene
Community Office Manager,
DuBois Office
Paul A. McDermott
Banking Officer, Community Banking,
Clearfield
Francine M. Papa
Community Office Manager,
Ridgway Office
Larry A. Putt
Banking Officer, Community Banking,
Clearfield
Mary Ann Roney
Banking Officer, Bradford
Douglas M. Shaffer
Community Office Manager, Punxsutawney
Office
Susan J. Shimmel
Community Office Manager,
Old Town Road Office, Clearfield
Gregory R. Williams
Banking Officer, Community Banking,
Clearfield
Lending Division
James M. Baker
Vice President, Commercial Banking,
DuBois
Robert S. Berezansky
Vice President, Corporate Lending
Michael E. Haines
Vice President, Commercial Banking,
St. Marys
Robin L. Hay
Vice President, Commercial Banking
Jeffrey A. Herr
Vice President, Commercial Banking,
Philipsburg
William J. Mills
Vice President, Commercial Banking,
St. Marys
Charles C. Shrader
Vice President, Commercial Banking,
Warren
Joseph H. Yaros
Vice President, Commercial Banking
Bradford
David W. Ogden
Vice President, Credit Administration
Duane P. Shifter
Vice President, Downtown Office,
Clearfield
Christopher L. Stott
Vice President, Mortgage Lending
Kristen L. Howard
Assistant Vice President, Commercial
Banking, Warren
Richard L. Bannon
Credit Administration Officer
Gregory M. Dixon
Credit Administration Officer
Steven C. Tunall
Community Banking Officer, Kane
Tammy C. Wagner
Staff Commercial Lender
| | |
| | CNB Financial Corporation & Subsidiaries | 2006 Annual Report| 46 |
OFFICERS
Trust & Asset Management Services
Calvin R. Thomas, Jr.
Vice President, Trust Officer
Jane M. Gnan
Assistant Trust Officer
Glenn R. Pentz
Trust Officer
Wealth Management Services
Craig C. Ball
Vice President, Wealth Management
Natalie R. Barnett
Financial Consultant,
Wealth Management
Holiday Financial Services Corporation
Dennis J. Weakland
Vice President
Robert R. Antesberger
Vice President
ERIEBANK, a Division of CNB Bank
David J. Zimmer
President
Donald W. Damon
Senior Vice President
William L. DeLuca, Jr.
Senior Vice President
Scott O. Calhoun
Vice President
James E. Zbach
Vice President, Wealth Management
Kelly S. Buck
Community Office Manager, Peach Street
Office
ERIEBANK Regional Board of Directors
Harry E. Brown
Vice President, Specialty Bar Products,
EBC Industries (Manufacturing)
Gary L. Clark
Vice President, Chief Financial Officer and
Chief Administrative Officer, Snap-tite, Inc.
(Manufacturing)
Thomas L. Doolin
President, New Age Business Solutions,
LLC (Consulting)
Thomas Kennedy
President, Professional Development
Associates, Inc. (Real estate developer)
Charles H. Reams
President, C. H. Reams & Associates, Inc.
(Insurance)
James E. Spoden
Esquire, MacDonald Illig Jones & Britton,
LLP (Law office)
| | |
47 | CNB Financial Corporation & Subsidiaries | 2006 Annual Report | | |
SHAREHOLDER INFORMATION
Annual Meeting
The Annual Meeting of the Shareholders of CNB Financial Corporation will be held Tuesday, April 17, 2007 at 2:00 p.m. at the Corporation’s Headquarters in Clearfield, PA.
Corporate Address
CNB Financial Corporation
1 S. Second Street
P.O. Box 42
Clearfield, PA 16830
(814) 765-9621
Stock Transfer Agent &
Registrar
CNB Bank
1 S. Second Street
P.O. Box 42
Clearfield, PA 16830
(814) 765-9621
Form 10-K
Shareholders may obtain a copy of the Annual Report to the Securities and Exchange Commission on Form 10-K by writing to:
CNB Financial Corporation
1 S. Second Street
P.O. Box 42
Clearfield, PA 16830
ATTN: Shareholder Relations
Quarterly Share Data
For information regarding the Corporation’s quarterly share data, please refer to page 31 in the 2006 Annual Report Financial Section.
Market Makers
The following firms have chosen to make a market in the stock of the Corporation. Inquiries concerning their services should be directed to:
Ferris Baker Watts, Inc.
6 Bird Cage Walk
Hollidaysburg, PA 16648
(800) 343-5149
Ryan, Beck & Co.
401 City Avenue Ste 902
Bala Cynwyd, PA 19004
(800) 223-8969
Boenning & Scattergood, Inc.
1700 Market Street, Ste 1420
Philadelphia, PA 19103
(800) 842-8928
Janny Montgomery Scott
484 Jeffers Street
DuBois, PA 15801
(800) 238-0067
Corporate Profile
CNB Bank, a subsidiary of CNB Financial Corporation, is a leader in providing integrated financial solutions, which creates value for both consumers and businesses. These solutions consist of a family of products and services developed to support the evolving needs of our customers from traditional to innovative. For 142 years, we have prided ourselves in building long-term customer relationships by being reliable and competitively priced.
Being a regional independent community bank in North Central Pennsylvania, we have approximately 240 employees who make our customer service more responsive and reliable. We strive to be more customer-driven than our competitors.
Hometown banking has always been our philosophy. Hometown people who are equipped to make quick decisions while, at the same time, make our customers feel ‘welcome’ is where it all begins. With another component of our hometown philosophy, community involvement, the Bank has played an integral role in all of our communities by contributing financial, in-kind and volunteer assistance to nonprofit organizations that enhance the quality of life and promote public interest.
In addition, CNB continues to rank technology as vital in executing our personal, quality service strategy by maintaining the latest data processing and information systems. We offer a variety of delivery channels, which includes 21 full-service offices, 19 ATMs, 1 loan production office, telephone banking (1-888-641-6554), Internet banking (www.bankcnb.com) and a centralized customer service center (1-800-492-3221).
ERIEBANK, headquartered in Erie, Pennsylvania, is a division of CNB Bank. Presently, there are two temporary locations which house our commercial, retail and Private Banking divisons with plans for expansion for three full service offices in 2007.
Another subsidiary of CNB Financial Corporation, Holiday Financial Services, a consumer loan company, was formed in November, 2005 and currently has four conveniently located offices in Hollidaysburg, Northern Cambria, Clearfield and Sidman, Pennsylvania. Our plans for expansion in 2007 include three additional offices in north central Pennsylvania.
The common stock of the Corporation trades over-the-counter on the NASDAQ under the symbol CCNE.

| | |
| | CNB Financial Corporation & Subsidiaries | 2006 Annual Report| 48 |
