Neuberger Berman
Advisers Management Trust
Short Duration Bond Portfolio
I Class Shares
Annual Report
December 31, 2021
As permitted by regulations adopted by the U.S. Securities and Exchange Commission, you may no longer receive paper copies of the Fund's annual and semi-annual shareholder reports by mail from the insurance company that issued your variable annuity and variable life insurance contract or from the financial intermediary that administers your qualified pension or retirement plan, unless you specifically request paper copies of the reports from your insurance company or financial intermediary. Instead, the reports will be made available on the Fund's website www.nb.com/AMTliterature, and may also be available on a website from the insurance company or financial intermediary that offers your contract or administers your retirement plan, and such insurance company or financial intermediary will notify you by mail each time a report is posted and provide you with a website link to access the report.
If you already elected to receive shareholder reports electronically, you will not be affected by this change and you need not take any action. You may elect to receive shareholder reports and other communications from the insurance company or financial intermediary electronically by following the instructions provided by the insurance company or financial intermediary. If offered by your insurance company or financial intermediary, you may elect to receive all future reports in paper and free of charge from the insurance company or financial intermediary. You can contact your insurance company or financial intermediary if you wish to continue receiving paper copies of your shareholder reports. Your election to receive reports in paper will apply to all funds available under your contract or retirement plan.
Short Duration Bond Portfolio Commentary (Unaudited)
The Neuberger Berman Advisers Management Trust Short Duration Bond Portfolio Class I posted a 0.74% total return for the fiscal year ended December 31, 2021 (the reporting period), outperforming its benchmark, the Bloomberg 1-3 Year U.S. Government/Credit Bond Index (the Index), which returned –0.47% for the same period.
The overall taxable investment-grade U.S. bond market, as measured by the Bloomberg U.S. Aggregate Bond Index, modestly declined during the reporting period. Both short and long-term U.S. Treasury yields moved sharply higher as the economic recovery from the depths of the pandemic continued and inflation moved higher. Against this backdrop, the U.S. Federal Reserve Board (Fed) pivoted from its highly accommodative monetary policy stance. In November 2021, the Fed announced that it would begin reducing its monthly purchase of Treasury and agency mortgage-backed securities. At the Fed's meeting in December, it further accelerated the reduction of its monthly bond purchases. The Fed's asset purchases are expected to end in mid-March 2022, setting the stage for interest rate hikes shortly thereafter. Fed officials now expect to raise rates three times in 2022. Generally speaking, the spread sectors (non-U.S. Treasury securities) produced mixed results relative to similar duration Treasuries during the reporting period.
The largest contributor to the Fund's performance was its overweight exposure to corporate bonds. Their spreads narrowed during the reporting period as the economy continued to recover, and investor demand for incremental yield was strong overall. Also supporting the sector was continued monetary and fiscal stimulus and corporate earnings that generally exceeded expectations. Elsewhere, an out-of-benchmark allocation to structured products, including commercial mortgage-backed securities, asset-backed securities (ABS) and mortgage credit, contributed to returns. Finally, an opportunistic allocation to U.S. Treasury Inflation-Protected Securities was rewarded.
The Fund's use of futures contracts contributed positively to performance during the reporting period.
During the reporting period, we maintained the Fund's overweight to non-Treasury securities and underweights to Treasuries, agency debt and non-corporate securities. We increased the Fund's allocation to agency pass-through securities in the spring of 2020 given their attractive valuations at that time. We later largely eliminated this position as they performed well and reached our estimate of fair value. The proceeds from these sales were primarily allocated to corporate bonds, as well as ABS.
We continue to anticipate higher volatility in the bond markets in 2022. Drivers of volatility will likely be macro and policy trends—specifically, the evolution of inflation and central bank policy. With elevated levels of core inflation in the U.S., Europe and numerous key emerging markets, we believe the debate is not about whether inflation will exceed central bank targets, but for how long. We believe it is the Fed's reaction function that will be most important as a driver of real yields, the dollar and risk markets in general. A second potential driver of volatility, related to persistent higher inflation, is the market's expectation for a global interest rate hiking cycle in 2022. In our view, the hiking cycle in 2022 will be more about ending "emergency" policy rather than attempting to significantly slow global growth. As such, we do not anticipate these policy changes to fundamentally alter the global growth environment. In conclusion, we believe investors should maintain defensive positioning to interest rates, particularly in the U.S. With fundamental credit risk limited, in our view, we still favor overweighting credit markets.
Sincerely,
MICHAEL FOSTER, MATTHEW MCGINNIS, WOOLF NORMAN MILNER AND DAVID M. BROWN
PORTFOLIO MANAGERS
Information about principal risks of investing in the Fund is set forth in the prospectus and statement of additional information.
The portfolio composition, industries and holdings of the Fund are subject to change without notice.
The opinions expressed are those of the Fund's portfolio managers. The opinions are as of the date of this report and are subject to change without notice.
1
Short Duration Bond Portfolio (Unaudited)
PORTFOLIO BY TYPE OF INVESTMENT
(as a % of Total Net Assets) | |
Asset-Backed Securities | | | 16.1 | % | |
Corporate Bonds | | | 48.2 | | |
Exchange-Traded Funds | | | 2.5 | | |
Mortgage-Backed Securities | | | 31.0 | | |
U.S. Treasury Obligations | | | 0.7 | | |
Short-Term Investments | | | 2.0 | | |
Liabilities Less Other Assets | | | (0.5 | )* | |
Total | | | 100.0 | % | |
* Includes the impact of the Fund's open positions in derivatives, if any.
PERFORMANCE HIGHLIGHTS
| | Inception | | Average Annual Total Return
Ended 12/31/2021 | |
| | Date | | 1 Year | | 5 Years | | 10 Years | | Life of Fund | |
Class I | | 09/10/1984 | | | 0.74 | % | | | 1.95 | % | | | 1.69 | % | | | 4.50 | % | |
Bloomberg 1-3 Year
U.S. Government/Credit
Bond Index*,1,2 | | | | | –0.47 | % | | | 1.85 | % | | | 1.39 | % | | | 5.00 | % | |
* Effective August 24, 2021, the Bloomberg Barclays 1-3 Year U.S. Government/Credit Bond Index changes its name to the Bloomberg 1-3 Year U.S. Government/Credit Bond Index.
The performance data quoted represent past performance and do not indicate future results. Current performance may be lower or higher than the performance data quoted. For current performance data, including current to the most recent month-end, please visit http://www.nb.com/amtportfolios/performance.
The results shown in the table reflect the reinvestment of income dividends and other distributions, if any. The results do not reflect the effect of taxes a shareholder would pay on Fund distributions or on the redemption of Fund shares. The results do not reflect fees and expenses of the variable annuity and variable life insurance policies or the qualified pension and retirement plans whose proceeds are invested in the Fund.
The investment return and principal value of an investment will fluctuate and shares, when redeemed, may be worth more or less than their original cost.
Returns would have been lower if Neuberger Berman Investment Advisers LLC ("NBIA") had not reimbursed certain expenses and/ or waived a portion of the investment management fees during certain of the periods shown. Repayment by a class (of expenses previously reimbursed and/or fees previously waived by NBIA) will decrease the class's returns. Please see Note B in the Notes to Financial Statements for specific information regarding expense reimbursement and/or fee waiver arrangements.
For the period ended December 31, 2021, the 30-day SEC yield was 2.61% for Class I shares.
As stated in the Fund's most recent prospectus, the total annual operating expense ratio for fiscal year 2020 was 0.86% for Class I shares (before expense reimbursements and/or fee waivers, if any, and after restatement). The expense ratios for the annual period ended December 31, 2021 can be found in the Financial Highlights section of this report.
2
Short Duration Bond Portfolio (Unaudited)
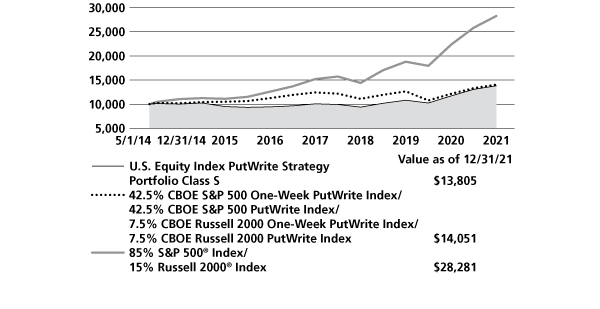
COMPARISON OF A $10,000 INVESTMENT
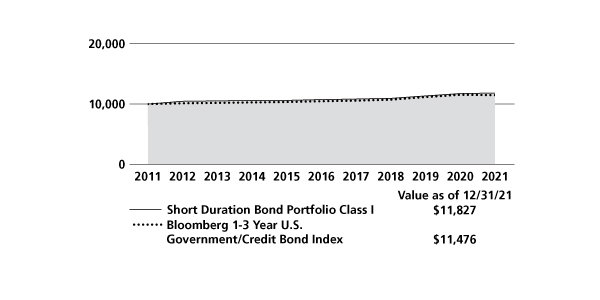
This graph shows the change in value of a hypothetical $10,000 investment in the Fund over the past 10 fiscal years, or since the Fund's inception, if it has not operated for 10 years. The result is compared with benchmarks, which include a broad-based market index and may include a more narrowly based index. Market indices have not been reduced to reflect any of the fees and costs of investing. The results shown in the graph reflect the reinvestment of income dividends and other distributions, if any. The results do not reflect the effect of taxes a shareholder would pay on Fund distributions or on the redemption of Fund shares. The results do not reflect fees and expenses of the variable annuity and variable life insurance policies or the qualified pension and retirement plans whose proceeds are invested in the Fund. Results represent past performance and do not indicate future results.
Please see Endnotes for additional information.
3
1 The date used to calculate Life of Fund performance for the index is September 10, 1984, the Fund's commencement of operations.
2 The Bloomberg 1-3 Year U.S. Government/Credit Bond Index is the 1-3 year component of the Bloomberg U.S. Government/Credit Bond Index. The Bloomberg U.S. Government/Credit Bond Index is the non-securitized component of the Bloomberg U.S. Aggregate Bond Index and includes Treasuries and government-related (agency, sovereign, supranational, and local authority debt) and corporate securities. Effective August 24, 2021 all Bloomberg Barclays fixed income indices were rebranded as "Bloomberg indices". Please note that the indices described in this report do not take into account any fees, expenses or tax consequences of investing in the individual securities that they track, and that individuals cannot invest directly in any index. Data about the performance of an index are prepared or obtained by Neuberger Berman Investment Advisers LLC and reflect the reinvestment of income dividends and other distributions, if any. The Fund may invest in securities not included in a described index and generally does not invest in all securities included in a described index.
The investments for the Fund are managed by the same portfolio manager(s) who manage(s) one or more other registered funds that have names, investment objectives and investment styles that are similar to those of the Fund. You should be aware that the Fund is likely to differ from those other mutual fund(s) in size, cash flow pattern and tax matters. Accordingly, the holdings and performance of the Fund can be expected to vary from those of the other mutual fund(s).
Shares of the separate Neuberger Berman Advisers Management Trust Portfolios, including the Fund, are not available to the general public. Shares of the Fund may be purchased only by life insurance companies to be held in their separate accounts, which fund variable annuity and variable life insurance policies, and by qualified pension and retirement plans. Statistics and projections in this report are derived from sources deemed to be reliable but cannot be regarded as a representation of future results of the Fund. This report is prepared for the general information of shareholders and is not an offer of shares of the Fund. Shares are sold only through the currently effective prospectus, which must precede or accompany this report.
The "Neuberger Berman" name and logo and "Neuberger Berman Investment Advisers LLC" name are registered service marks of Neuberger Berman Group LLC. The individual Fund name in this piece is either a service mark or registered service mark of Neuberger Berman Investment Advisers LLC, an affiliate of Neuberger Berman BD LLC, distributor, member FINRA.
© 2022 Neuberger Berman BD LLC, distributor. All rights reserved.
4
Information About Your Fund's Expenses (Unaudited)
As a Fund shareholder, you incur two types of costs: (1) transaction costs such as fees and expenses that are, or may be, imposed under your variable contract or qualified pension plan; and (2) ongoing costs, including management fees, distribution and/or service (12b-1) fees (if applicable), and other Fund expenses. This example is intended to help you understand your ongoing costs (in U.S. dollars) of investing in the Fund and compare these costs with the ongoing costs of investing in other mutual funds.
This table is designed to provide information regarding costs related to your investments. The following examples are based on an investment of $1,000 made at the beginning of the six month period ended December 31, 2021 and held for the entire period. The table illustrates the Fund's costs in two ways:
Actual Expenses and Performance: | | The first section of the table provides information about actual account values and actual expenses in dollars, based on the Fund's actual performance during the period indicated. You may use the information in this line, together with the amount you invested, to estimate the expenses you paid over the period. Simply divide your account value by $1,000 (for example, an $8,600 account value divided by $1,000 = 8.6), then multiply the result by the number in the first section of the table under the heading entitled "Expenses Paid During the Period" to estimate the expenses you paid over the period. | |
Hypothetical Example for
Comparison Purposes: | | The second section of the table provides information about hypothetical account values and hypothetical expenses based on the Fund's actual expense ratio and an assumed rate of return at 5% per year before expenses. This return is not the Fund's actual return. The hypothetical account values and expenses may not be used to estimate the actual ending account balance or expenses you paid for the period. You may use this information to compare the ongoing costs of investing in this Fund versus other funds. To do so, compare the expenses shown in this 5% hypothetical example with the 5% hypothetical examples that appear in the shareholder reports of other funds. | |
Please note that the expenses in the table are meant to highlight your ongoing costs only and do not include any transaction costs, such as fees and expenses that are, or may be imposed under your variable contract or qualified pension plan. Therefore, the information under the heading "Hypothetical (5% annual return before expenses)" is useful in comparing ongoing costs only, and will not help you determine the relative total costs of owning different funds. In addition, if these transaction costs were included, your costs would have been higher.
Expense Example (Unaudited)
NEUBERGER BERMAN ADVISERS MANAGEMENT TRUST SHORT DURATION BOND PORTFOLIO
Actual | | Beginning Account
Value
7/1/21 | | Ending Account
Value
12/31/21 | | Expenses Paid During
the Period
7/1/21 - 12/31/21 | |
Class I | | $ | 1,000.00 | | | $ | 996.20 | | | $ | 3.92 | (a) | |
Hypothetical (5% annual return before expenses) | |
Class I | | $ | 1,000.00 | | | $ | 1,021.27 | | | $ | 3.97 | (b) | |
(a) Expenses are equal to the annualized expense ratio of 0.78%, multiplied by the average account value over the period, multiplied by 184/365 (to reflect the one-half year period shown).
(b) Hypothetical expenses are equal to the annualized expense ratio of 0.78%, multiplied by the average account value over the period (assuming a 5% annual return), multiplied by 184/365 (to reflect the one-half year period shown).
5
Legend Short Duration Bond Portfolio (Unaudited)
December 31, 2021
Benchmarks:
LIBOR = London Interbank Offered Rate
SOFR30A = 30 Day Average Secured Overnight Financing Rate
Currency Abbreviations:
USD = United States Dollar
Counterparties:
SSB = State Street Bank and Trust Company
Index Periods/Payment Frequencies:
1M = 1 Month
3M = 3 Months
6
Schedule of Investments Short Duration Bond Portfolio^ December 31, 2021
PRINCIPAL AMOUNT | | | | VALUE | |
U.S. Treasury Obligations 0.7% | | | |
$ | 720,000 | | | U.S. Treasury Note, 0.13%, due 4/30/2023 (Cost $719,640) | | $ | 716,147 | | |
Mortgage-Backed Securities 31.0% | | | |
Adjustable Mixed Balance 0.1% | | | |
| 100,395 |
| | Harborview Mortgage Loan Trust, Ser. 2004-4, Class 3A, (1M USD LIBOR + 1.13%),
1.22%, due 6/19/2034 | |
| 100,185 | (a) | |
Collateralized Mortgage Obligations 12.3% | | | |
| | 273,574 | | | Angel Oak Mortgage Trust, Ser. 2019-6, Class A1, 2.62%, due 11/25/2059 | | | 273,243 | (b)(c) | |
| | 964,223 | | | Brass No. 10 PLC, Ser. 10A, Class A1, 0.67%, due 4/16/2069 | | | 958,901 | (b)(c) | |
| | | | | Connecticut Avenue Securities Trust | | | | | |
| | 115,799 | | | Ser. 2019-R02, Class 1M2, (1M USD LIBOR + 2.30%), 2.40%, due 8/25/2031 | | | 116,277 | (a)(b) | |
| | 236,000 | | | Ser. 2021-R01, Class 1M2, (SOFR30A + 1.55%), 1.60%, due 10/25/2041 | | | 236,285 | (a)(b) | |
| | | | | Fannie Mae Connecticut Avenue Securities | | | | | |
| | 862,030 | | | Ser. 2016-C02, Class 1M2, (1M USD LIBOR + 6.00%), 6.10%, due 9/25/2028 | | | 890,692 | (a) | |
| | 294,405 | | | Ser. 2016-C03, Class 1M2, (1M USD LIBOR + 5.30%), 5.40%, due 10/25/2028 | | | 304,956 | (a) | |
| | 986,012 | | | Ser. 2016-C04, Class 1M2, (1M USD LIBOR + 4.25%), 4.35%, due 1/25/2029 | | | 1,011,269 | (a) | |
| | 697,853 | | | Ser. 2016-C06, Class 1M2, (1M USD LIBOR + 4.25%), 4.35%, due 4/25/2029 | | | 720,459 | (a) | |
| | 266,469 | | | Ser. 2016-C07, Class 2M2, (1M USD LIBOR + 4.35%), 4.45%, due 5/25/2029 | | | 276,634 | (a) | |
| | 1,024,219 | | | Ser. 2017-C03, Class 1M2, (1M USD LIBOR + 3.00%), 3.10%, due 10/25/2029 | | | 1,047,976 | (a) | |
| | 885,963 | | | Ser. 2017-C05, Class 1M2, (1M USD LIBOR + 2.20%), 2.30%, due 1/25/2030 | | | 901,097 | (a) | |
| | 915,549 | | | Ser. 2018-C01, Class 1M2, (1M USD LIBOR + 2.25%), 2.35%, due 7/25/2030 | | | 925,890 | (a) | |
| | | | | Freddie Mac Structured Agency Credit Risk Debt Notes | | | | | |
| | 1,016,816 | | | Ser. 2017-DNA1, Class M2, (1M USD LIBOR + 3.25%), 3.35%, due 7/25/2029 | | | 1,038,492 | (a) | |
| | 665,720 | | | Ser. 2017-DNA3, Class M2, (1M USD LIBOR + 2.50%), 2.60%, due 3/25/2030 | | | 678,532 | (a) | |
| | 1,067,476 | | | Ser. 2017-HQA3, Class M2, (1M USD LIBOR + 2.35%), 2.45%, due 4/25/2030 | | | 1,084,301 | (a) | |
| | 264,744 | | | Ser. 2019-DNA2, Class M2, (1M USD LIBOR + 2.45%), 2.55%, due 3/25/2049 | | | 267,440 | (a)(b) | |
| 228,648 |
| | Freddie Mac Structured Agency Credit Risk Debt Notes Real Estate Mortgage Investment
Conduits, Ser. 2021-DNA1, Class M1, (SOFR30A + 0.65%), 0.70%, due 1/25/2051 | |
| 228,580 | (a)(b) | |
| | | | | GCAT Trust | | | | | |
| | 368,649 | | | Ser. 2019-NQM3, Class A1, 2.69%, due 11/25/2059 | | | 370,642 | (b)(c) | |
| | 617,675 | | | Ser. 2021-NQM5, Class A1, 1.26%, due 7/25/2066 | | | 608,835 | (b)(c) | |
| | 527,820 | | | SGR Residential Mortgage Trust, Ser. 2021-2, Class A1, 1.74%, due 12/25/2061 | | | 523,660 | (b)(c) | |
| | 73,267 | | | Starwood Mortgage Residential Trust, Ser. 2019-INV1, Class A1, 2.61%, due 9/27/2049 | | | 73,718 | (b)(c) | |
| | | | | Verus Securitization Trust | | | | | |
| | 685,392 | | | Ser. 2021-3, Class A3, 1.44%, due 6/25/2066 | | | 677,100 | (b)(c) | |
| | 547,793 | | | Ser. 2021-6, Class A3, 1.89%, due 10/25/2066 | | | 543,709 | (b)(c) | |
| | | | 13,758,688 | | |
Commercial Mortgage-Backed 17.3% | | | |
| | 1,313,795 | | | BANK, Ser. 2020-BN30, Class A1, 0.45%, due 12/15/2053 | | | 1,292,912 | | |
| | 510,000 | | | BB-UBS Trust, Ser. 2012-SHOW, Class A , 3.43%, due 11/5/2036 | | | 528,151 | (b) | |
| | 5,396,962 | | | BBCMS Mortgage Trust, Ser. 2021-C11, Class XA, 1.39%, due 9/15/2054 | | | 548,160 | (c)(d) | |
| | | | | Benchmark Mortgage Trust | | | | | |
| | 97,000 | | | Ser. 2021-B31, Class E, 2.25%, due 12/15/2054 | | | 74,456 | (b) | |
| | 227,000 | | | Ser. 2021-B31, Class D, 2.25%, due 12/15/2054 | | | 192,326 | (b) | |
| 1,150,000 |
| | BX Commercial Mortgage Trust, Ser. 2021-VOLT, Class D, (1M USD LIBOR + 1.65%),
1.76%, due 9/15/2036 | |
| 1,139,843 | (a)(b) | |
| | 587,000 | | | BX Trust, Ser. 2021-SDMF, Class E, (1M USD LIBOR + 1.59%), 1.70%, due 9/15/2034 | | | 574,686 | (a)(b) | |
| | 320,000 | | | BXMT Ltd., Ser. 2020-FL2, Class A, (SOFR30A + 1.01%), 1.06%, due 2/15/2038 | | | 319,500 | (a)(b) | |
| | | | | CAMB Commercial Mortgage Trust | | | | | |
| | 1,006,000 | | | Ser. 2019-LIFE, Class D, (1M USD LIBOR + 1.75%), 1.86%, due 12/15/2037 | | | 1,005,075 | (a)(b) | |
| | 130,000 | | | Ser. 2019-LIFE, Class F, (1M USD LIBOR + 2.55%), 2.66%, due 12/15/2037 | | | 129,713 | (a)(b) | |
See Notes to Financial Statements
7
Schedule of Investments Short Duration Bond Portfolio^ (cont'd)
PRINCIPAL AMOUNT | | | | VALUE | |
| | | | | Citigroup Commercial Mortgage Trust | | | | | |
$ | 162,217 | | | Ser. 2012-GC8, Class AAB, 2.61%, due 9/10/2045 | | $ | 162,545 | | |
| | 830,000 | | | Ser. 2015-P1, Class A5, 3.72%, due 9/15/2048 | | | 885,734 | | |
| | 99,427 | | | Ser. 2016-P3, Class A2, 2.74%, due 4/15/2049 | | | 99,363 | | |
| | | | | Commercial Mortgage Trust | | | | | |
| | 1,111,000 | | | Ser. 2012-CR4, Class AM, 3.25%, due 10/15/2045 | | | 1,119,132 | | |
| | 12,120,166 | | | Ser. 2014-CR18, Class XA, 1.00%, due 7/15/2047 | | | 248,335 | (c)(d) | |
| | 16,384,063 | | | CSAIL Commercial Mortgage Trust, Ser. 2016-C5, Class XA, 0.93%, due 11/15/2048 | | | 484,313 | (c)(d) | |
| | 800,000 | | | Eleven Madison Mortgage Trust, Ser. 2015-11MD, Class A, 3.55%, due 9/10/2035 | | | 836,293 | (b)(c) | |
| | | | | Freddie Mac Multiclass Certificates | | | | | |
| | 2,420,000 | | | Ser. 2020-RR03, Class X1, 1.71%, due 7/27/2028 | | | 239,927 | (d) | |
| | 1,500,000 | | | Ser. 2020-RR02, Class DX, 1.82%, due 9/27/2028 | | | 161,156 | (c)(d) | |
| | 1,535,000 | | | Ser. 2020-RR02, Class CX, 1.27%, due 3/27/2029 | | | 122,550 | (c)(d) | |
| 26,676,696 |
| | Freddie Mac Multifamily Structured Pass Through Certificates, Ser. K737, Class X1, 0.64%,
due 10/25/2026 | |
| 697,697 | (c)(d) | |
| | | | | GS Mortgage Securities Trust | | | | | |
| | 520,000 | | | Ser. 2019-BOCA, Class A, (1M USD LIBOR + 1.20%), 1.31%, due 6/15/2038 | | | 519,677 | (a)(b) | |
| | 915,000 | | | Ser. 2010-C1, Class B, 5.15%, due 8/10/2043 | | | 916,034 | (b) | |
| | 95,000 | | | Ser. 2012-GCJ7, Class B, 4.74%, due 5/10/2045 | | | 95,864 | | |
| | 175,738,695 | | | Ser. 2013-GC13, Class XA, 0.06%, due 7/10/2046 | | | 155,775 | (c)(d) | |
| | 1,000,000 | | | Ser. 2014-GC22, Class A4, 3.59%, due 6/10/2047 | | | 1,027,869 | | |
| | 18,234,471 | | | Ser. 2015-GC30, Class XA, 0.74%, due 5/10/2050 | | | 399,415 | (c)(d) | |
| | | | | JP Morgan Chase Commercial Mortgage Securities Trust | | | | | |
| | 285,000 | | | Ser. 2012-HSBC, Class B, 3.72%, due 7/5/2032 | | | 287,097 | (b) | |
| | 285,000 | | | Ser. 2012-HSBC, Class C, 4.02%, due 7/5/2032 | | | 287,201 | (b) | |
| | | | | JPMBB Commercial Mortgage Securities Trust | | | | | |
| | 293,640 | | | Ser. 2013-C12, Class ASB, 3.16%, due 7/15/2045 | | | 295,114 | | |
| | 322,214 | | | Ser. 2015-C29, Class ASB, 3.30%, due 5/15/2048 | | | 332,489 | | |
| 166,000 |
| | Morgan Stanley Bank of America Merrill Lynch Trust, Ser. 2013-C9, Class B, 3.71%,
due 5/15/2046 | |
| 169,372 | (c) | |
| 165,000 |
| | ONE Park Mortgage Trust, Ser. 2021-PARK, Class E, (1M USD LIBOR + 1.75%), 1.86%,
due 3/15/2036 | |
| 163,344 | (a)(b) | |
| | 334,716 | | | UBS Commercial Mortgage Trust, Ser. 2018-C14, Class A1, 3.38%, due 12/15/2051 | | | 339,421 | | |
| | 893,000 | | | VNDO Mortgage Trust, Ser. 2012-6AVE, Class E, 3.34%, due 11/15/2030 | | | 905,574 | (b)(c) | |
| | | | | Wells Fargo Commercial Mortgage Trust | | | | | |
| | 293,780 | | | Ser. 2012-LC5, Class A3, 2.92%, due 10/15/2045 | | | 296,006 | | |
| | 649,707 | | | Ser. 2020-C58, Class A1, 0.55%, due 7/15/2053 | | | 640,019 | | |
| | | | | WF-RBS Commercial Mortgage Trust | | | | | |
| | 16,842,695 | | | Ser. 2014-LC14, Class XA, 1.25%, due 3/15/2047 | | | 352,164 | (c)(d) | |
| | 1,130,000 | | | Ser. 2014-C25, Class A5, 3.63%, due 11/15/2047 | | | 1,189,302 | | |
| | | | 19,233,604 | | |
Fannie Mae 0.7% | | | |
| | 731,408 | | | Pass-Through Certificates, 4.50%, due 5/1/2041 – 5/1/2044 | | | 806,021 | | |
Freddie Mac 0.6% | | | |
| | | | | Pass-Through Certificates | | | | | |
| | 263,985 | | | 3.50%, due 5/1/2026 | | | 277,891 | | |
| | 375,196 | | | 4.50%, due 11/1/2039 | | | 415,122 | | |
| | | | 693,013 | | |
| | | | | Total Mortgage-Backed Securities (Cost $36,101,014) | | | 34,591,511 | | |
Corporate Bonds 48.2% | | | |
Advertising 0.1% | | | |
| | 140,000 | | | Outfront Media Capital LLC/Outfront Media Capital Corp., 6.25%, due 6/15/2025 | | | 145,600 | (b) | |
See Notes to Financial Statements
8
Schedule of Investments Short Duration Bond Portfolio^ (cont'd)
PRINCIPAL AMOUNT | | | | VALUE | |
Aerospace & Defense 1.8% | | | |
$ | 1,400,000 | | | Boeing Co., 2.20%, due 2/4/2026 | | $ | 1,399,666 | | |
| | 410,000 | | | Spirit AeroSystems, Inc., 7.50%, due 4/15/2025 | | | 429,988 | (b) | |
| | 230,000 | | | TransDigm, Inc., 6.25%, due 3/15/2026 | | | 239,056 | (b) | |
| | | | 2,068,710 | | |
Agriculture 0.5% | | | |
| | 535,000 | | | BAT Capital Corp., 2.26%, due 3/25/2028 | | | 521,323 | | |
Airlines 3.1% | | | |
| | 1,160,000 | | | American Airlines, Inc./AAdvantage Loyalty IP Ltd., 5.50%, due 4/20/2026 | | | 1,206,255 | (b) | |
| | 140,000 | | | Delta Air Lines, Inc., 7.00%, due 5/1/2025 | | | 160,077 | (b) | |
| | 535,000 | | | Delta Air Lines, Inc./SkyMiles IP Ltd., 4.50%, due 10/20/2025 | | | 562,291 | (b) | |
| | 255,000 | | | United Airlines, Inc., 4.38%, due 4/15/2026 | | | 265,898 | (b) | |
| | | | | United Continental Holdings, Inc. | | | | | |
| | 170,000 | | | 4.25%, due 10/1/2022 | | | 172,550 | | |
| | 1,090,000 | | | 4.88%, due 1/15/2025 | | | 1,121,338 | (e) | |
| | | | 3,488,409 | | |
Auto Manufacturers 2.0% | | | |
| | | | | General Motors Financial Co., Inc. | | | | | |
| | 530,000 | | | 2.75%, due 6/20/2025 | | | 546,895 | | |
| | 400,000 | | | 2.70%, due 8/20/2027 | | | 406,866 | (e) | |
| | 250,000 | | | Jaguar Land Rover Automotive PLC, 7.75%, due 10/15/2025 | | | 270,371 | (b) | |
| | | | | Volkswagen Group of America Finance LLC | | | | | |
| | 610,000 | | | 0.88%, due 11/22/2023 | | | 605,926 | (b) | |
| | 370,000 | | | 3.35%, due 5/13/2025 | | | 389,276 | (b) | |
| | | | 2,219,334 | | |
Auto Parts & Equipment 0.1% | | | |
| | 60,000 | | | Meritor, Inc., 6.25%, due 6/1/2025 | | | 62,550 | (b) | |
Banks 8.1% | | | |
| | 550,000 | | | Banco Santander SA, 2.75%, due 5/28/2025 | | | 568,475 | | |
| | 650,000 | | | Bank of America Corp., Ser. L, 3.95%, due 4/21/2025 | | | 694,786 | | |
| | 1,070,000 | | | Citigroup, Inc., 3.35%, due 4/24/2025 | | | 1,117,239 | (f) | |
| | | | | Goldman Sachs Group, Inc. | | | | | |
| | 795,000 | | | (3M USD LIBOR + 1.60%), 1.78%, due 11/29/2023 | | | 811,068 | (a) | |
| | 1,270,000 | | | 1.95%, due 10/21/2027 | | | 1,264,412 | (f) | |
| | 700,000 | | | JPMorgan Chase & Co., 2.30%, due 10/15/2025 | | | 715,895 | (f) | |
| | 1,065,000 | | | Lloyds Banking Group PLC, 1.33%, due 6/15/2023 | | | 1,066,789 | (f) | |
| | 1,700,000 | | | Morgan Stanley, 0.79%, due 5/30/2025 | | | 1,677,783 | (f) | |
| | 1,060,000 | | | Wells Fargo & Co., 3.75%, due 1/24/2024 | | | 1,112,956 | | |
| | | | 9,029,403 | | |
Chemicals 0.2% | | | |
| | 200,000 | | | SCIL IV LLC/SCIL USA Holdings LLC, 5.38%, due 11/1/2026 | | | 205,250 | (b) | |
Commercial Services 0.6% | | | |
| | 410,000 | | | Global Payments, Inc., 1.50%, due 11/15/2024 | | | 410,057 | | |
| | 240,000 | | | Prime Security Services Borrower LLC/Prime Finance, Inc., 5.25%, due 4/15/2024 | | | 255,395 | (b) | |
| | | | 665,452 | | |
See Notes to Financial Statements
9
Schedule of Investments Short Duration Bond Portfolio^ (cont'd)
PRINCIPAL AMOUNT | | | | VALUE | |
Distribution-Wholesale 0.3% | | | |
$ | 290,000 | | | KAR Auction Services, Inc., 5.13%, due 6/1/2025 | | $ | 294,350 | (b) | |
Diversified Financial Services 2.4% | | | |
| | | | | AerCap Ireland Capital DAC/AerCap Global Aviation Trust | | | | | |
| | 800,000 | | | 4.50%, due 9/15/2023 | | | 839,138 | | |
| | 540,000 | | | 6.50%, due 7/15/2025 | | | 617,079 | | |
| | 1,290,000 | | | Global Aircraft Leasing Co. Ltd., 6.50% Cash/7.25% PIK, 6.50%, due 9/15/2024 | | | 1,244,850 | (b)(g) | |
| | | | 2,701,067 | | |
Electric 0.1% | | | |
| | 150,000 | | | Talen Energy Supply LLC, 10.50%, due 1/15/2026 | | | 64,500 | (b) | |
Entertainment 0.9% | | | |
| | 250,000 | | | Cinemark USA, Inc., 8.75%, due 5/1/2025 | | | 265,000 | (b) | |
| | 215,000 | | | Int'l Game Technology PLC, 4.13%, due 4/15/2026 | | | 221,465 | (b) | |
| | 260,000 | | | Live Nation Entertainment, Inc., 4.88%, due 11/1/2024 | | | 262,600 | (b) | |
| | 230,000 | | | Six Flags Theme Parks, Inc., 7.00%, due 7/1/2025 | | | 245,627 | (b) | |
| | | | 994,692 | | |
Food 0.9% | | | |
| | 970,000 | | | JBS Finance Luxembourg S.a.r.l., 2.50%, due 1/15/2027 | | | 959,097 | (b) | |
Food Service 0.2% | | | |
| | | | | Aramark Services, Inc. | | | | | |
| | 150,000 | | | 5.00%, due 4/1/2025 | | | 153,030 | (b) | |
| | 80,000 | | | 6.38%, due 5/1/2025 | | | 83,600 | (b) | |
| | | | 236,630 | | |
Gas 0.9% | | | |
| | 1,035,000 | | | CenterPoint Energy Resources Corp., (3M USD LIBOR + 0.50%), 0.67%, due 3/2/2023 | | | 1,032,589 | (a) | |
Healthcare-Products 0.8% | | | |
| | 945,000 | | | Baxter Int'l, Inc., 1.32%, due 11/29/2024 | | | 943,677 | (b) | |
Housewares 0.2% | | | |
| | 180,000 | | | CD&R Smokey Buyer, Inc., 6.75%, due 7/15/2025 | | | 189,000 | (b) | |
Insurance 0.3% | | | |
| | 380,000 | | | Jackson Financial, Inc., 1.13%, due 11/22/2023 | | | 379,297 | (b) | |
Leisure Time 1.2% | | | |
| | | | | Carnival Corp. | | | | | |
| | 785,000 | | | 10.50%, due 2/1/2026 | | | 896,074 | (b) | |
| | 280,000 | | | 5.75%, due 3/1/2027 | | | 280,000 | (b) | |
| | 143,000 | | | NCL Corp. Ltd., 12.25%, due 5/15/2024 | | | 169,455 | (b) | |
| | | | 1,345,529 | | |
Lodging 0.2% | | | |
| | 260,000 | | | Wynn Las Vegas LLC/Wynn Las Vegas Capital Corp., 5.50%, due 3/1/2025 | | | 267,800 | (b) | |
See Notes to Financial Statements
10
Schedule of Investments Short Duration Bond Portfolio^ (cont'd)
PRINCIPAL AMOUNT | | | | VALUE | |
Machinery-Diversified 1.2% | | | |
$ | 1,385,000 | | | Otis Worldwide Corp., (3M USD LIBOR + 0.45%), 0.58%, due 4/5/2023 | | $ | 1,385,038 | (a) | |
Media 2.2% | | | |
| | | | | Charter Communications Operating LLC/Charter Communications Operating Capital | | | | | |
| | 430,000 | | | 4.91%, due 7/23/2025 | | | 473,477 | | |
| | 535,000 | | | 2.25%, due 1/15/2029 | | | 521,998 | | |
| | 343,000 | | | Cumulus Media New Holdings, Inc., 6.75%, due 7/1/2026 | | | 355,863 | (b)(e) | |
| | 550,000 | | | Fox Corp., 3.05%, due 4/7/2025 | | | 577,326 | | |
| | 180,000 | | | iHeartCommunications, Inc., 6.38%, due 5/1/2026 | | | 186,750 | | |
| | 310,000 | | | Radiate Holdco LLC/Radiate Finance, Inc., 4.50%, due 9/15/2026 | | | 313,100 | (b) | |
| | | | 2,428,514 | | |
Mining 0.3% | | | |
| | 320,000 | | | First Quantum Minerals Ltd., 7.50%, due 4/1/2025 | | | 329,184 | (b) | |
Miscellaneous Manufacturer 2.0% | | | |
| | 2,185,000 | | | General Electric Capital Corp., (3M USD LIBOR + 1.00%), 1.20%, due 3/15/2023 | | | 2,194,063 | (a) | |
Office-Business Equipment 1.1% | | | |
| | 1,200,000 | | | CDW LLC/CDW Finance Corp., 2.67%, due 12/1/2026 | | | 1,229,526 | | |
Oil & Gas 1.3% | | | |
| | 260,000 | | | Apache Corp., 4.63%, due 11/15/2025 | | | 279,175 | | |
| | 210,000 | | | Occidental Petroleum Corp., 5.50%, due 12/1/2025 | | | 232,968 | | |
| | 90,000 | | | PDC Energy, Inc., 5.75%, due 5/15/2026 | | | 93,005 | | |
| | 550,000 | | | Petroleos Mexicanos, (3M USD LIBOR + 3.65%), 3.85%, due 3/11/2022 | | | 550,000 | (a) | |
| | 250,000 | | | Range Resources Corp., 9.25%, due 2/1/2026 | | | 269,448 | | |
| | | | 1,424,596 | | |
Oil & Gas Services 0.1% | | | |
| | 150,000 | | | USA Compression Partners L.P./USA Compression Finance Corp., 6.88%, due 4/1/2026 | | | 156,000 | | |
Pharmaceuticals 1.1% | | | |
| | 1,135,000 | | | Upjohn, Inc., 1.65%, due 6/22/2025 | | | 1,130,699 | | |
| | 140,000 | | | Valeant Pharmaceuticals Int'l, Inc., 5.50%, due 11/1/2025 | | | 142,275 | (b) | |
| | | | 1,272,974 | | |
Pipelines 2.4% | | | |
| | 365,000 | | | Blue Racer Midstream LLC/Blue Racer Finance Corp., 7.63%, due 12/15/2025 | | | 386,900 | (b) | |
| | 130,000 | | | EQM Midstream Partners L.P., 6.00%, due 7/1/2025 | | | 141,375 | (b) | |
| | 160,000 | | | Genesis Energy L.P./Genesis Energy Finance Corp., 6.50%, due 10/1/2025 | | | 158,000 | | |
| | 660,000 | | | MPLX L.P., 4.88%, due 6/1/2025 | | | 722,211 | | |
| | | | | New Fortress Energy, Inc. | | | | | |
| | 260,000 | | | 6.75%, due 9/15/2025 | | | 262,600 | (b) | |
| | 720,000 | | | 6.50%, due 9/30/2026 | | | 714,600 | (b) | |
| | 90,000 | | | Rattler Midstream L.P., 5.63%, due 7/15/2025 | | | 93,600 | (b) | |
| | 140,000 | | | Tallgrass Energy Partners L.P./Tallgrass Energy Finance Corp., 7.50%, due 10/1/2025 | | | 151,550 | (b) | |
| | | | 2,630,836 | | |
Real Estate 0.2% | | | |
| | 215,000 | | | Realogy Group LLC/Realogy Co-Issuer Corp., 7.63%, due 6/15/2025 | | | 227,900 | (b) | |
See Notes to Financial Statements
11
Schedule of Investments Short Duration Bond Portfolio^ (cont'd)
PRINCIPAL AMOUNT | | | | VALUE | |
Real Estate Investment Trusts 2.6% | | | |
| | | | | American Tower Corp. | | | | | |
$ | 645,000 | | | 1.60%, due 4/15/2026 | | $ | 638,401 | | |
| | 805,000 | | | 1.45%, due 9/15/2026 | | | 787,674 | | |
| 115,000 |
| | MGM Growth Properties Operating Partnership L.P./MGP Finance Co-Issuer, Inc., 4.63%,
due 6/15/2025 | |
| 122,600 | (b) | |
| | 565,000 | | | Service Properties Trust, 4.35%, due 10/1/2024 | | | 553,703 | | |
| | 530,000 | | | Starwood Property Trust, Inc., 5.50%, due 11/1/2023 | | | 548,550 | (b) | |
| | 250,000 | | | Uniti Group L.P./Uniti Fiber Holdings, Inc./CSL Capital LLC, 7.88%, due 2/15/2025 | | | 260,937 | (b) | |
| | | | 2,911,865 | | |
Retail 1.0% | | | |
| | 1,100,000 | | | Lowe's Cos., Inc., 1.70%, due 9/15/2028 | | | 1,077,848 | | |
Semiconductors 1.5% | | | |
| | 750,000 | | | Broadcom, Inc., 3.15%, due 11/15/2025 | | | 785,210 | | |
| | 850,000 | | | Marvell Technology, Inc., 1.65%, due 4/15/2026 | | | 839,953 | | |
| | | | 1,625,163 | | |
Software 2.5% | | | |
| | 540,000 | | | Infor, Inc., 1.45%, due 7/15/2023 | | | 541,637 | (b) | |
| | 1,700,000 | | | Oracle Corp., 1.65%, due 3/25/2026 | | | 1,686,856 | | |
| | 530,000 | | | VMware, Inc., 1.00%, due 8/15/2024 | | | 524,883 | | |
| | | | 2,753,376 | | |
Telecommunications 3.8% | | | |
| | | | | AT&T, Inc. | | | | | |
| | 1,370,000 | | | 1.70%, due 3/25/2026 | | | 1,362,924 | | |
| | 550,000 | | | 1.65%, due 2/1/2028 | | | 538,354 | | |
| | 200,000 | | | Iliad Holding SAS, 6.50%, due 10/15/2026 | | | 210,146 | (b) | |
| | 550,000 | | | T-Mobile USA, Inc., 3.50%, due 4/15/2025 | | | 582,711 | | |
| | | | | Verizon Communications, Inc. | | | | | |
| | 1,025,000 | | | 1.45%, due 3/20/2026 | | | 1,019,803 | | |
| | 550,000 | | | 2.63%, due 8/15/2026 | | | 573,020 | | |
| | | | 4,286,958 | | |
| | | | | Total Corporate Bonds (Cost $53,448,203) | | | 53,748,100 | | |
Asset-Backed Securities 16.1% | | | |
| 1,125,000 |
| | 37 Capital CLO I Ltd., Ser. 2021-1A, Class A, (3M USD LIBOR + 1.20%), 1.40%,
due 10/15/2034 | |
| 1,124,994 | (a)(b) | |
| | 1,000,000 | | | AM Capital Funding LLC, Ser. 2018-1, Class A, 4.98%, due 12/15/2023 | | | 1,027,686 | (b) | |
| | 408,735 | | | Aqua Finance Trust, Ser. 2021-A, Class A, 1.54%, due 7/17/2046 | | | 405,086 | (b) | |
| 500,000 |
| | Benefit Street Partners CLO XIX Ltd., Ser. 2019-19A, Class D, (3M USD LIBOR + 3.80%),
3.92%, due 1/15/2033 | |
| 500,291 | (a)(b) | |
| 145,956 |
| | Consumer Loan Underlying Bond Club Certificate Issuer Trust I, Ser. 2019-HP1, Class A,
2.59%, due 12/15/2026 | |
| 146,459 | (b) | |
| | 1,400,000 | | | Crown Castle Towers LLC, 3.66%, due 5/15/2025 | | | 1,456,674 | (b) | |
| 565,000 |
| | Fort Washington CLO Ltd., Ser. 2021-2A, Class A, (3M USD LIBOR + 1.22%), 1.34%,
due 10/20/2034 | |
| 565,959 | (a)(b) | |
| 1,900,000 |
| | Gulf Stream Meridian 3 Ltd., Ser. 2021-IIA, Class A1, (3M USD LIBOR + 1.32%), 1.44%,
due 4/15/2034 | |
| 1,902,987 | (a)(b) | |
| | 951,813 | | | JPMorgan Chase Bank NA , Ser. 2021-3, Class B, 0.76%, due 2/26/2029 | | | 945,846 | (b) | |
| | 500,000 | | | Milos CLO Ltd., Ser. 2017-1A, Class DR, (3M USD LIBOR + 2.75%), 2.88%, due 10/20/2030 | | | 492,932 | (a)(b) | |
| | 134,522 | | | MVW LLC, Ser. 2021-1WA, Class B, 1.44%, due 1/22/2041 | | | 132,529 | (b) | |
See Notes to Financial Statements
12
Schedule of Investments Short Duration Bond Portfolio^ (cont'd)
PRINCIPAL AMOUNT | | | | VALUE | |
| | | | | MVW LLC | | | | | |
$ | 567,000 | | | Ser. 2021-2A, Class A, 1.43%, due 5/20/2039 | | $ | 560,179 | (b) | |
| | 393,000 | | | Ser. 2021-2A, Class B, 1.83%, due 5/20/2039 | | | 390,432 | (b) | |
| | 511,446 | | | Navient Private Ed. Refi Loan Trust, Ser. 2021-EA, Class A, 0.97%, due 12/16/2069 | | | 502,718 | (b) | |
| 500,000 |
| | OHA Loan Funding Ltd., Ser. 2016-1A, Class DR, (3M USD LIBOR + 3.00%), 3.13%,
due 1/20/2033 | |
| 496,556 | (a)(b) | |
| 500,000 |
| | Palmer Square CLO Ltd., Ser. 2015-2A, Class CR2, (3M USD LIBOR + 2.75%), 2.88%,
due 7/20/2030 | |
| 493,355 | (a)(b) | |
| | 1,195,000 | | | PFS Financing Corp., Ser. 2021-A, Class A, 0.71%, due 4/15/2026 | | | 1,178,102 | (b) | |
| | 565,000 | | | Prestige Auto Receivables Trust, Ser. 2021-1A, Class D, 2.08%, due 2/15/2028 | | | 561,618 | (b) | |
| | | | | Sierra Timeshare Receivables Funding LLC | | | | | |
| | 142,150 | | | Ser. 2019-2A, Class A, 2.59%, due 5/20/2036 | | | 143,738 | (b) | |
| | 169,668 | | | Ser. 2020-2A, Class C, 3.51%, due 7/20/2037 | | | 172,474 | (b) | |
| 500,000 |
| | Signal Peak CLO 2 LLC, Ser. 2015-1A, Class DR2, (3M USD LIBOR + 2.85%), 2.98%,
due 4/20/2029 | |
| 493,491 | (a)(b) | |
| 524,954 |
| | SLM Student Loan Trust, Ser. 2013-2, Class A, (1M USD LIBOR + 0.45%), 0.55%,
due 6/25/2043 | |
| 519,799 | (a) | |
| | 114,375 | | | SoFi Consumer Loan Program Trust, Ser. 2020-1, Class A, 2.02%, due 1/25/2029 | | | 114,823 | (b) | |
| | 487,638 | | | SoFi Professional Loan Program Trust, Ser. 2021-A, Class AFX, 1.03%, due 8/17/2043 | | | 480,833 | (b) | |
| 500,000 |
| | Symphony CLO XXII Ltd., Ser. 2020-22A, Class D, (3M USD LIBOR + 3.15%), 3.27%,
due 4/18/2033 | |
| 498,801 | (a)(b) | |
| | 500,000 | | | TICP CLO VII Ltd., Ser. 2017-7A, Class DR, (3M USD LIBOR + 3.20%), 3.32%, due 4/15/2033 | | | 500,238 | (a)(b) | |
| | 500,000 | | | TICP CLO XV Ltd., Ser. 2020-15A, Class D, (3M USD LIBOR + 3.15%), 3.28%, due 4/20/2033 | | | 501,064 | (a)(b) | |
| 500,000 |
| | TRESTLES CLO III Ltd., Ser. 2020-3A, Class D, (3M USD LIBOR + 3.25%), 3.38%,
due 1/20/2033 | |
| 499,994 | (a)(b) | |
| 1,125,000 |
| | Whitebox CLO III Ltd., Ser. 2021-3A , Class A1, (3M USD LIBOR + 1.22%), 1.34%,
due 10/15/2034 | |
| 1,125,523 | (a)(b) | |
| | | | | Total Asset-Backed Securities (Cost $18,061,072) | | | 17,935,181 | | |
NUMBER OF SHARES | | | | | |
Exchange-Traded Funds 2.5% | | | |
| | 101,945 | | | SPDR Bloomberg Barclays Short Term High Yield Bond ETF (Cost $2,778,635) | | | 2,767,807 | | |
Short-Term Investments 2.0% | | | |
Investment Companies 2.0% | | | |
| | 811,909 | | | State Street Institutional U.S. Government Money Market Fund Premier Class, 0.03%(h) | | | 811,909 | (i) | |
| | 1,446,618 | | | State Street Navigator Securities Lending Government Money Market Portfolio, 0.03%(h) | | | 1,446,618 | (j) | |
| | | | | Total Short-Term Investments (Cost $2,258,527) | | | 2,258,527 | | |
| | | | | Total Investments 100.5% (Cost $113,367,091) | | | 112,017,273 | | |
| | | | | Liabilities Less Other Assets (0.5)% | | | (540,093 | )(k) | |
| | | | | Net Assets 100.0% | | $ | 111,477,180 | | |
(a) Variable or floating rate security. The interest rate shown was the current rate as of December 31, 2021 and changes periodically.
(b) Securities were purchased under Rule 144A of the Securities Act of 1933, as amended, or are otherwise restricted and, unless registered under the Securities Act of 1933 or exempted from registration, may only be sold to qualified institutional investors or may have other restrictions on resale. At December 31, 2021, these securities amounted to $46,692,914, which represents 41.9% of net assets of the Fund.
See Notes to Financial Statements
13
Schedule of Investments Short Duration Bond Portfolio^ (cont'd)
(c) Variable or floating rate security where the stated interest rate is not based on a published reference rate and spread. Rather, the interest rate adjusts periodically based on changes in current interest rates and prepayments on the underlying pool of assets. The interest rate shown was the current rate as of December 31, 2021.
(d) Interest only security. These securities represent the right to receive the monthly interest payments on an underlying pool of mortgages. Payments of principal on the pool reduce the value of the "interest only" holding.
(e) The security or a portion of this security is on loan at December 31, 2021. Total value of all such securities at December 31, 2021 amounted to $1,418,868 for the Fund (see Note A of the Notes to Financial Statements).
(f) Security issued at a fixed coupon rate, which converts to a variable rate at a future date. Rate shown is the rate in effect as of period end.
(g) Payment-in-kind (PIK) security.
(h) Represents 7-day effective yield as of December 31, 2021.
(i) All or a portion of this security is segregated in connection with obligations for futures contracts with a total value of $811,909.
(j) Represents investment of cash collateral received from securities lending.
(k) Includes the impact of the Fund's open positions in derivatives at December 31, 2021.
POSITIONS BY COUNTRY
Country | | Investments
at Value | | Percentage of
Net Assets | |
United States | | $ | 92,565,094 | | | | 83.1 | % | |
Cayman Islands | | | 10,267,044 | | | | 9.2 | % | |
United Kingdom | | | 2,817,384 | | | | 2.5 | % | |
Ireland | | | 1,456,217 | | | | 1.3 | % | |
Germany | | | 995,202 | | | | 0.9 | % | |
Spain | | | 568,475 | | | | 0.5 | % | |
Mexico | | | 550,000 | | | | 0.5 | % | |
Zambia | | | 329,184 | | | | 0.3 | % | |
France | | | 210,146 | | | | 0.2 | % | |
Short-Term Investments and Other Liabilities-Net | | | 1,718,434 | | | | 1.5 | % | |
| | | $ | 111,477,180 | | | | 100.0 | % | |
Derivative Instruments
Futures contracts ("futures")
At December 31, 2021, open positions in futures for the Fund were as follows:
Long Futures:
Expiration Date | | Number of
Contracts | | Open Contracts | | Notional
Amount | | Value and
Unrealized
Appreciation/
(Depreciation) | |
3/2022 | | | 261 | | | U.S. Treasury Note, 2 Year | | $ | 56,942,860 | | | $ | (45,453 | ) | |
12/2022 | | | 90 | | | Euro, 90 day | | | 22,264,875 | | | | (57,937 | ) | |
Total Long Positions | | | | | | $ | 79,207,735 | | | $ | (103,390 | ) | |
See Notes to Financial Statements
14
Schedule of Investments Short Duration Bond Portfolio^ (cont'd)
Short Futures:
Expiration Date | | Number of
Contracts | | Open Contracts | | Notional
Amount | | Value and
Unrealized
Appreciation/
(Depreciation) | |
3/2022 | | | 163 | | | U.S. Treasury Note, 5 Year | | $ | (19,719,180 | ) | | $ | (89,555 | ) | |
3/2022 | | | 25 | | | U.S. Treasury Note, 10 Year | | | (3,261,719 | ) | | | (38,281 | ) | |
3/2022 | | | 4 | | | U.S. Treasury Note, Ultra 10 Year | | | (585,750 | ) | | | (9,813 | ) | |
Total Short Positions | | | | | | $ | (23,566,649 | ) | | $ | (137,649 | ) | |
Total Futures | | | | | | | | $ | (241,039 | ) | |
At December 31, 2021, the Fund had $465,119 deposited in a segregated account to cover margin requirements on open futures.
For the year ended December 31, 2021, the average notional value for the months where the Fund had futures outstanding was $63,484,302 for long positions and $(24,191,421) for short positions.
The following is a summary, categorized by Level (see Note A of Notes to Financial Statements), of inputs used to value the Fund's investments as of December 31, 2021:
Asset Valuation Inputs | | Level 1 | | Level 2 | | Level 3 | | Total | |
Investments: | |
U.S. Treasury Obligations | | $ | — | | | $ | 716,147 | | | $ | — | | | $ | 716,147 | | |
Mortgage-Backed Securities(a) | | | — | | | | 34,591,511 | | | | — | | | | 34,591,511 | | |
Corporate Bonds(a) | | | — | | | | 55,204,774 | | | | — | | | | 55,204,774 | | |
Asset-Backed Securities | | | — | | | | 16,478,507 | | | | — | | | | 16,478,507 | | |
Exchange-Traded Funds | | | 2,767,807 | | | | — | | | | — | | | | 2,767,807 | | |
Short-Term Investments | | | — | | | | 2,258,527 | | | | — | | | | 2,258,527 | | |
Total Investments | | $ | 2,767,807 | | | $ | 109,249,466 | | | $ | — | | | $ | 112,017,273 | | |
(a) The Schedule of Investments provides information on the industry or sector categorization as well as a Positions by Country summary.
The following is a summary, categorized by Level (see Note A of Notes to Financial Statements), of inputs used to value the Fund's derivatives as of December 31, 2021:
Other Financial Instruments | | Level 1 | | Level 2 | | Level 3 | | Total | |
| Futures(a) | |
Liabilities | | $ | (241,039 | ) | | $ | — | | | $ | — | | | $ | (241,039 | ) | |
Total | | $ | (241,039 | ) | | $ | — | | | $ | — | | | $ | (241,039 | ) | |
(a) Futures are reported at the cumulative unrealized appreciation/(depreciation) of the instrument.
^ A balance indicated with a "—", reflects either a zero balance or an amount that rounds to less than 1.
See Notes to Financial Statements
15
Statement of Assets and Liabilities
Neuberger Berman Advisers Management Trust
| | | SHORT DURATION
BOND PORTFOLIO | |
| | | December 31, 2021 | |
Assets | |
Investments in securities, at value*† (Note A)—see Schedule of Investments: | |
| Unaffiliated issuers(a) | | $ | 112,017,273 | | |
Cash collateral segregated for futures contracts (Note A) | | | 465,119 | | |
Interest receivable | | | 631,877 | | |
Receivable for Fund shares sold | | | 205,076 | | |
Receivable for securities lending income (Note A) | | | 1,947 | | |
Prepaid expenses and other assets | | | 2,876 | | |
Total Assets | | | 113,324,168 | | |
Liabilities | |
Payable to investment manager (Note B) | | | 16,073 | | |
Payable for Fund shares redeemed | | | 14,462 | | |
Payable for accumulated variation margin on futures contracts (Note A) | | | 241,039 | | |
Payable to administrator—net (Note B) | | | 37,820 | | |
Payable for loaned securities collateral (Note A) | | | 1,446,618 | | |
Other accrued expenses and payables | | | 90,976 | | |
Total Liabilities | | | 1,846,988 | | |
Net Assets | | $ | 111,477,180 | | |
Net Assets consist of: | |
Paid-in capital | | $ | 136,286,808 | | |
Total distributable earnings/(losses) | | | (24,809,628 | ) | |
Net Assets | | $ | 111,477,180 | | |
Shares Outstanding ($.001 par value; unlimited shares authorized) | | | 10,642,158 | | |
Net Asset Value, offering and redemption price per share | | $ | 10.48 | | |
†Securities on loan, at value: | |
Unaffiliated issuers | | $ | 1,418,868 | | |
*Cost of Investments: | |
(a) Unaffiliated Issuers | | $ | 113,367,091 | | |
See Notes to Financial Statements
16
Neuberger Berman Advisers Management Trust
| | | SHORT DURATION
BOND PORTFOLIO | |
| | | For the
Fiscal Year Ended
December 31, 2021 | |
Investment Income: | |
Income (Note A): | |
Dividend income—unaffiliated issuers | | $ | 217,784 | | |
Interest and other income—unaffiliated issuers | | | 3,402,471 | | |
Income from securities loaned—net | | | 12,843 | | |
Total income | | $ | 3,633,098 | | |
Expenses: | |
Investment management fees (Note B) | | | 188,777 | | |
Administration fees (Note B) | | | 444,180 | | |
Shareholder servicing agent fees | | | 7,109 | | |
Audit fees | | | 51,172 | | |
Custodian and accounting fees | | | 81,760 | | |
Insurance | | | 3,230 | | |
Legal fees | | | 24,505 | | |
Shareholder reports | | | 30,578 | | |
Trustees' fees and expenses | | | 47,253 | | |
Interest | | | 895 | | |
Miscellaneous and other fees | | | 9,163 | | |
Total expenses | | | 888,622 | | |
Net investment income/(loss) | | $ | 2,744,476 | | |
Realized and Unrealized Gain/(Loss) on Investments (Note A): | |
Net realized gain/(loss) on: | |
Transactions in investment securities of unaffiliated issuers | | | 896,404 | | |
Expiration or closing of futures contracts | | | 281,087 | | |
Change in net unrealized appreciation/(depreciation) in value of: | |
Investment securities of unaffiliated issuers | | | (2,960,825 | ) | |
Futures contracts | | | (256,687 | ) | |
Net gain/(loss) on investments | | | (2,040,021 | ) | |
Net increase/(decrease) in net assets resulting from operations | | $ | 704,455 | | |
See Notes to Financial Statements
17
Statements of Changes in Net Assets
Neuberger Berman Advisers Management Trust
| | | SHORT DURATION
BOND PORTFOLIO | |
| | | Fiscal Year
Ended
December 31,
2021 | | Fiscal Year
Ended
December 31,
2020 | |
Increase/(Decrease) in Net Assets: | |
From Operations (Note A): | |
Net investment income/(loss) | | $ | 2,744,476 | | | $ | 2,314,134 | | |
Net realized gain/(loss) on investments | | | 1,177,491 | | | | (489,300 | ) | |
Change in net unrealized appreciation/(depreciation) of investments | | | (3,217,512 | ) | | | 1,273,414 | | |
Net increase/(decrease) in net assets resulting from operations | | | 704,455 | | | | 3,098,248 | | |
Distributions to Shareholders From (Note A): | |
Distributable earnings | | | (2,940,011 | ) | | | (2,399,936 | ) | |
From Fund Share Transactions (Note D): | |
Proceeds from shares sold | | | 27,040,918 | | | | 25,404,721 | | |
Proceeds from reinvestment of dividends and distributions | | | 2,940,011 | | | | 2,399,936 | | |
Payments for shares redeemed | | | (19,321,469 | ) | | | (32,484,510 | ) | |
Net increase/(decrease) from Fund share transactions | | | 10,659,460 | | | | (4,679,853 | ) | |
Net Increase/(Decrease) in Net Assets | | | 8,423,904 | | | | (3,981,541 | ) | |
Net Assets: | |
Beginning of year | | | 103,053,276 | | | | 107,034,817 | | |
End of year | | $ | 111,477,180 | | | $ | 103,053,276 | | |
See Notes to Financial Statements
18
Notes to Financial Statements Short Duration Bond Portfolio
Note A—Summary of Significant Accounting Policies:
1 General: Neuberger Berman Advisers Management Trust (the "Trust") is a Delaware statutory trust organized pursuant to an Amended and Restated Trust Instrument dated March 27, 2014. The Trust is registered as an open-end management investment company under the Investment Company Act of 1940, as amended (the "1940 Act"), and its shares are registered under the Securities Act of 1933, as amended. Neuberger Berman Advisers Management Trust Short Duration Bond Portfolio (the "Fund") is a separate operating series of the Trust and is diversified. The Fund currently offers only Class I shares. The Trust's Board of Trustees (the "Board") may establish additional series or classes of shares without the approval of shareholders.
A balance indicated with a "—", reflects either a zero balance or a balance that rounds to less than 1.
The assets of the Fund belong only to the Fund, and the liabilities of the Fund are borne solely by the Fund and no other series of the Trust.
The Fund is an investment company and accordingly follows the investment company accounting and reporting guidance of the Financial Accounting Standards Board ("FASB") Accounting Standards Codification ("ASC") Topic 946 "Financial Services—Investment Companies."
The preparation of financial statements in accordance with U.S. generally accepted accounting principles ("GAAP") requires Neuberger Berman Investment Advisers LLC ("Management" or "NBIA") to make estimates and assumptions at the date of the financial statements. Actual results could differ from those estimates.
Shares of the Fund are not available to the general public and may be purchased only by life insurance companies to serve as an investment vehicle for premiums paid under their variable annuity and variable life insurance contracts and to certain qualified pension and other retirement plans.
2 Portfolio valuation: In accordance with ASC 820 "Fair Value Measurement" ("ASC 820"), all investments held by the Fund are carried at the value that Management believes the Fund would receive upon selling an investment in an orderly transaction to an independent buyer in the principal or most advantageous market for the investment under current market conditions. Various inputs, including the volume and level of activity for the asset or liability in the market, are considered in valuing the Fund's investments, some of which are discussed below. Significant Management judgment may be necessary to value investments in accordance with ASC 820.
ASC 820 established a three-tier hierarchy of inputs to create a classification of value measurements for disclosure purposes. The three-tier hierarchy of inputs is summarized in the three broad Levels listed below.
• Level 1—unadjusted quoted prices in active markets for identical investments
• Level 2—other observable inputs (including quoted prices for similar investments, interest rates, prepayment speeds, credit risk, amortized cost, etc.)
• Level 3—unobservable inputs (including the Fund's own assumptions in determining the fair value of investments)
The inputs or methodology used for valuing an investment are not necessarily an indication of the risk associated with investing in those securities.
The value of the Fund's investments in exchange-traded funds ("ETFs"), for which market quotations are readily available, is generally determined by Management by obtaining valuations from independent pricing services based on the latest sale price quoted on a principal exchange or market for that Security (Level 1 inputs). Securities traded primarily on the NASDAQ Stock Market are normally valued at the NASDAQ Official Closing Price ("NOCP") provided by NASDAQ each business day. The NOCP is the most recently reported price as of 4:00:02 p.m., Eastern Time, unless that price is outside the range of the "inside" bid and asked prices (i.e., the bid and asked prices that
19
dealers quote to each other when trading for their own accounts); in that case, NASDAQ will adjust the price to equal the inside bid or asked price, whichever is closer. Because of delays in reporting trades, the NOCP may not be based on the price of the last trade to occur before the market closes. If there is no sale of a security on a particular day, the independent pricing services may value the security based on market quotations.
The value of the Fund's investments in debt securities is determined by Management primarily by obtaining valuations from independent pricing services based on readily available bid quotations, or if quotations are not available, by methods which include various considerations based on security type (generally Level 2 inputs). In addition to the consideration of yields or prices of securities of comparable quality, coupon, maturity and type, indications as to values from dealers, and general market conditions, the following is a description of other Level 2 inputs and related valuation techniques used by independent pricing services to value certain types of debt securities held by the Fund:
Corporate Bonds. Inputs used to value corporate debt securities generally include relevant credit information, observed market movements, sector news, U.S. Treasury yield curve or relevant benchmark curve, and other market information, which may include benchmark yield curves, reported trades, broker-dealer quotes, issuer spreads, comparable securities, and reference data, such as market research publications, when available ("Other Market Information").
U.S. Treasury Obligations. Inputs used to value U.S. Treasury securities generally include quotes from several inter-dealer brokers and Other Market Information.
Asset-Backed Securities and Mortgage-Backed Securities. Inputs used to value asset-backed securities and mortgage-backed securities generally include models that consider a number of factors, which may include the following: prepayment speeds, cash flows, spread adjustments and Other Market Information.
The value of futures contracts is determined by Management by obtaining valuations from independent pricing services at the settlement price at the market close (Level 1 inputs).
Management has developed a process to periodically review information provided by independent pricing services for all types of securities.
Investments in non-exchange traded investment companies with a readily determinable fair value are valued using the respective fund's daily calculated net asset value ("NAV") per share (Level 2 inputs).
If a valuation is not available from an independent pricing service, or if Management has reason to believe that the valuation received does not represent the amount the Fund might reasonably expect to receive on a current sale in an orderly transaction, Management seeks to obtain quotations from brokers or dealers (generally considered Level 2 or Level 3 inputs depending on the number of quotes available). If such quotations are not readily available, the security is valued using methods the Board has approved in the good-faith belief that the resulting valuation will reflect the fair value of the security. Inputs and assumptions considered in determining the fair value of a security based on Level 2 or Level 3 inputs may include, but are not limited to, the type of the security; the initial cost of the security; the existence of any contractual restrictions on the security's disposition; the price and extent of public trading in similar securities of the issuer or of comparable companies; quotations or evaluated prices from broker-dealers and/or pricing services; information obtained from the issuer and/or analysts; an analysis of the company's or issuer's financial statements; an evaluation of the inputs that influence the issuer and the market(s) in which the security is purchased and sold.
Fair value prices are necessarily estimates, and there is no assurance that such a price will be at or close to the price at which the security is next quoted or next trades.
In December 2020, the Securities and Exchange Commission ("SEC") adopted Rule 2a-5 under the 1940 Act, which establishes requirements for determining fair value in good faith for purposes of the 1940 Act, including related oversight and reporting requirements. The rule also defines when market quotations are "readily available" for purposes of the 1940 Act, which is the threshold for determining whether a fund must fair value a security. The
20
rule became effective on March 8, 2021, however, the SEC adopted an eighteen-month transition period beginning from the effective date. Management is currently evaluating the rule.
3 Foreign currency translations: The accounting records of the Fund are maintained in U.S. dollars. Foreign currency amounts are normally translated into U.S. dollars using the exchange rate as of 4:00 p.m. Eastern Time, on days the NYSE is open for business, to determine the value of investments, other assets and liabilities. Purchase and sale prices of securities, and income and expenses, are translated into U.S. dollars at the prevailing rate of exchange on the respective dates of such transactions. Net unrealized foreign currency gain/(loss), if any, arises from changes in the value of assets and liabilities, other than investments in securities, as a result of changes in exchange rates and is stated separately in the Statement of Operations.
4 Securities transactions and investment income: Securities transactions are recorded on trade date for financial reporting purposes. Dividend income is recorded on the ex-dividend date or, for certain foreign dividends, as soon as the Fund becomes aware of the dividends. Non-cash dividends included in dividend income, if any, are recorded at the fair market value of the securities received. Interest income, including accretion of discount (adjusted for original issue discount, where applicable) and amortization of premium, where applicable, is recorded on the accrual basis. Realized gains and losses from securities transactions and foreign currency transactions, if any, are recorded on the basis of identified cost and stated separately in the Statement of Operations. Included in net realized gain/(loss) on investments are proceeds from the settlement of class action litigation(s) in which the Fund participated as a class member. The amount of such proceeds for the year ended December 31, 2021, was $9,209.
5 Income tax information: The Fund is treated as a separate entity for U.S. federal income tax purposes. It is the policy of the Fund to continue to qualify for treatment as a regulated investment company ("RIC") by complying with the requirements of the U.S. Internal Revenue Code applicable to RICs and to distribute substantially all of its net investment income and net realized capital gains to its shareholders. To the extent the Fund distributes substantially all of its net investment income and net realized capital gains to shareholders, no federal income or excise tax provision is required.
The Fund has adopted the provisions of ASC 740 "Income Taxes" ("ASC 740"). ASC 740 sets forth a minimum threshold for financial statement recognition of a tax position taken, or expected to be taken, in a tax return. The Fund recognizes interest and penalties, if any, related to unrecognized tax positions as an income tax expense in the Statement of Operations. The Fund is subject to examination by U.S. federal and state tax authorities for returns filed for the tax years for which the applicable statutes of limitations have not yet expired. As of December 31, 2021, the Fund did not have any unrecognized tax positions.
For federal income tax purposes, the estimated cost of investments held at December 31, 2021 was $113,693,762. The estimated gross unrealized appreciation was $961,791 and estimated gross unrealized depreciation was $2,638,277 resulting in net unrealized depreciation in value of investments of $(1,676,486) based on cost for U.S. federal income tax purposes.
Income distributions and capital gain distributions are determined in accordance with income tax regulations, which may differ from GAAP. These differences are primarily due to differing treatments of income and gains on various investment securities held by the Fund, timing differences and differing characterization of distributions made by the Fund. The Fund may also utilize earnings and profits distributed to shareholders on redemption of their shares as a part of the dividends-paid deduction for income tax purposes.
Any permanent differences resulting from different book and tax treatment are reclassified at year-end and have no impact on net income, NAV or NAV per share of the Fund. For the year ended December 31, 2021, the Fund recorded permanent reclassifications related to prior year true up adjustments:
| Paid-in Capital | | Total
Distributable
Earnings/(Loss) | |
| | (138,249 | ) | | | 138,249 | | |
21
The tax character of distributions paid during the years ended December 31, 2021, and December 31, 2020, was as follows:
| | | Distributions Paid From: | |
| | | Ordinary Income | | Long-Term Capital Gain | | Total | |
| | | 2021 | | 2020 | | 2021 | | 2020 | | 2021 | | 2020 | |
| | | | | $ | 2,940,011 | | | $ | 2,399,936 | | | $ | — | | | $ | — | | | $ | 2,940,011 | | | $ | 2,399,936 | | |
As of December 31, 2021, the components of distributable earnings (accumulated losses) on a U.S. federal income tax basis were as follows:
Undistributed
Ordinary
Income | | Undistributed
Long-Term
Capital Gain | | Unrealized
Appreciation/
(Depreciation) | | Loss
Carryforwards
and Deferrals | | Other
Temporary
Differences | | Total | |
| $ | 3,373,896 | | | $ | — | | | $ | (1,676,487 | ) | | $ | (26,507,037 | ) | | $ | — | | | $ | (24,809,628 | ) | |
The temporary differences between book basis and tax basis distributable earnings are primarily due to losses disallowed and recognized on wash sales, amortization of bond premium and mark-to-market adjustments on futures.
To the extent the Fund's net realized capital gains, if any, can be offset by capital loss carryforwards, it is the policy of the Fund not to distribute such gains. Capital loss carryforward rules allow for RICs to carry forward capital losses indefinitely and to retain the character of capital loss carryforwards as short-term or long-term. As determined at December 31, 2021, the Fund had unused capital loss carryforwards available for federal income tax purposes to offset future net realized capital gains, if any, as follows:
Capital Loss Carryforwards | |
Long-Term | | Short-Term | |
$ | 23,846,906 | | | $ | 2,660,131 | | |
During the fiscal year ended December 31, 2021, the Fund utilized capital loss carryforwards of $515,446.
6 Distributions to shareholders: The Fund may earn income, net of expenses, daily on its investments. Distributions from net investment income and net realized capital gains, if any, are generally distributed once a year (usually in October) and are recorded on the ex-date.
7 Foreign taxes: Foreign taxes withheld, if any, represent amounts withheld by foreign tax authorities, net of refunds recoverable.
8 Expense allocation: Certain expenses are applicable to multiple funds within the complex of related investment companies. Expenses directly attributable to a fund are charged to that fund. Expenses of the Trust that are not directly attributable to a particular series of the Trust (e.g., the Fund) are allocated among the series of the Trust, on the basis of relative net assets, except where a more appropriate allocation of expenses to each of the series can otherwise be made fairly. Expenses borne by the complex of related investment companies, which includes open-end and closed-end investment companies for which NBIA serves as investment manager, that are not directly attributable to a particular investment company in the complex (e.g., the Trust) or series thereof are allocated among the investment companies in the complex or series thereof on the basis of relative net assets, except where a more appropriate allocation of expenses to each of the investment companies in the complex or series thereof can otherwise be made fairly.
9 Investments in foreign securities: Investing in foreign securities may involve sovereign and other risks, in addition to the credit and market risks normally associated with domestic securities. These additional risks include the possibility of adverse political and economic developments (including political instability, nationalization, expropriation, or confiscatory taxation) and the potentially adverse effects of unavailability of public information regarding issuers, less governmental supervision and regulation of financial markets, reduced liquidity of certain financial markets, and the lack of uniform accounting, auditing, and financial reporting standards or the
22
application of standards that are different or less stringent than those applied in the United States. Foreign securities also may experience greater price volatility, higher rates of inflation, and delays in settlement.
10 Investment company securities and exchange-traded funds: The Fund may invest in shares of other registered investment companies, including exchange-traded funds ("ETFs"), within the limitations prescribed by (a) the 1940 Act, (b) the exemptive order from the SEC that permits the Fund to invest in both affiliated and unaffiliated investment companies, including ETFs, in excess of the limits in Section 12(d)(1)(A) of the 1940 Act, subject to the terms and conditions of such order, or (c) the ETF's exemptive order or other relief. Some ETFs seek to track the performance of a particular market index. These indices include both broad-based market indices and more narrowly-based indices, including those relating to particular sectors, markets, regions or industries. However, some ETFs have an actively-managed investment objective. ETF shares are traded like traditional equity securities on a national securities exchange or NASDAQ. The Fund will indirectly bear its proportionate share of any management fees and other expenses paid by such other investment companies, which will decrease returns.
In October 2020, the SEC adopted Rule 12d1-4, which permits a fund to exceed the limits prescribed by Section 12 of the 1940 Act in the absence of an exemptive order, if the Fund complies with the adopted framework for fund of funds arrangements. Rule 12d1-4 contains elements from the SEC's current exemptive orders and rules permitting fund of funds arrangements, and includes (i) limits on control and voting; (ii) required evaluations and findings; (iii) required fund of funds investment agreements; and (iv) limits on complex structures. In connection with the new rule, on or about January 19, 2022, the SEC is expected to rescind the Fund's current exemptive order and Rule 12d1-2 under the 1940 Act. After this occurs, a fund seeking to exceed the limits in Section 12 of the 1940 Act will need to rely on Rule 12d1-4.
11 When-issued/delayed delivery securities: The Fund may purchase securities with delivery or payment to occur at a later date beyond the normal settlement period. At the time the Fund enters into a commitment to purchase a security, the transaction is recorded and the value of the security is reflected in the NAV. The price of such security and the date when the security will be delivered and paid for are fixed at the time the transaction is negotiated. The value of the security may vary with market fluctuations. No interest accrues to the Fund until payment takes place. At the time the Fund enters into this type of transaction it is required to segregate cash or other liquid assets at least equal to the amount of the commitment. When-issued and delayed delivery transactions can have a leverage-like effect on the Fund, which can increase fluctuations in the Fund's NAV. Certain risks may arise upon entering into when-issued or delayed delivery securities transactions from the potential inability of counterparties to meet the terms of their contracts or if the issuer does not issue the securities due to political, economic, or other factors. Additionally, losses may arise due to changes in the value of the underlying securities.
The Fund may also enter into a TBA agreement and "roll over" such agreement prior to the settlement date by selling the obligation to purchase the pools set forth in the agreement and entering into a new TBA agreement for future delivery of pools of mortgage-backed securities. TBA mortgage-backed securities may increase prepayment risks because the underlying mortgages may be less favorable than anticipated by the Fund.
12 Derivative instruments: The Fund's use of derivatives during the year ended December 31, 2021, is described below. Please see the Schedule of Investments for the Fund's open positions in derivatives, if any, at December 31, 2021. The Fund has adopted the provisions of ASC 815 "Derivatives and Hedging" ("ASC 815"). The disclosure requirements of ASC 815 distinguish between derivatives that qualify for hedge accounting and those that do not. Because investment companies value their derivatives at fair value and recognize changes in fair value through the Statement of Operations, they do not qualify for hedge accounting. Accordingly, even though the Fund's investments in derivatives may represent economic hedges, they are considered non-hedge transactions for purposes of this disclosure.
In October 2020, the SEC adopted new regulations governing the use of derivatives by registered investment companies. Rule 18f-4 will impose limits on the amount of derivatives a fund could enter into, eliminate the asset segregation framework currently used by funds to comply with Section 18 of the 1940 Act, and require funds whose use of derivatives is more than a limited specified exposure to establish and maintain a derivatives risk
23
management program and appoint a derivatives risk manager. While the new rule became effective February 19, 2021, funds will not be required to fully comply with the new rule until August 19, 2022. It is not currently clear what impact, if any, the new rule will have on the availability, liquidity or performance of derivatives. When fully implemented, the new rule may require changes in how the Fund will use derivatives, may adversely affect the Fund's performance and may increase costs related to the Fund's use of derivatives.
Futures contracts: During the year ended December 31, 2021, the Fund used U.S. Treasury and Eurodollar futures to manage the duration of the Fund.
At the time the Fund enters into a futures contract, it is required to deposit with the futures commission merchant a specified amount of cash or liquid securities, known as "initial margin," which is a percentage of the value of the futures contract being traded that is set by the exchange upon which the futures contract is traded. Each day, the futures contract is valued at the official settlement price of the board of trade or U.S. commodity exchange on which such futures contract is traded. Subsequent payments, known as "variation margin," to and from the broker are made on a daily basis, or as needed, as the market price of the futures contract fluctuates. Daily variation margin adjustments, arising from this "mark to market," are recorded by the Fund as unrealized gains or losses.
Although some futures by their terms call for actual delivery or acquisition of the underlying securities or currency, in most cases the contracts are closed out prior to delivery by offsetting purchases or sales of matching futures. When the contracts are closed or expire, the Fund recognizes a gain or loss. Risks of entering into futures contracts include the possibility there may be an illiquid market, possibly at a time of rapidly declining prices, and/or a change in the value of the contract may not correlate with changes in the value of the underlying securities. Futures executed on regulated futures exchanges have minimal counterparty risk to the Fund because the exchange's clearinghouse assumes the position of the counterparty in each transaction. Thus, the Fund is exposed to risk only in connection with the clearinghouse and not in connection with the original counterparty to the transaction.
For U.S. federal income tax purposes, the futures transactions undertaken by the Fund may cause the Fund to recognize gains or losses from marking contracts to market even though its positions have not been sold or terminated, may affect the character of the gains or losses recognized as long-term or short-term, and may affect the timing of some capital gains and losses realized by the Fund. Also, the Fund's losses on transactions involving futures contracts may be deferred rather than being taken into account currently in calculating the Fund's taxable income.
At December 31, 2021, the Fund had the following derivatives (which did not qualify as hedging instruments under ASC 815), grouped by primary risk exposure:
Liability Derivatives
Derivative Type | | Statement of
Assets and Liabilities
Location | | Interest
Rate Risk | | Total | |
Futures | | Receivable/Payable
for accumulated variation
margin on futures contracts | | $ | (241,039 | ) | | $ | (241,039 | ) | |
Total Value Liabilities | | | | $ | (241,039 | ) | | $ | (241,039 | ) | |
The impact of the use of these derivative instruments on the Statement of Operations during the year ended December 31, 2021, was as follows:
24
Realized Gain/(Loss)
Derivative Type | | Statement of
Operations Location | | Interest
Rate Risk | | Total | |
Futures | | Net realized gain/(loss)
on: Expiration or closing
of futures contracts | | $ | 281,087 |
| | $ | 281,087 |
| |
Total Realized Gain/(Loss) | | | | $ | 281,087 | | | $ | 281,087 | | |
Change in Appreciation/(Depreciation)
Derivative Type | | Statement of
Operations Location | | Interest
Rate Risk | | Total | |
Futures | | Change in net unrealized
appreciation/(depreciation)
in value of: Futures contracts | | $ | (256,687 | ) | | $ | (256,687 | ) | |
Total Change in Appreciation/(Depreciation) | | | | $ | (256,687 | ) | | $ | (256,687 | ) | |
13 Securities lending: The Fund, using State Street Bank and Trust Company ("State Street") as its lending agent, may loan securities to qualified brokers and dealers in exchange for negotiated lender's fees. These fees, if any, would be disclosed within the Statement of Operations under the caption "Income from securities loaned-net" and are net of expenses retained by State Street as compensation for its services as lending agent.
The initial cash collateral received by the Fund at the beginning of each transaction shall have a value equal to at least 102% of the prior day's market value of the loaned securities (105% in the case of international securities). Thereafter, the value of the cash collateral is monitored on a daily basis, and cash collateral is moved daily between a counterparty and the Fund until the close of the transaction. The Fund may only receive collateral in the form of cash (U.S. dollars). Cash collateral is generally invested in a money market fund registered under the 1940 Act that is managed by an affiliate of State Street. The risks associated with lending portfolio securities include, but are not limited to, possible delays in receiving additional collateral or in the recovery of the loaned securities. Any increase or decrease in the fair value of the securities loaned and any interest earned or dividends paid or owed on those securities during the term of the loan would accrue to the Fund.
As of December 31, 2021, the Fund had outstanding loans of securities to certain approved brokers, with a value of $1,418,868 for which it received collateral as follows:
| | | Remaining Contractual Maturity of the Agreements | |
| | | Overnight and
Continuous | | Less Than
30 Days | | Between
30 & 90 Days | | Greater Than
90 Days | | Total | |
Securities Lending Transactions(a) | |
Corporate Bonds | | $ | 1,446,618 | | | $ | — | | | $ | — | | | $ | — | | | $ | 1,446,618 | | |
(a) Amounts represent the payable for loaned securities collateral received.
The Fund is required to disclose both gross and net information for assets and liabilities related to over-the-counter derivatives, repurchase and reverse repurchase agreements, and securities lending and securities borrowing transactions, if any, that are eligible for offset or subject to an enforceable master netting or similar agreement. The Fund's securities lending assets at fair value are reported gross in the Statement of Assets and Liabilities. The following tables present the Fund's securities lending assets by counterparty, and net of the related collateral received by the Fund for assets as of December 31, 2021.
Description | | Gross Amounts of
Recognized Assets | | Gross Amounts
Offset in the
Statement of
Assets and
Liabilities | | Net Amounts of Assets Presented in the
Statement of Assets and Liabilities | |
Securities Lending | | $ | 1,418,868 | | | $ | — | | | $ | 1,418,868 | | |
Total | | $ | 1,418,868 | | | $ | — | | | $ | 1,418,868 | | |
25
Gross Amounts Not Offset in the Statement of Assets and Liabilities
Counterparty | | Net Amounts of
Assets Presented in
the Statement of
Assets and Liabilities | | Liabilities
Available
for Offset | | Cash Collateral
Received(a) | | Net Amount(b) | |
SSB | | $ | 1,418,868 | | | $ | — | | | $ | (1,418,868 | ) | | $ | — | | |
Total | | $ | 1,418,868 | | | $ | — | | | $ | (1,418,868 | ) | | $ | — | | |
(a) Collateral received is limited to an amount not to exceed 100% of the net amount of assets (or liabilities) in the tables presented above.
(b) Net Amount represents amounts subject to loss at December 31, 2021, in the event of a counterparty failure.
14 Indemnifications: Like many other companies, the Trust's organizational documents provide that its officers ("Officers") and trustees ("Trustees") are indemnified against certain liabilities arising out of the performance of their duties to the Trust. In addition, both in some of its principal service contracts and in the normal course of its business, the Trust enters into contracts that provide indemnifications to other parties for certain types of losses or liabilities. The Trust's maximum exposure under these arrangements is unknown as this could involve future claims against the Trust.
15 Other matters—Coronavirus: The outbreak of the novel coronavirus in many countries has, among other things, disrupted global travel and supply chains, and adversely impacted global commercial activity, the transportation industry and commodity prices in the energy sector. The impact of this virus has negatively affected and may continue to affect the economies of many nations, individual companies and the global securities and commodities markets, including liquidity and volatility. The development and fluidity of this situation precludes any prediction as to its ultimate impact, which may have a continued adverse effect on global economic and market conditions. Such conditions (which may be across industries, sectors or geographies) have impacted and may continue to impact certain issuers of the securities held by the Fund and in turn, may impact the financial performance of the Fund.
Note B—Investment Management Fees, Administration Fees, Distribution Arrangements, and Other Transactions with Affiliates:
The Fund retains NBIA as its investment manager under a Management Agreement. For such investment management services, the Fund pays NBIA an investment management fee at an annual rate of 0.17% of the first $2 billion of the Fund's average daily net assets and 0.15% of average daily net assets in excess of $2 billion. Accordingly, for the year ended December 31, 2021, the investment management fee pursuant to the Management Agreement was equivalent to an annual effective rate of 0.17% of the Fund's average daily net assets.
The Fund retains NBIA as its administrator under an Administration Agreement. The Fund pays NBIA an administration fee at the annual rate of 0.40% of its average daily net assets under this agreement. Additionally, NBIA retains State Street as its sub-administrator under a Sub-Administration Agreement. NBIA pays State Street a fee for all services received under the Sub-Administration Agreement.
NBIA has contractually agreed to waive fees and/or reimburse the Fund so that the total annual operating expenses do not exceed the expense limitation as detailed in the following table. This undertaking excludes interest, taxes, transaction costs, brokerage commissions, acquired fund fees and expenses, extraordinary expenses, and dividend and interest expenses relating to short sales, if any (commitment fees relating to borrowings are treated as interest for purposes of this exclusion) ("annual operating expenses"); consequently, net expenses may exceed the contractual expense limitation. The Fund has agreed that it will repay NBIA for fees and expenses waived or reimbursed provided that repayment does not cause the annual operating expenses to exceed its contractual expense limitation in place at the time the fees and expenses were waived or reimbursed, or the expense limitation in place at the time the Fund repays NBIA, whichever is lower. Any such repayment must be made within three years after the year in which NBIA incurred the expense.
26
During the year ended December 31, 2021, there was no repayment to NBIA under these agreements.
At December 31, 2021, the Fund had no contingent liabilities to NBIA under the agreement.
| | | | | | | Expenses Reimbursed in
Year Ended December 31, | |
| | | | | | | 2018 | | 2019 | | 2020 | |
| | | | | | | Subject to Repayment Until December 31, | |
Class | | Contractual
Expense
Limitation(a) | | Expiration | | 2021 | | 2022 | | 2023 | |
Class I | | | 0.95 | %(b) | | 12/31/24 | | $ | — | | | $ | — | | | $ | — | | |
(a) Expense limitation per annum of the Fund's average daily net assets.
(b) Prior to February 28, 2020, the contractual expense limitation was 1.00%.
Neuberger Berman BD LLC is the Fund's "principal underwriter" within the meaning of the 1940 Act. It acts as agent in arranging for the sale of the Fund's Class I shares without sales commission or other compensation and bears all advertising and promotion expenses incurred in the sale of those shares. The Board adopted a non-fee distribution plan for the Fund's Class I shares.
Note C—Securities Transactions:
During the year ended December 31, 2021, there were purchase and sale transactions of long-term securities (excluding futures) as follows:
Purchases of
U.S. Government
and Agency
Obligations | | Purchases excluding
U.S. Government
and Agency
Obligations | | Sales and Maturities
of U.S. Government
and Agency
Obligations | | Sales and Maturities
excluding
U.S. Government
and Agency
Obligations | |
| $ | 32,193,001 | | | $ | 80,891,282 | | | $ | 42,458,188 | | | $ | 54,061,230 | | |
Note D—Fund Share Transactions:
Share activity for the years ended December 31, 2021 and December 31, 2020, was as follows:
| | | For the Year Ended December 31, 2021 | | For the Year Ended December 31, 2020 | |
| | | Shares Sold | | Shares Issued on
Reinvestment of
Dividends and
Distributions | | Shares
Redeemed | | Total | | Shares Sold | | Shares Issued on
Reinvestment of
Dividends and
Distributions | | Shares
Redeemed | | Total | |
Class I | | | 2,518,948 | | | | 279,469 | | | | (1,801,877 | ) | | | 996,540 | | | | 2,426,694 | | | | 227,914 | | | | (3,137,858 | ) | | | (483,250 | ) | |
Note E—Line of Credit:
At December 31, 2021, the Fund was a participant in a syndicated committed, unsecured $700,000,000 line of credit (the "Credit Facility"), to be used only for temporary or emergency purposes. Series of other investment companies managed by NBIA also participate in this line of credit on substantially the same terms. Interest is charged on borrowings under this Credit Facility at the highest of (a) a federal funds effective rate plus 1.00% per annum, (b) a Eurodollar rate for a one-month period plus 1.00% per annum, and (c) an overnight bank funding rate plus 1.00% per annum; provided that should the Administrative Agent of the Credit Facility determine that the Eurodollar rate is unavailable, then the interest rate option described in (b) shall be replaced with a benchmark
27
replacement determined to be applicable by such Administrative Agent. The Credit Facility has an annual commitment fee of 0.15% per annum of the available line of credit, which is paid quarterly. The Fund has agreed to pay its pro rata share of the annual commitment fee, based on the ratio of its individual net assets to the net assets of all participants at the time the fee is due, and interest charged on any borrowing made by the Fund and other costs incurred by the Fund. Because several mutual funds participate in the Credit Facility, there is no assurance that the Fund will have access to all or any part of the $700,000,000 at any particular time. There were no loans outstanding under the Credit Facility at December 31, 2021. During the year ended December 31, 2021, the Fund did not utilize the Credit Facility.
Note F—Recent Accounting Pronouncement:
In January 2021, the FASB issued Accounting Standards Update No. 2021-01 ("ASU 2021-01"), "Reference Rate Reform (Topic 848)". ASU 2021-01 is an update of ASU 2020-04, which is in response to concerns about structural risks of interbank offered rates, and particularly the risk of cessation of LIBOR, regulators have undertaken reference rate reform initiatives to identify alternative reference rates that are more observable or transaction based and less susceptible to manipulation. ASU 2020-04 provides optional guidance for a limited period of time to ease the potential burden in accounting for (or recognizing the effects of) reference rate reform on financial reporting. ASU 2020-04 is elective and applies to all entities, subject to meeting certain criteria, that have contracts, hedging relationships, and other transactions that reference LIBOR or another reference rate expected to be discontinued because of reference rate reform. The ASU 2021-01 update clarifies that certain optional expedients and exceptions in Topic 848 for contract modifications and hedge accounting apply to derivatives that are affected by the discounting transition. The amendments in this update are effective immediately through December 31, 2022, for all entities. Management is currently evaluating the implications, if any, of the additional requirements and its impact on the Fund's financial statements.
28
Short Duration Bond Portfolio
The following table includes selected data for a share outstanding throughout each year and other performance information derived from the Financial Statements. Amounts that do not round to $0.01 or $(0.01) per share are presented as $0.00 or $(0.00), respectively. Ratios that do not round to 0.01% or (0.01)% are presented as 0.00% or (0.00)%, respectively. A "—" indicates that the line item was not applicable in the corresponding period.
Class I | |
| | | Year Ended December 31, | |
| | | 2021 | | 2020 | | 2019 | | 2018 | | 2017 | |
Net Asset Value, Beginning of Year | | $ | 10.68 | | | $ | 10.57 | | | $ | 10.40 | | | $ | 10.46 | | | $ | 10.52 | | |
Income From Investment Operations: | |
| Net Investment Income/(Loss)@ | | | 0.26 | | | | 0.24 | | | | 0.18 | | | | 0.14 | | | | 0.11 | | |
Net Gains or Losses on Securities
(both realized and unrealized) | | | (0.18 | ) | | | 0.12 | | | | 0.20 | | | | (0.03 | ) | | | (0.02 | ) | |
Total From Investment Operations | | | 0.08 | | | | 0.36 | | | | 0.38 | | | | 0.11 | | | | 0.09 | | |
Less Distributions From: | |
Net Investment Income | | | (0.28 | ) | | | (0.25 | ) | | | (0.21 | ) | | | (0.17 | ) | | | (0.15 | ) | |
Net Asset Value, End of Year | | $ | 10.48 | | | $ | 10.68 | | | $ | 10.57 | | | $ | 10.40 | | | $ | 10.46 | | |
| Total Return† | | | 0.74 | %^ | | | 3.46 | % | | | 3.69 | % ^ | | | 1.02 | %^ | | | 0.89 | %‡^ | |
Ratios/Supplemental Data | |
Net Assets, End of Year (in millions) | | $ | 111.5 | | | $ | 103.1 | | | $ | 107.0 | | | $ | 117.6 | | | $ | 131.6 | | |
| Ratio of Gross Expenses to Average Net Assets# | | | 0.80 | % | | | 0.86 | % | | | 0.88 | % | | | 0.87 | % | | | 0.85 | % | |
Ratio of Net Expenses to Average Net Assets | | | 0.80 | % | | | 0.86 | % | | | 0.88 | % | | | 0.87 | % | | | 0.75 | %ß | |
Ratio of Net Investment Income/(Loss) to Average
Net Assets | | | 2.47 | % | | | 2.26 | % | | | 1.69 | % | | | 1.34 | % | | | 1.03 | %ß | |
Portfolio Turnover Rate | | | 91 | % | | | 162 | % | | | 91 | % | | | 60 | % | | | 87 | % | |
See Notes to Financial Highlights
29
Notes to Financial Highlights Short Duration Bond Portfolio
@ Calculated based on the average number of shares outstanding during each fiscal period.
† Total return based on per share NAV reflects the effects of changes in NAV on the performance of the Fund during each fiscal period. Returns assume income dividends and other distributions, if any, were reinvested. Results represent past performance and do not indicate future results. Current returns may be lower or higher than the performance data quoted. Investment returns and principal will fluctuate and shares, when redeemed, may be worth more or less than original cost. The total return information shown does not reflect charges and other expenses that apply to the separate accounts or the related insurance policies or other qualified pension or retirement plans, and the inclusion of these charges and other expenses would reduce the total return for all fiscal periods shown.
^ The class action proceeds listed in Note A of the Notes to Financial Statements had no impact on the Fund's total returns for the year ended December 31, 2021. The class action proceeds received in 2019 and 2017 had no impact on the Fund's total return for the years ended December 31, 2019 and 2017, respectively. Had the Fund not received class action proceeds in 2018, total return based on per share NAV for the year ended December 31, 2018, would have been:
| | Year Ended
December 31,
2018 | |
Class I | | | 0.92 | % | |
‡ In May 2016, the Fund's custodian, State Street, announced that it had identified inconsistencies in the way in which the Fund was invoiced for categories of expenses, particularly those deemed "out-of-pocket" costs, from 1998 through November 2015, and refunded to the Fund certain expenses, plus interest, determined to be payable to the Fund for the period in question. These amounts were refunded to the Fund by State Street during the year ended December 31, 2017. These amounts had no impact on the Fund's total return for the year ended December 31, 2017.
# Represents the annualized ratios of net expenses to average daily net assets if Management had not reimbursed certain expenses and/or waived a portion of the investment management fee and/or if the Fund had not received refunds, plus interest, from State Street noted in ‡ above for custodian out-of-pocket expenses previously paid during the year ended December 31, 2017. Management did not reimburse or waive fees during the fiscal periods shown.
ß The custodian expenses refund noted in ‡ above is non-recurring and is included in these ratios. Had the Fund not received the refund, the annualized ratio of net expenses to average net assets and the annualized ratio of net investment income/(loss) to average net assets would have been:
| | Ratio of Net
Expenses to
Average Net
Assets
Year Ended
December 31, 2017 | | Ratio of Net
Investment
Income/(Loss)
to Average
Net Assets
Year Ended
December 31, 2017 | |
Class I | | | 0.85 | % | | | 0.92 | % | |
30
Report of Independent Registered Public Accounting Firm
To the Shareholders of
Neuberger Berman Advisers Management Trust Short Duration Bond Portfolio and
Board of Trustees of the Neuberger Berman Advisers Management Trust
Opinion on the Financial Statements
We have audited the accompanying statement of assets and liabilities of Neuberger Berman Advisers Management Trust Short Duration Bond Portfolio (the "Portfolio") (one of the portfolios constituting Neuberger Berman Advisers Management Trust (the "Trust")), including the schedule of investments, as of December 31, 2021, and the related statement of operations for the year then ended, the statements of changes in net assets for each of the two years in the period then ended, the financial highlights for each of the five years in the period then ended and the related notes (collectively referred to as the "financial statements"). In our opinion, the financial statements present fairly, in all material respects, the financial position of the Portfolio (one of the portfolios constituting Neuberger Berman Advisers Management) at December 31, 2021, the results of its operations for the year then ended, the changes in its net assets for each of the two years in the period then ended and its financial highlights for each of the five years in the period then ended, in conformity with U.S. generally accepted accounting principles.
Basis for Opinion
These financial statements are the responsibility of the Trust's management. Our responsibility is to express an opinion on the Portfolio's financial statements based on our audits. We are a public accounting firm registered with the Public Company Accounting Oversight Board (United States) ("PCAOB") and are required to be independent with respect to the Trust in accordance with the U.S. federal securities laws and the applicable rules and regulations of the Securities and Exchange Commission and the PCAOB.
We conducted our audits in accordance with the standards of the PCAOB. Those standards require that we plan and perform the audit to obtain reasonable assurance about whether the financial statements are free of material misstatement, whether due to error or fraud. The Trust is not required to have, nor were we engaged to perform, an audit of the Trust's internal control over financial reporting. As part of our audits, we are required to obtain an understanding of internal control over financial reporting, but not for the purpose of expressing an opinion on the effectiveness of the Trust's internal control over financial reporting. Accordingly, we express no such opinion.
Our audits included performing procedures to assess the risks of material misstatement of the financial statements, whether due to error or fraud, and performing procedures that respond to those risks. Such procedures included examining, on a test basis, evidence regarding the amounts and disclosures in the financial statements. Our procedures included confirmation of securities owned as of December 31, 2021, by correspondence with the custodian and brokers. Our audits also included evaluating the accounting principles used and significant estimates made by management, as well as evaluating the overall presentation of the financial statements. We believe that our audits provide a reasonable basis for our opinion.

We have served as the auditor of one or more Neuberger Berman investment companies since 1954.
Boston, Massachusetts
February 14, 2022
31
Trustee and Officer Information
The following tables set forth information concerning the Trustees and Officers of the Fund. All persons named as Trustees and Officers also serve in similar capacities for other funds administered or managed by Neuberger Berman Investment Advisers LLC ("NBIA"). The Fund's Statement of Additional Information includes additional information about the Trustees as of the time of the Fund's most recent public offering and is available upon request, without charge, by calling (800) 877-9700.
Information about the Board of Trustees
Name, (Year of Birth),
and Address(1) | | Position(s)
and Length of
Time Served(2) | | Principal Occupation(s)(3) | | Number of
Funds in Fund
Complex
Overseen by
Fund Trustee | | Other Directorships
Held Outside Fund
Complex by Fund
Trustee(3) | |
Independent Fund Trustees | |
Michael J. Cosgrove (1949) | | Trustee since 2015 | | President, Carragh Consulting USA, since 2014; formerly, Executive, General Electric Company, 1970 to 2014, including President, Mutual Funds and Global Investment Programs, GE Asset Management, 2011 to 2014, President and Chief Executive Officer, Mutual Funds and Intermediary Business, GE Asset Management, 2007 to 2011, President, Institutional Sales and Marketing, GE Asset Management, 1998 to 2007, and Chief Financial Officer, GE Asset Management, and Deputy Treasurer, GE Company, 1988 to 1993. | |
| 47 |
| | Director, America Press, Inc. (not-for-profit Jesuit publisher), since 2015; formerly, Director, Fordham University, 2001 to 2018; formerly, Director, The Gabelli Go Anywhere Trust, June 2015 to June 2016; formerly, Director, Skin Cancer Foundation (not-for-profit), 2006 to 2015; formerly, Director, GE Investments Funds, Inc., 1997 to 2014; formerly, Trustee, GE Institutional Funds, 1997 to 2014; formerly, Director, GE Asset Management, 1988 to 2014; formerly, Director, Elfun Trusts, 1988 to 2014; formerly, Trustee, GE Pension & Benefit Plans, 1988 to 2014; formerly, Member of Board of Governors, Investment Company Institute. | |
32
Name, (Year of Birth),
and Address(1) | | Position(s)
and Length of
Time Served(2) | | Principal Occupation(s)(3) | | Number of
Funds in Fund
Complex
Overseen by
Fund Trustee | | Other Directorships
Held Outside Fund
Complex by Fund
Trustee(3) | |
Marc Gary (1952) | | Trustee since 2015 | | Executive Vice Chancellor and Chief Operating Officer, Jewish Theological Seminary, since 2012; formerly, Executive Vice President and General Counsel, Fidelity Investments, 2007 to 2012; formerly, Executive Vice President and General Counsel, BellSouth Corporation, 2004 to 2007; formerly, Vice President and Associate General Counsel, BellSouth Corporation, 2000 to 2004; formerly, Associate, Partner, and National Litigation Practice Co-Chair, Mayer, Brown LLP, 1981 to 2000; formerly, Associate Independent Counsel, Office of Independent Counsel, 1990 to 1992. | |
| 47 |
| | Director, UJA Federation of Greater New York, since 2019; Trustee, Jewish Theological Seminary, since 2015; Director, Legility, Inc. (privately held for-profit company), since 2012; Director, Lawyers Committee for Civil Rights Under Law (not-for-profit), since 2005; formerly, Director, Equal Justice Works (not-for-profit), 2005 to 2014; formerly, Director, Corporate Counsel Institute, Georgetown University Law Center, 2007 to 2012; formerly, Director, Greater Boston Legal Services (not-for-profit), 2007 to 2012. | |
33
Name, (Year of Birth),
and Address(1) | | Position(s)
and Length of
Time Served(2) | | Principal Occupation(s)(3) | | Number of
Funds in Fund
Complex
Overseen by
Fund Trustee | | Other Directorships
Held Outside Fund
Complex by Fund
Trustee(3) | |
Martha C. Goss (1949) | | Trustee since 2007 | | President, Woodhill Enterprises Inc./Chase Hollow Associates LLC (personal investment vehicle), since 2006; formerly, Consultant, Resources Global Professionals (temporary staffing), 2002 to 2006; formerly, Chief Financial Officer, Booz-Allen & Hamilton, Inc., 1995 to 1999; formerly, Enterprise Risk Officer, Prudential Insurance, 1994 to1995; formerly, President, Prudential Asset Management Company, 1992 to 1994; formerly, President, Prudential Power Funding (investments in electric and gas utilities and alternative energy projects), 1989 to 1992; formerly, Treasurer, Prudential Insurance Company, 1983 to 1989. | |
| 47 |
| | Director, American Water (water utility), since 2003; Director, Allianz Life of New York (insurance), since 2005; Director, Berger Group Holdings, Inc. (engineering consulting firm), since 2013; Director, Financial Women's Association of New York (not-for-profit association), since 2003; Trustee Emerita, Brown University, since 1998; Director, Museum of American Finance (not-for-profit), since 2013; formerly, Non-Executive Chair and Director, Channel Reinsurance (financial guaranty reinsurance), 2006 to 2010; formerly, Director, Ocwen Financial Corporation (mortgage servicing), 2005 to 2010; formerly, Director, Claire's Stores, Inc. (retailer), 2005 to 2007; formerly, Director, Parsons Brinckerhoff Inc. (engineering consulting firm), 2007 to 2010; formerly, Director, Bank Leumi (commercial bank), 2005 to 2007; formerly, Advisory Board Member, Attensity (software developer), 2005 to 2007. | |
34
Name, (Year of Birth),
and Address(1) | | Position(s)
and Length of
Time Served(2) | | Principal Occupation(s)(3) | | Number of
Funds in Fund
Complex
Overseen by
Fund Trustee | | Other Directorships
Held Outside Fund
Complex by Fund
Trustee(3) | |
Michael M. Knetter (1960) | | Trustee since 2007 | | President and Chief Executive Officer, University of Wisconsin Foundation, since 2010; formerly, Dean, School of Business, University of Wisconsin—Madison; formerly, Professor of International Economics and Associate Dean, Amos Tuck School of Business—Dartmouth College, 1998 to 2002. | |
| 47 |
| | Director, 1 William Street Credit Income Fund, since 2018; Board Member, American Family Insurance (a mutual company, not publicly traded), since March 2009; formerly, Trustee, Northwestern Mutual Series Fund, Inc., 2007 to 2011; formerly, Director, Wausau Paper, 2005 to 2011; formerly, Director, Great Wolf Resorts, 2004 to 2009. | |
Deborah C. McLean (1954) | | Trustee since 2015 | | Member, Circle Financial Group (private wealth management membership practice), since 2011; Managing Director, Golden Seeds LLC (an angel investing group), since 2009; Adjunct Professor, Columbia University School of International and Public Affairs, since 2008; formerly, Visiting Assistant Professor, Fairfield University, Dolan School of Business, Fall 2007; formerly, Adjunct Associate Professor of Finance, Richmond, The American International University in London, 1999 to 2007. | |
| 47 |
| | Board member, Norwalk Community College Foundation, since 2014; Dean's Advisory Council, Radcliffe Institute for Advanced Study, since 2014; formerly, Director and Treasurer, At Home in Darien (not-for-profit), 2012 to 2014; formerly, Director, National Executive Service Corps (not-for-profit), 2012 to 2013; formerly, Trustee, Richmond, The American International University in London, 1999 to 2013. | |
35
Name, (Year of Birth),
and Address(1) | | Position(s)
and Length of
Time Served(2) | | Principal Occupation(s)(3) | | Number of
Funds in Fund
Complex
Overseen by
Fund Trustee | | Other Directorships
Held Outside Fund
Complex by Fund
Trustee(3) | |
George W. Morriss (1947) | | Trustee since 2007 | | Adjunct Professor, Columbia University School of International and Public Affairs, since 2012; formerly, Executive Vice President and Chief Financial Officer, People's United Bank, Connecticut (a financial services company), 1991 to 2001. | |
| 47 |
| | Director, 1 William Street Credit Income Fund, since 2018; Director and Chair, Thrivent Church Loan and Income Fund, since 2018; formerly, Trustee, Steben Alternative Investment Funds, Steben Select Multi-Strategy Fund, and Steben Select Multi-Strategy Master Fund, 2013 to 2017; formerly, Treasurer, National Association of Corporate Directors, Connecticut Chapter, 2011 to 2015; formerly, Manager, Larch Lane Multi-Strategy Fund complex (which consisted of three funds), 2006 to 2011; formerly, Member, NASDAQ Issuers' Affairs Committee, 1995 to 2003. | |
Tom D. Seip (1950) | | Trustee since 2000; Chairman of the Board since 2008; formerly Lead Independent Trustee from 2006 to 2008 | | Formerly, Managing Member, Ridgefield Farm LLC (a private investment vehicle), 2004 to 2016; formerly, President and CEO, Westaff, Inc. (temporary staffing), May 2001 to January 2002; formerly, Senior Executive, The Charles Schwab Corporation, 1983 to 1998, including Chief Executive Officer, Charles Schwab Investment Management, Inc.; Trustee, Schwab Family of Funds and Schwab Investments, 1997 to 1998; and Executive Vice President-Retail Brokerage, Charles Schwab & Co., Inc., 1994 to 1997. | |
| 47 |
| | Formerly, Director, H&R Block, Inc. (tax services company), 2001 to 2018; formerly, Director, Talbot Hospice Inc., 2013 to 2016; formerly, Chairman, Governance and Nominating Committee, H&R Block, Inc., 2011 to 2015; formerly, Chairman, Compensation Committee, H&R Block, Inc., 2006 to 2010; formerly, Director, Forward Management, Inc. (asset management company), 1999 to 2006. | |
36
Name, (Year of Birth),
and Address(1) | | Position(s)
and Length of
Time Served(2) | | Principal Occupation(s)(3) | | Number of
Funds in Fund
Complex
Overseen by
Fund Trustee | | Other Directorships
Held Outside Fund
Complex by Fund
Trustee(3) | |
James G. Stavridis (1955) | | Trustee since 2015 | | Operating Executive, The Carlyle Group, since 2018; Commentator, NBC News, since 2015; formerly, Dean, Fletcher School of Law and Diplomacy, Tufts University, 2013 to 2018; formerly, Admiral, United States Navy, 1976 to 2013, including Supreme Allied Commander, NATO and Commander, European Command, 2009 to 2013, and Commander, United States Southern Command, 2006 to 2009. | |
| 47 |
| | Director, American Water (water utility), since 2018; Director, NFP Corp. (insurance broker and consultant), since 2017; Director, U.S. Naval Institute, since 2014; Director, Onassis Foundation, since 2014; Director, BMC Software Federal, LLC, since 2014; Director, Vertical Knowledge, LLC, since 2013; formerly, Director, Navy Federal Credit Union, 2000-2002. | |
37
Name, (Year of Birth),
and Address(1) | | Position(s)
and Length of
Time Served(2) | | Principal Occupation(s)(3) | | Number of
Funds in Fund
Complex
Overseen by
Fund Trustee | | Other Directorships
Held Outside Fund
Complex by Fund
Trustee(3) | |
Fund Trustees who are "Interested Persons" | |
Joseph V. Amato* (1962) | | Chief Executive Officer and President since 2018 and Trustee since 2009 | | President and Director, Neuberger Berman Group LLC, since 2009; President and Chief Executive Officer, Neuberger Berman BD LLC and Neuberger Berman Holdings LLC (including its predecessor, Neuberger Berman Inc.), since 2007; Chief Investment Officer (Equities) and President (Equities), NBIA (formerly, Neuberger Berman Fixed Income LLC and including predecessor entities), since 2007, and Board Member of NBIA since 2006; formerly, Global Head of Asset Management of Lehman Brothers Holdings Inc.'s ("LBHI") Investment Management Division, 2006 to 2009; formerly, member of LBHI's Investment Management Division's Executive Management Committee, 2006 to 2009; formerly, Managing Director, Lehman Brothers Inc. ("LBI"), 2006 to 2008; formerly, Chief Recruiting and Development Officer, LBI, 2005 to 2006; formerly, Global Head of LBI's Equity Sales and a Member of its Equities Division Executive Committee, 2003 to 2005; President and Chief Executive Officer, eleven registered investment companies for which NBIA acts as investment manager and/or administrator. | |
| 47 |
| | Member of Board of Advisors, McDonough School of Business, Georgetown University, since 2001; Member of New York City Board of Advisors, Teach for America, since 2005; Trustee, Montclair Kimberley Academy (private school), since 2007; Member of Board of Regents, Georgetown University, since 2013. | |
(1) The business address of each listed person is 1290 Avenue of the Americas, New York, New York 10104.
38
(2) Pursuant to the Trust's Amended and Restated Trust Instrument, subject to any limitations on the term of service imposed by the By-Laws or any retirement policy adopted by the Fund Trustees, each Fund Trustee shall hold office for life or until his or her successor is elected or the Trust terminates; except that (a) any Fund Trustee may resign by delivering a written resignation; (b) any Fund Trustee may be removed with or without cause at any time by a written instrument signed by at least two-thirds of the other Fund Trustees; (c) any Fund Trustee who requests to be retired, or who has become unable to serve, may be retired by a written instrument signed by a majority of the other Fund Trustees; and (d) any Fund Trustee may be removed at any shareholder meeting by a vote of at least two-thirds of the outstanding shares.
(3) Except as otherwise indicated, each individual has held the positions shown during at least the last five years.
* Indicates a Fund Trustee who is an "interested person" within the meaning of the 1940 Act. Mr. Amato is an interested person of the Trust by virtue of the fact that he is an officer of NBIA and/or its affiliates.
39
Information about the Officers of the Trust
Name, (Year of Birth),
and Address(1) | | Position(s)
and Length of
Time Served(2) | | Principal Occupation(s)(3) | |
Claudia A. Brandon (1956) | | Executive Vice President since 2008 and Secretary since 1985 | | Senior Vice President, Neuberger Berman, since 2007 and Employee since 1999; Senior Vice President, NBIA, since 2008 and Assistant Secretary since 2004; formerly, Vice President, Neuberger Berman, 2002 to 2006; formerly, Vice President—Mutual Fund Board Relations, NBIA, 2000 to 2008; formerly, Vice President, NBIA, 1986 to 1999 and Employee, 1984 to 1999; Executive Vice President and Secretary, thirty registered investment companies for which NBIA acts as investment manager and/or administrator. | |
Agnes Diaz (1971) | | Vice President since 2013 | | Senior Vice President, Neuberger Berman, since 2012; Senior Vice President, NBIA, since 2012 and Employee since 1996; formerly, Vice President, Neuberger Berman, 2007 to 2012; Vice President, eleven registered investment companies for which NBIA acts as investment manager and/or administrator. | |
Anthony DiBernardo (1979) | | Assistant Treasurer since 2011 | | Senior Vice President, Neuberger Berman, since 2014; Senior Vice President, NBIA, since 2014, and Employee since 2003; formerly, Vice President, Neuberger Berman, 2009 to 2014; Assistant Treasurer, eleven registered investment companies for which NBIA acts as investment manager and/or administrator. | |
Savonne L. Ferguson (1973) | | Chief Compliance Officer since 2018 | | Senior Vice President, Chief Compliance Officer (Mutual Funds) and Associate General Counsel, NBIA, since November 2018; formerly, Vice President T. Rowe Price Group, Inc. (2018), Vice President and Senior Legal Counsel, T. Rowe Price Associates, Inc. (2014-2018), Vice President and Director of Regulatory Fund Administration, PNC Capital Advisors, LLC (2009-2014), Secretary, PNC Funds and PNC Advantage Funds (2010-2014); Chief Compliance Officer, thirty registered investment companies for which NBIA acts as investment manager and/or administrator. | |
Corey A. Issing (1978) | | Chief Legal Officer since 2016 (only for purposes of sections 307 and 406 of the Sarbanes-Oxley Act of 2002) | | General Counsel—Mutual Funds since 2016 and Managing Director, NBIA, since 2017; formerly, Associate General Counsel (2015 to 2016), Counsel (2007 to 2015), Senior Vice President (2013-2016), Vice President (2009-2013); Chief Legal Officer (only for purposes of sections 307 and 406 of the Sarbanes-Oxley Act of 2002), thirty registered investment companies for which NBIA acts as investment manager and/or administrator. | |
Sheila R. James (1965) | | Assistant Secretary since 2002 | | Vice President, Neuberger Berman, since 2008 and Employee since 1999; Vice President, NBIA, since 2008; formerly, Assistant Vice President, Neuberger Berman, 2007; Employee, NBIA, 1991 to 1999; Assistant Secretary, thirty registered investment companies for which NBIA acts as investment manager and/or administrator. | |
40
Name, (Year of Birth),
and Address(1) | | Position(s)
and Length of
Time Served(2) | | Principal Occupation(s)(3) | |
Brian Kerrane (1969) | | Chief Operating Officer since 2015 and Vice President since 2008 | | Managing Director, Neuberger Berman, since 2013; Chief Operating Officer—Mutual Funds and Managing Director, NBIA, since 2015; formerly, Senior Vice President, Neuberger Berman, 2006 to 2014; Vice President, NBIA, 2008 to 2015 and Employee since 1991; Chief Operating Officer, eleven registered investment companies for which NBIA acts as investment manager and/or administrator; Vice President, thirty registered investment companies for which NBIA acts as investment manager and/or administrator. | |
Anthony Maltese (1959) | | Vice President since 2015 | | Senior Vice President, Neuberger Berman, since 2014 and Employee since 2000; Senior Vice President, NBIA, since 2014; Vice President, eleven registered investment companies for which NBIA acts as investment manager and/or administrator. | |
Josephine Marone (1963) | | Assistant Secretary since 2017 | | Senior Paralegal, Neuberger Berman, since 2007 and Employee since 2007; Assistant Secretary, thirty registered investment companies for which NBIA acts as investment manager and/or administrator. | |
Owen F. McEntee, Jr. (1961) | | Vice President since 2008 | | Vice President, Neuberger Berman, since 2006; Vice President, NBIA, since 2006 and Employee since 1992; Vice President, eleven registered investment companies for which NBIA acts as investment manager and/or administrator. | |
John M. McGovern (1970) | | Treasurer and Principal Financial and Accounting Officer since 2005 | | Senior Vice President, Neuberger Berman, since 2007; Senior Vice President, NBIA, since 2007 and Employee since 1993; formerly, Vice President, Neuberger Berman, 2004 to 2006; formerly, Assistant Treasurer, 2002 to 2005; Treasurer and Principal Financial and Accounting Officer, eleven registered investment companies for which NBIA acts as investment manager and/or administrator. | |
Frank Rosato (1971) | | Assistant Treasurer since 2005 | | Vice President, Neuberger Berman, since 2006; Vice President, NBIA, since 2006 and Employee since 1995; Assistant Treasurer, eleven registered investment companies for which NBIA acts as investment manager and/or administrator. | |
Niketh Velamoor (1979) | | Anti-Money Laundering Compliance Officer since 2018 | | Senior Vice President and Associate General Counsel, Neuberger Berman, since July 2018; Assistant United States Attorney, Southern District of New York, 2009 to 2018; Anti-Money Laundering Compliance Officer, four registered investment companies for which NBIA acts as investment manager and/or administrator. | |
(1) The business address of each listed person is 1290 Avenue of the Americas, New York, New York 10104.
(2) Pursuant to the By-Laws of the Trust, each officer elected by the Fund Trustees shall hold office until his or her successor shall have been elected and qualified or until his or her earlier death, inability to serve, or resignation. Officers serve at the pleasure of the Fund Trustees and may be removed at any time with or without cause.
(3) Except as otherwise indicated, each individual has held the positions shown during at least the last five years.
41
Proxy Voting Policies and Procedures
A description of the policies and procedures that the Trust uses to determine how to vote proxies relating to portfolio securities is available, without charge, by calling 800-877-9700 (toll-free) and on the SEC's website, at www.sec.gov. Information regarding how the Trust voted proxies relating to portfolio securities during the most recent 12-month period ended June 30 is also available upon request, without charge, by calling 800-877-9700 (toll-free), on the SEC's website at www.sec.gov, and on Neuberger Berman's website at www.nb.com.
Quarterly Portfolio Schedule
The Trust files a complete schedule of portfolio holdings with the SEC for the first and third quarters of each fiscal year as an exhibit to its report on Form N-PORT. The Trust's Form N-PORT is available on the SEC's website at www.sec.gov. The portfolio holdings information on Form N-PORT is available upon request, without charge, by calling 800-877-9700 (toll free).
Board Consideration of the Management Agreement
On an annual basis, the Board of Trustees (the "Board" or "Trustees") of Neuberger Berman Advisers Management Trust (the "Trust"), including the Trustees who are not "interested persons" of the Trust or of Neuberger Berman Investment Advisers LLC ("Management") (including its affiliates), as such term is defined under the Investment Company Act of 1940, as amended ("1940 Act"), ("Independent Fund Trustees"), considers whether to continue the management agreement with Management (the "Agreement") with respect to Short Duration Bond Portfolio (the "Fund"). Throughout the process, the Independent Fund Trustees are advised by counsel that is experienced in 1940 Act matters and that is independent of Management ("Independent Counsel"). At a meeting held on October 21, 2021, the Board, including the Independent Fund Trustees, approved the continuation of the Agreement for the Fund.
In evaluating the Agreement, the Board, including the Independent Fund Trustees, reviewed extensive materials provided by Management in response to questions submitted by the Independent Fund Trustees and Independent Counsel, and met with senior representatives of Management regarding its personnel, operations, and profitability as they relate to the Fund. The annual contract review extends over at least two regular meetings of the Board to ensure that Management has time to respond to any questions the Independent Fund Trustees may have on their initial review of the materials and that the Independent Fund Trustees have time to consider those responses. Additionally, the Board considered the impact of significant market volatility that occurred during and after the period for which information was requested in conducting its evaluation of Management.
In connection with its deliberations, the Board also considered the broad range of information relevant to the annual contract review that is provided to the Board (including its various standing committees) at meetings throughout the year, including reports on investment performance, portfolio risk, liquidity management, and other portfolio information for the Fund, including the use of derivatives, as well as periodic reports on, among other matters, pricing and valuation; quality and cost of portfolio trade execution; compliance; and shareholder and other services provided by Management and its affiliates. The Contract Review Committee, which is comprised of Independent Fund Trustees, was established by the Board to assist in its evaluation and analysis of materials for the annual contract review. The Board has also established other committees that focus throughout the year on specific areas relevant to the annual contract review, such as Fund performance or compliance matters, and that are charged with specific responsibilities regarding the annual contract review. Those committees provide reports to the full Board, including the members of the Contract Review Committee, which consider that information as part of the annual contract review process. The Board's Contract Review Committee annually considers and updates the questions it asks of Management in light of legal advice furnished to it by Independent Counsel; its own business judgment; and developments in the industry, in the markets, in mutual fund regulation and litigation, and in Management's business model.
The Independent Fund Trustees received from Independent Counsel a memorandum discussing the legal standards for their consideration of the proposed continuation of the Agreement. During the course of the year and during their
42
deliberations regarding the annual contract review, the Contract Review Committee and the Independent Fund Trustees met with Independent Counsel separately from representatives of Management.
Provided below is a description of the Board's contract approval process and material factors that the Board considered at its meetings regarding renewal of the Agreement and the compensation to be paid thereunder. In connection with its approval of the continuation of the Agreement, the Board evaluated the terms of the Agreement, the overall fairness of the Agreement to the Fund, and whether the Agreement was in the best interests of the Fund and its shareholders. The Board's determination to approve the continuation of the Agreement was based on a comprehensive consideration of all information provided to the Board throughout the year and specifically in connection with the annual contract review. The Board considered the Fund's investment management agreement separately from those of other funds of the Trust.
This description is not intended to include all of the factors considered by the Board. The Board members did not identify any particular information or factor that was all-important or controlling, and each Trustee may have attributed different weights to the various factors. The Board focused on the costs and benefits of the Agreement to the Fund and, through the Fund, its shareholders.
Nature, Extent, and Quality of Services
With respect to the nature, extent, and quality of the services provided, the Board considered the investment philosophy and decision-making processes of, and the qualifications, experience, and capabilities of, and the resources available to, the portfolio management personnel of Management who perform services for the Fund. The Board noted that Management also provides certain administrative services, including fund accounting and compliance services. The Board also considered Management's policies and practices regarding trade execution, transaction costs, and allocation of portfolio transactions and reviewed the quality of the execution services that Management had provided. Moreover, the Board considered Management's approach to potential conflicts of interest both generally and between the Fund's investments and those of other funds or accounts managed by Management. The Board also noted that Management had increased its capabilities with respect to environmental, social, and corporate governance matters and considered how those factors may relate to investment performance. The Board noted the additional responsibilities of Management in administering the liquidity risk management program.
The Board recognized the extensive range of services that Management provides to the Fund beyond the investment management services. The Board noted that Management is also responsible for monitoring compliance with the Fund's investment objectives, policies, and restrictions, as well as compliance with applicable law, including implementing rulemaking initiatives of the U.S. Securities and Exchange Commission. The Board considered that Management assumes significant ongoing entrepreneurial and business risks as the investment adviser and sponsor for the Fund, for which it is entitled to reasonable compensation. The Trustees also considered that Management's responsibilities include continual management of investment, operational, enterprise, legal, regulatory, and compliance risks as they relate to the Fund, and the Board considers on a regular basis information regarding Management's processes for monitoring and managing risk. In addition, the Board also noted that when Management launches a new fund or share class, it assumes entrepreneurial risk with respect to that fund or share class, and that some funds and share classes have been liquidated without ever having been profitable to Management.
The Board also reviewed and evaluated Management's activities under its contractual obligation to oversee the Fund's various outside service providers, including its renegotiation of certain service providers' fees and its evaluation of service providers' infrastructure, cybersecurity programs, compliance programs, and business continuity programs, among other matters. The Board also considered Management's ongoing development of its own infrastructure and information technology to support the Fund through, among other things, cybersecurity, business continuity planning, and risk management. The Board noted Management's largely seamless implementation of its business continuity plan in response to the COVID-19 pandemic and its success in continuously providing services to the Fund notwithstanding the disruptions caused by the pandemic. In addition, the Board noted the positive compliance history of Management, as no significant compliance problems were reported to the Board with respect to Management. The Board also considered the general structure of the portfolio managers' compensation and whether this structure provides appropriate incentives to
43
act in the best interests of the Fund. The Board also considered the ability of Management to attract and retain qualified personnel to service the Fund.
As in past years, the Board also considered the manner in which Management addressed various matters that arose during the year, some of them a result of developments in the broader fund industry or the regulations governing it. In addition, the Board considered actions taken by Management in response to recent market conditions, such as changes in fixed-income market liquidity and the economic dislocation and rise in volatility that accompanied shutdowns related to the efforts to stem the spread of COVID-19, and considered the overall performance of Management in this context.
Fund Performance
The Board requested a report from an outside consulting firm that specializes in the analysis of fund industry data that compared the Fund's performance, along with its fees and other expenses, to a group of industry peers ("Expense Group") and to a broader universe of funds pursuing generally similar strategies with the same investment classification and/or objective ("Performance Universe"). The Expense Group and Performance Universe were composed of two types of funds: proprietary funds that are operated by insurance companies or their affiliates, and non-proprietary funds, such as the Fund, operated for insurance company investors by independent investment managers. The Board considered the Fund's performance and fees in light of the limitations inherent in the methodology for constructing such comparative groups and determining which investment companies should be included in the comparative groups, noting differences as compared to certain fund industry ranking and rating systems. The Board also considered the impact and inherent limitation on the comparisons due to the small number of funds included in the Fund's Expense Group and Performance Universe.
With respect to investment performance, the Board considered information regarding the Fund's short-, intermediate- and long-term performance, net of the Fund's fees and expenses, on an absolute basis, relative to a benchmark index that does not deduct the fees or expenses of investing, and compared to the performance of the Expense Group and Performance Universe, each constructed by the consulting firm. The Board also reviewed performance in relation to certain measures of the degree of investment risk undertaken by the portfolio managers.
The Performance Universe referenced in this section was identified by the consulting firm, as discussed above. For any period of underperformance, the Board considered the magnitude and duration of that underperformance relative to the Performance Universe, and/or the benchmark (e.g., the amount by which a Fund underperformed, including, for example, whether the Fund slightly underperformed or significantly underperformed its benchmark).
With respect to performance quintile rankings for the Fund compared to its Performance Universe, the first quintile represents the highest (best) performance and the fifth quintile represents the lowest performance.
The Board considered that, based on performance data for the periods ended December 31, 2020: (1) as compared to its benchmark, the Fund's performance was higher for the 1- and 10-year periods and lower for the 3- and 5-year periods; and (2) as compared to its Performance Universe, the Fund's performance was in the second quintile for the 1-year period, the third quintile for the 3- and 10-year periods, and the fourth quintile for the 5-year period. The Board noted the Fund's outperformance versus its benchmark during the 7-month period ending July 31, 2021. The Board also noted the Fund's ranking was in the first quintile of its Lipper peer category and in the second quintile of its Morningstar peer category for the 7-month period ending July 31, 2021.
Noting that the Fund underperformed over certain periods, the Board discussed with Management the Fund's performance, potential reasons for the relative performance, and, if necessary, steps that Management had taken, or intended to take, to improve performance. The Board recognized that the performance data reflects a snapshot of a period as of a particular date and that selecting a different performance period could produce significantly different results. The Board further acknowledged that long-term performance could be impacted by even one period of significant outperformance or underperformance, and that a single investment theme could disproportionately affect performance. The Board also considered Management's responsiveness to the Fund's relative performance. In this regard, the Board noted that performance, especially short-term performance, is only one of the factors that it deems
44
relevant to its consideration of the Agreement and that, after considering all relevant factors, it determined to approve the continuation of the Agreement notwithstanding the Fund's relative performance.
Fee Rates, Profitability, and Fall-out Benefits
With respect to the overall fairness of the Agreement, the Board considered the fee structure for the Fund under the Agreement as compared to the Expense Group provided by the consulting firm, as discussed above. The Board reviewed a comparison of the Fund's management fee to its Expense Group. The Board noted that the comparative management fee analysis includes, in the Fund's management fee, the separate administrative fees paid to Management. However, the Board noted that some funds in the Expense Group pay directly from fund assets for certain services that Management covers out of the administration fees for the Fund. Accordingly, the Board also considered the Fund's total expense ratio as compared with its Expense Group as a way of taking account of these differences.
The Board compared the Fund's contractual and actual management fees to the median of the contractual and actual management fees, respectively, of the Fund's Expense Group. (The actual management fees are the contractual management fees reduced by any fee waivers or other adjustments.) The Board also compared the Fund's total expenses to the median of the total expenses of the Fund's Expense Group. The Board noted that the Fund's actual management fee and total expenses were higher than the Expense Group median, and considered whether specific portfolio management, administration or oversight needs contributed to the Fund's actual management fee and total expenses. With respect to the quintile rankings for fees and total expenses (net of waivers or other adjustments, if any) for the Fund compared to its Expense Group, the first quintile represents the lowest fees and/or total expenses and the fifth quintile represents the highest fees and/or total expenses.
The Board considered that, as compared to its Expense Group, the Fund's contractual management fee, the actual management fee, and total expenses each ranked in the fifth quintile. The Board also took into account that in 2020 Management reduced the Fund's expense limitation, added a new Portfolio Manager, and made changes to the Fund's investment strategy. In addition to considering the above-referenced factors, the Board took note of its ongoing dialogue with Management regarding the dynamics of the insurance/annuity marketplace. The Board considered, among other matters, tax-related restrictions and the unique challenges facing that market generally, which assisted the Board in understanding the context for the Fund's expense ratio and performance.
In concluding that the benefits accruing to Management and its affiliates by virtue of their relationship with the Fund were reasonable in light of the costs of providing the investment advisory and other services and the benefits accruing to the Fund, the Board reviewed specific data as to Management's estimated loss on the Fund for a recent period on a pre-tax basis without regard to distribution expenses, including year-over-year changes in each of Management's reported expense categories. (The Board also reviewed data on Management's estimated loss on the Fund after distribution/servicing expenses and taxes were factored in, as indicators of the health of the business and the extent to which Management is directing its profits into the growth of the business.) The Board considered the cost allocation methodology that Management used in developing its estimated profitability figures. In recent years, the Board engaged an independent forensic accountant to review the profitability methodology utilized by Management when preparing this information and discussed with the consultant its conclusion that Management's process for calculating and reporting its estimated loss was not unreasonable.
Recognizing that there is no uniform methodology regarding the allocation of firm-wide or complex-wide expenses within the asset management industry for determining profitability for this purpose and that the use of different reasonable methodologies can give rise to different profit and loss results, the Board, in recent years, requested from Management examples of profitability calculated by different methods and noted that the estimated profitability levels were still reasonable when calculated by these other methods. The Board further noted Management's representation that its estimate of profitability is derived using methodology that is consistent with the methodology used to assess and/or report measures of profitability elsewhere at the firm. In addition, the Board recognized that Management's calculations regarding its costs may not reflect all risks, including regulatory, legal, operational, reputational, and, where appropriate, entrepreneurial risks, associated with offering and managing a mutual fund in the current regulatory and
45
market environment. The Board also considered any fall-out (i.e., indirect) benefits likely to accrue to Management or its affiliates from their relationship with the Fund. The Board noted that Management incurred a loss on its management of the Fund during the review period even before consideration of distribution expenses and taxes.
Information Regarding Services to Other Clients
The Board also considered other funds and separate accounts that were advised or sub-advised by Management or its affiliates with investment objectives, policies and strategies that were similar to those of the Fund, and compared the fees charged to the Fund to the fees charged to such comparable funds and separate accounts. The Board considered the appropriateness and reasonableness of any differences between the fees charged to a Fund and such comparable funds and/or separate accounts, and determined that differences in fees and fee structures were consistent with the differences in the management and other services provided. The Board explored with Management its assertion that although, generally, the rates of fees paid by such accounts, except other Neuberger Berman mutual funds, were lower than the fee rates paid by the corresponding Fund, the differences reflected Management's greater level of responsibilities and significantly broader scope of services regarding the Fund, the more extensive regulatory obligations and risks associated with managing the Fund, and other financial considerations with respect to creation and sponsorship of the Fund.
Economies of Scale
The Board also evaluated apparent or anticipated economies of scale in relation to the services Management provides to the Fund. The Board considered whether the Fund's fee structure provides for a reduction of payments resulting from the use of breakpoints, the size of any breakpoints in the Fund's advisory fees, and whether any such breakpoints are set at appropriate asset levels. The Board also compared the breakpoint structure to that of the Expense Group. In addition, the Board considered the expense limitation and/or fee waiver arrangements that reduces Fund expenses at all asset levels which can have an effect similar to breakpoints in sharing economies of scale with shareholders and provide protection from an increase in expenses if the Fund's assets decline. The Board also considered that Management has provided, at no added cost to the Fund, certain additional services, including but not limited to, services required by new regulations or regulatory interpretations, services impelled by changes in the securities markets or the business landscape, and/or services requested by the Board. The Board considered that this is a way of sharing economies of scale with the Fund and its shareholders.
Conclusions
In approving the continuation of the Agreement, the Board concluded that, in its business judgment, the terms of the Agreement are fair and reasonable to the Fund and that approval of the continuation of the Agreement is in the best interests of the Fund and its shareholders. In reaching this determination, the Board considered that Management could be expected to continue to provide a high level of service to the Fund; that the performance of the Fund was satisfactory over time; that the Board retained confidence in Management's capabilities to manage the Fund; that the Fund's fee structure appeared to the Board to be reasonable given the nature, extent, and quality of services provided; and that the benefits accruing to Management and its affiliates by virtue of their relationship with the Fund were reasonable in light of the costs of providing the investment advisory and other services and the benefits accruing to the Fund. The Board's conclusions may be based in part on its consideration of materials prepared in connection with the approval or continuance of the Agreement in prior years and on the Board's ongoing regular review of Fund performance and operations throughout the year, in addition to material prepared specifically for the most recent annual review of the Agreement.
Liquidity Risk Management Program
Consistent with Rule 22e-4 under the Investment Company Act of 1940 (the "Liquidity Rule"), as amended, the Fund has established a liquidity risk management program (the "Program"). The Program seeks to assess and manage the Fund's
46
liquidity risk, which is defined as the risk that a Fund is unable to meet investor redemption requests without significantly diluting the remaining investors' interests in a Fund. The Board has approved the designation of NBIA Funds' Liquidity Committee, comprised of NBIA employees, as the program administrator (the "Program Administrator"). The Program Administrator is responsible for implementing and monitoring the Program and utilizes NBIA personnel to assess and review, on an ongoing basis, the Fund's liquidity risk.
The Program includes a number of elements that support the management and assessment of liquidity risk, including an annual assessment of the Fund's liquidity risk factors and the periodic classification (or re-classification, as necessary) of the Fund's investments into buckets (highly liquid, moderately liquid, less liquid and illiquid) that reflect the Program Administrator's assessment of the investments' liquidity under current market conditions. The Program Administrator also utilizes information about the Fund's investment strategy, the characteristics of the Fund's shareholder base and historical redemption activity.
The Program Administrator provided the Board with a written report that addressed the operation of the Program and assessed its adequacy and effectiveness of implementation from April 1, 2020 through March 31, 2021. During the period covered by this report, the Program Administrator reported that the Program effectively assisted the Program Administrator in monitoring whether a Fund maintained a level of liquidity appropriate for its shareholder base and historical redemption activity.
47