Joseph V. Amato
Lori L. Schneider, Esq.
1601 K Street, N.W.
Washington, D.C. 20006-1600
Form N-CSR is to be used by management investment companies to file reports with the Commission not later than 10 days after the transmission to stockholders of any report that is required to be transmitted to stockholders under Rule 30e-1 under the Investment Company Act of 1940, as amended (“Act”) (17 CFR 270.30e-1). The Commission may use the information provided on Form N-CSR in its regulatory, disclosure review, inspection, and policymaking roles.
A registrant is required to disclose the information specified by Form N-CSR, and the Commission will make this information public. A registrant is not required to respond to the collection of information contained in Form N-CSR unless the Form displays a currently valid Office of Management and Budget (“OMB”) control number. Please direct comments concerning the accuracy of the information collection burden estimate and any suggestions for reducing the burden to the Secretary, Securities and Exchange Commission, 100 F Street, NE, Washington, DC 20549-1090. The OMB has reviewed this collection of information under the clearance requirements of 44 U.S.C. §3507.
Item 1. Report to Shareholders.
(a) Following are copies of the annual reports transmitted to shareholders pursuant to Rule 30e-1 under the Act.

Neuberger Berman
Advisers Management Trust
U.S. Equity Index PutWrite Strategy Portfolio
S Class Shares
Annual Report
December 31, 2022
U.S. Equity Index PutWrite Strategy Portfolio Commentary (Unaudited)
The Neuberger Berman Advisers Management Trust U.S. Equity Index PutWrite Strategy Portfolio (the Fund) Class S generated a total return of –11.28% for the year ended December 31, 2022 (the reporting period), underperforming its benchmark, a blend consisting of 50% Cboe S&P 500 One-Week PutWrite Index and 50% Cboe S&P 500 PutWrite Index (collectively, the Index), which posted a total return of –10.94% for the same period.
On February 28, 2022, the Fund began comparing its performance to the Index rather than the 42.5% Cboe S&P 500 One-Week PutWrite Index/42.5% Cboe S&P 500 PutWrite Index/7.5% Cboe Russell 2000 One-Week PutWrite Index/7.5% Cboe Russell 2000 PutWrite Index, because the Index has characteristics that are more representative of the Fund's investment strategy than its previous index. From the close of February 28, 2022 (the effective date of the change) through the end of the reporting period, the Fund returned –6.08%, outperforming the Index, which returned –9.36%. For the entire reporting period, the Fund returned –11.28%, underperforming the prior index, which returned –11.25% for the same period.
Despite another 1.25% of tightening from the U.S. Federal Reserve Board of Governors over the 4th quarter, financial markets tried to salvage 2022 with broad gains. However, despite the holiday rebounds, the S&P 500® Index ended 2022 squarely in negative double-digits with a return of –18.11%. To paint the year with a single statistic, 2022 had the most +/– 8% monthly returns than any year since 1937. Equity index putwrite indexes performed as designed and finished the year well ahead of their underlying equity index exposures. Specifically, the Cboe S&P 500 PutWrite Index (PUT) declined a more modest –7.66%, having benefited from a few 'lucky' monthly option rolls. Fixed income markets suffered a similar fate as equity markets for the year with the Bloomberg U.S. Aggregate Bond Index and the Bloomberg U.S. Corporate High Yield Bond Index realizing losses of –13.01% and –11.19%, respectively. Short-term U.S. Treasury index returns weathered the inflation storm with the ICE BofA 3-Month U.S. Treasury Bill Index posting an attractive 1.46% for the year with 0.84% accruing in the 4th quarter. The slightly longer duration ICE BofA 1-3 Year U.S. Treasury Index rose 0.74% in the quarter but remained in negative territory for the year at –3.65%, only the second negative calendar year since 1978. This 2022 performance differential of 511 basis points was the most notable headwind for our portfolio's relative performance as passive option strategy indexes generally hold 1- to 3-month U.S. T-Bills as collateral.
In general, the Fund performed in line with expectations for 2022. Yet, unprecedented interest rate increases in 2022 proved to create a modest relative performance challenge versus option strategy indexes. We had reduced the duration of the Fund's collateral portfolio to approximately one year by the end of 2021, but any duration exposure was a detractor in 2022. Importantly, the 2022 performance dispersion between short-dated U.S. Treasury securities accounted for basically all of the Fund's underperformance versus the PUT Index which holds U.S. T-Bills as collateral. The good news is that collateral portfolio losses suffered in 2022 are largely marked-to-market in nature and discounted U.S. Treasury bond positions should recover to their full values (par values) at maturity. Over the reporting period, the Fund's S&P 500 putwriting strategy and the collateral portfolio detracted from overall Fund performance. Meanwhile, weekly putwriting, as measured by the Cboe S&P 500 One-Week PutWrite (WPUT), fell a material –14.25%, and the Cboe S&P 500 BuyWrite Index (BXM) tumbled –11.37%. Over the same period, the collateral portfolio modestly declined and finished behind the T-Bill Index return of 1.46%. During the reporting period, there were no positive contributors to Fund performance.
1
During the first quarter of 2022, the Fund adjusted its average option notional exposure from the strategic target of 85% S&P 500 Index and 15% Russell 2000® Index to 100% S&P 500 Index. We believe the U.S. small cap public equity universe is evolving into a less productive investment opportunity for several reasons, including:
• Private equity capital has grown to material levels over the last two decades.
• With increased demand to find investments, many private investors are holding investments until they reach larger market capitalizations than they have in the past.
• New investment vehicles such as Special Acquisition Corporations (SPACs) acquire or merge with smaller companies, that results in the companies' dropping out of small cap indices.
• Some small cap indices are relatively concentrated in a few names.
• Retail investors have the potential to influence smaller company prices and create 'meme' stocks that may have an outsized effect on small cap index performance.
We believe the challenges facing public U.S. small cap equities have contributed to the erosion in the risk efficiency of a Russell 2000 Index putwrite strategy relative to a S&P 500 Index putwrite strategy. Hence, as of February 28, 2022, we have removed the Russell 2000 equity exposure from the Fund. We believe this adjustment has the potential to result in a reduction in strategy volatility levels and an overall increased level of risk efficiency.
With the annual cycle of financial and economic prognostication upon us, we believe the next decade looks far more challenging than the last as investors face a combination of risks not seen in our careers, if ever. Specifically, investors face a 'dirty dozen': higher interest rates, aging demographics, polarized politics, uncertain inflation, pandemic policies, ESG regulation (social taxation), energy/commodity insecurity, decentralized finance (DeFi), climate disasters, social media (conspiracies), decreasing financial liquidity, and armed conflicts (war has many modern names). In our view, each of these factors has the potential to impact global economic outcomes in the coming decade, but it's impossible to handicap what combinations will emerge as the key economic drivers/influences. Regardless, we believe their confluence will lead to an unprecedented equity market volatility landscape characterized by less cyclical implied volatility levels that remain 'higher for longer.' The Cboe S&P 500 Volatility Index (VIX) continues to price higher equity market risk levels and resists returning to below long-term average levels. With increased levels of implied volatility over the course of the year, implied volatility premiums were positive in three out of four quarters and averaged 1.42 for the full reporting period. Lastly, VIX futures markets seem to agree with our expectations that 2023 will experience persistent elevated levels of equity implied volatility.
Sincerely,
DEREK DEVENS AND RORY EWING
PORTFOLIO MANAGERS
Information about principal risks of investing in the Fund is set forth in the prospectus and statement of additional information.
The portfolio composition, industries and holdings of the Fund are subject to change without notice.
The opinions expressed are those of the Fund's portfolio managers. The opinions are as of the date of this report and are subject to change without notice.
2
U.S. Equity Index PutWrite Strategy Portfolio (Unaudited)
PORTFOLIO BY TYPE OF INVESTMENT
(as a % of Total Net Assets) | |
Common Stocks | | | 0.0 | % | |
Rights | | | 0.0 | | |
U.S. Government Agency Securities | | | 71.6 | | |
U.S. Treasury Obligations | | | 23.7 | | |
Put Options Written | | | (2.0 | ) | |
Short-Term Investments | | | 6.3 | | |
Other Assets Less Liabilities | | | 0.4 | | |
Total | | | 100.0 | % | |
PERFORMANCE HIGHLIGHTS1
| | | | Average Annual Total Return
Ended 12/31/2022 | |
| | Inception
Date | | 1 Year | | 5 Years | | Life of
Fund | |
Class S* | | 05/01/2014 | | | –11.28 | % | | | 4.01 | % | | | 2.36 | % | |
50% Cboe S&P 500 One-Week
PutWrite Index/50% Cboe
S&P 500 PutWrite Index^2,3 | | | | | –10.94 | % | | | 0.92 | % | | | 3.19 | % | |
42.5% Cboe S&P 500 One-Week
PutWrite Index/42.5% Cboe
S&P 500 PutWrite Index/7.5% Cboe
Russell 2000 One-Week PutWrite
Index/7.5% Cboe Russell 2000
PutWrite Index2,3 | | | | | –11.25 | % | | | 0.07 | % | | | 2.58 | % | |
| S&P 500® Index2,3 | | | | | –18.11 | % | | | 9.42 | % | | | 10.64 | % | |
* Prior to May 1, 2017, the Fund had different investment goals, fees and expenses, principal investment strategies and portfolio managers. Please also see Endnote 1.
^ On February 28, 2022, the Fund began comparing its performance to the 50% Cboe S&P 500 One-Week PutWrite Index/50% Cboe S&P 500 PutWrite Index rather than the 42.5% Cboe S&P 500 One-Week PutWrite Index/42.5% Cboe S&P 500 PutWrite Index/7.5% Cboe Russell 2000 One-Week PutWrite Index/7.5% Cboe Russell 2000 PutWrite Index because the 50% Cboe S&P 500 One-Week PutWrite Index/50% Cboe S&P 500 PutWrite Index has characteristics that are more representative of the Fund's investment strategy than its previous index.
The performance data quoted represent past performance and do not indicate future results. Current performance may be lower or higher than the performance data quoted. For current performance data, including current to the most recent month-end, please visit http://www.nb.com/amtportfolios/performance.
The results shown in the table reflect the reinvestment of income dividends and other distributions, if any. The results do not reflect the effect of taxes a shareholder would pay on Fund distributions or on the redemption of Fund shares. The results do not reflect fees and expenses of the variable annuity and variable life insurance policies or the qualified pension and retirement plans whose proceeds are invested in the Fund.
The investment return and principal value of an investment will fluctuate and shares, when redeemed, may be worth more or less than their original cost.
Returns would have been lower if Neuberger Berman Investment Advisers LLC ("NBIA") had not reimbursed certain expenses and/or waived a portion of the investment management fees during certain of the periods shown. Repayment by a class (of expenses previously reimbursed and/or fees previously waived by NBIA) will decrease the class's returns. Please see Note B in the Notes to Financial Statements for specific information regarding expense reimbursement and/or fee waiver arrangements.
As stated in the Fund's most recent prospectus, the total annual operating expense ratio for fiscal year 2021 was 1.53% for Class S shares (before expense reimbursements and/or fee waivers, if any). The expense ratio was 1.06% for Class S shares after expense reimbursements and/or fee waivers. The expense ratios for the annual period ended December 31, 2022 can be found in the Financial Highlights section of this report.
3
U.S. Equity Index PutWrite Strategy Portfolio (Unaudited)
COMPARISON OF A $10,000 INVESTMENT
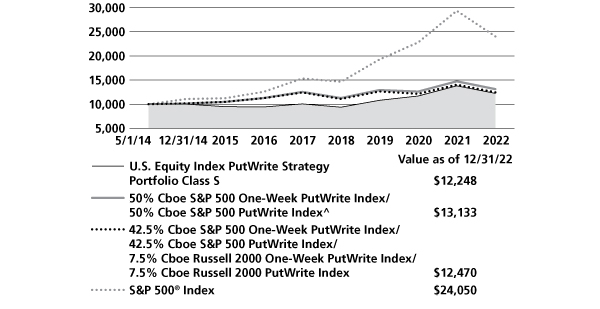
This graph shows the change in value of a hypothetical $10,000 investment in the Fund over the past 10 fiscal years, or since the Fund's inception if it has not operated for 10 years. The result is compared with benchmarks, which include a broad-based market index and may include a more narrowly based index. Market indices described in this report do not take into account any fees, expenses or tax consequences of investing in the individual securities that they track. The results shown in the graph reflect the reinvestment of income dividends and other distributions, if any. The results do not reflect the effect of taxes a shareholder would pay on Fund distributions or on the redemption of Fund shares. The results do not reflect fees and expenses of the variable annuity and variable life insurance policies or the qualified pension and retirement plans whose proceeds are invested in the Fund. Results represent past performance and do not indicate future results.
^ On February 28, 2022, the Fund began comparing its performance to the 50% Cboe S&P 500 One-Week PutWrite Index/50% Cboe S&P 500 PutWrite Index rather than the 42.5% Cboe S&P 500 One-Week PutWrite Index/42.5% Cboe S&P 500 PutWrite Index/7.5% Cboe Russell 2000 One-Week PutWrite Index/7.5% Cboe Russell 2000 PutWrite Index because the 50% Cboe S&P 500 One-Week PutWrite Index/50% Cboe S&P 500 PutWrite Index has characteristics that are more representative of the Fund's investment strategy than its previous index.
Please see Endnotes for additional information.
4
1 The Fund was relatively small prior to December 31, 2014, which could have impacted Fund performance. The same techniques used to produce returns in a small fund may not work to produce similar returns in a larger fund. Effective May 1, 2017, Absolute Return Multi-Manager Portfolio changed its name to the U.S. Equity Index PutWrite Strategy Portfolio and changed its investment goal, fees and expenses, principal investment strategies, risks and portfolio manager(s). Prior to that date, the Fund had a higher management fee, different expenses, a different goal and principal investment strategies, which included a multi-manager strategy, and different risks. Its performance prior to that date might have been different if the current fees and expenses, goal, and principal investment strategies had been in effect.
2 The date used to calculate Life of Fund performance for the index is May 1, 2014, the Fund's commencement of operations.
3 The 50% Cboe S&P 500 One-Week PutWrite Index/50% Cboe S&P 500 PutWrite Index is a blended index composed of 50% Cboe S&P 500 One-Week PutWrite Index/50% Cboe S&P 500 PutWrite Index, and is rebalanced monthly. The 42.5% Cboe S&P 500 One-Week PutWrite Index/42.5% Cboe S&P 500 PutWrite Index/7.5% Cboe Russell 2000 One-Week PutWrite Index/7.5% Cboe Russell 2000 PutWrite Index is a blended index composed of 42.5% Cboe S&P 500 One-Week PutWrite Index/42.5% Cboe S&P 500 PutWrite Index/7.5% Cboe Russell 2000 One-Week PutWrite Index/7.5% Cboe Russell 2000 PutWrite Index, and is rebalanced monthly. The Cboe S&P 500 One-Week PutWrite Index is designed to track the performance of a hypothetical strategy that sells an at-the-money (ATM) S&P 500® Index (SPX) put option on a weekly basis. The maturity of the written SPX put option is one week to expiry. The written SPX put option is collateralized by a money market account invested in one month Treasury bills. The index rolls on a weekly basis, typically every Friday. The Cboe S&P 500 PutWrite Index (PUT) is designed to represent a proposed hypothetical short put strategy. PUT is an award-winning benchmark index that measures the performance of a hypothetical portfolio that sells SPX put options against collateralized cash reserves held in a money market account. The PUT strategy is designed to sell a sequence of one-month, ATM SPX puts and invest cash at one- and three-month Treasury Bill rates. The Cboe Russell 2000 One-Week PutWrite Index is designed to track the performance of a hypothetical strategy that sells an ATM Russell 2000 Index put option on a weekly basis. The maturity of the written Russell 2000 put option is one week to expiry. The written Russell 2000 put option is collateralized by a money market account invested in one-month Treasury bills. The index rolls on a weekly basis, typically every Friday. The Cboe Russell 2000 PutWrite Index is designed to represent a proposed hypothetical short put strategy that sells a monthly ATM Russell 2000 Index put option. The written Russell 2000 put option is collateralized by a money market account invested in one-month Treasury bills. The S&P 500 Index is a float-adjusted market capitalization weighted index that focuses on the large-cap segment of the U.S. equity market, and includes a significant portfolio of the total value of the market. Please note that individuals cannot invest directly in any index. The indices described in this report do not take into account any fees, expenses or tax consequences of investing in the individual securities that they track. Data about the performance of an index are prepared or obtained by Neuberger Berman Investment Advisers LLC and reflect the reinvestment of income dividends and other distributions, if any. The Fund may invest in securities not included in a described index and generally does not invest in all securities included in a described index.
5
Endnotes (Unaudited) (cont'd)
The investments for the Fund are managed by the same portfolio manager(s) who manage one or more other registered funds that have names, investment objectives and investment styles that are similar to those of the Fund. You should be aware that the Fund is likely to differ from those other mutual fund(s) in size, cash flow pattern and tax matters. Accordingly, the holdings and performance of the Fund can be expected to vary from those of the other mutual fund(s).
Shares of the separate Neuberger Berman Advisers Management Trust Portfolios, including the Fund, are not available to the general public. Shares of the Fund may be purchased only by life insurance companies to be held in their separate accounts, which fund variable annuity and variable life insurance policies, and by qualified pension and retirement plans. Statistics and projections in this report are derived from sources deemed to be reliable but cannot be regarded as a representation of future results of the Fund. This report is prepared for the general information of shareholders and is not an offer of shares of the Fund. Shares are sold only through the currently effective prospectus, which must precede or accompany this report.
The "Neuberger Berman" name and logo and "Neuberger Berman Investment Advisers LLC" name are registered service marks of Neuberger Berman Group LLC. The individual Fund name in this piece is either a service mark or registered service mark of Neuberger Berman Investment Advisers LLC, an affiliate of Neuberger Berman BD LLC, distributor, member FINRA.
© 2023 Neuberger Berman BD LLC, distributor. All rights reserved.
6
Information About Your Fund's Expenses (Unaudited)
As a Fund shareholder, you incur two types of costs: (1) transaction costs such as fees and expenses that are, or may be, imposed under your variable contract or qualified pension plan; and (2) ongoing costs, including management fees, distribution and/or service (12b-1) fees (if applicable), and other Fund expenses. This example is intended to help you understand your ongoing costs (in U.S. dollars) of investing in the Fund and compare these costs with the ongoing costs of investing in other mutual funds.
This table is designed to provide information regarding costs related to your investments. The following examples are based on an investment of $1,000 made at the beginning of the six month period ended December 31, 2022 and held for the entire period. The table illustrates the Fund's costs in two ways:
Actual Expenses and Performance: | | The first section of the table provides information about actual account values and actual expenses in dollars, based on the Fund's actual performance during the period indicated. You may use the information in this line, together with the amount you invested, to estimate the expenses you paid over the period. Simply divide your account value by $1,000 (for example, an $8,600 account value divided by $1,000 = 8.6), then multiply the result by the number in the first section of the table under the heading entitled "Expenses Paid During the Period" to estimate the expenses you paid over the period. | |
Hypothetical Example for
Comparison Purposes: | | The second section of the table provides information about hypothetical account values and hypothetical expenses based on the Fund's actual expense ratio and an assumed rate of return at 5% per year before expenses. This return is not the Fund's actual return. The hypothetical account values and expenses may not be used to estimate the actual ending account balance or expenses you paid for the period. You may use this information to compare the ongoing costs of investing in this Fund versus other funds. To do so, Compare the expenses shown in this 5% hypothetical example with the 5% hypothetical examples that appear in the shareholder reports of other funds. | |
Please note that the expenses in the table are meant to highlight your ongoing costs only and do not include any transaction costs, such as fees and expenses that are, or may be imposed under your variable contract or qualified pension plan. Therefore, the information under the heading "Hypothetical (5% annual return before expenses)" is useful in comparing ongoing costs only, and will not help you determine the relative total costs of owning different funds. In addition, if these transaction costs were included, your costs would have been higher.
Expense Example (Unaudited)
NEUBERGER BERMAN ADVISERS MANAGEMENT TRUST U.S. EQUITY INDEX PUTWRITE STRATEGY PORTFOLIO
Actual | | Beginning Account
Value
7/1/2022 | | Ending Account
Value
12/31/2022 | | Expenses Paid During
the Period
7/1/2022 – 12/31/2022(a) | |
Class S | | $ | 1,000.00 | | | $ | 1,015.60 | | | $ | 5.33 | | |
| Hypothetical (5% annual return before expenses)(b) | |
Class S | | $ | 1,000.00 | | | $ | 1,019.91 | | | $ | 5.35 | | |
(a) Expenses are equal to the annualized expense ratio of 1.05%, multiplied by the average account value over the period, multiplied by 184/365 (to reflect the one-half year period shown).
(b) Hypothetical expenses are equal to the annualized expense ratio of 1.05%, multiplied by the average account value over the period (assuming a 5% annual return), multiplied by 184/365 (to reflect the one-half year period shown).
7
Schedule of Investments U.S. Equity Index PutWrite Strategy Portfolio^ December 31, 2022
SHARES | | | | VALUE | |
Common Stocks 0.0% | | | |
Food & Staples Retailing 0.0% | | | |
| 800
|
| | Fresh Market, Inc. (The)
Escrow*(a)(d) (Cost $—) | | $ | —
|
| |
PRINCIPAL AMOUNT | | | | | |
U.S. Government Agency Securities 71.6% | | | |
| | | | | Federal Agricultural
Mortgage Corp., | | | | | |
$ | 2,800,000 | | | 1.59%, 1/10/2024(b) | | | 2,708,644 | | |
| | 1,200,000 | | | 2.62%, 2/26/2024(b) | | | 1,170,234 | | |
| | | | | FFCB, | | | | | |
| 1,000,000
|
| | (SOFR + 0.05%), 4.35%,
2/17/2023(c) | |
| 1,000,023
|
| |
| | 1,000,000 | | | 0.13%, 5/10/2023 | | | 984,789 | | |
| | | | | FHLB, | | | | | |
| | 4,500,000 | | | 3.25%, 6/9/2023 | | | 4,475,874 | | |
| | | | | FHLMC, | | | | | |
| | 2,500,000 | | | 0.25%, 9/8/2023 | | | 2,424,777 | | |
| | 6,000,000 | | | 0.25%, 11/6/2023(b) | | | 5,772,281 | | |
| | | | | FNMA, | | | | �� | |
| | 8,000,000 | | | 2.88%, 9/12/2023 | | | 7,897,179 | | |
| | | | | Total U.S. Government Agency Securities
(Cost $27,090,875) | |
| 26,433,801
|
| |
U.S. Treasury Obligations 23.7% | | | |
| | | | | U.S. Treasury Notes, | | | | | |
| | 2,200,000 | | | 0.50%, 3/15/2023(b) | | | 2,183,241 | | |
| | 3,000,000 | | | 0.13%, 12/15/2023 | | | 2,873,789 | | |
| | 4,000,000 | | | 0.38%, 9/15/2024 | | | 3,727,969 | | |
| | | | | Total U.S. Treasury Obligations
(Cost $8,845,124) | |
| 8,784,999
|
| |
NO. OF RIGHTS | | | | VALUE | |
Rights 0.0% | | | |
Biotechnology 0.0% | | | |
| 225
|
| | Tobira Therapeutics,
Inc., CVR*(a)(d) (Cost $3,092) | | $ | —
|
| |
SHARES | | | | | |
Short-Term Investments 6.3% | | | |
Investment Companies 6.3% | | | |
| 2,312,232 |
| | Invesco Government &
Agency Portfolio,
Institutional Class, 4.23%(e) | |
| 2,312,232 |
| |
| 1,863 |
| | Morgan Stanley Institutional
Liquidity Funds Treasury
Securities Portfolio, Institutional
Class, 3.96%(e) | |
| 1,863 |
| |
| | | | | Total Investment Companies
(Cost $2,314,094) | |
| 2,314,095
|
| |
Total Investments 101.6%
(Cost $38,253,185) | |
| 37,532,895 |
| |
| Liabilities Less Other Assets (1.6%)(f) | | | (605,358 | ) | |
Net Assets 100.0% | | $ | 36,927,537 | | |
* Non-income producing security.
(a) Value determined using significant unobservable inputs.
(b) All or a portion of this security is pledged with the custodian for options written.
(c) Variable or floating rate security. The interest rate shown was the current rate as of December 31, 2022, and changes periodically.
(d) Security fair valued as of December 31, 2022, in accordance with procedures approved by the valuation designee. Total value of all such securities at December 31, 2022, amounted to $0, which represents 0.0% of net assets of the Fund.
(e) Represents 7-day effective yield as of December 31, 2022.
(f) Includes the impact of the Fund's open positions in derivatives at December 31, 2022.
See Notes to Financial Statements
8
Schedule of Investments U.S. Equity Index PutWrite Strategy Portfolio^ (cont'd)
Abbreviations
CVR Contingent Value Rights
FFCB Federal Farm Credit Bank
FHLB Federal Home Loan Bank
FHLMC Federal Home Loan Mortgage Corp.
FNMA Federal National Mortgage Association
SOFR Secured Overnight Financing Rate
Derivative Instruments
Written option contracts ("options written")
At December 31, 2022, the Fund had outstanding options written as follows:
Description | | Number of
Contracts | | Notional
Amount | | Exercise
Price | | Expiration
Date | | Value | |
Puts | |
Index | |
S&P 500 Index | | | 11 | | | $ | (4,223,450 | ) | | $ | 3,805 | | | 1/6/2023 | | $ | (29,205 | ) | |
S&P 500 Index | | | 2 | | | | (767,900 | ) | | | 3,940 | | | 1/6/2023 | | | (21,290 | ) | |
S&P 500 Index | | | 11 | | | | (4,223,450 | ) | | | 3,960 | | | 1/6/2023 | | | (136,125 | ) | |
S&P 500 Index | | | 11 | | | | (4,223,450 | ) | | | 3,845 | | | 1/13/2023 | | | (73,095 | ) | |
S&P 500 Index | | | 12 | | | | (4,607,400 | ) | | | 3,885 | | | 1/13/2023 | | | (103,980 | ) | |
S&P 500 Index | | | 1 | | | | (383,950 | ) | | | 3,955 | | | 1/13/2023 | | | (13,290 | ) | |
S&P 500 Index | | | 1 | | | | (383,950 | ) | | | 3,960 | | | 1/13/2023 | | | (13,665 | ) | |
S&P 500 Index | | | 2 | | | | (767,900 | ) | | | 3,775 | | | 1/20/2023 | | | (9,440 | ) | |
S&P 500 Index | | | 10 | | | | (3,839,500 | ) | | | 3,815 | | | 1/20/2023 | | | (61,600 | ) | |
S&P 500 Index | | | 13 | | | | (4,991,350 | ) | | | 3,830 | | | 1/20/2023 | | | (88,270 | ) | |
S&P 500 Index | | | 1 | | | | (383,950 | ) | | | 3,810 | | | 1/27/2023 | | | (7,005 | ) | |
S&P 500 Index | | | 21 | | | | (8,062,950 | ) | | | 3,825 | | | 1/27/2023 | | | (159,705 | ) | |
S&P 500 Index | | | 1 | | | | (383,950 | ) | | | 3,850 | | | 1/27/2023 | | | (8,695 | ) | |
Total options written (premium received $811,620) | | | | | | | | | | $ | (725,365 | ) | |
For the year ended December 31, 2022, the average market value for the months where the Fund had options written outstanding was $(793,413). At December 31, 2022, the Fund had securities pledged in the amount of $11,834,400 to cover collateral requirements for options written.
The following is a summary, categorized by Level (see Note A of the Notes to Financial Statements), of inputs used to value the Fund's investments as of December 31, 2022:
Asset Valuation Inputs | | Level 1 | | Level 2 | | Level 3* | | Total | |
Investments: | |
| Common Stocks(a)(b)(c) | | $ | — | | | $ | — | | | $ | — | | | $ | — | | |
U.S. Government Agency Securities | | | — | | | | 26,433,801 | | | | — | | | | 26,433,801 | | |
U.S. Treasury Obligations | | | — | | | | 8,784,999 | | | | — | | | | 8,784,999 | | |
| Rights(a)(c) | | | — | | | | — | | | | — | | | | — | | |
Short-Term Investments | | | — | | | | 2,314,095 | | | | — | | | | 2,314,095 | | |
Total Long Positions | | $ | — | | | $ | 37,532,895 | | | $ | — | | | $ | 37,532,895 | | |
See Notes to Financial Statements
9
Schedule of Investments U.S. Equity Index PutWrite Strategy Portfolio^ (cont'd)
(a) The Schedule of Investments provides information on the industry or sector categorization.
(b) The reconciliation between beginning and ending balances of investments in which unobservable inputs (Level 3) were used is not presented as all values rounded to less than $1.
(c) As of the year ended December 31, 2022, these investments were valued in accordance with procedures approved by the valuation designee. These investments did not have a material impact on the Fund's net assets and, therefore, disclosure of unobservable inputs used in formulating valuations is not presented.
* The following is a reconciliation between the beginning and ending balances of investments in which unobservable inputs (Level 3) were used in determining value:
| | | Rights(a) | |
Assets: | |
Investments in Securities: | |
Beginning Balance as of January 1, 2022 | | $ | — | | |
Transfers into Level 3 | | | — | | |
Transfers out of Level 3 | | | — | | |
Accrued discounts/(premiums) | | | — | | |
Realized gain/(loss) | | | (3,809 | ) | |
Change in unrealized appreciation/(depreciation) | | | 4,080 | | |
Purchases | | | — | | |
Sales | | | (271 | ) | |
Balance as of December 31, 2022 | | $ | — | | |
Net change in unrealized appreciation/(depreciation) on investments still held as of December 31, 2022 | | $ | — | | |
(a) As of the year ended December 31, 2022, these investments were fair valued in accordance with procedures approved by the valuation designee. These investments did not have a material impact on the Fund's net assets; therefore, disclosure of unobservable inputs used in formulating valuations is not presented.
The following is a summary, categorized by level (see Note A of the Notes to Financial Statements), of inputs used to value the Fund's derivatives as of December 31, 2022:
Other Financial Instruments
| | | Level 1 | | Level 2 | | Level 3 | | Total | |
Options Written | |
Liabilities | | $ | (725,365 | ) | | $ | — | | | $ | — | | | $ | (725,365 | ) | |
^ A balance indicated with a "—", reflects either a zero balance or an amount that rounds to less than 1.
See Notes to Financial Statements
10
Statement of Assets and Liabilities
Neuberger Berman Advisers Management Trust
| | | U.S. EQUITY INDEX
PUTWRITE
STRATEGY
PORTFOLIO | |
| | | December 31, 2022 | |
Assets | | | |
Investments in securities, at value* (Note A)—see Schedule of Investments: | |
| Unaffiliated issuers(a) | | $ | 37,532,895 | | |
| Foreign currency(b) | | | 120 | | |
Dividends and interest receivable | | | 131,184 | | |
Receivable for securities sold | | | 195,308 | | |
Receivable for Fund shares sold | | | 3,051 | | |
Receivable from administrator—net (Note B) | | | 170 | | |
Prepaid expenses and other assets | | | 822 | | |
Total Assets | | | 37,863,550 | | |
Liabilities | | | |
| Options contracts written, at value(c) (Note A) | | | 725,365 | | |
Due to custodian | | | 22,644 | | |
Payable to investment manager—net (Note B) | | | 14,191 | | |
Payable for securities purchased | | | 47,620 | | |
Payable for Fund shares redeemed | | | 51,038 | | |
Payable to trustees | | | 927 | | |
Payable for audit fees | | | 42,980 | | |
Payable for custodian and accounting fees | | | 19,776 | | |
Other accrued expenses and payables | | | 11,472 | | |
Total Liabilities | | | 936,013 | | |
Net Assets | | $ | 36,927,537 | | |
Net Assets consist of: | | | |
Paid-in capital | | $ | 41,582,682 | | |
Total distributable earnings/(losses) | | | (4,655,145 | ) | |
Net Assets | | $ | 36,927,537 | | |
Shares Outstanding ($.001 par value; unlimited shares authorized) | | | 4,503,287 | | |
Net Asset Value, offering and redemption price per share | |
Class S | | $ | 8.20 | | |
*Cost of Investments: | | | |
(a) Unaffiliated issuers | | $ | 38,253,185 | | |
(b) Total cost of foreign currency | | $ | 112 | | |
(c) Premium received from option contracts written | | $ | 811,620 | | |
See Notes to Financial Statements
11
Neuberger Berman Advisers Management Trust
| | | U.S. EQUITY INDEX
PUTWRITE
STRATEGY
PORTFOLIO | |
| | | For the
Year Ended
December 31, 2022 | |
Investment Income: | |
Income (Note A): | |
Interest income—unaffiliated issuers | | $ | 376,986 | | |
Dividend income | | | 10 | | |
Total income | | $ | 376,996 | | |
Expenses: | |
Investment management fees (Note B) | | | 168,039 | | |
Administration fees (Note B) | | | 112,026 | | |
Distribution fees (Note B) | | | 93,355 | | |
Shareholder servicing agent fees | | | 3,190 | | |
Audit fees | | | 42,980 | | |
Custodian and accounting fees | | | 79,111 | | |
Insurance | | | 858 | | |
Legal fees | | | 13,637 | | |
Shareholder reports | | | 15,308 | | |
Trustees' fees and expenses | | | 39,695 | | |
Miscellaneous and other fees | | | 2,561 | | |
Total expenses | | | 570,760 | | |
Expenses reimbursed by Management (Note B) | | | (178,991 | ) | |
Total net expenses | | | 391,769 | | |
Net investment income/(loss) | | $ | (14,773 | ) | |
Realized and Unrealized Gain/(Loss) on Investments (Note A): | |
Net realized gain/(loss) on: | |
Transactions in investment securities of unaffiliated issuers | | | (3,295 | ) | |
Settlement of foreign currency transactions | | | (20 | ) | |
Expiration or closing of option contracts written | | | (3,586,981 | ) | |
Change in net unrealized appreciation/(depreciation) in value of: | |
Investment securities of unaffiliated issuers | | | (677,015 | ) | |
Foreign currency translations | | | (28 | ) | |
Option contracts written | | | (341,566 | ) | |
Net gain/(loss) on investments | | | (4,608,905 | ) | |
Net increase/(decrease) in net assets resulting from operations | | $ | (4,623,678 | ) | |
See Notes to Financial Statements
12
Statements of Changes in Net Assets
Neuberger Berman Advisers Management Trust
| | | U.S. EQUITY INDEX
PUTWRITE STRATEGY PORTFOLIO | |
| | | Fiscal
Year Ended
December 31,
2022 | | Fiscal
Year Ended
December 31,
2021 | |
Increase/(Decrease) in Net Assets: | |
From Operations (Note A): | |
Net investment income/(loss) | | $ | (14,773 | ) | | $ | (205,768 | ) | |
Net realized gain/(loss) on investments | | | (3,590,296 | ) | | | 6,690,022 | | |
Change in net unrealized appreciation/(depreciation) of investments | | | (1,018,609 | ) | | | (110,223 | ) | |
Net increase/(decrease) in net assets resulting from operations | | | (4,623,678 | ) | | | 6,374,031 | | |
Distributions to Shareholders From (Note A): | |
Distributable earnings | | | (6,598,259 | ) | | | (2,529,384 | ) | |
Total distributions to shareholders | | | (6,598,259 | ) | | | (2,529,384 | ) | |
From Fund Share Transactions (Note D): | |
Proceeds from shares sold | | | 5,802,357 | | | | 6,125,738 | | |
Proceeds from reinvestment of dividends and distributions | | | 6,598,259 | | | | 2,529,383 | | |
Payments for shares redeemed | | | (5,573,219 | ) | | | (7,222,835 | ) | |
Net increase/(decrease) from Fund share transactions | | | 6,827,397 | | | | 1,432,286 | | |
Net Increase/(Decrease) in Net Assets | | | (4,394,540 | ) | | | 5,276,933 | | |
Net Assets: | |
Beginning of year | | | 41,322,077 | | | | 36,045,144 | | |
End of year | | $ | 36,927,537 | | | $ | 41,322,077 | | |
See Notes to Financial Statements
13
Notes to Financial Statements U.S. Equity Index PutWrite Strategy Portfolio
Note A—Summary of Significant Accounting Policies:
1 General: Neuberger Berman Advisers Management Trust (the "Trust") is a Delaware statutory trust organized pursuant to an Amended and Restated Trust Instrument dated March 27, 2014. The Trust is registered as an open-end management investment company under the Investment Company Act of 1940, as amended (the "1940 Act"), and its shares are registered under the Securities Act of 1933, as amended. Neuberger Berman Advisers Management Trust U.S. Equity Index PutWrite Strategy Portfolio (the "Fund") is a separate operating series of the Trust and is diversified. The Fund currently offers only Class S shares. The Trust's Board of Trustees (the "Board") may establish additional series or classes of shares without the approval of shareholders.
A balance indicated with a "—", reflects either a zero balance or a balance that rounds to less than 1.
The assets of the Fund belong only to the Fund, and the liabilities of the Fund are borne solely by the Fund and no other series of the Trust.
The Fund is an investment company and accordingly follows the investment company accounting and reporting guidance of the Financial Accounting Standards Board ("FASB") Accounting Standards Codification ("ASC") Topic 946 "Financial Services—Investment Companies."
The preparation of financial statements in accordance with U.S. generally accepted accounting principles ("GAAP") requires Neuberger Berman Investment Advisers LLC ("Management" or "NBIA") to make estimates and assumptions at the date of the financial statements. Actual results could differ from those estimates.
Shares of the Fund are not available to the general public and may be purchased only by life insurance companies to serve as an investment vehicle for premiums paid under their variable annuity and variable life insurance contracts and to certain qualified pension and other retirement plans.
2 Portfolio valuation: In accordance with ASC 820 "Fair Value Measurement" ("ASC 820"), all investments held by the Fund are carried at the value that Management believes the Fund would receive upon selling an investment in an orderly transaction to an independent buyer in the principal or most advantageous market for the investment under current market conditions. Various inputs, including the volume and level of activity for the asset or liability in the market, are considered in valuing the Fund's investments, some of which are discussed below. At times, Management may need to apply significant judgment to value investments in accordance with ASC 820.
ASC 820 established a three-tier hierarchy of inputs to create a classification of value measurements for disclosure purposes. The three-tier hierarchy of inputs is summarized in the three broad Levels listed below.
• Level 1—unadjusted quoted prices in active markets for identical investments
• Level 2—other observable inputs (including quoted prices for similar investments, interest rates, prepayment speeds, credit risk, amortized cost, etc.)
• Level 3—unobservable inputs (including the Fund's own assumptions in determining the fair value of investments)
The inputs or methodology used for valuing an investment are not necessarily an indication of the risk associated with investing in those securities.
The value of the Fund's investments in equity securities, exchange traded options written and rights, for which market quotations are available, is generally determined by Management by obtaining valuations from independent pricing services based on the latest sale price quoted on a principal exchange or market for that security (Level 1 inputs). Securities traded primarily on the NASDAQ Stock Market are normally valued at the
14
NASDAQ Official Closing Price ("NOCP") provided by NASDAQ each business day. The NOCP is the most recently reported price as of 4:00:02 p.m., Eastern Time, unless that price is outside the range of the "inside" bid and asked prices (i.e., the bid and asked prices that dealers quote to each other when trading for their own accounts); in that case, NASDAQ will adjust the price to equal the inside bid or asked price, whichever is closer. Because of delays in reporting trades, the NOCP may not be based on the price of the last trade to occur before the market closes. If there is no sale of a security on a particular day, the independent pricing services may value the security based on market quotations.
The value of the Fund's investments in debt securities is determined by Management primarily by obtaining valuations from independent pricing services based on bid quotations, or if quotations are not available, by methods which include various considerations based on security type (generally Level 2 inputs). In addition to the consideration of yields or prices of securities of comparable quality, coupon, maturity and type, indications as to values from dealers, and general market conditions, the following is a description of other Level 2 inputs and related valuation techniques used by independent pricing services to value certain types of debt securities held by the Fund:
U.S. Treasury Obligations. Inputs used to value U.S. Treasury securities generally include quotes from several inter-dealer brokers and other market information which may include benchmark yield curves, reported trades, broker-dealer quotes, issuer spreads, comparable securities and reference data, such as market research publications, when available ("Other Market Information").
U.S. Government Agency Securities. Inputs used to value U.S. Government Agency securities generally include obtaining benchmark quotes and Other Market Information.
Management has developed a process to periodically review information provided by independent pricing services for all types of securities.
Investments in non-exchange traded investment companies are valued using the respective fund's daily calculated net asset value ("NAV") per share (Level 2 inputs), when available.
If a valuation is not available from an independent pricing service, or if Management has reason to believe that the valuation received does not represent the amount the Fund might reasonably expect to receive on a current sale in an orderly transaction, Management seeks to obtain quotations from brokers or dealers (generally considered Level 2 or Level 3 inputs depending on the number of quotes available). If such quotations are not available, the security is valued using methods Management has approved in the good-faith belief that the resulting valuation will reflect the fair value of the security. Pursuant to Rule 2a-5 under the 1940 Act, the Board designated Management as the Fund's valuation designee. As the Fund's valuation designee, Management is responsible for determining fair value in good faith for any and all Fund investments. Inputs and assumptions considered in determining the fair value of a security based on Level 2 or Level 3 inputs may include, but are not limited to, the type of the security; the initial cost of the security; the existence of any contractual restrictions on the security's disposition; the price and extent of public trading in similar securities of the issuer or of comparable companies; quotations or evaluated prices from broker-dealers and/or pricing services; information obtained from the issuer and/or analysts; an analysis of the company's or issuer's financial statements; an evaluation of the inputs that influence the issuer and the market(s) in which the security is purchased and sold.
Fair value prices are necessarily estimates, and there is no assurance that such a price will be at or close to the price at which the security is next quoted or next trades.
3 Foreign currency translations: The accounting records of the Fund are maintained in U.S. dollars. Foreign currency amounts are normally translated into U.S. dollars using the exchange rate as of 4:00 p.m. Eastern Time, on days the New York Stock Exchange is open for business, to determine the value of investments, other assets and liabilities. Purchase and sale prices of securities, and income and expenses, are translated into U.S. dollars at the prevailing rate of exchange on the respective dates of such transactions. Net unrealized foreign currency
15
gain/(loss), if any, arises from changes in the value of assets and liabilities, other than investments in securities, as a result of changes in exchange rates and is stated separately in the Statement of Operations.
4 Securities transactions and investment income: Securities transactions are recorded on trade date for financial reporting purposes. Dividend income is recorded on the ex-dividend date or, for certain foreign dividends, as soon as the Fund becomes aware of the dividends. Non-cash dividends included in dividend income, if any, are recorded at the fair market value of the securities received. Interest income, including accretion of discount (adjusted for original issue discount, where applicable) and amortization of premium, where applicable, is recorded on the accrual basis. Realized gains and losses from securities transactions and foreign currency transactions, if any, are recorded on the basis of identified cost and stated separately in the Statement of Operations.
5 Income tax information: The Fund is treated as a separate entity for U.S. federal income tax purposes. It is the policy of the Fund to continue to qualify for treatment as a regulated investment company ("RIC") by complying with the requirements of the U.S. Internal Revenue Code applicable to RICs and to distribute substantially all of its net investment income and net realized capital gains to its shareholders. To the extent the Fund distributes substantially all of its net investment income and net realized capital gains to shareholders, no federal income or excise tax provision is required.
ASC 740 "Income Taxes" sets forth a minimum threshold for financial statement recognition of a tax position taken, or expected to be taken, in a tax return. The Fund recognizes interest and penalties, if any, related to unrecognized tax positions as an income tax expense in the Statement of Operations. The Fund is subject to examination by U.S. federal and state tax authorities for returns filed for the tax years for which the applicable statutes of limitations have not yet expired. As of December 31, 2022, the Fund did not have any unrecognized tax positions.
For federal income tax purposes, the estimated cost of investments held at December 31, 2022, was $38,253,185. The estimated gross unrealized appreciation was $0 and estimated gross unrealized depreciation was $720,290 resulting in net unrealized depreciation in value of investments of $720,290 based on cost for U.S. federal income tax purposes.
Income distributions and capital gain distributions are determined in accordance with income tax regulations, which may differ from GAAP. These differences are primarily due to differing treatments of income and gains on various investment securities held by the Fund, timing differences and differing characterization of distributions made by the Fund. The Fund may also utilize earnings and profits distributed to shareholders on redemption of their shares as a part of the dividends-paid deduction for income tax purposes.
Any permanent differences resulting from different book and tax treatment are reclassified at year-end and have no impact on net income, NAV or NAV per share of the Fund. For the year ended December 31, 2022, the Fund recorded permanent reclassifications primarily related to net operating losses written off.
For the year ended December 31, 2022, the Fund recorded the following permanent reclassifications:
| Paid-in Capital | | Total
Distributable
Earnings | |
$ | (15,541 | ) | | $ | 15,541 | | |
The tax character of distributions paid during the years ended December 31, 2022, and December 31, 2021, was as follows:
Distributions Paid From: | |
Ordinary Income | | Long-Term Capital Gain | | Total | |
2022 | | 2021 | | 2022 | | 2021 | | 2022 | | 2021 | |
$ | 2,516,257 |
| | $ | 1,087,058 |
| | $ | 4,082,002 |
| | $ | 1,442,326 |
| | $ | 6,598,259 | | | $ | 2,529,384 | | |
16
As of December 31, 2022, the components of distributable earnings (accumulated losses) on a U.S. federal income tax basis were as follows:
Undistributed
Ordinary
Income | | Undistributed
Long-Term
Capital Gain | | Unrealized
(Depreciation) | | Loss
Carryforwards
and Deferrals | | Other
Temporary
Differences | | Total | |
| $ | — | | | $ | — | | | $ | (720,288 | ) | | $ | (3,931,842 | ) | | $ | (3,015 | ) | | $ | (4,655,145 | ) | |
The temporary differences between book basis and tax basis distributable earnings are primarily due to mark-to market adjustments on options contracts, unamortized organization expenses and capital loss carryforwards.
To the extent the Fund's net realized capital gains, if any, can be offset by capital loss carryforwards, it is the policy of the Fund not to distribute such gains. Capital loss carryforward rules allow for RICs to carry forward capital losses indefinitely and to retain the character of capital loss carryforwards as short-term or long-term. As determined at December 31, 2022, the Fund had unused capital loss carryforwards available for federal income tax purposes to offset net realized capital gains, if any, as follows:
Capital Loss Carryforwards | |
Long-Term | | Short-Term | |
$ | 2,360,881 |
| | $ | 1,570,961 | | |
During the year ended December 31, 2022, the Fund did not utilize any capital loss carryforwards.
6 Foreign taxes: Foreign taxes withheld, if any, represent amounts withheld by foreign tax authorities, net of refunds recoverable.
7 Distributions to shareholders: The Fund may earn income, net of expenses, daily on its investments. Distributions from net investment income and net realized capital gains, if any, are generally distributed once a year (usually in October) and are recorded on the ex-date.
8 Expense allocation: Certain expenses are applicable to multiple funds within the complex of related investment companies. Expenses directly attributable to a fund are charged to that fund. Expenses of the Trust that are not directly attributable to a particular series of the Trust (e.g., the Fund) are allocated among the series of the Trust, on the basis of relative net assets, except where a more appropriate allocation of expenses to each of the series can otherwise be made fairly. Expenses borne by the complex of related investment companies, which includes open-end and closed-end investment companies for which NBIA serves as investment manager, that are not directly attributable to a particular investment company in the complex (e.g., the Trust) or series thereof are allocated among the investment companies in the complex or series thereof on the basis of relative net assets, except where a more appropriate allocation of expenses to each of the investment companies in the complex or series thereof can otherwise be made fairly.
9 Investment company securities and exchange-traded funds: The Fund may invest in shares of other registered investment companies, including exchange traded funds ("ETFs"), within the limitations prescribed by the 1940 Act, in reliance on rules adopted by the SEC, particularly Rule 12d1-4 or any other applicable exemptive relief. Rule 12d1-4 permits fund of funds arrangements, and includes (i) limits on control and voting; (ii) required evaluations and findings; (iii) required fund of funds investment agreements; and (iv) limits on complex structures. Shareholders of the Fund will indirectly bear their proportionate share of any management fees and other expenses paid by such other investment companies, in addition to the management fees and expenses of the Fund.
10 Derivative instruments: The Fund's use of derivatives during the year ended December 31, 2022, is described below. Please see the Schedule of Investments for the Fund's open positions in derivatives at December 31, 2022. The disclosure requirements of ASC 815 "Derivatives and Hedging" ("ASC 815") distinguish between derivatives that qualify for hedge accounting and those that do not. Because investment companies value their derivatives at fair value and recognize changes in fair value through the Statement of Operations, they do not qualify for hedge
17
accounting. Accordingly, even though the Fund's investments in derivatives may represent economic hedges, they are considered non-hedge transactions for purposes of this disclosure.
Rule 18f-4 under the 1940 Act which became effective in August 2022, regulates the use of derivatives for certain funds registered under the 1940 Act ("Rule 18f-4"). The Fund has adopted a Rule 18f-4 Policy which provides, among other things, that unless the Fund qualifies as a "limited derivatives user" as defined in Rule 18f-4, the Fund is subject to a comprehensive derivatives risk management program, is required to comply with certain value-at-risk based leverage limits and is required to provide additional disclosure both publicly and to the SEC regarding its derivatives positions. If the Fund qualifies as a limited derivatives user, Rule 18f-4 requires the Fund to have policies and procedures to manage its aggregate derivatives risk.
Options: The Fund's principal investment strategy is an options-based strategy. During the year ended December 31, 2022, the Fund used options written to manage or adjust the risk profile of the Fund or the risk of individual index exposures and to gain exposure more efficiently than through a direct purchase of the underlying security or to gain exposure to securities, markets, sectors or geographical areas. Options written were also used to generate incremental returns.
Premiums paid by the Fund upon purchasing a call or put option are recorded in the asset section of the Fund's Statement of Assets and Liabilities and are subsequently adjusted to the current market value. When an option is exercised, closed, or expired, the Fund realizes a gain or loss and the asset is eliminated. For purchased call options, the Fund's loss is limited to the amount of the option premium paid.
Premiums received by the Fund upon writing a call option or a put option are recorded in the liability section of the Fund's Statement of Assets and Liabilities and are subsequently adjusted to the current market value. When an option is exercised, closed, or expired, the Fund realizes a gain or loss and the liability is eliminated.
When the Fund writes a call option on an underlying asset it does not own, its exposure on such an option is theoretically unlimited. When writing a covered call option, the Fund, in return for the premium, gives up the opportunity for profit from a price increase in the underlying security above the exercise price, but conversely retains the risk of loss should the price of the security decline. When writing a put option, the Fund, in return for the premium, takes the risk that it must purchase the underlying security at a price that may be higher than the current market price of the security. If a call or put option that the Fund has written expires unexercised, the Fund will realize a gain in the amount of the premium. All securities covering outstanding written options are held in escrow by the custodian bank.
The Fund (as the seller of a put option) receives premiums from the purchaser of the option in exchange for providing the purchaser with the right to sell the underlying instrument to the Fund at a specific price (i.e., the exercise price or strike price). If the market price of the instrument underlying the option exceeds the strike price, it is anticipated that the option would go unexercised and the Fund would earn the full premium upon the option's expiration or a portion of the premium upon the option's early termination. If the market price of the instrument underlying the option drops below the strike price, it is anticipated that the option would be exercised and the Fund would pay the option buyer the difference between the market value of the underlying instrument and the strike price.
At December 31, 2022, the Fund had the following derivatives (which did not qualify as hedging instruments under ASC 815), grouped by primary risk exposure:
Liability Derivatives
Derivative Type | | Statement of
Assets and Liabilities
Location | | Equity Risk | |
Options written | | Option contracts written,
at value | | $ | (725,365 | ) | |
18
The impact of the use of these derivative instruments on the Statement of Operations during the fiscal year ended December 31, 2022, was as follows:
Realized Gain/(Loss)
Derivative Type | | Statement of
Operations Location | | Equity Risk | |
Options written | | Net realized gain/(loss)
on: Expiration or closing
of option contracts written | | $ | (3,586,981 | ) | |
Change in Appreciation / (Depreciation)
Derivative Type | | Statement of
Operations Location | | Equity Risk | |
Options written | | Change in net unrealized
appreciation/(depreciation)
in value of: Option
contracts written | | $ | (341,566 | ) | |
While the Fund may receive rights and warrants in connection with its investments in securities, these rights and warrants are not considered "derivative instruments" under ASC 815.
11 Indemnifications: Like many other companies, the Trust's organizational documents provide that its officers ("Officers") and trustees ("Trustees") are indemnified against certain liabilities arising out of the performance of their duties to the Trust. In addition, both in some of its principal service contracts and in the normal course of its business, the Trust enters into contracts that provide indemnifications to other parties for certain types of losses or liabilities. The Trust's maximum exposure under these arrangements is unknown as this could involve future claims against the Trust.
Note B—Investment Management Fees, Administration Fees, Distribution Arrangements, and Other Transactions with Affiliates:
The Fund retains NBIA as its investment manager under a Management Agreement. For such investment management services, the Fund pays NBIA an investment management fee at the annual rate of 0.45% of the Fund's average daily net assets.
The Fund retains NBIA as its administrator under an Administration Agreement. The Fund pays NBIA an administration fee at the annual rate of 0.30% of its average daily net assets under this agreement. Additionally, NBIA retains JPMorgan Chase Bank, NA ("JPM") as its sub-administrator under a Sub-Administration Agreement. NBIA pays JPM a fee for all services received under the Sub-Administration Agreement.
NBIA has contractually agreed to waive fees and/or reimburse certain expenses of the Fund so that the total annual operating expenses do not exceed the expense limitation as detailed in the following table. This undertaking excludes interest, brokerage commissions, dividend and interest expenses relating to short sales, acquired fund fees and expenses, taxes, including any expenses related to tax reclaims and extraordinary expenses, if any (commitment fees relating to borrowings are treated as interest for purposes of this exclusion) ("annual operating expenses"); consequently, net expenses may exceed the contractual expense limitation. The Fund has agreed that it will repay NBIA for fees and expenses waived or reimbursed provided that repayment does not cause the annual operating expenses to exceed its contractual expense limitation in place at the time the fees and expenses were waived or reimbursed, or the expense limitation in place at the time the Fund repays NBIA, whichever is lower. Any such repayment must be made within three years after the year in which NBIA incurred the expense.
During the year ended December 31, 2022, there was no repayment to NBIA under this agreement.
19
At December 31, 2022, the Fund's contingent liabilities to NBIA under the agreement were as follows:
| | | | | | | Expenses Reimbursed in
Year Ending, December 31, | |
| | | | | | | 2020 | | 2021 | | 2022 | |
| | | | | | | Subject to Repayment until December 31, | |
| | | Contractual
Expense
Limitation(1) | | Expiration | | 2023 | | 2024 | | 2025 | |
Class S | | | 1.05 | % | | 12/31/25 | | $ | 183,237 | | | $ | 184,142 | | | $ | 178,991 | | |
(1) Expense limitation per annum of the Fund's average daily net assets.
Neuberger Berman BD LLC (the "Distributor") is the Fund's "principal underwriter" within the meaning of the 1940 Act. It acts as agent in arranging for the sale of the Fund's Class S shares. The Board has adopted a distribution and shareholder services plan (the "Plan") for Class S shares pursuant to Rule 12b-1 under the 1940 Act. The Plan provides that, as compensation for administrative and other services related to the sale and distribution of Class S shares, and ongoing services provided to investors in the class, the Distributor receives from Class S a fee at the annual rate of 0.25% of Class S's average daily net assets. The Distributor may pay a portion of the proceeds from the 12b-1 fee to institutions that provide such services, including insurance companies or their affiliates and qualified plan administrators ("intermediaries") for services they provide respecting the Fund to current and prospective variable contract owners and qualified plan participants that invest in the Fund through the intermediaries. Those institutions may use the payments for, among other purposes, compensating employees engaged in sales and/or shareholder servicing. The amount of fees paid by the class during any year may be more or less than the cost of distribution and other services provided to the class. FINRA rules limit the amount of annual distribution fees that may be paid by a mutual fund and impose a ceiling on the cumulative distribution fees paid. The Plan complies with those rules.
Note C—Securities Transactions:
During the year ended December 31, 2022, there were purchase and sale transactions of long-term securities (excluding written option contracts) as follows:
Purchases of
U.S. Government
and Agency
Obligations | | Purchases excluding
U.S. Government
and Agency
Obligations | | Sales and Maturities
of U.S. Government
and Agency
Obligations | | Sales and Maturities
excluding
U.S. Government
and Agency
Obligations | |
| $ | 22,324,837 | | | $ | — | | | $ | 10,101,992 | | | $ | 271 | | |
During the year ended December 31, 2022, no brokerage commissions on securities transactions were paid to affiliated brokers.
Note D—Fund Share Transactions:
Share activity for the years ended December 31, 2022 and December 31, 2021 was as follows:
| | | For the Year Ended December 31, 2022 | | For the Year Ended December 31, 2021 | |
| | | Shares Sold | | Shares Issued on
Reinvestment of
Dividends and
Distributions | | Shares
Redeemed | | Total | | Shares Sold | | Shares Issued on
Reinvestment of
Dividends and
Distributions | | Shares
Redeemed | | Total | |
Class S | | | 574,101 | | | | 851,388 | | | | (550,169 | ) | | | 875,320 | | | | 545,032 | | | | 228,078 | | | | (640,606 | ) | | | 132,504 | | |
20
Other: At December 31, 2022, affiliated persons, as defined in the 1940 Act, owned 0.06% of the Fund's outstanding shares.
Note E—Line of Credit:
At December 31, 2022, the Fund was a participant in a syndicated committed, unsecured $700,000,000 line of credit (the "Credit Facility"), to be used only for temporary or emergency purposes. Series of other investment companies managed by NBIA also participate in this line of credit on substantially the same terms. Interest is charged on borrowings under this Credit Facility at the highest of (a) a federal funds effective rate plus 1.00% per annum, (b) a daily simple Secured Overnight Financing Rate ("SOFR") plus 1.10% per annum, and (c) an overnight bank funding rate plus 1.00% per annum; provided that should the Administrative Agent of the Credit Facility determine that the daily simple SOFR rate is unavailable, then the interest rate option described in (b) shall be replaced with a benchmark replacement determined to be applicable by such Administrative Agent. The Credit Facility has an annual commitment fee of 0.15% per annum of the available line of credit, which is paid quarterly. The Fund has agreed to pay its pro rata share of the annual commitment fee, based on the ratio of its individual net assets to the net assets of all participants at the time the fee is due, and interest charged on any borrowing made by the Fund and other costs incurred by the Fund. Because several mutual funds participate in the Credit Facility, there is no assurance that the Fund will have access to all or any part of the $700,000,000 at any particular time. There were no loans outstanding under the Credit Facility at December 31, 2022. During the year ended December 31, 2022, the Fund did not utilize the Credit Facility.
Note F—Recent Accounting Pronouncement:
In December 2022, the FASB issued Accounting Standards Update No. 2022-06 ("ASU 2022-06"), "Reference Rate Reform (Topic 848), which is an update to Accounting Standards Update No. 2021-01 ("ASU 2021-01"), "Reference Rate Reform (Topic 848)" and defers the sunset date for applying the reference rate reform relief in Topic 848. ASU 2021-01 is an update of Accounting Standards Update No. 2020-04 ("ASU 2020-04"), which is in response to concerns about structural risks of interbank offered rates, and particularly the risk of cessation of LIBOR, regulators have undertaken reference rate reform initiatives to identify alternative reference rates that are more observable or transaction based and less susceptible to manipulation. ASU 2020-04 provides optional guidance for a limited period of time to ease the potential burden in accounting for (or recognizing the effects of) reference rate reform on financial reporting. ASU 2020-04 is elective and applies to all entities, subject to meeting certain criteria, that have contracts, hedging relationships, and other transactions that reference LIBOR or another reference rate expected to be discontinued because of reference rate reform. The ASU 2021-01 update clarifies that certain optional expedients and exceptions in Topic 848 for contract modifications and hedge accounting apply to derivatives that are affected by the discounting transition. The amendments in this update are effective immediately through December 31, 2024, for all entities. Management is currently evaluating the implications, if any, of the additional requirements and its impact on the Fund's financial statements.
Note G—Other Matters:
Coronavirus: The outbreak of the novel coronavirus in many countries has, among other things, disrupted global travel and supply chains, and adversely impacted global commercial activity, the transportation industry and commodity prices in the energy sector. The impact of this virus has negatively affected and may continue to affect the economies of many nations, individual companies and the global securities and commodities markets, including liquidity and volatility. The development and fluidity of this situation precludes any prediction as to its ultimate impact, which may have a continued adverse effect on global economic and market conditions. Such conditions (which may be across industries, sectors or geographies) have impacted and may continue to impact the issuers of the securities held by the Fund and in turn, may impact the financial performance of the Fund.
21
Russia's invasion of Ukraine: Russia's invasion of Ukraine, and corresponding events in late February 2022, have had, and could continue to have, severe adverse effects on regional and global economic markets for securities and commodities. Following Russia's actions, various governments, including the United States, have issued broad-ranging economic sanctions against Russia. The current events have had, and could continue to have, an adverse effect on global markets performance and liquidity, thereby negatively affecting the value of the Fund's investments beyond any direct exposure to Russian or Ukrainian issuers. The duration of ongoing hostilities and the vast array of sanctions and related events cannot be predicted. Those events present material uncertainty and risk with respect to markets globally and the performance of the Fund and its investments or operations could be negatively impacted.
22
U.S. Equity Index PutWrite Strategy Portfolio
The following table includes selected data for a share outstanding throughout each period and other performance information derived from the Financial Statements. Amounts that do not round to $0.01 or $(0.01) per share are presented as $0.00 or $(0.00), respectively. Ratios that do not round to 0.01% or (0.01)% are presented as 0.00% or (0.00)%, respectively. A "—" indicates that the line item was not applicable in the corresponding period.
Class S | |
| | | Year Ended December 31, | |
| | | 2022 | | 2021 | | 2020 | | 2019 | | 2018 | |
Net Asset Value, Beginning of Year | | $ | 11.39 | | | $ | 10.31 | | | $ | 10.30 | | | $ | 8.95 | | | $ | 9.90 | | |
Income From Investment Operations: | |
| Net Investment Income/(Loss)‡ | | | — | | | | (0.06 | ) | | | 0.04 | | | | 0.09 | | | | 0.04 | | |
Net Gains or Losses on Securities
(both realized and unrealized) | | | (1.39 | ) | | | 1.89 | | | | 0.77 | | | | 1.28 | | | | (0.70 | ) | |
Total From Investment Operations | | | (1.39 | ) | | | 1.83 | | | | 0.81 | | | | 1.37 | | | | (0.66 | ) | |
Less Distributions From: | |
Net Investment Income | | | — | | | | (0.03 | ) | | | (0.09 | ) | | | (0.02 | ) | | | — | | |
Net Realized Capital Gains | | | (1.80 | ) | | | (0.72 | ) | | | (0.71 | ) | | | — | | | | (0.29 | ) | |
Total Distributions | | | (1.80 | ) | | | (0.75 | ) | | | (0.80 | ) | | | (0.02 | ) | | | (0.29 | ) | |
Net Asset Value, End of Year | | $ | 8.20 | | | $ | 11.39 | | | $ | 10.31 | | | $ | 10.30 | | | $ | 8.95 | | |
| Total Return†† | | | (11.28 | )% | | | 17.94 | % | | | 8.26 | % | | | 15.26 | % | | | (6.78 | )% | |
Ratios/Supplemental Data | |
Net Assets, End of Year (in millions) | | $ | 36.9 | | | $ | 41.3 | | | $ | 36.0 | | | $ | 34.6 | | | $ | 12.0 | | |
| Ratio of Gross Expenses to Average Net Assets# | | | 1.53 | % | | | 1.52 | % | | | 1.61 | % | | | 1.72 | % | | | 2.59 | % | |
Ratio of Net Expenses to Average Net Assets | | | 1.05 | % | | | 1.05 | % | | | 1.05 | % | | | 1.05 | % | | | 1.05 | % | |
Ratio of Net Investment Income/(Loss) to
Average Net Assets | | | (0.04 | )% | | | (0.53 | )% | | | 0.36 | % | | | 0.97 | % | | | 0.46 | % | |
Portfolio Turnover Rate | | | 36 | % | | | 44 | % | | | 48 | % | | | 26 | % | | | 23 | % | |
See Notes to Financial Highlights
23
Notes to Financial Highlights U.S. Equity Index PutWrite Strategy Portfolio
†† Total return based on per share NAV reflects the effects of changes in NAV on the performance of the Fund during each fiscal period. Returns assume income dividends and other distributions, if any, were reinvested. Results represent past performance and do not indicate future results. Current returns may be lower or higher than the performance data quoted. Investment returns and principal will fluctuate and shares, when redeemed, may be worth more or less than original cost. Total return would have been lower if Management had not reimbursed and/or waived certain expenses. The total return information shown does not reflect charges and other expenses that apply to the separate accounts or the related insurance policies or other qualified pension or retirement plans, and the inclusion of these charges and other expenses would reduce the total return for all fiscal periods shown.
‡ Calculated based on the average number of shares outstanding during each fiscal period.
# Represents the annualized ratios of net expenses to average daily net assets if Management had not reimbursed certain expenses and/or waived a portion of the investment management fee.
24
Report of Independent Registered Public Accounting Firm
To the Shareholders of
Neuberger Berman Advisers Management Trust
U.S. Equity Index PutWrite Strategy Portfolio and
Board of Trustees of the Neuberger Berman Advisers Management Trust
Opinion on the Financial Statements
We have audited the accompanying statement of assets and liabilities of Neuberger Berman Advisers Management Trust U.S. Equity Index PutWrite Strategy Portfolio (the "Portfolio") (one of the portfolios constituting Neuberger Berman Advisers Management Trust (the "Trust")), including the schedule of investments, as of December 31, 2022, and the related statement of operations for the year then ended, the statements of changes in net assets for each of the two years in the period then ended, the financial highlights for each of the five years in the period then ended and the related notes (collectively referred to as the "financial statements"). In our opinion, the financial statements present fairly, in all material respects, the financial position of the Portfolio (one of the portfolios constituting Neuberger Berman Advisers Management Trust) at December 31, 2022, the results of its operations for the year then ended, the changes in its net assets for each of the two years in the period then ended and its financial highlights for each of the five years in the period then ended, in conformity with U.S. generally accepted accounting principles.
Basis for Opinion
These financial statements are the responsibility of the Trust's management. Our responsibility is to express an opinion on the Portfolio's financial statements based on our audits. We are a public accounting firm registered with the Public Company Accounting Oversight Board (United States) ("PCAOB") and are required to be independent with respect to the Trust in accordance with the U.S. federal securities laws and the applicable rules and regulations of the Securities and Exchange Commission and the PCAOB.
We conducted our audits in accordance with the standards of the PCAOB. Those standards require that we plan and perform the audit to obtain reasonable assurance about whether the financial statements are free of material misstatement, whether due to error or fraud. The Trust is not required to have, nor were we engaged to perform, an audit of the Trust's internal control over financial reporting. As part of our audits, we are required to obtain an understanding of internal control over financial reporting but not for the purpose of expressing an opinion on the effectiveness of the Trust's internal control over financial reporting. Accordingly, we express no such opinion.
Our audits included performing procedures to assess the risks of material misstatement of the financial statements, whether due to error or fraud, and performing procedures that respond to those risks. Such procedures included examining, on a test basis, evidence regarding the amounts and disclosures in the financial statements. Our procedures included confirmation of securities owned as of December 31, 2022, by correspondence with the custodian and brokers; when replies were not received from brokers, we performed other auditing procedures. Our audits also included evaluating the accounting principles used and significant estimates made by management, as well as evaluating the overall presentation of the financial statements. We believe that our audits provide a reasonable basis for our opinion.

We have served as the auditor of one or more Neuberger Berman investment companies since 1954.
Boston, Massachusetts
February 14, 2023
25
The following tables set forth information concerning the Trustees and Officers of the Fund. All persons named as Trustees and Officers also serve in similar capacities for other funds administered or managed by Neuberger Berman Investment Advisers LLC ("NBIA"). The Fund's Statement of Additional Information includes additional information about the Trustees as of the time of the Fund's most recent public offering and is available upon request, without charge, by calling (800) 877-9700.
Information about the Board of Trustees
Name, (Year of Birth),
and Address(1) | | Position(s)
and Length of
Time Served(2) | | Principal Occupation(s)(3) | | Number of
Funds in Fund
Complex
Overseen by
Fund Trustee | | Other Directorships
Held Outside Fund
Complex by Fund
Trustee(3) | |
Independent Fund Trustees | |
Michael J. Cosgrove (1949) | | Trustee since 2015 | | President, Carragh Consulting USA, since 2014; formerly, Executive, General Electric Company, 1970 to 2014, including President, Mutual Funds and Global Investment Programs, GE Asset Management, 2011 to 2014, President and Chief Executive Officer, Mutual Funds and Intermediary Business, GE Asset Management, 2007 to 2011, President, Institutional Sales and Marketing, GE Asset Management, 1998 to 2007, and Chief Financial Officer, GE Asset Management, and Deputy Treasurer, GE Company, 1988 to 1993. | |
| 50 |
| | Director, America Press, Inc. (not-for-profit Jesuit publisher), 2015 to 2021; formerly, Director, Fordham University, 2001 to 2018; formerly, Director, The Gabelli Go Anywhere Trust, June 2015 to June 2016; formerly, Director, Skin Cancer Foundation (not-for-profit), 2006 to 2015; formerly, Director, GE Investments Funds, Inc., 1997 to 2014; formerly, Trustee, GE Institutional Funds, 1997 to 2014; formerly, Director, GE Asset Management, 1988 to 2014; formerly, Director, Elfun Trusts, 1988 to 2014; formerly, Trustee, GE Pension & Benefit Plans, 1988 to 2014; formerly, Member of Board of Governors, Investment Company Institute. | |
26
Name, (Year of Birth),
and Address(1) | | Position(s)
and Length of
Time Served(2) | | Principal Occupation(s)(3) | | Number of
Funds in Fund
Complex
Overseen by
Fund Trustee | | Other Directorships
Held Outside Fund
Complex by Fund
Trustee(3) | |
Marc Gary (1952) | | Trustee since 2015 | | Executive Vice Chancellor Emeritus, The Jewish Theological Seminary, since 2020; formerly, Executive Vice Chancellor and Chief Operating Officer, Jewish Theological Seminary, 2012 to 2020; formerly, Executive Vice President and General Counsel, Fidelity Investments, 2007 to 2012; formerly, Executive Vice President and General Counsel, BellSouth Corporation, 2004 to 2007; formerly, Vice President and Associate General Counsel, BellSouth Corporation, 2000 to 2004; formerly, Associate, Partner, and National Litigation Practice Co-Chair, Mayer, Brown LLP, 1981 to 2000; formerly, Associate Independent Counsel, Office of Independent Counsel, 1990 to 1992. | |
| 50 |
| | Chair and Director, USCJ Supporting Foundation, since 2021; Director, UJA Federation of Greater New York, since 2019; Trustee, The Jewish Theological Seminary, since 2015; formerly, Director, Legility, Inc. (privately held for-profit company), 2012 to 2021; Director, Lawyers Committee for Civil Rights Under Law (not-for-profit), since 2005; formerly, Director, Equal Justice Works (not-for-profit), 2005 to 2014; formerly, Director, Corporate Counsel Institute, Georgetown University Law Center, 2007 to 2012; formerly, Director, Greater Boston Legal Services (not-for-profit), 2007 to 2012. | |
27
Name, (Year of Birth),
and Address(1) | | Position(s)
and Length of
Time Served(2) | | Principal Occupation(s)(3) | | Number of
Funds in Fund
Complex
Overseen by
Fund Trustee | | Other Directorships
Held Outside Fund
Complex by Fund
Trustee(3) | |
Martha C. Goss (1949) | | Trustee since 2007 | | Formerly, President, Woodhill Enterprises Inc./Chase Hollow Associates LLC (personal investment vehicle), 2006 to 2020; formerly, Consultant, Resources Global Professionals (temporary staffing), 2002 to 2006; formerly, Chief Financial Officer, Booz- Allen & Hamilton, Inc., 1995 to 1999; formerly, Enterprise Risk Officer, Prudential Insurance, 1994 to 1995; formerly, President, Prudential Asset Management Company, 1992 to 1994; formerly, President, Prudential Power Funding (investments in electric and gas utilities and alternative energy projects), 1989 to 1992; formerly, Treasurer, Prudential Insurance Company, 1983 to 1989. | |
| 50 |
| | Director, American Water (water utility), since 2003; Director, Allianz Life of New York (insurance), since 2005; formerly, Director, Berger Group Holdings, Inc. (engineering consulting firm), 2013 to 2018; formerly, Director, Financial Women's Association of New York (not-for-profit association), 1987 to 1996, 2003 to 2019; Trustee Emerita, Brown University, since 1998; Director, Museum of American Finance (not-for-profit), since 2013; formerly, Non-Executive Chair and Director, Channel Reinsurance (financial guaranty reinsurance), 2006 to 2010; formerly, Director, Ocwen Financial Corporation (mortgage servicing), 2005 to 2010; formerly, Director, Claire's Stores, Inc. (retailer), 2005 to 2007; formerly, Director, Parsons Brinckerhoff Inc. (engineering consulting firm), 2007 to 2010; formerly, Director, Bank Leumi (commercial bank), 2005 to 2007; formerly, Advisory Board Member, Attensity (software developer), 2005 to 2007; formerly, Director, Foster Wheeler Manufacturing, 1994 to 2004; formerly, Director, Dexter Corp., (Manufacturer of Non-Wovens, Plastics, and Medical Supplies), 1992 to 2001. | |
28
Name, (Year of Birth),
and Address(1) | | Position(s)
and Length of
Time Served(2) | | Principal Occupation(s)(3) | | Number of
Funds in Fund
Complex
Overseen by
Fund Trustee | | Other Directorships
Held Outside Fund
Complex by Fund
Trustee(3) | |
Michael M. Knetter (1960) | | Trustee since 2007 | | President and Chief Executive Officer, University of Wisconsin Foundation, since 2010; formerly, Dean, School of Business, University of Wisconsin—Madison; formerly, Professor of International Economics and Associate Dean, Amos Tuck School of Business—Dartmouth College, 1998 to 2002. | |
| 50 |
| | Director, 1 William Street Credit Income Fund, since 2018; Board Member, American Family Insurance (a mutual company, not publicly traded), since March 2009; formerly, Trustee, Northwestern Mutual Series Fund, Inc., 2007 to 2011; formerly, Director, Wausau Paper, 2005 to 2011; formerly, Director, Great Wolf Resorts, 2004 to 2009. | |
Deborah C. McLean (1954) | | Trustee since 2015 | | Member, Circle Financial Group (private wealth management membership practice), since 2011; Managing Director, Golden Seeds LLC (an angel investing group), since 2009; Adjunct Professor (Corporate Finance), Columbia University School of International and Public Affairs, since 2008; formerly, Visiting Assistant Professor, Fairfield University, Dolan School of Business, Fall 2007; formerly, Adjunct Associate Professor of Finance, Richmond, The American International University in London, 1999 to 2007. | |
| 50 |
| | Board member, The Maritime Aquarium at Norwalk, since 2020; Board member, Norwalk Community College Foundation, since 2014; Dean's Advisory Council, Radcliffe Institute for Advanced Study, since 2014; formerly, Director and Treasurer, At Home in Darien (not-for- profit), 2012 to 2014; formerly, Director, National Executive Service Corps (not-for- profit), 2012 to 2013; formerly, Trustee, Richmond, The American International University in London, 1999 to 2013. | |
29
Name, (Year of Birth),
and Address(1) | | Position(s)
and Length of
Time Served(2) | | Principal Occupation(s)(3) | | Number of
Funds in Fund
Complex
Overseen by
Fund Trustee | | Other Directorships
Held Outside Fund
Complex by Fund
Trustee(3) | |
George W. Morriss (1947) | | Trustee since 2007 | | Formerly, Adjunct Professor, Columbia University School of International and Public Affairs, 2012 to 2018; formerly, Executive Vice President and Chief Financial Officer, People's United Bank, Connecticut (a financial services company), 1991 to 2001. | |
| 50 |
| | Director, 1 WS Credit Income Fund; Chair, Audit Committee, since 2018; Director and Chair, Thrivent Church Loan and Income Fund, since 2018; formerly, Trustee, Steben Alternative Investment Funds, Steben Select Multi-Strategy Fund, and Steben Select Multi-Strategy Master Fund, 2013 to 2017; formerly, Treasurer, National Association of Corporate Directors, Connecticut Chapter, 2011 to 2015; formerly, Manager, Larch Lane Multi-Strategy Fund complex (which consisted of three funds), 2006 to 2011; formerly, Member, NASDAQ Issuers' Affairs Committee, 1995 to 2003. | |
Tom D. Seip (1950) | | Trustee since 2000; Chairman of the Board since 2008; formerly Lead Independent Trustee from 2006 to 2008 | | Formerly, Managing Member, Ridgefield Farm LLC (a private investment vehicle), 2004 to 2016; formerly, President and CEO, Westaff, Inc. (temporary staffing), May 2001 to January 2002; formerly, Senior Executive, The Charles Schwab Corporation, 1983 to 1998, including Chief Executive Officer, Charles Schwab Investment Management, Inc.; Trustee, Schwab Family of Funds and Schwab Investments, 1997 to 1998; and Executive Vice President-Retail Brokerage, Charles Schwab & Co., Inc., 1994 to 1997. | |
| 50 |
| | Trustee, University of Maryland, Shore Regional Health System, since 2020; formerly, Director, H&R Block, Inc. (tax services company), 2001 to 2018; formerly, Director, Talbot Hospice Inc., 2013 to 2016; formerly, Chairman, Governance and Nominating Committee, H&R Block, Inc., 2011 to 2015; formerly, Chairman, Compensation Committee, H&R Block, Inc., 2006 to 2010; formerly, Director, Forward Management, Inc. (asset management company), 1999 to 2006. | |
30
Name, (Year of Birth),
and Address(1) | | Position(s)
and Length of
Time Served(2) | | Principal Occupation(s)(3) | | Number of
Funds in Fund
Complex
Overseen by
Fund Trustee | | Other Directorships
Held Outside Fund
Complex by Fund
Trustee(3) | |
James G. Stavridis (1955) | | Trustee since 2015 | | Vice Chairman Global Affairs, The Carlyle Group, since 2018; Commentator, NBC News, since 2015; formerly, Dean, Fletcher School of Law and Diplomacy, Tufts University, 2013 to 2018; formerly, Admiral, United States Navy, 1976 to 2013, including Supreme Allied Commander, NATO and Commander, European Command, 2009 to 2013, and Commander, United States Southern Command, 2006 to 2009. | |
| 50 |
| | Director, Fortinet (cybersecurity), since 2021; Director, Ankura, since 2020; Director, Vigor Shipyard, since 2019; Director, Rockefeller Foundation, since 2018; Director, American Water (water utility), since 2018; Director, NFP Corp. (insurance broker and consultant), since 2017; Director, Onassis Foundation, since 2014; Director, Michael Baker International (construction) since 2014; Director, Vertical Knowledge, LLC, since 2013; formerly, Director, U.S. Naval Institute, 2014 to 2019; formerly, Director, Navy Federal Credit Union, 2000 to 2002; formerly, Director, BMC Software Federal, LLC, 2014 to 2019. | |
31
Name, (Year of Birth),
and Address(1) | | Position(s)
and Length of
Time Served(2) | | Principal Occupation(s)(3) | | Number of
Funds in Fund
Complex
Overseen by
Fund Trustee | | Other Directorships
Held Outside Fund
Complex by Fund
Trustee(3) | |
Fund Trustees who are "Interested Persons" | |
Joseph V. Amato* (1962) | | Chief Executive Officer and President since 2018 and Trustee since 2009 | | President and Director, Neuberger Berman Group LLC, since 2009; President and Chief Executive Officer, Neuberger Berman BD LLC and Neuberger Berman Holdings LLC (including its predecessor, Neuberger Berman Inc.), since 2007; Chief Investment Officer (Equities) and President (Equities), NBIA (formerly, Neuberger Berman Fixed Income LLC and including predecessor entities), since 2007, and Board Member of NBIA since 2006; formerly, Global Head of Asset Management of Lehman Brothers Holdings Inc.'s ("LBHI") Investment Management Division, 2006 to 2009; formerly, member of LBHI's Investment Management Division's Executive Management Committee, 2006 to 2009; formerly, Managing Director, Lehman Brothers Inc. ("LBI"), 2006 to 2008; formerly, Chief Recruiting and Development Officer, LBI, 2005 to 2006; formerly, Global Head of LBI's Equity Sales and a Member of its Equities Division Executive Committee, 2003 to 2005; President and Chief Executive Officer, twelve registered investment companies for which NBIA acts as investment manager and/or administrator. | |
| 50 |
| | Member of Board of Advisors, McDonough School of Business, Georgetown University, since 2001; Member of New York City Board of Advisors, Teach for America, since 2005; Trustee, Montclair Kimberley Academy (private school), since 2007; Member of Board of Regents, Georgetown University, since 2013. | |
(1) The business address of each listed person is 1290 Avenue of the Americas, New York, New York 10104.
32
(2) Pursuant to the Trust's Amended and Restated Trust Instrument, subject to any limitations on the term of service imposed by the By-Laws or any retirement policy adopted by the Fund Trustees, each Fund Trustee shall hold office for life or until his or her successor is elected or the Trust terminates; except that (a) any Fund Trustee may resign by delivering a written resignation; (b) any Fund Trustee may be removed with or without cause at any time by a written instrument signed by at least two-thirds of the other Fund Trustees; (c) any Fund Trustee who requests to be retired, or who has become unable to serve, may be retired by a written instrument signed by a majority of the other Fund Trustees; and (d) any Fund Trustee may be removed at any shareholder meeting by a vote of at least two-thirds of the outstanding shares.
(3) Except as otherwise indicated, each individual has held the positions shown during at least the last five years.
* Indicates a Fund Trustee who is an "interested person" within the meaning of the 1940 Act. Mr. Amato is an interested person of the Trust by virtue of the fact that he is an officer of NBIA and/or its affiliates.
33
Information about the Officers of the Trust
Name, (Year of Birth),
and Address(1) | | Position(s)
and Length of
Time Served(2) | | Principal Occupation(s)(3) | |
Claudia A. Brandon (1956) | | Executive Vice President since 2008 and Secretary since 1985 | | Senior Vice President, Neuberger Berman, since 2007 and Employee since 1999; Senior Vice President, NBIA, since 2008 and Assistant Secretary since 2004; formerly, Vice President, Neuberger Berman, 2002 to 2006; formerly, Vice President—Mutual Fund Board Relations, NBIA, 2000 to 2008; formerly, Vice President, NBIA, 1986 to 1999 and Employee, 1984 to 1999; Executive Vice President and Secretary, thirty-three registered investment companies for which NBIA acts as investment manager and/or administrator. | |
Agnes Diaz (1971) | | Vice President since 2013 | | Senior Vice President, Neuberger Berman, since 2012; Senior Vice President, NBIA, since 2012, and Employee since 1996; formerly, Vice President, Neuberger Berman, 2007 to 2012; Vice President, twelve registered investment companies for which NBIA acts as investment manager and/or administrator. | |
Anthony DiBernardo (1979) | | Assistant Treasurer since 2011 | | Senior Vice President, Neuberger Berman, since 2014; Senior Vice President, NBIA, since 2014, and Employee since 2003; formerly, Vice President, Neuberger Berman, 2009 to 2014; Assistant Treasurer, twelve registered investment companies for which NBIA acts as investment manager and/or administrator. | |
Savonne L. Ferguson (1973) | | Chief Compliance Officer since 2018 | | Senior Vice President, Chief Compliance Officer (Mutual Funds) and Associate General Counsel, NBIA, since November 2018; formerly, Vice President, T. Rowe Price Group, Inc., 2018; Vice President and Senior Legal Counsel, T. Rowe Price Associates, Inc., 2014 to 2018; Vice President and Director of Regulatory Fund Administration, PNC Capital Advisors, LLC, 2009 to 2014; Secretary, PNC Funds and PNC Advantage Funds 2010 to 2014; Chief Compliance Officer, thirty-three registered investment companies for which NBIA acts as investment manager and/or administrator. | |
Corey A. Issing (1978) | | Chief Legal Officer since 2016 (only for purposes of sections 307 and 406 of the Sarbanes-Oxley Act of 2002) | | General Counsel—Mutual Funds, since 2016 and Managing Director, NBIA, since 2017; formerly, Associate General Counsel, 2015 to 2016; Counsel, 2007 to 2015; Senior Vice President, 2013 to 2016; Vice President, 2009 to 2013; Chief Legal Officer (only for purposes of sections 307 and 406 of the Sarbanes-Oxley Act of 2002), thirty-three registered investment companies for which NBIA acts as investment manager and/or administrator. | |
Sheila R. James (1965) | | Assistant Secretary since 2002 | | Senior Vice President, Neuberger Berman, since 2023; Vice President, Neuberger Berman, since 2008 and Employee since 1999; Vice President, NBIA, since 2008; formerly, Assistant Vice President, Neuberger Berman, 2007; Employee, NBIA, 1991 to 1999; Assistant Secretary, thirty-three registered investment companies for which NBIA acts as investment manager and/or administrator. | |
34
Name, (Year of Birth),
and Address(1) | | Position(s)
and Length of
Time Served(2) | | Principal Occupation(s)(3) | |
Brian Kerrane (1969) | | Chief Operating Officer since 2015 and Vice President since 2008 | | Managing Director, Neuberger Berman, since 2013; Chief Operating Officer—Mutual Funds and Managing Director, NBIA, since 2015; formerly, Senior Vice President, Neuberger Berman, 2006 to 2014; Vice President, NBIA, 2008 to 2015 and Employee since 1991; Chief Operating Officer, twelve registered investment companies for which NBIA acts as investment manager and/or administrator; Vice President, thirty-three registered investment companies for which NBIA acts as investment manager and/or administrator. | |
Anthony Maltese (1959) | | Vice President since 2015 | | Senior Vice President, Neuberger Berman, since 2014 and Employee since 2000; Senior Vice President, NBIA, since 2014; Vice President, twelve registered investment companies for which NBIA acts as investment manager and/or administrator. | |
Josephine Marone (1963) | | Assistant Secretary since 2017 | | Senior Paralegal, Neuberger Berman, since 2007 and Employee since 2007; Assistant Secretary, thirty-three registered investment companies for which NBIA acts as investment manager and/or administrator. | |
Owen F. McEntee, Jr. (1961) | | Vice President since 2008 | | Vice President, Neuberger Berman, since 2006; Vice President, NBIA, since 2006 and Employee since 1992; Vice President, twelve registered investment companies for which NBIA acts as investment manager and/or administrator. | |
John M. McGovern (1970) | | Treasurer and Principal Financial and Accounting Officer since 2005 | | Managing Director, Neuberger Berman, since 2022; Senior Vice President, Neuberger Berman, 2007 to 2021; Senior Vice President, NBIA, since 2007 and Employee since 1993; formerly, Vice President, Neuberger Berman, 2004 to 2006; formerly, Assistant Treasurer, 2002 to 2005; Treasurer and Principal Financial and Accounting Officer, twelve registered investment companies for which NBIA acts as investment manager and/or administrator. | |
Frank Rosato (1971) | | Assistant Treasurer since 2005 | | Vice President, Neuberger Berman, since 2006; Vice President, NBIA, since 2006 and Employee since 1995; Assistant Treasurer, twelve registered investment companies for which NBIA acts as investment manager and/or administrator. | |
Niketh Velamoor (1979) | | Anti-Money Laundering Compliance Officer since 2018 | | Senior Vice President and Associate General Counsel, Neuberger Berman, since July 2018; Assistant United States Attorney, Southern District of New York, 2009 to 2018; Anti-Money Laundering Compliance Officer, five registered investment companies for which NBIA acts as investment manager and/or administrator. | |
(1) The business address of each listed person is 1290 Avenue of the Americas, New York, New York 10104.
(2) Pursuant to the By-Laws of the Trust, each officer elected by the Fund Trustees shall hold office until his or her successor shall have been elected and qualified or until his or her earlier death, inability to serve, or resignation. Officers serve at the pleasure of the Fund Trustees and may be removed at any time with or without cause.
(3) Except as otherwise indicated, each individual has held the positions shown during at least the last five years.
35
Proxy Voting Policies and Procedures
A description of the policies and procedures that the Trust uses to determine how to vote proxies relating to portfolio securities is available, without charge, by calling 800-877-9700 (toll-free) and on the SEC's website at www.sec.gov. Information regarding how the Trust voted proxies relating to portfolio securities during the most recent 12-month period ended June 30 is also available upon request, without charge, by calling 800-877-9700 (toll-free), on the SEC's website at www.sec.gov, and on Neuberger Berman's website at www.nb.com.
Quarterly Portfolio Schedule
The Trust files a complete schedule of portfolio holdings for the Fund with the SEC for the first and third quarters of each fiscal year as an exhibit to its report on Form N-PORT. The Trust's Form N-PORT is available on the SEC's website at www.sec.gov. The portfolio holdings information on Form N-PORT is available upon request, without charge, by calling 800-877-9700 (toll-free).
Report of Votes of Shareholders
A Special Meeting of Shareholders was held on June 30, 2022 for the Neuberger Berman Advisers Management Trust Portfolios (the "Trust"). Shareholders voted to approve the election of four trustees to the Board of Trustees of the Trust and to approve the amendment of certain fundamental investment policies of the Trust, Including the Fund:
Proposal 1—To approve the election of Michael J. Cosgrove, Marc Gary, Deborah C. McLean, and James G. Stavridis as Trustees to the Board of Trustees of the Trust as follows:
Neuberger Berman Advisers Management Trust Portfolios:
| | Number of Shares | |
| | Votes For | | Votes Against | | Abstentions | |
Michael J. Cosgrove | | | 34,898,362 | | | | — | | | | 1,716,138 | | |
Marc Gary | | | 34,979,049 | | | | — | | | | 1,635,451 | | |
Deborah C. McLean | | | 34,951,303 | | | | — | | | | 1,663,197 | | |
James G. Stavridis | | | 34,888,635 | | | | — | | | | 1,725,865 | | |
Proposal 2—To approve the amendment of certain fundamental investment policies of the Fund as follows:
(A) To approve the amendment of the fundamental investment policy regarding borrowing;
(B) To approve the amendment of the fundamental investment policy regarding commodities;
(C) To approve the amendment of the fundamental investment policy regarding industry concentration;
(D) To approve the amendment of the fundamental investment policy regarding lending;
(E) To approve the amendment of the fundamental investment policy regarding investing in real estate;
(F) To approve the amendment of the fundamental investment policy regarding the issuance of senior securities to permit issuing senior securities; and
(G) To approve the amendment of the fundamental investment policy regarding underwriting.
36
AMT U.S. Equity Index PutWrite Strategy:
| | Number of Shares | |
| Proposal | | Votes For | | Votes Against | | Abstentions | |
| A | | | 2,801,262 | | | | 222,249 | | | | 79,376 | | |
| B | | | 2,878,944 | | | | 111,936 | | | | 112,008 | | |
| C | | | 2,846,485 | | | | 144,395 | | | | 112,008 | | |
| D | | | 2,878,944 | | | | 111,936 | | | | 112,008 | | |
| E | | | 2,947,335 | | | | 76,176 | | | | 79,376 | | |
| F | | | 2,947,335 | | | | 76,176 | | | | 79,376 | | |
| G | | | 2,933,030 | | | | 90,481 | | | | 79,376 | | |
Board Consideration of the Management Agreement
On an annual basis, the Board of Trustees (the "Board" or "Trustees") of Neuberger Berman Advisers Management Trust (the "Trust"), including the Trustees who are not "interested persons" of the Trust or of Neuberger Berman Investment Advisers LLC ("Management") (including its affiliates), as such term is defined under the Investment Company Act of 1940, as amended ("1940 Act"), ("Independent Fund Trustees"), considers whether to continue the management agreement with Management (the "Agreement") with respect to U.S. Equity Index PutWrite Strategy Portfolio (the "Fund"). Throughout the process, the Independent Fund Trustees are advised by counsel that is experienced in 1940 Act matters and that is independent of Management ("Independent Counsel"). At a meeting held on September 29, 2022, the Board, including the Independent Fund Trustees, approved the continuation of the Agreement for the Fund.
In evaluating the Agreement, the Board, including the Independent Fund Trustees, reviewed extensive materials provided by Management in response to questions submitted by the Independent Fund Trustees and Independent Counsel, and met with senior representatives of Management regarding its personnel, operations, and profitability as they relate to the Fund. The annual contract review extends over at least two regular meetings of the Board to ensure that Management has time to respond to any questions the Independent Fund Trustees may have on their initial review of the materials and that the Independent Fund Trustees have time to consider those responses. Additionally, the Board considered the impact of significant periods of market volatility that occurred during and after the period for which information was requested in conducting its evaluation of Management.
In connection with its deliberations, the Board also considered the broad range of information relevant to the annual contract review that is provided to the Board (including its various standing committees) at meetings throughout the year, including reports on investment performance, portfolio risk, liquidity management, and other portfolio information for the Fund, including the use of derivatives, as well as periodic reports on, among other matters, pricing and valuation; quality and cost of portfolio trade execution; compliance; and shareholder and other services provided by Management and its affiliates. The Contract Review Committee, which is comprised solely of Independent Fund Trustees, was established by the Board to assist in its evaluation and analysis of materials for the annual contract review. The Board has also established other committees that focus throughout the year on specific areas relevant to the annual contract review, such as Fund performance or compliance matters, and that are charged with specific responsibilities regarding the annual contract review. Those committees provide reports to the full Board, including the members of the Contract Review Committee, which consider that information as part of the annual contract review process. The Contract Review Committee annually considers and updates the questions it asks of Management in light of legal advice furnished to it by Independent Counsel; its own business judgment; and developments in the industry, in the markets, in mutual fund regulation and litigation, and in Management's business model.
The Independent Fund Trustees received from Independent Counsel a memorandum discussing the legal standards for their consideration of the proposed continuation of the Agreement. During the course of the year and during their deliberations regarding the annual contract review, the Contract Review Committee and the Independent Fund Trustees met with Independent Counsel separately from representatives of Management.
37
Provided below is a description of the Board's contract approval process and material factors that the Board considered at its meetings regarding renewal of the Agreement and the compensation to be paid thereunder. In connection with its approval of the continuation of the Agreement, the Board evaluated the terms of the Agreement, the overall fairness of the Agreement to the Fund, and whether the Agreement was in the best interests of the Fund and its shareholders. The Board's determination to approve the continuation of the Agreement was based on a comprehensive consideration of all information provided to the Board throughout the year and specifically in connection with the annual contract review. The Board considered the Fund's investment management agreement separately from those of other funds of the Trust.
This description is not intended to include all of the factors considered by the Board. The Board members did not identify any particular information or factor that was all-important or controlling, and each Trustee may have attributed different weights to the various factors. The Board focused on the costs and benefits of the Agreement to the Fund and, through the Fund, its shareholders.
Nature, Extent, and Quality of Services
With respect to the nature, extent, and quality of the services provided, the Board considered the investment philosophy and decision-making processes of, and the qualifications, experience, and capabilities of, and the resources available to, the portfolio management personnel of Management who perform services for the Fund. The Board noted that Management also provides certain administrative services, including fund accounting and compliance services. The Board also considered Management's policies and practices regarding brokerage, commissions, other trading costs, and allocation of portfolio transactions and reviewed the quality of the execution services that Management had provided. The Board also reviewed Management's use of brokers to execute Fund transactions that provide research services to Management. Moreover, the Board considered Management's approach to potential conflicts of interest both generally and between the Fund's investments and those of other funds or accounts managed by Management. The Board noted the additional responsibilities of Management in administering the liquidity risk management program.
The Board recognized the extensive range of services that Management provides to the Fund beyond the investment management services. The Board noted that Management is also responsible for monitoring compliance with the Fund's investment objectives, policies, and restrictions, as well as compliance with applicable law, including implementing rulemaking initiatives of the U.S. Securities and Exchange Commission. The Board considered that Management assumes significant ongoing entrepreneurial and business risks as the investment adviser and sponsor for the Fund, for which it is entitled to reasonable compensation. The Trustees also considered that Management's responsibilities include continual management of investment, operational, cybersecurity, enterprise, legal, regulatory, and compliance risks as they relate to the Fund, and the Board considers on a regular basis information regarding Management's processes for monitoring and managing risk. In addition, the Board also noted that when Management launches a new fund or share class, it assumes entrepreneurial risk with respect to that fund or share class, and that some funds and share classes have been liquidated without ever having been profitable to Management.
The Board also reviewed and evaluated Management's activities under its contractual obligation to oversee the Fund's various outside service providers, including its renegotiation of certain service providers' fees and its evaluation of service providers' infrastructure, cybersecurity programs, compliance programs, and business continuity programs, among other matters. The Board also considered Management's ongoing development of its own infrastructure and information technology to support the Fund through, among other things, cybersecurity, business continuity planning, and risk management. The Board noted Management's largely seamless implementation of its business continuity plan in response to the COVID-19 pandemic and its success in continuously providing services to the Fund notwithstanding the disruptions caused by the pandemic. In addition, the Board noted the positive compliance history of Management, as no significant compliance problems were reported to the Board with respect to Management. The Board also considered the general structure of the portfolio managers' compensation and whether this structure provides appropriate incentives to act in the best interests of the Fund. The Board also considered the ability of Management to attract and retain qualified personnel to service the Fund.
38
As in past years, the Board also considered the manner in which Management addressed various matters that arose during the year, some of them a result of developments in the broader fund industry or the regulations governing it. In addition, the Board considered actions taken by Management in response to market conditions and considered the overall performance of Management in this context.
Fund Performance
The Board requested a report from an outside consulting firm that specializes in the analysis of fund industry data that compared the Fund's performance, along with its fees and other expenses, to a group of industry peers ("Expense Group") and to a broader universe of funds pursuing generally similar strategies with the same investment classification and/or objective ("Performance Universe"). The Board considered the outside consulting group's statements regarding the composition of each of the Expense Group and Performance Universe and whether they were inclusive of non-proprietary funds, such as the Fund, operated for insurance company investors by independent investment managers or both proprietary funds that are operated by insurance companies or their affiliates, and non-proprietary funds. The Board considered the Fund's performance and fees in light of the limitations inherent in the methodology for constructing such comparative groups and determining which investment companies should be included in the comparative groups, noting differences as compared to certain fund industry ranking and rating systems. The Board also considered the impact and inherent limitation on the comparisons due to the small number of funds included in the Fund's Expense Group and Performance Universe.
With respect to investment performance, the Board considered information regarding the Fund's short-term performance, net of the Fund's fees and expenses, on an absolute basis, relative to a benchmark index that does not deduct the fees or expenses of investing, and compared to the performance of the Expense Group and Performance Universe, each constructed by the consulting firm. The Board also reviewed performance in relation to certain measures of the degree of investment risk undertaken by the portfolio managers.
The Performance Universe referenced in this section was identified by the consulting firm, as discussed above. For any period of underperformance, the Board considered the magnitude and duration of that underperformance relative to the Performance Universe, and/or the benchmark (e.g., the amount by which a Fund underperformed, including, for example, whether the Fund slightly underperformed or significantly underperformed its benchmark). With respect to performance quintile rankings for the Fund compared to its Performance Universe, the first quintile represents the highest (best) performance and the fifth quintile represents the lowest performance. For investment performance comparisons, the Board looked at the Fund's Class S as a proxy for both of the Fund's classes.
With regard to performance, the Board considered that the Fund adopted an entirely new investment strategy in May 2017. The Board considered that, for its new investment strategy since May 2017, based on performance data for the periods ended December 31, 2021: (1) as compared to its prior benchmark, the Fund's performance was higher for the 1-, 3-, and 5-year periods; and (2) as compared to its Performance Universe, the Fund's performance ranked third out of three funds for the 1-year period and first out of two funds for the 3- and 5-year periods. The Board also noted the Fund's ranking was in the third quintile of its Lipper peer category for the 7-month period ending July 31, 2022. In addition, the Board noted that in February 2022, Management added a new portfolio manager, adjusted its strategy, and changed its benchmark index to an index with characteristics that are more representative of the Fund's investment strategy.
The Board recognized that the performance data reflects a snapshot of a period as of a particular date and that selecting a different performance period could produce significantly different results. The Board further acknowledged that long-term performance could be impacted by even one period of significant outperformance or underperformance, and that a single investment theme could disproportionately affect performance. The Board also considered Management's responsiveness to the Fund's relative performance. In this regard, the Board noted that performance, especially short-term performance, is only one of the factors that it deems relevant to its consideration of the Agreement and that, after considering all relevant factors, it determined to approve the continuation of the Agreement.
39
Fee Rates, Profitability, and Fall-out Benefits
With respect to the overall fairness of the Agreement, the Board considered the fee structure for the Fund under the Agreement as compared to the Expense Group provided by the consulting firm, as discussed above. The Board reviewed a comparison of the Fund's management fee to its Expense Group. The Board noted that the comparative management fee analysis includes, in the Fund's management fee, the separate administrative fees paid to Management. However, the Board noted that some funds in the Expense Group pay directly from fund assets for certain services that Management covers out of the administration fees for the Fund. Accordingly, the Board also considered the Fund's total expense ratio as compared with its Expense Group as a way of taking account of these differences.
The Board compared the Fund's contractual and actual management fees to the median of the contractual and actual management fees, respectively, of the Fund's Expense Group. (The actual management fees are the contractual management fees reduced by any fee waivers or other adjustments.) The Board also compared the Fund's total expenses to the median of the total expenses of the Fund's Expense Group. The Board noted that the Fund's total expenses were higher than the Expense Group median, and considered whether specific portfolio management, administration or oversight needs or the Fund's relatively small size contributed to the Fund's total expenses. With respect to the quintile rankings for fees and total expenses (net of waivers or other adjustments, if any) for the Fund compared to its Expense Group, the first quintile represents the lowest (best) fees and/or total expenses and the fifth quintile represents the highest fees and/or total expenses. For fee comparisons, the Board looked at the Fund's Class S as a proxy for both of the Fund's classes.
The Board considered that, as compared to its Expense Group, the Fund's contractual management fee ranked in the third quintile, the actual management fee net of fees waived by Management ranked in the first quintile, and total expenses ranked in the fourth quintile. In addition to considering the above-referenced factors, the Board took note of its ongoing dialogue with Management regarding the dynamics of the insurance/annuity marketplace. The Board considered, among other matters, related tax restrictions and the unique challenges facing that market generally, which assisted the Board in understanding the context for the Fund's expense ratio and performance.
In concluding that the benefits accruing to Management and its affiliates by virtue of their relationship with the Fund were reasonable in light of the costs of providing the investment advisory and other services and the benefits accruing to the Fund, the Board reviewed specific data as to Management's estimated loss on the Fund for a recent period on a pre-tax basis without regard to distribution expenses. (The Board also reviewed data on Management's estimated loss on the Fund after distribution/servicing expenses and taxes were factored in, as indicators of the health of the business and the extent to which Management is directing its profits into the growth of the business.) The Board considered the cost allocation methodology that Management used in developing its estimated profitability figures. In recent years, the Board engaged an independent forensic accountant to review the profitability methodology utilized by Management when preparing this information and discussed with the consultant its conclusion that Management's process for calculating and reporting its estimated loss was not unreasonable.
Recognizing that there is no uniform methodology regarding the allocation of firm-wide or complex-wide expenses within the asset management industry for determining profitability for this purpose and that the use of different reasonable methodologies can give rise to different profit and loss results, the Board, in the past, requested from Management examples of profitability calculated by different methods and noted that the estimated profitability levels were still reasonable when calculated by these other methods. The Board further noted Management's representation that its estimate of profitability is derived using methodology that is consistent with the methodology used to assess and/or report measures of profitability elsewhere at the firm. In addition, the Board recognized that Management's calculations regarding its costs may not reflect all risks, including regulatory, legal, operational, cybersecurity, reputational, and, where appropriate, entrepreneurial risks, associated with offering and managing a mutual fund in the current regulatory and market environment. The Board also considered any fall-out (i.e., indirect) benefits likely to accrue to Management or its affiliates from their relationship with the Fund, such as research it may receive from broker-dealers executing the Fund's portfolio transactions on an agency basis. The Board noted that Management incurred a loss on its management of the Fund during the review period even before consideration of distribution expenses and taxes.
40
Information Regarding Services to Other Clients
The Board also considered other funds and separate accounts that were advised or sub-advised by Management or its affiliates with investment objectives, policies and strategies that were similar to those of the Fund, and compared the fees charged to the Fund to the fees charged to such comparable funds and separate accounts. The Board considered the appropriateness and reasonableness of any differences between the fees charged to a Fund and such comparable funds and/or separate accounts, and determined that differences in fees and fee structures were consistent with the differences in the management and other services provided. The Board explored with Management its assertion that although, generally, the rates of fees paid by such accounts, except other Neuberger Berman mutual funds, were lower than the fee rates paid by the corresponding Fund, the differences reflected Management's greater level of responsibilities and significantly broader scope of services to the Fund, the more extensive regulatory obligations and risks associated with managing the Fund, and other financial considerations with respect to creation and sponsorship of the Fund.
Economies of Scale
The Board also evaluated apparent or anticipated economies of scale in relation to the services Management provides to the Fund. The Board considered that the Fund's fee structure does not provide for a reduction of payments resulting from the use of breakpoints, and concluded that the lack of breakpoints was reasonable based on the consideration that setting competitive fee rates and pricing the Fund to scale are other means of sharing potential economies of scale with shareholders. In addition, the Board considered the expense limitation and/or fee waiver arrangements that reduces Fund expenses at all asset levels which can have an effect similar to breakpoints in sharing economies of scale with shareholders and provide protection from an increase in expenses if the Fund's assets decline. The Board also considered that Management has provided, at no added cost to the Fund, certain additional services, including but not limited to, services required by new regulations or regulatory interpretations, services impelled by changes in the securities markets or the business landscape, and/or services requested by the Board. The Board considered that this is a way of sharing economies of scale with the Fund and its shareholders.
Conclusions
In approving the continuation of the Agreement, the Board concluded that, in its business judgment, the terms of the Agreement are fair and reasonable to the Fund and that approval of the continuation of the Agreement is in the best interests of the Fund and its shareholders. In reaching this determination, the Board considered that Management could be expected to continue to provide a high level of service to the Fund; that the performance of the Fund was satisfactory over time; that the Board retained confidence in Management's capabilities to manage the Fund; that the Fund's fee structure appeared to the Board to be reasonable given the nature, extent, and quality of services provided or the Fund's relatively small size; and that the benefits accruing to Management and its affiliates by virtue of their relationship with the Fund were reasonable in light of the costs of providing the investment advisory and other services and the benefits accruing to the Fund. The Board's conclusions may be based in part on its consideration of materials prepared in connection with the approval or continuance of the Agreement in prior years and on the Board's ongoing regular review of Fund performance and operations throughout the year, in addition to material prepared specifically for the most recent annual review of the Agreement.
41
(b) Not applicable to the Registrant.
Item 2. Code of Ethics.
The Board of Trustees (“Board”) of Neuberger Berman Advisers Management Trust (“Registrant”) has adopted a code of ethics that applies to the Registrant's principal executive officer, principal financial officer, principal accounting officer or controller, or persons performing similar functions (“Code of Ethics”). During the period covered by this Form N-CSR, there were no substantive amendments to the Code of Ethics and there were no waivers from the Code of Ethics granted to the Registrant's principal executive officer, principal financial officer, principal accounting officer or controller, or persons performing similar functions.
Item 3. Audit Committee Financial Expert.
The Board has determined that the Registrant has three audit committee financial experts serving on its audit committee. The Registrant’s audit committee financial experts are Michael J. Cosgrove, Martha C. Goss, and Deborah C. McLean. Mr. Cosgrove, Ms. Goss, and Ms. McLean are independent trustees as defined by Form N-CSR.
Item 4. Principal Accountant Fees and Services.
Ernst & Young LLP (“E&Y”) serves as independent registered public accounting firm to International Equity Portfolio, Mid Cap Growth Portfolio, Mid Cap Intrinsic Value Portfolio, Short Duration Bond Portfolio, Sustainable Equity Portfolio, and U.S. Equity Index PutWrite Strategy Portfolio (collectively, the “Funds”). The Funds commenced operations on, respectively, April 29, 2005, November 3, 1997, August 22, 2001, July 12, 2002, February 18, 1999, and May 1, 2014.
The aggregate fees billed for professional services rendered by E&Y for the audit of the annual financial statements or services that are normally provided by E&Y in connection with statutory and regulatory filings or engagements were $227,590 and $218,200 for the fiscal years ended 2021 and 2022, respectively.
The aggregate fees billed to the Registrant for assurance and related services by E&Y that are reasonably related to the performance of the audit of the Registrant’s financial statements and are not reported above in Audit Fees were $0 and $0 for the fiscal years ended 2021 and 2022, respectively. The Audit Committee approved 0% and 0% of these services provided by E&Y for the fiscal years ended 2021 and 2022, respectively, pursuant to the waiver provisions of Rule 2-01(c)(7)(i)(C) of Regulation S-X.
The fees billed to other entities in the investment company complex for assurance and related services by E&Y that are reasonably related to the performance of the audit that the Audit Committee was required to approve because the engagement related directly to the operations and financial reporting of the Registrant were $0 and $0 for the fiscal years ended 2021 and 2022, respectively. The Audit Committee approved 0% and 0% of these services provided by E&Y for the fiscal years ended 2021 and 2022, respectively, pursuant to the waiver provisions of Rule 2-01(c)(7)(i)(C) of Regulation S-X.
The aggregate fees billed to the Registrant for professional services rendered by E&Y for tax compliance, tax advice, and tax planning were $53,730 and $56,170 for the fiscal years ended 2021 and 2022, respectively. The nature of the services provided includes preparation of the Federal and State tax extensions and tax returns, review of annual excise tax calculations, and preparation of form 8613, in addition to assistance with the identification of Passive Foreign Investment Companies ("PFICs"), assistance with determination of various foreign withholding taxes, and assistance with Internal Revenue Code and tax regulation requirements for fund investments. The Audit Committee approved 0% and 0% of these services provided by E&Y for the fiscal years ended 2021 and 2022, respectively, pursuant to the waiver provisions of Rule 2-01(c)(7)(i)(C) of Regulation S-X.
The fees billed to other entities in the investment company complex for professional services rendered by E&Y for tax compliance, tax advice, and tax planning that the Audit Committee was required to approve because the engagement related directly to the operations and financial reporting of the Registrant were $0 and $0 for the fiscal years ended 2021 and 2022, respectively. The Audit Committee approved 0% and 0% of these services provided by E&Y for the fiscal years ended 2021 and 2022, respectively, pursuant to the waiver provisions of Rule 2-01(c)(7)(i)(C) of Regulation S-X.
The aggregate fees billed to the Registrant for products and services provided by E&Y, other than services reported in Audit Fees, Audit-Related Fees, and Tax Fees were $0 and $0 for the fiscal years ended 2021 and 2022, respectively. The Audit Committee approved 0% and 0% of these services provided by E&Y for the fiscal years ended 2021 and 2022, respectively, pursuant to the waiver provisions of Rule 2-01(c)(7)(i)(C) of Regulation S-X.
The fees billed to other entities in the investment company complex for products and services provided by E&Y, other than services reported in Audit Fees, Audit-Related Fees, and Tax Fees, that the Audit Committee was required to approve because the engagement related directly to the operations and financial reporting of the Registrant were $0 and $0 for the fiscal years ended 2021 and 2022, respectively. The Audit Committee approved 0% and 0% of these services provided by E&Y for the fiscal years ended 2021 and 2022, respectively, pursuant to the waiver provisions of Rule 2-01(c)(7)(i)(C) of Regulation S-X.
(1) The Audit Committee’s pre-approval policies and procedures for the Registrant to engage an accountant to render audit and non-audit services delegate to each member of the Committee the power to pre-approve services between meetings of the Committee.
(2) None of the services described in paragraphs (b) through (d) above were approved by the Audit Committee pursuant to paragraph (c)(7)(i)(C) of Rule 2-01 of Regulation S-X.
Not applicable.
Non-audit fees billed by E&Y for services rendered to the Registrant were $53,730 and $56,170 for the fiscal years ended 2021 and 2022, respectively.
Non-audit fees billed by E&Y for services rendered to the Registrant’s investment adviser and any entity controlling, controlled by, or under common control with the adviser that provides ongoing services to the Registrant were $0 and $0 for the fiscal years ended 2021 and 2022, respectively.
(h) The Audit Committee of the Board considered whether the provision of non-audit services rendered to the Registrant’s investment adviser and any entity controlling, controlled by, or under common control with the adviser that provides ongoing services to the Registrant that were not pre-approved by the Audit Committee because the engagement did not relate directly to the operations and financial reporting of the Registrant is compatible with maintaining E&Y’s independence.
Item 5. Audit Committee of Listed Registrants.
Not applicable to the Registrant.
Item 6. Schedule of Investments.
The complete schedule of investments for each series is disclosed in the Registrant's applicable annual report included as Item 1 of this Form N-CSR.
Item 7. Disclosure of Proxy Voting Policies and Procedures for Closed-End Management Investment Companies.
Not applicable to the Registrant.
Item 8. Portfolio Managers of Closed-End Management Investment Companies.
Not applicable to the Registrant.
Item 9. Purchases of Equity Securities by Closed-End Management Investment Company and Affiliated Purchasers.
Not applicable to the Registrant.
Item 10. Submission of Matters to a Vote of Security Holders.
There were no changes to the procedures by which shareholders may recommend nominees to the Board.
Item 11. Controls and Procedures.
Item 12. Disclosure of Securities Lending Activities for Closed-End Management Investment Companies.
Not applicable to the Registrant.
Item 13. Exhibits.
(a) (3 ) Not applicable to the Registrant.
(a) (4) Not applicable to the Registrant.
The certification furnished pursuant to Rule 30a-2(b) under the Act and Section 906 of the Sarbanes-Oxley Act will not be deemed “filed” for purposes of Section 18 of the Securities Exchange Act of 1934, as amended (“Exchange Act”), or otherwise subject to the liability of that section. Such certification will not be deemed to be incorporated by reference into any filing under the Securities Act of 1933, as amended, or the Exchange Act, except to the extent that the Registrant specifically incorporates it by reference.
Pursuant to the requirements of the Securities Exchange Act of 1934 and the Investment Company Act of 1940, the Registrant has duly caused this report to be signed on its behalf by the undersigned, thereunto duly authorized.
Pursuant to the requirements of the Securities Exchange Act of 1934 and the Investment Company Act of 1940, this report has been signed below by the following persons on behalf of the Registrant and in the capacities and on the dates indicated.