Joseph V. Amato
Arthur C. Delibert, Esq.
1601 K Street, N.W.
Washington, D.C. 20006-1600
Form N-CSR is to be used by management investment companies to file reports with the Commission not later than 10 days after the transmission to stockholders of any report that is required to be transmitted to stockholders under Rule 30e-1 under the Investment Company Act of 1940, as amended (“Act”) (17 CFR 270.30e-1). The Commission may use the information provided on Form N-CSR in its regulatory, disclosure review, inspection, and policymaking roles.
A registrant is required to disclose the information specified by Form N-CSR, and the Commission will make this information public. A registrant is not required to respond to the collection of information contained in Form N-CSR unless the Form displays a currently valid Office of Management and Budget (“OMB”) control number. Please direct comments concerning the accuracy of the information collection burden estimate and any suggestions for reducing the burden to the Secretary, Securities and Exchange Commission, 100 F Street, NE, Washington, DC 20549-1090. The OMB has reviewed this collection of information under the clearance requirements of 44 U.S.C. §3507.
Item 1. Report to Shareholders.
Following are copies of the annual reports transmitted to shareholders pursuant to Rule 30e-1 under the Act.

Neuberger Berman
Advisers Management Trust
International Equity Portfolio
I Class Shares
S Class Shares
Annual Report
December 31, 2020
As permitted by regulations adopted by the U.S. Securities and Exchange Commission, you may no longer receive paper copies of the Fund's annual and semi-annual shareholder reports by mail from the insurance company that issued your variable annuity and variable life insurance contract or from the financial intermediary that administers your qualified pension or retirement plan, unless you specifically request paper copies of the reports from your insurance company or financial intermediary. Instead, the reports will be made available on the Fund's website www.nb.com/AMTliterature, and may also be available on a website from the insurance company or financial intermediary that offers your contract or administers your retirement plan, and such insurance company or financial intermediary will notify you by mail each time a report is posted and provide you with a website link to access the report.
If you already elected to receive shareholder reports electronically, you will not be affected by this change and you need not take any action. You may elect to receive shareholder reports and other communications from the insurance company or financial intermediary electronically by following the instructions provided by the insurance company or financial intermediary. If offered by your insurance company or financial intermediary, you may elect to receive all future reports in paper and free of charge from the insurance company or financial intermediary. You can contact your insurance company or financial intermediary if you wish to continue receiving paper copies of your shareholder reports. Your election to receive reports in paper will apply to all funds available under your contract or retirement plan.
International Equity Portfolio Commentary (Unaudited)
The Neuberger Berman Advisers Management Trust International Equity Portfolio Class S posted a total return of 12.57% for the 12-month period ended December 31, 2020 (the reporting period), outperforming the 7.82% total return of its benchmark, the MSCI EAFE® Index (Net) (the Index) for the same period. (Performance for all share classes is provided in the table immediately following this letter.)
Global equity markets experienced a sharp correction in March, when COVID-19 began spreading globally. Developed international markets remained volatile, but generally positive from that point forward, supported by better-than-expected economic data, vaccine advances, central bank and government stimulus, and U.S. election results, which bode well for additional U.S. stimulus and more normalized trade globally. The Index results lagged the S&P 500® Index and the MSCI Emerging Markets Index, as each advanced over 18% for the reporting period.
By sector, the Index was led by Information Technology (IT), partially due to COVID-19 pandemic-related changes to work and consumer behavior, plus Materials and Consumer Discretionary stocks. Energy declined sharply as oil prices remained depressed given a combination of reduced demand and excess supply, and Real Estate and Financials also lost value. By country, Denmark, the Netherlands and Sweden outperformed, while the UK, Belgium and Singapore declined the most.
The Fund's outperformance was driven both by stock selection and sector allocation. Financials, IT and Industrials were our strongest sectors versus the Index, and the UK, Switzerland and Germany were our strongest relative markets.
Top contributors included Netherlands-based ASML, the semiconductor firm, which saw strong demand for its Extreme Ultraviolet Lithography (EUV) tools, following COVID-19 related delays in orders. Techtronic, the Hong Kong based power tool maker, saw demand rise as homeowners undertook DIY projects in lockdown, and Swiss medical devices firm Tecan saw an increase in diagnostic instrument orders due to COVID-19.
Stock selection and underweights to Consumer Discretionary, Communication Services, and Utilities versus the Index detracted from relative performance. By country, stock selection in Japan, and underweights to Denmark and Sweden were disadvantages.
We exited key detractors Samsonite, Compass Group, and Continental during the reporting period. Samsonite, the Hong Kong-based luggage maker, lagged as travel reductions threaten to extend the replacement cycle for luggage, even if tourism recovers in 2021. Compass Group, the UK-based global contract caterer, declined as stay-at-home and social-distancing orders impacted revenues across divisions. Continental, the German global automotive parts manufacturer, declined as COVID-19 economic shutdowns closed factories and weighed on automotive parts demand.
Looking ahead, while the Index underperformed the S&P 500 in 2020, it outperformed during the fourth quarter. We think that could be a harbinger for the future, given concerns over valuations in large cap U.S. growth stocks, the potential for further dollar weakness, and increased flows into an asset class that has been largely out of favor. We believe that these factors, plus the potential for faster earnings growth in Index markets, may help continue to close the gap between developed international and U.S. valuations in the year ahead.
Several of the names we bought during 2020's selloffs contributed to our strong relative performance. In keeping with our 'quality at a reasonable price' discipline, we locked in profits and recycled proceeds into areas that appeared to us more attractively valued. We continue to avoid deep value stocks, instead focusing on names where we believe investor skepticism means that valuations should offer upside even under conservative assumptions.
We have high conviction in our current portfolio companies. They have shown great resilience in a challenging period. As we emerge from the pandemic—where the market favored solid returns, secular growth, and strong balance sheets,
1
with less concern about valuations—we are increasingly focused on ensuring that we own what we believe to be the right businesses at the right price. These are the stocks that we think will reward investors in the months and quarters to come.
Sincerely,
BENJAMIN SEGAL AND ELIAS COHEN
PORTFOLIO MANAGERS
Information about principal risks of investing in the Fund is set forth in the prospectus and statement of additional information.
The portfolio composition, industries and holdings of the Fund are subject to change without notice.
The opinions expressed are those of the Fund's portfolio managers. The opinions are as of the date of this report and are subject to change without notice.
2
International Equity Portfolio (Unaudited)
PERFORMANCE HIGHLIGHTS
| | Inception | | Average Annual Total Return
Ended 12/31/2020 | |
| | Date | | 1 Year | | 5 Years | | 10 Years | | Life of Fund | |
At NAV | |
| Class I2 | | 01/30/2018 | | | 13.14 | % | | | 8.54 | % | | | 6.12 | % | | | 5.69 | % | |
Class S | | 04/29/2005 | | | 12.57 | % | | | 8.24 | % | | | 5.97 | % | | | 5.60 | % | |
Index | |
| MSCI EAFE® Index (Net)1,3 | | | | | 7.82 | % | | | 7.45 | % | | | 5.51 | % | | | 5.32 | % | |
The performance data quoted represent past performance and do not indicate future results. Current performance may be lower or higher than the performance data quoted. For current performance data, including current to the most recent month-end, please visit http://www.nb.com/amtportfolios/performance.
The results shown in the table reflect the reinvestment of income dividends and other distributions, if any. The results do not reflect the effect of taxes a shareholder would pay on Fund distributions or on the redemption of Fund shares. The results do not reflect fees and expenses of the variable annuity and variable life insurance policies or the qualified pension and retirement plans whose proceeds are invested in the Fund.
The investment return and principal value of an investment will fluctuate and shares, when redeemed, may be worth more or less than their original cost.
Returns would have been lower if Neuberger Berman Investment Advisers LLC ("Management") had not reimbursed certain expenses and/or waived a portion of the investment management fees during certain of the periods shown. Repayment by a class (of expenses previously reimbursed and/or fees previously waived by Management) will decrease the class's returns. Please see Note B in the Notes to Financial Statements for specific information regarding expense reimbursement and/or fee waiver arrangements.
As stated in the Fund's most recent prospectus, the total annual operating expense ratios for fiscal year 2019 were 1.47% and 1.72% for Class I and Class S shares, respectively (before expense reimbursements and/or fee waivers, if any). The expense ratios were 1.01% and 1.51% after expense reimbursements and/or fee waivers for Class I and Class S shares, respectively. The expense ratios for the annual period ended December 31, 2020 can be found in the Financial Highlights section of this report.
COMPARISON OF A $10,000 INVESTMENT
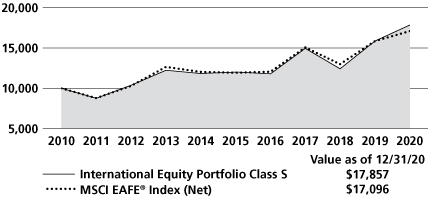
This graph shows the change in value of a hypothetical $10,000 investment in the Fund over the past 10 fiscal years, or since the Fund's inception if it has not operated for 10 years. The graph is based on Class S shares only; the performance of the Fund's share classes will differ primarily due to different class expenses (see Performance Highlights chart above). The result is compared with benchmarks, which include a broad-based market index and may include a more narrowly based index. Market indices have not been reduced to reflect any of the fees and costs of investing. The results shown in the graph reflect the reinvestment of income dividends and other distributions, if any. The results do not reflect the effect of taxes a shareholder would pay on Fund distributions or on the redemption of Fund shares. The results do not reflect fees and expenses of the variable annuity and variable life insurance policies or the qualified pension and retirement plans whose proceeds are invested in the Fund. Results represent past performance and do not indicate future results.
Please see Endnotes for additional information.
3
1 The date used to calculate Life of Fund performance for the index is April 29, 2005, the inception date of Class S shares, the Fund's oldest share class.
2 Performance shown prior to January 30, 2018, for Class I shares is that of Class S shares, which has higher expenses and correspondingly lower returns than Class I shares.
3 The MSCI EAFE® Index (Net) (Europe, Australasia, Far East) is a free float-adjusted market capitalization weighted index that is designed to measure the equity market performance of developed markets, excluding the United States and Canada. The index consists of the following 21 developed market country indexes: Australia, Austria, Belgium, Denmark, Finland, France, Germany, Hong Kong, Ireland, Israel, Italy, Japan, the Netherlands, New Zealand, Norway, Portugal, Singapore, Spain, Sweden, Switzerland, and the United Kingdom. Net total return indices reinvest dividends after the deduction of withholding taxes, using (for international indices) a tax rate applicable to non-resident institutional investors who do not benefit from double taxation treaties. Please note that the index described in this report does not take into account any fees, expenses or tax consequences of investing in the individual securities that it tracks (except the withholding taxes noted above), and that individuals cannot invest directly in any index. Data about the performance of an index are prepared or obtained by Neuberger Berman Investment Advisers LLC ("Management") and reflect the reinvestment of income dividends and other distributions, if any. The Fund may invest in securities not included in a described index and generally does not invest in all securities included in a described index.
The investments for the Fund are managed by the same portfolio manager(s) who manage(s) one or more other registered funds that have names, investment objectives and investment styles that are similar to those of the Fund. You should be aware that the Fund is likely to differ from those other mutual fund(s) in size, cash flow pattern and tax matters. Accordingly, the holdings and performance of the Fund can be expected to vary from those of the other mutual fund(s).
Shares of the separate Neuberger Berman Advisers Management Trust Portfolios, including the Fund, are not available to the general public. Shares of the Fund may be purchased only by life insurance companies to be held in their separate accounts, which fund variable annuity and variable life insurance policies, and by qualified pension and retirement plans.
Statistics and projections in this report are derived from sources deemed to be reliable but cannot be regarded as a representation of future results of the Fund. This report is prepared for the general information of shareholders and is not an offer of shares of the Fund. Shares are sold only through the currently effective prospectus, which must precede or accompany this report.
The "Neuberger Berman" name and logo and "Neuberger Berman Investment Advisers LLC" name are registered service marks of Neuberger Berman Group LLC. The individual Fund name in this piece is either a service mark or registered service mark of Neuberger Berman Investment Advisers LLC, an affiliate of Neuberger Berman BD LLC, distributor, member FINRA.
© 2021 Neuberger Berman BD LLC, distributor. All rights reserved.
4
Information About Your Fund's Expenses (Unaudited)
As a Fund shareholder, you incur two types of costs: (1) transaction costs such as fees and expenses that are, or may be, imposed under your variable contract or qualified pension plan; and (2) ongoing costs, including management fees, distribution and/or service (12b-1) fees (if applicable), and other Fund expenses. This example is intended to help you understand your ongoing costs (in U.S. dollars) of investing in the Fund and compare these costs with the ongoing costs of investing in other mutual funds.
This table is designed to provide information regarding costs related to your investments. The following examples are based on an investment of $1,000 made at the beginning of the six month period ended December 31, 2020 and held for the entire period. The table illustrates the Fund's costs in two ways:
Actual Expenses and Performance: | | The first section of the table provides information about actual account values and actual expenses in dollars, based on the Fund's actual performance during the period indicated. You may use the information in this line, together with the amount you invested, to estimate the expenses you paid over the period. Simply divide your account value by $1,000 (for example, an $8,600 account value divided by $1,000 = 8.6), then multiply the result by the number in the first section of the table under the heading entitled "Expenses Paid During the Period" to estimate the expenses you paid over the period. | |
Hypothetical Example for
Comparison Purposes: | | The second section of the table provides information about hypothetical account values and hypothetical expenses based on the Fund's actual expense ratio and an assumed rate of return at 5% per year before expenses. This return is not the Fund's actual return. The hypothetical account values and expenses may not be used to estimate the actual ending account balance or expenses you paid for the period. You may use this information to compare the ongoing costs of investing in this Fund versus other funds. To do so, compare the expenses shown in this 5% hypothetical example with the 5% hypothetical examples that appear in the shareholder reports of other funds. | |
Please note that the expenses in the table are meant to highlight your ongoing costs only and do not include any transaction costs, such as fees and expenses that are, or may be imposed under your variable contract or qualified pension plan. Therefore, the information under the heading "Hypothetical (5% annual return before expenses)" is useful in comparing ongoing costs only, and will not help you determine the relative total costs of owning different funds. In addition, if these transaction costs were included, your costs would have been higher.
Expense Example (Unaudited)
NEUBERGER BERMAN ADVISERS MANAGEMENT TRUST INTERNATIONAL EQUITY PORTFOLIO
Actual | | Beginning Account
Value
7/1/20 | | Ending Account
Value
12/31/20 | | Expenses Paid
During the Period
7/1/20 – 12/31/20 | | Expense
Ratio | |
Class I | | $ | 1,000.00 | | | $ | 1,225.70 | | | $ | 5.59 | (a) | | | 1.00 | % | |
Class S | | $ | 1,000.00 | | | $ | 1,222.20 | | | $ | 8.38 | (a) | | | 1.50 | % | |
Hypothetical (5% annual return before expenses) | |
Class I | | $ | 1,000.00 | | | $ | 1,020.11 | | | $ | 5.08 | (b) | | | 1.00 | % | |
Class S | | $ | 1,000.00 | | | $ | 1,017.60 | | | $ | 7.61 | (b) | | | 1.50 | % | |
(a) For each class, expenses are equal to the annualized expense ratio for the class, multiplied by the average account value over the period, multiplied by 184/366 (to reflect the one-half year period shown).
(b) Hypothetical expenses are equal to the annualized expense ratios for each class, multiplied by the average account value over the period (assuming a 5% annual return), multiplied by 184/366 (to reflect the one-half year period shown).
5
Legend International Equity Portfolio (Unaudited) December 31, 2020
Counterparties:
SSB = State Street Bank and Trust Company
6
Schedule of Investments International Equity Portfolio^ December 31, 2020
NUMBER OF SHARES | | | | VALUE | |
Common Stocks 97.7% | | | |
Austria 1.4% | | | |
| | 25,905 | | | BAWAG Group AG | | $ | 1,204,917 | *(a) | |
Belgium 0.9% | | | |
| | 11,337 | | | KBC Group NV | | | 793,376 | * | |
Canada 0.7% | | | |
| | 4,458 | | | Kinaxis, Inc. | | | 631,594 | * | |
France 7.3% | | | |
| | 3,942 | | | Air Liquide SA | | | 646,278 | | |
| | 3,372 | | | Arkema SA | | | 385,831 | | |
| | 8,232 | | | Pernod-Ricard SA | | | 1,580,926 | | |
| | 8,941 | | | Schneider Electric SE | | | 1,292,220 | | |
| | 5,393 | | | Teleperformance | | | 1,790,375 | | |
| | 16,748 | | | TOTAL SE | | | 722,880 | | |
| | | | 6,418,510 | | |
Germany 10.3% | | | |
| | 2,683 | | | adidas AG | | | 976,088 | * | |
| | 16,232 | | | Brenntag AG | | | 1,262,225 | | |
| | 3,278 | | | Deutsche Boerse AG | | | 558,153 | | |
| | 14,886 | | | Gerresheimer AG | | | 1,605,284 | | |
| | 34,241 | | | Infineon Technologies AG | | | 1,307,616 | | |
| | 1,331 | | | SAP SE | | | 172,389 | | |
| | 11,411 | | | SAP SE ADR | | | 1,487,880 | | |
| | 15,812 | | | Scout24 AG | | | 1,292,059 | (a) | |
| | 5,316 | | | Stabilus SA | | | 375,805 | | |
| | | | 9,037,499 | | |
Hong Kong 3.7% | | | |
| | 80,800 | | | AIA Group Ltd. | | | 984,638 | | |
| | 189,400 | | | HKBN Ltd. | | | 293,374 | | |
| | 134,800 | | | Techtronic Industries Co. Ltd. | | | 1,926,753 | | |
| | | | 3,204,765 | | |
India 1.4% | | | |
| | 72,624 | | | Infosys Ltd. ADR | | | 1,230,977 | | |
Ireland 6.1% | | | |
| | 10,884 | | | AerCap Holdings NV | | | 496,093 | * | |
| | 43,422 | | | CRH PLC | | | 1,834,753 | | |
| | 12,935 | | | Kerry Group PLC Class A | | | 1,878,724 | | |
| | 24,792 | | | Smurfit Kappa Group PLC | | | 1,158,857 | | |
| | | | 5,368,427 | | |
Israel 2.2% | | | |
| 14,571
|
| | Check Point Software
Technologies Ltd. | |
| 1,936,632
| * | |
NUMBER OF SHARES | | | | VALUE | |
Italy 1.2% | | | |
| | 51,010 | | | Nexi SpA | | $ | 1,015,053 | *(a) | |
Japan 11.7% | | | |
| | 25,200 | | | Bridgestone Corp. | | | 826,455 | (b) | |
| | 5,600 | | | Daikin Industries Ltd. | | | 1,245,816 | | |
| | 10,200 | | | Hoya Corp. | | | 1,412,647 | | |
| | 65,200 | | | Ichigo, Inc. | | | 196,419 | | |
| | 4,600 | | | Kao Corp. | | | 355,378 | | |
| | 6,000 | | | Otsuka Corp. | | | 316,482 | (c) | |
| | 108,300 | | | Sanwa Holdings Corp. | | | 1,264,693 | | |
| | 11,400 | | | SCSK Corp. | | | 651,914 | | |
| | 9,400 | | | Shionogi & Co. Ltd. | | | 513,912 | | |
| | 8,700 | | | TechnoPro Holdings, Inc. | | | 722,760 | | |
| | 17,700 | | | Terumo Corp. | | | 740,679 | | |
| | 15,100 | | | Tokio Marine Holdings, Inc. | | | 777,976 | | |
| | 16,100 | | | Toyota Motor Corp. | | | 1,242,438 | | |
| | | | 10,267,569 | | |
Netherlands 7.4% | | | |
| | 3,590 | | | ASML Holding NV | | | 1,738,195 | | |
| | 16,503 | | | Heineken NV | | | 1,836,941 | (b) | |
| | 28,494 | | | Intertrust NV | | | 483,159 | *(a) | |
| | 23,067 | | | Koninklijke Philips NV | | | 1,242,562 | * | |
| | 7,280 | | | NXP Semiconductors NV | | | 1,157,593 | | |
| | | | 6,458,450 | | |
Norway 0.7% | | | |
| | 73,154 | | | Sbanken ASA | | | 587,912 | *(a) | |
Singapore 1.0% | | | |
| | 44,000 | | | DBS Group Holdings Ltd. | | | 833,832 | | |
Sweden 2.3% | | | |
| | 64,158 | | | Assa Abloy AB Class B | | | 1,585,473 | | |
| | 4,993 | | | Autoliv, Inc. | | | 459,855 | | |
| | | | 2,045,328 | | |
Switzerland 13.7% | | | |
| | 17,093 | | | Julius Baer Group Ltd. | | | 984,754 | | |
| | 1,503 | | | Lonza Group AG | | | 968,182 | | |
| | 13,572 | | | Novartis AG | | | 1,277,911 | | |
| | 969 | | | Partners Group Holding AG | | | 1,138,615 | | |
| | 5,401 | | | Roche Holding AG | | | 1,881,160 | | |
| | 264 | | | SGS SA | | | 795,794 | | |
| | 68,428 | | | SIG Combibloc Group AG | | | 1,593,235 | | |
| | 5,207 | | | Sonova Holding AG | | | 1,354,307 | * | |
| | 2,537 | | | Tecan Group AG | | | 1,244,353 | | |
| | 52,787 | | | UBS Group AG | | | 743,232 | | |
| | | | 11,981,543 | | |
See Notes to Financial Statements
7
Schedule of Investments International Equity Portfolio^ (cont'd)
NUMBER OF SHARES | | | | VALUE | |
United Kingdom 21.1% | | | |
| | 47,982 | | | Barratt Developments PLC | | $ | 438,657 | * | |
| | 63,300 | | | Bunzl PLC | | | 2,113,454 | | |
| | 71,625 | | | Clinigen Group PLC | | | 661,854 | | |
| | 18,550 | | | DCC PLC | | | 1,312,642 | | |
| | 24,494 | | | Diageo PLC | | | 969,197 | | |
| | 135,500 | | | Electrocomponents PLC | | | 1,611,145 | | |
| | 35,548 | | | Fevertree Drinks PLC | | | 1,229,768 | | |
| | 224,010 | | | Ibstock PLC | | | 631,982 | *(a) | |
| 6,814 |
| | London Stock Exchange
Group PLC | |
| 841,096 |
| |
| | 50,710 | | | Prudential PLC | | | 932,454 | | |
| | 16,161 | | | Reckitt Benckiser Group PLC | | | 1,442,438 | | |
| | 59,388 | | | RELX PLC | | | 1,453,071 | | |
| | 48,414 | | | Rightmove PLC | | | 430,148 | * | |
| | 15,164 | | | Savills PLC | | | 197,869 | * | |
| | 53,310 | | | Smith & Nephew PLC | | | 1,107,381 | | |
| | 11,655 | | | Spectris PLC | | | 448,908 | | |
| | 44,666 | | | St. James's Place PLC | | | 691,166 | | |
| | 22,991 | | | Unilever PLC | | | 1,392,130 | | |
| | 21,300 | | | Weir Group PLC | | | 579,137 | * | |
| | | | 18,484,497 | | |
United States 4.6% | | | |
| | 7,040 | | | Aon PLC Class A | | | 1,487,341 | | |
| | 14,936 | | | Ferguson PLC | | | 1,814,731 | | |
| | 13,405 | | | QIAGEN NV | | | 708,454 | * | |
| | | | 4,010,526 | | |
| |
| | Total Common Stocks
(Cost $62,478,652) | |
| 85,511,407 |
| |
NUMBER OF SHARES | | | | VALUE | |
Short-Term Investments 4.8% | | | |
Investment Companies 4.8% | | | |
| 2,003,469 |
| | State Street Institutional
Treasury Money Market
Fund Premier Class, 0.01%(d) | | $ | 2,003,469 | (e) | |
| 2,218,080 |
| | State Street Navigator
Securities Lending Government
Money Market Portfolio,
0.10%(d) | |
| 2,218,080 | (f) | |
| |
| | Total Short-Term Investments
(Cost $4,221,549) | |
| 4,221,549 |
| |
| |
| | Total Investments 102.5%
(Cost $66,700,201) | |
| 89,732,956 |
| |
| | | | | Liabilities Less Other Assets (2.5)% | | | (2,198,296 | ) | |
| | | | | Net Assets 100.0% | | $ | 87,534,660 | | |
* Non-income producing security.
(a) Security exempt from registration pursuant to Regulation S under the Securities Act of 1933, as amended. Regulation S applies to securities offerings that are made outside of the United States and do not involve directed selling efforts in the United States and as such may have restrictions on resale. Total value of all such securities at December 31, 2020 amounted to $5,215,082, which represents 6.0% of net assets of the Fund.
(b) The security or a portion of this security is on loan at December 31, 2020. Total value of all such securities at December 31, 2020 amounted to $2,102,587 for the Fund (See Note A of Notes to Financial Statements).
(c) All or a portion of this security was purchased on a delayed delivery basis.
(d) Represents 7-day effective yield as of December 31, 2020.
(e) All or a portion of this security is segregated in connection with obligations for delayed delivery securities with a total value of $2,003,469.
(f) Represents investment of cash collateral received from securities lending.
See Notes to Financial Statements
8
Schedule of Investments International Equity Portfolio^ (cont'd)
POSITIONS BY INDUSTRY
Industry | | Investments
at Value | | Percentage of
Net Assets | |
Trading Companies & Distributors | | $ | 7,297,648 | | | | 8.4 | % | |
Health Care Equipment & Supplies | | | 5,857,576 | | | | 6.7 | % | |
Beverages | | | 5,616,832 | | | | 6.4 | % | |
Professional Services | | | 5,245,159 | | | | 6.0 | % | |
Life Sciences Tools & Services | | | 5,188,127 | | | | 5.9 | % | |
Capital Markets | | | 4,957,016 | | | | 5.7 | % | |
Software | | | 4,228,495 | | | | 4.8 | % | |
Semiconductors & Semiconductor Equipment | | | 4,203,404 | | | | 4.8 | % | |
Insurance | | | 4,182,409 | | | | 4.8 | % | |
Building Products | | | 4,095,982 | | | | 4.7 | % | |
Pharmaceuticals | | | 3,672,983 | | | | 4.2 | % | |
Banks | | | 3,420,037 | | | | 3.9 | % | |
IT Services | | | 3,214,426 | | | | 3.7 | % | |
Machinery | | | 2,881,695 | | | | 3.3 | % | |
Containers & Packaging | | | 2,752,092 | | | | 3.1 | % | |
Construction Materials | | | 2,466,735 | | | | 2.8 | % | |
Food Products | | | 1,878,724 | | | | 2.1 | % | |
Personal Products | | | 1,747,508 | | | | 2.0 | % | |
Interactive Media & Services | | | 1,722,207 | | | | 2.0 | % | |
Household Products | | | 1,442,438 | | | | 1.6 | % | |
Industrial Conglomerates | | | 1,312,642 | | | | 1.5 | % | |
Electrical Equipment | | | 1,292,220 | | | | 1.5 | % | |
Auto Components | | | 1,286,310 | | | | 1.5 | % | |
Automobiles | | | 1,242,438 | | | | 1.4 | % | |
Chemicals | | | 1,032,109 | | | | 1.2 | % | |
Textiles, Apparel & Luxury Goods | | | 976,088 | | | | 1.1 | % | |
Oil, Gas & Consumable Fuels | | | 722,880 | | | | 0.8 | % | |
Electronic Equipment, Instruments & Components | | | 448,908 | | | | 0.5 | % | |
Household Durables | | | 438,657 | | | | 0.5 | % | |
Real Estate Management & Development | | | 394,288 | | | | 0.5 | % | |
Diversified Telecommunication Services | | | 293,374 | | | | 0.3 | % | |
Short-Term Investments and Other Liabilities—Net | | | 2,023,253 | | | | 2.3 | % | |
| | | $ | 87,534,660 | | | | 100.0 | % | |
See Notes to Financial Statements
9
Schedule of Investments International Equity Portfolio^ (cont'd)
The following is a summary, categorized by Level (see Note A of Notes to Financial Statements), of inputs used to value the Fund's investments as of December 31, 2020:
Asset Valuation Inputs | | Level 1 | | Level 2 | | Level 3 | | Total | |
Investments: | |
Common Stocks | |
Austria | | $ | — | | | $ | 1,204,917 | | | $ | — | | | $ | 1,204,917 | | |
Belgium | | | — | | | | 793,376 | | | | — | | | | 793,376 | | |
France | | | — | | | | 6,418,510 | | | | — | | | | 6,418,510 | | |
Germany | | | 1,487,880 | | | | 7,549,619 | | | | — | | | | 9,037,499 | | |
Hong Kong | | | — | | | | 3,204,765 | | | | — | | | | 3,204,765 | | |
Ireland | | | 496,093 | | | | 4,872,334 | | | | — | | | | 5,368,427 | | |
Italy | | | — | | | | 1,015,053 | | | | — | | | | 1,015,053 | | |
Japan | | | — | | | | 10,267,569 | | | | — | | | | 10,267,569 | | |
Netherlands | | | 1,640,752 | | | | 4,817,698 | | | | — | | | | 6,458,450 | | |
Norway | | | — | | | | 587,912 | | | | — | | | | 587,912 | | |
Singapore | | | — | | | | 833,832 | | | | — | | | | 833,832 | | |
Sweden | | | 459,855 | | | | 1,585,473 | | | | — | | | | 2,045,328 | | |
Switzerland | | | — | | | | 11,981,543 | | | | — | | | | 11,981,543 | | |
United Kingdom | | | 1,392,130 | | | | 17,092,367 | | | | — | | | | 18,484,497 | | |
United States | | | 2,195,795 | | | | 1,814,731 | | | | — | | | | 4,010,526 | | |
| Other Common Stocks(a) | | | 3,799,203 | | | | — | | | | — | | | | 3,799,203 | | |
Total Common Stocks | | | 11,471,708 | | | | 74,039,699 | | | | — | | | | 85,511,407 | | |
Short-Term Investments | | | — | | | | 4,221,549 | | | | — | | | | 4,221,549 | | |
Total Investments | | $ | 11,471,708 | | | $ | 78,261,248 | | | $ | — | | | $ | 89,732,956 | | |
(a) The Schedule of Investments provides a geographic categorization as well as a Positions by Industry summary.
^ A balance indicated with a "—", reflects either a zero balance or an amount that rounds to less than 1.
See Notes to Financial Statements
10
Statement of Assets and Liabilities
Neuberger Berman Advisers Management Trust
| | | INTERNATIONAL
EQUITY
PORTFOLIO | |
| | | December 31, 2020 | |
Assets | |
Investments in securities, at value*† (Note A)—see Schedule of Investments: | |
| Unaffiliated issuers(a) | | $ | 89,732,956 | | |
| Foreign currency(b) | | | 70,770 | | |
Dividends and interest receivable | | | 211,222 | | |
Receivable for securities sold | | | 168 | | |
Receivable from Management—net (Note B) | | | 3,464 | | |
Receivable for Fund shares sold | | | 7,408 | | |
Receivable for securities lending income (Note A) | | | 485 | | |
Prepaid expenses and other assets | | | 835 | | |
Total Assets | | | 90,027,308 | | |
Liabilities | |
Payable to investment manager—net (Note B) | | | 60,878 | | |
Payable for securities purchased | | | 68,748 | | |
Payable for Fund shares redeemed | | | 69,608 | | |
Payable to trustees | | | 12,717 | | |
Payable for loaned securities collateral (Note A) | | | 2,218,080 | | |
Other accrued expenses and payables | | | 62,617 | | |
Total Liabilities | | | 2,492,648 | | |
Net Assets | | $ | 87,534,660 | | |
Net Assets consist of: | |
Paid-in capital | | $ | 63,421,815 | | |
Total distributable earnings/(losses) | | | 24,112,845 | | |
Net Assets | | $ | 87,534,660 | | |
Net Assets | |
Class I | | $ | 71,239,389 | | |
Class S | | | 16,295,271 | | |
Shares Outstanding ($.001 par value; unlimited shares authorized) | |
Class I | | | 4,862,174 | | |
Class S | | | 1,108,685 | | |
Net Asset Value, offering and redemption price per share | |
Class I | | $ | 14.65 | | |
Class S | | | 14.70 | | |
†Securities on loan, at value: | |
Unaffiliated issuers | | $ | 2,102,587 | | |
*Cost of Investments: | |
(a) Unaffiliated Issuers | | $ | 66,700,201 | | |
(b) Total cost of foreign currency | | $ | 68,997 | | |
See Notes to Financial Statements
11
Neuberger Berman Advisers Management Trust
| | | INTERNATIONAL
EQUITY
PORTFOLIO | |
| | | For the
Fiscal Year Ended
December 31, 2020 | |
Investment Income: | |
Income (Note A): | |
Dividend income—unaffiliated issuers | | $ | 1,255,856 | | |
Interest and other income—unaffiliated issuers | | | 5,747 | | |
Income from securities loaned—net | | | 8,747 | | |
Foreign taxes withheld | | | (94,705 | ) | |
Total income | | $ | 1,175,645 | | |
Expenses: | |
Investment management fees (Note B) | | | 639,178 | | |
Administration fees (Note B): | |
Class I | | | 181,539 | | |
Class S | | | 44,053 | | |
Distribution fees (Note B): | |
Class S | | | 36,711 | | |
Shareholder servicing agent fees: | |
Class S | | | 11 | | |
Audit fees | | | 40,442 | | |
Custodian and accounting fees | | | 79,385 | | |
Insurance | | | 2,568 | | |
Legal fees | | | 17,644 | | |
Shareholder reports | | | 16,152 | | |
Trustees' fees and expenses | | | 51,620 | | |
Interest | | | 79 | | |
Miscellaneous | | | 17,841 | | |
Total expenses | | | 1,127,223 | | |
Expenses reimbursed by Management (Note B) | | | (298,816 | ) | |
Total net expenses | | | 828,407 | | |
Net investment income/(loss) | | $ | 347,238 | | |
Realized and Unrealized Gain/(Loss) on Investments (Note A): | |
Net realized gain/(loss) on: | |
Transactions in investment securities of unaffiliated issuers | | | 769,620 | | |
Settlement of foreign currency transactions | | | 6,589 | | |
Net increase from payments by affiliates (Note B) | | | 37,878 | | |
Change in net unrealized appreciation/(depreciation) in value of: | |
Investment securities of unaffiliated issuers | | | 8,129,064 | | |
Foreign currency translations | | | 12,883 | | |
Net gain/(loss) on investments | | | 8,956,034 | | |
Net increase/(decrease) in net assets resulting from operations | | $ | 9,303,272 | | |
See Notes to Financial Statements
12
Statements of Changes in Net Assets
Neuberger Berman Advisers Management Trust
| | | INTERNATIONAL EQUITY PORTFOLIO | |
| | | Fiscal Year Ended
December 31,
2020 | | Fiscal Year Ended
December 31,
2019 | |
Increase/(Decrease) in Net Assets: | |
From Operations (Note A): | |
Net investment income/(loss) | | $ | 347,238 | | | $ | 687,719 | | |
Net realized gain/(loss) on investments | | | 776,209 | | | | 3,846,198 | | |
Net increase from payments by affiliates (Note B) | | | 37,878 | | | | — | | |
Change in net unrealized appreciation/(depreciation) of investments | | | 8,141,947 | | | | 14,376,583 | | |
Net increase/(decrease) in net assets resulting from operations | | | 9,303,272 | | | | 18,910,500 | | |
Distributions to Shareholders From (Note A): | |
Distributable earnings: | |
Class I | | | (3,802,291 | ) | | | (3,127,585 | ) | |
Class S | | | (819,339 | ) | | | (680,381 | ) | |
Total distributions to shareholders | | | (4,621,630 | ) | | | (3,807,966 | ) | |
From Fund Share Transactions (Note D): | |
Proceeds from shares sold: | |
Class I | | | 1,292,000 | | | | 266,083 | | |
Class S | | | 946,058 | | | | 922,972 | | |
Proceeds from reinvestment of dividends and distributions: | |
Class I | | | 3,802,291 | | | | 3,127,585 | | |
Class S | | | 819,339 | | | | 680,381 | | |
Payments for shares redeemed: | |
Class I | | | (3,556,277 | ) | | | (2,931,305 | ) | |
Class S | | | (2,880,224 | ) | | | (3,577,754 | ) | |
Net increase/(decrease) from Fund share transactions | | | 423,187 | | | | (1,512,038 | ) | |
Net Increase/(Decrease) in Net Assets | | | 5,104,829 | | | | 13,590,496 | | |
Net Assets: | |
Beginning of year | | | 82,429,831 | | | | 68,839,335 | | |
End of year | | $ | 87,534,660 | | | $ | 82,429,831 | | |
See Notes to Financial Statements
13
Notes to Financial Statements International Equity Portfolio
Note A—Summary of Significant Accounting Policies:
1 General: Neuberger Berman Advisers Management Trust (the "Trust") is a Delaware statutory trust organized pursuant to an Amended and Restated Trust Instrument dated March 27, 2014. The Trust is registered as an open-end management investment company under the Investment Company Act of 1940, as amended (the "1940 Act"), and its shares are registered under the Securities Act of 1933, as amended. Neuberger Berman Advisers Management Trust International Equity Portfolio (the "Fund") is a separate operating series of the Trust and is diversified. The Fund offers Class I and Class S shares. The Trust's Board of Trustees (the "Board") may establish additional series or classes of shares without the approval of shareholders.
A balance indicated with a "—", reflects either a zero balance or a balance that rounds to less than 1.
The assets of the Fund belong only to the Fund, and the liabilities of the Fund are borne solely by the Fund and no other series of the Trust.
The Fund is an investment company and accordingly follows the investment company accounting and reporting guidance of the Financial Accounting Standards Board Accounting Standards Codification ("ASC") Topic 946 "Financial Services—Investment Companies."
The preparation of financial statements in accordance with U.S. generally accepted accounting principles ("GAAP") requires Neuberger Berman Investment Advisers LLC ("Management" or "NBIA") to make estimates and assumptions at the date of the financial statements. Actual results could differ from those estimates.
Shares of the Fund are not available to the general public and may be purchased only by life insurance companies to serve as an investment vehicle for premiums paid under their variable annuity and variable life insurance contracts and to certain qualified pension and other retirement plans.
2 Portfolio valuation: In accordance with ASC 820 "Fair Value Measurement" ("ASC 820"), all investments held by the Fund are carried at the value that Management believes the Fund would receive upon selling an investment in an orderly transaction to an independent buyer in the principal or most advantageous market for the investment under current market conditions. Various inputs, including the volume and level of activity for the asset or liability in the market, are considered in valuing the Fund's investments, some of which are discussed below. Significant Management judgment may be necessary to value investments in accordance with ASC 820.
ASC 820 established a three-tier hierarchy of inputs to create a classification of value measurements for disclosure purposes. The three-tier hierarchy of inputs is summarized in the three broad Levels listed below.
• Level 1—unadjusted quoted prices in active markets for identical investments
• Level 2—other observable inputs (including quoted prices for similar investments, interest rates, prepayment speeds, credit risk, amortized cost, etc.)
• Level 3—unobservable inputs (including the Fund's own assumptions in determining the fair value of investments)
The inputs or methodology used for valuing an investment are not necessarily an indication of the risk associated with investing in those securities.
The value of the Fund's investments in equity securities, for which market quotations are readily available, is generally determined by Management by obtaining valuations from independent pricing services based on the latest sale price quoted on a principal exchange or market for that security (Level 1 inputs). Securities traded primarily on the NASDAQ Stock Market are normally valued at the NASDAQ Official Closing Price ("NOCP") provided by NASDAQ each business day. The NOCP is the most recently reported price as of 4:00:02 p.m., Eastern Time, unless that price is outside the range of the "inside" bid and asked prices (i.e., the bid and asked prices that
14
dealers quote to each other when trading for their own accounts); in that case, NASDAQ will adjust the price to equal the inside bid or asked price, whichever is closer. Because of delays in reporting trades, the NOCP may not be based on the price of the last trade to occur before the market closes. If there is no sale of a security on a particular day, the independent pricing services may value the security based on market quotations.
Management has developed a process to periodically review information provided by independent pricing services for all types of securities.
Investments in non-exchange traded investment companies are valued using the respective fund's daily calculated net asset value ("NAV") per share (Level 2 inputs).
If a valuation is not available from an independent pricing service, or if Management has reason to believe that the valuation received does not represent the amount the Fund might reasonably expect to receive on a current sale in an orderly transaction, Management seeks to obtain quotations from brokers or dealers (generally considered Level 2 or Level 3 inputs depending on the number of quotes available). If such quotations are not readily available, the security is valued using methods the Board has approved in the good-faith belief that the resulting valuation will reflect the fair value of the security. Inputs and assumptions considered in determining the fair value of a security based on Level 2 or Level 3 inputs may include, but are not limited to, the type of the security; the initial cost of the security; the existence of any contractual restrictions on the security's disposition; the price and extent of public trading in similar securities of the issuer or of comparable companies; quotations or evaluated prices from broker-dealers and/or pricing services; information obtained from the issuer and/or analysts; an analysis of the company's or issuer's financial statements; an evaluation of the inputs that influence the issuer and the market(s) in which the security is purchased and sold.
The value of the Fund's investments in foreign securities is generally determined using the same valuation methods and inputs as other Fund investments, as discussed above. Foreign security prices expressed in local currency values are normally translated from the local currency into U.S. dollars using the exchange rates as of 4:00 p.m., Eastern Time on days the New York Stock Exchange ("NYSE") is open for business. The Board has approved the use of ICE Data Pricing & Reference Data LLC ("ICE") to assist in determining the fair value of foreign equity securities when changes in the value of a certain index suggest that the closing prices on the foreign exchanges may no longer represent the amount that the Fund could expect to receive for those securities or on days when foreign markets are closed and U.S. markets are open. In each of these events, ICE will provide adjusted prices for certain foreign equity securities using a statistical analysis of historical correlations of multiple factors (Level 2 inputs). In the absence of precise information about the market values of these foreign securities as of the time as of which the Fund's share price is calculated, the Board has determined on the basis of available data that prices adjusted or evaluated in this way are likely to be closer to the prices the Fund could realize on a current sale than are the prices of those securities established at the close of the foreign markets in which the securities primarily trade.
Fair value prices are necessarily estimates, and there is no assurance that such a price will be at or close to the price at which the security is next quoted or next trades.
3 Foreign currency translations: The accounting records of the Fund are maintained in U.S. dollars. Foreign currency amounts are normally translated into U.S. dollars using the exchange rate as of 4:00 p.m. Eastern Time, on days the NYSE is open for business, to determine the value of investments, other assets and liabilities. Purchase and sale prices of securities, and income and expenses, are translated into U.S. dollars at the prevailing rate of exchange on the respective dates of such transactions. Net unrealized foreign currency gain/(loss), if any, arises from changes in the value of assets and liabilities, other than investments in securities, as a result of changes in exchange rates and is stated separately in the Statement of Operations.
4 Securities transactions and investment income: Securities transactions are recorded on trade date for financial reporting purposes. Dividend income is recorded on the ex-dividend date or, for certain foreign dividends, as soon as the Fund becomes aware of the dividends. Non-cash dividends included in dividend income, if any, are recorded at the fair market value of the securities received. Interest income, including accretion of discount (adjusted for original issue discount, where applicable), and amortization of premium, where applicable, is
15
recorded on the accrual basis. Realized gains and losses from securities transactions and foreign currency transactions, if any, are recorded on the basis of identified cost and stated separately in the Statement of Operations. Included in net realized gain/(loss) on investments are proceeds from the settlement of class action litigation(s) in which the Fund participated as a class member. The amount of such proceeds for the year ended December 31, 2020, was $29,473.
5 Income tax information: The Fund is treated as a separate entity for U.S. federal income tax purposes. It is the policy of the Fund to continue to qualify for treatment as a regulated investment company ("RIC") by complying with the requirements of the U.S. Internal Revenue Code applicable to RICs and to distribute substantially all of its net investment income and net realized capital gains to its shareholders. To the extent the Fund distributes substantially all of its net investment income and net realized capital gains to shareholders, no federal income or excise tax provision is required.
The Fund has adopted the provisions of ASC 740 "Income Taxes" ("ASC 740"). ASC 740 sets forth a minimum threshold for financial statement recognition of a tax position taken, or expected to be taken, in a tax return. The Fund recognizes interest and penalties, if any, related to unrecognized tax positions as an income tax expense in the Statement of Operations. The Fund is subject to examination by U.S. federal and state tax authorities for returns filed for the tax years for which the applicable statutes of limitations have not yet expired. As of December 31, 2020, the Fund did not have any unrecognized tax positions.
For federal income tax purposes, the estimated cost in value of investments held at December 31, 2020 was $66,814,638. The estimated gross unrealized appreciation was $24,005,882 and estimated gross unrealized depreciation was $1,087,564 resulting in net unrealized appreciation of $22,918,318 based on cost for U.S. federal income tax purposes.
Income distributions and capital gain distributions are determined in accordance with income tax regulations, which may differ from GAAP. These differences are primarily due to differing treatments of income and gains on various investment securities held by the Fund, timing differences and differing characterization of distributions made by the Fund. The Fund may also utilize earnings and profits distributed to shareholders on redemption of their shares as a part of the dividends-paid deduction for income tax purposes.
Any permanent differences resulting from different book and tax treatment are reclassified at year-end and have no impact on net income, NAV or NAV per share of the Fund. For the year ended December 31, 2020, the Fund recorded permanent reclassifications primarily related to prior period adjustments.
Paid-in
Capital | | Total Distributable
Earnings/(Losses) | |
| $ | 3 | | | $ | (3 | ) | |
The tax character of distributions paid during the years ended December 31, 2020, and December 31, 2019, was as follows:
| | | Distributions Paid From: | |
| | | Ordinary Income | | Long-Term
Capital Gain | | Total | |
| | | 2020 | | 2019 | | 2020 | | 2019 | | 2020 | | 2019 | |
| | | | | $ | 852,050 | | | $ | 619,365 | | | $ | 3,769,580 | | | $ | 3,188,601 | | | $ | 4,621,630 | | | $ | 3,807,966 | | |
As of December 31, 2020, the components of distributable earnings (accumulated losses) on a U.S. federal income tax basis were as follows:
Undistributed
Ordinary
Income | | Undistributed
Long-Term
Capital Gain | | Unrealized
Appreciation/
(Depreciation) | | Loss
Carryforwards
and Deferrals | | Other
Temporary
Differences | | Total | |
| $ | 352,968 | | | $ | 826,530 | | | $ | 22,933,347 | | | $ | — | | | $ | — | | | $ | 24,112,845 | | |
16
The temporary differences between book basis and tax basis distributable earnings are primarily due to losses disallowed and recognized on wash sales.
6 Distributions to shareholders: The Fund may earn income, net of expenses, daily on its investments. Distributions from net investment income and net realized capital gains, if any, are generally distributed once a year (usually in October) and are recorded on the ex-date.
7 Foreign taxes: Foreign taxes withheld, if any, represent amounts withheld by foreign tax authorities, net of refunds recoverable.
8 Expense allocation: Certain expenses are applicable to multiple funds within the complex of related investment companies. Expenses directly attributable to a fund are charged to that fund. Expenses of the Trust that are not directly attributable to a particular series of the Trust (e.g., the Fund) are allocated among the series of the Trust, on the basis of relative net assets, except where a more appropriate allocation of expenses to each of the series can otherwise be made fairly. Expenses borne by the complex of related investment companies, which includes open-end and closed-end investment companies for which NBIA serves as investment manager, that are not directly attributable to a particular investment company in the complex (e.g., the Trust) or series thereof are allocated among the investment companies in the complex or series thereof on the basis of relative net assets, except where a more appropriate allocation of expenses to each of the investment companies in the complex or series thereof can otherwise be made fairly. The Fund's expenses (other than those specific to each class) are allocated proportionally each day among its classes based upon the relative net assets of each class.
9 Investments in foreign securities: Investing in foreign securities may involve sovereign and other risks, in addition to the credit and market risks normally associated with domestic securities. These additional risks include the possibility of adverse political and economic developments (including political instability, nationalization, expropriation, or confiscatory taxation) and the potentially adverse effects of unavailability of public information regarding issuers, less governmental supervision and regulation of financial markets, reduced liquidity of certain financial markets, and the lack of uniform accounting, auditing, and financial reporting standards or the application of standards that are different or less stringent than those applied in the United States. Foreign securities also may experience greater price volatility, higher rates of inflation, and delays in settlement.
10 Investment company securities and exchange-traded funds: The Fund may invest in shares of other registered investment companies, including exchange-traded funds ("ETFs"), within the limitations prescribed by (a) the 1940 Act, (b) the exemptive order from the Securities and Exchange Commission ("SEC") that permits the Fund to invest in both affiliated and unaffiliated investment companies, including ETFs, in excess of the limits in Section 12(d)(1)(A) of the 1940 Act, subject to the terms and conditions of such order, or (c) the ETF's exemptive order or other relief. Some ETFs seek to track the performance of a particular market index. These indices include both broad-based market indices and more narrowly-based indices, including those relating to particular sectors, markets, regions or industries. However, some ETFs have an actively-managed investment objective. ETF shares are traded like traditional equity securities on a national securities exchange or NASDAQ. The Fund will indirectly bear its proportionate share of any management fees and other expenses paid by such other investment companies, which will decrease returns.
11 Securities lending: The Fund, using State Street Bank and Trust Company ("State Street") as its lending agent, may loan securities to qualified brokers and dealers in exchange for negotiated lender's fees. These fees, if any, would be disclosed within the Statement of Operations under the caption "Income from securities loaned-net" and are net of expenses retained by State Street as compensation for its services as lending agent.
The initial cash collateral received by the Fund at the beginning of each transaction shall have a value equal to at least 102% of the prior day's market value of the loaned securities (105% in the case of international securities). Thereafter, the value of the cash collateral is monitored on a daily basis, and cash collateral is moved daily between a counterparty and the Fund until the close of the transaction. The Fund may only receive collateral in the form of cash (U.S. dollars). Cash collateral is generally invested in a money market fund registered under the 1940 Act that is managed by an affiliate of State Street. The risks associated with lending portfolio securities include, but are not
17
limited to, possible delays in receiving additional collateral or in the recovery of the loaned securities. Any increase or decrease in the fair value of the securities loaned and any interest earned or dividends paid or owed on those securities during the term of the loan would accrue to the Fund.
As of December 31, 2020, the Fund had outstanding loans of securities to certain approved brokers, with a value of $2,102,587, for which it received collateral as follows:
| | | Remaining Contractual Maturity of the Agreements | |
| | | Overnight and
Continuous | | Less Than
30 Days | | Between
30 & 90 Days | | Greater Than
90 Days | | Total | |
Securities Lending Transactions(a) | |
Common Stocks | | $ | 2,218,080 | | | $ | — | | | $ | — | | | $ | — | | | $ | 2,218,080 | | |
(a) Amounts represent the payable for loaned securities collateral received.
The Fund is required to disclose both gross and net information for assets and liabilities related to derivatives, repurchase and reverse repurchase agreements, and securities lending and securities borrowing transactions, if any, that are eligible for offset or subject to an enforceable master netting or similar agreement. The Fund's securities lending assets at fair value are reported gross in the Statement of Assets and Liabilities. The following tables present the Fund's securities lending assets by counterparty and net of the related collateral received by the Fund for assets as of December 31, 2020.
Description | | Gross Amounts of
Recognized Assets | | Gross Amounts
Offset in the
Statement of
Assets and
Liabilities | | Net Amounts of Assets Presented in the
Statement of Assets and Liabilities | |
Securities Lending | | $ | 2,102,587 | | | $ | — | | | $ | 2,102,587 | | |
Total | | $ | 2,102,587 | | | $ | — | | | $ | 2,102,587 | | |
Gross Amounts Not Offset in the Statement of Assets and Liabilities
Counterparty | | Net Amounts of
Assets Presented in
the Statement of
Assets and Liabilities | | Liabilities
Available
for Offset | | Cash Collateral
Received(a) | | Net Amount(b) | |
SSB | | $ | 2,102,587 | | | $ | — | | | $ | (2,102,587 | ) | | $ | — | | |
Total | | $ | 2,102,587 | | | $ | — | | | $ | (2,102,587 | ) | | $ | — | | |
(a) Collateral received is limited to an amount not to exceed 100% of the net amount of assets in the tables presented above.
(b) Net Amount represents amounts subject to loss at December 31, 2020, in the event of a counterparty failure.
12 Indemnifications: Like many other companies, the Trust's organizational documents provide that its officers ("Officers") and trustees ("Trustees") are indemnified against certain liabilities arising out of the performance of their duties to the Trust. In addition, both in some of its principal service contracts and in the normal course of its business, the Trust enters into contracts that provide indemnifications to other parties for certain types of losses or liabilities. The Trust's maximum exposure under these arrangements is unknown as this could involve future claims against the Trust.
13 Other: All net investment income and realized and unrealized capital gains and losses of the Fund are allocated, on the basis of relative net assets, pro rata among its respective classes.
14 Other matters—Coronavirus: The outbreak of the novel coronavirus in many countries, which is a rapidly evolving situation, has, among other things, disrupted global travel and supply chains, and has adversely impacted global commercial activity, the transportation industry and commodity prices in the energy sector. The impact of
18
this virus has negatively affected and may continue to affect the economies of many nations, individual companies and the global securities and commodities markets, including liquidity and volatility, in ways that cannot necessarily be foreseen at the present time. The rapid development and fluidity of this situation precludes any prediction as to its ultimate impact, which may have a continued adverse effect on economic and market conditions and trigger a period of global economic slowdown. Such conditions (which may be across industries, sectors or geographies) have impacted and may continue to impact the issuers of the securities held by the Fund.
Note B—Investment Management Fees, Administration Fees, Distribution Arrangements, and Other Transactions With Affiliates:
The Fund retains NBIA as its investment manager under a Management Agreement. For such investment management services, the Fund pays NBIA an investment management fee at the annual rate of 0.85% of the first $250 million of the Fund's average daily net assets, 0.825% of the next $250 million, 0.80% of the next $250 million, 0.775% of the next $250 million, 0.75% of the next $500 million, 0.725% of the next $1 billion, and 0.70% of average daily net assets in excess of $2.5 billion. Accordingly, for the year ended December 31, 2020, the investment management fee pursuant to the Management Agreement was equivalent to an annual effective rate of 0.85% of the Fund's average daily net assets.
The Fund retains NBIA as its administrator under an Administration Agreement. Each class pays NBIA an administration fee at the annual rate of 0.30% of its average daily net assets under this agreement. Additionally, NBIA retains State Street as its sub-administrator under a Sub-Administration Agreement. NBIA pays State Street a fee for all services received under the Sub-Administration Agreement.
NBIA has contractually agreed to waive fees and/or reimburse the Fund's Class I and Class S shares so that the total annual operating expenses of those classes do not exceed the expense limitations as detailed in the following table. These undertakings exclude interest, taxes, transaction costs, brokerage commissions, acquired fund fees and expenses, extraordinary expenses, and dividend and interest expenses relating to short sales, if any (commitment fees relating to borrowings are treated as interest for purposes of this exclusion) ("annual operating expenses"); consequently, net expenses may exceed the contractual expense limitations. The Fund has agreed that each of its classes will repay NBIA for fees and expenses waived or reimbursed for that class provided that repayment does not cause that class's annual operating expenses to exceed its contractual expense limitation in place at the time the fees and expenses were waived or reimbursed, or the expense limitation in place at the time the Fund repays NBIA, whichever is lower. Any such repayment must be made within three years after the year in which NBIA incurred the expense.
During the year ended December 31, 2020, there was no repayment to NBIA under these agreements.
At December 31, 2020, the Fund's contingent liabilities to NBIA under the agreements were as follows:
| | | | | | | Expenses Reimbursed in
Year Ended December 31, | |
| | | | | | | 2018 | | 2019 | | 2020 | |
| | | | | | | Subject to Repayment Until December 31, | |
Class | | Contractual
Expense
Limitation(a) | | Expiration | | 2021 | | 2022 | | 2023 | |
Class I | | | 1.00 | % | | 12/31/23 | | $ | 262,560 | (b) | | $ | 281,611 | | | $ | 269,970 | | |
Class S | | | 1.50 | % | | 12/31/23 | | | 52,969 | | | | 34,567 | | | | 28,846 | | |
(a) Expense limitation per annum of the Fund's average daily net assets.
(b) Period from January 30, 2018 (Commencement of Operations) to December 31, 2018.
Neuberger Berman BD LLC (the "Distributor") is the Fund's "principal underwriter" within the meaning of the 1940 Act. It acts as agent in arranging for the sale of the Fund's Class I shares without sales commission or other
19
compensation and bears all advertising and promotion expenses incurred in the sale of those shares. The Board adopted a non-fee distribution plan for the Fund's Class I shares.
The Board has adopted a distribution and shareholder services plan (the "Plan") for Class S shares pursuant to Rule 12b-1 under the 1940 Act. The Plan provides that, as compensation for administrative and other services related to the sale and distribution of Class S shares, and ongoing services provided to investors in the class, the Distributor receives from Class S a fee at the annual rate of 0.25% of Class S's average daily net assets. The Distributor may pay a portion of the proceeds from the 12b-1 fee to institutions that provide such services, including insurance companies or their affiliates and qualified plan administrators ("intermediaries") for services they provide respecting the Fund to current and prospective variable contract owners and qualified plan participants that invest in the Fund through the intermediaries. Those institutions may use the payments for, among other purposes, compensating employees engaged in sales and/or shareholder servicing. The amount of fees paid by the class during any year may be more or less than the cost of distribution and other services provided to the class. FINRA rules limit the amount of annual distribution fees that may be paid by a mutual fund and impose a ceiling on the cumulative distribution fees paid. The Plan complies with those rules.
For the year ended December 31, 2020, the Fund recorded a capital contribution from Management in the amount of $37,878. This amount was paid in connection with losses incurred in the execution of a trade.
Note C—Securities Transactions:
During the year ended December 31, 2020, there were purchase and sale transactions of long-term securities of $22,694,461 and $26,926,273, respectively.
During the year ended December 31, 2020, no brokerage commissions on securities transactions were paid to affiliated brokers.
Note D—Fund Share Transactions:
Share activity for the years ended December 31, 2020, and December 31, 2019, was as follows:
| | For the Year Ended December 31, 2020 | | For the Year Ended December 31, 2019 | |
| | Shares Sold | | Shares Issued on
Reinvestment of
Dividends and
Distributions | | Shares
Redeemed | | Total | | Shares Sold | | Shares Issued on
Reinvestment of
Dividends and
Distributions | | Shares
Redeemed | | Total | |
Class I | | | 87,832 | | | | 287,399 | | | | (300,412 | ) | | | 74,819 | | | | 20,804 | | | | 246,849 | | | | (223,128 | ) | | | 44,525 | | |
Class S | | | 73,576 | | | | 61,651 | | | | (221,681 | ) | | | (86,454 | ) | | | 72,386 | | | | 53,489 | | | | (279,674 | ) | | | (153,799 | ) | |
Note E—Line of Credit:
At December 31, 2020, the Fund was a participant in a syndicated committed, unsecured $700,000,000 line of credit (the "Credit Facility"), to be used only for temporary or emergency purposes. Series of other investment companies managed by NBIA also participate in this line of credit on substantially the same terms. Interest is charged on borrowings under this Credit Facility at the highest of (a) a federal funds effective rate plus 1.00% per annum, (b) a Eurodollar rate for a one-month period plus 1.00% per annum, and (c) an overnight bank funding rate plus 1.00% per annum. The Credit Facility has an annual commitment fee of 0.15% per annum of the available line of credit, which is paid quarterly. The Fund has agreed to pay its pro rata share of the annual commitment fee, based on the ratio of its individual net assets to the net assets of all participants at the time the fee is due, and interest charged on any borrowing made by the Fund and other costs incurred by the Fund. Because several mutual funds participate in the Credit Facility, there is no assurance that the Fund will have access to all or any part of the $700,000,000 at any particular time. There were no loans outstanding under the Credit Facility at December 31, 2020. During the year ended December 31, 2020, the Fund did not utilize the Credit Facility.
20
International Equity Portfolio
The following tables include selected data for a share outstanding throughout each year and other performance information derived from the Financial Statements. Amounts that do not round to $0.01 or $(0.01) per share are presented as $0.00 or $(0.00), respectively. Ratios that do not round to 0.01% or (0.01)% are presented as 0.00% or (0.00)%, respectively. A "—" indicates that the line item was not applicable in the corresponding period.
Class I | |
| | | Year Ended December 31, | | Period from
January 30, 2018(a)
to December 31, | |
| | | 2020 | | 2019 | | 2018 | |
Net Asset Value, Beginning of Year | | $ | 13.77 | | | $ | 11.30 | | | $ | 14.42 | | |
Income From Investment Operations: | |
| Net Investment Income/(Loss)@ | | | 0.07 | | | | 0.13 | | | | 0.13 | | |
Net Gains or Losses on Securities
(both realized and unrealized) | | | 1.65 | | | | 3.01 | | | | (3.18 | ) | |
Total From Investment Operations | | | 1.72 | | | | 3.14 | | | | (3.05 | ) | |
Less Distributions From: | |
Net Investment Income | | | (0.14 | ) | | | (0.12 | ) | | | (0.07 | ) | |
Net Realized Capital Gains | | | (0.70 | ) | | | (0.55 | ) | | | — | | |
Total Distributions | | | (0.84 | ) | | | (0.67 | ) | | | (0.07 | ) | |
Voluntary Contribution from Management | | | 0.01 | | | | — | | | | — | | |
Net Asset Value, End of Year | | $ | 14.65 | | | $ | 13.77 | | | $ | 11.30 | | |
| Total Return† | | | 13.14 | %^(b) | | | 28.35 | %^ | | | (21.20 | )%* | |
Ratios/Supplemental Data | |
Net Assets, End of Year (in millions) | | $ | 71.2 | | | $ | 65.9 | | | $ | 53.6 | | |
| Ratio of Gross Expenses to Average Net Assets# | | | 1.45 | % | | | 1.47 | % | | | 1.49 | %** | |
Ratio of Net Expenses to Average Net Assets | | | 1.00 | % | | | 1.00 | % | | | 1.01 | %** | |
Ratio of Net Investment Income/(Loss) to
Average Net Assets | | | 0.56 | % | | | 1.00 | % | | | 1.12 | %** | |
Portfolio Turnover Rate | | | 31 | % | | | 26 | % | | | 31 | %^^* | |
See Notes to Financial Highlights
21
Financial Highlights (cont'd)
Class S | |
| | | Year Ended December 31, | |
| | | 2020 | | 2019 | | 2018 | | 2017 | | 2016 | |
Net Asset Value, Beginning of Year | | $ | 13.81 | | | $ | 11.30 | | | $ | 13.63 | | | $ | 10.82 | | | $ | 11.15 | | |
Income From Investment Operations: | |
| Net Investment Income/(Loss)@ | | | 0.01 | | | | 0.06 | | | | 0.02 | | | | 0.05 | | | | 0.08 | | |
Net Gains or Losses on Securities
(both realized and unrealized) | | | 1.65 | | | | 3.02 | | | | (2.33 | ) | | | 2.84 | | | | (0.28 | ) | |
Total From Investment Operations | | | 1.66 | | | | 3.08 | | | | (2.31 | ) | | | 2.89 | | | | (0.20 | ) | |
Less Distributions From: | |
Net Investment Income | | | (0.07 | ) | | | (0.02 | ) | | | (0.02 | ) | | | (0.08 | ) | | | (0.07 | ) | |
Net Realized Capital Gains | | | (0.70 | ) | | | (0.55 | ) | | | — | | | | — | | | | (0.06 | ) | |
Total Distributions | | | (0.77 | ) | | | (0.57 | ) | | | (0.02 | ) | | | (0.08 | ) | | | (0.13 | ) | |
Voluntary Contribution from Management | | | 0.01 | | | | — | | | | — | | | | — | | | | — | | |
Net Asset Value, End of Year | | $ | 14.70 | | | $ | 13.81 | | | $ | 11.30 | | | $ | 13.63 | | | $ | 10.82 | | |
| Total Return† | | | 12.57 | %^(b) | | | 27.69 | %^ | | | (16.95 | )% | | | 26.76 | % | | | (1.82 | )% | |
Ratios/Supplemental Data | |
Net Assets, End of Year (in millions) | | $ | 16.3 | | | $ | 16.5 | | | $ | 15.2 | | | $ | 83.6 | | | $ | 74.8 | | |
| Ratio of Gross Expenses to Average Net Assets# | | | 1.70 | % | | | 1.72 | % | | | 1.73 | % | | | 1.74 | % | | | 1.78 | % | |
Ratio of Net Expenses to Average Net Assets | | | 1.50 | % | | | 1.50 | % | | | 1.51 | % | | | 1.50 | % | | | 1.50 | % | |
Ratio of Net Investment Income/(Loss) to
Average Net Assets | | | 0.06 | % | | | 0.51 | % | | | 0.13 | % | | | 0.42 | % | | | 0.76 | % | |
Portfolio Turnover Rate | | | 31 | % | | | 26 | % | | | 31 | % | | | 23 | % | | | 28 | % | |
See Notes to Financial Highlights
22
Notes to Financial Highlights International Equity Portfolio
@ Calculated based on the average number of shares outstanding during each fiscal period.
(a) The date investment operations commenced.
(b) Had the Fund not received the voluntary contribution listed in Note B of the Notes to Financial Statements, the total return based on per share NAV for the year ended December 31, 2020, would have been:
| | | Year Ended
December 31,
2020 | |
Class I | | | 13.06 | % | |
Class S | | | 12.50 | % | |
† Total return based on per share NAV reflects the effects of changes in NAV on the performance of the Fund during each fiscal period. Returns assume income dividends and other distributions, if any, were reinvested. Results represent past performance and do not indicate future results. Current returns may be lower or higher than the performance data quoted. Investment returns and principal will fluctuate and shares, when redeemed, may be worth more or less than original cost. Total return would have been lower if Management had not reimbursed and/or waived certain expenses. Total return would have been lower if Management had not reimbursed and/or waived certain expenses. The total return information shown does not reflect charges and other expenses that apply to the separate accounts or the related insurance policies or other qualified pension or retirement plans, and the inclusion of these charges and other expenses would reduce the total return for all fiscal periods shown.
^ The class action proceeds listed in Note A of the Notes to Financial Statements had no impact on the Fund's total return for the year ended December 31, 2020. Had the Fund not received class action proceeds in 2019, total return based on per share NAV for the year ended December 31, 2019 would have been:
| | | Year Ended
December 31,
2019 | |
Class I | | | 28.07 | % | |
Class S | | | 27.41 | % | |
* Not annualized.
# Represents the annualized ratios of net expenses to average daily net assets if Management had not reimbursed certain expenses and/or waived a portion of the investment management fee.
** Annualized.
^^ Portfolio turnover is calculated at the Fund level. Percentage indicated was calculated for the year ended December 31, 2018 for Class I.
23
Report of Independent Registered Public Accounting Firm
To the Shareholders of
International Equity Portfolio and
Board of Trustees of the Neuberger Berman Advisers Management Trust
Opinion on the Financial Statements
We have audited the accompanying statement of assets and liabilities of International Equity Portfolio (the "Portfolio") (one of the portfolios constituting Neuberger Berman Advisers Management Trust (the "Trust")), including the schedule of investments, as of December 31, 2020, and the related statement of operations for the year then ended, the statements of changes in net assets for each of the two years in the period then ended, the financial highlights for each of the five years in the period then ended and the related notes (collectively referred to as the "financial statements"). In our opinion, the financial statements present fairly, in all material respects, the financial position of the Portfolio (one of the portfolios constituting Neuberger Berman Advisers Management Trust) at December 31, 2020, the results of its operations for the year then ended, the changes in its net assets for each of the two years in the period then ended and its financial highlights for each of the five years in the period then ended, in conformity with U.S. generally accepted accounting principles.
Basis for Opinion
These financial statements are the responsibility of the Trust's management. Our responsibility is to express an opinion on the Portfolio's financial statements based on our audits. We are a public accounting firm registered with the Public Company Accounting Oversight Board (United States) ("PCAOB") and are required to be independent with respect to the Trust in accordance with the U.S. federal securities laws and the applicable rules and regulations of the Securities and Exchange Commission and the PCAOB.
We conducted our audits in accordance with the standards of the PCAOB. Those standards require that we plan and perform the audit to obtain reasonable assurance about whether the financial statements are free of material misstatement, whether due to error or fraud. The Trust is not required to have, nor were we engaged to perform, an audit of the Trust's internal control over financial reporting. As part of our audits, we are required to obtain an understanding of internal control over financial reporting, but not for the purpose of expressing an opinion on the effectiveness of the Trust's internal control over financial reporting. Accordingly, we express no such opinion.
Our audits included performing procedures to assess the risks of material misstatement of the financial statements, whether due to error or fraud, and performing procedures that respond to those risks. Such procedures included examining, on a test basis, evidence regarding the amounts and disclosures in the financial statements. Our procedures included confirmation of securities owned as of December 31, 2020, by correspondence with the custodian and brokers or by other appropriate auditing procedures where replies from brokers were not received. Our audits also included evaluating the accounting principles used and significant estimates made by management, as well as evaluating the overall presentation of the financial statements. We believe that our audits provide a reasonable basis for our opinion.

We have served as the auditor of one or more Neuberger Berman investment companies since 1954.
Boston, Massachusetts
February 12, 2021
24
The following tables set forth information concerning the Trustees and Officers of the Fund. All persons named as Trustees and Officers also serve in similar capacities for other funds administered or managed by Neuberger Berman Investment Advisers LLC ("NBIA"). The Fund's Statement of Additional Information includes additional information about the Trustees as of the time of the Fund's most recent public offering and is available upon request, without charge, by calling (800) 877-9700.
Information about the Board of Trustees
Name, (Year of Birth),
and Address(1) | | Position(s)
and Length of
Time Served(2) | | Principal Occupation(s)(3) | | Number of
Funds in Fund
Complex
Overseen by
Fund Trustee | | Other Directorships
Held Outside Fund
Complex by Fund
Trustee(3) | |
Independent Fund Trustees | |
Michael J. Cosgrove (1949) | | Trustee since 2015 | | President, Carragh Consulting USA, since 2014; formerly, Executive, General Electric Company, 1970 to 2014, including President, Mutual Funds and Global Investment Programs, GE Asset Management, 2011 to 2014, President and Chief Executive Officer, Mutual Funds and Intermediary Business, GE Asset Management, 2007 to 2011, President, Institutional Sales and Marketing, GE Asset Management, 1998 to 2007, and Chief Financial Officer, GE Asset Management, and Deputy Treasurer, GE Company, 1988 to 1993. | |
| 46 |
| | Director, America Press, Inc. (not-for-profit Jesuit publisher), since 2015; formerly, Director, Fordham University, 2001 to 2018; formerly, Director, The Gabelli Go Anywhere Trust, June 2015 to June 2016; formerly, Director, Skin Cancer Foundation (not-for-profit), 2006 to 2015; formerly, Director, GE Investments Funds, Inc., 1997 to 2014; formerly, Trustee, GE Institutional Funds, 1997 to 2014; formerly, Director, GE Asset Management, 1988 to 2014; formerly, Director, Elfun Trusts, 1988 to 2014; formerly, Trustee, GE Pension & Benefit Plans, 1988 to 2014; formerly, Member of Board of Governors, Investment Company Institute. | |
25
Name, (Year of Birth),
and Address(1) | | Position(s)
and Length of
Time Served(2) | | Principal Occupation(s)(3) | | Number of
Funds in Fund
Complex
Overseen by
Fund Trustee | | Other Directorships
Held Outside Fund
Complex by Fund
Trustee(3) | |
Marc Gary (1952) | | Trustee since 2015 | | Executive Vice Chancellor and Chief Operating Officer, Jewish Theological Seminary, since 2012; formerly, Executive Vice President and General Counsel, Fidelity Investments, 2007 to 2012; formerly, Executive Vice President and General Counsel, BellSouth Corporation, 2004 to 2007; formerly, Vice President and Associate General Counsel, BellSouth Corporation, 2000 to 2004; formerly, Associate, Partner, and National Litigation Practice Co-Chair, Mayer, Brown LLP, 1981 to 2000; formerly, Associate Independent Counsel, Office of Independent Counsel, 1990 to 1992. | |
| 46 |
| | Director, UJA Federation of Greater New York, since 2019; Trustee, Jewish Theological Seminary, since 2015; Director, Legility, Inc. (privately held for-profit company), since 2012; Director, Lawyers Committee for Civil Rights Under Law (not-for-profit), since 2005; formerly, Director, Equal Justice Works (not-for-profit), 2005 to 2014; formerly, Director, Corporate Counsel Institute, Georgetown University Law Center, 2007 to 2012; formerly, Director, Greater Boston Legal Services (not-for-profit), 2007 to 2012. | |
26
Name, (Year of Birth),
and Address(1) | | Position(s)
and Length of
Time Served(2) | | Principal Occupation(s)(3) | | Number of
Funds in Fund
Complex
Overseen by
Fund Trustee | | Other Directorships
Held Outside Fund
Complex by Fund
Trustee(3) | |
Martha C. Goss (1949) | | Trustee since 2007 | | President, Woodhill Enterprises Inc./Chase Hollow Associates LLC (personal investment vehicle), since 2006; formerly, Consultant, Resources Global Professionals (temporary staffing), 2002 to 2006; formerly, Chief Financial Officer, Booz-Allen & Hamilton, Inc., 1995 to 1999; formerly, Enterprise Risk Officer, Prudential Insurance, 1994 to1995; formerly, President, Prudential Asset Management Company, 1992 to 1994; formerly, President, Prudential Power Funding (investments in electric and gas utilities and alternative energy projects), 1989 to 1992; formerly, Treasurer, Prudential Insurance Company, 1983 to 1989. | |
| 46 |
| | Director, American Water (water utility), since 2003; Director, Allianz Life of New York (insurance), since 2005; Director, Berger Group Holdings, Inc. (engineering consulting firm), since 2013; Director, Financial Women's Association of New York (not-for-profit association), since 2003; Trustee Emerita, Brown University, since 1998; Director, Museum of American Finance (not-for-profit), since 2013; formerly, Non-Executive Chair and Director, Channel Reinsurance (financial guaranty reinsurance), 2006 to 2010; formerly, Director, Ocwen Financial Corporation (mortgage servicing), 2005 to 2010; formerly, Director, Claire's Stores, Inc. (retailer), 2005 to 2007; formerly, Director, Parsons Brinckerhoff Inc. (engineering consulting firm), 2007 to 2010; formerly, Director, Bank Leumi (commercial bank), 2005 to 2007; formerly, Advisory Board Member, Attensity (software developer), 2005 to 2007. | |
27
Name, (Year of Birth),
and Address(1) | | Position(s)
and Length of
Time Served(2) | | Principal Occupation(s)(3) | | Number of
Funds in Fund
Complex
Overseen by
Fund Trustee | | Other Directorships
Held Outside Fund
Complex by Fund
Trustee(3) | |
Michael M. Knetter (1960) | | Trustee since 2007 | | President and Chief Executive Officer, University of Wisconsin Foundation, since 2010; formerly, Dean, School of Business, University of Wisconsin—Madison; formerly, Professor of International Economics and Associate Dean, Amos Tuck School of Business—Dartmouth College, 1998 to 2002. | |
| 46 |
| | Director, 1 William Street Credit Income Fund, since 2018; Board Member, American Family Insurance (a mutual company, not publicly traded), since March 2009; formerly, Trustee, Northwestern Mutual Series Fund, Inc., 2007 to 2011; formerly, Director, Wausau Paper, 2005 to 2011; formerly, Director, Great Wolf Resorts, 2004 to 2009. | |
Deborah C. McLean (1954) | | Trustee since 2015 | | Member, Circle Financial Group (private wealth management membership practice), since 2011; Managing Director, Golden Seeds LLC (an angel investing group), since 2009; Adjunct Professor, Columbia University School of International and Public Affairs, since 2008; formerly, Visiting Assistant Professor, Fairfield University, Dolan School of Business, Fall 2007; formerly, Adjunct Associate Professor of Finance, Richmond, The American International University in London, 1999 to 2007. | |
| 46 |
| | Board member, Norwalk Community College Foundation, since 2014; Dean's Advisory Council, Radcliffe Institute for Advanced Study, since 2014; formerly, Director and Treasurer, At Home in Darien (not-for-profit), 2012 to 2014; formerly, Director, National Executive Service Corps (not-for-profit), 2012 to 2013; formerly, Trustee, Richmond, The American International University in London, 1999 to 2013. | |
28
Name, (Year of Birth),
and Address(1) | | Position(s)
and Length of
Time Served(2) | | Principal Occupation(s)(3) | | Number of
Funds in Fund
Complex
Overseen by
Fund Trustee | | Other Directorships
Held Outside Fund
Complex by Fund
Trustee(3) | |
George W. Morriss (1947) | | Trustee since 2007 | | Adjunct Professor, Columbia University School of International and Public Affairs, since 2012; formerly, Executive Vice President and Chief Financial Officer, People's United Bank, Connecticut (a financial services company), 1991 to 2001. | |
| 46 |
| | Director, 1 William Street Credit Income Fund, since 2018; Director and Chair, Thrivent Church Loan and Income Fund, since 2018; formerly, Trustee, Steben Alternative Investment Funds, Steben Select Multi-Strategy Fund, and Steben Select Multi-Strategy Master Fund, 2013 to 2017; formerly, Treasurer, National Association of Corporate Directors, Connecticut Chapter, 2011 to 2015; formerly, Manager, Larch Lane Multi-Strategy Fund complex (which consisted of three funds), 2006 to 2011; formerly, Member, NASDAQ Issuers' Affairs Committee, 1995 to 2003. | |
Tom D. Seip (1950) | | Trustee since 2000; Chairman of the Board since 2008; formerly Lead Independent Trustee from 2006 to 2008 | | Formerly, Managing Member, Ridgefield Farm LLC (a private investment vehicle), 2004 to 2016; formerly, President and CEO, Westaff, Inc. (temporary staffing), May 2001 to January 2002; formerly, Senior Executive, The Charles Schwab Corporation, 1983 to 1998, including Chief Executive Officer, Charles Schwab Investment Management, Inc.; Trustee, Schwab Family of Funds and Schwab Investments, 1997 to 1998; and Executive Vice President-Retail Brokerage, Charles Schwab & Co., Inc., 1994 to 1997. | |
| 46 |
| | Formerly, Director, H&R Block, Inc. (tax services company), 2001 to 2018; formerly, Director, Talbot Hospice Inc., 2013 to 2016; formerly, Chairman, Governance and Nominating Committee, H&R Block, Inc., 2011 to 2015; formerly, Chairman, Compensation Committee, H&R Block, Inc., 2006 to 2010; formerly, Director, Forward Management, Inc. (asset management company), 1999 to 2006. | |
29
Name, (Year of Birth),
and Address(1) | | Position(s)
and Length of
Time Served(2) | | Principal Occupation(s)(3) | | Number of
Funds in Fund
Complex
Overseen by
Fund Trustee | | Other Directorships
Held Outside Fund
Complex by Fund
Trustee(3) | |
James G. Stavridis (1955) | | Trustee since 2015 | | Operating Executive, The Carlyle Group, since 2018; Commentator, NBC News, since 2015; formerly, Dean, Fletcher School of Law and Diplomacy, Tufts University, 2013 to 2018; formerly, Admiral, United States Navy, 1976 to 2013, including Supreme Allied Commander, NATO and Commander, European Command, 2009 to 2013, and Commander, United States Southern Command, 2006 to 2009. | |
| 46 |
| | Director, American Water (water utility), since 2018; Director, NFP Corp. (insurance broker and consultant), since 2017; Director, U.S. Naval Institute, since 2014; Director, Onassis Foundation, since 2014; Director, BMC Software Federal, LLC, since 2014; Director, Vertical Knowledge, LLC, since 2013; formerly, Director, Navy Federal Credit Union, 2000-2002. | |
30
Name, (Year of Birth),
and Address(1) | | Position(s)
and Length of
Time Served(2) | | Principal Occupation(s)(3) | | Number of
Funds in Fund
Complex
Overseen by
Fund Trustee | | Other Directorships
Held Outside Fund
Complex by Fund
Trustee(3) | |
Candace L. Straight (1947) | | Trustee since 1999 | | Private investor and consultant specializing in the insurance industry; formerly, Advisory Director, Securitas Capital LLC (a global private equity investment firm dedicated to making investments in the insurance sector), 1998 to 2003. | |
| 46 |
| | Director, ERA Coalition (not-for-profit), 2019 to 2020; Director, Re belle Media (a privately held TV and film production company), since 2018; formerly, Public Member, Board of Governors and Board of Trustees, Rutgers University, 2011 to 2016; formerly, Director, Montpelier Re Holdings Ltd. (reinsurance company), 2006 to 2015; formerly, Director, National Atlantic Holdings Corporation (property and casualty insurance company), 2004 to 2008; formerly, Director, The Proformance Insurance Company (property and casualty insurance company), 2004 to 2008; formerly, Director, Providence Washington Insurance Company (property and casualty insurance company), 1998 to 2006; formerly, Director, Summit Global Partners (insurance brokerage firm), 2000 to 2005. | |
Peter P. Trapp (1944) | | Trustee since 1984 | | Retired; formerly, Regional Manager for Mid-Southern Region, Ford Motor Credit Company, September 1997 to 2007; formerly, President, Ford Life Insurance Company, April 1995 to August 1997. | |
| 46 |
| | None. | |
31
Name, (Year of Birth),
and Address(1) | | Position(s)
and Length of
Time Served(2) | | Principal Occupation(s)(3) | | Number of
Funds in Fund
Complex
Overseen by
Fund Trustee | | Other Directorships
Held Outside Fund
Complex by Fund
Trustee(3) | |
Fund Trustees who are "Interested Persons" | |
Joseph V. Amato* (1962) | | Chief Executive Officer and President since 2018 and Trustee since 2009 | | President and Director, Neuberger Berman Group LLC, since 2009; President and Chief Executive Officer, Neuberger Berman BD LLC and Neuberger Berman Holdings LLC (including its predecessor, Neuberger Berman Inc.), since 2007; Chief Investment Officer (Equities) and President (Equities), NBIA (formerly, Neuberger Berman Fixed Income LLC and including predecessor entities), since 2007, and Board Member of NBIA since 2006; formerly, Global Head of Asset Management of Lehman Brothers Holdings Inc.'s ("LBHI") Investment Management Division, 2006 to 2009; formerly, member of LBHI's Investment Management Division's Executive Management Committee, 2006 to 2009; formerly, Managing Director, Lehman Brothers Inc. ("LBI"), 2006 to 2008; formerly, Chief Recruiting and Development Officer, LBI, 2005 to 2006; formerly, Global Head of LBI's Equity Sales and a Member of its Equities Division Executive Committee, 2003 to 2005; President and Chief Executive Officer, ten registered investment companies for which NBIA acts as investment manager and/or administrator. | |
| 46 |
| | Member of Board of Advisors, McDonough School of Business, Georgetown University, since 2001; Member of New York City Board of Advisors, Teach for America, since 2005; Trustee, Montclair Kimberley Academy (private school), since 2007; Member of Board of Regents, Georgetown University, since 2013. | |
(1) The business address of each listed person is 1290 Avenue of the Americas, New York, NY 10104.
32
(2) Pursuant to the Trust's Amended and Restated Trust Instrument, subject to any limitations on the term of service imposed by the By-Laws or any retirement policy adopted by the Fund Trustees, each Fund Trustee shall hold office for life or until his or her successor is elected or the Trust terminates; except that (a) any Fund Trustee may resign by delivering a written resignation; (b) any Fund Trustee may be removed with or without cause at any time by a written instrument signed by at least two-thirds of the other Fund Trustees; (c) any Fund Trustee who requests to be retired, or who has become unable to serve, may be retired by a written instrument signed by a majority of the other Fund Trustees; and (d) any Fund Trustee may be removed at any shareholder meeting by a vote of at least two-thirds of the outstanding shares.
(3) Except as otherwise indicated, each individual has held the positions shown during at least the last five years.
* Indicates a Fund Trustee who is an "interested person" within the meaning of the 1940 Act. Mr. Amato is an interested person of the Trust by virtue of the fact that he is an officer of NBIA and/or its affiliates.
33
Information about the Officers of the Trust
Name, (Year of Birth),
and Address(1) | | Position(s)
and Length of
Time Served(2) | | Principal Occupation(s)(3) | |
Claudia A. Brandon (1956) | | Executive Vice President since 2008 and Secretary since 1985 | | Senior Vice President, Neuberger Berman, since 2007 and Employee since 1999; Senior Vice President, NBIA, since 2008 and Assistant Secretary since 2004; formerly, Vice President, Neuberger Berman, 2002 to 2006; formerly, Vice President—Mutual Fund Board Relations, NBIA, 2000 to 2008; formerly, Vice President, NBIA, 1986 to 1999 and Employee, 1984 to 1999; Executive Vice President and Secretary, twenty-nine registered investment companies for which NBIA acts as investment manager and/or administrator. | |
Agnes Diaz (1971) | | Vice President since 2013 | | Senior Vice President, Neuberger Berman, since 2012; Senior Vice President, NBIA, since 2012 and Employee since 1996; formerly, Vice President, Neuberger Berman, 2007 to 2012; Vice President, ten registered investment companies for which NBIA acts as investment manager and/or administrator. | |
Anthony DiBernardo (1979) | | Assistant Treasurer since 2011 | | Senior Vice President, Neuberger Berman, since 2014; Senior Vice President, NBIA, since 2014, and Employee since 2003; formerly, Vice President, Neuberger Berman, 2009 to 2014; Assistant Treasurer, ten registered investment companies for which NBIA acts as investment manager and/or administrator. | |
Savonne L. Ferguson (1973) | | Chief Compliance Officer since 2018 | | Senior Vice President, Chief Compliance Officer (Mutual Funds) and Associate General Counsel, NBIA, since November 2018; formerly, Vice President T. Rowe Price Group, Inc. (2018), Vice President and Senior Legal Counsel, T. Rowe Price Associates, Inc. (2014-2018), Vice President and Director of Regulatory Fund Administration, PNC Capital Advisors, LLC (2009-2014), Secretary, PNC Funds and PNC Advantage Funds (2010-2014); Chief Compliance Officer, twenty-nine registered investment companies for which NBIA acts as investment manager and/or administrator. | |
Corey A. Issing (1978) | | Chief Legal Officer since 2016 (only for purposes of sections 307 and 406 of the Sarbanes-Oxley Act of 2002) | | General Counsel and Head of Compliance—Mutual Funds since 2016 and Managing Director, NBIA, since 2017; formerly, Associate General Counsel (2015 to 2016), Counsel (2007 to 2015), Senior Vice President (2013-2016), Vice President (2009-2013); Chief Legal Officer (only for purposes of sections 307 and 406 of the Sarbanes-Oxley Act of 2002), twenty-nine registered investment companies for which NBIA acts as investment manager and/or administrator. | |
Sheila R. James (1965) | | Assistant Secretary since 2002 | | Vice President, Neuberger Berman, since 2008 and Employee since 1999; Vice President, NBIA, since 2008; formerly, Assistant Vice President, Neuberger Berman, 2007; Employee, NBIA, 1991 to 1999; Assistant Secretary, twenty-nine registered investment companies for which NBIA acts as investment manager and/or administrator. | |
34
Name, (Year of Birth),
and Address(1) | | Position(s)
and Length of
Time Served(2) | | Principal Occupation(s)(3) | |
Brian Kerrane (1969) | | Chief Operating Officer since 2015 and Vice President since 2008 | | Managing Director, Neuberger Berman, since 2014; Chief Operating Officer—Mutual Funds and Managing Director, NBIA, since 2015; formerly, Senior Vice President, Neuberger Berman, 2006 to 2014; Vice President, NBIA, 2008 to 2015 and Employee since 1991; Chief Operating Officer, ten registered investment companies for which NBIA acts as investment manager and/or administrator; Vice President, twenty-nine registered investment companies for which NBIA acts as investment manager and/or administrator. | |
Anthony Maltese (1959) | | Vice President since 2015 | | Senior Vice President, Neuberger Berman, since 2014 and Employee since 2000; Senior Vice President, NBIA, since 2014; Vice President, ten registered investment companies for which NBIA acts as investment manager and/or administrator. | |
Josephine Marone (1963) | | Assistant Secretary since 2017 | | Senior Paralegal, Neuberger Berman, since 2007 and Employee since 2007; Assistant Secretary, twenty-nine registered investment companies for which NBIA acts as investment manager and/or administrator. | |
Owen F. McEntee, Jr. (1961) | | Vice President since 2008 | | Vice President, Neuberger Berman, since 2006; Vice President, NBIA, since 2006 and Employee since 1992; Vice President, ten registered investment companies for which NBIA acts as investment manager and/or administrator. | |
John M. McGovern (1970) | | Treasurer and Principal Financial and Accounting Officer since 2005 | | Senior Vice President, Neuberger Berman, since 2007; Senior Vice President, NBIA, since 2007 and Employee since 1993; formerly, Vice President, Neuberger Berman, 2004 to 2006; formerly, Assistant Treasurer, 2002 to 2005; Treasurer and Principal Financial and Accounting Officer, ten registered investment companies for which NBIA acts as investment manager and/or administrator. | |
Frank Rosato (1971) | | Assistant Treasurer since 2005 | | Vice President, Neuberger Berman, since 2006; Vice President, NBIA, since 2006 and Employee since 1995; Assistant Treasurer, ten registered investment companies for which NBIA acts as investment manager and/or administrator. | |
Niketh Velamoor (1979) | | Anti-Money Laundering Compliance Officer since 2018 | | Senior Vice President and Associate General Counsel, Neuberger Berman, since July 2018; Assistant United States Attorney, Southern District of New York, 2009 to 2018; Anti-Money Laundering Compliance Officer, four registered investment companies for which NBIA acts as investment manager and/or administrator. | |
(1) The business address of each listed person is 1290 Avenue of the Americas, New York, NY 10104.
(2) Pursuant to the By-Laws of the Trust, each officer elected by the Fund Trustees shall hold office until his or her successor shall have been elected and qualified or until his or her earlier death, inability to serve, or resignation. Officers serve at the pleasure of the Fund Trustees and may be removed at any time with or without cause.
(3) Except as otherwise indicated, each individual has held the positions shown during at least the last five years.
35
Proxy Voting Policies and Procedures
A description of the policies and procedures that the Trust uses to determine how to vote proxies relating to portfolio securities is available, without charge, by calling 800-877-9700 (toll-free) and on the SEC's website, at www.sec.gov. Information regarding how the Trust voted proxies relating to portfolio securities during the most recent 12-month period ended June 30 is also available upon request, without charge, by calling 800-877-9700 (toll-free), on the SEC's website at www.sec.gov, and on Neuberger Berman's website at www.nb.com.
Quarterly Portfolio Schedule
The Trust files a complete schedule of portfolio holdings with the SEC for the first and third quarters of each fiscal year as an exhibit to its report on Form N-PORT. The Trust's Form N-PORT is available on the SEC's website at www.sec.gov. The portfolio holdings information on Form N-PORT is available upon request, without charge, by calling 800-877-9700 (toll free).
Board Consideration of the Management Agreement
On an annual basis, the Board of Trustees (the "Board") of Neuberger Berman Advisers Management Trust (the "Trust"), including the Trustees who are not "interested persons" of the Trust or of Neuberger Berman Investment Advisers LLC ("Management") (including its affiliates) ("Independent Fund Trustees"), considers whether to continue the management agreement with Management (the "Agreement") with respect to International Equity Portfolio (the "Fund"). Throughout the process, the Independent Fund Trustees are advised by counsel that is experienced in Investment Company Act of 1940 matters and that is independent of Management ("Independent Counsel"). At a meeting held on October 1, 2020, the Board, including the Independent Fund Trustees, approved the continuation of the Agreement for the Fund.
In evaluating the Agreement, the Board, including the Independent Fund Trustees, reviewed extensive materials provided by Management in response to questions submitted by the Independent Fund Trustees and Independent Counsel, and met with senior representatives of Management regarding its personnel, operations, and profitability as they relate to the Fund. The annual contract review extends over at least two regular meetings of the Board to ensure that Management has time to respond to any questions the Independent Fund Trustees may have on their initial review of the materials and that the Independent Fund Trustees have time to consider those responses.
In connection with its deliberations, the Board also considered the broad range of information relevant to the annual contract review that is provided to the Board (including its various standing committees) at meetings throughout the year, including reports on investment performance, portfolio risk, and other portfolio information for the Fund, as well as periodic reports on, among other matters, pricing and valuation; quality and cost of portfolio trade execution; compliance; and shareholder and other services provided by Management and its affiliates. The Contract Review Committee, which is comprised of Independent Fund Trustees, was established by the Board to assist in its evaluation and analysis of materials for the annual contract review. The Board has also established other committees that focus throughout the year on specific areas relevant to the annual contract review, such as Fund performance or compliance matters, and that are charged with specific responsibilities regarding the annual contract review. Those committees provide reports to the Contract Review Committee and the full Board, which consider that information as part of the annual contract review process. The Board's Contract Review Committee annually considers and updates the questions it asks of Management in light of legal advice furnished to it by Independent Counsel; its own business judgment; and developments in the industry, in the markets, in mutual fund regulation and litigation, and in Management's business model.
The Independent Fund Trustees received from Independent Counsel a memorandum discussing the legal standards for their consideration of the proposed continuation of the Agreement. During the course of the year and during their deliberations regarding the annual contract review, the Contract Review Committee and the Independent Fund Trustees met with Independent Counsel separately from representatives of Management.
36
Provided below is a description of the Board's contract approval process and material factors that the Board considered at its meetings regarding renewal of the Agreement and the compensation to be paid thereunder. In connection with its approval of the continuation of the Agreement, the Board evaluated the terms of the Agreement, the overall fairness of the Agreement to the Fund, and whether the Agreement was in the best interests of the Fund and its shareholders. The Board's determination to approve the continuation of the Agreement was based on a comprehensive consideration of all information provided to the Board throughout the year and specifically in connection with the annual contract review. The Board considered the Fund's investment management agreement separately from those of other funds of the Trust.
This description is not intended to include all of the factors considered by the Board. The Board members did not identify any particular information or factor that was all-important or controlling, and each Trustee may have attributed different weights to the various factors. The Board focused on the costs and benefits of the Agreement to the Fund and, through the Fund, its shareholders.
Nature, Extent, and Quality of Services
With respect to the nature, extent, and quality of the services provided, the Board considered the investment philosophy and decision-making processes of, and the qualifications, experience, and capabilities of, and the resources available to, the portfolio management personnel of Management who perform services for the Fund. The Board noted that Management also provides certain administrative services, including fund accounting and compliance services. The Board also considered Management's policies and practices regarding brokerage, commissions, other trading costs, and allocation of portfolio transactions and reviewed the quality of the execution services that Management had provided. The Board also reviewed Management's use of brokers to execute Fund transactions that provide research services to Management. Moreover, the Board considered Management's approach to potential conflicts of interest both generally and between the Fund's investments and those of other funds or accounts managed by Management. The Board also noted that Management had increased its research capabilities with respect to environmental, social, and corporate governance matters and how those factors may relate to investment performance. The Board noted the additional responsibilities of Management in administering the liquidity risk management program.
The Board recognized the extensive range of services that Management provides to the Fund beyond the investment management services. The Board noted that Management is also responsible for monitoring compliance with the Fund's investment objectives, policies, and restrictions, as well as compliance with applicable law, including implementing rulemaking initiatives of the U.S. Securities and Exchange Commission. The Board considered that Management assumes significant ongoing entrepreneurial and business risks as the investment adviser and sponsor for the Fund, for which it is entitled to reasonable compensation. The Trustees also considered that Management's responsibilities include continual management of investment, operational, enterprise, legal, regulatory, and compliance risks as they relate to the Fund, and the Board considers on a regular basis information regarding Management's processes for monitoring and managing risk. In addition, the Board also noted that when Management launches a new fund or share class, it assumes entrepreneurial risk with respect to that fund or share class, and that some funds and share classes have been liquidated without ever having been profitable to Management.
The Board also reviewed and evaluated Management's activities under its contractual obligation to oversee the Fund's various outside service providers, including its renegotiation of certain service providers' fees and its evaluation of service providers' infrastructure, cybersecurity programs, compliance programs, and business continuity programs, among other matters. The Board also considered Management's ongoing development of its own infrastructure and information technology to support the Fund through, among other things, cybersecurity, business continuity planning, and risk management. The Board noted Management's largely seamless implementation of its business continuity plan in response to the COVID-19 pandemic. In addition, the Board noted the positive compliance history of Management, as no significant compliance problems were reported to the Board with respect to Management. The Board also considered the general structure of the portfolio managers' compensation and whether this structure provides appropriate incentives to act in the best interests of the Fund. The Board also considered the ability of Management to attract and retain qualified personnel to service the Fund.
37
As in past years, the Board also considered the manner in which Management addressed various matters that arose during the year, some of them a result of developments in the broader fund industry or the regulations governing it. In addition, the Board considered actions taken by Management in response to recent market conditions, such as the economic dislocation and rise in volatility that accompanied shutdowns related to the efforts to stem the spread of COVID-19, and considered the overall performance of Management in this context.
Fund Performance
The Board requested a report from an outside consulting firm that specializes in the analysis of fund industry data that compared the Fund's performance, along with its fees and other expenses, to a group of industry peers ("Expense Group") and a broader universe of funds pursuing generally similar strategies with the same investment classification and/or objective ("Performance Universe"). The Expense Group and Performance Universe were composed of two types of funds: proprietary funds that are operated by insurance companies or their affiliates, and non-proprietary funds, such as the Fund, operated for insurance company investors by independent investment managers. The Board considered the Fund's performance and fees in light of the limitations inherent in the methodology for constructing such comparative groups and determining which investment companies should be included in the comparative groups, noting differences as compared to certain fund industry ranking and rating systems. The Board also considered the impact and inherent limitation on the comparisons due to the small number of funds included in the Fund's Expense Group and Performance Universe.
With respect to investment performance, the Board considered information regarding the Fund's short-, intermediate- and long-term performance, net of the Fund's fees and expenses, on an absolute basis, relative to a benchmark index that does not deduct the fees or expenses of investing, and compared to the performance of the Expense Group and Performance Universe, each constructed by the consulting firm. The Board also reviewed performance in relation to certain measures of the degree of investment risk undertaken by the portfolio managers.
The Performance Universe referenced in this section was identified by the consulting firm, as discussed above. For any period of underperformance, the Board considered the magnitude and duration of that underperformance relative to the Performance Universe, and/or the benchmark (e.g., the amount by which a Fund underperformed, including, for example, whether the Fund slightly underperformed or significantly underperformed its benchmark). With respect to performance quintile rankings for the Fund compared to its Performance Universe, the first quintile represents the highest (best) performance and the fifth quintile represents the lowest performance. For investment performance comparisons, the Board looked at the Fund's Class S as a proxy for both of the Fund's classes.
The Board considered that, based on performance data for the periods ended December 31, 2019: (1) as compared to its benchmark, the Fund's performance was higher for the 1-, 3-, 5-, and 10-year periods; and (2) as compared to its Performance Universe, the Fund's performance was in the third quintile for the 1-year period, the fifth quintile for the 3-year period, the fourth quintile for the 5-year period, and the second quintile for the 10-year period. The Board also met with members of the portfolio management team in December 2019 to discuss the Fund's performance. The Board also noted the Fund's outperformance versus its benchmark during the 7-month period ending July 31, 2020.
Noting that the Fund underperformed over certain periods, the Board considered Management's representations regarding the factors impacting the Fund's performance and discussed with Management the Fund's performance, potential reasons for the relative performance, and, if necessary, steps that Management had taken, or intended to take, to improve performance. The Board also considered Management's responsiveness to the Fund's relative performance. In this regard, the Board noted that performance, especially short-term performance, is only one of the factors that it deems relevant to its consideration of the Agreement and that, after considering all relevant factors, it determined to approve the continuation of the Agreement notwithstanding the Fund's relative underperformance.
38
Fee Rates, Profitability, and Fall-out Benefits
With respect to the overall fairness of the Agreement, the Board considered the fee structure for the Fund under the Agreement as compared to the Expense Group provided by the consulting firm, as discussed above. The Board reviewed a comparison of the Fund's management fee to its Expense Group. The Board noted that the comparative management fee analysis includes, in the Fund's management fee, the separate administrative fees paid to Management. However, the Board noted that some funds in the Expense Group pay directly from fund assets for certain services that Management covers out of the administration fees for the Fund. Accordingly, the Board also considered the Fund's total expense ratio as compared with its Expense Group as a way of taking account of these differences.
The Board compared the Fund's contractual and actual management fees to the median of the contractual and actual management fees, respectively, of the Fund's Expense Group. (The actual management fees are the contractual management fees reduced by any fee waivers or other adjustments.) The Board also compared the Fund's total expenses to the median of the total expenses of the Fund's Expense Group. The Board noted that the Fund's actual management fee and total expenses were higher than the Expense Group median, and considered whether specific portfolio management, administration or oversight needs contributed to the Fund's actual management fee and total expenses. With respect to the quintile rankings for fees and total expenses (net of waivers or other adjustments, if any) for the Fund compared to its Expense Group, the first quintile represents the lowest fees and/or total expenses and the fifth quintile represents the highest fees and/or total expenses. For fee comparisons, the Board looked at the Fund's Class S as a proxy for both of the Fund's classes.
The Board considered that, as compared to its Expense Group, the Fund's contractual management fee, the actual management fee net of fees waived by Management, and total expenses each ranked in the fifth quintile.
In addition to considering the above-referenced factors, the Board took note of its ongoing dialogue with Management regarding the dynamics of the insurance/annuity marketplace. The Board considered, among other matters, related tax restrictions and the unique challenges facing that market generally, which assisted the Board in understanding the context for the Fund's expense ratio and performance.
In concluding that the benefits accruing to Management and its affiliates by virtue of their relationship with the Fund were reasonable in light of the costs of providing the investment advisory and other services and the benefits accruing to the Fund, the Board reviewed specific data as to Management's estimated profit on the Fund for a recent period on a pre-tax basis without regard to distribution expenses, including year-over-year changes in each of Management's reported expense categories. (The Board also reviewed data on Management's estimated profit on the Fund after distribution/servicing expenses and taxes were factored in, as indicators of the health of the business and the extent to which Management is directing its profits into the growth of the business.) The Board considered the cost allocation methodology that Management used in developing its estimated profitability figures. In recent years, the Board engaged an independent forensic accountant to review the profitability methodology utilized by Management when preparing this information and discussed with the consultant its conclusion that Management's process for calculating and reporting its estimated profit was not unreasonable.
Recognizing that there is no uniform methodology regarding the allocation of firm-wide or complex-wide expenses within the asset management industry for determining profitability for this purpose and that the use of different reasonable methodologies can give rise to different profit and loss results, the Board, in recent years, requested from Management examples of profitability calculated by different methods and noted that the estimated profitability levels were still reasonable when calculated by these other methods. The Board further noted Management's representation that its estimate of profitability is derived using methodology that is consistent with the methodology used to assess and/or report measures of profitability elsewhere at the firm. In addition, the Board recognized that Management's calculations regarding its costs may not reflect all risks, including regulatory, legal, operational, reputational, and, where appropriate, entrepreneurial risks, associated with offering and managing a mutual fund in the current regulatory and market environment. The Board also considered any fall-out (i.e., indirect) benefits likely to accrue to Management or its affiliates from their relationship with the Fund, such as research it may receive from broker-dealers executing the Funds' portfolio transactions on an agency basis. The Board recognized that Management and its affiliates should be entitled to
39
earn a reasonable level of profits for services they provide to the Fund and, based on its review, concluded that Management's reported level of estimated profitability on the Fund was reasonable.
Information Regarding Services to Other Clients
The Board also considered other funds and separate accounts that were advised or sub-advised by Management or its affiliates with investment objectives, policies and strategies that were similar to those of the Fund, and compared the fees charged to the Fund to the fees charged to such comparable funds and separate accounts. The Board considered the appropriateness and reasonableness of any differences between the fees charged to a Fund and such comparable funds and/or separate accounts, and determined that differences in fees and fee structures were consistent with the differences in the management and other services provided. The Board explored with Management its assertion that although, generally, the rates of fees paid by such accounts, except other Neuberger Berman mutual funds, were lower than the fee rates paid by the corresponding Fund, the differences reflected Management's greater level of responsibilities and significantly broader scope of services regarding the Fund, the more extensive regulatory obligations and risks associated with managing the Fund, and other financial considerations with respect to creation and sponsorship of the Fund.
Economies of Scale
The Board also evaluated apparent or anticipated economies of scale in relation to the services Management provides to the Fund. The Board considered whether the Fund's fee structure provides for a reduction of payments resulting from the use of breakpoints, the size of any breakpoints in the Fund's advisory fees, and whether any such breakpoints are set at appropriate asset levels. The Board also compared the breakpoint structure to that of the Expense Group. In addition, the Board considered the expense limitation and/or fee waiver arrangements that reduces Fund expenses at all asset levels which can have an effect similar to breakpoints in sharing economies of scale with shareholders and provide protection from an increase in expenses if the Fund's assets decline. The Board also considered that Management has provided, at no added cost to the Fund, certain additional services, including but not limited to, services required by new regulations or regulatory interpretations, services impelled by changes in the securities markets or the business landscape, and/or services requested by the Board. The Board considered that this is a way of sharing economies of scale with the Fund and its shareholders.
Conclusions
In approving the continuation of the Agreement, the Board concluded that, in its business judgment, the terms of the Agreement are fair and reasonable to the Fund and that approval of the continuation of the Agreement is in the best interests of the Fund and its shareholders. In reaching this determination, the Board considered that Management could be expected to continue to provide a high level of service to the Fund; that the performance of the Fund was satisfactory over time; that the Board retained confidence in Management's capabilities to manage the Fund; that the Fund's fee structure appeared to the Board to be reasonable given the nature, extent, and quality of services provided ; and that the benefits accruing to Management and its affiliates by virtue of their relationship with the Fund were reasonable in light of the costs of providing the investment advisory and other services and the benefits accruing to the Fund. The Board's conclusions may be based in part on its consideration of materials prepared in connection with the approval or continuance of the Agreement in prior years and on the Board's ongoing regular review of Fund performance and operations throughout the year, in addition to material prepared specifically for the most recent annual review of the Agreement.
40
Notice to Shareholders
The Fund has elected to pass through to its shareholders the credits for taxes paid to foreign countries. For the fiscal year ended December 31, 2020, the Fund designates $59,701, or $0.01 per share outstanding, foreign taxes paid and $1,255,856, or $0.22 per share outstanding, foreign source income earned for federal income tax purposes. The Fund designates $3,769,580 as a capital gain distribution.
41
Neuberger Berman
Advisers Management Trust
Mid Cap Growth Portfolio
I Class Shares
S Class Shares
Annual Report
December 31, 2020
As permitted by regulations adopted by the U.S. Securities and Exchange Commission, you may no longer receive paper copies of the Fund's annual and semi-annual shareholder reports by mail from the insurance company that issued your variable annuity and variable life insurance contract or from the financial intermediary that administers your qualified pension or retirement plan, unless you specifically request paper copies of the reports from your insurance company or financial intermediary. Instead, the reports will be made available on the Fund's website www.nb.com/AMTliterature, and may also be available on a website from the insurance company or financial intermediary that offers your contract or administers your retirement plan, and such insurance company or financial intermediary will notify you by mail each time a report is posted and provide you with a website link to access the report.
If you already elected to receive shareholder reports electronically, you will not be affected by this change and you need not take any action. You may elect to receive shareholder reports and other communications from the insurance company or financial intermediary electronically by following the instructions provided by the insurance company or financial intermediary. If offered by your insurance company or financial intermediary, you may elect to receive all future reports in paper and free of charge from the insurance company or financial intermediary. You can contact your insurance company or financial intermediary if you wish to continue receiving paper copies of your shareholder reports. Your election to receive reports in paper will apply to all funds available under your contract or retirement plan.
Mid Cap Growth Portfolio Commentary (Unaudited)
The Neuberger Berman Advisers Management Trust Mid Cap Growth Portfolio Class I had a total return of 39.98% for the 12-month period ended December 31, 2020 (the reporting period), outperforming its benchmark, the Russell Midcap® Growth Index (the Index), which returned 35.59% for the same period. (Performance for all share classes is provided in the table immediately following this letter.)
2020 was an unprecedented year that encapsulated a stunningly accelerated market cycle, as what began with a frightening initial proliferation of COVID-19 that overwhelmed our health care infrastructure and stymied economic development, eventually pivoted to forward-looking optimism anticipating an eventual return to normalcy and remarkably closed with strong momentum from unexpectedly compelling vaccine efficacy results. While science garnered the headlines, the reality is that our extraordinary journey from fearful market dislocation to bull recovery was buttressed by impressive monetary and fiscal stimulus, which likely blunted the negative momentum that could have been further amplified by political disfunction, social unrest and a disjointed response to combatting the pandemic. Given that backdrop, it shouldn't be a surprise that 2020 demanded an active approach and that the prevailing economic, monetary and fiscal environment strongly favored growth-style investing.
Our search for resilient trends targeting newly relevant opportunities and evolving needs and, in populating those investment themes, renewed qualitative emphasis on management leadership, balance sheet strength and the financial self-reliance necessary to navigate the uncertain and disruptive nature of this pandemic, was validated as strong stock selection within Information Technology (IT), Industrials and Consumer Staples easily offset COVID-related weakness within Consumer Discretionary and Financials. At the industry level, the accelerated pace of digital transformation initiatives represented a significant tailwind for multiple IT segments, while virus precautions and concerns triggered a precipitous decline in elective medical procedures, which resulted in our Health Care Equipment & Supplies allocation being the leading detractor to relative performance. Drilling down to our holdings, Twilio, which provides cloud-based infrastructure to develop customizable and scalable communication networks, was the leading contributor to performance as their digital messaging tools benefitted from the surge in e-commerce and work-from-home, while MasTec, an infrastructure construction company focused on energy, cable and water projects, was the leading detractor as a broad decline in non-IT capital expenditures significantly impacted their project pipeline. We exited the position during the reporting period.
While it was unquestionably cathartic to flip the last calendar page and officially close the books on 2020, the sobering reality is that despite an impressive global therapeutic development effort, many of the associated social constraints, economic hardships and health challenges of the past year will persist into 2021. However, that doesn't imply that 2021 can't again deliver a compelling market environment for equities, active management and growth-style investing. As we look ahead, we don't anticipate a binary-type style rotation that abandons growth in favor of more value-oriented segments of the market. Instead, we're cautiously optimistic that innovation, the sustainability of digital transformation trends and behaviors, accommodative policy from the U.S. Federal Reserve Board and the likelihood of additional fiscal stimulus will continue to foster a favorable environment for equities and for growth stocks in particular. That said, we are mindful that challenging expectations lie ahead for many of our highest conviction ideas, but we believe our longer-term confidence in those broader secular themes, and the specific companies driving them, outweigh the risk of any potential near-term weakness. Regardless of how 2021 unfolds, our focus will remain on identifying business models with long-term sustainability, highlighted by underappreciated and intriguing catalysts, expanding addressable markets, compelling top- and bottom-line fundamentals and balance sheet strength.
Sincerely,
KENNETH J. TUREK
PORTFOLIO MANAGER
Information about principal risks of investing in the Fund is set forth in the prospectus and statement of additional information.
The portfolio composition, industries and holdings of the Fund are subject to change without notice.
The opinions expressed are those of the Fund's portfolio manager. The opinions are as of the date of this report and are subject to change without notice.
1
Mid Cap Growth Portfolio (Unaudited)
SECTOR ALLOCATION
(as a % of Total Investments*) | |
Communication Services | | | 6.0 | % | |
Consumer Discretionary | | | 13.3 | | |
Consumer Staples | | | 2.9 | | |
Financials | | | 3.8 | | |
Health Care | | | 19.5 | | |
Industrials | | | 14.2 | | |
Information Technology | | | 36.9 | | |
Materials | | | 1.0 | | |
Real Estate | | | 0.5 | | |
Short-Term Investments | | | 1.9 | | |
Total | | | 100.0 | % | |
* Derivatives, if any, are excluded from this chart.
PERFORMANCE HIGHLIGHTS
| | Inception | | Average Annual Total Return
Ended 12/31/2020 | |
| | Date | | 1 Year | | 5 Years | | 10 Years | | Life of Fund | |
At NAV | |
Class I | | 11/03/1997 | | | 39.98 | % | | | 17.87 | % | | | 14.02 | % | | | 10.69 | % | |
| Class S2 | | 02/18/2003 | | | 39.71 | % | | | 17.54 | % | | | 13.72 | % | | | 10.47 | % | |
Index | |
Russell Midcap®
Growth Index1,3 | | | | | 35.59 | % | | | 18.66 | % | | | 15.04 | % | | | 9.89 | % | |
| Russell Midcap® Index1,3 | | | | | 17.10 | % | | | 13.40 | % | | | 12.41 | % | | | 9.94 | % | |
The performance data quoted represent past performance and do not indicate future results. Current performance may be lower or higher than the performance data quoted. For current performance data, including current to the most recent month-end, please visit http://www.nb.com/amtportfolios/performance.
The results shown in the table reflect the reinvestment of income dividends and other distributions, if any. The results do not reflect the effect of taxes a shareholder would pay on Fund distributions or on the redemption of Fund shares. The results do not reflect fees and expenses of the variable annuity and variable life insurance policies or the qualified pension and retirement plans whose proceeds are invested in the Fund.
The investment return and principal value of an investment will fluctuate and shares, when redeemed, may be worth more or less than their original cost.
Returns would have been lower if Neuberger Berman Investment Advisers LLC ("Management") had not reimbursed certain expenses and/or waived a portion of the investment management fees during certain of the periods shown. Repayment by a class (of expenses previously reimbursed and/or fees previously waived by Management) will decrease the class's returns. Please see Note B in the Notes to Financial Statements for specific information regarding expense reimbursement and/or fee waiver arrangements.
As stated in the Fund's most recent prospectus, the total annual operating expense ratios for fiscal year 2019 were 0.93% and 1.18% for Class I and Class S shares, respectively (before expense reimbursements and/or fee waivers, if any). The expense ratio was 1.11% after expense reimbursements and/or fee waivers for Class S shares. The expense ratios for the annual period ended December 31, 2020 can be found in the Financial Highlights section of this report.
2
Mid Cap Growth Portfolio (Unaudited)
COMPARISON OF A $10,000 INVESTMENT

This graph shows the change in value of a hypothetical $10,000 investment in the Fund over the past 10 fiscal years, or since the Fund's inception if it has not operated for 10 years. The graph is based on Class I shares only; the performance of the Fund's share classes will differ primarily due to different class expenses (see Performance Highlights chart above).The result is compared with benchmarks, which include a broad-based market index and may include a more narrowly based index. Market indices have not been reduced to reflect any of the fees and costs of investing. The results shown in the graph reflect the reinvestment of income dividends and other distributions, if any. The results do not reflect the effect of taxes a shareholder would pay on Fund distributions or on the redemption of Fund shares. The results do not reflect fees and expenses of the variable annuity and variable life insurance policies or the qualified pension and retirement plans whose proceeds are invested in the Fund. Results represent past performance and do not indicate future results.
Please see Endnotes for additional information.
3
1 The date used to calculate Life of Fund performance for the index is November 3, 1997, the inception date of Class I shares, the Fund's oldest share class.
2 Performance shown prior to February 18, 2003 for Class S shares is that of Class I shares, which has lower expenses and correspondingly higher returns than Class S shares.
3 The Russell Midcap® Growth Index is a float-adjusted market capitalization-weighted index that measures the performance of the mid-cap growth segment of the U.S. equity market. It includes those Russell Midcap® Index companies with higher price-to-book ratios and higher forecasted growth rates. The index is rebalanced annually in June. The Russell Midcap Index is a float-adjusted market capitalization-weighted index that measures the performance of the mid-cap segment of the U.S. equity market. It includes approximately 800 of the smallest securities in the Russell 1000® Index. The index is rebalanced annually in June. Please note that the indices described in this report do not take into account any fees, expenses or tax consequences of investing in the individual securities that they track, and that individuals cannot invest directly in any index. Data about the performance of an index are prepared or obtained by Neuberger Berman Investment Advisers LLC ("Management") and reflect the reinvestment of income dividends and other distributions, if any. The Fund may invest in securities not included in a described index and generally does not invest in all securities included in a described index.
The investments for the Fund are managed by the same portfolio manager(s) who manage(s) one or more other registered funds that have names, investment objectives and investment styles that are similar to those of the Fund. You should be aware that the Fund is likely to differ from those other mutual fund(s) in size, cash flow pattern and tax matters. Accordingly, the holdings and performance of the Fund can be expected to vary from those of the other mutual fund(s).
Shares of the separate Neuberger Berman Advisers Management Trust Portfolios, including the Fund, are not available to the general public. Shares of the Fund may be purchased only by life insurance companies to be held in their separate accounts, which fund variable annuity and variable life insurance policies, and by qualified pension and retirement plans. Statistics and projections in this report are derived from sources deemed to be reliable but cannot be regarded as a representation of future results of the Fund. This report is prepared for the general information of shareholders and is not an offer of shares of the Fund. Shares are sold only through the currently effective prospectus, which must precede or accompany this report.
The "Neuberger Berman" name and logo and "Neuberger Berman Investment Advisers LLC" name are registered service marks of Neuberger Berman Group LLC. The individual Fund name in this piece is either a service mark or registered service mark of Neuberger Berman Investment Advisers LLC, an affiliate of Neuberger Berman BD LLC, distributor, member FINRA.
© 2021 Neuberger Berman BD LLC, distributor. All rights reserved.
4
Information About Your Fund's Expenses (Unaudited)
As a Fund shareholder, you incur two types of costs: (1) transaction costs such as fees and expenses that are, or may be, imposed under your variable contract or qualified pension plan; and (2) ongoing costs, including management fees, distribution and/or service (12b-1) fees (if applicable), and other Fund expenses. This example is intended to help you understand your ongoing costs (in U.S. dollars) of investing in the Fund and compare these costs with the ongoing costs of investing in other mutual funds.
This table is designed to provide information regarding costs related to your investments. The following examples are based on an investment of $1,000 made at the beginning of the six month period ended December 31, 2020 and held for the entire period. The table illustrates the Fund's costs in two ways:
Actual Expenses and Performance: | | The first section of the table provides information about actual account values and actual expenses in dollars, based on the Fund's actual performance during the period indicated. You may use the information in this line, together with the amount you invested, to estimate the expenses you paid over the period. Simply divide your account value by $1,000 (for example, an $8,600 account value divided by $1,000 = 8.6), then multiply the result by the number in the first section of the table under the heading entitled "Expenses Paid During the Period" to estimate the expenses you paid over the period. | |
Hypothetical Example for
Comparison Purposes: | | The second section of the table provides information about hypothetical account values and hypothetical expenses based on the Fund's actual expense ratio and an assumed rate of return at 5% per year before expenses. This return is not the Fund's actual return. The hypothetical account values and expenses may not be used to estimate the actual ending account balance or expenses you paid for the period. You may use this information to compare the ongoing costs of investing in this Fund versus other funds. To do so, compare the expenses shown in this 5% hypothetical example with the 5% hypothetical examples that appear in the shareholder reports of other funds. | |
Please note that the expenses in the table are meant to highlight your ongoing costs only and do not include any transaction costs, such as fees and expenses that are, or may be imposed under your variable contract or qualified pension plan. Therefore, the information under the heading "Hypothetical (5% annual return before expenses)" is useful in comparing ongoing costs only, and will not help you determine the relative total costs of owning different funds. In addition, if these transaction costs were included, your costs would have been higher.
Expense Example (Unaudited)
NEUBERGER BERMAN ADVISERS MANAGEMENT TRUST MID CAP GROWTH PORTFOLIO
Actual | | Beginning Account
Value
7/1/20 | | Ending Account
Value
12/31/20 | | Expenses Paid
During the Period
7/1/20 – 12/31/20 | | Expense
Ratio | |
Class I | | $ | 1,000.00 | | | $ | 1,313.30 | | | $ | 5.29 | (a) | | | 0.91 | % | |
Class S | | $ | 1,000.00 | | | $ | 1,312.00 | | | $ | 6.39 | (a) | | | 1.10 | % | |
Hypothetical (5% annual return before expenses) | |
Class I | | $ | 1,000.00 | | | $ | 1,020.56 | | | $ | 4.62 | (b) | | | 0.91 | % | |
Class S | | $ | 1,000.00 | | | $ | 1,019.61 | | | $ | 5.58 | (b) | | | 1.10 | % | |
(a) For each class, expenses are equal to the annualized expense ratio for the class, multiplied by the average account value over the period, multiplied by 184/366 (to reflect the one-half year period shown).
(b) Hypothetical expenses are equal to the annualized expense ratios for each class, multiplied by the average account value over the period (assuming a 5% annual return), multiplied by 184/366 (to reflect the one-half year period shown).
5
Legend Mid Cap Growth Portfolio (Unaudited)
December 31, 2020
Counterparties:
SSB = State Street Bank and Trust Company
6
Schedule of Investments Mid Cap Growth Portfolio^ December 31, 2020
NUMBER OF SHARES | | | | VALUE | |
Common Stocks 98.2% | | | �� |
Aerospace & Defense 2.5% | | | |
| | 34,400 | | | Axon Enterprise, Inc. | | $ | 4,215,032 | * | |
| | 44,300 | | | HEICO Corp. | | | 5,865,320 | | |
| | 12,300 | | | Teledyne Technologies, Inc. | | | 4,821,354 | * | |
| | | | 14,901,706 | | |
Auto Components 1.5% | | | |
| | 39,300 | | | Aptiv PLC | | | 5,120,397 | | |
| | 29,500 | | | Visteon Corp. | | | 3,702,840 | * | |
| | | | 8,823,237 | | |
Banks 2.3% | | | |
| | 32,000 | | | Signature Bank | | | 4,329,280 | | |
| | 24,600 | | | SVB Financial Group | | | 9,540,618 | * | |
| | | | 13,869,898 | | |
Beverages 1.1% | | | |
| | 6,400 | | | Boston Beer Co., Inc. Class A | | | 6,363,456 | * | |
Biotechnology 3.3% | | | |
| | 98,300 | | | ACADIA Pharmaceuticals, Inc. | | | 5,255,118 | * | |
| | 27,000 | | | Ascendis Pharma A/S ADR | | | 4,503,060 | * | |
| | 63,900 | | | Exact Sciences Corp. | | | 8,466,111 | * | |
| | 10,000 | | | Sarepta Therapeutics, Inc. | | | 1,704,900 | * | |
| | | | 19,929,189 | | |
Capital Markets 1.5% | | | |
| | 59,000 | | | Houlihan Lokey, Inc. | | | 3,966,570 | | |
| | 8,900 | | | MarketAxess Holdings, Inc. | | | 5,077,984 | | |
| | | | 9,044,554 | | |
Commercial Services & Supplies 2.8% | | | |
| | 29,500 | | | Cintas Corp. | | | 10,427,070 | | |
| | 63,900 | | | Waste Connections, Inc. | | | 6,554,223 | | |
| | | | 16,981,293 | | |
Communications Equipment 0.2% | | | |
| | 15,000 | | | Lumentum Holdings, Inc. | | | 1,422,000 | * | |
Containers & Packaging 1.0% | | | |
| | 63,900 | | | Ball Corp. | | | 5,954,202 | | |
Diversified Consumer Services 2.0% | | | |
| 34,400 |
| | Bright Horizons Family
Solutions, Inc. | |
| 5,950,856 | * | |
| | 66,400 | | | Chegg, Inc. | | | 5,997,912 | * | |
| | | | 11,948,768 | | |
NUMBER OF SHARES | | | | VALUE | |
Electrical Equipment 2.6% | | | |
| | 66,400 | | | AMETEK, Inc. | | $ | 8,030,416 | | |
| | 33,400 | | | Generac Holdings, Inc. | | | 7,595,494 | * | |
| | | | 15,625,910 | | |
Electronic Equipment, Instruments & Components 3.0% | | | |
| | 34,400 | | | Amphenol Corp. Class A | | | 4,498,488 | | |
| | 44,300 | | | CDW Corp. | | | 5,838,297 | | |
| | 19,700 | | | Zebra Technologies Corp.
Class A | |
| 7,571,301
| * | |
| | | | 17,908,086 | | |
Entertainment 3.1% | | | |
| | 27,000 | | | Roku, Inc. | | | 8,964,540 | * | |
| | 29,500 | | | Spotify Technology SA | | | 9,282,470 | * | |
| | | | 18,247,010 | | |
Equity Real Estate Investment Trusts 0.5% | | | |
| | 9,800 | | | SBA Communications Corp. | | | 2,764,874 | | |
Food & Staples Retailing 1.0% | | | |
| | 152,400 | | | BJ's Wholesale Club
Holdings, Inc. | |
| 5,681,472
| * | |
Health Care Equipment & Supplies 6.8% | | | |
| | 18,700 | | | IDEXX Laboratories, Inc. | | | 9,347,569 | * | |
| | 34,400 | | | Insulet Corp. | | | 8,793,672 | * | |
| | 14,800 | | | Masimo Corp. | | | 3,972,024 | * | |
| | 24,600 | | | Penumbra, Inc. | | | 4,305,000 | * | |
| | 21,100 | | | Teleflex, Inc. | | | 8,684,127 | | |
| | 14,800 | | | West Pharmaceutical
Services, Inc. | |
| 4,192,988
|
| |
| | 10,000 | | | Zimmer Biomet Holdings, Inc. | | | 1,540,900 | | |
| | | | 40,836,280 | | |
Health Care Providers & Services 1.3% | | | |
| | 49,200 | | | Encompass Health Corp. | | | 4,068,348 | | |
| | 32,000 | | | Quest Diagnostics, Inc. | | | 3,813,440 | | |
| | | | 7,881,788 | | |
Health Care Technology 2.8% | | | |
| | 27,000 | | | Teladoc Health, Inc. | | | 5,398,920 | *(a) | |
| | 41,800 | | | Veeva Systems, Inc. Class A | | | 11,380,050 | * | |
| | | | 16,778,970 | | |
Hotels, Restaurants & Leisure 2.5% | | | |
| | 4,900 | | | Chipotle Mexican Grill, Inc. | | | 6,794,879 | * | |
| | 39,300 | | | Darden Restaurants, Inc. | | | 4,681,416 | | |
| | 78,700 | | | DraftKings, Inc. Class A | | | 3,664,272 | * | |
| | | | 15,140,567 | | |
Household Products 0.9% | | | |
| | 63,900 | | | Church & Dwight Co., Inc. | | | 5,573,997 | | |
See Notes to Financial Statements
7
Schedule of Investments Mid Cap Growth Portfolio^ (cont'd)
NUMBER OF SHARES | | | | VALUE | |
Industrial Conglomerates 0.9% | | | |
| | 12,300 | | | Roper Technologies, Inc. | | $ | 5,302,407 | | |
Interactive Media & Services 3.0% | | | |
| | 32,000 | | | IAC/InterActiveCorp. | | | 6,059,200 | * | |
| | 29,500 | | | Match Group, Inc. | | | 4,460,105 | * | |
| | 113,100 | | | Pinterest, Inc. Class A | | | 7,453,290 | * | |
| | | | 17,972,595 | | |
Internet & Direct Marketing Retail 0.7% | | | |
| | 22,100 | | | Etsy, Inc. | | | 3,931,811 | * | |
IT Services 8.7% | | | |
| | 27,000 | | | EPAM Systems, Inc. | | | 9,675,450 | * | |
| | 22,500 | | | MongoDB, Inc. | | | 8,078,400 | * | |
| | 35,000 | | | Okta, Inc. | | | 8,899,100 | * | |
| | 34,400 | | | Twilio, Inc. Class A | | | 11,644,400 | * | |
| | 32,000 | | | WEX, Inc. | | | 6,512,960 | * | |
| | 29,500 | | | Wix.com Ltd. | | | 7,373,820 | * | |
| | | | 52,184,130 | | |
Life Sciences Tools & Services 3.1% | | | |
| | 221,300 | | | Avantor, Inc. | | | 6,229,595 | * | |
| | 12,300 | | | Bio-Rad Laboratories, Inc.
Class A | |
| 7,170,162
| * | |
| | 152,400 | | | PPD, Inc. | | | 5,215,128 | * | |
| | | | 18,614,885 | | |
Machinery 1.3% | | | |
| | 39,300 | | | IDEX Corp. | | | 7,828,560 | | |
Multiline Retail 0.6% | | | |
| | 45,000 | | | Ollie's Bargain Outlet
Holdings, Inc. | |
| 3,679,650
| * | |
Pharmaceuticals 2.1% | | | |
| | 54,100 | | | Catalent, Inc. | | | 5,630,187 | * | |
| | 98,300 | | | Horizon Therapeutics PLC | | | 7,190,645 | * | |
| | | | 12,820,832 | | |
Professional Services 1.7% | | | |
| | 10,800 | | | CoStar Group, Inc. | | | 9,982,224 | * | |
Road & Rail 1.0% | | | |
| | 32,000 | | | Old Dominion Freight Line, Inc. | | | 6,245,760 | | |
Semiconductors & Semiconductor Equipment 6.9% | | | |
| | 68,800 | | | Entegris, Inc. | | | 6,611,680 | | |
| | 27,500 | | | KLA Corp. | | | 7,120,025 | | |
| | 147,500 | | | Marvell Technology Group Ltd. | | | 7,012,150 | | |
| | 27,000 | | | Monolithic Power Systems, Inc. | | | 9,888,210 | | |
NUMBER OF SHARES | | | | VALUE | |
| | 90,000 | | | ON Semiconductor Corp. | | $ | 2,945,700 | * | |
| | 65,000 | | | Teradyne, Inc. | | | 7,792,850 | | |
| | | | 41,370,615 | | |
Software 18.1% | | | |
| | 44,300 | | | Avalara, Inc. | | | 7,304,627 | * | |
| | 73,800 | | | Cloudflare, Inc. Class A | | | 5,608,062 | * | |
| | 29,500 | | | Coupa Software, Inc. | | | 9,997,845 | * | |
| | 42,500 | | | Crowdstrike Holdings, Inc.
Class A | |
| 9,002,350
| * | |
| | 51,600 | | | DocuSign, Inc. | | | 11,470,680 | * | |
| | 47,200 | | | Everbridge, Inc. | | | 7,036,104 | * | |
| | 42,500 | | | Five9, Inc. | | | 7,412,000 | * | |
| | 14,800 | | | HubSpot, Inc. | | | 5,867,312 | * | |
| | 56,500 | | | Manhattan Associates, Inc. | | | 5,942,670 | * | |
| | 37,500 | | | Paylocity Holding Corp. | | | 7,721,625 | * | |
| | 54,100 | | | Q2 Holdings, Inc. | | | 6,845,273 | * | |
| | 32,000 | | | RingCentral, Inc. Class A | | | 12,127,040 | * | |
| | 10,500 | | | Trade Desk, Inc. Class A | | | 8,410,500 | * | |
| | 17,200 | | | Zscaler, Inc. | | | 3,435,012 | * | |
| | | | 108,181,100 | | |
Specialty Retail 6.1% | | | |
| | 34,400 | | | Best Buy Co., Inc. | | | 3,432,776 | | |
| | 36,900 | | | Burlington Stores, Inc. | | | 9,651,195 | * | |
| | 54,100 | | | CarMax, Inc. | | | 5,110,286 | * | |
| | 63,900 | | | Dick's Sporting Goods, Inc. | | | 3,591,819 | | |
| | 44,300 | | | Five Below, Inc. | | | 7,751,614 | * | |
| | 14,800 | | | O'Reilly Automotive, Inc. | | | 6,698,036 | * | |
| | | | 36,235,726 | | |
Trading Companies & Distributors 1.3% | | | |
| | 34,400 | | | United Rentals, Inc. | | | 7,977,704 | * | |
| | | | | Total Common Stocks
(Cost $339,335,275) | |
| 588,005,256
|
| |
Short-Term Investments 2.0% | | | |
Investment Companies 2.0% | | | |
| | 11,470,768 | | | State Street Institutional
U.S. Government Money
Market Fund Premier
Class, 0.03%(b) | |
| 11,470,768
|
| |
| 175,964 |
| | State Street Navigator
Securities Lending
Government Money
Market Portfolio, 0.10%(b) | |
| 175,964 | (c) | |
| |
| | Total Short-Term Investments
(Cost $11,646,732) | |
| 11,646,732 |
| |
| |
| | Total Investments 100.2%
(Cost $350,982,007) | |
| 599,651,988 |
| |
| | | | | Liabilities Less Other Assets (0.2)% | | | (1,084,102 | ) | |
| | | | | Net Assets 100.0% | | $ | 598,567,886 | | |
See Notes to Financial Statements
8
Schedule of Investments Mid Cap Growth Portfolio^ (cont'd)
* Non-income producing security.
(a) The security or a portion of this security is on loan at December 31, 2020. Total value of all such securities at December 31, 2020 amounted to $169,366 for the Fund (see Note A of the Notes to Financial Statements).
(b) Represents 7-day effective yield as of December 31, 2020.
(c) Represents investment of cash collateral received from securities lending.
The following is a summary, categorized by Level (see Note A of Notes to Financial Statements), of inputs used to value the Fund's investments as of December 31, 2020:
Asset Valuation Inputs | | Level 1 | | Level 2 | | Level 3 | | Total | |
Investments: | |
| Common Stocks(a) | | $ | 588,005,256 | | | $ | — | | | $ | — | | | $ | 588,005,256 | | |
Short-Term Investments | | | — | | | | 11,646,732 | | | | — | | | | 11,646,732 | | |
Total Investments | | $ | 588,005,256 | | | $ | 11,646,732 | | | $ | — | | | $ | 599,651,988 | | |
(a) The Schedule of Investments provides information on the industry categorization for the portfolio.
^ A balance indicated with a "—", reflects either a zero balance or an amount that rounds to less than 1.
See Notes to Financial Statements
9
Statement of Assets and Liabilities
Neuberger Berman Advisers Management Trust
| | | MID CAP GROWTH
PORTFOLIO | |
| | | December 31, 2020 | |
Assets | |
Investments in securities, at value*† (Note A)—see Schedule of Investments: | |
| Unaffiliated issuers(a) | | $ | 599,651,988 | | |
Dividends and interest receivable | | | 68,104 | | |
Receivable for Fund shares sold | | | 7,758 | | |
Receivable for securities lending income (Note A) | | | 208 | | |
Prepaid expenses and other assets | | | 11,793 | | |
Total Assets | | | 599,739,851 | | |
Liabilities | |
Payable to investment manager—net (Note B) | | | 269,168 | | |
Payable for securities purchased | | | 256,760 | | |
Payable for Fund shares redeemed | | | 147,104 | | |
Payable to administrator—net (Note B) | | | 236,499 | | |
Payable to trustees | | | 12,717 | | |
Payable for loaned securities collateral (Note A) | | | 175,964 | | |
Other accrued expenses and payables | | | 73,753 | | |
Total Liabilities | | | 1,171,965 | | |
Net Assets | | $ | 598,567,886 | | |
Net Assets consist of: | |
Paid-in capital | | $ | 274,807,773 | | |
Total distributable earnings/(losses) | | | 323,760,113 | | |
Net Assets | | $ | 598,567,886 | | |
Net Assets | |
Class I | | $ | 139,393,896 | | |
Class S | | | 459,173,990 | | |
Shares Outstanding ($.001 par value; unlimited shares authorized) | |
Class I | | | 3,502,427 | | |
Class S | | | 12,734,762 | | |
Net Asset Value, offering and redemption price per share | |
Class I | | $ | 39.80 | | |
Class S | | | 36.06 | | |
†Securities on loan, at value: | |
Unaffiliated issuers | | $ | 169,366 | | |
*Cost of Investments: | |
(a) Unaffiliated Issuers | | $ | 350,982,007 | | |
See Notes to Financial Statements
10
Neuberger Berman Advisers Management Trust
| | | MID CAP GROWTH
PORTFOLIO | |
| | | For the Fiscal
Year Ended
December 31, 2020 | |
Investment Income: | |
Income (Note A): | |
Dividend income—unaffiliated issuers | | $ | 1,776,785 | | |
Interest and other income—unaffiliated issuers | | | 66,314 | | |
Income from securities loaned-net | | | 12,041 | | |
Foreign taxes withheld | | | (8,302 | ) | |
Total income | | $ | 1,846,838 | | |
Expenses: | |
Investment management fees (Note B) | | | 2,703,888 | | |
Administration fees (Note B): | |
Class I | | | 350,528 | | |
Class S | | | 1,162,119 | | |
Distribution fees (Note B): | |
Class S | | | 968,433 | | |
Shareholder servicing agent fees: | |
Class I | | | 85 | | |
Class S | | | 59 | | |
Audit fees | | | 40,442 | | |
Custodian and accounting fees | | | 78,658 | | |
Insurance | | | 16,778 | | |
Legal fees | | | 126,908 | | |
Shareholder reports | | | 21,481 | | |
Trustees' fees and expenses | | | 51,882 | | |
Interest | | | 413 | | |
Miscellaneous | | | 31,298 | | |
Total expenses | | | 5,552,972 | | |
Expenses reimbursed by Management (Note B) | | | (214,503 | ) | |
Total net expenses | | | 5,338,469 | | |
Net investment income/(loss) | | $ | (3,491,631 | ) | |
Realized and Unrealized Gain/(Loss) on Investments (Note A): | |
Net realized gain/(loss) on: | |
Transactions in investment securities of unaffiliated issuers | | | 78,554,284 | | |
Settlement of foreign currency transactions | | | 16 | | |
Change in net unrealized appreciation/(depreciation) in value of: | |
Investment securities of unaffiliated issuers | | | 102,197,342 | | |
Net gain/(loss) on investments | | | 180,751,642 | | |
Net increase/(decrease) in net assets resulting from operations | | $ | 177,260,011 | | |
See Notes to Financial Statements
11
Statements of Changes in Net Assets
Neuberger Berman Advisers Management Trust
| | | MID CAP GROWTH PORTFOLIO | |
| | | Fiscal Year Ended
December 31,
2020 | | Fiscal Year Ended
December 31,
2019 | |
Increase/(Decrease) in Net Assets: | |
From Operations (Note A): | |
Net investment income/(loss) | | $ | (3,491,631 | ) | | $ | (2,166,466 | ) | |
Net realized gain/(loss) on investments | | | 78,554,300 | | | | 26,771,062 | | |
Change in net unrealized appreciation/(depreciation) of investments | | | 102,197,342 | | | | 102,143,654 | | |
Net increase/(decrease) in net assets resulting from operations | | | 177,260,011 | | | | 126,748,250 | | |
Distributions to Shareholders From (Note A): | |
Distributable earnings: | |
Class I | | | (5,782,156 | ) | | | (7,652,681 | ) | |
Class S | | | (21,091,814 | ) | | | (27,361,448 | ) | |
Total distributions to shareholders | | | (26,873,970 | ) | | | (35,014,129 | ) | |
From Fund Share Transactions (Note D): | |
Proceeds from shares sold: | |
Class I | | | 16,001,264 | | | | 15,626,858 | | |
Class S | | | 10,204,641 | | | | 17,851,730 | | |
Proceeds from reinvestment of dividends and distributions: | |
Class I | | | 5,782,156 | | | | 7,652,681 | | |
Class S | | | 21,091,814 | | | | 27,361,448 | | |
Payments for shares redeemed: | |
Class I | | | (32,484,568 | ) | | | (24,173,564 | ) | |
Class S | | | (67,867,539 | ) | | | (33,150,767 | ) | |
Net increase/(decrease) from Fund share transactions | | | (47,272,232 | ) | | | 11,168,386 | | |
Net Increase/(Decrease) in Net Assets | | | 103,113,809 | | | | 102,902,507 | | |
Net Assets: | |
Beginning of year | | | 495,454,077 | | | | 392,551,570 | | |
End of year | | $ | 598,567,886 | | | $ | 495,454,077 | | |
See Notes to Financial Statements
12
Notes to Financial Statements Mid Cap Growth Portfolio
Note A—Summary of Significant Accounting Policies:
1 General: Neuberger Berman Advisers Management Trust (the "Trust") is a Delaware statutory trust organized pursuant to an Amended and Restated Trust Instrument dated March 27, 2014. The Trust is registered as an open-end management investment company under the Investment Company Act of 1940, as amended (the "1940 Act"), and its shares are registered under the Securities Act of 1933, as amended. Neuberger Berman Advisers Management Trust Mid Cap Growth Portfolio (the "Fund") is a separate operating series of the Trust and is diversified. The Fund offers Class I and Class S shares. The Trust's Board of Trustees (the "Board") may establish additional series or classes of shares without the approval of shareholders.
A balance indicated with a "—", reflects either a zero balance or a balance that rounds to less than 1.
The assets of the Fund belong only to the Fund, and the liabilities of the Fund are borne solely by the Fund and no other series of the Trust.
The Fund is an investment company and accordingly follows the investment company accounting and reporting guidance of the Financial Accounting Standards Board Accounting Standards Codification ("ASC") Topic 946 "Financial Services—Investment Companies."
The preparation of financial statements in accordance with U.S. generally accepted accounting principles ("GAAP") requires Neuberger Berman Investment Advisers LLC ("Management" or "NBIA") to make estimates and assumptions at the date of the financial statements. Actual results could differ from those estimates.
Shares of the Fund are not available to the general public and may be purchased only by life insurance companies to serve as an investment vehicle for premiums paid under their variable annuity and variable life insurance contracts and to certain qualified pension and other retirement plans.
2 Portfolio valuation: In accordance with ASC 820 "Fair Value Measurement" ("ASC 820"), all investments held by the Fund are carried at the value that Management believes the Fund would receive upon selling an investment in an orderly transaction to an independent buyer in the principal or most advantageous market for the investment under current market conditions. Various inputs, including the volume and level of activity for the asset or liability in the market, are considered in valuing the Fund's investments, some of which are discussed below. Significant Management judgment may be necessary to value investments in accordance with ASC 820.
ASC 820 established a three-tier hierarchy of inputs to create a classification of value measurements for disclosure purposes. The three-tier hierarchy of inputs is summarized in the three broad Levels listed below.
• Level 1—unadjusted quoted prices in active markets for identical investments
• Level 2—other observable inputs (including quoted prices for similar investments, interest rates, prepayment speeds, credit risk, amortized cost, etc.)
• Level 3—unobservable inputs (including the Fund's own assumptions in determining the fair value of investments)
The inputs or methodology used for valuing an investment are not necessarily an indication of the risk associated with investing in those securities.
The value of the Fund's investments in equity securities, for which market quotations are readily available, is generally determined by Management by obtaining valuations from independent pricing services based on the latest sale price quoted on a principal exchange or market for that security (Level 1 inputs). Securities traded primarily on the NASDAQ Stock Market are normally valued at the NASDAQ Official Closing Price ("NOCP") provided by NASDAQ each business day. The NOCP is the most recently reported price as of 4:00:02 p.m., Eastern Time, unless that price is outside the range of the "inside" bid and asked prices (i.e., the bid and asked prices that
13
dealers quote to each other when trading for their own accounts); in that case, NASDAQ will adjust the price to equal the inside bid or asked price, whichever is closer. Because of delays in reporting trades, the NOCP may not be based on the price of the last trade to occur before the market closes. If there is no sale of a security on a particular day, the independent pricing services may value the security based on market quotations.
Management has developed a process to periodically review information provided by independent pricing services for all types of securities.
Investments in non-exchange traded investment companies are valued using the respective fund's daily calculated net asset value ("NAV") per share (Level 2 inputs).
If a valuation is not available from an independent pricing service, or if Management has reason to believe that the valuation received does not represent the amount the Fund might reasonably expect to receive on a current sale in an orderly transaction, Management seeks to obtain quotations from brokers or dealers (generally considered Level 2 or Level 3 inputs depending on the number of quotes available). If such quotations are not readily available, the security is valued using methods the Board has approved in the good-faith belief that the resulting valuation will reflect the fair value of the security. Inputs and assumptions considered in determining the fair value of a security based on Level 2 or Level 3 inputs may include, but are not limited to, the type of the security; the initial cost of the security; the existence of any contractual restrictions on the security's disposition; the price and extent of public trading in similar securities of the issuer or of comparable companies; quotations or evaluated prices from broker-dealers and/or pricing services; information obtained from the issuer and/or analysts; an analysis of the company's or issuer's financial statements; an evaluation of the inputs that influence the issuer and the market(s) in which the security is purchased and sold.
Fair value prices are necessarily estimates, and there is no assurance that such a price will be at or close to the price at which the security is next quoted or next trades.
3 Foreign currency translations: The accounting records of the Fund are maintained in U.S. dollars. Foreign currency amounts are normally translated into U.S. dollars using the exchange rate as of 4:00 p.m. Eastern Time, on days the New York Stock Exchange is open for business, to determine the value of investments, other assets and liabilities. Purchase and sale prices of securities, and income and expenses, are translated into U.S. dollars at the prevailing rate of exchange on the respective dates of such transactions. Net unrealized foreign currency gain/(loss), if any, arises from changes in the value of assets and liabilities, other than investments in securities, as a result of changes in exchange rates and is stated separately in the Statement of Operations.
4 Securities transactions and investment income: Securities transactions are recorded on trade date for financial reporting purposes. Dividend income is recorded on the ex-dividend date or, for certain foreign dividends, as soon as the Fund becomes aware of the dividends. Non-cash dividends included in dividend income, if any, are recorded at the fair market value of the securities received. Interest income, including accretion of discount (adjusted for original issue discount, where applicable), and amortization of premium, where applicable, is recorded on the accrual basis. Realized gains and losses from securities transactions and foreign currency transactions, if any, are recorded on the basis of identified cost and stated separately in the Statement of Operations.
5 Income tax information: The Fund is treated as a separate entity for U.S. federal income tax purposes. It is the policy of the Fund to continue to qualify for treatment as a regulated investment company ("RIC") by complying with the requirements of the U.S. Internal Revenue Code applicable to RICs and to distribute substantially all of its net investment income and net realized capital gains to its shareholders. To the extent the Fund distributes substantially all of its net investment income and net realized capital gains to shareholders, no federal income or excise tax provision is required.
The Fund has adopted the provisions of ASC 740 "Income Taxes" ("ASC 740"). ASC 740 sets forth a minimum threshold for financial statement recognition of a tax position taken, or expected to be taken, in a tax return. The Fund recognizes interest and penalties, if any, related to unrecognized tax positions as an income tax expense in
14
the Statement of Operations. The Fund is subject to examination by U.S. federal and state tax authorities for returns filed for the tax years for which the applicable statutes of limitations have not yet expired. As of December 31, 2020, the Fund did not have any unrecognized tax positions.
For federal income tax purposes, the estimated cost in value of investments held at December 31, 2020 was $351,001,868. The estimated gross unrealized appreciation was $249,054,044 and estimated gross unrealized depreciation was $403,924 resulting in net unrealized appreciation of $248,650,120 based on cost for U.S. federal income tax purposes.
Income distributions and capital gain distributions are determined in accordance with income tax regulations, which may differ from GAAP. These differences are primarily due to differing treatments of income and gains on various investment securities held by the Fund, timing differences and differing characterization of distributions made by the Fund. The Fund may also utilize earnings and profits distributed to shareholders on redemption of their shares as a part of the dividends-paid deduction for income tax purposes.
Any permanent differences resulting from different book and tax treatment are reclassified at year-end and have no impact on net income, NAV or NAV per share of the Fund. For the year ended December 31, 2020, the Fund recorded permanent reclassifications related to prior year true up adjustments:
| Paid-in Capital | | Total Distributable
Earnings/(Losses) | |
| $ | (37,500 | ) | | $ | 37,500 | | |
The tax character of distributions paid during the years ended December 31, 2020, and December 31, 2019, was as follows:
| | | Distributions Paid From: | |
| | | Ordinary Income | | Long-Term Capital Gain | | Total | |
| | | 2020 | | 2019 | | 2020 | | 2019 | | 2020 | | 2019 | |
| | | $ | — | | | $ | — | | | $ | 26,873,970 | | | $ | 35,014,129 | | | $ | 26,873,970 | | | $ | 35,014,129 | | |
As of December 31, 2020, the components of distributable earnings (accumulated losses) on a U.S. federal income tax basis were as follows:
Undistributed
Ordinary
Income | | Undistributed
Long-Term
Capital Gain | | Unrealized
Appreciation/
(Depreciation) | | Loss
Carryforwards
and Deferrals | | Other
Temporary
Differences | | Total | |
| $ | 1,246,637 | | | $ | 73,863,356 | | | $ | 248,650,120 | | | $ | — | | | $ | — | | | $ | 323,760,113 | | |
The temporary differences between book basis and tax basis distributable earnings are primarily due to losses disallowed and recognized on wash sales and tax adjustments related to other investments.
6 Distributions to shareholders: The Fund may earn income, net of expenses, daily on its investments. Distributions from net investment income and net realized capital gains, if any, are generally distributed once a year (usually in October) and are recorded on the ex-date.
7 Foreign taxes: Foreign taxes withheld, if any, represent amounts withheld by foreign tax authorities, net of refunds recoverable.
8 Expense allocation: Certain expenses are applicable to multiple funds within the complex of related investment companies. Expenses directly attributable to a fund are charged to that fund. Expenses of the Trust that are not directly attributable to a particular series of the Trust (e.g., the Fund) are allocated among the series of the Trust, on the basis of relative net assets, except where a more appropriate allocation of expenses to each of the series can otherwise be made fairly. Expenses borne by the complex of related investment companies, which includes open-end and closed-end investment companies for which NBIA serves as investment manager, that are not directly attributable to a particular investment company in the complex (e.g., the Trust) or series thereof are
15
allocated among the investment companies in the complex or series thereof on the basis of relative net assets, except where a more appropriate allocation of expenses to each of the investment companies in the complex or series thereof can otherwise be made fairly. The Fund's expenses (other than those specific to each class) are allocated proportionally each day among its classes based upon the relative net assets of each class.
9 Investments in foreign securities: Investing in foreign securities may involve sovereign and other risks, in addition to the credit and market risks normally associated with domestic securities. These additional risks include the possibility of adverse political and economic developments (including political instability, nationalization, expropriation, or confiscatory taxation) and the potentially adverse effects of unavailability of public information regarding issuers, less governmental supervision and regulation of financial markets, reduced liquidity of certain financial markets, and the lack of uniform accounting, auditing, and financial reporting standards or the application of standards that are different or less stringent than those applied in the United States. Foreign securities also may experience greater price volatility, higher rates of inflation, and delays in settlement.
10 Investment company securities and exchange-traded funds: The Fund may invest in shares of other registered investment companies, including exchange-traded funds ("ETFs"), within the limitations prescribed by (a) the 1940 Act, (b) the exemptive order from the Securities and Exchange Commission ("SEC") that permits the Fund to invest in both affiliated and unaffiliated investment companies, including ETFs, in excess of the limits in Section 12(d)(1)(A) of the 1940 Act, subject to the terms and conditions of such order, or (c) the ETF's exemptive order or other relief. Some ETFs seek to track the performance of a particular market index. These indices include both broad-based market indices and more narrowly-based indices, including those relating to particular sectors, markets, regions or industries. However, some ETFs have an actively-managed investment objective. ETF shares are traded like traditional equity securities on a national securities exchange or NASDAQ. The Fund will indirectly bear its proportionate share of any management fees and other expenses paid by such other investment companies, which will decrease returns.
11 Securities lending: The Fund, using State Street Bank and Trust Company ("State Street") as its lending agent, may loan securities to qualified brokers and dealers in exchange for negotiated lender's fees. These fees, if any, would be disclosed within the Statement of Operations under the caption "Income from securities loaned-net" and are net of expenses retained by State Street as compensation for its services as lending agent.
The initial cash collateral received by the Fund at the beginning of each transaction shall have a value equal to at least 102% of the prior day's market value of the loaned securities (105% in the case of international securities). Thereafter, the value of the cash collateral is monitored on a daily basis, and cash collateral is moved daily between a counterparty and the Fund until the close of the transaction. The Fund may only receive collateral in the form of cash (U.S. dollars). Cash collateral is generally invested in a money market fund registered under the 1940 Act that is managed by an affiliate of State Street. The risks associated with lending portfolio securities include, but are not limited to, possible delays in receiving additional collateral or in the recovery of the loaned securities. Any increase or decrease in the fair value of the securities loaned and any interest earned or dividends paid or owed on those securities during the term of the loan would accrue to the Fund.
As of December 31, 2020, the Fund had outstanding loans of securities to certain approved brokers, with a value of $169,366, for which it received collateral as follows:
| | | Remaining Contractual Maturity of the Agreements | |
| | | Overnight and
Continuous | | Less Than
30 Days | | Between
30 & 90 Days | | Greater Than
90 Days | | Total | |
Securities Lending Transactions(a) | | $ | 175,964 | | | $ | — | | | $ | — | | | $ | — | | | $ | 175,964 | | |
(a) Amounts represent the payable for loaned securities collateral received.
The Fund is required to disclose both gross and net information for assets and liabilities related to derivatives, repurchase and reverse repurchase agreements, and securities lending and securities borrowing transactions, if any, that are eligible for offset or subject to an enforceable master netting or similar agreement. The Fund's
16
securities lending assets at fair value are reported gross in the Statement of Assets and Liabilities. The following tables present the Fund's securities lending assets by counterparty and net of the related collateral received by the Fund for assets as of December 31, 2020.
Description | | Gross Amounts of
Recognized Assets | | Gross Amounts
Offset in the
Statement of
Assets and
Liabilities | | Net Amounts of Assets Presented in the
Statement of Assets and Liabilities | |
Securities Lending | | $ | 169,366 | | | $ | — | | | $ | 169,366 | | |
Total | | $ | 169,366 | | | $ | — | | | $ | 169,366 | | |
Gross Amounts Not Offset in the Statement of Assets and Liabilities
Counterparty | | Net Amounts of
Assets Presented in
the Statement of
Assets and Liabilities | | Liabilities
Available
for Offset | | Cash
Collateral
Received(a) | | Net Amount(b) | |
SSB | | $ | 169,366 | | | $ | — | | | $ | (169,366 | ) | | $ | — | | |
Total | | $ | 169,366 | | | $ | — | | | $ | (169,366 | ) | | $ | — | | |
(a) Collateral received is limited to an amount not to exceed 100% of the net amount of assets in the tables presented above.
(b) Net Amount represents amounts subject to loss at December 31, 2020, in the event of a counterparty failure.
12 Indemnifications: Like many other companies, the Trust's organizational documents provide that its officers ("Officers") and trustees ("Trustees") are indemnified against certain liabilities arising out of the performance of their duties to the Trust. In addition, both in some of its principal service contracts and in the normal course of its business, the Trust enters into contracts that provide indemnifications to other parties for certain types of losses or liabilities. The Trust's maximum exposure under these arrangements is unknown as this could involve future claims against the Trust.
13 Other: All net investment income and realized and unrealized capital gains and losses of the Fund are allocated, on the basis of relative net assets, pro rata among its respective classes.
14 Other matters—Coronavirus: The outbreak of the novel coronavirus in many countries, which is a rapidly evolving situation, has, among other things, disrupted global travel and supply chains, and has adversely impacted global commercial activity, the transportation industry and commodity prices in the energy sector. The impact of this virus has negatively affected and may continue to affect the economies of many nations, individual companies and the global securities and commodities markets, including liquidity and volatility, in ways that cannot necessarily be foreseen at the present time. The rapid development and fluidity of this situation precludes any prediction as to its ultimate impact, which may have a continued adverse effect on economic and market conditions and trigger a period of global economic slowdown. Such conditions (which may be across industries, sectors or geographies) have impacted and may continue to impact the issuers of the securities held by the Fund.
Note B—Investment Management Fees, Administration Fees, Distribution Arrangements, and Other Transactions with Affiliates:
The Fund retains NBIA as its investment manager under a Management Agreement. For such investment management services, the Fund pays NBIA an investment management fee at the annual rate of 0.55% of the first $250 million of the Fund's average daily net assets, 0.525% of the next $250 million, 0.50% of the next $250 million, 0.475% of the next $250 million, 0.45% of the next $500 million, 0.425% of the next $2.5 billion, and 0.40% of average daily net assets in excess of $4 billion. Accordingly, for the year ended December 31, 2020, the
17
investment management fee pursuant to the Management Agreement was equivalent to an annual effective rate of 0.54% of the Fund's average daily net assets.
The Fund retains NBIA as its administrator under an Administration Agreement. Each class pays NBIA an administration fee at the annual rate of 0.30% of its average daily net assets under this agreement. Additionally, NBIA retains State Street as its sub-administrator under a Sub-Administration Agreement. NBIA pays State Street a fee for all services received under the Sub-Administration Agreement.
NBIA has contractually agreed to waive fees and/or reimburse the Fund's Class I and Class S shares so that the total annual operating expenses of those classes do not exceed the expense limitations as detailed in the following table. These undertakings exclude interest, taxes, transaction costs, brokerage commissions, acquired fund fees and expenses, extraordinary expenses, and dividend and interest expenses relating to short sales, if any (commitment fees relating to borrowings are treated as interest for purposes of this exclusion) ("annual operating expenses"); consequently, net expenses may exceed the contractual expense limitations. The Fund has agreed that each of its classes will repay NBIA for fees and expenses waived or reimbursed for that class provided that repayment does not cause that class's annual operating expenses to exceed its contractual expense limitation in place at the time the fees and expenses were waived or reimbursed, or the expense limitation in place at the time the Fund repays NBIA, whichever is lower. Any such repayment must be made within three years after the year in which NBIA incurred the expense.
During the year ended December 31, 2020, there was no repayment to NBIA under these agreements.
At December 31, 2020, the Fund's contingent liabilities to NBIA under the agreements were as follows:
| | | | | | | Expenses Reimbursed in
Year Ended December 31, | |
| | | | | | | 2018 | | 2019 | | 2020 | |
| | | | | | | Subject to Repayment until December 31, | |
Class | | Contractual
Expense
Limitation(a) | | Expiration | | 2021 | | 2022 | | 2023 | |
Class I | | | 1.00 | % | | 12/31/23 | | $ | — | | | $ | — | | | $ | — | | |
Class S | | | 1.10 | % | | 12/31/23 | | | 253,455 | | | | 240,462 | | | | 214,503 | | |
(a) Expense limitation per annum of the Fund's average daily net assets.
Neuberger Berman BD LLC (the "Distributor") is the Fund's "principal underwriter" within the meaning of the 1940 Act. It acts as agent in arranging for the sale of the Fund's Class I shares without sales commission or other compensation and bears all advertising and promotion expenses incurred in the sale of those shares. The Board adopted a non-fee distribution plan for the Fund's Class I shares.
The Board has adopted a distribution and shareholder services plan (the "Plan") for Class S shares pursuant to Rule 12b-1 under the 1940 Act. The Plan provides that, as compensation for administrative and other services related to the sale and distribution of Class S shares, and ongoing services provided to investors in the class, the Distributor receives from Class S a fee at the annual rate of 0.25% of Class S's average daily net assets. The Distributor may pay a portion of the proceeds from the 12b-1 fee to institutions that provide such services, including insurance companies or their affiliates and qualified plan administrators ("intermediaries") for services they provide respecting the Fund to current and prospective variable contract owners and qualified plan participants that invest in the Fund through the intermediaries. Those institutions may use the payments for, among other purposes, compensating employees engaged in sales and/or shareholder servicing. The amount of fees paid by the class during any year may be more or less than the cost of distribution and other services provided to the class. FINRA rules limit the amount of annual distribution fees that may be paid by a mutual fund and impose a ceiling on the cumulative distribution fees paid. The Plan complies with those rules.
18
Note C—Securities Transactions:
During the year ended December 31, 2020, there were purchase and sale transactions of long-term securities of $265,085,511 and $338,676,434 respectively.
During the year ended December 31, 2020, no brokerage commissions on securities transactions were paid to affiliated brokers.
Note D—Fund Share Transactions:
Share activity for the years ended December 31, 2020, and December 31, 2019, was as follows:
| | | For the Year Ended December 31, 2020 | | For the Year Ended December 31, 2019 | |
| | Shares Sold | | Shares Issued on
Reinvestment of
Dividends and
Distributions | | Shares
Redeemed | | Total | | Shares Sold | | Shares Issued on
Reinvestment of
Dividends and
Distributions | | Shares
Redeemed | | Total | |
Class I | | | 501,565 | | | | 160,437 | | | | (1,003,283 | ) | | | (341,281 | ) | | | 537,511 | | | | 271,372 | | | | (831,165 | ) | | | (22,282 | ) | |
Class S | | | 361,450 | | | | 645,602 | | | | (2,312,974 | ) | | | (1,305,922 | ) | | | 690,664 | | | | 1,063,406 | | | | (1,223,003 | ) | | | 531,067 | | |
Note E—Line of Credit:
At December 31, 2020, the Fund was a participant in a syndicated committed, unsecured $700,000,000 line of credit (the "Credit Facility"), to be used only for temporary or emergency purposes. Series of other investment companies managed by NBIA also participate in this line of credit on substantially the same terms. Interest is charged on borrowings under this Credit Facility at the highest of (a) a federal funds effective rate plus 1.00% per annum, (b) a Eurodollar rate for a one-month period plus 1.00% per annum, and (c) an overnight bank funding rate plus 1.00% per annum. The Credit Facility has an annual commitment fee of 0.15% per annum of the available line of credit, which is paid quarterly. The Fund has agreed to pay its pro rata share of the annual commitment fee, based on the ratio of its individual net assets to the net assets of all participants at the time the fee is due, and interest charged on any borrowing made by the Fund and other costs incurred by the Fund. Because several mutual funds participate in the Credit Facility, there is no assurance that the Fund will have access to all or any part of the $700,000,000 at any particular time. There were no loans outstanding under the Credit Facility at December 31, 2020. During the year ended December 31, 2020, the Fund did not utilize the Credit Facility.
˚
19
Mid Cap Growth Portfolio
The following tables include selected data for a share outstanding throughout each year and other performance information derived from the Financial Statements. Amounts that do not round to $0.01 or $(0.01) per share are presented as $0.00 or $(0.00), respectively. Ratios that do not round to 0.01% or (0.01)% are presented as 0.00% or (0.00)%, respectively. A "—" indicates that the line item was not applicable in the corresponding period.
Class I | |
| | | Year Ended December 31, | |
| | | 2020 | | 2019 | | 2018 | | 2017 | | 2016 | |
Net Asset Value, Beginning of Year | | $ | 29.76 | | | $ | 24.09 | | | $ | 27.79 | | | $ | 22.61 | | | $ | 22.73 | | |
Income From Investment Operations: | |
| Net Investment Income/(Loss)@ | | | (0.17 | ) | | | (0.09 | ) | | | (0.07 | ) | | | 0.01 | | | | (0.08 | ) | |
Net Gains or Losses on Securities
(both realized and unrealized) | | | 11.89 | | | | 7.86 | | | | (1.48 | ) | | | 5.68 | | | | 1.04 | | |
Total From Investment Operations | | | 11.72 | | | | 7.77 | | | | (1.55 | ) | | | 5.69 | | | | 0.96 | | |
Less Distributions From: | |
Net Realized Capital Gains | | | (1.68 | ) | | | (2.10 | ) | | | (2.15 | ) | | | (0.51 | ) | | | (1.08 | ) | |
Net Asset Value, End of Year | | $ | 39.80 | | | $ | 29.76 | | | $ | 24.09 | | | $ | 27.79 | | | $ | 22.61 | | |
| Total Return† | | | 39.98 | % | | | 32.75 | %^ | | | (6.40 | )%^ | | | 25.29 | %^‡ | | | 4.40 | %^ | |
Ratios/Supplemental Data | |
Net Assets, End of Year (in millions) | | $ | 139.4 | | | $ | 114.4 | | | $ | 93.2 | | | $ | 106.4 | | | $ | 85.8 | | |
| Ratio of Gross Expenses to Average Net Assets# | | | 0.91 | % | | | 0.92 | % | | | 0.93 | % | | | 0.94 | % | | | 0.99 | % | |
Ratio of Net Expenses to Average Net Assets | | | 0.91 | % | | | 0.92 | % | | | 0.93 | % | | | 0.65 | %ß | | | 0.99 | % | |
Ratio of Net Investment Income/(Loss) to Average
Net Assets | | | (0.54 | )% | | | (0.32 | )% | | | (0.25 | )% | | | 0.04 | %ß | | | (0.35 | )% | |
Portfolio Turnover Rate | | | 54 | % | | | 47 | % | | | 50 | % | | | 57 | % | | | 54 | % | |
See Notes to Financial Highlights
20
Financial Highlights (cont'd)
Class S | |
| | | Year Ended December 31, | |
| | | 2020 | | 2019 | | 2018 | | 2017 | | 2016 | |
Net Asset Value, Beginning of Year | | $ | 27.14 | | | $ | 22.16 | | | $ | 25.77 | | | $ | 21.12 | | | $ | 21.35 | | |
Income From Investment Operations: | |
| Net Investment Income/(Loss)@ | | | (0.22 | ) | | | (0.13 | ) | | | (0.11 | ) | | | (0.12 | ) | | | (0.12 | ) | |
Net Gains or Losses on Securities
(both realized and unrealized) | | | 10.82 | | | | 7.21 | | | | (1.35 | ) | | | 5.28 | | | | 0.97 | | |
Total From Investment Operations | | | 10.60 | | | | 7.08 | | | | (1.46 | ) | | | 5.16 | | | | 0.85 | | |
Less Distributions From: | |
Net Realized Capital Gains | | | (1.68 | ) | | | (2.10 | ) | | | (2.15 | ) | | | (0.51 | ) | | | (1.08 | ) | |
Net Asset Value, End of Year | | $ | 36.06 | | | $ | 27.14 | | | $ | 22.16 | | | $ | 25.77 | | | $ | 21.12 | | |
| Total Return† | | | 39.71 | % | | | 32.48 | %^ | | | (6.56 | )%^ | | | 24.56 | %^‡ | | | 4.16 | %^ | |
Ratios/Supplemental Data | |
Net Assets, End of Year (in millions) | | $ | 459.2 | | | $ | 381.1 | | | $ | 299.4 | | | $ | 317.7 | | | $ | 244.4 | | |
| Ratio of Gross Expenses to Average Net Assets# | | | 1.16 | % | | | 1.17 | % | | | 1.18 | % | | | 1.19 | % | | | 1.24 | % | |
Ratio of Net Expenses to Average Net Assets | | | 1.10 | % | | | 1.10 | % | | | 1.10 | % | | | 1.18 | %ß | | | 1.24 | % | |
Ratio of Net Investment Income/(Loss) to Average
Net Assets | | | (0.74 | )% | | | (0.50 | )% | | | (0.42 | )% | | | (0.52 | )%ß | | | (0.59 | )% | |
Portfolio Turnover Rate | | | 54 | % | | | 47 | % | | | 50 | % | | | 57 | % | | | 54 | % | |
See Notes to Financial Highlights
21
Notes to Financial Highlights Mid Cap Growth Portfolio
@ Calculated based on the average number of shares outstanding during each fiscal period.
† Total return based on per share NAV reflects the effects of changes in NAV on the performance of the Fund during each fiscal period. Returns assume income dividends and other distributions, if any, were reinvested. Results represent past performance and do not indicate future results. Current returns may be lower or higher than the performance data quoted. Investment returns and principal will fluctuate and shares, when redeemed, may be worth more or less than original cost. Total return would have been lower if Management had not reimbursed and/or waived certain expenses. The total return information shown does not reflect charges and other expenses that apply to the separate accounts or the related insurance policies or other qualified pension or retirement plans, and the inclusion of these charges and other expenses would reduce the total return for all fiscal periods shown.
^ The class action proceeds received in 2019, 2018 and, 2017 had no impact on the Fund's total return for the years ended December 31, 2019, 2018 and 2017, respectively. Had the Fund not received class action proceeds in 2016, total return based on per share NAV for the year ended December 31, 2016 would have been:
| | | Year Ended
December 31,
2016 | |
Class I | | | 4.35 | % | |
Class S | | | 4.11 | % | |
‡ In May 2016, the Fund's custodian, State Street, announced that it had identified inconsistencies in the way in which the Fund was invoiced for categories of expenses, particularly those deemed "out-of-pocket" costs, from 1998 through November 2015, and refunded to the Fund certain expenses, plus interest, determined to be payable to the Fund for the period in question. These amounts were refunded to the Fund by State Street during the year ended December 31, 2017. These amounts had` no impact on Class S's total return for the year ended December 31, 2017. Had the Fund not received the custodian expenses refund, the total return based on per share NAV for the year ended December 31, 2017 for Class I would have been 24.93%.
# Represents the annualized ratios of net expenses to average daily net assets if Management had not reimbursed certain expenses and/or waived a portion of the investment management fee and/or if the Fund had not received refunds, plus interest, from State Street noted in ‡ above for custodian out-of-pocket expenses previously paid during the year ended December 31, 2017. Management did not reimburse or waive fees during the fiscal periods shown for Class I. Management did not reimburse or waive fees during fiscal period ended December 31, 2016 for Class S.
ß The custodian expenses refund noted in ‡ above is non-recurring and is included in these ratios. Had the Fund not received the refund, the annualized ratio of net expenses to average net assets and the annualized ratio of net investment income/(loss) to average net assets would have been:
| | | Ratio of Net
Expenses to
Average
Net Assets
Year Ended
December 31, 2017 | | Ratio of Net
Investment
Income/(Loss)
to Average
Net Assets
Year Ended
December 31, 2017 | |
Class I | | | 0.94 | % | | | (0.29 | )% | |
Class S | | | 1.18 | % | | | (0.53 | )% | |
22
Report of Independent Registered Public Accounting Firm
To the Shareholders of
Mid Cap Growth Portfolio and
Board of Trustees of the Neuberger Berman Advisers Management Trust
Opinion on the Financial Statements
We have audited the accompanying statement of assets and liabilities of Mid Cap Growth Portfolio (the "Portfolio") (one of the portfolios constituting Neuberger Berman Advisers Management Trust (the "Trust")), including the schedule of investments, as of December 31, 2020, and the related statement of operations for the year then ended, the statements of changes in net assets for each of the two years in the period then ended, the financial highlights for each of the five years in the period then ended and the related notes (collectively referred to as the "financial statements"). In our opinion, the financial statements present fairly, in all material respects, the financial position of the Portfolio (one of the portfolios constituting Neuberger Berman Advisers Management Trust) at December 31, 2020, the results of its operations for the year then ended, the changes in its net assets for each of the two years in the period then ended and its financial highlights for each of the five years in the period then ended, in conformity with U.S. generally accepted accounting principles.
Basis for Opinion
These financial statements are the responsibility of the Trust's management. Our responsibility is to express an opinion on the Portfolio's financial statements based on our audits. We are a public accounting firm registered with the Public Company Accounting Oversight Board (United States) ("PCAOB") and are required to be independent with respect to the Trust in accordance with the U.S. federal securities laws and the applicable rules and regulations of the Securities and Exchange Commission and the PCAOB.
We conducted our audits in accordance with the standards of the PCAOB. Those standards require that we plan and perform the audit to obtain reasonable assurance about whether the financial statements are free of material misstatement, whether due to error or fraud. The Trust is not required to have, nor were we engaged to perform, an audit of the Trust's internal control over financial reporting. As part of our audits, we are required to obtain an understanding of internal control over financial reporting, but not for the purpose of expressing an opinion on the effectiveness of the Trust's internal control over financial reporting. Accordingly, we express no such opinion.
Our audits included performing procedures to assess the risks of material misstatement of the financial statements, whether due to error or fraud, and performing procedures that respond to those risks. Such procedures included examining, on a test basis, evidence regarding the amounts and disclosures in the financial statements. Our procedures included confirmation of securities owned as of December 31, 2020, by correspondence with the custodian and brokers or by other appropriate auditing procedures where replies from others were not received. Our audits also included evaluating the accounting principles used and significant estimates made by management, as well as evaluating the overall presentation of the financial statements. We believe that our audits provide a reasonable basis for our opinion.
We have served as the auditor of one or more Neuberger Berman investment companies since 1954.
Boston, Massachusetts
February 12, 2021
23
The following tables set forth information concerning the Trustees and Officers of the Fund. All persons named as Trustees and Officers also serve in similar capacities for other funds administered or managed by Neuberger Berman Investment Advisers LLC ("NBIA"). The Fund's Statement of Additional Information includes additional information about the Trustees as of the time of the Fund's most recent public offering and is available upon request, without charge, by calling (800) 877-9700.
Information about the Board of Trustees
Name, (Year of Birth),
and Address(1) | | Position(s)
and Length of
Time Served(2) | | Principal Occupation(s)(3) | | Number of
Funds in Fund
Complex
Overseen by
Fund Trustee | | Other Directorships
Held Outside Fund
Complex by Fund
Trustee(3) | |
Independent Fund Trustees | |
Michael J. Cosgrove (1949) | | Trustee since 2015 | | President, Carragh Consulting USA, since 2014; formerly, Executive, General Electric Company, 1970 to 2014, including President, Mutual Funds and Global Investment Programs, GE Asset Management, 2011 to 2014, President and Chief Executive Officer, Mutual Funds and Intermediary Business, GE Asset Management, 2007 to 2011, President, Institutional Sales and Marketing, GE Asset Management, 1998 to 2007, and Chief Financial Officer, GE Asset Management, and Deputy Treasurer, GE Company, 1988 to 1993. | |
| 46 |
| | Director, America Press, Inc. (not-for-profit Jesuit publisher), since 2015; formerly, Director, Fordham University, 2001 to 2018; formerly, Director, The Gabelli Go Anywhere Trust, June 2015 to June 2016; formerly, Director, Skin Cancer Foundation (not-for-profit), 2006 to 2015; formerly, Director, GE Investments Funds, Inc., 1997 to 2014; formerly, Trustee, GE Institutional Funds, 1997 to 2014; formerly, Director, GE Asset Management, 1988 to 2014; formerly, Director, Elfun Trusts, 1988 to 2014; formerly, Trustee, GE Pension & Benefit Plans, 1988 to 2014; formerly, Member of Board of Governors, Investment Company Institute. | |
24
Name, (Year of Birth),
and Address(1) | | Position(s)
and Length of
Time Served(2) | | Principal Occupation(s)(3) | | Number of
Funds in Fund
Complex
Overseen by
Fund Trustee | | Other Directorships
Held Outside Fund
Complex by Fund
Trustee(3) | |
Marc Gary (1952) | | Trustee since 2015 | | Executive Vice Chancellor and Chief Operating Officer, Jewish Theological Seminary, since 2012; formerly, Executive Vice President and General Counsel, Fidelity Investments, 2007 to 2012; formerly, Executive Vice President and General Counsel, BellSouth Corporation, 2004 to 2007; formerly, Vice President and Associate General Counsel, BellSouth Corporation, 2000 to 2004; formerly, Associate, Partner, and National Litigation Practice Co-Chair, Mayer, Brown LLP, 1981 to 2000; formerly, Associate Independent Counsel, Office of Independent Counsel, 1990 to 1992. | |
| 46 |
| | Director, UJA Federation of Greater New York, since 2019; Trustee, Jewish Theological Seminary, since 2015; Director, Legility, Inc. (privately held for-profit company), since 2012; Director, Lawyers Committee for Civil Rights Under Law (not-for-profit), since 2005; formerly, Director, Equal Justice Works (not-for-profit), 2005 to 2014; formerly, Director, Corporate Counsel Institute, Georgetown University Law Center, 2007 to 2012; formerly, Director, Greater Boston Legal Services (not-for-profit), 2007 to 2012. | |
25
Name, (Year of Birth),
and Address(1) | | Position(s)
and Length of
Time Served(2) | | Principal Occupation(s)(3) | | Number of
Funds in Fund
Complex
Overseen by
Fund Trustee | | Other Directorships
Held Outside Fund
Complex by Fund
Trustee(3) | |
Martha C. Goss (1949) | | Trustee since 2007 | | President, Woodhill Enterprises Inc./Chase Hollow Associates LLC (personal investment vehicle), since 2006; formerly, Consultant, Resources Global Professionals (temporary staffing), 2002 to 2006; formerly, Chief Financial Officer, Booz-Allen & Hamilton, Inc., 1995 to 1999; formerly, Enterprise Risk Officer, Prudential Insurance, 1994 to1995; formerly, President, Prudential Asset Management Company, 1992 to 1994; formerly, President, Prudential Power Funding (investments in electric and gas utilities and alternative energy projects), 1989 to 1992; formerly, Treasurer, Prudential Insurance Company, 1983 to 1989. | |
| 46 |
| | Director, American Water (water utility), since 2003; Director, Allianz Life of New York (insurance), since 2005; Director, Berger Group Holdings, Inc. (engineering consulting firm), since 2013; Director, Financial Women's Association of New York (not-for-profit association), since 2003; Trustee Emerita, Brown University, since 1998; Director, Museum of American Finance (not-for-profit), since 2013; formerly, Non-Executive Chair and Director, Channel Reinsurance (financial guaranty reinsurance), 2006 to 2010; formerly, Director, Ocwen Financial Corporation (mortgage servicing), 2005 to 2010; formerly, Director, Claire's Stores, Inc. (retailer), 2005 to 2007; formerly, Director, Parsons Brinckerhoff Inc. (engineering consulting firm), 2007 to 2010; formerly, Director, Bank Leumi (commercial bank), 2005 to 2007; formerly, Advisory Board Member, Attensity (software developer), 2005 to 2007. | |
26
Name, (Year of Birth),
and Address(1) | | Position(s)
and Length of
Time Served(2) | | Principal Occupation(s)(3) | | Number of
Funds in Fund
Complex
Overseen by
Fund Trustee | | Other Directorships
Held Outside Fund
Complex by Fund
Trustee(3) | |
Michael M. Knetter (1960) | | Trustee since 2007 | | President and Chief Executive Officer, University of Wisconsin Foundation, since 2010; formerly, Dean, School of Business, University of Wisconsin—Madison; formerly, Professor of International Economics and Associate Dean, Amos Tuck School of Business—Dartmouth College, 1998 to 2002. | |
| 46 |
| | Director, 1 William Street Credit Income Fund, since 2018; Board Member, American Family Insurance (a mutual company, not publicly traded), since March 2009; formerly, Trustee, Northwestern Mutual Series Fund, Inc., 2007 to 2011; formerly, Director, Wausau Paper, 2005 to 2011; formerly, Director, Great Wolf Resorts, 2004 to 2009. | |
Deborah C. McLean (1954) | | Trustee since 2015 | | Member, Circle Financial Group (private wealth management membership practice), since 2011; Managing Director, Golden Seeds LLC (an angel investing group), since 2009; Adjunct Professor, Columbia University School of International and Public Affairs, since 2008; formerly, Visiting Assistant Professor, Fairfield University, Dolan School of Business, Fall 2007; formerly, Adjunct Associate Professor of Finance, Richmond, The American International University in London, 1999 to 2007. | |
| 46 |
| | Board member, Norwalk Community College Foundation, since 2014; Dean's Advisory Council, Radcliffe Institute for Advanced Study, since 2014; formerly, Director and Treasurer, At Home in Darien (not-for-profit), 2012 to 2014; formerly, Director, National Executive Service Corps (not-for-profit), 2012 to 2013; formerly, Trustee, Richmond, The American International University in London, 1999 to 2013. | |
27
Name, (Year of Birth),
and Address(1) | | Position(s)
and Length of
Time Served(2) | | Principal Occupation(s)(3) | | Number of
Funds in Fund
Complex
Overseen by
Fund Trustee | | Other Directorships
Held Outside Fund
Complex by Fund
Trustee(3) | |
George W. Morriss (1947) | | Trustee since 2007 | | Adjunct Professor, Columbia University School of International and Public Affairs, since 2012; formerly, Executive Vice President and Chief Financial Officer, People's United Bank, Connecticut (a financial services company), 1991 to 2001. | |
| 46 |
| | Director, 1 William Street Credit Income Fund, since 2018; Director and Chair, Thrivent Church Loan and Income Fund, since 2018; formerly, Trustee, Steben Alternative Investment Funds, Steben Select Multi-Strategy Fund, and Steben Select Multi-Strategy Master Fund, 2013 to 2017; formerly, Treasurer, National Association of Corporate Directors, Connecticut Chapter, 2011 to 2015; formerly, Manager, Larch Lane Multi-Strategy Fund complex (which consisted of three funds), 2006 to 2011; formerly, Member, NASDAQ Issuers' Affairs Committee, 1995 to 2003. | |
Tom D. Seip (1950) | | Trustee since 2000; Chairman of the Board since 2008; formerly Lead Independent Trustee from 2006 to 2008 | | Formerly, Managing Member, Ridgefield Farm LLC (a private investment vehicle), 2004 to 2016; formerly, President and CEO, Westaff, Inc. (temporary staffing), May 2001 to January 2002; formerly, Senior Executive, The Charles Schwab Corporation, 1983 to 1998, including Chief Executive Officer, Charles Schwab Investment Management, Inc.; Trustee, Schwab Family of Funds and Schwab Investments, 1997 to 1998; and Executive Vice President-Retail Brokerage, Charles Schwab & Co., Inc., 1994 to 1997. | |
| 46 |
| | Formerly, Director, H&R Block, Inc. (tax services company), 2001 to 2018; formerly, Director, Talbot Hospice Inc., 2013 to 2016; formerly, Chairman, Governance and Nominating Committee, H&R Block, Inc., 2011 to 2015; formerly, Chairman, Compensation Committee, H&R Block, Inc., 2006 to 2010; formerly, Director, Forward Management, Inc. (asset management company), 1999 to 2006. | |
28
Name, (Year of Birth),
and Address(1) | | Position(s)
and Length of
Time Served(2) | | Principal Occupation(s)(3) | | Number of
Funds in Fund
Complex
Overseen by
Fund Trustee | | Other Directorships
Held Outside Fund
Complex by Fund
Trustee(3) | |
James G. Stavridis (1955) | | Trustee since 2015 | | Operating Executive, The Carlyle Group, since 2018; Commentator, NBC News, since 2015; formerly, Dean, Fletcher School of Law and Diplomacy, Tufts University, 2013 to 2018; formerly, Admiral, United States Navy, 1976 to 2013, including Supreme Allied Commander, NATO and Commander, European Command, 2009 to 2013, and Commander, United States Southern Command, 2006 to 2009. | |
| 46 |
| | Director, American Water (water utility), since 2018; Director, NFP Corp. (insurance broker and consultant), since 2017; Director, U.S. Naval Institute, since 2014; Director, Onassis Foundation, since 2014; Director, BMC Software Federal, LLC, since 2014; Director, Vertical Knowledge, LLC, since 2013; formerly, Director, Navy Federal Credit Union, 2000-2002. | |
29
Name, (Year of Birth),
and Address(1) | | Position(s)
and Length of
Time Served(2) | | Principal Occupation(s)(3) | | Number of
Funds in Fund
Complex
Overseen by
Fund Trustee | | Other Directorships
Held Outside Fund
Complex by Fund
Trustee(3) | |
Candace L. Straight (1947) | | Trustee since 1999 | | Private investor and consultant specializing in the insurance industry; formerly, Advisory Director, Securitas Capital LLC (a global private equity investment firm dedicated to making investments in the insurance sector), 1998 to 2003. | |
| 46 |
| | Director, ERA Coalition (not-for-profit), 2019 to 2020; Director, Re belle Media (a privately held TV and film production company), since 2018; formerly, Public Member, Board of Governors and Board of Trustees, Rutgers University, 2011 to 2016; formerly, Director, Montpelier Re Holdings Ltd. (reinsurance company), 2006 to 2015; formerly, Director, National Atlantic Holdings Corporation (property and casualty insurance company), 2004 to 2008; formerly, Director, The Proformance Insurance Company (property and casualty insurance company), 2004 to 2008; formerly, Director, Providence Washington Insurance Company (property and casualty insurance company), 1998 to 2006; formerly, Director, Summit Global Partners (insurance brokerage firm), 2000 to 2005. | |
Peter P. Trapp (1944) | | Trustee since 1984 | | Retired; formerly, Regional Manager for Mid-Southern Region, Ford Motor Credit Company, September 1997 to 2007; formerly, President, Ford Life Insurance Company, April 1995 to August 1997. | |
| 46 |
| | None. | |
30
Name, (Year of Birth),
and Address(1) | | Position(s)
and Length of
Time Served(2) | | Principal Occupation(s)(3) | | Number of
Funds in Fund
Complex
Overseen by
Fund Trustee | | Other Directorships
Held Outside Fund
Complex by Fund
Trustee(3) | |
Fund Trustees who are "Interested Persons" | |
Joseph V. Amato* (1962) | | Chief Executive Officer and President since 2018 and Trustee since 2009 | | President and Director, Neuberger Berman Group LLC, since 2009; President and Chief Executive Officer, Neuberger Berman BD LLC and Neuberger Berman Holdings LLC (including its predecessor, Neuberger Berman Inc.), since 2007; Chief Investment Officer (Equities) and President (Equities), NBIA (formerly, Neuberger Berman Fixed Income LLC and including predecessor entities), since 2007, and Board Member of NBIA since 2006; formerly, Global Head of Asset Management of Lehman Brothers Holdings Inc.'s ("LBHI") Investment Management Division, 2006 to 2009; formerly, member of LBHI's Investment Management Division's Executive Management Committee, 2006 to 2009; formerly, Managing Director, Lehman Brothers Inc. ("LBI"), 2006 to 2008; formerly, Chief Recruiting and Development Officer, LBI, 2005 to 2006; formerly, Global Head of LBI's Equity Sales and a Member of its Equities Division Executive Committee, 2003 to 2005; President and Chief Executive Officer, ten registered investment companies for which NBIA acts as investment manager and/or administrator. | |
| 46 |
| | Member of Board of Advisors, McDonough School of Business, Georgetown University, since 2001; Member of New York City Board of Advisors, Teach for America, since 2005; Trustee, Montclair Kimberley Academy (private school), since 2007; Member of Board of Regents, Georgetown University, since 2013. | |
(1) The business address of each listed person is 1290 Avenue of the Americas, New York, NY 10104.
31
(2) Pursuant to the Trust's Amended and Restated Trust Instrument, subject to any limitations on the term of service imposed by the By-Laws or any retirement policy adopted by the Fund Trustees, each Fund Trustee shall hold office for life or until his or her successor is elected or the Trust terminates; except that (a) any Fund Trustee may resign by delivering a written resignation; (b) any Fund Trustee may be removed with or without cause at any time by a written instrument signed by at least two-thirds of the other Fund Trustees; (c) any Fund Trustee who requests to be retired, or who has become unable to serve, may be retired by a written instrument signed by a majority of the other Fund Trustees; and (d) any Fund Trustee may be removed at any shareholder meeting by a vote of at least two-thirds of the outstanding shares.
(3) Except as otherwise indicated, each individual has held the positions shown during at least the last five years.
* Indicates a Fund Trustee who is an "interested person" within the meaning of the 1940 Act. Mr. Amato is an interested person of the Trust by virtue of the fact that he is an officer of NBIA and/or its affiliates.
32
Information about the Officers of the Trust
Name, (Year of Birth),
and Address(1) | | Position(s)
and Length of
Time Served(2) | | Principal Occupation(s)(3) | |
Claudia A. Brandon (1956) | | Executive Vice President since 2008 and Secretary since 1985 | | Senior Vice President, Neuberger Berman, since 2007 and Employee since 1999; Senior Vice President, NBIA, since 2008 and Assistant Secretary since 2004; formerly, Vice President, Neuberger Berman, 2002 to 2006; formerly, Vice President—Mutual Fund Board Relations, NBIA, 2000 to 2008; formerly, Vice President, NBIA, 1986 to 1999 and Employee, 1984 to 1999; Executive Vice President and Secretary, twenty-nine registered investment companies for which NBIA acts as investment manager and/or administrator. | |
Agnes Diaz (1971) | | Vice President since 2013 | | Senior Vice President, Neuberger Berman, since 2012; Senior Vice President, NBIA, since 2012 and Employee since 1996; formerly, Vice President, Neuberger Berman, 2007 to 2012; Vice President, ten registered investment companies for which NBIA acts as investment manager and/or administrator. | |
Anthony DiBernardo (1979) | | Assistant Treasurer since 2011 | | Senior Vice President, Neuberger Berman, since 2014; Senior Vice President, NBIA, since 2014, and Employee since 2003; formerly, Vice President, Neuberger Berman, 2009 to 2014; Assistant Treasurer, ten registered investment companies for which NBIA acts as investment manager and/or administrator. | |
Savonne L. Ferguson (1973) | | Chief Compliance Officer since 2018 | | Senior Vice President, Chief Compliance Officer (Mutual Funds) and Associate General Counsel, NBIA, since November 2018; formerly, Vice President T. Rowe Price Group, Inc. (2018), Vice President and Senior Legal Counsel, T. Rowe Price Associates, Inc. (2014-2018), Vice President and Director of Regulatory Fund Administration, PNC Capital Advisors, LLC (2009-2014), Secretary, PNC Funds and PNC Advantage Funds (2010-2014); Chief Compliance Officer, twenty-nine registered investment companies for which NBIA acts as investment manager and/or administrator. | |
Corey A. Issing (1978) | | Chief Legal Officer since 2016 (only for purposes of sections 307 and 406 of the Sarbanes-Oxley Act of 2002) | | General Counsel and Head of Compliance—Mutual Funds since 2016 and Managing Director, NBIA, since 2017; formerly, Associate General Counsel (2015 to 2016), Counsel (2007 to 2015), Senior Vice President (2013-2016), Vice President (2009-2013); Chief Legal Officer (only for purposes of sections 307 and 406 of the Sarbanes-Oxley Act of 2002), twenty-nine registered investment companies for which NBIA acts as investment manager and/or administrator. | |
Sheila R. James (1965) | | Assistant Secretary since 2002 | | Vice President, Neuberger Berman, since 2008 and Employee since 1999; Vice President, NBIA, since 2008; formerly, Assistant Vice President, Neuberger Berman, 2007; Employee, NBIA, 1991 to 1999; Assistant Secretary, twenty-nine registered investment companies for which NBIA acts as investment manager and/or administrator. | |
33
Name, (Year of Birth),
and Address(1) | | Position(s)
and Length of
Time Served(2) | | Principal Occupation(s)(3) | |
Brian Kerrane (1969) | | Chief Operating Officer since 2015 and Vice President since 2008 | | Managing Director, Neuberger Berman, since 2014; Chief Operating Officer—Mutual Funds and Managing Director, NBIA, since 2015; formerly, Senior Vice President, Neuberger Berman, 2006 to 2014; Vice President, NBIA, 2008 to 2015 and Employee since 1991; Chief Operating Officer, ten registered investment companies for which NBIA acts as investment manager and/or administrator; Vice President, twenty-nine registered investment companies for which NBIA acts as investment manager and/or administrator. | |
Anthony Maltese (1959) | | Vice President since 2015 | | Senior Vice President, Neuberger Berman, since 2014 and Employee since 2000; Senior Vice President, NBIA, since 2014; Vice President, ten registered investment companies for which NBIA acts as investment manager and/or administrator. | |
Josephine Marone (1963) | | Assistant Secretary since 2017 | | Senior Paralegal, Neuberger Berman, since 2007 and Employee since 2007; Assistant Secretary, twenty-nine registered investment companies for which NBIA acts as investment manager and/or administrator. | |
Owen F. McEntee, Jr. (1961) | | Vice President since 2008 | | Vice President, Neuberger Berman, since 2006; Vice President, NBIA, since 2006 and Employee since 1992; Vice President, ten registered investment companies for which NBIA acts as investment manager and/or administrator. | |
John M. McGovern (1970) | | Treasurer and Principal Financial and Accounting Officer since 2005 | | Senior Vice President, Neuberger Berman, since 2007; Senior Vice President, NBIA, since 2007 and Employee since 1993; formerly, Vice President, Neuberger Berman, 2004 to 2006; formerly, Assistant Treasurer, 2002 to 2005; Treasurer and Principal Financial and Accounting Officer, ten registered investment companies for which NBIA acts as investment manager and/or administrator. | |
Frank Rosato (1971) | | Assistant Treasurer since 2005 | | Vice President, Neuberger Berman, since 2006; Vice President, NBIA, since 2006 and Employee since 1995; Assistant Treasurer, ten registered investment companies for which NBIA acts as investment manager and/or administrator. | |
Niketh Velamoor (1979) | | Anti-Money Laundering Compliance Officer since 2018 | | Senior Vice President and Associate General Counsel, Neuberger Berman, since July 2018; Assistant United States Attorney, Southern District of New York, 2009 to 2018; Anti-Money Laundering Compliance Officer, four registered investment companies for which NBIA acts as investment manager and/or administrator. | |
(1) The business address of each listed person is 1290 Avenue of the Americas, New York, NY 10104.
(2) Pursuant to the By-Laws of the Trust, each officer elected by the Fund Trustees shall hold office until his or her successor shall have been elected and qualified or until his or her earlier death, inability to serve, or resignation. Officers serve at the pleasure of the Fund Trustees and may be removed at any time with or without cause.
(3) Except as otherwise indicated, each individual has held the positions shown during at least the last five years.
34
Proxy Voting Policies and Procedures
A description of the policies and procedures that the Trust uses to determine how to vote proxies relating to portfolio securities is available, without charge, by calling 800-877-9700 (toll-free) and on the SEC's website, at www.sec.gov. Information regarding how the Trust voted proxies relating to portfolio securities during the most recent 12-month period ended June 30 is also available upon request, without charge, by calling 800-877-9700 (toll-free), on the SEC's website at www.sec.gov, and on Neuberger Berman's website at www.nb.com.
Quarterly Portfolio Schedule
The Trust files a complete schedule of portfolio holdings with the SEC for the first and third quarters of each fiscal year as an exhibit to its report on Form N-PORT. The Trust's Form N-PORT is available on the SEC's website at www.sec.gov. The portfolio holdings information on Form N-PORT is available upon request, without charge, by calling 800-877-9700 (toll free).
Board Consideration of the Management Agreement
On an annual basis, the Board of Trustees (the "Board") of Neuberger Berman Advisers Management Trust (the "Trust"), including the Trustees who are not "interested persons" of the Trust or of Neuberger Berman Investment Advisers LLC ("Management") (including its affiliates) ("Independent Fund Trustees"), considers whether to continue the management agreement with Management (the "Agreement") with respect to Mid Cap Growth Portfolio (the "Fund"). Throughout the process, the Independent Fund Trustees are advised by counsel that is experienced in Investment Company Act of 1940 matters and that is independent of Management ("Independent Counsel"). At a meeting held on October 1, 2020, the Board, including the Independent Fund Trustees, approved the continuation of the Agreement for the Fund.
In evaluating the Agreement, the Board, including the Independent Fund Trustees, reviewed extensive materials provided by Management in response to questions submitted by the Independent Fund Trustees and Independent Counsel, and met with senior representatives of Management regarding its personnel, operations, and profitability as they relate to the Fund. The annual contract review extends over at least two regular meetings of the Board to ensure that Management has time to respond to any questions the Independent Fund Trustees may have on their initial review of the materials and that the Independent Fund Trustees have time to consider those responses.
In connection with its deliberations, the Board also considered the broad range of information relevant to the annual contract review that is provided to the Board (including its various standing committees) at meetings throughout the year, including reports on investment performance, portfolio risk, and other portfolio information for the Fund, as well as periodic reports on, among other matters, pricing and valuation; quality and cost of portfolio trade execution; compliance; and shareholder and other services provided by Management and its affiliates. The Contract Review Committee, which is comprised of Independent Fund Trustees, was established by the Board to assist in its evaluation and analysis of materials for the annual contract review. The Board has also established other committees that focus throughout the year on specific areas relevant to the annual contract review, such as Fund performance or compliance matters, and that are charged with specific responsibilities regarding the annual contract review. Those committees provide reports to the Contract Review Committee and the full Board, which consider that information as part of the annual contract review process. The Board's Contract Review Committee annually considers and updates the questions it asks of Management in light of legal advice furnished to it by Independent Counsel; its own business judgment; and developments in the industry, in the markets, in mutual fund regulation and litigation, and in Management's business model.
The Independent Fund Trustees received from Independent Counsel a memorandum discussing the legal standards for their consideration of the proposed continuation of the Agreement. During the course of the year and during their deliberations regarding the annual contract review, the Contract Review Committee and the Independent Fund Trustees met with Independent Counsel separately from representatives of Management.
35
Provided below is a description of the Board's contract approval process and material factors that the Board considered at its meetings regarding renewal of the Agreement and the compensation to be paid thereunder. In connection with its approval of the continuation of the Agreement, the Board evaluated the terms of the Agreement, the overall fairness of the Agreement to the Fund, and whether the Agreement was in the best interests of the Fund and its shareholders. The Board's determination to approve the continuation of the Agreement was based on a comprehensive consideration of all information provided to the Board throughout the year and specifically in connection with the annual contract review. The Board considered the Fund's investment management agreement separately from those of other funds of the Trust.
This description is not intended to include all of the factors considered by the Board. The Board members did not identify any particular information or factor that was all-important or controlling, and each Trustee may have attributed different weights to the various factors. The Board focused on the costs and benefits of the Agreement to the Fund and, through the Fund, its shareholders.
Nature, Extent, and Quality of Services
With respect to the nature, extent, and quality of the services provided, the Board considered the investment philosophy and decision-making processes of, and the qualifications, experience, and capabilities of, and the resources available to, the portfolio management personnel of Management who perform services for the Fund. The Board noted that Management also provides certain administrative services, including fund accounting and compliance services. The Board also considered Management's policies and practices regarding brokerage, commissions, other trading costs, and allocation of portfolio transactions and reviewed the quality of the execution services that Management had provided. The Board also reviewed Management's use of brokers to execute Fund transactions that provide research services to Management. Moreover, the Board considered Management's approach to potential conflicts of interest both generally and between the Fund's investments and those of other funds or accounts managed by Management. The Board also noted that Management had increased its research capabilities with respect to environmental, social, and corporate governance matters and how those factors may relate to investment performance. The Board noted the additional responsibilities of Management in administering the liquidity risk management program.
The Board recognized the extensive range of services that Management provides to the Fund beyond the investment management services. The Board noted that Management is also responsible for monitoring compliance with the Fund's investment objectives, policies, and restrictions, as well as compliance with applicable law, including implementing rulemaking initiatives of the U.S. Securities and Exchange Commission. The Board considered that Management assumes significant ongoing entrepreneurial and business risks as the investment adviser and sponsor for the Fund, for which it is entitled to reasonable compensation. The Trustees also considered that Management's responsibilities include continual management of investment, operational, enterprise, legal, regulatory, and compliance risks as they relate to the Fund, and the Board considers on a regular basis information regarding Management's processes for monitoring and managing risk. In addition, the Board also noted that when Management launches a new fund or share class, it assumes entrepreneurial risk with respect to that fund or share class, and that some funds and share classes have been liquidated without ever having been profitable to Management.
The Board also reviewed and evaluated Management's activities under its contractual obligation to oversee the Fund's various outside service providers, including its renegotiation of certain service providers' fees and its evaluation of service providers' infrastructure, cybersecurity programs, compliance programs, and business continuity programs, among other matters. The Board also considered Management's ongoing development of its own infrastructure and information technology to support the Fund through, among other things, cybersecurity, business continuity planning, and risk management. The Board noted Management's largely seamless implementation of its business continuity plan in response to the COVID-19 pandemic. In addition, the Board noted the positive compliance history of Management, as no significant compliance problems were reported to the Board with respect to Management. The Board also considered the general structure of the portfolio manager's compensation and whether this structure provides appropriate incentives to act in the best interests of the Fund. The Board also considered the ability of Management to attract and retain qualified personnel to service the Fund.
36
As in past years, the Board also considered the manner in which Management addressed various matters that arose during the year, some of them a result of developments in the broader fund industry or the regulations governing it. In addition, the Board considered actions taken by Management in response to recent market conditions, such as the economic dislocation and rise in volatility that accompanied shutdowns related to the efforts to stem the spread of COVID-19, and considered the overall performance of Management in this context.
Fund Performance
The Board requested a report from an outside consulting firm that specializes in the analysis of fund industry data that compared the Fund's performance, along with its fees and other expenses, to a group of industry peers ("Expense Group") and a broader universe of funds pursuing generally similar strategies with the same investment classification and/or objective ("Performance Universe"). The Expense Group and Performance Universe were composed of two types of funds: proprietary funds that are operated by insurance companies or their affiliates, and non-proprietary funds, such as the Fund, operated for insurance company investors by independent investment managers. The Board considered the Fund's performance and fees in light of the limitations inherent in the methodology for constructing such comparative groups and determining which investment companies should be included in the comparative groups, noting differences as compared to certain fund industry ranking and rating systems. The Board also considered the impact and inherent limitation on the comparisons due to the small number of funds included in the Fund's Expense Group and Performance Universe.
With respect to investment performance, the Board considered information regarding the Fund's short-, intermediate- and long-term performance, net of the Fund's fees and expenses, on an absolute basis, relative to a benchmark index that does not deduct the fees or expenses of investing, and compared to the performance of the Expense Group and Performance Universe, each constructed by the consulting firm. The Board also reviewed performance in relation to certain measures of the degree of investment risk undertaken by the portfolio manager.
The Performance Universe referenced in this section was identified by the consulting firm, as discussed above. For any period of underperformance, the Board considered the magnitude and duration of that underperformance relative to the Performance Universe, and/or the benchmark (e.g., the amount by which a Fund underperformed, including, for example, whether the Fund slightly underperformed or significantly underperformed its benchmark). With respect to performance quintile rankings for the Fund compared to its Performance Universe, the first quintile represents the highest (best) performance and the fifth quintile represents the lowest performance. For investment performance comparisons, the Board looked at the Fund's Class S as a proxy for both of the Fund's classes.
The Board considered that, based on performance data for the periods ended December 31, 2019: (1) as compared to its benchmark, the Fund's performance was lower for the 1-, 3-, 5-, and 10-year periods; and (2) as compared to its Performance Universe, the Fund's performance was in the fourth quintile for the 1-, 5-, and 10-year periods and the fifth quintile for the 3-year period. In addition, the Board also met with the Fund's portfolio manager in March 2020 to discuss the Fund's performance. The Board also noted the Fund's outperformance versus its benchmark during the 7-month period ending July 31, 2020. Further, the Board noted the Fund's ranking exceeded the average of its Morningstar peer category for the 1-year period ending July 31, 2020.
Noting that the Fund underperformed over certain periods, the Board considered Management's representations regarding the factors impacting the Fund's performance and discussed with Management the Fund's performance, potential reasons for the relative performance, and, if necessary, steps that Management had taken, or intended to take, to improve performance. The Board also considered Management's responsiveness to the Fund's relative performance. In this regard, the Board noted that performance, especially short-term performance, is only one of the factors that it deems relevant to its consideration of the Agreement and that, after considering all relevant factors, it determined to approve the continuation of the Agreement notwithstanding the Fund's relative underperformance.
37
Fee Rates, Profitability, and Fall-out Benefits
With respect to the overall fairness of the Agreement, the Board considered the fee structure for the Fund under the Agreement as compared to the Expense Group provided by the consulting firm, as discussed above. The Board reviewed a comparison of the Fund's management fee to its Expense Group. The Board noted that the comparative management fee analysis includes, in the Fund's management fee, the separate administrative fees paid to Management. However, the Board noted that some funds in the Expense Group pay directly from fund assets for certain services that Management covers out of the administration fees for the Fund. Accordingly, the Board also considered the Fund's total expense ratio as compared with its Expense Group as a way of taking account of these differences.
The Board compared the Fund's contractual and actual management fees to the median of the contractual and actual management fees, respectively, of the Fund's Expense Group. (The actual management fees are the contractual management fees reduced by any fee waivers or other adjustments.) The Board also compared the Fund's total expenses to the median of the total expenses of the Fund's Expense Group. The Board noted that the Fund's total expenses were higher than the Expense Group median, and considered whether specific portfolio management, administration or oversight needs contributed to the Fund's total expenses. With respect to the quintile rankings for fees and total expenses (net of waivers or other adjustments, if any) for the Fund compared to its Expense Group, the first quintile represents the lowest fees and/or total expenses and the fifth quintile represents the highest fees and/or total expenses. For fee comparisons, the Board looked at the Fund's Class S as a proxy for both of the Fund's classes.
The Board considered that, as compared to its Expense Group, the Fund's contractual management fee and the actual management fee net of fees waived by Management each ranked in the third quintile and total expenses ranked in the fifth quintile.
In addition to considering the above-referenced factors, the Board took note of its ongoing dialogue with Management regarding the dynamics of the insurance/annuity marketplace. The Board considered, among other matters, related tax restrictions and the unique challenges facing that market generally, which assisted the Board in understanding the context for the Fund's expense ratio and performance.
In concluding that the benefits accruing to Management and its affiliates by virtue of their relationship with the Fund were reasonable in light of the costs of providing the investment advisory and other services and the benefits accruing to the Fund, the Board reviewed specific data as to Management's estimated profit on the Fund for a recent period on a pre-tax basis without regard to distribution expenses, including year-over-year changes in each of Management's reported expense categories. (The Board also reviewed data on Management's estimated loss on the Fund after distribution/servicing expenses and taxes were factored in, as indicators of the health of the business and the extent to which Management is directing its profits into the growth of the business. The Board noted that when distribution expenses and taxes were considered, Management experienced a loss on the Fund.) The Board considered the cost allocation methodology that Management used in developing its estimated profitability figures. In recent years, the Board engaged an independent forensic accountant to review the profitability methodology utilized by Management when preparing this information and discussed with the consultant its conclusion that Management's process for calculating and reporting its estimated profit was not unreasonable.
Recognizing that there is no uniform methodology regarding the allocation of firm-wide or complex-wide expenses within the asset management industry for determining profitability for this purpose and that the use of different reasonable methodologies can give rise to different profit and loss results, the Board, in recent years, requested from Management examples of profitability calculated by different methods and noted that the estimated profitability levels were still reasonable when calculated by these other methods. The Board further noted Management's representation that its estimate of profitability is derived using methodology that is consistent with the methodology used to assess and/or report measures of profitability elsewhere at the firm. In addition, the Board recognized that Management's calculations regarding its costs may not reflect all risks, including regulatory, legal, operational, reputational, and, where appropriate, entrepreneurial risks, associated with offering and managing a mutual fund in the current regulatory and market environment. The Board also considered any fall-out (i.e., indirect) benefits likely to accrue to Management or its affiliates from their relationship with the Fund, such as research it may receive from broker-dealers executing the Funds'
38
portfolio transactions on an agency basis. The Board recognized that Management and its affiliates should be entitled to earn a reasonable level of profits for services they provide to the Fund and, based on its review, concluded that Management's reported level of estimated profitability on the Fund was reasonable.
Information Regarding Services to Other Clients
The Board also considered other funds and separate accounts that were advised or sub-advised by Management or its affiliates with investment objectives, policies and strategies that were similar to those of the Fund, and compared the fees charged to the Fund to the fees charged to such comparable funds and separate accounts. The Board considered the appropriateness and reasonableness of any differences between the fees charged to a Fund and such comparable funds and/or separate accounts, and determined that differences in fees and fee structures were consistent with the differences in the management and other services provided. The Board explored with Management its assertion that although, generally, the rates of fees paid by such accounts, except other Neuberger Berman mutual funds, were lower than the fee rates paid by the corresponding Fund, the differences reflected Management's greater level of responsibilities and significantly broader scope of services regarding the Fund, the more extensive regulatory obligations and risks associated with managing the Fund, and other financial considerations with respect to creation and sponsorship of the Fund.
Economies of Scale
The Board also evaluated apparent or anticipated economies of scale in relation to the services Management provides to the Fund. The Board considered whether the Fund's fee structure provides for a reduction of payments resulting from the use of breakpoints, the size of any breakpoints in the Fund's advisory fees, and whether any such breakpoints are set at appropriate asset levels. The Board also compared the breakpoint structure to that of the Expense Group. In addition, the Board considered the expense limitation and/or fee waiver arrangements that reduces Fund expenses at all asset levels which can have an effect similar to breakpoints in sharing economies of scale with shareholders and provide protection from an increase in expenses if the Fund's assets decline. The Board also considered that Management has provided, at no added cost to the Fund, certain additional services, including but not limited to, services required by new regulations or regulatory interpretations, services impelled by changes in the securities markets or the business landscape, and/or services requested by the Board. The Board considered that this is a way of sharing economies of scale with the Fund and its shareholders.
Conclusions
In approving the continuation of the Agreement, the Board concluded that, in its business judgment, the terms of the Agreement are fair and reasonable to the Fund and that approval of the continuation of the Agreement is in the best interests of the Fund and its shareholders. In reaching this determination, the Board considered that Management could be expected to continue to provide a high level of service to the Fund; that the Board retained confidence in Management's capabilities to manage the Fund; that the Fund's fee structure appeared to the Board to be reasonable given the nature, extent, and quality of services provided; and that the benefits accruing to Management and its affiliates by virtue of their relationship with the Fund were reasonable in light of the costs of providing the investment advisory and other services and the benefits accruing to the Fund. The Board's conclusions may be based in part on its consideration of materials prepared in connection with the approval or continuance of the Agreement in prior years and on the Board's ongoing regular review of Fund performance and operations throughout the year, in addition to material prepared specifically for the most recent annual review of the Agreement.
Notice to Shareholders
100% of the dividends earned during the fiscal year ended December 31, 2020 qualify for the dividends received deduction for corporate shareholders.
The Fund designates $26,873,970 as a capital gain distribution.
39
Neuberger Berman
Advisers Management Trust
Mid Cap Intrinsic Value Portfolio
I Class Shares
S Class Shares
Annual Report
December 31, 2020
As permitted by regulations adopted by the U.S. Securities and Exchange Commission, you may no longer receive paper copies of the Fund's annual and semi-annual shareholder reports by mail from the insurance company that issued your variable annuity and variable life insurance contract or from the financial intermediary that administers your qualified pension or retirement plan, unless you specifically request paper copies of the reports from your insurance company or financial intermediary. Instead, the reports will be made available on the Fund's website www.nb.com/AMTliterature, and may also be available on a website from the insurance company or financial intermediary that offers your contract or administers your retirement plan, and such insurance company or financial intermediary will notify you by mail each time a report is posted and provide you with a website link to access the report.
If you already elected to receive shareholder reports electronically, you will not be affected by this change and you need not take any action. You may elect to receive shareholder reports and other communications from the insurance company or financial intermediary electronically by following the instructions provided by the insurance company or financial intermediary. If offered by your insurance company or financial intermediary, you may elect to receive all future reports in paper and free of charge from the insurance company or financial intermediary. You can contact your insurance company or financial intermediary if you wish to continue receiving paper copies of your shareholder reports. Your election to receive reports in paper will apply to all funds available under your contract or retirement plan.
Mid Cap Intrinsic Value Portfolio Commentary (Unaudited)
For the 12 months ended December 31, 2020 (the reporting period), the Neuberger Berman Advisers Management Trust Mid Cap Intrinsic Value Portfolio Class I generated a total return of -2.62%, underperforming its benchmark, the Russell Midcap® Value Index (the Index), which posted a 4.96% total return for the same period. (Performance for all share classes is provided in the table immediately following this letter.)
While 2020 was a challenging year for the Fund overall, the strategy generated a strong absolute and relative return in the fourth quarter. However, the year-end recovery was not enough to overcome the underperformance during the first three quarters of 2020. We believe that the economic outlook for 2021, assuming vaccines are successful in controlling COVID-19, should be favorable for our style of value investing, as evidenced by our fourth quarter performance.
The Fund started the reporting period heavily skewed toward cyclicality and was, in our view, attractively valued on both an absolute and relative basis. When the COVID-19 pandemic hit in March, value investing and cyclically oriented stocks were severely punished as the economy shut down and many business models were questioned. The market largely ignored valuation as a factor and instead, momentum and growth were purchased even at seemingly undesirable valuations.
For the reporting period, both absolute and relative performance was negatively impacted by our positioning in cyclically oriented and travel-related companies. Relative performance was hurt by our lower average market capitalization versus the Index. On the positive side, the strategy benefitted from our large contingent of Information Technology companies, most of which generated strong returns, and limited exposure to the beleaguered Real Estate sector versus the Index. M&A activity also helped returns.
Given the dislocation in the stock market due to the pandemic, we were active in the portfolio throughout the year. In all, we introduced 15 new companies, using the market decline in March and April to add companies that were less cyclical and generally had more top-line growth but were still selling at attractive value multiples. Due to valuation considerations, this was the first time in several years that we were comfortable buying growth-at-a-reasonable-price companies and feel that this has added substantially more balance to the strategy. To fund these purchases, we sold companies we believed would have trouble recovering from the aftershocks of the pandemic.
Looking ahead to 2021, we feel that economic growth is poised to accelerate, fueled by our anticipation of aggressive monetary policy, another round of fiscal stimulus, and a successful roll out of COVID-19 vaccines. Many economists estimate GDP growth increasing to above 5% during the back half of the year as the consumer should be in a relatively strong position coming out of the pandemic.
Strong economic growth should lead to higher corporate earnings in 2021. In our opinion, earnings growth in cyclical companies can accelerate and perhaps exceed expectations. While we think the outlook for earnings growth is positive, market valuations in our opinion are on the high side and are discounting a large part of this growth, especially if faster economic growth leads to higher interest rates and inflation. Historically, accelerated growth and increasing inflation has favored value stocks.
We believe 2021 should be a robust year for value investing and our strategy. However, there are many crosscurrents in the present environment that could cause volatility in the short run including the outcome of the Georgia Senate elections, potential for spikes in COVID-19 cases, and the amount of time it takes to immunize the population. In our opinion, general market valuations are significantly above average and the boom in initial public offerings and special purpose acquisition companies are worrisome. However, looking at the ongoing disconnect between growth and value,
1
the massive monetary and fiscal stimulus, the pent-up demand created by the pandemic, and the portfolio's valuation level, we have confidence in our intrinsic value1 strategy moving forward.
Sincerely,
MICHAEL C. GREENE
PORTFOLIO MANAGER
1 Intrinsic value reflects the portfolio management team's analysis and estimates of a company's value. There is no guarantee that any intrinsic values will be realized; security prices may decrease regardless of intrinsic values.
Information about principal risks of investing in the Fund is set forth in the prospectus and statement of additional information.
The portfolio composition, industries and holdings of the Fund are subject to change without notice.
The opinions expressed are those of the Fund's portfolio manager. The opinions are as of the date of this report and are subject to change without notice.
2
Mid Cap Intrinsic Value Portfolio (Unaudited)
SECTOR ALLOCATION
(as a % of Total Investments*) | |
Communication Services | | | 2.5 | % | |
Consumer Discretionary | | | 14.4 | | |
Consumer Staples | | | 7.2 | | |
Energy | | | 5.8 | | |
Financials | | | 8.6 | | |
Health Care | | | 10.2 | | |
Industrials | | | 14.3 | | |
Information Technology | | | 19.4 | | |
Materials | | | 2.6 | | |
Real Estate | | | 1.9 | | |
Utilities | | | 7.9 | | |
Short-Term Investments | | | 5.2 | | |
Total | | | 100.0 | % | |
* Derivatives, if any, are excluded from this chart.
PERFORMANCE HIGHLIGHTS
| | Inception | | Average Annual Total Return
Ended 12/31/2020 | |
| | Date | | 1 Year | | 5 Years | | 10 Years | | Life of Fund | |
At NAV | | | | | | | | | |
| |
Class I | | 08/22/2001 | | | –2.62 | % | | | 5.49 | % | | | 7.27 | % | | | 7.21 | % | |
| Class S2 | | 04/29/2005 | | | –2.83 | % | | | 5.23 | % | | | 7.03 | % | | | 7.02 | % | |
Index | | | | | | | | | |
| |
Russell Midcap®
Value Index1,3 | | | | | 4.96 | % | | | 9.73 | % | | | 10.49 | % | | | 9.47 | % | |
| Russell Midcap® Index1,3 | | | | | 17.10 | % | | | 13.40 | % | | | 12.41 | % | | | 10.23 | % | |
The performance data quoted represent past performance and do not indicate future results. Current performance may be lower or higher than the performance data quoted. For current performance data, including current to the most recent month-end, please visit http://www.nb.com/amtportfolios/performance.
The results shown in the table reflect the reinvestment of income dividends and other distributions, if any. The results do not reflect the effect of taxes a shareholder would pay on Fund distributions or on the redemption of Fund shares. The results do not reflect fees and expenses of the variable annuity and variable life insurance policies or the qualified pension and retirement plans whose proceeds are invested in the Fund.
The investment return and principal value of an investment will fluctuate and shares, when redeemed, may be worth more or less than their original cost.
Returns would have been lower if Neuberger Berman Investment Advisers LLC ("Management") had not reimbursed certain expenses and/ or waived a portion of the investment management fees during certain of the periods shown. Repayment by a class (of expenses previously reimbursed and/ or fees previously waived by Management) will decrease the class's returns. Please see Note B in the Notes to Financial Statements for specific information regarding expense reimbursement and/ or fee waiver arrangements.
As stated in the Fund's most recent prospectus, the total annual operating expense ratios for fiscal year 2019 were 1.02% and 1.27% for Class I and Class S shares, respectively (before expense reimbursements and/or fee waivers, if any). The expense ratio was 1.26% after expense reimbursements and/or fee waivers for Class S shares. The expense ratios for the annual period ended December 31, 2020 can be found in the Financial Highlights section of this report.
3
Mid Cap Intrinsic Value Portfolio (Unaudited)
COMPARISON OF A $10,000 INVESTMENT

This graph shows the change in value of a hypothetical $10,000 investment in the Fund over the past 10 fiscal years, or since the Fund's inception, if it has not operated for 10 years. The graph is based on Class I shares only; the performance of the Fund's share classes will differ primarily due to different class expenses (see Performance Highlights chart above). The result is compared with benchmarks, which include a broad-based market index and may include a more narrowly based index. Market indices have not been reduced to reflect any of the fees and costs of investing. The results shown in the graph reflect the reinvestment of income dividends and other distributions, if any. The results do not reflect the effect of taxes a shareholder would pay on Fund distributions or on the redemption of Fund shares. The results do not reflect fees and expenses of the variable annuity and variable life insurance policies or the qualified pension and retirement plans whose proceeds are invested in the Fund. Results represent past performance and do not indicate future results.
Please see Endnotes for additional information.
4
1 The date used to calculate Life of Fund performance for the index is August 22, 2001, the inception date of Class I shares, the Fund's oldest share class.
2 Performance shown prior to April 29, 2005 for Class S shares is that of Class I shares, which has lower expenses and correspondingly higher returns than Class S shares.
3 The Russell Midcap® Value Index is a float-adjusted market capitalization-weighted index that measures the performance of the mid-cap value segment of the U.S. equity market. It includes those Russell Midcap® Index companies with lower price-to-book ratios and lower forecasted growth rates. The index is rebalanced annually in June. The Russell Midcap Index is a float-adjusted market capitalization-weighted index that measures the performance of the mid-cap segment of the U.S. equity market. It includes approximately 800 of the smallest securities in the Russell 1000® Index. The index is rebalanced annually in June. Please note that the indices described in this report do not take into account any fees, expenses or tax consequences of investing in the individual securities that they track, and that individuals cannot invest directly in any index. Data about the performance of an index are prepared or obtained by Neuberger Berman Investment Advisers LLC ("Management") and reflect the reinvestment of income dividends and other distributions, if any. The Fund may invest in securities not included in a described index and generally does not invest in all securities included in a described index.
The investments for the Fund are managed by the same portfolio manager(s) who manage(s) one or more other registered funds that have names, investment objectives and investment styles that are similar to those of the Fund. You should be aware that the Fund is likely to differ from those other mutual fund(s) in size, cash flow pattern and tax matters. Accordingly, the holdings and performance of the Fund can be expected to vary from those of the other mutual fund(s).
Shares of the separate Neuberger Berman Advisers Management Trust Portfolios, including the Fund, are not available to the general public. Shares of the Fund may be purchased only by life insurance companies to be held in their separate accounts, which fund variable annuity and variable life insurance policies, and by qualified pension and retirement plans. Statistics and projections in this report are derived from sources deemed to be reliable but cannot be regarded as a representation of future results of the Fund. This report is prepared for the general information of shareholders and is not an offer of shares of the Fund. Shares are sold only through the currently effective prospectus, which must precede or accompany this report.
The "Neuberger Berman" name and logo and "Neuberger Berman Investment Advisers LLC" name are registered service marks of Neuberger Berman Group LLC. The individual Fund name in this piece is either a service mark or registered service mark of Neuberger Berman Investment Advisers LLC, an affiliate of Neuberger Berman BD LLC, distributor, member FINRA.
© 2021 Neuberger Berman BD LLC, distributor. All rights reserved.
5
Information About Your Fund's Expenses (Unaudited)
As a Fund shareholder, you incur two types of costs: (1) transaction costs such as fees and expenses that are, or may be, imposed under your variable contract or qualified pension plan; and (2) ongoing costs, including management fees, distribution and/or service (12b-1) fees (if applicable), and other Fund expenses. This example is intended to help you understand your ongoing costs (in U.S. dollars) of investing in the Fund and compare these costs with the ongoing costs of investing in other mutual funds.
This table is designed to provide information regarding costs related to your investments. The following examples are based on an investment of $1,000 made at the beginning of the six month period ended December 31, 2020 and held for the entire period. The table illustrates the Fund's costs in two ways:
Actual Expenses and Performance: | | The first section of the table provides information about actual account values and actual expenses in dollars, based on the Fund's actual performance during the period indicated. You may use the information in this line, together with the amount you invested, to estimate the expenses you paid over the period. Simply divide your account value by $1,000 (for example, an $8,600 account value divided by $1,000 = 8.6), then multiply the result by the number in the first section of the table under the heading entitled "Expenses Paid During the Period" to estimate the expenses you paid over the period. | |
Hypothetical Example for
Comparison Purposes: | | The second section of the table provides information about hypothetical account values and hypothetical expenses based on the Fund's actual expense ratio and an assumed rate of return at 5% per year before expenses. This return is not the Fund's actual return. The hypothetical account values and expenses may not be used to estimate the actual ending account balance or expenses you paid for the period. You may use this information to compare the ongoing costs of investing in this Fund versus other funds. To do so, compare the expenses shown in this 5% hypothetical example with the 5% hypothetical examples that appear in the shareholder reports of other funds. | |
Please note that the expenses in the table are meant to highlight your ongoing costs only and do not include any transaction costs, such as fees and expenses that are, or may be imposed under your variable contract or qualified pension plan. Therefore, the information under the heading "Hypothetical (5% annual return before expenses)" is useful in comparing ongoing costs only, and will not help you determine the relative total costs of owning different funds. In addition, if these transaction costs were included, your costs would have been higher.
Expense Example (Unaudited)
NEUBERGER BERMAN ADVISERS MANAGEMENT TRUST MID CAP INTRINSIC VALUE PORTFOLIO
Actual | | Beginning Account
Value
7/1/20 | | Ending Account
Value
12/31/20 | | Expenses Paid
During the Period
7/1/20 – 12/31/20 | | Expense
Ratio | |
Class I | | $ | 1,000.00 | | | $ | 1,290.60 | | | $ | 5.87 | (a) | | | 1.02 | % | |
Class S | | $ | 1,000.00 | | | $ | 1,289.10 | | | $ | 7.19 | (a) | | | 1.25 | % | |
Hypothetical (5% annual return before expenses) | |
Class I | | $ | 1,000.00 | | | $ | 1,020.01 | | | $ | 5.18 | (b) | | | 1.02 | % | |
Class S | | $ | 1,000.00 | | | $ | 1,018.85 | | | $ | 6.34 | (b) | | | 1.25 | % | |
(a) For each class, expenses are equal to the annualized expense ratio for the class, multiplied by the average account value over the period, multiplied by 184/366 (to reflect the one-half year period shown).
(b) Hypothetical expenses are equal to the annualized expense ratios for each class, multiplied by the average account value over the period (assuming a 5% annual return), multiplied by 184/366 (to reflect the one-half year period shown).
6
Schedule of Investments Mid Cap Intrinsic Value Portfolio^ December 31, 2020
NUMBER OF SHARES | | | | VALUE | |
Common Stocks 96.7% | | | |
Aerospace & Defense 3.1% | | | |
| | 27,550 | | | General Dynamics Corp. | | $ | 4,099,991 | | |
Auto Components 4.0% | | | |
| | 40,500 | | | Aptiv PLC | | | 5,276,745 | | |
Banks 5.7% | | | |
| | 105,400 | | | BankUnited, Inc. | | | 3,665,812 | | |
| | 44,100 | | | Comerica, Inc. | | | 2,463,426 | | |
| | 28,000 | | | Truist Financial Corp. | | | 1,342,040 | | |
| | | | 7,471,278 | | |
Beverages 2.4% | | | |
| 69,300 |
| | Molson Coors Brewing
Co. Class B | |
| 3,131,667 |
| |
Biotechnology 4.0% | | | |
| | 34,000 | | | Alexion Pharmaceuticals, Inc. | | | 5,312,160 | * | |
Building Products 2.5% | | | |
| 70,510 |
| | Johnson Controls
International PLC | |
| 3,285,061 |
| |
Capital Markets 1.0% | | | |
| | 18,400 | | | State Street Corp. | | | 1,339,152 | | |
Chemicals 2.6% | | | |
| | 43,100 | | | Ashland Global Holdings, Inc. | | | 3,413,520 | | |
Commercial Services & Supplies 1.6% | | | |
| | 113,900 | | | KAR Auction Services, Inc. | | | 2,119,679 | | |
Communications Equipment 3.1% | | | |
| | 39,700 | | | Ciena Corp. | | | 2,098,145 | * | |
| | 11,500 | | | Motorola Solutions, Inc. | | | 1,955,690 | | |
| | | | 4,053,835 | | |
Construction & Engineering 1.2% | | | |
| | 8,700 | | | Valmont Industries, Inc. | | | 1,521,891 | | |
Electric Utilities 3.2% | | | |
| | 59,100 | | | Evergy, Inc. | | | 3,280,641 | | |
| | 30,300 | | | OGE Energy Corp. | | | 965,358 | | |
| | | | 4,245,999 | | |
NUMBER OF SHARES | | | | VALUE | |
Electronic Equipment, Instruments &
Components 4.3% | | | |
| | 20,000 | | | CDW Corp. | | $ | 2,635,800 | | |
| | 30,900 | | | FLIR Systems, Inc. | | | 1,354,347 | | |
| | 17,500 | | | Itron, Inc. | | | 1,678,250 | * | |
| | | | 5,668,397 | | |
Entertainment 2.6% | | | |
| 53,050 |
| | Lions Gate Entertainment
Corp. Class A | |
| 603,178 | * | |
| 267,650 |
| | Lions Gate Entertainment
Corp. Class B | |
| 2,778,207 | * | |
| | | | 3,381,385 | | |
Equity Real Estate Investment Trusts 2.0% | | | |
| | 57,100 | | | Regency Centers Corp. | | | 2,603,189 | | |
Food & Staples Retailing 1.1% | | | |
| 39,400 |
| | BJ's Wholesale Club Holdings,
Inc. | |
| 1,468,832 | * | |
Food Products 3.9% | | | |
| | 53,100 | | | Hain Celestial Group, Inc. | | | 2,131,965 | * | |
| | 70,000 | | | TreeHouse Foods, Inc. | | | 2,974,300 | * | |
| | | | 5,106,265 | | |
Health Care Equipment & Supplies 4.0% | | | |
| | 33,700 | | | Zimmer Biomet Holdings, Inc. | | | 5,192,833 | | |
Health Care Providers & Services 2.4% | | | |
| | 75,400 | | | MEDNAX, Inc. | | | 1,850,316 | * | |
| | 6,400 | | | Molina Healthcare, Inc. | | | 1,361,152 | * | |
| | | | 3,211,468 | | |
Hotels, Restaurants & Leisure 6.7% | | | |
| | 141,700 | | | MGM Resorts International | | | 4,464,967 | | |
| | 97,000 | | | Wyndham Destinations, Inc. | | | 4,351,420 | | |
| | | | 8,816,387 | | |
Independent Power and Renewable
Electricity Producers 3.4% | | | |
| | 124,400 | | | AES Corp. | | | 2,923,400 | | |
| | 77,200 | | | Vistra Energy Corp. | | | 1,517,752 | | |
| | | | 4,441,152 | | |
Industrial Conglomerates 2.1% | | | |
| | 18,000 | | | Carlisle Cos., Inc. | | | 2,811,240 | | |
See Notes to Financial Statements
7
Schedule of Investments Mid Cap Intrinsic Value Portfolio^ (cont'd)
NUMBER OF SHARES | | | | VALUE | |
IT Services 4.3% | | | |
| | 32,300 | | | Amdocs Ltd. | | $ | 2,291,039 | | |
| | 331,400 | | | Conduent, Inc. | | | 1,590,720 | * | |
| | 75,900 | | | Perspecta, Inc. | | | 1,827,672 | | |
| | | | 5,709,431 | | |
Machinery 0.9% | | | |
| | 6,300 | | | Stanley Black & Decker, Inc. | | | 1,124,928 | | |
Mortgage Real Estate Investment Trusts 2.0% | | | |
| | 138,900 | | | Starwood Property Trust, Inc. | | | 2,680,770 | | |
Multi-Utilities 1.4% | | | |
| | 84,800 | | | CenterPoint Energy, Inc. | | | 1,835,072 | | |
Multiline Retail 1.8% | | | |
| | 22,200 | | | Dollar Tree, Inc. | | | 2,398,488 | * | |
Oil, Gas & Consumable Fuels 5.9% | | | |
| | 37,900 | | | EOG Resources, Inc. | | | 1,890,073 | | |
| | 89,900 | | | ONEOK, Inc. | | | 3,450,362 | | |
| | 15,500 | | | Phillips 66 | | | 1,084,070 | | |
| | 69,000 | | | Williams Cos., Inc. | | | 1,383,450 | | |
| | | | 7,807,955 | | |
Semiconductors & Semiconductor
Equipment 4.4% | | | |
| | 16,800 | | | NXP Semiconductors NV | | | 2,671,368 | | |
| | 20,100 | | | Skyworks Solutions, Inc. | | | 3,072,888 | | |
| | | | 5,744,256 | | |
NUMBER OF SHARES | | | | VALUE | |
Software 1.5% | | | |
| | 45,500 | | | Nuance Communications, Inc. | | $ | 2,006,095 | * | |
Specialty Retail 2.2% | | | |
| | 407,000 | | | Chico's FAS, Inc. | | | 647,130 | | |
| | 43,900 | | | Children's Place, Inc. | | | 2,199,390 | * | |
| | | | 2,846,520 | | |
Technology Hardware, Storage &
Peripherals 2.2% | | | |
| | 51,621 | | | Western Digital Corp. | | | 2,859,287 | | |
Trading Companies & Distributors 3.2% | | | |
| | 91,400 | | | AerCap Holdings NV | | | 4,166,012 | * | |
| |
| | Total Common Stocks
(Cost $98,582,420) | |
| 127,150,940 |
| |
Short-Term Investments 5.3% | | | |
Investment Companies 5.3% | | | |
| | 7,004,750 | | | State Street Institutional
U.S. Government Money
Market Fund Premier
Class, 0.03%(a)
(Cost $7,004,750) | |
| 7,004,750
|
| |
| |
| | Total Investments 102.0%
(Cost $105,587,170) | |
| 134,155,690 |
| |
| | | | | Liabilities Less Other Assets (2.0)% | | | (2,662,839 | ) | |
| | | | | Net Assets 100.0% | | $ | 131,492,851 | | |
* Non-income producing security.
(a) Represents 7-day effective yield as of December 31, 2020.
The following is a summary, categorized by Level (see Note A of Notes to Financial Statements), of inputs used to value the Fund's investments as of December 31, 2020:
Asset Valuation Inputs | | Level 1 | | Level 2 | | Level 3 | | Total | |
Investments: | |
| Common Stocks(a) | | $ | 127,150,940 | | | $ | — | | | $ | — | | | $ | 127,150,940 | | |
Short-Term Investments | | | — | | | | 7,004,750 | | | | — | | | | 7,004,750 | | |
Total Investments | | $ | 127,150,940 | | | $ | 7,004,750 | | | $ | — | | | $ | 134,155,690 | | |
(a) The Schedule of Investments provides information on the industry categorization for the portfolio.
^ A balance indicated with a "—", reflects either a zero balance or an amount that rounds to less than 1.
See Notes to Financial Statements
8
Statement of Assets and Liabilities
Neuberger Berman Advisers Management Trust
| | | MID CAP
INTRINSIC
VALUE
PORTFOLIO | |
| | | December 31, 2020 | |
Assets | |
Investments in securities, at value* (Note A)—see Schedule of Investments: | |
| Unaffiliated issuers(a) | | $ | 134,155,690 | | |
Dividends and interest receivable | | | 200,130 | | |
Receivable for Fund shares sold | | | 30,570 | | |
Prepaid expenses and other assets | | | 1,290 | | |
Total Assets | | | 134,387,680 | | |
Liabilities | |
Payable to investment manager—net (Note B) | | | 61,162 | | |
Payable for Fund shares redeemed | | | 2,720,001 | | |
Payable to administrator—net (Note B) | | | 43,212 | | |
Payable to trustees | | | 12,717 | | |
Other accrued expenses and payables | | | 57,737 | | |
Total Liabilities | | | 2,894,829 | | |
Net Assets | | $ | 131,492,851 | | |
Net Assets consist of: | |
Paid-in capital | | $ | 112,675,321 | | |
Total distributable earnings/(losses) | | | 18,817,530 | | |
Net Assets | | $ | 131,492,851 | | |
Net Assets | |
Class I | | $ | 91,982,154 | | |
Class S | | | 39,510,697 | | |
Shares Outstanding ($.001 par value; unlimited shares authorized) | |
Class I | | | 5,974,423 | | |
Class S | | | 2,192,310 | | |
Net Asset Value, offering and redemption price per share | |
Class I | | $ | 15.40 | | |
Class S | | | 18.02 | | |
*Cost of Investments: | |
(a) Unaffiliated issuers | | $ | 105,587,170 | | |
See Notes to Financial Statements
9
Neuberger Berman Advisers Management Trust
| | | MID CAP
INTRINSIC
VALUE
PORTFOLIO | |
| | | For the Fiscal
Year Ended
December 31, 2020 | |
Investment Income: | |
Income (Note A): | |
Dividend income—unaffiliated issuers | | $ | 2,411,525 | | |
Interest and other income—unaffiliated issuers | | | 20,826 | | |
Foreign taxes withheld | | | (2,835 | ) | |
Total income | | $ | 2,429,516 | | |
Expenses: | |
Investment management fees (Note B) | | | 622,657 | | |
Administration fees (Note B): | |
Class I | | | 229,075 | | |
Class S | | | 110,556 | | |
Distribution fees (Note B): | |
Class S | | | 92,130 | | |
Shareholder servicing agent fees: | |
Class I | | | 54 | | |
Class S | | | 18 | | |
Audit fees | | | 40,442 | | |
Custodian and accounting fees | | | 56,266 | | |
Insurance | | | 4,319 | | |
Legal fees | | | 26,507 | | |
Shareholder reports | | | 14,310 | | |
Trustees' fees and expenses | | | 51,659 | | |
Interest | | | 928 | | |
Miscellaneous | | | 10,456 | | |
Total expenses | | | 1,259,377 | | |
Expenses reimbursed by Management (Note B) | | | (9,794 | ) | |
Total net expenses | | | 1,249,583 | | |
Net investment income/(loss) | | $ | 1,179,933 | | |
Realized and Unrealized Gain/(Loss) on Investments (Note A): | |
Net realized gain/(loss) on: | |
Transactions in investment securities of unaffiliated issuers | | | (7,672,127 | ) | |
Change in net unrealized appreciation/(depreciation) in value of: | |
Investment securities of unaffiliated issuers | | | 5,563,046 | | |
Net gain/(loss) on investments | | | (2,109,081 | ) | |
Net increase/(decrease) in net assets resulting from operations | | $ | (929,148 | ) | |
See Notes to Financial Statements
10
Statements of Changes in Net Assets
Neuberger Berman Advisers Management Trust
| | | MID CAP INTRINSIC VALUE PORTFOLIO | |
| | | Fiscal Year Ended
December 31,
2020 | | Fiscal Year Ended
December 31,
2019 | |
Increase/(Decrease) in Net Assets: | |
From Operations (Note A): | |
Net investment income/(loss) | | $ | 1,179,933 | | | $ | 1,669,602 | | |
Net realized gain/(loss) on investments | | | (7,672,127 | ) | | | (4,385,081 | ) | |
Change in net unrealized appreciation/(depreciation) of investments | | | 5,563,046 | | | | 25,137,645 | | |
Net increase/(decrease) in net assets resulting from operations | | | (929,148 | ) | | | 22,422,166 | | |
Distributions to Shareholders From (Note A): | |
Distributable earnings: | |
Class I | | | (935,713 | ) | | | (12,305,037 | ) | |
Class S | | | (264,448 | ) | | | (4,563,564 | ) | |
Total distributions to shareholders | | | (1,200,161 | ) | | | (16,868,601 | ) | |
From Fund Share Transactions (Note D): | |
Proceeds from shares sold: | |
Class I | | | 15,604,914 | | | | 13,886,972 | | |
Class S | | | 8,252,097 | | | | 3,950,675 | | |
Proceeds from reinvestment of dividends and distributions: | |
Class I | | | 935,713 | | | | 12,305,037 | | |
Class S | | | 264,448 | | | | 4,563,564 | | |
Payments for shares redeemed: | |
Class I | | | (16,350,788 | ) | | | (29,056,126 | ) | |
Class S | | | (12,856,048 | ) | | | (12,014,333 | ) | |
Net increase/(decrease) from Fund share transactions | | | (4,149,664 | ) | | | (6,364,211 | ) | |
Net Increase/(Decrease) in Net Assets | | | (6,278,973 | ) | | | (810,646 | ) | |
Net Assets: | |
Beginning of year | | | 137,771,824 | | | | 138,582,470 | | |
End of year | | $ | 131,492,851 | | | $ | 137,771,824 | | |
See Notes to Financial Statements
11
Notes to Financial Statements Mid Cap Intrinsic Value Portfolio
Note A—Summary of Significant Accounting Policies:
1 General: Neuberger Berman Advisers Management Trust (the "Trust") is a Delaware statutory trust organized pursuant to an Amended and Restated Trust Instrument dated March 27, 2014. The Trust is registered as an open-end management investment company under the Investment Company Act of 1940, as amended (the "1940 Act"), and its shares are registered under the Securities Act of 1933, as amended. Neuberger Berman Advisers Management Trust Mid Cap Intrinsic Value Portfolio (the "Fund") is a separate operating series of the Trust and is diversified. The Fund offers Class I and Class S shares. The Trust's Board of Trustees (the "Board") may establish additional series or classes of shares without the approval of shareholders.
A balance indicated with a "—", reflects either a zero balance or a balance that rounds to less than 1.
The assets of the Fund belong only to the Fund, and the liabilities of the Fund are borne solely by the Fund and no other series of the Trust.
The Fund is an investment company and accordingly follows the investment company accounting and reporting guidance of the Financial Accounting Standards Board Accounting Standards Codification ("ASC") Topic 946 "Financial Services—Investment Companies."
The preparation of financial statements in accordance with U.S. generally accepted accounting principles ("GAAP") requires Neuberger Berman Investment Advisers LLC ("Management" or "NBIA") to make estimates and assumptions at the date of the financial statements. Actual results could differ from those estimates.
Shares of the Fund are not available to the general public and may be purchased only by life insurance companies to serve as an investment vehicle for premiums paid under their variable annuity and variable life insurance contracts and to certain qualified pension and other retirement plans.
2 Portfolio valuation: In accordance with ASC 820 "Fair Value Measurement" ("ASC 820"), all investments held by the Fund are carried at the value that Management believes the Fund would receive upon selling an investment in an orderly transaction to an independent buyer in the principal or most advantageous market for the investment under current market conditions. Various inputs, including the volume and level of activity for the asset or liability in the market, are considered in valuing the Fund's investments, some of which are discussed below. Significant Management judgment may be necessary to value investments in accordance with ASC 820.
ASC 820 established a three-tier hierarchy of inputs to create a classification of value measurements for disclosure purposes. The three-tier hierarchy of inputs is summarized in the three broad Levels listed below.
• Level 1—unadjusted quoted prices in active markets for identical investments
• Level 2—other observable inputs (including quoted prices for similar investments, interest rates, prepayment speeds, credit risk, amortized cost, etc.)
• Level 3—unobservable inputs (including the Fund's own assumptions in determining the fair value of investments)
The inputs or methodology used for valuing an investment are not necessarily an indication of the risk associated with investing in those securities.
The value of the Fund's investments in equity securities, for which market quotations are readily available, is generally determined by Management by obtaining valuations from independent pricing services based on the latest sale price quoted on a principal exchange or market for that security (Level 1 inputs). Securities traded primarily on the NASDAQ Stock Market are normally valued at the NASDAQ Official Closing Price ("NOCP") provided by NASDAQ each business day. The NOCP is the most recently reported price as of 4:00:02 p.m., Eastern Time, unless that price is outside the range of the "inside" bid and asked prices (i.e., the bid and asked prices that
12
dealers quote to each other when trading for their own accounts); in that case, NASDAQ will adjust the price to equal the inside bid or asked price, whichever is closer. Because of delays in reporting trades, the NOCP may not be based on the price of the last trade to occur before the market closes. If there is no sale of a security on a particular day, the independent pricing services may value the security based on market quotations.
Management has developed a process to periodically review information provided by independent pricing services for all types of securities.
Investments in non-exchange traded investment companies are valued using the respective fund's daily calculated net asset value ("NAV") per share (Level 2 inputs).
If a valuation is not available from an independent pricing service, or if Management has reason to believe that the valuation received does not represent the amount the Fund might reasonably expect to receive on a current sale in an orderly transaction, Management seeks to obtain quotations from brokers or dealers (generally considered Level 2 or Level 3 inputs depending on the number of quotes available). If such quotations are not readily available, the security is valued using methods the Board has approved in the good-faith belief that the resulting valuation will reflect the fair value of the security. Inputs and assumptions considered in determining the fair value of a security based on Level 2 or Level 3 inputs may include, but are not limited to, the type of the security; the initial cost of the security; the existence of any contractual restrictions on the security's disposition; the price and extent of public trading in similar securities of the issuer or of comparable companies; quotations or evaluated prices from broker-dealers and/or pricing services; information obtained from the issuer and/or analysts; an analysis of the company's or issuer's financial statements; an evaluation of the inputs that influence the issuer and the market(s) in which the security is purchased and sold.
Fair value prices are necessarily estimates, and there is no assurance that such a price will be at or close to the price at which the security is next quoted or next trades.
3 Foreign currency translations: The accounting records of the Fund are maintained in U.S. dollars. Foreign currency amounts are normally translated into U.S. dollars using the exchange rate as of 4:00 p.m. Eastern Time, on days the New York Stock Exchange is open for business, to determine the value of investments, other assets and liabilities. Purchase and sale prices of securities, and income and expenses, are translated into U.S. dollars at the prevailing rate of exchange on the respective dates of such transactions. Net unrealized foreign currency gain/(loss), if any, arises from changes in the value of assets and liabilities, other than investments in securities, as a result of changes in exchange rates and is stated separately in the Statement of Operations.
4 Securities transactions and investment income: Securities transactions are recorded on trade date for financial reporting purposes. Dividend income is recorded on the ex-dividend date or, for certain foreign dividends, as soon as the Fund becomes aware of the dividends. Non-cash dividends included in dividend income, if any, are recorded at the fair market value of the securities received. Interest income, including accretion of discount (adjusted for original issue discount, where applicable), and amortization of premium, where applicable, is recorded on the accrual basis. Realized gains and losses from securities transactions and foreign currency transactions, if any, are recorded on the basis of identified cost and stated separately in the Statement of Operations.
5 Income tax information: The Fund is treated as a separate entity for U.S. federal income tax purposes. It is the policy of the Fund to continue to qualify for treatment as a regulated investment company ("RIC") by complying with the requirements of the U.S. Internal Revenue Code applicable to RICs and to distribute substantially all of its net investment income and net realized capital gains to its shareholders. To the extent the Fund distributes substantially all of its net investment income and net realized capital gains to shareholders, no federal income or excise tax provision is required.
The Fund has adopted the provisions of ASC 740 "Income Taxes" ("ASC 740"). ASC 740 sets forth a minimum threshold for financial statement recognition of a tax position taken, or expected to be taken, in a tax return. The Fund recognizes interest and penalties, if any, related to unrecognized tax positions as an income tax expense in
13
the Statement of Operations. The Fund is subject to examination by U.S. federal and state tax authorities for returns filed for the tax years for which the applicable statutes of limitations have not yet expired. As of December 31, 2020, the Fund did not have any unrecognized tax positions.
For federal income tax purposes, the estimated cost in value of investments held at December 31, 2020 was $105,978,641. The estimated gross unrealized appreciation was $37,766,143 and estimated gross unrealized depreciation was $9,589,094 resulting in net unrealized appreciation of $28,177,049 based on cost for U.S. federal income tax purposes.
Income distributions and capital gain distributions are determined in accordance with income tax regulations, which may differ from GAAP. These differences are primarily due to differing treatments of income and gains on various investment securities held by the Fund, timing differences and differing characterization of distributions made by the Fund. The Fund may also utilize earnings and profits distributed to shareholders on redemption of their shares as a part of the dividends-paid deduction for income tax purposes.
Any permanent differences resulting from different book and tax treatment are reclassified at year-end and have no impact on net income, NAV or NAV per share of the Fund. For the year ended December 31, 2020 there were no permanent differences requiring a reclassification between total distributable earnings/(losses) and paid-in capital.
The tax character of distributions paid during the years ended December 31, 2020, and December 31, 2019, was as follows:
| | | Distributions Paid From: | |
| | | Ordinary Income | | Long-Term Capital Gain | | Total | |
| | | 2020 | | 2019 | | 2020 | | 2019 | | 2020 | | 2019 | |
| | | | | $ | 1,200,161 | | | $ | 2,807,684 | | | $ | — | | | $ | 14,060,917 | | | $ | 1,200,161 | | | $ | 16,868,601 | | |
As of December 31, 2020, the components of distributable earnings (accumulated losses) on a U.S. federal income tax basis were as follows:
Undistributed
Ordinary
Income | | Undistributed
Long-Term
Capital Gain | | Unrealized
Appreciation/
(Depreciation) | | Loss
Carryforwards
and Deferrals | | Other
Temporary
Differences | | Total | |
| $ | 815,606 | | | $ | — | | | $ | 28,177,049 | | | $ | (10,175,125 | ) | | $ | — | | | $ | 18,817,530 | | |
The temporary differences between book basis and tax basis distributable earnings are primarily due to losses disallowed and recognized on wash sales and tax adjustments related to other investments.
To the extent the Fund's net realized capital gains, if any, can be offset by capital loss carryforwards, it is the policy of the Fund not to distribute such gains. Capital loss carryforward rules allow for RICs to carry forward capital losses indefinitely and to retain the character of capital loss carryforwards as short-term or long-term. As determined at December 31, 2020, the Fund had unused capital loss carryforwards available for federal income tax purposes to offset future net realized capital gains, if any, as follows:
| | | Capital Loss Carryforwards | |
| | | Long-Term | | Short-Term | |
| | | | | $ | 10,175,125 | | | $ | — | | |
6 Distributions to shareholders: The Fund may earn income, net of expenses, daily on its investments. Distributions from net investment income and net realized capital gains, if any, are generally distributed once a year (usually in October) and are recorded on the ex-date.
It is the policy of the Fund to pass through to its shareholders substantially all real estate investment trust ("REIT") distributions and other income it receives, less operating expenses. The distributions the Fund receives from
14
REITs are generally composed of income, capital gains, and/or return of REIT capital, but the REITs do not report this information to the Fund until the following calendar year. For the year ended December 31, 2020, the character of distributions, if any, paid to shareholders of the Fund disclosed within the Statements of Changes in Net Assets is based on estimates made at that time. Based on past experience it is possible that a portion of the Fund's distributions during the current fiscal year, if any, will be considered tax return of capital, but the actual amount of the tax return of capital, if any, is not determinable until after the Fund's fiscal year-end. After calendar year-end, when the Fund learns the nature of the distributions paid by REITs during that year, distributions previously identified as income are often recharacterized as return of capital and/or capital gain. After all applicable REITs have informed the Fund of the actual breakdown of distributions paid to the Fund during its fiscal year, estimates previously recorded are adjusted to reflect actual results. As a result, the composition of the Fund's distributions as reported herein may differ from the final composition determined after calendar year-end and reported to Fund shareholders on IRS Form 1099-DIV.
7 Foreign taxes: Foreign taxes withheld, if any, represent amounts withheld by foreign tax authorities, net of refunds recoverable.
8 Expense allocation: Certain expenses are applicable to multiple funds within the complex of related investment companies. Expenses directly attributable to a fund are charged to that fund. Expenses of the Trust that are not directly attributable to a particular series of the Trust (e.g., the Fund) are allocated among the series of the Trust, on the basis of relative net assets, except where a more appropriate allocation of expenses to each of the series can otherwise be made fairly. Expenses borne by the complex of related investment companies, which includes open-end and closed-end investment companies for which NBIA serves as investment manager, that are not directly attributable to a particular investment company in the complex (e.g., the Trust) or series thereof are allocated among the investment companies in the complex or series thereof on the basis of relative net assets, except where a more appropriate allocation of expenses to each of the investment companies in the complex or series thereof can otherwise be made fairly. The Fund's expenses (other than those specific to each class) are allocated proportionally each day among its classes based upon the relative net assets of each class.
9 Investments in foreign securities: Investing in foreign securities may involve sovereign and other risks, in addition to the credit and market risks normally associated with domestic securities. These additional risks include the possibility of adverse political and economic developments (including political instability, nationalization, expropriation, or confiscatory taxation) and the potentially adverse effects of unavailability of public information regarding issuers, less governmental supervision and regulation of financial markets, reduced liquidity of certain financial markets, and the lack of uniform accounting, auditing, and financial reporting standards or the application of standards that are different or less stringent than those applied in the United States. Foreign securities also may experience greater price volatility, higher rates of inflation, and delays in settlement.
10 Investment company securities and exchange-traded funds: The Fund may invest in shares of other registered investment companies, including exchange-traded funds ("ETFs"), within the limitations prescribed by (a) the 1940 Act, (b) the exemptive order from the Securities and Exchange Commission ("SEC") that permits the Fund to invest in both affiliated and unaffiliated investment companies, including ETFs, in excess of the limits in Section 12(d)(1)(A) of the 1940 Act, subject to the terms and conditions of such order, or (c) the ETF's exemptive order or other relief. Some ETFs seek to track the performance of a particular market index. These indices include both broad-based market indices and more narrowly-based indices, including those relating to particular sectors, markets, regions or industries. However, some ETFs have an actively-managed investment objective. ETF shares are traded like traditional equity securities on a national securities exchange or NASDAQ. The Fund will indirectly bear its proportionate share of any management fees and other expenses paid by such other investment companies, which will decrease returns.
11 Securities lending: The Fund, using State Street Bank and Trust Company ("State Street") as its lending agent, may loan securities to qualified brokers and dealers in exchange for negotiated lender's fees. These fees, if any, would be disclosed within the Statement of Operations under the caption "Income from securities loaned-net" and are net of expenses retained by State Street as compensation for its services as lending agent.
15
The initial cash collateral received by the Fund at the beginning of each transaction shall have a value equal to at least 102% of the prior day's market value of the loaned securities (105% in the case of international securities). Thereafter, the value of the cash collateral is monitored on a daily basis, and cash collateral is moved daily between a counterparty and the Fund until the close of the transaction. The Fund may only receive collateral in the form of cash (U.S. dollars). Cash collateral is generally invested in a money market fund registered under the 1940 Act that is managed by an affiliate of State Street. The risks associated with lending portfolio securities include, but are not limited to, possible delays in receiving additional collateral or in the recovery of the loaned securities. Any increase or decrease in the fair value of the securities loaned and any interest earned or dividends paid or owed on those securities during the term of the loan would accrue to the Fund.
During the year ended December 31, 2020, the Fund did not participate in securities lending.
12 Indemnifications: Like many other companies, the Trust's organizational documents provide that its officers ("Officers") and trustees ("Trustees") are indemnified against certain liabilities arising out of the performance of their duties to the Trust. In addition, both in some of its principal service contracts and in the normal course of its business, the Trust enters into contracts that provide indemnifications to other parties for certain types of losses or liabilities. The Trust's maximum exposure under these arrangements is unknown as this could involve future claims against the Trust.
13 Other: All net investment income and realized and unrealized capital gains and losses of the Fund are allocated, on the basis of relative net assets, pro rata among its respective classes.
14 Other matters—Coronavirus: The outbreak of the novel coronavirus in many countries, which is a rapidly evolving situation, has, among other things, disrupted global travel and supply chains, and has adversely impacted global commercial activity, the transportation industry and commodity prices in the energy sector. The impact of this virus has negatively affected and may continue to affect the economies of many nations, individual companies and the global securities and commodities markets, including liquidity and volatility, in ways that cannot necessarily be foreseen at the present time. The rapid development and fluidity of this situation precludes any prediction as to its ultimate impact, which may have a continued adverse effect on economic and market conditions and trigger a period of global economic slowdown. Such conditions (which may be across industries, sectors or geographies) have impacted and may continue to impact the issuers of the securities held by the Fund.
Note B—Investment Management Fees, Administration Fees, Distribution Arrangements, and Other Transactions with Affiliates:
The Fund retains NBIA as its investment manager under a Management Agreement. For such investment management services, the Fund pays NBIA an investment management fee at the annual rate of 0.55% of the first $250 million of the Fund's average daily net assets, 0.525% of the next $250 million, 0.50% of the next $250 million, 0.475% of the next $250 million, 0.45% of the next $500 million, 0.425% of the next $2.5 billion, and 0.40% of average daily net assets in excess of $4 billion. Accordingly, for the year ended December 31, 2020, the investment management fee pursuant to the Management Agreement was equivalent to an annual effective rate of 0.55% of the Fund's average daily net assets.
The Fund retains NBIA as its administrator under an Administration Agreement. Each class pays NBIA an administration fee at the annual rate of 0.30% of its average daily net assets under this agreement. Additionally, NBIA retains State Street as its sub-administrator under a Sub-Administration Agreement. NBIA pays State Street a fee for all services received under the Sub-Administration Agreement.
NBIA has contractually agreed to waive fees and/or reimburse the Fund's Class I and Class S shares so that the total annual operating expenses of those classes do not exceed the expense limitations as detailed in the following table. These undertakings exclude interest, taxes, transaction costs, brokerage commissions, acquired fund fees and expenses, extraordinary expenses, and dividend and interest expenses relating to short sales, if any (commitment
16
fees relating to borrowings are treated as interest for purposes of this exclusion) ("annual operating expenses"); consequently, net expenses may exceed the contractual expense limitations. The Fund has agreed that each of its classes will repay NBIA for fees and expenses waived or reimbursed for that class provided that repayment does not cause that class's annual operating expenses to exceed its contractual expense limitation in place at the time the fees and expenses were waived or reimbursed, or the expense limitation in place at the time the Fund repays NBIA, whichever is lower. Any such repayment must be made within three years after the year in which NBIA incurred the expense.
During the year ended December 31, 2020, there was no repayment to NBIA under these agreements.
At December 31, 2020, the Fund's contingent liabilities to NBIA under the agreements were as follows:
| | | | | | | Expenses Reimbursed in
Year Ended December 31, | |
| | | | | | | 2018 | | 2019 | | 2020 | |
| | | | | | | Subject to Repayment until December 31, | |
Class | | Contractual
Expense
Limitation(a) | | Expiration | | 2021 | | 2022 | | 2023 | |
Class I | | | 1.50 | % | | 12/31/23 | | $ | — | | | $ | — | | | $ | — | | |
Class S | | | 1.25 | % | | 12/31/23 | | | — | | | | 3,712 | | | | 9,794 | | |
(a) Expense limitation per annum of the respective class's average daily net assets.
Neuberger Berman BD LLC (the "Distributor") is the Fund's "principal underwriter" within the meaning of the 1940 Act. It acts as agent in arranging for the sale of the Fund's Class I shares without sales commission or other compensation and bears all advertising and promotion expenses incurred in the sale of those shares. The Board adopted a non-fee distribution plan for the Fund's Class I shares.
The Board has adopted a distribution and shareholder services plan (the "Plan") for Class S shares pursuant to Rule 12b-1 under the 1940 Act. The Plan provides that, as compensation for administrative and other services related to the sale and distribution of Class S shares, and ongoing services provided to investors in the class, the Distributor receives from Class S a fee at the annual rate of 0.25% of Class S's average daily net assets. The Distributor may pay a portion of the proceeds from the 12b-1 fee to institutions that provide such services, including insurance companies or their affiliates and qualified plan administrators ("intermediaries") for services they provide respecting the Fund to current and prospective variable contract owners and qualified plan participants that invest in the Fund through the intermediaries. Those institutions may use the payments for, among other purposes, compensating employees engaged in sales and/or shareholder servicing. The amount of fees paid by the class during any year may be more or less than the cost of distribution and other services provided to the class. FINRA rules limit the amount of annual distribution fees that may be paid by a mutual fund and impose a ceiling on the cumulative distribution fees paid. The Plan complies with those rules.
Note C—Securities Transactions:
During the year ended December 31, 2020, there were purchase and sale transactions of long-term securities of $37,826,353 and $44,690,843 respectively.
During the year ended December 31, 2020, no brokerage commissions on securities transactions were paid to affiliated brokers.
17
Note D—Fund Share Transactions:
Share activity for the years ended December 31, 2020, and December 31, 2019, was as follows:
| | | For the Year Ended December 31, 2020 | | For the Year Ended December 31, 2019 | |
| | | Shares Sold | | Shares Issued on
Reinvestment of
Dividends and
Distributions | | Shares
Redeemed | | Total | | Shares Sold | | Shares Issued on
Reinvestment of
Dividends and
Distributions | | Shares
Redeemed | | Total | |
Class I | | | 1,305,068 | | | | 73,102 | | | | (1,275,038 | ) | | | 103,132 | | | | 819,641 | | | | 807,417 | | | | (1,732,838 | ) | | | (105,780 | ) | |
Class S | | | 670,610 | | | | 17,642 | | | | (839,992 | ) | | | (151,740 | ) | | | 197,894 | | | | 256,380 | | | | (604,590 | ) | | | (150,316 | ) | |
Note E—Line of Credit:
At December 31, 2020, the Fund was a participant in a syndicated committed, unsecured $700,000,000 line of credit (the "Credit Facility"), to be used only for temporary or emergency purposes. Series of other investment companies managed by NBIA also participate in this line of credit on substantially the same terms. Interest is charged on borrowings under this Credit Facility at the highest of (a) a federal funds effective rate plus 1.00% per annum, (b) a Eurodollar rate for a one month period plus 1.00% per annum, and (c) an overnight bank funding rate plus 1.00% per annum. The Credit Facility has an annual commitment fee of 0.15% per annum of the available line of credit, which is paid quarterly. The Fund has agreed to pay its pro rata share of the annual commitment fee, based on the ratio of its individual net assets to the net assets of all participants at the time the fee is due, and interest charged on any borrowing made by the Fund and other costs incurred by the Fund. Because several mutual funds participate in the Credit Facility, there is no assurance that the Fund will have access to all or any part of the $700,000,000 at any particular time. There were no loans outstanding under the Credit Facility at December 31, 2020. During the year ended December 31, 2020, the Fund did not utilize the Credit Facility.
18
Mid Cap Intrinsic Value Portfolio
The following tables include selected data for a share outstanding throughout each year and other performance information derived from the Financial Statements. Amounts that do not round to $0.01 or $(0.01) per share are presented as $0.00 or $(0.00), respectively. Ratios that do not round to 0.01% or (0.01)% are presented as 0.00% or (0.00)%, respectively. A "—" indicates that the line item was not applicable in the corresponding period.
Class I | |
| | | Year Ended December 31, | |
| | | 2020 | | 2019 | | 2018 | | 2017 | | 2016 | |
Net Asset Value, Beginning of Year | | $ | 16.01 | | | $ | 15.69 | | | $ | 19.58 | | | $ | 16.91 | | | $ | 15.85 | | |
Income From Investment Operations: | |
| Net Investment Income/(Loss)@ | | | 0.14 | | | | 0.21 | | | | 0.15 | | | | 0.14 | | | | 0.18 | | |
Net Gains or Losses on Securities
(both realized and unrealized) | | | (0.59 | ) | | | 2.31 | | | | (3.00 | ) | | | 2.69 | | | | 2.27 | | |
Total From Investment Operations | | | (0.45 | ) | | | 2.52 | | | | (2.85 | ) | | | 2.83 | | | | 2.45 | | |
Less Distributions From: | |
Net Investment Income | | | (0.16 | ) | | | (0.13 | ) | | | (0.13 | ) | | | (0.16 | ) | | | (0.11 | ) | |
Net Realized Capital Gains | | | — | | | | (2.07 | ) | | | (0.91 | ) | | | — | | | | (1.28 | ) | |
Total Distributions | | | (0.16 | ) | | | (2.20 | ) | | | (1.04 | ) | | | (0.16 | ) | | | (1.39 | ) | |
Net Asset Value, End of Year | | $ | 15.40 | | | $ | 16.01 | | | $ | 15.69 | | | $ | 19.58 | | | $ | 16.91 | | |
| Total Return† | | | (2.62 | )% | | | 16.74 | %^ | | | (15.28 | )%^ | | | 16.74 | %^‡ | | | 16.17 | %^ | |
Ratios/Supplemental Data | |
Net Assets, End of Year (in millions) | | $ | 92.0 | | | $ | 94.0 | | | $ | 93.8 | | | $ | 119.1 | | | $ | 104.7 | | |
| Ratio of Gross Expenses to Average Net Assets# | | | 1.03 | % | | | 1.01 | % | | | 1.00 | % | | | 0.99 | % | | | 1.05 | % | |
Ratio of Net Expenses to Average Net Assets | | | 1.03 | % | | | 1.01 | % | | | 1.00 | % | | | 0.97 | %ß | | | 1.05 | % | |
Ratio of Net Investment Income/(Loss) to Average
Net Assets | | | 1.12 | % | | | 1.22 | % | | | 0.76 | % | | | 0.79 | %ß | | | 1.12 | % | |
Portfolio Turnover Rate | | | 35 | % | | | 14 | % | | | 34 | % | | | 35 | % | | | 36 | % | |
See Notes to Financial Highlights
19
Financial Highlights (cont'd)
Class S | |
| | | Year Ended December 31, | |
| | | 2020 | | 2019 | | 2018 | | 2017 | | 2016 | |
Net Asset Value, Beginning of Year | | $ | 18.68 | | | $ | 17.95 | | | $ | 22.22 | | | $ | 19.19 | | | $ | 17.78 | | |
Income From Investment Operations: | |
| Net Investment Income/(Loss)@ | | | 0.13 | | | | 0.19 | | | | 0.11 | | | | 0.10 | | | | 0.17 | | |
Net Gains or Losses on Securities
(both realized and unrealized) | | | (0.68 | ) | | | 2.66 | | | | (3.41 | ) | | | 3.03 | | | | 2.57 | | |
Total From Investment Operations | | | (0.55 | ) | | | 2.85 | | | | (3.30 | ) | | | 3.13 | | | | 2.74 | | |
Less Distributions From: | |
Net Investment Income | | | (0.11 | ) | | | (0.05 | ) | | | (0.06 | ) | | | (0.10 | ) | | | (0.05 | ) | |
Net Realized Capital Gains | | | — | | | | (2.07 | ) | | | (0.91 | ) | | | — | | | | (1.28 | ) | |
Total Distributions | | | (0.11 | ) | | | (2.12 | ) | | | (0.97 | ) | | | (0.10 | ) | | | (1.33 | ) | |
Net Asset Value, End of Year | | $ | 18.02 | | | $ | 18.68 | | | $ | 17.95 | | | $ | 22.22 | | | $ | 19.19 | | |
| Total Return† | | | (2.83 | )% | | | 16.43 | %^ | | | (15.48 | )%^ | | | 16.35 | %^‡ | | | 15.98 | %^ | |
Ratios/Supplemental Data | |
Net Assets, End of Year (in millions) | | $ | 39.5 | | | $ | 43.8 | | | $ | 44.8 | | | $ | 59.3 | | | $ | 56.9 | | |
| Ratio of Gross Expenses to Average Net Assets# | | | 1.28 | % | | | 1.26 | % | | | 1.25 | % | | | 1.25 | % | | | 1.30 | % | |
Ratio of Net Expenses to Average Net Assets | | | 1.25 | % | | | 1.25 | % | | | 1.25 | %§ | | | 1.25 | %ߧ | | | 1.25 | % | |
Ratio of Net Investment Income/(Loss) to Average
Net Assets | | | 0.89 | % | | | 0.98 | % | | | 0.49 | % | | | 0.49 | %ß | | | 0.91 | % | |
Portfolio Turnover Rate | | | 35 | % | | | 14 | % | �� | | 34 | % | | | 35 | % | | | 36 | % | |
See Notes to Financial Highlights
20
Notes to Financial Highlights Mid Cap Intrinsic Value Portfolio
@ Calculated based on the average number of shares outstanding during each fiscal period.
‡ In May 2016, the Fund's custodian, State Street, announced that it had identified inconsistencies in the way in which the Fund was invoiced for categories of expenses, particularly those deemed "out-of-pocket" costs, from 1998 through November 2015, and refunded to the Fund certain expenses, plus interest, determined to be payable to the Fund for the period in question. These amounts were refunded to the Fund by State Street during the year ended December 31, 2017. These amounts had no impact on the Fund's total return for the year ended December 31, 2017.
# Represents the annualized ratios of net expenses to average daily net assets if Management had not reimbursed certain expenses and/or waived a portion of the investment management fee and /or if the Fund had not received refunds, plus interest, from State Street noted in ‡ above for custodian out-of-pocket expenses previously paid during the year ended December 31, 2017. Management did not reimburse or waive fees during the fiscal periods shown for Class I.
ß The custodian expenses refund noted in ‡ above is non-recurring and is included in these ratios. Had the Fund not received the refund, the annualized ratio of net expenses to average net assets and the annualized ratio of net investment income/(loss) to average net assets would have been:
| | | Ratio of Net
Expenses to
Average Net
Assets
Year Ended
December 31,
2017 | | Ratio of Net
Investment
Income/(Loss)
to Average
Net Assets
Year Ended
December 31,
2017 | |
Class I | | | 0.99 | % | | | 0.77 | % | |
Class S | | | 1.25 | % | | | 0.48 | % | |
† Total return based on per share NAV reflects the effects of changes in NAV on the performance of the Fund during each fiscal period. Returns assume income dividends and other distributions, if any, were reinvested. Results represent past performance and do not indicate future results. Current returns may be lower or higher than the performance data quoted. Investment returns and principal will fluctuate and shares, when redeemed, may be worth more or less than original cost. Total return would have been lower if Management had not reimbursed and/or waived certain expenses. Total return would have been higher if Management had not recouped previously reimbursed and/or waived expenses. The total return information shown does not reflect charges and other expenses that apply to the separate accounts or the related insurance policies or other qualified pension or retirement plans, and the inclusion of these charges and other expenses would reduce the total return for all fiscal periods shown.
^ The class action proceeds received in 2019, 2018, 2017 and 2016 had no impact on the Fund's total return for the years ended December 31, 2019, 2018, 2017 and 2016, respectively.
§ After repayment of expenses previously reimbursed and/or fees previously waived by Management, as applicable. Had the Fund not made such repayments, the annualized ratios of net expenses to average net assets would have been:
| | | Year Ended
December 31,
2018 | | Year Ended
December 31,
2017 | |
Class S | | | 1.25 | % | | | 1.24 | % | |
21
Report of Independent Registered Public Accounting Firm
To the Shareholders of
Mid Cap Intrinsic Value Portfolio and
Board of Trustees of the Neuberger Berman Advisers Management Trust
Opinion on the Financial Statements
We have audited the accompanying statement of assets and liabilities of Mid Cap Intrinsic Value Portfolio (the "Portfolio") (one of the portfolios constituting Neuberger Berman Advisers Management Trust (the "Trust")), including the schedule of investments, as of December 31, 2020, and the related statement of operations for the year then ended, the statements of changes in net assets for each of the two years in the period then ended, the financial highlights for each of the five years in the period then ended and the related notes (collectively referred to as the "financial statements"). In our opinion, the financial statements present fairly, in all material respects, the financial position of the Portfolio (one of the portfolios constituting Neuberger Berman Advisers Management Trust) at December 31, 2020, the results of its operations for the year then ended, the changes in its net assets for each of the two years in the period then ended and its financial highlights for each of the five years in the period then ended, in conformity with U.S. generally accepted accounting principles.
Basis for Opinion
These financial statements are the responsibility of the Trust's management. Our responsibility is to express an opinion on the Portfolio's financial statements based on our audits. We are a public accounting firm registered with the Public Company Accounting Oversight Board (United States) ("PCAOB") and are required to be independent with respect to the Trust in accordance with the U.S. federal securities laws and the applicable rules and regulations of the Securities and Exchange Commission and the PCAOB.
We conducted our audits in accordance with the standards of the PCAOB. Those standards require that we plan and perform the audit to obtain reasonable assurance about whether the financial statements are free of material misstatement, whether due to error or fraud. The Trust is not required to have, nor were we engaged to perform, an audit of the Trust's internal control over financial reporting. As part of our audits, we are required to obtain an understanding of internal control over financial reporting, but not for the purpose of expressing an opinion on the effectiveness of the Trust's internal control over financial reporting. Accordingly, we express no such opinion.
Our audits included performing procedures to assess the risks of material misstatement of the financial statements, whether due to error or fraud, and performing procedures that respond to those risks. Such procedures included examining, on a test basis, evidence regarding the amounts and disclosures in the financial statements. Our procedures included confirmation of securities owned as of December 31, 2020, by correspondence with the custodian. Our audits also included evaluating the accounting principles used and significant estimates made by management, as well as evaluating the overall presentation of the financial statements. We believe that our audits provide a reasonable basis for our opinion.
We have served as the auditor of one or more Neuberger Berman investment companies since 1954.
Boston, Massachusetts
February 12, 2021
22
The following tables set forth information concerning the Trustees and Officers of the Fund. All persons named as Trustees and Officers also serve in similar capacities for other funds administered or managed by Neuberger Berman Investment Advisers LLC ("NBIA"). The Fund's Statement of Additional Information includes additional information about the Trustees as of the time of the Fund's most recent public offering and is available upon request, without charge, by calling (800) 877-9700.
Information about the Board of Trustees
Name, (Year of Birth),
and Address(1) | | Position(s)
and Length of
Time Served(2) | | Principal Occupation(s)(3) | | Number of
Funds in Fund
Complex
Overseen by
Fund Trustee | | Other Directorships
Held Outside Fund
Complex by Fund
Trustee(3) | |
Independent Fund Trustees | |
Michael J. Cosgrove (1949) | | Trustee since 2015 | | President, Carragh Consulting USA, since 2014; formerly, Executive, General Electric Company, 1970 to 2014, including President, Mutual Funds and Global Investment Programs, GE Asset Management, 2011 to 2014, President and Chief Executive Officer, Mutual Funds and Intermediary Business, GE Asset Management, 2007 to 2011, President, Institutional Sales and Marketing, GE Asset Management, 1998 to 2007, and Chief Financial Officer, GE Asset Management, and Deputy Treasurer, GE Company, 1988 to 1993. | |
| 46 |
| | Director, America Press, Inc. (not-for-profit Jesuit publisher), since 2015; formerly, Director, Fordham University, 2001 to 2018; formerly, Director, The Gabelli Go Anywhere Trust, June 2015 to June 2016; formerly, Director, Skin Cancer Foundation (not-for-profit), 2006 to 2015; formerly, Director, GE Investments Funds, Inc., 1997 to 2014; formerly, Trustee, GE Institutional Funds, 1997 to 2014; formerly, Director, GE Asset Management, 1988 to 2014; formerly, Director, Elfun Trusts, 1988 to 2014; formerly, Trustee, GE Pension & Benefit Plans, 1988 to 2014; formerly, Member of Board of Governors, Investment Company Institute. | |
23
Name, (Year of Birth),
and Address(1) | | Position(s)
and Length of
Time Served(2) | | Principal Occupation(s)(3) | | Number of
Funds in Fund
Complex
Overseen by
Fund Trustee | | Other Directorships
Held Outside Fund
Complex by Fund
Trustee(3) | |
Marc Gary (1952) | | Trustee since 2015 | | Executive Vice Chancellor and Chief Operating Officer, Jewish Theological Seminary, since 2012; formerly, Executive Vice President and General Counsel, Fidelity Investments, 2007 to 2012; formerly, Executive Vice President and General Counsel, BellSouth Corporation, 2004 to 2007; formerly, Vice President and Associate General Counsel, BellSouth Corporation, 2000 to 2004; formerly, Associate, Partner, and National Litigation Practice Co-Chair, Mayer, Brown LLP, 1981 to 2000; formerly, Associate Independent Counsel, Office of Independent Counsel, 1990 to 1992. | |
| 46 |
| | Director, UJA Federation of Greater New York, since 2019; Trustee, Jewish Theological Seminary, since 2015; Director, Legility, Inc. (privately held for-profit company), since 2012; Director, Lawyers Committee for Civil Rights Under Law (not-for-profit), since 2005; formerly, Director, Equal Justice Works (not-for-profit), 2005 to 2014; formerly, Director, Corporate Counsel Institute, Georgetown University Law Center, 2007 to 2012; formerly, Director, Greater Boston Legal Services (not-for-profit), 2007 to 2012. | |
24
Name, (Year of Birth),
and Address(1) | | Position(s)
and Length of
Time Served(2) | | Principal Occupation(s)(3) | | Number of
Funds in Fund
Complex
Overseen by
Fund Trustee | | Other Directorships
Held Outside Fund
Complex by Fund
Trustee(3) | |
Martha C. Goss (1949) | | Trustee since 2007 | | President, Woodhill Enterprises Inc./Chase Hollow Associates LLC (personal investment vehicle), since 2006; formerly, Consultant, Resources Global Professionals (temporary staffing), 2002 to 2006; formerly, Chief Financial Officer, Booz-Allen & Hamilton, Inc., 1995 to 1999; formerly, Enterprise Risk Officer, Prudential Insurance, 1994 to1995; formerly, President, Prudential Asset Management Company, 1992 to 1994; formerly, President, Prudential Power Funding (investments in electric and gas utilities and alternative energy projects), 1989 to 1992; formerly, Treasurer, Prudential Insurance Company, 1983 to 1989. | |
| 46 |
| | Director, American Water (water utility), since 2003; Director, Allianz Life of New York (insurance), since 2005; Director, Berger Group Holdings, Inc. (engineering consulting firm), since 2013; Director, Financial Women's Association of New York (not-for-profit association), since 2003; Trustee Emerita, Brown University, since 1998; Director, Museum of American Finance (not-for-profit), since 2013; formerly, Non-Executive Chair and Director, Channel Reinsurance (financial guaranty reinsurance), 2006 to 2010; formerly, Director, Ocwen Financial Corporation (mortgage servicing), 2005 to 2010; formerly, Director, Claire's Stores, Inc. (retailer), 2005 to 2007; formerly, Director, Parsons Brinckerhoff Inc. (engineering consulting firm), 2007 to 2010; formerly, Director, Bank Leumi (commercial bank), 2005 to 2007; formerly, Advisory Board Member, Attensity (software developer), 2005 to 2007. | |
25
Name, (Year of Birth),
and Address(1) | | Position(s)
and Length of
Time Served(2) | | Principal Occupation(s)(3) | | Number of
Funds in Fund
Complex
Overseen by
Fund Trustee | | Other Directorships
Held Outside Fund
Complex by Fund
Trustee(3) | |
Michael M. Knetter (1960) | | Trustee since 2007 | | President and Chief Executive Officer, University of Wisconsin Foundation, since 2010; formerly, Dean, School of Business, University of Wisconsin—Madison; formerly, Professor of International Economics and Associate Dean, Amos Tuck School of Business—Dartmouth College, 1998 to 2002. | |
| 46 |
| | Director, 1 William Street Credit Income Fund, since 2018; Board Member, American Family Insurance (a mutual company, not publicly traded), since March 2009; formerly, Trustee, Northwestern Mutual Series Fund, Inc., 2007 to 2011; formerly, Director, Wausau Paper, 2005 to 2011; formerly, Director, Great Wolf Resorts, 2004 to 2009. | |
Deborah C. McLean (1954) | | Trustee since 2015 | | Member, Circle Financial Group (private wealth management membership practice), since 2011; Managing Director, Golden Seeds LLC (an angel investing group), since 2009; Adjunct Professor, Columbia University School of International and Public Affairs, since 2008; formerly, Visiting Assistant Professor, Fairfield University, Dolan School of Business, Fall 2007; formerly, Adjunct Associate Professor of Finance, Richmond, The American International University in London, 1999 to 2007. | |
| 46 |
| | Board member, Norwalk Community College Foundation, since 2014; Dean's Advisory Council, Radcliffe Institute for Advanced Study, since 2014; formerly, Director and Treasurer, At Home in Darien (not-for-profit), 2012 to 2014; formerly, Director, National Executive Service Corps (not-for-profit), 2012 to 2013; formerly, Trustee, Richmond, The American International University in London, 1999 to 2013. | |
26
Name, (Year of Birth),
and Address(1) | | Position(s)
and Length of
Time Served(2) | | Principal Occupation(s)(3) | | Number of
Funds in Fund
Complex
Overseen by
Fund Trustee | | Other Directorships
Held Outside Fund
Complex by Fund
Trustee(3) | |
George W. Morriss (1947) | | Trustee since 2007 | | Adjunct Professor, Columbia University School of International and Public Affairs, since 2012; formerly, Executive Vice President and Chief Financial Officer, People's United Bank, Connecticut (a financial services company), 1991 to 2001. | |
| 46 |
| | Director, 1 William Street Credit Income Fund, since 2018; Director and Chair, Thrivent Church Loan and Income Fund, since 2018; formerly, Trustee, Steben Alternative Investment Funds, Steben Select Multi-Strategy Fund, and Steben Select Multi-Strategy Master Fund, 2013 to 2017; formerly, Treasurer, National Association of Corporate Directors, Connecticut Chapter, 2011 to 2015; formerly, Manager, Larch Lane Multi-Strategy Fund complex (which consisted of three funds), 2006 to 2011; formerly, Member, NASDAQ Issuers' Affairs Committee, 1995 to 2003. | |
Tom D. Seip (1950) | | Trustee since 2000; Chairman of the Board since 2008; formerly Lead Independent Trustee from 2006 to 2008 | | Formerly, Managing Member, Ridgefield Farm LLC (a private investment vehicle), 2004 to 2016; formerly, President and CEO, Westaff, Inc. (temporary staffing), May 2001 to January 2002; formerly, Senior Executive, The Charles Schwab Corporation, 1983 to 1998, including Chief Executive Officer, Charles Schwab Investment Management, Inc.; Trustee, Schwab Family of Funds and Schwab Investments, 1997 to 1998; and Executive Vice President-Retail Brokerage, Charles Schwab & Co., Inc., 1994 to 1997. | |
| 46 |
| | Formerly, Director, H&R Block, Inc. (tax services company), 2001 to 2018; formerly, Director, Talbot Hospice Inc., 2013 to 2016; formerly, Chairman, Governance and Nominating Committee, H&R Block, Inc., 2011 to 2015; formerly, Chairman, Compensation Committee, H&R Block, Inc., 2006 to 2010; formerly, Director, Forward Management, Inc. (asset management company), 1999 to 2006. | |
27
Name, (Year of Birth),
and Address(1) | | Position(s)
and Length of
Time Served(2) | | Principal Occupation(s)(3) | | Number of
Funds in Fund
Complex
Overseen by
Fund Trustee | | Other Directorships
Held Outside Fund
Complex by Fund
Trustee(3) | |
James G. Stavridis (1955) | | Trustee since 2015 | | Operating Executive, The Carlyle Group, since 2018; Commentator, NBC News, since 2015; formerly, Dean, Fletcher School of Law and Diplomacy, Tufts University, 2013 to 2018; formerly, Admiral, United States Navy, 1976 to 2013, including Supreme Allied Commander, NATO and Commander, European Command, 2009 to 2013, and Commander, United States Southern Command, 2006 to 2009. | |
| 46 |
| | Director, American Water (water utility), since 2018; Director, NFP Corp. (insurance broker and consultant), since 2017; Director, U.S. Naval Institute, since 2014; Director, Onassis Foundation, since 2014; Director, BMC Software Federal, LLC, since 2014; Director, Vertical Knowledge, LLC, since 2013; formerly, Director, Navy Federal Credit Union, 2000-2002. | |
28
Name, (Year of Birth),
and Address(1) | | Position(s)
and Length of
Time Served(2) | | Principal Occupation(s)(3) | | Number of
Funds in Fund
Complex
Overseen by
Fund Trustee | | Other Directorships
Held Outside Fund
Complex by Fund
Trustee(3) | |
Candace L. Straight (1947) | | Trustee since 1999 | | Private investor and consultant specializing in the insurance industry; formerly, Advisory Director, Securitas Capital LLC (a global private equity investment firm dedicated to making investments in the insurance sector), 1998 to 2003. | |
| 46 |
| | Director, ERA Coalition (not-for-profit), 2019 to 2020; Director, Re belle Media (a privately held TV and film production company), since 2018; formerly, Public Member, Board of Governors and Board of Trustees, Rutgers University, 2011 to 2016; formerly, Director, Montpelier Re Holdings Ltd. (reinsurance company), 2006 to 2015; formerly, Director, National Atlantic Holdings Corporation (property and casualty insurance company), 2004 to 2008; formerly, Director, The Proformance Insurance Company (property and casualty insurance company), 2004 to 2008; formerly, Director, Providence Washington Insurance Company (property and casualty insurance company), 1998 to 2006; formerly, Director, Summit Global Partners (insurance brokerage firm), 2000 to 2005. | |
Peter P. Trapp (1944) | | Trustee since 1984 | | Retired; formerly, Regional Manager for Mid-Southern Region, Ford Motor Credit Company, September 1997 to 2007; formerly, President, Ford Life Insurance Company, April 1995 to August 1997. | |
| 46 |
| | None. | |
29
Name, (Year of Birth),
and Address(1) | | Position(s)
and Length of
Time Served(2) | | Principal Occupation(s)(3) | | Number of
Funds in Fund
Complex
Overseen by
Fund Trustee | | Other Directorships
Held Outside Fund
Complex by Fund
Trustee(3) | |
Fund Trustees who are "Interested Persons" | |
Joseph V. Amato* (1962) | | Chief Executive Officer and President since 2018 and Trustee since 2009 | | President and Director, Neuberger Berman Group LLC, since 2009; President and Chief Executive Officer, Neuberger Berman BD LLC and Neuberger Berman Holdings LLC (including its predecessor, Neuberger Berman Inc.), since 2007; Chief Investment Officer (Equities) and President (Equities), NBIA (formerly, Neuberger Berman Fixed Income LLC and including predecessor entities), since 2007, and Board Member of NBIA since 2006; formerly, Global Head of Asset Management of Lehman Brothers Holdings Inc.'s ("LBHI") Investment Management Division, 2006 to 2009; formerly, member of LBHI's Investment Management Division's Executive Management Committee, 2006 to 2009; formerly, Managing Director, Lehman Brothers Inc. ("LBI"), 2006 to 2008; formerly, Chief Recruiting and Development Officer, LBI, 2005 to 2006; formerly, Global Head of LBI's Equity Sales and a Member of its Equities Division Executive Committee, 2003 to 2005; President and Chief Executive Officer, ten registered investment companies for which NBIA acts as investment manager and/or administrator. | |
| 46 |
| | Member of Board of Advisors, McDonough School of Business, Georgetown University, since 2001; Member of New York City Board of Advisors, Teach for America, since 2005; Trustee, Montclair Kimberley Academy (private school), since 2007; Member of Board of Regents, Georgetown University, since 2013. | |
(1) The business address of each listed person is 1290 Avenue of the Americas, New York, NY 10104.
30
(2) Pursuant to the Trust's Amended and Restated Trust Instrument, subject to any limitations on the term of service imposed by the By-Laws or any retirement policy adopted by the Fund Trustees, each Fund Trustee shall hold office for life or until his or her successor is elected or the Trust terminates; except that (a) any Fund Trustee may resign by delivering a written resignation; (b) any Fund Trustee may be removed with or without cause at any time by a written instrument signed by at least two-thirds of the other Fund Trustees; (c) any Fund Trustee who requests to be retired, or who has become unable to serve, may be retired by a written instrument signed by a majority of the other Fund Trustees; and (d) any Fund Trustee may be removed at any shareholder meeting by a vote of at least two-thirds of the outstanding shares.
(3) Except as otherwise indicated, each individual has held the positions shown during at least the last five years.
* Indicates a Fund Trustee who is an "interested person" within the meaning of the 1940 Act. Mr. Amato is an interested person of the Trust by virtue of the fact that he is an officer of NBIA and/or its affiliates.
31
Information about the Officers of the Trust
Name, (Year of Birth),
and Address(1) | | Position(s)
and Length of
Time Served(2) | | Principal Occupation(s)(3) | |
Claudia A. Brandon (1956) | | Executive Vice President since 2008 and Secretary since 1985 | | Senior Vice President, Neuberger Berman, since 2007 and Employee since 1999; Senior Vice President, NBIA, since 2008 and Assistant Secretary since 2004; formerly, Vice President, Neuberger Berman, 2002 to 2006; formerly, Vice President—Mutual Fund Board Relations, NBIA, 2000 to 2008; formerly, Vice President, NBIA, 1986 to 1999 and Employee, 1984 to 1999; Executive Vice President and Secretary, twenty-nine registered investment companies for which NBIA acts as investment manager and/or administrator. | |
Agnes Diaz (1971) | | Vice President since 2013 | | Senior Vice President, Neuberger Berman, since 2012; Senior Vice President, NBIA, since 2012 and Employee since 1996; formerly, Vice President, Neuberger Berman, 2007 to 2012; Vice President, ten registered investment companies for which NBIA acts as investment manager and/or administrator. | |
Anthony DiBernardo (1979) | | Assistant Treasurer since 2011 | | Senior Vice President, Neuberger Berman, since 2014; Senior Vice President, NBIA, since 2014, and Employee since 2003; formerly, Vice President, Neuberger Berman, 2009 to 2014; Assistant Treasurer, ten registered investment companies for which NBIA acts as investment manager and/or administrator. | |
Savonne L. Ferguson (1973) | | Chief Compliance Officer since 2018 | | Senior Vice President, Chief Compliance Officer (Mutual Funds) and Associate General Counsel, NBIA, since November 2018; formerly, Vice President T. Rowe Price Group, Inc. (2018), Vice President and Senior Legal Counsel, T. Rowe Price Associates, Inc. (2014-2018), Vice President and Director of Regulatory Fund Administration, PNC Capital Advisors, LLC (2009-2014), Secretary, PNC Funds and PNC Advantage Funds (2010-2014); Chief Compliance Officer, twenty-nine registered investment companies for which NBIA acts as investment manager and/or administrator. | |
Corey A. Issing (1978) | | Chief Legal Officer since 2016 (only for purposes of sections 307 and 406 of the Sarbanes-Oxley Act of 2002) | | General Counsel and Head of Compliance—Mutual Funds since 2016 and Managing Director, NBIA, since 2017; formerly, Associate General Counsel (2015 to 2016), Counsel (2007 to 2015), Senior Vice President (2013-2016), Vice President (2009-2013); Chief Legal Officer (only for purposes of sections 307 and 406 of the Sarbanes-Oxley Act of 2002), twenty-nine registered investment companies for which NBIA acts as investment manager and/or administrator. | |
Sheila R. James (1965) | | Assistant Secretary since 2002 | | Vice President, Neuberger Berman, since 2008 and Employee since 1999; Vice President, NBIA, since 2008; formerly, Assistant Vice President, Neuberger Berman, 2007; Employee, NBIA, 1991 to 1999; Assistant Secretary, twenty-nine registered investment companies for which NBIA acts as investment manager and/or administrator. | |
32
Name, (Year of Birth),
and Address(1) | | Position(s)
and Length of
Time Served(2) | | Principal Occupation(s)(3) | |
Brian Kerrane (1969) | | Chief Operating Officer since 2015 and Vice President since 2008 | | Managing Director, Neuberger Berman, since 2014; Chief Operating Officer—Mutual Funds and Managing Director, NBIA, since 2015; formerly, Senior Vice President, Neuberger Berman, 2006 to 2014; Vice President, NBIA, 2008 to 2015 and Employee since 1991; Chief Operating Officer, ten registered investment companies for which NBIA acts as investment manager and/or administrator; Vice President, twenty-nine registered investment companies for which NBIA acts as investment manager and/or administrator. | |
Anthony Maltese (1959) | | Vice President since 2015 | | Senior Vice President, Neuberger Berman, since 2014 and Employee since 2000; Senior Vice President, NBIA, since 2014; Vice President, ten registered investment companies for which NBIA acts as investment manager and/or administrator. | |
Josephine Marone (1963) | | Assistant Secretary since 2017 | | Senior Paralegal, Neuberger Berman, since 2007 and Employee since 2007; Assistant Secretary, twenty-nine registered investment companies for which NBIA acts as investment manager and/or administrator. | |
Owen F. McEntee, Jr. (1961) | | Vice President since 2008 | | Vice President, Neuberger Berman, since 2006; Vice President, NBIA, since 2006 and Employee since 1992; Vice President, ten registered investment companies for which NBIA acts as investment manager and/or administrator. | |
John M. McGovern (1970) | | Treasurer and Principal Financial and Accounting Officer since 2005 | | Senior Vice President, Neuberger Berman, since 2007; Senior Vice President, NBIA, since 2007 and Employee since 1993; formerly, Vice President, Neuberger Berman, 2004 to 2006; formerly, Assistant Treasurer, 2002 to 2005; Treasurer and Principal Financial and Accounting Officer, ten registered investment companies for which NBIA acts as investment manager and/or administrator. | |
Frank Rosato (1971) | | Assistant Treasurer since 2005 | | Vice President, Neuberger Berman, since 2006; Vice President, NBIA, since 2006 and Employee since 1995; Assistant Treasurer, ten registered investment companies for which NBIA acts as investment manager and/or administrator. | |
Niketh Velamoor (1979) | | Anti-Money Laundering Compliance Officer since 2018 | | Senior Vice President and Associate General Counsel, Neuberger Berman, since July 2018; Assistant United States Attorney, Southern District of New York, 2009 to 2018; Anti-Money Laundering Compliance Officer, four registered investment companies for which NBIA acts as investment manager and/or administrator. | |
(1) The business address of each listed person is 1290 Avenue of the Americas, New York, NY 10104.
(2) Pursuant to the By-Laws of the Trust, each officer elected by the Fund Trustees shall hold office until his or her successor shall have been elected and qualified or until his or her earlier death, inability to serve, or resignation. Officers serve at the pleasure of the Fund Trustees and may be removed at any time with or without cause.
(3) Except as otherwise indicated, each individual has held the positions shown during at least the last five years.
33
Proxy Voting Policies and Procedures
A description of the policies and procedures that the Trust uses to determine how to vote proxies relating to portfolio securities is available, without charge, by calling 800-877-9700 (toll-free) and on the SEC's website, at www.sec.gov. Information regarding how the Trust voted proxies relating to portfolio securities during the most recent 12-month period ended June 30 is also available upon request, without charge, by calling 800-877-9700 (toll-free), on the SEC's website at www.sec.gov, and on Neuberger Berman's website at www.nb.com.
Quarterly Portfolio Schedule
The Trust files a complete schedule of portfolio holdings with the SEC for the first and third quarters of each fiscal year as an exhibit to its report on Form N-PORT. The Trust's Form N-PORT is available on the SEC's website at www.sec.gov. The portfolio holdings information on Form N-PORT is available upon request, without charge, by calling 800-877-9700 (toll free).
Board Consideration of the Management Agreement
On an annual basis, the Board of Trustees (the "Board") of Neuberger Berman Advisers Management Trust (the "Trust"), including the Trustees who are not "interested persons" of the Trust or of Neuberger Berman Investment Advisers LLC ("Management") (including its affiliates) ("Independent Fund Trustees"), considers whether to continue the management agreement with Management (the "Agreement") with respect to Mid Cap Intrinsic Value Portfolio (the "Fund"). Throughout the process, the Independent Fund Trustees are advised by counsel that is experienced in Investment Company Act of 1940 matters and that is independent of Management ("Independent Counsel"). At a meeting held on October 1, 2020, the Board, including the Independent Fund Trustees, approved the continuation of the Agreement for the Fund.
In evaluating the Agreement, the Board, including the Independent Fund Trustees, reviewed extensive materials provided by Management in response to questions submitted by the Independent Fund Trustees and Independent Counsel, and met with senior representatives of Management regarding its personnel, operations, and profitability as they relate to the Fund. The annual contract review extends over at least two regular meetings of the Board to ensure that Management has time to respond to any questions the Independent Fund Trustees may have on their initial review of the materials and that the Independent Fund Trustees have time to consider those responses.
In connection with its deliberations, the Board also considered the broad range of information relevant to the annual contract review that is provided to the Board (including its various standing committees) at meetings throughout the year, including reports on investment performance, portfolio risk, and other portfolio information for the Fund, as well as periodic reports on, among other matters, pricing and valuation; quality and cost of portfolio trade execution; compliance; and shareholder and other services provided by Management and its affiliates. The Contract Review Committee, which is comprised of Independent Fund Trustees, was established by the Board to assist in its evaluation and analysis of materials for the annual contract review. The Board has also established other committees that focus throughout the year on specific areas relevant to the annual contract review, such as Fund performance or compliance matters, and that are charged with specific responsibilities regarding the annual contract review. Those committees provide reports to the Contract Review Committee and the full Board, which consider that information as part of the annual contract review process. The Board's Contract Review Committee annually considers and updates the questions it asks of Management in light of legal advice furnished to it by Independent Counsel; its own business judgment; and developments in the industry, in the markets, in mutual fund regulation and litigation, and in Management's business model.
The Independent Fund Trustees received from Independent Counsel a memorandum discussing the legal standards for their consideration of the proposed continuation of the Agreement. During the course of the year and during their deliberations regarding the annual contract review, the Contract Review Committee and the Independent Fund Trustees met with Independent Counsel separately from representatives of Management.
34
Provided below is a description of the Board's contract approval process and material factors that the Board considered at its meetings regarding renewal of the Agreement and the compensation to be paid thereunder. In connection with its approval of the continuation of the Agreement, the Board evaluated the terms of the Agreement, the overall fairness of the Agreement to the Fund, and whether the Agreement was in the best interests of the Fund and its shareholders. The Board's determination to approve the continuation of the Agreement was based on a comprehensive consideration of all information provided to the Board throughout the year and specifically in connection with the annual contract review. The Board considered the Fund's investment management agreement separately from those of other funds of the Trust.
This description is not intended to include all of the factors considered by the Board. The Board members did not identify any particular information or factor that was all-important or controlling, and each Trustee may have attributed different weights to the various factors. The Board focused on the costs and benefits of the Agreement to the Fund and, through the Fund, its shareholders.
Nature, Extent, and Quality of Services
With respect to the nature, extent, and quality of the services provided, the Board considered the investment philosophy and decision-making processes of, and the qualifications, experience, and capabilities of, and the resources available to, the portfolio management personnel of Management who perform services for the Fund. The Board noted that Management also provides certain administrative services, including fund accounting and compliance services. The Board also considered Management's policies and practices regarding brokerage, commissions, other trading costs, and allocation of portfolio transactions and reviewed the quality of the execution services that Management had provided. The Board also reviewed Management's use of brokers to execute Fund transactions that provide research services to Management. Moreover, the Board considered Management's approach to potential conflicts of interest both generally and between the Fund's investments and those of other funds or accounts managed by Management. The Board also noted that Management had increased its research capabilities with respect to environmental, social, and corporate governance matters and how those factors may relate to investment performance. The Board noted the additional responsibilities of Management in administering the liquidity risk management program.
The Board recognized the extensive range of services that Management provides to the Fund beyond the investment management services. The Board noted that Management is also responsible for monitoring compliance with the Fund's investment objectives, policies, and restrictions, as well as compliance with applicable law, including implementing rulemaking initiatives of the U.S. Securities and Exchange Commission. The Board considered that Management assumes significant ongoing entrepreneurial and business risks as the investment adviser and sponsor for the Fund, for which it is entitled to reasonable compensation. The Trustees also considered that Management's responsibilities include continual management of investment, operational, enterprise, legal, regulatory, and compliance risks as they relate to the Fund, and the Board considers on a regular basis information regarding Management's processes for monitoring and managing risk. In addition, the Board also noted that when Management launches a new fund or share class, it assumes entrepreneurial risk with respect to that fund or share class, and that some funds and share classes have been liquidated without ever having been profitable to Management.
The Board also reviewed and evaluated Management's activities under its contractual obligation to oversee the Fund's various outside service providers, including its renegotiation of certain service providers' fees and its evaluation of service providers' infrastructure, cybersecurity programs, compliance programs, and business continuity programs, among other matters. The Board also considered Management's ongoing development of its own infrastructure and information technology to support the Fund through, among other things, cybersecurity, business continuity planning, and risk management. The Board noted Management's largely seamless implementation of its business continuity plan in response to the COVID-19 pandemic. In addition, the Board noted the positive compliance history of Management, as no significant compliance problems were reported to the Board with respect to Management. The Board also considered the general structure of the portfolio manager's compensation and whether this structure provides appropriate incentives to act in the best interests of the Fund. The Board also considered the ability of Management to attract and retain qualified personnel to service the Fund.
35
As in past years, the Board also considered the manner in which Management addressed various matters that arose during the year, some of them a result of developments in the broader fund industry or the regulations governing it. In addition, the Board considered actions taken by Management in response to recent market conditions, such as the economic dislocation and rise in volatility that accompanied shutdowns related to the efforts to stem the spread of COVID-19, and considered the overall performance of Management in this context.
Fund Performance
The Board requested a report from an outside consulting firm that specializes in the analysis of fund industry data that compared the Fund's performance, along with its fees and other expenses, to a group of industry peers ("Expense Group") and a broader universe of funds pursuing generally similar strategies with the same investment classification and/or objective ("Performance Universe"). The Expense Group and Performance Universe were composed of two types of funds: proprietary funds that are operated by insurance companies or their affiliates, and non-proprietary funds, such as the Fund, operated for insurance company investors by independent investment managers. The Board considered the Fund's performance and fees in light of the limitations inherent in the methodology for constructing such comparative groups and determining which investment companies should be included in the comparative groups, noting differences as compared to certain fund industry ranking and rating systems. The Board also considered the impact and inherent limitation on the comparisons due to the small number of funds included in the Fund's Expense Group and Performance Universe.
With respect to investment performance, the Board considered information regarding the Fund's short-, intermediate- and long-term performance, net of the Fund's fees and expenses, on an absolute basis, relative to a benchmark index that does not deduct the fees or expenses of investing, and compared to the performance of the Expense Group and Performance Universe, each constructed by the consulting firm. The Board also reviewed performance in relation to certain measures of the degree of investment risk undertaken by the portfolio manager.
The Performance Universe referenced in this section was identified by the consulting firm, as discussed above. For any period of underperformance, the Board considered the magnitude and duration of that underperformance relative to the Performance Universe, and/or the benchmark (e.g., the amount by which a Fund underperformed, including, for example, whether the Fund slightly underperformed or significantly underperformed its benchmark). With respect to performance quintile rankings for the Fund compared to its Performance Universe, the first quintile represents the highest (best) performance and the fifth quintile represents the lowest performance. For investment performance comparisons, the Board looked at the Fund's Class I as a proxy for both of the Fund's classes.
The Board considered that, based on performance data for the periods ended December 31, 2019: (1) as compared to its benchmark, the Fund's performance was lower for the 1-, 3-, 5-, and 10-year periods; and (2) as compared to its Performance Universe, the Fund's performance was in the fifth quintile for the 1-, 3-, 5-, and 10-year periods.
Noting that the Fund underperformed over certain periods, the Board considered Management's representations regarding the factors impacting the Fund's performance and discussed with Management the Fund's performance, potential reasons for the relative performance, and steps that Management had taken, or intended to take, to improve performance. The Board also considered Management's responsiveness to the Fund's relative performance. In this regard, the Board noted that performance, especially short-term performance, is only one of the factors that it deems relevant to its consideration of the Agreement and that, after considering all relevant factors, it determined to approve the continuation of the Agreement notwithstanding the Fund's relative underperformance.
Fee Rates, Profitability, and Fall-out Benefits
With respect to the overall fairness of the Agreement, the Board considered the fee structure for the Fund under the Agreement as compared to the Expense Group provided by the consulting firm, as discussed above. The Board reviewed a comparison of the Fund's management fee to its Expense Group. The Board noted that the comparative management fee analysis includes, in the Fund's management fee, the separate administrative fees paid to Management. However, the
36
Board noted that some funds in the Expense Group pay directly from fund assets for certain services that Management covers out of the administration fees for the Fund. Accordingly, the Board also considered the Fund's total expense ratio as compared with its Expense Group as a way of taking account of these differences.
The Board compared the Fund's contractual and actual management fees to the median of the contractual and actual management fees, respectively, of the Fund's Expense Group. (The actual management fees are the contractual management fees reduced by any fee waivers or other adjustments.) The Board also compared the Fund's total expenses to the median of the total expenses of the Fund's Expense Group. The Board noted that the Fund's actual management fee and total expenses were higher than the Expense Group median, and considered whether specific portfolio management, administration or oversight needs or the Fund's relatively small size contributed to the Fund's actual management fee and total expenses. With respect to the quintile rankings for fees and total expenses (net of waivers or other adjustments, if any) for the Fund compared to its Expense Group, the first quintile represents the lowest fees and/or total expenses and the fifth quintile represents the highest fees and/or total expenses. For fee comparisons, the Board looked at the Fund's Class I as a proxy for both of the Fund's classes.
The Board considered that, as compared to its Expense Group, the Fund's contractual management fee ranked in the fourth quintile and the actual management fee and total expenses each ranked in the fifth quintile.
In addition to considering the above-referenced factors, the Board took note of its ongoing dialogue with Management regarding the dynamics of the insurance/annuity marketplace. The Board considered, among other matters, related tax restrictions and the unique challenges facing that market generally, which assisted the Board in understanding the context for the Fund's expense ratio and performance.
In concluding that the benefits accruing to Management and its affiliates by virtue of their relationship with the Fund were reasonable in light of the costs of providing the investment advisory and other services and the benefits accruing to the Fund, the Board reviewed specific data as to Management's estimated profit on the Fund for a recent period on a pre-tax basis without regard to distribution expenses, including year-over-year changes in each of Management's reported expense categories. (The Board also reviewed data on Management's estimated loss on the Fund after distribution/servicing expenses and taxes were factored in, as indicators of the health of the business and the extent to which Management is directing its profits into the growth of the business. The Board noted that when distribution expenses and taxes were considered, Management experienced a loss on the Fund.) The Board considered the cost allocation methodology that Management used in developing its estimated profitability figures. In recent years, the Board engaged an independent forensic accountant to review the profitability methodology utilized by Management when preparing this information and discussed with the consultant its conclusion that Management's process for calculating and reporting its estimated profit was not unreasonable.
Recognizing that there is no uniform methodology regarding the allocation of firm-wide or complex-wide expenses within the asset management industry for determining profitability for this purpose and that the use of different reasonable methodologies can give rise to different profit and loss results, the Board, in recent years, requested from Management examples of profitability calculated by different methods and noted that the estimated profitability levels were still reasonable when calculated by these other methods. The Board further noted Management's representation that its estimate of profitability is derived using methodology that is consistent with the methodology used to assess and/or report measures of profitability elsewhere at the firm. In addition, the Board recognized that Management's calculations regarding its costs may not reflect all risks, including regulatory, legal, operational, reputational, and, where appropriate, entrepreneurial risks, associated with offering and managing a mutual fund in the current regulatory and market environment. The Board also considered any fall-out (i.e., indirect) benefits likely to accrue to Management or its affiliates from their relationship with the Fund, such as research it may receive from broker-dealers executing the Funds' portfolio transactions on an agency basis. The Board recognized that Management and its affiliates should be entitled to earn a reasonable level of profits for services they provide to the Fund and, based on its review, concluded that Management's reported level of estimated profitability on the Fund was reasonable.
37
Information Regarding Services to Other Clients
The Board also considered other funds and separate accounts that were advised or sub-advised by Management or its affiliates with investment objectives, policies and strategies that were similar to those of the Fund, and compared the fees charged to the Fund to the fees charged to such comparable funds and separate accounts. The Board considered the appropriateness and reasonableness of any differences between the fees charged to a Fund and such comparable funds and/or separate accounts, and determined that differences in fees and fee structures were consistent with the differences in the management and other services provided. The Board explored with Management its assertion that although, generally, the rates of fees paid by such accounts, except other Neuberger Berman mutual funds, were lower than the fee rates paid by the corresponding Fund, the differences reflected Management's greater level of responsibilities and significantly broader scope of services regarding the Fund, the more extensive regulatory obligations and risks associated with managing the Fund, and other financial considerations with respect to creation and sponsorship of the Fund.
Economies of Scale
The Board also evaluated apparent or anticipated economies of scale in relation to the services Management provides to the Fund. The Board considered whether the Fund's fee structure provides for a reduction of payments resulting from the use of breakpoints, the size of any breakpoints in the Fund's advisory fees, and whether any such breakpoints are set at appropriate asset levels. The Board also compared the breakpoint structure to that of the Expense Group. In addition, the Board considered the expense limitation and/or fee waiver arrangements that reduces Fund expenses at all asset levels which can have an effect similar to breakpoints in sharing economies of scale with shareholders and provide protection from an increase in expenses if the Fund's assets decline. The Board also considered that Management has provided, at no added cost to the Fund, certain additional services, including but not limited to, services required by new regulations or regulatory interpretations, services impelled by changes in the securities markets or the business landscape, and/or services requested by the Board. The Board considered that this is a way of sharing economies of scale with the Fund and its shareholders.
Conclusions
In approving the continuation of the Agreement, the Board concluded that, in its business judgment, the terms of the Agreement are fair and reasonable to the Fund and that approval of the continuation of the Agreement is in the best interests of the Fund and its shareholders. In reaching this determination, the Board considered that Management could be expected to continue to provide a high level of service to the Fund; that the Board retained confidence in Management's capabilities to manage the Fund; that the Fund's fee structure appeared to the Board to be reasonable given the nature, extent, and quality of services provided or the Fund's relatively small size; and that the benefits accruing to Management and its affiliates by virtue of their relationship with the Fund were reasonable in light of the costs of providing the investment advisory and other services and the benefits accruing to the Fund. The Board's conclusions may be based in part on its consideration of materials prepared in connection with the approval or continuance of the Agreement in prior years and on the Board's ongoing regular review of Fund performance and operations throughout the year, in addition to material prepared specifically for the most recent annual review of the Agreement.
Notice to Shareholders
100.00% of the dividends earned during the fiscal year ended December 31, 2020 qualify for the dividends received deduction for corporate shareholders.
38
Neuberger Berman
Advisers Management Trust
Short Duration Bond Portfolio
I Class Shares
Annual Report
December 31, 2020
As permitted by regulations adopted by the U.S. Securities and Exchange Commission, you may no longer receive paper copies of the Fund's annual and semi-annual shareholder reports by mail from the insurance company that issued your variable annuity and variable life insurance contract or from the financial intermediary that administers your qualified pension or retirement plan, unless you specifically request paper copies of the reports from your insurance company or financial intermediary. Instead, the reports will be made available on the Fund's website www.nb.com/AMTliterature, and may also be available on a website from the insurance company or financial intermediary that offers your contract or administers your retirement plan, and such insurance company or financial intermediary will notify you by mail each time a report is posted and provide you with a website link to access the report.
If you already elected to receive shareholder reports electronically, you will not be affected by this change and you need not take any action. You may elect to receive shareholder reports and other communications from the insurance company or financial intermediary electronically by following the instructions provided by the insurance company or financial intermediary. If offered by your insurance company or financial intermediary, you may elect to receive all future reports in paper and free of charge from the insurance company or financial intermediary. You can contact your insurance company or financial intermediary if you wish to continue receiving paper copies of your shareholder reports. Your election to receive reports in paper will apply to all funds available under your contract or retirement plan.
Short Duration Bond Portfolio Commentary (Unaudited)
The Neuberger Berman Advisers Management Trust Short Duration Bond Portfolio Class I posted a 3.46% total return for the 12 months ended December 31, 2020 (the reporting period), outperforming its benchmark, the Bloomberg Barclays 1-3 Year U.S. Government/Credit Bond Index (the Index), which returned 3.33% for the same period.
The investment grade U.S. bond market, as measured by the Bloomberg Barclays U.S. Aggregate Bond Index, generated strong results during the reporting period. Both short- and long-term U.S. Treasury yields fell significantly given several "flights to quality" resulting from repercussions of the COVID-19 pandemic. Credit spreads meaningfully widened in March 2020 given investor risk aversion and challenged liquidity. However, spreads then narrowed as the year progressed, partially driven by unprecedented monetary policy accommodation by the U.S. Federal Reserve Board (Fed), and large fiscal stimulus. Investor risk appetite was robust toward the end of the year, as the COVID-19 vaccine breakthrough brought some much needed clarity as to the possible timing of when economic activity could normalize. That said, the near-term outlook remains clouded by the recent spike in infections and renewed restrictions in parts of the U.S. All told, higher quality spread sectors (non-U.S. Treasury securities) produced positive results during the period.
The primary contributors to performance were the Fund's allocations to mortgage credit, corporate credit, and agency mortgage-backed securities (MBS). On the downside, yield curve positioning was the largest detractor from results. An allocation to commercial mortgage-backed securities (CMBS) was also a small headwind for returns. The Fund's exposure to asset-backed securities (ABS) did not meaningfully impact performance.
The Fund's use of Treasury futures contributed positively to performance.
A number of changes were made to the Fund during the period. We pared our allocation to investment grade corporate bonds, in particular, securities that we believed were richly valued. In contrast, we increased the Fund's position in agency MBS given attractive valuations and the Fed's purchases, and mortgage credit given relatively attractive valuations.
Looking ahead, we anticipate a strong, if uneven, global economic recovery as the pandemic plays out. We anticipate the availability of COVID-19 vaccines, the reopening of economies, continued monetary and fiscal policy support, and pent-up demand in pandemic-sensitive sectors of the economy to provide a significant boost to demand. Although our outlook is dependent on a successful and timely distribution of safe, efficient and effective vaccines, we believe that recent approvals and distribution suggest that the end of the pandemic is in sight. While we anticipate the global recovery to be choppy, disinflationary pressures are starting to ease and should gradually reverse, with the potential for a resilient up-tilt in global core consumer price inflation over the next 12 to 36 months. We believe U.S. inflation will lead other developed markets. Overall, we do not see any significant change in monetary policy, as central banks maintain current support in light of ongoing, though potentially fading, pandemic conditions and lockdowns. As such, we are constructive on select credit securities, particularly favoring those that offer carry (incremental yield) with minimal duration. While we are looking at opportunities in COVID-sensitive industries, we believe research-driven security selection remains critical as ever.
Sincerely,
THOMAS SONTAG, MICHAEL FOSTER, MATTHEW MCGINNIS AND WOOLF NORMAN MILNER
PORTFOLIO MANAGERS
Information about principal risks of investing in the Fund is set forth in the prospectus and statement of additional information.
The portfolio composition, industries and holdings of the Fund are subject to change without notice.
The opinions expressed are those of the Fund's portfolio managers. The opinions are as of the date of this report and are subject to change without notice.
1
Short Duration Bond Portfolio (Unaudited)
PORTFOLIO BY TYPE OF INVESTMENT
(as a % of Total Net Assets) | |
Asset-Backed Securities | | | 7.3 | % | |
Corporate Bonds | | | 39.9 | | |
Mortgage-Backed Securities | | | 43.6 | | |
U.S. Government Agency Securities | | | 2.1 | | |
Short-Term Investments | | | 6.8 | | |
Other Assets Less Liabilities | | | 0.3 | * | |
Total | | | 100.0 | % | |
* Includes the impact of the Fund's open positions in derivatives, if any.
PERFORMANCE HIGHLIGHTS
| | Inception | | Average Annual Total Return
Ended 12/31/2020 | |
| | Date | | 1 Year | | 5 Years | | 10 Years | | Life of Fund | |
At NAV | |
Class I | | 09/10/1984 | | | 3.46 | % | | | 2.05 | % | | | 1.65 | % | | | 4.60 | % | |
Index | |
Bloomberg Barclays
1-3 Year U.S.
Government/Credit
Bond Index1,2 | | | | | 3.33 | % | | | 2.21 | % | | | 1.60 | % | | | 5.16 | % | |
The performance data quoted represent past performance and do not indicate future results. Current performance may be lower or higher than the performance data quoted. For current performance data, including current to the most recent month-end, please visit http://www.nb.com/amtportfolios/performance.
The results shown in the table reflect the reinvestment of income dividends and other distributions, if any. The results do not reflect the effect of taxes a shareholder would pay on Fund distributions or on the redemption of Fund shares. The results do not reflect fees and expenses of the variable annuity and variable life insurance policies or the qualified pension and retirement plans whose proceeds are invested in the Fund.
The investment return and principal value of an investment will fluctuate and shares, when redeemed, may be worth more or less than their original cost.
Returns would have been lower if Neuberger Berman Investment Advisers LLC ("Management") had not reimbursed certain expenses and/ or waived a portion of the investment management fees during certain of the periods shown. Repayment by a class (of expenses previously reimbursed and/or fees previously waived by Management) will decrease the class's returns. Please see Note B in the Notes to Financial Statements for specific information regarding expense reimbursement and/or fee waiver arrangements.
For the period ended December 31, 2020, the 30-day SEC yield was 1.89% for Class I shares.
As stated in the Fund's most recent prospectus, the total annual operating expense ratio for fiscal year 2019 was 0.80% for Class I shares (before expense reimbursements and/or fee waivers, if any, and after restatement). The expense ratios for the annual period ended December 31, 2020 can be found in the Financial Highlights section of this report.
COMPARISON OF A $10,000 INVESTMENT
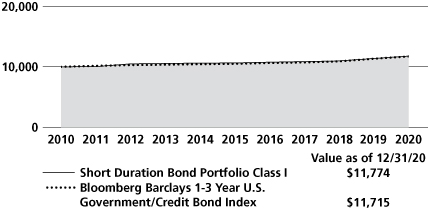
This graph shows the change in value of a hypothetical $10,000 investment in the Fund over the past 10 fiscal years, or since the Fund's inception, if it has not operated for 10 years. The result is compared with benchmarks, which include a broad-based market index and may include a more narrowly based index. Market indices have not been reduced to reflect any of the fees and costs of investing. The results shown in the graph reflect the reinvestment of income dividends and other distributions, if any. The results do not reflect the effect of taxes a shareholder would pay on Fund distributions or on the redemption of Fund shares. The results do not reflect fees and expenses of the variable annuity and variable life insurance policies or the qualified pension and retirement plans whose proceeds are invested in the Fund. Results represent past performance and do not indicate future results.
Please see Endnotes for additional information.
2
1 The date used to calculate Life of Fund performance for the index is September 10, 1984, the Fund's commencement of operations.
2 The Bloomberg Barclays 1-3 Year U.S. Government/Credit Bond Index is the 1-3 year component of the Bloomberg Barclays U.S. Government/Credit Bond Index. The Bloomberg Barclays U.S. Government/Credit Bond Index is the non-securitized component of the Bloomberg Barclays U.S. Aggregate Bond Index and includes Treasuries and government-related (agency, sovereign, supranational, and local authority debt) and corporate securities. Please note that the indices described in this report do not take into account any fees, expenses or tax consequences of investing in the individual securities that they track, and that individuals cannot invest directly in any index. Data about the performance of an index are prepared or obtained by Neuberger Berman Investment Advisers LLC ("Management") and reflect the reinvestment of income dividends and other distributions, if any. The Fund may invest in securities not included in a described index and generally does not invest in all securities included in a described index.
The investments for the Fund are managed by the same portfolio manager(s) who manage(s) one or more other registered funds that have names, investment objectives and investment styles that are similar to those of the Fund. You should be aware that the Fund is likely to differ from those other mutual fund(s) in size, cash flow pattern and tax matters. Accordingly, the holdings and performance of the Fund can be expected to vary from those of the other mutual fund(s).
Shares of the separate Neuberger Berman Advisers Management Trust Portfolios, including the Fund, are not available to the general public. Shares of the Fund may be purchased only by life insurance companies to be held in their separate accounts, which fund variable annuity and variable life insurance policies, and by qualified pension and retirement plans. Statistics and projections in this report are derived from sources deemed to be reliable but cannot be regarded as a representation of future results of the Fund. This report is prepared for the general information of shareholders and is not an offer of shares of the Fund. Shares are sold only through the currently effective prospectus, which must precede or accompany this report.
The "Neuberger Berman" name and logo and "Neuberger Berman Investment Advisers LLC" name are registered service marks of Neuberger Berman Group LLC. The individual Fund name in this piece is either a service mark or registered service mark of Neuberger Berman Investment Advisers LLC, an affiliate of Neuberger Berman BD LLC, distributor, member FINRA.
© 2021 Neuberger Berman BD LLC, distributor. All rights reserved.
3
Information About Your Fund's Expenses (Unaudited)
As a Fund shareholder, you incur two types of costs: (1) transaction costs such as fees and expenses that are, or may be, imposed under your variable contract or qualified pension plan; and (2) ongoing costs, including management fees, distribution and/or service (12b-1) fees (if applicable), and other Fund expenses. This example is intended to help you understand your ongoing costs (in U.S. dollars) of investing in the Fund and compare these costs with the ongoing costs of investing in other mutual funds.
This table is designed to provide information regarding costs related to your investments. The following examples are based on an investment of $1,000 made at the beginning of the six month period ended December 31, 2020 and held for the entire period. The table illustrates the Fund's costs in two ways:
Actual Expenses and Performance: | | The first section of the table provides information about actual account values and actual expenses in dollars, based on the Fund's actual performance during the period indicated. You may use the information in this line, together with the amount you invested, to estimate the expenses you paid over the period. Simply divide your account value by $1,000 (for example, an $8,600 account value divided by $1,000 = 8.6), then multiply the result by the number in the first section of the table under the heading entitled "Expenses Paid During the Period" to estimate the expenses you paid over the period. | |
Hypothetical Example for
Comparison Purposes: | | The second section of the table provides information about hypothetical account values and hypothetical expenses based on the Fund's actual expense ratio and an assumed rate of return at 5% per year before expenses. This return is not the Fund's actual return. The hypothetical account values and expenses may not be used to estimate the actual ending account balance or expenses you paid for the period. You may use this information to compare the ongoing costs of investing in this Fund versus other funds. To do so, compare the expenses shown in this 5% hypothetical example with the 5% hypothetical examples that appear in the shareholder reports of other funds. | |
Please note that the expenses in the table are meant to highlight your ongoing costs only and do not include any transaction costs, such as fees and expenses that are, or may be imposed under your variable contract or qualified pension plan. Therefore, the information under the heading "Hypothetical (5% annual return before expenses)" is useful in comparing ongoing costs only, and will not help you determine the relative total costs of owning different funds. In addition, if these transaction costs were included, your costs would have been higher.
Expense Example (Unaudited)
NEUBERGER BERMAN ADVISERS MANAGEMENT TRUST SHORT DURATION BOND PORTFOLIO
Actual | | Beginning Account
Value
7/1/20 | | Ending Account
Value
12/31/20 | | Expenses Paid During
the Period
7/1/20 – 12/31/20 | |
Class I | | $ | 1,000.00 | | | $ | 1,029.70 | | | $ | 4.44 | (a) | |
Hypothetical (5% annual return before expenses) | |
Class I | | $ | 1,000.00 | | | $ | 1,020.76 | | | $ | 4.42 | (b) | |
(a) Expenses are equal to the annualized expense ratio of 0.87%, multiplied by the average account value over the period, multiplied by 184/366 (to reflect the one-half year period shown).
(b) Hypothetical expenses are equal to the annualized expense ratio of 0.87%, multiplied by the average account value over the period (assuming a 5% annual return), multiplied by 184/366 (to reflect the one-half year period shown).
4
Legend Short Duration Bond Portfolio (Unaudited)
December 31, 2020
Benchmarks:
LIBOR = London Interbank Offered Rate
SOFR = Secured Overnight Financing Rate
Currency Abbreviations:
USD = United States Dollar
Counterparties:
SSB = State Street Bank and Trust Company
Index Periods/Payment Frequencies:
1M = 1 Month
3M = 3 Months
5
Schedule of Investments Short Duration Bond Portfolio^ December 31, 2020
PRINCIPAL AMOUNT | | | | VALUE | |
U.S. Treasury Obligations 2.1% | | | |
$ | 1,965,128 | | | United States Treasury Inflation Indexed Note, 0.13%, due 7/15/2030 (Cost $2,168,439) | | $ | 2,203,374 | (a) | |
Mortgage-Backed Securities 43.6% | | | |
Adjustable Mixed Balance 0.1% | | | |
| 117,514 |
| | Harborview Mortgage Loan Trust, Ser. 2004-4, Class 3A, (1M USD LIBOR + 1.13%),
1.28%, due 6/19/2034 | |
| 120,739 | (b) | |
Collateralized Mortgage Obligations 9.1% | | | |
| | 713,018 | | | Angel Oak Mortgage Trust, Ser. 2019-6, Class A1, 2.62%, due 11/25/2059 | | | 723,086 | (c)(d) | |
| | | | | Fannie Mae Connecticut Avenue Securities | | | | | |
| | 474,742 | | | Ser. 2017-C04, Class 2M2, (1M USD LIBOR + 2.85%), 3.00%, due 11/25/2029 | | | 477,736 | (b) | |
| | 375,595 | | | Ser. 2017-C05, Class 1M2, (1M USD LIBOR + 2.20%), 2.35%, due 1/25/2030 | | | 375,121 | (b) | |
| | 397,205 | | | Ser. 2017-C06, Class 2M2, (1M USD LIBOR + 2.80%), 2.95%, due 2/25/2030 | | | 400,215 | (b) | |
| | 378,892 | | | Ser. 2017-C07, Class 2M2, (1M USD LIBOR + 2.50%), 2.65%, due 5/25/2030 | | | 378,653 | (b) | |
| | 345,942 | | | Ser. 2018-C02, Class 2M2, (1M USD LIBOR + 2.20%), 2.35%, due 8/25/2030 | | | 343,746 | (b) | |
| | 732,819 | | | Ser. 2018-C04, Class 2M2, (1M USD LIBOR + 2.55%), 2.70%, due 12/25/2030 | | | 734,670 | (b) | |
| | 440,863 | | | Ser. 2018-C05, Class 1M2, (1M USD LIBOR + 2.35%), 2.50%, due 1/25/2031 | | | 441,423 | (b) | |
| | 854,010 | | | Ser. 2020-R02, Class 2M1, (1M USD LIBOR + 0.75%), 0.90%, due 1/25/2040 | | | 854,010 | (b)(c) | |
| | 474,852 | | | Ser. 2020-R01, Class 1M1, (1M USD LIBOR + 0.80%), 0.95%, due 1/25/2040 | | | 475,228 | (b)(c) | |
| | | | | Freddie Mac Structured Agency Credit Risk Debt Notes | | | | | |
| | 624,858 | | | Ser. 2017-DNA1, Class M2, (1M USD LIBOR + 3.25%), 3.40%, due 7/25/2029 | | | 639,670 | (b) | |
| | 742,272 | | | Ser. 2017-HQA2, Class M2, (1M USD LIBOR + 2.65%), 2.80%, due 12/25/2029 | | | 747,424 | (b) | |
| | 461,704 | | | Ser. 2018-HQA1, Class M2, (1M USD LIBOR + 2.30%), 2.45%, due 9/25/2030 | | | 459,949 | (b) | |
| | | | | Freddie Mac Structured Agency Credit Risk Debt Notes Real Estate Mortgage Investment Conduits | | | | | |
| | 205,268 | | | Ser. 2020-DNA1, Class M1, (1M USD LIBOR + 0.70%), 0.85%, due 1/25/2050 | | | 205,389 | (b)(c) | |
| | 334,494 | | | Ser. 2020-HQA1, Class M1, (1M USD LIBOR + 0.75%), 0.90%, due 1/25/2050 | | | 334,388 | (b)(c) | |
| | | | | GCAT Trust | | | | | |
| | 677,959 | | | Ser. 2019-NQM2, Class A1, 2.86%, due 9/25/2059 | | | 687,818 | (c)(e) | |
| | 784,031 | | | Ser. 2019-NQM3, Class A1, 2.69%, due 11/25/2059 | | | 804,997 | (c)(d) | |
| | 268,701 | | | Starwood Mortgage Residential Trust, Ser. 2019-INV1, Class A1, 2.61%, due 9/27/2049 | | | 273,481 | (c)(d) | |
| | | | 9,357,004 | | |
Commercial Mortgage-Backed 21.8% | | | |
| | 1,600,000 | | | BANK, Ser. 2020-BN30, Class A1, 0.45%, due 12/10/2053 | | | 1,600,282 | | |
| | 1,110,000 | | | BBCMS Trust, Ser. 2013-TYSN, Class B, 4.04%, due 9/5/2032 | | | 1,099,175 | (c) | |
| 512,386 |
| | BX Commercial Mortgage Trust, Ser. 2018-IND, Class A, (1M USD LIBOR + 0.75%),
0.91%, due 11/15/2035 | |
| 512,225 | (b)(c) | |
| | 320,000 | | | BXMT Ltd., Ser. 2020-FL2, Class A, (1M USD LIBOR + 0.90%), 1.05%, due 2/16/2037 | | | 317,810 | (b)(c) | |
| | | | | CD Mortgage Trust | | | | | |
| | 177,682 | | | Ser. 2017-CD3, Class A1, 1.97%, due 2/10/2050 | | | 178,260 | | |
| | 620,785 | | | Ser. 2017-CD5, Class A1, 2.03%, due 8/15/2050 | | | 625,500 | | |
| | | | | Citigroup Commercial Mortgage Trust | | | | | |
| | 477,515 | | | Ser. 2012-GC8, Class AAB, 2.61%, due 9/10/2045 | | | 483,978 | | |
| | 590,899 | | | Ser. 2016-P3, Class A2, 2.74%, due 4/15/2049 | | | 591,582 | | |
| | 314,491 | | | Ser. 2016-P6, Class A1, 1.88%, due 12/10/2049 | | | 315,021 | | |
| | 960,601 | | | Ser. 2018-C5, Class A1, 3.13%, due 6/10/2051 | | | 978,892 | | |
| | | | | Commercial Mortgage Trust | | | | | |
| | 1,111,000 | | | Ser. 2012-CR4, Class AM, 3.25%, due 10/15/2045 | | | 1,120,797 | | |
| | 12,975,772 | | | Ser. 2014-CR18, Class XA, 1.01%, due 7/15/2047 | | | 371,578 | (d)(f) | |
| | | | | CSAIL Commercial Mortgage Trust | | | | | |
| | 17,590,480 | | | Ser. 2016-C5, Class XA, 0.92%, due 11/15/2048 | | | 631,461 | (d)(f) | |
| | 692,844 | | | Ser. 2017-CX10, Class A1, 2.23%, due 11/15/2050 | | | 699,962 | | |
| | 304,252 | | | DBJPM Mortgage Trust, Ser. 2016-C3, Class A1, 1.50%, due 8/10/2049 | | | 305,090 | | |
| | 201,485 | | | DBUBS Mortgage Trust, Ser. 2011-LC1A, Class A3, 5.00%, due 11/10/2046 | | | 201,468 | (c) | |
See Notes to Financial Statements
6
Schedule of Investments Short Duration Bond Portfolio^ (cont'd)
PRINCIPAL AMOUNT | | | | VALUE | |
| | | | | Freddie Mac Multiclass Certificates | | | | | |
$ | 2,420,000 | | | Ser. 2020-RR03, Class X1, 1.71%, due 7/27/2028 | | $ | 272,971 | (f) | |
| | 1,500,000 | | | Ser. 2020-RR02, Class DX, 1.82%, due 9/27/2028 | | | 176,757 | (d)(f) | |
| | 1,535,000 | | | Ser. 2020-RR02, Class CX, 1.27%, due 3/27/2029 | | | 139,031 | (d)(f) | |
| 26,751,710 |
| | Freddie Mac Multifamily Structured Pass Through Certificates, Ser. K737, Class X1,
0.64%, due 10/25/2026 | |
| 863,074 | (d)(f) | |
| | | | | GS Mortgage Securities Trust | | | | | |
| | 520,000 | | | Ser. 2019-BOCA, Class A, (1M USD LIBOR + 1.20%), 1.36%, due 6/15/2038 | | | 516,086 | (b)(c) | |
| | 915,000 | | | Ser. 2010-C1, Class B, 5.15%, due 8/10/2043 | | | 883,351 | (c) | |
| | 95,000 | | | Ser. 2012-GCJ7, Class B, 4.74%, due 5/10/2045 | | | 97,619 | | |
| | 109,267,943 | | | Ser. 2013-GC13, Class XA, 0.07%, due 7/10/2046 | | | 223,103 | (d)(f) | |
| | 1,000,000 | | | Ser. 2014-GC22, Class A4, 3.59%, due 6/10/2047 | | | 1,068,119 | | |
| | | | | JPMBB Commercial Mortgage Securities Trust | | | | | |
| | 803,837 | | | Ser. 2013-C12, Class ASB, 3.16%, due 7/15/2045 | | | 817,667 | | |
| | 421,079 | | | Ser. 2015-C29, Class ASB, 3.30%, due 5/15/2048 | | | 443,078 | | |
| | | | | Morgan Stanley Bank of America Merrill Lynch Trust | | | | | |
| | 166,000 | | | Ser. 2013-C9, Class B, 3.71%, due 5/15/2046 | | | 171,152 | (d) | |
| | 457,842 | | | Ser. 2017-C33, Class A1, 2.03%, due 5/15/2050 | | | 460,509 | | |
| | | | | Morgan Stanley Capital I Trust | | | | | |
| | 1,266,490 | | | Ser. 2011-C2, Class A4, 4.66%, due 6/15/2044 | | | 1,273,833 | (c) | |
| | 764,000 | | | Ser. 2012-C4, Class A4, 3.24%, due 3/15/2045 | | | 775,879 | | |
| | 142,994 | | | SG Commercial Mortgage Securities Trust, Ser. 2016-C5, Class A1, 1.35%, due 10/10/2048 | | | 143,031 | | |
| | 489,275 | | | UBS Commercial Mortgage Trust, Ser. 2018-C14, Class A1, 3.38%, due 12/15/2051 | | | 502,562 | | |
| | | | | Wells Fargo Commercial Mortgage Trust | | | | | |
| | 293,780 | | | Ser. 2012-LC5, Class A3, 2.92%, due 10/15/2045 | | | 302,604 | | |
| | 273,447 | | | Ser. 2016-NXS6, Class A1, 1.42%, due 11/15/2049 | | | 273,653 | | |
| | 1,652,303 | | | Ser. 2018-C45, Class A1, 3.13%, due 6/15/2051 | | | 1,693,762 | | |
| | 745,000 | | | Ser. 2020-C58, Class A1, 0.55%, due 7/15/2053 | | | 746,215 | | |
| | 17,406,508 | | | WF-RBS Commercial Mortgage Trust, Ser. 2014-LC14, Class XA, 1.26%, due 3/15/2047 | | | 566,812 | (d)(f) | |
| | | | 22,443,949 | | |
Fannie Mae 4.1% | | | |
| | | | | Pass-Through Certificates | | | | | |
| | 932,389 | | | 3.00%, due 9/1/2027 | | | 979,282 | | |
| | 1,087,568 | | | 4.50%, due 5/1/2041 – 5/1/2044 | | | 1,211,853 | | |
| | 1,925,000 | | | 2.50%, due 1/1/2051 | | | 2,030,700 | | |
| | | | 4,221,835 | | |
Freddie Mac 8.5% | | | |
| | | | | Pass-Through Certificates | | | | | |
| | 440,555 | | | 3.50%, due 5/1/2026 | | | 467,276 | | |
| | 523,368 | | | 3.00%, due 1/1/2027 | | | 550,008 | | |
| | 567,501 | | | 4.50%, due 11/1/2039 | | | 634,615 | | |
| | 6,721,376 | | | 2.50%, due 6/1/2050 – 8/1/2050 | | | 7,090,441 | | |
| | | | 8,742,340 | | |
| | | | | Total Mortgage-Backed Securities (Cost $44,520,418) | | | 44,885,867 | | |
Corporate Bonds 39.9% | | | |
Advertising 0.1% | | | |
| | 140,000 | | | Outfront Media Capital LLC/Outfront Media Capital Corp., 6.25%, due 6/15/2025 | | | 147,700 | (c) | |
See Notes to Financial Statements
7
Schedule of Investments Short Duration Bond Portfolio^ (cont'd)
PRINCIPAL AMOUNT | | | | VALUE | |
Aerospace & Defense 1.7% | | | |
$ | 1,290,000 | | | Boeing Co., 4.88%, due 5/1/2025 | | $ | 1,470,206 | | |
| | 35,000 | | | Howmet Aerospace, Inc., 6.88%, due 5/1/2025 | | | 41,300 | | |
| | 230,000 | | | TransDigm, Inc., 6.25%, due 3/15/2026 | | | 244,950 | (c) | |
| | | | 1,756,456 | | |
Agriculture 0.5% | | | |
| | 535,000 | | | BAT Capital Corp., 2.26%, due 3/25/2028 | | | 555,114 | | |
Airlines 0.9% | | | |
| | 140,000 | | | Delta Air Lines, Inc., 7.00%, due 5/1/2025 | | | 161,608 | (c) | |
| | 535,000 | | | Delta Air Lines, Inc./SkyMiles IP Ltd., 4.50%, due 10/20/2025 | | | 571,752 | (c) | |
| | 170,000 | | | United Airlines Holdings, Inc., 4.25%, due 10/1/2022 | | | 170,850 | (g) | |
| | | | 904,210 | | |
Auto Manufacturers 2.9% | | | |
| | | | | Ford Motor Credit Co. LLC | | | | | |
| | 500,000 | | | 3.81%, due 10/12/2021 | | | 505,625 | | |
| | 435,000 | | | 5.13%, due 6/16/2025 | | | 472,976 | | |
| | | | | General Motors Financial Co., Inc. | | | | | |
| | 530,000 | | | 2.75%, due 6/20/2025 | | | 566,618 | | |
| | 400,000 | | | 2.70%, due 8/20/2027 | | | 424,048 | | |
| | | | | Volkswagen Group of America Finance LLC | | | | | |
| | 610,000 | | | 0.88%, due 11/22/2023 | | | 613,390 | (c) | |
| | 370,000 | | | 3.35%, due 5/13/2025 | | | 406,681 | (c) | |
| | | | 2,989,338 | | |
Auto Parts & Equipment 0.4% | | | |
| | 40,000 | | | Adient U.S. LLC, 9.00%, due 4/15/2025 | | | 44,600 | (c) | |
| | 230,000 | | | Goodyear Tire & Rubber Co., 9.50%, due 5/31/2025 | | | 259,969 | | |
| | 60,000 | | | Meritor, Inc., 6.25%, due 6/1/2025 | | | 64,800 | (c) | |
| | | | 369,369 | | |
Banks 10.3% | | | |
| | 550,000 | | | Banco Santander SA, 2.75%, due 5/28/2025 | | | 587,021 | | |
| | 650,000 | | | Bank of America Corp., Ser. L, 3.95%, due 4/21/2025 | | | 732,705 | | |
| | 1,000,000 | | | Capital One N.A., (3M USD LIBOR + 0.82%), 1.03%, due 8/8/2022 | | | 1,007,367 | (b) | |
| | 1,070,000 | | | Citigroup, Inc., 3.35%, due 4/24/2025 | | | 1,163,101 | (h) | |
| | 1,925,000 | | | Goldman Sachs Group, Inc., (3M USD LIBOR + 0.75%), 0.96%, due 2/23/2023 | | | 1,942,928 | (b) | |
| | 700,000 | | | JPMorgan Chase & Co., 2.30%, due 10/15/2025 | | | 742,938 | (h) | |
| | 1,065,000 | | | Lloyds Banking Group PLC, 1.33%, due 6/15/2023 | | | 1,076,705 | (h) | |
| | 2,310,000 | | | Morgan Stanley, (SOFR + 0.70%), 0.79%, due 1/20/2023 | | | 2,317,415 | (b) | |
| | 1,000,000 | | | Wells Fargo & Co., 3.07%, due 1/24/2023 | | | 1,028,513 | | |
| | | | 10,598,693 | | |
Biotechnology 0.6% | | | |
| | 565,000 | | | Gilead Sciences, Inc., (3M USD LIBOR + 0.52%), 0.77%, due 9/29/2023 | | | 566,561 | (b) | |
Chemicals 1.5% | | | |
| | 1,080,000 | | | LYB International Finance III LLC, (3M USD LIBOR + 1.00%), 1.24%, due 10/1/2023 | | | 1,081,871 | (b) | |
| | 250,000 | | | NOVA Chemicals Corp., 5.25%, due 8/1/2023 | | | 251,250 | (c) | |
| | 190,000 | | | Valvoline, Inc., 4.38%, due 8/15/2025 | | | 196,226 | | |
| | | | 1,529,347 | | |
See Notes to Financial Statements
8
Schedule of Investments Short Duration Bond Portfolio^ (cont'd)
PRINCIPAL AMOUNT | | | | VALUE | |
Commercial Services 0.6% | | | |
$ | 95,000 | | | Jaguar Holding Co. II/PPD Development L.P., 4.63%, due 6/15/2025 | | $ | 100,188 | (c) | |
| | 240,000 | | | Nielsen Co. Luxembourg S.a.r.l., 5.00%, due 2/1/2025 | | | 246,300 | (c)(g) | |
| | 240,000 | | | Prime Security Services Borrower LLC/Prime Finance, Inc., 5.25%, due 4/15/2024 | | | 256,200 | (c) | |
| | | | 602,688 | | |
Distribution-Wholesale 0.3% | | | |
| | 290,000 | | | KAR Auction Services, Inc., 5.13%, due 6/1/2025 | | | 298,419 | (c) | |
| | 50,000 | | | Performance Food Group, Inc., 6.88%, due 5/1/2025 | | | 53,500 | (c) | |
| | | | 351,919 | | |
Diversified Financial Services 1.7% | | | |
| | | | | AerCap Ireland Capital DAC/AerCap Global Aviation Trust | | | | | |
| | 800,000 | | | 4.50%, due 9/15/2023 | | | 867,321 | | |
| | 540,000 | | | 6.50%, due 7/15/2025 | | | 645,420 | | |
| | 240,000 | | | Springleaf Finance Corp., 6.13%, due 3/15/2024 | | | 262,200 | | |
| | | | 1,774,941 | | |
Electric 0.2% | | | |
| | 280,000 | | | Talen Energy Supply LLC, 10.50%, due 1/15/2026 | | | 249,068 | (c) | |
Entertainment 0.5% | | | |
| | 260,000 | | | Live Nation Entertainment, Inc., 4.88%, due 11/1/2024 | | | 263,250 | (c) | |
| | 230,000 | | | Six Flags Theme Parks, Inc., 7.00%, due 7/1/2025 | | | 248,400 | (c) | |
| | | | 511,650 | | |
Food Service 0.2% | | | |
| | | | | Aramark Services, Inc. | | | | | |
| | 150,000 | | | 5.00%, due 4/1/2025 | | | 154,500 | (c)(g) | |
| | 80,000 | | | 6.38%, due 5/1/2025 | | | 85,500 | (c) | |
| | | | 240,000 | | |
Healthcare-Services 0.3% | | | |
| | 255,000 | | | MEDNAX, Inc., 5.25%, due 12/1/2023 | | | 258,136 | (c) | |
Home Builders 0.2% | | | |
| | 230,000 | | | TRI Pointe Group, Inc./TRI Pointe Homes, Inc., 5.88%, due 6/15/2024 | | | 251,045 | | |
Housewares 0.2% | | | |
| | 180,000 | | | CD&R Smokey Buyer, Inc., 6.75%, due 7/15/2025 | | | 192,375 | (c) | |
Leisure Time 0.1% | | | |
| | 95,000 | | | Carnival Corp., 10.50%, due 2/1/2026 | | | 110,675 | (c) | |
Machinery-Construction & Mining 0.2% | | | |
| | 240,000 | | | Terex Corp., 5.63%, due 2/1/2025 | | | 247,230 | (c) | |
Machinery-Diversified 1.3% | | | |
| | 1,385,000 | | | Otis Worldwide Corp., (3M USD LIBOR + 0.45%), 0.69%, due 4/5/2023 | | | 1,385,328 | (b) | |
See Notes to Financial Statements
9
Schedule of Investments Short Duration Bond Portfolio^ (cont'd)
PRINCIPAL AMOUNT | | | | VALUE | |
Media 1.9% | | | |
$ | 430,000 | | | Charter Communications Operating LLC/Charter Communications Operating Capital,
4.91%, due 7/23/2025 | | $ | 499,596
|
| |
| | 343,000 | | | Cumulus Media New Holdings, Inc., 6.75%, due 7/1/2026 | | | 350,690 | (c) | |
| | 550,000 | | | Fox Corp., 3.05%, due 4/7/2025 | | | 601,618 | | |
| | 180,000 | | | iHeartCommunications, Inc., 6.38%, due 5/1/2026 | | | 192,600 | | |
| | 310,000 | | | Radiate Holdco LLC/Radiate Finance, Inc., 4.50%, due 9/15/2026 | | | 319,688 | (c) | |
| | | | 1,964,192 | | |
Miscellaneous Manufacturer 1.1% | | | |
| | 1,000,000 | | | General Electric Capital Corp., (3M USD LIBOR + 1.00%), 1.22%, due 3/15/2023 | | | 1,005,800 | (b) | |
| | 70,000 | | | Hillenbrand, Inc., 5.75%, due 6/15/2025 | | | 75,600 | | |
| | | | 1,081,400 | | |
Oil & Gas 2.2% | | | |
| | 260,000 | | | Apache Corp., 4.63%, due 11/15/2025 | | | 273,000 | | |
| | 1,500,000 | | | BP Capital Markets America, Inc., (3M USD LIBOR + 0.65%), 0.89%, due 9/19/2022 | | | 1,502,676 | (b) | |
| | 210,000 | | | Occidental Petroleum Corp., 5.50%, due 12/1/2025 | | | 218,948 | | |
| | 90,000 | | | PDC Energy, Inc., 5.75%, due 5/15/2026 | | | 92,925 | | |
| | 150,000 | | | WPX Energy, Inc., 5.25%, due 9/15/2024 | | | 163,390 | | |
| | | | 2,250,939 | | |
Pharmaceuticals 2.5% | | | |
| | 1,980,000 | | | AbbVie, Inc., (3M USD LIBOR + 0.65%), 0.86%, due 11/21/2022 | | | 1,992,896 | (b) | |
| | 370,000 | | | Upjohn, Inc., 1.65%, due 6/22/2025 | | | 382,355 | (c) | |
| | 140,000 | | | Valeant Pharmaceuticals Int'l, Inc., 5.50%, due 11/1/2025 | | | 145,080 | (c) | |
| | | | 2,520,331 | | |
Pipelines 2.6% | | | |
| | 115,000 | | | Blue Racer Midstream LLC/Blue Racer Finance Corp., 7.63%, due 12/15/2025 | | | 122,475 | (c) | |
| | 340,000 | | | Buckeye Partners L.P., 4.35%, due 10/15/2024 | | | 347,650 | | |
| | 250,000 | | | DCP Midstream Operating L.P., 3.88%, due 3/15/2023 | | | 257,500 | | |
| | 130,000 | | | EQM Midstream Partners L.P., 6.00%, due 7/1/2025 | | | 142,350 | (c) | |
| | 604,000 | | | Kinder Morgan, Inc., 5.63%, due 11/15/2023 | | | 679,636 | (c) | |
| | 660,000 | | | MPLX L.P., 4.88%, due 6/1/2025 | | | 762,194 | | |
| | 90,000 | | | Rattler Midstream L.P., 5.63%, due 7/15/2025 | | | 95,062 | (c) | |
| | 140,000 | | | Tallgrass Energy Partners L.P./Tallgrass Energy Finance Corp., 7.50%, due 10/1/2025 | | | 151,143 | (c) | |
| | 140,000 | | | Targa Resources Partners L.P./Targa Resources Partners Finance Corp., 5.13%, due 2/1/2025 | | | 143,500 | | |
| | | | 2,701,510 | | |
Real Estate 0.3% | | | |
| | | | | Realogy Group LLC/Realogy Co-Issuer Corp. | | | | | |
| | 220,000 | | | 4.88%, due 6/1/2023 | | | 224,400 | (c) | |
| | 115,000 | | | 7.63%, due 6/15/2025 | | | 124,858 | (c) | |
| | | | 349,258 | | |
Real Estate Investment Trusts 0.5% | | | |
| | 240,000 | | | ESH Hospitality, Inc., 5.25%, due 5/1/2025 | | | 246,000 | (c) | |
| 115,000 |
| | MGM Growth Properties Operating Partnership L.P./MGP Finance Co-Issuer, Inc.,
4.63%, due 6/15/2025 | |
| 123,165 | (c) | |
| | 150,000 | | | RHP Hotel Properties L.P./RHP Finance Corp., 5.00%, due 4/15/2023 | | | 150,375 | | |
| | | | 519,540 | | |
See Notes to Financial Statements
10
Schedule of Investments Short Duration Bond Portfolio^ (cont'd)
PRINCIPAL AMOUNT | | | | VALUE | |
Retail 0.2% | | | |
$ | 190,000 | | | Staples, Inc., 7.50%, due 4/15/2026 | | $ | 198,411 | (c) | |
Semiconductors 1.0% | | | |
| | 750,000 | | | Broadcom, Inc., 3.15%, due 11/15/2025 | | | 818,336 | | |
| | 225,000 | | | Microchip Technology, Inc., 4.25%, due 9/1/2025 | | | 238,019 | (c) | |
| | | | 1,056,355 | | |
Software 0.7% | | | |
| | 145,000 | | | BY Crown Parent LLC/BY Bond Finance, Inc., 4.25%, due 1/31/2026 | | | 148,625 | (c) | |
| | 540,000 | | | Infor, Inc., 1.45%, due 7/15/2023 | | | 548,689 | (c) | |
| | | | 697,314 | | |
Telecommunications 2.2% | | | |
| | 550,000 | | | AT&T, Inc., 1.65%, due 2/1/2028 | | | 560,908 | | |
| | 450,000 | | | Numericable-SFR SA, 7.38%, due 5/1/2026 | | | 473,625 | (c) | |
| | 550,000 | | | T-Mobile USA, Inc., 3.50%, due 4/15/2025 | | | 607,739 | (c) | |
| | 550,000 | | | Verizon Communications, Inc., 2.63%, due 8/15/2026 | | | 602,351 | | |
| | | | 2,244,623 | | |
| | | | | Total Corporate Bonds (Cost $39,935,874) | | | 41,175,716 | | |
Asset-Backed Securities 7.3% | | | |
| | 116,926 | | | Ally Auto Receivables Trust, Ser. 2018-1, Class A3, 2.35%, due 6/15/2022 | | | 117,243 | | |
| 500,000 |
| | Benefit Street Partners CLO XIX Ltd., Ser. 2019-19A, Class D, (3M USD LIBOR + 3.80%),
4.04%, due 1/15/2033 | |
| 501,611 | (b)(c) | |
| 754,219 |
| | Consumer Loan Underlying Bond Club Certificate Issuer Trust I, Ser. 2019-HP1, Class A,
2.59%, due 12/15/2026 | |
| 762,628 | (c) | |
| 433,352 |
| | Fannie Mae Grantor Trust, Ser. 2003-T4, Class 1A, (1M USD LIBOR + 0.22%),
0.35%, due 9/26/2033 | |
| 430,110 | (b) | |
| | 235,719 | | | Lending Point Asset Securitization Trust, Ser. 2020-1, Class A, 2.51%, due 2/10/2026 | | | 235,927 | (c) | |
| | 500,000 | | | Mariner CLO LLC, Ser. 2015-1A, Class DR2, (3M USD LIBOR + 2.85%), 3.07%, due 4/20/2029 | | | 483,868 | (b)(c) | |
| | 415,913 | | | Marlette Funding Trust, Ser. 2020-1A, Class A, 2.24%, due 3/15/2030 | | | 418,420 | (c) | |
| | 500,000 | | | Milos CLO Ltd., Ser. 2017-1A, Class DR, (3M USD LIBOR + 2.75%), 2.97%, due 10/20/2030 | | | 478,243 | (b)(c) | |
| 500,000 |
| | OHA Loan Funding Ltd., Ser. 2016-1A, Class DR, (3M USD LIBOR + 3.00%),
3.22%, due 1/20/2033 | |
| 479,870 | (b)(c) | |
| 500,000 |
| | Palmer Square CLO Ltd., Ser. 2015-2A, Class CR2, (3M USD LIBOR + 2.75%),
2.97%, due 7/20/2030 | |
| 491,859 | (b)(c) | |
| | 571,513 | | | SLM Student Loan Trust, Ser. 2013-2, Class A, (1M USD LIBOR + 0.45%), 0.60%, due 6/25/2043 | | | 564,639 | (b) | |
| | 534,719 | | | SoFi Consumer Loan Program Trust, Ser. 2020-1, Class A, 2.02%, due 1/25/2029 | | | 540,312 | (c) | |
| 500,000 |
| | Symphony CLO XXII Ltd., Ser. 2020-22A, Class D, (3M USD LIBOR + 3.15%),
3.37%, due 4/18/2033 | |
| 490,499 | (b)(c) | |
| | 500,000 | | | TICP CLO VII Ltd., Ser. 2017-7A, Class DR, (3M USD LIBOR + 3.20%), 3.44%, due 4/15/2033 | | | 499,995 | (b)(c) | |
| | 500,000 | | | TICP CLO XV Ltd., Ser. 2020-15A, Class D, (3M USD LIBOR + 3.15%), 3.37%, due 4/20/2033 | | | 492,624 | (b)(c) | |
| | 500,000 | | | TRESTLES CLO III Ltd., Ser. 2020-3A, Class D, (3M USD LIBOR + 3.25%), 3.47%, due 1/20/2033 | | | 490,887 | (b)(c) | |
| | | | | Total Asset-Backed Securities (Cost $7,508,066) | | | 7,478,735 | | |
Short-Term Investments 6.8% | | | |
Commercial Paper 1.1% | | | |
| | 1,100,000 | | | Energy Transfer Partners L.P., 0.80%, due 1/12/2021 | | | 1,099,843 | (i) | |
See Notes to Financial Statements
11
Schedule of Investments Short Duration Bond Portfolio^ (cont'd)
NUMBER OF SHARES | | | | VALUE | |
Investment Companies 5.7% | | | |
| | 5,517,593 | | | State Street Institutional U.S. Government Money Market Fund Premier Class, 0.03%(j) | | $ | 5,517,593 | (k) | |
| | 384,325 | | | State Street Navigator Securities Lending Government Money Market Portfolio, 0.10%(j) | | | 384,325 | (l) | |
| | | | | Total Short-Term Investments (Cost $7,001,649) | | | 7,001,761 | | |
| | | | | Total Investments 99.7% (Cost $101,134,446) | | | 102,745,453 | | |
| | | | | Other Assets Less Liabilities 0.3% | | | 307,823 | (m) | |
| | | | | Net Assets 100.0% | | $ | 103,053,276 | | |
(a) Index-linked bond whose principal amount adjusts according to a government retail price index.
(b) Variable or floating rate security. The interest rate shown was the current rate as of December 31, 2020 and changes periodically.
(c) Securities were purchased under Rule 144A of the Securities Act of 1933, as amended, or are otherwise restricted and, unless registered under the Securities Act of 1933 or exempted from registration, may only be sold to qualified institutional investors or may have other restrictions on resale. At December 31, 2020, these securities amounted to $26,121,570, which represents 25.3% of net assets of the Fund.
(d) Variable or floating rate security where the stated interest rate is not based on a published reference rate and spread. Rather, the interest rate adjusts periodically based on changes in current interest rates and prepayments on the underlying pool of assets. The interest rate shown was the current rate as of December 31, 2020.
(e) Step Bond. Coupon rate is a fixed rate for an initial period that either resets at a specific date or may reset in the future contingent upon a predetermined trigger. The interest rate shown was the current rate as of December 31, 2020.
(f) Interest only security. These securities represent the right to receive the monthly interest payments on an underlying pool of mortgages. Payments of principal on the pool reduce the value of the "interest only" holding.
(g) The security or a portion of this security is on loan at December 31, 2020. Total value of all such securities at December 31, 2020 amounted to $377,265 for the Fund (see Note A of the Notes to Financial Statements).
(h) Security issued at a fixed coupon rate, which converts to a variable rate at a future date. Rate shown is the rate in effect as of period end.
(i) Rate shown was the discount rate at the date of purchase.
(j) Represents 7-day effective yield as of December 31, 2020.
(k) All or a portion of this security is segregated in connection with obligations for futures with a total value of $5,517,593.
(l) Represents investment of cash collateral received from securities lending.
(m) Includes the impact of the Fund's open positions in derivatives at December 31, 2020.
See Notes to Financial Statements
12
Schedule of Investments Short Duration Bond Portfolio^ (cont'd)
Derivative Instruments
Futures contracts ("futures")
At December 31, 2020, open positions in futures for the Fund were as follows:
Long Futures:
Expiration Date | | Number of
Contracts | | Open Contracts | | Notional
Amount | | Value and
Unrealized
Appreciation/
(Depreciation) | |
3/2021 | | | 192 | | | U.S. Treasury Note, 2 Year | | $ | 42,427,500 | | | $ | 42,000 | | |
Total Long Positions | | | | | | $ | 42,427,500 | | | $ | 42,000 | | |
Short Futures:
Expiration Date | | Number of
Contracts | | Open Contracts | | Notional
Amount | | Value and
Unrealized
Appreciation/
(Depreciation) | |
3/2021 | | | 20 | | | U.S. Treasury Bond, Ultra10 Year | | $ | (3,127,188 | ) | | $ | 9,687 | | |
3/2021 | | | 118 | | | U.S. Treasury Note, 5 Year | | | (14,887,359 | ) | | | (35,031 | ) | |
3/2021 | | | 1 | | | U.S. Treasury Note, 10 Year | | | (138,078 | ) | | | (164 | ) | |
3/2021 | | | 1 | | | U.S. Treasury Ultra Bond | | | (213,563 | ) | | | (844 | ) | |
Total Short Positions | | | | | | $ | (18,366,188 | ) | | $ | (26,352 | ) | |
Total Futures | | | | | | | | $ | 15,648 | | |
At December 31, 2020, the Fund had $160,099 deposited in a segregated account to cover margin requirements on open futures.
For the year ended December 31, 2020, the average notional value for the months where the Fund had futures outstanding was $56,349,966 for long positions and $(13,584,010) for short positions.
The following is a summary, categorized by Level (see Note A of Notes to Financial Statements), of inputs used to value the Fund's investments as of December 31, 2020:
Asset Valuation Inputs | | Level 1 | | Level 2 | | Level 3 | | Total | |
Investments: | |
U.S. Treasury Obligations | | $ | — | | | $ | 2,203,374 | | | $ | — | | | $ | 2,203,374 | | |
| Mortgage-Backed Securities(a) | | | — | | | | 44,885,867 | | | | — | | | | 44,885,867 | | |
| Corporate Bonds(a) | | | — | | | | 41,175,716 | | | | — | | | | 41,175,716 | | |
Asset-Backed Securities | | | — | | | | 7,478,735 | | | | — | | | | 7,478,735 | | |
| Short-Term Investments(a) | | | — | | | | 7,001,761 | | | | — | | | | 7,001,761 | | |
Total Investments | | $ | — | | | $ | 102,745,453 | | | $ | — | | | $ | 102,745,453 | | |
(a) The Schedule of Investments provides information on the industry or sector categorization for the portfolio.
See Notes to Financial Statements
13
Schedule of Investments Short Duration Bond Portfolio^ (cont'd)
The following is a summary, categorized by Level (see Note A of Notes to Financial Statements), of inputs used to value the Fund's derivatives as of December 31, 2020:
Other Financial Instruments | | Level 1 | | Level 2 | | Level 3 | | Total | |
| Futures(a) | |
Assets | | $ | 51,687 | | | $ | — | | | $ | — | | | $ | 51,687 | | |
Liabilities | | | (36,039 | ) | | | — | | | | — | | | | (36,039 | ) | |
Total | | $ | 15,648 | | | $ | — | | | $ | — | | | $ | 15,648 | | |
(a) Futures are reported at the cumulative unrealized appreciation/(depreciation) of the instrument.
^ A balance indicated with a "—", reflects either a zero balance or an amount that rounds to less than 1.
See Notes to Financial Statements
14
Statement of Assets and Liabilities
Neuberger Berman Advisers Management Trust
| | | SHORT DURATION
BOND PORTFOLIO | |
| | | December 31, 2020 | |
Assets | |
Investments in securities, at value*† (Note A)—see Schedule of Investments: | |
| Unaffiliated issuers(a) | | $ | 102,745,453 | | |
Cash | | | 3,244 | | |
Cash collateral segregated for futures contracts (Note A) | | | 160,099 | | |
Interest receivable | | | 498,260 | | |
Receivable for accumulated variation margin on futures contracts (Note A) | | | 15,648 | | |
Receivable for Fund shares sold | | | 184,427 | | |
Receivable for securities lending income (Note A) | | | 176 | | |
Prepaid expenses and other assets | | | 3,129 | | |
Total Assets | | | 103,610,436 | | |
Liabilities | |
Payable to investment manager—net (Note B) | | | 14,840 | | |
Payable for Fund shares redeemed | | | 38,145 | | |
Payable to administrator—net (Note B) | | | 34,917 | | |
Payable to trustees | | | 12,718 | | |
Payable for audit fees | | | 50,522 | | |
Payable for loaned securities collateral (Note A) | | | 384,325 | | |
Other accrued expenses and payables | | | 21,693 | | |
Total Liabilities | | | 557,160 | | |
Net Assets | | $ | 103,053,276 | | |
Net Assets consist of: | |
Paid-in capital | | $ | 125,765,597 | | |
Total distributable earnings/(losses) | | | (22,712,321 | ) | |
Net Assets | | $ | 103,053,276 | | |
Shares Outstanding ($.001 par value; unlimited shares authorized) | | | 9,645,618 | | |
Net Asset Value, offering and redemption price per share | |
Class I | | $ | 10.68 | | |
†Securities on loan, at value: | |
Unaffiliated issuers | | $ | 377,265 | | |
*Cost of Investments: | | | |
(a) Unaffiliated Issuers | | $ | 101,134,446 | | |
See Notes to Financial Statements
15
Neuberger Berman Advisers Management Trust
| | | SHORT DURATION
BOND PORTFOLIO | |
| | | For the
Fiscal Year Ended
December 31, 2020 | |
Investment Income: | |
Income (Note A): | |
Interest and other income—unaffiliated issuers | | $ | 3,186,753 | | |
Income from securities loaned—net | | | 4,062 | | |
Total income | | $ | 3,190,815 | | |
Expenses: | |
Investment management fees (Note B) | | | 187,540 | | |
Administration fees (Note B) | | | 409,053 | | |
Shareholder servicing agent fees | | | 65 | | |
Audit fees | | | 51,022 | | |
Custodian and accounting fees | | | 81,641 | | |
Insurance | | | 3,751 | | |
Legal fees | | | 49,050 | | |
Shareholder reports | | | 32,159 | | |
Trustees' fees and expenses | | | 51,639 | | |
Interest | | | 856 | | |
Miscellaneous | | | 9,905 | | |
Total expenses | | | 876,681 | | |
Net investment income/(loss) | | $ | 2,314,134 | | |
Realized and Unrealized Gain/(Loss) on Investments (Note A): | |
Net realized gain/(loss) on: | |
Transactions in investment securities of unaffiliated issuers | | | (829,770 | ) | |
Expiration or closing of futures contracts | | | 340,470 | | |
Change in net unrealized appreciation/(depreciation) in value of: | |
Investment securities of unaffiliated issuers | | | 1,234,141 | | |
Futures contracts | | | 39,273 | | |
Net gain/(loss) on investments | | | 784,114 | | |
Net increase/(decrease) in net assets resulting from operations | | $ | 3,098,248 | | |
See Notes to Financial Statements
16
Statements of Changes in Net Assets
Neuberger Berman Advisers Management Trust
| | | SHORT DURATION
BOND PORTFOLIO | |
| | | Fiscal Year
Ended
December 31,
2020 | | Fiscal Year
Ended
December 31,
2019 | |
Increase/(Decrease) in Net Assets: | |
From Operations (Note A): | |
Net investment income/(loss) | | $ | 2,314,134 | | | $ | 1,895,155 | | |
Net realized gain/(loss) on investments | | | (489,300 | ) | | | 797,749 | | |
Change in net unrealized appreciation/(depreciation) of investments | | | 1,273,414 | | | | 1,297,661 | | |
Net increase/(decrease) in net assets resulting from operations | | | 3,098,248 | | | | 3,990,565 | | |
Distributions to Shareholders From (Note A): | |
Distributable earnings | | | (2,399,936 | ) | | | (2,162,405 | ) | |
From Fund Share Transactions (Note D): | |
Proceeds from shares sold | | | 25,404,721 | | | | 12,077,620 | | |
Proceeds from reinvestment of dividends and distributions | | | 2,399,936 | | | | 2,162,405 | | |
Payments for shares redeemed | | | (32,484,510 | ) | | | (26,632,481 | ) | |
Net increase/(decrease) from Fund share transactions | | | (4,679,853 | ) | | | (12,392,456 | ) | |
Net Increase/(Decrease) in Net Assets | | | (3,981,541 | ) | | | (10,564,296 | ) | |
Net Assets: | |
Beginning of year | | | 107,034,817 | | | | 117,599,113 | | |
End of year | | $ | 103,053,276 | | | $ | 107,034,817 | | |
See Notes to Financial Statements
17
Notes to Financial Statements Short Duration Bond Portfolio
Note A—Summary of Significant Accounting Policies:
1 General: Neuberger Berman Advisers Management Trust (the "Trust") is a Delaware statutory trust organized pursuant to an Amended and Restated Trust Instrument dated March 27, 2014. The Trust is registered as an open-end management investment company under the Investment Company Act of 1940, as amended (the "1940 Act"), and its shares are registered under the Securities Act of 1933, as amended. Neuberger Berman Advisers Management Trust Short Duration Bond Portfolio (the "Fund") is a separate operating series of the Trust and is diversified. The Fund currently offers only Class I shares. The Trust's Board of Trustees (the "Board") may establish additional series or classes of shares without the approval of shareholders.
A balance indicated with a "—", reflects either a zero balance or a balance that rounds to less than 1.
The assets of each Fund belong only to that Fund, and the liabilities of each Fund are borne solely by that Fund and no other series of the Trust.
The Fund is an investment company and accordingly follows the investment company accounting and reporting guidance of the Financial Accounting Standards Board Accounting Standards Codification ("ASC") Topic 946 "Financial Services—Investment Companies."
The preparation of financial statements in accordance with U.S. generally accepted accounting principles ("GAAP") requires Neuberger Berman Investment Advisers LLC ("Management" or "NBIA") to make estimates and assumptions at the date of the financial statements. Actual results could differ from those estimates.
Shares of the Fund are not available to the general public and may be purchased only by life insurance companies to serve as an investment vehicle for premiums paid under their variable annuity and variable life insurance contracts and to certain qualified pension and other retirement plans.
2 Portfolio valuation: In accordance with ASC 820 "Fair Value Measurement" ("ASC 820"), all investments held by each of the Funds are carried at the value that Management believes the Fund would receive upon selling an investment in an orderly transaction to an independent buyer in the principal or most advantageous market for the investment under current market conditions. Various inputs, including the volume and level of activity for the asset or liability in the market, are considered in valuing the Fund's investments, some of which are discussed below. Significant Management judgment may be necessary to value investments in accordance with ASC 820.
ASC 820 established a three-tier hierarchy of inputs to create a classification of value measurements for disclosure purposes. The three-tier hierarchy of inputs is summarized in the three broad Levels listed below.
• Level 1—unadjusted quoted prices in active markets for identical investments
• Level 2—other observable inputs (including quoted prices for similar investments, interest rates, prepayment speeds, credit risk, amortized cost, etc.)
• Level 3—unobservable inputs (including the Fund's own assumptions in determining the fair value of investments)
The inputs or methodology used for valuing an investment are not necessarily an indication of the risk associated with investing in those securities.
The value of the Fund's investments in debt securities is determined by Management primarily by obtaining valuations from independent pricing services based on readily available bid quotations, or if quotations are not available, by methods which include various considerations based on security type (generally Level 2 inputs). In addition to the consideration of yields or prices of securities of comparable quality, coupon, maturity and type, indications as to values from dealers, and general market conditions, the following is a description of other Level 2
18
inputs and related valuation techniques used by independent pricing services to value certain types of debt securities held by the Fund:
Corporate Bonds. Inputs used to value corporate debt securities generally include relative credit information, observed market movements, sector news, U.S. Treasury yield curve or relevant benchmark curve, and other market information, which may include benchmark yield curves, reported trades, broker-dealer quotes, issuer spreads, comparable securities, and reference data, such as market research publications, when available ("Other Market Information").
U.S. Treasury Obligations. Inputs used to value U.S. Treasury securities generally include quotes from several inter-dealer brokers and Other Market Information.
Asset-Backed Securities and Mortgage-Backed Securities. Inputs used to value asset-backed securities and mortgage-backed securities generally include models that consider a number of factors, which may include the following: prepayment speeds, cash flows, spread adjustments and Other Market Information.
Commercial Paper. Inputs to value commercial paper include quoted prices for similar assets, benchmark yield curves, market corroborated inputs, days to maturity, issue date, coupon rate (where relevant), settlement date convention and Other Market Information.
The value of futures contracts is determined by Management by obtaining valuations from independent pricing services at the settlement price at the market close (Level 1 inputs).
Management has developed a process to periodically review information provided by independent pricing services for all types of securities.
Investments in non-exchange traded investment companies are valued using the respective fund's daily calculated net asset value ("NAV") per share (Level 2 inputs).
If a valuation is not available from an independent pricing service, or if Management has reason to believe that the valuation received does not represent the amount the Fund might reasonably expect to receive on a current sale in an orderly transaction, Management seeks to obtain quotations from brokers or dealers (generally considered Level 2 or Level 3 inputs depending on the number of quotes available). If such quotations are not readily available, the security is valued using methods the Board has approved in the good-faith belief that the resulting valuation will reflect the fair value of the security. Inputs and assumptions considered in determining the fair value of a security based on Level 2 or Level 3 inputs may include, but are not limited to, the type of the security; the initial cost of the security; the existence of any contractual restrictions on the security's disposition; the price and extent of public trading in similar securities of the issuer or of comparable companies; quotations or evaluated prices from broker-dealers and/or pricing services; information obtained from the issuer and/or analysts; an analysis of the company's or issuer's financial statements; an evaluation of the inputs that influence the issuer and the market(s) in which the security is purchased and sold.
Fair value prices are necessarily estimates, and there is no assurance that such a price will be at or close to the price at which the security is next quoted or next trades.
3 Foreign currency translations: The accounting records of the Fund are maintained in U.S. dollars. Foreign currency amounts are normally translated into U.S. dollars using the exchange rate as of 4:00 p.m. Eastern Time, on days the NYSE is open for business, to determine the value of investments, other assets and liabilities. Purchase and sale prices of securities, and income and expenses, are translated into U.S. dollars at the prevailing rate of exchange on the respective dates of such transactions. Net unrealized foreign currency gain/(loss), if any, arises from changes in the value of assets and liabilities, other than investments in securities, as a result of changes in exchange rates and is stated separately in the Statement of Operations.
4 Securities transactions and investment income: Securities transactions are recorded on trade date for financial reporting purposes. Interest income, including accretion of discount (adjusted for original issue discount, where
19
applicable) and amortization of premium, where applicable, is recorded on the accrual basis. Realized gains and losses from securities transactions and foreign currency transactions, if any, are recorded on the basis of identified cost and stated separately in the Statement of Operations.
5 Income tax information: The Fund is treated as a separate entity for U.S. federal income tax purposes. It is the policy of the Fund to continue to qualify for treatment as a regulated investment company ("RIC") by complying with the requirements of the U.S. Internal Revenue Code applicable to RICs and to distribute substantially all of its net investment income and net realized capital gains to its shareholders. To the extent the Fund distributes substantially all of its net investment income and net realized capital gains to shareholders, no federal income or excise tax provision is required.
The Fund has adopted the provisions of ASC 740 "Income Taxes" ("ASC 740"). ASC 740 sets forth a minimum threshold for financial statement recognition of a tax position taken, or expected to be taken, in a tax return. The Fund recognizes interest and penalties, if any, related to unrecognized tax positions as an income tax expense in the Statement of Operations. The Fund is subject to examination by U.S. federal and state tax authorities for returns filed for the tax years for which the applicable statutes of limitations have not yet expired. As of December 31, 2020, the Fund did not have any unrecognized tax positions.
For federal income tax purposes, the estimated cost in value of investments held at December 31, 2020 was $101,375,132. The estimated gross unrealized appreciation was $2,238,526 and estimated gross unrealized depreciation was $868,205 resulting in net unrealized appreciation of $1,370,321 based on cost for U.S. federal income tax purposes.
Income distributions and capital gain distributions are determined in accordance with income tax regulations, which may differ from GAAP. These differences are primarily due to differing treatments of income and gains on various investment securities held by the Fund, timing differences and differing characterization of distributions made by the Fund. The Fund may also utilize earnings and profits distributed to shareholders on redemption of their shares as a part of the dividends-paid deduction for income tax purposes.
Any permanent differences resulting from different book and tax treatment are reclassified at year-end and have no impact on net income, NAV or NAV per share of the Fund. For the year ended December 31, 2020, there were no permanent differences requiring a reclassification between total distributable earnings/(losses) and paid-in capital.
The tax character of distributions paid during the years ended December 31, 2020, and December 31, 2019, was as follows:
Distributions Paid From: | |
Ordinary Income | | Total | |
| 2020 | | 2019 | | 2020 | | 2019 | |
| $ | 2,399,936 | | | $ | 2,162,405 | | | $ | 2,399,936 | | | $ | 2,162,405 | | |
As of December 31, 2020, the components of distributable earnings (accumulated losses) on a U.S. federal income tax basis were as follows:
Undistributed
Ordinary
Income | | Undistributed
Long-Term
Capital Gain | | Unrealized
Appreciation/
(Depreciation) | | Loss
Carryforwards
and Deferrals | | Other
Temporary
Differences | | Total | |
| $ | 2,939,840 | | | $ | — | | | $ | 1,370,321 | | | $ | (27,022,482 | ) | | $ | — | | | $ | (22,712,321 | ) | |
The temporary differences between book basis and tax basis distributable earnings are primarily due to amortization of bond premium and mark-to-market adjustments on futures.
20
To the extent the Fund's net realized capital gains, if any, can be offset by capital loss carryforwards, it is the policy of the Fund not to distribute such gains. Capital loss carryforward rules allow for RICs to carry forward capital losses indefinitely and to retain the character of capital loss carryforwards as short-term or long-term. As determined at December 31, 2020, the Fund had unused capital loss carryforwards available for federal income tax purposes to offset future net realized capital gains, if any, as follows:
Capital Loss Carryforwards | |
Long-Term | | Short-Term | |
$ | 23,758,954 | | | $ | 3,263,528 | | |
6 Distributions to shareholders: The Fund may earn income, net of expenses, daily on its investments. Distributions from net investment income and net realized capital gains, if any, are generally distributed once a year (usually in October) and are recorded on the ex-date.
7 Foreign taxes: Foreign taxes withheld, if any, represent amounts withheld by foreign tax authorities, net of refunds recoverable.
8 Expense allocation: Certain expenses are applicable to multiple funds within the complex of related investment companies. Expenses directly attributable to a fund are charged to that fund. Expenses of the Trust that are not directly attributable to a particular series of the Trust (e.g., the Fund) are allocated among the series of the Trust, on the basis of relative net assets, except where a more appropriate allocation of expenses to each of the series can otherwise be made fairly. Expenses borne by the complex of related investment companies, which includes open-end and closed-end investment companies for which NBIA serves as investment manager, that are not directly attributable to a particular investment company in the complex (e.g., the Trust) or series thereof are allocated among the investment companies in the complex or series thereof on the basis of relative net assets, except where a more appropriate allocation of expenses to each of the investment companies in the complex or series thereof can otherwise be made fairly.
9 Investments in foreign securities: Investing in foreign securities may involve sovereign and other risks, in addition to the credit and market risks normally associated with domestic securities. These additional risks include the possibility of adverse political and economic developments (including political instability, nationalization, expropriation, or confiscatory taxation) and the potentially adverse effects of unavailability of public information regarding issuers, less governmental supervision and regulation of financial markets, reduced liquidity of certain financial markets, and the lack of uniform accounting, auditing, and financial reporting standards or the application of standards that are different or less stringent than those applied in the United States. Foreign securities also may experience greater price volatility, higher rates of inflation, and delays in settlement.
10 Investment company securities and exchange-traded funds: The Fund may invest in shares of other registered investment companies, including exchange-traded funds ("ETFs"), within the limitations prescribed by (a) the 1940 Act, (b) the exemptive order from the Securities and Exchange Commission ("SEC") that permits the Fund to invest in both affiliated and unaffiliated investment companies, including ETFs, in excess of the limits in Section 12(d)(1)(A) of the 1940 Act, subject to the terms and conditions of such order, or (c) the ETF's exemptive order or other relief. Some ETFs seek to track the performance of a particular market index. These indices include both broad-based market indices and more narrowly-based indices, including those relating to particular sectors, markets, regions or industries. However, some ETFs have an actively-managed investment objective. ETF shares are traded like traditional equity securities on a national securities exchange or NASDAQ. The Fund will indirectly bear its proportionate share of any management fees and other expenses paid by such other investment companies, which will decrease returns.
11 When-issued/delayed delivery securities: The Fund may purchase securities with delivery or payment to occur at a later date beyond the normal settlement period. At the time the Fund enters into a commitment to purchase a security, the transaction is recorded and the value of the security is reflected in the NAV. The price of such security and the date when the security will be delivered and paid for are fixed at the time the transaction is negotiated. The
21
value of the security may vary with market fluctuations. No interest accrues to the Fund until payment takes place. At the time the Fund enters into this type of transaction it is required to segregate cash or other liquid assets at least equal to the amount of the commitment. When-issued and delayed delivery transactions can have a leverage-like effect on the Fund, which can increase fluctuations in the Fund's NAV. Certain risks may arise upon entering into when-issued or delayed delivery securities transactions from the potential inability of counterparties to meet the terms of their contracts or if the issuer does not issue the securities due to political, economic, or other factors. Additionally, losses may arise due to changes in the value of the underlying securities.
The Fund may also enter into a TBA agreement and "roll over" such agreement prior to the settlement date by selling the obligation to purchase the pools set forth in the agreement and entering into a new TBA agreement for future delivery of pools of mortgage-backed securities. TBA mortgage-backed securities may increase prepayment risks because the underlying mortgages may be less favorable than anticipated by the Fund.
12 Derivative instruments: The Fund's use of derivatives during the year ended December 31, 2020, is described below. Please see the Schedule of Investments for the Fund open positions in derivatives, if any, at December 31, 2020. The Fund has adopted the provisions of ASC 815 "Derivatives and Hedging" ("ASC 815"). The disclosure requirements of ASC 815 distinguish between derivatives that qualify for hedge accounting and those that do not. Because investment companies value their derivatives at fair value and recognize changes in fair value through the Statement of Operations, they do not qualify for hedge accounting. Accordingly, even though the Fund's investments in derivatives may represent economic hedges, they are considered non-hedge transactions for purposes of this disclosure.
In October 2020, the SEC adopted new regulations governing the use of derivatives by registered investment companies. Rule 18f-4 will impose limits on the amount of derivatives a fund could enter into, eliminate the asset segregation framework currently used by funds to comply with Section 18 of the 1940 Act, and require funds whose use of derivatives is more than a limited specified exposure to establish and maintain a derivatives risk management program and appoint a derivatives risk manager. While the new rule will become effective February 19, 2021, funds will not be required to fully comply with the new rule until August 19, 2022. It is not currently clear what impact, if any, the new rule will have on the availability, liquidity or performance of derivatives. When fully implemented, the new rule may require changes in how a Fund will use derivatives, may adversely affect a Fund's performance and may increase costs related to a Fund's use of derivatives.
Futures contracts: During the year ended December 31, 2020, the Fund used U.S. Treasury futures to manage the duration of the Fund.
At the time the Fund enters into a futures contract, it is required to deposit with the futures commission merchant a specified amount of cash or liquid securities, known as "initial margin," which is a percentage of the value of the futures contract being traded that is set by the exchange upon which the futures contract is traded. Each day, the futures contract is valued at the official settlement price of the board of trade or U.S. commodity exchange on which such futures contract is traded. Subsequent payments, known as "variation margin," to and from the broker are made on a daily basis, or as needed, as the market price of the futures contract fluctuates. Daily variation margin adjustments, arising from this "mark to market," are recorded by the Fund as unrealized gains or losses.
Although some futures by their terms call for actual delivery or acquisition of the underlying securities or currency, in most cases the contracts are closed out prior to delivery by offsetting purchases or sales of matching futures. When the contracts are closed or expire, the Fund recognizes a gain or loss. Risks of entering into futures contracts include the possibility there may be an illiquid market, possibly at a time of rapidly declining prices, and/or a change in the value of the contract may not correlate with changes in the value of the underlying securities. Futures executed on regulated futures exchanges have minimal counterparty risk to the Fund because the exchange's clearinghouse assumes the position of the counterparty in each transaction. Thus, the Fund is exposed to risk only in connection with the clearinghouse and not in connection with the original counterparty to the transaction.
22
For U.S. federal income tax purposes, the futures transactions undertaken by the Fund may cause the Fund to recognize gains or losses from marking contracts to market even though its positions have not been sold or terminated, may affect the character of the gains or losses recognized as long-term or short-term, and may affect the timing of some capital gains and losses realized by the Fund. Also, the Fund's losses on transactions involving futures contracts may be deferred rather than being taken into account currently in calculating the Fund's taxable income.
At December 31, 2020, the Fund listed below had the following derivatives (which did not qualify as hedging instruments under ASC 815), grouped by primary risk exposure:
Asset Derivatives
Derivative Type | | Statement of
Assets and Liabilities
Location | | Interest
Rate Risk | | Total | |
Futures | | Receivable/Payable
for accumulated variation
margin on futures contracts | | $ | 51,687 |
| | $ | 51,687 |
| |
Total Value—Assets | | | | $ | 51,687 | | | $ | 51,687 | | |
Liability Derivatives
Derivative Type | | Statement of
Assets and Liabilities
Location | | Interest
Rate Risk | | Total | |
Futures | | Receivable/Payable
for accumulated variation
margin on futures contracts | | $ | (36,039 | ) | | $ | (36,039 | ) | |
Total Value Liabilities | | | | $ | (36,039 | ) | | $ | (36,039 | ) | |
The impact of the use of these derivative instruments on the Statement of Operations during the year ended December 31, 2020, was as follows:
Realized Gain/(Loss)
Derivative Type | | Statement of
Operations Location | | Interest
Rate Risk | | Total | |
Futures | | Net realized gain/(loss)
on: Expiration or closing
of futures contracts | | $ | 340,470 |
| | $ | 340,470 |
| |
Total Realized Gain/(Loss) | | | | $ | 340,470 | | | $ | 340,470 | | |
Change in Appreciation/(Depreciation)
Derivative Type | | Statement of
Operations Location | | Interest
Rate Risk | | Total | |
Short Duration | |
Futures | | Change in net unrealized
appreciation/(depreciation)
in value of: Futures contracts | | $ | 39,273 |
| | $ | 39,273 |
| |
Total Change in Appreciation/(Depreciation) | | | | $ | 39,273 | | | $ | 39,273 | | |
13 Securities lending: The Fund, using State Street Bank and Trust Company ("State Street") as its lending agent, may loan securities to qualified brokers and dealers in exchange for negotiated lender's fees. These fees, if any, would be disclosed within the Statement of Operations under the caption "Income from securities loaned-net" and are net of expenses retained by State Street as compensation for its services as lending agent.
23
The initial cash collateral received by the Fund at the beginning of each transaction shall have a value equal to at least 102% of the prior day's market value of the loaned securities (105% in the case of international securities). Thereafter, the value of the cash collateral is monitored on a daily basis, and cash collateral is moved daily between a counterparty and the Fund until the close of the transaction. The Fund may only receive collateral in the form of cash (U.S. dollars). Cash collateral is generally invested in a money market fund registered under the 1940 Act that is managed by an affiliate of State Street. The risks associated with lending portfolio securities include, but are not limited to, possible delays in receiving additional collateral or in the recovery of the loaned securities. Any increase or decrease in the fair value of the securities loaned and any interest earned or dividends paid or owed on those securities during the term of the loan would accrue to the Fund.
As of December 31, 2020, the Fund had outstanding loans of securities to certain approved brokers, with a value of $377,265, for which it received collateral as follows:
| | | Remaining Contractual Maturity of the Agreements | |
| | | Overnight and
Continuous | | Less Than
30 Days | | Between
30 & 90 Days | | Greater Than
90 Days | | Total | |
Securities Lending Transactions(a) | |
Corporate Bonds | | $ | 384,325 | | | $ | — | | | $ | — | | | $ | — | | | $ | 384,325 | | |
(a) Amounts represent the payable for loaned securities collateral received.
The Fund is required to disclose both gross and net information for assets and liabilities related to derivatives, repurchase and reverse repurchase agreements, and securities lending and securities borrowing transactions, if any, that are eligible for offset or subject to an enforceable master netting or similar agreement. The Fund's securities lending assets at fair value are reported gross in the Statement of Assets and Liabilities. The following tables present the Fund's securities lending assets by counterparty and net of the related collateral received by the Fund for assets as of December 31, 2020.
Description | | Gross Amounts of
Recognized Assets | | Gross Amounts
Offset in the
Statement of
Assets and
Liabilities | | Net Amounts of Assets Presented in the
Statement of Assets and Liabilities | |
Securities Lending | | $ | 377,265 | | | $ | — | | | $ | 377,265 | | |
Total | | $ | 377,265 | | | $ | — | | | $ | 377,265 | | |
Gross Amounts Not Offset in the Statement of Assets and Liabilities
Counterparty | | Net Amounts of
Assets Presented in
the Statement of
Assets and Liabilities | | Liabilities
Available
for Offset | | Cash Collateral
Received(a) | | Net Amount(b) | |
SSB | | $ | 377,265 | | | $ | — | | | $ | (377,265 | ) | | $ | — | | |
Total | | $ | 377,265 | | | $ | — | | | $ | (377,265 | ) | | $ | — | | |
(a) Collateral received is limited to an amount not to exceed 100% of the net amount of assets in the tables presented above.
(b) Net Amount represents amounts subject to loss at December 31, 2020, in the event of a counterparty failure.
24
14 Indemnifications: Like many other companies, the Trust's organizational documents provide that its officers ("Officers") and trustees ("Trustees") are indemnified against certain liabilities arising out of the performance of their duties to the Trust. In addition, both in some of its principal service contracts and in the normal course of its business, the Trust enters into contracts that provide indemnifications to other parties for certain types of losses or liabilities. The Trust's maximum exposure under these arrangements is unknown as this could involve future claims against the Trust.
15 Other matters—Coronavirus: The outbreak of the novel coronavirus in many countries, which is a rapidly evolving situation, has, among other things, disrupted global travel and supply chains, and has adversely impacted global commercial activity, the transportation industry and commodity prices in the energy sector. The impact of this virus has negatively affected and may continue to affect the economies of many nations, individual companies and the global securities and commodities markets, including liquidity and volatility, in ways that cannot necessarily be foreseen at the present time. The rapid development and fluidity of this situation precludes any prediction as to its ultimate impact, which may have a continued adverse effect on economic and market conditions and trigger a period of global economic slowdown. Such conditions (which may be across industries, sectors or geographies) have impacted and may continue to impact the issuers of the securities held by the Fund.
Note B—Investment Management Fees, Administration Fees, Distribution Arrangements, and Other Transactions with Affiliates:
The Fund retains NBIA as its investment manager under a Management Agreement. For such investment management services, the Fund pays NBIA an investment management fee at the annual rate of 0.17% of the first $2 billion of the Fund's average daily net assets and 0.15% of average daily net assets in excess of $2 billion (prior to February 28, 2020, 0.25% of the first $500 million of the Fund's average daily net assets, 0.225% of the next $500 million, 0.20% of the next $500 million, 0.175% of the next $500 million, and 0.15% of average daily net assets in excess of $2 billion). Accordingly, for the year ended December 31, 2020, the investment management fee pursuant to the Management Agreement was equivalent to an annual effective rate of 0.18% of the Fund's average daily net assets.
The Fund retains NBIA as its administrator under an Administration Agreement. The Fund pays NBIA an administration fee at the annual rate of 0.40% of its average daily net assets under this agreement. Additionally, NBIA retains State Street as its sub-administrator under a Sub-Administration Agreement. NBIA pays State Street a fee for all services received under the Sub-Administration Agreement.
Neuberger Berman BD LLC is the Fund's "principal underwriter" within the meaning of the 1940 Act. It acts as agent in arranging for the sale of the Fund's Class I shares without sales commission or other compensation and bears all advertising and promotion expenses incurred in the sale of those shares. The Board adopted a non-fee distribution plan for the Fund's Class I shares.
NBIA has contractually agreed to waive fees and/or reimburse the Fund so that the total annual operating expenses do not exceed the expense limitation as detailed in the following table. This undertaking excludes interest, taxes, transaction costs, brokerage commissions, acquired fund fees and expenses, extraordinary expenses, and dividend and interest expenses relating to short sales, if any (commitment fees relating to borrowings are treated as interest for purposes of this exclusion) ("annual operating expenses"); consequently, net expenses may exceed the contractual expense limitation. The Fund has agreed that it will repay NBIA for fees and expenses waived or reimbursed provided that repayment does not cause the annual operating expenses to exceed its contractual expense limitation in place at the time the fees and expenses were waived or reimbursed, or the expense limitation in place at the time the Fund repays NBIA, whichever is lower. Any such repayment must be made within three years after the year in which NBIA incurred the expense.
During the year ended December 31, 2020, there was no repayment to NBIA under these agreements.
25
At December 31, 2020, the Fund had no contingent liabilities to NBIA under the agreements.
| | | | | | | Expenses Reimbursed in
Year Ended December 31, | |
| | | | | | | 2018 | | 2019 | | 2020 | |
| | | | | | | Subject to Repayment Until December 31, | |
Class | | Contractual
Expense
Limitation(a) | | Expiration | | 2021 | | 2022 | | 2023 | |
Class I | | | 0.95 | %(b) | | 12/31/23 | | $ | — | | | $ | — | | | $ | — | | |
(a) Expense limitation per annum of the Fund's average daily net assets.
(b) Prior to February 28, 2020, the contractual expense limitation was 1.00%.
Neuberger Berman BD LLC is the Fund's "principal underwriter" within the meaning of the 1940 Act. It acts as agent in arranging for the sale of the Fund's Class I shares without sales commission or other compensation and bears all advertising and promotion expenses incurred in the sale of those shares. The Board adopted a non-fee distribution plan for the Fund's Class I shares.
Note C—Securities Transactions:
During the year ended December 31, 2020, there were purchase and sale transactions of long-term securities (excluding futures) as follows:
Purchases of
U.S. Government
and Agency
Obligations | | Purchases excluding
U.S. Government
and Agency
Obligations | | Sales and Maturities
of U.S. Government
and Agency
Obligations | | Sales and Maturities
excluding
U.S. Government
and Agency
Obligations | |
| $ | 31,984,225 | | | $ | 122,574,075 | | | $ | 18,793,582 | | | $ | 143,475,544 | | |
During the year ended December 31, 2020, no brokerage commissions on securities transactions were paid to affiliated brokers.
Note D—Fund Share Transactions:
Share activity for the years ended December 31, 2020, and December 31, 2019, was as follows:
| | For the Year Ended December 31, 2020 | | For the Year Ended December 31, 2019 | |
| | Shares Sold | | Shares Issued on
Reinvestment of
Dividends and
Distributions | | Shares
Redeemed | | Total | | Shares Sold | | Shares Issued on
Reinvestment of
Dividends and
Distributions | | Shares
Redeemed | | Total | |
Class I | | | 2,426,694 | | | | 227,914 | | | | (3,137,858 | ) | | | (483,250 | ) | | | 1,144,266 | | | | 205,552 | | | | (2,524,513 | ) | | | (1,174,695 | ) | |
Note E—Line of Credit:
At December 31, 2020, the Fund was a participant in a syndicated committed, unsecured $700,000,000 line of credit (the "Credit Facility"), to be used only for temporary or emergency purposes. Series of other investment companies managed by NBIA also participate in this line of credit on substantially the same terms. Interest is charged on borrowings under this Credit Facility at the highest of (a) a federal funds effective rate plus 1.00% per annum, (b) a Eurodollar rate for a one-month period plus 1.00% per annum, and (c) an overnight bank funding rate plus 1.00% per annum. The Credit Facility has an annual commitment fee of 0.15% per annum of the available
26
line of credit, which is paid quarterly. The Fund has agreed to pay its pro rata share of the annual commitment fee, based on the ratio of its individual net assets to the net assets of all participants at the time the fee is due, and interest charged on any borrowing made by the Fund and other costs incurred by the Fund. Because several mutual funds participate in the Credit Facility, there is no assurance that the Fund will have access to all or any part of the $700,000,000 at any particular time. There were no loans outstanding under the Credit Facility at December 31, 2020. During the year ended December 31, 2020, the Fund did not utilize the Credit Facility.
Note F—Recent Accounting Pronouncement:
In March 2020, FASB issued Accounting Standards Update No. 2020-04 ("ASU 2020-04"), "Reference Rate Reform (Topic 848)". In response to concerns about structural risks of interbank offered rates, and particularly the risk of cessation of LIBOR, regulators have undertaken reference rate reform initiatives to identify alternative reference rates that are more observable or transaction based and less susceptible to manipulation. ASU 2020-04 provides optional guidance for a limited period of time to ease the potential burden in accounting for (or recognizing the effects of) reference rate reform on financial reporting. ASU 2020-04 is elective and applies to all entities, subject to meeting certain criteria, that have contracts, hedging relationships, and other transactions that reference LIBOR or another reference rate expected to be discontinued because of reference rate reform. The amendments are effective as of March 12, 2020 through December 31, 2022. Management is currently evaluating the impact of the guidance.
27
Short Duration Bond Portfolio
The following table includes selected data for a share outstanding throughout each year and other performance information derived from the Financial Statements. Amounts that do not round to $0.01 or $(0.01) per share are presented as $0.00 or $(0.00), respectively. Ratios that do not round to 0.01% or (0.01)% are presented as 0.00% or (0.00)%, respectively. A "—" indicates that the line item was not applicable in the corresponding period.
Class I | |
| | | Year Ended December 31, | |
| | | 2020 | | 2019 | | 2018 | | 2017 | | 2016 | |
Net Asset Value, Beginning of Year | | $ | 10.57 | | | $ | 10.40 | | | $ | 10.46 | | | $ | 10.52 | | | $ | 10.52 | | |
Income From Investment Operations: | |
| Net Investment Income/(Loss)@ | | | 0.24 | | | | 0.18 | | | | 0.14 | | | | 0.11 | | | | 0.07 | | |
Net Gains or Losses on Securities
(both realized and unrealized) | | | 0.12 | | | | 0.20 | | | | (0.03 | ) | | | (0.02 | ) | | | 0.06 | | |
Total From Investment Operations | | | 0.36 | | | | 0.38 | | | | 0.11 | | | | 0.09 | | | | 0.13 | | |
Less Distributions From: | |
Net Investment Income | | | (0.25 | ) | | | (0.21 | ) | | | (0.17 | ) | | | (0.15 | ) | | | (0.13 | ) | |
Net Asset Value, End of Year | | $ | 10.68 | | | $ | 10.57 | | | $ | 10.40 | | | $ | 10.46 | | | $ | 10.52 | | |
| Total Return† | | | 3.46 | % | | | 3.69 | %^ | | | 1.02 | %^ | | | 0.89 | %‡^ | | | 1.22 | %^ | |
Ratios/Supplemental Data | |
Net Assets, End of Year (in millions) | | $ | 103.1 | | | $ | 107.0 | | | $ | 117.6 | | | $ | 131.6 | | | $ | 143.0 | | |
| Ratio of Gross Expenses to Average Net Assets# | | | 0.86 | % | | | 0.88 | % | | | 0.87 | % | | | 0.85 | % | | | 0.88 | % | |
Ratio of Net Expenses to Average Net Assets | | | 0.86 | % | | | 0.88 | % | | | 0.87 | % | | | 0.75 | %ß | | | 0.88 | % | |
Ratio of Net Investment Income/(Loss) to Average
Net Assets | | | 2.26 | % | | | 1.69 | % | | | 1.34 | % | | | 1.03 | %ß | | | 0.68 | % | |
Portfolio Turnover Rate | | | 162 | % | | | 91 | % | | | 60 | % | | | 87 | % | | | 79 | % | |
See Notes to Financial Highlights
28
Notes to Financial Highlights Short Duration Bond Portfolio
@ Calculated based on the average number of shares outstanding during each fiscal period.
† Total return based on per share NAV reflects the effects of changes in NAV on the performance of the Fund during each fiscal period. Returns assume income dividends and other distributions, if any, were reinvested. Results represent past performance and do not indicate future results. Current returns may be lower or higher than the performance data quoted. Investment returns and principal will fluctuate and shares, when redeemed, may be worth more or less than original cost. The total return information shown does not reflect charges and other expenses that apply to the separate accounts or the related insurance policies or other qualified pension or retirement plans, and the inclusion of these charges and other expenses would reduce the total return for all fiscal periods shown.
^ The class action proceeds received in 2019 and 2017 had no impact on the Fund's total return for the years ended December 31, 2019 and 2017, respectively. Had the Fund not received class action proceeds in 2018 and 2016, total return based on per share NAV for the years ended December 31, 2018 and December 31, 2016, would have been:
| | | Year Ended December 31, | |
| | | 2018 | | 2016 | |
Class I | | | 0.92 | % | | | 0.64 | % | |
‡ In May 2016, the Fund's custodian, State Street, announced that it had identified inconsistencies in the way in which the Fund was invoiced for categories of expenses, particularly those deemed "out-of-pocket" costs, from 1998 through November 2015, and refunded to the Fund certain expenses, plus interest, determined to be payable to the Fund for the period in question. These amounts were refunded to the Fund by State Street during the year ended December 31, 2017. These amounts had no impact on the Fund's total return for the year ended December 31, 2017.
# Represents the annualized ratios of net expenses to average daily net assets if Management had not reimbursed certain expenses and/or waived a portion of the investment management fee and/or if the Fund had not received refunds, plus interest, from State Street noted in ‡ above for custodian out-of-pocket expenses previously paid during the year ended December 31, 2017. Management did not reimburse or waive fees during the fiscal periods shown.
ß The custodian expenses refund noted in ‡ above is non-recurring and is included in these ratios. Had the Fund not received the refund, the annualized ratio of net expenses to average net assets and the annualized ratio of net investment income/(loss) to average net assets would have been:
| | | Ratio of Net
Expenses to
Average Net
Assets
Year Ended
December 31, 2017 | | Ratio of Net
Investment
Income/(Loss)
to Average
Net Assets
Year Ended
December 31, 2017 | |
Class I | | | 0.85 | % | | | 0.92 | % | |
29
Report of Independent Registered Public Accounting Firm
To the Shareholders of Short Duration Bond Portfolio and Board of Trustees of the Neuberger Berman Advisers Management Trust
Opinion on the Financial Statements
We have audited the accompanying statement of assets and liabilities of Short Duration Bond Portfolio (the "Portfolio") (one of the portfolios constituting Neuberger Berman Advisers Management Trust (the "Trust")), including the schedule of investments, as of December 31, 2020, and the related statement of operations for the year then ended, the statements of changes in net assets for each of the two years in the period then ended, the financial highlights for each of the five years in the period then ended and the related notes (collectively referred to as the "financial statements"). In our opinion, the financial statements present fairly, in all material respects, the financial position of the Portfolio (one of the portfolios constituting Neuberger Berman Advisers Management) at December 31, 2020, the results of its operations for the year then ended, the changes in its net assets for each of the two years in the period then ended and its financial highlights for each of the five years in the period then ended, in conformity with U.S. generally accepted accounting principles.
Basis for Opinion
These financial statements are the responsibility of the Trust's management. Our responsibility is to express an opinion on the Portfolio's financial statements based on our audits. We are a public accounting firm registered with the Public Company Accounting Oversight Board (United States) ("PCAOB") and are required to be independent with respect to the Trust in accordance with the U.S. federal securities laws and the applicable rules and regulations of the Securities and Exchange Commission and the PCAOB.
We conducted our audits in accordance with the standards of the PCAOB. Those standards require that we plan and perform the audit to obtain reasonable assurance about whether the financial statements are free of material misstatement, whether due to error or fraud. The Trust is not required to have, nor were we engaged to perform, an audit of the Trust's internal control over financial reporting. As part of our audits, we are required to obtain an understanding of internal control over financial reporting, but not for the purpose of expressing an opinion on the effectiveness of the Trust's internal control over financial reporting. Accordingly, we express no such opinion.
Our audits included performing procedures to assess the risks of material misstatement of the financial statements, whether due to error or fraud, and performing procedures that respond to those risks. Such procedures included examining, on a test basis, evidence regarding the amounts and disclosures in the financial statements. Our procedures included confirmation of securities owned as of December 31, 2020, by correspondence with the custodian and brokers or by other appropriate auditing procedures where replies from others were not received. Our audits also included evaluating the accounting principles used and significant estimates made by management, as well as evaluating the overall presentation of the financial statements. We believe that our audits provide a reasonable basis for our opinion.
We have served as the auditor of one or more Neuberger Berman investment companies since 1954.
Boston, Massachusetts
February 12, 2021
30
The following tables set forth information concerning the Trustees and Officers of the Fund. All persons named as Trustees and Officers also serve in similar capacities for other funds administered or managed by Neuberger Berman Investment Advisers LLC ("NBIA"). The Fund's Statement of Additional Information includes additional information about the Trustees as of the time of the Fund's most recent public offering and is available upon request, without charge, by calling (800) 877-9700.
Information about the Board of Trustees
Name, (Year of Birth),
and Address(1) | | Position(s)
and Length of
Time Served(2) | | Principal Occupation(s)(3) | | Number of
Funds in Fund
Complex
Overseen by
Fund Trustee | | Other Directorships
Held Outside Fund
Complex by Fund
Trustee(3) | |
Independent Fund Trustees | |
Michael J. Cosgrove (1949) | | Trustee since 2015 | | President, Carragh Consulting USA, since 2014; formerly, Executive, General Electric Company, 1970 to 2014, including President, Mutual Funds and Global Investment Programs, GE Asset Management, 2011 to 2014, President and Chief Executive Officer, Mutual Funds and Intermediary Business, GE Asset Management, 2007 to 2011, President, Institutional Sales and Marketing, GE Asset Management, 1998 to 2007, and Chief Financial Officer, GE Asset Management, and Deputy Treasurer, GE Company, 1988 to 1993. | |
| 46 |
| | Director, America Press, Inc. (not-for-profit Jesuit publisher), since 2015; formerly, Director, Fordham University, 2001 to 2018; formerly, Director, The Gabelli Go Anywhere Trust, June 2015 to June 2016; formerly, Director, Skin Cancer Foundation (not-for-profit), 2006 to 2015; formerly, Director, GE Investments Funds, Inc., 1997 to 2014; formerly, Trustee, GE Institutional Funds, 1997 to 2014; formerly, Director, GE Asset Management, 1988 to 2014; formerly, Director, Elfun Trusts, 1988 to 2014; formerly, Trustee, GE Pension & Benefit Plans, 1988 to 2014; formerly, Member of Board of Governors, Investment Company Institute. | |
31
Name, (Year of Birth),
and Address(1) | | Position(s)
and Length of
Time Served(2) | | Principal Occupation(s)(3) | | Number of
Funds in Fund
Complex
Overseen by
Fund Trustee | | Other Directorships
Held Outside Fund
Complex by Fund
Trustee(3) | |
Marc Gary (1952) | | Trustee since 2015 | | Executive Vice Chancellor and Chief Operating Officer, Jewish Theological Seminary, since 2012; formerly, Executive Vice President and General Counsel, Fidelity Investments, 2007 to 2012; formerly, Executive Vice President and General Counsel, BellSouth Corporation, 2004 to 2007; formerly, Vice President and Associate General Counsel, BellSouth Corporation, 2000 to 2004; formerly, Associate, Partner, and National Litigation Practice Co-Chair, Mayer, Brown LLP, 1981 to 2000; formerly, Associate Independent Counsel, Office of Independent Counsel, 1990 to 1992. | |
| 46 |
| | Director, UJA Federation of Greater New York, since 2019; Trustee, Jewish Theological Seminary, since 2015; Director, Legility, Inc. (privately held for-profit company), since 2012; Director, Lawyers Committee for Civil Rights Under Law (not-for-profit), since 2005; formerly, Director, Equal Justice Works (not-for-profit), 2005 to 2014; formerly, Director, Corporate Counsel Institute, Georgetown University Law Center, 2007 to 2012; formerly, Director, Greater Boston Legal Services (not-for-profit), 2007 to 2012. | |
32
Name, (Year of Birth),
and Address(1) | | Position(s)
and Length of
Time Served(2) | | Principal Occupation(s)(3) | | Number of
Funds in Fund
Complex
Overseen by
Fund Trustee | | Other Directorships
Held Outside Fund
Complex by Fund
Trustee(3) | |
Martha C. Goss (1949) | | Trustee since 2007 | | President, Woodhill Enterprises Inc./Chase Hollow Associates LLC (personal investment vehicle), since 2006; formerly, Consultant, Resources Global Professionals (temporary staffing), 2002 to 2006; formerly, Chief Financial Officer, Booz-Allen & Hamilton, Inc., 1995 to 1999; formerly, Enterprise Risk Officer, Prudential Insurance, 1994 to1995; formerly, President, Prudential Asset Management Company, 1992 to 1994; formerly, President, Prudential Power Funding (investments in electric and gas utilities and alternative energy projects), 1989 to 1992; formerly, Treasurer, Prudential Insurance Company, 1983 to 1989. | |
| 46 |
| | Director, American Water (water utility), since 2003; Director, Allianz Life of New York (insurance), since 2005; Director, Berger Group Holdings, Inc. (engineering consulting firm), since 2013; Director, Financial Women's Association of New York (not-for-profit association), since 2003; Trustee Emerita, Brown University, since 1998; Director, Museum of American Finance (not-for-profit), since 2013; formerly, Non-Executive Chair and Director, Channel Reinsurance (financial guaranty reinsurance), 2006 to 2010; formerly, Director, Ocwen Financial Corporation (mortgage servicing), 2005 to 2010; formerly, Director, Claire's Stores, Inc. (retailer), 2005 to 2007; formerly, Director, Parsons Brinckerhoff Inc. (engineering consulting firm), 2007 to 2010; formerly, Director, Bank Leumi (commercial bank), 2005 to 2007; formerly, Advisory Board Member, Attensity (software developer), 2005 to 2007. | |
33
Name, (Year of Birth),
and Address(1) | | Position(s)
and Length of
Time Served(2) | | Principal Occupation(s)(3) | | Number of
Funds in Fund
Complex
Overseen by
Fund Trustee | | Other Directorships
Held Outside Fund
Complex by Fund
Trustee(3) | |
Michael M. Knetter (1960) | | Trustee since 2007 | | President and Chief Executive Officer, University of Wisconsin Foundation, since 2010; formerly, Dean, School of Business, University of Wisconsin—Madison; formerly, Professor of International Economics and Associate Dean, Amos Tuck School of Business—Dartmouth College, 1998 to 2002. | |
| 46 |
| | Director, 1 William Street Credit Income Fund, since 2018; Board Member, American Family Insurance (a mutual company, not publicly traded), since March 2009; formerly, Trustee, Northwestern Mutual Series Fund, Inc., 2007 to 2011; formerly, Director, Wausau Paper, 2005 to 2011; formerly, Director, Great Wolf Resorts, 2004 to 2009. | |
Deborah C. McLean (1954) | | Trustee since 2015 | | Member, Circle Financial Group (private wealth management membership practice), since 2011; Managing Director, Golden Seeds LLC (an angel investing group), since 2009; Adjunct Professor, Columbia University School of International and Public Affairs, since 2008; formerly, Visiting Assistant Professor, Fairfield University, Dolan School of Business, Fall 2007; formerly, Adjunct Associate Professor of Finance, Richmond, The American International University in London, 1999 to 2007. | |
| 46 |
| | Board member, Norwalk Community College Foundation, since 2014; Dean's Advisory Council, Radcliffe Institute for Advanced Study, since 2014; formerly, Director and Treasurer, At Home in Darien (not-for-profit), 2012 to 2014; formerly, Director, National Executive Service Corps (not-for-profit), 2012 to 2013; formerly, Trustee, Richmond, The American International University in London, 1999 to 2013. | |
34
Name, (Year of Birth),
and Address(1) | | Position(s)
and Length of
Time Served(2) | | Principal Occupation(s)(3) | | Number of
Funds in Fund
Complex
Overseen by
Fund Trustee | | Other Directorships
Held Outside Fund
Complex by Fund
Trustee(3) | |
George W. Morriss (1947) | | Trustee since 2007 | | Adjunct Professor, Columbia University School of International and Public Affairs, since 2012; formerly, Executive Vice President and Chief Financial Officer, People's United Bank, Connecticut (a financial services company), 1991 to 2001. | |
| 46 |
| | Director, 1 William Street Credit Income Fund, since 2018; Director and Chair, Thrivent Church Loan and Income Fund, since 2018; formerly, Trustee, Steben Alternative Investment Funds, Steben Select Multi-Strategy Fund, and Steben Select Multi-Strategy Master Fund, 2013 to 2017; formerly, Treasurer, National Association of Corporate Directors, Connecticut Chapter, 2011 to 2015; formerly, Manager, Larch Lane Multi-Strategy Fund complex (which consisted of three funds), 2006 to 2011; formerly, Member, NASDAQ Issuers' Affairs Committee, 1995 to 2003. | |
Tom D. Seip (1950) | | Trustee since 2000; Chairman of the Board since 2008; formerly Lead Independent Trustee from 2006 to 2008 | | Formerly, Managing Member, Ridgefield Farm LLC (a private investment vehicle), 2004 to 2016; formerly, President and CEO, Westaff, Inc. (temporary staffing), May 2001 to January 2002; formerly, Senior Executive, The Charles Schwab Corporation, 1983 to 1998, including Chief Executive Officer, Charles Schwab Investment Management, Inc.; Trustee, Schwab Family of Funds and Schwab Investments, 1997 to 1998; and Executive Vice President-Retail Brokerage, Charles Schwab & Co., Inc., 1994 to 1997. | |
| 46 |
| | Formerly, Director, H&R Block, Inc. (tax services company), 2001 to 2018; formerly, Director, Talbot Hospice Inc., 2013 to 2016; formerly, Chairman, Governance and Nominating Committee, H&R Block, Inc., 2011 to 2015; formerly, Chairman, Compensation Committee, H&R Block, Inc., 2006 to 2010; formerly, Director, Forward Management, Inc. (asset management company), 1999 to 2006. | |
35
Name, (Year of Birth),
and Address(1) | | Position(s)
and Length of
Time Served(2) | | Principal Occupation(s)(3) | | Number of
Funds in Fund
Complex
Overseen by
Fund Trustee | | Other Directorships
Held Outside Fund
Complex by Fund
Trustee(3) | |
James G. Stavridis (1955) | | Trustee since 2015 | | Operating Executive, The Carlyle Group, since 2018; Commentator, NBC News, since 2015; formerly, Dean, Fletcher School of Law and Diplomacy, Tufts University, 2013 to 2018; formerly, Admiral, United States Navy, 1976 to 2013, including Supreme Allied Commander, NATO and Commander, European Command, 2009 to 2013, and Commander, United States Southern Command, 2006 to 2009. | |
| 46 |
| | Director, American Water (water utility), since 2018; Director, NFP Corp. (insurance broker and consultant), since 2017; Director, U.S. Naval Institute, since 2014; Director, Onassis Foundation, since 2014; Director, BMC Software Federal, LLC, since 2014; Director, Vertical Knowledge, LLC, since 2013; formerly, Director, Navy Federal Credit Union, 2000-2002. | |
36
Name, (Year of Birth),
and Address(1) | | Position(s)
and Length of
Time Served(2) | | Principal Occupation(s)(3) | | Number of
Funds in Fund
Complex
Overseen by
Fund Trustee | | Other Directorships
Held Outside Fund
Complex by Fund
Trustee(3) | |
Candace L. Straight (1947) | | Trustee since 1999 | | Private investor and consultant specializing in the insurance industry; formerly, Advisory Director, Securitas Capital LLC (a global private equity investment firm dedicated to making investments in the insurance sector), 1998 to 2003. | |
| 46 |
| | Director, ERA Coalition (not-for-profit), 2019 to 2020; Director, Re belle Media (a privately held TV and film production company), since 2018; formerly, Public Member, Board of Governors and Board of Trustees, Rutgers University, 2011 to 2016; formerly, Director, Montpelier Re Holdings Ltd. (reinsurance company), 2006 to 2015; formerly, Director, National Atlantic Holdings Corporation (property and casualty insurance company), 2004 to 2008; formerly, Director, The Proformance Insurance Company (property and casualty insurance company), 2004 to 2008; formerly, Director, Providence Washington Insurance Company (property and casualty insurance company), 1998 to 2006; formerly, Director, Summit Global Partners (insurance brokerage firm), 2000 to 2005. | |
Peter P. Trapp (1944) | | Trustee since 1984 | | Retired; formerly, Regional Manager for Mid-Southern Region, Ford Motor Credit Company, September 1997 to 2007; formerly, President, Ford Life Insurance Company, April 1995 to August 1997. | |
| 46 |
| | None. | |
37
Name, (Year of Birth),
and Address(1) | | Position(s)
and Length of
Time Served(2) | | Principal Occupation(s)(3) | | Number of
Funds in Fund
Complex
Overseen by
Fund Trustee | | Other Directorships
Held Outside Fund
Complex by Fund
Trustee(3) | |
Fund Trustees who are "Interested Persons" | |
Joseph V. Amato* (1962) | | Chief Executive Officer and President since 2018 and Trustee since 2009 | | President and Director, Neuberger Berman Group LLC, since 2009; President and Chief Executive Officer, Neuberger Berman BD LLC and Neuberger Berman Holdings LLC (including its predecessor, Neuberger Berman Inc.), since 2007; Chief Investment Officer (Equities) and President (Equities), NBIA (formerly, Neuberger Berman Fixed Income LLC and including predecessor entities), since 2007, and Board Member of NBIA since 2006; formerly, Global Head of Asset Management of Lehman Brothers Holdings Inc.'s ("LBHI") Investment Management Division, 2006 to 2009; formerly, member of LBHI's Investment Management Division's Executive Management Committee, 2006 to 2009; formerly, Managing Director, Lehman Brothers Inc. ("LBI"), 2006 to 2008; formerly, Chief Recruiting and Development Officer, LBI, 2005 to 2006; formerly, Global Head of LBI's Equity Sales and a Member of its Equities Division Executive Committee, 2003 to 2005; President and Chief Executive Officer, ten registered investment companies for which NBIA acts as investment manager and/or administrator. | |
| 46 |
| | Member of Board of Advisors, McDonough School of Business, Georgetown University, since 2001; Member of New York City Board of Advisors, Teach for America, since 2005; Trustee, Montclair Kimberley Academy (private school), since 2007; Member of Board of Regents, Georgetown University, since 2013. | |
(1) The business address of each listed person is 1290 Avenue of the Americas, New York, NY 10104.
38
(2) Pursuant to the Trust's Amended and Restated Trust Instrument, subject to any limitations on the term of service imposed by the By-Laws or any retirement policy adopted by the Fund Trustees, each Fund Trustee shall hold office for life or until his or her successor is elected or the Trust terminates; except that (a) any Fund Trustee may resign by delivering a written resignation; (b) any Fund Trustee may be removed with or without cause at any time by a written instrument signed by at least two-thirds of the other Fund Trustees; (c) any Fund Trustee who requests to be retired, or who has become unable to serve, may be retired by a written instrument signed by a majority of the other Fund Trustees; and (d) any Fund Trustee may be removed at any shareholder meeting by a vote of at least two-thirds of the outstanding shares.
(3) Except as otherwise indicated, each individual has held the positions shown during at least the last five years.
* Indicates a Fund Trustee who is an "interested person" within the meaning of the 1940 Act. Mr. Amato is an interested person of the Trust by virtue of the fact that he is an officer of NBIA and/or its affiliates.
39
Information about the Officers of the Trust
Name, (Year of Birth),
and Address(1) | | Position(s)
and Length of
Time Served(2) | | Principal Occupation(s)(3) | |
Claudia A. Brandon (1956) | | Executive Vice President since 2008 and Secretary since 1985 | | Senior Vice President, Neuberger Berman, since 2007 and Employee since 1999; Senior Vice President, NBIA, since 2008 and Assistant Secretary since 2004; formerly, Vice President, Neuberger Berman, 2002 to 2006; formerly, Vice President—Mutual Fund Board Relations, NBIA, 2000 to 2008; formerly, Vice President, NBIA, 1986 to 1999 and Employee, 1984 to 1999; Executive Vice President and Secretary, twenty-nine registered investment companies for which NBIA acts as investment manager and/or administrator. | |
Agnes Diaz (1971) | | Vice President since 2013 | | Senior Vice President, Neuberger Berman, since 2012; Senior Vice President, NBIA, since 2012 and Employee since 1996; formerly, Vice President, Neuberger Berman, 2007 to 2012; Vice President, ten registered investment companies for which NBIA acts as investment manager and/or administrator. | |
Anthony DiBernardo (1979) | | Assistant Treasurer since 2011 | | Senior Vice President, Neuberger Berman, since 2014; Senior Vice President, NBIA, since 2014, and Employee since 2003; formerly, Vice President, Neuberger Berman, 2009 to 2014; Assistant Treasurer, ten registered investment companies for which NBIA acts as investment manager and/or administrator. | |
Savonne L. Ferguson (1973) | | Chief Compliance Officer since 2018 | | Senior Vice President, Chief Compliance Officer (Mutual Funds) and Associate General Counsel, NBIA, since November 2018; formerly, Vice President T. Rowe Price Group, Inc. (2018), Vice President and Senior Legal Counsel, T. Rowe Price Associates, Inc. (2014-2018), Vice President and Director of Regulatory Fund Administration, PNC Capital Advisors, LLC (2009-2014), Secretary, PNC Funds and PNC Advantage Funds (2010-2014); Chief Compliance Officer, twenty-nine registered investment companies for which NBIA acts as investment manager and/or administrator. | |
Corey A. Issing (1978) | | Chief Legal Officer since 2016 (only for purposes of sections 307 and 406 of the Sarbanes-Oxley Act of 2002) | | General Counsel and Head of Compliance—Mutual Funds since 2016 and Managing Director, NBIA, since 2017; formerly, Associate General Counsel (2015 to 2016), Counsel (2007 to 2015), Senior Vice President (2013-2016), Vice President (2009-2013); Chief Legal Officer (only for purposes of sections 307 and 406 of the Sarbanes-Oxley Act of 2002), twenty-nine registered investment companies for which NBIA acts as investment manager and/or administrator. | |
Sheila R. James (1965) | | Assistant Secretary since 2002 | | Vice President, Neuberger Berman, since 2008 and Employee since 1999; Vice President, NBIA, since 2008; formerly, Assistant Vice President, Neuberger Berman, 2007; Employee, NBIA, 1991 to 1999; Assistant Secretary, twenty-nine registered investment companies for which NBIA acts as investment manager and/or administrator. | |
40
Name, (Year of Birth),
and Address(1) | | Position(s)
and Length of
Time Served(2) | | Principal Occupation(s)(3) | |
Brian Kerrane (1969) | | Chief Operating Officer since 2015 and Vice President since 2008 | | Managing Director, Neuberger Berman, since 2014; Chief Operating Officer—Mutual Funds and Managing Director, NBIA, since 2015; formerly, Senior Vice President, Neuberger Berman, 2006 to 2014; Vice President, NBIA, 2008 to 2015 and Employee since 1991; Chief Operating Officer, ten registered investment companies for which NBIA acts as investment manager and/or administrator; Vice President, twenty-nine registered investment companies for which NBIA acts as investment manager and/or administrator. | |
Anthony Maltese (1959) | | Vice President since 2015 | | Senior Vice President, Neuberger Berman, since 2014 and Employee since 2000; Senior Vice President, NBIA, since 2014; Vice President, ten registered investment companies for which NBIA acts as investment manager and/or administrator. | |
Josephine Marone (1963) | | Assistant Secretary since 2017 | | Senior Paralegal, Neuberger Berman, since 2007 and Employee since 2007; Assistant Secretary, twenty-nine registered investment companies for which NBIA acts as investment manager and/or administrator. | |
Owen F. McEntee, Jr. (1961) | | Vice President since 2008 | | Vice President, Neuberger Berman, since 2006; Vice President, NBIA, since 2006 and Employee since 1992; Vice President, ten registered investment companies for which NBIA acts as investment manager and/or administrator. | |
John M. McGovern (1970) | | Treasurer and Principal Financial and Accounting Officer since 2005 | | Senior Vice President, Neuberger Berman, since 2007; Senior Vice President, NBIA, since 2007 and Employee since 1993; formerly, Vice President, Neuberger Berman, 2004 to 2006; formerly, Assistant Treasurer, 2002 to 2005; Treasurer and Principal Financial and Accounting Officer, ten registered investment companies for which NBIA acts as investment manager and/or administrator. | |
Frank Rosato (1971) | | Assistant Treasurer since 2005 | | Vice President, Neuberger Berman, since 2006; Vice President, NBIA, since 2006 and Employee since 1995; Assistant Treasurer, ten registered investment companies for which NBIA acts as investment manager and/or administrator. | |
Niketh Velamoor (1979) | | Anti-Money Laundering Compliance Officer since 2018 | | Senior Vice President and Associate General Counsel, Neuberger Berman, since July 2018; Assistant United States Attorney, Southern District of New York, 2009 to 2018; Anti-Money Laundering Compliance Officer, four registered investment companies for which NBIA acts as investment manager and/or administrator. | |
(1) The business address of each listed person is 1290 Avenue of the Americas, New York, NY 10104.
(2) Pursuant to the By-Laws of the Trust, each officer elected by the Fund Trustees shall hold office until his or her successor shall have been elected and qualified or until his or her earlier death, inability to serve, or resignation. Officers serve at the pleasure of the Fund Trustees and may be removed at any time with or without cause.
(3) Except as otherwise indicated, each individual has held the positions shown during at least the last five years.
41
Proxy Voting Policies and Procedures
A description of the policies and procedures that the Trust uses to determine how to vote proxies relating to portfolio securities is available, without charge, by calling 800-877-9700 (toll-free) and on the SEC's website, at www.sec.gov. Information regarding how the Trust voted proxies relating to portfolio securities during the most recent 12-month period ended June 30 is also available upon request, without charge, by calling 800-877-9700 (toll-free), on the SEC's website at www.sec.gov, and on Neuberger Berman's website at www.nb.com.
Quarterly Portfolio Schedule
The Trust files a complete schedule of portfolio holdings with the SEC for the first and third quarters of each fiscal year as an exhibit to its report on Form N-PORT. The Trust's Form N-PORT is available on the SEC's website at www.sec.gov. The portfolio holdings information on Form N-PORT is available upon request, without charge, by calling 800-877-9700 (toll free).
Board Consideration of the Management Agreement
On an annual basis, the Board of Trustees (the "Board") of Neuberger Berman Advisers Management Trust (the "Trust"), including the Trustees who are not "interested persons" of the Trust or of Neuberger Berman Investment Advisers LLC ("Management") (including its affiliates) ("Independent Fund Trustees"), considers whether to continue the management agreement with Management (the "Agreement") with respect to Short Duration Bond Portfolio (the "Fund"). Throughout the process, the Independent Fund Trustees are advised by counsel that is experienced in Investment Company Act of 1940 matters and that is independent of Management ("Independent Counsel"). At a meeting held on October 1, 2020, the Board, including the Independent Fund Trustees, approved the continuation of the Agreement for the Fund.
In evaluating the Agreement, the Board, including the Independent Fund Trustees, reviewed extensive materials provided by Management in response to questions submitted by the Independent Fund Trustees and Independent Counsel, and met with senior representatives of Management regarding its personnel, operations, and profitability as they relate to the Fund. The annual contract review extends over at least two regular meetings of the Board to ensure that Management has time to respond to any questions the Independent Fund Trustees may have on their initial review of the materials and that the Independent Fund Trustees have time to consider those responses.
In connection with its deliberations, the Board also considered the broad range of information relevant to the annual contract review that is provided to the Board (including its various standing committees) at meetings throughout the year, including reports on investment performance, portfolio risk, and other portfolio information for the Fund, including the use of derivatives, as well as periodic reports on, among other matters, pricing and valuation; quality and cost of portfolio trade execution; compliance; and shareholder and other services provided by Management and its affiliates. The Contract Review Committee, which is comprised of Independent Fund Trustees, was established by the Board to assist in its evaluation and analysis of materials for the annual contract review. The Board has also established other committees that focus throughout the year on specific areas relevant to the annual contract review, such as Fund performance or compliance matters, and that are charged with specific responsibilities regarding the annual contract review. Those committees provide reports to the Contract Review Committee and the full Board, which consider that information as part of the annual contract review process. The Board's Contract Review Committee annually considers and updates the questions it asks of Management in light of legal advice furnished to it by Independent Counsel; its own business judgment; and developments in the industry, in the markets, in mutual fund regulation and litigation, and in Management's business model.
The Independent Fund Trustees received from Independent Counsel a memorandum discussing the legal standards for their consideration of the proposed continuation of the Agreement. During the course of the year and during their deliberations regarding the annual contract review, the Contract Review Committee and the Independent Fund Trustees met with Independent Counsel separately from representatives of Management.
42
Provided below is a description of the Board's contract approval process and material factors that the Board considered at its meetings regarding renewal of the Agreement and the compensation to be paid thereunder. In connection with its approval of the continuation of the Agreement, the Board evaluated the terms of the Agreement, the overall fairness of the Agreement to the Fund, and whether the Agreement was in the best interests of the Fund and its shareholders. The Board's determination to approve the continuation of the Agreement was based on a comprehensive consideration of all information provided to the Board throughout the year and specifically in connection with the annual contract review. The Board considered the Fund's investment management agreement separately from those of other funds of the Trust.
This description is not intended to include all of the factors considered by the Board. The Board members did not identify any particular information or factor that was all-important or controlling, and each Trustee may have attributed different weights to the various factors. The Board focused on the costs and benefits of the Agreement to the Fund and, through the Fund, its shareholders.
Nature, Extent, and Quality of Services
With respect to the nature, extent, and quality of the services provided, the Board considered the investment philosophy and decision-making processes of, and the qualifications, experience, and capabilities of, and the resources available to, the portfolio management personnel of Management who perform services for the Fund. The Board noted that Management also provides certain administrative services, including fund accounting and compliance services. The Board also considered Management's policies and practices regarding trade execution, transaction costs, and allocation of portfolio transactions and reviewed the quality of the execution services that Management had provided. Moreover, the Board considered Management's approach to potential conflicts of interest both generally and between the Fund's investments and those of other funds or accounts managed by Management. The Board also noted that Management had increased its research capabilities with respect to environmental, social, and corporate governance matters and how those factors may relate to investment performance. The Board noted the additional responsibilities of Management in administering the liquidity risk management program.
The Board recognized the extensive range of services that Management provides to the Fund beyond the investment management services. The Board noted that Management is also responsible for monitoring compliance with the Fund's investment objectives, policies, and restrictions, as well as compliance with applicable law, including implementing rulemaking initiatives of the U.S. Securities and Exchange Commission. The Board considered that Management assumes significant ongoing entrepreneurial and business risks as the investment adviser and sponsor for the Fund, for which it is entitled to reasonable compensation. The Trustees also considered that Management's responsibilities include continual management of investment, operational, enterprise, legal, regulatory, and compliance risks as they relate to the Fund, and the Board considers on a regular basis information regarding Management's processes for monitoring and managing risk. In addition, the Board also noted that when Management launches a new fund or share class, it assumes entrepreneurial risk with respect to that fund or share class, and that some funds and share classes have been liquidated without ever having been profitable to Management.
The Board also reviewed and evaluated Management's activities under its contractual obligation to oversee the Fund's various outside service providers, including its renegotiation of certain service providers' fees and its evaluation of service providers' infrastructure, cybersecurity programs, compliance programs, and business continuity programs, among other matters. The Board also considered Management's ongoing development of its own infrastructure and information technology to support the Fund through, among other things, cybersecurity, business continuity planning, and risk management. The Board noted Management's largely seamless implementation of its business continuity plan in response to the COVID-19 pandemic. In addition, the Board noted the positive compliance history of Management, as no significant compliance problems were reported to the Board with respect to Management. The Board also considered the general structure of the portfolio managers' compensation and whether this structure provides appropriate incentives to act in the best interests of the Fund. The Board also considered the ability of Management to attract and retain qualified personnel to service the Fund.
43
As in past years, the Board also considered the manner in which Management addressed various matters that arose during the year, some of them a result of developments in the broader fund industry or the regulations governing it. In addition, the Board considered actions taken by Management in response to recent market conditions, such as changes in fixed-income market liquidity and, the economic dislocation and rise in volatility that accompanied shutdowns related to the efforts to stem the spread of COVID-19, and considered the overall performance of Management in this context.
Fund Performance
The Board requested a report from an outside consulting firm that specializes in the analysis of fund industry data that compared the Fund's performance, along with its fees and other expenses, to a group of industry peers ("Expense Group") and a broader universe of funds pursuing generally similar strategies with the same investment classification and/or objective ("Performance Universe"). The Expense Group and Performance Universe were composed of two types of funds: proprietary funds that are operated by insurance companies or their affiliates, and non-proprietary funds, such as the Fund, operated for insurance company investors by independent investment managers. The Board considered the Fund's performance and fees in light of the limitations inherent in the methodology for constructing such comparative groups and determining which investment companies should be included in the comparative groups, noting differences as compared to certain fund industry ranking and rating systems. The Board also considered the impact and inherent limitation on the comparisons due to the small number of funds included in the Fund's Expense Group and Performance Universe.
With respect to investment performance, the Board considered information regarding the Fund's short-, intermediate- and long-term performance, net of the Fund's fees and expenses, on an absolute basis, relative to a benchmark index that does not deduct the fees or expenses of investing, and compared to the performance of the Expense Group and Performance Universe, each constructed by the consulting firm. The Board also reviewed performance in relation to certain measures of the degree of investment risk undertaken by the portfolio managers.
The Performance Universe referenced in this section was identified by the consulting firm, as discussed above. For any period of underperformance, the Board considered the magnitude and duration of that underperformance relative to the Performance Universe, and/or the benchmark (e.g., the amount by which a Fund underperformed, including, for example, whether the Fund slightly underperformed or significantly underperformed its benchmark). With respect to performance quintile rankings for the Fund compared to its Performance Universe, the first quintile represents the highest (best) performance and the fifth quintile represents the lowest performance.
The Board considered that, based on performance data for the periods ended December 31, 2019: (1) as compared to its benchmark, the Fund's performance was lower for the 1-, 3-, and 5-year periods and higher for the 10-year period; and (2) as compared to its Performance Universe, the Fund's performance was in the fourth quintile for the 1-, 3-, and 5-year periods and the second quintile for the 10-year period. In addition, the Board met with a member of the portfolio management team in September 2020 to discuss the Fund's performance.
Noting that the Fund underperformed over certain periods, the Board considered Management's representations regarding the factors impacting the Fund's performance and discussed with Management the Fund's performance, potential reasons for the relative performance, and, if necessary, steps that Management had taken, or intended to take, to improve performance. The Board also considered Management's responsiveness to the Fund's relative performance. In this regard, the Board noted that performance, especially short-term performance, is only one of the factors that it deems relevant to its consideration of the Agreement and that, after considering all relevant factors, it determined to approve the continuation of the Agreement notwithstanding the Fund's relative underperformance.
Fee Rates, Profitability, and Fall-out Benefits
With respect to the overall fairness of the Agreement, the Board considered the fee structure for the Fund under the Agreement as compared to the Expense Group provided by the consulting firm, as discussed above. The Board reviewed a comparison of the Fund's management fee to its Expense Group. The Board noted that the comparative management
44
fee analysis includes, in the Fund's management fee, the separate administrative fees paid to Management. However, the Board noted that some funds in the Expense Group pay directly from fund assets for certain services that Management covers out of the administration fees for the Fund. Accordingly, the Board also considered the Fund's total expense ratio as compared with its Expense Group as a way of taking account of these differences.
The Board compared the Fund's contractual and actual management fees to the median of the contractual and actual management fees, respectively, of the Fund's Expense Group. (The actual management fees are the contractual management fees reduced by any fee waivers or other adjustments.) The Board also compared the Fund's total expenses to the median of the total expenses of the Fund's Expense Group. The Board noted that the Fund's actual management fee and total expenses were higher than the Expense Group median, and considered whether specific portfolio management, administration or oversight needs contributed to the Fund's actual management fee and total expenses. With respect to the quintile rankings for fees and total expenses (net of waivers or other adjustments, if any) for the Fund compared to its Expense Group, the first quintile represents the lowest fees and/or total expenses and the fifth quintile represents the highest fees and/or total expenses.
The Board considered that, as compared to its Expense Group, the Fund's contractual management fee, the actual management fee, and total expenses each ranked in the fifth quintile. The Board also took into account that in 2020 Management reduced the Fund's expense limitation, added a new Portfolio Manager, and made changes to the Fund's investment strategy.
In addition to considering the above-referenced factors, the Board took note of its ongoing dialogue with Management regarding the dynamics of the insurance/annuity marketplace. The Board considered, among other matters, related tax restrictions and the unique challenges facing that market generally, which assisted the Board in understanding the context for the Fund's expense ratio and performance.
In concluding that the benefits accruing to Management and its affiliates by virtue of their relationship with the Fund were reasonable in light of the costs of providing the investment advisory and other services and the benefits accruing to the Fund, the Board reviewed specific data as to Management's estimated loss on the Fund for a recent period on a pre-tax basis without regard to distribution expenses, including year-over-year changes in each of Management's reported expense categories. (The Board also reviewed data on Management's estimated loss on the Fund after distribution/servicing expenses and taxes were factored in, as indicators of the health of the business and the extent to which Management is directing its profits into the growth of the business. The Board noted that when distribution expenses and taxes were considered, Management experienced a loss on the Fund.) The Board considered the cost allocation methodology that Management used in developing its estimated profitability figures. In recent years, the Board engaged an independent forensic accountant to review the profitability methodology utilized by Management when preparing this information and discussed with the consultant its conclusion that Management's process for calculating and reporting its estimated loss was not unreasonable.
Recognizing that there is no uniform methodology regarding the allocation of firm-wide or complex-wide expenses within the asset management industry for determining profitability for this purpose and that the use of different reasonable methodologies can give rise to different profit and loss results, the Board, in recent years, requested from Management examples of profitability calculated by different methods and noted that the estimated profitability levels were still reasonable when calculated by these other methods. The Board further noted Management's representation that its estimate of profitability is derived using methodology that is consistent with the methodology used to assess and/or report measures of profitability elsewhere at the firm. In addition, the Board recognized that Management's calculations regarding its costs may not reflect all risks, including regulatory, legal, operational, reputational, and, where appropriate, entrepreneurial risks, associated with offering and managing a mutual fund in the current regulatory and market environment. The Board also considered any fall-out (i.e., indirect) benefits likely to accrue to Management or its affiliates from their relationship with the Fund. The Board noted that Management incurred a loss on its management of the Fund during the review period even before consideration of distribution expenses and taxes.
45
Information Regarding Services to Other Clients
The Board also considered other funds and separate accounts that were advised or sub-advised by Management or its affiliates with investment objectives, policies and strategies that were similar to those of the Fund, and compared the fees charged to the Fund to the fees charged to such comparable funds and separate accounts. The Board considered the appropriateness and reasonableness of any differences between the fees charged to a Fund and such comparable funds and/or separate accounts, and determined that differences in fees and fee structures were consistent with the differences in the management and other services provided. The Board explored with Management its assertion that although, generally, the rates of fees paid by such accounts, except other Neuberger Berman mutual funds, were lower than the fee rates paid by the corresponding Fund, the differences reflected Management's greater level of responsibilities and significantly broader scope of services regarding the Fund, the more extensive regulatory obligations and risks associated with managing the Fund, and other financial considerations with respect to creation and sponsorship of the Fund.
Economies of Scale
The Board also evaluated apparent or anticipated economies of scale in relation to the services Management provides to the Fund. The Board considered whether the Fund's fee structure provides for a reduction of payments resulting from the use of breakpoints, the size of any breakpoints in the Fund's advisory fees, and whether any such breakpoints are set at appropriate asset levels. The Board also compared the breakpoint structure to that of the Expense Group. In addition, the Board considered the expense limitation and/or fee waiver arrangements that reduces Fund expenses at all asset levels which can have an effect similar to breakpoints in sharing economies of scale with shareholders and provide protection from an increase in expenses if the Fund's assets decline. The Board also considered that Management has provided, at no added cost to the Fund, certain additional services, including but not limited to, services required by new regulations or regulatory interpretations, services impelled by changes in the securities markets or the business landscape, and/or services requested by the Board. The Board considered that this is a way of sharing economies of scale with the Fund and its shareholders.
Conclusions
In approving the continuation of the Agreement, the Board concluded that, in its business judgment, the terms of the Agreement are fair and reasonable to the Fund and that approval of the continuation of the Agreement is in the best interests of the Fund and its shareholders. In reaching this determination, the Board considered that Management could be expected to continue to provide a high level of service to the Fund; that the Board retained confidence in Management's capabilities to manage the Fund; that the Fund's fee structure appeared to the Board to be reasonable given the nature, extent, and quality of services provided; and that the benefits accruing to Management and its affiliates by virtue of their relationship with the Fund were reasonable in light of the costs of providing the investment advisory and other services and the benefits accruing to the Fund. The Board's conclusions may be based in part on its consideration of materials prepared in connection with the approval or continuance of the Agreement in prior years and on the Board's ongoing regular review of Fund performance and operations throughout the year, in addition to material prepared specifically for the most recent annual review of the Agreement.
46
Neuberger Berman
Advisers Management Trust
Sustainable Equity Portfolio
I Class Shares
S Class Shares
Annual Report
December 31, 2020
As permitted by regulations adopted by the U.S. Securities and Exchange Commission, you may no longer receive paper copies of the Fund's annual and semi-annual shareholder reports by mail from the insurance company that issued your variable annuity and variable life insurance contract or from the financial intermediary that administers your qualified pension or retirement plan, unless you specifically request paper copies of the reports from your insurance company or financial intermediary. Instead, the reports will be made available on the Fund's website www.nb.com/AMTliterature, and may also be available on a website from the insurance company or financial intermediary that offers your contract or administers your retirement plan, and such insurance company or financial intermediary will notify you by mail each time a report is posted and provide you with a website link to access the report.
If you already elected to receive shareholder reports electronically, you will not be affected by this change and you need not take any action. You may elect to receive shareholder reports and other communications from the insurance company or financial intermediary electronically by following the instructions provided by the insurance company or financial intermediary. If offered by your insurance company or financial intermediary, you may elect to receive all future reports in paper and free of charge from the insurance company or financial intermediary. You can contact your insurance company or financial intermediary if you wish to continue receiving paper copies of your shareholder reports. Your election to receive reports in paper will apply to all funds available under your contract or retirement plan.
Sustainable Equity Portfolio Commentary (Unaudited)
The Neuberger Berman Advisers Management Trust Sustainable Equity Portfolio Class I generated a total return of 19.56% for the 12-month period ended December 31, 2020 (the reporting period), outpacing the 18.40% total return of its benchmark, the S&P 500® Index (the Index) for the same period. (Performance for all share classes is provided in the table immediately following this letter.)
The Index recovered from its sharp decline earlier in the year, emerging relatively unscathed by the domestic election uncertainty and the unabated fall-winter virus surge and posting a double-digit gain. It was driven largely by the Information Technology sector; a clear beneficiary of the pandemic's stay-at-home and social distancing trends.
Positive vaccine news and a favorable election outcome—within a backdrop of continued supportive monetary policy—bolstered the market, accelerating investor appetite for growth in a market in which price appreciation had been outpacing earnings growth. While growth stocks outperformed value over the reporting period, relative valuations across industries offered attractive risk-reward opportunities.
Shifting to the economy, the back half of 2020 saw a strong rebound in U.S. GDP growth, driven by fulfillment of pent-up consumer demand and reopening of COVID-19 impacted sectors of the economy. Unemployment numbers came down and early signs of recovery in business and consumer confidence pointed to a gradual recovery, but all remain lower than pre-pandemic levels. U.S. consumers who maintained full employment through the year are in good shape, with balance sheets de-levered and savings up, compared to pre-pandemic levels.
The Fund outperformed the Index thanks to both stock selection and sector allocation. Industrials and Financials were the top contributing sectors from a relative perspective. Our top contributor, Vestas Wind Systems, a leading wind solutions firm, benefitted from strong order growth as well as the incoming Biden administration's emphasis on clean energy. Microsoft and mobile computer and productivity optimization firm, Zebra Technologies, both benefited from strong execution and pandemic driven acceleration of digitization trends.
Consumer Discretionary underperformed the most versus the Index, with multi-national food service provider, Compass Group, a top detractor, directly impacted by the pandemic driven shutdowns. Noble Energy and Ryanair, two other names impacted by demand declines in their respective sectors, detracted from portfolio returns, and both were sold at the onset of the pandemic.
Additional sales during the reporting period included American Express, Gildan Activewear, Kroger, EQT, Weyerhaeuser and Novozymes. Additions included Accenture, Starbucks, Colgate-Palmolive, EverSource Energy, Otis, Discovery, Booking Holdings, ANSYS, Regeneron Pharmaceuticals and Fiserv.
Looking ahead, we anticipate a continued economic rebound in 2021, notwithstanding unforeseen risks. The vaccine rollout should aid consumer and business confidence; and additional fiscal stimulus would support employment, incomes and consumer spending.
During the pandemic, the U.S. Federal Reserve Board (Fed) cut rates and backstopped commercial credit. We anticipate the Fed to be supportive of growth in the near term.
Overall, a loose monetary policy and fiscal stimulus, plus any improvement in trade relations driven by the Biden administration, should be supportive of capital markets. However, where appreciation was largely driven by valuation expansion in prior years, future returns will have to come from earnings growth.
We view the ability to provide solutions to key sustainability challenges, such as: access to innovative care, greening of the economy, grid decarbonization, green transportation, digital transformation, and enhanced efficiency and automation, as attractive underlying drivers of secular business growth.
We continue to focus on companies' growth prospects, ESG leadership, high return on invested capital, and balance sheet strength as we position the portfolio toward what we believe to be the best-in-class businesses we anticipate to be beneficiaries within the current disruption and during a rebound, while being mindful of valuations and potential inflation.
1
We look forward to continuing to serve your investment needs.
Sincerely,
INGRID S. DYOTT AND SAJJAD S. LADIWALA
CO-PORTFOLIO MANAGERS
Information about principal risks of investing in the Fund is set forth in the prospectus and statement of additional information.
The portfolio composition, industries and holdings of the Fund are subject to change without notice.
The opinions expressed are those of the Fund's portfolio managers. The opinions are as of the date of this report and are subject to change without notice.
To read more on how we integrate sustainability issues into our investment process, please visit www.nb.com/sustainableequity.
2
Sustainable Equity Portfolio (Unaudited)
SECTOR ALLOCATION
(as a % of Total Investments*) | |
Communication Services | | | 10.0 | % | |
Consumer Discretionary | | | 10.3 | | |
Consumer Staples | | | 4.3 | | |
Financials | | | 10.5 | | |
Health Care | | | 16.5 | | |
Industrials | | | 15.8 | | |
Information Technology | | | 27.2 | | |
Materials | | | 1.9 | | |
Utilities | | | 2.4 | | |
Short-Term Investments | | | 1.1 | | |
Total | | | 100.0 | % | |
* Derivatives, if any, are excluded from this chart.
PERFORMANCE HIGHLIGHTS
| | Inception | | Average Annual Total Return
Ended 12/31/2020 | |
| | Date | | 1 Year | | 5 Years | | 10 Years | | Life of Fund | |
At NAV | |
Class I | | 02/18/1999 | | | 19.56 | % | | | 13.05 | % | | | 11.62 | % | | | 8.06 | % | |
| Class S2 | | 05/01/2006 | | | 19.28 | % | | | 12.78 | % | | | 11.40 | % | | | 7.94 | % | |
Index | |
| S&P 500® Index1,3 | | | | | | | 18.40 | % | | | 15.22 | % | | | 13.88 | % | | | 7.28 | % | |
The performance data quoted represent past performance and do not indicate future results. Current performance may be lower or higher than the performance data quoted. For current performance data, including current to the most recent month-end, please visit http://www.nb.com/amtportfolios/performance.
The results shown in the table reflect the reinvestment of income dividends and other distributions, if any. The results do not reflect the effect of taxes a shareholder would pay on Fund distributions or on the redemption of Fund shares. The results do not reflect fees and expenses of the variable annuity and variable life insurance policies or the qualified pension and retirement plans whose proceeds are invested in the Fund.
The investment return and principal value of an investment will fluctuate and shares, when redeemed, may be worth more or less than their original cost.
Returns would have been lower if Neuberger Berman Investment Advisers LLC ("Management") had not reimbursed certain expenses and/or waived a portion of the investment management fees during certain of the periods shown. Repayment by a class (of expenses previously reimbursed and/or fees previously waived by Management) will decrease the class's returns. Please see Note B in the Notes to Financial Statements for specific information regarding expense reimbursement and/or fee waiver arrangements.
As stated in the Fund's most recent prospectus, the total annual operating expense ratios for fiscal year 2019 were 0.93% and 1.18% for Class I and Class S shares, respectively (before expense reimbursements and/or fee waivers, if any). The expense ratio was 1.18% for Class S shares after expense reimbursements and/or fee waivers. The expense ratios for the annual period ended December 31, 2020 can be found in the Financial Highlights section of this report.
COMPARISON OF A $10,000 INVESTMENT
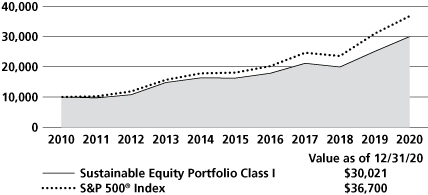
This graph shows the change in value of a hypothetical $10,000 investment in the Fund over the past 10 fiscal years, or since the Fund's inception, if it has not operated for 10 years. The graph is based on Class I shares only; the performance of the Fund's share classes will differ primarily due to different class expenses (see Performance Highlights chart above). The result is compared with benchmarks, which include a broad-based market index and may include a more narrowly based index. Market indices have not been reduced to reflect any of the fees and costs of investing. The results shown in the graph reflect the reinvestment of income dividends and other distributions, if any. The results do not reflect the effect of taxes a shareholder would pay on Fund distributions or on the redemption of Fund shares. The results do not reflect fees and expenses of the variable annuity and variable life insurance policies or the qualified pension and retirement plans whose proceeds are invested in the Fund. Results represent past performance and do not indicate future results.
Please see Endnotes for additional information.
3
1 The date used to calculate Life of Fund performance for the index is February 18, 1999, the inception date of Class I shares, the Fund's oldest share class.
2 Performance shown prior to May 1, 2006 for Class S shares is that of Class I shares, which has lower expenses and correspondingly higher returns than Class S shares.
3 The S&P 500® Index is a float-adjusted market capitalization-weighted index that focuses on the large-cap segment of the U.S. equity market, and includes a significant portion of the total value of the market. Please note that the index described in this report does not take into account any fees, expenses or tax consequences of investing in the individual securities that it tracks, and that individuals cannot invest directly in any index. Data about the performance of an index are prepared or obtained by Neuberger Berman Investment Advisers LLC ("Management") and reflect the reinvestment of income dividends and other distributions, if any. The Fund may invest in securities not included in a described index and generally does not invest in all securities included in a described index.
The investments for the Fund are managed by the same portfolio manager(s) who manage(s) one or more other registered funds that have names, investment objectives and investment styles that are similar to those of the Fund. You should be aware that the Fund is likely to differ from those other mutual fund(s) in size, cash flow pattern and tax matters. Accordingly, the holdings and performance of the Fund can be expected to vary from those of the other mutual fund(s).
Shares of the separate Neuberger Berman Advisers Management Trust Portfolios, including the Fund, are not available to the general public. Shares of the Fund may be purchased only by life insurance companies to be held in their separate accounts, which fund variable annuity and variable life insurance policies, and by qualified pension and retirement plans. Statistics and projections in this report are derived from sources deemed to be reliable but cannot be regarded as a representation of future results of the Fund. This report is prepared for the general information of shareholders and is not an offer of shares of the Fund. Shares are sold only through the currently effective prospectus, which must precede or accompany this report.
The "Neuberger Berman" name and logo and "Neuberger Berman Investment Advisers LLC" name are registered service marks of Neuberger Berman Group LLC. The individual Fund name in this piece is either a service mark or registered service mark of Neuberger Berman Investment Advisers LLC, an affiliate of Neuberger Berman BD LLC, distributor, member FINRA.
© 2021 Neuberger Berman BD LLC, distributor. All rights reserved.
4
Information About Your Fund's Expenses (Unaudited)
As a Fund shareholder, you incur two types of costs: (1) transaction costs such as fees and expenses that are, or may be, imposed under your variable contract or qualified pension plan; and (2) ongoing costs, including management fees, distribution and/or service (12b-1) fees (if applicable), and other Fund expenses. This example is intended to help you understand your ongoing costs (in U.S. dollars) of investing in the Fund and compare these costs with the ongoing costs of investing in other mutual funds.
This table is designed to provide information regarding costs related to your investments. The following examples are based on an investment of $1,000 made at the beginning of the six month period ended December 31, 2020 and held for the entire period. The table illustrates the Fund's costs in two ways:
Actual Expenses and Performance: | | The first section of the table provides information about actual account values and actual expenses in dollars, based on the Fund's actual performance during the period indicated. You may use the information in this line, together with the amount you invested, to estimate the expenses you paid over the period. Simply divide your account value by $1,000 (for example, an $8,600 account value divided by $1,000 = 8.6), then multiply the result by the number in the first section of the table under the heading entitled "Expenses Paid During the Period" to estimate the expenses you paid over the period. | |
Hypothetical Example for
Comparison Purposes: | | The second section of the table provides information about hypothetical account values and hypothetical expenses based on the Fund's actual expense ratio and an assumed rate of return at 5% per year before expenses. This return is not the Fund's actual return. The hypothetical account values and expenses may not be used to estimate the actual ending account balance or expenses you paid for the period. You may use this information to compare the ongoing costs of investing in this Fund versus other funds. To do so, compare the expenses shown in this 5% hypothetical example with the 5% hypothetical examples that appear in the shareholder reports of other funds. | |
Please note that the expenses in the table are meant to highlight your ongoing costs only and do not include any transaction costs, such as fees and expenses that are, or may be imposed under your variable contract or qualified pension plan. Therefore, the information under the heading "Hypothetical (5% annual return before expenses)" is useful in comparing ongoing costs only, and will not help you determine the relative total costs of owning different funds. In addition, if these transaction costs were included, your costs would have been higher.
Expense Example (Unaudited)
NEUBERGER BERMAN ADVISERS MANAGEMENT TRUST SUSTAINABLE EQUITY PORTFOLIO
Actual | | Beginning Account
Value
7/1/20 | | Ending Account
Value
12/31/20 | | Expenses Paid
During the Period
7/1/20 – 12/31/20 | | Expense
Ratio | |
Class I | | $ | 1,000.00 | | | $ | 1,275.80 | | | $ | 5.21 | (a) | | | 0.91 | % | |
Class S | | $ | 1,000.00 | | | $ | 1,274.00 | | | $ | 6.69 | (a) | | | 1.17 | % | |
Hypothetical (5% annual return before expenses) | |
Class I | | $ | 1,000.00 | | | $ | 1,020.56 | | | $ | 4.62 | (b) | | | 0.91 | % | |
Class S | | $ | 1,000.00 | | | $ | 1,019.25 | | | $ | 5.94 | (b) | | | 1.17 | % | |
(a) For each class, expenses are equal to the annualized expense ratio for the class, multiplied by the average account value over the period, multiplied by 184/366 (to reflect the one-half year period shown).
(b) Hypothetical expenses are equal to the annualized expense ratios for each class, multiplied by the average account value over the period (assuming a 5% annual return), multiplied by 184/366 (to reflect the one-half year period shown).
5
Schedule of Investments Sustainable Equity Portfolio^ December 31, 2020
NUMBER OF SHARES | | | | VALUE | |
Common Stocks 98.9% | | | |
Auto Components 3.0% | | | |
| | 157,534 | | | Aptiv PLC | | $ | 20,525,105 | | |
Banks 5.2% | | | |
| | 174,436 | | | JPMorgan Chase & Co. | | | 22,165,582 | | |
| | 269,618 | | | U.S. Bancorp | | | 12,561,503 | | |
| | | | 34,727,085 | | |
Biotechnology 1.0% | | | |
| | 13,385 | | | Regeneron
Pharmaceuticals, Inc. | |
| 6,466,427
| * | |
Capital Markets 2.9% | | | |
| | 171,243 | | | Intercontinental Exchange, Inc. | | | 19,742,605 | | |
Communications Equipment 2.1% | | | |
| | 47,584 | | | Arista Networks, Inc. | | | 13,826,483 | * | |
Electric Utilities 0.8% | | | |
| | 64,552 | | | Eversource Energy | | | 5,584,394 | | |
Electrical Equipment 4.2% | | | |
| | 119,897 | | | Vestas Wind Systems A/S | | | 28,323,186 | | |
Electronic Equipment, Instruments &
Components 3.3% | | | |
| | 57,909 | | | Zebra Technologies Corp.
Class A | |
| 22,256,166
| * | |
Health Care Equipment & Supplies 7.5% | | | |
| | 82,867 | | | Becton, Dickinson & Co. | | | 20,734,981 | | |
| | 67,389 | | | Danaher Corp. | | | 14,969,792 | | |
| | 127,542 | | | Medtronic PLC | | | 14,940,270 | | |
| | | | 50,645,043 | | |
Health Care Providers & Services 5.0% | | | |
| | 137,138 | | | AmerisourceBergen Corp. | | | 13,406,611 | | |
| | 98,457 | | | Cigna Corp. | | | 20,496,778 | | |
| | | | 33,903,389 | | |
Hotels, Restaurants & Leisure 3.8% | | | |
| | 776,178 | | | Compass Group PLC | | | 14,476,772 | | |
| | 102,105 | | | Starbucks Corp. | | | 10,923,193 | | |
| | | | 25,399,965 | | |
Household Products 1.3% | | | |
| | 103,007 | | | Colgate-Palmolive Co. | | | 8,808,129 | | |
NUMBER OF SHARES | | | | VALUE | |
Insurance 2.4% | | | |
| | 164,388 | | | Progressive Corp. | | $ | 16,254,685 | | |
Interactive Media & Services 3.8% | | | |
| | 14,754 | | | Alphabet, Inc. Class A | | | 25,858,451 | * | |
Internet & Direct Marketing Retail 1.1% | | | |
| | 3,438 | | | Booking Holdings, Inc. | | | 7,657,354 | * | |
IT Services 9.3% | | | |
| | 40,153 | | | Accenture PLC Class A | | | 10,488,365 | | |
| | 265,198 | | | Cognizant Technology
Solutions Corp. Class A | |
| 21,732,976
|
| |
| | 78,462 | | | Fiserv, Inc. | | | 8,933,683 | * | |
| | 59,323 | | | MasterCard, Inc. Class A | | | 21,174,752 | | |
| | | | 62,329,776 | | |
Machinery 3.8% | | | |
| | 102,185 | | | Otis Worldwide Corp. | | | 6,902,597 | | |
| | 103,387 | | | Stanley Black & Decker, Inc. | | | 18,460,782 | | |
| | | | 25,363,379 | | |
Materials 1.9% | | | |
| | 16,929 | | | Sherwin-Williams Co. | | | 12,441,291 | | |
Media 6.2% | | | |
| | 480,366 | | | Comcast Corp. Class A | | | 25,171,179 | | |
| | 549,014 | | | Discovery, Inc. Class A | | | 16,519,831 | * | |
| | | | 41,691,010 | | |
Multi-Utilities 1.6% | | | |
| | 905,837 | | | National Grid PLC | | | 10,704,666 | | |
Personal Products 3.0% | | | |
| | 333,263 | | | Unilever PLC ADR | | | 20,115,755 | | |
Pharmaceuticals 3.0% | | | |
| | 58,620 | | | Roche Holding AG | | | 20,417,256 | | |
Road & Rail 2.1% | | | |
| | 154,116 | | | CSX Corp. | | | 13,986,027 | | |
Semiconductors & Semiconductor
Equipment 4.5% | | | |
| | 184,033 | | | Texas Instruments, Inc. | | | 30,205,336 | | |
See Notes to Financial Statements
6
Schedule of Investments Sustainable Equity Portfolio^ (cont'd)
NUMBER OF SHARES | | | | VALUE | |
Software 8.1% | | | |
| | 18,284 | | | ANSYS, Inc. | | $ | 6,651,719 | * | |
| | 35,906 | | | Intuit, Inc. | | | 13,638,894 | | |
| | 155,389 | | | Microsoft Corp. | | | 34,561,622 | | |
| | | | 54,852,235 | | |
Specialty Retail 2.3% | | | |
| | 100,368 | | | Advance Auto Parts, Inc. | | | 15,808,964 | | |
Trading Companies & Distributors 5.7% | | | |
| | 95,040 | | | United Rentals, Inc. | | | 22,040,726 | * | |
| | 40,789 | | | W.W. Grainger, Inc. | | | 16,655,781 | | |
| | | | 38,696,507 | | |
| |
| | Total Common Stocks
(Cost $400,595,450) | |
| 666,590,669 |
| |
Short-Term Investments 1.1% | | | |
PRINCIPAL AMOUNT | | | | | |
| Certificates of Deposit 0.0%(a) | | | |
$ | 100,000 |
| | Self Help Credit Union,
0.25%, due 01/29/2021 | |
| 100,000 |
| |
| 100,000 |
| | Self Help Federal Credit Union,
0.25%, due 03/13/2021 | |
| 100,000 |
| |
| | | | 200,000 | | |
NUMBER OF SHARES | | | | VALUE | |
Investment Companies 1.1% | | | |
| 7,254,660
|
| | State Street Institutional
Treasury Money Market
Fund Premier Class, 0.01%(b) | | $ | 7,254,660 |
| |
| |
| | Total Short-Term Investments
(Cost $7,454,660) | |
| 7,454,660 |
| |
| | | | | Total Investments 100.0%
(Cost $408,050,110) | | | 674,045,329 | | |
| | | | | Liabilities Less Other Assets (0.0)%(a) | | | (110,158 | ) | |
| | | | | Net Assets 100.0% | | $ | 673,935,171 | | |
* Non-income producing security.
(a) Represents less than 0.05% of net assets of the Fund.
(b) Represents 7-day effective yield as of December 31, 2020.
See Notes to Financial Statements
7
Schedule of Investments Sustainable Equity Portfolio^ (cont'd)
POSITIONS BY COUNTRY
Country | | Investments at
Value | | Percentage of
Net Assets | |
United States | | $ | 572,553,034 | | | | 85.0 | % | |
United Kingdom | | | 45,297,193 | | | | 6.7 | % | |
Denmark | | | 28,323,186 | | | | 4.2 | % | |
Switzerland | | | 20,417,256 | | | | 3.0 | % | |
Short-Term Investments and Other Liabilities-Net | | | 7,344,502 | | | | 1.1 | % | |
| | | $ | 673,935,171 | | | | 100.0 | % | |
The following is a summary, categorized by Level (see Note A of Notes to Financial Statements), of inputs used to value the Fund's investments as of December 31, 2020:
Asset Valuation Inputs | | Level 1 | | Level 2 | | Level 3 | | Total | |
Investments: | |
Common Stocks | |
Electrical Equipment | | $ | — | | | $ | 28,323,186 | | | $ | — | | | $ | 28,323,186 | | |
Hotels, Restaurants & Leisure | | | 10,923,193 | | | | 14,476,772 | | | | — | | | | 25,399,965 | | |
Multi-Utilities | | | — | | | | 10,704,666 | | | | — | | | | 10,704,666 | | |
Pharmaceuticals | | | — | | | | 20,417,256 | | | | — | | | | 20,417,256 | | |
| Other Common Stocks(a) | | | 581,745,596 | | | | — | | | | — | | | | 581,745,596 | | |
Total Common Stocks | | | 592,668,789 | | | | 73,921,880 | | | | — | | | | 666,590,669 | | |
Short-Term Investments | | | — | | | | 7,454,660 | | | | — | | | | 7,454,660 | | |
Total Investments | | $ | 592,668,789 | | | $ | 81,376,540 | | | $ | — | | | $ | 674,045,329 | | |
(a) The Schedule of Investments provides information on the industry categorization as well as a Positions by Country summary.
^ A balance indicated with a "—", reflects either a zero balance or an amount that rounds to less than 1.
See Notes to Financial Statements
8
Statement of Assets and Liabilities
Neuberger Berman Advisers Management Trust
| | | SUSTAINABLE
EQUITY
PORTFOLIO | |
| | | December 31, 2020 | |
Assets | |
Investments in securities, at value* (Note A)—see Schedule of Investments: | |
| Unaffiliated issuers(a) | | $ | 674,045,329 | | |
| Foreign currency(b) | | | 11 | | |
Dividends and interest receivable | | | 809,259 | | |
Receivable for Fund shares sold | | | 25,418 | | |
Prepaid expenses and other assets | | | 20,652 | | |
Total Assets | | | 674,900,669 | | |
Liabilities | |
Payable to investment manager—net (Note B) | | | 295,613 | | |
Payable for Fund shares redeemed | | | 385,253 | | |
Payable to administrator—net (Note B) | | | 199,334 | | |
Payable to trustees | | | 12,717 | | |
Other accrued expenses and payables | | | 72,581 | | |
Total Liabilities | | | 965,498 | | |
Net Assets | | $ | 673,935,171 | | |
Net Assets consist of: | |
Paid-in capital | | $ | 391,516,226 | | |
Total distributable earnings/(losses) | | | 282,418,945 | | |
Net Assets | | $ | 673,935,171 | | |
Net Assets | |
Class I | | $ | 543,974,893 | | |
Class S | | | 129,960,278 | | |
Shares Outstanding ($.001 par value; unlimited shares authorized) | |
Class I | | | 17,722,739 | | |
Class S | | | 4,221,739 | | |
Net Asset Value, offering and redemption price per share | |
Class I | | $ | 30.69 | | |
Class S | | | 30.78 | | |
*Cost of Investments: | |
(a) Unaffiliated Issuers | | $ | 408,050,110 | | |
(b) Total cost of foreign currency | | $ | 11 | | |
See Notes to Financial Statements
9
Neuberger Berman Advisers Management Trust
| | | SUSTAINABLE
EQUITY
PORTFOLIO | |
| | | For the
Fiscal Year Ended
December 31, 2020 | |
Investment Income: | |
Income (Note A): | |
Dividend income—unaffiliated issuers | | $ | 8,228,858 | | |
Interest and other income—unaffiliated issuers | | | 39,604 | | |
Foreign taxes withheld | | | (214,619 | ) | |
Total income | | $ | 8,053,843 | | |
Expenses: | |
Investment management fees (Note B) | | | 3,075,608 | | |
Administration fees (Note B): | |
Class I | | | 1,396,457 | | |
Class S | | | 336,896 | | |
Distribution fees (Note B): | |
Class S | | | 280,747 | | |
Shareholder servicing agent fees: | |
Class I | | | 149 | | |
Class S | | | 60 | | |
Audit fees | | | 40,442 | | |
Custodian and accounting fees | | | 91,218 | | |
Insurance | | | 18,993 | | |
Legal fees | | | 136,429 | | |
Repayment to Management of expenses previously assumed by Management (Note B) | | | 9,196 | | |
Shareholder reports | | | 104,828 | | |
Trustees' fees and expenses | | | 51,946 | | |
Interest | | | 169 | | |
Miscellaneous | | | 37,922 | | |
Total expenses | | | 5,581,060 | | |
Net investment income/(loss) | | $ | 2,472,783 | | |
Realized and Unrealized Gain/(Loss) on Investments (Note A) | |
Net realized gain/(loss) on: | |
Transactions in investment securities of unaffiliated issuers | | | 14,829,372 | | |
Settlement of foreign currency transactions | | | 52,442 | | |
Change in net unrealized appreciation/(depreciation) in value of: | |
Investment securities of unaffiliated issuers | | | 92,854,733 | | |
Foreign currency translations | | | 33,116 | | |
Net gain/(loss) on investments | | | 107,769,663 | | |
Net increase/(decrease) in net assets resulting from operations | | $ | 110,242,446 | | |
See Notes to Financial Statements
10
Statements of Changes in Net Assets
Neuberger Berman Advisers Management Trust
| | | SUSTAINABLE EQUITY
PORTFOLIO | |
| | | Fiscal Year Ended
December 31,
2020 | | Fiscal Year Ended
December 31,
2019 | |
Increase/(Decrease) in Net Assets: | |
From Operations (Note A): | |
Net investment income/(loss) | | $ | 2,472,783 | | | $ | 3,291,759 | | |
Net realized gain/(loss) on investments | | | 14,881,814 | | | | 23,854,153 | | |
Change in net unrealized appreciation/(depreciation) of investments | | | 92,887,849 | | | | 86,950,452 | | |
Net increase/(decrease) in net assets resulting from operations | | | 110,242,446 | | | | 114,096,364 | | |
Distributions to Shareholders From (Note A): | |
Distributable earnings: | |
Class I | | | (22,511,583 | ) | | | (27,383,729 | ) | |
Class S | | | (5,103,478 | ) | | | (6,650,912 | ) | |
Total distributions to shareholders | | | (27,615,061 | ) | | | (34,034,641 | ) | |
From Fund Share Transactions (Note D): | |
Proceeds from shares sold: | |
Class I | | | 14,924,396 | | | | 50,062,884 | | |
Class S | | | 4,216,713 | | | | 48,642,200 | | |
Proceeds from reinvestment of dividends and distributions: | |
Class I | | | 22,511,583 | | | | 27,383,729 | | |
Class S | | | 5,103,477 | | | | 6,650,912 | | |
Proceeds from shares issued in connection with tax-free reorganizations (Note F): | |
Class I | | | — | | | | 51,104,256 | | |
Class S | | | — | | | | 125,163 | | |
Payments for shares redeemed: | |
Class I | | | (51,895,208 | ) | | | (42,305,183 | ) | |
Class S | | | (16,365,759 | ) | | | (17,528,030 | ) | |
Net increase/(decrease) from Fund share transactions | | | (21,504,798 | ) | | | 124,135,931 | | |
Net Increase/(Decrease) in Net Assets | | | 61,122,587 | | | | 204,197,654 | | |
Net Assets: | |
Beginning of year | | | 612,812,584 | | | | 408,614,930 | | |
End of year | | $ | 673,935,171 | | | $ | 612,812,584 | | |
See Notes to Financial Statements
11
Notes to Financial Statements Sustainable Equity Portfolio
Note A—Summary of Significant Accounting Policies:
1 General: Neuberger Berman Advisers Management Trust (the "Trust") is a Delaware statutory trust organized pursuant to an Amended and Restated Trust Instrument dated March 27, 2014. The Trust is registered as an open-end management investment company under the Investment Company Act of 1940, as amended (the "1940 Act"), and its shares are registered under the Securities Act of 1933, as amended. Neuberger Berman Advisers Management Trust Sustainable Equity Portfolio (the "Fund") is a separate operating series of the Trust and is diversified. The Fund offers Class I and Class S shares. The Trust's Board of Trustees (the "Board") may establish additional series or classes of shares without the approval of shareholders.
A balance indicated with a "—", reflects either a zero balance or a balance that rounds to less than 1.
The assets of the Fund belong only to the Fund, and the liabilities of the Fund are borne solely by the Fund and no other series of the Trust.
The Fund is an investment company and accordingly follows the investment company accounting and reporting guidance of the Financial Accounting Standards Board Accounting Standards Codification ("ASC") Topic 946 "Financial Services—Investment Companies."
The preparation of financial statements in accordance with U.S. generally accepted accounting principles ("GAAP") requires Neuberger Berman Investment Advisers LLC ("Management" or "NBIA") to make estimates and assumptions at the date of the financial statements. Actual results could differ from those estimates.
Shares of the Fund are not available to the general public and may be purchased only by life insurance companies to serve as an investment vehicle for premiums paid under their variable annuity and variable life insurance contracts and to certain qualified pension and other retirement plans.
2 Portfolio valuation: In accordance with ASC 820 "Fair Value Measurement" ("ASC 820"), all investments held by the Fund are carried at the value that Management believes the Fund would receive upon selling an investment in an orderly transaction to an independent buyer in the principal or most advantageous market for the investment under current market conditions. Various inputs, including the volume and level of activity for the asset or liability in the market, are considered in valuing the Fund's investments, some of which are discussed below. Significant Management judgment may be necessary to value investments in accordance with ASC 820.
ASC 820 established a three-tier hierarchy of inputs to create a classification of value measurements for disclosure purposes. The three-tier hierarchy of inputs is summarized in the three broad Levels listed below.
• Level 1—unadjusted quoted prices in active markets for identical investments
• Level 2—other observable inputs (including quoted prices for similar investments, interest rates, prepayment speeds, credit risk, amortized cost, etc.)
• Level 3—unobservable inputs (including the Fund's own assumptions in determining the fair value of investments)
The inputs or methodology used for valuing an investment are not necessarily an indication of the risk associated with investing in those securities.
The value of the Fund's investments in equity securities, for which market quotations are readily available, is generally determined by Management by obtaining valuations from independent pricing services based on the latest sale price quoted on a principal exchange or market for that security (Level 1 inputs). Securities traded primarily on the NASDAQ Stock Market are normally valued at the NASDAQ Official Closing Price ("NOCP") provided by NASDAQ each business day. The NOCP is the most recently reported price as of 4:00:02 p.m., Eastern Time, unless that price is outside the range of the "inside" bid and asked prices (i.e., the bid and asked prices that
12
dealers quote to each other when trading for their own accounts); in that case, NASDAQ will adjust the price to equal the inside bid or asked price, whichever is closer. Because of delays in reporting trades, the NOCP may not be based on the price of the last trade to occur before the market closes. If there is no sale of a security on a particular day, the independent pricing services may value the security based on market quotations.
Management has developed a process to periodically review information provided by independent pricing services for all types of securities.
Certificates of deposit are valued at amortized cost (Level 2 inputs).
Investments in non-exchange traded investment companies are valued using the respective fund's daily calculated net asset value ("NAV") per share (Level 2 inputs).
If a valuation is not available from an independent pricing service, or if Management has reason to believe that the valuation received does not represent the amount the Fund might reasonably expect to receive on a current sale in an orderly transaction, Management seeks to obtain quotations from brokers or dealers (generally considered Level 2 or Level 3 inputs depending on the number of quotes available). If such quotations are not readily available, the security is valued using methods the Board has approved in the good-faith belief that the resulting valuation will reflect the fair value of the security. Inputs and assumptions considered in determining the fair value of a security based on Level 2 or Level 3 inputs may include, but are not limited to, the type of the security; the initial cost of the security; the existence of any contractual restrictions on the security's disposition; the price and extent of public trading in similar securities of the issuer or of comparable companies; quotations or evaluated prices from broker-dealers and/or pricing services; information obtained from the issuer and/or analysts; an analysis of the company's or issuer's financial statements; an evaluation of the inputs that influence the issuer and the market(s) in which the security is purchased and sold.
The value of the Fund's investments in foreign securities is generally determined using the same valuation methods and inputs as other Fund investments, as discussed above. Foreign security prices expressed in local currency values are normally translated from the local currency into U.S. dollars using the exchange rates as of 4:00 p.m., Eastern Time on days the New York Stock Exchange ("NYSE") is open for business. The Board has approved the use of ICE Data Pricing & Reference Data LLC ("ICE") to assist in determining the fair value of foreign equity securities when changes in the value of a certain index suggest that the closing prices on the foreign exchanges may no longer represent the amount that the Fund could expect to receive for those securities or on days when foreign markets are closed and U.S. markets are open. In each of these events, ICE will provide adjusted prices for certain foreign equity securities using a statistical analysis of historical correlations of multiple factors (Level 2 inputs). In the absence of precise information about the market values of these foreign securities as of the time as of which the Fund's share price is calculated, the Board has determined on the basis of available data that prices adjusted or evaluated in this way are likely to be closer to the prices the Fund could realize on a current sale than are the prices of those securities established at the close of the foreign markets in which the securities primarily trade.
Fair value prices are necessarily estimates, and there is no assurance that such a price will be at or close to the price at which the security is next quoted or next trades.
3 Foreign currency translations: The accounting records of the Fund are maintained in U.S. dollars. Foreign currency amounts are normally translated into U.S. dollars using the exchange rate as of 4:00 p.m. Eastern Time, on days the NYSE is open for business, to determine the value of investments, other assets and liabilities. Purchase and sale prices of securities, and income and expenses, are translated into U.S. dollars at the prevailing rate of exchange on the respective dates of such transactions. Net unrealized foreign currency gain/(loss), if any, arises from changes in the value of assets and liabilities, other than investments in securities, as a result of changes in exchange rates and is stated separately in the Statement of Operations.
4 Securities transactions and investment income: Securities transactions are recorded on trade date for financial reporting purposes. Dividend income is recorded on the ex-dividend date or, for certain foreign dividends, as soon
13
as the Fund becomes aware of the dividends. Non-cash dividends included in dividend income, if any, are recorded at the fair market value of the securities received. Interest income, including accretion of discount (adjusted for original issue discount, where applicable), and amortization of premium, where applicable, is recorded on the accrual basis. Realized gains and losses from securities transactions and foreign currency transactions, if any, are recorded on the basis of identified cost and stated separately in the Statement of Operations. Included in net realized gain/(loss) on investments are proceeds from the settlement of class action litigation(s) in which the Fund participated as a class member. The amount of such proceeds for the year ended December 31, 2020, was $11,290.
5 Income tax information: The Fund is treated as a separate entity for U.S. federal income tax purposes. It is the policy of the Fund to continue to qualify for treatment as a regulated investment company ("RIC") by complying with the requirements of the U.S. Internal Revenue Code applicable to RICs and to distribute substantially all of its net investment income and net realized capital gains to its shareholders. To the extent the Fund distributes substantially all of its net investment income and net realized capital gains to shareholders, no federal income or excise tax provision is required.
The Fund has adopted the provisions of ASC 740 "Income Taxes" ("ASC 740"). ASC 740 sets forth a minimum threshold for financial statement recognition of a tax position taken, or expected to be taken, in a tax return. The Fund recognizes interest and penalties, if any, related to unrecognized tax positions as an income tax expense in the Statement of Operations. The Fund is subject to examination by U.S. federal and state tax authorities for returns filed for the tax years for which the applicable statutes of limitations have not yet expired. As of December 31, 2020, the Fund did not have any unrecognized tax positions.
For federal income tax purposes, the estimated cost in value of investments held at December 31, 2020 was $408,585,979. The estimated gross unrealized appreciation was $267,322,776 and estimated gross unrealized depreciation was $1,863,426 resulting in net unrealized appreciation of $265,459,350 based on cost for U.S. federal income tax purposes.
Income distributions and capital gain distributions are determined in accordance with income tax regulations, which may differ from GAAP. These differences are primarily due to differing treatments of income and gains on various investment securities held by the Fund, timing differences and differing characterization of distributions made by the Fund. The Fund may also utilize earnings and profits distributed to shareholders on redemption of their shares as a part of the dividends-paid deduction for income tax purposes.
Any permanent differences resulting from different book and tax treatment are reclassified at year-end and have no impact on net income, NAV or NAV per share of the Fund. For the year ended December 31, 2020, there were no permanent differences requiring a reclassification between total distributable earnings/(losses) and paid-in capital.
The tax character of distributions paid during the years ended December 31, 2020, and December 31, 2019, was as follows:
Distributions Paid From: | |
Ordinary Income | | Long-Term Capital Gain | | Total | |
| 2020 | | 2019 | | 2020 | | 2019 | | 2020 | | 2019 | |
| $ | 3,286,053 | | | $ | 2,241,408 | | | $ | 24,329,008 | | | $ | 31,793,233 | | | $ | 27,615,061 | | | $ | 34,034,641 | | |
14
As of December 31, 2020, the components of distributable earnings (accumulated losses) on a U.S. federal income tax basis were as follows:
Undistributed
Ordinary
Income | | Undistributed
Long-Term
Capital Gain | | Unrealized
Appreciation/
(Depreciation) | | Loss
Carryforwards
and Deferrals | | Other
Temporary
Differences | | Total | |
| $ | 2,523,788 | | | $ | 14,395,619 | | | $ | 265,499,538 | | | $ | — | | | $ | — | | | $ | 282,418,945 | | |
The temporary differences between book basis and tax basis distributable earnings are primarily due to losses disallowed and recognized on wash sales and tax adjustments related to real estate investment trusts ("REITs").
6 Distributions to shareholders: The Fund may earn income, net of expenses, daily on its investments. Distributions from net investment income and net realized capital gains, if any, are generally distributed once a year (usually in October) and are recorded on the ex-date.
It is the policy of the Fund to pass through to its shareholders substantially all REIT distributions and other income it receives, less operating expenses. The distributions the Fund receives from REITs are generally composed of income, capital gains, and/or return of REIT capital, but the REITs do not report this information to the Fund until the following calendar year. For the year ended December 31, 2020, the character of distributions, if any, paid to shareholders of the Fund disclosed within the Statements of Changes in Net Assets is based on estimates made at that time. Based on past experience it is possible that a portion of the Fund's distributions during the current fiscal year, if any, will be considered tax return of capital, but the actual amount of the tax return of capital, if any, is not determinable until after the Fund's fiscal year-end. After calendar year-end, when the Fund learns the nature of the distributions paid by REITs during that year, distributions previously identified as income are often recharacterized as return of capital and/or capital gain. After all applicable REITs have informed the Fund of the actual breakdown of distributions paid to the Fund during its fiscal year, estimates previously recorded are adjusted to reflect actual results. As a result, the composition of the Fund's distributions as reported herein may differ from the final composition determined after calendar year-end and reported to Fund shareholders on IRS Form 1099-DIV.
7 Foreign taxes: Foreign taxes withheld, if any, represent amounts withheld by foreign tax authorities, net of refunds recoverable.
8 Expense allocation: Certain expenses are applicable to multiple funds within the complex of related investment companies. Expenses directly attributable to a fund are charged to that fund. Expenses of the Trust that are not directly attributable to a particular series of the Trust (e.g., the Fund) are allocated among the series of the Trust, on the basis of relative net assets, except where a more appropriate allocation of expenses to each of the series can otherwise be made fairly. Expenses borne by the complex of related investment companies, which includes open-end and closed-end investment companies for which NBIA serves as investment manager, that are not directly attributable to a particular investment company in the complex (e.g., the Trust) or series thereof are allocated among the investment companies in the complex or series thereof on the basis of relative net assets, except where a more appropriate allocation of expenses to each of the investment companies in the complex or series thereof can otherwise be made fairly. The Fund's expenses (other than those specific to each class) are allocated proportionally each day among its classes based upon the relative net assets of each class.
9 Investments in foreign securities: Investing in foreign securities may involve sovereign and other risks, in addition to the credit and market risks normally associated with domestic securities. These additional risks include the possibility of adverse political and economic developments (including political instability, nationalization, expropriation, or confiscatory taxation) and the potentially adverse effects of unavailability of public information regarding issuers, less governmental supervision and regulation of financial markets, reduced liquidity of certain financial markets, and the lack of uniform accounting, auditing, and financial reporting standards or the application of standards that are different or less stringent than those applied in the United States. Foreign securities also may experience greater price volatility, higher rates of inflation, and delays in settlement.
15
10 Investment company securities and exchange-traded funds: The Fund may invest in shares of other registered investment companies, including exchange-traded funds ("ETFs"), within the limitations prescribed by (a) the 1940 Act, (b) the exemptive order from the Securities and Exchange Commission ("SEC") that permits the Fund to invest in both affiliated and unaffiliated investment companies, including ETFs, in excess of the limits in Section 12(d)(1)(A) of the 1940 Act, subject to the terms and conditions of such order, or (c) the ETF's exemptive order or other relief. Some ETFs seek to track the performance of a particular market index. These indices include both broad-based market indices and more narrowly-based indices, including those relating to particular sectors, markets, regions or industries. However, some ETFs have an actively-managed investment objective. ETF shares are traded like traditional equity securities on a national securities exchange or NASDAQ. The Fund will indirectly bear its proportionate share of any management fees and other expenses paid by such other investment companies, which will decrease returns.
11 Securities lending: The Fund, using State Street Bank and Trust Company ("State Street") as its lending agent, may loan securities to qualified brokers and dealers in exchange for negotiated lender's fees. These fees, if any, would be disclosed within the Statement of Operations under the caption "Income from securities loaned-net" and are net of expenses retained by State Street as compensation for its services as lending agent.
The initial cash collateral received by the Fund at the beginning of each transaction shall have a value equal to at least 102% of the prior day's market value of the loaned securities (105% in the case of international securities). Thereafter, the value of the cash collateral is monitored on a daily basis, and cash collateral is moved daily between a counterparty and the Fund until the close of the transaction. The Fund may only receive collateral in the form of cash (U.S. dollars). Cash collateral is generally invested in a money market fund registered under the 1940 Act that is managed by an affiliate of State Street. The risks associated with lending portfolio securities include, but are not limited to, possible delays in receiving additional collateral or in the recovery of the loaned securities. Any increase or decrease in the fair value of the securities loaned and any interest earned or dividends paid or owed on those securities during the term of the loan would accrue to the Fund.
During the year ended December 31, 2020, the Fund did not participate in securities lending.
12 Indemnifications: Like many other companies, the Trust's organizational documents provide that its officers ("Officers") and trustees ("Trustees") are indemnified against certain liabilities arising out of the performance of their duties to the Trust. In addition, both in some of its principal service contracts and in the normal course of its business, the Trust enters into contracts that provide indemnifications to other parties for certain types of losses or liabilities. The Trust's maximum exposure under these arrangements is unknown as this could involve future claims against the Trust.
13 Other: All net investment income and realized and unrealized capital gains and losses of the Fund are allocated, on the basis of relative net assets, pro rata among its respective classes.
14 Other matters—Coronavirus: The outbreak of the novel coronavirus in many countries, which is a rapidly evolving situation, has, among other things, disrupted global travel and supply chains, and has adversely impacted global commercial activity, the transportation industry and commodity prices in the energy sector. The impact of this virus has negatively affected and may continue to affect the economies of many nations, individual companies and the global securities and commodities markets, including liquidity and volatility, in ways that cannot necessarily be foreseen at the present time. The rapid development and fluidity of this situation precludes any prediction as to its ultimate impact, which may have a continued adverse effect on economic and market conditions and trigger a period of global economic slowdown. Such conditions (which may be across industries, sectors or geographies) have impacted and may continue to impact the issuers of the securities held by the Fund.
16
Note B—Investment Management Fees, Administration Fees, Distribution Arrangements, and Other Transactions With Affiliates:
The Fund retains NBIA as its investment manager under a Management Agreement. For such investment management services, the Fund pays NBIA an investment management fee at the annual rate of 0.55% of the first $250 million of the Fund's average daily net assets, 0.525% of the next $250 million, 0.50% of the next $250 million, 0.475% of the next $250 million, 0.45% of the next $500 million, 0.425% of the next $2.5 billion, and 0.40% of average daily net assets in excess of $4 billion. Accordingly, for the year ended December 31, 2020, the investment management fee pursuant to the Management Agreement was equivalent to an annual effective rate of 0.53% of the Fund's average daily net assets.
The Fund retains NBIA as its administrator under an Administration Agreement. Each class pays NBIA an administration fee at the annual rate of 0.30% of its average daily net assets under this agreement. Additionally, NBIA retains State Street as its sub-administrator under a Sub-Administration Agreement. NBIA pays State Street a fee for all services received under the Sub-Administration Agreement.
NBIA has contractually agreed to waive fees and/or reimburse the Fund's Class I and Class S shares so that the total annual operating expenses of those classes do not exceed the expense limitations as detailed in the following table. These undertakings exclude interest, taxes, transaction costs, brokerage commissions, acquired fund fees and expenses, extraordinary expenses, and dividend and interest expenses relating to short sales, if any (commitment fees relating to borrowings are treated as interest for purposes of this exclusion) ("annual operating expenses"); consequently, net expenses may exceed the contractual expense limitations. The Fund has agreed that each of its classes will repay NBIA for fees and expenses waived or reimbursed for that class provided that repayment does not cause that class's annual operating expenses to exceed its contractual expense limitation in place at the time the fees and expenses were waived or reimbursed, or the expense limitation in place at the time the Fund repays NBIA, whichever is lower. Any such repayment must be made within three years after the year in which NBIA incurred the expense.
During the year ended December 31, 2020, the Fund's Class S shares repaid NBIA $9,196, under its contractual expense limitation.
At December 31, 2020, the Fund's contingent liabilities to NBIA under the agreements were as follows:
| | | | | | | Expenses Reimbursed in
Year Ended December 31, | |
| | | | |
| | 2018 | | 2019 | | 2020 | |
| | | | | | | Subject to Repayment Until December 31, | |
Class | | Contractual
Expense
Limitation(a) | | Expiration | | 2021 | | 2022 | | 2023 | |
Class I | | | 1.30 | % | | 12/31/23 | | $ | — | | | $ | — | | | $ | — | | |
Class S | | | 1.17 | % | | 12/31/23 | | | 20,826 | | | | 1,611 | | | | — | | |
(a) Expense limitation per annum of the respective class's average daily net assets.
Neuberger Berman BD LLC (the "Distributor") is the Fund's "principal underwriter" within the meaning of the 1940 Act. It acts as agent in arranging for the sale of the Fund's Class I shares without sales commission or other compensation and bears all advertising and promotion expenses incurred in the sale of those shares. The Board adopted a non-fee distribution plan for the Fund's Class I shares.
The Board has adopted a distribution and shareholder services plan (the "Plan") for Class S shares pursuant to Rule 12b-1 under the 1940 Act. The Plan provides that, as compensation for administrative and other services related to the sale and distribution of Class S shares, and ongoing services provided to investors in the class, the Distributor receives from Class S a fee at the annual rate of 0.25% of Class S's average daily net assets.
17
The Distributor may pay a portion of the proceeds from the 12b-1 fee to institutions that provide such services, including insurance companies or their affiliates and qualified plan administrators ("intermediaries") for services they provide respecting the Fund to current and prospective variable contract owners and qualified plan participants that invest in the Fund through the intermediaries. Those institutions may use the payments for, among other purposes, compensating employees engaged in sales and/or shareholder servicing. The amount of fees paid by the class during any year may be more or less than the cost of distribution and other services provided to the class. FINRA rules limit the amount of annual distribution fees that may be paid by a mutual fund and impose a ceiling on the cumulative distribution fees paid. The Plan complies with those rules.
Note C—Securities Transactions:
During the year ended December 31, 2020, there were purchase and sale transactions of long-term securities of $125,312,200 and $169,877,360, respectively.
During the year ended December 31, 2020, no brokerage commissions on securities transactions were paid to affiliated brokers.
Note D—Fund Share Transactions:
Share activity for the years ended December 31, 2020, and December 31, 2019, was as follows:
| | For the Year Ended December 31, 2020 | | For the Year Ended December 31, 2019 | |
| | Shares
Sold | | Shares Issued on
Reinvestment of
Dividends and
Distributions | | Shares
Redeemed | | Total | | Shares
Sold | | Shares Issued on
Reinvestment of
Dividends and
Distributions | | Shares Issued
in Connection
with Tax-Free
Reorganization
(see Note F) | | Shares
Redeemed | | Total | |
Class I | | | 599,225 | | | | 818,008 | | | | (1,968,226 | ) | | | (550,993 | ) | | | 1,935,571 | | | | 1,095,787 | | | | 1,956,524 | | | | (1,650,810 | ) | | | 3,337,072 | | |
Class S | | | 159,875 | | | | 184,775 | | | | (626,951 | ) | | | (282,301 | ) | | | 1,862,001 | | | | 265,188 | | | | 4,775 | | | | (680,000 | ) | | | 1,451,964 | | |
Note E—Line of Credit:
At December 31, 2020, the Fund was a participant in a syndicated committed, unsecured $700,000,000 line of credit (the "Credit Facility"), to be used only for temporary or emergency purposes. Series of other investment companies managed by NBIA also participate in this line of credit on substantially the same terms. Interest is charged on borrowings under this Credit Facility at the highest of (a) a federal funds effective rate plus 1.00% per annum, (b) a Eurodollar rate for a one-month period plus 1.00% per annum, and (c) an overnight bank funding rate plus 1.00% per annum. The Credit Facility has an annual commitment fee of 0.15% per annum of the available line of credit, which is paid quarterly. The Fund has agreed to pay its pro rata share of the annual commitment fee, based on the ratio of its individual net assets to the net assets of all participants at the time the fee is due, and interest charged on any borrowing made by the Fund and other costs incurred by the Fund. Because several mutual funds participate in the Credit Facility, there is no assurance that the Fund will have access to all or any part of the $700,000,000 at any particular time. There were no loans outstanding under the Credit Facility at December 31, 2020. During the year ended December 31, 2020, the Fund did not utilize the Credit Facility.
Note F—Reorganizations:
At a meeting held on December 13, 2018, the Board of the Trust approved two separate tax-free reorganizations of Neuberger Berman Advisers Management Trust Guardian Portfolio ("Guardian Portfolio") and Neuberger Berman Advisers Management Trust Large Cap Value Portfolio ("Large Cap Value Portfolio") (each, a "Merging
18
Portfolio") into the Fund (the "Surviving Portfolio," and together with the Merging Portfolios, the "Reorganization Portfolios"). All Reorganization Portfolios are series of the Trust. After the close of business on April 30, 2019, the Surviving Portfolio acquired all of the net assets of the Merging Portfolios in a tax-free exchange of shares pursuant to the Plan of Reorganization and Dissolution approved by the Board. Accordingly, shareholders of each Merging Portfolio became shareholders of the Surviving Portfolio.
Guardian Portfolio | | Shares Prior to
Reorganization | | Shares Issued by
the Surviving
Portfolio | | Net Assets Prior
to Reorganization | |
Class I | | | 743,986 | | | | 308,792 | | | $ | 8,065,623 | | |
Class S | | | 11,758 | | | | 4,775 | | | | 125,163 | | |
Large Cap
Value Portfolio | | Shares Prior to
Reorganization | | Shares Issued by
the Surviving
Portfolio | | Net Assets Prior
to Reorganization | |
Class I | | | 3,418,695 | | | | 1,647,732 | | | $ | 43,038,633 | | |
The appreciation of Guardian Portfolio and Large Cap Value Portfolio were $2,282,095 and $389,841, respectively, as of the date of the reorganization. The combined net assets of the Surviving Portfolio immediately after the reorganization were $594,631,684. For financial reporting purposes, assets received and shares issued by the Surviving Portfolio were recorded at fair value; however, the cost basis of the investments received from the Merging Portfolios were carried forward to align ongoing reporting of the Surviving Portfolio's realized and unrealized gains and losses with amounts distributable to shareholders for tax purposes.
19
Sustainable Equity Portfolio
The following tables include selected data for a share outstanding throughout each year and other performance information derived from the Financial Statements. Amounts that do not round to $0.01 or $(0.01) per share are presented as $0.00 or $(0.00), respectively. Ratios that do not round to 0.01% or (0.01)% are presented as 0.00% or (0.00)%, respectively. A "—" indicates that the line item was not applicable in the corresponding period.
Class I | |
| | | Year Ended December 31, | |
| | | 2020 | | 2019 | | 2018 | | 2017 | | 2016 | |
Net Asset Value, Beginning of Year | | $ | 26.89 | | | $ | 22.70 | | | $ | 25.61 | | | $ | 22.57 | | | $ | 21.46 | | |
Income From Investment Operations: | |
| Net Investment Income/(Loss)@ | | | 0.13 | | | | 0.17 | | | | 0.14 | | | | 0.12 | | | | 0.13 | | |
Net Gains or Losses on Securities
(both realized and unrealized) | | | 4.98 | | | | 5.59 | | | | (1.48 | ) | | | 3.99 | | | | 1.94 | | |
Total From Investment Operations | | | 5.11 | | | | 5.76 | | | | (1.34 | ) | | | 4.11 | | | | 2.07 | | |
Less Distributions From: | |
Net Investment Income | | | (0.17 | ) | | | (0.11 | ) | | | (0.13 | ) | | | (0.13 | ) | | | (0.16 | ) | |
Net Realized Capital Gains | | | (1.14 | ) | | | (1.46 | ) | | | (1.44 | ) | | | (0.94 | ) | | | (0.80 | ) | |
Total Distributions | | | (1.31 | ) | | | (1.57 | ) | | | (1.57 | ) | | | (1.07 | ) | | | (0.96 | ) | |
Net Asset Value, End of Year | | $ | 30.69 | | | $ | 26.89 | | | $ | 22.70 | | | $ | 25.61 | | | $ | 22.57 | | |
| Total Return† | | | 19.56 | %^ | | | 25.88 | %^ | | | (5.73 | )%^ | | | 18.43 | %^‡ | | | 9.86 | % | |
Ratios/Supplemental Data | |
Net Assets, End of Year (in millions) | | $ | 544.0 | | | $ | 491.3 | | | $ | 339.0 | | | $ | 379.6 | | | $ | 329.1 | | |
| Ratio of Gross Expenses to Average Net Assets# | | | 0.92 | % | | | 0.93 | % | | | 0.95 | % | | | 0.94 | % | | | 1.00 | % | |
Ratio of Net Expenses to Average Net Assets | | | 0.92 | % | | | 0.93 | % | | | 0.95 | % | | | 0.93 | %ß | | | 1.00 | % | |
Ratio of Net Investment Income/(Loss) to Average
Net Assets | | | 0.48 | % | | | 0.67 | % | | | 0.53 | % | | | 0.50 | %ß | | | 0.59 | % | |
Portfolio Turnover Rate | | | 22 | % | | | 21 | %ñ | | | 13 | % | | | 18 | % | | | 31 | % | |
See Notes to Financial Highlights
20
Financial Highlights (cont'd)
Class S | |
| | | Year Ended December 31, | |
| | | 2020 | | 2019 | | 2018 | | 2017 | | 2016 | |
Net Asset Value, Beginning of Year | | $ | 26.97 | | | $ | 22.79 | | | $ | 25.69 | | | $ | 22.66 | | | $ | 21.54 | | |
Income From Investment Operations: | |
| Net Investment Income/(Loss)@ | | | 0.06 | | | | 0.10 | | | | 0.08 | | | | 0.06 | | | | 0.09 | | |
Net Gains or Losses on Securities
(both realized and unrealized) | | | 5.00 | | | | 5.61 | | | | (1.48 | ) | | | 3.99 | | | | 1.94 | | |
Total From Investment Operations | | | 5.06 | | | | 5.71 | | | | (1.40 | ) | | | 4.05 | | | | 2.03 | | |
Less Distributions From: | |
Net Investment Income | | | (0.11 | ) | | | (0.07 | ) | | | (0.06 | ) | | | (0.08 | ) | | | (0.11 | ) | |
Net Realized Capital Gains | | | (1.14 | ) | | | (1.46 | ) | | | (1.44 | ) | | | (0.94 | ) | | | (0.80 | ) | |
Total Distributions | | | (1.25 | ) | | | (1.53 | ) | | | (1.50 | ) | | | (1.02 | ) | | | (0.91 | ) | |
Net Asset Value, End of Year | | $ | 30.78 | | | $ | 26.97 | | | $ | 22.79 | | | $ | 25.69 | | | $ | 22.66 | | |
| Total Return† | | | 19.28 | %^ | | | 25.58 | %^ | | | (5.94 | )%^ | | | 18.11 | %^‡ | | | 9.64 | % | |
Ratios/Supplemental Data | |
Net Assets, End of Year (in millions) | | $ | 130.0 | | | $ | 121.5 | | | $ | 69.6 | | | $ | 85.7 | | | $ | 78.2 | | |
| Ratio of Gross Expenses to Average Net Assets# | | | 1.17 | % | | | 1.18 | % | | | 1.20 | % | | | 1.19 | % | | | 1.25 | % | |
Ratio of Net Expenses to Average Net Assets | | | 1.17 | %§ | | | 1.17 | % | | | 1.17 | % | | | 1.17 | %ß | | | 1.17 | % | |
Ratio of Net Investment Income/(Loss) to Average
Net Assets | | | 0.22 | % | | | 0.39 | % | | | 0.31 | % | | | 0.25 | %ß | | | 0.42 | % | |
Portfolio Turnover Rate | | | 22 | % | | | 21 | %ñ | | | 13 | % | | | 18 | % | | | 31 | % | |
See Notes to Financial Highlights
21
Notes to Financial Highlights Sustainable Equity Portfolio
@ Calculated based on the average number of shares outstanding during each fiscal period.
† Total return based on per share NAV reflects the effects of changes in NAV on the performance of the Fund during each fiscal period. Returns assume income dividends and other distributions, if any, were reinvested. Results represent past performance and do not indicate future results. Current returns may be lower or higher than the performance data quoted. Investment returns and principal will fluctuate and shares, when redeemed, may be worth more or less than original cost. Total return would have been lower if Management had not reimbursed and/or waived certain expenses. The total return information shown does not reflect charges and other expenses that apply to the separate accounts or the related insurance policies or other qualified pension or retirement plans, and the inclusion of these charges and other expenses would reduce the total return for all fiscal periods shown.
^ The class action proceeds listed in Note A of the Notes to Financial Statements had no impact on the Fund's total return for the year ended December 31, 2020. The class action proceeds received in 2019, 2018 and 2017 had no impact on the Fund's total returns for the years ended December 31, 2019, 2018 and 2017, respectively.
‡ In May 2016, the Fund's custodian, State Street, announced that it had identified inconsistencies in the way in which the Fund was invoiced for categories of expenses, particularly those deemed "out-of-pocket" costs, from 1998 through November 2015, and refunded to the Fund certain expenses, plus interest, determined to be payable to the Fund for the period in question. These amounts were refunded to the Fund by State Street during the year ended December 31, 2017. These amounts had no impact on the Fund's total returns for the year ended December 31, 2017.
# Represents the annualized ratios of net expenses to average daily net assets if Management had not reimbursed certain expenses and/or waived a portion of the investment management fee and/or if the Fund had not received refunds, plus interest, from State Street noted in ‡ above for custodian out-of-pocket expenses previously paid during the year ended December 31, 2017. Management did not reimburse or waive fees during the fiscal periods shown for Class I.
§ After repayment of expenses previously reimbursed and/or fees previously waived by Management, as applicable. Had the Fund not made such repayments, the annualized ratios of net expenses to average net assets would have been:
| | | Year Ended
December 31,
2020 | |
Class S | | | 1.17 | % | |
ß The custodian expenses refund noted in ‡ above is non-recurring and is included in these ratios. Had the Fund not received the refund, the annualized ratio of net expenses to average net assets and the annualized ratio of net investment income/(loss) to average net assets would have been:
| | | Ratio of Net
Expenses to
Average Net
Assets
Year Ended
December 31, 2017 | | Ratio of Net
Investment
Income/(Loss)
to Average
Net Assets
Year Ended
December 31, 2017 | |
Class I | | | 0.94 | % | | | 0.48 | % | |
Class S | | | 1.17 | % | | | 0.25 | % | |
22
Notes to Financial Highlights Sustainable Equity Portfolio (cont'd)
ñ After the close of business on April 30, 2019, the Fund acquired all of the net assets of Neuberger Berman Advisers Management Trust Guardian Portfolio ("Guardian") and Neuberger Berman Advisers Management Trust Large Cap Value Portfolio ("Large Cap Value") in a tax-free exchange of shares pursuant to a Plan of Reorganization and Dissolution approved by the Board. Portfolio turnover excludes purchases of $114,219,008 of securities acquired pursuant to the reorganization, and there were no sales made following a purchase-of-assets transaction relative to the reorganization.
23
Report of Independent Registered Public Accounting Firm
To the Shareholders of
Sustainable Equity Portfolio and
Board of Trustees of the Neuberger Berman Advisers Management Trust
Opinion on the Financial Statements
We have audited the accompanying statement of assets and liabilities of Sustainable Equity Portfolio (the "Portfolio") (one of the portfolios constituting Neuberger Berman Advisers Management Trust (the "Trust")), including the schedule of investments, as of December 31, 2020, and the related statement of operations for the year then ended, the statements of changes in net assets for each of the two years in the period then ended, the financial highlights for each of the five years in the period then ended and the related notes (collectively referred to as the "financial statements"). In our opinion, the financial statements present fairly, in all material respects, the financial position of the Portfolio (one of the portfolios constituting Neuberger Berman Advisers Management Trust) at December 31, 2020, the results of its operations for the year then ended, the changes in its net assets for each of the two years in the period then ended and its financial highlights for each of the five years in the period then ended, in conformity with U.S. generally accepted accounting principles.
Basis for Opinion
These financial statements are the responsibility of the Trust's management. Our responsibility is to express an opinion on the Portfolio's financial statements based on our audits. We are a public accounting firm registered with the Public Company Accounting Oversight Board (United States) ("PCAOB") and are required to be independent with respect to the Trust in accordance with the U.S. federal securities laws and the applicable rules and regulations of the Securities and Exchange Commission and the PCAOB.
We conducted our audits in accordance with the standards of the PCAOB. Those standards require that we plan and perform the audit to obtain reasonable assurance about whether the financial statements are free of material misstatement, whether due to error or fraud. The Trust is not required to have, nor were we engaged to perform, an audit of the Trust's internal control over financial reporting. As part of our audits, we are required to obtain an understanding of internal control over financial reporting, but not for the purpose of expressing an opinion on the effectiveness of the Trust's internal control over financial reporting. Accordingly, we express no such opinion.
Our audits included performing procedures to assess the risks of material misstatement of the financial statements, whether due to error or fraud, and performing procedures that respond to those risks. Such procedures included examining, on a test basis, evidence regarding the amounts and disclosures in the financial statements. Our procedures included confirmation of securities owned as of December 31, 2020, by correspondence with the custodian. Our audits also included evaluating the accounting principles used and significant estimates made by management, as well as evaluating the overall presentation of the financial statements. We believe that our audits provide a reasonable basis for our opinion.
We have served as the auditor of one or more Neuberger Berman investment companies since 1954.
Boston, Massachusetts
February 12, 2021
24
The following tables set forth information concerning the Trustees and Officers of the Fund. All persons named as Trustees and Officers also serve in similar capacities for other funds administered or managed by Neuberger Berman Investment Advisers LLC ("NBIA"). The Fund's Statement of Additional Information includes additional information about the Trustees as of the time of the Fund's most recent public offering and is available upon request, without charge, by calling (800) 877-9700.
Information about the Board of Trustees
Name, (Year of Birth),
and Address(1) | | Position(s)
and Length of
Time Served(2) | | Principal Occupation(s)(3) | | Number of
Funds in Fund
Complex
Overseen by
Fund Trustee | | Other Directorships
Held Outside Fund
Complex by Fund
Trustee(3) | |
Independent Fund Trustees | |
Michael J. Cosgrove (1949) | | Trustee since 2015 | | President, Carragh Consulting USA, since 2014; formerly, Executive, General Electric Company, 1970 to 2014, including President, Mutual Funds and Global Investment Programs, GE Asset Management, 2011 to 2014, President and Chief Executive Officer, Mutual Funds and Intermediary Business, GE Asset Management, 2007 to 2011, President, Institutional Sales and Marketing, GE Asset Management, 1998 to 2007, and Chief Financial Officer, GE Asset Management, and Deputy Treasurer, GE Company, 1988 to 1993. | |
| 46 |
| | Director, America Press, Inc. (not-for-profit Jesuit publisher), since 2015; formerly, Director, Fordham University, 2001 to 2018; formerly, Director, The Gabelli Go Anywhere Trust, June 2015 to June 2016; formerly, Director, Skin Cancer Foundation (not-for-profit), 2006 to 2015; formerly, Director, GE Investments Funds, Inc., 1997 to 2014; formerly, Trustee, GE Institutional Funds, 1997 to 2014; formerly, Director, GE Asset Management, 1988 to 2014; formerly, Director, Elfun Trusts, 1988 to 2014; formerly, Trustee, GE Pension & Benefit Plans, 1988 to 2014; formerly, Member of Board of Governors, Investment Company Institute. | |
25
Name, (Year of Birth),
and Address(1) | | Position(s)
and Length of
Time Served(2) | | Principal Occupation(s)(3) | | Number of
Funds in Fund
Complex
Overseen by
Fund Trustee | | Other Directorships
Held Outside Fund
Complex by Fund
Trustee(3) | |
Marc Gary (1952) | | Trustee since 2015 | | Executive Vice Chancellor and Chief Operating Officer, Jewish Theological Seminary, since 2012; formerly, Executive Vice President and General Counsel, Fidelity Investments, 2007 to 2012; formerly, Executive Vice President and General Counsel, BellSouth Corporation, 2004 to 2007; formerly, Vice President and Associate General Counsel, BellSouth Corporation, 2000 to 2004; formerly, Associate, Partner, and National Litigation Practice Co-Chair, Mayer, Brown LLP, 1981 to 2000; formerly, Associate Independent Counsel, Office of Independent Counsel, 1990 to 1992. | |
| 46 |
| | Director, UJA Federation of Greater New York, since 2019; Trustee, Jewish Theological Seminary, since 2015; Director, Legility, Inc. (privately held for-profit company), since 2012; Director, Lawyers Committee for Civil Rights Under Law (not-for-profit), since 2005; formerly, Director, Equal Justice Works (not-for-profit), 2005 to 2014; formerly, Director, Corporate Counsel Institute, Georgetown University Law Center, 2007 to 2012; formerly, Director, Greater Boston Legal Services (not-for-profit), 2007 to 2012. | |
26
Name, (Year of Birth),
and Address(1) | | Position(s)
and Length of
Time Served(2) | | Principal Occupation(s)(3) | | Number of
Funds in Fund
Complex
Overseen by
Fund Trustee | | Other Directorships
Held Outside Fund
Complex by Fund
Trustee(3) | |
Martha C. Goss (1949) | | Trustee since 2007 | | President, Woodhill Enterprises Inc./Chase Hollow Associates LLC (personal investment vehicle), since 2006; formerly, Consultant, Resources Global Professionals (temporary staffing), 2002 to 2006; formerly, Chief Financial Officer, Booz-Allen & Hamilton, Inc., 1995 to 1999; formerly, Enterprise Risk Officer, Prudential Insurance, 1994 to1995; formerly, President, Prudential Asset Management Company, 1992 to 1994; formerly, President, Prudential Power Funding (investments in electric and gas utilities and alternative energy projects), 1989 to 1992; formerly, Treasurer, Prudential Insurance Company, 1983 to 1989. | |
| 46 |
| | Director, American Water (water utility), since 2003; Director, Allianz Life of New York (insurance), since 2005; Director, Berger Group Holdings, Inc. (engineering consulting firm), since 2013; Director, Financial Women's Association of New York (not-for-profit association), since 2003; Trustee Emerita, Brown University, since 1998; Director, Museum of American Finance (not-for-profit), since 2013; formerly, Non-Executive Chair and Director, Channel Reinsurance (financial guaranty reinsurance), 2006 to 2010; formerly, Director, Ocwen Financial Corporation (mortgage servicing), 2005 to 2010; formerly, Director, Claire's Stores, Inc. (retailer), 2005 to 2007; formerly, Director, Parsons Brinckerhoff Inc. (engineering consulting firm), 2007 to 2010; formerly, Director, Bank Leumi (commercial bank), 2005 to 2007; formerly, Advisory Board Member, Attensity (software developer), 2005 to 2007. | |
27
Name, (Year of Birth),
and Address(1) | | Position(s)
and Length of
Time Served(2) | | Principal Occupation(s)(3) | | Number of
Funds in Fund
Complex
Overseen by
Fund Trustee | | Other Directorships
Held Outside Fund
Complex by Fund
Trustee(3) | |
Michael M. Knetter (1960) | | Trustee since 2007 | | President and Chief Executive Officer, University of Wisconsin Foundation, since 2010; formerly, Dean, School of Business, University of Wisconsin—Madison; formerly, Professor of International Economics and Associate Dean, Amos Tuck School of Business—Dartmouth College, 1998 to 2002. | |
| 46 |
| | Director, 1 William Street Credit Income Fund, since 2018; Board Member, American Family Insurance (a mutual company, not publicly traded), since March 2009; formerly, Trustee, Northwestern Mutual Series Fund, Inc., 2007 to 2011; formerly, Director, Wausau Paper, 2005 to 2011; formerly, Director, Great Wolf Resorts, 2004 to 2009. | |
Deborah C. McLean (1954) | | Trustee since 2015 | | Member, Circle Financial Group (private wealth management membership practice), since 2011; Managing Director, Golden Seeds LLC (an angel investing group), since 2009; Adjunct Professor, Columbia University School of International and Public Affairs, since 2008; formerly, Visiting Assistant Professor, Fairfield University, Dolan School of Business, Fall 2007; formerly, Adjunct Associate Professor of Finance, Richmond, The American International University in London, 1999 to 2007. | |
| 46 |
| | Board member, Norwalk Community College Foundation, since 2014; Dean's Advisory Council, Radcliffe Institute for Advanced Study, since 2014; formerly, Director and Treasurer, At Home in Darien (not-for-profit), 2012 to 2014; formerly, Director, National Executive Service Corps (not-for-profit), 2012 to 2013; formerly, Trustee, Richmond, The American International University in London, 1999 to 2013. | |
28
Name, (Year of Birth),
and Address(1) | | Position(s)
and Length of
Time Served(2) | | Principal Occupation(s)(3) | | Number of
Funds in Fund
Complex
Overseen by
Fund Trustee | | Other Directorships
Held Outside Fund
Complex by Fund
Trustee(3) | |
George W. Morriss (1947) | | Trustee since 2007 | | Adjunct Professor, Columbia University School of International and Public Affairs, since 2012; formerly, Executive Vice President and Chief Financial Officer, People's United Bank, Connecticut (a financial services company), 1991 to 2001. | |
| 46 |
| | Director, 1 William Street Credit Income Fund, since 2018; Director and Chair, Thrivent Church Loan and Income Fund, since 2018; formerly, Trustee, Steben Alternative Investment Funds, Steben Select Multi-Strategy Fund, and Steben Select Multi-Strategy Master Fund, 2013 to 2017; formerly, Treasurer, National Association of Corporate Directors, Connecticut Chapter, 2011 to 2015; formerly, Manager, Larch Lane Multi-Strategy Fund complex (which consisted of three funds), 2006 to 2011; formerly, Member, NASDAQ Issuers' Affairs Committee, 1995 to 2003. | |
Tom D. Seip (1950) | | Trustee since 2000; Chairman of the Board since 2008; formerly Lead Independent Trustee from 2006 to 2008 | | Formerly, Managing Member, Ridgefield Farm LLC (a private investment vehicle), 2004 to 2016; formerly, President and CEO, Westaff, Inc. (temporary staffing), May 2001 to January 2002; formerly, Senior Executive, The Charles Schwab Corporation, 1983 to 1998, including Chief Executive Officer, Charles Schwab Investment Management, Inc.; Trustee, Schwab Family of Funds and Schwab Investments, 1997 to 1998; and Executive Vice President-Retail Brokerage, Charles Schwab & Co., Inc., 1994 to 1997. | |
| 46 |
| | Formerly, Director, H&R Block, Inc. (tax services company), 2001 to 2018; formerly, Director, Talbot Hospice Inc., 2013 to 2016; formerly, Chairman, Governance and Nominating Committee, H&R Block, Inc., 2011 to 2015; formerly, Chairman, Compensation Committee, H&R Block, Inc., 2006 to 2010; formerly, Director, Forward Management, Inc. (asset management company), 1999 to 2006. | |
29
Name, (Year of Birth),
and Address(1) | | Position(s)
and Length of
Time Served(2) | | Principal Occupation(s)(3) | | Number of
Funds in Fund
Complex
Overseen by
Fund Trustee | | Other Directorships
Held Outside Fund
Complex by Fund
Trustee(3) | |
James G. Stavridis (1955) | | Trustee since 2015 | | Operating Executive, The Carlyle Group, since 2018; Commentator, NBC News, since 2015; formerly, Dean, Fletcher School of Law and Diplomacy, Tufts University, 2013 to 2018; formerly, Admiral, United States Navy, 1976 to 2013, including Supreme Allied Commander, NATO and Commander, European Command, 2009 to 2013, and Commander, United States Southern Command, 2006 to 2009. | |
| 46 |
| | Director, American Water (water utility), since 2018; Director, NFP Corp. (insurance broker and consultant), since 2017; Director, U.S. Naval Institute, since 2014; Director, Onassis Foundation, since 2014; Director, BMC Software Federal, LLC, since 2014; Director, Vertical Knowledge, LLC, since 2013; formerly, Director, Navy Federal Credit Union, 2000-2002. | |
30
Name, (Year of Birth),
and Address(1) | | Position(s)
and Length of
Time Served(2) | | Principal Occupation(s)(3) | | Number of
Funds in Fund
Complex
Overseen by
Fund Trustee | | Other Directorships
Held Outside Fund
Complex by Fund
Trustee(3) | |
Candace L. Straight (1947) | | Trustee since 1999 | | Private investor and consultant specializing in the insurance industry; formerly, Advisory Director, Securitas Capital LLC (a global private equity investment firm dedicated to making investments in the insurance sector), 1998 to 2003. | |
| 46 |
| | Director, ERA Coalition (not-for-profit), 2019 to 2020; Director, Re belle Media (a privately held TV and film production company), since 2018; formerly, Public Member, Board of Governors and Board of Trustees, Rutgers University, 2011 to 2016; formerly, Director, Montpelier Re Holdings Ltd. (reinsurance company), 2006 to 2015; formerly, Director, National Atlantic Holdings Corporation (property and casualty insurance company), 2004 to 2008; formerly, Director, The Proformance Insurance Company (property and casualty insurance company), 2004 to 2008; formerly, Director, Providence Washington Insurance Company (property and casualty insurance company), 1998 to 2006; formerly, Director, Summit Global Partners (insurance brokerage firm), 2000 to 2005. | |
Peter P. Trapp (1944) | | Trustee since 1984 | | Retired; formerly, Regional Manager for Mid-Southern Region, Ford Motor Credit Company, September 1997 to 2007; formerly, President, Ford Life Insurance Company, April 1995 to August 1997. | |
| 46 |
| | None. | |
31
Name, (Year of Birth),
and Address(1) | | Position(s)
and Length of
Time Served(2) | | Principal Occupation(s)(3) | | Number of
Funds in Fund
Complex
Overseen by
Fund Trustee | | Other Directorships
Held Outside Fund
Complex by Fund
Trustee(3) | |
Fund Trustees who are "Interested Persons" | |
Joseph V. Amato* (1962) | | Chief Executive Officer and President since 2018 and Trustee since 2009 | | President and Director, Neuberger Berman Group LLC, since 2009; President and Chief Executive Officer, Neuberger Berman BD LLC and Neuberger Berman Holdings LLC (including its predecessor, Neuberger Berman Inc.), since 2007; Chief Investment Officer (Equities) and President (Equities), NBIA (formerly, Neuberger Berman Fixed Income LLC and including predecessor entities), since 2007, and Board Member of NBIA since 2006; formerly, Global Head of Asset Management of Lehman Brothers Holdings Inc.'s ("LBHI") Investment Management Division, 2006 to 2009; formerly, member of LBHI's Investment Management Division's Executive Management Committee, 2006 to 2009; formerly, Managing Director, Lehman Brothers Inc. ("LBI"), 2006 to 2008; formerly, Chief Recruiting and Development Officer, LBI, 2005 to 2006; formerly, Global Head of LBI's Equity Sales and a Member of its Equities Division Executive Committee, 2003 to 2005; President and Chief Executive Officer, ten registered investment companies for which NBIA acts as investment manager and/or administrator. | |
| 46 |
| | Member of Board of Advisors, McDonough School of Business, Georgetown University, since 2001; Member of New York City Board of Advisors, Teach for America, since 2005; Trustee, Montclair Kimberley Academy (private school), since 2007; Member of Board of Regents, Georgetown University, since 2013. | |
(1) The business address of each listed person is 1290 Avenue of the Americas, New York, NY 10104.
32
(2) Pursuant to the Trust's Amended and Restated Trust Instrument, subject to any limitations on the term of service imposed by the By-Laws or any retirement policy adopted by the Fund Trustees, each Fund Trustee shall hold office for life or until his or her successor is elected or the Trust terminates; except that (a) any Fund Trustee may resign by delivering a written resignation; (b) any Fund Trustee may be removed with or without cause at any time by a written instrument signed by at least two-thirds of the other Fund Trustees; (c) any Fund Trustee who requests to be retired, or who has become unable to serve, may be retired by a written instrument signed by a majority of the other Fund Trustees; and (d) any Fund Trustee may be removed at any shareholder meeting by a vote of at least two-thirds of the outstanding shares.
(3) Except as otherwise indicated, each individual has held the positions shown during at least the last five years.
* Indicates a Fund Trustee who is an "interested person" within the meaning of the 1940 Act. Mr. Amato is an interested person of the Trust by virtue of the fact that he is an officer of NBIA and/or its affiliates.
33
Information about the Officers of the Trust
Name, (Year of Birth),
and Address(1) | | Position(s)
and Length of
Time Served(2) | | Principal Occupation(s)(3) | |
Claudia A. Brandon (1956) | | Executive Vice President since 2008 and Secretary since 1985 | | Senior Vice President, Neuberger Berman, since 2007 and Employee since 1999; Senior Vice President, NBIA, since 2008 and Assistant Secretary since 2004; formerly, Vice President, Neuberger Berman, 2002 to 2006; formerly, Vice President—Mutual Fund Board Relations, NBIA, 2000 to 2008; formerly, Vice President, NBIA, 1986 to 1999 and Employee, 1984 to 1999; Executive Vice President and Secretary, twenty-nine registered investment companies for which NBIA acts as investment manager and/or administrator. | |
Agnes Diaz (1971) | | Vice President since 2013 | | Senior Vice President, Neuberger Berman, since 2012; Senior Vice President, NBIA, since 2012 and Employee since 1996; formerly, Vice President, Neuberger Berman, 2007 to 2012; Vice President, ten registered investment companies for which NBIA acts as investment manager and/or administrator. | |
Anthony DiBernardo (1979) | | Assistant Treasurer since 2011 | | Senior Vice President, Neuberger Berman, since 2014; Senior Vice President, NBIA, since 2014, and Employee since 2003; formerly, Vice President, Neuberger Berman, 2009 to 2014; Assistant Treasurer, ten registered investment companies for which NBIA acts as investment manager and/or administrator. | |
Savonne L. Ferguson (1973) | | Chief Compliance Officer since 2018 | | Senior Vice President, Chief Compliance Officer (Mutual Funds) and Associate General Counsel, NBIA, since November 2018; formerly, Vice President T. Rowe Price Group, Inc. (2018), Vice President and Senior Legal Counsel, T. Rowe Price Associates, Inc. (2014-2018), Vice President and Director of Regulatory Fund Administration, PNC Capital Advisors, LLC (2009-2014), Secretary, PNC Funds and PNC Advantage Funds (2010-2014); Chief Compliance Officer, twenty-nine registered investment companies for which NBIA acts as investment manager and/or administrator. | |
Corey A. Issing (1978) | | Chief Legal Officer since 2016 (only for purposes of sections 307 and 406 of the Sarbanes-Oxley Act of 2002) | | General Counsel and Head of Compliance—Mutual Funds since 2016 and Managing Director, NBIA, since 2017; formerly, Associate General Counsel (2015 to 2016), Counsel (2007 to 2015), Senior Vice President (2013-2016), Vice President (2009-2013); Chief Legal Officer (only for purposes of sections 307 and 406 of the Sarbanes-Oxley Act of 2002), twenty-nine registered investment companies for which NBIA acts as investment manager and/or administrator. | |
Sheila R. James (1965) | | Assistant Secretary since 2002 | | Vice President, Neuberger Berman, since 2008 and Employee since 1999; Vice President, NBIA, since 2008; formerly, Assistant Vice President, Neuberger Berman, 2007; Employee, NBIA, 1991 to 1999; Assistant Secretary, twenty-nine registered investment companies for which NBIA acts as investment manager and/or administrator. | |
34
Name, (Year of Birth),
and Address(1) | | Position(s)
and Length of
Time Served(2) | | Principal Occupation(s)(3) | |
Brian Kerrane (1969) | | Chief Operating Officer since 2015 and Vice President since 2008 | | Managing Director, Neuberger Berman, since 2014; Chief Operating Officer—Mutual Funds and Managing Director, NBIA, since 2015; formerly, Senior Vice President, Neuberger Berman, 2006 to 2014; Vice President, NBIA, 2008 to 2015 and Employee since 1991; Chief Operating Officer, ten registered investment companies for which NBIA acts as investment manager and/or administrator; Vice President, twenty-nine registered investment companies for which NBIA acts as investment manager and/or administrator. | |
Anthony Maltese (1959) | | Vice President since 2015 | | Senior Vice President, Neuberger Berman, since 2014 and Employee since 2000; Senior Vice President, NBIA, since 2014; Vice President, ten registered investment companies for which NBIA acts as investment manager and/or administrator. | |
Josephine Marone (1963) | | Assistant Secretary since 2017 | | Senior Paralegal, Neuberger Berman, since 2007 and Employee since 2007; Assistant Secretary, twenty-nine registered investment companies for which NBIA acts as investment manager and/or administrator. | |
Owen F. McEntee, Jr. (1961) | | Vice President since 2008 | | Vice President, Neuberger Berman, since 2006; Vice President, NBIA, since 2006 and Employee since 1992; Vice President, ten registered investment companies for which NBIA acts as investment manager and/or administrator. | |
John M. McGovern (1970) | | Treasurer and Principal Financial and Accounting Officer since 2005 | | Senior Vice President, Neuberger Berman, since 2007; Senior Vice President, NBIA, since 2007 and Employee since 1993; formerly, Vice President, Neuberger Berman, 2004 to 2006; formerly, Assistant Treasurer, 2002 to 2005; Treasurer and Principal Financial and Accounting Officer, ten registered investment companies for which NBIA acts as investment manager and/or administrator. | |
Frank Rosato (1971) | | Assistant Treasurer since 2005 | | Vice President, Neuberger Berman, since 2006; Vice President, NBIA, since 2006 and Employee since 1995; Assistant Treasurer, ten registered investment companies for which NBIA acts as investment manager and/or administrator. | |
Niketh Velamoor (1979) | | Anti-Money Laundering Compliance Officer since 2018 | | Senior Vice President and Associate General Counsel, Neuberger Berman, since July 2018; Assistant United States Attorney, Southern District of New York, 2009 to 2018; Anti-Money Laundering Compliance Officer, four registered investment companies for which NBIA acts as investment manager and/or administrator. | |
(1) The business address of each listed person is 1290 Avenue of the Americas, New York, NY 10104.
(2) Pursuant to the By-Laws of the Trust, each officer elected by the Fund Trustees shall hold office until his or her successor shall have been elected and qualified or until his or her earlier death, inability to serve, or resignation. Officers serve at the pleasure of the Fund Trustees and may be removed at any time with or without cause.
(3) Except as otherwise indicated, each individual has held the positions shown during at least the last five years.
35
Proxy Voting Policies and Procedures
A description of the policies and procedures that the Trust uses to determine how to vote proxies relating to portfolio securities is available, without charge, by calling 800-877-9700 (toll-free) and on the SEC's website at www.sec.gov. Information regarding how the Trust voted proxies relating to portfolio securities during the most recent 12-month period ended June 30 is also available upon request, without charge, by calling 800-877-9700 (toll-free), on the SEC's website at www.sec.gov, and on Neuberger Berman's website at www.nb.com.
Quarterly Portfolio Schedule
The Trust files a complete schedule of portfolio holdings with the SEC for the first and third quarters of each fiscal year as an exhibit to its report on Form N-PORT. The Trust's Form N-PORT is available on the SEC's website at www.sec.gov. The portfolio holdings information on Form N-PORT is available upon request, without charge, by calling 800-877-9700 (toll free).
Board Consideration of the Management Agreement
On an annual basis, the Board of Trustees (the "Board") of Neuberger Berman Advisers Management Trust (the "Trust"), including the Trustees who are not "interested persons" of the Trust or of Neuberger Berman Investment Advisers LLC ("Management") (including its affiliates) ("Independent Fund Trustees"), considers whether to continue the management agreement with Management (the "Agreement") with respect to Sustainable Equity Portfolio (the "Fund"). Throughout the process, the Independent Fund Trustees are advised by counsel that is experienced in Investment Company Act of 1940 matters and that is independent of Management ("Independent Counsel"). At a meeting held on October 1, 2020, the Board, including the Independent Fund Trustees, approved the continuation of the Agreement for the Fund.
In evaluating the Agreement, the Board, including the Independent Fund Trustees, reviewed extensive materials provided by Management in response to questions submitted by the Independent Fund Trustees and Independent Counsel, and met with senior representatives of Management regarding its personnel, operations, and profitability as they relate to the Fund. The annual contract review extends over at least two regular meetings of the Board to ensure that Management has time to respond to any questions the Independent Fund Trustees may have on their initial review of the materials and that the Independent Fund Trustees have time to consider those responses.
In connection with its deliberations, the Board also considered the broad range of information relevant to the annual contract review that is provided to the Board (including its various standing committees) at meetings throughout the year, including reports on investment performance, portfolio risk, and other portfolio information for the Fund, as well as periodic reports on, among other matters, pricing and valuation; quality and cost of portfolio trade execution; compliance; and shareholder and other services provided by Management and its affiliates. The Contract Review Committee, which is comprised of Independent Fund Trustees, was established by the Board to assist in its evaluation and analysis of materials for the annual contract review. The Board has also established other committees that focus throughout the year on specific areas relevant to the annual contract review, such as Fund performance or compliance matters, and that are charged with specific responsibilities regarding the annual contract review. Those committees provide reports to the Contract Review Committee and the full Board, which consider that information as part of the annual contract review process. The Board's Contract Review Committee annually considers and updates the questions it asks of Management in light of legal advice furnished to it by Independent Counsel; its own business judgment; and developments in the industry, in the markets, in mutual fund regulation and litigation, and in Management's business model.
The Independent Fund Trustees received from Independent Counsel a memorandum discussing the legal standards for their consideration of the proposed continuation of the Agreement. During the course of the year and during their deliberations regarding the annual contract review, the Contract Review Committee and the Independent Fund Trustees met with Independent Counsel separately from representatives of Management.
Provided below is a description of the Board's contract approval process and material factors that the Board considered at its meetings regarding renewal of the Agreement and the compensation to be paid thereunder. In connection with its
36
approval of the continuation of the Agreement, the Board evaluated the terms of the Agreement, the overall fairness of the Agreement to the Fund, and whether the Agreement was in the best interests of the Fund and its shareholders. The Board's determination to approve the continuation of the Agreement was based on a comprehensive consideration of all information provided to the Board throughout the year and specifically in connection with the annual contract review. The Board considered the Fund's investment management agreement separately from those of other funds of the Trust.
This description is not intended to include all of the factors considered by the Board. The Board members did not identify any particular information or factor that was all-important or controlling, and each Trustee may have attributed different weights to the various factors. The Board focused on the costs and benefits of the Agreement to the Fund and, through the Fund, its shareholders.
Nature, Extent, and Quality of Services
With respect to the nature, extent, and quality of the services provided, the Board considered the investment philosophy and decision-making processes of, and the qualifications, experience, and capabilities of, and the resources available to, the portfolio management personnel of Management who perform services for the Fund. The Board noted that Management also provides certain administrative services, including fund accounting and compliance services. The Board also considered Management's policies and practices regarding brokerage, commissions, other trading costs, and allocation of portfolio transactions and reviewed the quality of the execution services that Management had provided. The Board also reviewed Management's use of brokers to execute Fund transactions that provide research services to Management. Moreover, the Board considered Management's approach to potential conflicts of interest both generally and between the Fund's investments and those of other funds or accounts managed by Management. The Board also noted that Management had increased its research capabilities with respect to environmental, social, and corporate governance matters and how those factors may relate to investment performance. The Board noted the additional responsibilities of Management in administering the liquidity risk management program.
The Board recognized the extensive range of services that Management provides to the Fund beyond the investment management services. The Board noted that Management is also responsible for monitoring compliance with the Fund's investment objectives, policies, and restrictions, as well as compliance with applicable law, including implementing rulemaking initiatives of the U.S. Securities and Exchange Commission. The Board considered that Management assumes significant ongoing entrepreneurial and business risks as the investment adviser and sponsor for the Fund, for which it is entitled to reasonable compensation. The Trustees also considered that Management's responsibilities include continual management of investment, operational, enterprise, legal, regulatory, and compliance risks as they relate to the Fund, and the Board considers on a regular basis information regarding Management's processes for monitoring and managing risk. In addition, the Board also noted that when Management launches a new fund or share class, it assumes entrepreneurial risk with respect to that fund or share class, and that some funds and share classes have been liquidated without ever having been profitable to Management.
The Board also reviewed and evaluated Management's activities under its contractual obligation to oversee the Fund's various outside service providers, including its renegotiation of certain service providers' fees and its evaluation of service providers' infrastructure, cybersecurity programs, compliance programs, and business continuity programs, among other matters. The Board also considered Management's ongoing development of its own infrastructure and information technology to support the Fund through, among other things, cybersecurity, business continuity planning, and risk management. The Board noted Management's largely seamless implementation of its business continuity plan in response to the COVID-19 pandemic. In addition, the Board noted the positive compliance history of Management, as no significant compliance problems were reported to the Board with respect to Management. The Board also considered the general structure of the portfolio managers' compensation and whether this structure provides appropriate incentives to act in the best interests of the Fund. The Board also considered the ability of Management to attract and retain qualified personnel to service the Fund.
As in past years, the Board also considered the manner in which Management addressed various matters that arose during the year, some of them a result of developments in the broader fund industry or the regulations governing it. In
37
addition, the Board considered actions taken by Management in response to recent market conditions, such as the economic dislocation and rise in volatility that accompanied shutdowns related to the efforts to stem the spread of COVID-19, and considered the overall performance of Management in this context.
Fund Performance
The Board requested a report from an outside consulting firm that specializes in the analysis of fund industry data that compared the Fund's performance, along with its fees and other expenses, to a group of industry peers ("Expense Group") and a broader universe of funds pursuing generally similar strategies with the same investment classification and/or objective ("Performance Universe"). The Expense Group and Performance Universe were composed of two types of funds: proprietary funds that are operated by insurance companies or their affiliates, and non-proprietary funds, such as the Fund, operated for insurance company investors by independent investment managers. The Board considered the Fund's performance and fees in light of the limitations inherent in the methodology for constructing such comparative groups and determining which investment companies should be included in the comparative groups, noting differences as compared to certain fund industry ranking and rating systems. The Board also considered the impact and inherent limitation on the comparisons due to the small number of funds included in the Fund's Expense Group and Performance Universe.
With respect to investment performance, the Board considered information regarding the Fund's short-, intermediate- and long-term performance, net of the Fund's fees and expenses, on an absolute basis, relative to a benchmark index that does not deduct the fees or expenses of investing, and compared to the performance of the Expense Group and Performance Universe, each constructed by the consulting firm. The Board also reviewed performance in relation to certain measures of the degree of investment risk undertaken by the portfolio managers.
The Performance Universe referenced in this section was identified by the consulting firm, as discussed above. For any period of underperformance, the Board considered the magnitude and duration of that underperformance relative to the Performance Universe, and/or the benchmark (e.g., the amount by which a Fund underperformed, including, for example, whether the Fund slightly underperformed or significantly underperformed its benchmark). With respect to performance quintile rankings for the Fund compared to its Performance Universe, the first quintile represents the highest (best) performance and the fifth quintile represents the lowest performance. For investment performance comparisons, the Board looked at the Fund's Class I as a proxy for both of the Fund's classes.
The Board considered that, based on performance data for the periods ended December 31, 2019: (1) as compared to its benchmark, the Fund's performance was lower for the 1-, 3-, 5-, and 10-year periods; and (2) as compared to its Performance Universe, the Fund's performance was in the fourth quintile for the 1- and 5-year periods and the third quintile for the 3- and 10-year periods.
Noting that the Fund underperformed over certain periods, the Board considered Management's representations regarding the factors impacting the Fund's performance and discussed with Management the Fund's performance, potential reasons for the relative performance, and steps that Management had taken, or intended to take, to improve performance. The Board also considered Management's responsiveness to the Fund's relative performance. In this regard, the Board noted that performance, especially short-term performance, is only one of the factors that it deems relevant to its consideration of the Agreement and that, after considering all relevant factors, it determined to approve the continuation of the Agreement notwithstanding the Fund's relative underperformance.
Fee Rates, Profitability, and Fall-out Benefits
With respect to the overall fairness of the Agreement, the Board considered the fee structure for the Fund under the Agreement as compared to the Expense Group provided by the consulting firm, as discussed above. The Board reviewed a comparison of the Fund's management fee to its Expense Group. The Board noted that the comparative management fee analysis includes, in the Fund's management fee, the separate administrative fees paid to Management. However, the Board noted that some funds in the Expense Group pay directly from fund assets for certain services that Management
38
covers out of the administration fees for the Fund. Accordingly, the Board also considered the Fund's total expense ratio as compared with its Expense Group as a way of taking account of these differences.
The Board compared the Fund's contractual and actual management fees to the median of the contractual and actual management fees, respectively, of the Fund's Expense Group. (The actual management fees are the contractual management fees reduced by any fee waivers or other adjustments.) The Board also compared the Fund's total expenses to the median of the total expenses of the Fund's Expense Group. The Board noted that the Fund's actual management fee and total expenses were higher than the Expense Group median, and considered whether specific portfolio management, administration or oversight needs contributed to the Fund's actual management fee and total expenses. With respect to the quintile rankings for fees and total expenses (net of waivers or other adjustments, if any) for the Fund compared to its Expense Group, the first quintile represents the lowest fees and/or total expenses and the fifth quintile represents the highest fees and/or total expenses. For fee comparisons, the Board looked at the Fund's Class I as a proxy for both of the Fund's classes.
The Board considered that, as compared to its Expense Group, the Fund's contractual management fee, the actual management fee, and total expenses each ranked in the fifth quintile.
In addition to considering the above-referenced factors, the Board took note of its ongoing dialogue with Management regarding the dynamics of the insurance/annuity marketplace. The Board considered, among other matters, related tax restrictions and the unique challenges facing that market generally, which assisted the Board in understanding the context for the Fund's expense ratio and performance.
In concluding that the benefits accruing to Management and its affiliates by virtue of their relationship with the Fund were reasonable in light of the costs of providing the investment advisory and other services and the benefits accruing to the Fund, the Board reviewed specific data as to Management's estimated profit on the Fund for a recent period on a pre-tax basis without regard to distribution expenses, including year-over-year changes in each of Management's reported expense categories. (The Board also reviewed data on Management's estimated profit on the Fund after distribution/servicing expenses and taxes were factored in, as indicators of the health of the business and the extent to which Management is directing its profits into the growth of the business.) The Board considered the cost allocation methodology that Management used in developing its estimated profitability figures. In recent years, the Board engaged an independent forensic accountant to review the profitability methodology utilized by Management when preparing this information and discussed with the consultant its conclusion that Management's process for calculating and reporting its estimated profit was not unreasonable.
Recognizing that there is no uniform methodology regarding the allocation of firm-wide or complex-wide expenses within the asset management industry for determining profitability for this purpose and that the use of different reasonable methodologies can give rise to different profit and loss results, the Board, in recent years, requested from Management examples of profitability calculated by different methods and noted that the estimated profitability levels were still reasonable when calculated by these other methods. The Board further noted Management's representation that its estimate of profitability is derived using methodology that is consistent with the methodology used to assess and/or report measures of profitability elsewhere at the firm. In addition, the Board recognized that Management's calculations regarding its costs may not reflect all risks, including regulatory, legal, operational, reputational, and, where appropriate, entrepreneurial risks, associated with offering and managing a mutual fund in the current regulatory and market environment. The Board also considered any fall-out (i.e., indirect) benefits likely to accrue to Management or its affiliates from their relationship with the Fund, such as research it may receive from broker-dealers executing the Funds' portfolio transactions on an agency basis. The Board recognized that Management and its affiliates should be entitled to earn a reasonable level of profits for services they provide to the Fund and, based on its review, concluded that Management's reported level of estimated profitability on the Fund was reasonable.
Information Regarding Services to Other Clients
The Board also considered other funds and separate accounts that were advised or sub-advised by Management or its affiliates with investment objectives, policies and strategies that were similar to those of the Fund, and compared the fees
39
charged to the Fund to the fees charged to such comparable funds and separate accounts. The Board considered the appropriateness and reasonableness of any differences between the fees charged to a Fund and such comparable funds and/or separate accounts, and determined that differences in fees and fee structures were consistent with the differences in the management and other services provided. The Board explored with Management its assertion that although, generally, the rates of fees paid by such accounts, except other Neuberger Berman mutual funds, were lower than the fee rates paid by the corresponding Fund, the differences reflected Management's greater level of responsibilities and significantly broader scope of services regarding the Fund, the more extensive regulatory obligations and risks associated with managing the Fund, and other financial considerations with respect to creation and sponsorship of the Fund.
Economies of Scale
The Board also evaluated apparent or anticipated economies of scale in relation to the services Management provides to the Fund. The Board considered whether the Fund's fee structure provides for a reduction of payments resulting from the use of breakpoints, the size of any breakpoints in the Fund's advisory fees, and whether any such breakpoints are set at appropriate asset levels. The Board also compared the breakpoint structure to that of the Expense Group. In addition, the Board considered the expense limitation and/or fee waiver arrangements that reduces Fund expenses at all asset levels which can have an effect similar to breakpoints in sharing economies of scale with shareholders and provide protection from an increase in expenses if the Fund's assets decline. The Board also considered that Management has provided, at no added cost to the Fund, certain additional services, including but not limited to, services required by new regulations or regulatory interpretations, services impelled by changes in the securities markets or the business landscape, and/or services requested by the Board. The Board considered that this is a way of sharing economies of scale with the Fund and its shareholders.
Conclusions
In approving the continuation of the Agreement, the Board concluded that, in its business judgment, the terms of the Agreement are fair and reasonable to the Fund and that approval of the continuation of the Agreement is in the best interests of the Fund and its shareholders. In reaching this determination, the Board considered that Management could be expected to continue to provide a high level of service to the Fund; that the Board retained confidence in Management's capabilities to manage the Fund; that the Fund's fee structure appeared to the Board to be reasonable given the nature, extent, and quality of services provided; and that the benefits accruing to Management and its affiliates by virtue of their relationship with the Fund were reasonable in light of the costs of providing the investment advisory and other services and the benefits accruing to the Fund. The Board's conclusions may be based in part on its consideration of materials prepared in connection with the approval or continuance of the Agreement in prior years and on the Board's ongoing regular review of Fund performance and operations throughout the year, in addition to material prepared specifically for the most recent annual review of the Agreement.
Notice to Shareholders
100.00% of the dividends earned during the fiscal year ended December 31, 2020 qualify for the dividends received deduction for corporate shareholders.
The Fund designates $24,329,008 as a capital gain distribution.
40
Neuberger Berman
Advisers Management Trust
U.S. Equity Index PutWrite Strategy Portfolio
S Class Shares
Annual Report
December 31, 2020
As permitted by regulations adopted by the U.S. Securities and Exchange Commission, you may no longer receive paper copies of the Fund's annual and semi-annual shareholder reports by mail from the insurance company that issued your variable annuity and variable life insurance contract or from the financial intermediary that administers your qualified pension or retirement plan, unless you specifically request paper copies of the reports from your insurance company or financial intermediary. Instead, the reports will be made available on the Fund's website www.nb.com/AMTliterature, and may also be available on a website from the insurance company or financial intermediary that offers your contract or administers your retirement plan, and such insurance company or financial intermediary will notify you by mail each time a report is posted and provide you with a website link to access the report.
If you already elected to receive shareholder reports electronically, you will not be affected by this change and you need not take any action. You may elect to receive shareholder reports and other communications from the insurance company or financial intermediary electronically by following the instructions provided by the insurance company or financial intermediary. If offered by your insurance company or financial intermediary, you may elect to receive all future reports in paper and free of charge from the insurance company or financial intermediary. You can contact your insurance company or financial intermediary if you wish to continue receiving paper copies of your shareholder reports. Your election to receive reports in paper will apply to all funds available under your contract or retirement plan.
U.S. Equity Index PutWrite Strategy Portfolio Commentary (Unaudited)
The Neuberger Berman Advisers Management Trust U.S. Equity Index PutWrite Strategy Portfolio Class S generated a total return of 8.26% for the 12-month period ended December 31, 2020 (the reporting period), outperforming its blended benchmark, a blend consisting of 42.5% CBOE S&P 500 One-Week PutWrite Index / 42.5% CBOE S&P 500 PutWrite Index / 7.5% CBOE Russell 2000 One-Week PutWrite Index / 7.5% CBOE Russell 2000 PutWrite Index (collectively, the Index), which posted a –3.97% total return for the same time period.
2020 was simply one of the most physically, socially, politically and financially destructive years in a generation. A year from which the collective us will most likely take a long time to recover. Remarkably, equity markets shrugged off the negative prospects and were buoyed by hope for prolonged monetary and fiscal stimulus well into 2021. Given equity markets supposedly look to the future when setting valuations, one must assume, at some point in time, they will be forced to ponder a future without unlimited stimulus. However, until that day arrives, the equity market pendulum that's said to swing between greed and fear will remain tilted towards greed. Social unrest, political changes in the U.S. and a global pandemic that crippled all aspects of the global economy are not your run-of-the-mill financial challenges and they most definitely don't usually happen all in the same year. Yet, equity investors ultimately dragged markets from the depths of a first quarter drawdown to record levels by year-end. It was a truly astonishing nine month rebound. For all of 2020, the S&P 500® Index posted a notable 18.40% total return. Moreover, the CBOE S&P 500 PutWrite (PUT) gained 2.13% while the CBOE Russell 2000 PutWrite (PUTR) declined –0.63% during the reporting period.
2020 brought record levels of both implied volatility and realized volatility. After the severity of the first quarter market drawdown, implied volatility levels rapidly adjusted higher. Overall, implied volatility levels continued to oscillate around elevated levels and are anticipated to remain above long-term averages well into 2021. On the year, the CBOE S&P 500 Volatility Index (VIX) was up 9.0 points with an average 30-day implied volatility premium of 0.8. In concert, the CBOE Russell 2000 Volatility Index (RVX) was up 14.5 points with an average 30-day implied volatility premium of –0.9.
Over the reporting period, the S&P 500 PutWrite sleeve was the strongest contributor to the Fund's performance as it outperformed the PUT and demonstrated its ability to offset losses posted by the CBOE S&P 500 One-Week PutWrite (WPUT). Over the reporting period, the Russell 2000 PutWrite sleeve managed to outperform the PUTR and avoided the losses posted by the CBOE Russell 2000 One-Week PutWrite (WPTR). Over the reporting period, the Fund's collateral was also a positive contributor to performance and ended the period ahead of T-Bills (as measured by the ICE BofA 3-Month U.S. Treasury Bill Index), while 1-Month U.S. T-Bill rates decreased –140 basis points (bps) and 2-Year U.S. Treasury Notes rates fell by –145 bps.
For the reporting period, there were no detractors to overall Fund relative performance and average option notional exposure remained consistent with our strategic targets of 85% S&P 500® Index and 15% Russell 2000® Index.
As we look forward to 2021 and beyond, we want to emphasize our view that option market (implied volatility) premiums are different than more traditional factor premiums that are believed to be cyclical. In the case of option markets, we believe using the term 'cycle' is inaccurate. Describing volatility markets as cyclical implies similarity or inheritance of properties from one cycle (phase) to the next, i.e. a degree of predictability. To the contrary, we believe option markets evolve from one regime to another based on a constantly evolving risk landscape.
There is no better analogy than the regime change in the U.S. that was formalized on January 20, 2021. To say the U.S. is entering a new political cycle misses the mark. We believe U.S. politics are on the verge of regime change and a political recalibration that is seeking to find a new equilibrium. To simply say we are shifting from a Republican phase of the political cycle to a Democratic phase of the political cycle is, in our view, grossly incomplete.
We believe this subtle market structure difference ensures that implied volatility premiums will persist and avoid the prolonged periods of erosion experienced by traditional risk premiums, e.g. value, size, growth, momentum, etc.
1
Sincerely,
DEREK DEVENS AND RORY EWING
PORTFOLIO MANAGERS
Information about principal risks of investing in the Fund is set forth in the prospectus and statement of additional information.
The portfolio composition, industries and holdings of the Fund are subject to change without notice.
The opinions expressed are those of the Fund's portfolio managers. The opinions are as of the date of this report and are subject to change without notice.
2
U.S. Equity Index PutWrite Strategy Portfolio (Unaudited)
PORTFOLIO BY TYPE OF INVESTMENT
(as a % of Total Net Assets) | |
Rights | | | 0.0 | % | |
U.S. Government Agency Securities | | | 69.1 | | |
U.S. Treasury Obligations | | | 16.9 | | |
Put Options Written | | | (1.3 | ) | |
Short-Term Investments | | | 14.6 | | |
Other Assets Less Liabilities | | | 0.7 | | |
Total | | | 100.0 | % | |
PERFORMANCE HIGHLIGHTS1
| | | | Average Annual Total Return
Ended 12/31/2020 | |
| | Inception
Date | | 1 Year | | 5 Years | | Life of
Fund | |
At NAV | |
Class S* | | 05/01/2014 | | | 8.26 | % | | | 4.28 | % | | | 2.39 | % | |
Index | | | | | | | |
| |
42.5% CBOE S&P 500 One-Week
PutWrite Index/42.5% CBOE S&P 500
PutWrite Index/7.5% CBOE Russell 2000
One-Week PutWrite Index/7.5% CBOE
Russell 2000 PutWrite Index2,3 | | | | | –3.97 | % | | | 2.96 | % | | | 2.95 | % | |
85% S&P 500 Index/15% Russell 2000
Index2,3 | | | | | 18.81 | % | | | 14.99 | % | | | 12.79 | % | |
* Prior to May 1, 2017, the Fund had different investment goals, fees and expenses, principal investment strategies and portfolio managers. Please also see Endnote 1.
The performance data quoted represent past performance and do not indicate future results. Current performance may be lower or higher than the performance data quoted. For current performance data, including current to the most recent month-end, please visit http://www.nb.com/amtportfolios/performance.
The results shown in the table reflect the reinvestment of income dividends and other distributions, if any. The results do not reflect the effect of taxes a shareholder would pay on Fund distributions or on the redemption of Fund shares. The results do not reflect fees and expenses of the variable annuity and variable life insurance policies or the qualified pension and retirement plans whose proceeds are invested in the Fund.
The investment return and principal value of an investment will fluctuate and shares, when redeemed, may be worth more or less than their original cost.
Returns would have been lower if Management had not reimbursed certain expenses and/or waived a portion of the investment management fees during certain of the periods shown. Repayment by a class (of expenses previously reimbursed and/or fees previously waived by Management) will decrease the class's returns. Please see Note B in the Notes to Financial Statements for specific information regarding expense reimbursement and/or fee waiver arrangements.
As stated in the Fund's most recent prospectus, the total annual operating expense ratio for fiscal year 2019 was 1.73% for Class S shares (before expense reimbursements and/or fee waivers, if any). The expense ratio was 1.06% for Class S shares after expense reimbursements and/or fee waivers. The expense ratios for the annual period ended December 31, 2020 can be found in the Financial Highlights section of this report.
3
U.S. Equity Index PutWrite Strategy Portfolio (Unaudited)
COMPARISON OF A $10,000 INVESTMENT
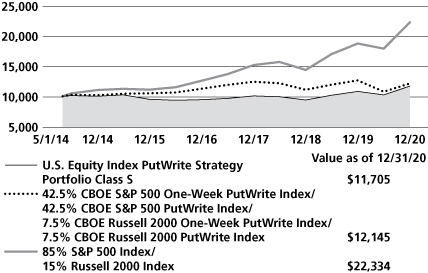
This graph shows the change in value of a hypothetical $10,000 investment in the Fund over the past 10 fiscal years, or since the Fund's inception if it has not operated for 10 years. The result is compared with benchmarks, which include a broad-based market index and may include a more narrowly based index. Market indices described in this report do not take into account any fees, expenses or tax consequences of investing in the individual securities that they track. The results shown in the graph reflect the reinvestment of income dividends and other distributions, if any. The results do not reflect the effect of taxes a shareholder would pay on Fund distributions or on the redemption of Fund shares. The results do not reflect fees and expenses of the variable annuity and variable life insurance policies or the qualified pension and retirement plans whose proceeds are invested in the Fund. Results represent past performance and do not indicate future results.
Please see Endnotes for additional information.
4
1 The Fund was relatively small prior to December 31, 2014, which could have impacted Fund performance. The same techniques used to produce returns in a small fund may not work to produce similar returns in a larger fund. Effective May 1, 2017, Absolute Return Multi-Manager Portfolio changed its name to the U.S. Equity Index PutWrite Strategy Portfolio and changed its investment goal, fees and expenses, principal investment strategies, risks and portfolio manager(s). Prior to that date, the Fund had a higher management fee, different expenses, a different goal and principal investment strategies, which included a multi-manager strategy, and different risks. Its performance prior to that date might have been different if the current fees and expenses, goal, and principal investment strategies had been in effect.
2 The date used to calculate Life of Fund performance for the index is May 1, 2014, the Fund's commencement of operations.
3 The 42.5% CBOE S&P 500 One-Week PutWrite Index/42.5% CBOE S&P 500 PutWrite Index/7.5% CBOE Russell 2000 One-Week PutWrite Index/7.5% CBOE Russell 2000 PutWrite Index is a blended index composed of 42.5% CBOE S&P 500 One-Week PutWrite Index/42.5% CBOE S&P 500 PutWrite Index/7.5% CBOE Russell 2000 One-Week PutWrite Index/7.5% CBOE Russell 2000 PutWrite Index, and is rebalanced monthly. The CBOE S&P 500® One-Week PutWrite Index is designed to track the performance of a hypothetical strategy that sells an at-the-money (ATM) S&P 500 Index (SPX) put option on a weekly basis. The maturity of the written SPX put option is one week to expiry. The written SPX put option is collateralized by a money market account invested in one month Treasury bills. The index rolls on a weekly basis, typically every Friday. The CBOE S&P 500 PutWrite Index (PUT) is designed to represent a proposed hypothetical short put strategy. PUT is an award-winning benchmark index that measures the performance of a hypothetical portfolio that sells SPX put options against collateralized cash reserves held in a money market account. The PUT strategy is designed to sell a sequence of one-month, ATM SPX puts and invest cash at one- and three-month Treasury Bill rates. The CBOE Russell 2000® One-Week PutWrite Index is designed to track the performance of a hypothetical strategy that sells an ATM Russell 2000 Index put option on a weekly basis. The maturity of the written Russell 2000 put option is one week to expiry. The written Russell 2000 put option is collateralized by a money market account invested in one-month Treasury bills. The index rolls on a weekly basis, typically every Friday. The CBOE Russell 2000 PutWrite Index is designed to represent a proposed hypothetical short put strategy that sells a monthly ATM Russell 2000 Index put option. The written Russell 2000 put option is collateralized by a money market account invested in one-month Treasury bills. The 85% S&P 500® Index / 15% Russell 2000® Index is a blended index composed of 85% S&P 500 Index and 15% Russell 2000 Index, and is rebalanced monthly. The S&P 500 Index is a float-adjusted market capitalization weighted index that focuses on the large-cap segment of the U.S. equity market, and includes a significant portfolio of the total value of the market. The Russell 2000 Index is a float-adjusted market capitalization-weighted index that measures the performance of the small-cap segment of the U.S. equity market. It includes approximately 2,000 of the smallest securities in the Russell 3000® Index (which measures the performance of the 3,000 largest U.S. public companies based on total market capitalization). The index is rebalanced annually in June. Please note that individuals cannot invest directly in any index. The indices described in this report do not take into account any fees, expenses or tax consequences of investing in the individual securities that they track. Data about the performance of an index are prepared or obtained by Neuberger Berman Investment Advisers LLC ("Management") and reflect the reinvestment of income dividends and other distributions, if any. The Fund may invest in securities not included in a described index and generally does not invest in all securities included in a described index.
The investments for the Fund are managed by the same portfolio manager(s) who manage one or more other registered funds that have names, investment objectives and investment styles that are similar to those of the Fund. You should be aware that the Fund is likely to differ from those other mutual fund(s) in size, cash flow pattern and tax matters. Accordingly, the holdings and performance of the Fund can be expected to vary from those of the other mutual fund(s).
5
Shares of the separate Neuberger Berman Advisers Management Trust Portfolios, including the Fund, are not available to the general public. Shares of the Fund may be purchased only by life insurance companies to be held in their separate accounts, which fund variable annuity and variable life insurance policies, and by qualified pension and retirement plans. Statistics and projections in this report are derived from sources deemed to be reliable but cannot be regarded as a representation of future results of the Fund. This report is prepared for the general information of shareholders and is not an offer of shares of the Fund. Shares are sold only through the currently effective prospectus, which must precede or accompany this report.
The "Neuberger Berman" name and logo and "Neuberger Berman Investment Advisers LLC" name are registered service marks of Neuberger Berman Group LLC. The individual Fund name in this piece is either a service mark or registered service mark of Neuberger Berman Investment Advisers LLC, an affiliate of Neuberger Berman BD LLC, distributor, member FINRA.
© 2021 Neuberger Berman BD LLC, distributor. All rights reserved.
6
Information About Your Fund's Expenses (Unaudited)
As a Fund shareholder, you incur two types of costs: (1) transaction costs such as fees and expenses that are, or may be, imposed under your variable contract or qualified pension plan; and (2) ongoing costs, including management fees, distribution and/or service (12b-1) fees (if applicable), and other Fund expenses. This example is intended to help you understand your ongoing costs (in U.S. dollars) of investing in the Fund and compare these costs with the ongoing costs of investing in other mutual funds.
This table is designed to provide information regarding costs related to your investments. The following examples are based on an investment of $1,000 made at the beginning of the six month period ended December 31, 2020 and held for the entire period. The table illustrates the Fund's costs in two ways:
Actual Expenses and Performance: | | The first section of the table provides information about actual account values and actual expenses in dollars, based on the Fund's actual performance during the period indicated. You may use the information in this line, together with the amount you invested, to estimate the expenses you paid over the period. Simply divide your account value by $1,000 (for example, an $8,600 account value divided by $1,000 = 8.6), then multiply the result by the number in the first section of the table under the heading entitled "Expenses Paid During the Period" to estimate the expenses you paid over the period. | |
Hypothetical Example for
Comparison Purposes: | | The second section of the table provides information about hypothetical account values and hypothetical expenses based on the Fund's actual expense ratio and an assumed rate of return at 5% per year before expenses. This return is not the Fund's actual return. The hypothetical account values and expenses may not be used to estimate the actual ending account balance or expenses you paid for the period. You may use this information to compare the ongoing costs of investing in this Fund versus other funds. To do so, Compare the expenses shown in this 5% hypothetical example with the 5% hypothetical examples that appear in the shareholder reports of other funds. | |
Please note that the expenses in the table are meant to highlight your ongoing costs only and do not include any transaction costs, such as fees and expenses that are, or may be imposed under your variable contract or qualified pension plan. Therefore, the information under the heading "Hypothetical (5% annual return before expenses)" is useful in comparing ongoing costs only, and will not help you determine the relative total costs of owning different funds. In addition, if these transaction costs were included, your costs would have been higher.
Expense Example (Unaudited)
NEUBERGER BERMAN ADVISERS MANAGEMENT TRUST U.S. EQUITY INDEX PUTWRITE STRATEGY PORTFOLIO
Actual | | Beginning Account
Value
7/1/2020 | | Ending Account
Value
12/31/2020 | | Expenses Paid During
the Period
7/1/2020 – 12/31/2020 | |
Class S | | $ | 1,000.00 | | | $ | 1,143.70 | | | $ | 5.66 | (a) | |
Hypothetical (5% annual return before expenses) | |
Class S | | $ | 1,000.00 | | | $ | 1,019.86 | | | $ | 5.33 | (b) | |
(a) Expenses are equal to the annualized expense ratio of 1.05%, multiplied by the average account value over the period, multiplied by 184/366 (to reflect the one-half year period shown).
(b) Hypothetical expenses are equal to the annualized expense ratio of 1.05%, multiplied by the average account value over the period (assuming a 5% annual return), multiplied by 184/366 (to reflect the one-half year period shown).
7
Schedule of Investments U.S. Equity Index PutWrite Strategy Portfolio^ December 31, 2020
PRINCIPAL AMOUNT | | | | VALUE | |
U.S. Government Agency Securities 69.1% | | | |
| | | | | Federal Agricultural
Mortgage Corp., | | | | | |
$ | 2,800,000 | | | 1.59%, 1/10/2024 | | $ | 2,913,101 | | |
| | 1,200,000 | | | 2.62%, 2/26/2024(a) | | | 1,288,512 | | |
| | | | | FFCB, | | | | | |
| | 500,000 | | | 2.23%, 4/5/2021 | | | 502,770 | | |
| | 1,000,000 | | | 1.90%, 6/24/2021 | | | 1,008,640 | | |
| | 1,000,000 | | | 1.60%, 1/21/2022 | | | 1,015,299 | | |
| | | | | FHLB, | | | | | |
| | 4,500,000 | | | 2.38%, 9/10/2021(a) | | | 4,568,423 | | |
| | | | | FHLMC, | | | | | |
| | 5,000,000 | | | 2.38%, 2/16/2021 | | | 5,013,390 | | |
| | 2,000,000 | | | 1.13%, 8/12/2021 | | | 2,012,278 | | |
| | | | | FNMA, | | | | | |
| | 6,500,000 | | | 2.75%, 6/22/2021(a) | | | 6,580,595 | | |
| | | | | Total U.S. Government Agency Securities
(Cost $24,721,553) | |
| 24,903,008
|
| |
U.S. Treasury Obligations 16.9% | | | |
| | | | | U.S. Treasury Notes, | | | | | |
| | 2,500,000 | | | 2.38%, 3/15/2021 | | | 2,510,846 | | |
| | 2,000,000 | | | 2.75%, 9/15/2021 | | | 2,036,875 | | |
| | 1,500,000 | | | 2.38%, 3/15/2022 | | | 1,540,371 | | |
| | | | | Total U.S. Treasury Obligations
(Cost $6,080,727) | |
| 6,088,092
|
| |
NO. OF RIGHTS | |
| Rights 0.0%(b) | | | |
| Biotechnology 0.0%(b) | | | |
| | 225 | | | Tobira Therapeutics, | | | 13 | | |
| | | | | Inc., CVR*(c)(d) | | | | | |
NO. OF RIGHTS | | | | VALUE | |
Media 0.0% | | | |
| | 2,550 | | | Media General, Inc., CVR*(c)(d) | | $ | — | | |
| | | | | Total Rights
(Cost $7,171) | |
| 13
|
| |
SHARES | | | | | |
Short-Term Investments 14.6% | | | |
Investment Companies 14.6% | | | |
| 5,252,831 |
| | Invesco Government &
Agency Portfolio,
Institutional Class, 0.03%(e) | |
| 5,252,831 |
| |
| 468 |
| | Morgan Stanley Institutional
Liquidity Funds Treasury
Portfolio Institutional
Class, 0.01%(e)(f) | |
| 468 |
| |
| | | | | Total Investment Companies
(Cost $5,253,299) | |
| 5,253,299
|
| |
| | | | | Total Investments 100.6%
(Cost $36,062,750) | |
| 36,244,412
|
| |
| | | | | Liabilities Less Other Assets (0.6%)(g) | | | (199,268 | ) | |
| | | | | Net Assets 100.0% | | $ | 36,045,144 | | |
* Non-income producing security.
(a) All or a portion of this security is pledged with the custodian for options written.
(b) Represents less than 0.05% of net assets of the Fund.
(c) Security fair valued as of December 31, 2020, in accordance with procedures approved by the Board of Trustees. Total value of all such securities at December 31, 2020, amounted to $13, which represents 0.0% of net assets of the Fund.
(d) Value determined using significant unobservable inputs.
(e) Represents 7-day effective yield as of December 31, 2020.
(f) All or a portion of this security is segregated in connection with obligations for options written with a total value of $468.
(g) Includes the impact of the Fund's open positions in derivatives at December 31, 2020.
See Notes to Financial Statements
8
Schedule of Investments U.S. Equity Index PutWrite Strategy Portfolio^ (cont'd)
Abbreviations
CVR Contingent Value Rights
FFCB Federal Farm Credit Bank
FHLB Federal Home Loan Bank
FHLMC Federal Home Loan Mortgage Corp.
FNMA Federal National Mortgage Association
Derivative Instruments
Written option contracts ("options written")
At December 31, 2020, the Fund had outstanding options written as follows:
Description | | Number of
Contracts | | Notional
Amount | | Exercise
Price | | Expiration
Date | | Value | |
Puts | |
Index | |
Russell 2000 Index | | | 3 | | | $ | (592,457 | ) | | $ | 1,900 | | | 1/8/2021 | | $ | (3,000 | ) | |
Russell 2000 Index | | | 1 | | | | (197,486 | ) | | | 1,910 | | | 1/8/2021 | | | (1,170 | ) | |
Russell 2000 Index | | | 2 | | | | (394,971 | ) | | | 1,920 | | | 1/8/2021 | | | (2,750 | ) | |
Russell 2000 Index | | | 1 | | | | (197,486 | ) | | | 1,930 | | | 1/8/2021 | | | (1,605 | ) | |
Russell 2000 Index | | | 1 | | | | (197,486 | ) | | | 1,930 | | | 1/15/2021 | | | (2,705 | ) | |
Russell 2000 Index | | | 1 | | | | (197,486 | ) | | | 1,940 | | | 1/15/2021 | | | (3,010 | ) | |
Russell 2000 Index | | | 1 | | | | (197,486 | ) | | | 1,950 | | | 1/15/2021 | | | (3,325 | ) | |
Russell 2000 Index | | | 2 | | | | (394,971 | ) | | | 1,970 | | | 1/15/2021 | | | (8,160 | ) | |
Russell 2000 Index | | | 2 | | | | (394,971 | ) | | | 1,990 | | | 1/15/2021 | | | (9,950 | ) | |
Russell 2000 Index | | | 1 | | | | (197,486 | ) | | | 1,980 | | | 1/22/2021 | | | (5,455 | ) | |
Russell 2000 Index | | | 1 | | | | (197,486 | ) | | | 1,990 | | | 1/22/2021 | | | (5,915 | ) | |
Russell 2000 Index | | | 5 | | | | (987,428 | ) | | | 2,005 | | | 1/22/2021 | | | (33,350 | ) | |
Russell 2000 Index | | | 6 | | | | (1,184,913 | ) | | | 1,975 | | | 1/29/2021 | | | (36,420 | ) | |
S&P 500 Index | | | 2 | | | | (751,214 | ) | | | 3,665 | | | 1/8/2021 | | | (2,960 | ) | |
S&P 500 Index | | | 9 | | | | (3,380,463 | ) | | | 3,685 | | | 1/8/2021 | | | (16,065 | ) | |
S&P 500 Index | | | 1 | | | | (375,607 | ) | | | 3,690 | | | 1/8/2021 | | | (1,875 | ) | |
S&P 500 Index | | | 8 | | | | (3,004,856 | ) | | | 3,695 | | | 1/8/2021 | | | (15,720 | ) | |
S&P 500 Index | | | 2 | | | | (751,214 | ) | | | 3,645 | | | 1/15/2021 | | | (4,640 | ) | |
S&P 500 Index | | | 1 | | | | (375,607 | ) | | | 3,675 | | | 1/15/2021 | | | (2,815 | ) | |
S&P 500 Index | | | 2 | | | | (751,214 | ) | | | 3,695 | | | 1/15/2021 | | | (6,450 | ) | |
S&P 500 Index | | | 8 | | | | (3,004,856 | ) | | | 3,705 | | | 1/15/2021 | | | (27,560 | ) | |
S&P 500 Index | | | 8 | | | | (3,004,856 | ) | | | 3,715 | | | 1/15/2021 | | | (29,600 | ) | |
S&P 500 Index | | | 1 | | | | (375,607 | ) | | | 3,685 | | | 1/22/2021 | | | (4,170 | ) | |
S&P 500 Index | | | 11 | | | | (4,131,677 | ) | | | 3,695 | | | 1/22/2021 | | | (48,455 | ) | |
S&P 500 Index | | | 9 | | | | (3,380,463 | ) | | | 3,705 | | | 1/22/2021 | | | (41,940 | ) | |
S&P 500 Index | | | 7 | | | | (2,629,249 | ) | | | 3,725 | | | 1/29/2021 | | | (44,870 | ) | |
S&P 500 Index | | | 1 | | | | (375,607 | ) | | | 3,730 | | | 1/29/2021 | | | (6,565 | ) | |
S&P 500 Index | | | 13 | | | | (4,882,891 | ) | | | 3,735 | | | 1/29/2021 | | | (87,295 | ) | |
Total options written (premium received $770,831) | | | | | | | | | | $ | (457,795 | ) | |
See Notes to Financial Statements
9
Schedule of Investments U.S. Equity Index PutWrite Strategy Portfolio^ (cont'd)
For the year ended December 31, 2020, the average market value for the months where the Fund had options written outstanding was $(743,617). At December 31, 2020, the Fund had securities pledged in the amount of $12,437,530 to cover collateral requirements for options written.
The following is a summary, categorized by Level (see Note A of Notes to Financial Statements), of inputs used to value the Fund's investments as of December 31, 2020:
Asset Valuation Inputs | | Level 1 | | Level 2 | | Level 3* | | Total | |
Investments: | |
U.S. Government Agency Securities | | $ | — | | | $ | 24,903,008 | | | $ | — | | | $ | 24,903,008 | | |
U.S. Treasury Obligations | | | — | | | | 6,088,092 | | | | — | | | | 6,088,092 | | |
| Rights(a) | | | — | | | | — | | | | 13 | | | | 13 | | |
Short-Term Investments | | | — | | | | 5,253,299 | | | | — | | | | 5,253,299 | | |
Total Long Positions | | $ | — | | | $ | 36,244,399 | | | $ | 13 | | | $ | 36,244,412 | | |
(a) The Schedule of Investments provides information on the industry or sector categorization for the portfolio.
* The following is a reconciliation between the beginning and ending balances of investments in which unobservable inputs (Level 3) were used in determining value:
| | | Rights(a) | |
Assets: | |
Investments in Securities: | |
Beginning Balance as of January 1, 2020 | | $ | 13 | | |
Transfers into Level 3 | | | — | | |
Transfers out of Level 3 | | | — | | |
Accrued discounts/(premiums) | | | — | | |
Realized gain/(loss) | | | — | | |
Change in unrealized appreciation/(depreciation) | | | — | | |
Purchases | | | — | | |
Sales | | | — | | |
Balance as of December 31, 2020 | | $ | 13 | | |
Net change in unrealized appreciation/(depreciation) on investments still held as of December 31, 2020 | | $ | — | | |
(a) As of the year ended December 31, 2020, these investments were fair valued in accordance with procedures approved by the Board of Trustees. These investments did not have a material impact on the Fund's net assets; therefore, disclosure of unobservable inputs used in formulating valuations is not presented.
The following is a summary, categorized by level (see Note A of Notes to Financial Statements), of inputs used to value the Fund's derivatives as of December 31, 2020:
Other Financial Instruments
| | | Level 1 | | Level 2 | | Level 3 | | Total | |
Options Written | |
Liabilities | | $ | (457,795 | ) | | $ | — | | | $ | — | | | $ | (457,795 | ) | |
^ A balance indicated with a "—", reflects either a zero balance or an amount that rounds to less than 1.
See Notes to Financial Statements
10
Statement of Assets and Liabilities
Neuberger Berman Advisers Management Trust
| | | U.S. EQUITY INDEX
PUTWRITE
STRATEGY
PORTFOLIO | |
| | | December 31, 2020 | |
Assets | |
Investments in securities, at value* (Note A)—see Schedule of Investments: | |
| Unaffiliated issuers(a) | | $ | 36,244,412 | | |
Cash | | | 110,175 | | |
Dividends and interest receivable | | | 179,858 | | |
Receivable for securities sold | | | 88,329 | | |
Receivable for Fund shares sold | | | 9,659 | | |
Prepaid expenses and other assets | | | 777 | | |
Total Assets | | | 36,633,210 | | |
Liabilities | |
| Options contracts written, at value(b) (Note A) | | | 457,795 | | |
Payable to administrator—net (Note B) | | | 10,856 | | |
Payable to investment manager (Note B) | | | 13,574 | | |
Payable for securities purchased | | | 15,646 | | |
Payable for Fund shares redeemed | | | 7,092 | | |
Payable to trustees | | | 12,718 | | |
Other accrued expenses and payables | | | 70,385 | | |
Total Liabilities | | | 588,066 | | |
Net Assets | | $ | 36,045,144 | | |
Net Assets consist of: | |
Paid-in capital | | $ | 33,338,540 | | |
Total distributable earnings/(losses) | | | 2,706,604 | | |
Net Assets | | $ | 36,045,144 | | |
Shares Outstanding ($.001 par value; unlimited shares authorized) | | | 3,495,463 | | |
Net Asset Value, offering and redemption price per share | | | |
Class S | | $ | 10.31 | | |
*Cost of Investments: | | | |
(a) Unaffiliated issuers | | $ | 36,062,750 | | |
(b) Premium received from option contracts written | | $ | 770,831 | | |
See Notes to Financial Statements
11
Neuberger Berman Advisers Management Trust
| | | U.S. EQUITY INDEX
PUTWRITE
STRATEGY
PORTFOLIO | |
| | | For the
Fiscal Year Ended
December 31, 2020 | |
Investment Income: | |
Income (Note A): | |
Interest income—unaffiliated issuers | | $ | 460,558 | | |
Total income | | $ | 460,558 | | |
Expenses: | |
Investment management fees (Note B) | | | 147,235 | | |
Administration fees (Note B) | | | 98,156 | | |
Distribution fees (Note B) | | | 81,797 | | |
Shareholder servicing agent fees | | | 75 | | |
Audit fees | | | 41,984 | | |
Custodian and accounting fees | | | 85,820 | | |
Insurance | | | 841 | | |
Legal fees | | | 7,939 | | |
Shareholder reports | | | 9,991 | | |
Trustees' fees and expenses | | | 44,734 | | |
Miscellaneous | | | 8,212 | | |
Total expenses | | | 526,784 | | |
Expenses reimbursed by Management (Note B) | | | (183,237 | ) | |
Total net expenses | | | 343,547 | | |
Net investment income/(loss) | | $ | 117,011 | | |
Realized and Unrealized Gain/(Loss) on Investments (Note A): | |
Net realized gain/(loss) on: | |
Transactions in investment securities of unaffiliated issuers | | | 66,648 | | |
Expiration or closing of option contracts written | | | 2,173,407 | | |
Change in net unrealized appreciation/(depreciation) in value of: | |
Investment securities of unaffiliated issuers | | | 120,824 | | |
Foreign currency translations | | | 104 | | |
Option contracts written | | | 172,678 | | |
Net gain/(loss) on investments | | | 2,533,661 | | |
Net increase/(decrease) in net assets resulting from operations | | $ | 2,650,672 | | |
See Notes to Financial Statements
12
Statements of Changes in Net Assets
Neuberger Berman Advisers Management Trust
| | | U.S. EQUITY INDEX
PUTWRITE STRATEGY PORTFOLIO | |
| | | Fiscal
Year Ended
December 31,
2020 | | Fiscal
Year Ended
December 31,
2019 | |
Increase/(Decrease) in Net Assets: | |
From Operations (Note A): | |
Net investment income/(loss) | | $ | 117,011 | | | $ | 277,047 | | |
Net realized gain/(loss) on investments | | | 2,240,055 | | | | 3,152,174 | | |
Change in net unrealized appreciation/(depreciation) of investments | | | 293,606 | | | | 175,762 | | |
Net increase/(decrease) in net assets resulting from operations | | | 2,650,672 | | | | 3,604,983 | | |
Distributions to Shareholders From (Note A): | |
Distributable earnings | | | (2,556,319 | ) | | | (50,670 | ) | |
Total distributions to shareholders | | | (2,556,319 | ) | | | (50,670 | ) | |
From Fund Share Transactions (Note D): | |
Proceeds from shares sold | | | 2,504,642 | | | | 22,945,885 | | |
Proceeds from reinvestment of dividends and distributions | | | 2,556,318 | | | | 50,670 | | |
Payments for shares redeemed | | | (3,728,254 | ) | | | (3,976,405 | ) | |
Net increase/(decrease) from Fund share transactions | | | 1,332,706 | | | | 19,020,150 | | |
Net Increase/(Decrease) in Net Assets | | | 1,427,059 | | | | 22,574,463 | | |
Net Assets: | |
Beginning of year | | | 34,618,085 | | | | 12,043,622 | | |
End of year | | $ | 36,045,144 | | | $ | 34,618,085 | | |
See Notes to Financial Statements
13
Notes to Financial Statements U.S. Equity Index PutWrite Strategy Portfolio
Note A—Summary of Significant Accounting Policies:
1 General: Neuberger Berman Advisers Management Trust (the "Trust") is a Delaware statutory trust organized pursuant to an Amended and Restated Trust Instrument dated March 27, 2014. The Trust is registered as an open-end management investment company under the Investment Company Act of 1940, as amended (the "1940 Act"), and its shares are registered under the Securities Act of 1933, as amended. Neuberger Berman Advisers Management Trust U.S. Equity Index PutWrite Strategy Portfolio (the "Fund") is a separate operating series of the Trust and is diversified. The Fund currently offers only Class S shares. The Trust's Board of Trustees (the "Board") may establish additional series or classes of shares without the approval of shareholders.
A balance indicated with a "—", reflects either a zero balance or a balance that rounds to less than 1.
The assets of the Fund belong only to the Fund, and the liabilities of the Fund are borne solely by the Fund and no other series of the Trust.
The Fund is an investment company and accordingly follows the investment company accounting and reporting guidance of the Financial Accounting Standards Board ("FASB") Accounting Standards Codification ("ASC") Topic 946 "Financial Services—Investment Companies."
The preparation of financial statements in accordance with U.S. generally accepted accounting principles ("GAAP") requires Neuberger Berman Investment Advisers LLC ("Management" or "NBIA") to make estimates and assumptions at the date of the financial statements. Actual results could differ from those estimates.
Shares of the Fund are not available to the general public and may be purchased only by life insurance companies to serve as an investment vehicle for premiums paid under their variable annuity and variable life insurance contracts and to certain qualified pension and other retirement plans.
2 Portfolio valuation: In accordance with ASC 820 "Fair Value Measurement" ("ASC 820"), all investments held by the Fund are carried at the value that Management believes the Fund would receive upon selling an investment in an orderly transaction to an independent buyer in the principal or most advantageous market for the investment under current market conditions. Various inputs, including the volume and level of activity for the asset or liability in the market, are considered in valuing the Fund's investments, some of which are discussed below. Significant Management judgment may be necessary to value investments in accordance with ASC 820.
ASC 820 established a three-tier hierarchy of inputs to create a classification of value measurements for disclosure purposes. The three-tier hierarchy of inputs is summarized in the three broad Levels listed below.
• Level 1—unadjusted quoted prices in active markets for identical investments
• Level 2—other observable inputs (including quoted prices for similar investments, interest rates, prepayment speeds, credit risk, amortized cost, etc.)
• Level 3—unobservable inputs (including the Fund's own assumptions in determining the fair value of investments)
The inputs or methodology used for valuing an investment are not necessarily an indication of the risk associated with investing in those securities.
The value of the Fund's investments in exchange traded options written and rights for which market quotations are readily available, is generally determined by Management by obtaining valuations from independent pricing services based on the latest sale price quoted on a principal exchange or market for that security (Level 1 inputs). Securities traded primarily on the NASDAQ Stock Market are normally valued at the NASDAQ Official Closing
14
Price ("NOCP") provided by NASDAQ each business day. The NOCP is the most recently reported price as of 4:00:02 p.m., Eastern Time, unless that price is outside the range of the "inside" bid and asked prices (i.e., the bid and asked prices that dealers quote to each other when trading for their own accounts); in that case, NASDAQ will adjust the price to equal the inside bid or asked price, whichever is closer. Because of delays in reporting trades, the NOCP may not be based on the price of the last trade to occur before the market closes. If there is no sale of a security on a particular day, the independent pricing services may value the security based on market quotations.
The value of the Fund's investments in debt securities is determined by Management primarily by obtaining valuations from independent pricing services based on readily available bid quotations, or if quotations are not available, by methods which include various considerations based on security type (generally Level 2 inputs). In addition to the consideration of yields or prices of securities of comparable quality, coupon, maturity and type, indications as to values from dealers, and general market conditions, the following is a description of other Level 2 inputs and related valuation techniques used by independent pricing services to value certain types of debt securities held by the Fund:
U.S. Treasury Obligations. Inputs used to value U.S. Treasury securities generally include quotes from several inter-dealer brokers and other market information which may include benchmark yield curves, reported trades, broker-dealer quotes, issuer spreads, comparable securities and reference data, such as market research publications, when available ("Other Market Information").
U.S. Government Agency Securities. Inputs used to value U.S. Government Agency securities generally include obtaining benchmark quotes and Other Market Information.
Management has developed a process to periodically review information provided by independent pricing services for all types of securities.
Investments in non-exchange traded investment companies are valued using the respective fund's daily calculated net asset value ("NAV") per share (Level 2 inputs).
If a valuation is not available from an independent pricing service, or if Management has reason to believe that the valuation received does not represent the amount a Fund might reasonably expect to receive on a current sale in an orderly transaction, Management seeks to obtain quotations from brokers or dealers (generally considered Level 2 or Level 3 inputs depending on the number of quotes available). If such quotations are not readily available, the security is valued using methods the Neuberger Berman Advisers Management Trust's Board of Trustees (the "Board") has approved in the good-faith belief that the resulting valuation will reflect the fair value of the security. Inputs and assumptions considered in determining the fair value of a security based on Level 2 or Level 3 inputs may include, but are not limited to, the type of the security; the initial cost of the security; the existence of any contractual restrictions on the security's disposition; the price and extent of public trading in similar securities of the issuer or of comparable companies; quotations or evaluated prices from broker-dealers and/or pricing services; information obtained from the issuer, and/or analysts; an analysis of the company's or issuer's financial statements; an evaluation of the inputs that influence the issuer and the market(s) in which the security is purchased and sold.
Fair value prices are necessarily estimates, and there is no assurance that such a price will be at or close to the price at which the security is next quoted or next trades.
3 Foreign currency translations: The accounting records of the Fund are maintained in U.S. dollars. Foreign currency amounts are normally translated into U.S. dollars using the exchange rate as of 4:00 p.m. Eastern Time, on days the New York Stock Exchange is open for business, to determine the value of investments, other assets and liabilities. Purchase and sale prices of securities, and income and expenses, are translated into U.S. dollars at the prevailing rate of exchange on the respective dates of such transactions. Net unrealized foreign currency gain/(loss), if any, arises from changes in the value of assets and liabilities, other than investments in securities, as a result of changes in exchange rates and is stated separately in the Statement of Operations.
15
4 Securities transactions and investment income: Securities transactions are recorded on trade date for financial reporting purposes. Dividend income is recorded on the ex-dividend date or, for certain foreign dividends, as soon as the Fund becomes aware of the dividends. Non-cash dividends included in dividend income, if any, are recorded at the fair market value of the securities received. Interest income, including accretion of discount (adjusted for original issue discount, where applicable) and amortization of premium, where applicable, is recorded on the accrual basis. Realized gains and losses from securities transactions and foreign currency transactions, if any, are recorded on the basis of identified cost and stated separately in the Statement of Operations.
5 Income tax information: The Fund is treated as a separate entity for U.S. federal income tax purposes. It is the policy of the Fund to continue to qualify for treatment as a regulated investment company ("RIC") by complying with the requirements of the U.S. Internal Revenue Code applicable to RICs and to distribute substantially all of its net investment income and net realized capital gains to its shareholders. To the extent the Fund distributes substantially all of its net investment income and net realized capital gains to shareholders, no federal income or excise tax provision is required.
The Fund has adopted the provisions of ASC 740 "Income Taxes" ("ASC 740"). ASC 740 sets forth a minimum threshold for financial statement recognition of a tax position taken, or expected to be taken, in a tax return. The Fund recognizes interest and penalties, if any, related to unrecognized tax positions as an income tax expense in the Statement of Operations. The Fund is subject to examination by U.S. federal and state tax authorities for returns filed for the tax years for which the applicable statutes of limitations have not yet expired. As of December 31, 2020, the Fund did not have any unrecognized tax positions.
For federal income tax purposes, the estimated cost in value of investments held at December 31, 2020, was $36,062,750. The estimated gross unrealized appreciation was $193,630 and estimated gross unrealized depreciation was $11,968 resulting in net unrealized appreciation of $181,662 based on cost for U.S. federal income tax purposes.
Income distributions and capital gain distributions are determined in accordance with income tax regulations, which may differ from GAAP. These differences are primarily due to differing treatments of income and gains on various investment securities held by the Fund, timing differences and differing characterization of distributions made by the Fund. The Fund may also utilize earnings and profits distributed to shareholders on redemption of their shares as a part of the dividends-paid deduction for income tax purposes.
Any permanent differences resulting from different book and tax treatment are reclassified at year-end and have no impact on net income, NAV, or NAV per share of the Fund. For the year ended December 31, 2020, there were no permanent differences requiring a reclassification between total distributable earnings/(losses) and paid-in capital.
The tax character of distributions paid during the years ended December 31, 2020, and December 31, 2019, was as follows:
| | | Distributions Paid From: | |
| | | Ordinary Income | | Long-Term Capital Gain | | Total | |
| | | 2020 | | 2019 | | 2020 | | 2019 | | 2020 | | 2019 | |
| | $ | 1,201,796 | | | $ | 50,670 | | | $ | 1,354,523 | | | $ | — | | | $ | 2,556,319 | | | $ | 50,670 | | |
As of December 31, 2020, the components of distributable earnings (accumulated losses) on a U.S. federal income tax basis were as follows:
Undistributed
Ordinary
Income/(Loss) | | Undistributed
Long-Term
Capital Gain | | Unrealized
Appreciation/
(Depreciation) | | Loss
Carryforwards
and Deferrals | | Other
Temporary
Differences | | Total | |
| $ | 1,086,509 | | | $ | 1,442,299 | | | $ | 181,763 | | | $ | — | | | $ | (3,967 | ) | | $ | 2,706,604 | | |
16
The temporary differences between book basis and tax basis distributable earnings are primarily due to mark-to market adjustments on options contracts and unamortized organization expenses.
6 Foreign taxes: Foreign taxes withheld, if any, represent amounts withheld by foreign tax authorities, net of refunds recoverable.
7 Distributions to shareholders: The Fund may earn income, net of expenses, daily on its investments. Distributions from net investment income and net realized capital gains, if any, are generally distributed once a year (usually in October) and are recorded on the ex-date.
8 Expense allocation: Certain expenses are applicable to multiple funds within the complex of related investment companies. Expenses directly attributable to a fund are charged to that fund. Expenses of the Trust that are not directly attributable to a particular series of the Trust (e.g., the Fund) are allocated among the series of the Trust, on the basis of relative net assets, except where a more appropriate allocation of expenses to each of the series can otherwise be made fairly. Expenses borne by the complex of related investment companies, which includes open-end and closed-end investment companies for which NBIA serves as investment manager, that are not directly attributable to a particular investment company in the complex (e.g., the Trust) or series thereof are allocated among the investment companies in the complex or series thereof on the basis of relative net assets, except where a more appropriate allocation of expenses to each of the investment companies in the complex or series thereof can otherwise be made fairly.
9 Investment company securities and exchange-traded funds: The Fund may invest in shares of other registered investment companies, including exchange-traded funds ("ETFs"), within the limitations prescribed by (a) the 1940 Act, (b) the exemptive order from the Securities and Exchange Commission ("SEC") that permits the Fund to invest in both affiliated and unaffiliated investment companies, including ETFs, in excess of the limits in Section 12(d)(1)(A) of the 1940 Act, subject to the terms and conditions of such order, or (c) the ETF's exemptive order or other relief. Some ETFs seek to track the performance of a particular market index. These indices include both broad-based market indices and more narrowly-based indices, including those relating to particular sectors, markets, regions or industries. However, some ETFs have an actively-managed investment objective. ETF shares are traded like traditional equity securities on a national securities exchange or NASDAQ. The Fund will indirectly bear its proportionate share of any management fees and other expenses paid by such other investment companies, which will decrease returns.
10 Derivative instruments: The Fund's use of derivatives during the year ended December 31, 2020, is described below. Please see the Schedule of Investments for the Fund's open positions in derivatives at December 31, 2020. The Fund has adopted the provisions of ASC 815 "Derivatives and Hedging" ("ASC 815"). The disclosure requirements of ASC 815 distinguish between derivatives that qualify for hedge accounting and those that do not. Because investment companies value their derivatives at fair value and recognize changes in fair value through the Statement of Operations, they do not qualify for hedge accounting. Accordingly, even though the Fund's investments in derivatives may represent economic hedges, they are considered non-hedge transactions for purposes of this disclosure.
In October 2020, the SEC adopted new regulations governing the use of derivatives by registered investment companies. Rule 18f-4 will impose limits on the amount of derivatives a fund could enter into, eliminate the asset segregation framework currently used by funds to comply with Section 18 of the 1940 Act, and require funds whose use of derivatives is more than a limited specified exposure to establish and maintain a derivatives risk management program and appoint a derivatives risk manager. While the new rule will become effective February 19, 2021, funds will not be required to fully comply with the new rule until August 19, 2022. It is not currently clear what impact, if any, the new rule will have on the availability, liquidity or performance of derivatives. When fully implemented, the new rule may require changes in how the Fund will use derivatives, may adversely affect the Fund's performance and may increase costs related to the Fund's use of derivatives.
17
Options: The Fund's principal investment strategy is an options-based strategy. During the year ended December 31, 2020, the Fund used options written to manage or adjust the risk profile of the Fund or the risk of individual index exposures and to gain exposure more efficiently than through a direct purchase of the underlying security or to gain exposure to securities, markets, sectors or geographical areas. Options written were also used to generate incremental returns.
Premiums paid by the Fund upon purchasing a call or put option are recorded in the asset section of the Fund's Statement of Assets and Liabilities and are subsequently adjusted to the current market value. When an option is exercised, closed, or expired, the Fund realizes a gain or loss and the asset is eliminated. For purchased call options, the Fund's loss is limited to the amount of the option premium paid.
Premiums received by the Fund upon writing a call option or a put option are recorded in the liability section of the Fund's Statement of Assets and Liabilities and are subsequently adjusted to the current market value. When an option is exercised, closed, or expired, the Fund realizes a gain or loss and the liability is eliminated.
When the Fund writes a call option on an underlying asset it does not own, its exposure on such an option is theoretically unlimited. When writing a covered call option, the Fund, in return for the premium, gives up the opportunity for profit from a price increase in the underlying security above the exercise price, but conversely retains the risk of loss should the price of the security decline. When writing a put option, the Fund, in return for the premium, takes the risk that it must purchase the underlying security at a price that may be higher than the current market price of the security. If a call or put option that the Fund has written expires unexercised, the Fund will realize a gain in the amount of the premium. All securities covering outstanding written options are held in escrow by the custodian bank.
The Fund (as the seller of a put option) receives premiums from the purchaser of the option in exchange for providing the purchaser with the right to sell the underlying instrument to the Fund at a specific price (i.e., the exercise price or strike price). If the market price of the instrument underlying the option exceeds the strike price, it is anticipated that the option would go unexercised and the Fund would earn the full premium upon the option's expiration or a portion of the premium upon the option's early termination. If the market price of the instrument underlying the option drops below the strike price, it is anticipated that the option would be exercised and the Fund would pay the option buyer the difference between the market value of the underlying instrument and the strike price.
At December 31, 2020, the Fund had the following derivatives (which did not qualify as hedging instruments under ASC 815), grouped by primary risk exposure:
Liability Derivatives
Derivative Type | | Statement of
Assets and Liabilities
Location | | Equity Risk | |
Options written | | Option contracts written,
at value | | $ | 457,795 |
| |
18
The impact of the use of these derivative instruments on the Statement of Operations during the fiscal year ended December 31, 2020, was as follows:
Realized Gain/(Loss)
Derivative Type | | Statement of
Operations Location | | Equity Risk | |
Options written | | Net realized gain/(loss) on:
Expiration or closing of option contracts
written | | $ | 2,173,407 |
| |
Change in Appreciation/(Depreciation)
Derivative Type | | Statement of
Operations Location | | Equity Risk | |
Options written | | Change in net unrealized
appreciation/(depreciation)
in value of: Option
contracts written | | $ | 172,678 |
| |
While the Fund may receive rights and warrants in connection with its investments in securities, these rights and warrants are not considered "derivative instruments" under ASC 815.
11 Indemnifications: Like many other companies, the Trust's organizational documents provide that its officers ("Officers") and trustees ("Trustees") are indemnified against certain liabilities arising out of the performance of their duties to the Trust. In addition, both in some of its principal service contracts and in the normal course of its business, the Trust enters into contracts that provide indemnifications to other parties for certain types of losses or liabilities. The Trust's maximum exposure under these arrangements is unknown as this could involve future claims against the Trust.
12 Other matters—Coronavirus: The outbreak of the novel coronavirus in many countries, which is a rapidly evolving situation, has, among other things, disrupted global travel and supply chains, and has adversely impacted global commercial activity, the transportation industry and commodity prices in the energy sector. The impact of this virus has negatively affected and may continue to affect the economies of many nations, individual companies and the global securities and commodities markets, including liquidity and volatility, in ways that cannot necessarily be foreseen at the present time. The rapid development and fluidity of this situation precludes any prediction as to its ultimate impact, which may have a continued adverse effect on economic and market conditions and trigger a period of global economic slowdown. Such conditions (which may be across industries, sectors or geographies) have impacted and may continue to impact the issuers of the securities held by the Fund.
Note B—Investment Management Fees, Administration Fees, Distribution Arrangements, and Other Transactions with Affiliates:
The Fund retains NBIA as its investment manager under a Management Agreement. For such investment management services, the Fund pays NBIA an investment management fee at the annual rate of 0.45% of the Fund's average daily net assets.
The Fund retains NBIA as its administrator under an Administration Agreement. The Fund pays NBIA an administration fee at the annual rate of 0.30% of its average daily net assets under this agreement. Additionally, NBIA retains JPMorgan Chase Bank, NA ("JPM") as its sub-administrator under a Sub-Administration Agreement. NBIA pays JPM a fee for all services received under the Sub-Administration Agreement.
19
NBIA has contractually agreed to waive fees and/or reimburse the Fund for its total annual operating expenses so that the total annual operating expenses do not exceed the expense limitation as detailed in the following table. These undertakings exclude interest, taxes, brokerage commissions, dividend and interest expenses relating to short sales, acquired fund fees and expenses, and extraordinary expenses, if any (commitment fees relating to borrowings are treated as interest for purposes of this exclusion) ("annual operating expenses"); consequently, net expenses may exceed the contractual expense limitation. The Fund has agreed that it will repay NBIA for fees and expenses waived or reimbursed provided that repayment does not cause the annual operating expenses to exceed its contractual expense limitation in place at the time the fees and expenses were waived or reimbursed, or the expense limitation in place at the time the Fund repays NBIA, whichever is lower. Any such repayment must be made within three years after the year in which NBIA incurred the expense.
During the year ended December 31, 2020, there was no repayment to NBIA under this agreement.
At December 31, 2020, the Fund's contingent liabilities to NBIA under the agreement were as follows:
| | | | | | | Expenses Reimbursed in
Year Ending, December 31, | |
| | | | | | | 2018 | | 2019 | | 2020 | |
| | | | | | | Subject to Repayment
Until December 31, | |
| | | Contractual
Expense
Limitation(1) | | Expiration | | 2021 | | 2022 | | 2023 | |
Class S | | | 1.05 | % | | 12/31/23 | | $ | 176,764 | | | $ | 192,742 | | | $ | 183,237 | | |
(1) Expense limitation per annum of the Fund's average daily net assets.
Neuberger Berman BD LLC (the "Distributor") is the Fund's "principal underwriter" within the meaning of the 1940 Act. It acts as agent in arranging for the sale of the Fund's Class S shares. The Board has adopted a distribution and shareholder services plan (the "Plan") for Class S shares pursuant to Rule 12b-1 under the 1940 Act. The Plan provides that, as compensation for administrative and other services related to the sale and distribution of Class S shares, and ongoing services provided to investors in the class, the Distributor receives from Class S a fee at the annual rate of 0.25% of Class S's average daily net assets. The Distributor may pay a portion of the proceeds from the 12b-1 fee to institutions that provide such services, including insurance companies or their affiliates and qualified plan administrators ("intermediaries") for services they provide respecting the Fund to current and prospective variable contract owners and qualified plan participants that invest in the Fund through the intermediaries. Those institutions may use the payments for, among other purposes, compensating employees engaged in sales and/or shareholder servicing. The amount of fees paid by the class during any year may be more or less than the cost of distribution and other services provided to the class. FINRA rules limit the amount of annual distribution fees that may be paid by a mutual fund and impose a ceiling on the cumulative distribution fees paid. The Plan complies with those rules.
Note C—Securities Transactions:
During the year ended December 31, 2020, there were purchase and sale transactions of long-term securities (excluding written option contracts) as follows:
Purchases of
U.S. Government
and Agency
Obligations | | Purchases excluding
U.S. Government
and Agency
Obligations | | Sales and Maturities
of U.S. Government
and Agency
Obligations | | Sales and Maturities
excluding
U.S. Government
and Agency
Obligations | |
| $ | 16,860,367 | | | $ | 468 | | | $ | 13,989,709 | | | $ | 54 | | |
20
During the year ended December 31, 2020, no brokerage commissions on securities transactions were paid to affiliated brokers.
Note D—Fund Share Transactions:
Share activity for the years ended December 31, 2020 and December 31, 2019 was as follows:
| | | For the Year Ended December 31, 2020 | | For the Year Ended December 31, 2019 | |
| | | Shares Sold | | Shares Issued on
Reinvestment of
Dividends and
Distributions | | Shares
Redeemed | | Total | | Shares Sold | | Shares Issued on
Reinvestment of
Dividends and
Distributions | | Shares
Redeemed | | Total | |
Class S | | | 253,053 | | | | 263,267 | | | | (383,302 | ) | | | 133,018 | | | | 2,422,391 | | | | 5,113 | | | | (410,612 | ) | | | 2,016,892 | | |
Other: At December 31, 2020, affiliated persons, as defined in the 1940 Act, owned 0.08% of the Fund's outstanding shares.
Note E—Line of Credit:
At December 31, 2020, the Fund was a participant in a syndicated committed, unsecured $700,000,000 line of credit (the "Credit Facility"), to be used only for temporary or emergency purposes. Series of other investment companies managed by NBIA also participate in this line of credit on substantially the same terms. Interest is charged on borrowings under this Credit Facility at the highest of (a) a federal funds effective rate plus 1.00% per annum, (b) a Eurodollar rate for a one-month period plus 1.00% per annum, and (c) an overnight bank funding rate plus 1.00% per annum. The Credit Facility has an annual commitment fee of 0.15% per annum of the available line of credit, which is paid quarterly. The Fund has agreed to pay its pro rata share of the annual commitment fee, based on the ratio of its individual net assets to the net assets of all participants at the time the fee is due, and interest charged on any borrowing made by the Fund and other costs incurred by the Fund. Because several mutual funds participate in the Credit Facility, there is no assurance that the Fund will have access to all or any part of the $700,000,000 at any particular time. There were no loans outstanding under the Credit Facility at December 31, 2020. During the year ended December 31, 2020, the Fund did not utilize the Credit Facility.
Note F—Recent Accounting Pronouncement:
In March 2020, the Financial Accounting Standards Board ("FASB") issued Accounting Standards Update No. 2020-04 ("ASU 2020-04"), "Reference Rate Reform (Topic 848)". In response to concerns about structural risks of interbank offered rates, and particularly the risk of cessation of LIBOR, regulators have undertaken reference rate reform initiatives to identify alternative reference rates that are more observable or transaction based and less susceptible to manipulation. ASU 2020-04 provides optional guidance for a limited period of time to ease the potential burden in accounting for (or recognizing the effects of) reference rate reform on financial reporting. ASU 2020-04 is elective and applies to all entities, subject to meeting certain criteria, that have contracts, hedging relationships, and other transactions that reference LIBOR or another reference rate expected to be discontinued because of reference rate reform. The amendments are effective as of March 12, 2020 through December 31, 2022. Management is currently evaluating the impact of the guidance.
21
U.S. Equity Index PutWrite Strategy Portfolio
The following table includes selected data for a share outstanding throughout each year and other performance information derived from the Financial Statements. Amounts that do not round to $0.01 or $(0.01) per share are presented as $0.00 or $(0.00), respectively. Ratios that do not round to 0.01% or (0.01)% are presented as 0.00% or (0.00)%, respectively. A "—" indicates that the line item was not applicable in the corresponding period.
Class S | |
| | | Year Ended December 31, | |
| | | 2020 | | 2019 | | 2018 | | 2017 | | 2016 | |
Net Asset Value, Beginning of Year | | $ | 10.30 | | | $ | 8.95 | | | $ | 9.90 | | | $ | 9.28 | | | $ | 9.39 | | |
Income From Investment Operations: | |
| Net Investment Income/(Loss)‡ | | | 0.04 | | | | 0.09 | | | | 0.04 | | | | (0.02 | ) | | | (0.12 | ) | |
Net Gains or Losses on Securities
(both realized and unrealized) | | | 0.77 | | | | 1.28 | | | | (0.70 | ) | | | 0.64 | | | | 0.06 | | |
Total From Investment Operations | | | 0.81 | | | | 1.37 | | | | (0.66 | ) | | | 0.62 | | | | (0.06 | ) | |
Less Distributions From: | |
Net Investment Income | | | (0.09 | ) | | | (0.02 | ) | | | — | | | | — | | | | — | | |
Net Realized Capital Gains | | | (0.71 | ) | | | — | | | | (0.29 | ) | | | — | | | | (0.05 | ) | |
Total Distributions | | | (0.80 | ) | | | (0.02 | ) | | | (0.29 | ) | | | — | | | | (0.05 | ) | |
Net Asset Value, End of Year | | $ | 10.31 | | | $ | 10.30 | | | $ | 8.95 | | | $ | 9.90 | | | $ | 9.28 | | |
| Total Return†† | | | 8.26 | % | | | 15.26 | % | | | (6.78 | )% | | | 6.68 | % | | | (0.65 | )% | |
Ratios/Supplemental Data | |
Net Assets, End of Year (in millions) | | $ | 36.0 | | | $ | 34.6 | | | $ | 12.0 | | | $ | 12.2 | | | $ | 14.5 | | |
| Ratio of Gross Expenses to Average Net Assets# | | | 1.61 | % | | | 1.72 | % | | | 2.59 | % | | | 3.68 | % | | | 6.83 | % | |
Ratio of Gross Expenses to Average Net Assets
(excluding dividend and interest expense
relating to short sales)# | | | — | | | | — | | | | — | | | | 3.50 | % | | | 5.99 | % | |
Ratio of Net Expenses to Average Net Assets | | | 1.05 | % | | | 1.05 | % | | | 1.05 | % | | | 1.72 | % | | | 3.24 | % | |
Ratio of Net Expenses to Average Net Assets
(excluding dividend and interest expense
relating to short sales) | | | — | | | | — | | | | — | | | | 1.54 | % | | | 2.40 | % | |
Ratio of Net Investment Income/(Loss) to
Average Net Assets | | | 0.36 | % | | | 0.97 | % | | | 0.46 | % | | | (0.24 | )% | | | (1.33 | )% | |
Portfolio Turnover Rate (including securities sold short) | | | — | | | | — | | | | — | | | | 368 | % | | | 547 | % | |
Portfolio Turnover Rate (excluding securities sold short) | | | 48 | % | | | 26 | % | | | 23 | % | | | 342 | % | | | 546 | % | |
See Notes to Financial Highlights
22
Notes to Financial Highlights U.S. Equity Index PutWrite Strategy Portfolio
†† Total return based on per share NAV reflects the effects of changes in NAV on the performance of the Fund during each fiscal period. Returns assume income dividends and other distributions, if any, were reinvested. Results represent past performance and do not indicate future results. Current returns may be lower or higher than the performance data quoted. Investment returns and principal will fluctuate and shares, when redeemed, may be worth more or less than original cost. Total return would have been lower if Management had not reimbursed and/or waived certain expenses. The total return information shown does not reflect charges and other expenses that apply to the separate accounts or the related insurance policies or other qualified pension or retirement plans, and the inclusion of these charges and other expenses would reduce the total return for all fiscal periods shown.
‡ Calculated based on the average number of shares outstanding during each fiscal period.
# Represents the annualized ratios of net expenses to average daily net assets if Management had not reimbursed certain expenses and/or waived a portion of the investment management fee.
23
Report of Independent Registered Public Accounting Firm
To the Shareholders of
U.S. Equity Index PutWrite Strategy Portfolio and
Board of Trustees of the Neuberger Berman Advisers Management Trust
Opinion on the Financial Statements
We have audited the accompanying statement of assets and liabilities of U.S. Equity Index PutWrite Strategy Portfolio (the "Portfolio") (one of the portfolios constituting Neuberger Berman Advisers Management Trust (the "Trust")), including the schedule of investments, as of December 31, 2020, and the related statement of operations for the year then ended, the statements of changes in net assets for each of the two years in the period then ended, the financial highlights for each of the five years in the period then ended and the related notes (collectively referred to as the "financial statements"). In our opinion, the financial statements present fairly, in all material respects, the financial position of the Portfolio (one of the portfolios constituting Neuberger Berman Advisers Management Trust) at December 31, 2020, the results of its operations for the year then ended, the changes in its net assets for each of the two years in the period then ended and its financial highlights for each of the five years in the period then ended, in conformity with U.S. generally accepted accounting principles.
Basis for Opinion
These financial statements are the responsibility of the Trust's management. Our responsibility is to express an opinion on the Portfolio's financial statements based on our audits. We are a public accounting firm registered with the Public Company Accounting Oversight Board (United States) ("PCAOB") and are required to be independent with respect to the Trust in accordance with the U.S. federal securities laws and the applicable rules and regulations of the Securities and Exchange Commission and the PCAOB.
We conducted our audits in accordance with the standards of the PCAOB. Those standards require that we plan and perform the audit to obtain reasonable assurance about whether the financial statements are free of material misstatement, whether due to error or fraud. The Trust is not required to have, nor were we engaged to perform, an audit of the Trust's internal control over financial reporting. As part of our audits, we are required to obtain an understanding of internal control over financial reporting but not for the purpose of expressing an opinion on the effectiveness of the Trust's internal control over financial reporting. Accordingly, we express no such opinion.
Our audits included performing procedures to assess the risks of material misstatement of the financial statements, whether due to error or fraud, and performing procedures that respond to those risks. Such procedures included examining, on a test basis, evidence regarding the amounts and disclosures in the financial statements. Our procedures included confirmation of securities owned as of December 31, 2020, by correspondence with the custodian and brokers or by other appropriate auditing procedures where replies from brokers were not received. Our audits also included evaluating the accounting principles used and significant estimates made by management, as well as evaluating the overall presentation of the financial statements. We believe that our audits provide a reasonable basis for our opinion.
We have served as the auditor of one or more Neuberger Berman investment companies since 1954.
Boston, Massachusetts
February 12, 2021
24
The following tables set forth information concerning the Trustees and Officers of the Fund. All persons named as Trustees and Officers also serve in similar capacities for other funds administered or managed by Neuberger Berman Investment Advisers LLC ("NBIA"). The Fund's Statement of Additional Information includes additional information about the Trustees as of the time of the Fund's most recent public offering and is available upon request, without charge, by calling (800) 877-9700.
Information about the Board of Trustees
Name, (Year of Birth),
and Address(1) | | Position(s)
and Length of
Time Served(2) | | Principal Occupation(s)(3) | | Number of
Funds in Fund
Complex
Overseen by
Fund Trustee | | Other Directorships
Held Outside Fund
Complex by Fund
Trustee(3) | |
Independent Fund Trustees | |
Michael J. Cosgrove (1949) | | Trustee since 2015 | | President, Carragh Consulting USA, since 2014; formerly, Executive, General Electric Company, 1970 to 2014, including President, Mutual Funds and Global Investment Programs, GE Asset Management, 2011 to 2014, President and Chief Executive Officer, Mutual Funds and Intermediary Business, GE Asset Management, 2007 to 2011, President, Institutional Sales and Marketing, GE Asset Management, 1998 to 2007, and Chief Financial Officer, GE Asset Management, and Deputy Treasurer, GE Company, 1988 to 1993. | |
| 46 |
| | Director, America Press, Inc. (not-for-profit Jesuit publisher), since 2015; formerly, Director, Fordham University, 2001 to 2018; formerly, Director, The Gabelli Go Anywhere Trust, June 2015 to June 2016; formerly, Director, Skin Cancer Foundation (not-for-profit), 2006 to 2015; formerly, Director, GE Investments Funds, Inc., 1997 to 2014; formerly, Trustee, GE Institutional Funds, 1997 to 2014; formerly, Director, GE Asset Management, 1988 to 2014; formerly, Director, Elfun Trusts, 1988 to 2014; formerly, Trustee, GE Pension & Benefit Plans, 1988 to 2014; formerly, Member of Board of Governors, Investment Company Institute. | |
25
Name, (Year of Birth),
and Address(1) | | Position(s)
and Length of
Time Served(2) | | Principal Occupation(s)(3) | | Number of
Funds in Fund
Complex
Overseen by
Fund Trustee | | Other Directorships
Held Outside Fund
Complex by Fund
Trustee(3) | |
Marc Gary (1952) | | Trustee since 2015 | | Executive Vice Chancellor and Chief Operating Officer, Jewish Theological Seminary, since 2012; formerly, Executive Vice President and General Counsel, Fidelity Investments, 2007 to 2012; formerly, Executive Vice President and General Counsel, BellSouth Corporation, 2004 to 2007; formerly, Vice President and Associate General Counsel, BellSouth Corporation, 2000 to 2004; formerly, Associate, Partner, and National Litigation Practice Co-Chair, Mayer, Brown LLP, 1981 to 2000; formerly, Associate Independent Counsel, Office of Independent Counsel, 1990 to 1992. | |
| 46 |
| | Director, UJA Federation of Greater New York, since 2019; Trustee, Jewish Theological Seminary, since 2015; Director, Legility, Inc. (privately held for-profit company), since 2012; Director, Lawyers Committee for Civil Rights Under Law (not-for-profit), since 2005; formerly, Director, Equal Justice Works (not-for-profit), 2005 to 2014; formerly, Director, Corporate Counsel Institute, Georgetown University Law Center, 2007 to 2012; formerly, Director, Greater Boston Legal Services (not-for-profit), 2007 to 2012. | |
26
Name, (Year of Birth),
and Address(1) | | Position(s)
and Length of
Time Served(2) | | Principal Occupation(s)(3) | | Number of
Funds in Fund
Complex
Overseen by
Fund Trustee | | Other Directorships
Held Outside Fund
Complex by Fund
Trustee(3) | |
Martha C. Goss (1949) | | Trustee since 2007 | | President, Woodhill Enterprises Inc./Chase Hollow Associates LLC (personal investment vehicle), since 2006; formerly, Consultant, Resources Global Professionals (temporary staffing), 2002 to 2006; formerly, Chief Financial Officer, Booz-Allen & Hamilton, Inc., 1995 to 1999; formerly, Enterprise Risk Officer, Prudential Insurance, 1994 to1995; formerly, President, Prudential Asset Management Company, 1992 to 1994; formerly, President, Prudential Power Funding (investments in electric and gas utilities and alternative energy projects), 1989 to 1992; formerly, Treasurer, Prudential Insurance Company, 1983 to 1989. | |
| 46 |
| | Director, American Water (water utility), since 2003; Director, Allianz Life of New York (insurance), since 2005; Director, Berger Group Holdings, Inc. (engineering consulting firm), since 2013; Director, Financial Women's Association of New York (not-for-profit association), since 2003; Trustee Emerita, Brown University, since 1998; Director, Museum of American Finance (not-for-profit), since 2013; formerly, Non-Executive Chair and Director, Channel Reinsurance (financial guaranty reinsurance), 2006 to 2010; formerly, Director, Ocwen Financial Corporation (mortgage servicing), 2005 to 2010; formerly, Director, Claire's Stores, Inc. (retailer), 2005 to 2007; formerly, Director, Parsons Brinckerhoff Inc. (engineering consulting firm), 2007 to 2010; formerly, Director, Bank Leumi (commercial bank), 2005 to 2007; formerly, Advisory Board Member, Attensity (software developer), 2005 to 2007. | |
27
Name, (Year of Birth),
and Address(1) | | Position(s)
and Length of
Time Served(2) | | Principal Occupation(s)(3) | | Number of
Funds in Fund
Complex
Overseen by
Fund Trustee | | Other Directorships
Held Outside Fund
Complex by Fund
Trustee(3) | |
Michael M. Knetter (1960) | | Trustee since 2007 | | President and Chief Executive Officer, University of Wisconsin Foundation, since 2010; formerly, Dean, School of Business, University of Wisconsin—Madison; formerly, Professor of International Economics and Associate Dean, Amos Tuck School of Business—Dartmouth College, 1998 to 2002. | |
| 46 |
| | Director, 1 William Street Credit Income Fund, since 2018; Board Member, American Family Insurance (a mutual company, not publicly traded), since March 2009; formerly, Trustee, Northwestern Mutual Series Fund, Inc., 2007 to 2011; formerly, Director, Wausau Paper, 2005 to 2011; formerly, Director, Great Wolf Resorts, 2004 to 2009. | |
Deborah C. McLean (1954) | | Trustee since 2015 | | Member, Circle Financial Group (private wealth management membership practice), since 2011; Managing Director, Golden Seeds LLC (an angel investing group), since 2009; Adjunct Professor, Columbia University School of International and Public Affairs, since 2008; formerly, Visiting Assistant Professor, Fairfield University, Dolan School of Business, Fall 2007; formerly, Adjunct Associate Professor of Finance, Richmond, The American International University in London, 1999 to 2007. | |
| 46 |
| | Board member, Norwalk Community College Foundation, since 2014; Dean's Advisory Council, Radcliffe Institute for Advanced Study, since 2014; formerly, Director and Treasurer, At Home in Darien (not-for-profit), 2012 to 2014; formerly, Director, National Executive Service Corps (not-for-profit), 2012 to 2013; formerly, Trustee, Richmond, The American International University in London, 1999 to 2013. | |
28
Name, (Year of Birth),
and Address(1) | | Position(s)
and Length of
Time Served(2) | | Principal Occupation(s)(3) | | Number of
Funds in Fund
Complex
Overseen by
Fund Trustee | | Other Directorships
Held Outside Fund
Complex by Fund
Trustee(3) | |
George W. Morriss (1947) | | Trustee since 2007 | | Adjunct Professor, Columbia University School of International and Public Affairs, since 2012; formerly, Executive Vice President and Chief Financial Officer, People's United Bank, Connecticut (a financial services company), 1991 to 2001. | |
| 46 |
| | Director, 1 William Street Credit Income Fund, since 2018; Director and Chair, Thrivent Church Loan and Income Fund, since 2018; formerly, Trustee, Steben Alternative Investment Funds, Steben Select Multi-Strategy Fund, and Steben Select Multi-Strategy Master Fund, 2013 to 2017; formerly, Treasurer, National Association of Corporate Directors, Connecticut Chapter, 2011 to 2015; formerly, Manager, Larch Lane Multi-Strategy Fund complex (which consisted of three funds), 2006 to 2011; formerly, Member, NASDAQ Issuers' Affairs Committee, 1995 to 2003. | |
Tom D. Seip (1950) | | Trustee since 2000; Chairman of the Board since 2008; formerly Lead Independent Trustee from 2006 to 2008 | | Formerly, Managing Member, Ridgefield Farm LLC (a private investment vehicle), 2004 to 2016; formerly, President and CEO, Westaff, Inc. (temporary staffing), May 2001 to January 2002; formerly, Senior Executive, The Charles Schwab Corporation, 1983 to 1998, including Chief Executive Officer, Charles Schwab Investment Management, Inc.; Trustee, Schwab Family of Funds and Schwab Investments, 1997 to 1998; and Executive Vice President-Retail Brokerage, Charles Schwab & Co., Inc., 1994 to 1997. | |
| 46 |
| | Formerly, Director, H&R Block, Inc. (tax services company), 2001 to 2018; formerly, Director, Talbot Hospice Inc., 2013 to 2016; formerly, Chairman, Governance and Nominating Committee, H&R Block, Inc., 2011 to 2015; formerly, Chairman, Compensation Committee, H&R Block, Inc., 2006 to 2010; formerly, Director, Forward Management, Inc. (asset management company), 1999 to 2006. | |
29
Name, (Year of Birth),
and Address(1) | | Position(s)
and Length of
Time Served(2) | | Principal Occupation(s)(3) | | Number of
Funds in Fund
Complex
Overseen by
Fund Trustee | | Other Directorships
Held Outside Fund
Complex by Fund
Trustee(3) | |
James G. Stavridis (1955) | | Trustee since 2015 | | Operating Executive, The Carlyle Group, since 2018; Commentator, NBC News, since 2015; formerly, Dean, Fletcher School of Law and Diplomacy, Tufts University, 2013 to 2018; formerly, Admiral, United States Navy, 1976 to 2013, including Supreme Allied Commander, NATO and Commander, European Command, 2009 to 2013, and Commander, United States Southern Command, 2006 to 2009. | |
| 46 |
| | Director, American Water (water utility), since 2018; Director, NFP Corp. (insurance broker and consultant), since 2017; Director, U.S. Naval Institute, since 2014; Director, Onassis Foundation, since 2014; Director, BMC Software Federal, LLC, since 2014; Director, Vertical Knowledge, LLC, since 2013; formerly, Director, Navy Federal Credit Union, 2000-2002. | |
30
Name, (Year of Birth),
and Address(1) | | Position(s)
and Length of
Time Served(2) | | Principal Occupation(s)(3) | | Number of
Funds in Fund
Complex
Overseen by
Fund Trustee | | Other Directorships
Held Outside Fund
Complex by Fund
Trustee(3) | |
Candace L. Straight (1947) | | Trustee since 1999 | | Private investor and consultant specializing in the insurance industry; formerly, Advisory Director, Securitas Capital LLC (a global private equity investment firm dedicated to making investments in the insurance sector), 1998 to 2003. | |
| 46 |
| | Director, ERA Coalition (not-for-profit), 2019 to 2020; Director, Re belle Media (a privately held TV and film production company), since 2018; formerly, Public Member, Board of Governors and Board of Trustees, Rutgers University, 2011 to 2016; formerly, Director, Montpelier Re Holdings Ltd. (reinsurance company), 2006 to 2015; formerly, Director, National Atlantic Holdings Corporation (property and casualty insurance company), 2004 to 2008; formerly, Director, The Proformance Insurance Company (property and casualty insurance company), 2004 to 2008; formerly, Director, Providence Washington Insurance Company (property and casualty insurance company), 1998 to 2006; formerly, Director, Summit Global Partners (insurance brokerage firm), 2000 to 2005. | |
Peter P. Trapp (1944) | | Trustee since 1984 | | Retired; formerly, Regional Manager for Mid-Southern Region, Ford Motor Credit Company, September 1997 to 2007; formerly, President, Ford Life Insurance Company, April 1995 to August 1997. | |
| 46 |
| | None. | |
31
Name, (Year of Birth),
and Address(1) | | Position(s)
and Length of
Time Served(2) | | Principal Occupation(s)(3) | | Number of
Funds in Fund
Complex
Overseen by
Fund Trustee | | Other Directorships
Held Outside Fund
Complex by Fund
Trustee(3) | |
Fund Trustees who are "Interested Persons" | |
Joseph V. Amato* (1962) | | Chief Executive Officer and President since 2018 and Trustee since 2009 | | President and Director, Neuberger Berman Group LLC, since 2009; President and Chief Executive Officer, Neuberger Berman BD LLC and Neuberger Berman Holdings LLC (including its predecessor, Neuberger Berman Inc.), since 2007; Chief Investment Officer (Equities) and President (Equities), NBIA (formerly, Neuberger Berman Fixed Income LLC and including predecessor entities), since 2007, and Board Member of NBIA since 2006; formerly, Global Head of Asset Management of Lehman Brothers Holdings Inc.'s ("LBHI") Investment Management Division, 2006 to 2009; formerly, member of LBHI's Investment Management Division's Executive Management Committee, 2006 to 2009; formerly, Managing Director, Lehman Brothers Inc. ("LBI"), 2006 to 2008; formerly, Chief Recruiting and Development Officer, LBI, 2005 to 2006; formerly, Global Head of LBI's Equity Sales and a Member of its Equities Division Executive Committee, 2003 to 2005; President and Chief Executive Officer, ten registered investment companies for which NBIA acts as investment manager and/or administrator. | |
| 46 |
| | Member of Board of Advisors, McDonough School of Business, Georgetown University, since 2001; Member of New York City Board of Advisors, Teach for America, since 2005; Trustee, Montclair Kimberley Academy (private school), since 2007; Member of Board of Regents, Georgetown University, since 2013. | |
(1) The business address of each listed person is 1290 Avenue of the Americas, New York, NY 10104.
32
(2) Pursuant to the Trust's Amended and Restated Trust Instrument, subject to any limitations on the term of service imposed by the By-Laws or any retirement policy adopted by the Fund Trustees, each Fund Trustee shall hold office for life or until his or her successor is elected or the Trust terminates; except that (a) any Fund Trustee may resign by delivering a written resignation; (b) any Fund Trustee may be removed with or without cause at any time by a written instrument signed by at least two-thirds of the other Fund Trustees; (c) any Fund Trustee who requests to be retired, or who has become unable to serve, may be retired by a written instrument signed by a majority of the other Fund Trustees; and (d) any Fund Trustee may be removed at any shareholder meeting by a vote of at least two-thirds of the outstanding shares.
(3) Except as otherwise indicated, each individual has held the positions shown during at least the last five years.
* Indicates a Fund Trustee who is an "interested person" within the meaning of the 1940 Act. Mr. Amato is an interested person of the Trust by virtue of the fact that he is an officer of NBIA and/or its affiliates.
33
Information about the Officers of the Trust
Name, (Year of Birth),
and Address(1) | | Position(s)
and Length of
Time Served(2) | | Principal Occupation(s)(3) | |
Claudia A. Brandon (1956) | | Executive Vice President since 2008 and Secretary since 1985 | | Senior Vice President, Neuberger Berman, since 2007 and Employee since 1999; Senior Vice President, NBIA, since 2008 and Assistant Secretary since 2004; formerly, Vice President, Neuberger Berman, 2002 to 2006; formerly, Vice President—Mutual Fund Board Relations, NBIA, 2000 to 2008; formerly, Vice President, NBIA, 1986 to 1999 and Employee, 1984 to 1999; Executive Vice President and Secretary, twenty-nine registered investment companies for which NBIA acts as investment manager and/or administrator. | |
Agnes Diaz (1971) | | Vice President since 2013 | | Senior Vice President, Neuberger Berman, since 2012; Senior Vice President, NBIA, since 2012 and Employee since 1996; formerly, Vice President, Neuberger Berman, 2007 to 2012; Vice President, ten registered investment companies for which NBIA acts as investment manager and/or administrator. | |
Anthony DiBernardo (1979) | | Assistant Treasurer since 2011 | | Senior Vice President, Neuberger Berman, since 2014; Senior Vice President, NBIA, since 2014, and Employee since 2003; formerly, Vice President, Neuberger Berman, 2009 to 2014; Assistant Treasurer, ten registered investment companies for which NBIA acts as investment manager and/or administrator. | |
Savonne L. Ferguson (1973) | | Chief Compliance Officer since 2018 | | Senior Vice President, Chief Compliance Officer (Mutual Funds) and Associate General Counsel, NBIA, since November 2018; formerly, Vice President T. Rowe Price Group, Inc. (2018), Vice President and Senior Legal Counsel, T. Rowe Price Associates, Inc. (2014-2018), Vice President and Director of Regulatory Fund Administration, PNC Capital Advisors, LLC (2009-2014), Secretary, PNC Funds and PNC Advantage Funds (2010-2014); Chief Compliance Officer, twenty-nine registered investment companies for which NBIA acts as investment manager and/or administrator. | |
Corey A. Issing (1978) | | Chief Legal Officer since 2016 (only for purposes of sections 307 and 406 of the Sarbanes-Oxley Act of 2002) | | General Counsel and Head of Compliance—Mutual Funds since 2016 and Managing Director, NBIA, since 2017; formerly, Associate General Counsel (2015 to 2016), Counsel (2007 to 2015), Senior Vice President (2013-2016), Vice President (2009-2013); Chief Legal Officer (only for purposes of sections 307 and 406 of the Sarbanes-Oxley Act of 2002), twenty-nine registered investment companies for which NBIA acts as investment manager and/or administrator. | |
Sheila R. James (1965) | | Assistant Secretary since 2002 | | Vice President, Neuberger Berman, since 2008 and Employee since 1999; Vice President, NBIA, since 2008; formerly, Assistant Vice President, Neuberger Berman, 2007; Employee, NBIA, 1991 to 1999; Assistant Secretary, twenty-nine registered investment companies for which NBIA acts as investment manager and/or administrator. | |
34
Name, (Year of Birth),
and Address(1) | | Position(s)
and Length of
Time Served(2) | | Principal Occupation(s)(3) | |
Brian Kerrane (1969) | | Chief Operating Officer since 2015 and Vice President since 2008 | | Managing Director, Neuberger Berman, since 2014; Chief Operating Officer—Mutual Funds and Managing Director, NBIA, since 2015; formerly, Senior Vice President, Neuberger Berman, 2006 to 2014; Vice President, NBIA, 2008 to 2015 and Employee since 1991; Chief Operating Officer, ten registered investment companies for which NBIA acts as investment manager and/or administrator; Vice President, twenty-nine registered investment companies for which NBIA acts as investment manager and/or administrator. | |
Anthony Maltese (1959) | | Vice President since 2015 | | Senior Vice President, Neuberger Berman, since 2014 and Employee since 2000; Senior Vice President, NBIA, since 2014; Vice President, ten registered investment companies for which NBIA acts as investment manager and/or administrator. | |
Josephine Marone (1963) | | Assistant Secretary since 2017 | | Senior Paralegal, Neuberger Berman, since 2007 and Employee since 2007; Assistant Secretary, twenty-nine registered investment companies for which NBIA acts as investment manager and/or administrator. | |
Owen F. McEntee, Jr. (1961) | | Vice President since 2008 | | Vice President, Neuberger Berman, since 2006; Vice President, NBIA, since 2006 and Employee since 1992; Vice President, ten registered investment companies for which NBIA acts as investment manager and/or administrator. | |
John M. McGovern (1970) | | Treasurer and Principal Financial and Accounting Officer since 2005 | | Senior Vice President, Neuberger Berman, since 2007; Senior Vice President, NBIA, since 2007 and Employee since 1993; formerly, Vice President, Neuberger Berman, 2004 to 2006; formerly, Assistant Treasurer, 2002 to 2005; Treasurer and Principal Financial and Accounting Officer, ten registered investment companies for which NBIA acts as investment manager and/or administrator. | |
Frank Rosato (1971) | | Assistant Treasurer since 2005 | | Vice President, Neuberger Berman, since 2006; Vice President, NBIA, since 2006 and Employee since 1995; Assistant Treasurer, ten registered investment companies for which NBIA acts as investment manager and/or administrator. | |
Niketh Velamoor (1979) | | Anti-Money Laundering Compliance Officer since 2018 | | Senior Vice President and Associate General Counsel, Neuberger Berman, since July 2018; Assistant United States Attorney, Southern District of New York, 2009 to 2018; Anti-Money Laundering Compliance Officer, four registered investment companies for which NBIA acts as investment manager and/or administrator. | |
(1) The business address of each listed person is 1290 Avenue of the Americas, New York, NY 10104.
(2) Pursuant to the By-Laws of the Trust, each officer elected by the Fund Trustees shall hold office until his or her successor shall have been elected and qualified or until his or her earlier death, inability to serve, or resignation. Officers serve at the pleasure of the Fund Trustees and may be removed at any time with or without cause.
(3) Except as otherwise indicated, each individual has held the positions shown during at least the last five years.
35
Proxy Voting Policies and Procedures
A description of the policies and procedures that the Trust uses to determine how to vote proxies relating to portfolio securities is available, without charge, by calling 800-877-9700 (toll-free) and on the SEC's website, at www.sec.gov. Information regarding how the Trust voted proxies relating to portfolio securities during the most recent 12-month period ended June 30 is also available upon request, without charge, by calling 800-877-9700 (toll-free), on the SEC's website at www.sec.gov, and on Neuberger Berman's website at www.nb.com.
Quarterly Portfolio Schedule
The Trust files a complete schedule of portfolio holdings for the Fund with the SEC for the first and third quarters of each fiscal year as an exhibit to its report on Form N-PORT. The Trust's Form N-PORT is available on the SEC's website at www.sec.gov. The portfolio holdings information on Form N-PORT is available upon request, without charge, by calling 800-877-9700 (toll-free).
Board Consideration of the Management Agreement
On an annual basis, the Board of Trustees (the "Board") of Neuberger Berman Advisers Management Trust (the "Trust"), including the Trustees who are not "interested persons" of the Trust or of Neuberger Berman Investment Advisers LLC ("Management") (including its affiliates) ("Independent Fund Trustees"), considers whether to continue the management agreement with Management (the "Agreement") with respect to U.S. Equity Index PutWrite Strategy Portfolio (the "Fund"). Throughout the process, the Independent Fund Trustees are advised by counsel that is experienced in Investment Company Act of 1940 matters and that is independent of Management ("Independent Counsel"). At a meeting held on October 1, 2020, the Board, including the Independent Fund Trustees, approved the continuation of the Agreement for the Fund.
In evaluating the Agreement, the Board, including the Independent Fund Trustees, reviewed extensive materials provided by Management in response to questions submitted by the Independent Fund Trustees and Independent Counsel, and met with senior representatives of Management regarding its personnel, operations, and profitability as they relate to the Fund. The annual contract review extends over at least two regular meetings of the Board to ensure that Management has time to respond to any questions the Independent Fund Trustees may have on their initial review of the materials and that the Independent Fund Trustees have time to consider those responses.
In connection with its deliberations, the Board also considered the broad range of information relevant to the annual contract review that is provided to the Board (including its various standing committees) at meetings throughout the year, including reports on investment performance, portfolio risk, and other portfolio information for the Fund, including the use of derivatives, as well as periodic reports on, among other matters, pricing and valuation; quality and cost of portfolio trade execution; compliance; and shareholder and other services provided by Management and its affiliates. The Contract Review Committee, which is comprised of Independent Fund Trustees, was established by the Board to assist in its evaluation and analysis of materials for the annual contract review. The Board has also established other committees that focus throughout the year on specific areas relevant to the annual contract review, such as Fund performance or compliance matters, and that are charged with specific responsibilities regarding the annual contract review. Those committees provide reports to the Contract Review Committee and the full Board, which consider that information as part of the annual contract review process. The Board's Contract Review Committee annually considers and updates the questions it asks of Management in light of legal advice furnished to it by Independent Counsel; its own business judgment; and developments in the industry, in the markets, in mutual fund regulation and litigation, and in Management's business model.
The Independent Fund Trustees received from Independent Counsel a memorandum discussing the legal standards for their consideration of the proposed continuation of the Agreement. During the course of the year and during their deliberations regarding the annual contract review, the Contract Review Committee and the Independent Fund Trustees met with Independent Counsel separately from representatives of Management.
36
Provided below is a description of the Board's contract approval process and material factors that the Board considered at its meetings regarding renewal of the Agreement and the compensation to be paid thereunder. In connection with its approval of the continuation of the Agreement, the Board evaluated the terms of the Agreement, the overall fairness of the Agreement to the Fund, and whether the Agreement was in the best interests of the Fund and its shareholders. The Board's determination to approve the continuation of the Agreement was based on a comprehensive consideration of all information provided to the Board throughout the year and specifically in connection with the annual contract review. The Board considered the Fund's investment management agreement separately from those of other funds of the Trust.
This description is not intended to include all of the factors considered by the Board. The Board members did not identify any particular information or factor that was all-important or controlling, and each Trustee may have attributed different weights to the various factors. The Board focused on the costs and benefits of the Agreement to the Fund and, through the Fund, its shareholders.
Nature, Extent, and Quality of Services
With respect to the nature, extent, and quality of the services provided, the Board considered the investment philosophy and decision-making processes of, and the qualifications, experience, and capabilities of, and the resources available to, the portfolio management personnel of Management who perform services for the Fund. The Board noted that Management also provides certain administrative services, including fund accounting and compliance services. The Board also considered Management's policies and practices regarding brokerage, commissions, other trading costs, and allocation of portfolio transactions and reviewed the quality of the execution services that Management had provided. The Board also reviewed Management's use of brokers to execute Fund transactions that provide research services to Management. Moreover, the Board considered Management's approach to potential conflicts of interest both generally and between the Fund's investments and those of other funds or accounts managed by Management. The Board also noted that Management had increased its research capabilities with respect to environmental, social, and corporate governance matters and how those factors may relate to investment performance. The Board noted the additional responsibilities of Management in administering the liquidity risk management program.
The Board recognized the extensive range of services that Management provides to the Fund beyond the investment management services. The Board noted that Management is also responsible for monitoring compliance with the Fund's investment objectives, policies, and restrictions, as well as compliance with applicable law, including implementing rulemaking initiatives of the U.S. Securities and Exchange Commission. The Board considered that Management assumes significant ongoing entrepreneurial and business risks as the investment adviser and sponsor for the Fund, for which it is entitled to reasonable compensation. The Trustees also considered that Management's responsibilities include continual management of investment, operational, enterprise, legal, regulatory, and compliance risks as they relate to the Fund, and the Board considers on a regular basis information regarding Management's processes for monitoring and managing risk. In addition, the Board also noted that when Management launches a new fund or share class, it assumes entrepreneurial risk with respect to that fund or share class, and that some funds and share classes have been liquidated without ever having been profitable to Management.
The Board also reviewed and evaluated Management's activities under its contractual obligation to oversee the Fund's various outside service providers, including its renegotiation of certain service providers' fees and its evaluation of service providers' infrastructure, cybersecurity programs, compliance programs, and business continuity programs, among other matters. The Board also considered Management's ongoing development of its own infrastructure and information technology to support the Fund through, among other things, cybersecurity, business continuity planning, and risk management. The Board noted Management's largely seamless implementation of its business continuity plan in response to the COVID-19 pandemic. In addition, the Board noted the positive compliance history of Management, as no significant compliance problems were reported to the Board with respect to Management. The Board also considered the general structure of the portfolio managers' compensation and whether this structure provides appropriate incentives to act in the best interests of the Fund. The Board also considered the ability of Management to attract and retain qualified personnel to service the Fund.
37
As in past years, the Board also considered the manner in which Management addressed various matters that arose during the year, some of them a result of developments in the broader fund industry or the regulations governing it. In addition, the Board considered actions taken by Management in response to recent market conditions, such as the economic dislocation and rise in volatility that accompanied shutdowns related to the efforts to stem the spread of COVID-19, and considered the overall performance of Management in this context.
Fund Performance
The Board requested a report from an outside consulting firm that specializes in the analysis of fund industry data that compared the Fund's performance, along with its fees and other expenses, to a group of industry peers ("Expense Group") and a broader universe of funds pursuing generally similar strategies with the same investment classification and/or objective ("Performance Universe"). The Expense Group and Performance Universe were composed of two types of funds: proprietary funds that are operated by insurance companies or their affiliates, and non-proprietary funds, such as the Fund, operated for insurance company investors by independent investment managers. The Board considered the Fund's performance and fees in light of the limitations inherent in the methodology for constructing such comparative groups and determining which investment companies should be included in the comparative groups, noting differences as compared to certain fund industry ranking and rating systems. The Board also considered the impact and inherent limitation on the comparisons due to the small number of funds included in the Fund's Expense Group and Performance Universe.
With respect to investment performance, the Board considered information regarding the Fund's short-term performance, net of the Fund's fees and expenses, on an absolute basis, relative to a benchmark index that does not deduct the fees or expenses of investing, and compared to the performance of the Expense Group and Performance Universe, each constructed by the consulting firm. The Board also reviewed performance in relation to certain measures of the degree of investment risk undertaken by the portfolio managers.
The Performance Universe referenced in this section was identified by the consulting firm, as discussed above. For any period of underperformance, the Board considered the magnitude and duration of that underperformance relative to the Performance Universe, and/or the benchmark (e.g., the amount by which a Fund underperformed, including, for example, whether the Fund slightly underperformed or significantly underperformed its benchmark). With respect to performance quintile rankings for the Fund compared to its Performance Universe, the first quintile represents the highest (best) performance and the fifth quintile represents the lowest performance. For investment performance comparisons, the Board looked at the Fund's Class S as a proxy for both of the Fund's classes.
With regard to performance, the Board considered that the Fund adopted an entirely new investment strategy in May 2017. The Board considered that, for its new investment strategy since May 2017, based on performance data for the periods ended December 31, 2019: (1) as compared to its benchmark, the Fund's performance was higher for the 1-year period; and (2) as compared to its Performance Universe, the Fund's performance was in the third quintile for the 1-year period. The Board also noted the Fund's outperformance versus its benchmark during the 7-month period ending July 31, 2020. Further, the Board noted the Fund's ranking exceeded the average of its Lipper and Morningstar peer category for the 1- and 3-year periods ending July 31, 2020.
The Board also considered Management's responsiveness to the Fund's relative performance. In this regard, the Board noted that performance, especially short-term performance, is only one of the factors that it deems relevant to its consideration of the Agreement and that, after considering all relevant factors, it determined to approve the continuation of the Agreement.
Fee Rates, Profitability, and Fall-out Benefits
With respect to the overall fairness of the Agreement, the Board considered the fee structure for the Fund under the Agreement as compared to the Expense Group provided by the consulting firm, as discussed above. The Board reviewed a comparison of the Fund's management fee to its Expense Group. The Board noted that the comparative management
38
fee analysis includes, in the Fund's management fee, the separate administrative fees paid to Management. However, the Board noted that some funds in the Expense Group pay directly from fund assets for certain services that Management covers out of the administration fees for the Fund. Accordingly, the Board also considered the Fund's total expense ratio as compared with its Expense Group as a way of taking account of these differences.
The Board compared the Fund's contractual and actual management fees to the median of the contractual and actual management fees, respectively, of the Fund's Expense Group. (The actual management fees are the contractual management fees reduced by any fee waivers or other adjustments.) The Board also compared the Fund's total expenses to the median of the total expenses of the Fund's Expense Group. The Board noted that the Fund's total expenses were higher than the Expense Group median, and considered whether specific portfolio management, administration or oversight needs contributed to the Fund's total expenses. With respect to the quintile rankings for fees and total expenses (net of waivers or other adjustments, if any) for the Fund compared to its Expense Group, the first quintile represents the lowest fees and/or total expenses and the fifth quintile represents the highest fees and/or total expenses. For fee comparisons, the Board looked at the Fund's Class S as a proxy for both of the Fund's classes.
The Board considered that, as compared to its Expense Group, the Fund's contractual management fee and total expenses each ranked in the third quintile and the actual management fee net of fees waived by Management ranked in the first quintile.
In addition to considering the above-referenced factors, the Board took note of its ongoing dialogue with Management regarding the dynamics of the insurance/annuity marketplace. The Board considered, among other matters, related tax restrictions and the unique challenges facing that market generally, which assisted the Board in understanding the context for the Fund's expense ratio and performance.
In concluding that the benefits accruing to Management and its affiliates by virtue of their relationship with the Fund were reasonable in light of the costs of providing the investment advisory and other services and the benefits accruing to the Fund, the Board reviewed specific data as to Management's estimated loss on the Fund for a recent period on a pre-tax basis without regard to distribution expenses, including year-over-year changes in each of Management's reported expense categories. (The Board also reviewed data on Management's estimated loss on the Fund after distribution/servicing expenses and taxes were factored in, as indicators of the health of the business and the extent to which Management is directing its profits into the growth of the business. The Board noted that when distribution expenses and taxes were considered, Management experienced a loss on the Fund.) The Board considered the cost allocation methodology that Management used in developing its estimated profitability figures. In recent years, the Board engaged an independent forensic accountant to review the profitability methodology utilized by Management when preparing this information and discussed with the consultant its conclusion that Management's process for calculating and reporting its estimated loss was not unreasonable.
Recognizing that there is no uniform methodology regarding the allocation of firm-wide or complex-wide expenses within the asset management industry for determining profitability for this purpose and that the use of different reasonable methodologies can give rise to different profit and loss results, the Board, in recent years, requested from Management examples of profitability calculated by different methods and noted that the estimated profitability levels were still reasonable when calculated by these other methods. The Board further noted Management's representation that its estimate of profitability is derived using methodology that is consistent with the methodology used to assess and/or report measures of profitability elsewhere at the firm. In addition, the Board recognized that Management's calculations regarding its costs may not reflect all risks, including regulatory, legal, operational, reputational, and, where appropriate, entrepreneurial risks, associated with offering and managing a mutual fund in the current regulatory and market environment. The Board also considered any fall-out (i.e., indirect) benefits likely to accrue to Management or its affiliates from their relationship with the Fund, such as research it may receive from broker-dealers executing the Funds' portfolio transactions on an agency basis. The Board noted that Management incurred a loss on its management of the Fund during the review period even before consideration of distribution expenses and taxes.
39
Information Regarding Services to Other Clients
The Board also considered other funds and separate accounts that were advised or sub-advised by Management or its affiliates with investment objectives, policies and strategies that were similar to those of the Fund, and compared the fees charged to the Fund to the fees charged to such comparable funds and separate accounts. The Board considered the appropriateness and reasonableness of any differences between the fees charged to a Fund and such comparable funds and/or separate accounts, and determined that differences in fees and fee structures were consistent with the differences in the management and other services provided. The Board explored with Management its assertion that although, generally, the rates of fees paid by such accounts, except other Neuberger Berman mutual funds, were lower than the fee rates paid by the corresponding Fund, the differences reflected Management's greater level of responsibilities and significantly broader scope of services regarding the Fund, the more extensive regulatory obligations and risks associated with managing the Fund, and other financial considerations with respect to creation and sponsorship of the Fund.
Economies of Scale
The Board also evaluated apparent or anticipated economies of scale in relation to the services Management provides to the Fund. The Board considered that the Fund's fee structure does not provide for a reduction of payments resulting from the use of breakpoints, and concluded that the lack of breakpoints was reasonable based on the consideration that setting competitive fee rates and pricing the Fund to scale are other means of sharing potential economies of scale with shareholders. In addition, the Board considered the expense limitation and/or fee waiver arrangements that reduces Fund expenses at all asset levels which can have an effect similar to breakpoints in sharing economies of scale with shareholders and provide protection from an increase in expenses if the Fund's assets decline. The Board also considered that Management has provided, at no added cost to the Fund, certain additional services, including but not limited to, services required by new regulations or regulatory interpretations, services impelled by changes in the securities markets or the business landscape, and/or services requested by the Board. The Board considered that this is a way of sharing economies of scale with the Fund and its shareholders.
Conclusions
In approving the continuation of the Agreement, the Board concluded that, in its business judgment, the terms of the Agreement are fair and reasonable to the Fund and that approval of the continuation of the Agreement is in the best interests of the Fund and its shareholders. In reaching this determination, the Board considered that Management could be expected to continue to provide a high level of service to the Fund; that the Board retained confidence in Management's capabilities to manage the Fund; that the Fund's fee structure appeared to the Board to be reasonable given the nature, extent, and quality of services provided or the Fund's relatively small size; and that the benefits accruing to Management and its affiliates by virtue of their relationship with the Fund were reasonable in light of the costs of providing the investment advisory and other services and the benefits accruing to the Fund. The Board's conclusions may be based in part on its consideration of materials prepared in connection with the approval or continuance of the Agreement in prior years and on the Board's ongoing regular review of Fund performance and operations throughout the year, in addition to material prepared specifically for the most recent annual review of the Agreement.
40