Neuberger Berman
Advisers Management Trust
U.S. Equity Index PutWrite Strategy Portfolio
(Formerly Absolute Return Multi-Manager Portfolio)
S Class Shares
Annual Report
December 31, 2017
U.S. Equity Index PutWrite Strategy Portfolio Commentary* (Unaudited)
The Neuberger Berman Advisers Management Trust (AMT) U.S. Equity Index PutWrite Strategy Portfolio (formerly, AMT Absolute Return Multi-Manager Portfolio) Class S generated a total return of 6.68% for the 12 months ended December 31, 2017, trailing the 10.38% total return of its primary benchmark, a blend of 85% CBOE S&P 500® PutWrite Index and 15% CBOE Russell 2000® PutWrite Index (Blended Index), for the same period.
On May 1, 2017, the AMT Absolute Return Multi-Manager Portfolio was converted to the AMT U.S. Equity Index PutWrite Strategy Portfolio and is now managed by the Neuberger Berman Option Group, led by Senior Portfolio Manager, Derek Devens. Effective on that date, the Fund began comparing its performance to the Blended Index rather than the HFRX Global Hedge Fund Index to correspond with the Fund's revised investment goals and principal investment strategies. For the period from May 1, 2017 through December 31, 2017, the Fund had a total return of 5.66%, outperforming the Blended Index, which returned 5.32% for the same period. For the full year, the Fund returned 6.68% which exceeded the HFRX Global Hedge Fund Index return of 5.99%, which was the Fund's primary benchmark prior to May 1, 2017.
The Fund's investment strategy seeks to collect index put option premiums and hold a fixed income portfolio, typically consisting of cash and limited duration U.S. Treasury Notes that 'collateralizes' the short index put option positions, if necessary. The market value of the Fund's fixed income portfolio is generally equal to the short index put option portfolio's aggregate notional value, rendering the strategy unlevered.
Despite historically low levels of option implied volatility in 2017, put option premiums provided ample cash flow to capture a reasonable share of the gains posted by the underlying equity indexes. For the period from May 1, 2017 through December 31, 2017, relative to the underlying equity exposures, the Fund captured roughly 40 to 50% of the total returns of the S&P 500® Index (S&P 500) and the Russell 2000® Index, which returned 13.7% and 10.7% respectively.
In 2017, the S&P 500 went an unprecedented 12 for 12, posting 12 consecutive months of positive total returns to accumulate a 21.83% total return. Since 1927, there have only been 5 years with 11 positive monthly returns ('50, '58, '64, '95, '06), and no perfect years until 2017. Further, it did so with an annualized daily volatility of 6.8%. So, whether you pronounce beta as 'bey-tuh' or 'bee-tuh', in 2017 it was just simply 'bet-tuhr' than everything else. Hence, the Fund's lower beta equity strategy, which can experience diminishing equity exposure during sharply rising markets, generally has a hard time keeping up when underlying equity indexes rally. In conjunction with a trending S&P 500, volatility was scarce. As performance during volatility is one of the more common concerns we hear about the Fund's investment strategy from prospective investors, 2017's historically low volatility delivered a great environment to illustrate how the Fund's strategy can perform in such a market. 2017 had the lowest average calendar year daily Volatility Index (VIX) level in its history at around 11.1. In addition, as of December 31, 2017, the 2017 average was also the lowest average versus rolling 252-day periods over the VIX's full history. Further, in 2017 the VIX experienced its third lowest daily standard deviation (1.36 volatility points) for a calendar year since its inception in 1990. Only in 1993 and 1995 was the VIX's standard deviation lower over a calendar year, at 1.33 and 0.97, respectively.
The two sources of the Fund's returns, interest income and option premium, accrue to Fund investors every day. Obviously, over the past few years capital appreciation in equity markets has consistently outpaced the combined accrual rate. However, over long periods of time, we believe that it is hard to "out run" the risk-efficient compounding of the Fund's investment approach. With the U.S. Federal Reserve widely believed to continue to increase short-term interest rates and equity markets in our opinion likely already pricing in expectations for tax reform and economic growth, we anticipate 2018 to be a less perfect, more uncertain year in equity markets than 2017.
Sincerely,
DEREK DEVENS
PORTFOLIO MANAGER
* Effective May 1, 2017, Absolute Return Multi-Manager Portfolio changed its name to U.S. Equity Index PutWrite Strategy Portfolio.
Information about principal risks of investing in the Fund is set forth in the prospectus and statement of additional information.
The portfolio composition, industries and holdings of the Fund are subject to change without notice.
The opinions expressed are those of the Fund's portfolio manager. The opinions are as of the date of this report and are subject to change without notice.
1
U.S. Equity Index PutWrite Strategy Portfolio (Unaudited)
PORTFOLIO BY TYPE OF SECURITY
(as a % of Total Net Assets) | |
Common Stocks | | | 0.0 | % | |
Corporate Bonds | | | 0.0 | | |
Loan Assignments | | | 0.0 | | |
Rights | | | 0.0 | | |
U.S. Government Agency Securities | | | 50.4 | | |
U.S. Treasury Obligations | | | 42.4 | | |
Warrants | | | 0.0 | | |
Put Options Written | | | (0.7 | ) | |
Short-Term Investments | | | 7.5 | | |
Other Assets Less Liabilities | | | 0.4 | * | |
Total | | | 100.0 | % | |
* Percentage includes appreciation from swaps.
PERFORMANCE HIGHLIGHTS1
| | | Inception | | Average Annual Total Return
Ended 12/31/2017 | |
| | | Date | | 1-Year | | Life of Fund | |
U.S. Equity Index PutWrite
Strategy Portfolio Class S* | | 05/01/2014 | | | 6.68 | % | | | 0.17 | % | |
85% CBOE S&P 500® PutWrite Index/
15% CBOE Russell 2000® PutWrite Index2,3 | | | | | | | 10.38 | % | | | 7.42 | % | |
| HFRX® Global Hedge Fund Index2,3 | | | | | | | 5.99 | % | | | 0.99 | % | |
| S&P 500® Index2,3 | | | | | | | 21.83 | % | | | 12.33 | % | |
Bloomberg Barclays U.S.
Aggregate Bond Index2,3 | | | | | | | 3.54 | % | | | 2.69 | % | |
* Prior to May 1, 2017, the Fund had different investment goals, fees and expenses, principal investment strategies and portfolio managers. Please also see Endnote 1.
The performance data quoted represent past performance and do not indicate future results. Current performance may be lower or higher than the performance data quoted. For performance data current to the most recent month-end, please visit http://www.nb.com/amtportfolios/performance.
The results shown in the table reflect the reinvestment of income dividends and other distributions, if any. The results do not reflect the effect of taxes a shareholder would pay on Fund distributions or on the redemption of Fund shares. The results do not reflect fees and expenses of the variable annuity and variable life insurance policies or the qualified pension and retirement plans whose proceeds are invested in the Fund.
The investment return and principal value of an investment will fluctuate and shares, when redeemed, may be worth more or less than their original cost.
Returns would have been lower if Neuberger Berman Investment Advisers LLC ("NBIA" or "Management") had not reimbursed certain expenses and/or waived a portion of the investment management fees during certain of the periods shown. Repayment by a class (of expenses previously reimbursed and/or fees previously waived by Management) will decrease the class's returns. Please see Note B in the Notes to Financial Statements for specific information regarding expense reimbursement and/or fee waiver arrangements.
As stated in the Fund's most recent prospectus, the estimated total annual operating expense ratios for fiscal year 2017 is 2.57% for Class S shares (before expense reimbursements and/or fee waivers, if any). The estimated total annual operating expense ratio for fiscal year 2017 is 1.05% for Class S shares after expense reimbursements and/or fee waivers. The expense ratios for the annual period ended December 31, 2017 can be found in the Financial Highlights section of this report.
COMPARISON OF A $10,000 INVESTMENT
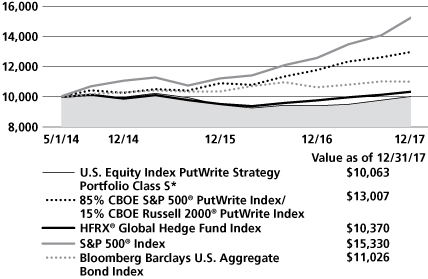
This graph shows the change in value of a hypothetical $10,000 investment in the Fund over the past 10 fiscal years, or since the Fund's inception if it has not operated for 10 years. The result is compared with benchmarks, which include a broad-based market index and may include a more narrowly based index. The HFRX Global Hedge Fund Index does take into account fees and expenses, but not tax consequences, of investing since it is based on the underlying hedge funds' net returns. The other indices described in this report do not take into account any fees, expenses or tax consequences of investing in the individual securities that they track. The results shown in the graph reflect the reinvestment of income dividends and other distributions, if any. The results do not reflect the effect of taxes a shareholder would pay on Fund distributions or on the redemption of Fund shares. The results do not reflect fees and expenses of the variable annuity and variable life insurance policies or the qualified pension and retirement plans whose proceeds are invested in the Fund. Results represent past performance and do not indicate future results.
Please see Endnotes for additional information.
2
1 The Fund was relatively small prior to December 31, 2014, which could have impacted Fund performance. The same techniques used to produce returns in a small fund may not work to produce similar returns in a larger fund. Effective May 1, 2017, Absolute Return Multi-Manager Portfolio changed its name to the U.S. Equity Index PutWrite Strategy Portfolio and changed its investment goal, fees and expenses, principal investment strategies, risks and portfolio managers. Prior to that date, the Fund had a higher management fee, different expenses, and a different goal and principal investment strategies, which included a multi-manager strategy, and risks. Its performance prior to that date might have been different if the current fees and expenses, goal, and principal investment strategies had been in effect.
2 The date used to calculate Life of Fund performance for the index is May 1, 2014, the Fund's commencement of operations. Effective May 1, 2017, the Fund began comparing its performance to the 85% CBOE S&P 500® PutWrite Index and 15% CBOE Russell 2000® PutWrite Index rather than the HFRX Global Hedge Fund Index to correspond with the Fund's revised principal investment strategy, as discussed in Endnote 1 above and Note A in the Notes to Financial Statements.
3 The 85% CBOE S&P 500 PutWrite Index and 15% CBOE Russell 2000 PutWrite Index is a blended index composed of 85% CBOE S&P 500 PutWrite Index and 15% CBOE Russell 2000 PutWrite Index, and is rebalanced monthly. The CBOE S&P 500 PutWrite Index tracks the value of a passive investment strategy which consists of overlaying S&P 500 (SPX) short put options over a money market account invested in one- and three-months Treasury bills. The SPX puts are struck at-the-money and are sold on a monthly basis. The CBOE Russell 2000 PutWrite Index tracks the value of a passive investment strategy which consists of overlaying Russell 2000 (RUT) short put options over a money market account invested in one-month Treasury bills. The RUT puts are struck at-the-money and are sold on a monthly basis. The HFRX Global Hedge Fund Index is designed to be representative of the overall composition of the hedge fund universe. It is comprised of all eligible hedge fund strategies; including but not limited to convertible arbitrage, distressed securities, equity hedge, equity market neutral, event driven, macro, merger arbitrage, and relative value arbitrage. The strategies are asset weighted based on the distribution of assets in the hedge fund industry. Constituent funds for each HFRX Index are selected from an eligible pool of the more than 7,500 funds worldwide that report to the Hedge Fund Research (HFR) Database. Constituent funds must meet all of the following criteria: report monthly; report performance net of all fees; be U.S. dollar denominated; be active and accepting new investments; have a minimum 24 months track record; and the fund's manager must have at least $50 million in assets under management. The HFRX Index is rebalanced quarterly. The Bloomberg Barclays U.S. Aggregate Bond Index measures the investment grade, U.S. dollar-denominated, fixed-rate, taxable bond market and includes Treasuries, government-related and corporate securities, mortgage-backed securities (MBS) (agency fixed-rate and hybrid adjustable rate mortgage (ARM) pass-throughs), asset-backed securities (ABS), and commercial mortgage-backed securities (CMBS) (agency and non-agency). The S&P 500® Index is a float-adjusted market capitalization-weighted index that focuses on the large-cap segment of the U.S. equity market, and includes a significant portion of the total value of the market. Please note that individuals cannot invest directly in any index. The HFRX Global Hedge Fund Index does take into account fees and expenses, but not tax consequences, of investing since it is based on the underlying hedge funds' net returns. The other indices described in this report do not take into account any fees, expenses or tax consequences of investing in the individual securities that they track. Data about the performance of an index are prepared or obtained by Neuberger Berman Investment Advisers LLC* ("Management") and reflect the reinvestment of income dividends and other distributions, if any. The Fund may invest in securities not included in a described index and generally does not invest in all securities included in a described index.
* On January 1, 2016, Neuberger Berman Management LLC ("NBM") transferred to Neuberger Berman Fixed Income LLC ("NBFI") its rights and obligations pertaining to all services it provided to the Fund under any investment management, and/or administration agreement, as applicable (the "Agreements"). Following such transfer, NBFI was renamed NBIA. In addition, on the date of the transfer, the services previously provided by NB
3
Alternative Investment Management LLC ("NBAIM") are provided by NBIA. Following the consolidation, the investment professionals of NBM and NBAIM who provided services to the Fund under the Agreements continue to provide the same services, except that they provide those services in their new capacities as investment professionals of NBIA. Further, the consolidation did not result in any change in the investment processes employed by the Fund, the nature or level of services provided to the Fund, or the fees the Fund pays under its Agreements.
On July 1, 2016, NBM was reorganized into Neuberger Berman LLC ("Neuberger Berman") (the "Reorganization"). Upon the completion of the Reorganization, Neuberger Berman assumed all rights and obligations pertaining to all services NBM provided to the Fund under any distribution agreement or distribution and services agreement (the "Agreements") or plan adopted pursuant to Rule 12b-1 under the Investment Company Act of 1940, as amended, (the "Plans"). Accordingly, after the Reorganization, Neuberger Berman became the Fund's distributor and the services previously provided by NBM under the Agreements and Plans are provided by Neuberger Berman.
Following the Reorganization, the employees of NBM provide the same services to the Fund under the Agreements and Plans, except that they provide those services in their capacities as employees of Neuberger Berman. Further, the Reorganization did not result in any change in the nature or level of services provided to the Fund, or the fees, if any, the Fund pays under the Agreements or the Plans.
On January 1, 2017, the Fund's distributor, Neuberger Berman, changed its name to Neuberger Berman BD LLC.
The investments for the Fund are managed by the same portfolio manager(s) who manage one or more other registered funds that have names, investment objectives and investment styles that are similar to those of the Fund.
You should be aware that the Fund is likely to differ from those other mutual fund(s) in size, cash flow pattern and tax matters. Accordingly, the holdings and performance of the Fund can be expected to vary from those of the other mutual fund(s).
Shares of the separate Neuberger Berman Advisers Management Trust Portfolios, including the Fund, are not available to the general public. Shares of the Fund may be purchased only by life insurance companies to be held in their separate accounts, which fund variable annuity and variable life insurance policies, and by qualified pension and retirement plans.
Statistics and projections in this report are derived from sources deemed to be reliable but cannot be regarded as a representation of future results of the Fund. This report is prepared for the general information of shareholders and is not an offer of shares of the Fund. Shares are sold only through the currently effective prospectus, which you can obtain by calling 877.628.2583.
The "Neuberger Berman" name and logo and "Neuberger Berman Investment Advisers LLC" name are registered service marks of Neuberger Berman Group LLC. The individual Fund name in this piece is either a service mark or registered service mark of Neuberger Berman Investment Advisers LLC , an affiliate of Neuberger Berman BD LLC, distributor, member FINRA.
© 2018 Neuberger Berman BD LLC, distributor. All rights reserved.
4
Information About Your Fund's Expenses (Unaudited)
As a Fund shareholder, you incur two types of costs: (1) transaction costs such as fees and expenses that are, or may be, imposed under your variable contract or qualified pension plan; and (2) ongoing costs, including management fees, distribution and/or service (12b-1) fees (if applicable), and other Fund expenses. This example is intended to help you understand your ongoing costs (in U.S. dollars) of investing in the Fund and compare these costs with the ongoing costs of investing in other mutual funds.
This table is designed to provide information regarding costs related to your investments. The following examples are based on an investment of $1,000 made at the beginning of the six month period ended December 31, 2017 and held for the entire period. The table illustrates the Fund's costs in two ways:
Actual Expenses and Performance: | | The first section of the table provides information about actual account values and actual expenses in dollars, based on the Fund's actual performance during the period indicated. You may use the information in this line, together with the amount you invested, to estimate the expenses you paid over the period. Simply divide your account value by $1,000 (for example, an $8,600 account value divided by $1,000 = 8.6), then multiply the result by the number in the first section of the table under the heading entitled "Expenses Paid During the Period" to estimate the expenses you paid over the period. | |
Hypothetical Example for
Comparison Purposes: | | The second section of the table provides information about hypothetical account values and hypothetical expenses based on the Fund's actual expense ratio and an assumed rate of return at 5% per year before expenses. This return is not the Fund's actual return. The hypothetical account values and expenses may not be used to estimate the actual ending account balance or expenses you paid for the period. You may use this information to compare the ongoing costs of investing in this Fund versus other funds. To do so, compare the expenses shown in this 5% hypothetical example with the 5% hypothetical examples that appear in the shareholder reports of other funds. | |
Please note that the expenses in the table are meant to highlight your ongoing costs only and do not include any transaction costs, such as fees and expenses that are, or may be imposed under your variable contract or qualified pension plan. Therefore, the information under the heading "Hypothetical (5% annual return before expenses)" is useful in comparing ongoing costs only, and will not help you determine the relative total costs of owning different funds. In addition, if these transaction costs were included, your costs would have been higher.
NEUBERGER BERMAN ADVISERS MANAGEMENT TRUST U.S. EQUITY INDEX PUTWRITE STRATEGY PORTFOLIO
| Actual | | Beginning Account
Value
7/1/2017 | | Ending Account
Value
12/31/2017 | | Expenses Paid
During the Period
7/1/2017 – 12/31/2017 | |
Class S | | $ | 1,000.00 | | | $ | 1,043.20 | | | $ | 5.46 | (a) | |
Hypothetical (5% annual return before expenses) | |
Class S | | $ | 1,000.00 | | | $ | 1,019.86 | | | $ | 5.40 | (b) | |
(a) Expenses are equal to the annualized expense ratio of 1.06%, multiplied by the average account value over the period, multiplied by 184/365 (to refelect the one-half year period shown).
(b) Hypothetical expenses are equal to the annualized expense ratio of 1.06%, multiplied by the average account value over the period (assuming a 5% annual return), multiplied by 184/365 (to reflect the one-half year period shown).
5
Schedule of Investments U.S. Equity Index PutWrite Strategy Portfolio# December 31, 2017
PRINCIPAL AMOUNT | | | | VALUE | |
U.S. Government Agency Securities 50.4% | | | |
$ | 1,000,000
| | | Federal Agricultural
Mortgage Corp.
1.64%, 4/17/2020 | | $ | 989,829
| | |
| 1,000,000
| | | FFCB
1.18%, 10/18/2019 | | | 985,858
| | |
| 1,500,000
| | | FHLB
1.00%, 9/26/2019 | | | 1,476,549
| | |
| 1,700,000
| | | FHLMC
1.50%, 1/17/2020 | | | 1,683,690
| | |
| 1,000,000
| | | FNMA
1.75%, 6/20/2019 | | | 998,133
| | |
| | | | | Total U.S. Government Agency Securities
(Cost $6,194,377) | | | 6,134,059
| | |
U.S. Treasury Obligations 42.4% | | | |
| | | | | U.S. Treasury Notes | | | | | |
| | 1,000,000 | | | 1.00%, 3/15/2019(a) | | | 989,912 | | |
| | 200,000 | | | 0.88%, 6/15/2019 | | | 197,189 | | |
| | 2,000,000 | | | 1.63%, 3/15/2020(a)(b) | | | 1,987,565 | | |
| | 2,000,000 | | | 1.63%, 6/30/2020(a) | | | 1,985,013 | | |
| | | | | Total U.S. Treasury Obligations
(Cost $5,208,653) | | | 5,159,679
| | |
SHARES | | | | | |
Common Stocks 0.0% | | | |
Capital Markets 0.0% | | | |
| 3,261 |
| | Aretec Group, Inc.,
Class A*(f)(g)(h)(i) | | | — | | |
Independent Power and Renewable Electricity Producers 0.0% | | | |
| | 312 | | | TerraForm Power, Inc. | | | 3,732 | | |
Semiconductors & Semiconductor Equipment 0.0% | | | |
| 312 |
| | SunEdison, Inc. Reorganized
Equity*(f)(g)(h) | | | — | | |
| | | | | Total Common Stocks
(Cost $35,196) | | | 3,732
| | |
NO. OF RIGHTS | | | | | |
| Rights 0.0%(c) | | | |
| Biotechnology 0.0%(c) | | | |
| 500 |
| | Chelsea Therapeutics, Inc.
Escrow (H Lundbeck A/S),
CVR (Denmark)*(f)(g)(h) | | | — | | |
| | 500 | | | Dyax Corp., CVR*(f)(g)(h) | | | 555 | | |
| 225 |
| | Tobira Therapeutics, Inc.,
CVR*(f)(g)(h) | | | 14 | | |
| | | | 569 | | |
NO. OF RIGHTS | | | | VALUE | |
| Food & Staples Retailing 0.0%(c) | | | |
| | 1,000 |
| | Safeway, Inc. (Casa Ley),
CVR*(f)(h) | | | $ 535 | | |
| 1,000 |
| | Safeway, Inc. (Property
Development Centers),
CVR*(f)(g)(h) | | | — | | |
| | | | 535 | | |
| Health Care Providers & Services 0.0%(c) | | | |
| 204
| | | Community Health
Systems, Inc., CVR* | | | 1
| | |
Media 0.0% | | | |
| | 2,550 | | | Media General, Inc., CVR*(f)(g)(h) | | | — | | |
| | | | | Total Rights
(Cost $7,443) | | | 1,105
| | |
NO. OF WARRANTS | | | | | |
Warrants 0.0% | | | |
Biotechnology 0.0% | | | |
| 11,740 |
| | Novelion Therapeutics,
Inc.*(f)(g)(h)
(Cost $—) | | | — | | |
PRINCIPAL AMOUNT | | | | | |
| Loan Assignments 0.0%(c) | | | |
| Semiconductors & Semiconductor Equipment 0.0%(c) | | | |
$ | 1,623
| | | SunEdison, Inc., 2nd Lien
Term Loan A2 (LIBOR USD
3 Month + 10.00%),
0.00%, 7/2/2018(d)(e)(f)(g)
(Cost $1,124) | | | 714
| | |
Corporate Bonds 0.0% | | | |
Oil, Gas & Consumable Fuels 0.0% | | | |
| 18,000
| | | Midstates Petroleum Co., Inc.
Escrow 10.00%,
6/1/2020(e)(f)(g)(h)
(Cost $—) | | | —
| | |
See Notes to Financial Statements
6
Schedule of Investments U.S. Equity Index PutWrite Strategy Portfolio#(cont'd)
SHARES | | | | VALUE | |
Short-Term Investments 7.5% | | | |
Investment Company 7.5% | | | |
| 914,238 |
| | Invesco Government &
Agency Portfolio,
Institutional Class, 1.22%(j)
(Cost $914,238) | | $ | 914,238 | | |
| | | | Total Investments 100.3%
(Cost $12,361,031) | | | 12,213,527 | | |
| | | | | Liabilities Less Other Assets (0.3%)(k) | | | (45,758 | ) | |
| | | | | Net assets 100.0% | | $ | 12,167,769 | | |
# Effective May 1, 2017. Formerly, Absolute Return Multi-Manager Portfolio through April 30, 2017.
* Non-income producing security.
(a) All or a portion of this security is pledged with the custodian for options written.
(b) All or a portion of this security is segregated in connection with obligations for swaps and/or options written with a total value of $1,987,565.
(c) Represents less than 0.05% of net assets.
(d) Variable or floating rate security. The interest rate shown was the current rate as of December 31, 2017 and changes periodically.
(e) Defaulted security.
(f) Illiquid security.
(g) Security fair valued as of December 31, 2017 in accordance with procedures approved by the Board of Trustees. Total value of all such securities at December 31, 2017 amounted to $1,283, which represents 0.0% of net assets of the Fund.
(h) Value determined using significant unobservable inputs.
(i) Issuer filed for bankruptcy.
(j) Represents 7-day effective yield as of December 31, 2017.
(k) Includes the impact of the Fund's open positions in derivatives at December 31, 2017.
Abbreviations
CVR Contingent Value Rights
FFCB Federal Farm Credit Bank
FHLB Federal Home Loan Bank
FHLMC Federal Home Loan Mortgage Corp.
FNMA Federal National Mortgage Association
LIBOR London Interbank Offered Rate
See Notes to Financial Statements
7
Schedule of Investments U.S. Equity Index PutWrite Strategy Portfolio#(cont'd)
Derivative Instruments
Futures contracts ("futures")
For the year ended December 31, 2017, the average notional value of futures for the Fund was $(548,449) for short positions.
At December 31, 2017, there were no open positions in futures for the Fund.
Forward foreign currency contracts ("forward contracts")
For the year ended December 31, 2017, the average notional value of forward contracts for the Fund was $376,418.
At December 31, 2017, there were no open forward contracts for the Fund.
Equity swap contracts ("equity swaps")
At December 31, 2017, the Fund had outstanding equity swaps* as follows:
Counterparty | | Description | | Maturity
Dates | | Absolute
Notional
Value | | Net Unrealized
Appreciation/
(Depreciation) | | Financing
Costs
and Other
Receivables/
(Payables) | | Value | |
JPMorgan Chase
Bank, NA
| | The Fund receives the total return, and pays
floating rates plus or minus a spread on a
portfolio of long positions. The Fund pays the
total return, and receives floating rates plus
or minus a spread on a portfolio of short
positions. The specified spreads range
from 0.00% to 0.35%. The payments/receipts,
based on the specified benchmark floating
rates (see table below), are denominated in
various foreign currencies based on the local
currencies of the positions within the swaps.
Payments will be made, if any, at maturity. | | 2/2/2018-
5/11/2018 | | $ | 1,609 | | | $ | 1,609 | | | $ | — | | | $ | 1,609 | | |
* The following table represents required component disclosures associated with the equity swaps as of December 31, 2017.
Reference Entity | | Shares | | Notional
Amount(a) | | Net Unrealized
Appreciation/
(Depreciation) | |
Long Positions | |
United States | |
Safeway, Inc. (Casa Ley), CVR | | | 3,007 | | | $ | 1,609 | | | $ | 1,609 | (b)(c) | |
Safeway, Inc. (Property Development Centers), CVR | | | 3,007 | | | | — | | | | — | (b)(c)(d)(e) | |
Total Long Positions of Equity Swaps JPMorgan Chase Bank, NA | | | | | | $ | 1,609 | | |
(a) For the year ended December 31, 2017, the average notional value of equity swaps for the Fund was $315,992 for long positions and $(645,710) for short positions.
(b) Illiquid security.
(c) Value determined using significant unobservable input.
(d) Security fair valued as of December 31, 2017 in accordance with procedures approved by the Board of Trustees.
(e) Amount less than one dollar.
See Notes to Financial Statements
8
Schedule of Investments U.S. Equity Index PutWrite Strategy Portfolio#(cont'd)
Benchmark Floating Rates | | Value at
Period End | |
LIBOR (USD)—London Interbank Offered Rate | | | 1.56 | % | |
Written option contracts ("options written")
At December 31, 2017, the Fund had outstanding options written as follows:
Description | | Number of
Contracts | | Notional
Amount | | Exercise
Price | | Expiration
Date | | Value | |
Puts | |
Index Funds | |
Russell 2000 Index | | | 1 | | | $ | (153,551 | ) | | $ | 1505 | | | 1/5/2018 | | $ | (285 | ) | |
Russell 2000 Index | | | 1 | | | | (153,551 | ) | | | 1,525 | | | 1/5/2018 | | | (685 | ) | |
Russell 2000 Index | | | 1 | | | | (153,551 | ) | | | 1,545 | | | 1/5/2018 | | | (1,640 | ) | |
Russell 2000 Index | | | 1 | | | | (153,551 | ) | | | 1,505 | | | 1/12/2018 | | | (645 | ) | |
Russell 2000 Index | | | 1 | | | | (153,551 | ) | | | 1,525 | | | 1/12/2018 | | | (1,160 | ) | |
Russell 2000 Index | | | 2 | | | | (307,102 | ) | | | 1,540 | | | 1/19/2018 | | | (4,170 | ) | |
Russell 2000 Index | | | 1 | | | | (153,551 | ) | | | 1,545 | | | 1/19/2018 | | | (2,330 | ) | |
Russell 2000 Index | | | 3 | | | | (460,653 | ) | | | 1,545 | | | 1/26/2018 | | | (7,980 | ) | |
S&P 500 Index | | | 3 | | | | (802,083 | ) | | | 2,640 | | | 1/5/2018 | | | (975 | ) | |
S&P 500 Index | | | 2 | | | | (534,722 | ) | | | 2,650 | | | 1/5/2018 | | | (880 | ) | |
S&P 500 Index | | | 2 | | | | (534,722 | ) | | | 2,655 | | | 1/5/2018 | | | (1,020 | ) | |
S&P 500 Index | | | 2 | | | | (534,722 | ) | | | 2,680 | | | 1/5/2018 | | | (2,780 | ) | |
S&P 500 Index | | | 1 | | | | (267,361 | ) | | | 2,650 | | | 1/12/2018 | | | (923 | ) | |
S&P 500 Index | | | 3 | | | | (802,083 | ) | | | 2,655 | | | 1/12/2018 | | | (3,069 | ) | |
S&P 500 Index | | | 2 | | | | (534,722 | ) | | | 2,665 | | | 1/12/2018 | | | (2,400 | ) | |
S&P 500 Index | | | 4 | | | | (1,069,444 | ) | | | 2,670 | | | 1/12/2018 | | | (5,400 | ) | |
S&P 500 Index | | | 3 | | | | (802,083 | ) | | | 2,680 | | | 1/19/2018 | | | (6,105 | ) | |
S&P 500 Index | | | 2 | | | | (534,722 | ) | | | 2,685 | | | 1/19/2018 | | | (4,490 | ) | |
S&P 500 Index | | | 5 | | | | (1,336,805 | ) | | | 2,690 | | | 1/19/2018 | | | (12,425 | ) | |
S&P 500 Index | | | 10 | | | | (2,673,610 | ) | | | 2,680 | | | 1/26/2018 | | | (23,750 | ) | |
Total options written (premium received $98,726) | | | | | | | | | | $ | (83,112 | ) | |
For the year ended December 31, 2017, the Fund had an average notional value of $13,085 in options purchased, and $(46,030) in options written. At December 31, 2017, the Fund had pledged securities in the amount of $3,474,315 to cover collateral requirements for options written.
See Notes to Financial Statements
9
Schedule of Investments U.S. Equity Index PutWrite Strategy Portfolio#(cont'd)
The following is a summary, categorized by Level (see Note A of Notes to Financial Statements), of inputs used to value the Fund's investments as of December 31, 2017:
Asset Valuation Inputs
| | Level 1 | | Level 2 | | Level 3* | | Total | |
Investments: | |
U.S. Government Agency Securities | | $ | — | | | $ | 6,134,059 | | | $ | — | | | $ | 6,134,059 | | |
U.S. Treasury Obligations | | | — | | | | 5,159,679 | | | | — | | | | 5,159,679 | | |
Common Stocks | |
Capital Markets | | | — | | | | — | | | | — | (b) | | | — | (b) | |
Semiconductors & Semiconductor Equipment | | | — | | | | — | | | | — | (b) | | | — | (b) | |
| Other Common Stocks(a) | | | 3,732 | | | | — | | | | — | | | | 3,732 | | |
Total Common Stocks | | | 3,732 | | | | — | | | | — | (b) | | | 3,732 | | |
Rights | |
Biotechnology | | | — | | | | — | | | | 569 | | | | 569 | | |
Food & Staples Retailing | | | — | | | | — | | | | 535 | | | | 535 | | |
Media | | | — | | | | — | | | | — | (b) | | | — | (b) | |
| Other Rights(a) | | | 1 | | | | — | | | | — | | | | 1 | | |
Total Rights | | | 1 | | | | — | | | | 1,104 | | | | 1,105 | | |
| Loan Assignments(a) | | | — | | | | — | | | | 714 | | | | 714 | | |
| Corporate Bonds(a) | | | — | | | | — | | | | — | (b) | | | — | (b) | |
| Warrants(a) | | | — | | | | — | | | | — | (b) | | | — | (b) | |
Short-Term Investments | | | — | | | | 914,238 | | | | — | | | | 914,238 | | |
Total Long Positions | | $ | 3,733 | | | $ | 12,207,976 | | | $ | 1,818 | | | $ | 12,213,527 | | |
(a) The Schedule of Investments provides information on the industry categorization for the portfolio.
(b) Amount less than one dollar.
* The following is a reconciliation between the beginning and ending balances of investments in which unobservable inputs (Level 3) were used in determining value:
| | | Beginning
balance as
of 1/1/2017 | | Accrued
discounts/
(premiums) | | Realized
gain/loss
and change
in unrealized
appreciation/
(depreciation) | | Purchases | | Sales | | Transfers
into
Level 3 | | Transfers
out of
Level 3 | | Balance as
of 12/31/2017 | | Net change in
unrealized
appreciation/
(depreciation)
from
investments
still held as of
12/31/2017 | |
Investments in Securities: | |
| Common Stock(b) | |
Capital Markets | | $ | — | (c) | | $ | — | | | $ | — | | | $ | — | | | $ | — | | | $ | — | | | $ | — | | | $ | — | (c) | | $ | — | | |
Semiconductors &
Semiconductor
Equipment | | | — | | | | — | | | | — | | | | — | (c) | | | — | | | | — | | | | — | | | | — | (c) | | | — | | |
See Notes to Financial Statements
10
Schedule of Investments U.S. Equity Index PutWrite Strategy Portfolio#(cont'd)
| | Beginning
balance as
of 1/1/2017 | | Accrued
discounts/
(premiums) | | Realized
gain/loss
and change
in unrealized
appreciation/
(depreciation) | | Purchases | | Sales | | Transfers
into
Level 3 | | Transfers
out of
Level 3 | | Balance as
of 12/31/2017 | | Net change in
unrealized
appreciation/
(depreciation)
from
investments
still held as of
12/31/2017 | |
Investments in Securities (cont'd): | |
Rights | |
| Biotechnology(a)(b) | | $ | 3,771 | | | $ | — | | | $ | (124 | ) | | $ | 3,092 | | | $ | (6,170 | ) | | $ | — | | | $ | — | | | $ | 569 | | | $ | (6,295 | ) | |
Energy Equipment &
Services | | | 733 | | | | — | | | | — | | | | — | | | | (733 | ) | | | — | | | | — | | | | — | | | | — | | |
Food & Staples
Retailing(a)(b) | | | 270 | | | | — | | | | 282 | | | | 270 | | | | (287 | ) | | | — | | | | — | | | | 535 | | | | (5 | ) | |
| Media(b) | | | — | | | | — | | | | 946 | | | | 4,080 | | | | (5,026 | ) | | | — | | | | — | | | | — | (c) | | | (4,080 | ) | |
Semiconductors &
Semiconductor
Equipment | | | 15,702 | | | | — | | | | 19,004 | | | | 5,680 | | | | (40,386 | ) | | | — | | | | — | | | | — | | | | — | | |
Loan Assignments | |
Auto Components | | | 14,070 | | | | (2 | ) | | | (208 | ) | | | — | | | | (13,860 | ) | | | — | | | | — | | | | — | | | | — | | |
Household Products | | | 6,060 | | | | 1 | | | | (15 | ) | | | — | | | | (6,046 | ) | | | — | | | | — | | | | — | | | | — | | |
Independent
Power & Renewable
Electricity Producers | | | 13,486 | | | | (420 | ) | | | (2,388 | ) | | | 37,045 | | | | (47,723 | ) | | | — | | | | — | | | | — | | | | — | | |
IT Services | | | 17,085 | | | | — | | | | (260 | ) | | | — | | | | (16,825 | ) | | | — | | | | — | | | | — | | | | — | | |
Professional Services | | | 15,593 | | | | (71 | ) | | | (87 | ) | | | — | | | | (15,435 | ) | | | — | | | | — | | | | — | | | | — | | |
Semiconductors &
Semiconductor
Equipment(a) | | | 27,720 | | | | 10 | | | | (544 | ) | | | 1,124 | | | | (27,596 | ) | | | — | | | | — | | | | 714 | | | | (410 | ) | |
| Corporate Bonds(b) | |
Chemicals | | | — | (c) | | | — | | | | — | | | | — | | | | — | (c) | | | — | | | | — | | | | — | | | | — | | |
Insurance | | | 2,217 | | | | 2 | | | | 171 | | | | — | | | | (2,390 | ) | | | — | | | | — | | | | — | | | | — | | |
Oil, Gas &
Consumable Fuels | | | — | (c) | | | — | | | | — | | | | — | | | | — | | | | — | | | | — | | | | — | (c) | | | — | | |
| Warrants(b) | |
Biotechnology | | | — | (c) | | | — | | | | — | | | | — | | | | — | | | | — | | | | — | | | | — | (c) | | | — | | |
Convertible Bonds | |
Semiconductors &
Semiconductor
Equipment | | | 11,400 | | | | — | | | | (7,500 | ) | | | — | | | | (3,900 | ) | | | — | | | | — | | | | — | | | | — | | |
Options Purchased | |
Industrial
Conglomerates | | | 15 | | | | — | | | | (15 | ) | | | — | | | | — | | | | — | | | | — | | | | — | | | | — | | |
Total | | $ | 128,122 | | | $ | (480 | ) | | $ | 9,262 | | | $ | 51,291 | | | $ | (186,377 | ) | | $ | — | | | $ | — | | | $ | 1,818 | | | $ | (10,790 | ) | |
(a) As of the year ended December 31, 2017, these securities are valued based on a single quotation obtained from a dealer. The Fund does not have access to unobservable inputs and therefore cannot disclose such inputs used in formulating such quotation.
See Notes to Financial Statements
11
Schedule of Investments U.S. Equity Index PutWrite Strategy Portfolio#(cont'd)
(b) As of the year ended December 31, 2017, these securities were valued in accordance with procedures approved by the Board of Trustees. These investments did not have a material impact on the Fund's net assets and, therefore, disclosure of unobservable inputs used in formulating valuations is not presented.
(c) Amount less than one dollar.
As of the year ended December 31, 2017, no securities were transferred from one level (as of December 31, 2016) to another.
The following is a summary, categorized by Level (see Note A of Notes to Financial Statements), of inputs used to value the Fund's derivatives as of December 31, 2017:
Other Financial Instruments
| | | Level 1 | | Level 2 | | Level 3* | | Total | |
| Swaps(a) | |
Assets | | $ | — | | | $ | — | | | $ | 1,609 | | | $ | 1,609 | | |
Options written | |
Liabilities | | | (83,112 | ) | | | — | | | | — | | | | (83,112 | ) | |
Total | | $ | (83,112 | ) | | $ | — | | | $ | 1,609 | | | $ | (81,503 | ) | |
(a) Equity swaps are reported at the cumulative unrealized appreciation/(depreciation) including financing costs and other receivables/payables.
* The following is reconciliation between the beginning and ending balances of derivative investments in which unobservable inputs (Level 3) were used in determining value:
| | | Beginning
balance as
of 1/1/2017 | | Accrued
discounts/
(premiums) | | Realized
gain/loss
and change
in unrealized
appreciation/
(depreciation) | | Purchases | | Sales | | Transfers
into
Level 3 | | Transfers
out of
Level 3 | | Balance as
of 12/31/2017 | | Net change in
unrealized
appreciation/
(depreciation)
from
investments
still held as of
12/31/2017 | |
Investments in Securities: | |
| Equity swaps(a) | |
United States | | $ | 812 | | | $ | — | | | $ | 797 | | | $ | — | | | $ | — | | | $ | — | | | $ | — | | | $ | 1,609 | | | $ | 797 | | |
Total | | $ | 812 | | | $ | — | | | $ | 797 | | | $ | — | | | $ | — | | | $ | — | | | $ | — | | | $ | 1,609 | | | $ | 797 | | |
(a) As of the year ended December 31, 2017, these investments were valued either based on a single quotation obtained from a dealer or in accordance with procedures approved by the Board of Trustees. The Fund does not have access to unobservable inputs; however, these investments did not have a material impact on the Fund's net assets and, therefore, disclosure of unobservable inputs used in formulating valuations is not presented.
See Notes to Financial Statements
12
Statement of Assets and Liabilities
Neuberger Berman Adviser Management Trust
| | | U.S. EQUITY INDEX
PUTWRITE
STRATEGY
PORTFOLIO# | |
| | | December 31, 2017 | |
Assets | |
Investments in securities, at value* (Note A)—see Schedule of Investments: | |
| Unaffiliated issuers(a) | | $ | 12,213,527 | | |
Cash | | | 11,375 | | |
Dividends and interest receivable | | | 54,064 | | |
Receivable for securities sold | | | 13,805 | | |
Receivable for Fund shares sold | | | 71,710 | | |
OTC swap contracts, at value (Note A) | | | 1,609 | | |
Prepaid expenses and other assets | | | 305 | | |
Total Assets | | | 12,366,395 | | |
Liabilities | |
| Options contracts written, at value(b) (Note A) | | | 83,112 | | |
Payable to administrator—net (Note B) | | | 13,956 | | |
Payable to investment manager (Note B) | | | 4,594 | | |
Payable for securities purchased | | | 986 | | |
Payable for Fund shares redeemed | | | 7,169 | | |
Accrued expenses and other payables | | | 88,809 | | |
Total Liabilities | | | 198,626 | | |
Net Assets | | $ | 12,167,769 | | |
Net Assets consist of: | |
Paid-in capital | | $ | 11,994,619 | | |
Undistributed net investment income/(loss) | | | (7,004 | ) | |
Accumulated net realized gains/(losses) on investments | | | 310,375 | | |
Net unrealized appreciation/(depreciation) in value of investments | | | (130,221 | ) | |
Net Assets | | $ | 12,167,769 | | |
Shares Outstanding ($.001 par value; unlimited shares authorized) | | | 1,229,285 | | |
Net Asset Value, offering and redemption price per share | | | | | |
Class S | | $ | 9.90 | | |
*Cost of Investments: | | | | | |
| (a)Unaffiliated issuers | | $ | 12,361,031 | | |
| (b)Premium received from option contracts written | | $ | 98,726 | | |
# Prior to May 1, 2017, Absolute Return Multi-Manager Portfolio. See Note A of Notes to Financial Statements.
See Notes to Financial Statements
13
Neuberger Berman Adviser Management Trust
| | | U.S. EQUITY INDEX
PUTWRITE
STRATEGY
PORTFOLIO# | |
| | | For the
Year Ended
December 31, 2017 | |
Investment Income: | |
Income (Note A): | |
Dividend income—unaffiliated issuers | | $ | 40,351 | | |
Interest income—unaffiliated issuers | | | 176,594 | | |
Foreign taxes withheld (Note A) | | | (278 | ) | |
Total income | | $ | 216,667 | | |
Expenses: | |
Investment management fees (Note B) | | | 131,811 | | |
Administration fees (Note B) | | | 43,854 | | |
Distribution fees (Note B) | | | 36,545 | | |
Audit fees | | | 53,800 | | |
Custodian and accounting fees | | | 114,331 | | |
Insurance expense | | | 529 | | |
Legal fees | | | 52,957 | | |
Shareholder reports | | | 20,225 | | |
Trustees' fees and expenses | | | 49,761 | | |
Dividend and interest expense on securities sold short (Note A) | | | 26,918 | | |
Interest expense | | | 125 | | |
Miscellaneous | | | 7,803 | | |
Total expenses | | | 538,659 | | |
Expenses reimbursed by Management (Note B) | | | (286,458 | ) | |
Total net expenses | | | 252,201 | | |
Net investment income/(loss) | | $ | (35,534 | ) | |
Realized and Unrealized Gain/(Loss) on Investments (Note A): | |
Net realized gain/(loss) on: | |
Transactions in investment securities of unaffiliated issuers | | | 512,050 | | |
Closed short positions of unaffiliated issuers | | | (160,395 | ) | |
Settlement of forward foreign currency contracts | | | (13,998 | ) | |
Settlement of foreign currency transactions | | | (9,297 | ) | |
Expiration or closing of futures contracts | | | (51,238 | ) | |
Expiration or closing of option contracts written | | | 840,934 | | |
Expiration or closing of swap contracts | | | 45,870 | | |
Change in net unrealized appreciation/(depreciation) in value of: | |
Investment securities of unaffiliated issuers | | | (259,049 | ) | |
Short positions of unaffiliated issuers | | | 14,925 | | |
Forward foreign currency contracts | | | (1,022 | ) | |
Foreign currency transactions | | | 13,161 | | |
Futures contracts | | | 7,206 | | |
Option contracts written | | | 15,722 | | |
Swap contracts | | | (32,616 | ) | |
Net gain/(loss) on investments | | | 922,253 | | |
Net increase/(decrease) in net assets resulting from operations | | $ | 886,719 | | |
# Prior to May 1, 2017, Absolute Return Multi-Manager Portfolio. See Note A of Notes to Financial Statements.
See Notes to Financial Statements
14
Statements of Changes in Net Assets
Neuberger Berman Adviser Management Trust
| | | U.S. EQUITY INDEX
PUTWRITE STRATEGY PORTFOLIO# | |
| | | Year Ended
December 31,
2017 | | Year Ended
December 31,
2016 | |
Increase/(Decrease) in Net Assets: | |
From Operations (Note A): | |
Net investment income/(loss) | | $ | (35,534 | ) | | $ | (187,966 | ) | |
Net realized gain/(loss) on investments | | | 1,163,926 | | | | (182,143 | ) | |
Change in net unrealized appreciation/(depreciation) of investments | | | (241,673 | ) | | | 320,649 | | |
Net increase/(decrease) in net assets resulting from operations | | | 886,719 | | | | (49,460 | ) | |
Distributions to Shareholders From (Note A): | |
Net realized gain on investments | | | — | | | | (77,182 | ) | |
From Fund Share Transactions (Note D): | |
Proceeds from shares sold | | | 5,171,887 | | | | 4,621,144 | | |
Proceeds from reinvestment of dividends and distributions | | | — | | | | 77,182 | | |
Payments for shares redeemed | | | (8,343,867 | ) | | | (3,344,345 | ) | |
Net increase/(decrease) from Fund share transactions | | | (3,171,980 | ) | | | 1,353,981 | | |
Net Increase/(Decrease) in Net Assets | | | (2,285,261 | ) | | | 1,227,339 | | |
Net Assets: | |
Beginning of year | | | 14,453,030 | | | | 13,225,691 | | |
End of year | | $ | 12,167,769 | | | $ | 14,453,030 | | |
Undistributed net investment income/(loss) at end of year | | | (7,004 | ) | | | (44,681 | ) | |
# Prior to May 1, 2017, Absolute Return Multi-Manager Portfolio. See Note A of Notes to Financial Statements.
See Notes to Financial Statements
15
Notes to Financial Statements U.S. Equity Index PutWrite Strategy Portfolio
Note A—Summary of Significant Accounting Policies:
1 General: Neuberger Berman Advisers Management Trust (the "Trust") is a Delaware statutory trust organized pursuant to an Amended and Restated Trust Instrument dated March 27, 2014. The Trust is currently comprised of eight separate operating series (each individually a "Fund," and collectively the "Funds") each of which is diversified. The Trust is registered as an open-end management investment company under the Investment Company Act of 1940, as amended (the "1940 Act"), and its shares are registered under the 1933 Act. Neuberger Berman Advisers Management Trust U.S. Equity Index PutWrite Strategy Portfolio (the "Fund") currently offers only Class S shares. The Trust's Board of Trustees (the "Board") may establish additional series or classes of shares without the approval of shareholders.
The assets of each Fund belong only to that Fund, and the liabilities of each Fund are borne solely by that Fund and no other.
Effective May 1, 2017, Absolute Return Multi-Manager Portfolio changed its name to the U.S. Equity Index PutWrite Strategy Portfolio in connection with the change in principal investment strategy from a multi-manager strategy to a strategy of writing put options primarily on U.S. equity indices. In connection with the principal investment strategy and name change, and as further described in the Fund's prospectus, the Fund also changed its principal investment risks, fees and expenses and portfolio managers. As such, this report reflects information about the Fund's prior strategy, risks, fees, expenses and other financial and transactional information through April 30, 2017, and the Fund's new strategy, risks, fees, expenses and other financial and transactional information from May 1, 2017, through December 31, 2017.
The Fund is an investment company and accordingly follows the investment company accounting and reporting guidance of the Financial Accounting Standards Board ("FASB") Accounting Standard Codification Topic 946 "Financial Services—Investment Companies."
The preparation of financial statements in accordance with U.S. generally accepted accounting principles ("GAAP") requires Neuberger Berman Investment Advisers LLC ("NBIA" or "Management") to make estimates and assumptions at the date of the financial statements. Actual results could differ from those estimates.
Shares of the Fund are not available to the general public and may be purchased only by life insurance companies to serve as an investment vehicle for premiums paid under their variable annuity and variable life insurance contracts and to certain qualified pension and other retirement plans.
2 Portfolio valuation: In accordance with Accounting Standards Codification ("ASC") 820 "Fair Value Measurement" ("ASC 820"), all investments held by the Fund are carried at the value that Management believes the Fund would receive upon selling an investment in an orderly transaction to an independent buyer in the principal or most advantageous market for the investment under current market conditions. Various inputs, including the volume and level of activity for the asset or liability in the market, are considered in valuing the Fund's investments, some of which are discussed below. Significant Management judgment may be necessary to value investments in accordance with ASC 820.
ASC 820 established a three-tier hierarchy of inputs to create a classification of value measurements for disclosure purposes. The three-tier hierarchy of inputs is summarized in the three broad Levels listed below.
• Level 1 – quoted prices in active markets for identical investments
• Level 2 – other observable inputs (including quoted prices for similar investments, interest rates, prepayment speeds, credit risk, amortized cost, etc.)
• Level 3 – unobservable inputs (including the Fund's own assumptions in determining the fair value of investments)
16
The inputs or methodology used for valuing an investment are not necessarily an indication of the risk associated with investing in those securities.
The value of the Fund's investments in equity securities, exchange traded options written, rights, and warrants, for which market quotations are readily available, is generally determined by Management by obtaining valuations from independent pricing services based on the latest sale price quoted on a principal exchange or market for that security (Level 1 inputs). Securities traded primarily on the NASDAQ Stock Market are normally valued at the NASDAQ Official Closing Price ("NOCP") provided by NASDAQ each business day. The NOCP is the most recently reported price as of 4:00:02 p.m., Eastern Time, unless that price is outside the range of the "inside" bid and asked prices (i.e., the bid and asked prices that dealers quote to each other when trading for their own accounts); in that case, NASDAQ will adjust the price to equal the inside bid or asked price, whichever is closer. Because of delays in reporting trades, the NOCP may not be based on the price of the last trade to occur before the market closes. If there is no sale of a security on a particular day, the independent pricing services may value the security based on market quotations.
The value of the Fund's investments in debt securities is determined by Management primarily by obtaining valuations from independent pricing services based on readily available bid or offer quotations, or if quotations are not available, by methods which include various considerations based on security type (generally Level 2 inputs). In addition to the consideration of yields or prices of securities of comparable quality, coupon, maturity and type, indications as to values from dealers, and general market conditions, the following is a description of other Level 2 inputs and related valuation techniques used by independent pricing services to value certain types of debt securities held by the Fund:
Corporate Bonds. Inputs used to value corporate debt securities generally include relative credit information, observed market movements, sector news, U.S. Treasury yield curve or relevant benchmark curve, and other market information which may include benchmark yields, reported trades, broker-dealer quotes, issuer spreads, benchmark securities, bids, offers, and reference data, such as market research publications, when available ("Other Market Information").
U.S. Treasury Obligations. Inputs used to value U.S. Treasury securities generally include quotes from several inter-dealer brokers and Other Market Information.
U.S. Government Agency Securities. Inputs used to value U.S. Government Agency securities generally include obtaining benchmark quotes and Other Market Information.
The value of loan assignments is determined by Management primarily by obtaining valuations from independent pricing services based on broker quotes (generally Level 2 or Level 3 inputs depending on the number of quotes available).
The value of equity swaps is determined by Management by obtaining valuations from independent pricing services using the underlying asset and stated London Interbank Offered Rate ("LIBOR") or Federal Funds floating rate (generally Level 2 or Level 3 inputs).
Management has developed a process to periodically review information provided by independent pricing services for all types of securities.
Investments in non-exchange traded investment companies are valued using the respective fund's daily calculated net asset value per share (Level 2 inputs).
If a valuation is not available from an independent pricing service, or if Management has reason to believe that the valuation received does not represent the amount the Fund might reasonably expect to receive on a current sale in an orderly transaction, Management seeks to obtain quotations from brokers or dealers (generally considered Level 2 or Level 3 inputs depending on the number of quotes available). If such quotations are not readily available, the security is valued using methods the Board has approved in the good-faith belief that the resulting valuation will reflect the fair value of the security. Numerous factors may be considered when determining the fair value of a
17
security based on Level 2 or Level 3 inputs, including available analyst, media or other reports, securities within the same industry with recent highly correlated performance, trading in futures or American Depositary Receipts and whether the issuer of the security being fair valued has other securities outstanding.
The value of the Fund's investments in foreign securities is generally determined using the same valuation methods and inputs as other Fund investments, as discussed above. Foreign security prices expressed in local currency values are normally translated from the local currency into U.S. dollars using the exchange rates as of 4:00 p.m., Eastern Time on days the New York Stock Exchange ("NYSE") is open for business. The Board has approved the use of Interactive Data Pricing and Reference Data, LLC ("Interactive") to assist in determining the fair value of foreign equity securities when changes in the value of a certain index suggest that the closing prices on the foreign exchanges may no longer represent the amount that the Fund could expect to receive for those securities or on days when foreign markets are closed and U.S. markets are open. In each of these events, Interactive will provide adjusted prices for certain foreign equity securities using a statistical analysis of historical correlations of multiple factors (Level 2 inputs). The Board has also approved the use of Interactive to evaluate the prices of foreign debt securities as of the time as of which a Fund's share price is calculated. Interactive utilizes benchmark spread and yield curves and evaluates available market activity from the local close to the time as of which a Fund's share price is calculated (Level 2 inputs) to assist in determining prices for certain foreign debt securities. In the case of both foreign equity and foreign income securities, in the absence of precise information about the market values of these foreign securities as of the time as of which a Fund's share price is calculated, the Board has determined on the basis of available data that prices adjusted or evaluated in this way are likely to be closer to the prices the Fund could realize on a current sale than are the prices of those securities established at the close of the foreign markets in which the securities primarily trade.
Fair value prices are necessarily estimates, and there is no assurance that such a price will be at or close to the price at which the security is next quoted or next trades.
3 Foreign currency translations: The accounting records of the Fund are maintained in U.S. dollars. Foreign currency amounts are normally translated into U.S. dollars using the exchange rate as of 4:00 p.m. Eastern Time, on days the NYSE is open for business, to determine the value of investments, other assets and liabilities. Purchase and sale prices of securities, and income and expenses, are translated into U.S. dollars at the prevailing rate of exchange on the respective dates of such transactions. Net unrealized foreign currency gain (loss), if any, arises from changes in the value of assets and liabilities, other than investments in securities, as a result of changes in exchange rates and is stated separately in the Statement of Operations.
4 Securities transactions and investment income: Securities transactions are recorded on trade date for financial reporting purposes. Dividend income is recorded on the ex-dividend date or, for certain foreign dividends, as soon as the Fund becomes aware of the dividends. Non-cash dividends included in dividend income, if any, are recorded at the fair market value of the securities received. Interest income, including accretion of discount (adjusted for original issue discount, where applicable) and amortization of premium, where applicable, and accretion of discount on short-term investments, if any, is recorded on the accrual basis. Realized gains and losses from securities transactions and foreign currency transactions, if any, are recorded on the basis of identified cost and stated separately in the Statement of Operations.
5 Income tax information: The Fund is treated as a separate entity for U.S. federal income tax purposes. It is the policy of the Fund to continue to qualify for treatment as a regulated investment company ("RIC") by complying with the requirements of the U.S. Internal Revenue Code applicable to RICs and to distribute substantially all of its net investment income and net realized capital gains to its shareholders. To the extent the Fund distributes substantially all of its net investment income and net realized capital gains to shareholders, no federal income or excise tax provision is required.
The Fund has adopted the provisions of ASC 740 "Income Taxes" ("ASC 740"). ASC 740 sets forth a minimum threshold for financial statement recognition of a tax position taken, or expected to be taken, in a tax return. The Fund recognizes interest and penalties, if any, related to unrecognized tax positions as an income tax expense in the
18
Statement of Operations. The Fund is subject to examination by U.S. federal and state tax authorities for returns filed for the tax years for which the applicable statutes of limitations have not yet expired. As of December 31, 2017, the Fund did not have any unrecognized tax positions.
At December 31, 2017, the cost of long security positions for U.S. federal income tax purposes was $12,361,540. Gross unrealized appreciation of long security positions and derivative instruments (if any) was $21,213 and gross unrealized depreciation of long security positions and derivative instruments (if any) was $169,226, resulting in net unrealized depreciation of $148,013 based on cost for U.S. federal income tax purposes.
Income distributions and capital gain distributions are determined in accordance with income tax regulations, which may differ from GAAP. These differences are primarily due to differing treatments of income and gains on various investment securities held by the Fund, timing differences and differing characterization of distributions made by the Fund. The Fund may also utilize earnings and profits distributed to shareholders on redemption of their shares as a part of the dividends-paid deduction for income tax purposes.
As determined on December 31, 2017, permanent differences resulting primarily from different book and tax accounting were reclassified at year end. Such differences are attributed to the tax treatment of paydown losses on mortgage-backed securities, income recognized on swap transactions, the tax treatment of foreign currency gains and losses, payments in lieu of dividends on short sales, non-deductible excise tax accrued, return of capital payments received from certain investments, gains and losses from passive foreign investment companies, income received from partnerships, non-taxable dividends, and net operating loss netted against short term capital gains. These reclassifications had no effect on net income, net asset value ("NAV") or NAV per share of the Fund. For the year ended December 31, 2017, the Fund recorded the following permanent reclassifications:
| Paid-in Capital | | Undistributed
Net Investment
Income/(Loss) | | Accumulated
Net Realized
Gains/(Losses)
on Investments | |
| $ | (40,937 | ) | | $ | 73,211 | | | $ | (32,274 | ) | |
The tax character of distributions paid during the years ended December 31, 2017 and December 31, 2016 was as follows:
| | | | | Distributions Paid From: | | | | | |
Ordinary Income | | Tax-Exempt Income | | Long-Term Capital Gain | | Return of Capital | | Total | |
| 2017 | | 2016 | | 2017 | | 2016 | | 2017 | | 2016 | | 2017 | | 2016 | | 2017 | | 2016 | |
| $ | — | | | $ | 77,182 | | | $ | — | | | $ | — | | | $ | — | | | $ | — | | | $ | — | | | $ | — | | | $ | — | | | $ | 77,182 | | |
As of December 31, 2017, the components of distributable earnings (accumulated losses) on a U.S. federal income tax basis were as follows:
Undistributed
Ordinary
Income/(Loss) | | Undistributed
Long-Term
Capital Gain | | Unrealized
Appreciation/
(Depreciation) | | Loss
Carryforwards
and Deferrals | | Other
Temporary
Differences | | Total | |
| $ | 33,833 | | | $ | 291,724 | | | $ | (147,011 | ) | | $ | — | | | $ | (5,396 | ) | | $ | 173,150 | | |
The temporary differences between book basis and tax basis distributable earnings are primarily due to: losses disallowed on wash sales, mark-to-market adjustments on swaps and options, unamortized organization expenses and tax adjustments related to swap contracts. To the extent the Fund's net realized capital gains, if any, can be offset by capital loss carryforwards, if any, it is the policy of the Fund not to distribute such gains.
19
To the extent the Fund's net realized capital gains, if any, can be offset by capital loss carryforwards, if any, it is the policy of the Fund not to distribute such gains. During the year ended December 31, 2017, the Fund utilized long-term and short-term capital loss carryforwards in the amount of:
| Long-Term | | Short-Term | |
| $ | 275,624 | | | $ | 251,598 | | |
6 Foreign taxes: Foreign taxes withheld, if any, represent amounts withheld by foreign tax authorities, net of refunds recoverable.
7 Distributions to shareholders: The Fund may earn income, net of expenses, daily on its investments. Distributions from net investment income and net realized capital gains, if any, are generally distributed once a year (usually in October). Income distributions and capital gain distributions to shareholders are recorded on the ex-date.
It is the policy of the Fund to pass through to its shareholders substantially all real estate investment trust ("REIT") distributions and other income it receives, less operating expenses. The distributions received from REITs are generally composed of income, capital gains, and/or return of REIT capital, but the REITs do not report this information to the Fund until the following calendar year. At December 31, 2017, the Fund estimated these amounts for the period January 1, 2017 to December 31, 2017 within the financial statements because the 2017 information is not available from the REITs until after the Fund's fiscal year-end. All estimates are based upon REIT information sources available to the Fund together with actual IRS Forms 1099-DIV received to date. For the year ended December 31, 2017, the character of distributions paid to shareholders of the Fund disclosed within the Statements of Changes in Net Assets is based on estimates made at that time. Based on past experience it is possible that a portion of the Fund's distributions during the current fiscal year, if any, will be considered tax return of capital, but the actual amount of the tax return of capital, if any, is not determinable until after the Fund's fiscal year-end. After calendar year-end, when the Fund learns the nature of the distributions paid by REITs during that year, distributions previously identified as income are often recharacterized as return of capital and/or capital gain. After all applicable REITs have informed the Fund of the actual breakdown of distributions paid to the Fund during its fiscal year, estimates previously recorded are adjusted on the books of the Fund to reflect actual results. As a result, the composition of the Fund's distributions as reported herein may differ from the final composition determined after calendar year-end and reported to the Fund shareholders on IRS Form 1099-DIV.
8 Expense allocation: Certain expenses are applicable to multiple funds within the complex of related investment companies. Expenses directly attributable to the Fund are charged to the Fund. Expenses of the Trust that are not directly attributable to a particular series of the Trust (e.g., the Fund) are allocated among the series of the Trust, on the basis of relative net assets, except where a more appropriate allocation of expenses to each of the series can otherwise be made fairly. Expenses borne by the complex of related investment companies, which includes open-end and closed-end investment companies for which Management serves as investment manager, that are not directly attributable to a particular investment company in the complex (e.g., the Trust) or series thereof are allocated among the investment companies in the complex or series thereof on the basis of relative net assets, except where a more appropriate allocation of expenses to each of the investment companies in the complex or series thereof can otherwise be made fairly.
9 Investments in foreign securities: Investing in foreign securities may involve sovereign and other risks, in addition to the credit and market risks normally associated with domestic securities. These additional risks include the possibility of adverse political and economic developments (including political instability, nationalization, expropriation, or confiscatory taxation) and the potentially adverse effects of unavailability of public information regarding issuers, less governmental supervision and regulation of financial markets, reduced liquidity of certain financial markets, and the lack of uniform accounting, auditing, and financial reporting standards or the application of standards that are different or less stringent than those applied in the United States. Foreign securities also may experience greater price volatility, higher rates of inflation, and delays in settlement.
10 Securities sold short: The Fund may engage in short sales, which are sales of securities which have been borrowed from a third party on the expectation that the market price will decline. If the price of the securities decreases, the
20
Fund will make a profit by purchasing the securities in the open market at a price lower than the one at which it sold the securities. If the price of the securities increases, the Fund may have to cover its short positions at a price higher than the short sale price, resulting in a loss. Gains are limited to the price at which the Fund sold the security short, while losses are potentially unlimited in size. The Fund pledges securities and/or other assets, to the lender as collateral. Proceeds received from short sales may be maintained by the lender as collateral or may be released to the Fund and used to purchase additional securities or for any other purpose. Proceeds maintained by the lender are included in "Cash collateral segregated for short sales" on the Statement of Assets and Liabilities. The Fund is required to segregate an amount of cash or liquid securities in an amount at least equal to the current market value of the securities sold short (less any additional collateral pledged to the lender). The Fund is contractually responsible to remit to the lender any dividends and interest payable on securities while those securities are being borrowed by the Fund. The Fund may receive or pay the net of the interest charged by the prime broker on the borrowed securities and a financing charge for the difference in the market value of the short position and the cash collateral deposited with the broker. This income or fee is calculated daily based upon the market value of each borrowed security and a variable rate that is dependent on the availability of the security. These costs related to short sales (i.e., dividend and interest remitted to the lender and interest charged by the prime broker) are recorded as an expense of the Fund and are excluded from the contractual expense limitation. The net amount of fees incurred during the year ended December 31, 2017, were $1,701 and are included in "Dividend and interest expense on securities sold short" on the Statement of Operations. At December 31, 2017, the Fund had no short sales.
11 Investment company securities, exchange traded funds and exchange traded notes: The Fund may invest in shares of other registered investment companies, including exchange traded funds ("ETFs"), within the limitations prescribed by the 1940 Act or pursuant to an exemptive order from the Securities and Exchange Commission ("SEC") that permits the Fund to invest in both affiliated and unaffiliated investment companies, including ETFs, in excess of the limits in Section 12(d)(1)(A) of the 1940 Act, as amended, subject to the terms and conditions of such order. Some ETFs seek to track the performance of a particular market index. These indices include both broad-based market indices and more narrowly-based indices, including those relating to particular sectors, markets, regions or industries. However, some ETFs have actively-managed investment objectives. ETF shares are traded like traditional equity securities on a national securities exchange or NASDAQ. The Fund will indirectly bear its proportionate share of any management fees and other expenses paid by such other investment companies, which will increase expenses and decrease returns. The Fund may also invest in exchange traded notes ("ETNs"). ETNs are senior, unsecured, unsubordinated debt securities that are linked to the performance of a particular market index or strategy. The issuer of the ETN pays the Fund an amount based on the returns of the underlying index or strategy, plus principal at maturity. The Fund will bear any applicable fees to the issuer upon redemption or maturity, which will increase expenses and decrease returns.
12 Derivative instruments: The Fund's use of derivatives during the year ended December 31, 2017, is described below. Please see the Schedule of Investments for the Fund's open positions in derivatives, if any, at December 31, 2017. The Fund has adopted the provisions of ASC 815 "Derivatives and Hedging" ("ASC 815"). The disclosure requirements of ASC 815 distinguish between derivatives that qualify for hedge accounting and those that do not. Because investment companies value their derivatives at fair value and recognize changes in fair value through the Statement of Operations, they do not qualify for hedge accounting. Accordingly, even though the Fund's investments in derivatives may represent economic hedges, they are considered non-hedge transactions for purposes of this disclosure.
Futures contracts: During the year ended December 31, 2017, the Fund used futures for economic hedging purposes.
At the time the Fund enters into a futures contract, it is required to deposit with the futures commission merchant a specified amount of cash or liquid securities, known as "initial margin," which is a percentage of the value of the futures contract being traded that is set by the exchange upon which the futures contract is traded. Each day, the futures contract is valued at the official settlement price of the board of trade or U.S. commodity exchange on
21
which such futures contract is traded. Subsequent payments, known as "variation margin" to and from the broker are made on a daily basis, or as needed, as the market price of the futures contract fluctuates. Daily variation margin adjustments, arising from this "mark to market," are recorded by the Fund as unrealized gains or losses.
Although some futures by their terms call for actual delivery or acquisition of the underlying securities or currency, in most cases the contracts are closed out prior to delivery by offsetting purchases or sales of matching futures. When the contracts are closed, the Fund recognizes a gain or loss. Risks of entering into futures contracts include the possibility there may be an illiquid market, possibly at a time of rapidly declining prices, and/or a change in the value of the contract may not correlate with changes in the value of the underlying securities. Futures executed on regulated futures exchanges have minimal counterparty risk to the Fund because the exchange's clearinghouse assumes the position of the counterparty in each transaction. Thus, the Fund is exposed to risk only in connection with the clearinghouse and not in connection with the original counterparty to the transaction.
For U.S. federal income tax purposes, futures transactions undertaken by a Fund may cause the Fund to recognize gains or losses from marking contracts to market even though its positions have not been sold or terminated, may affect the character of the gains or losses recognized as long-term or short-term, and may affect the timing of some capital gains and losses realized by the Fund. Also, the Fund's losses on transactions involving futures contracts may be deferred rather than being taken into account currently in calculating the Fund's taxable income.
Equity swap contracts: During the year ended December 31, 2017, the Fund used equity swaps to provide investment exposure to certain investments, primarily foreign securities.
Equity swaps are two-party contracts in which counterparties exchange the return on a specified reference security, basket of securities, security index or index component for the return based on a fixed or floating interest rate during the period of the swap. Equity swaps are marked to market daily based on the value of the underlying reference entity and the change, if any, is recorded as an unrealized gain or loss. Equity swaps normally do not involve the delivery of securities or other underlying assets. If the other party to an equity swap defaults, the Fund's risk of loss consists of the net amount of payments that the Fund is contractually entitled to receive, if any. Equity swaps are derivatives and their value can be very volatile. To the extent that future market trends, the values of assets or economic factors are not accurately analyzed and predicted, the Fund may suffer a loss, which may exceed the related amounts shown in the Statement of Assets and Liabilities. Periodic payments received or paid by the Fund are recorded as realized gains or losses.
Forward foreign currency contracts: During the year ended December 31, 2017, the Fund used forward contracts to hedge foreign currency.
A forward contract is an agreement between two parties to buy or sell a specific currency for another at a set price on a future date, and is individually negotiated and privately traded by currency traders and their customers in the interbank market. The market value of a forward contract fluctuates with changes in forward currency exchange rates. Forward contracts are marked to market daily, and the change in value is recorded by the Fund as an unrealized gain or loss. At the consummation of a forward contract to purchase or sell currency, the Fund may either exchange the currencies specified at the maturity of the forward contract or enter into a closing transaction involving the purchase or sale of an offsetting forward contract. Closing transactions with respect to forward contracts are usually performed with the counterparty to the original forward contract. The gain or loss arising from the difference between the U.S. dollar cost of the original contract and the value of the foreign currency in U.S. dollars upon closing a contract is included in "Net realized gain/(loss) on settlement of forward foreign currency contracts" in the Statement of Operations. These contracts may involve market risk in excess of the unrealized gain or loss reflected in the Fund's Statement of Assets and Liabilities. In addition, the Fund could be exposed to risks associated with fluctuations in foreign currency and the risk the counterparty will fail to fulfill its obligation.
Options: During the year ended December 31, 2017, the Fund used options written to manage or adjust the risk profile of the Fund or the risk of individual index exposures and to gain exposure more efficiently than through a direct purchase of the underlying security or to gain exposure to securities, markets, sectors or geographical areas.
22
Options written were also used to generate incremental returns. Purchased option contracts ("options purchased") were used to enhance returns and to manage or adjust the risk profile and to gain investment exposure more efficiently than through a direct purchase of the underlying security or to gain exposure to certain securities, markets, sectors or geographical areas.
Premiums paid by the Fund upon purchasing a call or put option are recorded in the asset section of the Fund's Statement of Assets and Liabilities and are subsequently adjusted to the current market value. When an option is exercised, closed, or expired, the Fund realizes a gain or loss and the asset is eliminated. For purchased call options, the Fund's loss is limited to the amount of the option premium paid.
Premiums received by the Fund upon writing a call option or a put option are recorded in the liability section of the Fund's Statement of Assets and Liabilities and are subsequently adjusted to the current market value. When an option is exercised, closed, or expired, the Fund realizes a gain or loss and the liability is eliminated.
When a Fund writes a call option on an underlying asset it does not own, its exposure on such an option is theoretically unlimited. When writing a covered call option, the Fund, in return for the premium, gives up the opportunity for profit from a price increase in the underlying security above the exercise price, but conversely retains the risk of loss should the price of the security decline. When writing a put option, the Fund, in return for the premium, takes the risk that it must purchase the underlying security at a price that may be higher than the current market price of the security. If a covered call or put option that the Fund has written expires unexercised, the Fund will realize a gain in the amount of the premium.
The Fund may write or purchase options on exchange traded futures contracts ("futures option") to hedge an existing position or future investment, for speculative purposes or to manage exposure to market movements. A futures option is an option contract in which the underlying instrument is a specific futures contract.
As a result of the Fund's new put writing investment strategy effective May 1, 2017, the Fund (as the seller of the option) receives premiums from the purchaser of the option in exchange for providing the purchaser with the right to sell the underlying instrument to the Fund at a specific price (i.e., the exercise price or strike price). If the market price of the instrument underlying the option exceeds the strike price, it is anticipated that the option would go unexercised and the Fund would earn the full premium upon the option's expiration or a portion of the premium upon the option's early termination. If the market price of the instrument underlying the option drops below the strike price, it is anticipated that the option would be exercised and the Fund would pay the option buyer the difference between the market value of the underlying instrument and the strike price. The proceeds received by the Fund for writing put options will generally be invested in fixed income instruments, money market mutual funds and ETFs in order to seek to offset any liabilities the Fund incurs from writing put options. Please see the Fund's prospectus for additional information on its principal investment strategies and risks.
23
At December 31, 2017, the Fund had the following derivatives (which did not qualify as hedging instruments under ASC 815), grouped by primary risk exposure:
Asset Derivatives
Derivative Type | | Statement of
Assets and
Liabilities Location | | Equity Risk | | Total | |
OTC swaps | | OTC swap contracts, at value | | $ | 1,609 | | | $ | 1,609 | | |
Total Value—Assets | | | | $ | 1,609 | | | $ | 1,609 | | |
Liability Derivatives
Derivative Type | | Statement of
Assets and
Liabilities Location | | Equity Risk | | Total | |
Options written | | Option contracts written,
at value | | $ | (83,112 | ) | | $ | (83,112 | ) | |
Total Value—Liabilities | | | | $ | (83,112 | ) | | $ | (83,112 | ) | |
The impact of the use of these derivative instruments on the Statement of Operations during the fiscal year ended December 31, 2017, was as follows:
Realized Gain/(Loss)
Derivative Type | | Statement of
Operations Location | | Currency Risk | | Equity Risk | | Total | |
| Forward contracts | | Net realized gain/(loss) on:
Settlement of forward
foreign currency contracts | | $ | (13,998 | ) | | $ | — | | | $ | (13,998 | ) | |
| Futures | | Net realized gain/(loss) on:
Expiration or closing
of futures contracts | | | — | | | | (51,238 | ) | | | (51,238 | ) | |
Options purchased | | Net realized gain/
(loss) on: Transactions in
investment securities
of unaffiliated issuers | | | — | | | | (35,671 | ) | | | (35,671 | ) | |
| Options written | | Net realized gain/(loss) on:
Expiration or closing of
option contracts written | | | — | | | | 840,934 | | | | 840,934 | | |
Swaps | | Net realized gain/(loss)
on: Expiration or closing
of swap contracts | | | — | | | | 45,870 | | | | 45,870 | | |
Total Realized Gain/(Loss) | | | | $ | (13,998 | ) | | $ | 799,895 | | | $ | 785,897 | | |
24
Change in Appreciation/
(Depreciation)
Derivative Type | | Statement of
Operations Location | | Currency Risk | | Equity Risk | | Total | |
Forward contracts | | Change in net unrealized
appreciation/(depreciation)
in value of: Forward
foreign currency contracts | | $ | (1,022 | ) | | $ | — | | | $ | (1,022 | ) | |
Futures | | Change in net unrealized
appreciation/(depreciation)
in value of: Futures contracts | | | — | | | | 7,206 | | | | 7,206 | | |
Options purchased | | Change in net unrealized
appreciation/(depreciation)
in value of: Investment
securities of unaffiliated issuers | | | — | | | | 3,820 | | | | 3,820 | | |
Options written | | Change in net unrealized
appreciation/(depreciation)
in value of: Option
contracts written | | | — | | | | 15,722 | | | | 15,722 | | |
Swaps | | Change in net unrealized
appreciation/(depreciation)
in value of: Swap contracts | | | — | | | | (32,616 | ) | | | (32,616 | ) | |
Total Change in Appreciation/
(Depreciation) | | | | $ | (1,022 | ) | | $ | (5,868 | ) | | $ | (6,890 | ) | |
While the Fund may receive rights and warrants in connection with their investments in securities, these rights and warrants are not considered "derivative instruments" under ASC 815.
The Fund discloses both gross and net information for assets and liabilities related to derivatives, repurchase and reverse repurchase agreements, and securities lending and securities borrowing transactions that are eligible for offset or subject to an enforceable master netting or similar agreement. The Fund's derivative assets and liabilities at fair value by type are reported gross in the Statement of Assets and Liabilities. The following tables present the Fund's derivative assets and liabilities by counterparty, net of amounts available for offset under a master netting agreement and net of the related collateral received by the Fund for assets and pledged by the Fund for liabilities as of December 31, 2017.
Description | | Gross Amounts of
Recognized Assets | | Gross Amounts
Offset in the
Statement of
Assets and
Liabilities | | Net Amounts of Assets Presented in the
Statement of Assets and Liabilities | |
OTC swap contracts | | $ | 1,609 | | | $ | — | | | $ | 1,609 | | |
Gross Amounts Not Offset in the Statement of Assets and Liabilities
Counterparty | | Net Amounts of
Assets Presented in
the Statement of
Assets and Liabilities | | Liabilites
Available
for Offset | | Cash Collateral
Received(a) | | Net Amount(b) | |
JPMorgan Chase Bank, NA | | $ | 1,609 | | | $ | — | | | $ | — | | | $ | 1,609 | | |
(a) Collateral received (or pledged) is limited to an amount not to exceed 100% of the net amount of assets (or liabilities) in the tables presented above, for each respective counterparty.
25
(b) Net Amount represents amounts subject to loss as of December 31, 2017, in the event of a counterparty failure.
13 Indemnifications: Like many other companies, the Trust's organizational documents provide that its officers ("Officers") and trustees ("Trustees") are indemnified against certain liabilities arising out of the performance of their duties to the Trust. In addition, both in some of its principal service contracts and in the normal course of its business, the Trust enters into contracts that provide indemnifications to other parties for certain types of losses or liabilities. The Trust's maximum exposure under these arrangements is unknown as this could involve future claims against the Trust.
Note B—Investment Management Fees, Administration Fees, Distribution Arrangements, and Other Transactions with Affiliates:
The Fund retains Management as its investment manager under a Management Agreement. For such investment management services, effective May 1, 2017, the Fund pays Management a fee at the annual rate of 0.450% of the Fund's average daily net assets. Prior to May 1, 2017, the Fund paid Management a fee at the annual rate of 1.700% of the first $250 million of the Fund's average daily net assets, 1.675% of the next $250 million, 1.650% of the next $250 million, 1.625% of the next $250 million, 1.600% of the next $500 million, 1.575% of the next $2.5 billion, and 1.550% of average daily net assets in excess of $4 billion. Accordingly, for the year ended December 31, 2017, the investment management fee pursuant to the Management Agreement was equivalent to an annual effective rate of 0.90% of the Fund's average daily net assets.
The Fund retains Management as its administrator under an Administration Agreement. The Fund pays Management an administration fee at the annual rate of 0.30% of its average daily net assets under this agreement. Additionally, Management retains JPMorgan Chase Bank, NA ("JPM") as its sub-administrator under a Sub-Administration Agreement. Management pays JPM a fee for all services received under the agreement.
Management has contractually agreed to waive fees and/or reimburse the Fund for its total annual operating expenses so that the total annual operating expenses do not exceed the expense limitations as detailed in the following table. These undertakings exclude interest, taxes, brokerage commissions, dividend and interest expenses relating to short sales, acquired fund fees and expenses, and extraordinary expenses, if any (commitment fees relating to borrowings are treated as interest for purposes of this exclusion); consequently, net expenses may exceed the contractual expense limitation. The Fund has agreed that it will repay Management for fees and expenses waived or reimbursed provided that repayment does not cause the annual operating expenses to exceed its expense limitation in place at the time the fees and expenses were waived or reimbursed, and the repayment is made within three years after the year in which Management incurred the expense.
During the year ended December 31, 2017, there was no repayment to Management under its contractual expense limitation.
At December 31, 2017, the Fund's contingent liabilities to Management under its contractual expense limitation were as follows:
| | | | | | | Expenses Reimbursed in
Year Ending, December 31, | |
| | | | | | | 2015 | | 2016 | | 2017 | |
| | | | | | | Subject to Repayment
until December 31, | |
| | | Contractual
Expense
Limitation(1) | | Expiration | | 2018 | | 2019 | | 2020 | |
Class S | | | 1.05 | %(2) | | 12/31/20 | | $ | 446,549 | | | $ | 508,177 | | | $ | 286,458 | | |
(1) Expense limitation per annum of the Fund's average daily net assets.
(2) Prior to May 1, 2017, the Fund had different investment goals, fees and expenses, principal investment strategies and portfolio managers and as such the expense limit prior to May 1, 2017 was 2.40%.
26
NB Alternative Investment Management LLC ("NBAIM") was retained by Management through December 31, 2015, pursuant to a Sub-Advisory Agreement, to provide day-to-day investment management services, including oversight of the Fund's investments and handling its day-to-day business, including oversight of the subadvisers' investment activities, and received a monthly fee paid by Management. As investment manager, Management was responsible for overseeing the investment activities of NBAIM. Several individuals who are Officers and/or Trustees of the Trust were also employees of NBAIM and/or Management. As a result of the entity consolidation described on page 3 of this Annual Report, the services previously provided by NBAIM under the sub-advisory agreement are now provided by Management as of January 1, 2016.
Prior to May 1, 2017, Management engaged Blue Jay Capital Management, LLC, Cramer Rosenthal McGlynn, LLC, GAMCO Asset Management Inc., Good Hill Partners LP, Lazard Asset Management LLC, Levin Capital Strategies, LP, Portland Hill Asset Management Limited, Sound Point Capital Management, L.P., and TPH Asset Management, LP as subadvisers to provide investment management services. Management compensated the subadvisers out of the investment advisory fees it received from the Fund.
Neuberger Berman BD LLC (the "Distributor") is the Fund's "principal underwriter" within the meaning of the 1940 Act. It acts as agent in arranging for the sale of the Fund's Class S shares. The Board has adopted a distribution and shareholder services plan (the "Plan") for Class S shares pursuant to Rule 12b-1 under the 1940 Act. The Plan provides that, as compensation for administrative and other services related to the sale and distribution of Class S, and ongoing services provided to investors in the class, the Distributor receives from Class S a fee at the annual rate of 0.25% of Class S's average daily net assets. The Distributor may pay a portion of the proceeds from the 12b-1 fee to institutions that provide such services, including insurance companies or their affiliates and qualified plan administrators ("intermediaries") for services they provide respecting the Fund to current and prospective variable contract owners and qualified plan participants that invest in the Fund through the intermediaries. Those institutions may use the payments for, among other purposes, compensating employees engaged in sales and/or shareholder servicing. The amount of fees paid by the class during any year may be more or less than the cost of distribution and other services provided to the class. FINRA rules limit the amount of annual distribution fees that may be paid by a mutual fund and impose a ceiling on the cumulative distribution fees paid. The Plan complies with those rules.
Note C—Securities Transactions:
During the year ended December 31, 2017, there were purchase and sale transactions of long-term securities (excluding swaps, futures, forward contracts and option contracts) as follows:
Purchases of
U.S. Government
and Agency
Obligations | | Purchases excluding
U.S. Government
and Agency
Obligations | | Securities Sold
Short excluding
U.S. Government
and Agency
Obligations | | Sales and Maturities
of U.S. Government
and Agency
Obligations | | Sales and Maturities
excluding
U.S. Government
and Agency
Obligations | | Covers on
Securities Sold
Short excluding
U.S. Government
and Agency
Obligations | |
| $ | 14,920,210 | | | $ | 31,834,368 | | | $ | 4,221,043 | | | $ | 3,538,720 | | | $ | 46,232,518 | | | $ | 7,890,300 | | |
During the year ended December 31, 2017, no brokerage commissions on securities transactions were paid to affiliated brokers.
27
Note D—Fund Share Transactions:
Share activity for the year ended December 31, 2017 and December 31, 2016 was as follows:
| | | For the Year Ended December 31, 2017 | | For the Year Ended December 31, 2016 | |
| | | Shares Sold | | Shares Issued on
Reinvestment of
Dividends and
Distributions | | Shares
Redeemed | | Total | | Shares Sold | | Shares Issued on
Reinvestment of
Dividends and
Distributions | | Shares
Redeemed | | Total | |
Class S | | | 541,638 | | | | — | | | | (869,120 | ) | | | (327,482 | ) | | | 501,360 | | | | 8,272 | | | | (361,056 | ) | | | 148,576 | | |
Other: At December 31, 2017, there was an affiliated investor owning 20.3% of the Fund's outstanding shares.
Note E—Line of Credit:
At December 31, 2017, the Fund was a participant in a syndicated committed, unsecured $700,000,000 line of credit (the "Credit Facility"), to be used only for temporary or emergency purposes. The Fund and the one multi-manager fund in the complex are subject to a separate limitation under the Credit Facility and collectively can only borrow $200,000,000. Series of other investment companies managed by Management also participate in this line of credit on substantially the same terms except that they are not subject to that $200,000,000 limitation. Interest is charged on borrowings under this Credit Facility at the highest of (a) a federal funds effective rate plus 1.00% per annum, (b) a Eurodollar rate for a one-month period plus 1.00% per annum, and (c) an overnight bank funding rate plus 1.00% per annum. The Credit Facility has an annual commitment fee of 0.15% per annum of the available line of credit, which is paid quarterly. The Fund has agreed to pay its pro rata share of the annual commitment fee, based on the ratio of its individual net assets to the net assets of all participants at the time the fee is due and payable and the level of its access to the Credit Facility, and interest charged on any borrowing made by the Fund and other costs incurred by the Fund. Because several mutual funds participate in the Credit Facility, there is no assurance that the Fund will have access to all or any part of the $700,000,000 at any particular time. There were no loans outstanding under the Credit Facility at December 31, 2017. During the period ended December 31, 2017, the Fund had the following borrowing under the Credit Facility:
Number of Days
Borrowed | | Greatest Amount
Borrowed | | Average Interest
Rate | | Interest
Paid(a) | |
| | 2 | | | $ | 1,010,000 | | | | 2.24 | % | | $ | 125 | | |
(a) Interest Paid is reflected in the Statement of Operations under the caption "Interest expense".
28
U.S. Equity Index PutWrite Strategy Portfolio§§
The following table includes selected data for a share outstanding throughout each period and other performance information derived from the Financial Statements. Amounts that do not round to $0.01 or ($0.01) per share are presented as $0.00 or ($0.00), respectively. Ratios that do not round to 0.01% or (0.01)% are presented as 0.00% or (0.00)%, respectively. A " — " indicates that the line item was not applicable in the corresponding period.
Class S | |
| | | Year Ended December 31, | | Period from
May 1, 2014^
to December 31, | |
| | | 2017 | | 2016 | | 2015 | | 2014 | |
Net Asset Value, Beginning of Period | | $ | 9.28 | | | $ | 9.39 | | | $ | 10.01 | | | $ | 10.00 | | |
Income From Investment Operations: | |
| Net Investment Income/(Loss)‡ | | | (0.02 | ) | | | (0.12 | ) | | | (0.13 | ) | | | (0.08 | ) | |
Net Gains or Losses on Securities
(both realized and unrealized) | | | 0.64 | | | | 0.06 | | | | (0.38 | ) | | | 0.09 | | |
Total From Investment Operations | | | 0.62 | | | | (0.06 | ) | | | (0.51 | ) | | | 0.01 | | |
Less Distributions from: | |
Net Realized Capital Gains | | | — | | | | (0.05 | ) | | | (0.11 | ) | | | — | | |
Total Distributions | | | — | | | | (0.05 | ) | | | (0.11 | ) | | | — | | |
Net Asset Value, End of Period | | $ | 9.90 | | | $ | 9.28 | | | $ | 9.39 | | | $ | 10.01 | | |
| Total Return†† | | | 6.68 | % | | | (0.65 | )% | | | (5.15 | )% | | | 0.10 | %** | |
Ratios/Supplemental Data | |
Net Assets, End of Period (in millions) | | $ | 12.2 | | | $ | 14.5 | | | $ | 13.2 | | | $ | 8.5 | | |
| Ratio of Gross Expenses to Average Net Assets# | | | 3.68 | % | | | 6.83 | % | | | 7.20 | % | | | 9.43 | %*@ | |
Ratio of Gross Expenses to Average Net Assets
(excluding dividend and interest expenses
relating to short sales)# | | | 3.50 | % | | | 5.99 | % | | | 6.38 | % | | | 8.88 | %*@ | |
Ratio of Net Expenses to Average Net Assets | | | 1.72 | % | | | 3.24 | % | | | 3.22 | % | | | 3.25 | %*@ | |
Ratio of Net Expenses to Average Net Assets
(excluding dividend and interest expenses relating
to short sales) | | | 1.54 | % | | | 2.40 | % | | | 2.40 | % | | | 2.69 | %*@ | |
Ratio of Net Investment Income/(Loss) to
Average Net Assets | | | (0.24 | )% | | | (1.33 | )% | | | (1.30 | )% | | | (1.21 | )%*@ | |
Portfolio Turnover Rate (including securities sold short) | | | 368 | % | | | 547 | % | | | 490 | % | | | 264 | %** | |
Portfolio Turnover Rate (excluding securities sold short) | | | 342 | % | | | 546 | % | | | 517 | % | | | 213 | %** | |
See Notes to Financial Highlights
29
Notes to Financial Highlights U.S. Equity Index PutWrite Strategy Portfolio
†† Total return based on per share NAV reflects the effects of changes in NAV on the performance of the Fund during each fiscal period. Returns assume income dividends and other distributions, if any, were reinvested. Results represent past performance and do not indicate future results. Current returns may be lower or higher than the performance data quoted. Investment returns and principal may fluctuate and shares when redeemed may be worth more or less than original cost. Total return would have been lower if Management had not reimbursed and/or waived certain expenses. The total return information shown does not reflect charges and other expenses that apply to the separate accounts or the related insurance policies or other qualified pension or retirement plans, and the inclusion of these charges and other expenses would reduce the total return for all fiscal periods shown.
‡ Calculated based on the average number of shares outstanding during each fiscal period.
# Represents the annualized ratios of net expenses to average daily net assets if Management had not reimbursed Certain expenses and/or waived a portion of the investment management fee.
@ Organization expense, which is a non-recurring expense, is included in these ratios on a non-annualized basis.
* Annualized.
** Not annualized.
^ The date investment operations commenced.
§§ Effective May 1, 2017, Absolute Return Multi-Manager Portfolio changed its name to U.S. Equity Index PutWrite Strategy Portfolio and also made other changes as described in Note A of the Notes to Financial Statements. Please refer to Note A for additional, important information.
30
Report of Independent Registered Public Accounting Firm
To the Board of Trustees of
Neuberger Berman Advisers Management Trust and
Shareholders of U.S. Equity Index PutWrite Strategy Portfolio
Opinion on the Financial Statements
We have audited the accompanying statement of assets and liabilities of U.S. Equity Index PutWrite Strategy Portfolio (formerly, Absolute Return Multi-Manager Portfolio) (the "Portfolio") (one of the portfolios constituting Neuberger Berman Advisers Management Trust (the "Trust")), including the schedule of investments, as of December 31, 2017, and the related statement of operations for the year then ended, the statements of changes in net assets for each of the two years in the period then ended, the financial highlights for each of the periods indicated therein and the related notes (collectively referred to as the "financial statements"). In our opinion, the financial statements present fairly, in all material respects, the financial position of U.S. Equity Index PutWrite Strategy Portfolio (one of the portfolios constituting Neuberger Berman Advisers Management Trust) at December 31, 2017, the results of its operations for the year then ended, the changes in its net assets for each of the two years in the period then ended and its financial highlights for each of the periods indicated therein, in conformity with U.S. generally accepted accounting principles.
Basis for Opinion
These financial statements are the responsibility of the Trust's management. Our responsibility is to express an opinion on the Portfolio's financial statements based on our audits. We are a public accounting firm registered with the Public Company Accounting Oversight Board (United States) ("PCAOB") and are required to be independent with respect to the Trust in accordance with the U.S. federal securities laws and the applicable rules and regulations of the Securities and Exchange Commission and the PCAOB.
We conducted our audits in accordance with the standards of the PCAOB. Those standards require that we plan and perform the audit to obtain reasonable assurance about whether the financial statements are free of material misstatement, whether due to error or fraud. The Trust is not required to have, nor were we engaged to perform, an audit of the Trust's internal control over financial reporting. As part of our audits, we are required to obtain an understanding of internal control over financial reporting, but not for the purpose of expressing an opinion on the effectiveness of the Trust's internal control over financial reporting. Accordingly, we express no such opinion.
Our audits included performing procedures to assess the risks of material misstatement of the financial statements, whether due to error or fraud, and performing procedures that respond to those risks. Such procedures included examining, on a test basis, evidence regarding the amounts and disclosures in the financial statements. Our procedures included confirmation of securities owned as of December 31, 2017, by correspondence with the custodian and brokers or by other appropriate auditing procedures where replies from brokers were not received. Our audits also included evaluating the accounting principles used and significant estimates made by management, as well as evaluating the overall presentation of the financial statements. We believe that our audits provide a reasonable basis for our opinion.

We have served as the auditor of one or more Neuberger Berman investment companies since 1954.
Boston, Massachusetts
February 16, 2018
31
The following tables set forth information concerning the Trustees and Officers of the Fund. All persons named as Trustees and Officers also serve in similar capacities for other funds administered or managed by NBIA (formerly, Neuberger Berman Fixed Income LLC ("NBFI") and including predecessor entities). The Fund's Statement of Additional Information includes additional information about the Trustees as of the time of the Fund's most recent public offering and is available upon request, without charge, by calling (800) 877-9700.
Information about the Board of Trustees
Name, (Year of Birth),
and Address(1) | | Position(s)
and Length of
Time Served(2) | | Principal Occupation(s)(3) | | Number of
Funds in Fund
Complex
Overseen by
Fund Trustee | | Other Directorships
Held Outside Fund
Complex by Fund
Trustee(3) | |
Independent Fund Trustees | |
Michael J. Cosgrove (1949) | | Trustee since 2015 | | President, Carragh Consulting USA, since 2014; formerly, Executive, General Electric Company, 1970 to 2014, including President, Mutual Funds and Global Investment Programs, GE Asset Management, 2011 to 2014, President and Chief Executive Officer, Mutual Funds and Intermediary Business, GE Asset Management, 2007 to 2011, President, Institutional Sales and Marketing, GE Asset Management, 1998 to 2007, and Chief Financial Officer, GE Asset Management, and Deputy Treasurer, GE Company, 1988 to 1993. | | | 56 | | | Director, America Press, Inc. (not-for-profit Jesuit publisher), since 2015; Director, Fordham University, since 2001; formerly, Director, The Gabelli Go Anywhere Trust, June 2015 to June 2016; Director, Skin Cancer Foundation (not-for-profit), 2006 to 2015; Director, GE Investments Funds, Inc., 1997 to 2014; Trustee, GE Institutional Funds, 1997 to 2014; Director, GE Asset Management, 1988 to 2014; Director, Elfun Trusts, 1988 to 2014; Trustee, GE Pension & Benefit Plans, 1988 to 2014. | |
Marc Gary (1952) | | Trustee since 2015 | | Executive Vice Chancellor and Chief Operating Officer, Jewish Theological Seminary, since 2012; formerly, Executive Vice President and General Counsel, Fidelity Investments, 2007 to 2012; Executive Vice President and General Counsel, BellSouth Corporation, 2004 to 2007; Vice President and Associate General Counsel, BellSouth Corporation, 2000 to 2004; Associate, Partner, and National Litigation Practice Co-Chair, Mayer, Brown LLP, 1981 to 2000; Associate Independent Counsel, Office of Independent Counsel, 1990 to 1992. | | | 56 | | | Trustee, Jewish Theological Seminary, since 2015; Director, Counsel on Call (privately held for-profit company), since 2012; Director, Lawyers Committee for Civil Rights Under Law (not-for-profit), since 2005; formerly, Director, Equal Justice Works (not-for-profit), 2005 to 2014; Director, Corporate Counsel Institute, Georgetown University Law Center, 2007 to 2012; Director, Greater Boston Legal Services (not-for-profit), 2007 to 2012. | |
32
Name, (Year of Birth),
and Address(1) | | Position(s)
and Length of
Time Served(2) | | Principal Occupation(s)(3) | | Number of
Funds in Fund
Complex
Overseen by
Fund Trustee | | Other Directorships
Held Outside Fund
Complex by Fund
Trustee(3) | |
Martha C. Goss (1949) | | Trustee since 2007 | | President, Woodhill Enterprises Inc./Chase Hollow Associates LLC (personal investment vehicle), since 2006; formerly, Consultant, Resources Global Professionals (temporary staffing), 2002 to 2006. | | | 56 | | | Director, American Water (water utility), since 2003; Director, Allianz Life of New York (insurance), since 2005; Director, Berger Group Holdings, Inc. (engineering consulting firm), since 2013; Director, Financial Women's Association of New York (not-for-profit association), since 2003; Trustee Emerita, Brown University, since 1998; Director, Museum of American Finance (not-for-profit), since 2013; formerly, Non-Executive Chair and Director, Channel Reinsurance (financial guaranty reinsurance), 2006 to 2010; formerly, Director, Ocwen Financial Corporation (mortgage servicing), 2005 to 2010; formerly, Director, Claire's Stores, Inc. (retailer), 2005 to 2007; formerly, Director, Parsons Brinckerhoff Inc. (engineering consulting firm), 2007 to 2010; formerly, Director, Bank Leumi (commercial bank), 2005 to 2007; formerly, Advisory Board Member, Attensity (software developer), 2005 to 2007. | |
Michael M. Knetter (1960) | | Trustee since 2007 | | President and Chief Executive Officer, University of Wisconsin Foundation, since October 2010; formerly, Dean, School of Business, University of Wisconsin - Madison; formerly, Professor of International Economics and Associate Dean, Amos Tuck School of Business - Dartmouth College, 1998 to 2002. | | | 56 | | | Board Member, American Family Insurance (a mutual company, not publicly traded), since March 2009; formerly, Trustee, Northwestern Mutual Series Fund, Inc., 2007 to 2011; formerly, Director, Wausau Paper, 2005 to 2011; formerly, Director, Great Wolf Resorts, 2004 to 2009. | |
33
Name, (Year of Birth),
and Address(1) | | Position(s)
and Length of
Time Served(2) | | Principal Occupation(s)(3) | | Number of
Funds in Fund
Complex
Overseen by
Fund Trustee | | Other Directorships
Held Outside Fund
Complex by Fund
Trustee(3) | |
Deborah C. McLean (1954) | | Trustee since 2015 | | Member, Circle Financial Group (private wealth management membership practice), since 2011; Managing Director, Golden Seeds LLC (an angel investing group), since 2009; Adjunct Professor, Columbia University School of International and Public Affairs, since 2008; formerly, Visiting Assistant Professor, Fairfield University, Dolan School of Business, Fall 2007; formerly, Adjunct Associate Professor of Finance, Richmond, The American International University in London, 1999 to 2007. | | | 56 | | | Board member, Norwalk Community College Foundation, since 2014; Dean's Advisory Council, Radcliffe Institute for Advanced Study, since 2014; formerly, Director and Treasurer, At Home in Darien (not-for-profit), 2012 to 2014; Director, National Executive Service Corps (not-for-profit), 2012 to 2013; Trustee, Richmond, The American International University in London, 1999 to 2013. | |
George W. Morriss (1947) | | Trustee since 2007 | | Adjunct Professor, Columbia University School of International and Public Affairs, since October 2012; formerly, Executive Vice President and Chief Financial Officer, People's United Bank, Connecticut (a financial services company), 1991 to 2001. | | | 56 | | | Director, National Association of Corporate Directors, Connecticut Chapter, since 2011; Trustee, Steben Alternative Investment Funds, Steben Select Multi-Strategy Fund, and Steben Select Multi-Strategy Master Fund, since 2013; formerly, Treasurer, National Association of Corporate Directors, Connecticut Chapter, 2011 to 2015; formerly, Manager, Larch Lane Multi-Strategy Fund complex (which consisted of three funds), 2006 to 2011; formerly, Member, NASDAQ Issuers' Affairs Committee, 1995 to 2003. | |
34
Name, (Year of Birth),
and Address(1) | | Position(s)
and Length of
Time Served(2) | | Principal Occupation(s)(3) | | Number of
Funds in Fund
Complex
Overseen by
Fund Trustee | | Other Directorships
Held Outside Fund
Complex by Fund
Trustee(3) | |
Tom D. Seip (1950) | | Trustee since 2000; Chairman of the Board since 2008; formerly Lead Independent Trustee from 2006 to 2008 | | General Partner, Ridgefield Farm LLC (a private investment vehicle); formerly, President and CEO, Westaff, Inc. (temporary staffing), May 2001 to January 2002; formerly, Senior Executive, The Charles Schwab Corporation, 1983 to 1998, including Chief Executive Officer, Charles Schwab Investment Management, Inc.; Trustee, Schwab Family of Funds and Schwab Investments, 1997 to 1998; and Executive Vice President-Retail Brokerage, Charles Schwab & Co., Inc., 1994 to 1997. | | | 56 | | | Director, H&R Block, Inc. (financial services company), since May 2001; Chairman, Governance and Nominating Committee, H&R Block, Inc., since 2011; formerly, Chairman, Compensation Committee, H&R Block, Inc., 2006 to 2010; formerly, Director, Forward Management, Inc. (asset management company), 1999 to 2006. | |
James G. Stavridis (1955) | | Trustee since 2015 | | Dean, Fletcher School of Law and Diplomacy, Tufts University since 2013; formerly, Admiral, United States Navy, 2006 to 2013, including Supreme Allied Commander, NATO and Commander, European Command, 2009 to 2013, and Commander, United States Southern Command, 2006 to 2009. | | | 56 | | | Director, Utilidata Inc., since 2015; Director, BMC Software Federal, LLC, since 2014; Director, Vertical Knowledge, LLC, since 2013; formerly, Director, Navy Federal Credit Union, 2000-2002. | |
35
Name, (Year of Birth),
and Address(1) | | Position(s)
and Length of
Time Served(2) | | Principal Occupation(s)(3) | | Number of
Funds in Fund
Complex
Overseen by
Fund Trustee | | Other Directorships
Held Outside Fund
Complex by Fund
Trustee(3) | |
Candace L. Straight (1947) | | Trustee since 1999 | | Private investor and consultant specializing in the insurance industry; formerly, Advisory Director, Securitas Capital LLC (a global private equity investment firm dedicated to making investments in the insurance sector), 1998 to 2003. | | | 56 | | | Formerly, Public Member, Board of Governors and Board of Trustees, Rutgers University, 2011 to 2016; formerly, Director, Montpelier Re Holdings Ltd. (reinsurance company), 2006 to 2015; formerly, Director, National Atlantic Holdings Corporation (property and casualty insurance company), 2004 to 2008; formerly, Director, The Proformance Insurance Company (property and casualty insurance company), 2004 to 2008; formerly, Director, Providence Washington Insurance Company (property and casualty insurance company), 1998 to 2006; formerly, Director, Summit Global Partners (insurance brokerage firm), 2000 to 2005. | |
Peter P. Trapp (1944) | | Trustee since 1984 | | Retired; formerly, Regional Manager for Mid-Southern Region, Ford Motor Credit Company, September 1997 to 2007; formerly, President, Ford Life Insurance Company, April 1995 to August 1997. | | | 56 | | | None. | |
36
Name, (Year of Birth),
and Address(1) | | Position(s)
and Length of
Time Served(2) | | Principal Occupation(s)(3) | | Number of
Funds in Fund
Complex
Overseen by
Fund Trustee | | Other Directorships
Held Outside Fund
Complex by Fund
Trustee(3) | |
Fund Trustees who are "Interested Persons" | |
Joseph V. Amato* (1962) | | Trustee since 2009 | | President and Director, Neuberger Berman Group LLC, since 2009; President and Chief Executive Officer, Neuberger Berman BD LLC ("Neuberger Berman") and Neuberger Berman Holdings LLC (including its predecessor, Neuberger Berman Inc.), since 2007; Chief Investment Officer (Equities) and President (Equities), NBIA, since 2007, and Board Member of NBIA since 2006; formerly, Global Head of Asset Management of Lehman Brothers Holdings Inc.'s ("LBHI") Investment Management Division, 2006 to 2009; formerly, member of LBHI's Investment Management Division's Executive Management Committee, 2006 to 2009; formerly, Managing Director, Lehman Brothers Inc. ("LBI"), 2006 to 2008; formerly, Chief Recruiting and Development Officer, LBI, 2005 to 2006; formerly, Global Head of LBI's Equity Sales and a Member of its Equities Division Executive Committee, 2003 to 2005. | | | 56 | | | Member of Board of Advisors, McDonough School of Business, Georgetown University, since 2001; Member of New York City Board of Advisors, Teach for America, since 2005; Trustee, Montclair Kimberley Academy (private school), since 2007; Member of Board of Regents, Georgetown University, since 2013. | |
37
Name, (Year of Birth),
and Address(1) | | Position(s)
and Length of
Time Served(2) | | Principal Occupation(s)(3) | | Number of
Funds in Fund
Complex
Overseen by
Fund Trustee | | Other Directorships
Held Outside Fund
Complex by Fund
Trustee(3) | |
Robert Conti* (1956) | | Chief Executive Officer, President and Trustee since 2008; prior thereto, Executive Vice President in 2008 and Vice President from 2000 to 2008 | | Managing Director, Neuberger Berman, since 2007; President—Mutual Funds, NBIA, since 2008; formerly, Senior Vice President, Neuberger Berman, 2003 to 2006; formerly, Vice President, Neuberger Berman, 1999 to 2003; President and Chief Executive Officer, twenty-six registered investment companies for which NBIA acts as investment manager and/or administrator. | | | 56 | | | Director, Staten Island Mental Health Society, since 1994; formerly, Chairman of the Board, Staten Island Mental Health Society, 2008 to 2011. | |
(1) The business address of each listed person is 1290 Avenue of the Americas, New York, NY 10104.
(2) Pursuant to the Trust's Trust Instrument, subject to any limitations on the term of service imposed by the By-Laws or any retirement policy adopted by the Trustees, each of these Trustees shall hold office for life or until his or her successor is elected or the Trust terminates; except that (a) any Trustee may resign by delivering a written resignation; (b) any Trustee may be removed with or without cause at any time by a written instrument signed by at least two-thirds of the other Trustees; (c) any Trustee who requests to be retired, or who has become unable to serve, may be retired by a written instrument signed by a majority of the other Trustees; and (d) any Trustee may be removed at any shareholder meeting by a vote of at least two-thirds of the outstanding shares.
(3) Except as otherwise indicated, each individual has held the positions shown during at least the last five years.
* Indicates a Trustee who is an "interested person" within the meaning of the 1940 Act. Mr. Amato and Mr. Conti are interested persons of the Trust by virtue of the fact that each is an officer of NBIA and/or its affiliates.
38
Information about the Officers of the Trust
Name, (Year of Birth),
and Address(1) | | Position(s)
and Length of
Time Served(2) | | Principal Occupation(s)(3) | |
Claudia A. Brandon (1956) | | Executive Vice President since 2008 and Secretary since 1985 | | Senior Vice President, Neuberger Berman, since 2007 and Employee since 1999; Senior Vice President, NBIA, since 2008 and Assistant Secretary since 2004; formerly, Vice President, Neuberger Berman, 2002 to 2006; formerly, Vice President—Mutual Fund Board Relations, NBIA, 2000 to 2008; formerly, Vice President, NBIA, 1986 to 1999 and Employee, 1984 to 1999; Executive Vice President and Secretary, twenty-six registered investment companies for which NBIA acts as investment manager and/or administrator. | |
Agnes Diaz (1971) | | Vice President since 2013 | | Senior Vice President, Neuberger Berman, since 2012; Senior Vice President, NBIA, since 2012 and Employee since 1996; formerly, Vice President, Neuberger Berman, 2007 to 2012; Vice President, ten registered investment companies for which NBIA acts as investment manager and/or administrator. | |
Anthony DiBernardo (1979) | | Assistant Treasurer since 2011 | | Senior Vice President, Neuberger Berman, since 2014; Senior Vice President, NBIA, since 2014, and Employee since 2003; formerly, Vice President, Neuberger Berman, 2009 to 2014; Assistant Treasurer, ten registered investment companies for which NBIA acts as investment manager and/or administrator. | |
Corey A. Issing (1978) | | Chief Legal Officer since 2016 (only for purposes of sections 307 and 406 of the Sarbanes-Oxley Act of 2002) and Anti-Money Laundering Compliance Officer since 2016 | | General Counsel and Head of Compliance—Mutual Funds since 2016 and Managing Director, NBIA, since 2017; formerly, Associate General Counsel (2015 to 2016), Counsel (2007 to 2015), Senior Vice President (2013-2016), Vice President (2009 – 2013); Chief Legal Officer (only for purposes of sections 307 and 406 of the Sarbanes-Oxley Act of 2002), twenty-six registered investment companies for which NBIA acts as investment manager and/or administrator; Anti-Money Laundering Compliance Officer, twenty-six registered investment companies for which NBIA acts as investment manager and/or administrator. | |
Sheila R. James (1965) | | Assistant Secretary since 2002 | | Vice President, Neuberger Berman, since 2008 and Employee since 1999; Vice President, NBIA, since 2008; formerly, Assistant Vice President, Neuberger Berman, 2007; Employee, NBIA, 1991 to 1999; Assistant Secretary, twenty-six registered investment companies for which NBIA acts as investment manager and/or administrator. | |
Brian Kerrane (1969) | | Chief Operating Officer since 2015 and Vice President since 2008 | | Managing Director, Neuberger Berman, since 2013; Chief Operating Officer—Mutual Funds and Managing Director, NBIA, since 2015; formerly, Senior Vice President, Neuberger Berman, 2006 to 2014; Vice President, NBIA, 2008 to 2015 and Employee since 1991; Chief Operating Officer, ten registered investment companies for which NBIA acts as investment manager and/or administrator; Vice President, twenty-six registered investment companies for which NBIA acts as investment manager and/or administrator. | |
39
Name, (Year of Birth),
and Address(1) | | Position(s)
and Length of
Time Served(2) | | Principal Occupation(s)(3) | |
Anthony Maltese (1959) | | Vice President since 2015 | | Senior Vice President, Neuberger Berman, since 2014 and Employee since 2000; Senior Vice President, NBIA, since 2014; Vice President, ten registered investment companies for which NBIA acts as investment manager and/or administrator. | |
Josephine Marone (1963) | | Assistant Secretary since 2017 | | Senior Paralegal, Neuberger Berman, since 2007 and Employee since 2007; Assistant Secretary, twenty-six registered investment companies for which NBIA acts as investment manager and/or administrator. | |
Owen F. McEntee, Jr. (1961) | | Vice President since 2008 | | Vice President, Neuberger Berman, since 2006; Vice President, NBIA, since 2006 and Employee since 1992; Vice President, ten registered investment companies for which NBIA acts as investment manager and/or administrator. | |
John M. McGovern (1970) | | Treasurer and Principal Financial and Accounting Officer since 2005 | | Senior Vice President, Neuberger Berman, since 2007; Senior Vice President, NBIA, since 2007 and Employee since 1993; formerly, Vice President, Neuberger Berman, 2004 to 2006; formerly, Assistant Treasurer, 2002 to 2005; Treasurer and Principal Financial and Accounting Officer, twenty-six registered investment companies for which NBIA acts as investment manager and/or administrator. | |
Frank Rosato (1971) | | Assistant Treasurer since 2005 | | Vice President, Neuberger Berman, since 2006; Vice President, NBIA, since 2006 and Employee since 1995; Assistant Treasurer, ten registered investment companies for which NBIA acts as investment manager and/or administrator. | |
Chamaine Williams (1971) | | Chief Compliance Officer since 2005 | | Chief Compliance Officer—Mutual Funds and Senior Vice President, NBIA, since 2006; formerly, Senior Vice President, LBI, 2007 to 2008; formerly, Vice President, LBI, 2003 to 2006; formerly, Chief Compliance Officer, Lehman Brothers Asset Management Inc., 2003 to 2007; formerly, Chief Compliance Officer, Lehman Brothers Alternative Investment Management LLC, 2003 to 2007; Chief Compliance Officer, twenty-six registered investment companies for which NBIA acts as investment manager and/or administrator. | |
(1) The business address of each listed person is 1290 Avenue of the Americas, New York, NY 10104.
(2) Pursuant to the By-Laws of the Trust, each officer elected by the Fund Trustees shall hold office until his or her successor shall have been elected and qualified or until his or her earlier death, inability to serve, or resignation. Officers serve at the pleasure of the Fund Trustees and may be removed at any time with or without cause.
(3) Except as otherwise indicated, each individual has held the positions shown during at least the last five years
40
Proxy Voting Policies and Procedures
A description of the policies and procedures that the Trust uses to determine how to vote proxies relating to portfolio securities is available, without charge, by calling 800-877-9700 (toll-free) and on the Securities and Exchange Commission's website at www.sec.gov. Information regarding how the Trust voted proxies relating to portfolio securities during the most recent 12-month period ended June 30 is also available upon request, without charge, by calling 800-877-9700 (toll-free), on the Securities and Exchange Commission's website at www.sec.gov, and on Management's website at www.nb.com.
Quarterly Portfolio Schedule
The Trust files a complete schedule of portfolio holdings for the Fund with the Securities and Exchange Commission for the first and third quarters of each fiscal year on Form N-Q. The Trust's Forms N-Q are available on the Securities and Exchange Commission's website at www.sec.gov and may be reviewed and copied at the Securities and Exchange Commission's Public Reference Room in Washington, DC. Information on the operation of the Public Reference Room may be obtained by calling 800-SEC-0330. The information on Form N-Q is available upon request, without charge, by calling 800-877-9700 (toll free).
Board Consideration of the Management Agreement
On an annual basis, the Board of Trustees (the "Board") of Neuberger Berman Advisers Management Trust (the "Trust"), including the Trustees who are not "interested persons" of the Trust or of Neuberger Berman Investment Advisers LLC ("NBIA" or "Management") (including its affiliates) ("Independent Fund Trustees"), considers whether to continue the management agreement with Management (the "Agreement") with respect to the U.S. Equity Index PutWrite Strategy Portfolio (the "Fund"). Throughout the process, the Independent Fund Trustees are advised by counsel that is experienced in Investment Company Act of 1940 matters and that is independent of Management ("Independent Counsel"). At a meeting held on September 28, 2017, the Board, including the Independent Fund Trustees, approved the continuation of the Agreement for the Fund.
In evaluating the Agreement, the Board, including the Independent Fund Trustees, reviewed extensive materials provided by Management in response to questions submitted by the Independent Fund Trustees and Independent Counsel, and met with senior representatives of Management regarding its personnel, operations and financial condition as they relate to the Fund. The annual contract review extends over at least two regular meetings of the Board to ensure that Management has time to respond to any questions the Independent Fund Trustees may have on their initial review of the materials and that the Independent Fund Trustees have time to consider those responses.
In connection with its deliberations, the Board also considered the broad range of information relevant to the annual contract review that is provided to the Board (including its various standing committees) at meetings throughout the year, including reports on investment performance, portfolio risk and other portfolio information for the Fund, including the use of derivatives, as well as periodic reports on, among other matters, pricing and valuation; brokerage and execution; compliance; and shareholder and other services provided by Management and its affiliates. The Contract Review Committee, which is comprised of Independent Fund Trustees, was established by the Board to assist in its deliberations regarding the annual contract review. The Board has also established other committees that focus throughout the year on specific areas relevant to the annual contract review, such as Fund performance or compliance matters, and that are charged with specific responsibilities regarding the annual contract review. Those committees provide reports to the Contract Review Committee and the full Board, which consider that information as part of the annual contract review process. The Board's Contract Review Committee annually considers and updates the questions it asks of Management in light of developments in the industry, in the markets, in mutual fund regulation and litigation, and in Management's business model.
41
The Independent Fund Trustees received from Independent Counsel a memorandum discussing the legal standards for their consideration of the proposed continuation of the Agreement. During the course of the year and during their deliberations regarding the annual contract review, the Contract Review Committee and the Independent Fund Trustees met with Independent Counsel separately from representatives of Management.
Provided below is a description of the Board's contract approval process and the material factors that the Board considered at its meetings regarding the renewal of the Agreement and the compensation to be paid thereunder. In connection with its approval of the continuation of the Agreement, the Board evaluated the terms of the Agreement, the overall fairness of the Agreement to the Fund and whether the Agreement was in the best interests of the Fund and Fund shareholders. The Board's determination to approve the continuation of the Agreement was based on a comprehensive consideration of all information provided to the Board throughout the year and specifically in connection with the annual contract review.
This description is not intended to include all of the factors considered by the Board. The Board members did not identify any particular information or factor that was all-important or controlling, and each Trustee may have attributed different weights to the various factors. The Board focused on the costs and benefits of the Agreement to the Fund and, through the Fund, its shareholders.
Nature, Extent and Quality of Services
With respect to the nature, extent and quality of the services provided, the Board considered the investment philosophy and decision-making processes of, and the qualifications, experience, and capabilities of, and the resources available to, the portfolio management personnel of Management who perform services for the Fund. The Board noted that Management also provides certain administrative services, including fund accounting and compliance services. The Board also considered Management's policies and practices regarding brokerage, commissions and other trading costs, and allocation of portfolio transactions and reviewed the quality of the execution services that Management had provided. The Board also reviewed whether Management used brokers to execute Fund transactions that provide research and other services to Management. Moreover, the Board considered Management's approach to potential conflicts of interest between the Fund's investments and those of other funds or accounts managed by Management.
The Board noted the extensive range of services that Management provides to the Fund beyond the investment management services. The Board noted that Management is also responsible for monitoring compliance with the Fund's investment objectives, policies and restrictions, as well as compliance with applicable law. The Board considered that Management's responsibilities include continual management of investment, operational, enterprise, legal, regulatory and compliance risks as they relate to the Fund, and considered information regarding Management's processes for managing risk. It also noted Management's activities under its contractual obligation to oversee the Fund's various outside service providers, including its renegotiation of certain service providers' fees and its evaluation of service providers' infrastructure, cybersecurity programs and business continuity programs, among other matters. The Board also considered Management's ongoing development of its own infrastructure and information technology to support the Fund through, among other things, cybersecurity, business continuity planning, and risk management. In addition, the Board noted the positive compliance history of Management, as no significant compliance problems were reported to the Board with respect to the firm. The Board also considered the general structure of the portfolio manager's compensation and whether this structure provides appropriate incentives to act in the best interests of the Fund. The Board also considered the ability of Management to attract and retain qualified personnel to service the Fund.
The Board noted that Management assumes significant ongoing risks with respect to all Funds, including investment, operational, enterprise, litigation, regulatory and compliance risks, for which Management is entitled to compensation. The Board also noted that when Management launches a new fund or share class, it assumes entrepreneurial risk with respect to that fund or share class, and that some new funds and share classes have been liquidated without ever having been profitable to Management.
42
As in past years, the Board also considered the manner in which Management addressed various matters that arose during the year, some of them a result of developments in the broader fund industry or the regulations governing it, including the Department of Labor Fiduciary Rule. In addition, the Board considered actions taken by Management in response to recent market conditions and considered the overall performance of Management in this context.
Fund Performance
Because the Fund had adopted a completely new investment strategy on May 1, 2017, the Board did not have Fund performance data for the period under review. In approving the new investment strategy, the Board did consider Management's performance history in private accounts managed in the same strategy.
Fee Rates, Profitability, and Fall-out Benefits
With respect to the overall fairness of the Agreement, the Board noted that the management fee was substantially reduced at the time the new investment strategy was adopted on May 1, 2017. The Board considered the new, lower fee structure for the Fund under the Agreement as compared to a group of retail funds following a similar investment strategy provided by Management in 2016. The Board reviewed a comparison of the Fund's management fee and total expense ratio to the peer group.
The Board considered the Fund's contractual and actual management fees. (The actual management fees are the contractual management fees reduced by any fee waivers or other adjustments.) In addition, the Board considered the contractual limit on expenses of the Fund. In addition, the Board noted that the Fund's size, which impacts its expenses and performance, has been affected by ongoing changes in the insurance market.
The Board also reviewed specific data as to Management's profit or loss on the Fund for a recent period on a pre-tax basis without regard to distribution expenses, including year-over-year changes in each of Management's reported expense categories. (This review related to Management's profit or loss under the higher fee rate that accompanied the prior investment strategy.) (The Board also reviewed data on Management's profit or loss on the Fund after distribution expenses and taxes were factored in, as indicators of the health of the business and the extent to which Management is directing its profits into the growth of the business.) The Board considered the cost allocation methodology that Management used in developing its profitability figures. The Board engaged an independent forensic accountant to review the profitability methodology utilized by Management when preparing this information and discussed with the consultant its conclusion that Management's process for calculating and reporting its profit or loss was not unreasonable. Recognizing that there is no uniform methodology within the asset management industry for determining profitability for this purpose and that the use of different reasonable methodologies can give rise to different profit and loss results, the Board requested from Management examples of profitability calculated by different methods and noted that the profitability levels were still reasonable when calculated by these other methods. In addition, the Board recognized that Management's calculations regarding its costs may not reflect all risks, including regulatory, legal, operational, reputational, and, where appropriate, entrepreneurial risks, associated with offering and managing a mutual fund in the current regulatory and market environment. The Board also considered any fall-out (i.e. indirect) benefits likely to accrue to Management or its affiliates from their relationship with the Fund. The Board noted that Management had incurred a loss on its operation of the Fund under the prior investment strategy.
Information Regarding Services to Other Clients
The Board also considered other funds or separate accounts that were advised or sub-advised by Management or its affiliates with investment objectives, policies and strategies that were similar to those of the Fund. The Board compared the fees charged to the Fund to the fees charged to such comparable funds and/or separate accounts. The Board considered the appropriateness and reasonableness of any differences between the fees charged to the Fund and such comparable funds and/or separate accounts, and determined that differences in fees and fee structures were consistent with the differences in the management and other services provided. The Board explored with Management its assertion
43
that although, generally, the rates of fees paid by such accounts (other than mutual funds) were lower than the fee rates paid by the corresponding Fund, the differences reflected Management's greater level of responsibilities and significantly broader scope of services regarding the Fund, the more extensive regulatory obligations and risks associated with managing the Fund, and other financial considerations with respect to creation and sponsorship of the Fund.
Economies of Scale
The Board also evaluated apparent or anticipated economies of scale in relation to the services Management provides to the Fund. The Board considered that the Fund's fee structure does not provide for a reduction of payments resulting from the use of breakpoints, and concluded that the lack of breakpoints was reasonable based on Management's representation that it shared economies of scale by proposing an advisory fee level at the Fund's inception as if it were already at scale.
Conclusions
In approving the continuation of the Agreement, the Board concluded that, in its business judgment, the terms of the Agreement are fair and reasonable to the Fund and that approval of the continuation of the Agreement is in the best interests of the Fund and its shareholders. In reaching this determination, the Board considered that Management could be expected to continue to provide a high level of service to the Fund; that the Fund's fee structure appeared to the Board to be reasonable given the nature, extent and quality of services provided; and that the benefits accruing to Management and its affiliates by virtue of their relationship with the Fund were reasonable in light of the costs of providing the investment advisory and other services and the benefits accruing to the Fund. The Board's conclusions may be based in part on its consideration of materials prepared in connection with the approval or continuance of the Agreement in prior years and on the Board's ongoing regular review of Fund performance and operations throughout the year, in addition to material prepared specifically for the most recent annual review of the Agreement.
44