Neuberger Berman
Advisers Management Trust
Mid Cap Growth Portfolio
I Class Shares
S Class Shares
Annual Report
December 31, 2014
Mid Cap Growth Portfolio Commentary (Unaudited)
The Neuberger Berman Advisers Management Trust Mid Cap Growth Portfolio (the "Fund") Class I generated a 7.58% total return for the 12 months ended December 31, 2014, lagging its benchmark, the Russell Midcap® Growth Index, which returned 11.90% during the period. Returns for the Fund's Class I and Class S shares are provided in the table immediately following this letter.
Looking back at a volatile, but positive, year for equities, U.S. Federal Reserve (Fed) comments continued to underscore the likelihood of a return to a more normalized interest rate environment. This "hawkish" tilt, easily digested by the markets, was likely the product, in our view, of the U.S. economy's continued measured growth, resiliency towards economic-fueled "walls of worry" emanating from Asia and Europe, and a number of positive trends, most notably low inflation, broad stimulus from falling oil prices, strong corporate earnings, continued incremental gains in housing and employment in the U.S., and the potential for a working truce in Washington with the return of two-party parity. These factors and a strengthening dollar also boosted the buying power and sentiment of consumers, a key component to any meaningful economic expansion. Of equal importance to our higher-qualitative and higher-growth investment approach was the surge in capital reinvestment as companies ramped up efforts focused on growing their franchises and expanding market share. This marked a departure from the short-term shareholder appeasement via dividend and share repurchase programs that had largely defined corporate investment strategy over the last three plus years. The net effect was a long-overdue rotation back towards fundamentals, which in turn ushered in a change of market leadership in the second half of 2014 that rewarded active management and stocks offering positive differentiation versus their peers and the broader market.
With respect to attribution highlights, our underweight in the Energy sector proved additive, overcoming our underweight to Consumer Staples, a sector that offered strong performance in the first half of the year. Negative stock selection, amplified by a Fed-induced stylistic rotation away from higher beta industries in the first half of the year, was the principal culprit behind our 2014 underperformance compared to the benchmark, as positive contributions from Information Technology and Materials could not overcome broad weakness from Health Care, Energy and Industrials. Our stock selection during the first half of 2014 proved especially frustrating as the market largely ignored what we believe are generally strong execution and fundamentals across our holdings.
Drilling down to our holdings over the fiscal year, Avago Technologies was the top contributor to performance, while Oasis Petroleum was the leading detractor. Avago, a designer, developer and supplier of analog semiconductors, consistently delivered strong fundamentals, boosted by the integration of recently acquired LSI Logic and its increased participation in Apple's iPhone 6. Oasis, an independent exploration and production company focused on unconventional oil and natural gas resources, primarily in Montana and North Dakota, was negatively impacted by the precipitous drop in oil prices in 2014. We exited this position in the fourth quarter.
Looking ahead, we still believe U.S. equities remain the place to be. In our opinion, the markets are ready for the long overdue tightening of monetary policy and we believe that fundamentals could continue to increase in relevancy as investors re-embrace higher-growth and higher-expectation stories.
Sincerely,
KENNETH J. TUREK
PORTFOLIO MANAGER
Information about principal risks of investing in the Fund is set forth in the prospectus and statement of additional information.
The portfolio composition, industries and holdings of the Fund are subject to change.
The opinions expressed are those of the Fund's portfolio manager. The opinions are as of the date of this report, and are subject to change without notice.
Mid Cap Growth Portfolio (Unaudited)
SECTOR ALLOCATION
(as a % of Total Investments) | |
Consumer Discretionary | | | 20.8 | % | |
Consumer Staples | | | 3.5 | | |
Energy | | | 1.9 | | |
Financials | | | 6.7 | | |
Health Care | | | 17.1 | | |
Industrials | | | 14.4 | | |
Information Technology | | | 23.6 | | |
Materials | | | 2.0 | | |
Telecommunication Services | | | 1.8 | | |
Other | | | 2.3 | | |
Short-Term Investments | | | 5.9 | | |
Total | | | 100.0 | % | |
PERFORMANCE HIGHLIGHTS
| | |
Inception | | Average Annual Total Return
Ended 12/31/2014 | |
| | | Date | | 1 Year | | 5 Years | | 10 Years | | Life of Fund | |
Mid Cap Growth
Portfolio Class I | |
11/03/1997 | | | 7.58 | % | | | 15.78 | % | | | 9.50 | % | | | 9.25 | % | |
Mid Cap Growth
Portfolio Class S2 | | 02/18/2003 | | | 7.31 | % | | | 15.49 | % | | | 9.23 | % | | | 9.06 | % | |
Russell Midcap®
Growth Index1,3 | | | | | | | 11.90 | % | | | 16.94 | % | | | 9.43 | % | | | 8.06 | % | |
Russell Midcap®
Index1,3 | | | | | | | 13.22 | % | | | 17.19 | % | | | 9.56 | % | | | 9.72 | % | |
The performance data quoted represent past performance and do not indicate future results. Current performance may be lower or higher than the performance data quoted. For performance data current to the most recent month-end, please visit http://www.nb.com/amtportfolios/performance.
The results shown in the table reflect the reinvestment of income dividends and other distributions, if any. The results do not reflect the effect of taxes a shareholder would pay on Fund distributions or on the redemption of Fund shares. The results do not reflect fees and expenses of the variable annuity and variable life insurance policies or the qualified pension and retirement plans whose proceeds are invested in the Fund.
The investment return and principal value of an investment will fluctuate and shares, when redeemed, may be worth more or less than their original cost.
Returns would have been lower if Neuberger Berman Management LLC ("Management") had not reimbursed certain expenses and/or waived a portion of the investment management fees during certain of the periods shown. Repayment by a class (of expenses previously reimbursed and/or fees previously waived by Management) will decrease the class's returns. Please see Note B in the Notes to Financial Statements for specific information regarding expense reimbursement and/or fee waiver arrangements.
As stated in the Fund's most recent prospectus, the total annual operating expense ratios for fiscal year 2013 were 0.99% and 1.25% for Class I and Class S shares, respectively (before expense reimbursements and/or fee waivers, if any). The expense ratios for fiscal year 2014 can be found in the Financial Highlights section of this report.
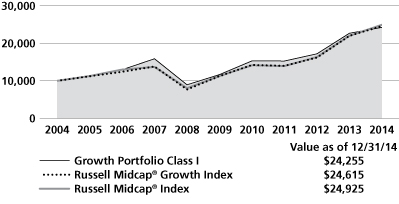
COMPARISON OF A $10,000 INVESTMENT
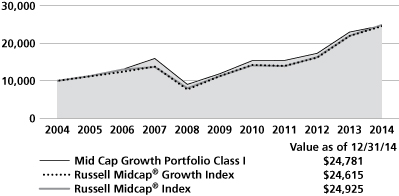
This graph shows the change in value of a hypothetical $10,000 investment in the Fund over the past 10 fiscal years, or since the Fund's inception if it has not operated for 10 years. The graph is based on Class I shares only; the performance of the Fund's share classes will differ primarily due to different class expenses (see Performance Highlights chart above).The result is compared with benchmarks, which include a broad-based market index and may include a more narrowly based index. Market indices have not been reduced to reflect any of the fees and costs of investing. The results shown in the graph reflect the reinvestment of income dividends and other distributions, if any. The results do not reflect the effect of taxes a shareholder would pay on Fund distributions or on the redemption of Fund shares. The results do not reflect fees and expenses of the variable annuity and variable life insurance policies or the qualified pension and retirement plans whose proceeds are invested in the Fund. Results represent past performance and do not indicate future results.
Please see Endnotes for additional information.
1 The date used to calculate Life of Fund performance for the index is November 3, 1997, the inception date of the oldest share class.
2 Performance shown prior to February 18, 2003 for Class S shares is that of Class I shares, which has lower expenses and correspondingly higher returns than Class S shares.
3 The Russell Midcap® Growth Index is a float-adjusted market capitalization-weighted index that measures the performance of the mid-cap growth segment of the U.S. equity market. It includes those Russell Midcap® Index companies with higher price-to-book ratios and higher forecasted growth rates. The index is rebalanced annually in June. The Russell Midcap Index measures the performance of the mid-cap segment of the U.S. equity market, and includes approximately 800 of the smallest securities in the Russell 1000® Index (which measures the performance of the 1,000 largest U.S. public companies based on total market capitalization). The index is rebalanced annually in June. Please note that the indices described in this report do not take into account any fees, expenses or tax consequences of investing in the individual securities that they track, and that investors cannot invest directly in any index. Data about the performance of an index are prepared or obtained by Neuberger Berman Management LLC ("Management") and reflect the reinvestment of income dividends and other distributions, if any. The Fund may invest in securities not included in a described index and generally does not invest in all securities included in a described index.
The investments for the Fund are managed by the same portfolio manager(s) who manage(s) one or more other mutual funds that have names, investment objectives and investment styles that are similar to those of the Fund. You should be aware that the Fund is likely to differ from those other mutual fund(s) in size, cash flow pattern and tax matters. Accordingly, the holdings and performance of the Fund can be expected to vary from those of the other mutual fund(s).
Shares of the separate Neuberger Berman Advisers Management Trust Portfolios (the "Funds") are not available to the general public. Shares of the Fund may be purchased only by life insurance companies to be held in their separate accounts, which fund variable annuity and variable life insurance policies, and by qualified pension and retirement plans.
Statistics and projections in this report are derived from sources deemed to be reliable but cannot be regarded as a representation of future results of the Fund. This report is prepared for the general information of shareholders and is not an offer of shares of the Fund. Shares are sold only through the currently effective prospectuses, which must precede or accompany this report.
The "Neuberger Berman" name and logo are registered service marks of Neuberger Berman Group LLC. "Neuberger Berman Management LLC" and the individual Fund name in this piece are either service marks or registered service marks of Neuberger Berman Management LLC.
© 2015 Neuberger Berman Management LLC, distributor. All rights reserved.
Information About Your Fund's Expenses (Unaudited)
As a Fund shareholder, you incur two types of costs: (1) transaction costs such as fees and expenses that are, or may be, imposed under your variable contract or qualified pension plan; and (2) ongoing costs, including management fees, distribution and/or service (12b-1) fees (if applicable), and other Fund expenses. This example is intended to help you understand your ongoing costs (in U.S. dollars) of investing in the Fund and compare these costs with the ongoing costs of investing in other mutual funds.
This table is designed to provide information regarding costs related to your investments. The following examples are based on an investment of $1,000 made at the beginning of the six month period ended December 31, 2014 and held for the entire period. The table illustrates the Fund's costs in two ways:
Actual Expenses and Performance: | | The first section of the table provides information about actual account values and actual expenses in dollars, based on the Fund's actual performance during the period indicated. You may use the information in this line, together with the amount you invested, to estimate the expenses you paid over the period. Simply divide your account value by $1,000 (for example, an $8,600 account value divided by $1,000 = 8.6), then multiply the result by the number in the first section of the table under the heading entitled "Expenses Paid During the Period" to estimate the expenses you paid over the period. | |
Hypothetical Example for
Comparison Purposes: | | The second section of the table provides information about hypothetical account values and hypothetical expenses based on the Fund's actual expense ratio and an assumed rate of return at 5% per year before expenses. This return is not the Fund's actual return. The hypothetical account values and expenses may not be used to estimate the actual ending account balance or expenses you paid for the period. You may use this information to compare the ongoing costs of investing in this Fund versus other funds. To do so, compare the expenses shown in this 5% hypothetical example with the 5% hypothetical examples that appear in the shareholder reports of other funds. | |
Please note that the expenses in the table are meant to highlight your ongoing costs only and do not include any transaction costs, such as fees and expenses that are, or may be imposed under your variable contract or qualified pension plan. Therefore, the information under the heading "Hypothetical (5% annual return before expenses)" is useful in comparing ongoing costs only, and will not help you determine the relative total costs of owning different funds. In addition, if these transaction costs were included, your costs would have been higher.
Expense Information as of 12/31/14
NEUBERGER BERMAN ADVISERS MANAGEMENT TRUST MID CAP GROWTH PORTFOLIO
Actual | | Beginning Account
Value
7/1/14 | | Ending Account
Value
12/31/14 | | Expenses Paid
During the Period*
7/1/14 – 12/31/14 | | Expense
Ratio | |
Class I | | $ | 1,000.00 | | | $ | 1,051.70 | | | $ | 5.12 | | | | 0.99 | % | |
Class S | | $ | 1,000.00 | | | $ | 1,050.50 | | | $ | 6.46 | | | | 1.25 | % | |
Hypothetical (5% annual return before expenses)** | |
Class I | | $ | 1,000.00 | | | $ | 1,020.21 | | | $ | 5.04 | | | | 0.99 | % | |
Class S | | $ | 1,000.00 | | | $ | 1,018.90 | | | $ | 6.36 | | | | 1.25 | % | |
* For each class, expenses are equal to the annualized expense ratio for the class, multiplied by the average account value over the period, multiplied by 184/365 (to reflect the one-half year period shown).
** Hypothetical 5% annual return before expenses is calculated by multiplying the number of days in the most recent half year divided by 365.
Schedule of Investments Mid Cap Growth Portfolio 12/31/14
NUMBER OF SHARES | | | | VALUE† | |
Common Stocks (91.7%) | | | |
Airlines (1.4%) | | | |
| | 50,000 | | | Alaska Air Group, Inc. | | $ | 2,988,000 | | |
Banks (1.0%) | | | |
| | 18,500 | | | SVB Financial Group | | | 2,147,295 | * | |
Biotechnology (2.9%) | | | |
| | 20,000 | | | Alkermes PLC | | | 1,171,200 | * | |
| | 35,000 | | | BioMarin Pharmaceutical, Inc. | | | 3,164,000 | * | |
| | 5,000 | | | Puma Biotechnology, Inc. | | | 946,350 | * | |
| | 7,500 | | | United Therapeutics Corp. | | | 971,175 | * | |
| | | | 6,252,725 | | |
Building Products (1.0%) | | | |
| 49,000 |
| | Fortune Brands Home &
Security, Inc. | | | 2,218,230 | | |
Capital Markets (2.6%) | | | |
| | 15,000 | | | Affiliated Managers Group, Inc. | | | 3,183,600 | * | |
| | 42,500 | | | Raymond James Financial, Inc. | | | 2,434,825 | | |
| | | | 5,618,425 | | |
Chemicals (0.7%) | | | |
| | 40,000 | | | PolyOne Corp. | | | 1,516,400 | | |
Commercial Services & Supplies (1.4%) | | | |
| | 22,500 | | | Stericycle, Inc. | | | 2,949,300 | * | |
Communications Equipment (2.0%) | | | |
| | 15,000 | | | F5 Networks, Inc. | | | 1,956,975 | * | |
| | 20,000 | | | Palo Alto Networks, Inc. | | | 2,451,400 | * | |
| | | | 4,408,375 | | |
Consumer Finance (1.0%) | | | |
| | 37,500 | | | PRA Group, Inc. | | | 2,172,375 | * | |
Containers & Packaging (1.3%) | | | |
| | 37,500 | | | Packaging Corp. of America | | | 2,926,875 | | |
Distributors (1.1%) | | | |
| | 85,000 | | | LKQ Corp. | | | 2,390,200 | * | |
Diversified Consumer Services (0.4%) | | | |
| | 42,500 | | | Service Corp. International | | | 964,750 | | |
Diversified Financial Services (1.0%) | | | |
| | 35,000 | | | CBOE Holdings, Inc. | | | 2,219,700 | | |
NUMBER OF SHARES | | | | VALUE† | |
Electrical Equipment (2.0%) | | | |
| | 10,000 | | | Acuity Brands, Inc. | | $ | 1,400,700 | | |
| | 57,500 | | | AMETEK, Inc. | | | 3,026,225 | | |
| | | | 4,426,925 | | |
Electronic Equipment, Instruments &
Components (2.7%) | | | |
| | 40,000 | | | Amphenol Corp. Class A | | | 2,152,400 | | |
| | 60,000 | | | CDW Corp. | | | 2,110,200 | | |
| 22,500 | | | Zebra Technologies
Corp. Class A | | | 1,741,725 | * | |
| | | | 6,004,325 | | |
Food & Staples Retailing (0.9%) | | | |
| | 21,000 | | | PriceSmart, Inc. | | | 1,915,620 | | |
Food Products (2.7%) | | | |
| | 45,000 | | | Pinnacle Foods, Inc. | | | 1,588,500 | | |
| | 25,000 | | | TreeHouse Foods, Inc. | | | 2,138,250 | * | |
| | 60,000 | | | WhiteWave Foods Co. | | | 2,099,400 | * | |
| | | | 5,826,150 | | |
Health Care Equipment & Supplies (2.3%) | | | |
| | 10,400 | | | Cooper Cos., Inc. | | | 1,685,736 | | |
| | 12,500 | | | Teleflex, Inc. | | | 1,435,250 | | |
| | 70,000 | | | Wright Medical Group, Inc. | | | 1,880,900 | * | |
| | | | 5,001,886 | | |
Health Care Providers & Services (5.3%) | | | |
| | 55,000 | | | Acadia Healthcare Co., Inc. | | | 3,366,550 | * | |
| 62,500 | | | Envision Healthcare
Holdings, Inc. | | | 2,168,125 | * | |
| | 35,000 | | | HealthSouth Corp. | | | 1,346,100 | | |
| | 25,000 | | | Omnicare, Inc. | | | 1,823,250 | | |
| 25,000 | | | Universal Health Services,
Inc. Class B | | | 2,781,500 | | |
| | | | 11,485,525 | | |
Health Care Technology (1.6%) | | | |
| | 52,500 | | | Cerner Corp. | | | 3,394,650 | * | |
Hotels, Restaurants & Leisure (2.0%) | | | |
| | 50,000 | | | Bloomin' Brands, Inc. | | | 1,238,000 | * | |
| | 10,000 | | | Buffalo Wild Wings, Inc. | | | 1,803,800 | * | |
| | 62,500 | | | MGM Resorts International | | | 1,336,250 | * | |
| | | | 4,378,050 | | |
Household Durables (1.0%) | | | |
| | 30,000 | | | Jarden Corp. | | | 1,436,400 | * | |
| | 20,000 | | | Newell Rubbermaid, Inc. | | | 761,800 | | |
| | | | 2,198,200 | | |
See Notes to Schedule of Investments
NUMBER OF SHARES | | | | VALUE† | |
Industrial Conglomerates (1.5%) | | | |
| | 21,000 | | | Roper Industries, Inc. | | $ | 3,283,350 | | |
Internet & Catalog Retail (0.5%) | | | |
| 37,500 | | | Liberty Interactive Corp.
Class A | | | 1,103,250 | * | |
Internet Software & Services (2.6%) | | | |
| | 22,500 | | | Akamai Technologies, Inc. | | | 1,416,600 | * | |
| | 10,000 | | | CoStar Group, Inc. | | | 1,836,300 | * | |
| | 25,000 | | | Demandware, Inc. | | | 1,438,500 | * | |
| | 32,500 | | | HomeAway, Inc. | | | 967,850 | * | |
| | | 5,659,250 | | |
IT Services (3.4%) | | | |
| | 13,500 | | | Alliance Data Systems Corp. | | | 3,861,675 | * | |
| | 22,500 | | | Fiserv, Inc. | | | 1,596,825 | * | |
| | 14,000 | | | FleetCor Technologies, Inc. | | | 2,081,940 | * | |
| | | | 7,540,440 | | |
Leisure Products (1.0%) | | | |
| | 15,000 | | | Polaris Industries, Inc. | | | 2,268,600 | | |
Life Sciences Tools & Services (1.2%) | | | |
| | 14,500 | | | Illumina, Inc. | | | 2,676,410 | * | |
Machinery (2.7%) | | | |
| | 25,000 | | | PACCAR, Inc. | | | 1,700,250 | | |
| | 25,000 | | | Pall Corp. | | | 2,530,250 | | |
| | 20,000 | | | Wabtec Corp. | | | 1,737,800 | | |
| | | | 5,968,300 | | |
Media (0.7%) | | | |
| 9,500 | | | Charter Communications,
Inc. Class A | | | 1,582,890 | * | |
Multiline Retail (1.6%) | | | |
| | 35,000 | | | Dollar Tree, Inc. | | | 2,463,300 | * | |
| | 50,000 | | | Tuesday Morning Corp. | | | 1,085,000 | * | |
| | | | 3,548,300 | | |
Oil, Gas & Consumable Fuels (1.8%) | | | |
| | 31,500 | | | Antero Resources Corp. | | | 1,278,270 | * | |
| | 37,500 | | | Cabot Oil & Gas Corp. | | | 1,110,375 | | |
| | 16,500 | | | Concho Resources, Inc. | | | 1,645,875 | * | |
| | | | 4,034,520 | | |
NUMBER OF SHARES | | | | VALUE† | |
Pharmaceuticals (3.9%) | | | |
| | 60,000 | | | Akorn, Inc. | | $ | 2,172,000 | * | |
| | 30,000 | | | Endo International PLC | | | 2,163,600 | * | |
| | 15,000 | | | Hospira, Inc. | | | 918,750 | * | |
| | 35,000 | | | Mylan, Inc. | | | 1,972,950 | * | |
| | 12,000 | | | Salix Pharmaceuticals Ltd. | | | 1,379,280 | * | |
| | | | 8,606,580 | | |
Professional Services (1.6%) | | | |
| | 22,500 | | | Nielsen NV | | | 1,006,425 | | |
| | 37,500 | | | WageWorks, Inc. | | | 2,421,375 | * | |
| | | | 3,427,800 | | |
Real Estate Management &
Development (1.1%) | | | |
| | 16,000 | | | Jones Lang LaSalle, Inc. | | | 2,398,880 | | |
Road & Rail (1.8%) | | | |
| 20,000 | | | J.B. Hunt Transport
Services, Inc. | | | 1,685,000 | | |
| 30,000 | | | Old Dominion Freight
Line, Inc. | | | 2,329,200 | * | |
| | | | 4,014,200 | | |
Semiconductors & Semiconductor
Equipment (6.3%) | | | |
| | 45,000 | | | Avago Technologies Ltd. | | | 4,526,550 | | |
| | 32,500 | | | Cavium, Inc. | | | 2,009,150 | * | |
| | 26,500 | | | Lam Research Corp. | | | 2,102,510 | | |
| 35,000 | | | Monolithic Power
Systems, Inc. | | | 1,740,900 | | |
| | 30,000 | | | NXP Semiconductors NV | | | 2,292,000 | * | |
| | 60,000 | | | SunEdison, Inc. | | | 1,170,600 | * | |
| | | | 13,841,710 | | |
Software (5.6%) | | | |
| | 95,000 | | | Activision Blizzard, Inc. | | | 1,914,250 | | |
| | 20,000 | | | Autodesk, Inc. | | | 1,201,200 | * | |
| | 30,000 | | | Electronic Arts, Inc. | | | 1,410,450 | * | |
| | 30,000 | | | ServiceNow, Inc. | | | 2,035,500 | * | |
| | 17,900 | | | Splunk, Inc. | | | 1,055,205 | * | |
| | 47,500 | | | Synchronoss Technologies, Inc. | | | 1,988,350 | * | |
| | 8,500 | | | Ultimate Software Group, Inc. | | | 1,247,928 | * | |
| | 17,500 | | | Workday, Inc. Class A | | | 1,428,175 | * | |
| | | | 12,281,058 | | |
Specialty Retail (7.8%) | | | |
| | 15,000 | | | Advance Auto Parts, Inc. | | | 2,389,200 | | |
| | 22,500 | | | Lithia Motors, Inc. Class A | | | 1,950,525 | | |
| | 19,100 | | | O'Reilly Automotive, Inc. | | | 3,679,042 | * | |
| | 25,000 | | | Ross Stores, Inc. | | | 2,356,500 | | |
| | 12,500 | | | Signet Jewelers Ltd. | | | 1,644,625 | | |
| | 35,000 | | | Tractor Supply Co. | | | 2,758,700 | | |
| | 30,000 | | | Williams-Sonoma, Inc. | | | 2,270,400 | | |
| | | | 17,048,992 | | |
See Notes to Schedule of Investments
NUMBER OF SHARES | | | | VALUE† | |
Technology Hardware, Storage &
Peripherals (0.9%) | | | |
| | 20,000 | | | SanDisk Corp. | | $ | 1,959,600 | | |
Textiles, Apparel & Luxury Goods (4.6%) | | | |
| | 23,500 | | | Carter's, Inc. | | | 2,051,785 | | |
| | 29,900 | | | Hanesbrands, Inc. | | | 3,337,438 | | |
| | 60,000 | | | Kate Spade & Co. | | | 1,920,600 | * | |
| | 40,000 | | | Under Armour, Inc. Class A | | | 2,716,000 | * | |
| | | | 10,025,823 | | |
Trading Companies & Distributors (1.0%) | | | |
| | 22,000 | | | United Rentals, Inc. | | | 2,244,220 | * | |
Wireless Telecommunication
Services (1.8%) | | | |
| 35,000 | | | SBA Communications
Corp. Class A | | | 3,876,600 | * | |
| | | | Total Common Stocks
(Cost $139,593,557) | | | 200,794,754 | | |
Exchange Traded Funds (2.4%) | | | |
| 55,000
| | | iShares Russell Mid-Cap
Growth ETF
(Cost $4,577,650) | | | 5,127,650
| | |
Short-Term Investments (5.9%) | | | |
| 12,960,382
| | | State Street Institutional
Liquid Reserves Fund
Premier Class
(Cost $12,960,382) | | | 12,960,382
| | |
| | | | | Total Investments (100.0%)
(Cost $157,131,589) | | | 218,882,786
| ## | |
| | | | | Cash, receivables and other assets,
less liabilities (0.0%) | | | 73,045
| | |
| | | | | Total Net Assets (100.0%) | | $ | 218,955,831 | | |
See Notes to Schedule of Investments
Notes to Schedule of Investments Mid Cap Growth Portfolio
† In accordance with Accounting Standards Codification ("ASC") 820 "Fair Value Measurement" ("ASC 820"), all investments held by Neuberger Berman Advisers Management Trust Mid Cap Growth Portfolio (the "Fund") are carried at the value that Neuberger Berman Management LLC ("Management") believes the Fund would receive upon selling an investment in an orderly transaction to an independent buyer in the principal or most advantageous market for the investment under current market conditions. Various inputs, including the volume and level of activity for the asset or liability in the market, are considered in valuing the Fund's investments, some of which are discussed below. Significant management judgment may be necessary to value investments in accordance with ASC 820.
ASC 820 established a three-tier hierarchy of inputs to create a classification of value measurements for disclosure purposes. The three-tier hierarchy of inputs is summarized in the three broad Levels listed below.
• Level 1 – quoted prices in active markets for identical investments
• Level 2 – other observable inputs (including quoted prices for similar investments, interest rates, prepayment speeds, credit risk, amortized cost, etc.)
• Level 3 – unobservable inputs (including the Fund's own assumptions in determining the fair value of investments)
The inputs or methodology used for valuing an investment are not necessarily an indication of the risk associated with investing in those securities.
The value of the Fund's investments in equity securities and exchange traded funds, for which market quotations are readily available, is generally determined by Management by obtaining valuations from an independent pricing service based on the latest sale price quoted on a principal exchange or market for that security (Level 1 inputs). Securities traded primarily on the NASDAQ Stock Market are normally valued at the NASDAQ Official Closing Price ("NOCP") provided by NASDAQ each business day. The NOCP is the most recently reported price as of 4:00:02 p.m., Eastern time, unless that price is outside the range of the "inside" bid and asked prices (i.e., the bid and asked prices that dealers quote to each other when trading for their own accounts); in that case, NASDAQ will adjust the price to equal the inside bid or asked price, whichever is closer. Because of delays in reporting trades, the NOCP may not be based on the price of the last trade to occur before the market closes. If there is no reported sale of a security on a particular day, the independent pricing service may value the security based on reported market quotations.
Management has developed a process to periodically review information provided by independent pricing services for all types of securities.
Investments in investment companies are valued using the respective fund's daily calculated net asset value per share (Level 2 inputs).
If a valuation is not available from an independent pricing service, or if Management has reason to believe that the valuation received does not represent the amount the Fund might reasonably expect to receive on a current sale in an orderly transaction, Management seeks to obtain quotations from brokers or dealers (generally considered Level 2 or Level 3 inputs depending on the number of quotes available). If such quotations are not readily available, the security is valued using methods the Neuberger Berman Advisers Management Trust's Board of Trustees (the "Board") has approved in the good-faith belief that the resulting valuation will reflect the fair value of the security. Numerous factors may be considered when determining the fair value of a security based on Level 2 or Level 3 inputs, including available analyst, media or other reports, trading in futures or American Depositary Receipts ("ADRs") and whether the issuer of the security being fair valued has other securities outstanding.
See Notes to Financial Statements
Notes to Schedule of Investments Mid Cap Growth Portfolio (cont'd)
The value of the Fund's investments in foreign securities is generally determined using the same valuation methods and inputs as other Fund investments, as discussed above. Foreign security prices expressed in local currency values are translated from the local currency into U.S. dollars using the exchange rates as of the end of regular trading on the New York Stock Exchange ("NYSE") on business days, usually 4:00 p.m., Eastern time. The Board has approved the use of Interactive Data Pricing and Reference Data, Inc. ("Interactive") to assist in determining the fair value of foreign equity securities when changes in the value of a certain index suggest that the closing prices on the foreign exchanges may no longer represent the amount that the Fund could expect to receive for those securities or on days when foreign markets are closed and U.S. markets are open. In each of these events, Interactive will provide adjusted prices for certain foreign equity securities using a statistical analysis of historical correlations of multiple factors (Level 2 inputs). In the absence of precise information about the market values of these foreign securities as of the close of the NYSE, the Board has determined on the basis of available data that prices adjusted in this way are likely to be closer to the prices the Fund could realize on a current sale than are the prices of those securities established at the close of the foreign markets in which the securities primarily trade.
Fair value prices are necessarily estimates, and there is no assurance that such a price will be at or close to the price at which the security is next quoted or next trades.
The following is a summary, categorized by Level, of inputs used to value the Fund's investments as of December 31, 2014:
Asset Valuation Inputs | | Level 1 | | Level 2 | | Level 3 | | Total | |
Investments: | |
Common Stocks^ | | $ | 200,794,754 | | | $ | — | | | $ | — | | | $ | 200,794,754 | | |
Exchange Traded Funds | | | 5,127,650 | | | | — | | | | — | | | | 5,127,650 | | |
Short-Term Investments | | | — | | | | 12,960,382 | | | | — | | | | 12,960,382 | | |
Total Investments | | $ | 205,922,404 | | | $ | 12,960,382 | | | $ | — | | | $ | 218,882,786 | | |
^ The Schedule of Investments provides information on the industry categorization for the portfolio.
As of the year ended December 31, 2014, the Fund had no transfers between Levels 1, 2 or 3 based on the beginning of period market values as of December 31, 2013.
## At December 31, 2014, the cost of investments for U.S. federal income tax purposes was $157,144,904. Gross unrealized appreciation of investments was $63,633,594 and gross unrealized depreciation of investments was $1,895,712, resulting in net unrealized appreciation of $61,737,882, based on cost for U.S. federal income tax purposes.
* Security did not produce income during the last twelve months.
See Notes to Financial Statements
Statement of Assets and Liabilities
Neuberger Berman Advisers Management Trust
| | | MID CAP
GROWTH
PORTFOLIO | |
| | | December 31, 2014 | |
Assets | |
Investments in securities, at value* (Note A)—see Schedule of Investments: | |
Unaffiliated issuers | | $ | 218,882,786 | | |
Dividends and interest receivable | | | 87,479 | | |
Receivable for securities sold | | | 452,004 | | |
Receivable for Fund shares sold | | | 226,880 | | |
Prepaid expenses and other assets | | | 2,023 | | |
Total Assets | | | 219,651,172 | | |
Liabilities | |
Payable for securities purchased | | | 420,200 | | |
Payable for Fund shares redeemed | | | 20,564 | | |
Payable to investment manager (Note B) | | | 100,999 | | |
Payable to administrator—net (Note B) | | | 83,204 | | |
Accrued expenses and other payables | | | 70,374 | | |
Total Liabilities | | | 695,341 | | |
Net Assets | | $ | 218,955,831 | | |
Net Assets consist of: | |
Paid-in capital | | $ | 130,746,006 | | |
Accumulated net realized gains (losses) on investments | | | 26,458,628 | | |
Net unrealized appreciation (depreciation) in value of investments | | | 61,751,197 | | |
Net Assets | | $ | 218,955,831 | | |
Net Assets | |
Class I | | $ | 69,620,086 | | |
Class S | | | 149,335,745 | | |
Shares Outstanding ($.001 par value; unlimited shares authorized) | |
Class I | | | 2,841,357 | | |
Class S | | | 6,436,609 | | |
Net Asset Value, offering and redemption price per share | |
Class I | | $ | 24.50 | | |
Class S | | | 23.20 | | |
*Cost of Investments | | $ | 157,131,589 | | |
See Notes to Financial Statements
Neuberger Berman Advisers Management Trust
| | | MID CAP
GROWTH
PORTFOLIO | |
| | | For the
Year Ended
December 31, 2014 | |
Investment Income: | |
Income (Note A): | |
Dividend income—unaffiliated issuers | | $ | 923,468 | | |
Interest income—unaffiliated issuers | | | 5,624 | | |
Foreign taxes withheld (Note A) | | | (900 | ) | |
Total income | | $ | 928,192 | | |
Expenses: | |
Investment management fees (Note B) | | | 1,095,045 | | |
Administration fees (Note B): | |
Class I | | | 201,187 | | |
Class S | | | 396,110 | | |
Distribution fees (Note B): | |
Class S | | | 330,092 | | |
Audit fees | | | 45,335 | | |
Custodian and accounting fees | | | 81,748 | | |
Insurance expense | | | 8,279 | | |
Legal fees | | | 104,145 | | |
Repayment to Management of expenses previously assumed by Management (Note B) | | | 3,674 | | |
Shareholder reports | | | 7,963 | | |
Trustees' fees and expenses | | | 35,905 | | |
Miscellaneous | | | 9,533 | | |
Total net expenses | | | 2,319,016 | | |
Net investment income (loss) | | $ | (1,390,824 | ) | |
Realized and Unrealized Gain (Loss) on Investments: | |
Net realized gain (loss) on: | |
Sales of investment securities of unaffiliated issuers (Note A) | | | 26,382,947 | | |
Net increase from payments by affiliates (Note B) | | | 5,113 | | |
Change in net unrealized appreciation (depreciation) in value of (Note A): | |
Unaffiliated investment securities | | | (10,129,270 | ) | |
Net gain (loss) on investments | | | 16,258,790 | | |
Net increase (decrease) in net assets resulting from operations | | $ | 14,867,966 | | |
See Notes to Financial Statements
Statements of Changes in Net Assets
Neuberger Berman Advisers Management Trust
| | | MID CAP GROWTH PORTFOLIO | |
| | | Year Ended
December 31,
2014 | | Year Ended
December 31,
2013 | |
Increase (Decrease) in Net Assets: | |
From Operations: | |
Net investment income (loss) (Note A) | | $ | (1,390,824 | ) | | $ | (1,555,306 | ) | |
Net realized gain (loss) on investments (Note A) | | | 26,382,947 | | | | 98,294,006 | | |
Net increase from payments by affiliates (Note B) | | | 5,113 | | | | — | | |
Change in net unrealized appreciation (depreciation) of investments (Note A) | | | (10,129,270 | ) | | | (24,519,958 | ) | |
Net increase (decrease) in net assets resulting from operations | | | 14,867,966 | | | | 72,218,742 | | |
Distributions to Shareholders From (Note A): | |
Net realized gain on investments: | |
Class I | | | (27,830,874 | ) | | | — | | |
Class S | | | (58,724,209 | ) | | | — | | |
Total distributions to shareholders | | | (86,555,083 | ) | | | — | | |
From Fund Share Transactions (Note D): | |
Proceeds from shares sold: | |
Class I | | | 8,025,034 | | | | 5,449,075 | | |
Class S | | | 19,854,027 | | | | 20,570,711 | | |
Proceeds from reinvestment of dividends and distributions: | |
Class I | | | 27,830,874 | | | | — | | |
Class S | | | 58,724,209 | | | | — | | |
Payments for shares redeemed: | |
Class I | | | (11,932,657 | ) | | | (207,856,415 | ) | |
Class S | | | (8,259,756 | ) | | | (11,137,390 | ) | |
Net increase (decrease) from Fund share transactions | | | 94,241,731 | | | | (192,974,019 | ) | |
Net Increase (Decrease) in Net Assets | | | 22,554,614 | | | | (120,755,277 | ) | |
Net Assets: | |
Beginning of year | | | 196,401,217 | | | | 317,156,494 | | |
End of year | | $ | 218,955,831 | | | $ | 196,401,217 | | |
Undistributed net investment income (loss) at end of year | | $ | — | | | $ | — | | |
See Notes to Financial Statements
Notes to Financial Statements Mid Cap Growth Portfolio
Note A—Summary of Significant Accounting Policies:
1 General: Neuberger Berman Advisers Management Trust (the "Trust") is a Delaware statutory trust organized pursuant to an Amended and Restated Trust Instrument dated March 27, 2014. The Trust is currently comprised of eleven separate operating series (each individually a "Series," and collectively the "Funds") each of which is diversified. The Trust is registered as an open-end management investment company under the Investment Company Act of 1940, as amended (the "1940 Act"), and its shares are registered under the Securities Act of 1933, as amended. The Fund currently offers Class I and Class S shares. The Board may establish additional series or classes of shares without the approval of shareholders.
The assets of each Series belong only to that Series, and the liabilities of each Series are borne solely by that Series and no other.
The Fund is an investment company and accordingly follows the investment company accounting and reporting guidance of the Financial Accounting Standards Board (FASB) Accounting Standard Codification Topic 946 "Financial Services—Investment Companies."
The preparation of financial statements in accordance with U.S. generally accepted accounting principles ("GAAP") requires Management to make estimates and assumptions at the date of the financial statements. Actual results could differ from those estimates.
Shares of the Fund are not available to the general public and may be purchased only by life insurance companies to be held in their separate accounts, which fund variable annuity and variable life insurance policies, and by qualified pension and retirement plans.
2 Portfolio valuation: Investment securities are valued as indicated in the notes following the Schedule of Investments.
3 Foreign currency translation: The accounting records of the Fund are maintained in U.S. dollars. Foreign currency amounts are translated into U.S. dollars using the exchange rate as of the end of regular trading on the NYSE on business days, usually 4:00 p.m. Eastern time, to determine the value of investments, other assets and liabilities. Purchase and sale prices of securities, and income and expenses, are translated into U.S. dollars at the prevailing rate of exchange on the respective dates of such transactions. Net unrealized foreign currency gain (loss), if any, arises from changes in the value of assets and liabilities, other than investments in securities, as a result of changes in exchange rates and is stated separately in the Statement of Operations.
4 Securities transactions and investment income: Securities transactions are recorded on trade date for financial reporting purposes. Dividend income is recorded on the ex-dividend date or, for certain foreign dividends, as soon as the Fund becomes aware of the dividends. Non-cash dividends included in dividend income, if any, are recorded at the fair market value of the securities received. Interest income, including accretion of original issue discount, where applicable, and accretion of discount on short-term investments, if any, is recorded on the accrual basis. Realized gains and losses from securities transactions and foreign currency transactions, if any, are recorded on the basis of identified cost and stated separately in the Statement of Operations. Included in net realized gain (loss) on investments are proceeds from the settlements of class action litigation in which the Fund participated as a class member. The amount of such proceeds for the year ended December 31, 2014 was $8,509.
5 Income tax information: Each Series is treated as a separate entity for U.S. federal income tax purposes. It is the policy of the Fund to continue to qualify for treatment as a regulated investment company ("RIC") by complying with the requirements of the U.S. Internal Revenue Code applicable to RICs and to distribute substantially all of its net investment income and net realized capital gains to its shareholders. To the extent the Fund distributes substantially all of its net investment income and net realized capital gains to shareholders, no federal income or excise tax provision is required.
The Fund has adopted the provisions of ASC 740 "Income Taxes" ("ASC 740"). ASC 740 sets forth a minimum threshold for financial statement recognition of a tax position taken, or expected to be taken, in a tax return. The Fund recognizes interest and penalties, if any, related to unrecognized tax positions as an income tax expense in the Statement of Operations. The Fund is subject to examination by U.S. federal and state tax authorities for returns filed for the tax years for which the applicable statutes of limitations have not yet expired. As of December 31, 2014, the Fund did not have any unrecognized tax positions.
Income distributions and capital gain distributions are determined in accordance with income tax regulations, which may differ from GAAP. These differences are primarily due to differing treatments of income and gains on various investment securities held by the Fund, timing differences and differing characterization of distributions made by the Fund. The Fund may also utilize earnings and profits distributed to shareholders on redemption of shares as a part of the dividends-paid deduction for income tax purposes.
As determined on December 31, 2014, permanent differences resulting primarily from different book and tax accounting were reclassified at year end. Such differences are attributed to the tax treatment of: net operating losses and non-real estate investment trusts return of capital adjustments. These reclassifications had no effect on net income, net asset value ("NAV") or NAV per share of the Fund. For the year ended December 31, 2014, the Fund recorded the following permanent reclassifications:
Paid-in Capital | | Undistributed
Net Investment
Income (Loss) | | Accumulated
Net Realized
Gains (Losses)
on Investments | |
$ | (1,432,348 | ) | | $ | 1,390,824 | | | $ | 41,524 | | |
The tax character of distributions paid during the years ended December 31, 2014 and December 31, 2013 was as follows:
Distributions Paid From: | |
Ordinary Income | | Long-Term Capital Gain | | Total | |
| 2014 | | 2013 | | 2014 | | 2013 | | 2014 | | 2013 | |
| $ | — | | | $ | — | | | $ | 86,555,083 | | | $ | — | | | $ | 86,555,083 | | | $ | — | | |
As of December 31, 2014, the components of distributable earnings (accumulated losses) on a U.S. federal income tax basis were as follows:
Undistributed
Long-Term
Capital Gain | | Unrealized
Appreciation
(Depreciation) | | Loss
Carryforwards
and Deferrals | | Other
Temporary
Differences | | Total | |
| $ | 26,471,943 | | | $ | 61,737,882 | | | $ | — | | | $ | — | | | $ | 88,209,825 | | |
The difference between book basis and tax basis distributable earnings is primarily due to losses disallowed and recognized on wash sales.
6 Distributions to shareholders: The Fund may earn income, net of expenses, daily on its investments. Distributions from net investment income and net realized capital gains, if any, generally are distributed once a year (usually in October). Income distributions and capital gain distributions to shareholders are recorded on the ex-date.
7 Foreign taxes: Foreign taxes withheld, if any, represent amounts withheld by foreign tax authorities, net of refunds recoverable.
8 Expense allocation: Certain expenses are applicable to multiple funds within the complex of related investment companies. Expenses directly attributable to a Series are charged to that Series. Expenses of the Trust that are not directly attributable to a particular series of the Trust (e.g., the Fund) are allocated among the series of the Trust, on the basis of relative net assets, except where a more appropriate allocation of expenses to each of the series can
otherwise be made fairly. Expenses borne by the complex of related investment companies, which includes open-end and closed-end investment companies for which Management serves as investment manager, that are not directly attributable to a particular investment company in the complex (e.g., the Trust) or series thereof are allocated among the investment companies or series thereof in the complex on the basis of relative net assets, except where a more appropriate allocation of expenses to each of the investment companies or series thereof in the complex can otherwise be made fairly. The Fund's expenses (other than those specific to each class) are allocated proportionally each day among the classes based upon the relative net assets of each class.
9 Investments in foreign securities: Investing in foreign securities may involve certain sovereign and other risks, in addition to the credit and market risks normally associated with domestic securities. These additional risks include the possibility of adverse political and economic developments (including political instability, nationalization, expropriation, or confiscatory taxation) and the potentially adverse effects of unavailability of public information regarding issuers, less governmental supervision and regulation of financial markets, reduced liquidity of certain financial markets, and the lack of uniform accounting, auditing, and financial reporting standards or the application of standards that are different or less stringent than those applied in the United States. Foreign securities also may experience greater price volatility, higher rates of inflation, and delays in settlement.
10 Indemnifications: Like many other companies, the Trust's organizational documents provide that its officers ("Officers") and trustees ("Trustees") are indemnified against certain liabilities arising out of the performance of their duties to the Trust. In addition, both in some of its principal service contracts and in the normal course of its business, the Trust enters into contracts that provide indemnifications to other parties for certain types of losses or liabilities. The Trust's maximum exposure under these arrangements is unknown as this could involve future claims against the Trust.
11 Other: All net investment income and realized and unrealized capital gains and losses of the Fund are allocated, on the basis of relative net assets, pro rata among its respective classes.
Note B—Management Fees, Administration Fees, Distribution Arrangements, and Other Transactions with Affiliates:
The Fund retains Management as its investment manager under a Management Agreement. For such investment management services, the Fund pays Management a fee at the annual rate of 0.55% of the first $250 million of the Fund's average daily net assets, 0.525% of the next $250 million, 0.50% of the next $250 million, 0.475% of the next $250 million, 0.45% of the next $500 million, 0.425% of the next $2.5 billion, and 0.40% of average daily net assets in excess of $4 billion. Accordingly, for the year ended December 31, 2014, the management fee pursuant to the Management Agreement was equivalent to an annual effective rate of 0.55% of the Fund's average daily net assets.
The Fund retains Management as its administrator under an Administration Agreement. Each class pays Management an administration fee at the annual rate of 0.30% of its average daily net assets under this agreement. Additionally, Management retains State Street Bank and Trust Company ("State Street") as its sub-administrator under a Sub-Administration Agreement. Management pays State Street a fee for all services received under this agreement.
The Board adopted a non-fee distribution plan for the Fund's Class I.
For the Fund's Class S, Management acts as agent in arranging for the sale of class shares without commission and bears advertising and promotion expenses. The Board has adopted a distribution plan (the "Plan") with respect to this class, pursuant to Rule 12b-1under the 1940 Act. The Plan provides that, as compensation for administrative and other services provided to this class, Management's activities and expenses related to the sale and distribution of this class, and ongoing services provided to investors in this class, Management receives from this class a fee at the annual rate of 0.25% of Class S's average daily net assets. Management receives this amount to provide distribution and shareholder servicing for this class and pays a portion of it to institutions that provide such services. Those institutions may use the payments for, among other purposes, compensating employees engaged in
sales and/or shareholder servicing. The amount of fees paid by this class during any year may be more or less than the cost of distribution and other services provided to this class. FINRA rules limit the amount of annual distribution fees that may be paid by a mutual fund and impose a ceiling on the cumulative distribution fees paid. The Trust's Plan complies with those rules.
Management has contractually undertaken to waive current payment of fees and/or reimburse the Fund's Class I and Class S shares for their operating expenses (including fees payable to Management for the Fund's Class S shares but excluding such fees payable for the Fund's Class I shares and excluding, for each class, interest, taxes, brokerage commissions, extraordinary expenses and transaction costs, if any; and, consequently, net expenses may exceed the contractual expense limitations) ("Operating Expenses") which exceed the expense limitation as detailed in the following table. Each respective class has agreed to repay Management for fees and expenses waived and/or its excess Operating Expenses previously reimbursed by Management, so long as its annual Operating Expenses during that period do not exceed its contractual expense limitation in place at the time the fees and expenses were waived or reimbursed, and the repayment is made within three years after the year in which Management issued the reimbursement or waived fees. During the year ended December 31, 2014, the Fund's Class S shares repaid Management $3,674, under its contractual expense limitation. At December 31, 2014, the Fund's contingent liabilities to Management under its contractual expense limitation were as follows:
| | | | | | | Expenses Reimbursed in
Fiscal Year Ending December 31, | |
| | | | | | | 2012 | | 2013 | | 2014 | |
| | | | | | | Subject to Repayment Until December 31, | |
| | | Contractual
Expense
Limitation(1) | | Expiration | | 2015 | | 2016 | | 2017 | |
Class I | | | 1.00 | % | | 12/31/17 | | $ | — | | | $ | — | | | $ | — | | |
Class S | | | 1.25 | % | | 12/31/17 | | | — | | | | 6,663 | | | | — | | |
(1) Expense limitation per annum of the respective class's average daily net assets.
Neuberger Berman LLC ("Neuberger") is retained by Management pursuant to a Sub-Advisory Agreement to furnish it with investment recommendations and research information without added cost to the Fund. Several individuals who are Officers and/or Trustees of the Trust are also employees of Neuberger and/or Management.
On June 3, 2014, Management made a voluntary contribution of $5,113 to the Fund in connection with a payment matter related to the Fund's investment in a State Street money market fund.
Note C—Securities Transactions:
During the year ended December 31, 2014, there were purchase and sale transactions (excluding short-term securities) of $123,564,582 and $126,580,582, respectively.
During the year ended December 31, 2014, no brokerage commissions on securities transactions were paid to affiliated brokers.
Note D—Fund Share Transactions:
Share activity for the years ended December 31, 2014 and December 31, 2013 was as follows:
For the Year Ended December 31, 2014
| | | Shares Sold | | Shares Issued on
Reinvestment of
Dividends and
Distributions | | Shares
Redeemed | | Total | |
Class I | | | 231,678 | | | | 1,280,758 | | | | (340,541 | ) | | | 1,171,895 | | |
Class S | | | 612,943 | | | | 2,852,074 | | | | (228,435 | ) | | | 3,236,582 | | |
For the Year Ended December 31, 2013
| | | Shares Sold | | Shares Issued on
Reinvestment of
Dividends and
Distributions | | Shares
Redeemed | | Total | |
Class I | | | 154,212 | | | | — | | | | (5,877,454 | ) | | | (5,723,242 | ) | |
Class S | | | 600,166 | | | | — | | | | (320,201 | ) | | | 279,965 | | |
Note E—Lines of Credit:
At December 31, 2014, the Fund was a participant in a single committed, unsecured $300,000,000 line of credit with State Street, to be used only for temporary or emergency purposes. Other investment companies managed by Management also participate in this line of credit on the same terms. Interest is charged on borrowings under this line of credit at the higher of (a) the Federal Funds Rate plus 1.25% per annum or (b) the Overnight LIBOR Rate plus 1.25% per annum. A commitment fee of 0.10% per annum on the unused portion of the available line of credit is charged, of which each participating fund has agreed to pay its pro rata share, based on the ratio of its individual net assets to the net assets of all participants at the time the fee is due and payable. The fee is paid quarterly in arrears. Because several mutual funds participate, there is no assurance that the Fund will have access to all or any part of the $300,000,000 at any particular time. There were no loans outstanding pursuant to this line of credit at December 31, 2014. During the year ended December 31, 2014, the Fund did not utilize this line of credit.
At December 31, 2014, the Fund was a participant in a single uncommitted, unsecured $100,000,000 line of credit with State Street, to be used only for temporary or emergency purposes. Other investment companies managed by Management also participate in this line of credit on the same terms. Interest is charged on borrowings under this line of credit at a variable rate per annum as determined and quoted by State Street at the time a fund requests a loan. Because several mutual funds participate, there is no assurance that the Fund will have access to all or any part of the $100,000,000 at any particular time. There were no loans outstanding pursuant to this line of credit at December 31, 2014. During the year ended December 31, 2014, the Fund did not utilize this line of credit.
In January 2015, a new syndicated committed, unsecured $700,000,000 line of credit, to be used only for temporary or emergency purposes, replaced the lines of credit with State Street noted above. Because several mutual funds participate in this line of credit, there is no assurance that the Fund will have access to all or any part of the $700,000,000 at any particular time.
Mid Cap Growth Portfolio
The following tables include selected data for a share outstanding throughout each year and other performance information derived from the Financial Statements. Per share amounts that round to less than $0.01 or $(0.01) per share are presented as $0.00 or $(0.00), respectively. Ratios that round to less than 0.00% or (0.00)% per share are presented as 0.00% or (0.00)%, respectively. A "—" indicates that the line item was not applicable in the corresponding period.
Class I | |
| | | Year Ended December 31, | |
| | | 2014 | | 2013 | | 2012 | | 2011 | | 2010 | |
Net Asset Value, Beginning of Year | | $ | 41.07 | | | $ | 30.97 | | | $ | 27.55 | | | $ | 27.42 | | | $ | 21.25 | | |
Income From Investment Operations: | |
| Net Investment Income (Loss)‡ | | | (0.19 | ) | | | (0.19 | ) | | | (0.10 | ) | | | (0.15 | ) | | | (0.11 | ) | |
Net Gains or Losses on Securities
(both realized and unrealized) | | | 1.08 | | | | 10.29 | | | | 3.52 | | | | 0.28 | | | | 6.28 | | |
Total From Investment Operations | | | 0.89 | | | | 10.10 | | | | 3.42 | | | | 0.13 | | | | 6.17 | | |
Less Distributions From: | |
Net Capital Gains | | | (17.46 | ) | | | — | | | | — | | | | — | | | | — | | |
Voluntary Contribution from Management | | | 0.00 | | | | — | | | | — | | | | — | | | | — | | |
Net Asset Value, End of Year | | $ | 24.50 | | | $ | 41.07 | | | $ | 30.97 | | | $ | 27.55 | | | $ | 27.42 | | |
| Total Return†† | | | 7.58 | %@ | | | 32.61 | %@ | | | 12.41 | %@ | | | 0.47 | % | | | 29.04 | % | |
Ratios/Supplemental Data | |
Net Assets, End of Year (in millions) | | $ | 69.6 | | | $ | 68.6 | | | $ | 229.0 | | | $ | 233.2 | | | $ | 266.0 | | |
| Ratio of Gross Expenses to Average Net Assets# | | | 1.00 | % | | | 0.99 | % | | | 0.99 | % | | | 1.01 | % | | | 1.02 | % | |
| Ratio of Net Expenses to Average Net Assets§ | | | 1.00 | % | | | 0.99 | % | | | 0.99 | % | | | 1.01 | % | | | 1.02 | % | |
Ratio of Net Investment Income (Loss) to Average
Net Assets | | | (0.53 | )% | | | (0.57 | )% | | | (0.34 | )% | | | (0.54 | )% | | | (0.49 | )% | |
Portfolio Turnover Rate | | | 64 | % | | | 43 | % | | | 38 | % | | | 35 | % | | | 46 | % | |
See Notes to Financial Highlights
Financial Highlights (cont'd)
Class S | |
| | | Year Ended December 31, | |
| | | 2014 | | 2013 | | 2012 | | 2011 | | 2010 | |
Net Asset Value, Beginning of Year | | $ | 39.95 | | | $ | 30.21 | | | $ | 26.94 | | | $ | 26.87 | | | $ | 20.87 | | |
Income From Investment Operations: | |
| Net Investment Income (Loss)‡ | | | (0.27 | ) | | | (0.26 | ) | | | (0.17 | ) | | | (0.21 | ) | | | (0.16 | ) | |
Net Gains or Losses on Securities
(both realized and unrealized) | | | 0.98 | | | | 10.00 | | | | 3.44 | | | | 0.28 | | | | 6.16 | | |
Total From Investment Operations | | | 0.71 | | | | 9.74 | | | | 3.27 | | | | 0.07 | | | | 6.00 | | |
Less Distributions From: | |
Net Capital Gains | | | (17.46 | ) | | | — | | | | — | | | | — | | | | — | | |
Voluntary Contribution from Management | | | 0.00 | | | | — | | | | — | | | | — | | | | — | | |
Net Asset Value, End of Year | | $ | 23.20 | | | $ | 39.95 | | | $ | 30.21 | | | $ | 26.94 | | | $ | 26.87 | | |
| Total Return†† | | | 7.31 | %@ | | | 32.24 | % | | | 12.14 | %@ | | | 0.26 | % | | | 28.75 | % | |
Ratios/Supplemental Data | |
Net Assets, End of Year (in millions) | | $ | 149.3 | | | $ | 127.8 | | | $ | 88.2 | | | $ | 64.2 | | | $ | 59.2 | | |
| Ratio of Gross Expenses to Average Net Assets# | | | 1.25 | % | | | 1.26 | % | | | 1.24 | % | | | 1.26 | % | | | 1.27 | % | |
| Ratio of Net Expenses to Average Net Assets§ | | | 1.25 | %Ø | | | 1.25 | % | | | 1.25 | %Ø | | | 1.25 | % | | | 1.25 | % | |
Ratio of Net Investment Income (Loss) to Average
Net Assets | | | (0.78 | )% | | | (0.76 | )% | | | (0.57 | )% | | | (0.78 | )% | | | (0.73 | )% | |
Portfolio Turnover Rate | | | 64 | % | | | 43 | % | | | 38 | % | | | 35 | % | | | 46 | % | |
See Notes to Financial Highlights
Notes to Financial Highlights Mid Cap Growth Portfolio
†† Total return based on per share NAV reflects the effects of changes in NAV on the performance of the Fund during each fiscal period. Returns assume income dividends and other distributions, if any, were reinvested. Results represent past performance and do not indicate future results. Current returns may be lower or higher than the performance data quoted. Investment returns and principal may fluctuate and shares when redeemed may be worth more or less than original cost. Total return would have been lower if Management had not reimbursed and/or waived certain expenses. Total return would have been higher if Management had not recouped previously reimbursed expenses. The total return information shown does not reflect charges and other expenses that apply to the separate account or the related insurance policies or other qualified pension or retirement plan, and the inclusion of these charges and other expenses would reduce the total return for all fiscal periods shown. The voluntary contribution listed in Note B of the Notes to Financial Statements had no impact on the Fund's total return for the year ended December 31, 2014.
@ The class action proceeds listed in Note A-4 of the Notes to Financial Statements had no impact on the Fund's total return for the year ended December 31, 2014. Had the Fund not received class action proceeds in 2013, total return based on per share NAV for the year ended December 31, 2013 would have been 32.58% for Class I. Had the Fund not received class action proceeds in 2012, total return based on per share NAV for the year ended December 31, 2012 would have been 12.34% and 12.06% for Class I and Class S, respectively.
# Represents the annualized ratios of net expenses to average daily net assets if Management had not reimbursed certain expenses and/or waived a portion of the investment management fee.
‡ Calculated based on the average number of shares outstanding during each fiscal period.
§ Prior to January 1, 2013, the Fund had an expense offset arrangement in connection with its custodian contract. The impact of expense reductions related to expense offset arrangements, if any, was less than 0.01%.
Ø After repayment of expenses previously reimbursed by Management. Had the Fund not made such repayments, the annualized ratio of net expenses to average daily net assets would have been:
| | | Year Ended December 31, | |
| | | 2014 | | 2013 | | 2012 | |
Mid Cap Growth Portfolio Class S | | | 1.25 | % | | | — | | | | 1.24 | % | |
Report of Independent Registered Public Accounting Firm
To the Board of Trustees of
Neuberger Berman Advisers Management Trust and
Shareholders of Mid Cap Growth Portfolio
We have audited the accompanying statement of assets and liabilities of Mid Cap Growth Portfolio, one of the series constituting Neuberger Berman Advisers Management Trust (the "Trust"), including the schedule of investments, as of December 31, 2014, and the related statement of operations for the year then ended, the statements of changes in net assets for each of the two years in the period then ended and the financial highlights for each of the five years in the period then ended. These financial statements and financial highlights are the responsibility of the Trust's management. Our responsibility is to express an opinion on these financial statements and financial highlights based on our audits.
We conducted our audits in accordance with the standards of the Public Company Accounting Oversight Board (United States). Those standards require that we plan and perform the audit to obtain reasonable assurance about whether the financial statements and financial highlights are free of material misstatement. We were not engaged to perform an audit of the Trust's internal control over financial reporting. Our audits included consideration of internal control over financial reporting as a basis for designing audit procedures that are appropriate in the circumstances, but not for the purpose of expressing an opinion on the effectiveness of the Trust's internal control over financial reporting. Accordingly, we express no such opinion. An audit also includes examining, on a test basis, evidence supporting the amounts and disclosures in the financial statements and financial highlights, assessing the accounting principles used and significant estimates made by management, and evaluating the overall financial statement presentation. Our procedures included confirmation of securities owned as of December 31, 2014 by correspondence with the custodian and others or by other appropriate auditing procedures where replies from others were not received. We believe that our audits provide a reasonable basis for our opinion.
In our opinion, the financial statements and financial highlights referred to above present fairly, in all material respects, the financial position of Mid Cap Growth Portfolio, a series of Neuberger Berman Advisers Management Trust, at December 31, 2014, the results of its operations for the year then ended, the changes in its net assets for each of the two years in the period then ended, and the financial highlights for each of the five years in the period then ended in conformity with U.S. generally accepted accounting principles.

Boston, Massachusetts
February 10, 2015
Trustee and Officer Information
The following tables set forth information concerning the Trustees and Officers of the Fund. All persons named as Trustees and Officers also serve in similar capacities for other funds administered or managed by Management and Neuberger. The Fund's Statement of Additional Information includes additional information about the Trustees and is available upon request, without charge, by calling (800) 877-9700.
Information about the Board of Trustees
Name, (Year of Birth),
and Address(1) | | Position(s) and
Length of
Time Served(2) | | Principal Occupation(s)(3) | | Number of
Funds in Fund
Complex
Overseen by
Fund Trustee | | Other Directorships Held
Outside Fund Complex by
Fund Trustee(3) | |
Independent Trustees | |
Faith Colish (1935) | | Trustee since 1982 | | Counsel, Carter Ledyard & Milburn LLP (law firm) since October 2002; formerly, Attorney-at-Law and President, Faith Colish, A Professional Corporation, 1980 to 2002. | | | 60 | | | Formerly, Director, 1997 to 2003, and Advisory Director, 2003 to 2006, ABA Retirement Funds (formerly, American Bar Retirement Association) (not-for-profit membership corporation). | |
Martha C. Goss (1949) | | Trustee since 2007 | | President, Woodhill Enterprises Inc./Chase Hollow Associates LLC (personal investment vehicle), since 2006; formerly, Consultant, Resources Global Professionals (temporary staffing), 2002 to 2006. | | | 60 | | | Director, American Water (water utility), since 2003; Director, Allianz Life of New York (insurance), since 2005; Director, Berger Group Holdings, Inc. (engineering consulting firm), since 2013; Director, Financial Women's Association of New York (not-for-profit association), since 2003; Trustee Emerita, Brown University, since 1998; Director, Museum of American Finance (not-for-profit), since 2013; formerly, Non-Executive Chair and Director, Channel Reinsurance (financial guaranty reinsurance), 2006 to 2010; formerly, Director, Ocwen Financial Corporation (mortgage servicing), 2005 to 2010; formerly, Director, Claire's Stores, Inc. (retailer), 2005 to 2007; formerly, Director, Parsons Brinckerhoff Inc. (engineering consulting firm), 2007 to 2010; formerly, Director, Bank Leumi (commercial bank), 2005 to 2007; formerly, Advisory Board Member, Attensity (software developer), 2005 to 2007. | |
Name, (Year of Birth),
and Address(1) | | Position(s) and
Length of
Time Served(2) | | Principal Occupation(s)(3) | | Number of
Funds in Fund
Complex
Overseen by
Fund Trustee | | Other Directorships Held
Outside Fund Complex by
Fund Trustee(3) | |
Michael M. Knetter (1960) | | Trustee since 2007 | | President and Chief Executive Officer, University of Wisconsin Foundation, since October 2010; formerly, Dean, School of Business, University of Wisconsin - Madison; formerly, Professor of International Economics and Associate Dean, Amos Tuck School of Business - Dartmouth College, 1998 to 2002. | | | 60 | | | Board Member, American Family Insurance (a mutual company, not publicly traded), since March 2009; formerly, Trustee, Northwestern Mutual Series Fund, Inc., 2007 to 2011; formerly, Director, Wausau Paper, 2005 to 2011; formerly, Director, Great Wolf Resorts, 2004 to 2009. | |
Howard A. Mileaf (1937) | | Trustee since 1999 | | Retired; formerly, Vice President and General Counsel, WHX Corporation (holding company), 1993 to 2001. | | | 60 | | | Formerly, Director, Webfinancial Corporation (holding company), 2002 to 2008; formerly, Director, WHX Corporation (holding company), 2002 to 2005; formerly, Director, State Theatre of New Jersey (not-for-profit theatre), 2000 to 2005. | |
George W. Morriss (1947) | | Trustee since 2007 | | Adjunct Professor, Columbia University School of International and Public Affairs, since October 2012; formerly, Executive Vice President and Chief Financial Officer, People's Bank, Connecticut (a financial services company), 1991 to 2001. | | | 60 | | | Director and Treasurer, National Association of Corporate Directors, Connecticut Chapter, since 2011; Trustee, Steben Alternative Investment Funds, Steben Select Multi-Strategy Fund and Steben Select Multi-Strategy Master Fund, since 2013; formerly, Manager, Larch Lane Multi-Strategy Fund complex (which consisted of three funds), 2006 to 2011; formerly, Member, NASDAQ Issuers' Affairs Committee, 1995 to 2003. | |
Name, (Year of Birth),
and Address(1) | | Position(s) and
Length of
Time Served(2) | | Principal Occupation(s)(3) | | Number of
Funds in Fund
Complex
Overseen by
Fund Trustee | | Other Directorships Held
Outside Fund Complex by
Fund Trustee(3) | |
Tom D. Seip (1950) | | Trustee since 2000; Chairman of the Board since 2008; Lead Independent Trustee from 2006 to 2008 | | General Partner, Ridgefield Farm LLC (a private investment vehicle); formerly, President and CEO, Westaff, Inc. (temporary staffing), May 2001 to January 2002; formerly, Senior Executive, The Charles Schwab Corporation, 1983 to 1998, including Chief Executive Officer, Charles Schwab Investment Management, Inc.; Trustee, Schwab Family of Funds and Schwab Investments, 1997 to 1998; and Executive Vice President-Retail Brokerage, Charles Schwab & Co., Inc., 1994 to 1997. | | | 60 | | | Director, H&R Block, Inc. (financial services company), since May 2001; Chairman, Governance and Nominating Committee, H&R Block, Inc., since 2011; formerly, Chairman, Compensation Committee, H&R Block, Inc., 2006 to 2010; formerly, Director, Forward Management, Inc. (asset management company), 1999 to 2006. | |
Candace L. Straight (1947) | | Trustee since 1999 | | Private investor and consultant specializing in the insurance industry; formerly, Advisory Director, Securitas Capital LLC (a global private equity investment firm dedicated to making investments in the insurance sector), 1998 to 2003. | | | 60 | | | Public Member, Board of Governors and Board of Trustees, Rutgers University, since 2011; Director, Montpelier Re Holdings Ltd. (reinsurance company), since 2006; formerly, Director, National Atlantic Holdings Corporation (property and casualty insurance company), 2004 to 2008; formerly, Director, The Proformance Insurance Company (property and casualty insurance company), 2004 to 2008; formerly, Director, Providence Washington Insurance Company (property and casualty insurance company), 1998 to 2006; formerly, Director, Summit Global Partners (insurance brokerage firm), 2000 to 2005. | |
Peter P. Trapp (1944) | | Trustee since 1984 | | Retired; formerly, Regional Manager for Mid-Southern Region, Ford Motor Credit Company, September 1997 to 2007; formerly, President, Ford Life Insurance Company, April 1995 to August 1997. | | | 60 | | | None. | |
Name, (Year of Birth),
and Address(1) | | Position(s) and
Length of
Time Served(2) | | Principal Occupation(s)(3) | | Number of
Funds in Fund
Complex
Overseen by
Fund Trustee | | Other Directorships Held
Outside Fund Complex by
Fund Trustee(3) | |
Trustees who are "Interested Persons" | |
Joseph V. Amato* (1962) | | Trustee since 2009 | | President and Director, Neuberger Berman Group LLC, since 2009; President and Chief Executive Officer, Neuberger and Neuberger Berman Holdings LLC (including its predecessor, Neuberger Berman Inc.), since 2007; Chief Investment Officer (Equities) and Managing Director, Management, since 2009; Managing Director, Neuberger Berman Fixed Income, LLC ("NBFI"), since 2007; Board member of NBFI since 2006; formerly, Global Head of Asset Management of Lehman Brothers Holdings Inc.'s ("LBHI") Investment Management Division, 2006 to 2009; formerly, member of LBHI's Investment Management Division's Executive Management Committee, 2006 to 2009; formerly, Managing Director, Lehman Brothers Inc. ("LBI"), 2006 to 2008; formerly, Chief Recruiting and Development Officer, LBI, 2005 to 2006; formerly, Global Head of LBI's Equity Sales and a Member of its Equities Division Executive Committee, 2003 to 2005. | | | 60 | | | Member of Board of Advisors, McDonough School of Business, Georgetown University, since 2001; Member of New York City Board of Advisors, Teach for America, since 2005; Trustee, Montclair Kimberley Academy (private school), since 2007; Member of Board of Regents, Georgetown University, since 2013. | |
Name, (Year of Birth),
and Address(1) | | Position(s) and
Length of
Time Served(2) | | Principal Occupation(s)(3) | | Number of
Funds in Fund
Complex
Overseen by
Fund Trustee | | Other Directorships Held
Outside Fund Complex by
Fund Trustee(3) | |
Robert Conti* (1956) | | Chief Executive Officer, President and Trustee since 2008; prior thereto, Executive Vice President in 2008 and Vice President from 2000 to 2008 | | Managing Director, Neuberger, since 2007; Managing Director, NBFI, since 2009; formerly, Senior Vice President, Neuberger, 2003 to 2006; formerly, Vice President, Neuberger, 1999 to 2003; President and Chief Executive Officer, Management, since 2008; formerly, Senior Vice President, Management, 2000 to 2008. | | | 60 | | | Director, Staten Island Mental Health Society, since 1994; formerly, Chairman of the Board, Staten Island Mental Health Society, 2008 to 2011. | |
(1) The business address of each listed person is 605 Third Avenue, New York, New York 10158.
(2) Pursuant to the Trust's Trust Instrument, each of these Trustees shall hold office for life or until his or her successor is elected or the Trust terminates; except that (a) any Trustee may resign by delivering a written resignation; (b) any Trustee may be removed with or without cause at any time by a written instrument signed by at least two-thirds of the other Trustees; (c) any Trustee who requests to be retired, or who has become unable to serve, may be retired by a written instrument signed by a majority of the other Trustees; and (d) any Trustee may be removed at any shareholder meeting by a vote of at least two-thirds of the outstanding shares.
(3) Except as otherwise indicated, each individual has held the positions shown for at least the last five years.
* Indicates a Trustee who is an "interested person" within the meaning of the 1940 Act. Mr. Amato and Mr. Conti are interested persons of the Trust by virtue of the fact that each is an officer of Management, Neuberger and/or their affiliates.
Information about the Officers of the Trust
Name, (Year of Birth),
and Address(1) | | Position(s) and
Length of Time
Served(2) | | Principal Occupation(s)(3) | |
Andrew B. Allard (1961) | | Chief Legal Officer since 2013 (only for purposes of sections 307 and 406 of the Sarbanes-Oxley Act of 2002) and Anti-Money Laundering Compliance Officer since 2002 | | General Counsel and Senior Vice President, Management, since 2013; Senior Vice President, Neuberger, since 2006 and Employee since 1999; Deputy General Counsel, Neuberger, since 2004; formerly, Vice President, Neuberger, 2000 to 2005; formerly, Employee, Management, 1994 to 1999; Chief Legal Officer since 2013 (only for purposes of sections 307 and 406 of the Sarbanes-Oxley Act of 2002), ten registered investment companies for which Management acts as investment manager and administrator (ten since 2013); Anti-Money Laundering Compliance Officer, ten registered investment companies for which Management acts as investment manager and administrator (six since 2002, one since 2003, one since 2005, one since 2006 and one since 2013). | |
Claudia A. Brandon (1956) | | Executive Vice President since 2008 and Secretary since 1985 | | Senior Vice President, Neuberger, since 2007 and Employee since 1999; Senior Vice President, Management, since 2008 and Assistant Secretary since 2004; formerly, Vice President, Neuberger, 2002 to 2006; formerly, Vice President-Mutual Fund Board Relations, Management, 2000 to 2008; formerly, Vice President, Management, 1986 to 1999 and Employee 1984 to 1999; Executive Vice President, ten registered investment companies for which Management acts as investment manager and administrator (nine since 2008 and one since 2013); Secretary, ten registered investment companies for which Management acts as investment manager and administrator (three since 1985, three since 2002, one since 2003, one since 2005, one since 2006 and one since 2013). | |
Agnes Diaz (1971) | | Vice President since 2013 | | Senior Vice President, Neuberger, since 2012; Employee, Management, since 1996; formerly, Vice President, Neuberger, 2007 to 2012; Vice President, ten registered investment companies for which Management acts as investment manager and administrator (ten since 2013). | |
Anthony DiBernardo (1979) | | Assistant Treasurer since 2011 | | Senior Vice President, Neuberger, since 2014; Employee, Management, since 2003; formerly, Vice President, Neuberger, 2009 to 2014; Assistant Treasurer, ten registered investment companies for which Management acts as investment manager and administrator (nine since 2011 and one since 2013). | |
Sheila R. James (1965) | | Assistant Secretary since 2002 | | Vice President, Neuberger, since 2008 and Employee since 1999; formerly, Assistant Vice President, Neuberger, 2007; formerly, Employee, Management, 1991 to 1999; Assistant Secretary, ten registered investment companies for which Management acts as investment manager and administrator (six since 2002, one since 2003, one since 2005, one since 2006 and one since 2013). | |
Brian Kerrane (1969) | | Vice President since 2008 | | Managing Director, Neuberger, since 2014; Vice President, Management, since 2008 and Employee since 1991; formerly, Senior Vice President, Neuberger, 2006 to 2014; Vice President, ten registered investment companies for which Management acts as investment manager and administrator (nine since 2008 and one since 2013). | |
Name, (Year of Birth),
and Address(1) | | Position(s) and
Length of Time
Served(2) | | Principal Occupation(s)(3) | |
Kevin Lyons (1955) | | Assistant Secretary since 2003 | | Assistant Vice President, Neuberger, since 2008 and Employee since 1999; formerly, Employee, Management, 1993 to 1999; Assistant Secretary, ten registered investment companies for which Management acts as investment manager and administrator (seven since 2003, one since 2005, one since 2006 and one since 2013). | |
Owen F. McEntee, Jr. (1961) | | Vice President since 2008 | | Vice President, Neuberger, since 2006; Employee, Management, since 1992; Vice President, ten registered investment companies for which Management acts as investment manager and administrator (nine since 2008 and one since 2013). | |
John M. McGovern (1970) | | Treasurer and Principal Financial and Accounting Officer since 2005 | | Senior Vice President, Neuberger, since 2007; Employee, Management, since 1993; Treasurer and Principal Financial and Accounting Officer, ten registered investment companies for which Management acts as investment manager and administrator (eight since 2005, one since 2006 and one since 2013); formerly, Vice President, Neuberger, 2004 to 2006; formerly, Assistant Treasurer, eight registered investment companies for which Management acts as investment manager and administrator, 2002 to 2005. | |
Frank Rosato (1971) | | Assistant Treasurer since 2005 | | Vice President, Neuberger, since 2006; Employee, Management, since 1995; Assistant Treasurer, ten registered investment companies for which Management acts as investment manager and administrator (eight since 2005, one since 2006 and one since 2013). | |
Neil S. Siegel (1967) | | Vice President since 2008 | | Managing Director, Management, since 2008; Managing Director, Neuberger, since 2006; Managing Director, NBFI, since 2011; formerly, Senior Vice President, Neuberger, 2004 to 2006; Vice President, ten registered investment companies for which Management acts as investment manager and administrator (nine since 2008 and one since 2013). | |
Chamaine Williams (1971) | | Chief Compliance Officer since 2005 | | Senior Vice President, Neuberger, since 2007; Chief Compliance Officer, Management, since 2006; Chief Compliance Officer, ten registered investment companies for which Management acts as investment manager and administrator (eight since 2005, one since 2006 and one since 2013); formerly, Senior Vice President, LBI, 2007 to 2008; formerly, Vice President, LBI, 2003 to 2006; formerly, Chief Compliance Officer, Lehman Brothers Asset Management Inc., 2003 to 2007; formerly, Chief Compliance Officer, Lehman Brothers Alternative Investment Management LLC, 2003 to 2007. | |
(1) The business address of each listed person is 605 Third Avenue, New York, New York 10158.
(2) Pursuant to the By-Laws of the Trust, each officer elected by the Trustees shall hold office until his or her successor shall have been elected and qualified or until his or her earlier death, inability to serve, or resignation. Officers serve at the pleasure of the Trustees and may be removed at any time with or without cause.
(3) Except as otherwise indicated, each individual has held the positions shown for at least the last five years.
Proxy Voting Policies and Procedures
A description of the policies and procedures that the Trust uses to determine how to vote proxies relating to portfolio securities is available, without charge, by calling 800-877-9700 (toll-free) and on the Securities and Exchange Commission's website, at www.sec.gov. Information regarding how the Trust voted proxies relating to portfolio securities during the most recent 12-month period ended June 30 is also available upon request, without charge, by calling 800-877-9700 (toll-free), on the Securities and Exchange Commission's website at www.sec.gov, and on Management's website at www.nb.com.
Quarterly Portfolio Schedule
The Trust files a complete schedule of portfolio holdings for the Fund with the Securities and Exchange Commission for the first and third quarters of each fiscal year on Form N-Q. The Trust's Forms N-Q are available on the Securities and Exchange Commission's website at www.sec.gov and may be reviewed and copied at the Securities and Exchange Commission's Public Reference Room in Washington, DC. Information on the operation of the Public Reference Room may be obtained by calling 800-SEC-0330. The information on Form N-Q is available upon request, without charge, by calling 800-877-9700 (toll free).
Notice to Shareholders
The Fund designates $86,555,083 as a capital gain distribution.
Board Consideration of the Management and Sub-Advisory Agreements
On an annual basis, the Board of the Trust, including the Trustees who are not "interested persons" of Management (including its affiliates) or the Trust ("Independent Fund Trustees"), considers whether to continue the Management and Sub-Advisory Agreements ("Agreements") with respect to the Fund. Throughout the process, the Independent Fund Trustees are advised by counsel that is experienced in Investment Company Act of 1940 matters and that is independent of Management ("Independent Counsel"). At a meeting held on October 6-7, 2014, the Board, including the Independent Fund Trustees, approved the continuation of the Agreements for the Fund.
In evaluating the Agreements, the Board, including the Independent Fund Trustees, reviewed extensive materials provided by Management in response to questions submitted by the Board and Independent Counsel, and met with senior representatives of Management regarding its personnel, operations and financial condition as they relate to the Fund. The annual contract review extends over at least two regular meetings of the Board to ensure that Management and Neuberger have time to respond to any questions the Independent Fund Trustees may have on their initial review of the materials and that the Independent Fund Trustees have time to consider those responses.
In connection with its deliberations, the Board also considered the broad range of information relevant to the annual contract review that is provided to the Board (including its various standing committees) at meetings throughout the year, including investment performance reports and related portfolio information for the Fund, as well as periodic reports on, among other matters, pricing and valuation; brokerage and execution; and compliance, shareholder and other services provided by Management and its affiliates. To assist the Board in its deliberations regarding the annual contract review, the Board has established a Contract Review Committee comprised of Independent Fund Trustees, as well as other committees that focus throughout the year on specific areas relevant to the annual contract review, such as Fund performance or compliance matters.
The Independent Fund Trustees received from Independent Counsel a memorandum discussing the legal standards for their consideration of the proposed continuation of the Agreements. During the course of the year and during their deliberations regarding the annual contract review, the Contract Review Committee and the Independent Fund Trustees met with Independent Counsel separately from representatives of Management.
In connection with its approval of the continuation of the Agreements, the Board evaluated the terms of the Agreements, the overall fairness of the Agreements to the Fund and whether the Agreements were in the best interests of the Fund and its shareholders. The Board considered all factors it deemed relevant with respect to the Fund, including the following factors: (1) the nature, extent, and quality of the services provided by Management and Neuberger; (2) the investment performance of the Fund compared to an appropriate market index and a peer group of investment companies; (3) the costs of the services provided as compared to a peer group of investment companies and the profit or loss realized by Management and its affiliates from their relationship with the Fund; (4) the extent to which economies of scale might be realized as the Fund grows; and (5) whether fee levels reflect any such potential economies of scale for the benefit of the Fund's shareholders.
The Board factored into its evaluation of the Fund's fees and performance a consideration of the limitations inherent in the methodology for constructing peer groups and determining which investment companies should be included in the peer groups. The Board considered two separate peer groups, one composed of proprietary funds that are operated by insurance companies, and the other composed of non-proprietary funds operated for insurance company investors by independent investment managers.
While each Trustee may have attributed different weights to the various factors, the Board's determination to approve the continuation of the Agreements was based on a comprehensive consideration of all information provided to the Board throughout the year and specifically in connection with the annual contract review. The Board members did not identify any particular information or factor that was all-important or controlling. The Board focused on the overall costs and benefits of the Agreements relating to the Fund and, through the Fund, its shareholders.
With respect to the nature, extent and quality of the services provided, the Board considered the investment philosophy and decision-making processes of Management and Neuberger, and the qualifications, experience and capabilities of and the resources available to the portfolio management personnel of Management and Neuberger who perform services for the Fund. The Board noted that Management also provides certain administrative services, including fund accounting and compliance oversight. The Board also considered Management's and Neuberger's policies and practices regarding brokerage and allocation of portfolio transactions and reviewed the quality of the execution services that Management had provided. The Board also reviewed whether Management or Neuberger used brokers to execute Fund transactions that provide research and other services to Management or Neuberger and the types of benefits potentially derived from such services by Management, Neuberger, the Fund and other clients of Management and Neuberger. The Board also considered that Management's responsibilities include daily management of investment, operational, enterprise, legal, regulatory and compliance risks as they relate to the Fund, and considered information regarding Management's processes for managing risk. In addition, the Board noted the positive compliance history of Management and Neuberger, as no significant compliance problems were reported to the Board with respect to either firm. The Board also considered the general structure of the portfolio manager compensation program and whether this structure provides appropriate incentives to act in the best interests of the Fund. As in past years, the Board also considered the manner in which Management addressed various non-routine matters that arose during the year, some of them a result of developments in the broader fund industry or the regulations governing it. In addition, the Board considered actions taken by Management and Neuberger in response to recent market conditions, including actions taken in response to regulatory concerns about changes in fixed-income market liquidity and potential volatility, and considered the overall performance of Management and Neuberger in this context.
With respect to investment performance, the Board considered information regarding the Fund's short-, intermediate- and long-term performance both on an absolute basis and relative to an appropriate market index (or benchmark) and the average performance of a composite peer group (as constructed by an independent organization) of investment companies pursuing broadly similar strategies. The Board also reviewed performance in relation to certain measures of the degree of investment risk undertaken by the portfolio manager. The Board considered that as compared to its proprietary peer group, the Fund's performance for its Class S shares was below the median for the 1, 3 and 5-year periods, and higher than the median for the 10-year period. As compared to its non-proprietary peer group, the Fund's performance for its Class S shares was below the median for the 1 and 5-year periods, and the same as the median for the 3 and 10-year periods. The Board also considered that the Fund's performance was below its benchmarks for the 1, 3 and
5-year periods, above one of its benchmarks and below one of its benchmarks for the 10-year period. The Board discussed with Management the Fund's performance and steps that Management was pursuing to improve performance. The Board also considered Management's responsiveness with respect to the Fund's underperformance. In this regard, the Board noted that performance, especially short-term performance, is only one of the factors that it deems relevant to its consideration of the Agreements and that, after considering all relevant factors, it may be appropriate to approve the continuation of the Agreements notwithstanding the Fund's performance.
With respect to the overall fairness of the Agreements, the Board decided to consider the fee structure for the Fund under the Agreements as compared to the non-proprietary peer group because it concluded that the proprietary funds are constructed on a different business model that the adviser cannot replicate. The Board also considered any fall-out benefits likely to accrue to Management or Neuberger or their affiliates from their relationship with the Fund. The Board also considered the profitability of Management and its affiliates from their association with the Fund, and profitability broken out between the investment management and administrative portions of the services provided, and year-over-year changes in each of Management's reported expense categories.
The Board reviewed a comparison of the Fund's management fee and overall expense ratio to the non-proprietary peer group. The Board noted that the comparative management fee analysis includes, in the Fund's management fee, the separate administrative fee paid to Management, but it was not clear whether this was the case for all funds in the peer group. The Board considered the mean and median of the management fees and overall expense ratios of each peer group. In addition, the Board considered the contractual limit on expenses of the Fund. Noting that the Fund's contractual management fee and actual management fee net of fees waived by Management were higher than the peer group's mean and median, the Board considered whether specific portfolio management, administration or oversight needs contributed to the management fee. The Board also noted that the Fund's size, which impacts its expenses and performance, has been affected by ongoing changes in the insurance market.
The Board also considered whether there were other funds that were advised or sub-advised by Management or its affiliates or separate accounts managed by Management or its affiliates with investment objectives, policies and strategies that were similar to those of the Fund. The Board compared the fees charged to the Fund to the fees charged to any such funds and/or separate accounts. The Board considered the appropriateness and reasonableness of any differences between the fees charged to the Fund and any such funds and/or separate accounts, including any breakpoints, and determined that any differences in fees and fee structures were consistent with the management and other services provided.
The Board also evaluated any apparent or anticipated economies of scale in relation to the services Management provides to the Fund. The Board considered that the Fund's fee structure provides for a reduction of payments resulting from the use of breakpoints and whether those breakpoints are set at appropriate asset levels. In concluding that the benefits accruing to Management and its affiliates by virtue of their relationship with the Fund were reasonable in light of the costs of providing the investment advisory and other services and the benefits accruing to the Fund, the Board reviewed specific data as to Management's profit on the Fund for a recent period. The Board also carefully examined Management's cost allocation methodology. The Board recognized that Management should be entitled to earn a reasonable level of profits for the services it provides to the Fund and, based on its review, concluded that Management's reported level of profitability was reasonable.
Conclusions
In approving the Agreements, the Board concluded that the terms of each Agreement are fair and reasonable to the Fund and that approval of the Agreements is in the best interests of the Fund and its shareholders. In reaching this determination, the Board considered that Management and Neuberger could be expected to provide a high level of service to the Fund; that it retained confidence in Management's and Neuberger's capabilities to manage the Fund; that the Fund's fee structure appeared to the Board to be reasonable given the nature, extent and quality of services provided; and that the benefits accruing to Management and its affiliates by virtue of their relationship to the Fund were reasonable in light of the costs of providing the investment advisory and other services and the benefits accruing to the Fund. The Board's conclusions may be based in part on its consideration of materials prepared in connection with the approval or
continuance of the Agreements in prior years and on the Board's ongoing regular review of Fund performance and operations throughout the year, in addition to material prepared specifically for the most recent annual review of the Agreements.
32
Neuberger Berman
Advisers Management Trust
Mid Cap Intrinsic Value Portfolio
I Class Shares
S Class Shares
Annual Report
December 31, 2014
Mid Cap Intrinsic Value Portfolio Commentary (Unaudited)
The Neuberger Berman Advisers Management Trust Mid Cap Intrinsic Value Portfolio (the "Fund") Class I provided a total return of 13.84% for the 12 months ended December 31, 2014, underperforming its benchmark, the Russell Midcap® Value Index, which returned 14.75% for the period. Returns for the Fund's Class I and S shares are provided in the table immediately following this letter.
During the past fiscal year, the Fund benefited from overweights in the Consumer Staples, Consumer Discretionary and Technology sectors. In the Consumer Staples sector, the market reacted positively to Safeway being acquired by a private equity firm and the steady and growing cash generating characteristics of CVS Health; and the announcements by Office Depot (Consumer Discretionary) that it is achieving higher than consensus earnings and is exploring a merger with Staples. In the Technology sector, the market reacted positively to Skyworks Solutions' growing earnings and cash flow, due in part to its increased chip content on the new iPhones.
Underweights in the Financial Services and Utilities sectors detracted from Fund performance as these sectors benefited from the decline in interest rates. With interest rates expected to rise and securities in the Utilities sector selling at record P/E's, we anticipate these underweights could benefit the Fund in 2015. Our lagging investments in 2014 included KBR, Elizabeth Arden and Express. We continue to hold KBR, whose new CEO has announced a major restructuring that we believe could benefit shareholders, and Express. Elizabeth Arden was eliminated as our investment thesis for the company changed.
Surprisingly, interest rates fell in 2014, making equities among the strongest investment alternatives. Due to the massive liquidity provided by the U.S. Federal Reserve (Fed), investors appeared to have largely ignored negative news, including a European economy that is close to deflationary levels, slowing economic conditions in China and Japan, and turmoil in Russia. We believe these factors could be headwinds for U.S. growth in 2015.
We think the Fed is likely to raise rates sometime during 2015; however, we also think the effects could be muted by the extraordinarily low rates abroad. Historically, the record is mixed as to how equities have performed when the Fed has tightened monetary policy, but we anticipate growth in earnings to be the primary driver of the equity market in 2015. Nonetheless, we still foresee an increase in market volatility to accompany a rise in interest rates. Generally, a more volatile environment favors higher-quality companies with strong cash flow and also increases the importance of stock picking—a key attribute of our investment style.
While in our view the market is overdue for a significant correction, major market declines rarely occur unless the economy is heading into a recession or a major macro event shocks the system. In our opinion, a domestic recession seems unlikely at this point; however, an unforeseen event (i.e., a fallout from the decline in oil prices) is hard to predict.
Despite the fact that midcap equities are not as cheap as they were several years ago, we continue to identify quality companies with strong balance sheets and robust free cash flow generation selling at significant discounts to intrinsic value.1 With the domestic economy accelerating, earnings and cash flow should continue to improve during 2015, providing a solid background for companies in the Fund. We anticipate M&A activity will accelerate due to the availability of inexpensive financing, excess cash on balance sheets, and shareholder activism. Our holdings often benefit from event-driven activity. We continue to position the Fund for stronger domestic growth, as it appears to us that foreign growth is slowing and the U.S. economy has decoupled from the rest of the world.
Sincerely,
MICHAEL C. GREENE
PORTFOLIO MANAGER
1Intrinsic value reflects the team's analysis and estimates of a company's value. There is no guarantee that any intrinsic values will be realized; security prices may decrease regardless of intrinsic values.
Information about principal risks of investing in the Fund is set forth in the prospectus and statement of additional information.
The portfolio composition, industries and holdings of the Fund are subject to change.
The opinions expressed are those of the Fund's portfolio manager. The opinions are as of the date of this report, and are subject to change without notice.
Mid Cap Intrinsic Value Portfolio (Unaudited)
SECTOR ALLOCATION
(as a % of Total Investments) | |
Consumer Discretionary | | | 16.3 | % | |
Consumer Staples | | | 3.5 | | |
Energy | | | 7.1 | | |
Financial Services | | | 17.6 | | |
Health Care | | | 4.7 | | |
Materials & Processing | | | 6.1 | | |
Producer Durables | | | 17.4 | | |
Technology | | | 16.6 | | |
Utilities | | | 8.7 | | |
Short-Term Investments | | | 2.0 | | |
Total | | | 100.0 | % | |
PERFORMANCE HIGHLIGHTS
| | | Inception | | Average Annual Total Return
Ended 12/31/2014 | |
| | | Date | | 1 Year | | 5 Years | | 10 Years | | Life of Fund | |
Mid Cap Intrinsic
Value Portfolio Class I | |
08/22/2001 | | | 13.84 | % | | | 16.29 | % | | | 8.06 | % | | | 9.14 | % | |
Mid Cap Intrinsic
Value Portfolio Class S2 | | 04/29/2005 | | | 13.56 | % | | | 16.05 | % | | | 7.85 | % | | | 8.98 | % | |
Russell Midcap®
Value Index1,3 | | | | | | | 14.75 | % | | | 17.43 | % | | | 9.43 | % | | | 10.52 | % | |
| Russell Midcap® Index1,3 | | | | | | | 13.22 | % | | | 17.19 | % | | | 9.56 | % | | | 10.08 | % | |
The performance data quoted represent past performance and do not indicate future results. Current performance may be lower or higher than the performance data quoted. For performance data current to the most recent month-end, please visit http://www.nb.com/amtportfolios/performance.
The results shown in the table reflect the reinvestment of income dividends and other distributions, if any. The results do not reflect the effect of taxes a shareholder would pay on Fund distributions or on the redemption of Fund shares. The results do not reflect fees and expenses of the variable annuity and variable life insurance policies or the qualified pension and retirement plans whose proceeds are invested in the Fund.
The investment return and principal value of an investment will fluctuate and shares, when redeemed, may be worth more or less than their original cost.
Returns would have been lower if Neuberger Berman Management LLC ("Management") had not reimbursed certain expenses and/or waived a portion of the investment management fees during certain of the periods shown. Repayment by a class (of expenses previously reimbursed and/or fees previously waived by Management) will decrease the class's returns. Please see Note B in the Notes to Financial Statements for specific information regarding expense reimbursement and/or fee waiver arrangements.
As stated in the Fund's most recent prospectus, the total annual operating expense ratios for fiscal year 2013 were 1.04% and 1.29% for Class I and Class S shares, respectively (before expense reimbursements and/or fee waivers, if any). The expense ratio was 1.25% for Class S shares after expense reimbursements and/or fee waivers. The expense ratios for fiscal year 2014 can be found in the Financial Highlights section of this report.
COMPARISON OF A $10,000 INVESTMENT
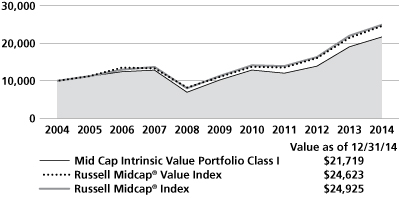
This graph shows the change in value of a hypothetical $10,000 investment in the Fund over the past 10 fiscal years, or since the Fund's inception, if it has not operated for 10 years. The graph is based on Class I shares only; the performance of the Fund's share classes will differ primarily due to different class expenses (see Performance Highlights chart above). The result is compared with benchmarks, which include a broad-based market index and may include a more narrowly based index. Market indices have not been reduced to reflect any of the fees and costs of investing. The results shown in the graph reflect the reinvestment of income dividends and other distributions, if any. The results do not reflect the effect of taxes a shareholder would pay on Fund distributions or on the redemption of Fund shares. The results do not reflect fees and expenses of the variable annuity and variable life insurance policies or the qualified pension and retirement plans whose proceeds are invested in the Fund. Results represent past performance and do not indicate future results.
Please see Endnotes for additional information.
1 The date used to calculate Life of Fund performance for the index is August 22, 2001, the inception date of the oldest share class.
2 Performance shown prior to April 29, 2005 for Class S shares is that of Class I shares, which has lower expenses and correspondingly higher returns than Class S shares.
3 The Russell Midcap® Value Index is a float-adjusted market capitalization-weighted index that measures the performance of the mid-cap value segment of the U.S. equity market. It includes those Russell Midcap® Index companies with lower price-to-book ratios and lower forecasted growth rates. The index is rebalanced annually in June. The Russell Midcap Index measures the performance of the mid-cap segment of the U.S. equity market, and includes approximately 800 of the smallest securities in the Russell 1000® Index (which measures the performance of the 1,000 largest U.S. public companies based on total market capitalization). The index is rebalanced annually in June. Please note that the indices described in this report do not take into account any fees, expenses or tax consequences of investing in the individual securities that they track, and that investors cannot invest directly in any index. Data about the performance of an index are prepared or obtained by Neuberger Berman Management LLC ("Management") and reflect the reinvestment of income dividends and other distributions, if any. The Fund may invest in securities not included in a described index and generally does not invest in all securities included in a described index.
The investments for the Fund are managed by the same portfolio manager(s) who manage(s) one or more other mutual funds that have names, investment objectives and investment styles that are similar to those of the Fund. You should be aware that the Fund is likely to differ from those other mutual fund(s) in size, cash flow pattern and tax matters. Accordingly, the holdings and performance of the Fund can be expected to vary from those of the other mutual fund(s).
Shares of the separate Neuberger Berman Advisers Management Trust Portfolios (the "Funds") are not available to the general public. Shares of the Fund may be purchased only by life insurance companies to be held in their separate accounts, which fund variable annuity and variable life insurance policies, and by qualified pension and retirement plans.
Statistics and projections in this report are derived from sources deemed to be reliable but cannot be regarded as a representation of future results of the Fund. This report is prepared for the general information of shareholders and is not an offer of shares of the Fund. Shares are sold only through the currently effective prospectuses, which must precede or accompany this report.
The "Neuberger Berman" name and logo are registered service marks of Neuberger Berman Group LLC. "Neuberger Berman Management LLC" and the individual Fund name in this piece are either service marks or registered service marks of Neuberger Berman Management LLC.
© 2015 Neuberger Berman Management LLC, distributor. All rights reserved.
Information About Your Fund's Expenses (Unaudited)
As a Fund shareholder, you incur two types of costs: (1) transaction costs such as fees and expenses that are, or may be, imposed under your variable contract or qualified pension plan; and (2) ongoing costs, including management fees, distribution and/or service (12b-1) fees (if applicable), and other Fund expenses. This example is intended to help you understand your ongoing costs (in U.S. dollars) of investing in the Fund and compare these costs with the ongoing costs of investing in other mutual funds.
This table is designed to provide information regarding costs related to your investments. The following examples are based on an investment of $1,000 made at the beginning of the six month period ended December 31, 2014 and held for the entire period. The table illustrates the Fund's costs in two ways:
Actual Expenses and Performance: | | The first section of the table provides information about actual account values and actual expenses in dollars, based on the Fund's actual performance during the period indicated. You may use the information in this line, together with the amount you invested, to estimate the expenses you paid over the period. Simply divide your account value by $1,000 (for example, an $8,600 account value divided by $1,000 = 8.6), then multiply the result by the number in the first section of the table under the heading entitled "Expenses Paid During the Period" to estimate the expenses you paid over the period. | |
Hypothetical Example for
Comparison Purposes: | | The second section of the table provides information about hypothetical account values and hypothetical expenses based on the Fund's actual expense ratio and an assumed rate of return at 5% per year before expenses. This return is not the Fund's actual return. The hypothetical account values and expenses may not be used to estimate the actual ending account balance or expenses you paid for the period. You may use this information to compare the ongoing costs of investing in this Fund versus other funds. To do so, compare the expenses shown in this 5% hypothetical example with the 5% hypothetical examples that appear in the shareholder reports of other funds. | |
Please note that the expenses in the table are meant to highlight your ongoing costs only and do not include any transaction costs, such as fees and expenses that are, or may be imposed under your variable contract or qualified pension plan. Therefore, the information under the heading "Hypothetical (5% annual return before expenses)" is useful in comparing ongoing costs only, and will not help you determine the relative total costs of owning different funds. In addition, if these transaction costs were included, your costs would have been higher.
Expense Information as of 12/31/14
NEUBERGER BERMAN ADVISERS MANAGEMENT TRUST MID CAP INTRINSIC VALUE PORTFOLIO
Actual | | Beginning Account
Value 7/1/14 | | Ending Account
Value 12/31/14 | | Expenses Paid During
the Period*
7/1/14 – 12/31/14 | | Expense
Ratio | |
Class I | | $ | 1,000.00 | | | $ | 1,048.10 | | | $ | 5.32 | | | | 1.03 | % | |
Class S | | $ | 1,000.00 | | | $ | 1,046.40 | | | $ | 6.45 | | | | 1.25 | % | |
Hypothetical (5% annual return before expenses)** | |
Class I | | $ | 1,000.00 | | | $ | 1,020.01 | | | $ | 5.24 | | | | 1.03 | % | |
Class S | | $ | 1,000.00 | | | $ | 1,018.90 | | | $ | 6.36 | | | | 1.25 | % | |
* For each class, expenses are equal to the annualized expense ratio for the class, multiplied by the average account value over the period, multiplied by 184/365 (to reflect the one-half year period shown).
** Hypothetical 5% annual return before expenses is calculated by multiplying the number of days in the most recent half year divided by 365.
Schedule of Investments Mid Cap Intrinsic Value Portfolio 12/31/14
NUMBER OF SHARES | | | | VALUE† | |
Common Stocks (99.4%) | | | |
Aerospace & Defense (5.6%) | | | |
| | 33,350 | | | General Dynamics Corp. | | $ | 4,589,627 | | |
| 95,600 | | | Spirit AeroSystems
Holdings, Inc. Class A | | | 4,114,624 | * | |
| | | | 8,704,251 | | |
Auto Components (1.5%) | | | |
| | 16,500 | | | Lear Corp. | | | 1,618,320 | | |
| 7,300 | | | TRW Automotive
Holdings Corp. | | | 750,805 | * | |
| | | | 2,369,125 | | |
Banks (8.2%) | | | |
| | 96,900 | | | BankUnited, Inc. | | | 2,807,193 | | |
| | 52,800 | | | BB&T Corp. | | | 2,053,392 | | |
| | 65,400 | | | Comerica, Inc. | | | 3,063,336 | | |
| | 225,800 | | | Huntington Bancshares, Inc. | | | 2,375,416 | | |
| | 19,400 | | | M&T Bank Corp. | | | 2,437,028 | | |
| | | | 12,736,365 | | |
Building Products (1.4%) | | | |
| | 59,000 | | | Owens Corning | | | 2,112,790 | | |
Capital Markets (2.0%) | | | |
| | 40,400 | | | State Street Corp. | | | 3,171,400 | | |
Chemicals (3.0%) | | | |
| | 38,700 | | | Ashland, Inc. | | | 4,634,712 | | |
Commercial Services & Supplies (7.6%) | | | |
| | 153,300 | | | ADT Corp. | | | 5,554,059 | | |
| | 168,700 | | | Covanta Holding Corp. | | | 3,713,087 | | |
| | 58,800 | | | Tyco International PLC | | | 2,578,968 | | |
| | | | 11,846,114 | | |
Construction & Engineering (1.3%) | | | |
| | 119,500 | | | KBR, Inc. | | | 2,025,525 | | |
Containers & Packaging (1.1%) | | | |
| | 32,100 | | | Avery Dennison Corp. | | | 1,665,348 | | |
Electric Utilities (2.3%) | | | |
| | 54,200 | | | Edison International | | | 3,549,016 | | |
Electrical Equipment (1.0%) | | | |
| | 20,800 | | | Regal-Beloit Corp. | | | 1,564,160 | | |
NUMBER OF SHARES | | | | VALUE† | |
Electronic Equipment, Instruments &
Components (2.1%) | | | |
| | 294,300 | | | Flextronics International Ltd. | | $ | 3,290,274 | * | |
Energy Equipment & Services (1.5%) | | | |
| | 46,500 | | | Cameron International Corp. | | | 2,322,675 | * | |
Food & Staples Retailing (3.5%) | | | |
| | 42,100 | | | CVS Health Corp. | | | 4,054,651 | | |
| | 39,450 | | | Safeway, Inc. | | | 1,385,484 | | |
| | | | 5,440,135 | | |
Health Care Equipment & Supplies (2.1%) | | | |
| | 28,200 | | | Zimmer Holdings, Inc. | | | 3,198,444 | | |
Health Care Providers & Services (2.7%) | | | |
| | 21,400 | | | Cardinal Health, Inc. | | | 1,727,622 | | |
| | 33,700 | | | Omnicare, Inc. | | | 2,457,741 | | |
| | | | 4,185,363 | | |
Hotels, Restaurants & Leisure (2.5%) | | | |
| | 66,100 | | | Darden Restaurants, Inc. | | | 3,875,443 | | |
Independent Power and Renewable
Electricity Producers (2.1%) | | | |
| | 241,300 | | | AES Corp. | | | 3,322,701 | | |
IT Services (6.6%) | | | |
| | 80,300 | | | Amdocs Ltd. | | | 3,746,396 | | |
| | 81,600 | | | Teradata Corp. | | | 3,564,288 | * | |
| | 160,300 | | | Western Union Co. | | | 2,870,973 | | |
| | | | 10,181,657 | | |
Machinery (2.9%) | | | |
| | 81,200 | | | Harsco Corp. | | | 1,533,868 | | |
| | 22,900 | | | Valmont Industries, Inc. | | | 2,908,300 | | |
| | | | 4,442,168 | | |
Multi-Utilities (3.4%) | | | |
| | 114,000 | | | CenterPoint Energy, Inc. | | | 2,671,020 | | |
| | 30,400 | | | DTE Energy Co. | | | 2,625,648 | | |
| | | | 5,296,668 | | |
Multiline Retail (2.2%) | | | |
| | 56,200 | | | Kohl's Corp. | | | 3,430,448 | | |
See Notes to Schedule of Investments
NUMBER OF SHARES | | | | VALUE† | |
Oil, Gas & Consumable Fuels (5.7%) | | | |
| | 90,300 | | | Cabot Oil & Gas Corp. | | $ | 2,673,783 | | |
| | 56,100 | | | Devon Energy Corp. | | | 3,433,881 | | |
| | 28,638 | | | Energy Transfer Partners L.P. | | | 1,861,470 | | |
| | 33,400 | | | Southwestern Energy Co. | | | 911,486 | * | |
| | | | 8,880,620 | | |
Real Estate Investment Trusts (5.7%) | | | |
| 119,577 | | | Corrections Corporation
of America | | | 4,345,428 | | |
| | 136,900 | | | Starwood Property Trust, Inc. | | | 3,181,556 | | |
| 53,340 | | | Starwood Waypoint
Residential Trust | | | 1,406,576 | | |
| | | | 8,933,560 | | |
Road & Rail (2.7%) | | | |
| | 167,200 | | | Hertz Global Holdings, Inc. | | | 4,169,968 | * | |
Semiconductors & Semiconductor
Equipment (4.0%) | | | |
| | 86,000 | | | Skyworks Solutions, Inc. | | | 6,253,060 | | |
Software (6.0%) | | | |
| | 107,100 | | | Cadence Design Systems, Inc. | | | 2,031,687 | * | |
| 42,700 | | | Check Point Software
Technologies Ltd. | | | 3,354,939 | * | |
| | 272,200 | | | Nuance Communications, Inc. | | | 3,884,294 | * | |
| | | | 9,270,920 | | |
Specialty Retail (7.7%) | | | |
| | 62,000 | | | Best Buy Co., Inc. | | | 2,416,760 | | |
| | 151,200 | | | Express, Inc. | | | 2,221,128 | * | |
| | 605,400 | | | Office Depot, Inc. | | | 5,191,305 | * | |
| | 76,700 | | | Select Comfort Corp. | | | 2,073,201 | * | |
| | | | 11,902,394 | | |
Wireless Telecommunication
Services (1.0%) | | | |
| 62,000 | | | Telephone & Data
Systems, Inc. | | | 1,565,500 | | |
| | | | Total Common Stocks
(Cost $115,692,605) | | | 154,340,804 | | |
Short-Term Investments (2.0%) | | | |
| 3,090,706 | | | State Street Institutional
Liquid Reserves Fund
Premier Class
(Cost $3,090,706) | | | 3,090,706 | | |
| | | | Total Investments (101.4%)
(Cost $118,783,311) | | | 157,431,510 | ## | |
| | | | Liabilities, less cash, receivables
and other assets [(1.4%)] | | | (2,133,131 | ) | |
| | | | | Total Net Assets (100.0%) | | $ | 155,298,379 | | |
See Notes to Schedule of Investments
Notes to Schedule of Investments Mid Cap Intrinsic Value
Portfolio
† In accordance with Accounting Standards Codification ("ASC") 820 "Fair Value Measurement" ("ASC 820"), all investments held by Neuberger Berman Advisers Management Trust Mid Cap Intrinsic Value Portfolio (the "Fund") are carried at the value that Neuberger Berman Management LLC ("Management") believes the Fund would receive upon selling an investment in an orderly transaction to an independent buyer in the principal or most advantageous market for the investment under current market conditions. Various inputs, including the volume and level of activity for the asset or liability in the market, are considered in valuing the Fund's investments, some of which are discussed below. Significant management judgment may be necessary to value investments in accordance with ASC 820.
ASC 820 established a three-tier hierarchy of inputs to create a classification of value measurements for disclosure purposes. The three-tier hierarchy of inputs is summarized in the three broad Levels listed below.
• Level 1 – quoted prices in active markets for identical investments
• Level 2 – other observable inputs (including quoted prices for similar investments, interest rates, prepayment speeds, credit risk, amortized cost, etc.)
• Level 3 – unobservable inputs (including the Fund's own assumptions in determining the fair value of investments)
The inputs or methodology used for valuing an investment are not necessarily an indication of the risk associated with investing in those securities.
The value of the Fund's investments in equity securities and exchange traded funds, for which market quotations are readily available, is generally determined by Management by obtaining valuations from an independent pricing service based on the latest sale price quoted on a principal exchange or market for that security (Level 1 inputs). Securities traded primarily on the NASDAQ Stock Market are normally valued at the NASDAQ Official Closing Price ("NOCP") provided by NASDAQ each business day. The NOCP is the most recently reported price as of 4:00:02 p.m., Eastern time, unless that price is outside the range of the "inside" bid and asked prices (i.e., the bid and asked prices that dealers quote to each other when trading for their own accounts); in that case, NASDAQ will adjust the price to equal the inside bid or asked price, whichever is closer. Because of delays in reporting trades, the NOCP may not be based on the price of the last trade to occur before the market closes. If there is no reported sale of a security on a particular day, the independent pricing service may value the security based on reported market quotations.
Management has developed a process to periodically review information provided by independent pricing services for all types of securities.
Investments in investment companies are valued using the respective fund's daily calculated net asset value per share (Level 2 inputs).
If a valuation is not available from an independent pricing service, or if Management has reason to believe that the valuation received does not represent the amount the Fund might reasonably expect to receive on a current sale in an orderly transaction, Management seeks to obtain quotations from brokers or dealers (generally considered Level 2 or Level 3 inputs depending on the number of quotes available). If such quotations are not readily available, the security is valued using methods the Neuberger Berman Advisers Management Trust's Board of Trustees (the "Board") has approved in the good-faith belief that the resulting valuation will reflect the fair value of the security. Numerous factors may be considered when determining the fair value of a security based on Level 2 or Level 3 inputs, including available analyst, media or other reports, trading in futures or American Depositary Receipts ("ADRs") and whether the issuer of the security being fair valued has other securities outstanding.
See Notes to Financial Statements
Notes to Schedule of Investments Mid Cap Intrinsic Value
Portfolio (cont'd)
The value of the Fund's investments in foreign securities is generally determined using the same valuation methods and inputs as other Fund investments, as discussed above. Foreign security prices expressed in local currency values are translated from the local currency into U.S. dollars using the exchange rates as of the end of regular trading on the New York Stock Exchange ("NYSE") on business days, usually 4:00 p.m., Eastern time. The Board has approved the use of Interactive Data Pricing and Reference Data, Inc. ("Interactive") to assist in determining the fair value of foreign equity securities when changes in the value of a certain index suggest that the closing prices on the foreign exchanges may no longer represent the amount that the Fund could expect to receive for those securities or on days when foreign markets are closed and U.S. markets are open. In each of these events, Interactive will provide adjusted prices for certain foreign equity securities using a statistical analysis of historical correlations of multiple factors (Level 2 inputs). In the absence of precise information about the market values of these foreign securities as of the close of the NYSE, the Board has determined on the basis of available data that prices adjusted in this way are likely to be closer to the prices the Fund could realize on a current sale than are the prices of those securities established at the close of the foreign markets in which the securities primarily trade.
Fair value prices are necessarily estimates, and there is no assurance that such a price will be at or close to the price at which the security is next quoted or next trades.
The following is a summary, categorized by Level, of inputs used to value the Fund's investments as of December 31, 2014:
Asset Valuation Inputs | | Level 1 | | Level 2 | | Level 3 | | Total | |
Investments: | |
Common Stocks^ | | $ | 154,340,804 | | | $ | — | | | $ | — | | | $ | 154,340,804 | | |
Short-Term Investments | | | — | | | | 3,090,706 | | | | — | | | | 3,090,706 | | |
Total Investments | | $ | 154,340,804 | | | $ | 3,090,706 | | | $ | — | | | $ | 157,431,510 | | |
^ The Schedule of Investments provides information on the industry categorization for the portfolio.
As of the year ended December 31, 2014, the Fund had no transfers between Levels 1, 2 or 3 based on the beginning of period market values as of December 31, 2013.
## At December 31, 2014, the cost of investments for U.S. federal income tax purposes was $118,747,876. Gross unrealized appreciation of investments was $41,891,446 and gross unrealized depreciation of investments was $3,207,812, resulting in net unrealized appreciation of $38,683,634, based on cost for U.S. federal income tax purposes.
* Security did not produce income during the last twelve months.
See Notes to Financial Statements
Statement of Assets and Liabilities
Neuberger Berman Advisers Management Trust
| | | MID CAP
INTRINSIC
VALUE
PORTFOLIO | |
| | | December 31, 2014 | |
Assets | |
Investments in securities, at value* (Note A)—see Schedule of Investments: | |
Unaffiliated issuers | | $ | 157,431,510 | | |
Dividends and interest receivable | | | 346,694 | | |
Receivable for Fund shares sold | | | 108,202 | | |
Prepaid expenses and other assets | | | 1,463 | | |
Total Assets | | | 157,887,869 | | |
Liabilities | |
Payable for securities purchased | | | 363,329 | | |
Payable for Fund shares redeemed | | | 2,038,319 | | |
Payable to investment manager (Note B) | | | 73,497 | | |
Payable to administrator—net (Note B) | | | 49,609 | | |
Accrued expenses and other payables | | | 64,736 | | |
Total Liabilities | | | 2,589,490 | | |
Net Assets | | $ | 155,298,379 | | |
Net Assets consist of: | |
Paid-in capital | | $ | 125,342,066 | | |
Undistributed net investment income (loss) | | | 1,678,672 | | |
Accumulated net realized gains (losses) on investments | | | (10,370,558 | ) | |
Net unrealized appreciation (depreciation) in value of investments | | | 38,648,199 | | |
Net Assets | | $ | 155,298,379 | | |
Net Assets | |
Class I | | $ | 92,417,617 | | |
Class S | | | 62,880,762 | | |
Shares Outstanding ($.001 par value; unlimited shares authorized) | |
Class I | | | 5,171,991 | | |
Class S | | | 3,151,327 | | |
Net Asset Value, offering and redemption price per share | |
Class I | | $ | 17.87 | | |
Class S | | | 19.95 | | |
*Cost of Investments | | $ | 118,783,311 | | |
See Notes to Financial Statements
Neuberger Berman Advisers Management Trust
| | | MID CAP
INTRINSIC
VALUE
PORTFOLIO | |
| | | For the
Year Ended
December 31, 2014 | |
Investment Income: | |
Income (Note A): | |
Dividend income—unaffiliated issuers | | $ | 3,321,263 | | |
Interest income—unaffiliated issuers | | | 2,590 | | |
Total income | | $ | 3,323,853 | | |
Expenses: | |
Investment management fees (Note B) | | | 824,560 | | |
Administration fees (Note B): | |
Class I | | | 260,992 | | |
Class S | | | 188,768 | | |
Distribution fees (Note B): | |
Class S | | | 157,307 | | |
Audit fees | | | 45,335 | | |
Custodian and accounting fees | | | 62,624 | | |
Insurance expense | | | 4,694 | | |
Legal fees | | | 78,681 | | |
Shareholder reports | | | 19,050 | | |
Trustees' fees and expenses | | | 35,906 | | |
Miscellaneous | | | 9,009 | | |
Total expenses | | | 1,686,926 | | |
Expenses reimbursed by Management (Note B) | | | (12,553 | ) | |
Total net expenses | | | 1,674,373 | | |
Net investment income (loss) | | $ | 1,649,480 | | |
Realized and Unrealized Gain (Loss) on Investments: | |
Net realized gain (loss) on: | |
Sales of investment securities of unaffiliated issuers (Note A) | | | 13,599,746 | | |
Net increase from payments by affiliates (Note B) | | | 8,995 | | |
Change in net unrealized appreciation (depreciation) in value of (Note A): | |
Unaffiliated investment securities | | | 3,910,640 | | |
Net gain (loss) on investments | | | 17,519,381 | | |
Net increase (decrease) in net assets resulting from operations | | $ | 19,168,861 | | |
See Notes to Financial Statements
Statements of Changes in Net Assets
Neuberger Berman Advisers Management Trust
| | | MID CAP INTRINSIC VALUE PORTFOLIO | |
| | | Year Ended
December 31,
2014 | | Year Ended
December 31,
2013 | |
Increase (Decrease) in Net Assets: | |
From Operations: | |
Net investment income (loss) (Note A) | | $ | 1,649,480 | | | $ | 1,450,751 | | |
Net realized gain (loss) on investments (Note A) | | | 13,599,746 | | | | 15,936,620 | | |
Net increase from payments by affiliates (Note B) | | | 8,995 | | | | — | | |
Change in net unrealized appreciation (depreciation) of investments (Note A) | | | 3,910,640 | | | | 24,718,127 | | |
Net increase (decrease) in net assets resulting from operations | | | 19,168,861 | | | | 42,105,498 | | |
Distributions to Shareholders From (Note A): | |
Net investment income: | |
Class I | | | (943,550 | ) | | | (907,815 | ) | |
Class S | | | (433,186 | ) | | | (537,739 | ) | |
Net realized gain on investments: | |
Class I | | | (2,499,406 | ) | | | — | | |
Class S | | | (1,585,058 | ) | | | — | | |
Total distributions to shareholders | | | (5,461,200 | ) | | | (1,445,554 | ) | |
From Fund Share Transactions (Note D): | |
Proceeds from shares sold: | |
Class I | | | 20,393,916 | | | | 15,148,369 | | |
Class S | | | 10,109,605 | | | | 8,686,977 | | |
Proceeds from reinvestment of dividends and distributions: | |
Class I | | | 3,442,956 | | | | 907,815 | | |
Class S | | | 2,018,244 | | | | 537,739 | | |
Payments for shares redeemed: | |
Class I | | | (23,329,924 | ) | | | (22,644,266 | ) | |
Class S | | | (17,628,105 | ) | | | (18,198,542 | ) | |
Net increase (decrease) from Fund share transactions | | | (4,993,308 | ) | | | (15,561,908 | ) | |
Net Increase (Decrease) in Net Assets | | | 8,714,353 | | | | 25,098,036 | | |
Net Assets: | |
Beginning of year | | | 146,584,026 | | | | 121,485,990 | | |
End of year | | $ | 155,298,379 | | | $ | 146,584,026 | | |
Undistributed net investment income (loss) at end of year | | $ | 1,678,672 | | | $ | 1,450,497 | | |
See Notes to Financial Statements
Notes to Financial Statements Mid Cap Intrinsic Value
Portfolio
Note A—Summary of Significant Accounting Policies:
1 General: Neuberger Berman Advisers Management Trust (the "Trust") is a Delaware statutory trust organized pursuant to an Amended and Restated Trust Instrument dated March 27, 2014. The Trust is currently comprised of eleven separate operating series (each individually a "Series," and collectively the "Funds") each of which is diversified. The Trust is registered as an open-end management investment company under the Investment Company Act of 1940, as amended (the "1940 Act"), and its shares are registered under the Securities Act of 1933, as amended. The Fund currently offers Class I and Class S shares. The Board may establish additional series or classes of shares without the approval of shareholders.
The assets of each Series belong only to that Series, and the liabilities of each Series are borne solely by that Series and no other.
The Fund is an investment company and accordingly follows the investment company accounting and reporting guidance of the Financial Accounting Standards Board (FASB) Accounting Standard Codification Topic 946 "Financial Services—Investment Companies."
The preparation of financial statements in accordance with U.S. generally accepted accounting principles ("GAAP") requires Management to make estimates and assumptions at the date of the financial statements. Actual results could differ from those estimates.
Shares of the Fund are not available to the general public and may be purchased only by life insurance companies to be held in their separate accounts, which fund variable annuity and variable life insurance policies, and by qualified pension and retirement plans.
2 Portfolio valuation: Investment securities are valued as indicated in the notes following the Schedule of Investments.
3 Foreign currency translation: The accounting records of the Fund are maintained in U.S. dollars. Foreign currency amounts are translated into U.S. dollars using the exchange rate as of the end of regular trading on the NYSE on business days, usually 4:00 p.m. Eastern time, to determine the value of investments, other assets and liabilities. Purchase and sale prices of securities, and income and expenses, are translated into U.S. dollars at the prevailing rate of exchange on the respective dates of such transactions. Net unrealized foreign currency gain (loss), if any, arises from changes in the value of assets and liabilities, other than investments in securities, as a result of changes in exchange rates and is stated separately in the Statement of Operations.
4 Securities transactions and investment income: Securities transactions are recorded on trade date for financial reporting purposes. Dividend income is recorded on the ex-dividend date or, for certain foreign dividends, as soon as the Fund becomes aware of the dividends. Non-cash dividends included in dividend income, if any, are recorded at the fair market value of the securities received. Interest income, including accretion of original issue discount, where applicable, and accretion of discount on short-term investments, if any, is recorded on the accrual basis. Realized gains and losses from securities transactions and foreign currency transactions, if any, are recorded on the basis of identified cost and stated separately in the Statement of Operations. Included in net realized gain (loss) on investments are proceeds from the settlements of class action litigation in which the Fund participated as a class member. The amount of such proceeds for the year ended December 31, 2014 was $106.
5 Income tax information: Each Series is treated as a separate entity for U.S. federal income tax purposes. It is the policy of the Fund to continue to qualify for treatment as a regulated investment company ("RIC") by complying with the requirements of the U.S. Internal Revenue Code applicable to RICs and to distribute substantially all of its net investment income and net realized capital gains to its shareholders. To the extent the Fund distributes
substantially all of its net investment income and net realized capital gains to shareholders, no federal income or excise tax provision is required.
The Fund has adopted the provisions of ASC 740 "Income Taxes" ("ASC 740"). ASC 740 sets forth a minimum threshold for financial statement recognition of a tax position taken, or expected to be taken, in a tax return. The Fund recognizes interest and penalties, if any, related to unrecognized tax positions as an income tax expense in the Statement of Operations. The Fund is subject to examination by U.S. federal and state tax authorities for returns filed for the tax years for which the applicable statutes of limitations have not yet expired. As of December 31, 2014, the Fund did not have any unrecognized tax positions.
Income distributions and capital gain distributions are determined in accordance with income tax regulations, which may differ from GAAP. These differences are primarily due to differing treatments of income and gains on various investment securities held by the Fund, timing differences and differing characterization of distributions made by the Fund. The Fund may also utilize earnings and profits distributed to shareholders on redemption of shares as a part of the dividends-paid deduction for income tax purposes.
As determined on December 31, 2014, permanent differences resulting primarily from different book and tax accounting were reclassified at year end. Such differences are attributed to the tax treatment of prior year accumulated balance adjustments and non-taxable distributions from underlying investments. These reclassifications had no effect on net income, net asset value ("NAV") or NAV per share of the Fund. For the year ended December 31, 2014, the Fund recorded the following permanent reclassifications:
| Paid-in Capital | | Undistributed
Net Investment
Income (Loss) | | Accumulated
Net Realized
Gains (Losses)
on Investments | |
| $ | (117 | ) | | $ | (44,569 | ) | | $ | 44,686 | | |
The tax character of distributions paid during the years ended December 31, 2014 and December 31, 2013 was as follows:
Distributions Paid From: | |
Ordinary Income | | Long-Term Capital Gain | | Total | |
| 2014 | | 2013 | | 2014 | | 2013 | | 2014 | | 2013 | |
| $ | 1,376,736 | | | $ | 1,445,554 | | | $ | 4,084,464 | | | $ | — | | | $ | 5,461,200 | | | $ | 1,445,554 | | |
As of December 31, 2014, the components of distributable earnings (accumulated losses) on a U.S. federal income tax basis were as follows:
Undistributed
Ordinary
Income | | Undistributed
Long-Term
Capital Gain | | Unrealized
Appreciation
(Depreciation) | | Loss
Carryforwards
and Deferrals | | Other
Temporary
Differences | | Total | |
| $ | 1,678,527 | | | $ | 3,519,106 | | | $ | 38,683,634 | | | $ | (13,924,954 | ) | | $ | — | | | $ | 29,956,313 | | |
The differences between book basis and tax basis distributable earnings are primarily due to: losses disallowed and recognized on wash sales, partnership basis adjustments and capital loss carryforwards.
To the extent the Fund's net realized capital gains, if any, can be offset by capital loss carryforwards, it is the policy of the Fund not to distribute such gains. The Regulated Investment Company Modernization Act of 2010 (the "Act") became effective for the Fund on January 1, 2011. The Act modernizes several of the federal income and excise tax provisions related to RICs. Among the changes made are changes to the capital loss carryforward rules allowing for RICs to carry forward capital losses indefinitely and to retain the character of capital loss carryforwards as short-term or long-term ("Post-Enactment"). Rules in effect previously limited the carryforward period to eight years and all carryforwards were considered short-term in character ("Pre-Enactment"). As
determined at December 31, 2014, the Fund had unused capital loss carryforwards available for federal income tax purposes to offset net realized capital gains, if any, as follows:
| Pre-Enactment | |
Expiring in:
2017 | |
| $ | 13,924,954 | | |
Post-Enactment capital loss carryforwards must be fully used before Pre-Enactment capital loss carryforwards; therefore, under certain circumstances, Pre-Enactment capital loss carryforwards available as of the report date may expire unused. As of December 31, 2014, the Fund had no Post-Enactment capital loss carryforwards.
During the year ended December 31, 2014, the Fund utilized capital loss carryforwards of $10,106,781.
6 Distributions to shareholders: The Fund may earn income, net of expenses, daily on its investments. Distributions from net investment income and net realized capital gains, if any, generally are distributed once a year (usually in October). Income distributions and capital gain distributions to shareholders are recorded on the ex-date.
It is the policy of the Fund to pass through to its shareholders substantially all real estate investment trust ("REIT") distributions and other income it receives, less operating expenses. The distributions the Fund receives from REITs are generally composed of income, capital gains, and/or return of REIT capital, but the REITs do not report this information to the Fund until the following calendar year. At December 31, 2014, the Fund estimated these amounts within the financial statements because the information is not available from the REITs until after the Fund's fiscal year-end. For the year ended December 31, 2014, the character of distributions paid to shareholders disclosed within the Statements of Changes in Net Assets is based on estimates made at that time. All estimates are based upon REIT information sources available to the Fund together with actual IRS Forms 1099-DIV received to date. Based on past experience it is possible that a portion of the Fund's distributions during the current fiscal year will be considered tax return of capital, but the actual amount of the tax return of capital, if any, is not determinable until after the Fund's fiscal year-end. After calendar year-end, when the Fund learns the nature of the distributions paid by REITs during that year, distributions previously identified as income are often re-characterized as return of capital and/or capital gain. After all applicable REITs have informed the Fund of the actual breakdown of distributions paid to the Fund during its fiscal year, estimates previously recorded are adjusted on the books of the Fund to reflect actual results. As a result, the composition of the Fund's distributions as reported herein may differ from the final composition determined after calendar year-end and reported to Fund shareholders on IRS Form 1099-DIV.
7 Foreign taxes: Foreign taxes withheld, if any, represent amounts withheld by foreign tax authorities, net of refunds recoverable.
8 Expense allocation: Certain expenses are applicable to multiple funds within the complex of related investment companies. Expenses directly attributable to a Series are charged to that Series. Expenses of the Trust that are not directly attributable to a particular series of the Trust (e.g., the Fund) are allocated among the series of the Trust, on the basis of relative net assets, except where a more appropriate allocation of expenses to each of the series can otherwise be made fairly. Expenses borne by the complex of related investment companies, which includes open-end and closed-end investment companies for which Management serves as investment manager, that are not directly attributable to a particular investment company in the complex (e.g., the Trust) or series thereof are allocated among the investment companies or series thereof in the complex on the basis of relative net assets, except where a more appropriate allocation of expenses to each of the investment companies or series thereof in the complex can otherwise be made fairly. The Fund's expenses (other than those specific to each class) are allocated proportionally each day among the classes based upon the relative net assets of each class.
9 Investments in foreign securities: Investing in foreign securities may involve certain sovereign and other risks, in addition to the credit and market risks normally associated with domestic securities. These additional risks include the possibility of adverse political and economic developments (including political instability, nationalization, expropriation, or confiscatory taxation) and the potentially adverse effects of unavailability of public information
regarding issuers, less governmental supervision and regulation of financial markets, reduced liquidity of certain financial markets, and the lack of uniform accounting, auditing, and financial reporting standards or the application of standards that are different or less stringent than those applied in the United States. Foreign securities also may experience greater price volatility, higher rates of inflation, and delays in settlement.
10 Indemnifications: Like many other companies, the Trust's organizational documents provide that its officers ("Officers") and trustees ("Trustees") are indemnified against certain liabilities arising out of the performance of their duties to the Trust. In addition, both in some of its principal service contracts and in the normal course of its business, the Trust enters into contracts that provide indemnifications to other parties for certain types of losses or liabilities. The Trust's maximum exposure under these arrangements is unknown as this could involve future claims against the Trust.
11 Other: All net investment income and realized and unrealized capital gains and losses of the Fund are allocated, on the basis of relative net assets, pro rata among its respective classes.
Note B—Management Fees, Administration Fees, Distribution Arrangements, and Other Transactions with Affiliates:
The Fund retains Management as its investment manager under a Management Agreement. For such investment management services, the Fund pays Management a fee at the annual rate of 0.55% of the first $250 million of the Fund's average daily net assets, 0.525% of the next $250 million, 0.50% of the next $250 million, 0.475% of the next $250 million, 0.45% of the next $500 million, 0.425% of the next $2.5 billion, and 0.40% of average daily net assets in excess of $4 billion. Accordingly, for the year ended December 31, 2014, the management fee pursuant to the Management Agreement was equivalent to an annual effective rate of 0.55% of the Fund's average daily net assets.
The Fund retains Management as its administrator under an Administration Agreement. Each class pays Management an administration fee at the annual rate of 0.30% of its average daily net assets under this agreement. Additionally, Management retains State Street Bank and Trust Company ("State Street") as its sub-administrator under a Sub-Administration Agreement. Management pays State Street a fee for all services received under this agreement.
The Board adopted a non-fee distribution plan for the Fund's Class I.
For the Fund's Class S, Management acts as agent in arranging for the sale of class shares without commission and bears advertising and promotion expenses. The Board has adopted a distribution plan (the "Plan") with respect to this class, pursuant to Rule 12b-1under the 1940 Act. The Plan provides that, as compensation for administrative and other services provided to this class, Management's activities and expenses related to the sale and distribution of this class, and ongoing services provided to investors in this class, Management receives from this class a fee at the annual rate of 0.25% of Class S's average daily net assets. Management receives this amount to provide distribution and shareholder servicing for this class and pays a portion of it to institutions that provide such services. Those institutions may use the payments for, among other purposes, compensating employees engaged in sales and/or shareholder servicing. The amount of fees paid by this class during any year may be more or less than the cost of distribution and other services provided to this class. FINRA rules limit the amount of annual distribution fees that may be paid by a mutual fund and impose a ceiling on the cumulative distribution fees paid. The Trust's Plan complies with those rules.
Management has contractually undertaken to waive current payment of fees and/or reimburse the Fund's Class I and Class S shares for their operating expenses (including fees payable to Management but excluding interest, taxes, brokerage commissions, extraordinary expenses and transaction costs, if any; and, consequently, net expenses may exceed the contractual expense limitations) ("Operating Expenses") which exceed the expense limitation as detailed in the following table. Each respective class has agreed to repay Management for fees and expenses waived and/or its excess Operating Expenses previously reimbursed by Management, so long as its annual Operating Expenses during that period do not exceed its contractual expense limitation in place at the time the fees and
expenses were waived or reimbursed, and the repayment is made within three years after the year in which Management issued the reimbursement or waived fees. During the year ended December 31, 2014, there was no repayment to Management under its contractual expense limitation. At December 31, 2014, the Fund's contingent liabilities to Management under its contractual expense limitation were as follows:
| | | | | | | Expenses Reimbursed in
Fiscal Year Ending December 31, | |
| | | | | | | 2012 | | 2013 | | 2014 | |
| | | | | | | Subject to Repayment Until December 31, | |
| | | Contractual
Expense
Limitation(1) | | Expiration | | 2015 | | 2016 | | 2017 | |
Class I | | | 1.50 | % | | 12/31/17 | | $ | — | | | $ | — | | | $ | — | | |
Class S | | | 1.25 | % | | 12/31/20 | | | 36,201 | | | | 19,254 | | | | 12,553 | | |
(1) Expense limitation per annum of the respective class's average daily net assets.
Neuberger Berman LLC ("Neuberger") is retained by Management pursuant to a Sub-Advisory Agreement to furnish it with investment recommendations and research information without added cost to the Fund. Several individuals who are Officers and/or Trustees of the Trust are also employees of Neuberger and/or Management.
On June 3, 2014, Management made a voluntary contribution of $8,995 to the Fund in connection with a payment matter related to the Fund's investment in a State Street money market fund.
Note C—Securities Transactions:
During the year ended December 31, 2014, there were purchase and sale transactions (excluding short-term securities) of $44,262,131 and $49,981,449, respectively.
During the year ended December 31, 2014, no brokerage commissions on securities transactions were paid to affiliated brokers.
Note D—Fund Share Transactions:
Share activity for the years ended December 31, 2014 and December 31, 2013 was as follows:
For the Year Ended December 31, 2014
| | | Shares Sold | | Shares Issued on
Reinvestment of
Dividends and
Distributions | | Shares
Redeemed | | Total | |
Class I | | | 1,180,610 | | | | 218,047 | | | | (1,362,129 | ) | | | 36,528 | | |
Class S | | | 534,158 | | | | 114,413 | | | | (928,718 | ) | | | (280,147 | ) | |
For the Year Ended December 31, 2013
| | | Shares Sold | | Shares Issued on
Reinvestment of
Dividends and
Distributions | | Shares
Redeemed | | Total | |
Class I | | | 1,039,121 | | | | 58,531 | | | | (1,583,009 | ) | | | (485,357 | ) | |
Class S | | | 537,511 | | | | 31,191 | | | | (1,122,710 | ) | | | (554,008 | ) | |
Note E—Lines of Credit:
At December 31, 2014, the Fund was a participant in a single committed, unsecured $300,000,000 line of credit with State Street, to be used only for temporary or emergency purposes. Other investment companies managed by Management also participate in this line of credit on the same terms. Interest is charged on borrowings under this line of credit at the higher of (a) the Federal Funds Rate plus 1.25% per annum or (b) the Overnight LIBOR Rate plus 1.25% per annum. A commitment fee of 0.10% per annum on the unused portion of the available line of credit is charged, of which each participating fund has agreed to pay its pro rata share, based on the ratio of its individual net assets to the net assets of all participants at the time the fee is due and payable. The fee is paid quarterly in arrears. Because several mutual funds participate, there is no assurance that the Fund will have access to all or any part of the $300,000,000 at any particular time. There were no loans outstanding pursuant to this line of credit at December 31, 2014. During the year ended December 31, 2014, the Fund did not utilize this line of credit.
At December 31, 2014, the Fund was a participant in a single uncommitted, unsecured $100,000,000 line of credit with State Street, to be used only for temporary or emergency purposes. Other investment companies managed by Management also participate in this line of credit on the same terms. Interest is charged on borrowings under this line of credit at a variable rate per annum as determined and quoted by State Street at the time a fund requests a loan. Because several mutual funds participate, there is no assurance that the Fund will have access to all or any part of the $100,000,000 at any particular time. There were no loans outstanding pursuant to this line of credit at December 31, 2014. During the year ended December 31, 2014, the Fund did not utilize this line of credit.
In January 2015, a new syndicated committed, unsecured $700,000,000 line of credit, to be used only for temporary or emergency purposes, replaced the lines of credit with State Street noted above. Because several mutual funds participate in this line of credit, there is no assurance that the Fund will have access to all or any part of the $700,000,000 at any particular time.
Mid Cap Intrinsic Value Portfolio
The following tables include selected data for a share outstanding throughout each year and other performance information derived from the Financial Statements. Per share amounts that round to less than $0.01 or $(0.01) per share are presented as $0.00 or $(0.00), respectively. Ratios that round to less than 0.00% or (0.00)% per share are presented as 0.00% or (0.00)%, respectively. A "—" indicates that the line item was not applicable in the corresponding period.
Class I | |
| | | Year Ended December 31, | |
| | 2014 | | 2013 | | 2012 | | 2011 | | 2010 | |
Net Asset Value, Beginning of Year | | $ | 16.38 | | | $ | 12.09 | | | $ | 14.26 | | | $ | 15.36 | | | $ | 12.26 | | |
Income From Investment Operations: | |
| Net Investment Income (Loss)‡ | | | 0.20 | | | | 0.17 | | | | 0.18 | | | | 0.06 | | | | 0.07 | | |
Net Gains or Losses on Securities
(both realized and unrealized) | | | 1.98 | | | | 4.30 | | | | 1.94 | | | | (1.06 | ) | | | 3.13 | | |
Total From Investment Operations | | | 2.18 | | | | 4.47 | | | | 2.12 | | | | (1.00 | ) | | | 3.20 | | |
Less Distributions From: | |
Net Investment Income | | | (0.19 | ) | | | (0.18 | ) | | | (0.10 | ) | | | (0.10 | ) | | | (0.10 | ) | |
Net Capital Gains | | | (0.50 | ) | | | — | | | | (4.19 | ) | | | — | | | | — | | |
Total Distributions | | | (0.69 | ) | | | (0.18 | ) | | | (4.29 | ) | | | (0.10 | ) | | | (0.10 | ) | |
Voluntary Contribution from Management | | | 0.00 | | | | — | | | | — | | | | — | | | | — | | |
Net Asset Value, End of Year | | $ | 17.87 | | | $ | 16.38 | | | $ | 12.09 | | | $ | 14.26 | | | $ | 15.36 | | |
| Total Return†† | | | 13.84 | %@ | 37.05 | %@ | 15.53 | % | | | (6.50 | )% | | | 26.18 | % | |
Ratios/Supplemental Data | |
Net Assets, End of Year (in millions) | | $ | 92.4 | | | $ | 84.1 | | | $ | 68.0 | | | $ | 70.0 | | | $ | 134.6 | | |
| Ratio of Gross Expenses to Average Net Assets# | | | 1.02 | % | | | 1.03 | % | | | 1.07 | % | | | 1.07 | % | | | 1.06 | % | |
| Ratio of Net Expenses to Average Net Assets§ | | | 1.02 | % | | | 1.03 | % | | | 1.07 | % | | | 1.07 | % | | | 1.06 | % | |
Ratio of Net Investment Income (Loss) to Average
Net Assets | | | 1.20 | % | | | 1.16 | % | | | 1.27 | % | | | 0.42 | % | | | 0.54 | % | |
Portfolio Turnover Rate | | | 30 | % | | | 35 | % | | | 29 | % | | | 95 | % | | | 39 | % | |
See Notes to Financial Highlights
Financial Highlights (cont'd)
Class S | |
| | | Year Ended December 31, | |
| | | 2014 | | 2013 | | 2012 | | 2011 | | 2010 | |
Net Asset Value, Beginning of Year | | $ | 18.20 | | | $ | 13.43 | | | $ | 15.41 | | | $ | 16.59 | | | $ | 13.21 | | |
Income From Investment Operations: | |
| Net Investment Income (Loss)‡ | | | 0.18 | | | | 0.15 | | | | 0.17 | | | | 0.05 | | | | 0.04 | | |
Net Gains or Losses on Securities
(both realized and unrealized) | | | 2.21 | | | | 4.77 | | | | 2.10 | | | | (1.16 | ) | | | 3.39 | | |
Total From Investment Operations | | | 2.39 | | | | 4.92 | | | | 2.27 | | | | (1.11 | ) | | | 3.43 | | |
Less Distributions From: | |
Net Investment Income | | | (0.14 | ) | | | (0.15 | ) | | | (0.06 | ) | | | (0.07 | ) | | | (0.05 | ) | |
Net Capital Gains | | | (0.50 | ) | | | — | | | | (4.19 | ) | | | — | | | | — | | |
Total Distributions | | | (0.64 | ) | | | (0.15 | ) | | | (4.25 | ) | | | (0.07 | ) | | | (0.05 | ) | |
Voluntary Contribution from Management | | | 0.00 | | | | — | | | | — | | | | — | | | | — | | |
Net Asset Value, End of Year | | $ | 19.95 | | | $ | 18.20 | | | $ | 13.43 | | | $ | 15.41 | | | $ | 16.59 | | |
| Total Return†† | | | 13.56 | %@ | | | 36.71 | %@ | | | 15.37 | % | | | (6.70 | )% | | | 25.99 | % | |
Ratios/Supplemental Data | |
Net Assets, End of Year (in millions) | | $ | 62.9 | | | $ | 62.5 | | | $ | 53.5 | | | $ | 55.2 | | | $ | 62.5 | | |
Ratio of Gross Expenses to Average Net Assets | | | 1.27 | % | | | 1.28 | % | | | 1.32 | % | | | 1.32 | % | | | 1.30 | % | |
| Ratio of Net Expenses to Average Net Assets§ | | | 1.25 | % | | | 1.25 | % | | | 1.25 | % | | | 1.25 | % | | | 1.25 | % | |
Ratio of Net Investment Income (Loss) to Average
Net Assets | | | 0.97 | % | | | 0.95 | % | | | 1.09 | % | | | 0.32 | % | | | 0.30 | % | |
Portfolio Turnover Rate | | | 30 | % | | | 35 | % | | | 29 | % | | | 95 | % | | | 39 | % | |
See Notes to Financial Highlights
Notes to Financial Highlights Mid Cap Intrinsic Value
Portfolio
†† Total return based on per share NAV reflects the effects of changes in NAV on the performance of the Fund during each fiscal period. Returns assume income dividends and other distributions, if any, were reinvested. Results represent past performance and do not indicate future results. Current returns may be lower or higher than the performance data quoted. Investment returns and principal may fluctuate and shares when redeemed may be worth more or less than original cost. Total return would have been lower if Management had not reimbursed and/or waived certain expenses. The total return information shown does not reflect charges and other expenses that apply to the separate account or the related insurance policies or other qualified pension or retirement plan, and the inclusion of these charges and other expenses would reduce the total return for all fiscal periods shown. The voluntary contribution listed in Note B of the Notes to Financial Statements had no impact on the Fund's total return for the year ended December 31, 2014.
@ The class action proceeds listed in Note A-4 of the Notes to Financial Statements had no impact on the Fund's total return for the year ended December 31, 2014. Had the Fund not received class action proceeds in 2013, total return based on per share NAV for the year ended December 31, 2013 would have been 36.88% and 36.56% for Class I and Class S, respectively.
# Represents the annualized ratios of net expenses to average daily net assets if Management had not reimbursed certain expenses and/or waived a portion of the investment management fee.
‡ Calculated based on the average number of shares outstanding during each fiscal period.
§ Prior to January 1, 2013, the Fund had an expense offset arrangement in connection with its custodian contract. The impact of expense reductions related to expense offset arrangements, if any, was less than 0.01%.
Report of Independent Registered Public Accounting Firm
To the Board of Trustees of
Neuberger Berman Advisers Management Trust and
Shareholders of Mid Cap Intrinsic Value Portfolio
We have audited the accompanying statement of assets and liabilities of Mid Cap Intrinsic Value Portfolio, one of the series constituting Neuberger Berman Advisers Management Trust (the "Trust"), including the schedule of investments, as of December 31, 2014, and the related statement of operations for the year then ended, the statements of changes in net assets for each of the two years in the period then ended and the financial highlights for each of the five years in the period then ended. These financial statements and financial highlights are the responsibility of the Trust's management. Our responsibility is to express an opinion on these financial statements and financial highlights based on our audits.
We conducted our audits in accordance with the standards of the Public Company Accounting Oversight Board (United States). Those standards require that we plan and perform the audit to obtain reasonable assurance about whether the financial statements and financial highlights are free of material misstatement. We were not engaged to perform an audit of the Trust's internal control over financial reporting. Our audits included consideration of internal control over financial reporting as a basis for designing audit procedures that are appropriate in the circumstances, but not for the purpose of expressing an opinion on the effectiveness of the Trust's internal control over financial reporting. Accordingly, we express no such opinion. An audit also includes examining, on a test basis, evidence supporting the amounts and disclosures in the financial statements and financial highlights, assessing the accounting principles used and significant estimates made by management, and evaluating the overall financial statement presentation. Our procedures included confirmation of securities owned as of December 31, 2014 by correspondence with the custodian and others or by other appropriate auditing procedures where replies from others were not received. We believe that our audits provide a reasonable basis for our opinion.
In our opinion, the financial statements and financial highlights referred to above present fairly, in all material respects, the financial position of Mid Cap Intrinsic Value Portfolio, a series of Neuberger Berman Advisers Management Trust, at December 31, 2014, the results of its operations for the year then ended, the changes in its net assets for each of the two years in the period then ended, and the financial highlights for each of the five years in the period then ended in conformity with U.S. generally accepted accounting principles.
Boston, Massachusetts
February 10, 2015
Trustee and Officer Information
The following tables set forth information concerning the Trustees and Officers of the Fund. All persons named as Trustees and Officers also serve in similar capacities for other funds administered or managed by Management and Neuberger. The Fund's Statement of Additional Information includes additional information about the Trustees and is available upon request, without charge, by calling (800) 877-9700.
Information about the Board of Trustees
Name, (Year of Birth), and Address(1) | | Position(s) and
Length of
Time Served(2) | | Principal Occupation(s)(3) | | Number of
Funds in Fund
Complex
Overseen by
Fund Trustee | | Other Directorships Held
Outside Fund Complex by
Fund Trustee(3) | |
Independent Trustees | |
Faith Colish (1935) | | Trustee since 1982 | | Counsel, Carter Ledyard & Milburn LLP (law firm) since October 2002; formerly, Attorney-at-Law and President, Faith Colish, A Professional Corporation, 1980 to 2002. | | | 60 | | | Formerly, Director, 1997 to 2003, and Advisory Director, 2003 to 2006, ABA Retirement Funds (formerly, American Bar Retirement Association) (not-for-profit membership corporation). | |
Martha C. Goss (1949) | | Trustee since 2007 | | President, Woodhill Enterprises Inc./Chase Hollow Associates LLC (personal investment vehicle), since 2006; formerly, Consultant, Resources Global Professionals (temporary staffing), 2002 to 2006. | | | 60 | | | Director, American Water (water utility), since 2003; Director, Allianz Life of New York (insurance), since 2005; Director, Berger Group Holdings, Inc. (engineering consulting firm), since 2013; Director, Financial Women's Association of New York (not-for-profit association), since 2003; Trustee Emerita, Brown University, since 1998; Director, Museum of American Finance (not-for-profit), since 2013; formerly, Non-Executive Chair and Director, Channel Reinsurance (financial guaranty reinsurance), 2006 to 2010; formerly, Director, Ocwen Financial Corporation (mortgage servicing), 2005 to 2010; formerly, Director, Claire's Stores, Inc. (retailer), 2005 to 2007; formerly, Director, Parsons Brinckerhoff Inc. (engineering consulting firm), 2007 to 2010; formerly, Director, Bank Leumi (commercial bank), 2005 to 2007; formerly, Advisory Board Member, Attensity (software developer), 2005 to 2007. | |
Name, (Year of Birth), and Address(1) | | Position(s) and
Length of
Time Served(2) | | Principal Occupation(s)(3) | | Number of
Funds in Fund
Complex
Overseen by
Fund Trustee | | Other Directorships Held
Outside Fund Complex by
Fund Trustee(3) | |
Michael M. Knetter (1960) | | Trustee since 2007 | | President and Chief Executive Officer, University of Wisconsin Foundation, since October 2010; formerly, Dean, School of Business, University of Wisconsin - Madison; formerly, Professor of International Economics and Associate Dean, Amos Tuck School of Business - Dartmouth College, 1998 to 2002. | | | 60 | | | Board Member, American Family Insurance (a mutual company, not publicly traded), since March 2009; formerly, Trustee, Northwestern Mutual Series Fund, Inc., 2007 to 2011; formerly, Director, Wausau Paper, 2005 to 2011; formerly, Director, Great Wolf Resorts, 2004 to 2009. | |
Howard A. Mileaf (1937) | | Trustee since 1999 | | Retired; formerly, Vice President and General Counsel, WHX Corporation (holding company), 1993 to 2001. | | | 60 | | | Formerly, Director, Webfinancial Corporation (holding company), 2002 to 2008; formerly, Director, WHX Corporation (holding company), 2002 to 2005; formerly, Director, State Theatre of New Jersey (not-for-profit theatre), 2000 to 2005. | |
George W. Morriss (1947) | | Trustee since 2007 | | Adjunct Professor, Columbia University School of International and Public Affairs, since October 2012; formerly, Executive Vice President and Chief Financial Officer, People's Bank, Connecticut (a financial services company), 1991 to 2001. | | | 60 | | | Director and Treasurer, National Association of Corporate Directors, Connecticut Chapter, since 2011; Trustee, Steben Alternative Investment Funds, Steben Select Multi-Strategy Fund and Steben Select Multi-Strategy Master Fund, since 2013; formerly, Manager, Larch Lane Multi-Strategy Fund complex (which consisted of three funds), 2006 to 2011; formerly, Member, NASDAQ Issuers' Affairs Committee, 1995 to 2003. | |
Name, (Year of Birth), and Address(1) | | Position(s) and
Length of
Time Served(2) | | Principal Occupation(s)(3) | | Number of
Funds in Fund
Complex
Overseen by
Fund Trustee | | Other Directorships Held
Outside Fund Complex by
Fund Trustee(3) | |
Tom D. Seip (1950) | | Trustee since 2000; Chairman of the Board since 2008; Lead Independent Trustee from 2006 to 2008 | | General Partner, Ridgefield Farm LLC (a private investment vehicle); formerly, President and CEO, Westaff, Inc. (temporary staffing), May 2001 to January 2002; formerly, Senior Executive, The Charles Schwab Corporation, 1983 to 1998, including Chief Executive Officer, Charles Schwab Investment Management, Inc.; Trustee, Schwab Family of Funds and Schwab Investments, 1997 to 1998; and Executive Vice President-Retail Brokerage, Charles Schwab & Co., Inc., 1994 to 1997. | | | 60 | | | Director, H&R Block, Inc. (financial services company), since May 2001; Chairman, Governance and Nominating Committee, H&R Block, Inc., since 2011; formerly, Chairman, Compensation Committee, H&R Block, Inc., 2006 to 2010; formerly, Director, Forward Management, Inc. (asset management company), 1999 to 2006. | |
Candace L. Straight (1947) | | Trustee since 1999 | | Private investor and consultant specializing in the insurance industry; formerly, Advisory Director, Securitas Capital LLC (a global private equity investment firm dedicated to making investments in the insurance sector), 1998 to 2003. | | | 60 | | | Public Member, Board of Governors and Board of Trustees, Rutgers University, since 2011; Director, Montpelier Re Holdings Ltd. (reinsurance company), since 2006; formerly, Director, National Atlantic Holdings Corporation (property and casualty insurance company), 2004 to 2008; formerly, Director, The Proformance Insurance Company (property and casualty insurance company), 2004 to 2008; formerly, Director, Providence Washington Insurance Company (property and casualty insurance company), 1998 to 2006; formerly, Director, Summit Global Partners (insurance brokerage firm), 2000 to 2005. | |
Peter P. Trapp (1944) | | Trustee since 1984 | | Retired; formerly, Regional Manager for Mid-Southern Region, Ford Motor Credit Company, September 1997 to 2007; formerly, President, Ford Life Insurance Company, April 1995 to August 1997. | | | 60 | | | None. | |
Name, (Year of Birth), and Address(1) | | Position(s) and
Length of
Time Served(2) | | Principal Occupation(s)(3) | | Number of
Funds in Fund
Complex
Overseen by
Fund Trustee | | Other Directorships Held
Outside Fund Complex by
Fund Trustee(3) | |
Trustees who are "Interested Persons" | | | | | | | |
Joseph V. Amato* (1962) | | Trustee since 2009 | | President and Director, Neuberger Berman Group LLC, since 2009; President and Chief Executive Officer, Neuberger and Neuberger Berman Holdings LLC (including its predecessor, Neuberger Berman Inc.), since 2007; Chief Investment Officer (Equities) and Managing Director, Management, since 2009; Managing Director, Neuberger Berman Fixed Income, LLC ("NBFI"), since 2007; Board member of NBFI since 2006; formerly, Global Head of Asset Management of Lehman Brothers Holdings Inc.'s ("LBHI") Investment Management Division, 2006 to 2009; formerly, member of LBHI's Investment Management Division's Executive Management Committee, 2006 to 2009; formerly, Managing Director, Lehman Brothers Inc. ("LBI"), 2006 to 2008; formerly, Chief Recruiting and Development Officer, LBI, 2005 to 2006; formerly, Global Head of LBI's Equity Sales and a Member of its Equities Division Executive Committee, 2003 to 2005. | | | 60 | | | Member of Board of Advisors, McDonough School of Business, Georgetown University, since 2001; Member of New York City Board of Advisors, Teach for America, since 2005; Trustee, Montclair Kimberley Academy (private school), since 2007; Member of Board of Regents, Georgetown University, since 2013. | |
Name, (Year of Birth), and Address(1) | | Position(s) and
Length of
Time Served(2) | | Principal Occupation(s)(3) | | Number of
Funds in Fund
Complex
Overseen by
Fund Trustee | | Other Directorships Held
Outside Fund Complex by
Fund Trustee(3) | |
Robert Conti* (1956) | | Chief Executive Officer, President and Trustee since 2008; prior thereto, Executive Vice President in 2008 and Vice President from 2000 to 2008 | | Managing Director, Neuberger, since 2007; Managing Director, NBFI, since 2009; formerly, Senior Vice President, Neuberger, 2003 to 2006; formerly, Vice President, Neuberger, 1999 to 2003; President and Chief Executive Officer, Management, since 2008; formerly, Senior Vice President, Management, 2000 to 2008. | | | 60 | | | Director, Staten Island Mental Health Society, since 1994; formerly, Chairman of the Board, Staten Island Mental Health Society, 2008 to 2011. | |
(1) The business address of each listed person is 605 Third Avenue, New York, New York 10158.
(2) Pursuant to the Trust's Trust Instrument, each of these Trustees shall hold office for life or until his or her successor is elected or the Trust terminates; except that (a) any Trustee may resign by delivering a written resignation; (b) any Trustee may be removed with or without cause at any time by a written instrument signed by at least two-thirds of the other Trustees; (c) any Trustee who requests to be retired, or who has become unable to serve, may be retired by a written instrument signed by a majority of the other Trustees; and (d) any Trustee may be removed at any shareholder meeting by a vote of at least two-thirds of the outstanding shares.
(3) Except as otherwise indicated, each individual has held the positions shown for at least the last five years.
* Indicates a Trustee who is an "interested person" within the meaning of the 1940 Act. Mr. Amato and Mr. Conti are interested persons of the Trust by virtue of the fact that each is an officer of Management, Neuberger and/or their affiliates.
Information about the Officers of the Trust
Name, (Year of Birth),
and Address(1) | | Position(s) and
Length of Time
Served(2) | | Principal Occupation(s)(3) | |
Andrew B. Allard (1961) | | Chief Legal Officer since 2013 (only for purposes of sections 307 and 406 of the Sarbanes-Oxley Act of 2002) and Anti-Money Laundering Compliance Officer since 2002 | | General Counsel and Senior Vice President, Management, since 2013; Senior Vice President, Neuberger, since 2006 and Employee since 1999; Deputy General Counsel, Neuberger, since 2004; formerly, Vice President, Neuberger, 2000 to 2005; formerly, Employee, Management, 1994 to 1999; Chief Legal Officer since 2013 (only for purposes of sections 307 and 406 of the Sarbanes-Oxley Act of 2002), ten registered investment companies for which Management acts as investment manager and administrator (ten since 2013); Anti-Money Laundering Compliance Officer, ten registered investment companies for which Management acts as investment manager and administrator (six since 2002, one since 2003, one since 2005, one since 2006 and one since 2013). | |
Claudia A. Brandon (1956) | | Executive Vice President since 2008 and Secretary since 1985 | | Senior Vice President, Neuberger, since 2007 and Employee since 1999; Senior Vice President, Management, since 2008 and Assistant Secretary since 2004; formerly, Vice President, Neuberger, 2002 to 2006; formerly, Vice President-Mutual Fund Board Relations, Management, 2000 to 2008; formerly, Vice President, Management, 1986 to 1999 and Employee 1984 to 1999; Executive Vice President, ten registered investment companies for which Management acts as investment manager and administrator (nine since 2008 and one since 2013); Secretary, ten registered investment companies for which Management acts as investment manager and administrator (three since 1985, three since 2002, one since 2003, one since 2005, one since 2006 and one since 2013). | |
Agnes Diaz (1971) | | Vice President since 2013 | | Senior Vice President, Neuberger, since 2012; Employee, Management, since 1996; formerly, Vice President, Neuberger, 2007 to 2012; Vice President, ten registered investment companies for which Management acts as investment manager and administrator (ten since 2013). | |
Anthony DiBernardo (1979) | | Assistant Treasurer since 2011 | | Senior Vice President, Neuberger, since 2014; Employee, Management, since 2003; formerly, Vice President, Neuberger, 2009 to 2014; Assistant Treasurer, ten registered investment companies for which Management acts as investment manager and administrator (nine since 2011 and one since 2013). | |
Sheila R. James (1965) | | Assistant Secretary since 2002 | | Vice President, Neuberger, since 2008 and Employee since 1999; formerly, Assistant Vice President, Neuberger, 2007; formerly, Employee, Management, 1991 to 1999; Assistant Secretary, ten registered investment companies for which Management acts as investment manager and administrator (six since 2002, one since 2003, one since 2005, one since 2006 and one since 2013). | |
Brian Kerrane (1969) | | Vice President since 2008 | | Managing Director, Neuberger, since 2014; Vice President, Management, since 2008 and Employee since 1991; formerly, Senior Vice President, Neuberger, 2006 to 2014; Vice President, ten registered investment companies for which Management acts as investment manager and administrator (nine since 2008 and one since 2013). | |
Name, (Year of Birth),
and Address(1) | | Position(s) and
Length of Time
Served(2) | | Principal Occupation(s)(3) | |
Kevin Lyons (1955) | | Assistant Secretary since 2003 | | Assistant Vice President, Neuberger, since 2008 and Employee since 1999; formerly, Employee, Management, 1993 to 1999; Assistant Secretary, ten registered investment companies for which Management acts as investment manager and administrator (seven since 2003, one since 2005, one since 2006 and one since 2013). | |
Owen F. McEntee, Jr. (1961) | | Vice President since 2008 | | Vice President, Neuberger, since 2006; Employee, Management, since 1992; Vice President, ten registered investment companies for which Management acts as investment manager and administrator (nine since 2008 and one since 2013). | |
John M. McGovern (1970) | | Treasurer and Principal Financial and Accounting Officer since 2005 | | Senior Vice President, Neuberger, since 2007; Employee, Management, since 1993; Treasurer and Principal Financial and Accounting Officer, ten registered investment companies for which Management acts as investment manager and administrator (eight since 2005, one since 2006 and one since 2013); formerly, Vice President, Neuberger, 2004 to 2006; formerly, Assistant Treasurer, eight registered investment companies for which Management acts as investment manager and administrator, 2002 to 2005. | |
Frank Rosato (1971) | | Assistant Treasurer since 2005 | | Vice President, Neuberger, since 2006; Employee, Management, since 1995; Assistant Treasurer, ten registered investment companies for which Management acts as investment manager and administrator (eight since 2005, one since 2006 and one since 2013). | |
Neil S. Siegel (1967) | | Vice President since 2008 | | Managing Director, Management, since 2008; Managing Director, Neuberger, since 2006; Managing Director, NBFI, since 2011; formerly, Senior Vice President, Neuberger, 2004 to 2006; Vice President, ten registered investment companies for which Management acts as investment manager and administrator (nine since 2008 and one since 2013). | |
Chamaine Williams (1971) | | Chief Compliance Officer since 2005 | | Senior Vice President, Neuberger, since 2007; Chief Compliance Officer, Management, since 2006; Chief Compliance Officer, ten registered investment companies for which Management acts as investment manager and administrator (eight since 2005, one since 2006 and one since 2013); formerly, Senior Vice President, LBI, 2007 to 2008; formerly, Vice President, LBI, 2003 to 2006; formerly, Chief Compliance Officer, Lehman Brothers Asset Management Inc., 2003 to 2007; formerly, Chief Compliance Officer, Lehman Brothers Alternative Investment Management LLC, 2003 to 2007. | |
(1) The business address of each listed person is 605 Third Avenue, New York, New York 10158.
(2) Pursuant to the By-Laws of the Trust, each officer elected by the Trustees shall hold office until his or her successor shall have been elected and qualified or until his or her earlier death, inability to serve, or resignation. Officers serve at the pleasure of the Trustees and may be removed at any time with or without cause.
(3) Except as otherwise indicated, each individual has held the positions shown for at least the last five years.
Proxy Voting Policies and Procedures
A description of the policies and procedures that the Trust uses to determine how to vote proxies relating to portfolio securities is available, without charge, by calling 800-877-9700 (toll-free) and on the Securities and Exchange Commission's website at www.sec.gov. Information regarding how the Trust voted proxies relating to portfolio securities during the most recent 12-month period ended June 30 is also available upon request, without charge, by calling 800-877-9700 (toll-free), on the Securities and Exchange Commission's website at www.sec.gov, and on Management's website at www.nb.com.
Quarterly Portfolio Schedule
The Trust files a complete schedule of portfolio holdings for the Fund with the Securities and Exchange Commission for the first and third quarters of each fiscal year on Form N-Q. The Trust's Forms N-Q are available on the Securities and Exchange Commission's website at www.sec.gov and may be reviewed and copied at the Securities and Exchange Commission's Public Reference Room in Washington, DC. Information on the operation of the Public Reference Room may be obtained by calling 800-SEC-0330. The information on Form N-Q is available upon request, without charge, by calling 800-877-9700 (toll free).
Notice to Shareholders
100.00% of the dividends earned during the fiscal year ended December 31, 2014 qualify for the dividends received deduction for corporate shareholders.
The Fund designates $4,084,464 as a capital gain distribution.
Board Consideration of the Management and Sub-Advisory Agreements
On an annual basis, the Board of the Trust, including the Trustees who are not "interested persons" of Management (including its affiliates) or the Trust ("Independent Fund Trustees"), considers whether to continue the Management and Sub-Advisory Agreements ("Agreements") with respect to the Fund. Throughout the process, the Independent Fund Trustees are advised by counsel that is experienced in Investment Company Act of 1940 matters and that is independent of Management ("Independent Counsel"). At a meeting held on October 6-7, 2014, the Board, including the Independent Fund Trustees, approved the continuation of the Agreements for the Fund.
In evaluating the Agreements, the Board, including the Independent Fund Trustees, reviewed extensive materials provided by Management in response to questions submitted by the Board and Independent Counsel, and met with senior representatives of Management regarding its personnel, operations and financial condition as they relate to the Fund. The annual contract review extends over at least two regular meetings of the Board to ensure that Management and Neuberger have time to respond to any questions the Independent Fund Trustees may have on their initial review of the materials and that the Independent Fund Trustees have time to consider those responses.
In connection with its deliberations, the Board also considered the broad range of information relevant to the annual contract review that is provided to the Board (including its various standing committees) at meetings throughout the year, including investment performance reports and related portfolio information for the Fund, as well as periodic reports on, among other matters, pricing and valuation; brokerage and execution; and compliance, shareholder and other services provided by Management and its affiliates. To assist the Board in its deliberations regarding the annual contract review, the Board has established a Contract Review Committee comprised of Independent Fund Trustees, as well as other committees that focus throughout the year on specific areas relevant to the annual contract review, such as Fund performance or compliance matters.
The Independent Fund Trustees received from Independent Counsel a memorandum discussing the legal standards for their consideration of the proposed continuation of the Agreements. During the course of the year and during their
deliberations regarding the annual contract review, the Contract Review Committee and the Independent Fund Trustees met with Independent Counsel separately from representatives of Management.
In connection with its approval of the continuation of the Agreements, the Board evaluated the terms of the Agreements, the overall fairness of the Agreements to the Fund and whether the Agreements were in the best interests of the Fund and its shareholders. The Board considered all factors it deemed relevant with respect to the Fund, including the following factors: (1) the nature, extent, and quality of the services provided by Management and Neuberger; (2) the investment performance of the Fund compared to an appropriate market index and a peer group of investment companies; (3) the costs of the services provided as compared to a peer group of investment companies and the profit or loss realized by Management and its affiliates from their relationship with the Fund; (4) the extent to which economies of scale might be realized as the Fund grows; and (5) whether fee levels reflect any such potential economies of scale for the benefit of the Fund's shareholders.
The Board factored into its evaluation of the Fund's fees and performance a consideration of the limitations inherent in the methodology for constructing peer groups and determining which investment companies should be included in the peer groups. The Board considered two separate peer groups, one composed of proprietary funds that are operated by insurance companies, and the other composed of non-proprietary funds operated for insurance company investors by independent investment managers.
While each Trustee may have attributed different weights to the various factors, the Board's determination to approve the continuation of the Agreements was based on a comprehensive consideration of all information provided to the Board throughout the year and specifically in connection with the annual contract review. The Board members did not identify any particular information or factor that was all-important or controlling. The Board focused on the overall costs and benefits of the Agreements relating to the Fund and, through the Fund, its shareholders.
With respect to the nature, extent and quality of the services provided, the Board considered the investment philosophy and decision-making processes of Management and Neuberger, and the qualifications, experience and capabilities of and the resources available to the portfolio management personnel of Management and Neuberger who perform services for the Fund. The Board noted that Management also provides certain administrative services, including fund accounting and compliance oversight. The Board also considered Management's and Neuberger's policies and practices regarding brokerage and allocation of portfolio transactions and reviewed the quality of the execution services that Management had provided. The Board also reviewed whether Management or Neuberger used brokers to execute Fund transactions that provide research and other services to Management or Neuberger and the types of benefits potentially derived from such services by Management, Neuberger, the Fund and other clients of Management and Neuberger. The Board also considered that Management's responsibilities include daily management of investment, operational, enterprise, legal, regulatory and compliance risks as they relate to the Fund, and considered information regarding Management's processes for managing risk. In addition, the Board noted the positive compliance history of Management and Neuberger, as no significant compliance problems were reported to the Board with respect to either firm. The Board also considered the general structure of the portfolio manager compensation program and whether this structure provides appropriate incentives to act in the best interests of the Fund. As in past years, the Board also considered the manner in which Management addressed various non-routine matters that arose during the year, some of them a result of developments in the broader fund industry or the regulations governing it. In addition, the Board considered actions taken by Management and Neuberger in response to recent market conditions, including actions taken in response to regulatory concerns about changes in fixed-income market liquidity and potential volatility, and considered the overall performance of Management and Neuberger in this context.
With respect to investment performance, the Board considered information regarding the Fund's short-, intermediate- and long-term performance both on an absolute basis and relative to an appropriate market index (or benchmark) and the average performance of a composite peer group (as constructed by an independent organization) of investment companies pursuing broadly similar strategies. The Board also reviewed performance in relation to certain measures of the degree of investment risk undertaken by the portfolio manager. The Board considered that as compared to the proprietary peer group, the Fund's performance for its Class I shares was higher than the median for the 1 and 5-year periods, and lower than the median for the 3 and 10-year periods. As compared to the non-proprietary peer group, the
Fund's performance for its Class I shares was the same as the median for the 10-year period, higher than the median for the 1 and 5-year periods and lower than the median for the 3-year period. The Board considered that the Fund's performance for its Class I shares was lower than its benchmarks for the 3 and 10-year periods, higher than one of its benchmarks and lower than one of its benchmarks for the 5-year period, and higher than its benchmarks for the 1 year period. The Board discussed with Management the Fund's performance and steps that Management was pursuing to improve performance. The Board also considered Management's responsiveness with respect to the Fund's underperformance. In this regard, the Board noted that performance, especially short-term performance, is only one of the factors that it deems relevant to its consideration of the Agreements and that, after considering all relevant factors, it may be appropriate to approve the continuation of the Agreements notwithstanding the Fund's performance.
With respect to the overall fairness of the Agreements, the Board decided to consider the fee structure for the Fund under the Agreements as compared to the non-proprietary peer group because it concluded that the proprietary funds are constructed on a different business model that the adviser cannot replicate. The Board also considered any fall-out benefits likely to accrue to Management or Neuberger or their affiliates from their relationship with the Fund. The Board also considered the profitability of Management and its affiliates from their association with the Fund, and profitability broken out between the investment management and administrative portions of the services provided, and year-over-year changes in each of Management's reported expense categories.
The Board reviewed a comparison of the Fund's management fee and overall expense ratio to the non-proprietary peer group. The Board noted that the comparative management fee analysis includes, in the Fund's management fee, the separate administrative fee paid to Management, but it was not clear whether this was the case for all funds in the peer group. The Board considered the mean and median of the management fees and overall expense ratios of the peer group. In addition, the Board considered the contractual limit on expenses of the Fund. Noting that the Fund's contractual management fee and actual management fee net of fees waived by Management were higher than the peer group mean and median, the Board considered whether specific portfolio management, administration or oversight needs contributed to the management fee. The Board also noted that the Fund's size, which impacts its expenses and performance, has been affected by ongoing changes in the insurance market.
The Board also considered whether there were other funds that were advised or sub-advised by Management or its affiliates or separate accounts managed by Management or its affiliates with investment objectives, policies and strategies that were similar to those of the Fund. The Board compared the fees charged to the Fund to the fees charged to any such funds and/or separate accounts. The Board considered the appropriateness and reasonableness of any differences between the fees charged to the Fund and any such funds and/or separate accounts, including any breakpoints, and determined that any differences in fees and fee structures were consistent with the management and other services provided.
The Board also evaluated any apparent or anticipated economies of scale in relation to the services Management provides to the Fund. The Board considered whether the Fund's fee structure provides for a reduction of payments resulting from the use of breakpoints and whether those breakpoints are set at appropriate asset levels. In concluding that the benefits accruing to Management and its affiliates by virtue of their relationship with the Fund were reasonable in light of the costs of providing the investment advisory and other services and the benefits accruing to the Fund, the Board reviewed specific data as to Management's profit on the Fund for a recent period. The Board also carefully examined Management's cost allocation methodology. The Board recognized that Management should be entitled to earn a reasonable level of profits for the services it provides to the Fund and, based on its review, concluded that Management's reported level of profitability was reasonable.
Conclusions
In approving the Agreements, the Board concluded that the terms of each Agreement are fair and reasonable to the Fund and that approval of the Agreements is in the best interests of the Fund and its shareholders. In reaching this determination, the Board considered that Management and Neuberger could be expected to provide a high level of service to the Fund; that it retained confidence in Management's and Neuberger's capabilities to manage the Fund; that the Fund's fee structure appeared to the Board to be reasonable given the nature, extent and quality of services provided;
and that the benefits accruing to Management and its affiliates by virtue of their relationship with the Fund were reasonable in light of the costs of providing the investment advisory and other services and the benefits accruing to the Fund. The Board's conclusions may be based in part on its consideration of materials prepared in connection with the approval or continuance of the Agreements in prior years and on the Board's ongoing regular review of Fund performance and operations throughout the year, in addition to material prepared specifically for the most recent annual review of the Agreements.
32
Neuberger Berman
Advisers Management Trust
Short Duration Bond Portfolio
I Class Shares
Annual Report
December 31, 2014
Short Duration Bond Portfolio Commentary (Unaudited)
The Neuberger Berman Advisers Management Trust Short Duration Bond Portfolio (the "Fund") Class I generated a 0.61% total return for the 12 months ended December 31, 2014, underperforming its benchmark, the Barclays 1-3 Year U.S. Government/Credit Index, which returned 0.77% for the same period.
When the year began, the overwhelming consensus was that U.S. interest rates would move higher amid a backdrop of improving economic growth. After stumbling early in the year, the economy quickly regained its footing. However, intermediate- and longer-term yields declined in 2014. This was triggered by a number of factors, including benign inflation, moderating growth overseas, geopolitical issues and overall strong demand. In addition, the U.S. Federal Reserve (Fed) vowed to take a measured approach in terms of rates. The yield curve flattened during the reporting period, as the yield on the two-year Treasury rose almost 30 basis points (bps), whereas the 10-year Treasury yield fell almost 90 bps. Most spread sectors generated positive returns during the period. The best absolute performers were longer-term government/credit and longer-term corporate securities, both of which posted double-digit returns. In contrast, Treasury Inflation-Protected Securities and local emerging markets debt were relative underperformers.
During the reporting period, the Fund's underweight to agency securities detracted from results as these securities outperformed the benchmark. The Fund's underweight to non-corporate credit, which includes foreign sovereigns, was also a drag on performance during the 12-month period. On the upside, the Fund's allocations to commercial mortgage-backed securities (CMBS), non-agency mortgage-backed securities (MBS), consumer asset-backed securities (ABS) and corporate credit (mostly financials) contributed to performance.
The Fund maintained its overall positioning during the reporting period, with an overweight to the spread sectors and an underweight to Treasuries. However, several adjustments were made to the Fund, including reducing its Treasury exposure and increasing its allocations to CMBS and consumer ABS. We also actively participated in the investment grade corporate bond new issuance market and sold certain positions that we believed were fully valued and where we felt there were potential event risks. Overall, the Fund's allocation to investment grade corporate bonds slightly declined during the year.
Despite our anticipation of continued growth in the U.S., economic issues overseas and sharply falling oil prices may give the Fed additional flexibility in terms of the timing of its first interest rate hike. In our view, the first rate hike will occur in either the second half of 2015 or the first quarter of 2016. As such, we believe the federal funds rate could be 0% to 0.25% to 0.75% by the end of 2015. If particular sectors of the bond market appear relatively underpriced, we may increase the Fund's exposure in those sectors and decrease exposure in other sectors. As such, we plan to continue with our current strategy of overweighting the spread sectors, as we feel it is appropriate in our attempt to achieve results that are consistent with client objectives.
Sincerely,
THOMAS SONTAG, MICHAEL J. FOSTER AND RICHARD GRAU
PORTFOLIO CO-MANAGERS
Information about principal risks of investing in the Fund is set forth in the prospectus and statement of additional information.
The portfolio composition, industries and holdings of the Fund are subject to change.
The opinions expressed are those of the Fund's portfolio managers. The opinions are as of the date of this report, and are subject to change without notice.
1
Short Duration Bond Portfolio (Unaudited)
PORTFOLIO BY TYPE OF SECURITY
(as a % of Total Net Assets) | |
Asset-Backed Securities | | | 22.3 | % | |
Corporate Debt Securities | | | 36.2 | | |
Mortgage-Backed Securities | | | 36.5 | | |
U.S. Treasury Securities | | | 4.4 | | |
Short-Term Investments | | | 0.4 | | |
Cash, receivables and other assets,
less liabilities | | | 0.2 | | |
Total | | | 100.0 | % | |
PERFORMANCE HIGHLIGHTS
| | | | | Average Annual Total Return | |
| | | Inception | | Ended 12/31/2014 | |
| | | Date | | 1 Year | | 5 Years | | 10 Years | | Life of Fund | |
Short Duration Bond
Portfolio Class I | | |
09/10/1984 | | | | 0.61 | % | | | 2.26 | % | | | 1.97 | % | | | 5.18 | % | |
Barclays 1-3 Year
U.S. Government/
Credit Index1,2 | | | | | | | 0.77 | % | | | 1.41 | % | | | 2.85 | % | | | 5.80 | % | |
The performance data quoted represent past performance and do not indicate future results. Current performance may be lower or higher than the performance data quoted. For performance data current to the most recent month-end, please visit http://www.nb.com/amtportfolios/performance.
The results shown in the table reflect the reinvestment of income dividends and other distributions, if any. The results do not reflect the effect of taxes a shareholder would pay on Fund distributions or on the redemption of Fund shares. The results do not reflect fees and expenses of the variable annuity and variable life insurance policies or the qualified pension and retirement plans whose proceeds are invested in the Fund.
The investment return and principal value of an investment will fluctuate and shares, when redeemed, may be worth more or less than their original cost.
Returns would have been lower if Neuberger Berman Management LLC ("Management") had not reimbursed certain expenses and/or waived a portion of the investment management fees during certain of the periods shown. Repayment by a class (of expenses previously reimbursed and/or fees previously waived by Management) will decrease the class's returns. Please see Note B in the Notes to Financial Statements for specific information regarding expense reimbursement and/or fee waiver arrangements.
For the period ended December 31, 2014, the 30-day SEC yield was 0.51% for Class I shares.
As stated in the Fund's most recent prospectus, the total annual operating expense ratio for fiscal year 2013 was 0.80% for Class I shares (before expense reimbursements and/or fee waivers, if any). The expense ratios for fiscal year 2014 can be found in the Financial Highlights section of this report.
COMPARISON OF A $10,000 INVESTMENT

This graph shows the change in value of a hypothetical $10,000 investment in the Fund over the past 10 fiscal years, or since the Fund's inception, if it has not operated for 10 years. The result is compared with benchmarks, which include a broad-based market index and may include a more narrowly based index. Market indices have not been reduced to reflect any of the fees and costs of investing. The results shown in the graph reflect the reinvestment of income dividends and other distributions, if any. The results do not reflect the effect of taxes a shareholder would pay on Fund distributions or on the redemption of Fund shares. The results do not reflect fees and expenses of the variable annuity and variable life insurance policies or the qualified pension and retirement plans whose proceeds are invested in the Fund. Results represent past performance and do not indicate future results.
Please see Endnotes for additional information.
2
1 The date used to calculate Life of Fund performance for the index is September 10, 1984, the Fund's commencement of operations.
2 The Barclays 1-3 Year U.S. Government/Credit Index is the 1-3 year component of the Barclays U.S. Government/Credit Index. The Barclays U.S. Government/Credit Index is the non-securitized component of the Barclays U.S. Aggregate Bond Index and includes Treasuries and government-related (agency, sovereign, supranational, and local authority debt) and investment-grade corporate securities. Please note that the indices described in this report do not take into account any fees, expenses or tax consequences of investing in the individual securities that they track, and that investors cannot invest directly in any index. Data about the performance of an index are prepared or obtained by Neuberger Berman Management LLC ("Management") and reflect the reinvestment of income dividends and other distributions, if any. The Fund may invest in securities not included in a described index and generally does not invest in all securities included in a described index.
The investments for the Fund are managed by the same portfolio manager(s) who manage(s) one or more other registered funds that have names, investment objectives and investment styles that are similar to those of the Fund. You should be aware that the Fund is likely to differ from those other mutual fund(s) in size, cash flow pattern and tax matters. Accordingly, the holdings and performance of the Fund can be expected to vary from those of the other mutual fund(s).
Shares of the separate Neuberger Berman Advisers Management Trust Portfolios (the "Funds") are not available to the general public. Shares of the Fund may be purchased only by life insurance companies to be held in their separate accounts, which fund variable annuity and variable life insurance policies, and by qualified pension and retirement plans.
Statistics and projections in this report are derived from sources deemed to be reliable but cannot be regarded as a representation of future results of the Fund. This report is prepared for the general information of shareholders and is not an offer of shares of the Fund. Shares are sold only through the currently effective prospectuses, which must precede or accompany this report.
The "Neuberger Berman" name and logo are registered service marks of Neuberger Berman Group LLC. "Neuberger Berman Management LLC" and the individual Fund name in this piece are either service marks or registered service marks of Neuberger Berman Management LLC.
© 2015 Neuberger Berman Management LLC, distributor. All rights reserved.
3
Information About Your Fund's Expenses (Unaudited)
As a Fund shareholder, you incur two types of costs: (1) transaction costs such as fees and expenses that are, or may be, imposed under your variable contract or qualified pension plan; and (2) ongoing costs, including management fees, distribution and/or service (12b-1) fees (if applicable), and other Fund expenses. This example is intended to help you understand your ongoing costs (in U.S. dollars) of investing in the Fund and compare these costs with the ongoing costs of investing in other mutual funds.
This table is designed to provide information regarding costs related to your investments. The following examples are based on an investment of $1,000 made at the beginning of the six month period ended December 31, 2014 and held for the entire period. The table illustrates the Fund's costs in two ways:
Actual Expenses and Performance: | | The first section of the table provides information about actual account values and actual expenses in dollars, based on the Fund's actual performance during the period indicated. You may use the information in this line, together with the amount you invested, to estimate the expenses you paid over the period. Simply divide your account value by $1,000 (for example, an $8,600 account value divided by $1,000 = 8.6), then multiply the result by the number in the first section of the table under the heading entitled "Expenses Paid During the Period" to estimate the expenses you paid over the period. | |
Hypothetical Example for Comparison Purposes: | | The second section of the table provides information about hypothetical account values and hypothetical expenses based on the Fund's actual expense ratio and an assumed rate of return at 5% per year before expenses. This return is not the Fund's actual return. The hypothetical account values and expenses may not be used to estimate the actual ending account balance or expenses you paid for the period. You may use this information to compare the ongoing costs of investing in this Fund versus other funds. To do so, compare the expenses shown in this 5% hypothetical example with the 5% hypothetical examples that appear in the shareholder reports of other funds. | |
Please note that the expenses in the table are meant to highlight your ongoing costs only and do not include any transaction costs, such as fees and expenses that are, or may be imposed under your variable contract or qualified pension plan. Therefore, the information under the heading "Hypothetical (5% annual return before expenses)" is useful in comparing ongoing costs only, and will not help you determine the relative total costs of owning different funds. In addition, if these transaction costs were included, your costs would have been higher.
Expense Information as of 12/31/14
NEUBERGER BERMAN ADVISERS MANAGEMENT TRUST SHORT DURATION BOND PORTFOLIO
Actual | | Beginning Account
Value
7/1/14 | | Ending Account
Value
12/31/14 | | Expenses Paid During
the Period*
7/1/14 – 12/31/14 | |
Class I | | $ | 1,000.00 | | | $ | 1,000.50 | | | $ | 4.24 | | |
Hypothetical (5% annual return before expenses)** | |
Class I | | $ | 1,000.00 | | | $ | 1,020.97 | | | $ | 4.28 | | |
* Expenses are equal to the annualized expense ratio of 0.84%, multiplied by the average account value over the period, multiplied by 184/365 (to reflect the one-half year period shown).
** Hypothetical 5% annual return before expenses is calculated by multiplying the number of days in the most recent half year divided by 365.
4
Schedule of Investments Short Duration Bond Portfolio 12/31/14
PRINCIPAL AMOUNT | | | | VALUE† | |
U.S. Treasury Securities-Backed by the Full Faith and Credit of the U.S. Government (4.4%) | | | |
$ | 1,675,000 | | | U.S. Treasury Notes, 0.38%, due 10/31/16 | | $ | 1,667,672 | | |
| | 6,500,000 | | | U.S. Treasury Notes, 0.63%, due 12/31/16 | | | 6,493,396 | | |
| | | | | Total U.S. Treasury Securities-Backed by the Full Faith and Credit of the U.S. Government
(Cost $8,166,174) | | | 8,161,068 | | |
Mortgage-Backed Securities (36.5%) | | | |
Adjustable Mixed Balance (1.8%) | | | |
| 2,080,477 | | | Countrywide Home Loan Mortgage Pass-Through Trust, Ser. 2006-HYB5, Class 2A1,
2.36%, due 9/20/36 | | | 1,803,959 | µ | |
| | 322,524 | | | Harborview Mortgage Loan Trust, Ser. 2004-4, Class 3A, 1.28%, due 6/19/34 | | | 312,199 | µ | |
| | 1,262,040 | | | Merrill Lynch Mortgage Investors Trust, Ser. 2005-A1, Class 2A1, 2.52%, due 12/25/34 | | | 1,247,762 | µ | |
| | | | 3,363,920 | | |
Collateralized Mortgage Obligations (0.4%) | | | |
| | 656,453 | | | Fannie Mae Grantor Trust, Ser. 2003-T4, Class 1A, 0.39%, due 9/26/33 | | | 650,378 | µ | |
Commercial Mortgage-Backed (22.7%) | | | |
| | 1,401,981 | | | Banc of America Commercial Mortgage, Inc., Ser. 2005-2, Class A5, 4.86%, due 7/10/43 | | | 1,407,544 | | |
| | 1,843,502 | | | Citigroup Commercial Mortgage Trust, Ser. 2013-GC15, Class A1, 1.38%, due 9/10/46 | | | 1,843,884 | | |
| 46,863 | | | Citigroup/Deutsche Bank Commercial Mortgage Trust, Ser. 2006-CD2, Class AAB,
5.33%, due 1/15/46 | | | 46,886 | µ | |
| 5,120,719 | | | Commercial Mortgage Pass-Through Certificates, Ser. 2014-LC15, Class A1,
1.26%, due 4/10/47 | | | 5,086,544 | | |
| 1,164,025 | | | Commercial Mortgage Pass-Through Certificates, Ser. 2014-CR16, Class A1,
1.45%, due 4/10/47 | | | 1,159,340 | | |
| 1,947,517 | | | Commercial Mortgage Pass-Through Certificates, Ser. 2014-UBS3, Class A1,
1.40%, due 6/10/47 | | | 1,931,255 | | |
| 2,338,237 | | | Commercial Mortgage Pass-Through Certificates, Ser. 2014-UBS4, Class A1,
1.31%, due 8/10/47 | | | 2,328,627 | | |
| | 1,875,685 | | | Credit Suisse Commercial Mortgage Trust, Ser. 2006-C3, Class A3, 5.81%, due 6/15/38 | | | 1,959,888 | µ | |
| 1,375,000 | | | Greenwich Capital Commercial Funding Corp. Commercial Mortgage Trust,
Ser. 2007-GG9, Class A4, 5.44%, due 3/10/39 | | | 1,466,491 | | |
| | 2,300,000 | | | GS Mortgage Securities Trust, Ser. 2006-GG6, Class A4, 5.55%, due 4/10/38 | | | 2,360,143 | | |
| | 4,205,212 | | | GS Mortgage Securities Trust, Ser. 2014-GC18, Class A1, 1.30%, due 1/10/47 | | | 4,190,035 | | |
| 1,993,662 | | | JP Morgan Chase Commercial Mortgage Securities Corp., Ser. 2006-CB14, Class A4,
5.48%, due 12/12/44 | | | 2,038,314 | | |
| 3,760,033 | | | Morgan Stanley Bank of America Merrill Lynch Trust, Ser. 2013-C10, Class A1,
1.39%, due 7/15/46 | | | 3,776,969 | | |
| | 819,914 | | | Morgan Stanley Capital I Trust, Ser. 2011-C1, Class A1, 2.60%, due 9/15/47 | | | 824,559 | ñ | |
| | 3,279,102 | | | Wachovia Bank Commercial Mortgage Trust, Ser. 2005-C20, Class A7, 5.12%, due 7/15/42 | | | 3,306,318 | | |
| | 3,316,264 | | | Wachovia Bank Commercial Mortgage Trust, Ser. 2006-C23, Class A4, 5.42%, due 1/15/45 | | | 3,401,900 | | |
| | 686,692 | | | WF-RBS Commercial Mortgage Trust, Ser. 2011-C2, Class A1, 2.50%, due 2/15/44 | | | 690,531 | ñ | |
| | 3,975,660 | | | WF-RBS Commercial Mortgage Trust, Ser. 2014-C21, Class A1, 1.41%, due 8/15/47 | | | 3,970,022 | | |
| | | | 41,789,250 | | |
Mortgage-Backed Non-Agency (1.8%) | | | |
| | 648,834 | | | Countrywide Home Loans, Ser. 2005-R2, Class 2A4, 8.50%, due 6/25/35 | | | 686,355 | ñ | |
| | 2,134,298 | | | GSMPS Mortgage Loan Trust, Ser. 2005-RP2, Class 1A4, 8.50%, due 3/25/35 | | | 2,280,751 | ñ | |
| | 386,447 | | | GSMPS Mortgage Loan Trust, Ser. 2005-RP3, Class 1A4, 8.50%, due 9/25/35 | | | 411,123 | ñ | |
| | | | 3,378,229 | | |
See Notes to Schedule of Investments
5
PRINCIPAL AMOUNT | | | | VALUE† | |
Fannie Mae (5.3%) | | | |
$ | 2,239,230 | | | Pass-Through Certificates, 3.50%, due 10/1/25 | | $ | 2,367,267 | | |
| | 3,868,245 | | | Pass-Through Certificates, 3.00%, due 9/1/27 | | | 4,029,985 | | |
| | 3,150,192 | | | Pass-Through Certificates, 4.50%, due 5/1/41 | | | 3,423,717 | | |
| | | | 9,820,969 | | |
Freddie Mac (4.5%) | | | |
| | 7,004 | | | Pass-Through Certificates, 10.00%, due 4/1/20 | | | 7,035 | | |
| | 2,271,741 | | | Pass-Through Certificates, 3.50%, due 5/1/26 | | | 2,401,189 | | |
| | 3,072,241 | | | Pass-Through Certificates, 3.00%, due 1/1/27 | | | 3,195,865 | | |
| | 2,474,848 | | | Pass-Through Certificates, 4.50%, due 11/1/39 | | | 2,682,636 | | |
| | | | 8,286,725 | | |
| | | | | Total Mortgage-Backed Securities (Cost $68,278,471) | | | 67,289,471 | | |
Corporate Debt Securities (36.2%) | | | |
Aerospace & Defense (0.1%) | | | |
| | 220,000 | | | L-3 Communications Corp., Guaranteed Notes, 1.50%, due 5/28/17 | | | 217,917 | | |
Auto Manufacturers (2.7%) | | | |
| | 1,900,000 | | | American Honda Finance Corp., Senior Unsecured Notes, 1.00%, due 8/11/15 | | | 1,907,258 | ñ | |
| | 1,405,000 | | | Harley-Davidson Financial Services, Inc., Guaranteed Notes, 1.15%, due 9/15/15 | | | 1,408,987 | ñ | |
| | 1,005,000 | | | Hyundai Capital America, Senior Unsecured Notes, 1.45%, due 2/6/17 | | | 1,001,547 | ñ | |
| | 750,000 | | | Volkswagen Group of America Finance LLC, Guaranteed Notes, 1.25%, due 5/23/17 | | | 746,357 | ñ | |
| | | | 5,064,149 | | |
Banks (13.9%) | | | |
| | 980,000 | | | American Express Centurion Bank, Senior Unsecured Notes, 0.88%, due 11/13/15 | | | 981,491 | | |
| | 1,110,000 | | | Bank of America Corp., Senior Unsecured Medium-Term Notes, 3.63%, due 3/17/16 | | | 1,141,399 | | |
| | 3,325,000 | | | Citigroup, Inc., Senior Unsecured Notes, 1.35%, due 3/10/17 | | | 3,309,509 | | |
| | 2,175,000 | | | Deutsche Bank AG London, Senior Unsecured Notes, 1.35%, due 5/30/17 | | | 2,157,476 | | |
| | 1,280,000 | | | Goldman Sachs Group, Inc., Senior Unsecured Medium-Term Notes, 1.60%, due 11/23/15 | | | 1,286,881 | | |
| | 6,390,000 | | | JPMorgan Chase & Co., Senior Unsecured Medium-Term Notes, 1.35%, due 2/15/17 | | | 6,390,217 | | |
| | 785,000 | | | Mizuho Bank Ltd., Guaranteed Notes, 1.30%, due 4/16/17 | | | 777,829 | ñ | |
| | 480,000 | | | Morgan Stanley, Senior Unsecured Notes, 1.75%, due 2/25/16 | | | 482,689 | | |
| | 1,445,000 | | | Sumitomo Mitsui Banking Corp., Guaranteed Notes, 0.90%, due 1/18/16 | | | 1,443,951 | | |
| | 4,875,000 | | | Wells Fargo & Co., Senior Unsecured Notes, 1.50%, due 7/1/15 | | | 4,901,549 | | |
| | 2,780,000 | | | Westpac Banking Corp., Senior Unsecured Notes, 1.13%, due 9/25/15 | | | 2,794,923 | | |
| | | | 25,667,914 | | |
Beverages (0.5%) | | | |
| | 280,000 | | | Heineken NV, Senior Unsecured Notes, 0.80%, due 10/1/15 | | | 280,345 | ñ | |
| | 640,000 | | | Suntory Holdings Ltd., Senior Unsecured Notes, 1.65%, due 9/29/17 | | | 638,111 | ñ | |
| | | | 918,456 | | |
Commercial Services (0.2%) | | | |
| | 305,000 | | | ERAC USA Finance LLC, Guaranteed Notes, 1.40%, due 4/15/16 | | | 305,777 | ñ | |
Computers (0.7%) | | | |
| | 1,300,000 | | | Hewlett-Packard Co., Senior Unsecured Notes, 2.20%, due 12/1/15 | | | 1,313,018 | | |
See Notes to Schedule of Investments
6
PRINCIPAL AMOUNT | | | | VALUE† | |
Diversified Financial Services (3.3%) | | | |
$ | 1,510,000 | | | Ford Motor Credit Co. LLC, Senior Unsecured Notes, 4.25%, due 2/3/17 | | $ | 1,585,689 | | |
| | 2,145,000 | | | General Electric Capital Corp., Senior Unsecured Medium-Term Notes, 1.00%, due 1/8/16 | | | 2,153,149 | | |
| 1,890,000 | | | General Electric Capital Corp., Senior Unsecured Global Medium-Term Notes,
1.50%, due 7/12/16 | | | 1,909,994 | | |
| | 425,000 | | | Synchrony Financial, Senior Unsecured Notes, 1.88%, due 8/15/17 | | | 425,854 | | |
| | | | 6,074,686 | | |
Electric (0.5%) | | | |
| | 895,000 | | | Electricite de France SA, Senior Unsecured Notes, 1.15%, due 1/20/17 | | | 894,492 | ñ | |
Electronics (0.5%) | | | |
| | 1,000,000 | | | Thermo Fisher Scientific, Inc., Senior Unsecured Notes, 1.30%, due 2/1/17 | | | 994,456 | | |
Food (0.8%) | | | |
| | 660,000 | | | Kraft Foods Group, Inc., Senior Unsecured Notes, 1.63%, due 6/4/15 | | | 662,855 | | |
| | 765,000 | | | WM Wrigley Jr. Co., Senior Unsecured Notes, 1.40%, due 10/21/16 | | | 765,833 | ñ | |
| | | | 1,428,688 | | |
Healthcare—Products (0.8%) | | | |
| | 245,000 | | | Becton Dickinson & Co., Senior Unsecured Notes, 1.80%, due 12/15/17 | | | 245,922 | | |
| | 475,000 | | | CareFusion Corp., Senior Unsecured Notes, 1.45%, due 5/15/17 | | | 471,811 | | |
| | 780,000 | | | Medtronic, Inc., Senior Unsecured Notes, 1.50%, due 3/15/18 | | | 776,337 | ñ | |
| | | | 1,494,070 | | |
Healthcare—Services (0.3%) | | | |
| | 475,000 | | | Ventas Realty LP, Guaranteed Notes, 1.25%, due 4/17/17 | | | 470,743 | | |
Home Furnishings (0.3%) | | | |
| | 615,000 | | | Whirlpool Corp., Senior Unsecured Notes, 1.35%, due 3/1/17 | | | 613,347 | | |
Internet (0.7%) | | | |
| | 1,310,000 | | | Amazon.com, Inc., Senior Unsecured Notes, 0.65%, due 11/27/15 | | | 1,309,273 | | |
Machinery Diversified (0.5%) | | | |
| | 900,000 | | | John Deere Capital Corp., Senior Unsecured Notes, 0.88%, due 4/17/15 | | | 901,161 | | |
Media (2.8%) | | | |
| | 2,325,000 | | | NBCUniversal Enterprise, Inc., Guaranteed Notes, 0.77%, due 4/15/16 | | | 2,329,197 | ñµ | |
| | 350,000 | | | Thomson Reuters Corp., Senior Unsecured Notes, 1.30%, due 2/23/17 | | | 348,185 | | |
| | 415,000 | | | Thomson Reuters Corp., Senior Unsecured Notes, 1.65%, due 9/29/17 | | | 412,487 | | |
| | 1,940,000 | | | Time Warner, Inc., Guaranteed Notes, 5.88%, due 11/15/16 | | | 2,103,462 | | |
| | | | 5,193,331 | | |
Mining (0.2%) | | | |
| | 410,000 | | | Freeport-McMoRan, Inc., Guaranteed Notes, 2.30%, due 11/14/17 | | | 410,523 | | |
Oil & Gas (0.6%) | | | |
| | 500,000 | | | CNOOC Finance 2013 Ltd., Guaranteed Notes, 1.13%, due 5/9/16 | | | 498,333 | | |
| | 615,000 | | | Marathon Oil Corp., Senior Unsecured Notes, 0.90%, due 11/1/15 | | | 613,284 | | |
| | | | 1,111,617 | | |
See Notes to Schedule of Investments
7
PRINCIPAL AMOUNT | | | | VALUE† | |
Pharmaceuticals (3.6%) | | | |
$ | 1,430,000 | | | Bayer Corp., Guaranteed Notes, 7.13%, due 10/1/15 | | $ | 1,494,685 | ñ | |
| | 795,000 | | | Bayer US Finance LLC, Guaranteed Notes, 1.50%, due 10/6/17 | | | 795,568 | ñ | |
| | 1,555,000 | | | Express Scripts Holding Co., Guaranteed Notes, 2.10%, due 2/12/15 | | | 1,556,906 | | |
| | 540,000 | | | McKesson Corp., Senior Unsecured Notes, 1.29%, due 3/10/17 | | | 537,423 | | |
| | 2,250,000 | | | Novartis Capital Corp., Guaranteed Notes, 2.90%, due 4/24/15 | | | 2,267,455 | | |
| | | | 6,652,037 | | |
Pipelines (1.3%) | | | |
| | 815,000 | | | Enterprise Products Operating LLC, Guaranteed Notes, 1.25%, due 8/13/15 | | | 817,230 | | |
| | 610,000 | | | Kinder Morgan, Inc., Guaranteed Notes, 2.00%, due 12/1/17 | | | 606,272 | | |
| | 875,000 | | | TransCanada PipeLines Ltd., Senior Unsecured Notes, 0.88%, due 3/2/15 | | | 875,462 | | |
| | | | 2,298,964 | | |
Real Estate (0.4%) | | | |
| 640,000 | | | WEA Finance LLC/Westfield UK & Europe Finance PLC, Guaranteed Notes,
1.75%, due 9/15/17 | | | 636,600 | ñ | |
Retail (0.2%) | | | |
| | 305,000 | | | Walgreens Boots Alliance, Inc., Guaranteed Notes, 1.75%, due 11/17/17 | | | 305,778 | | |
Telecommunications (1.3%) | | | |
| | 1,120,000 | | | British Telecommunications PLC, Senior Unsecured Notes, 1.25%, due 2/14/17 | | | 1,114,486 | | |
| | 1,313,000 | | | Verizon Communications, Inc., Senior Unsecured Notes, 2.50%, due 9/15/16 | | | 1,342,468 | | |
| | | | 2,456,954 | | |
| | | | | Total Corporate Debt Securities (Cost $66,473,527) | | | 66,733,951 | | |
Asset-Backed Securities (22.3%) | | | |
| | 4,890,000 | | | Ally Auto Receivables Trust, Ser. 2014-2, Class A3, 1.25%, due 4/15/19 | | | 4,883,971 | | |
| | 6,825,000 | | | American Express Credit Account Master Trust, Ser. 2012-4, Class A, 0.40%, due 5/15/20 | | | 6,812,169 | µ | |
| | 2,125,000 | | | Bank of America Credit Card Trust, Ser. 2014-A2, Class A, 0.43%, due 9/16/19 | | | 2,121,107 | µ | |
| | 4,797,000 | | | Capital One Multi-Asset Execution Trust, Ser. 2007-A2, Class A2, 0.24%, due 12/16/19 | | | 4,769,288 | µ | |
| | 2,890,000 | | | Carmax Auto Owner Trust, Ser. 2014-1, Class A3, 0.79%, due 10/15/18 | | | 2,881,174 | | |
| | 4,200,000 | | | Chase Issuance Trust, Ser. 2012-A2, Class A2, 0.43%, due 5/15/19 | | | 4,202,574 | µ | |
| | 3,705,000 | | | Citibank Credit Card Issuance Trust, Ser. 2013-A1, Class A1, 0.27%, due 4/24/17 | | | 3,702,540 | µ | |
| | 5,725,000 | | | Ford Credit Auto Owner Trust, Ser. 2014-A, Class A3, 0.79%, due 5/15/18 | | | 5,720,374 | | |
| | 2,225,000 | | | Hyundai Auto Receivables Trust, Ser. 2014-A, Class A3, 0.79%, due 7/16/18 | | | 2,222,043 | | |
| | 377,826 | | | Nelnet Student Loan Trust, Ser. 2006-1, Class A4, 0.32%, due 11/23/22 | | | 377,294 | µ | |
| | 11,968 | | | SLM Student Loan Trust, Ser. 2004-5, Class A4, 0.38%, due 1/25/21 | | | 11,967 | µ | |
| | 2,193,631 | | | SLM Student Loan Trust, Ser. 2006-5, Class A4, 0.31%, due 4/25/23 | | | 2,190,725 | µ | |
| | 1,362,168 | | | SLM Student Loan Trust, Ser. 2013-2, Class A, 0.62%, due 9/25/26 | | | 1,356,566 | µ | |
| | | | | Total Asset-Backed Securities (Cost $41,312,426) | | | 41,251,792 | | |
NUMBER OF SHARES | | | | | |
Short-Term Investments (0.4%) | | | |
| | 797,821 | | | State Street Institutional Liquid Reserves Fund Premier Class (Cost $797,821) | | | 797,821 | | |
| | | | | Total Investments (99.8%) (Cost $185,028,419) | | | 184,234,103 | ## | |
| | | | | Cash, receivables and other assets, less liabilities (0.2%) | | | 347,609 | | |
| | | | | Total Net Assets (100.0%) | | $ | 184,581,712 | | |
See Notes to Schedule of Investments
8
Notes to Schedule of Investments Short Duration Bond
Portfolio
† In accordance with Accounting Standards Codification ("ASC") 820 "Fair Value Measurement" ("ASC 820"), all investments held by Neuberger Berman Advisers Management Trust Short Duration Bond Portfolio (the "Fund") are carried at the value that Neuberger Berman Management LLC ("Management") believes the Fund would receive upon selling an investment in an orderly transaction to an independent buyer in the principal or most advantageous market for the investment under current market conditions. Various inputs, including the volume and level of activity for the asset or liability in the market, are considered in valuing the Fund's investments, some of which are discussed below. Significant management judgment may be necessary to value investments in accordance with ASC 820.
ASC 820 established a three-tier hierarchy of inputs to create a classification of value measurements for disclosure purposes. The three-tier hierarchy of inputs is summarized in the three broad Levels listed below.
• Level 1 – quoted prices in active markets for identical investments
• Level 2 – other observable inputs (including quoted prices for similar investments, interest rates, prepayment speeds, credit risk, amortized cost, etc.)
• Level 3 – unobservable inputs (including the Fund's own assumptions in determining the fair value of investments)
The inputs or methodology used for valuing an investment are not necessarily an indication of the risk associated with investing in those securities.
The value of the Fund's investments in debt securities is determined by Management primarily by obtaining valuations from independent pricing services based on readily available bid quotations, or if quotations are not available, by methods which include various considerations based on security type (generally Level 2 inputs). In addition to the consideration of yields or prices of securities of comparable quality, coupon, maturity and type; indications as to values from dealers; and general market conditions, the following is a description of other Level 2 inputs and related valuation techniques used by independent pricing services to value certain types of debt securities of the Fund:
Corporate Debt Securities. Inputs used to value corporate debt securities generally include relative credit information, observed market movements, sector news, spread to the U.S. Treasury market, and other market information, which may include benchmark yields, reported trades, broker-dealer quotes, issuer spreads, benchmark securities, bids, offers, and reference data, such as market research publications, when available ("Other Market Information").
U.S. Treasury Securities. Inputs used to value U.S. Treasury securities generally include quotes from several inter-dealer brokers and Other Market Information.
Asset-Backed Securities and Mortgage-Backed Securities. Inputs used to value asset-backed securities and mortgage-backed securities generally include models that consider a number of factors, which may include the following: prepayment speeds, cash flows, spread adjustments and Other Market Information.
Management has developed a process to periodically review information provided by independent pricing services for all types of securities.
Investments in investment companies are valued using the respective fund's daily calculated net asset value per share (Level 2 inputs).
If a valuation is not available from an independent pricing service, or if Management has reason to believe that the valuation received does not represent the amount the Fund might reasonably expect to receive on a current sale in an orderly transaction, Management seeks to obtain quotations from brokers or dealers (generally considered
See Notes to Financial Statements
9
Notes to Schedule of Investments Short Duration Bond
Portfolio (cont'd)
Level 2 or Level 3 inputs depending on the number of quotes available). If such quotations are not readily available, the security is valued using methods the Neuberger Berman Advisers Management Trust's Board of Trustees (the "Board") has approved in the good-faith belief that the resulting valuation will reflect the fair value of the security. Numerous factors may be considered when determining the fair value of a security based on Level 2 or Level 3 inputs, including available analyst, media or other reports, trading in financial futures contracts or American Depositary Receipts ("ADRs") and whether the issuer of the security being fair valued has other securities outstanding.
Fair value prices are necessarily estimates, and there is no assurance that such a price will be at or close to the price at which the security is next quoted or next trades.
The following is a summary, categorized by Level, of inputs used to value the Fund's investments as of December 31, 2014:
Asset Valuation Inputs | | Level 1 | | Level 2 | | Level 3 | | Total | |
Investments: | |
U.S. Treasury Securities-Backed by the Full Faith
and Credit of the U.S. Government | | $ | — | | | $ | 8,161,068 | | | $ | — | | | $ | 8,161,068 | | |
Mortgage-Backed Securities^ | | | — | | | | 67,289,471 | | | | — | | | | 67,289,471 | | |
Corporate Debt Securities^ | | | — | | | | 66,733,951 | | | | — | | | | 66,733,951 | | |
Asset-Backed Securities | | | — | | | | 41,251,792 | | | | — | | | | 41,251,792 | | |
Short-Term Investments | | | — | | | | 797,821 | | | | — | | | | 797,821 | | |
Total Investments | | $ | — | | | $ | 184,234,103 | | | $ | — | | | $ | 184,234,103 | | |
^ The Schedule of Investments provides information on the industry categorization for the portfolio.
As of the year ended December 31, 2014, the Fund had no transfers between Levels 1, 2 or 3 based on the beginning of period market values as of December 31, 2013.
## At December 31, 2014, the cost of investments for U.S. federal income tax purposes was $185,666,928. Gross unrealized appreciation of investments was $436,006 and gross unrealized depreciation of investments was $1,868,831, resulting in net unrealized depreciation of $1,432,825, based on cost for U.S. federal income tax purposes.
µ Floating rate securities are securities whose yields vary with a designated index or market rate. These securities are shown at their current rates as of December 31, 2014, and their final maturities.
ñ Securities were purchased under Rule 144A of the Securities Act of 1933, as amended (the "1933 Act"), or are private placements and, unless registered under the 1933 Act or exempted from registration, may only be sold to qualified institutional investors. These securities have been deemed by the investment manager to be liquid. At December 31, 2014, these securities amounted to $19,652,242 or 10.6% of net assets for the Fund.
See Notes to Financial Statements
10
Statement of Assets and Liabilities
Neuberger Berman Advisers Management Trust
| | | SHORT DURATION
BOND PORTFOLIO | |
| | | December 31, 2014 | |
Assets | |
Investments in securities, at value* (Note A)—see Schedule of Investments: | |
Unaffiliated issuers | | $ | 184,234,103 | | |
Interest receivable | | | 520,668 | | |
Receivable for Fund shares sold | | | 79,585 | | |
Prepaid expenses and other assets | | | 4,117 | | |
Total Assets | | | 184,838,473 | | |
Liabilities | |
Payable for Fund shares redeemed | | | 73,915 | | |
Payable to investment manager (Note B) | | | 39,506 | | |
Payable to administrator (Note B) | | | 63,210 | | |
Accrued expenses and other payables | | | 80,130 | | |
Total Liabilities | | | 256,761 | | |
Net Assets | | $ | 184,581,712 | | |
Net Assets consist of: | |
Paid-in capital | | $ | 260,568,041 | | |
Undistributed net investment income (loss) | | | 2,478,229 | | |
Accumulated net realized gains (losses) on investments | | | (77,670,242 | ) | |
Net unrealized appreciation (depreciation) in value of investments | | | (794,316 | ) | |
Net Assets | | $ | 184,581,712 | | |
Shares Outstanding ($.001 par value; unlimited shares authorized) | | | 17,314,724 | | |
Net Asset Value, offering and redemption price per share | | $ | 10.66 | | |
*Cost of Investments | | $ | 185,028,419 | | |
See Notes to Financial Statements
11
Neuberger Berman Advisers Management Trust
| | | SHORT DURATION
BOND PORTFOLIO | |
| | | For the
Year Ended
December 31, 2014 | |
Investment Income: | |
Income (Note A): | |
Interest income—unaffiliated issuers | | $ | 3,162,654 | | |
Expenses: | |
Investment management fees (Note B) | | | 523,857 | | |
Administration fees (Note B) | | | 838,171 | | |
Audit fees | | | 55,685 | | |
Custodian and accounting fees | | | 93,187 | | |
Insurance expense | | | 7,372 | | |
Legal fees | | | 111,853 | | |
Shareholder reports | | | 39,224 | | |
Trustees' fees and expenses | | | 35,905 | | |
Miscellaneous | | | 13,913 | | |
Total net expenses | | | 1,719,167 | | |
Net investment income (loss) | | $ | 1,443,487 | | |
Realized and Unrealized Gain (Loss) on Investments: | |
Net realized gain (loss) on: | |
Sales of investment securities of unaffiliated issuers (Note A) | | | 183,287 | | |
Financial futures contracts (Note A) | | | (46,356 | ) | |
Net increase from payments by affiliates (Note B) | | | 13,600 | | |
Change in net unrealized appreciation (depreciation) in value of (Note A): | |
Unaffiliated investment securities | | | (209,538 | ) | |
Net gain (loss) on investments | | | (59,007 | ) | |
Net increase (decrease) in net assets resulting from operations | | $ | 1,384,480 | | |
See Notes to Financial Statements
12
Statements of Changes in Net Assets
Neuberger Berman Advisers Management Trust
| | | SHORT DURATION
BOND PORTFOLIO | |
| | | Year Ended
December 31,
2014 | | Year Ended
December 31,
2013 | |
Increase (Decrease) in Net Assets: | |
From Operations: | |
Net investment income (loss) (Note A) | | $ | 1,443,487 | | | $ | 1,422,834 | | |
Net realized gain (loss) on investments (Note A) | | | 136,931 | | | | (2,246,353 | ) | |
Net increase from payments by affiliates (Note B) | | | 13,600 | | | | — | | |
Change in net unrealized appreciation (depreciation) of investments (Note A) | | | (209,538 | ) | | | 2,160,752 | | |
Net increase (decrease) in net assets resulting from operations | | | 1,384,480 | | | | 1,337,233 | | |
Distributions to Shareholders From (Note A): | |
Net investment income | | | (3,296,646 | ) | | | (4,926,694 | ) | |
From Fund Share Transactions (Note D): | |
Proceeds from shares sold | | | 16,591,588 | | | | 48,819,235 | | |
Proceeds from reinvestment of dividends and distributions | | | 3,296,646 | | | | 4,926,694 | | |
Payments for shares redeemed | | | (61,061,991 | ) | | | (49,081,536 | ) | |
Net increase (decrease) from Fund share transactions | | | (41,173,757 | ) | | | 4,664,393 | | |
Net Increase (Decrease) in Net Assets | | | (43,085,923 | ) | | | 1,074,932 | | |
Net Assets: | |
Beginning of year | | | 227,667,635 | | | | 226,592,703 | | |
End of year | | $ | 184,581,712 | | | $ | 227,667,635 | | |
Undistributed net investment income (loss) at end of year | | $ | 2,478,229 | | | $ | 3,296,078 | | |
See Notes to Financial Statements
13
Notes to Financial Statements Short Duration Bond Portfolio
Note A—Summary of Significant Accounting Policies:
1 General: Neuberger Berman Advisers Management Trust (the "Trust") is a Delaware statutory trust organized pursuant to an Amended and Restated Trust Instrument dated March 27, 2014. The Trust is currently comprised of eleven separate operating series (each individually a "Series," and collectively the "Funds") each of which is diversified. The Trust is registered as an open-end management investment company under the Investment Company Act of 1940, as amended (the "1940 Act"), and its shares are registered under the 1933 Act. The Fund currently offers only Class I shares. The Board may establish additional series or classes of shares without the approval of shareholders.
The assets of each Series belong only to that Series, and the liabilities of each Series are borne solely by that Series and no other.
The Fund is an investment company and accordingly follows the investment company accounting and reporting guidance of the Financial Accounting Standards Board (FASB) Accounting Standard Codification Topic 946 "Financial Services—Investment Companies."
The preparation of financial statements in accordance with U.S. generally accepted accounting principles ("GAAP") requires Management to make estimates and assumptions at the date of the financial statements. Actual results could differ from those estimates.
Shares of the Fund are not available to the general public and may be purchased only by life insurance companies to be held in their separate accounts, which fund variable annuity and variable life insurance policies, and by qualified pension and retirement plans.
2 Portfolio valuation: Investment securities are valued as indicated in the notes following the Schedule of Investments.
3 Foreign currency translation: The accounting records of the Fund are maintained in U.S. dollars. Foreign currency amounts are translated into U.S. dollars using the exchange rate as of the end of regular trading on the NYSE on business days, usually 4:00 p.m. Eastern time, to determine the value of investments, other assets and liabilities. Purchase and sale prices of securities, and income and expenses, are translated into U.S. dollars at the prevailing rate of exchange on the respective dates of such transactions. Net unrealized foreign currency gain (loss), if any, arises from changes in the value of assets and liabilities, other than investments in securities, as a result of changes in exchange rates and is stated separately in the Statement of Operations.
4 Securities transactions and investment income: Securities transactions are recorded on trade date for financial reporting purposes. Interest income, including accretion of discount (adjusted for original issue discount, where applicable) is recorded on the accrual basis. Realized gains and losses from securities transactions and foreign currency transactions, if any, are recorded on the basis of identified cost and stated separately in the Statement of Operations. Included in net realized gain (loss) on investments are proceeds from the settlements of class action litigation in which the Fund participated as a class member. The amount of such proceeds for the year ended December 31, 2014 was $596.
5 Income tax information: Each Series is treated as a separate entity for U.S. federal income tax purposes. It is the policy of the Fund to continue to qualify for treatment as a regulated investment company ("RIC") by complying with the requirements of the U.S. Internal Revenue Code applicable to RICs and to distribute substantially all of its net investment income and net realized capital gains to its shareholders. To the extent the Fund distributes substantially all of its net investment income and net realized capital gains to shareholders, no federal income or excise tax provision is required.
14
The Fund has adopted the provisions of ASC 740 "Income Taxes" ("ASC 740"). ASC 740 sets forth a minimum threshold for financial statement recognition of a tax position taken, or expected to be taken, in a tax return. The Fund recognizes interest and penalties, if any, related to unrecognized tax positions as an income tax expense in the Statement of Operations. The Fund is subject to examination by U.S. federal and state tax authorities for returns filed for the tax years for which the applicable statutes of limitations have not yet expired. As of December 31, 2014, the Fund did not have any unrecognized tax positions.
Income distributions and capital gain distributions are determined in accordance with income tax regulations, which may differ from GAAP. These differences are primarily due to differing treatments of income and gains on various investment securities held by the Fund, timing differences and differing characterization of distributions made by the Fund. The Fund may also utilize earnings and profits distributed to shareholders on redemption of shares as a part of the dividends-paid deduction for income tax purposes.
As determined on December 31, 2014, permanent differences resulting primarily from different book and tax accounting were reclassified at year end. Such differences are attributed to the tax treatment of: paydown gains and losses, amortization of bond premium and expiration of capital loss carryforwards. These reclassifications had no effect on net income, net asset value ("NAV") or NAV per share of the Fund. For the year ended December 31, 2014, the Fund recorded the following permanent reclassifications:
| Paid-in Capital | | Undistributed
Net Investment
Income (Loss) | | Accumulated
Net Realized
Gains (Losses)
on Investments | |
| $ | (3,820,726 | ) | | $ | 1,035,310 | | | $ | 2,785,416 | | |
The tax character of distributions paid during the years ended December 31, 2014 and December 31, 2013 was as follows:
Distributions Paid From: | |
Ordinary Income | | Total | |
| 2014 | | 2013 | | 2014 | | 2013 | |
| $ | 3,296,646 | | | $ | 4,926,694 | | | $ | 3,296,646 | | | $ | 4,926,694 | | |
As of December 31, 2014, the components of distributable earnings (accumulated losses) on a U.S. federal income tax basis were as follows:
Undistributed
Ordinary
Income | | Unrealized
Appreciation
(Depreciation) | | Loss
Carryforwards
and Deferrals | | Other
Temporary
Differences | | Total | |
| $ | 2,478,229 | | | $ | (1,432,825 | ) | | $ | (77,031,513 | ) | | $ | (220 | ) | | $ | (75,986,329 | ) | |
The differences between book basis and tax basis distributable earnings are primarily due to: amortization of bond premium, losses disallowed and recognized on wash sales and straddles and capital loss carryforwards.
To the extent the Fund's net realized capital gains, if any, can be offset by capital loss carryforwards, it is the policy of the Fund not to distribute such gains. The Regulated Investment Company Modernization Act of 2010 (the "Act") became effective for the Fund on January 1, 2011. The Act modernizes several of the federal income and excise tax provisions related to RICs. Among the changes made are changes to the capital loss carryforward rules allowing for RICs to carry forward capital losses indefinitely and to retain the character of capital loss carryforwards as short-term or long-term ("Post-Enactment"). Rules in effect previously limited the carryforward period to eight years and all carryforwards were considered short-term in character ("Pre-Enactment"). As
15
determined at December 31, 2014, the Fund had unused capital loss carryforwards available for federal income tax purposes to offset net realized capital gains, if any, as follows:
Pre-Enactment | |
Expiring in: | |
| 2015 | | 2017 | | 2018 | |
$ | 514,506 | | | $ | 45,541,698 | | | $ | 7,896,656 | | |
Post-Enactment (No Expiration Date) | |
| Long-Term | | Short-Term | |
| $ | 21,489,314 | | | $ | 1,589,339 | | |
Post-Enactment capital loss carryforwards must be fully used before Pre-Enactment capital loss carryforwards; therefore, under certain circumstances, Pre-Enactment capital loss carryforwards available as of the report date may expire unused.
During the year ended December 31, 2014, the Fund had capital loss carryforwards expire of $3,820,726.
6 Distributions to shareholders: The Fund may earn income, net of expenses, daily on its investments. Distributions from net investment income and net realized capital gains, if any, generally are distributed once a year (usually in October). Income distributions and capital gain distributions to shareholders are recorded on the ex-date.
7 Foreign taxes: Foreign taxes withheld, if any, represent amounts withheld by foreign tax authorities, net of refunds recoverable.
8 Expense allocation: Certain expenses are applicable to multiple funds within the complex of related investment companies. Expenses directly attributable to a Series are charged to that Series. Expenses of the Trust that are not directly attributable to a particular series of the Trust (e.g., the Fund) are allocated among the series of the Trust, on the basis of relative net assets, except where a more appropriate allocation of expenses to each of the series can otherwise be made fairly. Expenses borne by the complex of related investment companies, which includes open-end and closed-end investment companies for which Management serves as investment manager, that are not directly attributable to a particular investment company in the complex (e.g., the Trust) or series thereof are allocated among the investment companies or series thereof in the complex on the basis of relative net assets, except where a more appropriate allocation of expenses to each of the investment companies or series thereof in the complex can otherwise be made fairly.
9 Dollar rolls: The Fund may enter into dollar roll transactions with respect to mortgage-backed securities. In a dollar roll transaction, the Fund sells securities for delivery in the current month and simultaneously agrees to repurchase substantially similar (i.e., same type and coupon) securities on a specified future date from the same party. During the period before the repurchase, the Fund foregoes principal and interest payments on the securities. The Fund is compensated by the difference between the current sales price and the forward price for the future purchase (often referred to as the "drop"), as well as by the interest earned on the cash proceeds of the initial sale. Dollar rolls may increase fluctuations in the Fund's NAV and may be viewed as a form of leverage. There is a risk that the counterparty will be unable or unwilling to complete the transaction as scheduled, which may result in losses to the Fund.
10 Investments in foreign securities: Investing in foreign securities may involve certain sovereign and other risks, in addition to the credit and market risks normally associated with domestic securities. These additional risks include the possibility of adverse political and economic developments (including political instability, nationalization, expropriation, or confiscatory taxation) and the potentially adverse effects of unavailability of public information regarding issuers, less governmental supervision and regulation of financial markets, reduced liquidity of certain financial markets, and the lack of uniform accounting, auditing, and financial reporting standards or the
16
application of standards that are different or less stringent than those applied in the United States. Foreign securities also may experience greater price volatility, higher rates of inflation, and delays in settlement.
11 Derivative instruments: The Fund has adopted the provisions of ASC 815 "Derivatives and Hedging" ("ASC 815"). The disclosure requirements of ASC 815 distinguish between derivatives that qualify for hedge accounting and those that do not. Because investment companies value their derivatives at fair value and recognize changes in fair value through the Statement of Operations, they do not qualify for hedge accounting. Accordingly, even though the Fund's investments in derivatives may represent economic hedges, they are considered non-hedge transactions for purposes of this disclosure.
Financial futures contracts: During the year ended December 31, 2014, the Fund entered into financial futures contracts for economic hedging purposes, including as a maturity or duration management device. At December 31, 2014, the Fund did not have any outstanding financial futures contracts. At the time the Fund enters into a financial futures contract, it is required to deposit with the futures commission merchant a specified amount of cash or liquid securities, known as "initial margin," which is a percentage of the value of the financial futures contract being traded that is set by the exchange upon which the futures contract is traded. Each day, the futures contract is valued at the official settlement price of the board of trade or U.S. commodity exchange on which such futures contract is traded. Subsequent payments, known as "variation margin," to and from the broker are made on a daily basis, or as needed, as the market price of the financial futures contract fluctuates. Daily variation margin adjustments, arising from this "mark to market," are recorded by the Fund as unrealized gains or losses.
Although some financial futures contracts by their terms call for actual delivery or acquisition of the underlying securities or currency, in most cases the contracts are closed out prior to delivery by offsetting purchases or sales of matching financial futures contracts. When the contracts are closed, the Fund recognizes a gain or loss. Risks of entering into futures contracts include the possibility there may be an illiquid market, possibly at a time of rapidly declining prices, and/or a change in the value of the contract may not correlate with changes in the value of the underlying securities. Futures executed on regulated futures exchanges have minimal counterparty risk to the Fund because the exchange's clearinghouse assumes the position of the counterparty in each transaction. Thus, the Fund is exposed to risk only in connection with the clearinghouse and not in connection with the original counterparty to the transaction.
For U.S. federal income tax purposes, the futures transactions undertaken by the Fund may cause the Fund to recognize gains or losses from marking contracts to market even though its positions have not been sold or terminated, may affect the character of the gains or losses recognized as long-term or short-term, and may affect the timing of some capital gains and losses realized by the Fund. Also, the Fund's losses on transactions involving futures contracts may be deferred rather than being taken into account currently in calculating the Fund's taxable income.
During the year ended December 31, 2014, the average notional value of financial futures contracts for short positions was $(2,529,363).
The impact of the use of these derivative instruments on the Statement of Operations during the year ended December 31, 2014, was as follows:
Realized Gain (Loss)
| | | Interest Rate Risk | | Statement of
Operations Location | |
Futures Contracts | | $ | (46,356 | ) | | Net realized | |
Total Realized Gain (Loss)
| | $ | (46,356
| ) | | gain (loss) on: financial
futures contracts | |
12 Indemnifications: Like many other companies, the Trust's organizational documents provide that its officers ("Officers") and trustees ("Trustees") are indemnified against certain liabilities arising out of the performance of their duties to the Trust. In addition, both in some of its principal service contracts and in the normal course of its
17
business, the Trust enters into contracts that provide indemnifications to other parties for certain types of losses or liabilities. The Trust's maximum exposure under these arrangements is unknown as this could involve future claims against the Trust.
Note B—Management Fees, Administration Fees, Distribution Arrangements, and Other Transactions with Affiliates:
The Fund retains Management as its investment manager under a Management Agreement. For such investment management services, the Fund pays Management a fee at the annual rate of 0.25% of the first $500 million of the Fund's average daily net assets, 0.225% of the next $500 million, 0.20% of the next $500 million, 0.175% of the next $500 million, and 0.15% of average daily net assets in excess of $2 billion. Accordingly, for the year ended December 31, 2014, the management fee pursuant to the Management Agreement was equivalent to an annual effective rate of 0.25% of the Fund's average daily net assets.
The Fund retains Management as its administrator under an Administration Agreement. The Fund pays Management an administration fee at the annual rate of 0.40% of its average daily net assets under this agreement. Additionally, Management retains State Street Bank and Trust Company ("State Street") as its sub-administrator under a Sub-Administration Agreement. Management pays State Street a fee for all services received under this agreement.
The Board adopted a non-fee distribution plan for the Fund.
Management has contractually undertaken to waive current payment of fees and/or reimburse the Fund for its operating expenses (excluding fees payable to Management, interest, taxes, brokerage commissions, extraordinary expenses and transaction costs, if any; and, consequently, net expenses may exceed the contractual expense limitation) ("Operating Expenses") which exceed the expense limitation as detailed in the following table. The Fund has agreed to repay Management for fees and expenses waived and/or its excess Operating Expenses previously reimbursed by Management, so long as its annual Operating Expenses during that period do not exceed its contractual expense limitation in place at the time the fees and expenses were waived or reimbursed, and the repayment is made within three years after the year in which Management issued the reimbursement or waived fees. During the year ended December 31, 2014, there was no repayment to Management under its contractual expense limitation. At December 31, 2014, the Fund had no contingent liability to Management under its contractual expense limitation.
| | | | | | | Expenses Reimbursed in
Fiscal Year Ending December 31, | |
| | | | | | | 2012 | | 2013 | | 2014 | |
| | | | | | | Subject to Repayment Until December 31, | |
| | | Contractual
Expense
Limitation(1) | | Expiration | | 2015 | | 2016 | | 2017 | |
Class I | | | 1.00 | % | | 12/31/17 | | $ | — | | | $ | — | | | $ | — | | |
(1) Expense limitation per annum of the Fund's average daily net assets.
Neuberger Berman Fixed Income LLC ("NBFI"), as the sub-adviser to the Fund, is retained by Management to furnish it with investment recommendations and research information without added cost to the Fund. Several individuals who are Officers and/or Trustees of the Trust are also employees of NBFI and/or Management.
On June 3, 2014, Management made a voluntary contribution of $13,600 to the Fund in connection with a payment matter related to the Fund's investment in a State Street money market fund.
18
Note C—Securities Transactions:
Cost of purchases and proceeds of sales and maturities of long-term securities (excluding financial futures contracts) for the year ended December 31, 2014 were as follows:
Purchases of
U.S. Government
and Agency
Obligations | | Purchases excluding
U.S. Government
and Agency
Obligations | | Sales and Maturities
of U.S. Government
and Agency
Obligations | | Sales and Maturities
excluding
U.S. Government
and Agency
Obligations | |
| $ | 31,911,949 | | | $ | 82,127,100 | | | $ | 60,117,758 | | | $ | 83,340,104 | | |
Note D—Fund Share Transactions:
Share activity for the years ended December 31, 2014 and December 31, 2013 was as follows:
| | | For the Year Ended December 31, | |
| | | 2014 | | 2013 | |
Shares Sold | | | 1,536,915 | | | | 4,458,664 | | |
Shares Issued on Reinvestment of Dividends and Distributions | | | 308,675 | | | | 457,871 | | |
Shares Redeemed | | | (5,651,732 | ) | | | (4,482,544 | ) | |
Total | | | (3,806,142 | ) | | | 433,991 | | |
Note E—Lines of Credit:
At December 31, 2014, the Fund was a participant in a single committed, unsecured $300,000,000 line of credit with State Street, to be used only for temporary or emergency purposes. Other investment companies managed by Management also participate in this line of credit on the same terms. Interest is charged on borrowings under this line of credit at the higher of (a) the Federal Funds Rate plus 1.25% per annum or (b) the Overnight LIBOR Rate plus 1.25% per annum. A commitment fee of 0.10% per annum on the unused portion of the available line of credit is charged, of which each participating fund has agreed to pay its pro rata share, based on the ratio of its individual net assets to the net assets of all participants at the time the fee is due and payable. The fee is paid quarterly in arrears. Because several mutual funds participate, there is no assurance that the Fund will have access to all or any part of the $300,000,000 at any particular time. There were no loans outstanding pursuant to this line of credit at December 31, 2014. During the year ended December 31, 2014, the Fund did not utilize this line of credit.
At December 31, 2014, the Fund was a participant in a single uncommitted, unsecured $100,000,000 line of credit with State Street, to be used only for temporary or emergency purposes. Other investment companies managed by Management also participate in this line of credit on the same terms. Interest is charged on borrowings under this line of credit at a variable rate per annum as determined and quoted by State Street at the time a fund requests a loan. Because several mutual funds participate, there is no assurance that the Fund will have access to all or any part of the $100,000,000 at any particular time. There were no loans outstanding pursuant to this line of credit at December 31, 2014. During the year ended December 31, 2014, the Fund did not utilize this line of credit.
In January 2015, a new syndicated committed, unsecured $700,000,000 line of credit, to be used only for temporary or emergency purposes, replaced the lines of credit with State Street noted above. Because several mutual funds participate in this line of credit, there is no assurance that the Fund will have access to all or any part of the $700,000,000 at any particular time.
19
Short Duration Bond Portfolio
The following table includes selected data for a share outstanding throughout each year and other performance information derived from the Financial Statements. Per share amounts that round to less than $0.01 or $(0.01) per share are presented as $0.00 or $(0.00), respectively. Ratios that round to less than 0.00% or (0.00)% per share are presented as 0.00% or (0.00)%, respectively. A "—" indicates that the line item was not applicable in the corresponding period.
Class I | |
| | | Year Ended December 31, | |
| | | 2014 | | 2013 | | 2012 | | 2011 | | 2010 | |
Net Asset Value, Beginning of Year | | $ | 10.78 | | | $ | 10.95 | | | $ | 10.79 | | | $ | 11.20 | | | $ | 11.22 | | |
Income From Investment Operations: | |
| Net Investment Income (Loss)‡ | | | 0.07 | | | | 0.07 | | | | 0.13 | | | | 0.19 | | | | 0.24 | | |
Net Gains or Losses on Securities
(both realized and unrealized) | | | 0.00 | | | | (0.00 | ) | | | 0.37 | | | | (0.16 | ) | | | 0.36 | | |
Total From Investment Operations | | | 0.07 | | | | 0.07 | | | | 0.50 | | | | 0.03 | | | | 0.60 | | |
Less Distributions From: | |
Net Investment Income | | | (0.19 | ) | | | (0.24 | ) | | | (0.34 | ) | | | (0.44 | ) | | | (0.62 | ) | |
Voluntary Contribution from Management | | | 0.00 | | | | — | | | | — | | | | — | | | | — | | |
Net Asset Value, End of Year | | $ | 10.66 | | | $ | 10.78 | | | $ | 10.95 | | | $ | 10.79 | | | $ | 11.20 | | |
| Total Return†† | | | 0.61 | %@ | | | 0.62 | % | | | 4.61 | % | | | 0.29 | % | | | 5.28 | % | |
Ratios/Supplemental Data | |
Net Assets, End of Year (in millions) | | $ | 184.6 | | | $ | 227.7 | | | $ | 226.6 | | | $ | 245.6 | | | $ | 287.3 | | |
| Ratio of Gross Expenses to Average Net Assets# | | | 0.82 | % | | | 0.80 | % | | | 0.82 | % | | | 0.81 | % | | | 0.81 | % | |
| Ratio of Net Expenses to Average Net Assets§ | | | 0.82 | % | | | 0.80 | % | | | 0.82 | % | | | 0.81 | % | | | 0.81 | % | |
Ratio of Net Investment Income (Loss) to Average
Net Assets | | | 0.69 | % | | | 0.64 | % | | | 1.20 | % | | | 1.73 | % | | | 2.07 | % | |
Portfolio Turnover Rate | | | 58 | % | | | 72 | % | | | 67 | % | | | 74 | % | | | 70 | % | |
See Notes to Financial Highlights
20
Notes to Financial Highlights Short Duration Bond Portfolio
†† Total return based on per share NAV reflects the effects of changes in NAV on the performance of the Fund during each fiscal period. Returns assume income dividends and other distributions, if any, were reinvested. Results represent past performance and do not indicate future results. Current returns may be lower or higher than the performance data quoted. Investment returns and principal may fluctuate and shares when redeemed may be worth more or less than original cost. Total return would have been lower if Management had not reimbursed and/or waived certain expenses. The total return information shown does not reflect charges and other expenses that apply to the separate account or the related insurance policies or other qualified pension or retirement plan, and the inclusion of these charges and other expenses would reduce the total return for all fiscal periods shown. The voluntary contribution listed in Note B of the Notes to Financial Statements had no impact on the Fund's total return for the year ended December 31, 2014.
@ The class action proceeds listed in Note A-4 of the Notes to Financial Statements had no impact on the Fund's total return for the year ended December 31, 2014.
# Represents the annualized ratios of net expenses to average daily net assets if Management had not reimbursed certain expenses and/or waived a portion of the investment management fee.
‡ Calculated based on the average number of shares outstanding during each fiscal period.
§ Prior to January 1, 2013, the Fund had an expense offset arrangement in connection with its custodian contract. The impact of expense reductions related to expense offset arrangements, if any, was less than 0.01%.
21
Report of Independent Registered Public Accounting Firm
To the Board of Trustees of
Neuberger Berman Advisers Management Trust and
Shareholders of Short Duration Bond Portfolio
We have audited the accompanying statement of assets and liabilities of Short Duration Bond Portfolio, one of the series constituting Neuberger Berman Advisers Management Trust (the "Trust"), including the schedule of investments, as of December 31, 2014, and the related statement of operations for the year then ended, the statements of changes in net assets for each of the two years in the period then ended and the financial highlights for each of the five years in the period then ended. These financial statements and financial highlights are the responsibility of the Trust's management. Our responsibility is to express an opinion on these financial statements and financial highlights based on our audits.
We conducted our audits in accordance with the standards of the Public Company Accounting Oversight Board (United States). Those standards require that we plan and perform the audit to obtain reasonable assurance about whether the financial statements and financial highlights are free of material misstatement. We were not engaged to perform an audit of the Trust's internal control over financial reporting. Our audits included consideration of internal control over financial reporting as a basis for designing audit procedures that are appropriate in the circumstances, but not for the purpose of expressing an opinion on the effectiveness of the Trust's internal control over financial reporting. Accordingly, we express no such opinion. An audit also includes examining, on a test basis, evidence supporting the amounts and disclosures in the financial statements and financial highlights, assessing the accounting principles used and significant estimates made by management, and evaluating the overall financial statement presentation. Our procedures included confirmation of securities owned as of December 31, 2014 by correspondence with the custodian. We believe that our audits provide a reasonable basis for our opinion.
In our opinion, the financial statements and financial highlights referred to above present fairly, in all material respects, the financial position of Short Duration Bond Portfolio, a series of Neuberger Berman Advisers Management Trust, at December 31, 2014, the results of its operations for the year then ended, the changes in its net assets for each of the two years in the period then ended, and the financial highlights for each of the five years in the period then ended in conformity with U.S. generally accepted accounting principles.
Boston, Massachusetts
February 10, 2015
22
Trustee and Officer Information
The following tables set forth information concerning the Trustees and Officers of the Fund. All persons named as Trustees and Officers also serve in similar capacities for other funds administered or managed by Management and NBFI. The Fund's Statement of Additional Information includes additional information about the Trustees and is available upon request, without charge, by calling (800) 877-9700.
Information about the Board of Trustees
Name, (Year of Birth),
and Address(1) | | Position(s) and
Length of
Time Served(2) | | Principal Occupation(s)(3) | | Number of
Funds in Fund
Complex
Overseen by
Fund Trustee | | Other Directorships Held
Outside Fund Complex by
Fund Trustee(3) | |
Independent Trustees | |
Faith Colish (1935) | | Trustee since 1982 | | Counsel, Carter Ledyard & Milburn LLP (law firm) since October 2002; formerly, Attorney-at-Law and President, Faith Colish, A Professional Corporation, 1980 to 2002. | | | 60 | | | Formerly, Director, 1997 to 2003, and Advisory Director, 2003 to 2006, ABA Retirement Funds (formerly, American Bar Retirement Association) (not-for-profit membership corporation). | |
Martha C. Goss (1949) | | Trustee since 2007 | | President, Woodhill Enterprises Inc./Chase Hollow Associates LLC (personal investment vehicle), since 2006; formerly, Consultant, Resources Global Professionals (temporary staffing), 2002 to 2006. | | | 60 | | | Director, American Water (water utility), since 2003; Director, Allianz Life of New York (insurance), since 2005; Director, Berger Group Holdings, Inc. (engineering consulting firm), since 2013; Director, Financial Women's Association of New York (not-for-profit association), since 2003; Trustee Emerita, Brown University, since 1998; Director, Museum of American Finance (not-for-profit), since 2013; formerly, Non-Executive Chair and Director, Channel Reinsurance (financial guaranty reinsurance), 2006 to 2010; formerly, Director, Ocwen Financial Corporation (mortgage servicing), 2005 to 2010; formerly, Director, Claire's Stores, Inc. (retailer), 2005 to 2007; formerly, Director, Parsons Brinckerhoff Inc. (engineering consulting firm), 2007 to 2010; formerly, Director, Bank Leumi (commercial bank), 2005 to 2007; formerly, Advisory Board Member, Attensity (software developer), 2005 to 2007. | |
23
Name, (Year of Birth),
and Address(1) | | Position(s) and
Length of
Time Served(2) | | Principal Occupation(s)(3) | | Number of
Funds in Fund
Complex
Overseen by
Fund Trustee | | Other Directorships Held
Outside Fund Complex by
Fund Trustee(3) | |
Michael M. Knetter (1960) | | Trustee since 2007 | | President and Chief Executive Officer, University of Wisconsin Foundation, since October 2010; formerly, Dean, School of Business, University of Wisconsin - Madison; formerly, Professor of International Economics and Associate Dean, Amos Tuck School of Business - Dartmouth College, 1998 to 2002. | | | 60 | | | Board Member, American Family Insurance (a mutual company, not publicly traded), since March 2009; formerly, Trustee, Northwestern Mutual Series Fund, Inc., 2007 to 2011; formerly, Director, Wausau Paper, 2005 to 2011; formerly, Director, Great Wolf Resorts, 2004 to 2009. | |
Howard A. Mileaf (1937) | | Trustee since 1999 | | Retired; formerly, Vice President and General Counsel, WHX Corporation (holding company), 1993 to 2001. | | | 60 | | | Formerly, Director, Webfinancial Corporation (holding company), 2002 to 2008; formerly, Director, WHX Corporation (holding company), 2002 to 2005; formerly, Director, State Theatre of New Jersey (not-for-profit theatre), 2000 to 2005. | |
George W. Morriss (1947) | | Trustee since 2007 | | Adjunct Professor, Columbia University School of International and Public Affairs, since October 2012; formerly, Executive Vice President and Chief Financial Officer, People's Bank, Connecticut (a financial services company), 1991 to 2001. | | | 60 | | | Director and Treasurer, National Association of Corporate Directors, Connecticut Chapter, since 2011; Trustee, Steben Alternative Investment Funds, Steben Select Multi-Strategy Fund and Steben Select Multi-Strategy Master Fund, since 2013; formerly, Manager, Larch Lane Multi-Strategy Fund complex (which consisted of three funds), 2006 to 2011; formerly, Member, NASDAQ Issuers' Affairs Committee, 1995 to 2003. | |
24
Name, (Year of Birth),
and Address(1) | | Position(s) and
Length of
Time Served(2) | | Principal Occupation(s)(3) | | Number of
Funds in Fund
Complex
Overseen by
Fund Trustee | | Other Directorships Held
Outside Fund Complex by
Fund Trustee(3) | |
Tom D. Seip (1950) | | Trustee since 2000; Chairman of the Board since 2008; Lead Independent Trustee from 2006 to 2008 | | General Partner, Ridgefield Farm LLC (a private investment vehicle); formerly, President and CEO, Westaff, Inc. (temporary staffing), May 2001 to January 2002; formerly, Senior Executive, The Charles Schwab Corporation, 1983 to 1998, including Chief Executive Officer, Charles Schwab Investment Management, Inc.; Trustee, Schwab Family of Funds and Schwab Investments, 1997 to 1998; and Executive Vice President-Retail Brokerage, Charles Schwab & Co., Inc., 1994 to 1997. | | | 60 | | | Director, H&R Block, Inc. (financial services company), since May 2001; Chairman, Governance and Nominating Committee, H&R Block, Inc., since 2011; formerly, Chairman, Compensation Committee, H&R Block, Inc., 2006 to 2010; formerly, Director, Forward Management, Inc. (asset management company), 1999 to 2006. | |
Candace L. Straight (1947) | | Trustee since 1999 | | Private investor and consultant specializing in the insurance industry; formerly, Advisory Director, Securitas Capital LLC (a global private equity investment firm dedicated to making investments in the insurance sector), 1998 to 2003. | | | 60 | | | Public Member, Board of Governors and Board of Trustees, Rutgers University, since 2011; Director, Montpelier Re Holdings Ltd. (reinsurance company), since 2006; formerly, Director, National Atlantic Holdings Corporation (property and casualty insurance company), 2004 to 2008; formerly, Director, The Proformance Insurance Company (property and casualty insurance company), 2004 to 2008; formerly, Director, Providence Washington Insurance Company (property and casualty insurance company), 1998 to 2006; formerly, Director, Summit Global Partners (insurance brokerage firm), 2000 to 2005. | |
Peter P. Trapp (1944) | | Trustee since 1984 | | Retired; formerly, Regional Manager for Mid-Southern Region, Ford Motor Credit Company, September 1997 to 2007; formerly, President, Ford Life Insurance Company, April 1995 to August 1997. | | | 60 | | | None. | |
25
Name, (Year of Birth),
and Address(1) | | Position(s) and
Length of
Time Served(2) | | Principal Occupation(s)(3) | | Number of
Funds in Fund
Complex
Overseen by
Fund Trustee | | Other Directorships Held
Outside Fund Complex by
Fund Trustee(3) | |
Trustees who are "Interested Persons" | |
Joseph V. Amato* (1962) | | Trustee since 2009 | | President and Director, Neuberger Berman Group LLC, since 2009; President and Chief Executive Officer, Neuberger and Neuberger Berman Holdings LLC (including its predecessor, Neuberger Berman Inc.), since 2007; Chief Investment Officer (Equities) and Managing Director, Management, since 2009; Managing Director, NBFI, since 2007; Board member of NBFI since 2006; formerly, Global Head of Asset Management of Lehman Brothers Holdings Inc.'s ("LBHI") Investment Management Division, 2006 to 2009; formerly, member of LBHI's Investment Management Division's Executive Management Committee, 2006 to 2009; formerly, Managing Director, Lehman Brothers Inc. ("LBI"), 2006 to 2008; formerly, Chief Recruiting and Development Officer, LBI, 2005 to 2006; formerly, Global Head of LBI's Equity Sales and a Member of its Equities Division Executive Committee, 2003 to 2005. | | | 60 | | | Member of Board of Advisors, McDonough School of Business, Georgetown University, since 2001; Member of New York City Board of Advisors, Teach for America, since 2005; Trustee, Montclair Kimberley Academy (private school), since 2007; Member of Board of Regents, Georgetown University, since 2013. | |
26
Name, (Year of Birth),
and Address(1) | | Position(s) and
Length of
Time Served(2) | | Principal Occupation(s)(3) | | Number of
Funds in Fund
Complex
Overseen by
Fund Trustee | | Other Directorships Held
Outside Fund Complex by
Fund Trustee(3) | |
Robert Conti* (1956) | | Chief Executive Officer, President and Trustee since 2008; prior thereto, Executive Vice President in 2008 and Vice President from 2000 to 2008 | | Managing Director, Neuberger, since 2007; Managing Director, NBFI, since 2009; formerly, Senior Vice Pres ident, Neuberger, 2003 to 2006; formerly, Vice President, Neuberger, 1999 to 2003; President and Chief Executive Officer, Management, since 2008; formerly, Senior Vice President, Management, 2000 to 2008. | | | 60 | | | Director, Staten Island Mental Health Society, since 1994; formerly, Chairman of the Board, Staten Island Mental Health Society, 2008 to 2011. | |
(1) The business address of each listed person is 605 Third Avenue, New York, New York 10158.
(2) Pursuant to the Trust's Trust Instrument, each of these Trustees shall hold office for life or until his or her successor is elected or the Trust terminates; except that (a) any Trustee may resign by delivering a written resignation; (b) any Trustee may be removed with or without cause at any time by a written instrument signed by at least two-thirds of the other Trustees; (c) any Trustee who requests to be retired, or who has become unable to serve, may be retired by a written instrument signed by a majority of the other Trustees; and (d) any Trustee may be removed at any shareholder meeting by a vote of at least two-thirds of the outstanding shares.
(3) Except as otherwise indicated, each individual has held the positions shown for at least the last five years.
* Indicates a Trustee who is an "interested person" within the meaning of the 1940 Act. Mr. Amato and Mr. Conti are interested persons of the Trust by virtue of the fact that each is an officer of Management, Neuberger and/or their affiliates.
27
Information about the Officers of the Trust
Name, (Year of Birth),
and Address(1) | | Position(s) and
Length of Time
Served(2) | | Principal Occupation(s)(3) | |
Andrew B. Allard (1961) | | Chief Legal Officer since 2013 (only for purposes of sections 307 and 406 of the Sarbanes-Oxley Act of 2002) and Anti-Money Laundering Compliance Officer since 2002 | | General Counsel and Senior Vice President, Management, since 2013; Senior Vice President, Neuberger, since 2006 and Employee since 1999; Deputy General Counsel, Neuberger, since 2004; formerly, Vice President, Neuberger, 2000 to 2005; formerly, Employee, Management, 1994 to 1999; Chief Legal Officer since 2013 (only for purposes of sections 307 and 406 of the Sarbanes-Oxley Act of 2002), ten registered investment companies for which Management acts as investment manager and administrator (ten since 2013); Anti-Money Laundering Compliance Officer, ten registered investment companies for which Management acts as investment manager and administrator (six since 2002, one since 2003, one since 2005, one since 2006 and one since 2013). | |
Claudia A. Brandon (1956) | | Executive Vice President since 2008 and Secretary since 1985 | | Senior Vice President, Neuberger, since 2007 and Employee since 1999; Senior Vice President, Management, since 2008 and Assistant Secretary since 2004; formerly, Vice President, Neuberger, 2002 to 2006; formerly, Vice President-Mutual Fund Board Relations, Management, 2000 to 2008; formerly, Vice President, Management, 1986 to 1999 and Employee 1984 to 1999; Executive Vice President, ten registered investment companies for which Management acts as investment manager and administrator (nine since 2008 and one since 2013); Secretary, ten registered investment companies for which Management acts as investment manager and administrator (three since 1985, three since 2002, one since 2003, one since 2005, one since 2006 and one since 2013). | |
Agnes Diaz (1971) | | Vice President since 2013 | | Senior Vice President, Neuberger, since 2012; Employee, Management, since 1996; formerly, Vice President, Neuberger, 2007 to 2012; Vice President, ten registered investment companies for which Management acts as investment manager and administrator (ten since 2013). | |
Anthony DiBernardo (1979) | | Assistant Treasurer since 2011 | | Senior Vice President, Neuberger, since 2014; Employee, Management, since 2003; formerly, Vice President, Neuberger, 2009 to 2014; Assistant Treasurer, ten registered investment companies for which Management acts as investment manager and administrator (nine since 2011 and one since 2013). | |
Sheila R. James (1965) | | Assistant Secretary since 2002 | | Vice President, Neuberger, since 2008 and Employee since 1999; formerly, Assistant Vice President, Neuberger, 2007; formerly, Employee, Management, 1991 to 1999; Assistant Secretary, ten registered investment companies for which Management acts as investment manager and administrator (six since 2002, one since 2003, one since 2005, one since 2006 and one since 2013). | |
Brian Kerrane (1969) | | Vice President since 2008 | | Managing Director, Neuberger, since 2014; Vice President, Management, since 2008 and Employee since 1991; formerly, Senior Vice President, Neuberger, 2006 to 2014; Vice President, ten registered investment companies for which Management acts as investment manager and administrator (nine since 2008 and one since 2013). | |
28
Name, (Year of Birth),
and Address(1) | | Position(s) and
Length of Time
Served(2) | | Principal Occupation(s)(3) | |
Kevin Lyons (1955) | | Assistant Secretary since 2003 | | Assistant Vice President, Neuberger, since 2008 and Employee since 1999; formerly, Employee, Management, 1993 to 1999; Assistant Secretary, ten registered investment companies for which Management acts as investment manager and administrator (seven since 2003, one since 2005, one since 2006 and one since 2013). | |
Owen F. McEntee, Jr. (1961) | | Vice President since 2008 | | Vice President, Neuberger, since 2006; Employee, Management, since 1992; Vice President, ten registered investment companies for which Management acts as investment manager and administrator (nine since 2008 and one since 2013). | |
John M. McGovern (1970) | | Treasurer and Principal Financial and Accounting Officer since 2005 | | Senior Vice President, Neuberger, since 2007; Employee, Management, since 1993; Treasurer and Principal Financial and Accounting Officer, ten registered investment companies for which Management acts as investment manager and administrator (eight since 2005, one since 2006 and one since 2013); formerly, Vice President, Neuberger, 2004 to 2006; formerly, Assistant Treasurer, eight registered investment companies for which Management acts as investment manager and administrator, 2002 to 2005. | |
Frank Rosato (1971) | | Assistant Treasurer since 2005 | | Vice President, Neuberger, since 2006; Employee, Management, since 1995; Assistant Treasurer, ten registered investment companies for which Management acts as investment manager and administrator (eight since 2005, one since 2006 and one since 2013). | |
Neil S. Siegel (1967) | | Vice President since 2008 | | Managing Director, Management, since 2008; Managing Director, Neuberger, since 2006; Managing Director, NBFI, since 2011; formerly, Senior Vice President, Neuberger, 2004 to 2006; Vice President, ten registered investment companies for which Management acts as investment manager and administrator (nine since 2008 and one since 2013). | |
Chamaine Williams (1971) | | Chief Compliance Officer since 2005 | | Senior Vice President, Neuberger, since 2007; Chief Compliance Officer, Management, since 2006; Chief Compliance Officer, ten registered investment companies for which Management acts as investment manager and administrator (eight since 2005, one since 2006 and one since 2013); formerly, Senior Vice President, LBI, 2007 to 2008; formerly, Vice President, LBI, 2003 to 2006; formerly, Chief Compliance Officer, Lehman Brothers Asset Management Inc., 2003 to 2007; formerly, Chief Compliance Officer, Lehman Brothers Alternative Investment Management LLC, 2003 to 2007. | |
(1) The business address of each listed person is 605 Third Avenue, New York, New York 10158.
(2) Pursuant to the By-Laws of the Trust, each officer elected by the Trustees shall hold office until his or her successor shall have been elected and qualified or until his or her earlier death, inability to serve, or resignation. Officers serve at the pleasure of the Trustees and may be removed at any time with or without cause.
(3) Except as otherwise indicated, each individual has held the positions shown for at least the last five years.
29
Proxy Voting Policies and Procedures
A description of the policies and procedures that the Trust uses to determine how to vote proxies relating to portfolio securities is available, without charge, by calling 800-877-9700 (toll-free) and on the Securities and Exchange Commission's website, at www.sec.gov. Information regarding how the Trust voted proxies relating to portfolio securities during the most recent 12-month period ended June 30 is also available upon request, without charge, by calling 800-877-9700 (toll-free), on the Securities and Exchange Commission's website at www.sec.gov, and on Management's website at www.nb.com.
Quarterly Portfolio Schedule
The Trust files a complete schedule of portfolio holdings for the Fund with the Securities and Exchange Commission for the first and third quarters of each fiscal year on Form N-Q. The Trust's Forms N-Q are available on the Securities and Exchange Commission's website at www.sec.gov and may be reviewed and copied at the Securities and Exchange Commission's Public Reference Room in Washington, DC. Information on the operation of the Public Reference Room may be obtained by calling 800-SEC-0330. The information on Form N-Q is available upon request, without charge, by calling 800-877-9700 (toll free).
Board Consideration of the Management and Sub-Advisory Agreements
On an annual basis, the Board of the Trust, including the Trustees who are not "interested persons" of Management (including its affiliates) or the Trust ("Independent Fund Trustees"), considers whether to continue the Management and Sub-Advisory Agreements ("Agreements") with respect to the Fund. Throughout the process, the Independent Fund Trustees are advised by counsel that is experienced in Investment Company Act of 1940 matters and that is independent of Management ("Independent Counsel"). At a meeting held on October 6-7, 2014, the Board, including the Independent Fund Trustees, approved the continuation of the Agreements for the Fund.
In evaluating the Agreements, the Board, including the Independent Fund Trustees, reviewed extensive materials provided by Management in response to questions submitted by the Board and Independent Counsel, and met with senior representatives of Management regarding its personnel, operations and financial condition as they relate to the Fund. The annual contract review extends over at least two regular meetings of the Board to ensure that Management and NBFI have time to respond to any questions the Independent Fund Trustees may have on their initial review of the materials and that the Independent Fund Trustees have time to consider those responses.
In connection with its deliberations, the Board also considered the broad range of information relevant to the annual contract review that is provided to the Board (including its various standing committees) at meetings throughout the year, including investment performance reports and related portfolio information for the Fund, as well as periodic reports on, among other matters, pricing and valuation; brokerage and execution; and compliance, shareholder and other services provided by Management and its affiliates. To assist the Board in its deliberations regarding the annual contract review, the Board has established a Contract Review Committee comprised of Independent Fund Trustees, as well as other committees that focus throughout the year on specific areas relevant to the annual contract review, such as Fund performance or compliance matters.
The Independent Fund Trustees received from Independent Counsel a memorandum discussing the legal standards for their consideration of the proposed continuation of the Agreements. During the course of the year and during their deliberations regarding the annual contract review, the Contract Review Committee and the Independent Fund Trustees met with Independent Counsel separately from representatives of Management.
In connection with its approval of the continuation of the Agreements, the Board evaluated the terms of the Agreements, the overall fairness of the Agreements to the Fund and whether the Agreements were in the best interests of the Fund and its shareholders. The Board considered all factors it deemed relevant with respect to the Fund, including the following factors: (1) the nature, extent, and quality of the services provided by Management and NBFI; (2) the investment
30
performance of the Fund compared to an appropriate market index and a peer group of investment companies; (3) the costs of the services provided as compared to a peer group of investment companies and the profit or loss realized by Management and its affiliates from their relationship with the Fund; (4) the extent to which economies of scale might be realized as the Fund grows; and (5) whether fee levels reflect any such potential economies of scale for the benefit of the Fund's shareholders.
The Board factored into its evaluation of the Fund's fees and performance a consideration of the limitations inherent in the methodology for constructing peer groups and determining which investment companies should be included in the peer groups. The Board considered two separate peer groups, one composed of proprietary funds that are operated by insurance companies, and the other composed of non-proprietary funds operated for insurance company investors by independent investment managers.
While each Trustee may have attributed different weights to the various factors, the Board's determination to approve the continuation of the Agreements was based on a comprehensive consideration of all information provided to the Board throughout the year and specifically in connection with the annual contract review. The Board members did not identify any particular information or factor that was all-important or controlling. The Board focused on the overall costs and benefits of the Agreements relating to the Fund and, through the Fund, its shareholders.
With respect to the nature, extent and quality of the services provided, the Board considered the investment philosophy and decision-making processes of Management and NBFI, and the qualifications, experience and capabilities of and the resources available to the portfolio management personnel of Management and NBFI who perform services for the Fund. The Board noted that Management also provides certain administrative services, including fund accounting and compliance oversight. The Board also considered Management's and NBFI's policies and practices regarding brokerage and allocation of portfolio transactions and reviewed the quality of the execution services that Management had provided. The Board also reviewed whether Management or NBFI used brokers to execute Fund transactions that provide research and other services to Management or NBFI and the types of benefits potentially derived from such services by Management, NBFI, the Fund and other clients of Management and NBFI. The Board also considered that Management's responsibilities include daily management of investment, operational, enterprise, legal, regulatory and compliance risks as they relate to the Fund, and considered information regarding Management's processes for managing risk. In addition, the Board noted the positive compliance history of Management and NBFI, as no significant compliance problems were reported to the Board with respect to either firm. The Board also considered the general structure of the portfolio manager compensation program and whether this structure provides appropriate incentives to act in the best interests of the Fund. As in past years, the Board also considered the manner in which Management addressed various non-routine matters that arose during the year, some of them a result of developments in the broader fund industry or the regulations governing it. In addition, the Board considered actions taken by Management and NBFI in response to recent market conditions, including actions taken in response to regulatory concerns about changes in fixed-income market liquidity and potential volatility, and considered the overall performance of Management and NBFI in this context.
With respect to investment performance, the Board considered information regarding the Fund's short-, intermediate- and long-term performance both on an absolute basis and relative to an appropriate market index (or benchmark) and the average performance of a composite peer group (as constructed by an independent organization) of investment companies pursuing broadly similar strategies. The Board also reviewed performance in relation to certain measures of the degree of investment risk undertaken by the portfolio manager. The Board considered that as compared to both its proprietary and non-proprietary peer groups, the Fund's performance was higher than the median for the 1, 3, and 5 year periods and lower than the median for the 10-year period. The Board considered that as compared to its benchmark, the Fund's performance was higher for the 3 and 5 year periods and lower for the 1 and 10-year periods. In this regard, the Board noted that performance, especially short-term performance, is only one of the factors that it deems relevant to its consideration of the Agreements and that, after considering all relevant factors, it may be appropriate to approve the continuation of the Agreements.
With respect to the overall fairness of the Agreements, the Board decided to consider the fee structure for the Fund under the Agreements as compared to the non-proprietary peer group because it concluded that the proprietary funds are constructed on a different business model that the adviser cannot replicate. The Board also considered any fall-out
31
benefits likely to accrue to Management or NBFI or their affiliates from their relationship with the Fund. The Board also considered the profitability of Management and its affiliates from their association with the Fund, and profitability broken out between the investment management and administrative portions of the services provided, and year-over-year changes in each of Management's reported expense categories.
The Board reviewed a comparison of the Fund's management fee and overall expense ratio to the non-proprietary peer group. The Board noted that the comparative management fee analysis includes, in the Fund's management fee, the separate administrative fee paid to Management, but it was not clear whether this was the case for all funds in the peer group. The Board considered the mean and median of the management fees and overall expense ratios of each peer group. In addition, the Board considered the contractual limit on expenses of the Fund. Noting that the Fund's contractual management fee and actual management fee net of fees waived by Management were higher than the peer group mean and median, the Board considered whether specific portfolio management, administration or oversight needs contributed to the management fee. The Board also noted that the Fund's size, which impacts its expenses and performance, has been affected by ongoing changes in the insurance market.
The Board also considered whether there were other funds that were advised or sub-advised by Management or its affiliates or separate accounts managed by Management or its affiliates with investment objectives, policies and strategies that were similar to those of the Fund. The Board compared the fees charged to the Fund to the fees charged to any such funds and/or separate accounts. The Board considered the appropriateness and reasonableness of any differences between the fees charged to the Fund and any such funds and/or separate accounts, including any breakpoints, and determined that any differences in fees and fee structures were consistent with the management and other services provided.
The Board also evaluated any apparent or anticipated economies of scale in relation to the services Management provides to the Fund. The Board considered that the Fund's fee structure provides for a reduction of payments resulting from the use of breakpoints and whether those breakpoints are set at appropriate asset levels. In concluding that the benefits accruing to Management and its affiliates by virtue of their relationship with the Fund were reasonable in light of the costs of providing the investment advisory and other services and the benefits accruing to the Fund, the Board reviewed specific data as to Management's profit on the Fund for a recent period. The Board also carefully examined Management's cost allocation methodology. The Board recognized that Management should be entitled to earn a reasonable level of profits for the services it provides to the Fund and, based on its review, concluded that Management's reported level of profitability was reasonable.
Conclusions
In approving the Agreements, the Board concluded that the terms of each Agreement are fair and reasonable to the Fund and that approval of the Agreements is in the best interests of the Fund and its shareholders. In reaching this determination, the Board considered that Management and NBFI could be expected to provide a high level of service to the Fund; that the performance of the Fund was satisfactory over time; that the Fund's fee structure appeared to the Board to be reasonable given the nature, extent and quality of services provided; and that the benefits accruing to Management and its affiliates by virtue of their relationship with the Fund were reasonable in light of the costs of providing the investment advisory and other services and the benefits accruing to the Fund. The Board's conclusions may be based in part on its consideration of materials prepared in connection with the approval or continuance of the Agreements in prior years and on the Board's ongoing regular review of Fund performance and operations throughout the year, in addition to material prepared specifically for the most recent annual review of the Agreements.
32