Washington, D.C. 20549
Jeffrey S. Puretz, Esq.
1775 I Street, N.W.
Washington, D.C. 20006
Form N-CSR is to be used by management investment companies to file reports with the Commission not later than 10 days after the transmission to stockholders of any report that is required to be transmitted to stockholders under Rule 30e-1 under the Investment Company Act of 1940 (the “Act”) (17 CFR 270.30e-1). The Commission may use the information provided on Form N-CSR in its regulatory, disclosure review, inspection, and policymaking roles.
A registrant is required to disclose the information specified by Form N-CSR, and the Commission will make this information public. A registrant is not required to respond to the collection of information contained in Form N-CSR unless the Form displays a currently valid Office of Management and Budget (“OMB”) control number. Please direct comments concerning the accuracy of the information collection burden estimate and any suggestions for reducing the burden to Secretary, Securities and Exchange Commission, 100 F Street, NE, Washington, DC 20549. The OMB has reviewed this collection of information under the clearance requirements of 44 U.S.C. § 3507.
The following are copies of the annual reports transmitted to shareholders pursuant to Rule 30e-1 under the Act.
Neuberger Berman
Advisers Management Trust
Balanced Portfolio
I Class Shares
Annual Report
December 31, 2011
B1014 02/12
Balanced Portfolio Commentary (Unaudited)
The Neuberger Berman Advisors Management Trust (AMT) Balanced Portfolio posted a –0.63% total return for the fiscal year ended December 31, 2011. The Portfolio's equity component outperformed the Russell Midcap® Growth Index while its fixed income component underperformed the Barclays Capital 1-3 Year U.S. Government/Credit Index for the same period.
Equities
2011 was a year in which macro and political headlines overshadowed fundamentals. Characterized by "risk-on, risk-off" volatility and highly correlated market moves that failed to differentiate between companies, 2011, much like 2010, was plagued by Europe's unresolved debt crisis, political gridlock and acrimony in Washington and concerns over China's management of its growth.
For the year, the equity component of the Portfolio outperformed on the basis of stock selection, relative to the benchmark, with Industrials and Health Care serving as the leading positive contributors to performance. Consumer Discretionary, although muted on a relative basis due to an underweight versus the benchmark, delivered strong absolute contributions from stock selection. Areas of relative underperformance were Information Technology (IT) and Financials. In IT, both an overweight allocation and stock selection detracted. Despite a positively contributing underweight allocation to Financials, poor stock selection resulted in performance that detracted from returns.
At year end, the Portfolio's equity component was overweighted relative to the midcap index in Industrials, IT, Health Care and Telecommunication Services and underweighted in Materials, Consumer Staples, Financials and Consumer Discretionary.
As we look toward 2012, despite the many threats to both global and domestic financial stability, we remain cautiously optimistic about equities. We anticipate modest growth in the U.S. economy to continue, with the risk of recession already priced into the market and an economic downturn unlikely. We also believe that stocks can do well, even if the pace of economic growth remains slow. In our view, 2012 will likely be about business confidence and whether we can move beyond the current fragile state and begin to log meaningful gains in hiring and capital expenditures, which in turn could lend support to the consumer. We believe there is pent-up demand, which in many cases has been on hold in developed markets since 2008. If the leaders in Washington and overseas, especially in Europe, can turn uncertainties into resolutions, then hopefully companies will have the confidence to put their cash to work and we could see the potential for positive momentum in the economy.
Fixed Income
The fixed income market also experienced periods of heightened volatility during the year. After generating relatively solid results during the first quarter of 2011, non-Treasury sectors performed poorly over the next two quarters. During that time, investor risk aversion increased and there were several extreme flights to quality given concerns over a double-dip recession and the fears of contagion from the European sovereign debt crisis. The year ended on a positive note for non-Treasuries, however, as risk aversion was often replaced with an increase in risk appetite during the fourth quarter. All told, non-Treasuries generated positive absolute returns in 2011, but most sectors lagged equal-duration Treasuries.
Throughout the reporting period, the Portfolio's fixed income component maintained an overweight to non-Treasuries compared to the Barclays benchmark index. While this was beneficial at times, overall, it negatively impacted performance. In particular, our allocations to non-agency mortgage-backed securities (MBS), asset-backed securities (ABS) and investment grade corporate bonds were not rewarded. On the upside, our exposure to commercial mortgage-backed securities (CMBS) contributed to performance. Elsewhere, our yield curve positioning enhanced results, as our exposure to the two-year and longer portion of the yield curve performed well during the year. This more than offset the negative impact of our overall defensive duration posture.
1
A number of adjustments were made to the Portfolio's fixed income component during the reporting period. We significantly reduced our allocation to Treasuries in order to increase exposures to investment grade corporate bonds, agency MBS, ABS and CMBS. We maintained the Portfolio's defensive duration posture as we felt that interest rates were unsustainably low.
We anticipate moderate U.S. growth and are generally positive on the outlook for non-Treasury sectors in 2012. While the near-term outlook is cloudy, we feel the intermediate- to longer-term picture remains bright. When some of the uncertainties regarding the macro headwinds lift, investor sentiment could improve, providing a tailwind for these sectors. In addition, the combination of positive economic growth and relatively benign inflation could support a tightening in the spreads in yield between Treasuries and other fixed income investments in 2012.
Sincerely,
Kenneth J. Turek, Thomas Sontag,
Michael Foster and Richard Grau
Portfolio Co-Managers
Information about the principal risks of investing in the Portfolio is set forth in the prospectus and statement of additional information.
The composition, industries and holding of the Portfolio are subject to change.
2
Balanced Portfolio (Unaudited)
PORTFOLIO BY TYPE OF SECURITY
| (as a % of Total Net Assets) | |
| Asset-Backed Securities | | | 4.8 | % | |
| Common Stocks | | | 66.5 | | |
| Corporate Debt Securities | | | 11.3 | | |
| Mortgage-Backed Securities | | | 12.2 | | |
| U.S. Treasury Securities | | | 3.5 | | |
| Short-Term Investments | | | 3.0 | | |
Liabilities, less cash, receivables and other assets | | | (1.3 | ) | |
| Total | | | 100.0 | % | |
PERFORMANCE HIGHLIGHTS1
| | | Inception | | Average Annual Total Return Ended 12/31/2011 | |
| | | Date | | 1 Year | | 5 Years | | 10 Years | | Life of Fund* | |
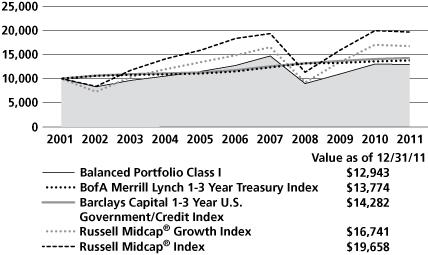
Balanced Portfolio Class I | | | 02/28/1989 | | | | –0.63 | % | | | 0.34 | % | | | 2.61 | % | | | 6.37 | % | |
BofA Merrill Lynch 1-3 Year Treasury Index2 | | | | | | | 1.55 | % | | | 3.69 | % | | | 3.25 | % | | | 5.44 | % | |
Barclays Capital 1-3 Year U.S. Government/ Credit Index2** | | | | | | | 1.59 | % | | | 3.99 | % | | | 3.63 | % | | | 5.65 | % | |
Russell Midcap® Growth Index2 | | | | | | | –1.65 | % | | | 2.44 | % | | | 5.29 | % | | | 9.75 | % | |
Russell Midcap® Index2 | | | | | | | –1.55 | % | | | 1.41 | % | | | 6.99 | % | | | 10.84 | % | |
Performance data quoted represent past performance, and do not indicate future results. The investment return and principal value of an investment will fluctuate so that an investor's shares, when redeemed, may be worth more or less than their original cost. Results are shown on a "total return" basis and include reinvestment of all income dividends and distributions.
Current performance may be lower or higher than the performance data quoted. For performance data current to the most recent month end, please visit https://www.nb.com.
* Index returns are as of the inception date 02/28/1989.
**The Portfolio's broad-based index used for comparison purposes has been changed from the BofA Merrill Lynch 1-3 Year U.S. Treasury Index to the Barclays Capital 1-3 Year U.S. Government/Credit Index because the new index more closely resembles the characteristics of the Portfolio's fixed income investments.
As stated in the Portfolio's most recent prospectus, the total annual operating expense ratio for fiscal year 2010 was 1.93% for Class I shares (prior to any fee waivers or expense reimbursements, if any). The expense ratio net of waivers and/or reimbursements was 1.86% for Class I shares. Neuberger Berman Management LLC has contractually agreed to limit certain expenses of the Portfolio through 12/31/2014.
The results shown in the table do not reflect the effect of taxes an investor would pay on Portfolio distributions or on the redemption of Portfolio shares.
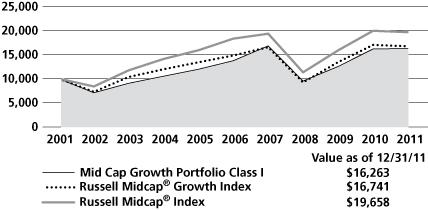
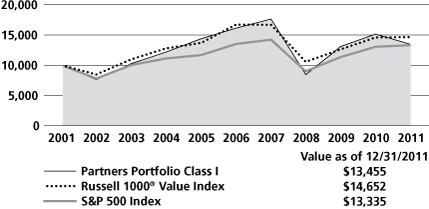
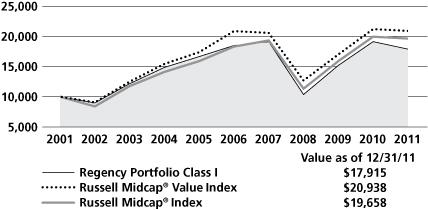
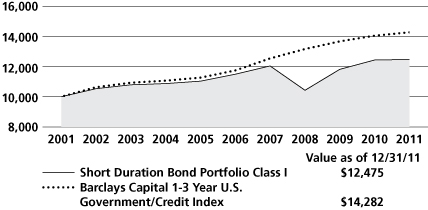
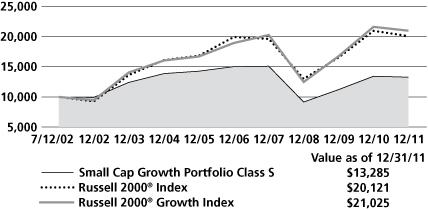
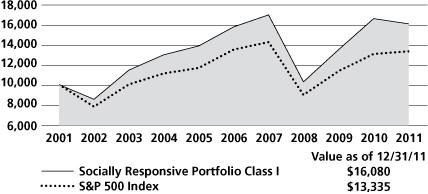
COMPARISON OF A $10,000 INVESTMENT
This graph shows the change in value of a hypothetical $10,000 investment in the Portfolio over the past 10 fiscal years, or since the Portfolio's inception if it has not operated for 10 years. The result is compared with benchmarks, which include a broad-based market index and may include a more narrowly based index. Market indices have not been reduced to reflect any of the fees and costs of investing. All results include the reinvestment of income dividends and distributions. The results shown in the graph do not reflect the effect of taxes an investor would pay on Portfolio distributions or on the redemption of Portfolio shares. Results represent past performance and do not indicate future results
Please see Endnotes for additional information.
Endnotes (Unaudited)
1 "Total Return" includes reinvestment of all income dividends and distributions. Results represent past performance and do not indicate future results. The value of an investment in the Portfolio and the return on the investment both will fluctuate, and redemption proceeds may be higher or lower than an investor's original cost. The performance information does not reflect fees and expenses of the variable annuity and variable life insurance policies or the qualified pension and retirement plans whose proceeds are invested in the Portfolio. Neuberger Berman Management LLC ("NBM LLC") has agreed to absorb certain expenses of the AMT Portfolios, including the Portfolio. Without this arrangement, which is subject to change, the total returns of the Portfolio may have been less.
2 The Russell Midcap® Growth Index measures the performance of those Russell Midcap® Index companies with higher price-to-book ratios and higher forecasted growth values. The Russell Midcap Index measures the performance of the 800 smallest companies in the Russell 1000® Index, which represents approximately 31% of the total market capitalization of the Russell 1000 Index (which, in turn, consists of the 1,000 largest U.S. companies, based on the market capitalization). The Barclays Capital 1-3 Year U.S. Government/Credit Index is an unmanaged index that includes all bonds in the U.S. Government/Credit Index with at least one to three years to maturity. The U.S. Government/Credit Index includes all securities in the Government and Credit Indices. The Government Index includes Treasuries (i.e., public obligations of the U.S. Treasury that have remaining maturities of more than one year) and agencies (i.e., publicly issued debt of U.S. Government agencies, quasi-federal corporations, and corporate or foreign debt guaranteed by the U.S. Government). The Credit Index includes publicly issued U.S. corporate and foreign debentures and secured notes that meet specified maturity, liquidity, and quality requirements. All bonds in the index must meet the following additional criteria: must have at least one year to final maturity regardless of call features; must have at least $250 million par amount outstanding; must be rated investment-grade (Baa3/BBB- or higher) by at least two of the following ratings agencies: Standard & Poor's, Moody's Investors Services, Inc., and Fitch, Inc.; must be fixed rate; must be dollar-denominated and non-convertible; and must be publicly issued. The BofA Merrill Lynch 1-3 Year U.S.Treasury Index is an unmanaged total return market value index consisting of all coupon bearing U.S. Treasury publicly placed debt securities with maturities between 1 to 3 years. The Portfolio's broad-based index used for comparison purposes has been changed from the BofA Merrill Lynch 1-3 Year U.S. Treasury Index to the Barclays Capital 1-3 Year U.S. Government/Credit Index because the new index more closely resembles the characteristics of the Portfolio's fixed income investments. Please note that indices do not take into account any fees and expenses of investing in the individual securities that they track and that individuals cannot invest directly in any index. Data about the performance of these indices are prepared or obtained by NBM LLC and include reinvestment of all income dividends and distributions. The Portfolio may invest in securities not included in the above-described indices and may not invest in all securities included in the above-described indices.
Any ratios or other measurements using a factor of forecasted earnings of a company discussed herein are based on consensus estimates, not NBM LLC's own projections, and they may or may not be realized. In addition, any revision to a forecast could affect the market price of a security. By quoting them herein, NBM LLC does not offer an opinion as to the accuracy of and does not guarantee these forecasted numbers.
The investments for the Portfolio are managed by the same portfolio manager(s) who manage(s) one or more other registered funds that have similar names, investment objectives and investment styles as the Portfolio. You should be aware that the Portfolio is likely to differ from the other mutual funds in size, cash flow pattern and tax matters. Accordingly, the holdings and performance can be expected to vary from those of the other mutual funds.
The composition, industries and holdings of the Portfolio are subject to change.
Shares of the separate AMT Portfolios are not available to the general public. Shares of this Portfolio may be purchased only by life insurance companies to be used with their separate accounts that fund variable annuity and variable life insurance policies and by qualified pension and retirement plans.
Statistics and projections in this report are derived from sources deemed to be reliable but cannot be regarded as a representation of future results of the AMT Portfolios. This report is prepared for the general information of shareholders and is not an offer of shares of the AMT Portfolios. Shares of the AMT Portfolios are sold only through the currently effective prospectuses, which must precede or accompany this report.
The "Neuberger Berman" name and logo are registered service marks of Neuberger Berman Group LLC. "Neuberger Berman Management LLC" and the individual Fund names in this piece are either service marks or registered service marks of Neuberger Berman Management LLC.
© 2012 Neuberger Berman Management LLC distributor. All rights reserved.
4
Information About Your Fund's Expenses (Unaudited)
This table is designed to provide information regarding costs related to your investments. All mutual funds incur operating expenses, which include management fees, fees for administrative services and costs of shareholder reports, among others. The following examples are based on an investment of $1,000 made at the beginning of the six month period ended December 31, 2011 and held for the entire period. The table illustrates the fund's costs in two ways:
| Actual Expenses and Performance: | | The first section of the table provides information about actual account values and actual expenses in dollars, based on the fund's actual performance during the period. You may use the information in this line, together with the amount you invested, to estimate the expenses you paid over the period. Simply divide your account value by $1,000 (for example, an $8,600 account value divided by $1,000 = 8.6), then multiply the result by the number in the first section of the table under the heading entitled "Expenses Paid During the Period" to estimate the expenses you paid over the period. | |
| |
Hypothetical Example for Comparison Purposes: | | The second section of the table provides information about hypothetical account values and hypothetical expenses based on the fund's actual expense ratio and an assumed rate of return at 5% per year before expenses. This return is not the fund's actual return. The hypothetical account values and expenses may not be used to estimate the actual ending account balance or expenses you paid for the period. You may use this information to compare the ongoing costs of investing in this fund versus other funds. To do so, compare the expenses shown in this 5% hypothetical example with the 5% hypothetical examples that appear in the shareholder reports of other funds. | |
| |
Please note that the expenses in the table are meant to highlight your ongoing costs only. The table and expense example do not include any transaction costs, such as fees and expenses that are, or may be, imposed under your variable contract or qualified pension plan. Therefore, the information under the heading "Hypothetical (5% annual return before expenses)" is useful in comparing ongoing costs only, and will not help you determine the relative total costs of owning different funds. In addition, if these transaction costs were included, your costs would have been higher.
Expense Information as of 12/31/11
NEUBERGER BERMAN ADVISERS MANAGEMENT TRUST BALANCED PORTFOLIO
| Actual | | Beginning Account Value 7/1/11 | | Ending Account Value 12/31/11 | | Expenses Paid During the Period* 7/1/11 – 12/31/11 | |
| Class I | | $ | 1,000.00 | | | $ | 936.20 | | | $ | 9.03 | | |
| Hypothetical (5% annual return before expenses)** | |
| Class I | | $ | 1,000.00 | | | $ | 1,015.88 | | | $ | 9.40 | | |
* Expenses are equal to the annualized expense ratio of 1.85%, multiplied by the average account value over the period, multiplied by 184/365 (to reflect the one-half year period shown).
** Hypothetical 5% annual return before expenses is calculated by multiplying the number of days in the most recent half year divided by 365.
Schedule of Investments Balanced Portfolio
| NUMBER OF SHARES | | | | VALUE† | |
| Common Stocks (66.5%) | | | |
| Aerospace & Defense (2.0%) | | | |
| | 2,500 | | | BE Aerospace | | $ | 96,775 | * | |
| | 1,562 | | | HEICO Corp. | | | 91,346 | | |
| | 700 | | | Precision Castparts | | | 115,353 | | |
| | | | 303,474 | | |
| Auto Components (1.4%) | | | |
| | 1,250 | | | BorgWarner, Inc. | | | 79,675 | * | |
| | 4,500 | | | Gentex Corp. | | | 133,155 | | |
| | | | 212,830 | | |
| Beverages (0.3%) | | | |
| | 1,000 | | | Beam, Inc. | | | 51,230 | | |
| Biotechnology (1.5%) | | | |
| | 2,750 | | | Alexion Pharmaceuticals | | | 196,625 | * | |
| | 1,000 | | | Cepheid, Inc. | | | 34,410 | * | |
| | | | 231,035 | | |
| Building Products (0.3%) | | | |
| | 2,500 | | | Fortune Brands Home & Security | | | 42,575 | * | |
| Capital Markets (0.8%) | | | |
| | 1,300 | | | Affiliated Managers Group | | | 124,735 | * | |
| Chemicals (1.9%) | | | |
| | 2,000 | | | Airgas, Inc. | | | 156,160 | | |
| | 1,150 | | | Ashland Inc. | | | 65,734 | | |
| | 1,000 | | | Sigma-Aldrich | | | 62,460 | | |
| | | | 284,354 | | |
| Commercial Services & Supplies (1.3%) | | | |
| | 2,500 | | | Stericycle, Inc. | | | 194,800 | * | |
| Communications Equipment (0.7%) | | | |
| | 1,500 | | | Acme Packet | | | 46,365 | * | |
| | 550 | | | F5 Networks | | | 58,366 | * | |
| | | | 104,731 | | |
| Diversified Financial Services (1.2%) | | | |
| | 1,000 | | | IntercontinentalExchange Inc. | | | 120,550 | * | |
| | 1,750 | | | MSCI Inc. Class A | | | 57,628 | * | |
| | | | 178,178 | | |
| Electrical Equipment (2.8%) | | | |
| | 3,500 | | | AMETEK, Inc. | | | 147,350 | | |
| | 1,150 | | | Polypore International | | | 50,589 | * | |
| | 1,750 | | | Roper Industries | | | 152,022 | | |
| NUMBER OF SHARES | | | | VALUE† | |
| | 2,750 | | | Sensata Technologies Holding | | $ | 72,270 | * | |
| | | | 422,231 | | |
Electronic Equipment, Instruments & Components (1.7%) | | | |
| | 2,000 | | | National Instruments | | | 51,900 | | |
| | 3,800 | | | Trimble Navigation | | | 164,920 | * | |
| | 1,250 | | | Universal Display | | | 45,862 | * | |
| | | | 262,682 | | |
| Energy Equipment & Services (3.6%) | | | |
| | 700 | | | Cameron International | | | 34,433 | * | |
| | 1,250 | | | CARBO Ceramics | | | 154,163 | | |
| | 1,700 | | | Core Laboratories | | | 193,715 | | |
| | 2,250 | | | Oil States International | | | 171,832 | * | |
| | | | 554,143 | | |
| Food & Staples Retailing (0.6%) | | | |
| | 1,350 | | | Whole Foods Market | | | 93,933 | | |
| Food Products (0.7%) | | | |
| | 1,600 | | | Mead Johnson Nutrition | | | 109,968 | | |
| Health Care Equipment & Supplies (2.1%) | | | |
| | 800 | | | Edwards Lifesciences | | | 56,560 | * | |
| | 250 | | | Intuitive Surgical | | | 115,752 | * | |
| | 4,000 | | | NxStage Medical | | | 71,120 | * | |
| | 3,550 | | | Volcano Corp. | | | 84,455 | * | |
| | | | 327,887 | | |
| Health Care Providers & Services (2.5%) | | | |
| | 2,250 | | | Catalyst Health Solutions | | | 117,000 | * | |
| | 1,100 | | | DaVita, Inc. | | | 83,391 | * | |
| | 5,850 | | | HMS Holdings | | | 187,083 | * | |
| | | | 387,474 | | |
| Health Care Technology (1.5%) | | | |
| | 2,800 | | | Cerner Corp. | | | 171,500 | * | |
| | 1,500 | | | Quality Systems | | | 55,485 | | |
| | | | 226,985 | | |
| Hotels, Restaurants & Leisure (2.0%) | | | |
| | 4,000 | | | Arcos Dorados Holdings Class A | | | 82,120 | | |
| | 300 | | | Chipotle Mexican Grill | | | 101,322 | * | |
| | 1,200 | | | Starwood Hotels & Resorts Worldwide | | | 57,564 | | |
| | 550 | | | Wynn Resorts | | | 60,769 | | |
| | | | 301,775 | | |
| Household Products (0.7%) | | | |
| | 2,500 | | | Church & Dwight | | | 114,400 | | |
See Notes to Schedule of Investments
6
| NUMBER OF SHARES | | | | VALUE† | |
| Internet Software & Services (0.8%) | | | |
| | 2,750 | | | Rackspace Hosting | | $ | 118,278 | * | |
| IT Services (1.6%) | | | |
| | 1,750 | | | Cognizant Technology Solutions Class A | | | 112,543 | * | |
| | 3,750 | | | VeriFone Systems | | | 133,200 | * | |
| | | | 245,743 | | |
| Life Science Tools & Services (0.4%) | | | |
| | 750 | | | Waters Corp. | | | 55,538 | * | |
| Machinery (2.7%) | | | |
| | 1,000 | | | Cummins Inc. | | | 88,020 | | |
| | 2,000 | | | Donaldson Co. | | | 136,160 | | |
| | 800 | | | Joy Global | | | 59,976 | | |
| | 2,250 | | | Pall Corp. | | | 128,587 | | |
| | | | 412,743 | | |
| Media (0.9%) | | | |
| | 1,150 | | | AMC Networks Class A | | | 43,217 | * | |
| | 2,200 | | | Discovery Communications Class A | | | 90,134 | * | |
| | | | 133,351 | | |
| Metals & Mining (0.3%) | | | |
| | 1,150 | | | Agnico-Eagle Mines | | | 41,768 | | |
| Multiline Retail (2.1%) | | | |
| | 2,500 | | | Dollar Tree | | | 207,775 | * | |
| | 2,400 | | | Nordstrom, Inc. | | | 119,304 | | |
| | | | 327,079 | | |
| Oil, Gas & Consumable Fuels (3.8%) | | | |
| | 1,350 | | | Cabot Oil & Gas | | | 102,465 | | |
| | 1,750 | | | Concho Resources | | | 164,062 | * | |
| | 4,500 | | | Denbury Resources | | | 67,950 | * | |
| | 1,200 | | | Laredo Petroleum Holdings | | | 26,760 | * | |
| | 1,250 | | | Oasis Petroleum | | | 36,363 | * | |
| | 2,250 | | | QEP Resources | | | 65,925 | | |
| | 1,550 | | | SM Energy | | | 113,305 | | |
| | | | 576,830 | | |
| Pharmaceuticals (2.7%) | | | |
| | 1,500 | | | Medicis Pharmaceutical Class A | | | 49,875 | | |
| | 1,750 | | | Perrigo Co. | | | 170,275 | | |
| | 1,500 | | | Salix Pharmaceuticals | | | 71,775 | * | |
| | 2,000 | | | Watson Pharmaceuticals | | | 120,680 | * | |
| | | | 412,605 | | |
| Professional Services (1.4%) | | | |
| | 2,000 | | | Nielsen Holdings | | | 59,380 | * | |
| | 3,800 | | | Verisk Analytics Class A | | | 152,494 | * | |
| | | | 211,874 | | |
| NUMBER OF SHARES | | | | VALUE† | |
Real Estate Management & Development (0.6%) | | | |
| | 1,500 | | | Jones Lang LaSalle | | $ | 91,890 | | |
| Road & Rail (0.7%) | | | |
| | 2,500 | | | J.B. Hunt Transport Services | | | 112,675 | | |
Semiconductors & Semiconductor Equipment (2.1%) | | | |
| | 1,500 | | | Altera Corp. | | | 55,650 | | |
| | 4,300 | | | Avago Technologies | | | 124,098 | | |
| | 2,750 | | | Cavium Inc. | | | 78,182 | * | |
| | 1,750 | | | Microchip Technology | | | 64,103 | | |
| | | | 322,033 | | |
| Software (6.6%) | | | |
| | 2,500 | | | ANSYS, Inc. | | | 143,200 | * | |
| | 1,900 | | | Ariba, Inc. | | | 53,352 | * | |
| | 2,150 | | | Check Point Software Technologies | | | 112,961 | * | |
| | 1,900 | | | Citrix Systems | | | 115,368 | * | |
| | 1,750 | | | Electronic Arts | | | 36,050 | * | |
| | 3,550 | | | Informatica Corp. | | | 131,101 | * | |
| | 2,250 | | | MICROS Systems | | | 104,805 | * | |
| | 3,500 | | | QLIK Technologies | | | 84,700 | * | |
| | 1,500 | | | Red Hat | | | 61,935 | * | |
| | 800 | | | Salesforce.com, Inc. | | | 81,168 | * | |
| | 1,700 | | | Solera Holdings | | | 75,718 | | |
| | 1,000 | | | Zynga Inc. | | | 9,410 | * | |
| | | | 1,009,768 | | |
| Specialty Retail (4.8%) | | | |
| | 2,400 | | | Bed Bath & Beyond | | | 139,128 | * | |
| | 2,900 | | | Dick's Sporting Goods | | | 106,952 | | |
| | 1,500 | | | DSW Inc. Class A | | | 66,315 | | |
| | 1,900 | | | O'Reilly Automotive | | | 151,905 | * | |
| | 3,800 | | | Ross Stores | | | 180,614 | | |
| | 1,350 | | | Tractor Supply | | | 94,702 | | |
| | | | 739,616 | | |
| Textiles, Apparel & Luxury Goods (1.4%) | | | |
| | 1,750 | | | Coach, Inc. | | | 106,820 | | |
| | 1,500 | | | PVH Corp. | | | 105,735 | | |
| | | | 212,555 | | |
| Trading Companies & Distributors (2.1%) | | | |
| | 5,200 | | | Fastenal Co. | | | 226,772 | | |
| | 1,400 | | | MSC Industrial Direct Class A | | | 100,170 | | |
| | | | 326,942 | | |
| Wireless Telecommunication Services (1.9%) | | | |
| | 1,900 | | | American Tower Class A | | | 114,019 | | |
| | 4,100 | | | SBA Communications Class A | | | 176,136 | * | |
| | | | 290,155 | | |
| | | | | Total Common Stocks (Cost $7,142,244) | | | 10,170,863 | | |
See Notes to Schedule of Investments
7
| PRINCIPAL AMOUNT | | | | VALUE† | |
| U.S. Treasury Securities-Backed by the Full Faith and Credit of the U.S. Government (3.5%) | | | |
| $ | 100,000 | | | U.S. Treasury Notes, 2.00%, due 11/30/13 | | $ | 103,301 | | |
| | 405,000 | | | U.S. Treasury Notes, 2.13%, due 11/30/14 | | | 425,376 | | |
| | | | | Total U.S. Treasury Securities-Backed by the Full Faith and Credit of the U.S. Government (Cost $527,342) | | | 528,677 | | |
| Mortgage-Backed Securities (12.2%) | | | |
| Adjustable Alt-B Mixed Balance (0.4%) | | | |
| | 81,354 | | | Lehman XS Trust, Floating Rate, Ser. 2005-1, Class 2A1, 1.76%, due 7/25/35 | | | 58,625 | µ | |
| Adjustable Jumbo Balance (0.9%) | | | |
| | 189,801 | | | GMAC Mortgage Corp. Loan Trust, Ser. 2006-AR1, Class 1A1, 3.03%, due 4/19/36 | | | 129,634 | µ | |
| Adjustable Mixed Balance (1.9%) | | | |
| | 189,918 | | | Credit Suisse First Boston Mortgage Securities Corp., Ser. 2004-AR4, Class 2A1, 2.70%, due 5/25/34 | | | 149,076 | µ | |
| | 188,792 | | | First Horizon Mortgage Pass-Through Trust, Ser. 2005-AR5, Class 2A1, 2.62%, due 11/25/35 | | | 139,019 | µ | |
| | 10,569 | | | Harborview Mortgage Loan Trust, Ser. 2004-4, Class 3A, 1.02%, due 6/19/34 | | | 7,772 | µ | |
| | | | 295,867 | | |
| Commercial Mortgage-Backed (4.1%) | | | |
| | 127,706 | | | Bear Stearns Commercial Mortgage Securities, Inc., Ser. 2005-PWR8, Class AAB, 4.58%, due 6/11/41 | | | 130,724 | | |
| | 50,000 | | | Citigroup Commercial Mortgage Trust, Ser. 2006-C4, Class A2, 5.92%, due 3/15/49 | | | 52,604 | µ | |
| | 16,586 | | | Citigroup/Deutsche Bank Commercial Mortgage Trust, Ser. 2006-CD2, Class AAB, 5.53%, due 1/15/46 | | | 17,130 | µ | |
| | 102,362 | | | JP Morgan Chase Commercial Mortgage Securities Corp., Ser. 2011-C3, Class A1, 1.87%, due 2/15/46 | | | 102,638 | ñ | |
| | 64,336 | | | Morgan Stanley Capital I, Ser. 2011-C1, Class A1, 2.60%, due 9/15/47 | | | 65,292 | ñ | |
| | 106,845 | | | Morgan Stanley Capital I, Ser. 2011-C3, Class A1, 2.18%, due 7/15/49 | | | 107,803 | | |
| | 85,000 | | | Wachovia Bank Commercial Mortgage Trust, Ser. 2005-C22, Class A3, 5.46%, due 12/15/44 | | | 86,609 | µ | |
| | 64,641 | | | WF-RBS Commercial Mortgage Trust, Ser. 2011-C2, Class A1, 2.50%, due 2/15/44 | | | 65,830 | ñ | |
| | | | 628,630 | | |
| Mortgage-Backed Non-Agency (0.9%) | | | |
| | 87,492 | | | Countrywide Home Loans, Ser. 2005-R2, Class 2A4, 8.50%, due 6/25/35 | | | 90,039 | ñ | |
| | 43,802 | | | GSMPS Mortgage Loan Trust, Ser. 2005-RP3, Class 1A4, 8.50%, due 9/25/35 | | | 45,745 | ñ | |
| | | | 135,784 | | |
| Fannie Mae (1.6%) | | | |
| | 145,999 | | | Pass-Through Certificates, 4.50%, due 4/1/39 | | | 155,486 | | |
| | 81,683 | | | Whole Loan, Ser. 2004-W8, Class PT, 11.19%, due 6/25/44 | | | 91,714 | µ | |
| | | | 247,200 | | |
| Freddie Mac (2.4%) | | | |
| | 109,638 | | | Pass-Through Certificates, 8.00%, due 11/1/26 | | | 129,529 | | |
| | 80,029 | | | Pass-Through Certificates, 8.50%, due 10/1/30 | | | 95,401 | | |
| | 134,662 | | | Pass-Through Certificates, 4.50%, due 11/1/39 | | | 142,816 | | |
| | | | 367,746 | | |
| | | | | Total Mortgage-Backed Securities (Cost $2,019,159) | | | 1,863,486 | | |
See Notes to Schedule of Investments
8
| PRINCIPAL AMOUNT | | | | VALUE† | |
| Corporate Debt Securities (11.3%) | | | |
| Banks (4.4%) | | | |
| $ | 75,000 | | | Bank of America Corp., Senior Unsecured Notes, 6.25%, due 4/15/12 | | $ | 75,677 | | |
| | 105,000 | | | Citigroup, Inc., Senior Unsecured Notes, 6.00%, due 12/13/13 | | | 108,650 | | |
| | 125,000 | | | Goldman Sachs Group, Inc., Senior Unsecured Notes, 6.60%, due 1/15/12 | | | 125,165 | | |
| | 135,000 | | | JP Morgan Chase & Co., Senior Unsecured Medium-Term Notes, 2.05%, due 1/24/14 | | | 135,102 | | |
| | 110,000 | | | Morgan Stanley, Senior Unsecured Notes, 2.88%, due 1/24/14 | | | 105,357 | | |
| | 125,000 | | | Westpac Banking Corp., Senior Unsecured Notes, 1.85%, due 12/9/13 | | | 125,115 | | |
| | | | 675,066 | | |
| Beverages (0.5%) | | | |
| | 75,000 | | | Anheuser-Busch Cos., Inc., Guaranteed Unsecured Notes, 4.95%, due 1/15/14 | | | 80,828 | | |
| Diversified Financial Services (2.2%) | | | |
| | 85,000 | | | American Express Credit Corp., Senior Unsecured Medium-Term Notes, Ser. C, 5.88%, due 5/2/13 | | | 89,348 | | |
| | 20,000 | | | Caterpillar Financial Services Corp., Senior Unsecured Medium-Term Notes, 1.13%, due 12/15/14 | | | 20,025 | | |
| | 45,000 | | | Caterpillar Financial Services Corp., Senior Unsecured Notes, 1.65%, due 4/1/14 | | | 45,604 | | |
| | 35,000 | | | ERAC USA Finance Co., Guaranteed Notes, 2.25%, due 1/10/14 | | | 34,855 | ñ | |
| | 145,000 | | | General Electric Capital Corp., Senior Unsecured Global Medium-Term Notes, 5.00%, due 4/10/12 | | | 146,784 | | |
| | | | 336,616 | | |
| Food (0.2%) | | | |
| | 31,000 | | | Kraft Foods, Inc., Senior Unsecured Notes, 6.25%, due 6/1/12 | | | 31,675 | | |
| Insurance (0.4%) | | | |
| | 50,000 | | | Berkshire Hathaway Finance Corp., Guaranteed Notes, 1.50%, due 1/10/14 | | | 50,556 | | |
| Media (1.4%) | | | |
| | 65,000 | | | DIRECTTV Holdings LLC, Guaranteed Notes, 4.75%, due 10/1/14 | | | 70,211 | | |
| | 70,000 | | | NBC Universal Media LLC, Senior Unsecured Notes, 2.10%, due 4/1/14 | | | 71,153 | | |
| | 75,000 | | | Time Warner Cable, Inc., Guaranteed Notes, 5.40%, due 7/2/12 | | | 76,691 | | |
| | | | 218,055 | | |
| Mining (0.2%) | | | |
| | 25,000 | | | BHP Billiton Finance USA Ltd., Guaranteed Notes, 1.13%, due 11/21/14 | | | 25,059 | | |
| Office-Business Equipment (0.4%) | | | |
| | 60,000 | | | Xerox Corp., Senior Unsecured Notes, 5.50%, due 5/15/12 | | | 60,995 | | |
| Oil & Gas (0.3%) | | | |
| | 50,000 | | | BP Capital Markets PLC, Guaranteed Notes, 1.70%, due 12/5/14 | | | 50,482 | | |
| Retail (0.4%) | | | |
| | 55,000 | | | Home Depot, Inc., Senior Unsecured Notes, 5.25%, due 12/16/13 | | | 59,725 | | |
| Telecommunications (0.9%) | | | |
| | 70,000 | | | Telefonica Emisiones SAU, Guaranteed Notes, 2.58%, due 4/26/13 | | | 68,306 | | |
| | 70,000 | | | Verizon Communications, Inc., Senior Unsecured Notes, 1.95%, due 3/28/14 | | | 71,446 | | |
| | | | 139,752 | | |
| | | | | Total Corporate Debt Securities (Cost $1,722,953) | | | 1,728,809 | | |
See Notes to Schedule of Investments
9
| PRINCIPAL AMOUNT | | | | VALUE† | |
| Asset-Backed Securities (4.8%) | | | |
| $ | 96,924 | | | ACE Securities Corp. Home Equity Loan Trust, Ser. 2006-OP1, Class A2C, 0.44%, due 4/25/36 | | $ | 64,887 | µ | |
| | 125,641 | | | ACE Securities Corp. Home Equity Loan Trust, Ser. 2006-ASP5, Class A2B, 0.42%, due 10/25/36 | | | 48,486 | µ | |
| | 75,000 | | | Ally Auto Receivables Trust, Ser. 2010-4, Class A3, 0.91%, due 11/17/14 | | | 75,071 | | |
| | 75,000 | | | Ally Auto Receivables Trust, Ser. 2011-1, Class A3, 1.38%, due 1/15/15 | | | 75,472 | | |
| | 200,000 | | | Carrington Mortgage Loan Trust, Ser. 2007-FRE1, Class A3, 0.55%, due 2/25/37 | | | 68,190 | µ | |
| | 175,000 | | | Ford Credit Auto Owner Trust, Ser. 2011-A, Class A3, 0.97%, due 1/15/15 | | | 175,368 | | |
| | 125,000 | | | Hyundai Auto Receivables Trust, Ser. 2011-A, Class A3, 1.16%, due 4/15/15 | | | 125,400 | | |
| | 2,203 | | | Impac Secured Assets Corp., Ser. 2006-3, Class A4, 0.38%, due 11/25/36 | | | 2,170 | µ | |
| | 40,000 | | | Mercedes-Benz Auto Receivables Trust, Ser. 2011-1, Class A3, 0.85%, due 3/16/15 | | | 40,031 | | |
| | 86,823 | | | Residential Asset Mortgage Products, Inc., Ser. 2006-RS1, Class AI2, 0.52%, due 1/25/36 | | | 60,531 | µ | |
| | | | | Total Asset-Backed Securities (Cost $994,209) | | | 735,606 | | |
| NUMBER OF SHARES | | | | | |
| Short-Term Investments (3.0%) | | | |
| | 456,452 | | | State Street Institutional Liquid Reserves Fund Institutional Class (Cost $456,452) | | | 456,452 | | |
| | | | | Total Investments (101.3%) (Cost $12,862,359) | | | 15,483,893 | ## | |
| | | | | Liabilities, less cash, receivables and other assets [(1.3%)] | | | (191,203 | ) | |
| | | | | Total Net Assets (100.0%) | | $ | 15,292,690 | | |
See Notes to Schedule of Investments
10
Notes to Schedule of Investments Balanced Portfolio
† In accordance with Accounting Standards Codification ("ASC") 820 "Fair Value Measurements and Disclosures" ("ASC 820"), all investments held by Neuberger Berman Advisers Management Trust Balanced Portfolio (the "Fund") are carried at the value that Neuberger Berman Management LLC ("Management") believes the Fund would receive upon selling an investment in an orderly transaction to an independent buyer in the principal or most advantageous market for the investment under current market conditions. Various inputs, including the volume and level of activity for the asset or liability in the market, are considered in valuing the Fund's investments, some of which are discussed below. Significant management judgment may be necessary to value investments in accordance with ASC 820.
ASC 820 established a three-tier hierarchy of inputs to create a classification of value measurements for disclosure purposes. The three-tier hierarchy of inputs is summarized in the three broad Levels listed below.
• Level 1 – quoted prices in active markets for identical investments
• Level 2 – other significant observable inputs (including quoted prices for similar investments, interest rates, prepayment speeds, credit risk, amortized cost, etc.)
• Level 3 – significant unobservable inputs (including the Fund's own assumptions in determining the fair value of investments)
The inputs or methodology used for valuing an investment are not necessarily an indication of the risk associated with investing in those securities.
The value of the Fund's investments in equity securities, for which market quotations are readily available, is generally determined by Management by obtaining valuations from an independent pricing service based on the latest sale price quoted on a principal exchange or market for that security (Level 1 inputs). Securities traded primarily on the NASDAQ Stock Market are normally valued by the Fund at the NASDAQ Official Closing Price ("NOCP") provided by NASDAQ each business day. The NOCP is the most recently reported price as of 4:00:02 p.m., Eastern time, unless that price is outside the range of the "inside" bid and asked prices (i.e., the bid and asked prices that dealers quote to each other when trading for their own accounts); in that case, NASDAQ will adjust the price to equal the inside bid or asked price, whichever is closer. Because of delays in reporting trades, the NOCP may not be based on the price of the last trade to occur before the market closes. If there is no reported sale of a security on a particular day, the independent pricing service may value the security based on reported market quotations.
The value of the Fund's investments in debt securities is determined by Management primarily by obtaining valuations from independent pricing services based on readily available bid quotations, or if quotations are not available, by methods which include various considerations based on security type (generally Level 2 inputs). In addition to the consideration of yields or prices of securities of comparable quality, coupon, maturity and type; indications as to values from dealers; and general market conditions, the following is a description of other Level 2 inputs and related valuation techniques used by an independent pricing service to value certain types of debt securities of the Fund:
Corporate Debt Securities. Inputs used to value corporate debt securities generally include relative credit information, observed market movements, sector news, spread to the U.S. Treasury market, and other market information which may include benchmark yields, reported trades, broker-dealer quotes, issuer spreads, benchmark securities, bids, offers, and reference data, such as market research publications, when available ("Other Market Information").
U.S. Treasury Securities. Inputs used to value U.S. Treasury securities generally include quotes from several inter-dealer brokers and Other Market Information.
See Notes to Financial Statements
Notes to Schedule of Investments Balanced Portfolio (cont'd)
Asset-Backed Securities and Mortgage-Backed Securities. Inputs used to value asset-backed securities and mortgage- backed securities generally include models that consider a number of factors, which may include the following: prepayment speeds, cash flows, spread adjustments and Other Market Information.
High Yield Securities. Inputs used to value high yield securities generally include a number of observations of equity and credit default swap curves related to the issuer and Other Market Information.
Management has developed a process to periodically review information provided by independent pricing services for all types of securities.
Investments in State Street Institutional Liquid Reserves Fund Institutional Class are valued using the fund's daily calculated net asset value per share (Level 2 inputs).
If a valuation is not available from an independent pricing service, or if Management has reason to believe that the valuation received does not represent the amount the Fund might reasonably expect to receive on a current sale in an orderly transaction, the Fund seeks to obtain quotations from principal market makers (generally considered Level 3 inputs). If such quotations are not readily available, the security is valued using methods the Neuberger Berman Advisers Management Trust's Board of Trustees (the "Board") has approved on the belief that they reflect fair value. Numerous factors may be considered when determining the fair value of a security based on Level 2 or 3 inputs, including available analyst, media or other reports, trading in futures or ADRs and whether the issuer of the security being fair valued has other securities outstanding.
The value of the Fund's investments in foreign securities is generally determined using the same valuation methods and inputs as other Fund investments, as discussed above. Foreign security prices expressed in local currency values are translated from the local currency into U.S. dollars using the exchange rates as of 4:00 p.m., Eastern time. The Board has approved the use of Interactive Data Pricing and Reference Data, Inc. ("Interactive") to assist in determining the fair value of foreign equity securities when changes in the value of a certain index suggest that the closing prices on the foreign exchanges may no longer represent the amount that the Fund could expect to receive for those securities. In this event, Interactive will provide adjusted prices for certain foreign equity securities using a statistical analysis of historical correlations of multiple factors (Level 2 inputs). In the absence of precise information about the market values of these foreign securities as of the close of the New York Stock Exchange, the Board has determined on the basis of available data that prices adjusted in this way are likely to be closer to the prices the Fund could realize on a current sale than are the prices of those securities established at the close of the foreign markets in which the securities primarily trade.
Fair value prices are necessarily estimates, and there is no assurance that such a price will be at or close to the price at which the security is next quoted or next trades.
The following is a summary, categorized by Level, of inputs used to value the Fund's investments as of December 31, 2011:
| Asset Valuation Inputs | | Level 1 | | Level 2 | | Level 3 | | Total | |
| Investments: | |
| Common Stocks^ | | $ | 10,170,863 | | | $ | — | | | $ | — | | | $ | 10,170,863 | | |
U.S. Treasury Securities-Backed by the Full Faith and Credit of the U.S. Government | | | — | | | | 528,677 | | | | — | | | | 528,677 | | |
| Mortgage-Backed Securities^ | | | — | | | | 1,863,486 | | | | — | | | | 1,863,486 | | |
| Corporate Debt Securities^ | | | — | | | | 1,728,809 | | | | — | | | | 1,728,809 | | |
| Asset-Backed Securities | | | — | | | | 735,606 | | | | — | | | | 735,606 | | |
| Short-Term Investments | | | — | | | | 456,452 | | | | — | | | | 456,452 | | |
| Total Investments | | $ | 10,170,863 | | | $ | 5,313,030 | | | $ | — | | | $ | 15,483,893 | | |
See Notes to Financial Statements
12
Notes to Schedule of Investments Balanced Portfolio (cont'd)
^ The Schedule of Investments provides information on the industry categorization for the portfolio.
The Fund had no significant transfers between Levels 1 and 2 during the year ended December 31, 2011.
## At December 31, 2011, the cost of investments for U.S. federal income tax purposes was $12,934,797. Gross unrealized appreciation of investments was $3,235,540 and gross unrealized depreciation of investments was $686,444, resulting in net unrealized appreciation of $2,549,096, based on cost for U.S. federal income tax purposes.
* Security did not produce income during the last twelve months.
µ Floating rate securities are securities whose yields vary with a designated market index or market rate. These securities are shown at their current rates as of December 31, 2011 and their final maturity dates.
ñ Restricted security subject to restrictions on resale under federal securities laws. These securities may be resold in transactions exempt from registration, normally to qualified institutional buyers under Rule 144A under the Securities Act of 1933, as amended, and have been deemed by the investment manager to be liquid. At December 31, 2011, these securities amounted to $404,399 or 2.6% of net assets for the Fund.
See Notes to Financial Statements
13
Statement of Assets and Liabilities
Neuberger Berman Advisers Management Trust
| | | BALANCED PORTFOLIO | |
| | | December 31, 2011 | |
| Assets | |
| Investments in securities, at value* (Note A)—see Schedule of Investments: | |
| Unaffiliated issuers | | $ | 15,483,893 | | |
| Cash | | | 1,098 | | |
| Foreign currency | | | 10,245 | | |
| Dividends and interest receivable | | | 57,425 | | |
| Receivable for securities sold | | | 13,929 | | |
| Receivable for Fund shares sold | | | 2 | | |
| Receivable from Management—net (Note B) | | | 784 | | |
| Prepaid expenses and other assets | | | 8,329 | | |
| Total Assets | | | 15,575,705 | | |
| Liabilities | |
| Payable for securities purchased | | | 218,318 | | |
| Payable for Fund shares redeemed | | | 3,053 | | |
| Payable to investment manager (Note B) | | | 7,194 | | |
| Accrued expenses and other payables | | | 54,450 | | |
| Total Liabilities | | | 283,015 | | |
| Net Assets at value | | $ | 15,292,690 | | |
| Net Assets consist of: | |
| Paid-in capital | | $ | 14,368,379 | | |
| Accumulated net realized gains (losses) on investments | | | (1,697,781 | ) | |
| Net unrealized appreciation (depreciation) in value of investments | | | 2,622,092 | | |
| Net Assets at value | | $ | 15,292,690 | | |
| Shares Outstanding ($.001 par value; unlimited shares authorized) | | | 1,457,145 | | |
| Net Asset Value, offering and redemption price per share | | $ | 10.49 | | |
| *Cost of Investments: | |
| Unaffiliated issuers | | $ | 12,862,359 | | |
| Total cost of foreign currency | | $ | 9,687 | | |
See Notes to Financial Statements
14
Statement of Operations
Neuberger Berman Advisers Management Trust
| | | BALANCED PORTFOLIO | |
| | | For the Year Ended December 31, 2011 | |
| Investment Income: | |
| Income (Note A): | |
| Dividend income—unaffiliated issuers | | $ | 51,270 | | |
| Interest income—unaffiliated issuers | | | 131,317 | | |
| Foreign taxes withheld | | | (272 | ) | |
| Total income | | $ | 182,315 | | |
| Expenses: | |
| Investment management fees (Note B) | | | 92,052 | | |
| Administration fees (Note B) | | | 50,210 | | |
| Audit fees | | | 43,985 | | |
| Custodian fees (Note A) | | | 28,341 | | |
| Insurance expense | | | 1,152 | | |
| Legal fees | | | 9,119 | | |
| Registration and filing fees | | | 5,259 | | |
| Reimbursement of expenses previously assumed by Management (Note B) | | | 2,744 | | |
| Shareholder reports | | | 19,444 | | |
| Trustees' fees and expenses | | | 55,586 | | |
| Miscellaneous | | | 1,825 | | |
| Total expenses | | | 309,717 | | |
| Expenses reduced by custodian fee expense offset arrangement (Note A) | | | (6 | ) | |
| Total net expenses | | | 309,711 | | |
| Net investment income (loss) | | $ | (127,396 | ) | |
| Realized and Unrealized Gain (Loss) on Investments (Note A): | |
| Net realized gain (loss) on: | |
| Sales of investment securities of unaffiliated issuers | | | 1,216,775 | | |
| Change in net unrealized appreciation (depreciation) in value of: | |
| Unaffiliated investment securities | | | (1,136,333 | ) | |
| Foreign currency | | | (252 | ) | |
| Net gain (loss) on investments | | | 80,190 | | |
| Net increase (decrease) in net assets resulting from operations | | $ | (47,206 | ) | |
See Notes to Financial Statements
15
Statements of Changes in Net Assets
Neuberger Berman Advisers Management Trust
| | | BALANCED PORTFOLIO | |
| | | Year Ended December 31, 2011 | | Year Ended December 31, 2010 | |
| Increase (Decrease) in Net Assets: | |
| From Operations (Note A): | |
| Net investment income (loss) | | $ | (127,396 | ) | | $ | (60,276 | ) | |
| Net realized gain (loss) on investments | | | 1,216,775 | | | | 289,726 | | |
| Change in net unrealized appreciation (depreciation) of investments | | | (1,136,585 | ) | | | 2,661,938 | | |
| Net increase (decrease) in net assets resulting from operations | | | (47,206 | ) | | | 2,891,388 | | |
| Distributions to Shareholders From (Note A): | |
| Net investment income | | | (49,434 | ) | | | (163,192 | ) | |
| From Fund Share Transactions (Note D): | |
| Proceeds from shares sold | | | 381,133 | | | | 390,902 | | |
| Proceeds from reinvestment of dividends and distributions | | | 49,434 | | | | 163,192 | | |
| Payments for shares redeemed | | | (2,593,182 | ) | | | (2,144,729 | ) | |
| Net increase (decrease) from Fund share transactions | | | (2,162,615 | ) | | | (1,590,635 | ) | |
| Net Increase (Decrease) in Net Assets | | | (2,259,255 | ) | | | 1,137,561 | | |
| Net Assets: | |
| Beginning of year | | | 17,551,945 | | | | 16,414,384 | | |
| End of year | | $ | 15,292,690 | | | $ | 17,551,945 | | |
| Undistributed net investment income (loss) at end of year | | $ | — | | | $ | 44,371 | | |
See Notes to Financial Statements
16
Notes to Financial Statements Balanced Portfolio
Note A—Summary of Significant Accounting Policies:
1 General: The Fund is a separate operating series of Neuberger Berman Advisers Management Trust (the "Trust"), a Delaware statutory trust organized pursuant to a Trust Instrument dated May 23, 1994. The Trust is currently comprised of ten separate operating series (each individually a "Series," and collectively the "Funds") each of which is diversified. The Trust is registered as an open-end management investment company under the Investment Company Act of 1940, as amended (the "1940 Act"), and its shares are registered under the Securities Act of 1933, as amended. The Fund currently offers only Class I shares. The Board may establish additional series or classes of shares without the approval of shareholders.
The assets of each Series belong only to that Series, and the liabilities of each Series are borne solely by that Series and no other.
The preparation of financial statements in accordance with U.S. generally accepted accounting principles ("GAAP") requires Management to make estimates and assumptions at the date of the financial statements. Actual results could differ from those estimates.
2 Portfolio valuation: Investment securities are valued as indicated in the notes following the Schedule of Investments.
3 Foreign currency translation: The accounting records of the Fund are maintained in U.S. dollars. Foreign currency amounts are translated into U.S. dollars using the exchange rate as of 4:00 p.m., Eastern time, to determine the value of investments, other assets and liabilities. Purchase and sale prices of securities, and income and expenses, are translated into U.S. dollars at the prevailing rate of exchange on the respective dates of such transactions. Net unrealized foreign currency gain (loss), if any, arises from changes in the value of assets and liabilities, other than investments in securities, as a result of changes in exchange rates and is stated separately in the Statement of Operations.
4 Securities transactions and investment income: Securities transactions are recorded on trade date for financial reporting purposes. Dividend income is recorded on the ex-dividend date or, for certain foreign dividends, as soon as the Fund becomes aware of the dividends. Non-cash dividends included in dividend income, if any, are recorded at the fair market value of the securities received. Interest income, including accretion of discount (adjusted for original issue discount, where applicable), and accretion of market discount on long-term bonds and short-term investments, if any, is recorded on the accrual basis. Realized gains and losses from securities transactions and foreign currency transactions, if any, are recorded on the basis of identified cost and stated separately in the Statement of Operations. Included in net realized gain (loss) on investments are proceeds from the settlements of class action litigation in which the Fund participated as a class member. The amount of such proceeds for the year ended December 31, 2011 was $12,049.
5 Income tax information: The Funds are treated as separate entities for U.S. federal income tax purposes. It is the policy of the Fund to continue to qualify as a regulated investment company by complying with the requirements of the U.S. Internal Revenue Code applicable to regulated investment companies and to distribute substantially all of its earnings to its shareholders. To the extent the Fund distributes substantially all of its earnings to shareholders, no federal income or excise tax provision is required.
The Fund has adopted the provisions of ASC 740 "Income Taxes" ("ASC 740"). ASC 740 sets forth a minimum threshold for financial statement recognition of a tax position taken, or expected to be taken, in a tax return. The Fund recognizes interest and penalties, if any, related to unrecognized tax positions as an income tax expense in the Statement of Operations. The Fund is subject to examination by U.S. federal and state tax authorities for returns filed for the prior three fiscal years 2008 - 2010. As of December 31, 2011, the Fund did not have any unrecognized tax positions.
17
Income distributions and capital gain distributions are determined in accordance with income tax regulations, which may differ from GAAP. These differences are primarily due to differing treatments of income and gains on various investment securities held by the Fund, timing differences and differing characterization of distributions made by the Fund as a whole. The Fund may also utilize earnings and profits distributed to shareholders on redemption of shares as a part of the dividends paid deduction for income tax purposes.
As determined on December 31, 2011, permanent differences resulting primarily from different book and tax accounting for net operating losses, paydown gains and losses, amortization of bond premium, non-taxable dividend adjustments to income, passive foreign investment company gains and losses and distributions in excess of earnings, were reclassified at fiscal year-end. These reclassifications had no effect on net income, net asset value ("NAV") or NAV per share of the Fund. For the year ended December 31, 2011, the Fund recorded the following permanent reclassifications:
| Paid-in Capital | | Undistributed Net Investment Income (Loss) | | Accumulated Net Realized Gains (Losses) on Investments | |
| $ | (76,670 | ) | | $ | 132,459 | | | $ | (55,789 | ) | |
For tax purposes, short-term gains are considered ordinary income.
The tax character of distributions paid during the years ended December 31, 2011 and December 31, 2010 was as follows:
| Distributions Paid From: | |
| Ordinary Income | | Total | |
| 2011 | | 2010 | | 2011 | | 2010 | |
| $ | 49,434 | | | $ | 163,192 | | | $ | 49,434 | | | $ | 163,192 | | |
As of December 31, 2011, the components of distributable earnings (accumulated losses) on a U.S. federal income tax basis were as follows:
Undistributed Ordinary Income | | Unrealized Appreciation (Depreciation) | | Loss Carryforwards and Deferrals | | Other Temporary Differences | | Total | |
| $ | — | | | $ | 2,549,654 | | | $ | (1,625,343 | ) | | $ | — | | | $ | 924,311 | | |
The difference between book basis and tax basis distributable earnings is attributable primarily to timing differences of wash sales, amortization of bond premium, return of capital adjustments for securities sold and capital loss carryforwards.
To the extent the Fund's net realized capital gains, if any, can be offset by capital loss carryforwards, it is the policy of the Fund not to distribute such gains. The Regulated Investment Company ("RIC") Modernization Act of 2010 (the "Act") became effective for the Fund on January 1, 2011. The Act modernizes several of the federal income and excise tax provisions related to RICs. Among the changes made are changes to the capital loss carryforward rules allowing for RICs to carry forward capital losses indefinitely and to retain the character of capital loss carryforwards as short-term or long-term ("Post-Enactment"). Rules in effect previously limited the carryforward period to eight years and all carryforwards were considered short-term in character ("Pre-Enactment"). As determined at December 31, 2011, the Fund had unused capital loss carryforwards available for federal income tax purposes to offset net realized capital gains, if any, as follows:
| | | Pre-Enactment | | Post-Enactment (No Expiration Date) | |
| | | Expiring in: 2017 | | Long-Term | | Short-Term | |
| | | | | $ | 1,625,343 | | | $ | — | | | $ | — | | |
18
Post-Enactment capital loss carryforwards must be fully used before Pre-Enactment capital loss carryforwards; therefore, under certain circumstances, Pre-Enactment capital loss carryforwards available as of the report date may expire unused.
During the year ended December 31, 2011, the Fund utilized capital loss carryforwards of $1,097,689.
6 Distributions to shareholders: The Fund may earn income, net of expenses, daily on its investments. Distributions from net investment income and net realized capital gains, if any, generally are distributed once a year (usually in October). Income distributions and capital gain distributions to shareholders are recorded on the ex-date.
7 Foreign taxes: Foreign taxes withheld represent amounts withheld by foreign tax authorities, net of refunds recoverable.
8 Expense allocation: Certain expenses are applicable to multiple funds. Expenses directly attributable to a Series are charged to that Series. Expenses of the Trust that are not directly attributable to a particular series of the Trust (e.g., the Fund) are allocated among the series of the Trust, on the basis of relative net assets, except where a more appropriate allocation of expenses to each of the series can otherwise be made fairly. Expenses borne by the complex of related investment companies, which includes open-end and closed-end investment companies for which Management serves as investment manager, that are not directly attributable to a particular investment company in the complex (e.g., the Trust) or series thereof are allocated among the investment companies in the complex or series thereof, on the basis of relative net assets, except where a more appropriate allocation of expenses to each of the investment companies in the complex or series thereof can otherwise be made fairly.
9 Dollar rolls: The Fund may enter into dollar roll transactions with respect to mortgage-backed securities. In a dollar roll transaction, the Fund sells securities for delivery in the current month and simultaneously agrees to repurchase substantially similar (i.e., same type and coupon) securities on a specified future date from the same party. During the period before this repurchase, the Fund foregoes principal and interest payments on the securities. The Fund is compensated by the difference between the current sales price and the forward price for the future purchase (often referred to as the "drop"), as well as by the interest earned on the cash proceeds of the initial sale. Dollar rolls may increase fluctuations in the Fund's NAV and may be viewed as a form of leverage. There is a risk that the counterparty will be unable or unwilling to complete the transaction as scheduled, which may result in losses to the Fund.
10 Investments in foreign securities: Investing in foreign securities may involve certain sovereign and other risks, in addition to the credit and market risks normally associated with domestic securities. These additional risks include the possibility of adverse political and economic developments (including political instability, nationalization, expropriation, or confiscatory taxation) and the potentially adverse effects of unavailability of public information regarding issuers, less governmental supervision and regulation of financial markets, reduced liquidity of certain financial markets, and the lack of uniform accounting, auditing, and financial reporting standards or the application of standards that are different or less stringent than those applied in the United States. Foreign securities also may experience greater price volatility, higher rates of inflation, and delays in settlement.
11 Derivative instruments: The Fund has adopted the provisions of ASC 815 "Derivatives and Hedging" ("ASC 815"). The disclosure requirements of ASC 815 distinguish between derivatives that qualify for hedge accounting and those that do not. Because investment companies value their derivatives at fair value and recognize changes in fair value through the Statement of Operations, they do not qualify for hedge accounting. Accordingly, even though a Fund's investments in derivatives may represent economic hedges, they are considered non-hedge transactions for purposes of this disclosure.
Financial futures contracts: At the time the Fund enters into a financial futures contract, it is required to deposit with the futures commission merchant a specified amount of cash or liquid securities, known as "initial margin," which is a percentage of the value of the financial futures contract being traded that is set by the exchange upon which the futures contract is traded. Each day, the futures contract is valued at the official settlement price of the board of trade or U.S. commodity exchange on which such futures contract is traded. Subsequent payments,
19
known as "variation margin," to and from the broker are made on a daily basis, as the market price of the financial futures contract fluctuates. Daily variation margin adjustments, arising from this "mark to market," are recorded by the Fund as unrealized gains or losses.
Although some financial futures contracts by their terms call for actual delivery or acceptance of financial instruments, in most cases the contracts are closed out prior to delivery by offsetting purchases or sales of matching financial futures contracts. When the contracts are closed, the Fund recognizes a gain or loss. Risks of entering into futures contracts include the possibility there may be an illiquid market, possibly at a time of rapidly declining prices, and/or a change in the value of the contract may not correlate with changes in the value of the underlying securities. Futures have minimal counterparty risk to the Fund because the exchange's clearinghouse, as counterparty to all exchange traded futures, guarantees the futures against default.
For U.S. federal income tax purposes, the futures transactions undertaken by the Fund may cause the Fund to recognize gains or losses from marking contracts to market even though its positions have not been sold or terminated, may affect the character of the gains or losses recognized as long-term or short-term, and may affect the timing of some capital gains and losses realized by the Fund. Also, the Fund's losses on transactions involving futures contracts may be deferred rather than being taken into account currently in calculating the Fund's taxable income.
During the year ended December 31, 2011, the Fund did not enter into any financial futures contracts.
Management has concluded that the Fund did not hold any derivative instruments during the year ended December 31, 2011 that require additional disclosures pursuant to ASC 815.
12 Indemnifications: Like many other companies, the Trust's organizational documents provide that its officers and trustees are indemnified against certain liabilities arising out of the performance of their duties to the Trust. In addition, both in some of its principal service contracts and in the normal course of its business, the Trust enters into contracts that provide indemnifications to other parties for certain types of losses or liabilities. The Trust's maximum exposure under these arrangements is unknown as this could involve future claims against the Trust.
13 Expense offset arrangement: The Fund has an expense offset arrangement in connection with its custodian contract. For the year ended December 31, 2011, the impact of this arrangement was a reduction of expenses of $6.
Note B—Management Fees, Administration Fees, Distribution Arrangements, and Other Transactions with Affiliates:
Fund shares are issued and redeemed in connection with investments in and payments under certain variable annuity contracts and variable life insurance policies issued through separate accounts of life insurance companies and are also offered directly to certain qualified pension and retirement plans.
The Fund retains Management as its investment manager under a Management Agreement. For such investment management services, the Fund pays Management a fee at the annual rate of 0.55% of the first $250 million of the Fund's average daily net assets, 0.525% of the next $250 million, 0.50% of the next $250 million, 0.475% of the next $250 million, 0.45% of the next $500 million, 0.425% of the next $2.5 billion, and 0.40% of average daily net assets in excess of $4 billion.
The Fund retains Management as its administrator under an Administration Agreement. The Fund pays Management an administration fee at the annual rate of 0.30% of its average daily net assets under this agreement. Additionally, Management retains State Street Bank and Trust Company ("State Street") as its sub-administrator under a Sub-Administration Agreement. Management pays State Street a fee for all services received under this agreement.
The Board adopted a non-fee distribution plan for the Fund.
Management has contractually undertaken through December 31, 2014 to forgo current payment of fees and/or reimburse the Fund for its operating expenses (excluding fees payable to Management, interest, taxes, brokerage
20
commissions, extraordinary expenses, transaction costs and dividend expense on short sales, if any) ("Operating Expenses") which exceed, in the aggregate, 1.00% per annum of the Fund's average daily net assets (the "Expense Limitation"). For the year ended December 31, 2011, no reimbursement to the Fund was required. The Fund has agreed to repay Management through December 31, 2017 for fees and expenses foregone and/or its excess Operating Expenses previously reimbursed by Management, so long as its annual Operating Expenses during that period do not exceed its Expense Limitation, and the repayment is made within three years after the year in which Management issued the reimbursement or waived fees. During the year ended December 31, 2011, the Fund reimbursed Management $2,744, under its contractual expense limitation. At December 31, 2011, contingent liabilities to Management under its contractual expense limitation were as follows:
| Expiring in: | | | |
| 2012 | | 2013 | | Total | |
| $ | 24,624 | | | $ | 11,078 | | | $ | 35,702 | | |
Neuberger Berman LLC ("Neuberger") is retained by Management to furnish it with investment recommendations and research information without added cost to the Fund. Several individuals who are officers and/or trustees of the Trust are also employees of Neuberger and/or Management.
Management and Neuberger are indirect subsidiaries of Neuberger Berman Group LLC ("NBG," and together with its consolidated subsidiaries "NB Group"). The voting equity of NBG is owned by NBSH Acquisition, LLC ("NBSH"), which was formed to facilitate the May 4, 2009 management buyout of the businesses conducted by NB Group, and Lehman Brothers Holdings Inc. ("LBHI"). NBSH, which is owned by portfolio managers, members of the NB Group management team and certain of NB Group's key employees and senior professionals, owns approximately 52% of the voting equity of NBG, and LBHI and certain of its subsidiaries own the remaining 48% of NBG's voting equity.
On December 14, 2011, the United States Bankruptcy Court for the Southern District of New York approved a motion filed by LBHI and certain of its subsidiaries, as debtors and debtors in possession, (collectively, the "Lehman Brothers Estate") that will provide NBG with the opportunity to purchase the Lehman Brothers Estate's interest in preferred and common equity of NBG. The proposed transactions, which are subject to the Lehman Brothers Estate and NBG signing definitive documentation, as well as to market conditions, would, if successfully implemented, enable NBG to have a lower cost capital structure and set it on a path to 100% employee ownership within the next five to six years.
Note C—Securities Transactions:
Cost of purchases and proceeds of sales and maturities of long-term securities for the year ended December 31, 2011 were as follows:
Purchases of U.S. Government and Agency Obligations | | Purchases excluding U.S. Government and Agency Obligations | | Sales and Maturities of U.S. Government and Agency Obligations | | Sales and Maturities excluding U.S. Government and Agency Obligations | |
| $ | 2,258,564 | | | $ | 6,172,553 | | | $ | 3,610,119 | | | $ | 6,835,173 | | |
During the year ended December 31, 2011, no brokerage commissions on securities transactions were paid to affiliated brokers.
21
Note D—Fund Share Transactions:
Share activity for the years ended December 31, 2011 and December 31, 2010 was as follows:
| | | For the Year Ended December 31, | |
| | | 2011 | | 2010 | |
| Shares Sold | | | 35,379 | | | | 40,424 | | |
| Shares Issued on Reinvestment of Dividends and Distributions | | | 4,699 | | | | 16,551 | | |
| Shares Redeemed | | | (240,106 | ) | | | (224,488 | ) | |
| Total | | | (200,028 | ) | | | (167,513 | ) | |
Note E—Line of Credit:
At December 31, 2011, the Fund was a participant in a single committed, unsecured $200,000,000 line of credit with State Street, to be used only for temporary or emergency purposes. Other investment companies managed by Management also participate in this line of credit on the same terms. Interest is charged on borrowings under this line of credit at the higher of (a) the Federal Funds Rate plus 1.25% per annum or (b) the Overnight LIBOR Rate plus 1.25% per annum. A commitment fee of 0.10% (0.125% prior to September 16, 2011) per annum of the available line of credit is charged, of which each participating Fund has agreed to pay its pro rata share, based on the ratio of its individual net assets to the net assets of all participants at the time the fee is due and payable. The fee is paid quarterly in arrears. Because several mutual funds participate, there is no assurance that an individual Fund will have access to all or any part of the $200,000,000 at any particular time. There were no loans outstanding pursuant to this line of credit at December 31, 2011. During the year ended December 31, 2011, the Fund did not utilize this line of credit.
Note F—Recent Accounting Pronouncement:
In May 2011, the Financial Accounting Standards Board ("FASB") issued Accounting Standards Update ("ASU") No. 2011-04 "Amendments to Achieve Common Fair Value Measurement and Disclosure Requirements in U.S. GAAP and International Financial Reporting Standards ("IFRS")." ASU No. 2011-04 amends ASC 820 to establish common requirements for measuring fair value and for disclosing information about fair value measurements in accordance with GAAP and IFRS. It will not affect the fair valuation of the Fund's investments, but rather the quantitative and qualitative disclosures in the financial statements. ASU No. 2011-04 is effective for fiscal years beginning after December 15, 2011 and for interim periods within those fiscal years. Management is currently evaluating the impact of the adoption of ASU No. 2011-04 on the Fund's financial statement disclosures.
22
Financial Highlights
Balanced Portfolio
The following table includes selected data for a share outstanding throughout each year and other performance information derived from the Financial Statements. Per share amounts that round to less than $.01 or $(.01) per share are presented as $.00 or $(.00), respectively.
| | | Year Ended December 31, | |
| | | 2011 | | 2010 | | 2009 | | 2008 | | 2007 | |
| Net Asset Value, Beginning of Year | | $ | 10.59 | | | $ | 9.00 | | | $ | 7.58 | | | $ | 13.08 | | | $ | 11.44 | | |
| Income From Investment Operations: | |
Net Investment Income (Loss)‡ | | | (.08 | ) | | | (.03 | ) | | | .05 | | | | .09 | | | | .12 | | |
Net Gains or Losses on Securities (both realized and unrealized) | | | .01 | | | | 1.72 | | | | 1.65 | | | | (5.17 | ) | | | 1.67 | | |
| Total From Investment Operations | | | (.07 | ) | | | 1.69 | | | | 1.70 | | | | (5.08 | ) | | | 1.79 | | |
| Less Distributions From: | |
| Net Investment Income | | | (.03 | ) | | | (.10 | ) | | | (.28 | ) | | | (.42 | ) | | | (.15 | ) | |
| Net Asset Value, End of Year | | $ | 10.49 | | | $ | 10.59 | | | $ | 9.00 | | | $ | 7.58 | | | $ | 13.08 | | |
Total Return†† | | | (.63 | )% | | | 18.83 | % | | | 22.47 | % | | | (39.15 | )% | | | 15.60 | % | |
| Ratios/Supplemental Data | |
| Net Assets, End of Year (in millions) | | $ | 15.3 | | | $ | 17.6 | | | $ | 16.4 | | | $ | 15.5 | | | $ | 78.4 | | |
Ratio of Gross Expenses to Average Net Assets# | | | 1.85 | % | | | 1.85 | % | | | 1.86 | % | | | 1.29 | % | | | 1.16 | % | |
Ratio of Net Expenses to Average Net Assets§ | | | 1.85 | % | | | 1.85 | % | | | 1.86 | % | | | 1.29 | % | | | 1.16 | % | |
Ratio of Net Investment Income (Loss) to Average Net Assets | | | (.76 | )% | | | (.37 | )% | | | .66 | % | | | .81 | % | | | 1.00 | % | |
| Portfolio Turnover Rate | | | 52 | % | | | 58 | % | | | 85 | % | | | 57 | % | | | 54 | % | |
See Notes to Financial Highlights
23
Notes to Financial Highlights Balanced Portfolio
†† Total return based on per share NAV reflects the effects of changes in NAV on the performance of the Fund during each fiscal period and assumes income dividends and other distributions, if any, were reinvested. Results represent past performance and do not indicate future results. Current returns may be lower or higher than the performance data quoted. Investment returns and principal may fluctuate and shares when redeemed may be worth more or less than original cost. Total return would have been lower if Management had not reimbursed and/or waived certain expenses. Total return would have been higher if Management had not recouped previously reimbursed expenses. The total return information shown does not reflect charges and other expenses that apply to the separate account or the related insurance policies, and the inclusion of these charges and other expenses would reduce the total return for all fiscal periods shown.
# The Fund is required to calculate an expense ratio without taking into consideration any expense reductions related to expense offset arrangements.
‡ Calculated based on the average number of shares outstanding during each fiscal period.
§ After reimbursement and/or waiver of a portion of the investment management fee by Management. Had Management not undertaken such actions, the annualized ratios of net expenses to average net assets would have been:
| | | Year Ended December 31, | |
| | | 2010 | | 2009 | | 2008 | | 2007 | |
| | | | | | 1.92 | % | | | 2.04 | % | | | 1.29 | % | | | 1.16 | % | |
After reimbursement of expenses previously paid by Management. Had the Fund not made such reimbursements, the annualized ratio of net expenses to average daily net assets would have been:
| | | Year Ended December 31, | |
| | | 2011 | |
| | | | | | 1.83 | % | |
24
Report of Independent Registered Public Accounting Firm
To the Board of Trustees of
Neuberger Berman Advisers Management Trust and
Shareholders of Balanced Portfolio
We have audited the accompanying statement of assets and liabilities, including the schedule of investments, of Balanced Portfolio, one of the series constituting Neuberger Berman Advisers Management Trust (the "Trust"), as of December 31, 2011, and the related statement of operations for the year then ended, the statements of changes in net assets for each of the two years in the period then ended, and the financial highlights for each of the five years in the period then ended. These financial statements and financial highlights are the responsibility of the Trust's management. Our responsibility is to express an opinion on these financial statements and financial highlights based on our audits.
We conducted our audits in accordance with the standards of the Public Company Accounting Oversight Board (United States). Those standards require that we plan and perform the audit to obtain reasonable assurance about whether the financial statements and financial highlights are free of material misstatement. We were not engaged to perform an audit of the Trust's internal control over financial reporting. Our audits included consideration of internal control over financial reporting as a basis for designing audit procedures that are appropriate in the circumstances, but not for the purpose of expressing an opinion on the effectiveness of the Trust's internal control over financial reporting. Accordingly, we express no such opinion. An audit also includes examining, on a test basis, evidence supporting the amounts and disclosures in the financial statements and financial highlights, assessing the accounting principles used and significant estimates made by management, and evaluating the overall financial statement presentation. Our procedures included confirmation of securities owned as of December 31, 2011 by correspondence with the custodian and brokers or by other appropriate auditing procedures where replies from brokers were not received. We believe that our audits provide a reasonable basis for our opinion.
In our opinion, the financial statements and financial highlights referred to above present fairly, in all material respects, the financial position of Balanced Portfolio, a series of Neuberger Berman Advisers Management Trust, at December 31, 2011, the results of its operations for the year then ended, the changes in its net assets for each of the two years in the period then ended, and the financial highlights for each of the five years in the period then ended, in conformity with U.S. generally accepted accounting principles.
Boston, Massachusetts
February 10, 2012
25
Trustee and Officer Information
The following tables set forth information concerning the trustees ("Trustees") and officers ("Officers") of the Trust. All persons named as Trustees and Officers also serve in similar capacities for other funds administered or managed by Management, Neuberger and Neuberger Berman Fixed Income LLC ("NBFI"). The Statement of Additional Information includes additional information about Trustees and is available upon request, without charge, by calling (800) 877-9700.
Information about the Board of Trustees
Name, (Year of Birth), and Address(1) | | Position and Length of Time Served(2) | | Principal Occupation(s)(3) | | Number of Funds in Fund Complex Overseen by Fund Trustee | | Other Directorships Held Outside Fund Complex by Fund Trustee | |
| Independent Trustees | |
| |
| John Cannon (1930) | | Trustee since 2000 | | Consultant; formerly, Chairman, CDC Investment Advisers (registered investment adviser), 1993 to January 1999; formerly, President and Chief Executive Officer, AMA Investment Advisors, an affiliate of the American Medical Association. | | | 47 | | | Formerly, Independent Trustee or Director of three series of Oppenheimer Funds: Oppenheimer Limited Term New York Municipal Fund, Rochester Fund Municipals, and Oppenheimer Convertible Securities Fund, 1992 to 2009. | |
| |
| Faith Colish (1935) | | Trustee since 1982 | | Counsel, Carter Ledyard & Milburn LLP (law firm) since October 2002; formerly, Attorney-at-Law and President, Faith Colish, A Professional Corporation, 1980 to 2002. | | | 47 | | | Formerly, Director, 1997 to 2003, and Advisory Director, 2003 to 2006, ABA Retirement Funds (formerly, American Bar Retirement Association) (not-for-profit membership corporation). | |
| |
26
Name, (Year of Birth), and Address(1) | | Position and Length of Time Served(2) | | Principal Occupation(s)(3) | | Number of Funds in Fund Complex Overseen by Fund Trustee | | Other Directorships Held Outside Fund Complex by Fund Trustee | |
| Martha C. Goss (1949) | | Trustee since 2007 | | President, Woodhill Enterprises Inc./Chase Hollow Associates LLC (personal investment vehicle), since 2006; Chief Operating and Financial Officer, Hopewell Holdings LLC/Amwell Holdings, LLC (a holding company for a healthcare reinsurance company start-up), since 2003; formerly, Consultant, Resources Connection (temporary staffing), 2002 to 2006. | | | 47 | | | Director, American Water (water utility), since 2003; Director, Channel Reinsurance (financial guaranty reinsurance), since 2006; Director, Allianz Life of New York (insurance), since 2005; Director, Financial Women's Association of New York (not-for-profit association), since 2003; Trustee Emerita, Brown University, since 1998; formerly, Director, Ocwen Financial Corporation (mortgage servicing), 2005 to 2010; formerly, Advisory Board Member, Attensity (software developer), 2005 to 2007; formerly, Director, Bank Leumi (commercial bank), 2005 to 2007; formerly, Director, Claire's Stores, Inc. (retailer), 2005 to 2007. | |
| |
| C. Anne Harvey (1937) | | Trustee since 1998 | | President, C.A. Harvey Associates, since October 2001; formerly, Director, AARP, 1978 to December 2001. | | | 47 | | | Formerly, President, Board of Associates to The National Rehabilitation Hospital's Board of Directors, 2001 to 2002; formerly, Member, Individual Investors Advisory Committee to the New York Stock Exchange Board of Directors, 1998 to 2002. | |
| |
27
Name, (Year of Birth), and Address(1) | | Position and Length of Time Served(2) | | Principal Occupation(s)(3) | | Number of Funds in Fund Complex Overseen by Fund Trustee | | Other Directorships Held Outside Fund Complex by Fund Trustee | |
| Robert A. Kavesh (1927) | | Trustee since 2000 | | Retired, since 2002; Marcus Nadler Professor Emeritus of Finance and Economics, New York University Stern School of Business; formerly, Executive Secretary-Treasurer, American Finance Association, 1961 to 1979. | | | 47 | | | Formerly, Director, The Caring Community (not-for-profit), 1997 to 2006; formerly, Director, DEL Laboratories, Inc. (cosmetics and pharmaceuticals), 1978 to 2004; formerly, Director, Apple Bank for Savings, 1979 to 1990; formerly, Director, Western Pacific Industries, Inc., (public company), 1972 to 1986. | |
| |
| Michael M. Knetter (1960) | | Trustee since 2007 | | President and Chief Executive Officer, University of Wisconsin Foundation, since October 2010; formerly, Dean, School of Business, University of Wisconsin - Madison; formerly, Professor of International Economics and Associate Dean, Amos Tuck School of Business - Dartmouth College, 1998 to 2002. | | | 47 | | | Director, American Family Insurance (a mutual company, not publicly traded), since March 2009; formerly, Trustee, Northwestern Mutual Series Fund, Inc., 2007 to 2010; formerly, Director, Wausau Paper, 2005 to 2011; formerly, Director, Great Wolf Resorts, 2004 to 2009. | |
| |
| Howard A. Mileaf (1937) | | Trustee since 1999 | | Retired; formerly, Vice President and General Counsel, WHX Corporation (holding company), 1993 to 2001. | | | 47 | | | Formerly, Director, Webfinancial Corporation (holding company), 2002 to 2008; formerly, Director, WHX Corporation (holding company), 2002 to 2005; formerly, Director, State Theatre of New Jersey (not-for-profit theatre), 2000 to 2005. | |
| |
| George W. Morriss (1947) | | Trustee since 2007 | | Retired; formerly, Executive Vice President and Chief Financial Officer, People's Bank, Connecticut (a financial services company), 1991 to 2001. | | | 47 | | | Manager, Larch Lane Multi-Strategy Fund complex (which currently consists of three funds), since 2006; formerly, Member, NASDAQ Issuers' Affairs Committee, 1995 to 2003. | |
| |
28
Name, (Year of Birth), and Address(1) | | Position and Length of Time Served(2) | | Principal Occupation(s)(3) | | Number of Funds in Fund Complex Overseen by Fund Trustee | | Other Directorships Held Outside Fund Complex by Fund Trustee | |
| Edward I. O'Brien (1928) | | Trustee since 2000 | | Private Investor; formerly, Member, Investment Policy Committee, Edward Jones, 1993 to 2001; President, Securities Industry Association ("SIA") (securities industry's representative in government relations and regulatory matters at the federal and state levels), 1974 to 1992; Adviser to SIA, November 1992 to November 1993. | | | 47 | | | Formerly, Director, Legg Mason, Inc. (financial services holding company), 1993 to July 2008; formerly, Director, Boston Financial Group (real estate and tax shelters), 1993 to 1999. | |
| |
| Jack L. Rivkin (1940) | | Trustee since 2002; President, 2002 to 2008 | | Formerly, Executive Vice President and Chief Investment Officer, Neuberger Berman Holdings LLC (holding company), 2002 to August 2008 and 2003 to August 2008, respectively; formerly, Managing Director and Chief Investment Officer, Neuberger, December 2005 to August 2008 and 2003 to August 2008, respectively; formerly, Executive Vice President, Neuberger, December 2002 to 2005; formerly, Director and Chairman, Management, December 2002 to August 2008; formerly, Executive Vice President, Citigroup Investments, Inc., September 1995 to February 2002; formerly, Executive Vice President, Citigroup Inc., September 1995 to February 2002. | | | 47 | | | Director, Idealab (private company), since 2009; Director, Distributed World Power (private company), since 2009; Director, Dale Carnegie and Associates, Inc. (private company), since 1999; Director, Solbright, Inc. (private company), since 1998; Director, SA Agricultural Fund, since 2009; Chairman and Director, Essential Brands (consumer products) since 2008; formerly, Director, New York Society of Security Analysts, 2006 to 2008. | |
| |
29
Name, (Year of Birth), and Address(1) | | Position and Length of Time Served(2) | | Principal Occupation(s)(3) | | Number of Funds in Fund Complex Overseen by Fund Trustee | | Other Directorships Held Outside Fund Complex by Fund Trustee | |
| Cornelius T. Ryan (1931) | | Trustee since 2000 | | General Partner and Adviser, TD2, TD3, and TOF1 Healthcare Venture Capital Partnerships; formerly, Founding General Partner, Oxford Partners and Oxford Bioscience Partners (venture capital investing) and President, Oxford Venture Corporation, 1981 to 2010. | | | 47 | | | Trustee, Norwalk Hospital Foundation, since 2000; Director, Supply Pro (privately held company), since 2008; formerly, Trustee, Norwalk Hospital, 1995 to 2004; formerly, President and Director, Randolph Computer Corp., 1966 to 1984; formerly, Director of numerous privately held portfolio companies of Oxford Partners and Oxford Bioscience Partners, 1981 to 2005. | |
| |
| Tom D. Seip (1950) | | Trustee since 2000; Chairman of the Board since 2008; Lead Independent Trustee from 2006 to 2008 | | General Partner, Ridgefield Farm LLC (a private investment vehicle); formerly, President and CEO, Westaff, Inc. (temporary staffing), May 2001 to January 2002; formerly, Senior Executive, The Charles Schwab Corporation, 1983 to 1998, including Chief Executive Officer, Charles Schwab Investment Management, Inc.; Trustee, Schwab Family of Funds and Schwab Investments, 1997 to 1998; and Executive Vice President-Retail Brokerage, Charles Schwab & Co., Inc., 1994 to 1997. | | | 47 | | | Director, H&R Block, Inc. (financial services company), since May 2001; formerly, Chairman, Compensation Committee, H&R Block, Inc., 2006 to 2010; formerly, Director, Forward Management, Inc. (asset management company), 1999 to 2006. | |
| |
30
Name, (Year of Birth), and Address(1) | | Position and Length of Time Served(2) | | Principal Occupation(s)(3) | | Number of Funds in Fund Complex Overseen by Fund Trustee | | Other Directorships Held Outside Fund Complex by Fund Trustee | |
| Candace L. Straight (1947) | | Trustee since 1999 | | Private investor and consultant specializing in the insurance industry; formerly, Advisory Director, Securitas Capital LLC (a global private equity investment firm dedicated to making investments in the insurance sector), 1998 to December 2003. | | | 47 | | | Public Member, Board of Governors and Board of Trustees, Rutgers University, since 2011; Director, Montpelier Re Holdings Ltd. (reinsurance company), since 2006; formerly, Director, National Atlantic Holdings Corporation (property and casualty insurance company), 2004 to 2008; formerly, Director, The Proformance Insurance Company (property and casualty insurance company), 2004 to 2008; formerly, Director, Providence Washington Insurance Company (property and casualty insurance company), 1998 to 2006; formerly, Director, Summit Global Partners (insurance brokerage firm), 2000 to 2005. | |
| |
| Peter P. Trapp (1944) | | Trustee since 1984 | | Retired; formerly, Regional Manager for Mid-Southern Region, Ford Motor Credit Company, September 1997 to 2007; formerly, President, Ford Life Insurance Company, April 1995 to August 1997. | | | 47 | | | None. | |
| |
31
Name, (Year of Birth), and Address(1) | | Position and Length of Time Served(2) | | Principal Occupation(s)(3) | | Number of Funds in Fund Complex Overseen by Fund Trustee | | Other Directorships Held Outside Fund Complex by Fund Trustee | |
| Trustees who are "Interested Persons" | |
| |
| Joseph V. Amato* (1962) | | Trustee since 2009 | | President and Director, Neuberger Berman Group LLC, since 2009; President and Chief Executive Officer, Neuberger and Neuberger Berman Holdings LLC (including its predecessor, Neuberger Berman Inc.), since 2007; Chief Investment Officer, Neuberger, since 2009; Chief Investment Officer (Equities) and Managing Director, Management, since 2009; Managing Director, Neuberger Berman Fixed Income LLC ("NBFI") since 2007; Board member of NBFI since 2006; formerly, Global Head of Asset Management of Lehman Brothers Holdings Inc.'s ("LBHI") Investment Management Division, 2006 to 2009; formerly, member of LBHI's Investment Management Division's Executive Management Committee, 2006 to 2009; formerly, Managing Director, Lehman Brothers Inc. ("LBI"), 2006 to 2008; formerly, Chief Recruiting and Development Officer, LBI, 2005 to 2006; formerly, Global Head of LBI's Equity Sales and a Member of its Equities Division Executive Committee, 2003 to 2005. | | | 47 | | | Member of Board of Advisors, McDonough School of Business, Georgetown University, since 2001; Member of New York City Board of Advisors, Teach for America, since 2005; Trustee, Montclair Kimberley Academy (private school), since 2007. | |
| |
32
Name, (Year of Birth), and Address(1) | | Position and Length of Time Served(2) | | Principal Occupation(s)(3) | | Number of Funds in Fund Complex Overseen by Fund Trustee | | Other Directorships Held Outside Fund Complex by Fund Trustee | |
| Robert Conti* (1956) | | Chief Executive Officer, President and Trustee since 2008; prior thereto, Executive Vice President in 2008 and Vice President, 2000 to 2008 | | Managing Director, Neuberger, since 2007; formerly, Senior Vice President, Neuberger, 2003 to 2006; formerly, Vice President, Neuberger, 1999 to 2003; President and Chief Executive Officer, Management, since 2008; formerly, Senior Vice President, Management, 2000 to 2008. | | | 47 | | | Director since 1994 and formerly, Chairman of the Board, 2008 to 2010, Staten Island Mental Health Society, Inc. | |
| |
(1) The business address of each listed person is 605 Third Avenue, New York, New York 10158.
(2) Pursuant to the Trust's Trust Instrument, each of these Trustees shall hold office for life or until his or her successor is elected or the Trust terminates; except that (a) any Trustee may resign by delivering a written resignation; (b) any Trustee may be removed with or without cause at any time by a written instrument signed by at least two-thirds of the other Trustees; (c) any Trustee who requests to be retired, or who has become unable to serve, may be retired by a written instrument signed by a majority of the other Trustees; and (d) any Trustee may be removed at any shareholder meeting by a vote of at least two-thirds of the outstanding shares.
(3) Except as otherwise indicated, each individual has held the positions shown for at least the last five years.
* Indicates a Trustee who is an "interested person" within the meaning of the 1940 Act. Mr. Amato and Mr. Conti are interested persons of the Trust by virtue of the fact that each is an officer of Management, Neuberger and/or their affiliates.
33
Information about the Officers of the Trust
Name, (Year of Birth), and Address(1) | | Position and Length of Time Served(2) | | Principal Occupation(s)(3) | |
| Andrew B. Allard (1961) | | Anti-Money Laundering Compliance Officer since 2002 | | Senior Vice President, Neuberger, since 2006 and Employee since 1999; Deputy General Counsel, Neuberger, since 2004; formerly, Vice President, Neuberger, 2000 to 2005; formerly, Employee, Management, 1994 to 1999; Anti-Money Laundering Compliance Officer, nine registered investment companies for which Management acts as investment manager and administrator (six since 2002, one since 2003, one since 2005 and one since 2006). | |
| |
| Claudia A. Brandon (1956) | | Executive Vice President since 2008 and Secretary since 1985 | | Senior Vice President, Neuberger, since 2007 and Employee since 1999; Senior Vice President, Management, since 2008 and Assistant Secretary since 2004; formerly, Vice President, Neuberger, 2002 to 2006; formerly, Vice President-Mutual Fund Board Relations, Management, 2000 to 2008; formerly, Vice President, Management, 1986 to 1999 and Employee 1984 to 1999; Executive Vice President, nine registered investment companies for which Management acts as investment manager and administrator (nine since 2008); Secretary, nine registered investment companies for which Management acts as investment manager and administrator (three since 1985, three since 2002, one since 2003, one since 2005 and one since 2006). | |
| |
| Anthony DiBernardo (1979) | | Assistant Treasurer since 2011 | | Vice President, Neuberger, since 2009; Employee, Management, since 2003; Assistant Treasurer, nine registered investment companies for which Management acts as investment manager and administrator. | |
| |
| Maxine L. Gerson (1950) | | Executive Vice President since 2008 and Chief Legal Officer since 2005 (only for purposes of sections 307 and 406 of the Sarbanes-Oxley Act of 2002) | | Managing Director, Neuberger, since 2009, and Deputy General Counsel and Assistant Secretary, Neuberger, since 2001; Managing Director, Management, since 2009, and Secretary and General Counsel, Management, since 2004; formerly, Senior Vice President, Neuberger, 2002 to 2009; formerly, Senior Vice President, Management, 2006 to 2009; Executive Vice President, nine registered investment companies for which Management acts as investment manager and administrator (nine since 2008); Chief Legal Officer (only for purposes of sections 307 and 406 of the Sarbanes-Oxley Act of 2002), nine registered investment companies for which Management acts as investment manager and administrator (eight since 2005 and one since 2006). | |
| |
| Sheila R. James (1965) | | Assistant Secretary since 2002 | | Vice President, Neuberger, since 2008 and Employee since 1999; formerly, Assistant Vice President, Neuberger, 2007; formerly, Employee, Management, 1991 to 1999; Assistant Secretary, nine registered investment companies for which Management acts as investment manager and administrator (six since 2002, one since 2003, one since 2005 and one since 2006). | |
| |
| Brian Kerrane (1969) | | Vice President since 2008 | | Senior Vice President, Neuberger, since 2006; formerly, Vice President, Neuberger, 2002 to 2006; Vice President, Management, since 2008 and Employee since 1991; Vice President, nine registered investment companies for which Management acts as investment manager and administrator (nine since 2008). | |
| |
34
Name, (Year of Birth), and Address(1) | | Position and Length of Time Served(2) | | Principal Occupation(s)(3) | |
| Kevin Lyons (1955) | | Assistant Secretary since 2003 | | Assistant Vice President, Neuberger, since 2008 and Employee since 1999; formerly, Employee, Management, 1993 to 1999; Assistant Secretary, nine registered investment companies for which Management acts as investment manager and administrator (seven since 2003, one since 2005 and one since 2006). | |
| |
| Owen F. McEntee, Jr. (1961) | | Vice President since 2008 | | Vice President, Neuberger, since 2006; Employee, Management, since 1992; Vice President, nine registered investment companies for which Management acts as investment manager and administrator (nine since 2008). | |
| |
| John M. McGovern (1970) | | Treasurer and Principal Financial and Accounting Officer since 2005 | | Senior Vice President, Neuberger, since 2007; formerly, Vice President, Neuberger, 2004 to 2006; Employee, Management, since 1993; Treasurer and Principal Financial and Accounting Officer, nine registered investment companies for which Management acts as investment manager and administrator (eight since 2005 and one since 2006); formerly, Assistant Treasurer, eight registered investment companies for which Management acts as investment manager and administrator, 2002 to 2005. | |
| |
| Frank Rosato (1971) | | Assistant Treasurer since 2005 | | Vice President, Neuberger, since 2006; Employee, Management, since 1995; Assistant Treasurer, nine registered investment companies for which Management acts as investment manager and administrator (eight since 2005 and one since 2006). | |
| |
| Neil S. Siegel (1967) | | Vice President since 2008 | | Managing Director, Management, since 2008; Managing Director, Neuberger, since 2006; formerly, Senior Vice President, Neuberger, 2004 to 2006; Vice President, nine registered investment companies for which Management acts as investment manager and administrator (nine since 2008). | |
| |
| Chamaine Williams (1971) | | Chief Compliance Officer since 2005 | | Senior Vice President, Neuberger, since 2007; Chief Compliance Officer, Management, since 2006; Chief Compliance Officer, nine registered investment companies for which Management acts as investment manager and administrator (eight since 2005 and one since 2006); formerly, Senior Vice President, LBI, 2007 to 2008; formerly, Vice President, LBI, 2003 to 2006; formerly, Chief Compliance Officer, Lehman Brothers Asset Management Inc., 2003 to 2007; formerly, Chief Compliance Officer, Lehman Brothers Alternative Investment Management LLC, 2003 to 2007. | |
| |
(1) The business address of each listed person is 605 Third Avenue, New York, New York 10158.
(2) Pursuant to the By-Laws of the Trust, each officer elected by the Trustees shall hold office until his or her successor shall have been elected and qualified or until his or her earlier death, inability to serve, or resignation. Officers serve at the pleasure of the Trustees and may be removed at any time with or without cause.
(3) Except as otherwise indicated, each individual has held the positions shown for at least the last five years.
35
Proxy Voting Policies and Procedures
A description of the policies and procedures that the Trust uses to determine how to vote proxies relating to portfolio securities is available, without charge, by calling 1-800-877-9700 (toll-free) and on the website of the Securities and Exchange Commission, at www.sec.gov. Information regarding how the Trust voted proxies relating to portfolio securities during the most recent 12-month period ended June 30 is also available, without charge, by calling 1-800-877-9700 (toll-free), on the website of the Securities and Exchange Commission at www.sec.gov, and on Management's website at www.nb.com.
Quarterly Portfolio Schedule
The Trust files a complete schedule of portfolio holdings for the Fund with the Securities and Exchange Commission for the first and third quarters of each fiscal year on Form N-Q. The Trust's Forms N-Q are available on the Securities and Exchange Commission's website at www.sec.gov and may be reviewed and copied at the Securities and Exchange Commission's Public Reference Room in Washington, DC. Information on the operation of the Public Reference Room may be obtained by calling 1-800-SEC-0330. The information on Form N-Q is available upon request, without charge, by calling 1-800-877-9700 (toll free).
Board Consideration of the Management and Sub-Advisory Agreements
At a meeting held on October 13, 2011, the Board, including the Trustees who are not "interested persons" of Management (including its affiliates) or Neuberger Berman Advisers Management Trust ("Independent Fund Trustees"), approved the continuance of the Management and Sub-Advisory Agreements ("Agreements") for the Fund.
In evaluating the Agreements, the Board, including the Independent Fund Trustees, reviewed materials furnished by Management and Neuberger in response to questions submitted by counsel for the Independent Fund Trustees, and met with senior representatives of Management and Neuberger regarding their personnel and operations. The Independent Fund Trustees were advised by counsel that is experienced in Investment Company Act of 1940 matters and that is independent of Management and Neuberger. The Independent Fund Trustees received a memorandum from independent counsel discussing the legal standards for their consideration of the proposed continuance of the Agreements. They met with such counsel separately from representatives of Management to discuss the annual contract review. The annual contract review extends over three regular meetings of the Board, including one meeting devoted primarily to reviewing and discussing Fund performance, to ensure that Management and Neuberger have time to respond to any questions the Independent Fund Trustees may have on their initial review of the report and that the Independent Fund Trustees have time to consider those responses.
The Board considered the following factors, among others, in connection with its approval of the continuance of the Agreements: (1) the nature, extent, and quality of the services provided by Management and Neuberger; (2) the performance of the Fund compared to a relevant market index and a peer group of investment companies; (3) the costs of the services provided and profits or losses realized by Management and its affiliates from their relationship with the Fund; (4) the extent to which economies of scale might be realized as the Fund grows; and (5) whether fee levels reflect any such potential economies of scale for the benefit of investors in the Fund. In their deliberations, the Board members did not identify any particular information that was all-important or controlling, and each Trustee may have attributed different weights to the various factors.
The Board evaluated the terms of the Agreements, the overall fairness of the Agreements to the Fund and whether the Agreements were in the best interests of the Fund and its shareholders.
With respect to the nature, extent and quality of the services provided, the Board considered the performance of the Fund and the experience and staffing of the portfolio management and investment research personnel of Management and Neuberger who perform services for the Fund. The Board noted that Management also provides certain administrative services, including fund accounting and compliance oversight. The Board also considered Management's and Neuberger's
36
policies and practices regarding brokerage and the allocation of portfolio transactions. The Board's Portfolio Transactions and Pricing Committee from time to time reviewed the quality of the execution services that Management and Neuberger had provided, and periodically reviews studies by an independent firm engaged to review and evaluate the quality of brokerage execution received by the Fund. The Board also reviewed whether Management and Neuberger used brokers to execute Fund transactions that provide research and other services to Management and Neuberger, and the types of benefits potentially derived from such services by Management, Neuberger, the Fund and other clients of Management and Neuberger. In addition, the Board noted the positive compliance history of Management and Neuberger, as each firm has been free of significant reported compliance problems.
The Board considered the performance of the Fund relative to its benchmark and the average performance of composite peer groups of investment companies dedicated to insurance products pursuing broadly similar strategies that also allocate investments across various asset classes, including both fixed-income and equity instruments. The Board also reviewed performance in relation to certain measures of the degree of investment risk undertaken by the portfolio managers, during the period. The Board discussed the Fund's performance with Management and discussed steps that Management had taken, or intended to take, to improve the Fund's performance. The Board also considered Management's resources and responsiveness with respect to the Fund.
With respect to the overall fairness of the Agreements, the Board considered the fee structure for the Fund under the Agreements and any fall-out benefits likely to accrue to Management or Neuberger or their affiliates from their relationship with the Fund. The Board also considered the contractual limit on Fund expenses undertaken by Management and the actual expenses reimbursed and investment management fees waived by Management. With regard to the sub-advisory fee paid to Neuberger, the Board noted that this fee is "at cost." In addition, the Board considered the profitability of Management and its affiliates from their association with the Fund and noted that Management incurred a loss on the Fund.
The Board considered whether there were other funds that were advised or sub-advised by Management or its affiliates or separate accounts managed by Management or its affiliates with similar investment objectives, policies and strategies to the Fund. The Board noted that there were no comparable advised or sub-advised funds. The Board considered the appropriateness and reasonableness of any differences between the fees charged to the Fund and the separate accounts and determined that the differences in fees were consistent with the management and other services provided.
The Board also evaluated any apparent or anticipated economies of scale in relation to the services Management provides to the Fund. The Board considered whether the Fund's fee structure provides for a reduction of payments resulting from the use of breakpoints and whether those breakpoints are set at appropriate asset levels. In concluding that the benefits accruing to Management and its affiliates by virtue of their relationship to the Fund were reasonable in comparison with the costs of providing the investment advisory services and the benefits accruing to the Fund, the Board reviewed specific data as to Management's loss on the Fund for a recent period and the trend in profit or loss over recent years. The Board also carefully examined Management's cost allocation methodology.
Conclusions
In approving the Agreements, the Board concluded that the terms of each Agreement are fair and reasonable and that approval of the Agreements is in the best interests of the Fund and its shareholders. In reaching this determination, the Board considered that Management and Neuberger could be expected to provide a high level of service to the Fund; that it retained confidence in Management's and Neuberger's capabilities to manage the Fund; that the Fund's fee structure appeared to the Board to be reasonable given the nature and quality of services provided; and that the benefits accruing to Management and its affiliates by virtue of their relationship to the Fund were reasonable in comparison with the benefits accruing to the Fund.
37
Neuberger Berman
Advisers Management Trust
Growth Portfolio
I Class Shares
Annual Report
December 31, 2011
B1015 02/12
Growth Portfolio Commentary (Unaudited)
Neuberger Berman Advisers Management Trust (AMT) Growth Portfolio Class I generated a –0.21% total return for the fiscal year ended December 31, 2011, outperforming its benchmark, the Russell Midcap® Growth Index, which returned –1.65% for the period.
2011 was a year in which macro and political headlines overshadowed fundamentals. Characterized by "risk-on, risk-off" volatility and highly correlated market moves that failed to differentiate between companies, 2011, much like 2010, was plagued by Europe's unresolved debt crisis, political gridlock and acrimony in Washington and concerns over China's management of its growth.
However, despite the broader negative sentiment and legitimate risks to both a domestic and global recovery, there were, in our opinion, encouraging signs. While the pace of the U.S. economic recovery remained muted, we believe it continued to march in the right direction. While volatility posed certain problems, it also afforded opportunities, as valuations for quality mid-cap stocks moved from fair to attractive during the year. Overall, and relative to other options, the U.S. equity market was attractive, in our opinion, with corporate balance sheets continuing to gain strength, strong earnings, lean inventories, low leverage and margins that, for the most part, held steady.
For the year, the Portfolio outperformed on the basis of stock selection, relative to the benchmark, with Industrials and Health Care serving as the leading positive contributors to performance. Fastenal, a wholesale and retail company that sells industrial and construction supplies, led the way for Industrials. Fastenal continued to deliver good fundamentals, while increasing market share. Their new vending machine method of distribution for safety products successfully delivered incremental sales revenue.
Alexion Pharmaceuticals, engaged in the discovery, development and commercialization of therapeutic products aimed at treating patients with rare, life-threatening diseases, was the Portfolio's top performer for the year. Alexion, driven by their successful international rollout and potential new indications for their primary drug, continued to exceed expectations. HMS Holdings, another top contributor, provides a variety of cost containment, benefit coordination and program integrity services for government and private health care sponsors. HMS acquired a company that focuses on Medicare audits, complementing their strength in Medicaid.
Consumer Discretionary, although muted on a relative basis due to the Portfolio's underweight versus the benchmark, delivered strong absolute contributions with Dollar Tree and Ross Stores. Dollar Tree's discount variety stores, which offer merchandise at the fixed price of one dollar, and Ross Stores, with off-price retail apparel and home accessories, continued to benefit from budget-conscience consumers trading down from more expensive retail options.
Areas of relative underperformance were Information Technology (IT) and Financials. In IT, both an overweight allocation and stock selection detracted. Rovi Corporation, an integrated product and service solutions provider for consumer interaction with digital media and entertainment, was the leading detractor from performance in 2011 due to disappointing fourth quarter results and the company's guidance on future results. NetApp, a provider of storage and data management solutions, delivered disappointing results amid concerns over rising costs and declining market share. We sold both positions.
Poor stock selection in Financials resulted in performance that detracted from Portfolio returns. Affected by fears of a global recession, Jones Lang LaSalle, a real estate and investment management services firm, was negatively impacted by a slowdown in global leasing.
Based on our expectations for 2012, we have maintained the Portfolio's overweights in Industrials, IT and Health Care and its underweights in Materials, Consumer Staples, Utilities, Financials and Consumer Discretionary. We believe innovation and unique products and services can be catalysts for outperformance in a tough environment, and the Portfolio's sector overweights reflect that belief. Inconsistent earnings and high cyclicality have led us to underweight Materials and the stubbornly sluggish recoveries in employment and housing have caused us to underweight the two consumer-oriented sectors.
1
As we look toward 2012, despite the many threats to both global and domestic financial stability, we remain cautiously optimistic. We anticipate modest growth in the U.S. economy to continue, with the risk of recession already priced into the market and an economic downturn seeming unlikely, and we believe that stocks can do well, even if the pace of economic growth remains slow. In our view, 2012 will likely be about business confidence and whether we can move beyond the current fragile state and begin to log meaningful gains in hiring and capital expenditures, which in turn could lend support to the consumer. We believe there is pent-up demand, which in many cases has been on hold in developed markets since 2008, but if the leaders in Washington and overseas, especially Europe, can turn uncertainties into resolutions, then hopefully companies will have the confidence to put their cash to work and we could see the potential for positive momentum in the economy.
Sincerely,
Kenneth J. Turek
Portfolio Manager
Information about the principal risks of investing in the Portfolio is set forth in the prospectus and statement of additional information.
The composition, industries and holding of the Portfolio are subject to change.
2
Growth Portfolio (Unaudited)
SECTOR ALLOCATION
| (as a % of Total Investments) | |
| Consumer Discretionary | | | 19.2 | % | |
| Consumer Staples | | | 3.6 | | |
| Energy | | | 10.8 | | |
| Financials | | | 5.2 | | |
| Health Care | | | 16.6 | | |
| Industrials | | | 18.4 | | |
| Information Technology | | | 20.0 | | |
| Materials | | | 3.3 | | |
| Telecommunication Services | | | 1.7 | | |
| Short-Term Investments | | | 1.2 | | |
| Total | | | 100.0 | % | |
PERFORMANCE HIGHLIGHTS1
| | | | | Average Annual Total Return Ended 12/31/2011 | |
| | | Inception Date | | 1 Year | | 5 Years | | 10 Years | | Life of Fund* | |
Growth Portfolio Class I | | | 09/10/1984 | | | | –0.21 | % | | | 3.38 | % | | | 4.89 | % | | | 8.72 | % | |
Russell Midcap® Growth Index2 | | | | | | | –1.65 | % | | | 2.44 | % | | | 5.29 | % | | | N/A | | |
Russell Midcap® Index2 | | | | | | | –1.55 | % | | | 1.41 | % | | | 6.99 | % | | | 11.88 | % | |
Performance data quoted represent past performance, and do not indicate future results. The investment return and principal value of an investment will fluctuate so that an investor's shares, when redeemed, may be worth more or less than their original cost. Results are shown on a "total return" basis and include reinvestment of all income dividends and distributions. Current performance may be higher or lower than the performance data quoted. For performance data current to the most recent month end, please visit https://www.nb.com.
* Index returns are as of the inception date 09/10/1984.
As stated in the Portfolio's most recent prospectus, the total annual operating expense ratio for fiscal year 2010 was 2.64% for Class I shares (prior to any fee waivers and/or expense reimbursements, if any). The expense ratio net of waivers and/or reimbursements was 1.85% for Class I shares. Neuberger Berman Management LLC has contractually agreed to limit certain expenses of the Portfolio through 12/31/2014 for Class I shares.
The results shown in the table do not reflect the effect of taxes an investor would pay on Portfolio distributions or on the redemption of Portfolio shares.
COMPARISON OF A $10,000 INVESTMENT
The graph shows the change in value of a hypothetical $10,000 investment in the Portfolio over the past 10 fiscal years, or since the Portfolio's inception, if it has not operated for 10 years. The result is compared with benchmarks, which may include a broad-based market index and/or a narrower index. Market indices have not been reduced to reflect any of the fees and costs of investing. All results include the reinvestment of income dividends and distributions. The results shown in the graph do not reflect the effect of taxes that an investor would pay on Portfolio distributions or the redemption of Portfolio shares. Results represent past performance and do not indicate future results.
Please see Endnotes for additional information.
3
Endnotes (Unaudited)
1 "Total Return" includes reinvestment of all income dividends and distributions. Results represent past performance and do not indicate future results. The value of an investment in the Portfolio and the return on the investment both will fluctuate, and redemption proceeds may be higher or lower than an investor's original cost. The performance information does not reflect fees and expenses of the variable annuity and variable life insurance policies or the qualified pension and retirement plans whose proceeds are invested in the Portfolio. Neuberger Berman Management LLC ("NBM LLC") has agreed to absorb certain expenses of the AMT Portfolios, including the Portfolio. Without this arrangement, which is subject to change, the total returns of the Portfolio may have been less.
2 The Russell Midcap® Growth Index measures the performance of those Russell Midcap® Index companies with higher price-to-book ratios and higher forecasted growth values. The Russell Midcap Index measures the performance of the 800 smallest companies in the Russell 1000® Index, which represents approximately 31% of the total market capitalization of the Russell 1000 Index (which, in turn, consists of the 1,000 largest U.S. companies, based on market capitalization). Please note that indices do not take into account any fees and expenses of investing in the individual securities that they track and that individuals cannot invest directly in any index. Data about the performance of these indices are prepared or obtained by NBM LLC and include reinvestment of all income dividends and distributions. The Portfolio may invest in securities not included in the above-described indices and may not invest in all securities included in the above-described indices.
Any ratios or other measurements using a factor of forecasted earnings of a company discussed herein are based on consensus estimates, not NBM LLC's own projections, and they may or may not be realized. In addition, any revision to a forecast could affect the market price of a security. By quoting them herein, NBM LLC does not offer an opinion as to the accuracy of and does not guarantee these forecasted numbers.
The investments for the Portfolio are managed by the same portfolio manager(s) who manage(s) one or more other registered funds that have similar names, investment objectives and investment styles as the Portfolio. You should be aware that the Portfolio is likely to differ from the other mutual funds in size, cash flow pattern and tax matters. Accordingly, the holdings and performance can be expected to vary from those of the other mutual funds.
The composition, industries and holdings of the Portfolio are subject to change.
Shares of the separate AMT Portfolios are not available to the general public. Shares of this Portfolio may be purchased only by life insurance companies to be used with their separate accounts that fund variable annuity and variable life insurance policies and by qualified pension and retirement plans.
Statistics and projections in this report are derived from sources deemed to be reliable but cannot be regarded as a representation of future results of the AMT Portfolios. This report is prepared for the general information of shareholders and is not an offer of shares of the AMT Portfolios. Shares of the AMT Portfolios are sold only through the currently effective prospectuses, which must precede or accompany this report.
The "Neuberger Berman" name and logo are registered service marks of Neuberger Berman Group LLC. "Neuberger Berman Management LLC" and the individual Fund names in this piece are either service marks or registered service marks of Neuberger Berman Management LLC.
© 2012 Neuberger Berman Management LLC distributor. All rights reserved.
4
Information About Your Fund's Expenses (Unaudited)
This table is designed to provide information regarding costs related to your investments. All mutual funds incur operating expenses, which include management fees, fees for administrative services and costs of shareholder reports, among others. The following examples are based on an investment of $1,000 made at the beginning of the six month period ended December 31, 2011 and held for the entire period. The table illustrates the fund's costs in two ways:
| Actual Expenses and Performance: | | The first section of the table provides information about actual account values and actual expenses in dollars, based on the fund's actual performance during the period. You may use the information in this line, together with the amount you invested, to estimate the expenses you paid over the period. Simply divide your account value by $1,000 (for example, an $8,600 account value divided by $1,000 = 8.6), then multiply the result by the number in the first section of the table under the heading entitled "Expenses Paid During the Period" to estimate the expenses you paid over the period. | |
| |
Hypothetical Example for Comparison Purposes: | | The second section of the table provides information about hypothetical account values and hypothetical expenses based on the fund's actual expense ratio and an assumed rate of return at 5% per year before expenses. This return is not the fund's actual return. The hypothetical account values and expenses may not be used to estimate the actual ending account balance or expenses you paid for the period. You may use this information to compare the ongoing costs of investing in this fund versus other funds. To do so, compare the expenses shown in this 5% hypothetical example with the 5% hypothetical examples that appear in the shareholder reports of other funds. | |
| |
Please note that the expenses in the table are meant to highlight your ongoing costs only. The table and expense example do not include any transaction costs, such as fees and expenses that are, or may be, imposed under your variable contract or qualified pension plan. Therefore, the information under the heading "Hypothetical (5% annual return before expenses)" is useful in comparing ongoing costs only, and will not help you determine the relative total costs of owning different funds. In addition, if these transaction costs were included, your costs would have been higher.
Expense Information as of 12/31/11
NEUBERGER BERMAN ADVISERS MANAGEMENT TRUST GROWTH PORTFOLIO
| Actual | | Beginning Account Value 7/1/11 | | Ending Account Value 12/31/11 | | Expenses Paid During the Period* 7/1/11 – 12/31/11 | |
| Class I | | $ | 1,000.00 | | | $ | 911.20 | | | $ | 8.96 | | |
| Hypothetical (5% annual return before expenses)** | | | | | |
| Class I | | $ | 1,000.00 | | | $ | 1,015.83 | | | $ | 9.45 | | |
* Expenses are equal to the annualized expense ratio of 1.86%, multiplied by the average account value over the period, multiplied by 184/365 (to reflect the one-half year period shown).
** Hypothetical 5% annual return before expenses is calculated by multiplying the number of days in the most recent half year divided by 365.
5
Schedule of Investments Growth Portfolio
| NUMBER OF SHARES | | | | VALUE† | |
| Common Stocks (99.6%) | | | |
| Aerospace & Defense (2.0%) | | | |
| | 1,900 | | | BE Aerospace | | $ | 73,549 | * | |
| | 1,250 | | | HEICO Corp. | | | 73,100 | | |
| | | | 146,649 | | |
| Auto Components (1.9%) | | | |
| | 800 | | | BorgWarner, Inc. | | | 50,992 | * | |
| | 3,000 | | | Gentex Corp. | | | 88,770 | | |
| | | | 139,762 | | |
| Beverages (0.5%) | | | |
| | 700 | | | Beam, Inc. | | | 35,861 | | |
| Biotechnology (2.3%) | | | |
| | 2,000 | | | Alexion Pharmaceuticals | | | 143,000 | * | |
| | 750 | | | Cepheid, Inc. | | | 25,808 | * | |
| | | | 168,808 | | |
| Building Products (0.5%) | | | |
| | 2,000 | | | Fortune Brands Home & Security | | | 34,060 | * | |
| Capital Markets (1.4%) | | | |
| | 1,100 | | | Affiliated Managers Group | | | 105,545 | * | |
| Chemicals (2.9%) | | | |
| | 1,500 | | | Airgas, Inc. | | | 117,120 | | |
| | 850 | | | Ashland Inc. | | | 48,586 | | |
| | 750 | | | Sigma-Aldrich | | | 46,845 | | |
| | | | 212,551 | | |
| Commercial Services & Supplies (1.6%) | | | |
| | 1,500 | | | Stericycle, Inc. | | | 116,880 | * | |
| Communications Equipment (1.2%) | | | |
| | 1,000 | | | Acme Packet | | | 30,910 | * | |
| | 500 | | | F5 Networks | | | 53,060 | * | |
| | | | 83,970 | | |
| Diversified Financial Services (1.7%) | | | |
| | 750 | | | IntercontinentalExchange Inc. | | | 90,413 | * | |
| | 1,000 | | | MSCI Inc. Class A | | | 32,930 | * | |
| | | | 123,343 | | |
| Electrical Equipment (4.4%) | | | |
| | 2,500 | | | AMETEK, Inc. | | | 105,250 | | |
| | 800 | | | Polypore International | | | 35,192 | * | |
| | 1,500 | | | Roper Industries | | | 130,305 | | |
| | 2,000 | | | Sensata Technologies Holding | | | 52,560 | * | |
| | | | 323,307 | | |
| NUMBER OF SHARES | | | | VALUE† | |
Electronic Equipment, Instruments & Components (2.1%) | | | |
| | 1,500 | | | National Instruments | | $ | 38,925 | | |
| | 2,600 | | | Trimble Navigation | | | 112,840 | * | |
| | | | 151,765 | | |
| Energy Equipment & Services (5.1%) | | | |
| | 500 | | | Cameron International | | | 24,595 | * | |
| | 900 | | | CARBO Ceramics | | | 110,997 | | |
| | 1,000 | | | Core Laboratories | | | 113,950 | | |
| | 1,600 | | | Oil States International | | | 122,192 | * | |
| | | | 371,734 | | |
| Food & Staples Retailing (1.0%) | | | |
| | 1,000 | | | Whole Foods Market | | | 69,580 | | |
| Food Products (1.0%) | | | |
| | 1,100 | | | Mead Johnson Nutrition | | | 75,603 | | |
| Health Care Equipment & Supplies (3.4%) | | | |
| | 550 | | | Edwards Lifesciences | | | 38,885 | * | |
| | 200 | | | Intuitive Surgical | | | 92,602 | * | |
| | 3,000 | | | NxStage Medical | | | 53,340 | * | |
| | 2,700 | | | Volcano Corp. | | | 64,233 | * | |
| | | | 249,060 | | |
| Health Care Providers & Services (4.0%) | | | |
| | 1,500 | | | Catalyst Health Solutions | | | 78,000 | * | |
| | 750 | | | DaVita, Inc. | | | 56,857 | * | |
| | 4,950 | | | HMS Holdings | | | 158,301 | * | |
| | | | 293,158 | | |
| Health Care Technology (2.2%) | | | |
| | 2,000 | | | Cerner Corp. | | | 122,500 | * | |
| | 1,000 | | | Quality Systems | | | 36,990 | | |
| | | | 159,490 | | |
| Hotels, Restaurants & Leisure (2.9%) | | | |
| | 3,000 | | | Arcos Dorados Holdings Class A | | | 61,590 | | |
| | 200 | | | Chipotle Mexican Grill | | | 67,548 | * | |
| | 850 | | | Starwood Hotels & Resorts Worldwide | | | 40,774 | | |
| | 400 | | | Wynn Resorts | | | 44,196 | | |
| | | | 214,108 | | |
| Household Products (1.1%) | | | |
| | 1,800 | | | Church & Dwight | | | 82,368 | | |
| Internet Software & Services (1.2%) | | | |
| | 2,000 | | | Rackspace Hosting | | | 86,020 | * | |
See Notes to Schedule of Investments
6
| NUMBER OF SHARES | | | | VALUE† | |
| IT Services (2.6%) | | | |
| | 1,250 | | | Cognizant Technology Solutions | | $ | 80,388 | * | |
| | | | | Class A | | | | | |
| | 3,000 | | | VeriFone Systems | | | 106,560 | * | |
| | | | 186,948 | | |
| Life Science Tools & Services (0.8%) | | | |
| | 750 | | | Waters Corp. | | | 55,538 | * | |
| Machinery (4.1%) | | | |
| | 800 | | | Cummins Inc. | | | 70,416 | | |
| | 1,500 | | | Donaldson Co. | | | 102,120 | | |
| | 550 | | | Joy Global | | | 41,234 | | |
| | 1,550 | | | Pall Corp. | | | 88,582 | | |
| | | | 302,352 | | |
| Media (1.3%) | | | |
| | 800 | | | AMC Networks Class A | | | 30,064 | * | |
| | 1,650 | | | Discovery Communications Class A | | | 67,601 | * | |
| | | | 97,665 | | |
| Metals & Mining (0.4%) | | | |
| | 850 | | | Agnico-Eagle Mines | | | 30,872 | | |
| Multiline Retail (3.3%) | | | |
| | 1,800 | | | Dollar Tree | | | 149,598 | * | |
| | 1,900 | | | Nordstrom, Inc. | | | 94,449 | | |
| | | | 244,047 | | |
| Oil, Gas & Consumable Fuels (5.8%) | | | |
| | 1,250 | | | Cabot Oil & Gas | | | 94,875 | | |
| | 1,150 | | | Concho Resources | | | 107,812 | * | |
| | 3,500 | | | Denbury Resources | | | 52,850 | * | |
| | 800 | | | Laredo Petroleum Holdings | | | 17,840 | * | |
| | 1,000 | | | Oasis Petroleum | | | 29,090 | * | |
| | 1,250 | | | QEP Resources | | | 36,625 | | |
| | 1,150 | | | SM Energy | | | 84,065 | | |
| | | | 423,157 | | |
| Pharmaceuticals (4.0%) | | | |
| | 1,000 | | | Medicis Pharmaceutical Class A | | | 33,250 | | |
| | 1,250 | | | Perrigo Co. | | | 121,625 | | |
| | 1,000 | | | Salix Pharmaceuticals | | | 47,850 | * | |
| | 1,500 | | | Watson Pharmaceuticals | | | 90,510 | * | |
| | | | 293,235 | | |
| Professional Services (1.7%) | | | |
| | 1,000 | | | Nielsen Holdings | | | 29,690 | * | |
| | 2,400 | | | Verisk Analytics Class A | | | 96,312 | * | |
| | | | 126,002 | | |
Real Estate Management & Development (0.8%) | | | |
| | 1,000 | | | Jones Lang LaSalle | | | 61,260 | | |
| NUMBER OF SHARES | | | | VALUE† | |
| Road & Rail (1.2%) | | | |
| | 2,000 | | | J.B. Hunt Transport Services | | $ | 90,140 | | |
Semiconductors & Semiconductor Equipment (3.1%) | | | |
| | 1,000 | | | Altera Corp. | | | 37,100 | | |
| | 3,000 | | | Avago Technologies | | | 86,580 | | |
| | 2,000 | | | Cavium Inc. | | | 56,860 | * | |
| | 1,250 | | | Microchip Technology | | | 45,787 | | |
| | | | 226,327 | | |
| Software (10.1%) | | | |
| | 1,800 | | | ANSYS, Inc. | | | 103,104 | * | |
| | 1,500 | | | Ariba, Inc. | | | 42,120 | * | |
| | 1,650 | | | Check Point Software Technologies | | | 86,691 | * | |
| | 1,500 | | | Citrix Systems | | | 91,080 | * | |
| | 1,000 | | | Electronic Arts | | | 20,600 | * | |
| | 2,500 | | | Informatica Corp. | | | 92,325 | * | |
| | 1,650 | | | MICROS Systems | | | 76,857 | * | |
| | 2,750 | | | QLIK Technologies | | | 66,550 | * | |
| | 1,000 | | | Red Hat | | | 41,290 | * | |
| | 500 | | | Salesforce.com, Inc. | | | 50,730 | * | |
| | 1,250 | | | Solera Holdings | | | 55,675 | | |
| | 700 | | | Zynga Inc. | | | 6,587 | * | |
| | | | 733,609 | | |
| Specialty Retail (7.7%) | | | |
| | 1,600 | | | Bed Bath & Beyond | | | 92,752 | * | |
| | 2,100 | | | Dick's Sporting Goods | | | 77,448 | | |
| | 1,250 | | | DSW Inc. Class A | | | 55,262 | | |
| | 1,500 | | | O'Reilly Automotive | | | 119,925 | * | |
| | 3,000 | | | Ross Stores | | | 142,590 | | |
| | 1,000 | | | Tractor Supply | | | 70,150 | | |
| | | | 558,127 | | |
| Textiles, Apparel & Luxury Goods (2.2%) | | | |
| | 1,300 | | | Coach, Inc. | | | 79,352 | | |
| | 1,100 | | | PVH Corp. | | | 77,539 | | |
| | | | 156,891 | | |
| Trading Companies & Distributors (3.1%) | | | |
| | 3,500 | | | Fastenal Co. | | | 152,635 | | |
| | 1,000 | | | MSC Industrial Direct Class A | | | 71,550 | | |
| | | | 224,185 | | |
| Wireless Telecommunication Services (3.0%) | | | |
| | 1,500 | | | American Tower Class A | | | 90,015 | | |
| | 2,950 | | | SBA Communications Class A | | | 126,732 | * | |
| | | | 216,747 | | |
| | | | | Total Common Stocks (Cost $4,887,207) | | | 7,270,724 | | |
See Notes to Schedule of Investments
7
| NUMBER OF SHARES | | | | VALUE† | |
| Short-Term Investments (1.2%) | | | |
| | 85,932 | | | State Street Institutional | | $ | 85,932 | | |
| | | | | Liquid Reserves Fund | | | |
| | | | | Institutional Class | | | |
| | | | | (Cost $85,932) | | | | | |
| | | | | Total Investments (100.8%) (Cost $4,973,139) | | | 7,356,656 | ## | |
| | | | | Liabilities, less cash, receivables and other assets [(0.8%)] | | | (55,804 | ) | |
| | | | | Total Net Assets (100.0%) | | $ | 7,300,852 | | |
See Notes to Schedule of Investments
8
Notes to Schedule of Investments Growth Portfolio
† In accordance with Accounting Standards Codification ("ASC") 820 "Fair Value Measurements and Disclosures" ("ASC 820"), all investments held by Neuberger Berman Advisers Management Trust Growth Portfolio (the "Fund") are carried at the value that Neuberger Berman Management LLC ("Management") believes the Fund would receive upon selling an investment in an orderly transaction to an independent buyer in the principal or most advantageous market for the investment under current market conditions. Various inputs, including the volume and level of activity for the asset or liability in the market, are considered in valuing the Fund's investments, some of which are discussed below. Significant management judgment may be necessary to value investments in accordance with ASC 820.
ASC 820 established a three-tier hierarchy of inputs to create a classification of value measurements for disclosure purposes. The three-tier hierarchy of inputs is summarized in the three broad Levels listed below.
• Level 1 – quoted prices in active markets for identical investments
• Level 2 – other significant observable inputs (including quoted prices for similar investments, interest rates, prepayment speeds, credit risk, amortized cost, etc.)
• Level 3 – significant unobservable inputs (including the Fund's own assumptions in determining the fair value of investments)
The inputs or methodology used for valuing an investment are not necessarily an indication of the risk associated with investing in those securities.
The value of the Fund's investments in equity securities, for which market quotations are readily available, is generally determined by Management by obtaining valuations from an independent pricing service based on the latest sale price quoted on a principal exchange or market for that security (Level 1 inputs). Securities traded primarily on the NASDAQ Stock Market are normally valued by the Fund at the NASDAQ Official Closing Price ("NOCP") provided by NASDAQ each business day. The NOCP is the most recently reported price as of 4:00:02 p.m., Eastern time, unless that price is outside the range of the "inside" bid and asked prices (i.e., the bid and asked prices that dealers quote to each other when trading for their own accounts); in that case, NASDAQ will adjust the price to equal the inside bid or asked price, whichever is closer. Because of delays in reporting trades, the NOCP may not be based on the price of the last trade to occur before the market closes. If there is no reported sale of a security on a particular day, the independent pricing service may value the security based on reported market quotations.
Management has developed a process to periodically review information provided by independent pricing services for all types of securities.
Investments in State Street Institutional Liquid Reserves Fund Institutional Class are valued using the fund's daily calculated net asset value per share (Level 2 inputs).
If a valuation is not available from an independent pricing service, or if Management has reason to believe that the valuation received does not represent the amount the Fund might reasonably expect to receive on a current sale in an orderly transaction, the Fund seeks to obtain quotations from principal market makers (generally considered Level 3 inputs). If such quotations are not readily available, the security is valued using methods the Neuberger Berman Advisers Management Trust's Board of Trustees (the "Board") has approved on the belief that they reflect fair value. Numerous factors may be considered when determining the fair value of a security based on Level 2 or 3 inputs, including available analyst, media or other reports, trading in futures or ADRs and whether the issuer of the security being fair valued has other securities outstanding.
The value of the Fund's investments in foreign securities is generally determined using the same valuation methods and inputs as other Fund investments, as discussed above. Foreign security prices expressed in local currency values
See Notes to Financial Statements
9
Notes to Schedule of Investments Growth Portfolio (cont'd)
are translated from the local currency into U.S. dollars using the exchange rates as of 4:00 p.m., Eastern time. The Board has approved the use of Interactive Data Pricing and Reference Data, Inc. ("Interactive") to assist in determining the fair value of foreign equity securities when changes in the value of a certain index suggest that the closing prices on the foreign exchanges may no longer represent the amount that the Fund could expect to receive for those securities. In this event, Interactive will provide adjusted prices for certain foreign equity securities using a statistical analysis of historical correlations of multiple factors (Level 2 inputs). In the absence of precise information about the market values of these foreign securities as of the close of the New York Stock Exchange, the Board has determined on the basis of available data that prices adjusted in this way are likely to be closer to the prices the Fund could realize on a current sale than are the prices of those securities established at the close of the foreign markets in which the securities primarily trade.
Fair value prices are necessarily estimates, and there is no assurance that such a price will be at or close to the price at which the security is next quoted or next trades.
The following is a summary, categorized by Level, of inputs used to value the Fund's investments as of December 31, 2011:
| Asset Valuation Inputs | | Level 1 | | Level 2 | | Level 3 | | Total | |
| Investments: | |
| Common Stocks^ | | $ | 7,270,724 | | | $ | — | | | $ | — | | | $ | 7,270,724 | | |
| Short-Term Investments | | | — | | | | 85,932 | | | | — | | | | 85,932 | | |
| Total Investments | | $ | 7,270,724 | | | $ | 85,932 | | | $ | — | | | $ | 7,356,656 | | |
^ The Schedule of Investments provides information on the industry categorization for the portfolio.
The Fund had no significant transfers between Levels 1 and 2 during the year ended December 31, 2011.
## ��At December 31, 2011, the cost of investments for U.S. federal income tax purposes was $4,981,287. Gross unrealized appreciation of investments was $2,508,322 and gross unrealized depreciation of investments was $132,953, resulting in net unrealized appreciation of $2,375,369, based on cost for U.S. federal income tax purposes.
* Security did not produce income during the last twelve months.
See Notes to Financial Statements
10
Statement of Assets and Liabilities
Neuberger Berman Advisers Management Trust
| | | GROWTH PORTFOLIO | |
| | | December 31, 2011 | |
| Assets | |
| Investments in securities, at value* (Note A)—see Schedule of Investments: | |
| Unaffiliated issuers | | $ | 7,356,656 | | |
| Cash | | | 2,070 | | |
| Dividends and interest receivable | | | 1,293 | | |
| Receivable for securities sold | | | 6,385 | | |
| Receivable for Fund shares sold | | | 40 | | |
| Receivable from Management—net (Note B) | | | 3,323 | | |
| Prepaid expenses and other assets | | | 5,511 | | |
| Total Assets | | | 7,375,278 | | |
| Liabilities | |
| Payable for securities purchased | | | 18,599 | | |
| Payable for Fund shares redeemed | | | 1,662 | | |
| Payable to investment manager (Note B) | | | 3,429 | | |
| Accrued expenses and other payables | | | 50,736 | | |
| Total Liabilities | | | 74,426 | | |
| Net Assets at value | | $ | 7,300,852 | | |
| Net Assets consist of: | |
| Paid-in capital | | $ | 15,202,770 | | |
| Accumulated net realized gains (losses) on investments | | | (10,285,435 | ) | |
| Net unrealized appreciation (depreciation) in value of investments | | | 2,383,517 | | |
| Net Assets at value | | $ | 7,300,852 | | |
| Shares Outstanding ($.001 par value; unlimited shares authorized) | | | 393,194 | | |
| Net Asset Value, offering and redemption price per share | | $ | 18.57 | | |
| *Cost of Investments: | |
| Unaffiliated issuers | | $ | 4,973,139 | | |
See Notes to Financial Statements
11
Statement of Operations
Neuberger Berman Advisers Management Trust
| | | GROWTH PORTFOLIO | |
| | | For the Year Ended December 31, 2011 | |
| Investment Income: | |
| Income (Note A): | |
| Dividend income—unaffiliated issuers | | $ | 38,214 | | |
| Interest income—unaffiliated issuers | | | 70 | | |
| Foreign taxes withheld | | | (178 | ) | |
| Total income | | $ | 38,106 | | |
| Expenses: | |
| Investment management fees (Note B) | | | 44,375 | | |
| Administration fees (Note B) | | | 24,204 | | |
| Audit fees | | | 41,935 | | |
| Custodian fees (Note A) | | | 13,869 | | |
| Insurance expense | | | 99 | | |
| Legal fees | | | 4,367 | | |
| Shareholder reports | | | 17,756 | | |
| Trustees' fees and expenses | | | 55,592 | | |
| Miscellaneous | | | 951 | | |
| Total expenses | | | 203,148 | | |
| Expenses reimbursed by Management (Note B) | | | (53,512 | ) | |
| Expenses reduced by custodian fee expense offset arrangement (Note A) | | | (1 | ) | |
| Total net expenses | | | 149,635 | | |
| Net investment income (loss) | | $ | (111,529 | ) | |
| Realized and Unrealized Gain (Loss) on Investments (Note A): | |
| Net realized gain (loss) on: | |
| Sales of investment securities of unaffiliated issuers | | | 1,042,902 | | |
| Change in net unrealized appreciation (depreciation) in value of: | |
| Unaffiliated investment securities | | | (909,812 | ) | |
| Net gain (loss) on investments | | | 133,090 | | |
| Net increase (decrease) in net assets resulting from operations | | $ | 21,561 | | |
See Notes to Financial Statements
12
Statements of Changes in Net Assets
Neuberger Berman Advisers Management Trust
| | | GROWTH PORTFOLIO | |
| | | Year Ended December 31, 2011 | | Year Ended December 31, 2010 | |
| Increase (Decrease) in Net Assets: | |
| From Operations (Note A): | |
| Net investment income (loss) | | $ | (111,529 | ) | | $ | (99,416 | ) | |
| Net realized gain (loss) on investments | | | 1,042,902 | | | | 1,089,306 | | |
| Change in net unrealized appreciation (depreciation) of investments | | | (909,812 | ) | | | 1,080,252 | | |
| Net increase (decrease) in net assets resulting from operations | | | 21,561 | | | | 2,070,142 | | |
| From Fund Share Transactions (Note D): | |
| Proceeds from shares sold | | | 434,595 | | | | 426,297 | | |
| Payments for shares redeemed | | | (1,627,031 | ) | | | (1,481,815 | ) | |
| Net increase (decrease) from Fund share transactions | | | (1,192,436 | ) | | | (1,055,518 | ) | |
| Net Increase (Decrease) in Net Assets | | | (1,170,875 | ) | | | 1,014,624 | | |
| Net Assets: | |
| Beginning of year | | | 8,471,727 | | | | 7,457,103 | | |
| End of year | | $ | 7,300,852 | | | $ | 8,471,727 | | |
| Undistributed net investment income (loss) at end of year | | $ | — | | | $ | — | | |
See Notes to Financial Statements
13
Notes to Financial Statements Growth Portfolio
Note A—Summary of Significant Accounting Policies:
1 General: The Fund is a separate operating series of Neuberger Berman Advisers Management Trust (the "Trust"), a Delaware statutory trust organized pursuant to a Trust Instrument dated May 23, 1994. The Trust is currently comprised of ten separate operating series (each individually a "Series," and collectively the "Funds") each of which is diversified. The Trust is registered as an open-end management investment company under the Investment Company Act of 1940, as amended (the "1940 Act"), and its shares are registered under the Securities Act of 1933, as amended. The Fund currently offers only Class I shares. The Board may establish additional series or classes of shares without the approval of shareholders.
The assets of each Series belong only to that Series, and the liabilities of each Series are borne solely by that Series and no other.
The preparation of financial statements in accordance with U.S. generally accepted accounting principles ("GAAP") requires Management to make estimates and assumptions at the date of the financial statements. Actual results could differ from those estimates.
2 Portfolio valuation: Investment securities are valued as indicated in the notes following the Schedule of Investments.
3 Foreign currency translation: The accounting records of the Fund are maintained in U.S. dollars. Foreign currency amounts are translated into U.S. dollars using the exchange rate as of 4:00 p.m., Eastern time, to determine the value of investments, other assets and liabilities. Purchase and sale prices of securities, and income and expenses, are translated into U.S. dollars at the prevailing rate of exchange on the respective dates of such transactions. Net unrealized foreign currency gain (loss), if any, arises from changes in the value of assets and liabilities, other than investments in securities, as a result of changes in exchange rates and is stated separately in the Statement of Operations.
4 Securities transactions and investment income: Securities transactions are recorded on trade date for financial reporting purposes. Dividend income is recorded on the ex-dividend date or, for certain foreign dividends, as soon as the Fund becomes aware of the dividends. Non-cash dividends included in dividend income, if any, are recorded at the fair market value of the securities received. Interest income, including accretion of original issue discount, where applicable, and accretion of discount on short-term investments, if any, is recorded on the accrual basis. Realized gains and losses from securities transactions and foreign currency transactions, if any, are recorded on the basis of identified cost and stated separately in the Statement of Operations. Included in net realized gain (loss) on investments are proceeds from the settlements of class action litigation in which the Fund participated as a class member. The amount of such proceeds for the year ended December 31, 2011 was $25,731.
5 Income tax information: The Funds are treated as separate entities for U.S. federal income tax purposes. It is the policy of the Fund to continue to qualify as a regulated investment company by complying with the requirements of the U.S. Internal Revenue Code applicable to regulated investment companies and to distribute substantially all of its earnings to its shareholders. To the extent the Fund distributes substantially all of its earnings to shareholders, no federal income or excise tax provision is required.
The Fund has adopted the provisions of ASC 740 "Income Taxes" ("ASC 740"). ASC 740 sets forth a minimum threshold for financial statement recognition of a tax position taken, or expected to be taken, in a tax return. The Fund recognizes interest and penalties, if any, related to unrecognized tax positions as an income tax expense in the Statement of Operations. The Fund is subject to examination by U.S. federal and state tax authorities for returns filed for the prior three fiscal years 2008 - 2010. As of December 31, 2011, the Fund did not have any unrecognized tax positions.
14
Income distributions and capital gain distributions are determined in accordance with income tax regulations, which may differ from GAAP. These differences are primarily due to differing treatments of income and gains on various investment securities held by the Fund, timing differences and differing characterization of distributions made by the Fund as a whole. The Fund may also utilize earnings and profits distributed to shareholders on redemption of shares as a part of the dividends paid deduction for income tax purposes.
As determined on December 31, 2011, permanent differences resulting primarily from different book and tax accounting for net operating losses and non-taxable dividend adjustments to income were reclassified at fiscal year-end. These reclassifications had no effect on net income, net asset value ("NAV") or NAV per share of the Fund. For the year ended December 31, 2011, the Fund recorded the following permanent reclassifications:
| Paid-in Capital | | Undistributed Net Investment Income (Loss) | | Accumulated Net Realized Gains (Losses) on Investments | |
| $ | (113,767 | ) | | $ | 111,529 | | | $ | 2,238 | | |
For tax purposes, short-term gains are considered ordinary income.
As of December 31, 2011, the components of distributable earnings (accumulated losses) on a U.S. federal income tax basis were as follows:
Undistributed Ordinary Income (Loss) | | Unrealized Appreciation (Depreciation) | | Loss Carryforwards and Deferrals | | Other Temporary Differences | | Total | |
| $ | — | | | $ | 2,375,369 | | | $ | (10,277,287 | ) | | $ | — | | | $ | (7,901,918 | ) | |
The differences between book basis and tax basis distributable earnings are attributable primarily to timing differences of wash sales, return of capital adjustments for securities sold and capital loss carryforwards.
To the extent the Fund's net realized capital gains, if any, can be offset by capital loss carryforwards, it is the policy of the Fund not to distribute such gains. The Regulated Investment Company ("RIC") Modernization Act of 2010 (the "Act") became effective for the Fund on January 1, 2011. The Act modernizes several of the federal income and excise tax provisions related to RICs. Among the changes made are changes to the capital loss carryforward rules allowing for RICs to carry forward capital losses indefinitely and to retain the character of capital loss carryforwards as short-term or long-term ("Post-Enactment"). Rules in effect previously limited the carryforward period to eight years and all carryforwards were considered short-term in character ("Pre-Enactment"). As determined at December 31, 2011, the Fund had unused capital loss carryforwards available for federal income tax purposes to offset net realized capital gains, if any, as follows:
| Pre-Enactment | | Post-Enactment (No Expiration Date) | |
| Expiring in: | | Long-Term | | Short-Term | |
| 2017 | | | | | |
| $ | 10,277,287 | | | $ | — | | | $ | — | | |
Post-Enactment capital loss carryforwards must be fully used before Pre-Enactment capital loss carryforwards; therefore, under certain circumstances, Pre-Enactment capital loss carryforwards available as of the report date may expire unused.
During the year ended December 31, 2011, the Fund utilized capital loss carryforwards of $1,047,888.
6 Distributions to shareholders: The Fund may earn income, net of expenses, daily on its investments. Distributions from net investment income and net realized capital gains, if any, generally are distributed once a year (usually in October). Income distributions and capital gain distributions to shareholders are recorded on the ex-date.
15
7 Foreign taxes: Foreign taxes withheld represent amounts withheld by foreign tax authorities, net of refunds recoverable.
8 Expense allocation: Certain expenses are applicable to multiple funds. Expenses directly attributable to a Series are charged to that Series. Expenses of the Trust that are not directly attributable to a particular series of the Trust (e.g., the Fund) are allocated among the series of the Trust, on the basis of relative net assets, except where a more appropriate allocation of expenses to each of the series can otherwise be made fairly. Expenses borne by the complex of related investment companies, which includes open-end and closed-end investment companies for which Management serves as investment manager, that are not directly attributable to a particular investment company in the complex (e.g., the Trust) or series thereof are allocated among the investment companies in the complex or series thereof, on the basis of relative net assets, except where a more appropriate allocation of expenses to each of the investment companies in the complex or series thereof can otherwise be made fairly.
9 Investments in foreign securities: Investing in foreign securities may involve certain sovereign and other risks, in addition to the credit and market risks normally associated with domestic securities. These additional risks include the possibility of adverse political and economic developments (including political instability, nationalization, expropriation, or confiscatory taxation) and the potentially adverse effects of unavailability of public information regarding issuers, less governmental supervision and regulation of financial markets, reduced liquidity of certain financial markets, and the lack of uniform accounting, auditing, and financial reporting standards or the application of standards that are different or less stringent than those applied in the United States. Foreign securities also may experience greater price volatility, higher rates of inflation, and delays in settlement.
10 Indemnifications: Like many other companies, the Trust's organizational documents provide that its officers and trustees are indemnified against certain liabilities arising out of the performance of their duties to the Trust. In addition, both in some of its principal service contracts and in the normal course of its business, the Trust enters into contracts that provide indemnifications to other parties for certain types of losses or liabilities. The Trust's maximum exposure under these arrangements is unknown as this could involve future claims against the Trust.
11 Expense offset arrangement: The Fund has an expense offset arrangement in connection with its custodian contract. For the year ended December 31, 2011, the impact of this arrangement was a reduction of expenses of $1.
Note B—Management Fees, Administration Fees, Distribution Arrangements, and Other Transactions with Affiliates:
Fund shares are issued and redeemed in connection with investments in and payments under certain variable annuity contracts and variable life insurance policies issued through separate accounts of life insurance companies and are also offered directly to certain qualified pension and retirement plans.
The Fund retains Management as its investment manager under a Management Agreement. For such investment management services, the Fund pays Management a fee at the annual rate of 0.55% of the first $250 million of the Fund's average daily net assets, 0.525% of the next $250 million, 0.50% of the next $250 million, 0.475% of the next $250 million, 0.45% of the next $500 million, 0.425% of the next $2.5 billion, and 0.40% of average daily net assets in excess of $4 billion.
The Fund retains Management as its administrator under an Administration Agreement. The Fund pays Management an administration fee at the annual rate of 0.30% of its average daily net assets under this agreement. Additionally, Management retains State Street Bank and Trust Company ("State Street") as its sub-administrator under a Sub-Administration Agreement. Management pays State Street a fee for all services received under this agreement.
The Board adopted a non-fee distribution plan for the Fund.
Management has contractually undertaken through December 31, 2014 to forgo current payment of fees and/or reimburse the Fund for its operating expenses (excluding fees payable to Management, interest, taxes, brokerage
16
commissions, extraordinary expenses, transaction costs and dividend expense on short sales, if any) ("Operating Expenses") which exceed, in the aggregate, 1.00% per annum of the Fund's average daily net assets (the "Expense Limitation"). For the year ended December 31, 2011, such excess expenses amounted to $53,512. The Fund has agreed to repay Management through December 31, 2017 for fees and expenses foregone and/or its excess Operating Expenses previously reimbursed by Management, so long as its annual Operating Expenses during that period do not exceed its Expense Limitation, and the repayment is made within three years after the year in which Management issued the reimbursement or waived fees. During the year ended December 31, 2011, there was no repayment to Management under its contractual expense limitation. At December 31, 2011, contingent liabilities to Management under its contractual expense limitation were as follows:
| | | Expiring in: | |
| | | 2013 | | 2014 | | Total | |
| | | | | $ | 58,438 | | | $ | 53,512 | | | $ | 111,950 | | |
Neuberger Berman LLC ("Neuberger") is retained by Management to furnish it with investment recommendations and research information without added cost to the Fund. Several individuals who are officers and/or trustees of the Trust are also employees of Neuberger and/or Management.
Management and Neuberger are indirect subsidiaries of Neuberger Berman Group LLC ("NBG," and together with its consolidated subsidiaries "NB Group"). The voting equity of NBG is owned by NBSH Acquisition, LLC ("NBSH"), which was formed to facilitate the May 4, 2009 management buyout of the businesses conducted by NB Group, and Lehman Brothers Holdings Inc. ("LBHI"). NBSH, which is owned by portfolio managers, members of the NB Group management team and certain of NB Group's key employees and senior professionals, owns approximately 52% of the voting equity of NBG, and LBHI and certain of its subsidiaries own the remaining 48% of NBG's voting equity.
On December 14, 2011, the United States Bankruptcy Court for the Southern District of New York approved a motion filed by LBHI and certain of its subsidiaries, as debtors and debtors in possession, (collectively, the "Lehman Brothers Estate") that will provide NBG with the opportunity to purchase the Lehman Brothers Estate's interest in preferred and common equity of NBG. The proposed transactions, which are subject to the Lehman Brothers Estate and NBG signing definitive documentation, as well as to market conditions, would, if successfully implemented, enable NBG to have a lower cost capital structure and set it on a path to 100% employee ownership within the next five to six years.
Note C—Securities Transactions:
During the year ended December 31, 2011, there were purchase and sale transactions (excluding short-term securities) of $2,662,767 and $3,931,299, respectively.
During the years ended December 31, 2011, no brokerage commissions on securities transactions were paid to affiliated brokers.
Note D—Fund Share Transactions:
Share activity for the years ended December 31, 2011 and December 31, 2010 was as follows:
| | | For the Year Ended December 31, | |
| | | 2011 | | 2010 | |
| Shares Sold | | | 22,555 | | | | 26,076 | | |
| Shares Redeemed | | | (84,514 | ) | | | (96,132 | ) | |
| Total | | | (61,959 | ) | | | (70,056 | ) | |
17
Note E—Line of Credit:
At December 31, 2011, the Fund was a participant in a single committed, unsecured $200,000,000 line of credit with State Street, to be used only for temporary or emergency purposes. Other investment companies managed by Management also participate in this line of credit on the same terms. Interest is charged on borrowings under this line of credit at the higher of (a) the Federal Funds Rate plus 1.25% per annum or (b) the Overnight LIBOR Rate plus 1.25% per annum. A commitment fee of 0.10% (0.125% prior to September 16, 2011) per annum of the available line of credit is charged, of which each participating Fund has agreed to pay its pro rata share, based on the ratio of its individual net assets to the net assets of all participants at the time the fee is due and payable. The fee is paid quarterly in arrears. Because several mutual funds participate, there is no assurance that an individual Fund will have access to all or any part of the $200,000,000 at any particular time. There were no loans outstanding pursuant to this line of credit at December 31, 2011. During the year ended December 31, 2011, the Fund did not utilize this line of credit.
Note F—Recent Accounting Pronouncement:
In May 2011, the Financial Accounting Standards Board ("FASB") issued Accounting Standards Update ("ASU") No. 2011-04 "Amendments to Achieve Common Fair Value Measurement and Disclosure Requirements in U.S. GAAP and International Financial Reporting Standards ("IFRS")." ASU No. 2011-04 amends ASC 820 to establish common requirements for measuring fair value and for disclosing information about fair value measurements in accordance with GAAP and IFRS. It will not affect the fair valuation of the Fund's investments, but rather the quantitative and qualitative disclosures in the financial statements. ASU No. 2011-04 is effective for fiscal years beginning after December 15, 2011 and for interim periods within those fiscal years. Management is currently evaluating the impact of the adoption of ASU No. 2011-04 on the Fund's financial statement disclosures.
18
Financial Highlights
Growth Portfolio
The following table includes selected data for a share outstanding throughout each year and other performance information derived from the Financial Statements. Per share amounts that round to less than $.01 or $(.01) per share are presented as $.00 or $(.00), respectively.
| | | Year Ended December 31, | |
| | | 2011 | | 2010 | | 2009 | | 2008 | | 2007 | |
| Net Asset Value, Beginning of Year | | $ | 18.61 | | | $ | 14.20 | | | $ | 10.87 | | | $ | 19.30 | | | $ | 15.73 | | |
| Income From Investment Operations: | |
Net Investment Income (Loss)‡ | | | (.26 | ) | | | (.21 | ) | | | (.05 | ) | | | (.10 | ) | | | (.11 | ) | |
Net Gains or Losses on Securities (both realized and unrealized) | | | .22 | | | | 4.62 | | | | 3.38 | | | | (8.33 | ) | | | 3.68 | | |
| Total From Investment Operations | | | (.04 | ) | | | 4.41 | | | | 3.33 | | | | (8.43 | ) | | | 3.57 | | |
| Net Asset Value, End of Year | | $ | 18.57 | | | $ | 18.61 | | | $ | 14.20 | | | $ | 10.87 | | | $ | 19.30 | | |
Total Return†† | | | (.21 | )% | | | 31.06 | % | | | 30.63 | % | | | (43.68 | )% | | | 22.70 | % | |
| Ratios/Supplemental Data | |
| Net Assets, End of Year (in millions) | | $ | 7.3 | | | $ | 8.5 | | | $ | 7.5 | | | $ | 82.0 | | | $ | 172.6 | | |
Ratio of Gross Expenses to Average Net Assets# | | | 1.85 | % | | | 1.85 | % | | | 1.27 | % | | | 1.04 | % | | | 1.00 | % | |
Ratio of Net Expenses to Average Net Assets§ | | | 1.85 | % | | | 1.85 | % | | | 1.27 | % | | | 1.04 | % | | | .99 | % | |
Ratio of Net Investment Income (Loss) to Average Net Assets | | | (1.38 | )% | | | (1.33 | )% | | | (.49 | )% | | | (.63 | )% | | | (.61 | )% | |
| Portfolio Turnover Rate | | | 33 | % | | | 49 | % | | | 68 | % | | | 63 | % | | | 48 | % | |
See Notes to Financial Highlights
19
Notes to Financial Highlights Growth Portfolio
†† Total return based on per share NAV reflects the effects of changes in NAV on the performance of the Fund during each fiscal period and assumes income dividends and other distributions, if any, were reinvested. Results represent past performance and do not indicate future results. Current returns may be lower or higher than the performance data quoted. Investment returns and principal may fluctuate and shares when redeemed may be worth more or less than original cost. Total return would have been lower if Management had not reimbursed and/or waived certain expenses. The total return information shown does not reflect charges and other expenses that apply to the separate account or the related insurance policies, and the inclusion of these charges and other expenses would reduce the total return for all fiscal periods shown. For the year ended December 31, 2010, the Fund received proceeds from the settlements of class action litigation in which it participated as a class member, which had an approximate impact on total return of 2.91%.
# The Fund is required to calculate an expense ratio without taking into consideration any expense reductions related to expense offset arrangements.
‡ Calculated based on the average number of shares outstanding during each fiscal period.
§ After reimbursement of expenses and/or waiver of a portion of the investment management fee by Management. Had Management not undertaken such actions, the annualized ratios of net expenses to average daily net assets would have been:
| | | Year Ended December 31, | |
| 2011 | | 2010 | | 2009 | | 2008 | | 2007 | | | |
| | 2.52 | % | | | 2.64 | % | | | 1.27 | % | | | 1.04 | % | | | .99 | % | | | |
20
Report of Independent Registered Public Accounting Firm
To the Board of Trustees of
Neuberger Berman Advisers Management Trust and
Shareholders of Growth Portfolio
We have audited the accompanying statement of assets and liabilities, including the schedule of investments, of Growth Portfolio, one of the series constituting Neuberger Berman Advisers Management Trust (the "Trust"), as of December 31, 2011, and the related statement of operations for the year then ended, the statements of changes in net assets for each of the two years in the period then ended, and the financial highlights for each of the five years in the period then ended. These financial statements and financial highlights are the responsibility of the Trust's management. Our responsibility is to express an opinion on these financial statements and financial highlights based on our audits.
We conducted our audits in accordance with the standards of the Public Company Accounting Oversight Board (United States). Those standards require that we plan and perform the audit to obtain reasonable assurance about whether the financial statements and financial highlights are free of material misstatement. We were not engaged to perform an audit of the Trust's internal control over financial reporting. Our audits included consideration of internal control over financial reporting as a basis for designing audit procedures that are appropriate in the circumstances, but not for the purpose of expressing an opinion on the effectiveness of the Trust's internal control over financial reporting. Accordingly, we express no such opinion. An audit also includes examining, on a test basis, evidence supporting the amounts and disclosures in the financial statements and financial highlights, assessing the accounting principles used and significant estimates made by management, and evaluating the overall financial statement presentation. Our procedures included confirmation of securities owned as of December 31, 2011 by correspondence with the custodian and brokers or by other appropriate auditing procedures where replies from brokers were not received. We believe that our audits provide a reasonable basis for our opinion.
In our opinion, the financial statements and financial highlights referred to above present fairly, in all material respects, the financial position of Growth Portfolio, a series of Neuberger Berman Advisers Management Trust, at December 31, 2011, the results of its operations for the year then ended, the changes in its net assets for each of the two years in the period then ended, and the financial highlights for each of the five years in the period then ended, in conformity with U.S. generally accepted accounting principles.
Boston, Massachusetts
February 10, 2012
21
Trustee and Officer Information
The following tables set forth information concerning the trustees ("Trustees") and officers ("Officers") of the Trust. All persons named as Trustees and Officers also serve in similar capacities for other funds administered or managed by Management, Neuberger and Neuberger Berman Fixed Income LLC ("NBFI"). The Statement of Additional Information includes additional information about Trustees and is available upon request, without charge, by calling (800) 877-9700.
Information about the Board of Trustees
Name, (Year of Birth), and Address(1) | | Position and Length of Time Served(2) | | Principal Occupation(s)(3) | | Number of Funds in Fund Complex Overseen by Fund Trustee | | Other Directorships Held Outside Fund Complex by Fund Trustee | |
| Independent Trustees | |
| |
| John Cannon (1930) | | Trustee since 2000 | | Consultant; formerly, Chairman, CDC Investment Advisers (registered investment adviser), 1993 to January 1999; formerly, President and Chief Executive Officer, AMA Investment Advisors, an affiliate of the American Medical Association. | | | 47 | | | Formerly, Independent Trustee or Director of three series of Oppenheimer Funds: Oppenheimer Limited Term New York Municipal Fund, Rochester Fund Municipals, and Oppenheimer Convertible Securities Fund, 1992 to 2009. | |
| |
| Faith Colish (1935) | | Trustee since 1982 | | Counsel, Carter Ledyard & Milburn LLP (law firm) since October 2002; formerly, Attorney-at-Law and President, Faith Colish, A Professional Corporation, 1980 to 2002. | | | 47 | | | Formerly, Director, 1997 to 2003, and Advisory Director, 2003 to 2006, ABA Retirement Funds (formerly, American Bar Retirement Association) (not-for-profit membership corporation). | |
| |
22
Name, (Year of Birth), and Address(1) | | Position and Length of Time Served(2) | | Principal Occupation(s)(3) | | Number of Funds in Fund Complex Overseen by Fund Trustee | | Other Directorships Held Outside Fund Complex by Fund Trustee | |
| Martha C. Goss (1949) | | Trustee since 2007 | | President, Woodhill Enterprises Inc./Chase Hollow Associates LLC (personal investment vehicle), since 2006; Chief Operating and Financial Officer, Hopewell Holdings LLC/Amwell Holdings, LLC (a holding company for a healthcare reinsurance company start-up), since 2003; formerly, Consultant, Resources Connection (temporary staffing), 2002 to 2006. | | | 47 | | | Director, American Water (water utility), since 2003; Director, Channel Reinsurance (financial guaranty reinsurance), since 2006; Director, Allianz Life of New York (insurance), since 2005; Director, Financial Women's Association of New York (not-for-profit association), since 2003; Trustee Emerita, Brown University, since 1998; formerly, Director, Ocwen Financial Corporation (mortgage servicing), 2005 to 2010; formerly, Advisory Board Member, Attensity (software developer), 2005 to 2007; formerly, Director, Bank Leumi (commercial bank), 2005 to 2007; formerly, Director, Claire's Stores, Inc. (retailer), 2005 to 2007. | |
| |
| C. Anne Harvey (1937) | | Trustee since 1998 | | President, C.A. Harvey Associates, since October 2001; formerly, Director, AARP, 1978 to December 2001. | | | 47 | | | Formerly, President, Board of Associates to The National Rehabilitation Hospital's Board of Directors, 2001 to 2002; formerly, Member, Individual Investors Advisory Committee to the New York Stock Exchange Board of Directors, 1998 to 2002. | |
| |
23
Name, (Year of Birth), and Address(1) | | Position and Length of Time Served(2) | | Principal Occupation(s)(3) | | Number of Funds in Fund Complex Overseen by Fund Trustee | | Other Directorships Held Outside Fund Complex by Fund Trustee | |
| Robert A. Kavesh (1927) | | Trustee since 2000 | | Retired, since 2002; Marcus Nadler Professor Emeritus of Finance and Economics, New York University Stern School of Business; formerly, Executive Secretary-Treasurer, American Finance Association, 1961 to 1979. | | | 47 | | | Formerly, Director, The Caring Community (not-for-profit), 1997 to 2006; formerly, Director, DEL Laboratories, Inc. (cosmetics and pharmaceuticals), 1978 to 2004; formerly, Director, Apple Bank for Savings, 1979 to 1990; formerly, Director, Western Pacific Industries, Inc., (public company), 1972 to 1986. | |
| |
| Michael M. Knetter (1960) | | Trustee since 2007 | | President and Chief Executive Officer, University of Wisconsin Foundation, since October 2010; formerly, Dean, School of Business, University of Wisconsin - Madison; formerly, Professor of International Economics and Associate Dean, Amos Tuck School of Business - Dartmouth College, 1998 to 2002. | | | 47 | | | Director, American Family Insurance (a mutual company, not publicly traded), since March 2009; formerly, Trustee, Northwestern Mutual Series Fund, Inc., 2007 to 2010; formerly, Director, Wausau Paper, 2005 to 2011; formerly, Director, Great Wolf Resorts, 2004 to 2009. | |
| |
| Howard A. Mileaf (1937) | | Trustee since 1999 | | Retired; formerly, Vice President and General Counsel, WHX Corporation (holding company), 1993 to 2001. | | | 47 | | | Formerly, Director, Webfinancial Corporation (holding company), 2002 to 2008; formerly, Director, WHX Corporation (holding company), 2002 to 2005; formerly, Director, State Theatre of New Jersey (not-for-profit theatre), 2000 to 2005. | |
| |
| George W. Morriss (1947) | | Trustee since 2007 | | Retired; formerly, Executive Vice President and Chief Financial Officer, People's Bank, Connecticut (a financial services company), 1991 to 2001. | | | 47 | | | Manager, Larch Lane Multi-Strategy Fund complex (which currently consists of three funds), since 2006; formerly, Member, NASDAQ Issuers' Affairs Committee, 1995 to 2003. | |
| |
24
Name, (Year of Birth), and Address(1) | | Position and Length of Time Served(2) | | Principal Occupation(s)(3) | | Number of Funds in Fund Complex Overseen by Fund Trustee | | Other Directorships Held Outside Fund Complex by Fund Trustee | |
| Edward I. O'Brien (1928) | | Trustee since 2000 | | Private Investor; formerly, Member, Investment Policy Committee, Edward Jones, 1993 to 2001; President, Securities Industry Association ("SIA") (securities industry's representative in government relations and regulatory matters at the federal and state levels), 1974 to 1992; Adviser to SIA, November 1992 to November 1993. | | | 47 | | | Formerly, Director, Legg Mason, Inc. (financial services holding company), 1993 to July 2008; formerly, Director, Boston Financial Group (real estate and tax shelters), 1993 to 1999. | |
| |
| Jack L. Rivkin (1940) | | Trustee since 2002; President, 2002 to 2008 | | Formerly, Executive Vice President and Chief Investment Officer, Neuberger Berman Holdings LLC (holding company), 2002 to August 2008 and 2003 to August 2008, respectively; formerly, Managing Director and Chief Investment Officer, Neuberger, December 2005 to August 2008 and 2003 to August 2008, respectively; formerly, Executive Vice President, Neuberger, December 2002 to 2005; formerly, Director and Chairman, Management, December 2002 to August 2008; formerly, Executive Vice President, Citigroup Investments, Inc., September 1995 to February 2002; formerly, Executive Vice President, Citigroup Inc., September 1995 to February 2002. | | | 47 | | | Director, Idealab (private company), since 2009; Director, Distributed World Power (private company), since 2009; Director, Dale Carnegie and Associates, Inc. (private company), since 1999; Director, Solbright, Inc. (private company), since 1998; Director, SA Agricultural Fund, since 2009; Chairman and Director, Essential Brands (consumer products) since 2008; formerly, Director, New York Society of Security Analysts, 2006 to 2008. | |
| |
25
Name, (Year of Birth), and Address(1) | | Position and Length of Time Served(2) | | Principal Occupation(s)(3) | | Number of Funds in Fund Complex Overseen by Fund Trustee | | Other Directorships Held Outside Fund Complex by Fund Trustee | |
| Cornelius T. Ryan (1931) | | Trustee since 2000 | | General Partner and Adviser, TD2, TD3, and TOF1 Healthcare Venture Capital Partnerships; formerly, Founding General Partner, Oxford Partners and Oxford Bioscience Partners (venture capital investing) and President, Oxford Venture Corporation, 1981 to 2010. | | | 47 | | | Trustee, Norwalk Hospital Foundation, since 2000; Director, Supply Pro (privately held company), since 2008; formerly, Trustee, Norwalk Hospital, 1995 to 2004; formerly, President and Director, Randolph Computer Corp., 1966 to 1984; formerly, Director of numerous privately held portfolio companies of Oxford Partners and Oxford Bioscience Partners, 1981 to 2005. | |
| |
| Tom D. Seip (1950) | | Trustee since 2000; Chairman of the Board since 2008; Lead Independent Trustee from 2006 to 2008 | | General Partner, Ridgefield Farm LLC (a private investment vehicle); formerly, President and CEO, Westaff, Inc. (temporary staffing), May 2001 to January 2002; formerly, Senior Executive, The Charles Schwab Corporation, 1983 to 1998, including Chief Executive Officer, Charles Schwab Investment Management, Inc.; Trustee, Schwab Family of Funds and Schwab Investments, 1997 to 1998; and Executive Vice President-Retail Brokerage, Charles Schwab & Co., Inc., 1994 to 1997. | | | 47 | | | Director, H&R Block, Inc. (financial services company), since May 2001; formerly, Chairman, Compensation Committee, H&R Block, Inc., 2006 to 2010; formerly, Director, Forward Management, Inc. (asset management company), 1999 to 2006. | |
| |
26
Name, (Year of Birth), and Address(1) | | Position and Length of Time Served(2) | | Principal Occupation(s)(3) | | Number of Funds in Fund Complex Overseen by Fund Trustee | | Other Directorships Held Outside Fund Complex by Fund Trustee | |
| Candace L. Straight (1947) | | Trustee since 1999 | | Private investor and consultant specializing in the insurance industry; formerly, Advisory Director, Securitas Capital LLC (a global private equity investment firm dedicated to making investments in the insurance sector), 1998 to December 2003. | | | 47 | | | Public Member, Board of Governors and Board of Trustees, Rutgers University, since 2011; Director, Montpelier Re Holdings Ltd. (reinsurance company), since 2006; formerly, Director, National Atlantic Holdings Corporation (property and casualty insurance company), 2004 to 2008; formerly, Director, The Proformance Insurance Company (property and casualty insurance company), 2004 to 2008; formerly, Director, Providence Washington Insurance Company (property and casualty insurance company), 1998 to 2006; formerly, Director, Summit Global Partners (insurance brokerage firm), 2000 to 2005. | |
| |
| Peter P. Trapp (1944) | | Trustee since 1984 | | Retired; formerly, Regional Manager for Mid-Southern Region, Ford Motor Credit Company, September 1997 to 2007; formerly, President, Ford Life Insurance Company, April 1995 to August 1997. | | | 47 | | | None. | |
| |
27
Name, (Year of Birth), and Address(1) | | Position and Length of Time Served(2) | | Principal Occupation(s)(3) | | Number of Funds in Fund Complex Overseen by Fund Trustee | | Other Directorships Held Outside Fund Complex by Fund Trustee | |
| Trustees who are "Interested Persons" | |
| |
| Joseph V. Amato* (1962) | | Trustee since 2009 | | President and Director, Neuberger Berman Group LLC, since 2009; President and Chief Executive Officer, Neuberger and Neuberger Berman Holdings LLC (including its predecessor, Neuberger Berman Inc.), since 2007; Chief Investment Officer, Neuberger, since 2009; Chief Investment Officer (Equities) and Managing Director, Management, since 2009; Managing Director, Neuberger Berman Fixed Income LLC ("NBFI") since 2007; Board member of NBFI since 2006; formerly, Global Head of Asset Management of Lehman Brothers Holdings Inc.'s ("LBHI") Investment Management Division, 2006 to 2009; formerly, member of LBHI's Investment Management Division's Executive Management Committee, 2006 to 2009; formerly, Managing Director, Lehman Brothers Inc. ("LBI"), 2006 to 2008; formerly, Chief Recruiting and Development Officer, LBI, 2005 to 2006; formerly, Global Head of LBI's Equity Sales and a Member of its Equities Division Executive Committee, 2003 to 2005. | | | 47 | | | Member of Board of Advisors, McDonough School of Business, Georgetown University, since 2001; Member of New York City Board of Advisors, Teach for America, since 2005; Trustee, Montclair Kimberley Academy (private school), since 2007. | |
| |
28
Name, (Year of Birth), and Address(1) | | Position and Length of Time Served(2) | | Principal Occupation(s)(3) | | Number of Funds in Fund Complex Overseen by Fund Trustee | | Other Directorships Held Outside Fund Complex by Fund Trustee | |
| Robert Conti* (1956) | | Chief Executive Officer, President and Trustee since 2008; prior thereto, Executive Vice President in 2008 and Vice President, 2000 to 2008 | | Managing Director, Neuberger, since 2007; formerly, Senior Vice President, Neuberger, 2003 to 2006; formerly, Vice President, Neuberger, 1999 to 2003; President and Chief Executive Officer, Management, since 2008; formerly, Senior Vice President, Management, 2000 to 2008. | | | 47 | | | Director since 1994 and formerly, Chairman of the Board, 2008 to 2010, Staten Island Mental Health Society, Inc. | |
| |
(1) The business address of each listed person is 605 Third Avenue, New York, New York 10158.
(2) Pursuant to the Trust's Trust Instrument, each of these Trustees shall hold office for life or until his or her successor is elected or the Trust terminates; except that (a) any Trustee may resign by delivering a written resignation; (b) any Trustee may be removed with or without cause at any time by a written instrument signed by at least two-thirds of the other Trustees; (c) any Trustee who requests to be retired, or who has become unable to serve, may be retired by a written instrument signed by a majority of the other Trustees; and (d) any Trustee may be removed at any shareholder meeting by a vote of at least two-thirds of the outstanding shares.
(3) Except as otherwise indicated, each individual has held the positions shown for at least the last five years.
* Indicates a Trustee who is an "interested person" within the meaning of the 1940 Act. Mr. Amato and Mr. Conti are interested persons of the Trust by virtue of the fact that each is an officer of Management, Neuberger and/or their affiliates.
29
Information about the Officers of the Trust
Name, (Year of Birth), and Address(1) | | Position and Length of Time Served(2) | | Principal Occupation(s)(3) | |
| Andrew B. Allard (1961) | | Anti-Money Laundering Compliance Officer since 2002 | | Senior Vice President, Neuberger, since 2006 and Employee since 1999; Deputy General Counsel, Neuberger, since 2004; formerly, Vice President, Neuberger, 2000 to 2005; formerly, Employee, Management, 1994 to 1999; Anti-Money Laundering Compliance Officer, nine registered investment companies for which Management acts as investment manager and administrator (six since 2002, one since 2003, one since 2005 and one since 2006). | |
| |
| Claudia A. Brandon (1956) | | Executive Vice President since 2008 and Secretary since 1985 | | Senior Vice President, Neuberger, since 2007 and Employee since 1999; Senior Vice President, Management, since 2008 and Assistant Secretary since 2004; formerly, Vice President, Neuberger, 2002 to 2006; formerly, Vice President-Mutual Fund Board Relations, Management, 2000 to 2008; formerly, Vice President, Management, 1986 to 1999 and Employee 1984 to 1999; Executive Vice President, nine registered investment companies for which Management acts as investment manager and administrator (nine since 2008); Secretary, nine registered investment companies for which Management acts as investment manager and administrator (three since 1985, three since 2002, one since 2003, one since 2005 and one since 2006). | |
| |
| Anthony DiBernardo (1979) | | Assistant Treasurer since 2011 | | Vice President, Neuberger, since 2009; Employee, Management, since 2003; Assistant Treasurer, nine registered investment companies for which Management acts as investment manager and administrator. | |
| |
| Maxine L. Gerson (1950) | | Executive Vice President since 2008 and Chief Legal Officer since 2005 (only for purposes of sections 307 and 406 of the Sarbanes-Oxley Act of 2002) | | Managing Director, Neuberger, since 2009, and Deputy General Counsel and Assistant Secretary, Neuberger, since 2001; Managing Director, Management, since 2009, and Secretary and General Counsel, Management, since 2004; formerly, Senior Vice President, Neuberger, 2002 to 2009; formerly, Senior Vice President, Management, 2006 to 2009; Executive Vice President, nine registered investment companies for which Management acts as investment manager and administrator (nine since 2008); Chief Legal Officer (only for purposes of sections 307 and 406 of the Sarbanes-Oxley Act of 2002), nine registered investment companies for which Management acts as investment manager and administrator (eight since 2005 and one since 2006). | |
| |
| Sheila R. James (1965) | | Assistant Secretary since 2002 | | Vice President, Neuberger, since 2008 and Employee since 1999; formerly, Assistant Vice President, Neuberger, 2007; formerly, Employee, Management, 1991 to 1999; Assistant Secretary, nine registered investment companies for which Management acts as investment manager and administrator (six since 2002, one since 2003, one since 2005 and one since 2006). | |
| |
| Brian Kerrane (1969) | | Vice President since 2008 | | Senior Vice President, Neuberger, since 2006; formerly, Vice President, Neuberger, 2002 to 2006; Vice President, Management, since 2008 and Employee since 1991; Vice President, nine registered investment companies for which Management acts as investment manager and administrator (nine since 2008). | |
| |
30
Name, (Year of Birth), and Address(1) | | Position and Length of Time Served(2) | | Principal Occupation(s)(3) | |
| Kevin Lyons (1955) | | Assistant Secretary since 2003 | | Assistant Vice President, Neuberger, since 2008 and Employee since 1999; formerly, Employee, Management, 1993 to 1999; Assistant Secretary, nine registered investment companies for which Management acts as investment manager and administrator (seven since 2003, one since 2005 and one since 2006). | |
| |
| Owen F. McEntee, Jr. (1961) | | Vice President since 2008 | | Vice President, Neuberger, since 2006; Employee, Management, since 1992; Vice President, nine registered investment companies for which Management acts as investment manager and administrator (nine since 2008). | |
| |
| John M. McGovern (1970) | | Treasurer and Principal Financial and Accounting Officer since 2005 | | Senior Vice President, Neuberger, since 2007; formerly, Vice President, Neuberger, 2004 to 2006; Employee, Management, since 1993; Treasurer and Principal Financial and Accounting Officer, nine registered investment companies for which Management acts as investment manager and administrator (eight since 2005 and one since 2006); formerly, Assistant Treasurer, eight registered investment companies for which Management acts as investment manager and administrator, 2002 to 2005. | |
| |
| Frank Rosato (1971) | | Assistant Treasurer since 2005 | | Vice President, Neuberger, since 2006; Employee, Management, since 1995; Assistant Treasurer, nine registered investment companies for which Management acts as investment manager and administrator (eight since 2005 and one since 2006). | |
| |
| Neil S. Siegel (1967) | | Vice President since 2008 | | Managing Director, Management, since 2008; Managing Director, Neuberger, since 2006; formerly, Senior Vice President, Neuberger, 2004 to 2006; Vice President, nine registered investment companies for which Management acts as investment manager and administrator (nine since 2008). | |
| |
| Chamaine Williams (1971) | | Chief Compliance Officer since 2005 | | Senior Vice President, Neuberger, since 2007; Chief Compliance Officer, Management, since 2006; Chief Compliance Officer, nine registered investment companies for which Management acts as investment manager and administrator (eight since 2005 and one since 2006); formerly, Senior Vice President, LBI, 2007 to 2008; formerly, Vice President, LBI, 2003 to 2006; formerly, Chief Compliance Officer, Lehman Brothers Asset Management Inc., 2003 to 2007; formerly, Chief Compliance Officer, Lehman Brothers Alternative Investment Management LLC, 2003 to 2007. | |
| |
(1) The business address of each listed person is 605 Third Avenue, New York, New York 10158.
(2) Pursuant to the By-Laws of the Trust, each officer elected by the Trustees shall hold office until his or her successor shall have been elected and qualified or until his or her earlier death, inability to serve, or resignation. Officers serve at the pleasure of the Trustees and may be removed at any time with or without cause.
(3) Except as otherwise indicated, each individual has held the positions shown for at least the last five years.
31
Proxy Voting Policies and Procedures
A description of the policies and procedures that the Trust uses to determine how to vote proxies relating to portfolio securities is available, without charge, by calling 1-800-877-9700 (toll-free) and on the website of the Securities and Exchange Commission, at www.sec.gov. Information regarding how the Trust voted proxies relating to portfolio securities during the most recent 12-month period ended June 30 is also available, without charge, by calling 1-800-877-9700 (toll-free), on the website of the Securities and Exchange Commission at www.sec.gov, and on Management's website at www.nb.com.
Quarterly Portfolio Schedule
The Trust files a complete schedule of portfolio holdings for the Fund with the Securities and Exchange Commission for the first and third quarters of each fiscal year on Form N-Q. The Trust's Forms N-Q are available on the Securities and Exchange Commission's website at www.sec.gov and may be reviewed and copied at the Securities and Exchange Commission's Public Reference Room in Washington, DC. Information on the operation of the Public Reference Room may be obtained by calling 1-800-SEC-0330. The information on Form N-Q is available upon request, without charge, by calling 1-800-877-9700 (toll free).
Board Consideration of the Management and Sub-Advisory Agreements
At a meeting held on October 13, 2011, the Board, including the Trustees who are not "interested persons" of Management (including its affiliates) or Neuberger Berman Advisers Management Trust ("Independent Fund Trustees"), approved the continuance of the Management and Sub-Advisory Agreements ("Agreements") for the Fund.
In evaluating the Agreements, the Board, including the Independent Fund Trustees, reviewed materials furnished by Management and Neuberger in response to questions submitted by counsel for the Independent Fund Trustees, and met with senior representatives of Management and Neuberger regarding their personnel and operations. The Independent Fund Trustees were advised by counsel that is experienced in Investment Company Act of 1940 matters and that is independent of Management and Neuberger. The Independent Fund Trustees received a memorandum from independent counsel discussing the legal standards for their consideration of the proposed continuance of the Agreements. They met with such counsel separately from representatives of Management to discuss the annual contract review. The annual contract review extends over three regular meetings of the Board, including one meeting devoted primarily to reviewing and discussing Fund performance, to ensure that Management and Neuberger have time to respond to any questions the Independent Fund Trustees may have on their initial review of the report and that the Independent Fund Trustees have time to consider those responses.
The Board considered the following factors, among others, in connection with its approval of the continuance of the Agreements: (1) the nature, extent, and quality of the services provided by Management and Neuberger; (2) the performance of the Fund compared to a relevant market index and a peer group of investment companies; (3) the costs of the services provided and profits or losses realized by Management and its affiliates from their relationship with the Fund; (4) the extent to which economies of scale might be realized as the Fund grows; and (5) whether fee levels reflect any such potential economies of scale for the benefit of investors in the Fund. In their deliberations, the Board members did not identify any particular information that was all-important or controlling, and each Trustee may have attributed different weights to the various factors.
The Board evaluated the terms of the Agreements, the overall fairness of the Agreements to the Fund and whether the Agreements were in the best interests of the Fund and its shareholders.
With respect to the nature, extent and quality of the services provided, the Board considered the performance of the Fund and the experience and staffing of the portfolio management and investment research personnel of Management and Neuberger who perform services for the Fund. The Board noted that Management also provides certain administrative services, including fund accounting and compliance oversight. The Board also considered Management's and Neuberger's
32
policies and practices regarding brokerage and the allocation of portfolio transactions. The Board's Portfolio Transactions and Pricing Committee from time to time reviewed the quality of the execution services that Management and Neuberger had provided, and periodically reviews studies by an independent firm engaged to review and evaluate the quality of brokerage execution received by the Fund. The Board also reviewed whether Management and Neuberger used brokers to execute Fund transactions that provide research and other services to Management and Neuberger, and the types of benefits potentially derived from such services by Management, Neuberger, the Fund and other clients of Management and Neuberger. In addition, the Board noted the positive compliance history of Management and Neuberger, as each firm has been free of significant reported compliance problems.
The Board considered the performance of the Fund relative to its benchmark and the average performance of composite peer groups of investment companies dedicated to insurance products pursuing broadly similar strategies. The Board also reviewed performance in relation to certain measures of the degree of investment risk undertaken by the portfolio managers, during the period. The Board also considered Management's resources and responsiveness with respect to the Fund.
With respect to the overall fairness of the Agreements, the Board considered the fee structure for the Fund under the Agreements and any fall-out benefits likely to accrue to Management or Neuberger or their affiliates from their relationship with the Fund. The Board also considered the contractual limit on Fund expenses undertaken by Management. With regard to the sub-advisory fee paid to Neuberger, the Board noted that this fee is "at cost." In addition, the Board considered the profitability of Management and its affiliates from their association with the Fund and noted that Management incurred a loss on the Fund.
The Board considered whether there were other funds that were advised or sub-advised by Management or its affiliates or separate accounts managed by Management or its affiliates with similar investment objectives, policies and strategies to the Fund. The Board compared the fees charged to the Fund to the fees charged to a registered fund, a sub-advised fund and a separate account, each managed by Management in a similar style to the Fund. The Board considered the appropriateness and reasonableness of any differences between the fees charged to the Fund and the other funds and account and determined that the differences in fees were consistent with the management and other services provided.
The Board also evaluated any apparent or anticipated economies of scale in relation to the services Management provides to the Fund. The Board considered whether the Fund's fee structure provides for a reduction of payments resulting from the use of breakpoints and whether those breakpoints are set at appropriate asset levels. In concluding that the benefits accruing to Management and its affiliates by virtue of their relationship to the Fund were reasonable in comparison with the costs of providing the investment advisory services and the benefits accruing to the Fund, the Board reviewed specific data as to Management's loss on the Fund for a recent period and the trend in profit or loss over recent years. The Board also carefully examined Management's cost allocation methodology.
Conclusions
In approving the Agreements, the Board concluded that the terms of each Agreement are fair and reasonable and that approval of the Agreements is in the best interests of the Fund and its shareholders. In reaching this determination, the Board considered that Management and Neuberger could be expected to provide a high level of service to the Fund; that the performance of the Fund was satisfactory over time; that the Fund's fee structure appeared to the Board to be reasonable given the nature and quality of services provided; and that the benefits accruing to Management and its affiliates by virtue of their relationship to the Fund were reasonable in comparison with the benefits accruing to the Fund.
33

Neuberger Berman
Advisers Management Trust
Guardian Portfolio
I Class Shares
S Class Shares
Annual Report
December 31, 2011
B1016 02/12
Guardian Portfolio Commentary (Unaudited)
The Neuberger Berman Advisers Management Trust (AMT) Guardian Portfolio Class I generated a total return of –2.94% for the fiscal year ended December 31, 2011, underperforming its benchmark, the S&P 500 Index, which returned 2.11% for the same period. Returns for the Portfolio's Class I and Class S shares are provided on page 3.
The S&P 500 Index's nearly flat performance belies the dramatic events and extreme equity market volatility that characterized the year. As 2011 began, the general tone of the economy was positive, but as the year progressed, a harsh winter impacted macro demand, the Arab Spring added to volatility, and, by April, the economic effects of the disaster in Japan began to be felt. Supply chain disruptions impacted industrial production on a global basis, with a meaningful dampening effect on second quarter results. Late in the second quarter, sovereign debt pressures in Greece roiled the financial markets as the European Union and International Monetary Fund debated bailout terms and Greece's future in the eurozone. By late summer, worries extended to the future of the greater eurozone, the euro, and eurozone banks. At the same time, a damaging political stalemate around the U.S. debt ceiling resulted in a downgrade of the credit rating on U.S. Treasuries by Standard & Poor's.
As investors struggled to digest this news, fears of a double-dip recession reappeared and global financial markets became incredibly volatile. Credit spreads widened during this period of heightened uncertainty. The U.S. equity market, which peaked for the year in early May, hit its low in early October and then, with continued high volatility, market performance improved over the course of the fourth quarter to finish relatively flat for the year. Within the S&P 500 Index, defensive sectors, including Utilities, Consumer Staples and Health Care, were performance leaders. Financials and Materials stocks posted losses.
From a return perspective, the Portfolio saw strong performance during the first half of the year, and weaker performance during the second. However, the businesses within our Portfolio generally performed extremely well throughout the year, consistently delivering earnings regardless of the difficult environment.
Two stocks delivered the bulk of our underperformance for the year. Newfield Exploration declined as Wall Street, in our opinion, overreacted to the company's decision to reallocate its capital budget to maximize returns on capital. This decision modestly impacted 2011 production growth, but in our opinion positions the company for accelerated production growth with improving margins as management executes its revised business plan. Newfield continues to be a top holding, and we have taken advantage of the price disruption to add to our position. Hospira, a position we sold after the reporting period, declined after the company announced that ongoing FDA compliance and manufacturing issues were going to limit revenue and lead to higher costs.
From a sector perspective, Energy and Health Care were our weakest areas relative to the index this year, primarily as a result of these specific disappointments. To a lesser extent, Charles Schwab and Bank of New York Mellon, which was sold during the period, were also detrimental to performance. Information Technology was far and away our strongest sector for the year. Top performers included MasterCard, Google, National Instruments and Altera.
After an extremely tumultuous year, with significant impacts on business and investor sentiment, we exited 2011 with a better tone to the U.S. macro economy. Since 2008, our view has been that the debt situation in the western world would dampen economic growth and create market volatility. 2011 proved consistent with this view. As of this writing, we still lack a holistic solution in Europe—although the European Central Bank and other central banks have taken aggressive actions to add liquidity to the system to help counter stresses in the credit markets.
However, surprisingly, economic growth in the fourth quarter appears to have been higher than recent quarters, and third quarter growth was nominally positive against a headwind of severe inventory liquidations. We've been in this position twice before since 2008—where inventories have been drawn down because of fear, the economy ultimately finds its footing, and the base level of production needed to satisfy end market demand helps drive growth.
1
From a Portfolio perspective, by and large, the businesses in our Portfolio performed significantly better than what was reflected by their stock prices in 2011. Going into 2012, valuations generally reflect the broader macroeconomic uncertainty. To the extent that the Portfolio's companies have executed against a tough environment largely as we would have expected, we feel constructive about what we own and the forward prospects for their stocks should sentiment improve. We are also excited that we had the ability to add great names like Google and Ecolab over the past year—businesses that had been on our prospect list for a very long time.
As always, we look forward to continuing to serve your investment needs.
Sincerely,
Arthur Moretti
Portfolio Manager
Information about the principal risks of investing in the Portfolio is set forth in the prospectus and statement of additional information.
The composition, industries and holding of the Portfolio are subject to change.
2
Guardian Portfolio (Unaudited)
SECTOR ALLOCATION
| (as a % of Total Investments) | |
| Consumer Discretionary | | | 8.7 | % | |
| Consumer Staples | | | 11.9 | | |
| Energy | | | 14.7 | | |
| Financials | | | 11.2 | | |
| Health Care | | | 11.6 | | |
| Industrials | | | 14.4 | | |
| Information Technology | | | 20.9 | | |
| Materials | | | 5.5 | | |
| Short-Term Investments | | | 1.1 | | |
| Total | | | 100.0 | % | |
PERFORMANCE HIGHLIGHTS1
| | | Inception | | Average Annual Total Return Ended 12/31/2011 | |
| | | Date | | 1 Year | | 5 Years | | 10 Years | | Life of Fund* | |
Guardian Portfolio Class I | | | 11/03/1997 | | | | –2.94 | % | | | 0.19 | % | | | 3.37 | % | | | 5.75 | % | |
Guardian Portfolio Class S2 | | | 08/02/2002 | | | | –3.08 | % | | | 0.04 | % | | | 3.17 | % | | | 5.61 | % | |
S&P 500 Index3 | | | | | | | 2.11 | % | | | –0.25 | % | | | 2.92 | % | | | 4.11 | % | |
Performance data quoted represent past performance and do not indicate future results. The investment return and principal value of an investment will fluctuate so that an investor's shares, when redeemed, may be worth more or less than their original cost. Results are shown on a "total return" basis and include reinvestment of all income dividends and distributions.
Current performance may be lower or higher than the performance data quoted. For performance data current to the most recent month end, please visit https://www.nb.com.
* Index returns are as of the inception date 11/03/1997.
As stated in the Portfolio's most recent prospectus, the total annual operating expense ratios for fiscal year 2010 were 1.13% and 1.38% for Class I and Class S shares, respectively (prior to any fee waivers and/or expense reimbursements, if any). The expense ratio net of waivers and/or reimbursements was 1.25% for Class S shares. Neuberger Berman Management LLC has contractually agreed to limit certain expenses of the Portfolio through 12/31/2014 for Class I and Class S shares.
The results shown in the table do not reflect the effect of taxes an investor would pay on Portfolio distributions or on the redemption of Portfolio shares.
COMPARISON OF A $10,000 INVESTMENT
The graph shows the change in value of a hypothetical $10,000 investment in the Portfolio over the past 10 fiscal years, or since the Portfolio's inception, if it has not operated for 10 years. The graph is based on Class I shares only; performance of other classes will vary due to differences in fee structures (see Performance Highlights chart above). The result is compared with benchmarks, which may include a broad-based market index and/or a narrower index. Market indices have not been reduced to reflect any of the fees and costs of investing. All results include the reinvestment of income dividends and distributions. The results shown in the graph do not reflect the effect of taxes that an investor would pay on Portfolio distributions or the redemption of Portfolio shares. Results represent past performance and do not indicate future results.
Please see Endnotes for additional information.
3
Endnotes (Unaudited)
1 "Total Return" includes reinvestment of all income dividends and distributions. Results represent past performance and do not indicate future results. The value of an investment in the Portfolio and the return on the investment both will fluctuate, and redemption proceeds may be higher or lower than an investor's original cost. The performance information does not reflect fees and expenses of the variable annuity and variable life insurance policies or the qualified pension and retirement plans whose proceeds are invested in the Portfolio. Neuberger Berman Management LLC ("NBM LLC") has agreed to absorb certain expenses of the AMT Portfolios, including the Portfolio. Without this arrangement, which is subject to change, the total returns of the Portfolio may have been less.
2 Performance shown prior to August 2, 2002 for the Class S shares is that of the Class I shares, which has lower expenses and correspondingly higher returns than Class S shares.
3 The S&P 500 Index is widely regarded as the standard for measuring large-cap U.S. stock market performance and includes a representative sample of leading companies in leading industries. Please note that indices do not take into account any fees and expenses or tax consequences of investing in the individual securities that they track and that individuals cannot invest directly in any index. Data about the performance of this index are prepared or obtained by NBM LLC and include reinvestment of all income dividends and distributions. The Portfolio may invest in securities not included in the above-described index or may not invest in all securities included in the above-described index.
Any ratios or other measurements using a factor of forecasted earnings of a company discussed herein are based on consensus estimates, not NBM LLC's own projections, and they may or may not be realized. In addition, any revision to a forecast could affect the market price of a security. By quoting them herein, NBM LLC does not offer an opinion as to the accuracy of and does not guarantee these forecasted numbers.
The investments for the Portfolio are managed by the same portfolio manager(s) who manage(s) one or more other registered funds that have similar names, investment objectives and investment styles as the Portfolio. You should be aware that the Portfolio is likely to differ from the other mutual funds in size, cash flow pattern and tax matters. Accordingly, the holdings and performance can be expected to vary from those of the other mutual funds.
The composition, industries and holdings of the Portfolio are subject to change.
Shares of the separate AMT Portfolios are not available to the general public. Shares of this Portfolio may be purchased only by life insurance companies to be used with their separate accounts that fund variable annuity and variable life insurance policies and by qualified pension and retirement plans.
Statistics and projections in this report are derived from sources deemed to be reliable but cannot be regarded as a representation of future results of the AMT Portfolios. This report is prepared for the general information of shareholders and is not an offer of shares of the AMT Portfolios. Shares of the AMT Portfolios are sold only through the currently effective prospectuses, which must precede or accompany this report.
The "Neuberger Berman" name and logo are registered service marks of Neuberger Berman Group LLC. "Neuberger Berman Management LLC" and the individual Fund names in this piece are either service marks or registered service marks of Neuberger Berman Management LLC.
© 2012 Neuberger Berman Management LLC distributor. All rights reserved.
4
Information About Your Fund's Expenses (Unaudited)
This table is designed to provide information regarding costs related to your investments. All mutual funds incur operating expenses, which include management fees, fees for administrative services and costs of shareholder reports, among others. The following examples are based on an investment of $1,000 made at the beginning of the six month period ended December 31, 2011 and held for the entire period. The table illustrates the fund's costs in two ways:
| Actual Expenses and Performance: | | The first section of the table provides information about actual account values and actual expenses in dollars, based on the fund's actual performance during the period. You may use the information in this line, together with the amount you invested, to estimate the expenses you paid over the period. Simply divide your account value by $1,000 (for example, an $8,600 account value divided by $1,000 = 8.6), then multiply the result by the number in the first section of the table under the heading entitled "Expenses Paid During the Period" to estimate the expenses you paid over the period. | |
| |
Hypothetical Example for Comparison Purposes: | | The second section of the table provides information about hypothetical account values and hypothetical expenses based on the fund's actual expense ratio and an assumed rate of return at 5% per year before expenses. This return is not the fund's actual return. The hypothetical account values and expenses may not be used to estimate the actual ending account balance or expenses you paid for the period. You may use this information to compare the ongoing costs of investing in this fund versus other funds. To do so, compare the expenses shown in this 5% hypothetical example with the 5% hypothetical examples that appear in the shareholder reports of other funds. | |
| |
Please note that the expenses in the table are meant to highlight your ongoing costs only. The table and expense example do not include any transaction costs, such as fees and expenses that are, or may be, imposed under your variable contract or qualified pension plan. Therefore, the information under the heading "Hypothetical (5% annual return before expenses)" is useful in comparing ongoing costs only, and will not help you determine the relative total costs of owning different funds. In addition, if these transaction costs were included, your costs would have been higher.
Expense Information as of 12/31/11
NEUBERGER BERMAN ADVISERS MANAGEMENT TRUST GUARDIAN PORTFOLIO
| Actual | | Beginning Account Value 7/1/11 | | Ending Account Value 12/31/11 | | Expenses Paid During the Period* 7/1/11 – 12/31/11 | | Expense Ratio | |
| Class I | | $ | 1,000.00 | | | $ | 911.40 | | | $ | 5.49 | | | | 1.14 | % | |
| Class S | | $ | 1,000.00 | | | $ | 910.70 | | | $ | 6.02 | | | | 1.25 | % | |
| Hypothetical (5% annual return before expenses)** | |
| Class I | | $ | 1,000.00 | | | $ | 1,019.46 | | | $ | 5.80 | | | | 1.14 | % | |
| Class S | | $ | 1,000.00 | | | $ | 1,018.90 | | | $ | 6.36 | | | | 1.25 | % | |
* For each class, expenses are equal to the annualized expense ratio for the class, multiplied by the average account value over the period, multiplied by 184/365 (to reflect the one-half year period shown).
** Hypothetical 5% annual return before expenses is calculated by multiplying the number of days in the most recent half year divided by 365.
5
Schedule of Investments Guardian Portfolio
| NUMBER OF SHARES | | | | VALUE† | |
| Common Stocks (98.8%) | | | |
| Beverages (4.6%) | | | |
| | 29,200 | | | Anheuser-Busch InBev ADR | | $ | 1,780,908 | | |
| | 29,593 | | | Coca-Cola | | | 2,070,622 | | |
| | | | 3,851,530 | | |
| Capital Markets (6.9%) | | | |
| | 15,390 | | | BlackRock, Inc. | | | 2,743,113 | | |
| | 264,780 | | | Charles Schwab | | | 2,981,423 | | |
| | | | 5,724,536 | | |
| Chemicals (3.1%) | | | |
| | 44,355 | | | Ecolab Inc. | | | 2,564,163 | | |
| Commercial Services & Supplies (2.7%) | | | |
| | 82,921 | | | Republic Services | | | 2,284,474 | | |
Electronic Equipment, Instruments & Components (5.2%) | | | |
| | 35,358 | | | Anixter International | | | 2,108,751 | * | |
| | 84,087 | | | National Instruments | | | 2,182,058 | | |
| | | | 4,290,809 | | |
| Energy Equipment & Services (6.0%) | | | |
| | 40,610 | | | Cameron International | | | 1,997,606 | * | |
| | 42,962 | | | Schlumberger Ltd. | | | 2,934,734 | | |
| | | | 4,932,340 | | |
| Food Products (3.1%) | | | |
| | 50,655 | | | McCormick & Company | | | 2,554,025 | | |
| Health Care Equipment & Supplies (6.7%) | | | |
| | 36,220 | | | C.R. Bard | | | 3,096,810 | | |
| | 53,916 | | | Covidien PLC | | | 2,426,759 | | |
| | | | 5,523,569 | | |
| Household Products (4.1%) | | | |
| | 50,866 | | | Procter & Gamble | | | 3,393,271 | | |
| Industrial Conglomerates (8.1%) | | | |
| | 32,609 | | | 3M Co. | | | 2,665,134 | | |
| | 85,111 | | | Danaher Corp. | | | 4,003,621 | | |
| | | | 6,668,755 | | |
| Industrial Gases (2.4%) | | | |
| | 18,498 | | | Praxair, Inc. | | | 1,977,436 | | |
| Insurance (4.3%) | | | |
| | 180,655 | | | Progressive Corp. | | | 3,524,579 | | |
| NUMBER OF SHARES | | | | VALUE† | |
| Internet Software & Services (4.8%) | | | |
| | 6,100 | | | Google Inc. Class A | | $ | 3,939,990 | * | |
| IT Services (2.5%) | | | |
| | 5,580 | | | MasterCard, Inc. Class A | | | 2,080,336 | | |
| Media (5.8%) | | | |
| | 70,835 | | | Comcast Corp. Class A Special | | | 1,668,873 | | |
| | 73,789 | | | Scripps Networks Interactive Class A | | | 3,130,129 | | |
| | | | 4,799,002 | | |
| Multiline Retail (2.9%) | | | |
| | 46,765 | | | Target Corp. | | | 2,395,303 | | |
| Oil, Gas & Consumable Fuels (8.8%) | | | |
| | 164,129 | | | BG Group | | | 3,508,593 | | |
| | 99,250 | | | Newfield Exploration | | | 3,744,702 | * | |
| | | | 7,253,295 | | |
| Pharmaceuticals (4.9%) | | | |
| | 53,880 | | | Hospira, Inc. | | | 1,636,335 | * | |
| | 14,453 | | | Roche Holding | | | 2,449,609 | | |
| | | | 4,085,944 | | |
| Road & Rail (1.4%) | | | |
| | 14,694 | | | Canadian National Railway | | | 1,154,361 | | |
Semiconductors & Semiconductor Equipment (8.4%) | | | |
| | 96,264 | | | Altera Corp. | | | 3,571,395 | | |
| | 116,903 | | | Texas Instruments | | | 3,403,046 | | |
| | | | 6,974,441 | | |
| Trading Companies & Distributors (2.1%) | | | |
| | 9,136 | | | W.W. Grainger | | | 1,710,168 | | |
| | | | | Total Common Stocks (Cost $66,550,345) | | | 81,682,327 | | |
| Short-Term Investments (1.1%) | | | |
| | 930,746 | | | State Street Institutional Treasury Money Market Fund Institutional Class (Cost $930,746) | | | 930,746 | | |
| | | | | Total Investments (99.9%) (Cost $67,481,091) | | | 82,613,073 | ## | |
| | | | | Cash, receivables and other assets, less liabilities (0.1%) | | | 46,887 | | |
| | | | | Total Net Assets (100.0%) | | $ | 82,659,960 | | |
See Notes to Schedule of Investments
6
Notes to Schedule of Investments Guardian Portfolio
† In accordance with Accounting Standards Codification ("ASC") 820 "Fair Value Measurements and Disclosures" ("ASC 820"), all investments held by Neuberger Berman Advisers Management Trust Guardian Portfolio (the "Fund") are carried at the value that Neuberger Berman Management LLC ("Management") believes the Fund would receive upon selling an investment in an orderly transaction to an independent buyer in the principal or most advantageous market for the investment under current market conditions. Various inputs, including the volume and level of activity for the asset or liability in the market, are considered in valuing the Fund's investments, some of which are discussed below. Significant management judgment may be necessary to value investments in accordance with ASC 820.
ASC 820 established a three-tier hierarchy of inputs to create a classification of value measurements for disclosure purposes. The three-tier hierarchy of inputs is summarized in the three broad Levels listed below.
• Level 1 – quoted prices in active markets for identical investments
• Level 2 – other significant observable inputs (including quoted prices for similar investments, interest rates, prepayment speeds, credit risk, amortized cost, etc.)
• Level 3 – significant unobservable inputs (including the Fund's own assumptions in determining the fair value of investments)
The inputs or methodology used for valuing an investment are not necessarily an indication of the risk associated with investing in those securities.
The value of the Fund's investments in equity securities, for which market quotations are readily available, is generally determined by Management by obtaining valuations from an independent pricing service based on the latest sale price quoted on a principal exchange or market for that security (Level 1 inputs). Securities traded primarily on the NASDAQ Stock Market are normally valued by the Fund at the NASDAQ Official Closing Price ("NOCP") provided by NASDAQ each business day. The NOCP is the most recently reported price as of 4:00:02 p.m., Eastern time, unless that price is outside the range of the "inside" bid and asked prices (i.e., the bid and asked prices that dealers quote to each other when trading for their own accounts); in that case, NASDAQ will adjust the price to equal the inside bid or asked price, whichever is closer. Because of delays in reporting trades, the NOCP may not be based on the price of the last trade to occur before the market closes. If there is no reported sale of a security on a particular day, the independent pricing service may value the security based on reported market quotations.
Management has developed a process to periodically review information provided by independent pricing services for all types of securities.
Investments in State Street Institutional Treasury Money Market Fund Institutional Class are valued using the fund's daily calculated net asset value per share (Level 2 inputs).
If a valuation is not available from an independent pricing service, or if Management has reason to believe that the valuation received does not represent the amount the Fund might reasonably expect to receive on a current sale in an orderly transaction, the Fund seeks to obtain quotations from principal market makers (generally considered Level 3 inputs). If such quotations are not readily available, the security is valued using methods the Neuberger Berman Advisers Management Trust's Board of Trustees (the "Board") has approved on the belief that they reflect fair value. Numerous factors may be considered when determining the fair value of a security based on Level 2 or 3 inputs, including available analyst, media or other reports, trading in futures or ADRs and whether the issuer of the security being fair valued has other securities outstanding.
The value of the Fund's investments in foreign securities is generally determined using the same valuation methods and inputs as other Fund investments, as discussed above. Foreign security prices expressed in local currency values
See Notes to Financial Statements
7
Notes to Schedule of Investments Guardian Portfolio (cont'd)
are translated from the local currency into U.S. dollars using the exchange rates as of 4:00 p.m., Eastern time. The Board has approved the use of Interactive Data Pricing and Reference Data, Inc. ("Interactive") to assist in determining the fair value of foreign equity securities when changes in the value of a certain index suggest that the closing prices on the foreign exchanges may no longer represent the amount that the Fund could expect to receive for those securities. In this event, Interactive will provide adjusted prices for certain foreign equity securities using a statistical analysis of historical correlations of multiple factors (Level 2 inputs). In the absence of precise information about the market values of these foreign securities as of the close of the New York Stock Exchange, the Board has determined on the basis of available data that prices adjusted in this way are likely to be closer to the prices the Fund could realize on a current sale than are the prices of those securities established at the close of the foreign markets in which the securities primarily trade.
Fair value prices are necessarily estimates, and there is no assurance that such a price will be at or close to the price at which the security is next quoted or next trades.
The following is a summary, categorized by Level, of inputs used to value the Fund's investments as of December 31, 2011:
| Asset Valuation Inputs | | Level 1 | | Level 2 | | Level 3 | | Total | |
| Investments: | |
| Common Stocks^ | | $ | 81,682,327 | | | $ | — | | | $ | — | | | $ | 81,682,327 | | |
| Short-Term Investments | | | — | | | | 930,746 | | | | — | | | | 930,746 | | |
| Total Investments | | $ | 81,682,327 | | | $ | 930,746 | | | $ | — | | | $ | 82,613,073 | | |
^ The Schedule of Investments provides information on the industry categorization for the portfolio.
The Fund had no significant transfers between Levels 1 and 2 during the year ended December 31, 2011.
## At December 31, 2011, the cost of investments for U.S. federal income tax purposes was $67,835,459. Gross unrealized appreciation of investments was $17,500,334 and gross unrealized depreciation of investments was $2,722,720, resulting in net unrealized appreciation of $14,777,614, based on cost for U.S. federal income tax purposes.
* Security did not produce income during the last twelve months.
See Notes to Financial Statements
8
Statement of Assets and Liabilities
Neuberger Berman Advisers Management Trust
| | | GUARDIAN PORTFOLIO | |
| | | December 31, 2011 | |
| Assets | |
| Investments in securities, at value* (Note A)—see Schedule of Investments: | |
| Unaffiliated issuers | | $ | 82,613,073 | | |
| Cash | | | 4,082 | | |
| Dividends and interest receivable | | | 90,582 | | |
| Receivable for securities sold | | | 559,453 | | |
| Receivable for Fund shares sold | | | 3,967 | | |
| Prepaid expenses and other assets | | | 2,085 | | |
| Total Assets | | | 83,273,242 | | |
| Liabilities | |
| Payable for securities purchased | | | 473,651 | | |
| Payable for Fund shares redeemed | | | 8,887 | | |
| Payable to investment manager (Note B) | | | 38,338 | | |
| Payable to administrator—net (Note B) | | | 23,492 | | |
| Accrued expenses and other payables | | | 68,914 | | |
| Total Liabilities | | | 613,282 | | |
| Net Assets at value | | $ | 82,659,960 | | |
| Net Assets consist of: | |
| Paid-in capital | | $ | 67,603,677 | | |
| Undistributed net investment income (loss) | | | 144,861 | | |
| Accumulated net realized gains (losses) on investments | | | (220,338 | ) | |
| Net unrealized appreciation (depreciation) in value of investments | | | 15,131,760 | | |
| Net Assets at value | | $ | 82,659,960 | | |
| Net Assets | |
| Class I | | $ | 15,085,911 | | |
| Class S | | | 67,574,049 | | |
| Shares Outstanding ($.001 par value; unlimited shares authorized) | |
| Class I | | | 824,819 | | |
| Class S | | | 3,713,995 | | |
| Net Asset Value, offering and redemption price per share | |
| Class I | | $ | 18.29 | | |
| Class S | | | 18.19 | | |
| *Cost of Investments: | | | |
| Unaffiliated issuers | | $ | 67,481,091 | | |
See Notes to Financial Statements
9
Statement of Operations
Neuberger Berman Advisers Management Trust
| | | GUARDIAN PORTFOLIO | |
| | | For the Year Ended December 31, 2011 | |
| Investment Income: | |
| Income (Note A): | |
| Dividend income—unaffiliated issuers | | $ | 1,290,935 | | |
| Interest income—unaffiliated issuers | | | 1,774 | | |
| Foreign taxes withheld | | | (23,983 | ) | |
| Total income | | $ | 1,268,726 | | |
| Expenses: | |
| Investment management fees (Note B) | | | 497,081 | | |
| Administration fees (Note B): | | | |
| Class I | | | 50,043 | | |
| Class S | | | 221,092 | | |
| Distribution fees (Note B): | | | |
| Class S | | | 184,243 | | |
| Audit fees | | | 41,935 | | |
| Custodian fees (Note A) | | | 50,628 | | |
| Insurance expense | | | 5,469 | | |
| Legal fees | | | 49,374 | | |
| Shareholder reports | | | 45,107 | | |
| Trustees' fees and expenses | | | 55,592 | | |
| Miscellaneous | | | 6,019 | | |
| Total expenses | | | 1,206,583 | | |
| Expenses reimbursed by Management (Note B) | | | (96,517 | ) | |
| Total net expenses | | | 1,110,066 | | |
| Net investment income (loss) | | $ | 158,660 | | |
| Realized and Unrealized Gain (Loss) on Investments (Note A): | |
| Net realized gain (loss) on: | |
| Sales of investment securities of unaffiliated issuers | | | 4,390,565 | | |
| Foreign currency | | | (13,474 | ) | |
| Change in net unrealized appreciation (depreciation) in value of: | |
| Unaffiliated investment securities | | | (7,356,309 | ) | |
| Foreign currency | | | (2,788 | ) | |
| Net gain (loss) on investments | | | (2,982,006 | ) | |
| Net increase (decrease) in net assets resulting from operations | | $ | (2,823,346 | ) | |
See Notes to Financial Statements
10
Statements of Changes in Net Assets
Neuberger Berman Advisers Management Trust
| | | GUARDIAN PORTFOLIO | |
| | | Year Ended December 31, 2011 | | Year Ended December 31, 2010 | |
| Increase (Decrease) in Net Assets: | |
| From Operations (Note A): | |
| Net investment income (loss) | | $ | 158,660 | | | $ | 334,203 | | |
| Net realized gain (loss) on investments | | | 4,377,091 | | | | 8,273,072 | | |
| Change in net unrealized appreciation (depreciation) of investments | | | (7,359,097 | ) | | | 6,393,997 | | |
| Net increase (decrease) in net assets resulting from operations | | | (2,823,346 | ) | | | 15,001,272 | | |
| Distributions to Shareholders From (Note A): | |
| Net investment income: | |
| Class I | | | (78,575 | ) | | | (57,381 | ) | |
| Class S | | | (256,628 | ) | | | (226,058 | ) | |
| Total distributions to shareholders | | | (335,203 | ) | | | (283,439 | ) | |
| From Fund Share Transactions (Note D): | |
| Proceeds from shares sold: | |
| Class I | | | 8,767,410 | | | | 4,398,162 | | |
| Class S | | | 2,169,061 | | | | 2,324,104 | | |
| Proceeds from reinvestment of dividends and distributions: | |
| Class I | | | 78,575 | | | | 57,381 | | |
| Class S | | | 256,628 | | | | 226,058 | | |
| Payments for shares redeemed: | |
| Class I | | | (8,259,398 | ) | | | (5,360,459 | ) | |
| Class S | | | (9,516,461 | ) | | | (9,355,363 | ) | |
| Net increase (decrease) from Fund share transactions | | | (6,504,185 | ) | | | (7,710,117 | ) | |
| Net Increase (Decrease) in Net Assets | | | (9,662,734 | ) | | | 7,007,716 | | |
| Net Assets: | |
| Beginning of year | | | 92,322,694 | | | | 85,314,978 | | |
| End of year | | $ | 82,659,960 | | | $ | 92,322,694 | | |
| Undistributed net investment income (loss) at end of year | | $ | 144,861 | | | $ | 334,878 | | |
See Notes to Financial Statements
11
Notes to Financial Statements Guardian Portfolio
Note A—Summary of Significant Accounting Policies:
1 General: The Fund is a separate operating series of Neuberger Berman Advisers Management Trust (the "Trust"), a Delaware statutory trust organized pursuant to a Trust Instrument dated May 23, 1994. The Trust is currently comprised of ten separate operating series (each individually a "Series," and collectively the "Funds") each of which is diversified. The Trust is registered as an open-end management investment company under the Investment Company Act of 1940, as amended (the "1940 Act"), and its shares are registered under the Securities Act of 1933, as amended. The Fund currently offers Class I and Class S shares. The Board may establish additional series or classes of shares without the approval of shareholders.
The assets of each Series belong only to that Series, and the liabilities of each Series are borne solely by that Series and no other.
The preparation of financial statements in accordance with U.S. generally accepted accounting principles ("GAAP") requires Management to make estimates and assumptions at the date of the financial statements. Actual results could differ from those estimates.
2 Portfolio valuation: Investment securities are valued as indicated in the notes following the Schedule of Investments.
3 Foreign currency translation: The accounting records of the Fund are maintained in U.S. dollars. Foreign currency amounts are translated into U.S. dollars using the exchange rate as of 4:00 p.m., Eastern time, to determine the value of investments, other assets and liabilities. Purchase and sale prices of securities, and income and expenses, are translated into U.S. dollars at the prevailing rate of exchange on the respective dates of such transactions. Net unrealized foreign currency gain (loss), if any, arises from changes in the value of assets and liabilities, other than investments in securities, as a result of changes in exchange rates and is stated separately in the Statement of Operations.
4 Securities transactions and investment income: Securities transactions are recorded on trade date for financial reporting purposes. Dividend income is recorded on the ex-dividend date or, for certain foreign dividends, as soon as the Fund becomes aware of the dividends. Non-cash dividends included in dividend income, if any, are recorded at the fair market value of the securities received. Interest income, including accretion of original issue discount, where applicable, and accretion of discount on short-term investments, if any, is recorded on the accrual basis. Realized gains and losses from securities transactions and foreign currency transactions, if any, are recorded on the basis of identified cost and stated separately in the Statement of Operations. Included in net realized gain (loss) on investments are proceeds from the settlements of class action litigation in which the Fund participated as a class member. The amount of such proceeds for the year ended December 31, 2011 was $65,018.
5 Income tax information: The Funds are treated as separate entities for U.S. federal income tax purposes. It is the policy of the Fund to continue to qualify as a regulated investment company by complying with the requirements of the U.S. Internal Revenue Code applicable to regulated investment companies and to distribute substantially all of its earnings to its shareholders. To the extent the Fund distributes substantially all of its earnings to shareholders, no federal income or excise tax provision is required.
The Fund has adopted the provisions of ASC 740 "Income Taxes" ("ASC 740"). ASC 740 sets forth a minimum threshold for financial statement recognition of a tax position taken, or expected to be taken, in a tax return. The Fund recognizes interest and penalties, if any, related to unrecognized tax positions as an income tax expense in the Statement of Operations. The Fund is subject to examination by U.S. federal and state tax authorities for returns filed for the prior three fiscal years 2008-2010. As of December 31, 2011, the Fund did not have any unrecognized tax positions.
12
Income distributions and capital gain distributions are determined in accordance with income tax regulations, which may differ from GAAP. These differences are primarily due to differing treatments of income and gains on various investment securities held by the Fund, timing differences and differing characterization of distributions made by the Fund as a whole. The Fund may also utilize earnings and profits distributed to shareholders on redemption of shares as a part of the dividends paid deduction for income tax purposes.
As determined on December 31, 2011, permanent differences resulting primarily from different book and tax accounting for foreign currency gains and losses were reclassified at fiscal year-end. These reclassifications had no effect on net income, net asset value ("NAV") or NAV per share of the Fund. For the year ended December 31, 2011, the Fund recorded the following permanent reclassifications:
| Paid-in Capital | | Undistributed Net Investment Income (Loss) | | Accumulated Net Realized Gains (Losses) on Investments | |
| $ | — | | | $ | (13,474 | ) | | $ | 13,474 | | |
For tax purposes, short-term gains are considered ordinary income.
The tax character of distributions paid during the years ended December 31, 2011 and December 31, 2010 was as follows:
| | | Distributions Paid From: | |
| | | Ordinary Income | | Long-Term Gains | | Total | |
| | | 2011 | | 2010 | | 2011 | | 2010 | | 2011 | | 2010 | |
| | | | | $ | 335,203 | | | $ | 283,439 | | | $ | — | | | $ | — | | | $ | 335,203 | | | $ | 283,439 | | |
As of December 31, 2011, the components of distributable earnings (accumulated losses) on a U.S. federal income tax basis were as follows:
Undistributed Ordinary Income | | Undistributed Long-Term Gain | | Unrealized Appreciation (Depreciation) | | Loss Carryforwards and Deferrals | | Other Temporary Differences | | Total | |
| $ | 144,455 | | | $ | 665,243 | | | $ | 14,777,798 | | | $ | (531,213 | ) | | $ | — | | | $ | 15,056,283 | | |
The difference between book basis and tax basis distributable earnings is attributable primarily to timing differences of wash sales, forward contracts mark to market and capital loss carryforwards.
To the extent the Fund's net realized capital gains, if any, can be offset by capital loss carryforwards, it is the policy of the Fund not to distribute such gains. The Regulated Investment Company ("RIC") Modernization Act of 2010 (the "Act") became effective for the Fund on January 1, 2011. The Act modernizes several of the federal income and excise tax provisions related to RICs. Among the changes made are changes to the capital loss carryforward rules allowing for RICs to carry forward capital losses indefinitely and to retain the character of capital loss carryforwards as short-term or long-term ("Post-Enactment"). Rules in effect previously limited the carryforward period to eight years and all carryforwards were considered short-term in character ("Pre-Enactment"). As determined at December 31, 2011, the Fund had unused capital loss carryforwards available for federal income tax purposes to offset net realized capital gains, if any, as follows:
| | | Pre-Enactment | | Post-Enactment (No Expiration Date) | |
| | | Expiring in: 2017 | | Long-Term | | Short-Term | |
| | | | | $ | 531,213 | | | $ | — | | | $ | — | | |
Post-Enactment capital loss carryforwards must be fully used before Pre-Enactment capital loss carryforwards; therefore, under certain circumstances, Pre-Enactment capital loss carryforwards available as of the report date may expire unused.
13
During the year ended December 31, 2011, the Fund utilized capital loss carryforwards of $3,680,897.
6 Distributions to shareholders: The Fund may earn income, net of expenses, daily on its investments. Distributions from net investment income and net realized capital gains, if any, generally are distributed once a year (usually in October). Income distributions and capital gain distributions to shareholders are recorded on the ex-date.
7 Foreign taxes: Foreign taxes withheld represent amounts withheld by foreign tax authorities, net of refunds recoverable.
8 Expense allocation: Certain expenses are applicable to multiple funds. Expenses directly attributable to a Series are charged to that Series. Expenses of the Trust that are not directly attributable to a particular series of the Trust (e.g., the Fund) are allocated among the series of the Trust, on the basis of relative net assets, except where a more appropriate allocation of expenses to each of the series can otherwise be made fairly. Expenses borne by the complex of related investment companies, which includes open-end and closed-end investment companies for which Management serves as investment manager, that are not directly attributable to a particular investment company in the complex (e.g., the Trust) or series thereof are allocated among the investment companies in the complex or series thereof, on the basis of relative net assets, except where a more appropriate allocation of expenses to each of the investment companies in the complex or series thereof can otherwise be made fairly. The Fund's expenses (other than those specific to each class) are allocated proportionally each day between the classes based upon the relative net assets of each class.
9 Investments in foreign securities: Investing in foreign securities may involve certain sovereign and other risks, in addition to the credit and market risks normally associated with domestic securities. These additional risks include the possibility of adverse political and economic developments (including political instability, nationalization, expropriation, or confiscatory taxation) and the potentially adverse effects of unavailability of public information regarding issuers, less governmental supervision and regulation of financial markets, reduced liquidity of certain financial markets, and the lack of uniform accounting, auditing, and financial reporting standards or the application of standards that are different or less stringent than those applied in the United States. Foreign securities also may experience greater price volatility, higher rates of inflation, and delays in settlement.
10 Indemnifications: Like many other companies, the Trust's organizational documents provide that its officers and trustees are indemnified against certain liabilities arising out of the performance of their duties to the Trust. In addition, both in some of its principal service contracts and in the normal course of its business, the Trust enters into contracts that provide indemnifications to other parties for certain types of losses or liabilities. The Trust's maximum exposure under these arrangements is unknown as this could involve future claims against the Trust.
11 Expense offset arrangement: The Fund has an expense offset arrangement in connection with its custodian contract. For the year ended December 31, 2011, there was no reduction of expenses under this agreement.
12 Other: All net investment income and realized and unrealized capital gains and losses of the Fund are allocated, on the basis of relative net assets, pro rata among its respective classes.
Note B—Management Fees, Administration Fees, Distribution Arrangements, and Other Transactions With Affiliates:
Fund shares are issued and redeemed in connection with investments in and payments under certain variable annuity contracts and variable life insurance policies issued through separate accounts of life insurance companies and are also offered directly to certain qualified pension and retirement plans.
The Fund retains Management as its investment manager under a Management Agreement. For such investment management services, the Fund pays Management a fee at the annual rate of 0.55% of the first $250 million of the Fund's average daily net assets, 0.525% of the next $250 million, 0.50% of the next $250 million, 0.475% of the
14
next $250 million, 0.45% of the next $500 million, 0.425% of the next $2.5 billion, and 0.40% of average daily net assets in excess of $4 billion.
The Fund retains Management as its administrator under an Administration Agreement. Each class pays Management an administration fee at the annual rate of 0.30% of its average daily net assets under this agreement. Additionally, Management retains State Street Bank and Trust Company ("State Street") as its sub-administrator under a Sub-Administration Agreement. Management pays State Street a fee for all services received under this agreement.
The Board adopted a non-fee distribution plan for the Fund's Class I.
For the Fund's Class S, Management acts as agent in arranging for the sale of class shares without commission and bears advertising and promotion expenses. The Board has adopted a distribution plan (the "Plan") with respect to this class, pursuant to Rule 12b-1 under the 1940 Act. The Plan provides that, as compensation for administrative and other services provided to this class, Management's activities and expenses related to the sale and distribution of this class of shares, and ongoing services provided to investors in this class, Management receives from this class a fee at the annual rate of 0.25% of Class S's average daily net assets. Management receives this amount to provide distribution and shareholder servicing for this class and pays a portion of it to institutions that provide such services. Those institutions may use the payments for, among other purposes, compensating employees engaged in sales and/or shareholder servicing. The amount of fees paid by this class during any year could have been more or less than the cost of distribution and other services provided to this class. FINRA rules limit the amount of annual distribution fees that may be paid by a mutual fund and impose a ceiling on the cumulative distribution fees paid. The Trust's Plan complies with those rules.
Management has contractually undertaken to forgo current payment of fees and/or reimburse the Fund's Class I and Class S shares for their operating expenses (excluding fees payable to Management (including fees payable to Management with respect to the Fund's Class S shares), interest, taxes, brokerage commissions, extraordinary expenses, transaction costs and dividend expense on short sales, if any) ("Operating Expenses") which exceed the expense limitation as detailed in the following table:
| | | Expense Limitation(1) | | Expiration | | Reimbursement from Management for the Year Ended December 31, 2011 | |
| Class I | | | 1.00 | % | | 12/31/14 | | $ | — | | |
| Class S | | | 1.25 | % | | 12/31/14 | | | 96,517 | | |
(1) Expense limitation per annum of the respective class' average daily net assets.
Each respective class has agreed to repay Management through December 31, 2017 for fees and expenses foregone and/or its excess Operating Expenses previously reimbursed by Management, so long as its annual Operating Expenses during that period do not exceed its expense limitation, and the repayment is made within three years after the year in which Management issued the reimbursement or waived fees. During the year ended December 31, 2011, there was no repayment to Management under its contractual expense limitation. At December 31, 2011, the Fund's Class I shares had no contingent liability to Management under its contractual expense limitation. At December 31, 2011, the Fund's Class S shares contingent liabilities to Management under its contractual expense limitation were as follows:
| | | Expiring in: | | | |
| | | 2012 | | 2013 | | 2014 | | Total | |
| Class S | | $ | 79,295 | | | $ | 91,992 | | | $ | 96,517 | | | $ | 267,804 | | |
15
Neuberger Berman LLC ("Neuberger") is retained by Management to furnish it with investment recommendations and research information without added cost to the Fund. Several individuals who are officers and/or trustees of the Trust are also employees of Neuberger and/or Management.
Management and Neuberger are indirect subsidiaries of Neuberger Berman Group LLC ("NBG," and together with its consolidated subsidiaries "NB Group"). The voting equity of NBG is owned by NBSH Acquisition, LLC ("NBSH"), which was formed to facilitate the May 4, 2009 management buyout of the businesses conducted by NB Group, and Lehman Brothers Holdings Inc. ("LBHI"). NBSH, which is owned by portfolio managers, members of the NB Group management team and certain of NB Group's key employees and senior professionals, owns approximately 52% of the voting equity of NBG, and LBHI and certain of its subsidiaries own the remaining 48% of NBG's voting equity.
On December 14, 2011, the United States Bankruptcy Court for the Southern District of New York approved a motion filed by LBHI and certain of its subsidiaries, as debtors and debtors in possession, (collectively, the "Lehman Brothers Estate") that will provide NBG with the opportunity to purchase the Lehman Brothers Estate's interest in preferred and common equity of NBG. The proposed transactions, which are subject to the Lehman Brothers Estate and NBG signing definitive documentation, as well as to market conditions, would, if successfully implemented, enable NBG to have a lower cost capital structure and set it on a path to 100% employee ownership within the next five to six years.
Note C—Securities Transactions:
During the year ended December 31, 2011, there were purchase and sale transactions (excluding short-term securities) of $24,190,821 and $29,351,991, respectively.
During the year ended December 31, 2011, no brokerage commissions on securities transactions were paid to affiliated brokers.
Note D—Fund Share Transactions:
Share activity for the years ended December 31, 2011 and December 31, 2010 was as follows:
For the Year Ended December 31, 2011
| | | Shares Sold | | Shares Issued on Reinvestment of Dividends and Distributions | | Shares Redeemed | | Total | |
| Class I | | | 440,908 | | | | 4,370 | | | | (427,584 | ) | | | 17,694 | | |
| Class S | | | 113,237 | | | | 14,345 | | | | (501,949 | ) | | | (374,367 | ) | |
For the Year Ended December 31, 2010
| | | Shares Sold | | Shares Issued on Reinvestment of Dividends and Distributions | | Shares Redeemed | | Total | |
| Class I | | | 259,281 | | | | 3,309 | | | | (315,796 | ) | | | (53,206 | ) | |
| Class S | | | 136,987 | | | | 13,105 | | | | (564,453 | ) | | | (414,361 | ) | |
16
Note E—Line of Credit:
At December 31, 2011, the Fund was a participant in a single committed, unsecured $200,000,000 line of credit with State Street, to be used only for temporary or emergency purposes. Other investment companies managed by Management also participate in this line of credit on the same terms. Interest is charged on borrowings under this line of credit at the higher of (a) the Federal Funds Rate plus 1.25% per annum or (b) the Overnight LIBOR Rate plus 1.25% per annum. A commitment fee of 0.10% (0.125% prior to September 16, 2011) per annum of the available line of credit is charged, of which each participating Fund has agreed to pay its pro rata share, based on the ratio of its individual net assets to the net assets of all participants at the time the fee is due and payable. The fee is paid quarterly in arrears. Because several mutual funds participate, there is no assurance that an individual Fund will have access to all or any part of the $200,000,000 at any particular time. There were no loans outstanding pursuant to this line of credit at December 31, 2011. During the year ended December 31, 2011, the Fund did not utilize this line of credit.
Note F—Recent Accounting Pronouncement:
In May 2011, the Financial Accounting Standards Board ("FASB") issued Accounting Standards Update ("ASU") No. 2011-04 "Amendments to Achieve Common Fair Value Measurement and Disclosure Requirements in U.S. GAAP and International Financial Reporting Standards ("IFRS")." ASU No. 2011-04 amends ASC 820 to establish common requirements for measuring fair value and for disclosing information about fair value measurements in accordance with GAAP and IFRS. It will not affect the fair valuation of the Fund's investments, but rather the quantitative and qualitative disclosures in the financial statements. ASU No. 2011-04 is effective for fiscal years beginning after December 15, 2011 and for interim periods within those fiscal years. Management is currently evaluating the impact of the adoption of ASU No. 2011-04 on the Fund's financial statement disclosures.
17
Financial Highlights
Guardian Portfolio
The following tables include selected data for a share outstanding throughout each year and other performance information derived from the Financial Statements. Per share amounts that round to less than $.01 or $(.01) per share are presented as $.00 or $(.00), respectively.
| Class I | |
| | | Year Ended December 31, | |
| | | 2011 | | 2010 | | 2009 | | 2008 | | 2007 | |
| Net Asset Value, Beginning of Year | | $ | 18.94 | | | $ | 15.98 | | | $ | 12.45 | | | $ | 21.11 | | | $ | 19.71 | | |
| Income From Investment Operations: | |
Net Investment Income (Loss)‡ | | | .05 | | | | .08 | | | | .05 | | | | .12 | | | | .11 | | |
Net Gains or Losses on Securities (both realized and unrealized) | | | (.61 | ) | | | 2.95 | | | | 3.64 | | | | (7.97 | ) | | | 1.35 | | |
| Total From Investment Operations | | | (.56 | ) | | | 3.03 | | | | 3.69 | | | | (7.85 | ) | | | 1.46 | | |
| Less Distributions From: | |
| Net Investment Income | | | (.09 | ) | | | (.07 | ) | | | (.16 | ) | | | (.10 | ) | | | (.06 | ) | |
| Net Capital Gains | | | — | | | | — | | | | — | | | | (.71 | ) | | | — | | |
| Total Distributions | | | (.09 | ) | | | (.07 | ) | | | (.16 | ) | | | (.81 | ) | | | (.06 | ) | |
| Net Asset Value, End of Year | | $ | 18.29 | | | $ | 18.94 | | | $ | 15.98 | | | $ | 12.45 | | | $ | 21.11 | | |
Total Return†† | | | (2.94 | )% | | | 19.01 | % | | | 29.69 | % | | | (37.24 | )% | | | 7.39 | % | |
| Ratios/Supplemental Data | |
| Net Assets, End of Year (in millions) | | $ | 15.1 | | | $ | 15.3 | | | $ | 13.7 | | | $ | 67.0 | | | $ | 129.1 | | |
Ratio of Gross Expenses to Average Net Assets# | | | 1.13 | % | | | 1.13 | % | | | 1.10 | % | | | 1.01 | % | | | .99 | % | |
| Ratio of Net Expenses to Average Net Assets | | | 1.13 | % | | | 1.13 | % | | | 1.10 | %§ | | | 1.01 | %§ | | | .99 | %§ | |
Ratio of Net Investment Income (Loss) to Average Net Assets | | | .26 | % | | | .50 | % | | | .39 | % | | | .65 | % | | | .55 | % | |
| Portfolio Turnover Rate | | | 27 | % | | | 35 | % | | | 30 | % | | | 32 | % | | | 38 | % | |
See Notes to Financial Highlights
18
Financial Highlights (cont'd)
| Class S | |
| | | Year Ended December 31, | |
| | | 2011 | | 2010 | | 2009 | | 2008 | | 2007 | |
| Net Asset Value, Beginning of Year | | $ | 18.84 | | | $ | 15.89 | | | $ | 12.38 | | | $ | 21.02 | | | $ | 19.67 | | |
| Income From Investment Operations: | |
Net Investment Income (Loss)‡ | | | .03 | | | | .06 | | | | .02 | | | | .08 | | | | .09 | | |
Net Gains or Losses on Securities (both realized and unrealized) | | | (.61 | ) | | | 2.94 | | | | 3.63 | | | | (7.92 | ) | | | 1.32 | | |
| Total From Investment Operations | | | (.58 | ) | | | 3.00 | | | | 3.65 | | | | (7.84 | ) | | | 1.41 | | |
| Less Distributions From: | |
| Net Investment Income | | | (.07 | ) | | | (.05 | ) | | | (.14 | ) | | | (.09 | ) | | | (.06 | ) | |
| Net Capital Gains | | | — | | | | — | | | | — | | | | (.71 | ) | | | — | | |
| Total Distributions | | | (.07 | ) | | | (.05 | ) | | | (.14 | ) | | | (.80 | ) | | | (.06 | ) | |
| Net Asset Value, End of Year | | $ | 18.19 | | | $ | 18.84 | | | $ | 15.89 | | | $ | 12.38 | | | $ | 21.02 | | |
Total Return†† | | | (3.08 | )% | | | 18.94 | % | | | 29.50 | % | | | (37.36 | )% | | | 7.14 | % | |
| Ratios/Supplemental Data | |
| Net Assets, End of Year (in millions) | | $ | 67.6 | | | $ | 77.0 | | | $ | 71.6 | | | $ | 48.6 | | | $ | 32.5 | | |
Ratio of Gross Expenses to Average Net Assets# | | | 1.25 | % | | | 1.25 | % | | | 1.25 | % | | | 1.25 | % | | | 1.24 | % | |
Ratio of Net Expenses to Average Net Assets§ | | | 1.25 | % | | | 1.25 | % | | | 1.25 | % | | | 1.25 | % | | | 1.24 | % | |
Ratio of Net Investment Income (Loss) to Average Net Assets | | | .16 | % | | | .37 | % | | | .16 | % | | | .48 | % | | | .42 | % | |
| Portfolio Turnover Rate | | | 27 | % | | | 35 | % | | | 30 | % | | | 32 | % | | | 38 | % | |
See Notes to Financial Highlights
19
Notes to Financial Highlights Guardian Portfolio
†† Total return based on per share NAV reflects the effects of changes in NAV on the performance of the Fund during each fiscal period and assumes income dividends and other distributions, if any, were reinvested. Results represent past performance and do not indicate future results. Current returns may be lower or higher than the performance data quoted. Investment returns and principal may fluctuate and shares when redeemed may be worth more or less than original cost. Total return would have been lower if Management had not reimbursed and/or waived certain expenses. Total return would have been higher if Management had not recouped previously reimbursed expenses. The total return information shown does not reflect charges and other expenses that apply to the separate account or the related insurance policies, and the inclusion of these charges and other expenses would reduce the total return for all fiscal periods shown.
# The Fund is required to calculate an expense ratio without taking into consideration any expense reductions related to expense offset arrangements.
‡ Calculated based on the average number of shares outstanding during each fiscal period.
§ After reimbursement of expenses and/or waiver of a portion of the investment management fee by Management. Had Management not undertaken such actions, the annualized ratios of net expenses to average daily net assets would have been:
| | | Year Ended December 31, | |
| | | 2011 | | 2010 | | 2009 | | 2008 | | 2007 | |
| Guardian Portfolio Class I | | | — | | | | — | | | | 1.10 | % | | | 1.01 | % | | | .99 | % | |
| Guardian Portfolio Class S | | | 1.38 | % | | | 1.38 | % | | | 1.38 | % | | | 1.27 | % | | | 1.24 | % | |
After reimbursement of expenses previously paid by Management and/or waiver of a portion of the investment management fee by Management. Had the Fund not made such reimbursements or Management not undertaken such actions, the annualized ratio of net expenses to average daily net assets would have been:
| | | Year Ended December 31, 2007 | |
| Guardian Portfolio Class S | | | 1.24 | % | |
20
Report of Independent Registered Public Accounting Firm
To the Board of Trustees of
Neuberger Berman Advisers Management Trust and
Shareholders of Guardian Portfolio
We have audited the accompanying statement of assets and liabilities, including the schedule of investments, of Guardian Portfolio, one of the series constituting Neuberger Berman Advisers Management Trust (the "Trust"), as of December 31, 2011, and the related statement of operations for the year then ended, the statements of changes in net assets for each of the two years in the period then ended, and the financial highlights for each of the five years in the period then ended. These financial statements and financial highlights are the responsibility of the Trust's management. Our responsibility is to express an opinion on these financial statements and financial highlights based on our audits.
We conducted our audits in accordance with the standards of the Public Company Accounting Oversight Board (United States). Those standards require that we plan and perform the audit to obtain reasonable assurance about whether the financial statements and financial highlights are free of material misstatement. We were not engaged to perform an audit of the Trust's internal control over financial reporting. Our audits included consideration of internal control over financial reporting as a basis for designing audit procedures that are appropriate in the circumstances, but not for the purpose of expressing an opinion on the effectiveness of the Trust's internal control over financial reporting. Accordingly, we express no such opinion. An audit also includes examining, on a test basis, evidence supporting the amounts and disclosures in the financial statements and financial highlights, assessing the accounting principles used and significant estimates made by management, and evaluating the overall financial statement presentation. Our procedures included confirmation of securities owned as of December 31, 2011 by correspondence with the custodian and brokers or by other appropriate auditing procedures where replies from brokers were not received. We believe that our audits provide a reasonable basis for our opinion.
In our opinion, the financial statements and financial highlights referred to above present fairly, in all material respects, the financial position of Guardian Portfolio, a series of Neuberger Berman Advisers Management Trust, at December 31, 2011, the results of its operations for the year then ended, the changes in its net assets for each of the two years in the period then ended, and the financial highlights for each of the five years in the period then ended, in conformity with U.S. generally accepted accounting principles.
Boston, Massachusetts
February 10, 2012
21
Trustee and Officer Information
The following tables set forth information concerning the trustees ("Trustees") and officers ("Officers") of the Trust. All persons named as Trustees and Officers also serve in similar capacities for other funds administered or managed by Management, Neuberger and Neuberger Berman Fixed Income LLC ("NBFI"). The Statement of Additional Information includes additional information about Trustees and is available upon request, without charge, by calling (800) 877-9700.
Information about the Board of Trustees
Name, (Year of Birth), and Address(1) | | Position and Length of Time Served(2) | | Principal Occupation(s)(3) | | Number of Funds in Fund Complex Overseen by Fund Trustee | | Other Directorships Held Outside Fund Complex by Fund Trustee | |
| Independent Trustees | |
| |
| John Cannon (1930) | | Trustee since 2000 | | Consultant; formerly, Chairman, CDC Investment Advisers (registered investment adviser), 1993 to January 1999; formerly, President and Chief Executive Officer, AMA Investment Advisors, an affiliate of the American Medical Association. | | | 47 | | | Formerly, Independent Trustee or Director of three series of Oppenheimer Funds: Oppenheimer Limited Term New York Municipal Fund, Rochester Fund Municipals, and Oppenheimer Convertible Securities Fund, 1992 to 2009. | |
| |
| Faith Colish (1935) | | Trustee since 1982 | | Counsel, Carter Ledyard & Milburn LLP (law firm) since October 2002; formerly, Attorney-at-Law and President, Faith Colish, A Professional Corporation, 1980 to 2002. | | | 47 | | | Formerly, Director, 1997 to 2003, and Advisory Director, 2003 to 2006, ABA Retirement Funds (formerly, American Bar Retirement Association) (not-for-profit membership corporation). | |
| |
22
Name, (Year of Birth), and Address(1) | | Position and Length of Time Served(2) | | Principal Occupation(s)(3) | | Number of Funds in Fund Complex Overseen by Fund Trustee | | Other Directorships Held Outside Fund Complex by Fund Trustee | |
| Martha C. Goss (1949) | | Trustee since 2007 | | President, Woodhill Enterprises Inc./Chase Hollow Associates LLC (personal investment vehicle), since 2006; Chief Operating and Financial Officer, Hopewell Holdings LLC/ Amwell Holdings, LLC (a holding company for a healthcare reinsurance company start-up), since 2003; formerly, Consultant, Resources Connection (temporary staffing), 2002 to 2006. | | | 47 | | | Director, American Water (water utility), since 2003; Director, Channel Reinsurance (financial guaranty reinsurance), since 2006; Director, Allianz Life of New York (insurance), since 2005; Director, Financial Women's Association of New York (not-for-profit association), since 2003; Trustee Emerita, Brown University, since 1998; formerly, Director, Ocwen Financial Corporation (mortgage servicing), 2005 to 2010; formerly, Advisory Board Member, Attensity (software developer), 2005 to 2007; formerly, Director, Bank Leumi (commercial bank), 2005 to 2007; formerly, Director, Claire's Stores, Inc. (retailer), 2005 to 2007. | |
| |
| C. Anne Harvey (1937) | | Trustee since 1998 | | President, C.A. Harvey Associates, since October 2001; formerly, Director, AARP, 1978 to December 2001. | | | 47 | | | Formerly, President, Board of Associates to The National Rehabilitation Hospital's Board of Directors, 2001 to 2002; formerly, Member, Individual Investors Advisory Committee to the New York Stock Exchange Board of Directors, 1998 to 2002. | |
| |
23
Name, (Year of Birth), and Address(1) | | Position and Length of Time Served(2) | | Principal Occupation(s)(3) | | Number of Funds in Fund Complex Overseen by Fund Trustee | | Other Directorships Held Outside Fund Complex by Fund Trustee | |
| Robert A. Kavesh (1927) | | Trustee since 2000 | | Retired, since 2002; Marcus Nadler Professor Emeritus of Finance and Economics, New York University Stern School of Business; formerly, Executive Secretary-Treasurer, American Finance Association, 1961 to 1979. | | | 47 | | | Formerly, Director, The Caring Community (not-for-profit), 1997 to 2006; formerly, Director, DEL Laboratories, Inc. (cosmetics and pharmaceuticals), 1978 to 2004; formerly, Director, Apple Bank for Savings, 1979 to 1990; formerly, Director, Western Pacific Industries, Inc., (public company), 1972 to 1986. | |
| |
| Michael M. Knetter (1960) | | Trustee since 2007 | | President and Chief Executive Officer, University of Wisconsin Foundation, since October 2010; formerly, Dean, School of Business, University of Wisconsin - Madison; formerly, Professor of International Economics and Associate Dean, Amos Tuck School of Business - Dartmouth College, 1998 to 2002. | | | 47 | | | Director, American Family Insurance (a mutual company, not publicly traded), since March 2009; formerly, Trustee, Northwestern Mutual Series Fund, Inc., 2007 to 2010; formerly, Director, Wausau Paper, 2005 to 2011; formerly, Director, Great Wolf Resorts, 2004 to 2009. | |
| |
| Howard A. Mileaf (1937) | | Trustee since 1999 | | Retired; formerly, Vice President and General Counsel, WHX Corporation (holding company), 1993 to 2001. | | | 47 | | | Formerly, Director, Webfinancial Corporation (holding company), 2002 to 2008; formerly, Director, WHX Corporation (holding company), 2002 to 2005; formerly, Director, State Theatre of New Jersey (not-for-profit theatre), 2000 to 2005. | |
| |
| George W. Morriss (1947) | | Trustee since 2007 | | Retired; formerly, Executive Vice President and Chief Financial Officer, People's Bank, Connecticut (a financial services company), 1991 to 2001. | | | 47 | | | Manager, Larch Lane Multi-Strategy Fund complex (which currently consists of three funds), since 2006; formerly, Member, NASDAQ Issuers' Affairs Committee, 1995 to 2003. | |
| |
24
Name, (Year of Birth), and Address(1) | | Position and Length of Time Served(2) | | Principal Occupation(s)(3) | | Number of Funds in Fund Complex Overseen by Fund Trustee | | Other Directorships Held Outside Fund Complex by Fund Trustee | |
| Edward I. O'Brien (1928) | | Trustee since 2000 | | Private Investor; formerly, Member, Investment Policy Committee, Edward Jones, 1993 to 2001; President, Securities Industry Association ("SIA") (securities industry's representative in government relations and regulatory matters at the federal and state levels), 1974 to 1992; Adviser to SIA, November 1992 to November 1993. | | | 47 | | | Formerly, Director, Legg Mason, Inc. (financial services holding company), 1993 to July 2008; formerly, Director, Boston Financial Group (real estate and tax shelters), 1993 to 1999. | |
| |
| Jack L. Rivkin (1940) | | Trustee since 2002; President, 2002 to 2008 | | Formerly, Executive Vice President and Chief Investment Officer, Neuberger Berman Holdings LLC (holding company), 2002 to August 2008 and 2003 to August 2008, respectively; formerly, Managing Director and Chief Investment Officer, Neuberger, December 2005 to August 2008 and 2003 to August 2008, respectively; formerly, Executive Vice President, Neuberger, December 2002 to 2005; formerly, Director and Chairman, Management, December 2002 to August 2008; formerly, Executive Vice President, Citigroup Investments, Inc., September 1995 to February 2002; formerly, Executive Vice President, Citigroup Inc., September 1995 to February 2002. | | | 47 | | | Director, Idealab (private company), since 2009; Director, Distributed World Power (private company), since 2009; Director, Dale Carnegie and Associates, Inc. (private company), since 1999; Director, Solbright, Inc. (private company), since 1998; Director, SA Agricultural Fund, since 2009; Chairman and Director, Essential Brands (consumer products) since 2008; formerly, Director, New York Society of Security Analysts, 2006 to 2008. | |
| |
25
Name, (Year of Birth), and Address(1) | | Position and Length of Time Served(2) | | Principal Occupation(s)(3) | | Number of Funds in Fund Complex Overseen by Fund Trustee | | Other Directorships Held Outside Fund Complex by Fund Trustee | |
| Cornelius T. Ryan (1931) | | Trustee since 2000 | | General Partner and Adviser, TD2, TD3, and TOF1 Healthcare Venture Capital Partnerships; formerly, Founding General Partner, Oxford Partners and Oxford Bioscience Partners (venture capital investing) and President, Oxford Venture Corporation, 1981 to 2010. | | | 47 | | | Trustee, Norwalk Hospital Foundation, since 2000; Director, Supply Pro (privately held company), since 2008; formerly, Trustee, Norwalk Hospital, 1995 to 2004; formerly, President and Director, Randolph Computer Corp., 1966 to 1984; formerly, Director of numerous privately held portfolio companies of Oxford Partners and Oxford Bioscience Partners, 1981 to 2005. | |
| |
| Tom D. Seip (1950) | | Trustee since 2000; Chairman of the Board since 2008; Lead Independent Trustee from 2006 to 2008 | | General Partner, Ridgefield Farm LLC (a private investment vehicle); formerly, President and CEO, Westaff, Inc. (temporary staffing), May 2001 to January 2002; formerly, Senior Executive, The Charles Schwab Corporation, 1983 to 1998, including Chief Executive Officer, Charles Schwab Investment Management, Inc.; Trustee, Schwab Family of Funds and Schwab Investments, 1997 to 1998; and Executive Vice President-Retail Brokerage, Charles Schwab & Co., Inc., 1994 to 1997. | | | 47 | | | Director, H&R Block, Inc. (financial services company), since May 2001; formerly, Chairman, Compensation Committee, H&R Block, Inc., 2006 to 2010; formerly, Director, Forward Management, Inc. (asset management company), 1999 to 2006. | |
| |
26
Name, (Year of Birth), and Address(1) | | Position and Length of Time Served(2) | | Principal Occupation(s)(3) | | Number of Funds in Fund Complex Overseen by Fund Trustee | | Other Directorships Held Outside Fund Complex by Fund Trustee | |
| Candace L. Straight (1947) | | Trustee since 1999 | | Private investor and consultant specializing in the insurance industry; formerly, Advisory Director, Securitas Capital LLC (a global private equity investment firm dedicated to making investments in the insurance sector), 1998 to December 2003. | | | 47 | | | Public Member, Board of Governors and Board of Trustees, Rutgers University, since 2011; Director, Montpelier Re Holdings Ltd. (reinsurance company), since 2006; formerly, Director, National Atlantic Holdings Corporation (property and casualty insurance company), 2004 to 2008; formerly, Director, The Proformance Insurance Company (property and casualty insurance company), 2004 to 2008; formerly, Director, Providence Washington Insurance Company (property and casualty insurance company), 1998 to 2006; formerly, Director, Summit Global Partners (insurance brokerage firm), 2000 to 2005. | |
| |
| Peter P. Trapp (1944) | | Trustee since 1984 | | Retired; formerly, Regional Manager for Mid-Southern Region, Ford Motor Credit Company, September 1997 to 2007; formerly, President, Ford Life Insurance Company, April 1995 to August 1997. | | | 47 | | | None. | |
| |
27
Name, (Year of Birth), and Address(1) | | Position and Length of Time Served(2) | | Principal Occupation(s)(3) | | Number of Funds in Fund Complex Overseen by Fund Trustee | | Other Directorships Held Outside Fund Complex by Fund Trustee | |
| Trustees who are "Interested Persons" | |
| |
| Joseph V. Amato* (1962) | | Trustee since 2009 | | President and Director, Neuberger Berman Group LLC, since 2009; President and Chief Executive Officer, Neuberger and Neuberger Berman Holdings LLC (including its predecessor, Neuberger Berman Inc.), since 2007; Chief Investment Officer, Neuberger, since 2009; Chief Investment Officer (Equities) and Managing Director, Management, since 2009; Managing Director, Neuberger Berman Fixed Income LLC ("NBFI") since 2007; Board member of NBFI since 2006; formerly, Global Head of Asset Management of Lehman Brothers Holdings Inc.'s ("LBHI") Investment Management Division, 2006 to 2009; formerly, member of LBHI's Investment Management Division's Executive Management Committee, 2006 to 2009; formerly, Managing Director, Lehman Brothers Inc. ("LBI"), 2006 to 2008; formerly, Chief Recruiting and Development Officer, LBI, 2005 to 2006; formerly, Global Head of LBI's Equity Sales and a Member of its Equities Division Executive Committee, 2003 to 2005. | | | 47 | | | Member of Board of Advisors, McDonough School of Business, Georgetown University, since 2001; Member of New York City Board of Advisors, Teach for America, since 2005; Trustee, Montclair Kimberley Academy (private school), since 2007. | |
| |
28
Name, (Year of Birth), and Address(1) | | Position and Length of Time Served(2) | | Principal Occupation(s)(3) | | Number of Funds in Fund Complex Overseen by Fund Trustee | | Other Directorships Held Outside Fund Complex by Fund Trustee | |
| Robert Conti* (1956) | | Chief Executive Officer, President and Trustee since 2008; prior thereto, Executive Vice President in 2008 and Vice President, 2000 to 2008 | | Managing Director, Neuberger, since 2007; formerly, Senior Vice President, Neuberger, 2003 to 2006; formerly, Vice President, Neuberger, 1999 to 2003; President and Chief Executive Officer, Management, since 2008; formerly, Senior Vice President, Management, 2000 to 2008. | | | 47 | | | Director since 1994 and formerly, Chairman of the Board, 2008 to 2010, Staten Island Mental Health Society, Inc. | |
| |
(1) The business address of each listed person is 605 Third Avenue, New York, New York 10158.
(2) Pursuant to the Trust's Trust Instrument, each of these Trustees shall hold office for life or until his or her successor is elected or the Trust terminates; except that (a) any Trustee may resign by delivering a written resignation; (b) any Trustee may be removed with or without cause at any time by a written instrument signed by at least two-thirds of the other Trustees; (c) any Trustee who requests to be retired, or who has become unable to serve, may be retired by a written instrument signed by a majority of the other Trustees; and (d) any Trustee may be removed at any shareholder meeting by a vote of at least two-thirds of the outstanding shares.
(3) Except as otherwise indicated, each individual has held the positions shown for at least the last five years.
* Indicates a Trustee who is an "interested person" within the meaning of the 1940 Act. Mr. Amato and Mr. Conti are interested persons of the Trust by virtue of the fact that each is an officer of Management, Neuberger and/or their affiliates.
29
Information about the Officers of the Trust
Name, (Year of Birth), and Address(1) | | Position and Length of Time Served(2) | | Principal Occupation(s)(3) | |
| Andrew B. Allard (1961) | | Anti-Money Laundering Compliance Officer since 2002 | | Senior Vice President, Neuberger, since 2006 and Employee since 1999; Deputy General Counsel, Neuberger, since 2004; formerly, Vice President, Neuberger, 2000 to 2005; formerly, Employee, Management, 1994 to 1999; Anti-Money Laundering Compliance Officer, nine registered investment companies for which Management acts as investment manager and administrator (six since 2002, one since 2003, one since 2005 and one since 2006). | |
| |
| Claudia A. Brandon (1956) | | Executive Vice President since 2008 and Secretary since 1985 | | Senior Vice President, Neuberger, since 2007 and Employee since 1999; Senior Vice President, Management, since 2008 and Assistant Secretary since 2004; formerly, Vice President, Neuberger, 2002 to 2006; formerly, Vice President-Mutual Fund Board Relations, Management, 2000 to 2008; formerly, Vice President, Management, 1986 to 1999 and Employee 1984 to 1999; Executive Vice President, nine registered investment companies for which Management acts as investment manager and administrator (nine since 2008); Secretary, nine registered investment companies for which Management acts as investment manager and administrator (three since 1985, three since 2002, one since 2003, one since 2005 and one since 2006). | |
| |
| Anthony DiBernardo (1979) | | Assistant Treasurer since 2011 | | Vice President, Neuberger, since 2009; Employee, Management, since 2003; Assistant Treasurer, nine registered investment companies for which Management acts as investment manager and administrator. | |
| |
| Maxine L. Gerson (1950) | | Executive Vice President since 2008 and Chief Legal Officer since 2005 (only for purposes of sections 307 and 406 of the Sarbanes-Oxley Act of 2002) | | Managing Director, Neuberger, since 2009, and Deputy General Counsel and Assistant Secretary, Neuberger, since 2001; Managing Director, Management, since 2009, and Secretary and General Counsel, Management, since 2004; formerly, Senior Vice President, Neuberger, 2002 to 2009; formerly, Senior Vice President, Management, 2006 to 2009; Executive Vice President, nine registered investment companies for which Management acts as investment manager and administrator (nine since 2008); Chief Legal Officer (only for purposes of sections 307 and 406 of the Sarbanes-Oxley Act of 2002), nine registered investment companies for which Management acts as investment manager and administrator (eight since 2005 and one since 2006). | |
| |
| Sheila R. James (1965) | | Assistant Secretary since 2002 | | Vice President, Neuberger, since 2008 and Employee since 1999; formerly, Assistant Vice President, Neuberger, 2007; formerly, Employee, Management, 1991 to 1999; Assistant Secretary, nine registered investment companies for which Management acts as investment manager and administrator (six since 2002, one since 2003, one since 2005 and one since 2006). | |
| |
| Brian Kerrane (1969) | | Vice President since 2008 | | Senior Vice President, Neuberger, since 2006; formerly, Vice President, Neuberger, 2002 to 2006; Vice President, Management, since 2008 and Employee since 1991; Vice President, nine registered investment companies for which Management acts as investment manager and administrator (nine since 2008). | |
| |
30
Name, (Year of Birth), and Address(1) | | Position and Length of Time Served(2) | | Principal Occupation(s)(3) | |
| Kevin Lyons (1955) | | Assistant Secretary since 2003 | | Assistant Vice President, Neuberger, since 2008 and Employee since 1999; formerly, Employee, Management, 1993 to 1999; Assistant Secretary, nine registered investment companies for which Management acts as investment manager and administrator (seven since 2003, one since 2005 and one since 2006). | |
| |
| Owen F. McEntee, Jr. (1961) | | Vice President since 2008 | | Vice President, Neuberger, since 2006; Employee, Management, since 1992; Vice President, nine registered investment companies for which Management acts as investment manager and administrator (nine since 2008). | |
| |
| John M. McGovern (1970) | | Treasurer and Principal Financial and Accounting Officer since 2005 | | Senior Vice President, Neuberger, since 2007; formerly, Vice President, Neuberger, 2004 to 2006; Employee, Management, since 1993; Treasurer and Principal Financial and Accounting Officer, nine registered investment companies for which Management acts as investment manager and administrator (eight since 2005 and one since 2006); formerly, Assistant Treasurer, eight registered investment companies for which Management acts as investment manager and administrator, 2002 to 2005. | |
| |
| Frank Rosato (1971) | | Assistant Treasurer since 2005 | | Vice President, Neuberger, since 2006; Employee, Management, since 1995; Assistant Treasurer, nine registered investment companies for which Management acts as investment manager and administrator (eight since 2005 and one since 2006). | |
| |
| Neil S. Siegel (1967) | | Vice President since 2008 | | Managing Director, Management, since 2008; Managing Director, Neuberger, since 2006; formerly, Senior Vice President, Neuberger, 2004 to 2006; Vice President, nine registered investment companies for which Management acts as investment manager and administrator (nine since 2008). | |
| |
| Chamaine Williams (1971) | | Chief Compliance Officer since 2005 | | Senior Vice President, Neuberger, since 2007; Chief Compliance Officer, Management, since 2006; Chief Compliance Officer, nine registered investment companies for which Management acts as investment manager and administrator (eight since 2005 and one since 2006); formerly, Senior Vice President, LBI, 2007 to 2008; formerly, Vice President, LBI, 2003 to 2006; formerly, Chief Compliance Officer, Lehman Brothers Asset Management Inc., 2003 to 2007; formerly, Chief Compliance Officer, Lehman Brothers Alternative Investment Management LLC, 2003 to 2007. | |
| |
(1) The business address of each listed person is 605 Third Avenue, New York, New York 10158.
(2) Pursuant to the By-Laws of the Trust, each officer elected by the Trustees shall hold office until his or her successor shall have been elected and qualified or until his or her earlier death, inability to serve, or resignation. Officers serve at the pleasure of the Trustees and may be removed at any time with or without cause.
(3) Except as otherwise indicated, each individual has held the positions shown for at least the last five years.
31
Proxy Voting Policies and Procedures
A description of the policies and procedures that the Trust uses to determine how to vote proxies relating to portfolio securities is available, without charge, by calling 1-800-877-9700 (toll-free) and on the website of the Securities and Exchange Commission, at www.sec.gov. Information regarding how the Trust voted proxies relating to portfolio securities during the most recent 12-month period ended June 30 is also available, without charge, by calling 1-800-877-9700 (toll-free), on the website of the Securities and Exchange Commission at www.sec.gov, and on Management's website at www.nb.com.
Quarterly Portfolio Schedule
The Trust files a complete schedule of portfolio holdings for the Fund with the Securities and Exchange Commission for the first and third quarters of each fiscal year on Form N-Q. The Trust's Forms N-Q are available on the Securities and Exchange Commission's website at www.sec.gov and may be reviewed and copied at the Securities and Exchange Commission's Public Reference Room in Washington, DC. Information on the operation of the Public Reference Room may be obtained by calling 1-800-SEC-0330. The information on Form N-Q is available upon request, without charge, by calling 1-800-877-9700 (toll free).
Notice to Shareholders
100.00% of the dividends earned during the fiscal year ended December 31, 2011 qualifies for the dividend received deduction for corporate shareholders.
Board Consideration of the Management and Sub-Advisory Agreements
At a meeting held on October 13, 2011, the Board, including the Trustees who are not "interested persons" of Management (including its affiliates) or Neuberger Berman Advisers Management Trust ("Independent Fund Trustees"), approved the continuance of the Management and Sub-Advisory Agreements ("Agreements") for the Fund.
In evaluating the Agreements, the Board, including the Independent Fund Trustees, reviewed materials furnished by Management and Neuberger in response to questions submitted by counsel for the Independent Fund Trustees, and met with senior representatives of Management and Neuberger regarding their personnel and operations. The Independent Fund Trustees were advised by counsel that is experienced in Investment Company Act of 1940 matters and that is independent of Management and Neuberger. The Independent Fund Trustees received a memorandum from independent counsel discussing the legal standards for their consideration of the proposed continuance of the Agreements. They met with such counsel separately from representatives of Management to discuss the annual contract review. The annual contract review extends over three regular meetings of the Board, including one meeting devoted primarily to reviewing and discussing Fund performance, to ensure that Management and Neuberger have time to respond to any questions the Independent Fund Trustees may have on their initial review of the report and that the Independent Fund Trustees have time to consider those responses.
The Board considered the following factors, among others, in connection with its approval of the continuance of the Agreements: (1) the nature, extent, and quality of the services provided by Management and Neuberger; (2) the performance of the Fund compared to a relevant market index and a peer group of investment companies; (3) the costs of the services provided and profits or losses realized by Management and its affiliates from their relationship with the Fund; (4) the extent to which economies of scale might be realized as the Fund grows; and (5) whether fee levels reflect any such potential economies of scale for the benefit of investors in the Fund. In their deliberations, the Board members did not identify any particular information that was all-important or controlling, and each Trustee may have attributed different weights to the various factors.
The Board evaluated the terms of the Agreements, the overall fairness of the Agreements to the Fund and whether the Agreements were in the best interests of the Fund and its shareholders.
32
With respect to the nature, extent and quality of the services provided, the Board considered the performance of the Fund and the experience and staffing of the portfolio management and investment research personnel of Management and Neuberger who perform services for the Fund. The Board noted that Management also provides certain administrative services, including fund accounting and compliance oversight. The Board also considered Management's and Neuberger's policies and practices regarding brokerage and the allocation of portfolio transactions. The Board's Portfolio Transactions and Pricing Committee from time to time reviewed the quality of the execution services that Management and Neuberger had provided, and periodically reviews studies by an independent firm engaged to review and evaluate the quality of brokerage execution received by the Fund. The Board also reviewed whether Management and Neuberger used brokers to execute Fund transactions that provide research and other services to Management and Neuberger, and the types of benefits potentially derived from such services by Management, Neuberger, the Fund and other clients of Management and Neuberger. In addition, the Board noted the positive compliance history of Management and Neuberger, as each firm has been free of significant reported compliance problems.
The Board considered the performance of the Fund relative to its benchmark and the average performance of composite peer groups of investment companies dedicated to insurance products pursuing broadly similar strategies. The Board also reviewed performance in relation to certain measures of the degree of investment risk undertaken by the portfolio managers, during the period. The Board also considered Management's resources and responsiveness with respect to the Fund.
With respect to the overall fairness of the Agreements, the Board considered the fee structure for the Fund under the Agreements as compared to a peer group of comparable funds and any fall-out benefits likely to accrue to Management or Neuberger or their affiliates from their relationship with the Fund. The Board also considered the profitability of Management and its affiliates from their association with the Fund.
The Board reviewed a comparison of the Fund's management fee and overall expense ratio to a peer group of broadly comparable funds. The Board considered the mean and median of the management fees and expense ratios of the peer group. The Board noted that the Fund's management fee was higher than the peer group mean and median. The Board considered whether specific portfolio management or administration needs contributed to the management fee. With regard to the sub-advisory fee paid to Neuberger, the Board noted that this fee is "at cost." In addition, the Board considered the contractual limit on Fund expenses undertaken by Management.
The Board considered whether there were other funds that were advised or sub-advised by Management or its affiliates or separate accounts managed by Management or its affiliates with similar investment objectives, policies and strategies to the Fund. The Board noted that there were no comparable sub-advised funds or separate accounts. The Board compared the fees charged to the Fund to the fees charged to a registered fund managed by Management in a similar style to the Fund. The Board considered the appropriateness and reasonableness of any differences between the fees charged to the Fund and the other fund and determined that the differences in fees were consistent with the management and other services provided.
The Board also evaluated any apparent or anticipated economies of scale in relation to the services Management provides to the Fund. The Board considered whether the Fund's fee structure provides for a reduction of payments resulting from the use of breakpoints and whether those breakpoints are set at appropriate asset levels. In concluding that the benefits accruing to Management and its affiliates by virtue of their relationship to the Fund were reasonable in comparison with the costs of providing the investment advisory services and the benefits accruing to the Fund, the Board reviewed specific data as to Management's profit or loss on the Fund for a recent period and the trend in profit or loss over recent years. The Board also carefully examined Management's cost allocation methodology. The Board recognized that Management should be entitled to earn a reasonable level of profits for services it provides to the Fund.
33
Conclusions
In approving the Agreements, the Board concluded that the terms of each Agreement are fair and reasonable and that approval of the Agreements is in the best interests of the Fund and its shareholders. In reaching this determination, the Board considered that Management and Neuberger could be expected to provide a high level of service to the Fund; that the performance of the Fund was satisfactory over time; that the Fund's fee structure appeared to the Board to be reasonable given the nature and quality of services provided; and that the benefits accruing to Management and its affiliates by virtue of their relationship to the Fund were reasonable in comparison with the benefits accruing to the Fund.
34
Neuberger Berman
Advisers Management Trust
International Portfolio
S Class Shares
Annual Report
December 31, 2011
F0509 02/12
International Portfolio Commentary (Unaudited)
Both the Neuberger Berman Advisers Management Trust (AMT) International Portfolio and its benchmark, the MSCI EAFE® Index, posted negative results in 2011—a time that put tremendous pressure on the international equity markets. Posting a total return of –12.33%, the Portfolio underperformed the index, which posted a –11.73% return for the same period.
Although performance improved somewhat as 2011 came to a close, markets were quite volatile and negative throughout the year, primarily due to investor concerns about the ultimate resolution to the European sovereign debt crisis. Unsurprisingly, Greece was the worst performing market, down more than –60%. Much of continental Europe was weak as well, as fears about the debt crisis expanded into concerns about the future of the eurozone. The UK was one of the better performing countries in the benchmark, as it was down just slightly for the year. Only Ireland and New Zealand posted positive returns. By sector, the more defensive areas such as Health Care, Consumer Staples, and Telecommunication Services, along with Energy, were the better performers, while Materials, Financials and Utilities were weak.
Within the Portfolio, Consumer Discretionary and Health Care holdings were the greatest contributors to returns relative to the benchmark, driven by strong stock performance. An overweight in Telecommunication Services and an underweight in Utilities also benefited performance. Weak stock performance in Energy and Consumer Staples detracted from results. From a country perspective, strong stock performance in Japan, Germany and France positively impacted the Portfolio. Stock performance in the UK and exposure to Brazil and China detracted from returns.
Vodafone Group, the global mobile telecom service provider, was among the Portfolio's top contributors for the year, raising forecasts after its full-year results beat the market's expectations. Another holding, Nihon Khoden, a Japanese medical equipment company, posted solid results driven by its domestic business, which continued to benefit from last year's expansion in hospital budgets. Tognum, a German manufacturer of high-speed engines for marine, industrial, power generation and defense applications, was another top performer, as it was acquired by a joint venture between Daimler and Rolls Royce.
The Portfolio's most significant detractor was HRT Participacões, a Brazilian energy company. The stock's price declined as a result of several exploration disappointments. Sulzer, a Swiss diversified industrial company, also disappointed. Sulzer saw its cyclical exposure decrease with the acquisition of Cardo Flow Solution. Sulzer has demonstrated its ability to manage costs and maintain positive profit margins in a recessionary environment, which we believe they could maintain in the event of another downturn. Deutsche Boerse, one of the world's leading exchange organizations, also underperformed under pressure relating to its still-to-be- completed merger with the NYSE and the fear of a global recession, which would negatively affect volumes. We think that Deutsche Boerse is undervalued both as a single entity and as a partner of the NYSE.
As the year ended, although coordinated action by the European Central Bank and other central banks to provide liquidity to European financial institutions offered short-term relief, the sovereign debt situation in Europe continued to drive market volatility. In our view, European Union governments have yet to develop a credible plan to tackle excessive public sector debt. Any plan seems likely to involve both higher taxes and reduced government spending, which could dampen 2012 economic activity. With this uncertainty hanging over Europe, we believe global equity prices are likely to remain volatile. Another area of investor concern is China. The debate as to whether China's near-term gross domestic product growth will fall below 7% will likely continue into 2012. Still, mid-single-digit emerging markets growth and positive U.S. economic data would be supportive for our companies.
Looking ahead, we have positioned the Portfolio defensively, focusing on companies able to perform in tougher economic times. In Europe, we continue to overweight countries outside the eurozone—such as Switzerland and the Nordic countries—that we believe have superior growth prospects, as well as on companies with significant revenues from North America and emerging markets. As a result, large-capitalization global companies now comprise a larger percentage of portfolio assets.
1
From a sector perspective, the Portfolio is overweighted in Materials, with a focused exposure to precious metals and agriculture, as well as specialty chemical companies with pricing power and relatively stable end markets. The Portfolio also remains overweighted in Telecommunication Services, where we believe globalizing smart phone technology penetration should drive lower costs and higher average revenue per user. This theme carries into the Information Technology sector, where our overweight is focused on telecom equipment suppliers and software businesses with ongoing revenue streams. In Consumer Discretionary, holdings are focused on pay TV, contract catering and professional publishers, where demand tends to be less economically sensitive. Our largest underweight continues to be in Financials, in which we prefer brokers and exchanges with recurring fee revenue over banks. We continue to like Canadian natural resources names that benefit from a stable regulatory environment and strong management teams that we believe will drive healthy production growth.
Thank you for your continued confidence in our portfolio management team. We look forward to continuing to serve your investment needs in the future.
Sincerely,
Benjamin Segal
Portfolio Manager
Information about the principal risks of investing in the Portfolio is set forth in the prospectus and statement of additional information.
The composition, industries and holdings of the Portfolio are subject to change.
2
International Portfolio (Unaudited)
SECTOR ALLOCATION
| (as a % of Total Investments) | |
| Consumer Discretionary | | | 12.2 | % | |
| Consumer Staples | | | 11.7 | | |
| Energy | | | 8.6 | | |
| Financials | | | 11.0 | | |
| Health Care | | | 10.9 | | |
| Industrials | | | 14.8 | | |
| Information Technology | | | 5.9 | | |
| Materials | | | 14.9 | | |
| Telecommunication Services | | | 8.0 | | |
| Short-Term Investments | | | 2.0 | | |
| Total | | | 100.0 | % | |
PERFORMANCE HIGHLIGHTS1
| | | | | Average Annual Total Return Ended 12/31/2011 | |
| | | Inception Date | | 1 Year | | 5 Years | | Life of Fund* | |
| International Portfolio Class S | | 04/29/2005 | | | –12.33 | % | | | –4.47 | % | | | 2.17 | % | |
MSCI EAFE® Index2 | | | | | | | –11.73 | % | | | –4.26 | % | | | 2.70 | % | |
Performance data quoted represent past performance and do not indicate future results. The investment return and principal value of an investment will fluctuate so that an investor's shares, when redeemed, may be worth more or less than their original cost. Results are shown on a "total return" basis and include reinvestment of all income dividends and distributions.
Current performance may be lower or higher than the performance data quoted. For performance data current to the most recent month end, please visit https://www.nb.com.
* Index returns are as of the inception date 04/29/2005.
As stated in the Portfolio's most recent prospectus, the total annual operating expense ratio for fiscal year 2010 was 1.67% for Class S shares (prior to any fee waivers and/or expense reimbursements, if any). The expense ratio net of waivers and/or reimbursements was 1.52% for Class S shares. Neuberger Berman Management LLC has contractually agreed to limit certain expenses of the Portfolio through 12/31/2014.
The results shown in the table do not reflect the effect of taxes an investor would pay on Portfolio distributions or on the redemption of Portfolio shares.
COMPARISON OF A $10,000 INVESTMENT
This graph shows the change in value of a hypothetical $10,000 investment in the Portfolio over the past 10 fiscal years, or since the Portfolio's inception if it has not operated for 10 years. The result is compared with benchmarks, which include a broad-based market index and may include a more narrowly based index. Market indices have not been reduced to reflect any of the fees and costs of investing. All results include the reinvestment of income dividends and distributions. The results shown in the graph do not reflect the effect of taxes an investor would pay on Portfolio distributions or on the redemption of Portfolio shares. Results represent past performance and do not indicate future results
Please see Endnotes for additional information.
3
Endnotes (Unaudited)
1 "Total Return" includes reinvestment of all income dividends and distributions. Results represent past performance and do not indicate future results. The value of an investment in the Portfolio and the return on the investment both will fluctuate, and redemption proceeds may be higher or lower than an investor's original cost. The performance information does not reflect fees and expenses of the variable annuity and variable life insurance policies or the qualified pension and retirement plans whose proceeds are invested in the Portfolio. Neuberger Berman Management LLC ("NBM LLC") has agreed to absorb certain expenses of the AMT Portfolios, including the Portfolio. Without this arrangement, which is subject to change, the total returns of the Portfolio may have been less.
2 The MSCI EAFE® Index (Europe, Australasia, Far East) is a free float-adjusted market capitalization index that is designed to measure the equity market performance of developed markets, excluding the U.S. & Canada. As of May 2010, the MSCI EAFE Index consisted of the following 22 developed market country indices: Australia, Austria, Belgium, Denmark, Finland, France, Germany, Greece, Hong Kong, Ireland, Israel, Italy, Japan, the Netherlands, New Zealand, Norway, Portugal, Singapore, Spain, Sweden, Switzerland and the United Kingdom. The index is translated into U.S. dollars. Please note that indices do not take into account any fees and expenses or tax consequences of investing in the individual securities that they track and that individuals cannot invest directly in any index. Data about the performance of this index is prepared or obtained by NBM LLC and include reinvestment of all income dividends and distributions. The Portfolio may invest in many securities not included in the above-described index or may not invest in all securities included in the above-described index.
Any ratios or other measurements using a factor of forecasted earnings of a company discussed herein are based on consensus estimates, not NBM LLC's own projections, and they may or may not be realized. In addition, any revision to a forecast could affect the market price of a security. By quoting them herein, NBM LLC does not offer an opinion as to the accuracy of and does not guarantee these forecasted numbers.
The investments for the Portfolio are managed by the same portfolio manager(s) who manage(s) one or more other registered funds that have similar names, investment objectives and investment styles as the Portfolio. You should be aware that the Portfolio is likely to differ from the other mutual funds in size, cash flow pattern and tax matters. Accordingly, the holdings and performance can be expected to vary from those of the other mutual funds.
The composition, industries and holdings of the Portfolio are subject to change.
Shares of the separate AMT Portfolios are not available to the general public. Shares of this Portfolio may be purchased only by life insurance companies to be used with their separate accounts that fund variable annuity and variable life insurance policies and by qualified pension and retirement plans.
Statistics and projections in this report are derived from sources deemed to be reliable but cannot be regarded as a representation of future results of the AMT Portfolios. This report is prepared for the general information of shareholders and is not an offer of shares of the AMT Portfolios. Shares of the AMT Portfolios are sold only through the currently effective prospectuses, which must precede or accompany this report.
The "Neuberger Berman" name and logo are registered service marks of Neuberger Berman Group LLC. "Neuberger Berman Management LLC" and the individual Fund names in this piece are either service marks or registered service marks of Neuberger Berman Management LLC.
© 2012 Neuberger Berman Management LLC distributor. All rights reserved.
4
Information About Your Fund's Expenses (Unaudited)
This table is designed to provide information regarding costs related to your investments. All mutual funds incur operating expenses, which include management fees, fees for administrative services and costs of shareholder reports, among others. The following examples are based on an investment of $1,000 made at the beginning of the six month period ended December 31, 2011 and held for the entire period. The table illustrates the fund's costs in two ways:
| Actual Expenses and Performance: | | The first section of the table provides information about actual account values and actual expenses in dollars, based on the fund's actual performance during the period. You may use the information in this line, together with the amount you invested, to estimate the expenses you paid over the period. Simply divide your account value by $1,000 (for example, an $8,600 account value divided by $1,000 = 8.6), then multiply the result by the number in the first section of the table under the heading entitled "Expenses Paid During the Period" to estimate the expenses you paid over the period. | |
| |
| Hypothetical Example for Comparison Purposes: | | The second section of the table provides information about hypothetical account values and hypothetical expenses based on the fund's actual expense ratio and an assumed rate of return at 5% per year before expenses. This return is not the fund's actual return. The hypothetical account values and expenses may not be used to estimate the actual ending account balance or expenses you paid for the period. You may use this information to compare the ongoing costs of investing in this fund versus other funds. To do so, compare the expenses shown in this 5% hypothetical example with the 5% hypothetical examples that appear in the shareholder reports of other funds. | |
| |
Please note that the expenses in the table are meant to highlight your ongoing costs only. The table and expense example do not include any transaction costs, such as fees and expenses that are, or may be, imposed under your variable contract or qualified pension plan. Therefore, the information under the heading "Hypothetical (5% annual return before expenses)" is useful in comparing ongoing costs only, and will not help you determine the relative total costs of owning different funds. In addition, if these transaction costs were included, your costs would have been higher.
Expense Information as of 12/31/11
NEUBERGER BERMAN ADVISERS MANAGEMENT TRUST INTERNATIONAL PORTFOLIO
| Actual | | Beginning Account Value 7/1/11 | | Ending Account Value 12/31/11 | | Expenses Paid During the Period* 7/1/11 – 12/31/11 | |
| Class S | | $ | 1,000.00 | | | $ | 827.10 | | | $ | 6.91 | | |
| Hypothetical (5% annual return before expenses)** | |
| Class S | | $ | 1,000.00 | | | $ | 1,017.64 | | | $ | 7.63 | | |
* Expenses are equal to the annualized expense ratio of 1.50%, multiplied by the average account value over the period, multiplied by 184/365 (to reflect the one-half year period shown).
** Hypothetical 5% annual return before expenses is calculated by multiplying the number of days in the most recent half year divided by 365.
5
Schedule of Investments International Portfolio
| NUMBER OF SHARES | | | | VALUE† | |
| Common Stocks (97.8%) | | | |
| Australia (1.7%) | | | |
| | 7,155 | | | CSL Ltd. | | $ | 234,181 | | |
| | 51,260 | | | Imdex Ltd. | | | 96,993 | | |
| | | | 331,174 | | |
| Austria (0.6%) | | | |
| | 2,920 | | | Vienna Insurance Group | | | 115,719 | | |
| Belgium (1.7%) | | | |
| | 2,359 | | | Anheuser-Busch InBev | | | 144,428 | | |
| | 4,995 | | | Colruyt SA | | | 189,095 | | |
| | | | 333,523 | | |
| Brazil (0.3%) | | | |
| | 200 | | | HRT Participacoes em Petroleo | | | 60,903 | * | |
| Canada (10.3%) | | | |
| | 3,321 | | | Cenovus Energy | | | 110,282 | | |
| | 11,802 | | | Corus Entertainment, B Shares | | | 237,720 | | |
| | 6,000 | | | Goldcorp, Inc. | | | 266,267 | | |
| | 4,288 | | | MacDonald, Dettwiler & Associates | | | 198,206 | | |
| | 22,400 | | | Neo Material Technologies | | | 161,170 | * | |
| | 22,500 | | | New Gold | | | 227,043 | * | |
| | 10,700 | | | Peyto Exploration & Development | | | 256,170 | | |
| | 5,414 | | | Potash Corp. of Saskatchewan | | | 223,787 | | |
| | 6,900 | | | Silver Wheaton | | | 199,804 | | |
| | 3,812 | | | Vermilion Energy | | | 169,767 | | |
| | | | 2,050,216 | | |
| Chile (1.1%) | | | |
| | 4,210 | | | Sociedad Quimica y Minera de Chile ADR, B Shares | | | 226,708 | | |
| China (1.5%) | | | |
| | 227,500 | | | China Liansu Group Holdings | | | 98,714 | | |
| | 3,950 | | | China Mobile ADR | | | 191,536 | | |
| | | | 290,250 | | |
| Denmark (3.1%) | | | |
| | 2,090 | | | Novo Nordisk A/S Class B | | | 240,175 | | |
| | 9,460 | | | Sydbank A/S | | | 148,407 | | |
| | 3,996 | | | Tryg A/S | | | 221,950 | | |
| | | | 610,532 | | |
| France (6.6%) | | | |
| | 93,695 | | | Alcatel-Lucent France | | | 146,367 | * | |
| | 2,195 | | | Arkema SA | | | 155,396 | | |
| | 6,235 | | | CFAO | | | 211,223 | | |
| NUMBER OF SHARES | | | | VALUE† | |
| | 6,150 | | | Eutelsat Communications | | $ | 239,983 | | |
| | 1,195 | | | LVMH Moet Hennessy Louis Vuitton | | | 169,201 | | |
| | 5,556 | | | Sodexo | | | 398,877 | | |
| | | | 1,321,047 | | |
| Germany (6.6%) | | | |
| | 2,945 | | | Brenntag AG | | | 274,242 | | |
| | 4,916 | | | Deutsche Boerse | | | 257,746 | * | |
| | 15,145 | | | Deutsche Telekom | | | 173,767 | | |
| | 4,736 | | | Fresenius Medical Care | | | 321,803 | | |
| | 1,916 | | | Linde AG | | | 285,051 | | |
| | | | 1,312,609 | | |
| Ireland (0.6%) | | | |
| | 5,425 | | | DCC PLC | | | 128,350 | | |
| Japan (13.1%) | | | |
| | 4,400 | | | BRIDGESTONE Corp. | | | 99,753 | | |
| | 16,500 | | | Brother Industries | | | 202,579 | | |
| | 14,800 | | | Circle K Sunkus | | | 245,161 | | |
| | 425 | | | Jupiter Telecommunications | | | 430,687 | | |
| | 16,600 | | | KANSAI PAINT | | | 148,164 | | |
| | 36 | | | KDDI Corp. | | | 231,519 | | |
| | 59 | | | Kenedix Realty Investment | | | 171,703 | | |
| | 11,100 | | | Nihon Kohden | | | 273,859 | | |
| | 115 | | | NTT DOCOMO | | | 211,414 | | |
| | 2,700 | | | PIGEON Corp. | | | 109,971 | | |
| | 1,200 | | | SMC Corp. | | | 193,634 | | |
| | 9,600 | | | Sundrug Co. | | | 290,856 | | |
| | | | 2,609,300 | | |
| Korea (3.5%) | | | |
| | 1,167 | | | Hyundai Mobis | | | 295,802 | * | |
| | 465 | | | Samsung Electronics GDR | | | 214,226 | | |
| | 2,700 | | | Shinhan Financial Group ADR | | | 184,167 | | |
| | | | 694,195 | | |
| Netherlands (6.8%) | | | |
| | 3,412 | | | Akzo Nobel | | | 164,981 | | |
| | 8,040 | | | Imtech NV | | | 208,272 | | |
| | 19,260 | | | Koninklijke Ahold | | | 259,368 | | |
| | 4,770 | | | Nutreco Holding | | | 313,865 | | |
| | 2,777 | | | Sligro Food Group | | | 74,578 | | |
| | 9,881 | | | Unilever NV | | | 339,790 | | |
| | | | 1,360,854 | | |
| Norway (1.8%) | | | |
| | 17,646 | | | DnB ASA | | | 172,747 | | |
| | 27,064 | | | ProSafe SE | | | 185,484 | | |
| | | | 358,231 | | |
See Notes to Schedule of Investments
6
| NUMBER OF SHARES | | | | VALUE† | |
| Russia (0.4%) | | | |
| | 700 | | | NovaTek OAO GDR | | $ | 87,640 | | |
| South Africa (1.2%) | | | |
| | 12,941 | | | MTN Group | | | 230,412 | | |
| Sweden (3.3%) | | | |
| | 2,900 | | | Axfood AB | | | 106,864 | | |
| | 5,853 | | | Elekta AB | | | 253,866 | | |
| | 11,380 | | | Nordea Bank | | | 88,053 | | |
| | 19,325 | | | Telefonaktiebolaget LM Ericsson, B Shares | | | 197,685 | | |
| | | | 646,468 | | |
| Switzerland (11.9%) | | | |
| | 1,149 | | | Bucher Industries | | | 200,858 | | |
| | 7,889 | | | Credit Suisse Group | | | 185,362 | * | |
| | 299 | | | Givaudan SA | | | 284,898 | * | |
| | 4,249 | | | Nestle SA | | | 244,273 | | |
| | 5,157 | | | Novartis AG | | | 294,827 | | |
| | 2,006 | | | Roche Holding | | | 339,993 | | |
| | 177 | | | SGS SA | | | 293,021 | | |
| | 113 | | | Sika AG | | | 212,935 | | |
| | 3,005 | | | Sulzer AG | | | 321,199 | | |
| | | | 2,377,366 | | |
| Turkey (0.4%) | | | |
| | 151,338 | | | Sinpas Gayrimenkul Yatirim Ortakligi | | | 79,115 | | |
| United Kingdom (21.3%) | | | |
| | 45,829 | | | Amlin PLC | | | 223,410 | | |
| | 11,830 | | | Avanti Communications Group | | | 53,279 | * | |
| | 12,190 | | | BG Group | | | 260,586 | | |
| | 4,995 | | | BHP Billiton | | | 145,642 | | |
| | 19,364 | | | Bunzl PLC | | | 265,839 | | |
| | 39,390 | | | Chemring Group | | | 244,629 | | |
| | 20,515 | | | Diploma PLC | | | 108,228 | | |
| | 19,141 | | | Experian PLC | | | 260,251 | | |
| | 4,461 | | | Fidessa Group | | | 104,820 | | |
| | 24,978 | | | Informa PLC | | | 140,151 | | |
| | 67,858 | | | Mitie Group | | | 256,082 | | |
| | 7,410 | | | Petrofac Ltd. | | | 165,826 | | |
| | 25,404 | | | Reed Elsevier | | | 204,758 | | |
| | 3,200 | | | Rio Tinto ADR | | | 156,544 | | |
| | 69,036 | | | RPS Group | | | 192,983 | | |
| | 10,439 | | | Subsea 7 | | | 193,740 | * | |
| | 15,250 | | | Synergy Health | | | 200,479 | | |
| | 10,303 | | | Tullow Oil | | | 224,328 | | |
| | 181,680 | | | Vodafone Group | | | 504,765 | | |
| | 8,700 | | | Willis Group Holdings | | | 337,560 | | |
| | | | 4,243,900 | | |
| | | | | Total Common Stocks (Cost $19,773,407) | | | 19,468,512 | | |
| NUMBER OF SHARES | | | | VALUE† | |
| Rights (0.0%) | |
| Belgium (0.0%) | | | |
| | 112,269 | | | Anheuser-Busch InBev | | $ | 145 | *^^ | |
| | | | | VVPR Strip (Cost $43) | | | | | |
| Short-Term Investments (2.0%) | | | |
| | | | | State Street Institutional Treasury Money Market Fund Institutional Class (Cost $388,699) | | | | | |
| | | | | Total Investments (99.8%) (Cost $20,162,149) | | | 19,857,356 | ## | |
| | | | | Cash, receivables and other assets, less liabilities (0.2%) | | | 44,877 | | |
| | | | | Total Net Assets (100.0%) | | $ | 19,902,233 | | |
See Notes to Schedule of Investments
7
SUMMARY SCHEDULE OF INVESTMENTS BY INDUSTRY INTERNATIONAL PORTFOLIO (UNAUDITED)
| Industry | | Value† | | Percentage of Net Assets | |
| Chemicals | | $ | 1,863,090 | | | | 9.3 | % | |
| Wireless Telecommunication Services | | | 1,369,646 | | | | 6.8 | % | |
| Media | | | 1,253,299 | | | | 6.3 | % | |
| Oil, Gas & Consumable Fuels | | | 1,169,676 | | | | 5.9 | % | |
| Food & Staples Retailing | | | 1,165,922 | | | | 5.9 | % | |
| Metals & Mining | | | 1,092,293 | | | | 5.5 | % | |
| Insurance | | | 898,639 | | | | 4.5 | % | |
| Food Products | | | 897,928 | | | | 4.5 | % | |
| Pharmaceuticals | | | 874,995 | | | | 4.4 | % | |
| Machinery | | | 715,691 | | | | 3.6 | % | |
| Commercial Banks | | | 593,374 | | | | 3.0 | % | |
| Professional Services | | | 553,272 | | | | 2.8 | % | |
| Energy Equipment & Services | | | 545,050 | | | | 2.7 | % | |
| Trading Companies & Distributors | | | 540,081 | | | | 2.7 | % | |
| Health Care Equipment & Supplies | | | 527,725 | | | | 2.7 | % | |
| Health Care Providers & Services | | | 522,282 | | | | 2.6 | % | |
| Commercial Services & Supplies | | | 449,065 | | | | 2.3 | % | |
| Hotels, Restaurants & Leisure | | | 398,877 | | | | 2.0 | % | |
| Auto Components | | | 395,555 | | | | 2.0 | % | |
| Communications Equipment | | | 344,052 | | | | 1.7 | % | |
| Software | | | 303,026 | | | | 1.5 | % | |
| Diversified Financial Services | | | 257,746 | | | | 1.3 | % | |
| Real Estate Investment Trusts | | | 250,818 | | | | 1.3 | % | |
| Aerospace & Defense | | | 244,629 | | | | 1.2 | % | |
| Biotechnology | | | 234,181 | | | | 1.2 | % | |
| Diversified Telecommunication Services | | | 227,046 | | | | 1.2 | % | |
| Semiconductors & Semiconductor Equipment | | | 214,226 | | | | 1.1 | % | |
| Distributors | | | 211,223 | | | | 1.1 | % | |
| Construction & Engineering | | | 208,272 | | | | 1.0 | % | |
| Office Electronics | | | 202,579 | | | | 1.0 | % | |
| Capital Markets | | | 185,362 | | | | 0.9 | % | |
| Textiles, Apparel & Luxury Goods | | | 169,201 | | | | 0.9 | % | |
| Beverages | | | 144,573 | | | | 0.7 | % | |
| Industrial Conglomerates | | | 128,350 | | | | 0.6 | % | |
| Household Products | | | 109,971 | | | | 0.6 | % | |
| Electronic Equipment, Instruments & Components | | | 108,228 | | | | 0.5 | % | |
| Building Products | | | 98,714 | | | | 0.5 | % | |
| Short-Term Investments and Other Assets—Net | | | 433,576 | | | | 2.2 | % | |
| | | $ | 19,902,233 | | | | 100.0 | % | |
See Notes to Schedule of Investments
8
Notes to Schedule of Investments International Portfolio
† In accordance with Accounting Standards Codification ("ASC") 820 "Fair Value Measurements and Disclosures" ("ASC 820"), all investments held by Neuberger Berman Advisers Management Trust International Portfolio (the "Fund") are carried at the value that Neuberger Berman Management LLC ("Management") believes the Fund would receive upon selling an investment in an orderly transaction to an independent buyer in the principal or most advantageous market for the investment under current market conditions. Various inputs, including the volume and level of activity for the asset or liability in the market, are considered in valuing the Fund's investments, some of which are discussed below. Significant management judgment may be necessary to value investments in accordance with ASC 820.
ASC 820 established a three-tier hierarchy of inputs to create a classification of value measurements for disclosure purposes. The three-tier hierarchy of inputs is summarized in the three broad Levels listed below.
• Level 1 – quoted prices in active markets for identical investments
• Level 2 – other significant observable inputs (including quoted prices for similar investments, interest rates, prepayment speeds, credit risk, amortized cost, etc.)
• Level 3 – significant unobservable inputs (including the Fund's own assumptions in determining the fair value of investments)
The inputs or methodology used for valuing an investment are not necessarily an indication of the risk associated with investing in those securities.
The value of the Fund's investments in equity securities, for which market quotations are readily available, is generally determined by Management by obtaining valuations from an independent pricing service based on the latest sale price quoted on a principal exchange or market for that security (Level 1 inputs). Securities traded primarily on the NASDAQ Stock Market are normally valued by the Fund at the NASDAQ Official Closing Price ("NOCP") provided by NASDAQ each business day. The NOCP is the most recently reported price as of 4:00:02 p.m., Eastern time, unless that price is outside the range of the "inside" bid and asked prices (i.e., the bid and asked prices that dealers quote to each other when trading for their own accounts); in that case, NASDAQ will adjust the price to equal the inside bid or asked price, whichever is closer. Because of delays in reporting trades, the NOCP may not be based on the price of the last trade to occur before the market closes. If there is no reported sale of a security on a particular day, the independent pricing service may value the security based on reported market quotations.
Management has developed a process to periodically review information provided by independent pricing services for all types of securities.
Investments in State Street Institutional Treasury Money Market Fund Institutional Class are valued using the fund's daily calculated net asset value per share (Level 2 inputs).
If a valuation is not available from an independent pricing service, or if Management has reason to believe that the valuation received does not represent the amount the Fund might reasonably expect to receive on a current sale in an orderly transaction, the Fund seeks to obtain quotations from principal market makers (generally considered Level 3 inputs). If such quotations are not readily available, the security is valued using methods the Neuberger Berman Advisers Management Trust's Board of Trustees (the "Board") has approved on the belief that they reflect fair value. Numerous factors may be considered when determining the fair value of a security based on Level 2 or 3 inputs, including available analyst, media or other reports, trading in futures or ADRs and whether the issuer of the security being fair valued has other securities outstanding.
The value of the Fund's investments in foreign securities is generally determined using the same valuation methods and inputs as other Fund investments, as discussed above. Foreign security prices expressed in local currency values are translated from the local currency into U.S. dollars using the exchange rates as of 4:00 p.m., Eastern time. The Board has approved the use of Interactive Data Pricing and Reference Data, Inc. ("Interactive") to assist in
See Notes to Financial Statements
9
Notes to Schedule of Investments International Portfolio (cont'd)
determining the fair value of foreign equity securities when changes in the value of a certain index suggest that the closing prices on the foreign exchanges may no longer represent the amount that the Fund could expect to receive for those securities. In this event, Interactive will provide adjusted prices for certain foreign equity securities using a statistical analysis of historical correlations of multiple factors (Level 2 inputs). In the absence of precise information about the market values of these foreign securities as of the close of the New York Stock Exchange, the Board has determined on the basis of available data that prices adjusted in this way are likely to be closer to the prices the Fund could realize on a current sale than are the prices of those securities established at the close of the foreign markets in which the securities primarily trade.
Fair value prices are necessarily estimates, and there is no assurance that such a price will be at or close to the price at which the security is next quoted or next trades.
The following is a summary, categorized by Level, of inputs used to value the Fund's investments as of December 31, 2011:
| Asset Valuation Inputs | | Level 1 | | Level 2 | | Level 3 | | Total | |
| Investments: | |
| Common Stocks^ | | $ | 19,468,512 | | | $ | — | | | $ | — | | | $ | 19,468,512 | | |
| Rights^ | | | — | | | | 145 | | | | — | | | | 145 | | |
| Short-Term Investments | | | — | | | | 388,699 | | | | — | | | | 388,699 | | |
| Total Investments | | $ | 19,468,512 | | | $ | 388,844 | | | $ | — | | | $ | 19,857,356 | | |
^ The Schedule of Investments and Summary Schedule of Investments by Industry provide information on the country and industry categorization for the portfolio.
The Fund had no significant transfers between Levels 1 and 2 during the year ended December 31, 2011.
## At December 31, 2011, the cost of investments for U.S. federal income tax purposes was $20,471,547. Gross unrealized appreciation of investments was $1,589,942 and gross unrealized depreciation of investments was $2,204,133, resulting in net unrealized depreciation of $614,191, based on cost for U.S. federal income tax purposes.
^^ Value of the security was determined using methods the Board has approved on the belief they reflect fair value.
* Security did not produce income during the last twelve months.
See Notes to Financial Statements
10
Statement of Assets and Liabilities
Neuberger Berman Advisers Management Trust
| | | INTERNATIONAL PORTFOLIO | |
| | | December 31, 2011 | |
| Assets | |
| Investments in securities, at value* (Note A)—see Schedule of Investments: | |
| Unaffiliated issuers | | $ | 19,857,356 | | |
| Cash | | | 1 | | |
| Foreign currency | | | 5,770 | | |
| Dividends and interest receivable | | | 112,550 | | |
| Receivable from Management—net (Note B) | | | 28,604 | | |
| Total Assets | | | 20,004,281 | | |
| Liabilities | |
| Payable for securities purchased | | | 8,245 | | |
| Payable for Fund shares redeemed | | | 14,236 | | |
| Payable to investment manager (Note B) | | | 14,460 | | |
| Accrued expenses and other payables | | | 65,107 | | |
| Total Liabilities | | | 102,048 | | |
| Net Assets at value | | $ | 19,902,233 | | |
| Net Assets consist of: | |
| Paid-in capital | | $ | 153,627,803 | | |
| Undistributed net investment income (loss) | | | 150,471 | | |
| Accumulated net realized gains (losses) on investments | | | (133,577,796 | ) | |
| Net unrealized appreciation (depreciation) in value of investments | | | (298,245 | ) | |
| Net Assets at value | | $ | 19,902,233 | | |
| Shares Outstanding ($.001 par value; unlimited shares authorized) | | | 2,356,006 | | |
| Net Asset Value, offering and redemption price per share | | $ | 8.45 | | |
| *Cost of Investments: | | | | | |
| Unaffiliated issuers | | $ | 20,162,149 | | |
| Total cost of foreign currency | | $ | 5,789 | | |
See Notes to Financial Statements
11
Statement of Operations
Neuberger Berman Advisers Management Trust
| | | INTERNATIONAL PORTFOLIO | |
| | | For the Year Ended December 31, 2011 | |
| Investment Income: | |
| Income (Note A): | |
| Dividend income—unaffiliated issuers | | $ | 671,300 | | |
| Interest income—unaffiliated issuers | | | 683 | | |
| Foreign taxes withheld | | | (56,233 | ) | |
| Total income | | $ | 615,750 | | |
| Expenses: | |
| Investment management fees (Note B) | | | 201,840 | | |
| Administration fees (Note B) | | | 71,238 | | |
| Distribution fees (Note B) | | | 59,365 | | |
| Audit fees | | | 41,935 | | |
| Custodian fees (Note A) | | | 107,483 | | |
| Insurance expense | | | 6,117 | | |
| Legal fees | | | 13,068 | | |
| Shareholder reports | | | 119,960 | | |
| Trustees' fees and expenses | | | 55,592 | | |
| Miscellaneous | | | 10,304 | | |
| Total expenses | | | 686,902 | | |
| Expenses reimbursed by Management (Note B) | | | (330,578 | ) | |
| Expenses reduced by custodian fee expense offset arrangement (Note A) | | | (1 | ) | |
| Total net expenses | | | 356,323 | | |
| Net investment income (loss) | | $ | 259,427 | | |
| Realized and Unrealized Gain (Loss) on Investments (Note A): | |
| Net realized gain (loss) on: | |
| Sales of investment securities of unaffiliated issuers | | | 871,758 | | |
| Foreign currency | | | 4,612 | | |
| Change in net unrealized appreciation (depreciation) in value of: | |
| Unaffiliated investment securities | | | (4,088,846 | ) | |
| Foreign currency | | | (22,914 | ) | |
| Net gain (loss) on investments | | | (3,235,390 | ) | |
| Net increase (decrease) in net assets resulting from operations | | $ | (2,975,963 | ) | |
See Notes to Financial Statements
12
Statements of Changes in Net Assets
Neuberger Berman Advisers Management Trust
| | | INTERNATIONAL PORTFOLIO | |
| | | Year Ended December 31, 2011 | | Year Ended December 31, 2010 | |
| Increase (Decrease) in Net Assets: | |
| From Operations (Note A): | |
| Net investment income (loss) | | $ | 259,427 | | | $ | 2,104,525 | | |
| Net realized gain (loss) on investments | | | 876,370 | | | | 38,059,689 | | |
| Change in net unrealized appreciation (depreciation) of investments | | | (4,111,760 | ) | | | (51,887,186 | ) | |
| Net increase (decrease) in net assets resulting from operations | | | (2,975,963 | ) | | | (11,722,972 | ) | |
| Distributions to Shareholders From (Note A): | |
| Net investment income | | | (1,454,260 | ) | | | (2,679,376 | ) | |
| From Fund Share Transactions (Note D): | |
| Proceeds from shares sold | | | 2,732,858 | | | | 14,509,693 | | |
| Proceeds from reinvestment of dividends and distributions | | | 1,454,260 | | | | 2,679,376 | | |
| Payments for shares redeemed | | | (4,681,550 | ) | | | (308,068,821 | ) | |
| Redemption fees retained | | | 162 | | | | 711 | | |
| Net increase (decrease) from Fund share transactions | | | (494,270 | ) | | | (290,879,041 | ) | |
| Net Increase (Decrease) in Net Assets | | | (4,924,493 | ) | | | (305,281,389 | ) | |
| Net Assets: | |
| Beginning of year | | | 24,826,726 | | | | 330,108,115 | | |
| End of year | | $ | 19,902,233 | | | $ | 24,826,726 | | |
| Undistributed net investment income (loss) at end of year | | $ | 150,471 | | | $ | 1,333,733 | | |
See Notes to Financial Statements
13
Notes to Financial Statements International Portfolio
Note A—Summary of Significant Accounting Policies:
1 General: The Fund is a separate operating series of Neuberger Berman Advisers Management Trust (the "Trust"), a Delaware statutory trust organized pursuant to a Trust Instrument dated May 23, 1994. The Trust is currently comprised of ten separate operating series (each individually a "Series," and collectively the "Funds") each of which is diversified. The Trust is registered as an open-end management investment company under the Investment Company Act of 1940, as amended (the "1940 Act"), and its shares are registered under the Securities Act of 1933, as amended. The Fund currently offers only Class S shares. The Board may establish additional series or classes of shares without the approval of shareholders.
The assets of each Series belong only to that Series, and the liabilities of each Series are borne solely by that Series and no other.
The preparation of financial statements in accordance with U.S. generally accepted accounting principles ("GAAP") requires Management to make estimates and assumptions at the date of the financial statements. Actual results could differ from those estimates.
2 Portfolio valuation: Investment securities are valued as indicated in the notes following the Schedule of Investments.
3 Foreign currency translation: The accounting records of the Fund are maintained in U.S. dollars. Foreign currency amounts are translated into U.S. dollars using the exchange rate as of 4:00 p.m., Eastern time, to determine the value of investments, other assets and liabilities. Purchase and sale prices of securities, and income and expenses, are translated into U.S. dollars at the prevailing rate of exchange on the respective dates of such transactions. Net unrealized foreign currency gain (loss), if any, arises from changes in the value of assets and liabilities, other than investments in securities, as a result of changes in exchange rates and is stated separately in the Statement of Operations.
4 Securities transactions and investment income: Securities transactions are recorded on trade date for financial reporting purposes. Dividend income is recorded on the ex-dividend date or, for certain foreign dividends, as soon as the Fund becomes aware of the dividends. Non-cash dividends included in dividend income, if any, are recorded at the fair market value of the securities received. Interest income, including accretion of original issue discount, where applicable, and accretion of discount on short-term investments, if any, is recorded on the accrual basis. Realized gains and losses from securities transactions and foreign currency transactions, if any, are recorded on the basis of identified cost and stated separately in the Statement of Operations.
5 Income tax information: The Funds are treated as separate entities for U.S. federal income tax purposes. It is the policy of the Fund to continue to qualify as a regulated investment company by complying with the requirements of the U.S. Internal Revenue Code applicable to regulated investment companies and to distribute substantially all of its earnings to its shareholders. To the extent the Fund distributes substantially all of its earnings to shareholders, no federal income or excise tax provision is required.
The Fund has adopted the provisions of ASC 740 "Income Taxes" ("ASC 740"). ASC 740 sets forth a minimum threshold for financial statement recognition of a tax position taken, or expected to be taken, in a tax return. The Fund recognizes interest and penalties, if any, related to unrecognized tax positions as an income tax expense in the Statement of Operations. The Fund is subject to examination by U.S. federal and state tax authorities for returns filed for the prior three fiscal years 2008 - 2010. As of December 31, 2011, the Fund did not have any unrecognized tax positions.
Income distributions and capital gain distributions are determined in accordance with income tax regulations, which may differ from GAAP. These differences are primarily due to differing treatments of income and gains on
14
various investment securities held by the Fund, timing differences and differing characterization of distributions made by the Fund as a whole. The Fund may also utilize earnings and profits distributed to shareholders on redemption of shares as a part of the dividends paid deduction for income tax purposes.
As determined on December 31, 2011, permanent differences resulting primarily from different book and tax accounting for foreign currency gains and losses and passive foreign investment company gains and losses were reclassified at fiscal year-end. These reclassifications had no effect on net income, net asset value ("NAV") or NAV per share of the Fund. For the year ended December 31, 2011, the Fund recorded the following permanent reclassifications:
| Paid-in Capital | | Undistributed Net Investment Income (Loss) | | Accumulated Net Realized Gains (Losses) on Investments | |
| $ | — | | | $ | 11,571 | | | $ | (11,571 | ) | |
For tax purposes, short-term gains are considered ordinary income.
The tax character of distributions paid during the years ended December 31, 2011 and December 31, 2010 was as follows:
| Distributions Paid From: | | | |
| Ordinary Income | | Total | | | |
| 2011 | | 2010 | | 2011 | | 2010 | | | |
| $ | 1,454,260 | | | $ | 2,679,376 | | | $ | 1,454,260 | | | $ | 2,679,376 | | | | |
As of December 31, 2011, the components of distributable earnings (accumulated losses) on a U.S. federal income tax basis were as follows:
Undistributed Ordinary Income | | Unrealized Appreciation (Depreciation) | | Loss Carryforwards and Deferrals | | Other Temporary Differences | | Total | |
| $ | 160,100 | | | $ | (607,664 | ) | | $ | (133,278,006 | ) | | $ | — | | | $ | (133,725,570 | ) | |
The difference between book basis and tax basis distributable earnings is attributable primarily to timing differences of wash sales, forward contracts mark to market, passive foreign investment companies and capital loss carryforwards.
To the extent the Fund's net realized capital gains, if any, can be offset by capital loss carryforwards, it is the policy of the Fund not to distribute such gains. The Regulated Investment Company ("RIC") Modernization Act of 2010 (the "Act") became effective for the Fund on January 1, 2011. The Act modernizes several of the federal income and excise tax provisions related to RICs. Among the changes made are changes to the capital loss carryforward rules allowing for RICs to carry forward capital losses indefinitely and to retain the character of capital loss carryforwards as short-term or long-term ("Post-Enactment"). Rules in effect previously limited the carryforward period to eight years and all carryforwards were considered short-term in character ("Pre-Enactment"). As determined at December 31, 2011, the Fund had unused capital loss carryforwards available for federal income tax purposes to offset net realized capital gains, if any, as follows:
| Pre-Enactment | | Post-Enactment (No Expiration Date) | |
| Expiring in: | | Long-Term | | Short-Term | |
| 2016 | | 2017 | | | | | |
| $ | 69,691,258 | | | $ | 63,586,748 | | | $ | — | | | $ | — | | |
15
Post-Enactment capital loss carryforwards must be fully used before Pre-Enactment capital loss carryforwards; therefore, under certain circumstances, Pre-Enactment capital loss carryforwards available as of the report date may expire unused.
During the year ended December 31, 2011, the Fund utilized capital loss carryforwards of $295,388.
6 Distributions to shareholders: The Fund may earn income, net of expenses, daily on its investments. Distributions from net investment income and net realized capital gains, if any, generally are distributed once a year (usually in October). Income distributions and capital gain distributions to shareholders are recorded on the ex-date.
7 Foreign taxes: Foreign taxes withheld represent amounts withheld by foreign tax authorities, net of refunds recoverable.
8 Expense allocation: Certain expenses are applicable to multiple funds. Expenses directly attributable to a Series are charged to that Series. Expenses of the Trust that are not directly attributable to a particular series of the Trust (e.g., the Fund) are allocated among the series of the Trust, on the basis of relative net assets, except where a more appropriate allocation of expenses to each of the series can otherwise be made fairly. Expenses borne by the complex of related investment companies, which includes open-end and closed-end investment companies for which Management serves as investment manager, that are not directly attributable to a particular investment company in the complex (e.g., the Trust) or series thereof are allocated among the investment companies in the complex or series thereof, on the basis of relative net assets, except where a more appropriate allocation of expenses to each of the investment companies in the complex or series thereof can otherwise be made fairly.
9 Redemption of fund shares: Prior to May 1, 2011, the Fund charged a redemption fee of 2% on shares redeemed or exchanged for shares of another fund within 60 days or less of the purchase date. As of May 1, 2011, the Fund no longer charged a redemption fee. All redemption fees were paid to and recorded by the Fund as Paid-in capital. For the year ended December 31, 2011, the Fund received $162 in redemption fees.
10 Investments in foreign securities: Investing in foreign securities may involve certain sovereign and other risks, in addition to the credit and market risks normally associated with domestic securities. These additional risks include the possibility of adverse political and economic developments (including political instability, nationalization, expropriation, or confiscatory taxation) and the potentially adverse effects of unavailability of public information regarding issuers, less governmental supervision and regulation of financial markets, reduced liquidity of certain financial markets, and the lack of uniform accounting, auditing, and financial reporting standards or the application of standards that are different or less stringent than those applied in the United States. Foreign securities also may experience greater price volatility, higher rates of inflation, and delays in settlement.
11 Indemnifications: Like many other companies, the Trust's organizational documents provide that its officers and trustees are indemnified against certain liabilities arising out of the performance of their duties to the Trust. In addition, both in some of its principal service contracts and in the normal course of its business, the Trust enters into contracts that provide indemnifications to other parties for certain types of losses or liabilities. The Trust's maximum exposure under these arrangements is unknown as this could involve future claims against the Trust.
12 Expense offset arrangement: The Fund has an expense offset arrangement in connection with its custodian contract. For the year ended December 31, 2011, the impact of this arrangement was a reduction of expenses of $1.
Note B—Management Fees, Administration Fees, Distribution Arrangements, and Other Transactions with Affiliates:
Fund shares are issued and redeemed in connection with investments in and payments under certain variable annuity contracts and variable life insurance policies issued through separate accounts of life insurance companies and are also offered directly to certain qualified pension and retirement plans.
16
The Fund retains Management as its investment manager under a Management Agreement. For such investment management services, the Fund pays Management a fee at the annual rate of 0.85% of the first $250 million of the Fund's average daily net assets, 0.825% of the next $250 million, 0.80% of the next $250 million, 0.775% of the next $250 million, 0.75% of the next $500 million, 0.725% of the next $1 billion, and 0.70% of average daily net assets in excess of $2.5 billion.
The Fund retains Management as its administrator under an Administration Agreement. The Fund pays Management an administration fee at the annual rate of 0.30% of its average daily net assets under this agreement. Additionally, Management retains State Street Bank and Trust Company ("State Street") as its sub-administrator under a Sub-Administration Agreement. Management pays State Street a fee for all services received under this agreement.
Management acts as agent in arranging for the sale of Fund shares without commission and bears advertising and promotion expenses. The Board has adopted a distribution plan (the "Plan") with respect to the Fund, pursuant to Rule 12b-1 under the 1940 Act. The Plan provides that, as compensation for administrative and other services provided to the Fund, Management's activities and expenses related to the sale and distribution of the Fund's shares, and ongoing services provided to investors in the Fund, Management receives from the Fund a fee at the annual rate of 0.25% of the Fund's average daily net assets. Management receives this amount to provide distribution and shareholder servicing for the Fund and pays a portion of it to institutions that provide such services. Those institutions may use the payments for, among other purposes, compensating employees engaged in sales and/or shareholder servicing. The amount of fees paid by the Fund during any year could have been more or less than the cost of distribution and other services provided to the Fund. FINRA rules limit the amount of annual distribution fees that may be paid by a mutual fund and impose a ceiling on the cumulative distribution fees paid. The Trust's Plan complies with those rules.
Management has contractually undertaken through December 31, 2014 to forgo current payment of fees and/or reimburse the Fund for its operating expenses (including fees payable to Management but excluding interest, taxes, brokerage commissions, extraordinary expenses, transaction costs and dividend expense on short sales, if any) ("Operating Expenses") which exceed, in the aggregate, 2.00% per annum of the Fund's average daily net assets (the "Expense Limitation"). Moreover, Management has contractually committed to reimburse certain expenses, as stated above, for an additional 0.50% per annum of the Fund's average daily net assets to maintain the Fund's Operating Expenses at 1.50% until May 1, 2012. For the year ended December 31, 2011, such excess expenses amounted to $330,578. The Fund has agreed to repay Management through December 31, 2017 for fees and expenses foregone and/or its excess Operating Expenses previously reimbursed by Management, so long as its annual Operating Expenses during that period do not exceed its Expense Limitation, and the repayment is made within three years after the year in which Management issued the reimbursement or waived fees. During the year ended December 31, 2011, there was no repayment to Management under its contractual expense limitation. At December 31, 2011, contingent liabilities to Management under its contractual expense limitation were as follows:
| | | Expiring in: | | | |
| | | 2013 | | 2014 | | Total | |
| | | | | $ | 217,800 | | | $ | 330,578 | | | $ | 548,378 | | |
Neuberger Berman LLC ("Neuberger") is retained by Management to furnish it with investment recommendations and research information without added cost to the Fund. Several individuals who are officers and/or trustees of the Trust are also employees of Neuberger and/or Management.
Management and Neuberger are indirect subsidiaries of Neuberger Berman Group LLC ("NBG," and together with its consolidated subsidiaries "NB Group"). The voting equity of NBG is owned by NBSH Acquisition, LLC ("NBSH"), which was formed to facilitate the May 4, 2009 management buyout of the businesses conducted by NB Group, and Lehman Brothers Holdings Inc. ("LBHI"). NBSH, which is owned by portfolio managers, members of the NB Group management team and certain of NB Group's key employees and senior professionals, owns
17
approximately 52% of the voting equity of NBG, and LBHI and certain of its subsidiaries own the remaining 48% of NBG's voting equity.
On December 14, 2011, the United States Bankruptcy Court for the Southern District of New York approved a motion filed by LBHI and certain of its subsidiaries, as debtors and debtors in possession, (collectively, the "Lehman Brothers Estate") that will provide NBG with the opportunity to purchase the Lehman Brothers Estate's interest in preferred and common equity of NBG. The proposed transactions, which are subject to the Lehman Brothers Estate and NBG signing definitive documentation, as well as to market conditions, would, if successfully implemented, enable NBG to have a lower cost capital structure and set it on a path to 100% employee ownership within the next five to six years.
Note C—Securities Transactions:
During the year ended December 31, 2011, there were purchase and sale transactions (excluding short-term securities) of $10,341,043 and $11,980,180, respectively.
During the year ended December 31, 2011, no brokerage commissions on securities transactions were paid to affiliated brokers.
Note D—Fund Share Transactions:
Share activity for the years ended December 31, 2011 and December 31, 2010 was as follows:
| | | For the Year Ended December 31, | |
| | | 2011 | | 2010 | |
| Shares Sold | | | 267,940 | | | | 1,513,829 | | |
| Shares Issued on Reinvestment of Dividends and Distributions | | | 164,695 | | | | 272,571 | | |
| Shares Redeemed | | | (477,844 | ) | | | (34,113,468 | ) | |
| Total | | | (45,209 | ) | | | (32,327,068 | ) | |
Note E—Line of Credit:
At December 31, 2011, the Fund was a participant in a single committed, unsecured $200,000,000 line of credit with State Street, to be used only for temporary or emergency purposes. Other investment companies managed by Management also participate in this line of credit on the same terms. Interest is charged on borrowings under this line of credit at the higher of (a) the Federal Funds Rate plus 1.25% per annum or (b) the Overnight LIBOR Rate plus 1.25% per annum. A commitment fee of 0.10% (0.125% prior to September 16, 2011) per annum of the available line of credit is charged, of which each participating Fund has agreed to pay its pro rata share, based on the ratio of its individual net assets to the net assets of all participants at the time the fee is due and payable. The fee is paid quarterly in arrears. Because several mutual funds participate, there is no assurance that an individual Fund will have access to all or any part of the $200,000,000 at any particular time.
At December 31, 2011, the Fund was a participant in a single uncommitted, secured $100,000,000 line of credit with State Street to be used only for temporary or emergency purposes or for leverage. Other investment companies managed by Management also participate in this line of credit on the same terms. Interest is charged at LIBOR, or the overnight Federal Funds Rate, plus a spread to be determined at the time of borrowing. Because several mutual funds participate, there is no assurance that the Fund will have access to all or any part of the $100,000,000 at any particular time.
The Fund had no loans outstanding pursuant to these lines of credit at December 31, 2011. During the year ended December 31, 2011, the Fund did not utilize these lines of credit.
18
Note F—Recent Accounting Pronouncement:
In May 2011, the Financial Accounting Standards Board ("FASB") issued Accounting Standards Update ("ASU") No. 2011-04 "Amendments to Achieve Common Fair Value Measurement and Disclosure Requirements in U.S. GAAP and International Financial Reporting Standards ("IFRS")." ASU No. 2011-04 amends ASC 820 to establish common requirements for measuring fair value and for disclosing information about fair value measurements in accordance with GAAP and IFRS. It will not affect the fair valuation of the Fund's investments, but rather the quantitative and qualitative disclosures in the financial statements. ASU No. 2011-04 is effective for fiscal years beginning after December 15, 2011 and for interim periods within those fiscal years. Management is currently evaluating the impact of the adoption of ASU No. 2011-04 on the Fund's financial statement disclosures.
19
Financial Highlights
International Portfolio
The following table includes selected data for a share outstanding throughout each year and other performance information derived from the Financial Statements. Per share amounts that round to less than $.01 or $(.01) per share are presented as $.00 or $(.00), respectively.
| | | Year Ended December 31, | |
| | | 2011 | | 2010 | | 2009 | | 2008 | | 2007 | |
| Net Asset Value, Beginning of Year | | $ | 10.34 | | | $ | 9.51 | | | $ | 7.29 | | | $ | 13.61 | | | $ | 14.29 | | |
| Income From Investment Operations: | |
Net Investment Income (Loss)‡ | | | .11 | | | | .13 | | | | .09 | | | | .32 | | | | .13 | | |
Net Gains or Losses on Securities (both realized and unrealized) | | | (1.36 | ) | | | 1.90 | | | | 2.43 | | | | (6.64 | ) | | | .30 | | |
| Total From Investment Operations | | | (1.25 | ) | | | 2.03 | | | | 2.52 | | | | (6.32 | ) | | | .43 | | |
| Less Distributions From: | |
| Net Investment Income | | | (.64 | ) | | | (1.20 | ) | | | (.30 | ) | | | — | | | | (.24 | ) | |
| Net Capital Gains | | | — | | | | — | | | | — | | | | — | | | | (.87 | ) | |
| Total Distributions | | | (.64 | ) | | | (1.20 | ) | | | (.30 | ) | | | — | | | | (1.11 | ) | |
Redemption FeesØØ | | | .00 | | | | .00 | | | | .00 | | | | .00 | | | | .00 | | |
| Net Asset Value, End of Year | | $ | 8.45 | | | $ | 10.34 | | | $ | 9.51 | | | $ | 7.29 | | | $ | 13.61 | | |
Total Return†† | | | (12.33 | )% | | | 22.01 | % | | | 34.51 | % | | | (46.44 | )% | | | 3.21 | % | |
| Ratios/Supplemental Data | |
| Net Assets, End of Year (in millions) | | $ | 19.9 | | | $ | 24.8 | | | $ | 330.1 | | | $ | 246.9 | | | $ | 653.7 | | |
Ratio of Gross Expenses to Average Net Assets# | | | 1.50 | % | | | 1.50 | % | | | 1.50 | % | | | 1.53 | % | | | 1.51 | % | |
Ratio of Net Expenses to Average Net Assets§ | | | 1.50 | % | | | 1.50 | % | | | 1.50 | % | | | 1.53 | % | | | 1.50 | % | |
Ratio of Net Investment Income (Loss) to Average Net Assets | | | 1.09 | % | | | 1.42 | % | | | 1.13 | % | | | 2.78 | % | | | .85 | % | |
| Portfolio Turnover Rate | | | 45 | % | | | 61 | % | | | 80 | % | | | 149 | % | | | 43 | % | |
See Notes to Financial Highlights
20
Notes to Financial Highlights International Portfolio
†† Total return based on per share NAV reflects the effects of changes in NAV on the performance of the Fund during each fiscal period and assumes income dividends and other distributions, if any, were reinvested. Results represent past performance and do not indicate future results. Current returns may be lower or higher than the performance data quoted. Investment returns and principal may fluctuate and shares when redeemed may be worth more or less than original cost. Total return would have been lower if Management had not reimbursed and/or waived certain expenses. The total return information shown does not reflect charges and other expenses that apply to the separate account or the related insurance policies, and the inclusion of these charges and other expenses would reduce the total return for all fiscal periods shown. For the year ended December 31, 2009, Management reimbursed the Fund for losses incurred in connection with the disposition of foreign currency contracts, which had a .01% impact on total return.
# The Fund is required to calculate an expense ratio without taking into consideration any expense reductions related to expense offset arrangements.
‡ Calculated based on the average number of shares outstanding during the fiscal period.
ØØ Prior to June 1, 2011, redemption fees were charged on the Fund. Calculated based on the average number of shares outstanding during each fiscal period.
§ After reimbursement of expenses and/or waiver of a portion of the investment management fee by Management. Had Management not undertaken such actions, the annualized ratios of net expenses to average daily net assets would have been:
| | | Year Ended December 31, | |
| | | 2011 | | 2010 | | 2009 | | 2008 | | 2007 | |
| | | | | | 2.89 | % | | | 1.65 | % | | | 1.66 | % | | | 1.59 | % | | | 1.53 | % | |
21
Report of Independent Registered Public Accounting Firm
To the Board of Trustees of
Neuberger Berman Advisers Management Trust and
Shareholders of International Portfolio
We have audited the accompanying statement of assets and liabilities, including the schedule of investments, of International Portfolio, one of the series constituting Neuberger Berman Advisers Management Trust (the "Trust"), as of December 31, 2011, and the related statement of operations for the year then ended, the statements of changes in net assets for each of the two years in the period then ended, and the financial highlights for each of the five years in the period then ended. These financial statements and financial highlights are the responsibility of the Trust's management. Our responsibility is to express an opinion on these financial statements and financial highlights based on our audits.
We conducted our audits in accordance with the standards of the Public Company Accounting Oversight Board (United States). Those standards require that we plan and perform the audit to obtain reasonable assurance about whether the financial statements and financial highlights are free of material misstatement. We were not engaged to perform an audit of the Trust's internal control over financial reporting. Our audits included consideration of internal control over financial reporting as a basis for designing audit procedures that are appropriate in the circumstances, but not for the purpose of expressing an opinion on the effectiveness of the Trust's internal control over financial reporting. Accordingly, we express no such opinion. An audit also includes examining, on a test basis, evidence supporting the amounts and disclosures in the financial statements and financial highlights, assessing the accounting principles used and significant estimates made by management, and evaluating the overall financial statement presentation. Our procedures included confirmation of securities owned as of December 31, 2011 by correspondence with the custodian and brokers or by other appropriate auditing procedures where replies from brokers were not received. We believe that our audits provide a reasonable basis for our opinion.
In our opinion, the financial statements and financial highlights referred to above present fairly, in all material respects, the financial position of International Portfolio, a series of Neuberger Berman Advisers Management Trust, at December 31, 2011, the results of its operations for the year then ended, the changes in its net assets for each of the two years in the period then ended, and the financial highlights for each of the five years in the period then ended, in conformity with U.S. generally accepted accounting principles.
Boston, Massachusetts
February 10, 2012
22
Trustee and Officer Information
The following tables set forth information concerning the trustees ("Trustees") and officers ("Officers") of the Trust. All persons named as Trustees and Officers also serve in similar capacities for other funds administered or managed by Management, Neuberger and Neuberger Berman Fixed Income LLC ("NBFI"). The Statement of Additional Information includes additional information about Trustees and is available upon request, without charge, by calling (800) 877-9700.
Information about the Board of Trustees
Name, (Year of Birth), and Address(1) | | Position and Length of Time Served(2) | | Principal Occupation(s)(3) | | Number of Funds in Fund Complex Overseen by Fund Trustee | | Other Directorships Held Outside Fund Complex by Fund Trustee | |
| Independent Trustees | |
| |
| John Cannon (1930) | | Trustee since 2000 | | Consultant; formerly, Chairman, CDC Investment Advisers (registered investment adviser), 1993 to January 1999; formerly, President and Chief Executive Officer, AMA Investment Advisors, an affiliate of the American Medical Association. | | | 47 | | | Formerly, Independent Trustee or Director of three series of Oppenheimer Funds: Oppenheimer Limited Term New York Municipal Fund, Rochester Fund Municipals, and Oppenheimer Convertible Securities Fund, 1992 to 2009. | |
| |
| Faith Colish (1935) | | Trustee since 1982 | | Counsel, Carter Ledyard & Milburn LLP (law firm) since October 2002; formerly, Attorney-at-Law and President, Faith Colish, A Professional Corporation, 1980 to 2002. | | | 47 | | | Formerly, Director, 1997 to 2003, and Advisory Director, 2003 to 2006, ABA Retirement Funds (formerly, American Bar Retirement Association) (not-for-profit membership corporation). | |
| |
23
Name, (Year of Birth), and Address(1) | | Position and Length of Time Served(2) | | Principal Occupation(s)(3) | | Number of Funds in Fund Complex Overseen by Fund Trustee | | Other Directorships Held Outside Fund Complex by Fund Trustee | |
| Martha C. Goss (1949) | | Trustee since 2007 | | President, Woodhill Enterprises Inc./Chase Hollow Associates LLC (personal investment vehicle), since 2006; Chief Operating and Financial Officer, Hopewell Holdings LLC/Amwell Holdings, LLC (a holding company for a healthcare reinsurance company start-up), since 2003; formerly, Consultant, Resources Connection (temporary staffing), 2002 to 2006. | | | 47 | | | Director, American Water (water utility), since 2003; Director, Channel Reinsurance (financial guaranty reinsurance), since 2006; Director, Allianz Life of New York (insurance), since 2005; Director, Financial Women's Association of New York (not-for-profit association), since 2003; Trustee Emerita, Brown University, since 1998; formerly, Director, Ocwen Financial Corporation (mortgage servicing), 2005 to 2010; formerly, Advisory Board Member, Attensity (software developer), 2005 to 2007; formerly, Director, Bank Leumi (commercial bank), 2005 to 2007; formerly, Director, Claire's Stores, Inc. (retailer), 2005 to 2007. | |
| |
| C. Anne Harvey (1937) | | Trustee since 1998 | | President, C.A. Harvey Associates, since October 2001; formerly, Director, AARP, 1978 to December 2001. | | | 47 | | | Formerly, President, Board of Associates to The National Rehabilitation Hospital's Board of Directors, 2001 to 2002; formerly, Member, Individual Investors Advisory Committee to the New York Stock Exchange Board of Directors, 1998 to 2002. | |
| |
24
Name, (Year of Birth), and Address(1) | | Position and Length of Time Served(2) | | Principal Occupation(s)(3) | | Number of Funds in Fund Complex Overseen by Fund Trustee | | Other Directorships Held Outside Fund Complex by Fund Trustee | |
| Robert A. Kavesh (1927) | | Trustee since 2000 | | Retired, since 2002; Marcus Nadler Professor Emeritus of Finance and Economics, New York University Stern School of Business; formerly, Executive Secretary-Treasurer, American Finance Association, 1961 to 1979. | | | 47 | | | Formerly, Director, The Caring Community (not-for-profit), 1997 to 2006; formerly, Director, DEL Laboratories, Inc. (cosmetics and pharmaceuticals), 1978 to 2004; formerly, Director, Apple Bank for Savings, 1979 to 1990; formerly, Director, Western Pacific Industries, Inc., (public company), 1972 to 1986. | |
| |
| Michael M. Knetter (1960) | | Trustee since 2007 | | President and Chief Executive Officer, University of Wisconsin Foundation, since October 2010; formerly, Dean, School of Business, University of Wisconsin - Madison; formerly, Professor of International Economics and Associate Dean, Amos Tuck School of Business - Dartmouth College, 1998 to 2002. | | | 47 | | | Director, American Family Insurance (a mutual company, not publicly traded), since March 2009; formerly, Trustee, Northwestern Mutual Series Fund, Inc., 2007 to 2010; formerly, Director, Wausau Paper, 2005 to 2011; formerly, Director, Great Wolf Resorts, 2004 to 2009. | |
| |
| Howard A. Mileaf (1937) | | Trustee since 1999 | | Retired; formerly, Vice President and General Counsel, WHX Corporation (holding company), 1993 to 2001. | | | 47 | | | Formerly, Director, Webfinancial Corporation (holding company), 2002 to 2008; formerly, Director, WHX Corporation (holding company), 2002 to 2005; formerly, Director, State Theatre of New Jersey (not-for-profit theatre), 2000 to 2005. | |
| |
| George W. Morriss (1947) | | Trustee since 2007 | | Retired; formerly, Executive Vice President and Chief Financial Officer, People's Bank, Connecticut (a financial services company), 1991 to 2001. | | | 47 | | | Manager, Larch Lane Multi-Strategy Fund complex (which currently consists of three funds), since 2006; formerly, Member, NASDAQ Issuers' Affairs Committee, 1995 to 2003. | |
| |
25
Name, (Year of Birth), and Address(1) | | Position and Length of Time Served(2) | | Principal Occupation(s)(3) | | Number of Funds in Fund Complex Overseen by Fund Trustee | | Other Directorships Held Outside Fund Complex by Fund Trustee | |
| Edward I. O'Brien (1928) | | Trustee since 2000 | | Private Investor; formerly, Member, Investment Policy Committee, Edward Jones, 1993 to 2001; President, Securities Industry Association ("SIA") (securities industry's representative in government relations and regulatory matters at the federal and state levels), 1974 to 1992; Adviser to SIA, November 1992 to November 1993. | | | 47 | | | Formerly, Director, Legg Mason, Inc. (financial services holding company), 1993 to July 2008; formerly, Director, Boston Financial Group (real estate and tax shelters), 1993 to 1999. | |
| |
| Jack L. Rivkin (1940) | | Trustee since 2002; President, 2002 to 2008 | | Formerly, Executive Vice President and Chief Investment Officer, Neuberger Berman Holdings LLC (holding company), 2002 to August 2008 and 2003 to August 2008, respectively; formerly, Managing Director and Chief Investment Officer, Neuberger, December 2005 to August 2008 and 2003 to August 2008, respectively; formerly, Executive Vice President, Neuberger, December 2002 to 2005; formerly, Director and Chairman, Management, December 2002 to August 2008; formerly, Executive Vice President, Citigroup Investments, Inc., September 1995 to February 2002; formerly, Executive Vice President, Citigroup Inc., September 1995 to February 2002. | | | 47 | | | Director, Idealab (private company), since 2009; Director, Distributed World Power (private company), since 2009; Director, Dale Carnegie and Associates, Inc. (private company), since 1999; Director, Solbright, Inc. (private company), since 1998; Director, SA Agricultural Fund, since 2009; Chairman and Director, Essential Brands (consumer products) since 2008; formerly, Director, New York Society of Security Analysts, 2006 to 2008. | |
| |
26
Name, (Year of Birth), and Address(1) | | Position and Length of Time Served(2) | | Principal Occupation(s)(3) | | Number of Funds in Fund Complex Overseen by Fund Trustee | | Other Directorships Held Outside Fund Complex by Fund Trustee | |
| Cornelius T. Ryan (1931) | | Trustee since 2000 | | General Partner and Adviser, TD2, TD3, and TOF1 Healthcare Venture Capital Partnerships; formerly, Founding General Partner, Oxford Partners and Oxford Bioscience Partners (venture capital investing) and President, Oxford Venture Corporation, 1981 to 2010. | | | 47 | | | Trustee, Norwalk Hospital Foundation, since 2000; Director, Supply Pro (privately held company), since 2008; formerly, Trustee, Norwalk Hospital, 1995 to 2004; formerly, President and Director, Randolph Computer Corp., 1966 to 1984; formerly, Director of numerous privately held portfolio companies of Oxford Partners and Oxford Bioscience Partners, 1981 to 2005. | |
| |
| Tom D. Seip (1950) | | Trustee since 2000; Chairman of the Board since 2008; Lead Independent Trustee from 2006 to 2008 | | General Partner, Ridgefield Farm LLC (a private investment vehicle); formerly, President and CEO, Westaff, Inc. (temporary staffing), May 2001 to January 2002; formerly, Senior Executive, The Charles Schwab Corporation, 1983 to 1998, including Chief Executive Officer, Charles Schwab Investment Management, Inc.; Trustee, Schwab Family of Funds and Schwab Investments, 1997 to 1998; and Executive Vice President-Retail Brokerage, Charles Schwab & Co., Inc., 1994 to 1997. | | | 47 | | | Director, H&R Block, Inc. (financial services company), since May 2001; formerly, Chairman, Compensation Committee, H&R Block, Inc., 2006 to 2010; formerly, Director, Forward Management, Inc. (asset management company), 1999 to 2006. | |
| |
27
Name, (Year of Birth), and Address(1) | | Position and Length of Time Served(2) | | Principal Occupation(s)(3) | | Number of Funds in Fund Complex Overseen by Fund Trustee | | Other Directorships Held Outside Fund Complex by Fund Trustee | |
| Candace L. Straight (1947) | | Trustee since 1999 | | Private investor and consultant specializing in the insurance industry; formerly, Advisory Director, Securitas Capital LLC (a global private equity investment firm dedicated to making investments in the insurance sector), 1998 to December 2003. | | | 47 | | | Public Member, Board of Governors and Board of Trustees, Rutgers University, since 2011; Director, Montpelier Re Holdings Ltd. (reinsurance company), since 2006; formerly, Director, National Atlantic Holdings Corporation (property and casualty insurance company), 2004 to 2008; formerly, Director, The Proformance Insurance Company (property and casualty insurance company), 2004 to 2008; formerly, Director, Providence Washington Insurance Company (property and casualty insurance company), 1998 to 2006; formerly, Director, Summit Global Partners (insurance brokerage firm), 2000 to 2005. | |
| |
| Peter P. Trapp (1944) | | Trustee since 1984 | | Retired; formerly, Regional Manager for Mid-Southern Region, Ford Motor Credit Company, September 1997 to 2007; formerly, President, Ford Life Insurance Company, April 1995 to August 1997. | | | 47 | | | None. | |
| |
28
Name, (Year of Birth), and Address(1) | | Position and Length of Time Served(2) | | Principal Occupation(s)(3) | | Number of Funds in Fund Complex Overseen by Fund Trustee | | Other Directorships Held Outside Fund Complex by Fund Trustee | |
| Trustees who are "Interested Persons" | |
| |
| Joseph V. Amato* (1962) | | Trustee since 2009 | | President and Director, Neuberger Berman Group LLC, since 2009; President and Chief Executive Officer, Neuberger and Neuberger Berman Holdings LLC (including its predecessor, Neuberger Berman Inc.), since 2007; Chief Investment Officer, Neuberger, since 2009; Chief Investment Officer (Equities) and Managing Director, Management, since 2009; Managing Director, Neuberger Berman Fixed Income LLC ("NBFI") since 2007; Board member of NBFI since 2006; formerly, Global Head of Asset Management of Lehman Brothers Holdings Inc.'s ("LBHI") Investment Management Division, 2006 to 2009; formerly, member of LBHI's Investment Management Division's Executive Management Committee, 2006 to 2009; formerly, Managing Director, Lehman Brothers Inc. ("LBI"), 2006 to 2008; formerly, Chief Recruiting and Development Officer, LBI, 2005 to 2006; formerly, Global Head of LBI's Equity Sales and a Member of its Equities Division Executive Committee, 2003 to 2005. | | | 47 | | | Member of Board of Advisors, McDonough School of Business, Georgetown University, since 2001; Member of New York City Board of Advisors, Teach for America, since 2005; Trustee, Montclair Kimberley Academy (private school), since 2007. | |
| |
29
Name, (Year of Birth), and Address(1) | | Position and Length of Time Served(2) | | Principal Occupation(s)(3) | | Number of Funds in Fund Complex Overseen by Fund Trustee | | Other Directorships Held Outside Fund Complex by Fund Trustee | |
| Robert Conti* (1956) | | Chief Executive Officer, President and Trustee since 2008; prior thereto, Executive Vice President in 2008 and Vice President, 2000 to 2008 | | Managing Director, Neuberger, since 2007; formerly, Senior Vice President, Neuberger, 2003 to 2006; formerly, Vice President, Neuberger, 1999 to 2003; President and Chief Executive Officer, Management, since 2008; formerly, Senior Vice President, Management, 2000 to 2008. | | | 47 | | | Director since 1994 and formerly, Chairman of the Board, 2008 to 2010, Staten Island Mental Health Society, Inc. | |
| |
(1) The business address of each listed person is 605 Third Avenue, New York, New York 10158.
(2) Pursuant to the Trust's Trust Instrument, each of these Trustees shall hold office for life or until his or her successor is elected or the Trust terminates; except that (a) any Trustee may resign by delivering a written resignation; (b) any Trustee may be removed with or without cause at any time by a written instrument signed by at least two-thirds of the other Trustees; (c) any Trustee who requests to be retired, or who has become unable to serve, may be retired by a written instrument signed by a majority of the other Trustees; and (d) any Trustee may be removed at any shareholder meeting by a vote of at least two-thirds of the outstanding shares.
(3) Except as otherwise indicated, each individual has held the positions shown for at least the last five years.
* Indicates a Trustee who is an "interested person" within the meaning of the 1940 Act. Mr. Amato and Mr. Conti are interested persons of the Trust by virtue of the fact that each is an officer of Management, Neuberger and/or their affiliates.
30
Information about the Officers of the Trust
Name, (Year of Birth), and Address(1) | | Position and Length of Time Served(2) | | Principal Occupation(s)(3) | |
| Andrew B. Allard (1961) | | Anti-Money Laundering Compliance Officer since 2002 | | Senior Vice President, Neuberger, since 2006 and Employee since 1999; Deputy General Counsel, Neuberger, since 2004; formerly, Vice President, Neuberger, 2000 to 2005; formerly, Employee, Management, 1994 to 1999; Anti-Money Laundering Compliance Officer, nine registered investment companies for which Management acts as investment manager and administrator (six since 2002, one since 2003, one since 2005 and one since 2006). | |
| |
| Claudia A. Brandon (1956) | | Executive Vice President since 2008 and Secretary since 1985 | | Senior Vice President, Neuberger, since 2007 and Employee since 1999; Senior Vice President, Management, since 2008 and Assistant Secretary since 2004; formerly, Vice President, Neuberger, 2002 to 2006; formerly, Vice President-Mutual Fund Board Relations, Management, 2000 to 2008; formerly, Vice President, Management, 1986 to 1999 and Employee 1984 to 1999; Executive Vice President, nine registered investment companies for which Management acts as investment manager and administrator (nine since 2008); Secretary, nine registered investment companies for which Management acts as investment manager and administrator (three since 1985, three since 2002, one since 2003, one since 2005 and one since 2006). | |
| |
| Anthony DiBernardo (1979) | | Assistant Treasurer since 2011 | | Vice President, Neuberger, since 2009; Employee, Management, since 2003; Assistant Treasurer, nine registered investment companies for which Management acts as investment manager and administrator. | |
| |
| Maxine L. Gerson (1950) | | Executive Vice President since 2008 and Chief Legal Officer since 2005 (only for purposes of sections 307 and 406 of the Sarbanes-Oxley Act of 2002) | | Managing Director, Neuberger, since 2009, and Deputy General Counsel and Assistant Secretary, Neuberger, since 2001; Managing Director, Management, since 2009, and Secretary and General Counsel, Management, since 2004; formerly, Senior Vice President, Neuberger, 2002 to 2009; formerly, Senior Vice President, Management, 2006 to 2009; Executive Vice President, nine registered investment companies for which Management acts as investment manager and administrator (nine since 2008); Chief Legal Officer (only for purposes of sections 307 and 406 of the Sarbanes-Oxley Act of 2002), nine registered investment companies for which Management acts as investment manager and administrator (eight since 2005 and one since 2006). | |
| |
| Sheila R. James (1965) | | Assistant Secretary since 2002 | | Vice President, Neuberger, since 2008 and Employee since 1999; formerly, Assistant Vice President, Neuberger, 2007; formerly, Employee, Management, 1991 to 1999; Assistant Secretary, nine registered investment companies for which Management acts as investment manager and administrator (six since 2002, one since 2003, one since 2005 and one since 2006). | |
| |
| Brian Kerrane (1969) | | Vice President since 2008 | | Senior Vice President, Neuberger, since 2006; formerly, Vice President, Neuberger, 2002 to 2006; Vice President, Management, since 2008 and Employee since 1991; Vice President, nine registered investment companies for which Management acts as investment manager and administrator (nine since 2008). | |
| |
31
Name, (Year of Birth), and Address(1) | | Position and Length of Time Served(2) | | Principal Occupation(s)(3) | |
| Kevin Lyons (1955) | | Assistant Secretary since 2003 | | Assistant Vice President, Neuberger, since 2008 and Employee since 1999; formerly, Employee, Management, 1993 to 1999; Assistant Secretary, nine registered investment companies for which Management acts as investment manager and administrator (seven since 2003, one since 2005 and one since 2006). | |
| |
| Owen F. McEntee, Jr. (1961) | | Vice President since 2008 | | Vice President, Neuberger, since 2006; Employee, Management, since 1992; Vice President, nine registered investment companies for which Management acts as investment manager and administrator (nine since 2008). | |
| |
| John M. McGovern (1970) | | Treasurer and Principal Financial and Accounting Officer since 2005 | | Senior Vice President, Neuberger, since 2007; formerly, Vice President, Neuberger, 2004 to 2006; Employee, Management, since 1993; Treasurer and Principal Financial and Accounting Officer, nine registered investment companies for which Management acts as investment manager and administrator (eight since 2005 and one since 2006); formerly, Assistant Treasurer, eight registered investment companies for which Management acts as investment manager and administrator, 2002 to 2005. | |
| |
| Frank Rosato (1971) | | Assistant Treasurer since 2005 | | Vice President, Neuberger, since 2006; Employee, Management, since 1995; Assistant Treasurer, nine registered investment companies for which Management acts as investment manager and administrator (eight since 2005 and one since 2006). | |
| |
| Neil S. Siegel (1967) | | Vice President since 2008 | | Managing Director, Management, since 2008; Managing Director, Neuberger, since 2006; formerly, Senior Vice President, Neuberger, 2004 to 2006; Vice President, nine registered investment companies for which Management acts as investment manager and administrator (nine since 2008). | |
| |
| Chamaine Williams (1971) | | Chief Compliance Officer since 2005 | | Senior Vice President, Neuberger, since 2007; Chief Compliance Officer, Management, since 2006; Chief Compliance Officer, nine registered investment companies for which Management acts as investment manager and administrator (eight since 2005 and one since 2006); formerly, Senior Vice President, LBI, 2007 to 2008; formerly, Vice President, LBI, 2003 to 2006; formerly, Chief Compliance Officer, Lehman Brothers Asset Management Inc., 2003 to 2007; formerly, Chief Compliance Officer, Lehman Brothers Alternative Investment Management LLC, 2003 to 2007. | |
| |
(1) The business address of each listed person is 605 Third Avenue, New York, New York 10158.
(2) Pursuant to the By-Laws of the Trust, each officer elected by the Trustees shall hold office until his or her successor shall have been elected and qualified or until his or her earlier death, inability to serve, or resignation. Officers serve at the pleasure of the Trustees and may be removed at any time with or without cause.
(3) Except as otherwise indicated, each individual has held the positions shown for at least the last five years.
32
Proxy Voting Policies and Procedures
A description of the policies and procedures that the Trust uses to determine how to vote proxies relating to portfolio securities is available, without charge, by calling 1-800-877-9700 (toll-free) and on the website of the Securities and Exchange Commission, at www.sec.gov. Information regarding how the Trust voted proxies relating to portfolio securities during the most recent 12-month period ended June 30 is also available, without charge, by calling 1-800-877-9700 (toll-free), on the website of the Securities and Exchange Commission at www.sec.gov, and on Management's website at www.nb.com.
Quarterly Portfolio Schedule
The Trust files a complete schedule of portfolio holdings for the Fund with the Securities and Exchange Commission for the first and third quarters of each fiscal year on Form N-Q. The Trust's Forms N-Q are available on the Securities and Exchange Commission's website at www.sec.gov and may be reviewed and copied at the Securities and Exchange Commission's Public Reference Room in Washington, DC. Information on the operation of the Public Reference Room may be obtained by calling 1-800-SEC-0330. The information on Form N-Q is available upon request, without charge, by calling 1-800-877-9700 (toll free).
Notice to Shareholders
The Fund has elected to pass through to its shareholders the credits for taxes paid to foreign countries. For the fiscal year ended December 31, 2011, the Fund designates $52,688, or $0.02 per share outstanding, foreign taxes paid and $671,300, or $0.28 per share outstanding, foreign source income earned for Federal income tax purposes.
Board Consideration of the Management and Sub-Advisory Agreements
At a meeting held on October 13, 2011, the Board, including the Trustees who are not "interested persons" of Management (including its affiliates) or Neuberger Berman Advisers Management Trust ("Independent Fund Trustees"), approved the continuance of the Management and Sub-Advisory Agreements ("Agreements") for the Fund.
In evaluating the Agreements, the Board, including the Independent Fund Trustees, reviewed materials furnished by Management and Neuberger in response to questions submitted by counsel for the Independent Fund Trustees, and met with senior representatives of Management and Neuberger regarding their personnel and operations. The Independent Fund Trustees were advised by counsel that is experienced in Investment Company Act of 1940 matters and that is independent of Management and Neuberger. The Independent Fund Trustees received a memorandum from independent counsel discussing the legal standards for their consideration of the proposed continuance of the Agreements. They met with such counsel separately from representatives of Management to discuss the annual contract review. The annual contract review extends over three regular meetings of the Board, including one meeting devoted primarily to reviewing and discussing Fund performance, to ensure that Management and Neuberger have time to respond to any questions the Independent Fund Trustees may have on their initial review of the report and that the Independent Fund Trustees have time to consider those responses.
The Board considered the following factors, among others, in connection with its approval of the continuance of the Agreements: (1) the nature, extent, and quality of the services provided by Management and Neuberger; (2) the performance of the Fund compared to a relevant market index and a peer group of investment companies; (3) the costs of the services provided and profits or losses realized by Management and its affiliates from their relationship with the Fund; (4) the extent to which economies of scale might be realized as the Fund grows; and (5) whether fee levels reflect any such potential economies of scale for the benefit of investors in the Fund. In their deliberations, the Board members did not identify any particular information that was all-important or controlling, and each Trustee may have attributed different weights to the various factors.
33
The Board evaluated the terms of the Agreements, the overall fairness of the Agreements to the Fund and whether the Agreements were in the best interests of the Fund and its shareholders.
With respect to the nature, extent and quality of the services provided, the Board considered the performance of the Fund and the experience and staffing of the portfolio management and investment research personnel of Management and Neuberger who perform services for the Fund. The Board noted that Management also provides certain administrative services, including fund accounting and compliance oversight. The Board also considered Management's and Neuberger's policies and practices regarding brokerage and the allocation of portfolio transactions. The Board's Portfolio Transactions and Pricing Committee from time to time reviewed the quality of the execution services that Management and Neuberger had provided, and periodically reviews studies by an independent firm engaged to review and evaluate the quality of brokerage execution received by the Fund. The Board also reviewed whether Management and Neuberger used brokers to execute Fund transactions that provide research and other services to Management and Neuberger, and the types of benefits potentially derived from such services by Management, Neuberger, the Fund and other clients of Management and Neuberger. In addition, the Board noted the positive compliance history of Management and Neuberger, as each firm has been free of significant reported compliance problems.
The Board considered the performance of the Fund relative to its benchmark and the average performance of composite peer groups of investment companies pursuing broadly similar strategies. The Board also reviewed performance in relation to certain measures of the degree of investment risk undertaken by the portfolio managers, during the period. The Board also considered Management's resources and responsiveness with respect to the Fund.
With respect to the overall fairness of the Agreements, the Board considered the fee structure for the Fund under the Agreements as compared to a peer group of comparable funds and any fall-out benefits likely to accrue to Management or Neuberger or their affiliates from their relationship with the Fund. The Board also considered the profitability of Management and its affiliates from their association with the Fund.
The Board reviewed a comparison of the Fund's management fee and overall expense ratio to a peer group of broadly comparable funds. The Board considered the mean and median of the management fees and expense ratios of the peer group. The Board noted that the Fund's management fee was higher than the peer group mean and median. The Board considered whether specific portfolio management or administration needs contributed to the management fee. With regard to the sub-advisory fee paid to Neuberger, the Board noted that this fee is "at cost." In addition, the Board considered the contractual and voluntary limits on Fund expenses undertaken by Management.
The Board considered whether there were other funds that were advised or sub-advised by Management or its affiliates or separate accounts managed by Management or its affiliates with similar investment objectives, policies and strategies to the Fund. The Board compared the fees charged to the Fund to the fees charged to registered funds, a sub-advised fund and a separate account, each managed by Management in a similar style to the Fund. The Board considered the appropriateness and reasonableness of any differences between the fees charged to the Fund and the other funds and account and determined that the differences in fees were consistent with the management and other services provided.
The Board also evaluated any apparent or anticipated economies of scale in relation to the services Management provides to the Fund. The Board considered whether the Fund's fee structure provides for a reduction of payments resulting from the use of breakpoints and whether those breakpoints are set at appropriate asset levels. In concluding that the benefits accruing to Management and its affiliates by virtue of their relationship to the Fund were reasonable in comparison with the costs of providing the investment advisory services and the benefits accruing to the Fund, the Board reviewed specific data as to Management's profit on the Fund for a recent period and the trend in profit or loss over recent years. The Board also carefully examined Management's cost allocation methodology. The Board recognized that Management should be entitled to earn a reasonable level of profits for services it provides to the Fund and, based on its review, concluded that Management's level of profitability was not excessive.
34
Conclusions
In approving the Agreements, the Board concluded that the terms of each Agreement are fair and reasonable and that approval of the Agreements is in the best interests of the Fund and its shareholders. In reaching this determination, the Board considered that Management and Neuberger could be expected to provide a high level of service to the Fund; that the performance of the Fund was satisfactory over time; that the Fund's fee structure appeared to the Board to be reasonable given the nature and quality of services provided; and that the benefits accruing to Management and its affiliates by virtue of their relationship to the Fund were reasonable in comparison with the benefits accruing to the Fund.
35
Neuberger Berman
Advisers Management Trust
Mid Cap Growth Portfolio
I Class Shares
S Class Shares
Annual Report
December 31, 2011
B1013 02/12
Mid Cap Growth Portfolio Commentary (Unaudited)
Neuberger Berman Advisers Management Trust (AMT) Mid Cap Growth Portfolio Class I generated a 0.47% total return for the fiscal year ended December 31, 2011, outperforming its benchmark, the Russell Midcap® Growth Index, which returned –1.65% for the same period. Returns for the Portfolio's Class I and Class S shares are provided on page 3.
2011 was a year in which macro and political headlines overshadowed fundamentals. Characterized by "risk-on, risk-off" volatility and highly correlated market moves among stocks that failed to differentiate between companies, 2011, much like 2010, was plagued by Europe's unresolved debt crisis, political gridlock and acrimony in Washington and concerns over China's management of its growth.
However, despite the broader negative sentiment and legitimate risks to both a domestic and global recovery, there were in our opinion encouraging signs. While the pace of the U.S. economic recovery remained muted, we believe it nonetheless continued to march in the right direction. While volatility posed certain problems, it also afforded opportunities, as valuations for quality mid-cap stocks moved from fair to attractive during the year. Overall, and relative to other options, the U.S. equity market was attractive in our opinion, with corporate balance sheets continuing to gain strength, strong earnings, lean inventories, low leverage and margins that, for the most part, held steady.
For the year, the Portfolio outperformed on the basis of stock selection, relative to the benchmark, with Industrials and Health Care serving as the leading positive contributors to performance. Fastenal, a wholesale and retail company that sells industrial and construction supplies, led the way for Industrials. Fastenal continued to deliver good fundamentals, while increasing market share. Their new vending machine method of distribution for safety products successfully delivered incremental sales revenue.
Alexion Pharmaceuticals, engaged in the discovery, development and commercialization of therapeutic products aimed at treating patients with rare, life-threatening diseases, was the Portfolio's top performer for the year. Alexion, driven by its successful international rollout and potential new indications for its primary drug, continued to exceed expectations. HMS Holdings, another top contributor, provides a variety of cost containment, benefit coordination and program integrity services for government and private health care sponsors. HMS acquired a company that focuses on Medicare audits, complementing their strength in Medicaid.
Consumer Discretionary, although muted on a relative basis due to the Portfolio's underweight versus the benchmark, delivered strong absolute contributions with Dollar Tree and Ross Stores. Dollar Tree's discount variety stores offering merchandise at the fixed price of one dollar, and Ross Stores, with off-price retail apparel and home accessories, continued to benefit from budget-conscious consumers trading down from more expensive retail options.
Areas of relative underperformance were Information Technology (IT) and Financials. In IT, both an overweight position and stock selection detracted. Rovi Corporation, an integrated product and service solutions provider for consumer interaction with digital media and entertainment, was the leading detractor from performance in 2011 due to disappointing fourth quarter results and the company's guidance on future results. NetApp, a provider of storage and data management solutions, delivered disappointing results amid concerns over rising costs and declining market share. We sold both positions.
Poor stock selection in Financials resulted in performance that detracted from Portfolio returns. Affected by fears of a global recession, Jones Lang LaSalle, a real estate and investment management services firm, was negatively impacted by a slowdown in global leasing.
Based on our expectations for 2012, we have maintained the Portfolio's overweights in Industrials, IT and Health Care and its underweights in Materials, Consumer Staples, Financials and Consumer Discretionary. We believe innovation and unique products and services can be catalysts for outperformance in a tough environment, and the Portfolio's sector overweights reflect that belief. Inconsistent earnings and high cyclicality have led us to underweight Materials and the stubbornly sluggish recoveries in employment and housing have caused us to underweight the two consumer-oriented sectors.
1
As we look toward 2012, despite the many threats to both global and domestic financial stability, we remain cautiously optimistic. We anticipate that modest growth in the U.S. economy will continue, with the risk of recession already priced into the market and an economic downturn unlikely, and we believe that stocks can do well, even if the pace of economic growth remains slow. In our view, 2012 will likely be about business confidence and whether we can move beyond the current fragile state and begin to log meaningful gains in hiring and capital expenditures, which in turn could lend support to the consumer. We believe there is pent-up demand, which in many cases has been on hold in developed markets since 2008; if the leaders in Washington and overseas, especially Europe, can turn uncertainties into resolutions, then hopefully companies will have the confidence to put their cash to work and we could see the potential for positive momentum in the economy.
Sincerely,
Kenneth J. Turek
Portfolio Manager
Information about the principal risks of investing in the Portfolio is set forth in the prospectus and statement of additional information.
The composition, industries and holdings of the Portfolio are subject to change.
2
Mid Cap Growth Portfolio (Unaudited)
SECTOR ALLOCATION
| (as a % of Total Investments) | |
| Consumer Discretionary | | | 18.5 | % | |
| Consumer Staples | | | 3.6 | | |
| Energy | | | 11.1 | | |
| Financials | | | 4.9 | | |
| Health Care | | | 16.3 | | |
| Industrials | | | 19.6 | | |
| Information Technology | | | 19.9 | | |
| Materials | | | 3.2 | | |
| Telecommunication Services | | | 1.7 | | |
| Short-Term Investments | | | 1.2 | | |
| Total | | | 100.0 | % | |
PERFORMANCE HIGHLIGHTS1
| | | Inception | | Average Annual Total Return Ended 12/31/2011 | |
| | | Date | | 1 Year | | 5 Years | | 10 Years | | Life of Fund* | |
Mid Cap Growth Portfolio Class I | | | 11/03/1997 | | | | 0.47 | % | | | 3.44 | % | | | 4.98 | % | | | 7.67 | % | |
Mid Cap Growth Portfolio Class S2 | | | 02/18/2003 | | | | 0.26 | % | | | 3.19 | % | | | 4.75 | % | | | 7.50 | % | |
Russell Midcap® Growth Index3 | | | | | | | –1.65 | % | | | 2.44 | % | | | 5.29 | % | | | 5.56 | % | |
Russell Midcap® Index3 | | | | | | | –1.55 | % | | | 1.41 | % | | | 6.99 | % | | | 7.40 | % | |
Performance data quoted represent past performance and do not indicate future results. The investment return and principal value of an investment will fluctuate so that an investor's shares, when redeemed, may be worth more or less than their original cost. Results are shown on a "total return" basis and include reinvestment of all income dividends and distributions.
Current performance may be lower or higher than the performance data quoted. For performance data current to the most recent month end, please visit https://www.nb.com.
* Index returns are as of the inception date 11/03/1997.
As stated in the Portfolio's most recent prospectus, the total annual operating expense ratios for fiscal year 2010 were 1.02% and 1.27% for Class I and Class S shares, respectively (prior to any fee waivers and/or expense reimbursements, if any). The expense ratio net of waivers and/or reimbursements was 1.25% for Class S shares. Neuberger Berman Management LLC has contractually agreed to limit certain expenses of the Portfolio through 12/31/2014 for Class I and Class S shares.
The results shown in the table do not reflect the effect of taxes an investor would pay on Portfolio distributions or on the redemption of Portfolio shares.
COMPARISON OF A $10,000 INVESTMENT
The graph shows the change in value of a hypothetical $10,000 investment in the Portfolio over the past 10 fiscal years, or since the Portfolio's inception, if it has not operated for 10 years. The graph is based on Class I shares only; performance of other classes will vary due to differences in fee structures (see Performance Highlights chart above). The result is compared with benchmarks, which may include a broad-based market index and/or a narrower index. Market indices have not been reduced to reflect any of the fees and costs of investing. All results include the reinvestment of income dividends and distributions. The results shown in the graph do not reflect the effect of taxes that an investor would pay on Portfolio distributions or the redemption of Portfolio shares. Results represent past performance and do not indicate future results.
Please see Endnotes for additional information.
3
Endnotes (Unaudited)
1 "Total Return" includes reinvestment of all income dividends and distributions. Results represent past performance and do not indicate future results. The value of an investment in the Portfolio and the return on the investment both will fluctuate, and redemption proceeds may be higher or lower than an investor's original cost. The performance information does not reflect fees and expenses of the variable annuity and variable life insurance policies or the qualified pension retirement plans whose proceeds are invested in the Portfolio. Neuberger Berman Management LLC ("NBM LLC") has agreed to absorb certain expenses of the AMT Portfolios, including the Portfolio. Without this arrangement, which is subject to change, the total returns of the Portfolio may have been less.
2 Performance shown prior to February 18, 2003 for the Class S shares is that of the Class I shares, which has lower expenses and correspondingly higher returns than the Class S shares.
3 The Russell Midcap® Growth Index measures the performance of those Russell Midcap® Index companies with higher price-to-book ratios and higher forecasted growth values. The Russell Midcap Index measures the performance of the 800 smallest companies in the Russell 1000® Index, which represents approximately 31% of the total market capitalization of the Russell 1000 Index (which, in turn, consists of the 1,000 largest U.S. companies, based on market capitalization). Please note that indices do not take into account any fees and expenses of investing in the individual securities that they track and that individuals cannot invest directly in any index. Data about the performance of these indices are prepared or obtained by NBM LLC and include reinvestment of all income dividends and distributions. The Portfolio may invest in securities not included in the above-described indices and may not invest in all securities included in the above-described indices.
Any ratios or other measurements using a factor of forecasted earnings of a company discussed herein are based on consensus estimates, not NBM LLC's own projections, and they may or may not be realized. In addition, any revision to a forecast could affect the market price of a security. By quoting them herein, NBM LLC does not offer an opinion as to the accuracy of and does not guarantee these forecasted numbers.
The investments for the Portfolio are managed by the same portfolio manager(s) who manage(s) one or more other registered funds that have similar names, investment objectives and investment styles as the Portfolio. You should be aware that the Portfolio is likely to differ from the other mutual funds in size, cash flow pattern and tax matters. Accordingly, the holdings and performance of the Portfolio can be expected to vary from those of the other mutual funds.
The composition, industries and holdings of the Portfolio are subject to change.
Shares of the separate AMT Portfolios are not available to the general public. Shares of this Portfolio may be purchased only by life insurance companies to be used with their separate accounts that fund variable annuity and variable life insurance policies and by qualified pension and retirement plans.
Statistics and projections in this report are derived from sources deemed to be reliable but cannot be regarded as a representation of future results of the AMT Portfolios. This report is prepared for the general information of shareholders and is not an offer of shares of the AMT Portfolios. Shares of the AMT Portfolios are sold only through the currently effective prospectuses, which must precede or accompany this report.
The "Neuberger Berman" name and logo are registered service marks of Neuberger Berman Group LLC. "Neuberger Berman Management LLC" and the individual Fund names in this piece are either service marks or registered service marks of Neuberger Berman Management LLC.
© 2012 Neuberger Berman Management LLC distributor. All rights reserved.
4
Information About Your Fund's Expenses (Unaudited)
This table is designed to provide information regarding costs related to your investments. All mutual funds incur operating expenses, which include management fees, fees for administrative services and costs of shareholder reports, among others. The following examples are based on an investment of $1,000 made at the beginning of the six month period ended December 31, 2011 and held for the entire period. The table illustrates the fund's costs in two ways:
| Actual Expenses and Performance: | | The first section of the table provides information about actual account values and actual expenses in dollars, based on the fund's actual performance during the period. You may use the information in this line, together with the amount you invested, to estimate the expenses you paid over the period. Simply divide your account value by $1,000 (for example, an $8,600 account value divided by $1,000 = 8.6), then multiply the result by the number in the first section of the table under the heading entitled "Expenses Paid During the Period" to estimate the expenses you paid over the period. | |
| |
Hypothetical Example for Comparison Purposes: | | The second section of the table provides information about hypothetical account values and hypothetical expenses based on the fund's actual expense ratio and an assumed rate of return at 5% per year before expenses. This return is not the fund's actual return. The hypothetical account values and expenses may not be used to estimate the actual ending account balance or expenses you paid for the period. You may use this information to compare the ongoing costs of investing in this fund versus other funds. To do so, compare the expenses shown in this 5% hypothetical example with the 5% hypothetical examples that appear in the shareholder reports of other funds. | |
| |
Please note that the expenses in the table are meant to highlight your ongoing costs only. The table and expense example do not include any transaction costs, such as fees and expenses that are, or may be, imposed under your variable contract or qualified pension plan. Therefore, the information under the heading "Hypothetical (5% annual return before expenses)" is useful in comparing ongoing costs only, and will not help you determine the relative total costs of owning different funds. In addition, if these transaction costs were included, your costs would have been higher.
Expense Information as of 12/31/11
NEUBERGER BERMAN ADVISERS MANAGEMENT TRUST MID CAP GROWTH PORTFOLIO
| Actual | | Beginning Account Value 7/1/11 | | Ending Account Value 12/31/11 | | Expenses Paid During the Period* 7/1/11 – 12/31/11 | | Expense Ratio | |
| Class I | | $ | 1,000.00 | | | $ | 916.20 | | | $ | 4.88 | | | | 1.01 | % | |
| Class S | | $ | 1,000.00 | | | $ | 915.10 | | | $ | 6.03 | | | | 1.25 | % | |
| Hypothetical (5% annual return before expenses)** | |
| Class I | | $ | 1,000.00 | | | $ | 1,020.11 | | | $ | 5.14 | | | | 1.01 | % | |
| Class S | | $ | 1,000.00 | | | $ | 1,018.90 | | | $ | 6.36 | | | | 1.25 | % | |
* For each class, expenses are equal to the annualized expense ratio for the class, multiplied by the average account value over the period, multiplied by 184/365 (to reflect the one-half year period shown).
** Hypothetical 5% annual return before expenses is calculated by multiplying the number of days in the most recent half year divided by 365.
5
Schedule of Investments Mid Cap Growth Portfolio
| NUMBER OF SHARES | | | | VALUE† | |
| Common Stocks (98.6%) | | | |
| Aerospace & Defense (3.0%) | | | |
| | 75,000 | | | BE Aerospace | | $ | 2,903,250 | * | |
| | 49,000 | | | HEICO Corp. | | | 2,865,520 | | |
| | 20,000 | | | Precision Castparts | | | 3,295,800 | | |
| | | | 9,064,570 | | |
| Auto Components (1.8%) | | | |
| | 35,000 | | | BorgWarner, Inc. | | | 2,230,900 | * | |
| | 110,000 | | | Gentex Corp. | | | 3,254,900 | | |
| | | | 5,485,800 | | |
| Beverages (0.5%) | | | |
| | 26,500 | | | Beam, Inc. | | | 1,357,595 | | |
| Biotechnology (2.2%) | | | |
| | 80,000 | | | Alexion Pharmaceuticals | | | 5,720,000 | * | |
| | 22,500 | | | Cepheid, Inc. | | | 774,225 | * | |
| | | | 6,494,225 | | |
| Building Products (0.5%) | | | |
| | 90,000 | | | Fortune Brands Home & Security | | | 1,532,700 | * | |
| Capital Markets (1.2%) | | | |
| | 37,900 | | | Affiliated Managers Group | | | 3,636,505 | * | |
| Chemicals (2.8%) | | | |
| | 60,000 | | | Airgas, Inc. | | | 4,684,800 | | |
| | 32,500 | | | Ashland Inc. | | | 1,857,700 | | |
| | 27,300 | | | Sigma-Aldrich | | | 1,705,158 | | |
| | | | 8,247,658 | | |
| Commercial Services & Supplies (1.8%) | | | |
| | 70,000 | | | Stericycle, Inc. | | | 5,454,400 | * | |
| Communications Equipment (1.0%) | | | |
| | 40,000 | | | Acme Packet | | | 1,236,400 | * | |
| | 15,500 | | | F5 Networks | | | 1,644,860 | * | |
| | | | 2,881,260 | | |
| Diversified Financial Services (1.6%) | | | |
| | 29,400 | | | IntercontinentalExchange Inc. | | | 3,544,170 | * | |
| | 35,000 | | | MSCI Inc. Class A | | | 1,152,550 | * | |
| | | | 4,696,720 | | |
| NUMBER OF SHARES | | | | VALUE† | |
| Electrical Equipment (4.3%) | | | |
| | 100,900 | | | AMETEK, Inc. | | $ | 4,247,890 | | |
| | 32,500 | | | Polypore International | | | 1,429,675 | * | |
| | 51,500 | | | Roper Industries | | | 4,473,805 | | |
| | 95,000 | | | Sensata Technologies Holding | | | 2,496,600 | * | |
| | | | 12,647,970 | | |
Electronic Equipment, Instruments & Components (2.6%) | | | |
| | 58,500 | | | National Instruments | | | 1,518,075 | | |
| | 110,500 | | | Trimble Navigation | | | 4,795,700 | * | |
| | 40,000 | | | Universal Display | | | 1,467,600 | * | |
| | | | 7,781,375 | | |
| Energy Equipment & Services (5.2%) | | | |
| | 21,500 | | | Cameron International | | | 1,057,585 | * | |
| | 35,000 | | | CARBO Ceramics | | | 4,316,550 | | |
| | 50,000 | | | Core Laboratories | | | 5,697,500 | | |
| | 57,500 | | | Oil States International | | | 4,391,275 | * | |
| | | | 15,462,910 | | |
| Food & Staples Retailing (0.9%) | | | |
| | 36,800 | | | Whole Foods Market | | | 2,560,544 | | |
| Food Products (1.2%) | | | |
| | 50,000 | | | Mead Johnson Nutrition | | | 3,436,500 | | |
| Health Care Equipment & Supplies (3.4%) | | | |
| | 22,500 | | | Edwards Lifesciences | | | 1,590,750 | * | |
| | 7,200 | | | Intuitive Surgical | | | 3,333,672 | * | |
| | 40,000 | | | Masimo Corp. | | | 747,400 | * | |
| | 115,900 | | | NxStage Medical | | | 2,060,702 | * | |
| | 105,700 | | | Volcano Corp. | | | 2,514,603 | * | |
| | | | 10,247,127 | | |
| Health Care Providers & Services (3.8%) | | | |
| | 67,500 | | | Catalyst Health Solutions | | | 3,510,000 | * | |
| | 32,000 | | | DaVita, Inc. | | | 2,425,920 | * | |
| | 168,000 | | | HMS Holdings | | | 5,372,640 | * | |
| | | | 11,308,560 | | |
| Health Care Technology (2.0%) | | | |
| | 75,000 | | | Cerner Corp. | | | 4,593,750 | * | |
| | 40,000 | | | Quality Systems | | | 1,479,600 | | |
| | | | 6,073,350 | | |
See Notes to Schedule of Investments
6
| NUMBER OF SHARES | | | | VALUE† | |
| Hotels, Restaurants & Leisure (2.7%) | | | |
| | 105,000 | | | Arcos Dorados Holdings Class A | | $ | 2,155,650 | | |
| | 8,000 | | | Chipotle Mexican Grill | | | 2,701,920 | * | |
| | 33,500 | | | Starwood Hotels & Resorts Worldwide | | | 1,606,995 | | |
| | 15,000 | | | Wynn Resorts | | | 1,657,350 | | |
| | | | 8,121,915 | | |
| Household Products (1.1%) | | | |
| | 70,000 | | | Church & Dwight | | | 3,203,200 | | |
| Internet Software & Services (1.1%) | | | |
| | 75,000 | | | Rackspace Hosting | | | 3,225,750 | * | |
| IT Services (2.5%) | | | |
| | 52,500 | | | Cognizant Technology Solutions Class A | | | 3,376,275 | * | |
| | 110,000 | | | VeriFone Systems | | | 3,907,200 | * | |
| | | | 7,283,475 | | |
| Life Science Tools & Services (0.8%) | | | |
| | 30,500 | | | Waters Corp. | | | 2,258,525 | * | |
| Machinery (3.9%) | | | |
| | 27,500 | | | Cummins Inc. | | | 2,420,550 | | |
| | 60,000 | | | Donaldson Co. | | | 4,084,800 | | |
| | 22,500 | | | Joy Global | | | 1,686,825 | | |
| | 60,000 | | | Pall Corp. | | | 3,429,000 | | |
| | | | 11,621,175 | | |
| Media (1.3%) | | | |
| | 32,500 | | | AMC Networks Class A | | | 1,221,350 | * | |
| | 62,400 | | | Discovery Communications Class A | | | 2,556,528 | * | |
| | | | 3,777,878 | | |
| Metals & Mining (0.4%) | | | |
| | 34,500 | | | Agnico-Eagle Mines | | | 1,253,040 | | |
| Multiline Retail (3.2%) | | | |
| | 70,000 | | | Dollar Tree | | | 5,817,700 | * | |
| | 75,900 | | | Nordstrom, Inc. | | | 3,772,989 | | |
| | | | 9,590,689 | | |
| Oil, Gas & Consumable Fuels (5.8%) | | | |
| | 46,000 | | | Cabot Oil & Gas | | | 3,491,400 | | |
| | 50,000 | | | Concho Resources | | | 4,687,500 | * | |
| | 125,000 | | | Denbury Resources | | | 1,887,500 | * | |
| | 33,700 | | | Laredo Petroleum Holdings | | | 751,510 | * | |
| | 42,500 | | | Oasis Petroleum | | | 1,236,325 | * | |
| | 70,000 | | | QEP Resources | | | 2,051,000 | | |
| | 45,000 | | | SM Energy | | | 3,289,500 | | |
| | | | 17,394,735 | | |
| NUMBER OF SHARES | | | | VALUE† | |
| Pharmaceuticals (4.0%) | | | |
| | 41,500 | | | Medicis Pharmaceutical Class A | | $ | 1,379,875 | | |
| | 45,000 | | | Perrigo Co. | | | 4,378,500 | | |
| | 55,000 | | | Salix Pharmaceuticals | | | 2,631,750 | * | |
| | 58,800 | | | Watson Pharmaceuticals | | | 3,547,992 | * | |
| | | | 11,938,117 | | |
| Professional Services (1.8%) | | | |
| | 52,000 | | | Nielsen Holdings | | | 1,543,880 | * | |
| | 96,100 | | | Verisk Analytics Class A | | | 3,856,493 | * | |
| | | | 5,400,373 | | |
Real Estate Management & Development (1.0%) | | | |
| | 47,500 | | | Jones Lang LaSalle | | | 2,909,850 | | |
| Road & Rail (1.1%) | | | |
| | 75,000 | | | J.B. Hunt Transport Services | | | 3,380,250 | | |
Semiconductors & Semiconductor Equipment (3.2%) | | | |
| | 41,500 | | | Altera Corp. | | | 1,539,650 | | |
| | 140,300 | | | Avago Technologies | | | 4,049,058 | | |
| | 70,000 | | | Cavium Inc. | | | 1,990,100 | * | |
| | 50,000 | | | Microchip Technology | | | 1,831,500 | | |
| | | | 9,410,308 | | |
| Software (9.6%) | | | |
| | 69,000 | | | ANSYS, Inc. | | | 3,952,320 | * | |
| | 55,000 | | | Ariba, Inc. | | | 1,544,400 | * | |
| | 57,600 | | | Check Point Software Technologies | | | 3,026,304 | * | |
| | 52,800 | | | Citrix Systems | | | 3,206,016 | * | |
| | 52,500 | | | Electronic Arts | | | 1,081,500 | * | |
| | 105,700 | | | Informatica Corp. | | | 3,903,501 | * | |
| | 65,000 | | | MICROS Systems | | | 3,027,700 | * | |
| | 100,000 | | | QLIK Technologies | | | 2,420,000 | * | |
| | 46,500 | | | Red Hat | | | 1,919,985 | * | |
| | 20,000 | | | Salesforce.com, Inc. | | | 2,029,200 | * | |
| | 47,500 | | | Solera Holdings | | | 2,115,650 | | |
| | 29,400 | | | Zynga Inc. | | | 276,654 | * | |
| | | | 28,503,230 | | |
| Specialty Retail (7.3%) | | | |
| | 78,800 | | | Bed Bath & Beyond | | | 4,568,036 | * | |
| | 86,700 | | | Dick's Sporting Goods | | | 3,197,496 | | |
| | 42,500 | | | DSW Inc. Class A | | | 1,878,925 | | |
| | 53,900 | | | O'Reilly Automotive | | | 4,309,305 | * | |
| | 105,600 | | | Ross Stores | | | 5,019,168 | | |
| | 40,000 | | | Tractor Supply | | | 2,806,000 | | |
| | | | 21,778,930 | | |
See Notes to Schedule of Investments
7
| NUMBER OF SHARES | | | | VALUE† | |
| Textiles, Apparel & Luxury Goods (2.1%) | | | |
| | 50,000 | | | Coach, Inc. | | $ | 3,052,000 | | |
| | 45,000 | | | PVH Corp. | | | 3,172,050 | | |
| | | | 6,224,050 | | |
| Trading Companies & Distributors (3.1%) | | | |
| | 150,000 | | | Fastenal Co. | | | 6,541,500 | | |
| | 39,200 | | | MSC Industrial Direct Class A | | | 2,804,760 | | |
| | | | 9,346,260 | | |
| Wireless Telecommunication Services (2.8%) | | | |
| | 55,000 | | | American Tower Class A | | | 3,300,550 | | |
| | 117,100 | | | SBA Communications Class A | | | 5,030,616 | * | |
| | | | 8,331,166 | | |
| | | | | Total Common Stocks (Cost $204,442,687) | | | 293,322,685 | | |
| Short-Term Investments (1.2%) | | | |
| | 3,536,596 | | | State Street Institutional Liquid Reserves Fund Institutional Class (Cost $3,536,596) | | | 3,536,596 | | |
| | | | | Total Investments (99.8%) (Cost $207,979,283) | | | 296,859,281 | ## | |
| | | | | Cash, receivables and other assets, less liabilities (0.2%) | | | 581,228 | | |
| | | | | Total Net Assets (100.0%) | | $ | 297,440,509 | | |
See Notes to Schedule of Investments
8
Notes to Schedule of Investments Mid Cap Growth Portfolio
† In accordance with Accounting Standards Codification ("ASC") 820 "Fair Value Measurements and Disclosures" ("ASC 820"), all investments held by Neuberger Berman Advisers Management Trust Mid Cap Growth Portfolio (the "Fund") are carried at the value that Neuberger Berman Management LLC ("Management") believes the Fund would receive upon selling an investment in an orderly transaction to an independent buyer in the principal or most advantageous market for the investment under current market conditions. Various inputs, including the volume and level of activity for the asset or liability in the market, are considered in valuing the Fund's investments, some of which are discussed below. Significant management judgment may be necessary to value investments in accordance with ASC 820.
ASC 820 established a three-tier hierarchy of inputs to create a classification of value measurements for disclosure purposes. The three-tier hierarchy of inputs is summarized in the three broad Levels listed below.
• Level 1 – quoted prices in active markets for identical investments
• Level 2 – other significant observable inputs (including quoted prices for similar investments, interest rates, prepayment speeds, credit risk, amortized cost, etc.)
• Level 3 – significant unobservable inputs (including the Fund's own assumptions in determining the fair value of investments)
The inputs or methodology used for valuing an investment are not necessarily an indication of the risk associated with investing in those securities.
The value of the Fund's investments in equity securities, for which market quotations are readily available, is generally determined by Management by obtaining valuations from an independent pricing service based on the latest sale price quoted on a principal exchange or market for that security (Level 1 inputs). Securities traded primarily on the NASDAQ Stock Market are normally valued by the Fund at the NASDAQ Official Closing Price ("NOCP") provided by NASDAQ each business day. The NOCP is the most recently reported price as of 4:00:02 p.m., Eastern time, unless that price is outside the range of the "inside" bid and asked prices (i.e., the bid and asked prices that dealers quote to each other when trading for their own accounts); in that case, NASDAQ will adjust the price to equal the inside bid or asked price, whichever is closer. Because of delays in reporting trades, the NOCP may not be based on the price of the last trade to occur before the market closes. If there is no reported sale of a security on a particular day, the independent pricing service may value the security based on reported market quotations.
Management has developed a process to periodically review information provided by independent pricing services for all types of securities.
Investments in State Street Institutional Liquid Reserves Fund Institutional Class are valued using the fund's daily calculated net asset value per share (Level 2 inputs).
If a valuation is not available from an independent pricing service, or if Management has reason to believe that the valuation received does not represent the amount the Fund might reasonably expect to receive on a current sale in an orderly transaction, the Fund seeks to obtain quotations from principal market makers (generally considered Level 3 inputs). If such quotations are not readily available, the security is valued using methods the Neuberger Berman Advisers Management Trust's Board of Trustees (the "Board") has approved on the belief that they reflect fair value. Numerous factors may be considered when determining the fair value of a security based on Level 2 or 3 inputs, including available analyst, media or other reports, trading in futures or ADRs and whether the issuer of the security being fair valued has other securities outstanding.
See Notes to Financial Statements
9
Notes to Schedule of Investments Mid Cap Growth Portfolio (cont'd)
The value of the Fund's investments in foreign securities is generally determined using the same valuation methods and inputs as other Fund investments, as discussed above. Foreign security prices expressed in local currency values are translated from the local currency into U.S. dollars using the exchange rates as of 4:00 p.m., Eastern time. The Board has approved the use of Interactive Data Pricing and Reference Data, Inc. ("Interactive") to assist in determining the fair value of foreign equity securities when changes in the value of a certain index suggest that the closing prices on the foreign exchanges may no longer represent the amount that the Fund could expect to receive for those securities. In this event, Interactive will provide adjusted prices for certain foreign equity securities using a statistical analysis of historical correlations of multiple factors (Level 2 inputs). In the absence of precise information about the market values of these foreign securities as of the close of the New York Stock Exchange, the Board has determined on the basis of available data that prices adjusted in this way are likely to be closer to the prices the Fund could realize on a current sale than are the prices of those securities established at the close of the foreign markets in which the securities primarily trade.
Fair value prices are necessarily estimates, and there is no assurance that such a price will be at or close to the price at which the security is next quoted or next trades.
The following is a summary, categorized by Level, of inputs used to value the Fund's investments as of December 31, 2011:
| Asset Valuation Inputs | | Level 1 | | Level 2 | | Level 3 | | Total | |
| Investments: | |
| Common Stocks^ | | $ | 293,322,685 | | | $ | — | | | $ | — | | | $ | 293,322,685 | | |
| Short-Term Investments | | | — | | | | 3,536,596 | | | | — | | | | 3,536,596 | | |
| Total Investments | | $ | 293,322,685 | | | $ | 3,536,596 | | | $ | — | | | $ | 296,859,281 | | |
^ The Schedule of Investments provides information on the industry categorization for the portfolio.
The Fund had no significant transfers between Levels 1 and 2 during the year ended December 31, 2011.
## At December 31, 2011, the cost of investments for U.S. federal income tax purposes was $208,590,712. Gross unrealized appreciation of investments was $94,897,472 and gross unrealized depreciation of investments was $6,628,903, resulting in net unrealized appreciation of $88,268,569, based on cost for U.S. federal income tax purposes.
* Security did not produce income during the last twelve months.
See Notes to Financial Statements
10
Statement of Assets and Liabilities
Neuberger Berman Advisers Management Trust
| | | MID CAP GROWTH PORTFOLIO | |
| | | December 31, 2011 | |
| Assets | |
| Investments in securities, at value* (Note A)—see Schedule of Investments: | |
| Unaffiliated issuers | | $ | 296,859,281 | | |
| Cash | | | 58,545 | | |
| Dividends and interest receivable | | | 54,631 | | |
| Receivable for securities sold | | | 370,556 | | |
| Receivable for Fund shares sold | | | 993,496 | | |
| Prepaid expenses and other assets | | | 7,203 | | |
| Total Assets | | | 298,343,712 | | |
| Liabilities | |
| Payable for securities purchased | | | 554,600 | | |
| Payable for Fund shares redeemed | | | 24,262 | | |
| Payable to investment manager (Note B) | | | 138,551 | | |
| Payable to administrator—net (Note B) | | | 84,999 | | |
| Accrued expenses and other payables | | | 100,791 | | |
| Total Liabilities | | | 903,203 | | |
| Net Assets at value | | $ | 297,440,509 | | |
| Net Assets consist of: | |
| Paid-in capital | | $ | 250,888,460 | | |
| Accumulated net realized gains (losses) on investments | | | (42,327,949 | ) | |
| Net unrealized appreciation (depreciation) in value of investments | | | 88,879,998 | | |
| Net Assets at value | | $ | 297,440,509 | | |
| Net Assets | |
| Class I | | $ | 233,235,490 | | |
| Class S | | | 64,205,019 | | |
| Shares Outstanding ($.001 par value; unlimited shares authorized) | |
| Class I | | | 8,465,476 | | |
| Class S | | | 2,383,198 | | |
| Net Asset Value, offering and redemption price per share | |
| Class I | | $ | 27.55 | | |
| Class S | | | 26.94 | | |
| *Cost of Investments: | |
| Unaffiliated issuers | | $ | 207,979,283 | | |
See Notes to Financial Statements
11
Statement of Operations
Neuberger Berman Advisers Management Trust
| | | MID CAP GROWTH PORTFOLIO | |
| | | For the Year Ended December 31, 2011 | |
| Investment Income: | |
| Income (Note A): | |
| Dividend income—unaffiliated issuers | | $ | 1,497,333 | | |
| Interest income—unaffiliated issuers | | | 2,375 | | |
| Foreign taxes withheld | | | (8,366 | ) | |
| Total income | | $ | 1,491,342 | | |
| Expenses: | |
| Investment management fees (Note B) | | | 1,727,017 | | |
| Administration fees (Note B): | |
| Class I | | | 764,319 | | |
| Class S | | | 186,833 | | |
| Distribution fees (Note B): | |
| Class S | | | 155,694 | | |
| Audit fees | | | 41,935 | | |
| Custodian fees (Note A) | | | 106,863 | | |
| Insurance expense | | | 19,606 | | |
| Legal fees | | | 173,700 | | |
| Shareholder reports | | | 96,451 | | |
| Trustees' fees and expenses | | | 55,592 | | |
| Miscellaneous | | | 25,357 | | |
| Total expenses | | | 3,353,367 | | |
| Expenses reimbursed by Management (Note B) | | | (4,506 | ) | |
| Expenses reduced by custodian fee expense offset arrangement (Note A) | | | (1 | ) | |
| Total net expenses | | | 3,348,860 | | |
| Net investment income (loss) | | $ | (1,857,518 | ) | |
| Realized and Unrealized Gain (Loss) on Investments (Note A): | |
| Net realized gain (loss) on: | |
| Sales of investment securities of unaffiliated issuers | | | 40,544,868 | | |
| Change in net unrealized appreciation (depreciation) in value of: | |
| Unaffiliated investment securities | | | (37,234,254 | ) | |
| Net gain (loss) on investments | | | 3,310,614 | | |
| Net increase (decrease) in net assets resulting from operations | | $ | 1,453,096 | | |
See Notes to Financial Statements
12
Statements of Changes in Net Assets
Neuberger Berman Advisers Management Trust
| | | MID CAP GROWTH PORTFOLIO | |
| | | Year Ended December 31, 2011 | | Year Ended December 31, 2010 | |
| Increase (Decrease) in Net Assets: | |
| From Operations (Note A): | |
| Net investment income (loss) | | $ | (1,857,518 | ) | | $ | (1,534,288 | ) | |
| Net realized gain (loss) on investments | | | 40,544,868 | | | | 26,150,806 | | |
| Change in net unrealized appreciation (depreciation) of investments | | | (37,234,254 | ) | | | 49,484,663 | | |
| Net increase (decrease) in net assets resulting from operations | | | 1,453,096 | | | | 74,101,181 | | |
| From Fund Share Transactions (Note D): | |
| Proceeds from shares sold: | |
| Class I | | | 13,672,447 | | | | 15,025,210 | | |
| Class S | | | 16,391,288 | | | | 15,437,784 | | |
| Payments for shares redeemed: | |
| Class I | | | (48,218,175 | ) | | | (44,837,450 | ) | |
| Class S | | | (11,075,136 | ) | | | (11,719,211 | ) | |
| Net increase (decrease) from Fund share transactions | | | (29,229,576 | ) | | | (26,093,667 | ) | |
| Net Increase (Decrease) in Net Assets | | | (27,776,480 | ) | | | 48,007,514 | | |
| Net Assets: | |
| Beginning of year | | | 325,216,989 | | | | 277,209,475 | | |
| End of year | | $ | 297,440,509 | | | $ | 325,216,989 | | |
| Undistributed net investment income (loss) at end of year | | $ | — | | | $ | — | | |
See Notes to Financial Statements
13
Notes to Financial Statements Mid Cap Growth Portfolio
Note A—Summary of Significant Accounting Policies:
1 General: The Fund is a separate operating series of Neuberger Berman Advisers Management Trust (the "Trust"), a Delaware statutory trust organized pursuant to a Trust Instrument dated May 23, 1994. The Trust is currently comprised of ten separate operating series (each individually a "Series," and collectively the "Funds") each of which is diversified. The Trust is registered as an open-end management investment company under the Investment Company Act of 1940, as amended (the "1940 Act"), and its shares are registered under the Securities Act of 1933, as amended. The Fund currently offers Class I and Class S shares. The Board may establish additional series or classes of shares without the approval of shareholders.
The assets of each Series belong only to that Series, and the liabilities of each Series are borne solely by that Series and no other.
The preparation of financial statements in accordance with U.S. generally accepted accounting principles ("GAAP") requires Management to make estimates and assumptions at the date of the financial statements. Actual results could differ from those estimates.
2 Portfolio valuation: Investment securities are valued as indicated in the notes following the Schedule of Investments.
3 Foreign currency translation: The accounting records of the Fund are maintained in U.S. dollars. Foreign currency amounts are translated into U.S. dollars using the exchange rate as of 4:00 p.m., Eastern time, to determine the value of investments, other assets and liabilities. Purchase and sale prices of securities, and income and expenses, are translated into U.S. dollars at the prevailing rate of exchange on the respective dates of such transactions. Net unrealized foreign currency gain (loss), if any, arises from changes in the value of assets and liabilities, other than investments in securities, as a result of changes in exchange rates and is stated separately in the Statement of Operations.
4 Securities transactions and investment income: Securities transactions are recorded on trade date for financial reporting purposes. Dividend income is recorded on the ex-dividend date or, for certain foreign dividends, as soon as the Fund becomes aware of the dividends. Non-cash dividends included in dividend income, if any, are recorded at the fair market value of the securities received. Interest income, including accretion of original issue discount, where applicable, and accretion of discount on short-term investments, if any, is recorded on the accrual basis. Realized gains and losses from securities transactions and foreign currency transactions, if any, are recorded on the basis of identified cost and stated separately in the Statement of Operations. Included in net realized gain (loss) on investments are proceeds from the settlements of class action litigation in which the Fund participated as a class member. The amount of such proceeds for the year ended December 31, 2011 was $143,283.
5 Income tax information: The Funds are treated as separate entities for U.S. federal income tax purposes. It is the policy of the Fund to continue to qualify as a regulated investment company by complying with the requirements of the U.S. Internal Revenue Code applicable to regulated investment companies and to distribute substantially all of its earnings to its shareholders. To the extent the Fund distributes substantially all of its earnings to shareholders, no federal income or excise tax provision is required.
The Fund has adopted the provisions of ASC 740 "Income Taxes" ("ASC 740"). ASC 740 sets forth a minimum threshold for financial statement recognition of a tax position taken, or expected to be taken, in a tax return. The Fund recognizes interest and penalties, if any, related to unrecognized tax positions as an income tax expense in the Statement of Operations. The Fund is subject to examination by U.S. federal and state tax authorities for returns filed for the prior three fiscal years 2008-2010. As of December 31, 2011, the Fund did not have any unrecognized tax positions.
14
Income distributions and capital gain distributions are determined in accordance with income tax regulations, which may differ from GAAP. These differences are primarily due to differing treatments of income and gains on various investment securities held by the Fund, timing differences and differing characterization of distributions made by the Fund as a whole. The Fund may also utilize earnings and profits distributed to shareholders on redemption of shares as a part of the dividends paid deduction for income tax purposes.
As determined on December 31, 2011, permanent differences resulting primarily from different book and tax accounting for net operating losses and non-taxable dividend adjustments to income were reclassified at fiscal year-end. These reclassifications had no effect on net income, net asset value ("NAV") or NAV per share of the Fund. For the year ended December 31, 2011, the Fund recorded the following permanent reclassifications:
| Paid-in Capital | | Undistributed Net Investment Income (Loss) | | Accumulated Net Realized Gains (Losses) on Investments | |
| $ | (1,937,514 | ) | | $ | 1,857,518 | | | $ | 79,996 | | |
As of December 31, 2011, the components of distributable earnings (accumulated losses) on a U.S. federal income tax basis were as follows:
Unrealized Appreciation (Depreciation) | | Loss Carryforwards and Deferrals | | Other Temporary Differences | | Total | |
| $ | 88,268,569 | | | $ | (41,716,520 | ) | | $ | — | | | $ | 46,552,049 | | |
The difference between book basis and tax basis distributable earnings is attributable primarily to timing differences of wash sales, capital loss carryforwards and return of capital adjustments for securities sold.
To the extent the Fund's net realized capital gains, if any, can be offset by capital loss carryforwards, it is the policy of the Fund not to distribute such gains. The Regulated Investment Company ("RIC") Modernization Act of 2010 (the "Act") became effective for the Fund on January 1, 2011. The Act modernizes several of the federal income and excise tax provisions related to RICs. Among the changes made are changes to the capital loss carryforward rules allowing for RICs to carry forward capital losses indefinitely and to retain the character of capital loss carryforwards as short-term or long-term ("Post-Enactment"). Rules in effect previously limited the carryforward period to eight years and all carryforwards were considered short-term in character ("Pre-Enactment"). As determined at December 31, 2011, the Fund had unused capital loss carryforwards available for federal income tax purposes to offset net realized capital gains, if any, as follows:
| | | Pre-Enactment | | Post-Enactment (No Expiration Date) | |
| | | Expiring in: 2017 | | Long-Term | | Short-Term | |
| | | | | $ | 41,716,520 | | | $ | — | | | $ | — | | |
Post-Enactment capital loss carryforwards must be fully used before Pre-Enactment capital loss carryforwards; therefore, under certain circumstances, Pre-Enactment capital loss carryforwards available as of the report date may expire unused.
During the year ended December 31, 2011, the Fund utilized capital loss carryforwards of $39,993,273.
6 Distributions to shareholders: The Fund may earn income, net of expenses, daily on its investments. Distributions from net investment income and net realized capital gains, if any, generally are distributed once a year (usually in October). Income distributions and capital gain distributions to shareholders are recorded on the ex-date.
7 Foreign taxes: Foreign taxes withheld represent amounts withheld by foreign tax authorities, net of refunds recoverable.
15
8 Expense allocation: Certain expenses are applicable to multiple funds. Expenses directly attributable to a Series are charged to that Series. Expenses of the Trust that are not directly attributable to a particular series of the Trust (e.g., the Fund) are allocated among the series of the Trust, on the basis of relative net assets, except where a more appropriate allocation of expenses to each of the series can otherwise be made fairly. Expenses borne by the complex of related investment companies, which includes open-end and closed-end investment companies for which Management serves as investment manager, that are not directly attributable to a particular investment company in the complex (e.g., the Trust) or series thereof are allocated among the investment companies in the complex or series thereof, on the basis of relative net assets, except where a more appropriate allocation of expenses to each of the investment companies in the complex or series thereof can otherwise be made fairly. The Fund's expenses (other than those specific to each class) are allocated proportionally each day between the classes based upon the relative net assets of each class.
9 Investments in foreign securities: Investing in foreign securities may involve certain sovereign and other risks, in addition to the credit and market risks normally associated with domestic securities. These additional risks include the possibility of adverse political and economic developments (including political instability, nationalization, expropriation, or confiscatory taxation) and the potentially adverse effects of unavailability of public information regarding issuers, less governmental supervision and regulation of financial markets, reduced liquidity of certain financial markets, and the lack of uniform accounting, auditing, and financial reporting standards or the application of standards that are different or less stringent than those applied in the United States. Foreign securities also may experience greater price volatility, higher rates of inflation, and delays in settlement.
10 Indemnifications: Like many other companies, the Trust's organizational documents provide that its officers and trustees are indemnified against certain liabilities arising out of the performance of their duties to the Trust. In addition, both in some of its principal service contracts and in the normal course of its business, the Trust enters into contracts that provide indemnifications to other parties for certain types of losses or liabilities. The Trust's maximum exposure under these arrangements is unknown as this could involve future claims against the Trust.
11 Expense offset arrangement: The Fund has an expense offset arrangement in connection with its custodian contract. For the year ended December 31, 2011, the impact of this arrangement was a reduction of expenses of $1.
12 Other: All net investment income and realized and unrealized capital gains and losses of the Fund are allocated, on the basis of relative net assets, pro rata among its respective classes.
Note B—Management Fees, Administration Fees, Distribution Arrangements, and Other Transactions with Affiliates:
Fund shares are issued and redeemed in connection with investments in and payments under certain variable annuity contracts and variable life insurance policies issued through separate accounts of life insurance companies and are also offered directly to certain qualified pension and retirement plans.
The Fund retains Management as its investment manager under a Management Agreement. For such investment management services, the Fund pays Management a fee at the annual rate of 0.55% of the first $250 million of the Fund's average daily net assets, 0.525% of the next $250 million, 0.50% of the next $250 million, 0.475% of the next $250 million, 0.45% of the next $500 million, 0.425% of the next $2.5 billion, and 0.40% of average daily net assets in excess of $4 billion.
The Fund retains Management as its administrator under an Administration Agreement. Each class pays Management an administration fee at the annual rate of 0.30% of its average daily net assets under this agreement. Additionally, Management retains State Street Bank and Trust Company ("State Street") as its sub-administrator under a Sub-Administration Agreement. Management pays State Street a fee for all services received under this agreement.
The Board adopted a non-fee distribution plan for the Fund's Class I.
16
For the Fund's Class S, Management acts as agent in arranging for the sale of class shares without commission and bears advertising and promotion expenses. The Board has adopted a distribution plan (the "Plan") with respect to this class, pursuant to Rule 12b-1 under the 1940 Act. The Plan provides that, as compensation for administrative and other services provided to this class, Management's activities and expenses related to the sale and distribution of this class of shares, and ongoing services provided to investors in this class, Management receives from this class a fee at the annual rate of 0.25% of Class S's average daily net assets. Management receives this amount to provide distribution and shareholder servicing for this class and pays a portion of it to institutions that provide such services. Those institutions may use the payments for, among other purposes, compensating employees engaged in sales and/or shareholder servicing. The amount of fees paid by this class during any year could have been more or less than the cost of distribution and other services provided to this class. FINRA rules limit the amount of annual distribution fees that may be paid by a mutual fund and impose a ceiling on the cumulative distribution fees paid. The Trust's Plan complies with those rules.
Management has contractually undertaken to forgo current payment of fees and/or reimburse the Fund's Class I and Class S shares for their operating expenses (excluding fees payable to Management (including fees payable to Management with respect to the Fund's Class S shares), interest, taxes, brokerage commissions, extraordinary expenses, transaction costs and dividend expense on short sales, if any) ("Operating Expenses") which exceed the expense limitation as detailed in the following table:
| | | Expense Limitation(1) | | Expiration | | Reimbursement from Management for the Year Ended December 31, 2011 | |
| Class I | | | 1.00 | % | | 12/31/14 | | $ | — | | |
| Class S | | | 1.25 | % | | 12/31/14 | | | 4,506 | | |
(1) Expense limitation per annum of the respective class' average daily net assets.
Each respective class has agreed to repay Management through December 31, 2017 for fees and expenses foregone and/or its excess Operating Expenses previously reimbursed by Management, so long as its annual Operating Expenses during that period do not exceed its expense limitation, and the repayment is made within three years after the year in which Management issued the reimbursement or waived fees. During the year ended December 31, 2011, there was no repayment to Management under its contractual expense limitation. At December 31, 2011, the Fund's Class I shares had no contingent liability to Management under its contractual expense limitation. At December 31, 2011, the Fund's Class S shares contingent liabilities to Management under its contractual expense limitation were as follows:
| | | Expiring in: | | | |
| | | 2012 | | 2013 | | 2014 | | Total | |
| Class S | | $ | 6,114 | | | $ | 7,615 | | | $ | 4,506 | | | $ | 18,235 | | |
Neuberger Berman LLC ("Neuberger") is retained by Management to furnish it with investment recommendations and research information without added cost to the Fund. Several individuals who are officers and/or trustees of the Trust are also employees of Neuberger and/or Management.
Management and Neuberger are indirect subsidiaries of Neuberger Berman Group LLC ("NBG," and together with its consolidated subsidiaries "NB Group"). The voting equity of NBG is owned by NBSH Acquisition, LLC ("NBSH"), which was formed to facilitate the May 4, 2009 management buyout of the businesses conducted by NB Group, and Lehman Brothers Holdings Inc. ("LBHI"). NBSH, which is owned by portfolio managers, members of the NB Group management team and certain of NB Group's key employees and senior professionals, owns approximately 52% of the voting equity of NBG, and LBHI and certain of its subsidiaries own the remaining 48% of NBG's voting equity.
17
On December 14, 2011, the United States Bankruptcy Court for the Southern District of New York approved a motion filed by LBHI and certain of its subsidiaries, as debtors and debtors in possession, (collectively, the "Lehman Brothers Estate") that will provide NBG with the opportunity to purchase the Lehman Brothers Estate's interest in preferred and common equity of NBG. The proposed transactions, which are subject to the Lehman Brothers Estate and NBG signing definitive documentation, as well as to market conditions, would, if successfully implemented, enable NBG to have a lower cost capital structure and set it on a path to 100% employee ownership within the next five to six years.
Note C—Securities Transactions:
During the year ended December 31, 2011, there were purchase and sale transactions (excluding short-term securities) of $110,441,543 and $142,451,169, respectively.
During the year ended December 31, 2011, no brokerage commissions on securities transactions were paid to affiliated brokers.
Note D—Fund Share Transactions:
Share activity for the years ended December 31, 2011 and December 31, 2010 was as follows:
For the Year Ended December 31, 2011
| | | Shares Sold | | Shares Redeemed | | Total | |
| Class I | | | 478,220 | | | | (1,714,503 | ) | | | (1,236,283 | ) | |
| Class S | | | 587,530 | | | | (408,330 | ) | | | 179,200 | | |
For the Year Ended December 31, 2010
| | | Shares Sold | | Shares Redeemed | | Total | |
| Class I | | | 645,657 | | | | (1,960,763 | ) | | | (1,315,106 | ) | |
| Class S | | | 667,353 | | | | (530,610 | ) | | | 136,743 | | |
Note E—Line of Credit:
At December 31, 2011, the Fund was a participant in a single committed, unsecured $200,000,000 line of credit with State Street, to be used only for temporary or emergency purposes. Other investment companies managed by Management also participate in this line of credit on the same terms. Interest is charged on borrowings under this line of credit at the higher of (a) the Federal Funds Rate plus 1.25% per annum or (b) the Overnight LIBOR Rate plus 1.25% per annum. A commitment fee of 0.10% (0.125% prior to September 16, 2011) per annum of the available line of credit is charged, of which each participating Fund has agreed to pay its pro rata share, based on the ratio of its individual net assets to the net assets of all participants at the time the fee is due and payable. The fee is paid quarterly in arrears. Because several mutual funds participate, there is no assurance that an individual Fund will have access to all or any part of the $200,000,000 at any particular time. There were no loans outstanding pursuant to this line of credit at December 31, 2011. During the year ended December 31, 2011, the Fund did not utilize this line of credit.
Note F—Recent Accounting Pronouncement:
In May 2011, the Financial Accounting Standards Board ("FASB") issued Accounting Standards Update ("ASU") No. 2011-04 "Amendments to Achieve Common Fair Value Measurement and Disclosure Requirements in U.S. GAAP and International Financial Reporting Standards ("IFRS")." ASU No. 2011-04 amends ASC 820 to establish common requirements for measuring fair value and for disclosing information about fair value measurements in
18
accordance with GAAP and IFRS. It will not affect the fair valuation of the Fund's investments, but rather the quantitative and qualitative disclosures in the financial statements. ASU No. 2011-04 is effective for fiscal years beginning after December 15, 2011 and for interim periods within those fiscal years. Management is currently evaluating the impact of the adoption of ASU No. 2011-04 on the Fund's financial statement disclosures.
19
Financial Highlights
Mid Cap Growth Portfolio
The following tables include selected data for a share outstanding throughout each year and other performance information derived from the Financial Statements. Per share amounts that round to less than $.01 or $(.01) per share are presented as $.00 or $(.00), respectively.
| Class I | |
| | | Year Ended December 31, | |
| | | 2011 | | 2010 | | 2009 | | 2008 | | 2007 | |
| Net Asset Value, Beginning of Year | | $ | 27.42 | | | $ | 21.25 | | | $ | 16.14 | | | $ | 28.50 | | | $ | 23.26 | | |
| Income From Investment Operations: | |
Net Investment Income (Loss)‡ | | | (.15 | ) | | | (.11 | ) | | | (.03 | ) | | | (.12 | ) | | | (.05 | ) | |
Net Gains or Losses on Securities (both realized and unrealized) | | | .28 | | | | 6.28 | | | | 5.14 | | | | (12.24 | ) | | | 5.29 | | |
| Total From Investment Operations | | | .13 | | | | 6.17 | | | | 5.11 | | | | (12.36 | ) | | | 5.24 | | |
| Net Asset Value, End of Year | | $ | 27.55 | | | $ | 27.42 | | | $ | 21.25 | | | $ | 16.14 | | | $ | 28.50 | | |
Total Return†† | | | .47 | % | | | 29.04 | % | | | 31.66 | % | | | (43.37 | )% | | | 22.53 | % | |
| Ratios/Supplemental Data | |
| Net Assets, End of Year (in millions) | | $ | 233.2 | | | $ | 266.0 | | | $ | 234.1 | | | $ | 345.1 | | | $ | 819.0 | | |
Ratio of Gross Expenses to Average Net Assets# | | | 1.01 | % | | | 1.02 | % | | | 1.01 | % | | | .92 | % | | | .88 | % | |
| Ratio of Net Expenses to Average Net Assets | | | 1.01 | % | | | 1.02 | % | | | 1.01 | %§ | | | .92 | %§ | | | .88 | %§ | |
Ratio of Net Investment Income (Loss) to Average Net Assets | | | (.54 | )% | | | (.49 | )% | | | (.16 | )% | | | (.51 | )% | | | (.20 | )% | |
| Portfolio Turnover Rate | | | 35 | % | | | 46 | % | | | 67 | % | | | 62 | % | | | 56 | % | |
See Notes to Financial Highlights
20
Financial Highlights (cont'd)
| Class S | |
| | | Year Ended December 31, | |
| | | 2011 | | 2010 | | 2009 | | 2008 | | 2007 | |
| Net Asset Value, Beginning of Year | | $ | 26.87 | | | $ | 20.87 | | | $ | 15.89 | | | $ | 28.13 | | | $ | 23.02 | | |
| Income From Investment Operations: | |
Net Investment Income (Loss)‡ | | | (.21 | ) | | | (.16 | ) | | | (.08 | ) | | | (.17 | ) | | | (.12 | ) | |
Net Gains or Losses on Securities (both realized and unrealized) | | | .28 | | | | 6.16 | | | | 5.06 | | | | (12.07 | ) | | | 5.23 | | |
| Total From Investment Operations | | | .07 | | | | 6.00 | | | | 4.98 | | | | (12.24 | ) | | | 5.11 | | |
| Net Asset Value, End of Year | | $ | 26.94 | | | $ | 26.87 | | | $ | 20.87 | | | $ | 15.89 | | | $ | 28.13 | | |
Total Return†† | | | .26 | % | | | 28.75 | % | | | 31.34 | % | | | (43.51 | )% | | | 22.20 | % | |
| Ratios/Supplemental Data | |
| Net Assets, End of Year (in millions) | | $ | 64.2 | | | $ | 59.2 | | | $ | 43.2 | | | $ | 38.7 | | | $ | 68.9 | | |
Ratio of Gross Expenses to Average Net Assets# | | | 1.25 | % | | | 1.25 | % | | | 1.25 | % | | | 1.18 | % | | | 1.14 | % | |
Ratio of Net Expenses to Average Net Assets§ | | | 1.25 | % | | | 1.25 | % | | | 1.25 | % | | | 1.17 | % | | | 1.13 | % | |
Ratio of Net Investment Income (Loss) to Average Net Assets | | | (.78 | )% | | | (.73 | )% | | | (.44 | )% | | | (.77 | )% | | | (.47 | )% | |
| Portfolio Turnover Rate | | | 35 | % | | | 46 | % | | | 67 | % | | | 62 | % | | | 56 | % | |
See Notes to Financial Highlights
21
Notes to Financial Highlights Mid Cap Growth Portfolio
†† Total return based on per share NAV reflects the effects of changes in NAV on the performance of the Fund during each fiscal period and assumes income dividends and other distributions, if any, were reinvested. Results represent past performance and do not indicate future results. Current returns may be lower or higher than the performance data quoted. Investment returns and principal may fluctuate and shares when redeemed may be worth more or less than original cost. Total return would have been lower if Management had not reimbursed and/or waived certain expenses. The total return information shown does not reflect charges and other expenses that apply to the separate account or the related insurance policies, and the inclusion of these charges and other expenses would reduce the total return for all fiscal periods shown.
# The Fund is required to calculate an expense ratio without taking into consideration any expense reductions related to expense offset arrangements.
‡ Calculated based on the average number of shares outstanding during each fiscal period.
§ After reimbursement of expenses and/or waiver of a portion of the investment management fee by Management. Had Management not undertaken such actions, the annualized ratios of net expenses to average daily net assets would have been:
| | | Year Ended December 31, | |
| | | 2011 | | 2010 | | 2009 | | 2008 | | 2007 | |
| Mid Cap Growth Portfolio Class I | | | — | | | | — | | | | 1.01 | % | | | .92 | % | | | .88 | % | |
| Mid Cap Growth Portfolio Class S | | | 1.26 | % | | | 1.27 | % | | | 1.27 | % | | | 1.17 | % | | | 1.13 | % | |
22
Report of Independent Registered Public Accounting Firm
To the Board of Trustees of
Neuberger Berman Advisers Management Trust and
Shareholders of Mid Cap Growth Portfolio
We have audited the accompanying statement of assets and liabilities, including the schedule of investments, of Mid Cap Growth Portfolio, one of the series constituting Neuberger Berman Advisers Management Trust (the "Trust"), as of December 31, 2011, and the related statement of operations for the year then ended, the statements of changes in net assets for each of the two years in the period then ended, and the financial highlights for each of the five years in the period then ended. These financial statements and financial highlights are the responsibility of the Trust's management. Our responsibility is to express an opinion on these financial statements and financial highlights based on our audits.
We conducted our audits in accordance with the standards of the Public Company Accounting Oversight Board (United States). Those standards require that we plan and perform the audit to obtain reasonable assurance about whether the financial statements and financial highlights are free of material misstatement. We were not engaged to perform an audit of the Trust's internal control over financial reporting. Our audits included consideration of internal control over financial reporting as a basis for designing audit procedures that are appropriate in the circumstances, but not for the purpose of expressing an opinion on the effectiveness of the Trust's internal control over financial reporting. Accordingly, we express no such opinion. An audit also includes examining, on a test basis, evidence supporting the amounts and disclosures in the financial statements and financial highlights, assessing the accounting principles used and significant estimates made by management, and evaluating the overall financial statement presentation. Our procedures included confirmation of securities owned as of December 31, 2011 by correspondence with the custodian and brokers or by other appropriate auditing procedures where replies from brokers were not received. We believe that our audits provide a reasonable basis for our opinion.
In our opinion, the financial statements and financial highlights referred to above present fairly, in all material respects, the financial position of Mid Cap Growth Portfolio, a series of Neuberger Berman Advisers Management Trust, at December 31, 2011, the results of its operations for the year then ended, the changes in its net assets for each of the two years in the period then ended, and the financial highlights for each of the five years in the period then ended, in conformity with U.S. generally accepted accounting principles.
Boston, Massachusetts
February 10, 2012
23
Trustee and Officer Information
The following tables set forth information concerning the trustees ("Trustees") and officers ("Officers") of the Trust. All persons named as Trustees and Officers also serve in similar capacities for other funds administered or managed by Management, Neuberger and Neuberger Berman Fixed Income LLC ("NBFI"). The Statement of Additional Information includes additional information about Trustees and is available upon request, without charge, by calling (800) 877-9700.
Information about the Board of Trustees
Name, (Year of Birth), and Address(1) | | Position and Length of Time Served(2) | | Principal Occupation(s)(3) | | Number of Funds in Fund Complex Overseen by Fund Trustee | | Other Directorships Held Outside Fund Complex by Fund Trustee | |
| Independent Trustees | |
| |
| John Cannon (1930) | | Trustee since 2000 | | Consultant; formerly, Chairman, CDC Investment Advisers (registered investment adviser), 1993 to January 1999; formerly, President and Chief Executive Officer, AMA Investment Advisors, an affiliate of the American Medical Association. | | | 47 | | | Formerly, Independent Trustee or Director of three series of Oppenheimer Funds: Oppenheimer Limited Term New York Municipal Fund, Rochester Fund Municipals, and Oppenheimer Convertible Securities Fund, 1992 to 2009. | |
| |
| Faith Colish (1935) | | Trustee since 1982 | | Counsel, Carter Ledyard & Milburn LLP (law firm) since October 2002; formerly, Attorney-at-Law and President, Faith Colish, A Professional Corporation, 1980 to 2002. | | | 47 | | | Formerly, Director, 1997 to 2003, and Advisory Director, 2003 to 2006, ABA Retirement Funds (formerly, American Bar Retirement Association) (not-for-profit membership corporation). | |
| |
24
Name, (Year of Birth), and Address(1) | | Position and Length of Time Served(2) | | Principal Occupation(s)(3) | | Number of Funds in Fund Complex Overseen by Fund Trustee | | Other Directorships Held Outside Fund Complex by Fund Trustee | |
| Martha C. Goss (1949) | | Trustee since 2007 | | President, Woodhill Enterprises Inc./Chase Hollow Associates LLC (personal investment vehicle), since 2006; Chief Operating and Financial Officer, Hopewell Holdings LLC/Amwell Holdings, LLC (a holding company for a healthcare reinsurance company start-up), since 2003; formerly, Consultant, Resources Connection (temporary staffing), 2002 to 2006. | | | 47 | | | Director, American Water (water utility), since 2003; Director, Channel Reinsurance (financial guaranty reinsurance), since 2006; Director, Allianz Life of New York (insurance), since 2005; Director, Financial Women's Association of New York (not-for-profit association), since 2003; Trustee Emerita, Brown University, since 1998; formerly, Director, Ocwen Financial Corporation (mortgage servicing), 2005 to 2010; formerly, Advisory Board Member, Attensity (software developer), 2005 to 2007; formerly, Director, Bank Leumi (commercial bank), 2005 to 2007; formerly, Director, Claire's Stores, Inc. (retailer), 2005 to 2007. | |
| |
| C. Anne Harvey (1937) | | Trustee since 1998 | | President, C.A. Harvey Associates, since October 2001; formerly, Director, AARP, 1978 to December 2001. | | | 47 | | | Formerly, President, Board of Associates to The National Rehabilitation Hospital's Board of Directors, 2001 to 2002; formerly, Member, Individual Investors Advisory Committee to the New York Stock Exchange Board of Directors, 1998 to 2002. | |
| |
25
Name, (Year of Birth), and Address(1) | | Position and Length of Time Served(2) | | Principal Occupation(s)(3) | | Number of Funds in Fund Complex Overseen by Fund Trustee | | Other Directorships Held Outside Fund Complex by Fund Trustee | |
| Robert A. Kavesh (1927) | | Trustee since 2000 | | Retired, since 2002; Marcus Nadler Professor Emeritus of Finance and Economics, New York University Stern School of Business; formerly, Executive Secretary-Treasurer, American Finance Association, 1961 to 1979. | | | 47 | | | Formerly, Director, The Caring Community (not-for-profit), 1997 to 2006; formerly, Director, DEL Laboratories, Inc. (cosmetics and pharmaceuticals), 1978 to 2004; formerly, Director, Apple Bank for Savings, 1979 to 1990; formerly, Director, Western Pacific Industries, Inc., (public company), 1972 to 1986. | |
| |
| Michael M. Knetter (1960) | | Trustee since 2007 | | President and Chief Executive Officer, University of Wisconsin Foundation, since October 2010; formerly, Dean, School of Business, University of Wisconsin - Madison; formerly, Professor of International Economics and Associate Dean, Amos Tuck School of Business - Dartmouth College, 1998 to 2002. | | | 47 | | | Director, American Family Insurance (a mutual company, not publicly traded), since March 2009; formerly, Trustee, Northwestern Mutual Series Fund, Inc., 2007 to 2010; formerly, Director, Wausau Paper, 2005 to 2011; formerly, Director, Great Wolf Resorts, 2004 to 2009. | |
| |
| Howard A. Mileaf (1937) | | Trustee since 1999 | | Retired; formerly, Vice President and General Counsel, WHX Corporation (holding company), 1993 to 2001. | | | 47 | | | Formerly, Director, Webfinancial Corporation (holding company), 2002 to 2008; formerly, Director, WHX Corporation (holding company), 2002 to 2005; formerly, Director, State Theatre of New Jersey (not-for-profit theatre), 2000 to 2005. | |
| |
| George W. Morriss (1947) | | Trustee since 2007 | | Retired; formerly, Executive Vice President and Chief Financial Officer, People's Bank, Connecticut (a financial services company), 1991 to 2001. | | | 47 | | | Manager, Larch Lane Multi-Strategy Fund complex (which currently consists of three funds), since 2006; formerly, Member, NASDAQ Issuers' Affairs Committee, 1995 to 2003. | |
| |
26
Name, (Year of Birth), and Address(1) | | Position and Length of Time Served(2) | | Principal Occupation(s)(3) | | Number of Funds in Fund Complex Overseen by Fund Trustee | | Other Directorships Held Outside Fund Complex by Fund Trustee | |
| Edward I. O'Brien (1928) | | Trustee since 2000 | | Private Investor; formerly, Member, Investment Policy Committee, Edward Jones, 1993 to 2001; President, Securities Industry Association ("SIA") (securities industry's representative in government relations and regulatory matters at the federal and state levels), 1974 to 1992; Adviser to SIA, November 1992 to November 1993. | | | 47 | | | Formerly, Director, Legg Mason, Inc. (financial services holding company), 1993 to July 2008; formerly, Director, Boston Financial Group (real estate and tax shelters), 1993 to 1999. | |
| |
| Jack L. Rivkin (1940) | | Trustee since 2002; President, 2002 to 2008 | | Formerly, Executive Vice President and Chief Investment Officer, Neuberger Berman Holdings LLC (holding company), 2002 to August 2008 and 2003 to August 2008, respectively; formerly, Managing Director and Chief Investment Officer, Neuberger, December 2005 to August 2008 and 2003 to August 2008, respectively; formerly, Executive Vice President, Neuberger, December 2002 to 2005; formerly, Director and Chairman, Management, December 2002 to August 2008; formerly, Executive Vice President, Citigroup Investments, Inc., September 1995 to February 2002; formerly, Executive Vice President, Citigroup Inc., September 1995 to February 2002. | | | 47 | | | Director, Idealab (private company), since 2009; Director, Distributed World Power (private company), since 2009; Director, Dale Carnegie and Associates, Inc. (private company), since 1999; Director, Solbright, Inc. (private company), since 1998; Director, SA Agricultural Fund, since 2009; Chairman and Director, Essential Brands (consumer products) since 2008; formerly, Director, New York Society of Security Analysts, 2006 to 2008. | |
| |
27
Name, (Year of Birth), and Address(1) | | Position and Length of Time Served(2) | | Principal Occupation(s)(3) | | Number of Funds in Fund Complex Overseen by Fund Trustee | | Other Directorships Held Outside Fund Complex by Fund Trustee | |
| Cornelius T. Ryan (1931) | | Trustee since 2000 | | General Partner and Adviser, TD2, TD3, and TOF1 Healthcare Venture Capital Partnerships; formerly, Founding General Partner, Oxford Partners and Oxford Bioscience Partners (venture capital investing) and President, Oxford Venture Corporation, 1981 to 2010. | | | 47 | | | Trustee, Norwalk Hospital Foundation, since 2000; Director, Supply Pro (privately held company), since 2008; formerly, Trustee, Norwalk Hospital, 1995 to 2004; formerly, President and Director, Randolph Computer Corp., 1966 to 1984; formerly, Director of numerous privately held portfolio companies of Oxford Partners and Oxford Bioscience Partners, 1981 to 2005. | |
| |
| Tom D. Seip (1950) | | Trustee since 2000; Chairman of the Board since 2008; Lead Independent Trustee from 2006 to 2008 | | General Partner, Ridgefield Farm LLC (a private investment vehicle); formerly, President and CEO, Westaff, Inc. (temporary staffing), May 2001 to January 2002; formerly, Senior Executive, The Charles Schwab Corporation, 1983 to 1998, including Chief Executive Officer, Charles Schwab Investment Management, Inc.; Trustee, Schwab Family of Funds and Schwab Investments, 1997 to 1998; and Executive Vice President-Retail Brokerage, Charles Schwab & Co., Inc., 1994 to 1997. | | | 47 | | | Director, H&R Block, Inc. (financial services company), since May 2001; formerly, Chairman, Compensation Committee, H&R Block, Inc., 2006 to 2010; formerly, Director, Forward Management, Inc. (asset management company), 1999 to 2006. | |
| |
28
Name, (Year of Birth), and Address(1) | | Position and Length of Time Served(2) | | Principal Occupation(s)(3) | | Number of Funds in Fund Complex Overseen by Fund Trustee | | Other Directorships Held Outside Fund Complex by Fund Trustee | |
| Candace L. Straight (1947) | | Trustee since 1999 | | Private investor and consultant specializing in the insurance industry; formerly, Advisory Director, Securitas Capital LLC (a global private equity investment firm dedicated to making investments in the insurance sector), 1998 to December 2003. | | | 47 | | | Public Member, Board of Governors and Board of Trustees, Rutgers University, since 2011; Director, Montpelier Re Holdings Ltd. (reinsurance company), since 2006; formerly, Director, National Atlantic Holdings Corporation (property and casualty insurance company), 2004 to 2008; formerly, Director, The Proformance Insurance Company (property and casualty insurance company), 2004 to 2008; formerly, Director, Providence Washington Insurance Company (property and casualty insurance company), 1998 to 2006; formerly, Director, Summit Global Partners (insurance brokerage firm), 2000 to 2005. | |
| |
| Peter P. Trapp (1944) | | Trustee since 1984 | | Retired; formerly, Regional Manager for Mid-Southern Region, Ford Motor Credit Company, September 1997 to 2007; formerly, President, Ford Life Insurance Company, April 1995 to August 1997. | | | 47 | | | None. | |
| |
29
Name, (Year of Birth), and Address(1) | | Position and Length of Time Served(2) | | Principal Occupation(s)(3) | | Number of Funds in Fund Complex Overseen by Fund Trustee | | Other Directorships Held Outside Fund Complex by Fund Trustee | |
| Trustees who are "Interested Persons" | |
| |
| Joseph V. Amato* (1962) | | Trustee since 2009 | | President and Director, Neuberger Berman Group LLC, since 2009; President and Chief Executive Officer, Neuberger and Neuberger Berman Holdings LLC (including its predecessor, Neuberger Berman Inc.), since 2007; Chief Investment Officer, Neuberger, since 2009; Chief Investment Officer (Equities) and Managing Director, Management, since 2009; Managing Director, Neuberger Berman Fixed Income LLC ("NBFI") since 2007; Board member of NBFI since 2006; formerly, Global Head of Asset Management of Lehman Brothers Holdings Inc.'s ("LBHI") Investment Management Division, 2006 to 2009; formerly, member of LBHI's Investment Management Division's Executive Management Committee, 2006 to 2009; formerly, Managing Director, Lehman Brothers Inc. ("LBI"), 2006 to 2008; formerly, Chief Recruiting and Development Officer, LBI, 2005 to 2006; formerly, Global Head of LBI's Equity Sales and a Member of its Equities Division Executive Committee, 2003 to 2005. | | | 47 | | | Member of Board of Advisors, McDonough School of Business, Georgetown University, since 2001; Member of New York City Board of Advisors, Teach for America, since 2005; Trustee, Montclair Kimberley Academy (private school), since 2007. | |
| |
30
Name, (Year of Birth), and Address(1) | | Position and Length of Time Served(2) | | Principal Occupation(s)(3) | | Number of Funds in Fund Complex Overseen by Fund Trustee | | Other Directorships Held Outside Fund Complex by Fund Trustee | |
| Robert Conti* (1956) | | Chief Executive Officer, President and Trustee since 2008; prior thereto, Executive Vice President in 2008 and Vice President, 2000 to 2008 | | Managing Director, Neuberger, since 2007; formerly, Senior Vice President, Neuberger, 2003 to 2006; formerly, Vice President, Neuberger, 1999 to 2003; President and Chief Executive Officer, Management, since 2008; formerly, Senior Vice President, Management, 2000 to 2008. | | | 47 | | | Director since 1994 and formerly, Chairman of the Board, 2008 to 2010, Staten Island Mental Health Society, Inc. | |
| |
(1) The business address of each listed person is 605 Third Avenue, New York, New York 10158.
(2) Pursuant to the Trust's Trust Instrument, each of these Trustees shall hold office for life or until his or her successor is elected or the Trust terminates; except that (a) any Trustee may resign by delivering a written resignation; (b) any Trustee may be removed with or without cause at any time by a written instrument signed by at least two-thirds of the other Trustees; (c) any Trustee who requests to be retired, or who has become unable to serve, may be retired by a written instrument signed by a majority of the other Trustees; and (d) any Trustee may be removed at any shareholder meeting by a vote of at least two-thirds of the outstanding shares.
(3) Except as otherwise indicated, each individual has held the positions shown for at least the last five years.
* Indicates a Trustee who is an "interested person" within the meaning of the 1940 Act. Mr. Amato and Mr. Conti are interested persons of the Trust by virtue of the fact that each is an officer of Management, Neuberger and/or their affiliates.
31
Information about the Officers of the Trust
Name, (Year of Birth), and Address(1) | | Position and Length of Time Served(2) | | Principal Occupation(s)(3) | |
| Andrew B. Allard (1961) | | Anti-Money Laundering Compliance Officer since 2002 | | Senior Vice President, Neuberger, since 2006 and Employee since 1999; Deputy General Counsel, Neuberger, since 2004; formerly, Vice President, Neuberger, 2000 to 2005; formerly, Employee, Management, 1994 to 1999; Anti-Money Laundering Compliance Officer, nine registered investment companies for which Management acts as investment manager and administrator (six since 2002, one since 2003, one since 2005 and one since 2006). | |
| |
| Claudia A. Brandon (1956) | | Executive Vice President since 2008 and Secretary since 1985 | | Senior Vice President, Neuberger, since 2007 and Employee since 1999; Senior Vice President, Management, since 2008 and Assistant Secretary since 2004; formerly, Vice President, Neuberger, 2002 to 2006; formerly, Vice President-Mutual Fund Board Relations, Management, 2000 to 2008; formerly, Vice President, Management, 1986 to 1999 and Employee 1984 to 1999; Executive Vice President, nine registered investment companies for which Management acts as investment manager and administrator (nine since 2008); Secretary, nine registered investment companies for which Management acts as investment manager and administrator (three since 1985, three since 2002, one since 2003, one since 2005 and one since 2006). | |
| |
| Anthony DiBernardo (1979) | | Assistant Treasurer since 2011 | | Vice President, Neuberger, since 2009; Employee, Management, since 2003; Assistant Treasurer, nine registered investment companies for which Management acts as investment manager and administrator. | |
| |
| Maxine L. Gerson (1950) | | Executive Vice President since 2008 and Chief Legal Officer since 2005 (only for purposes of sections 307 and 406 of the Sarbanes-Oxley Act of 2002) | | Managing Director, Neuberger, since 2009, and Deputy General Counsel and Assistant Secretary, Neuberger, since 2001; Managing Director, Management, since 2009, and Secretary and General Counsel, Management, since 2004; formerly, Senior Vice President, Neuberger, 2002 to 2009; formerly, Senior Vice President, Management, 2006 to 2009; Executive Vice President, nine registered investment companies for which Management acts as investment manager and administrator (nine since 2008); Chief Legal Officer (only for purposes of sections 307 and 406 of the Sarbanes-Oxley Act of 2002), nine registered investment companies for which Management acts as investment manager and administrator (eight since 2005 and one since 2006). | |
| |
| Sheila R. James (1965) | | Assistant Secretary since 2002 | | Vice President, Neuberger, since 2008 and Employee since 1999; formerly, Assistant Vice President, Neuberger, 2007; formerly, Employee, Management, 1991 to 1999; Assistant Secretary, nine registered investment companies for which Management acts as investment manager and administrator (six since 2002, one since 2003, one since 2005 and one since 2006). | |
| |
32
Name, (Year of Birth), and Address(1) | | Position and Length of Time Served(2) | | Principal Occupation(s)(3) | |
| Brian Kerrane (1969) | | Vice President since 2008 | | Senior Vice President, Neuberger, since 2006; formerly, Vice President, Neuberger, 2002 to 2006; Vice President, Management, since 2008 and Employee since 1991; Vice President, nine registered investment companies for which Management acts as investment manager and administrator (nine since 2008). | |
| |
| Kevin Lyons (1955) | | Assistant Secretary since 2003 | | Assistant Vice President, Neuberger, since 2008 and Employee since 1999; formerly, Employee, Management, 1993 to 1999; Assistant Secretary, nine registered investment companies for which Management acts as investment manager and administrator (seven since 2003, one since 2005 and one since 2006). | |
| |
| Owen F. McEntee, Jr. (1961) | | Vice President since 2008 | | Vice President, Neuberger, since 2006; Employee, Management, since 1992; Vice President, nine registered investment companies for which Management acts as investment manager and administrator (nine since 2008). | |
| |
| John M. McGovern (1970) | | Treasurer and Principal Financial and Accounting Officer since 2005 | | Senior Vice President, Neuberger, since 2007; formerly, Vice President, Neuberger, 2004 to 2006; Employee, Management, since 1993; Treasurer and Principal Financial and Accounting Officer, nine registered investment companies for which Management acts as investment manager and administrator (eight since 2005 and one since 2006); formerly, Assistant Treasurer, eight registered investment companies for which Management acts as investment manager and administrator, 2002 to 2005. | |
| |
| Frank Rosato (1971) | | Assistant Treasurer since 2005 | | Vice President, Neuberger, since 2006; Employee, Management, since 1995; Assistant Treasurer, nine registered investment companies for which Management acts as investment manager and administrator (eight since 2005 and one since 2006). | |
| |
| Neil S. Siegel (1967) | | Vice President since 2008 | | Managing Director, Management, since 2008; Managing Director, Neuberger, since 2006; formerly, Senior Vice President, Neuberger, 2004 to 2006; Vice President, nine registered investment companies for which Management acts as investment manager and administrator (nine since 2008). | |
| |
| Chamaine Williams (1971) | | Chief Compliance Officer since 2005 | | Senior Vice President, Neuberger, since 2007; Chief Compliance Officer, Management, since 2006; Chief Compliance Officer, nine registered investment companies for which Management acts as investment manager and administrator (eight since 2005 and one since 2006); formerly, Senior Vice President, LBI, 2007 to 2008; formerly, Vice President, LBI, 2003 to 2006; formerly, Chief Compliance Officer, Lehman Brothers Asset Management Inc., 2003 to 2007; formerly, Chief Compliance Officer, Lehman Brothers Alternative Investment Management LLC, 2003 to 2007. | |
| |
(1) The business address of each listed person is 605 Third Avenue, New York, New York 10158.
(2) Pursuant to the By-Laws of the Trust, each officer elected by the Trustees shall hold office until his or her successor shall have been elected and qualified or until his or her earlier death, inability to serve, or resignation. Officers serve at the pleasure of the Trustees and may be removed at any time with or without cause.
(3) Except as otherwise indicated, each individual has held the positions shown for at least the last five years.
33
Proxy Voting Policies and Procedures
A description of the policies and procedures that the Trust uses to determine how to vote proxies relating to portfolio securities is available, without charge, by calling 1-800-877-9700 (toll-free) and on the website of the Securities and Exchange Commission, at www.sec.gov. Information regarding how the Trust voted proxies relating to portfolio securities during the most recent 12-month period ended June 30 is also available, without charge, by calling 1-800-877-9700 (toll-free), on the website of the Securities and Exchange Commission at www.sec.gov, and on Management's website at www.nb.com.
Quarterly Portfolio Schedule
The Trust files a complete schedule of portfolio holdings for the Fund with the Securities and Exchange Commission for the first and third quarters of each fiscal year on Form N-Q. The Trust's Forms N-Q are available on the Securities and Exchange Commission's website at www.sec.gov and may be reviewed and copied at the Securities and Exchange Commission's Public Reference Room in Washington, DC. Information on the operation of the Public Reference Room may be obtained by calling 1-800-SEC-0330. The information on Form N-Q is available upon request, without charge, by calling 1-800-877-9700 (toll free).
Board Consideration of the Management and Sub-Advisory Agreements
At a meeting held on October 13, 2011, the Board, including the Trustees who are not "interested persons" of Management (including its affiliates) or Neuberger Berman Advisers Management Trust ("Independent Fund Trustees"), approved the continuance of the Management and Sub-Advisory Agreements ("Agreements") for the Fund.
In evaluating the Agreements, the Board, including the Independent Fund Trustees, reviewed materials furnished by Management and Neuberger in response to questions submitted by counsel for the Independent Fund Trustees, and met with senior representatives of Management and Neuberger regarding their personnel and operations. The Independent Fund Trustees were advised by counsel that is experienced in Investment Company Act of 1940 matters and that is independent of Management and Neuberger. The Independent Fund Trustees received a memorandum from independent counsel discussing the legal standards for their consideration of the proposed continuance of the Agreements. They met with such counsel separately from representatives of Management to discuss the annual contract review. The annual contract review extends over three regular meetings of the Board, including one meeting devoted primarily to reviewing and discussing Fund performance, to ensure that Management and Neuberger have time to respond to any questions the Independent Fund Trustees may have on their initial review of the report and that the Independent Fund Trustees have time to consider those responses.
The Board considered the following factors, among others, in connection with its approval of the continuance of the Agreements: (1) the nature, extent, and quality of the services provided by Management and Neuberger; (2) the performance of the Fund compared to a relevant market index and a peer group of investment companies; (3) the costs of the services provided and profits or losses realized by Management and its affiliates from their relationship with the Fund; (4) the extent to which economies of scale might be realized as the Fund grows; and (5) whether fee levels reflect any such potential economies of scale for the benefit of investors in the Fund. In their deliberations, the Board members did not identify any particular information that was all-important or controlling, and each Trustee may have attributed different weights to the various factors.
The Board evaluated the terms of the Agreements, the overall fairness of the Agreements to the Fund and whether the Agreements were in the best interests of the Fund and its shareholders.
With respect to the nature, extent and quality of the services provided, the Board considered the performance of the Fund and the experience and staffing of the portfolio management and investment research personnel of Management and Neuberger who perform services for the Fund. The Board noted that Management also provides certain administrative services, including fund accounting and compliance oversight. The Board also considered Management's and Neuberger's policies and practices regarding brokerage and the allocation of portfolio transactions. The Board's Portfolio Transactions
34
and Pricing Committee from time to time reviewed the quality of the execution services that Management and Neuberger had provided, and periodically reviews studies by an independent firm engaged to review and evaluate the quality of brokerage execution received by the Fund. The Board also reviewed whether Management and Neuberger used brokers to execute Fund transactions that provide research and other services to Management and Neuberger, and the types of benefits potentially derived from such services by Management, Neuberger, the Fund and other clients of Management and Neuberger. In addition, the Board noted the positive compliance history of Management and Neuberger, as each firm has been free of significant reported compliance problems.
The Board considered the performance of the Fund relative to its benchmark and the average performance of composite peer groups of investment companies dedicated to insurance products pursuing broadly similar strategies. The Board also reviewed performance in relation to certain measures of the degree of investment risk undertaken by the portfolio manager, during the period. The Board also considered Management's resources and responsiveness with respect to the Fund.
With respect to the overall fairness of the Agreements, the Board considered the fee structure for the Fund under the Agreements as compared to a peer group of comparable funds and any fall-out benefits likely to accrue to Management or Neuberger or their affiliates from their relationship with the Fund. The Board also considered the profitability of Management and its affiliates from their association with the Fund.
The Board reviewed a comparison of the Fund's management fee and overall expense ratio to a peer group of broadly comparable funds. The Board considered the mean and median of the management fees and expense ratios of the peer group. The Board noted that the Fund's management fee was higher than the peer group mean and median. The Board considered whether specific portfolio management or administration needs contributed to the management fee. With regard to the sub-advisory fee paid to Neuberger, the Board noted that this fee is "at cost." In addition, the Board considered the contractual limit on Fund expenses undertaken by Management.
The Board considered whether there were other funds that were advised or sub-advised by Management or its affiliates or separate accounts managed by Management or its affiliates with similar investment objectives, policies and strategies to the Fund. The Board compared the fees charged to the Fund to the fees charged to a registered fund, a sub-advised fund and a separate account, each managed by Management in a similar style to the Fund. The Board considered the appropriateness and reasonableness of any differences between the fees charged to the Fund and the other funds and account and determined that the differences in fees were consistent with the management and other services provided.
The Board also evaluated any apparent or anticipated economies of scale in relation to the services Management provides to the Fund. The Board considered whether the Fund's fee structure provides for a reduction of payments resulting from the use of breakpoints and whether those breakpoints are set at appropriate asset levels. In concluding that the benefits accruing to Management and its affiliates by virtue of their relationship to the Fund were reasonable in comparison with the costs of providing the investment advisory services and the benefits accruing to the Fund, the Board reviewed specific data as to Management's profit on the Fund for a recent period and the trend in profit or loss over recent years. The Board also carefully examined Management's cost allocation methodology. The Board recognized that Management should be entitled to earn a reasonable level of profits for services it provides to the Fund and, based on its review, concluded that Management's level of profitability was not excessive.
Conclusions
In approving the Agreements, the Board concluded that the terms of each Agreement are fair and reasonable and that approval of the Agreements is in the best interests of the Fund and its shareholders. In reaching this determination, the Board considered that Management and Neuberger could be expected to provide a high level of service to the Fund; that the performance of the Fund was satisfactory over time; that the Fund's fee structure appeared to the Board to be reasonable given the nature and quality of services provided; and that the benefits accruing to Management and its affiliates by virtue of their relationship to the Fund were reasonable in comparison with the benefits accruing to the Fund.
35
Neuberger Berman
Advisers Management Trust
Partners Portfolio
I Class Shares
Annual Report
December 31, 2011
B1010 02/12
Partners Portfolio Commentary (Unaudited)
The Neuberger Berman Advisers Management Trust (AMT) Partners Portfolio posted a –11.36% total return for the fiscal year ended December 31, 2011, underperforming the Russell 1000® Value Index and the S&P 500 Index, which produced returns of 0.39% and 2.11%, respectively.
2011 was a challenging year for investors as market movements were often dictated by macro events around the world. In the first half of the year, political upheaval in the Middle East and North Africa, tenuous economic growth in China, a devastating earthquake and tsunami in Japan and the beginnings of a downward spiral in Europe caused a great deal of volatility in equities. Still, the market appreciated overall in these first six months as a pick-up in mergers and acquisitions activity along with strong corporate earnings provided hope that the U.S. could remain on a path of slow growth. By the third quarter, however, investor optimism waned and stocks declined sharply as the U.S. and European governments failed to meet deadlines to devise any lasting solutions to their nations' debt issues. Yet the market recouped these losses in the final three months of the year; most of this recovery took place in October when economic data in the U.S. turned somewhat positive and European leaders came up with more concrete measures to avert, or at least postpone, a financial meltdown. The earnings season also turned out to be one of the strongest on record for the S&P 500 Index, albeit with tempered expectations for 2012. Over the last several weeks of the year the market vacillated sharply but finished 2011 in modestly positive territory as investors seemed to give credence to recent signs of progress while remaining somewhat cautious about the possibility of a more severe recession in Europe and the implications of this for the U.S. and other parts of the world.
For the full year, performance in the Russell 1000 Value Index could be clearly delineated across sectors with the defensive Utilities, Health Care and Consumer Staples segments far outperforming the more economically sensitive areas of the market. The bulk of this divergence occurred towards the middle of the year when sovereign debt troubles in the U.S. and Europe grew increasingly dire, prompting a sell-off in assets with greater exposure to the global economy or capital markets. For this reason, Financials was the worst performing sector for the year, posting a double-digit decline that accelerated in the third quarter, while Materials and Information Technology (IT) also produced negative returns for the year.
Management of the Portfolio was transferred from another portfolio manager in mid-December and Portfolio holdings were then gradually repositioned through year-end. AMT Partners underperformed the Russell 1000 Value Index due largely to overweight allocations to and negative stock selection in IT, Energy, Consumer Discretionary, Materials and Industrials. An underweight allocation to the Financials sector contributed positively to performance relative to the benchmark as this was by far the weakest segment of the index for the period. Positive stock selection in Utilities and an overweight allocation to Health Care, one of the strongest areas of the market, also helped relative performance modestly.
By the end of 2011, we had positioned the Portfolio according to our team's rigorous bottom-up stock selection process. At the core of our team's investment process is the idea that valuation discrepancies are always present in the market and that the opportunity exists to capitalize on these discrepancies. We believe that informed judgments of where the market should price stocks at "normal" values can be made by combining fundamental criteria with in-depth company research. As such, we look for stocks that are trading below where we think they should trade based on normalized earnings. The Portfolio ended the period underweighted relative to the Russell 1000 Value Index in Utilities, Industrials, Consumer Staples and Consumer Discretionary; and overweighted in IT, Materials (primarily gold stocks), Financials, and Health Care.
We are entering 2012 with a modestly positive outlook on the domestic economy. Although political issues at home and abroad will likely continue through next year, we believe that recent actions taken by European governments to contain their financial crises should be beneficial for the global economy through at least the first few months of 2012. In terms of the U.S. equity market, Financials were the worst performers in 2011 but, in general, these companies are in better shape now then they have been in the recent past with ample cash on their balance sheets, less leverage, higher loss reserves and improved credit profiles. Additionally, equity multiples on the whole appear reasonable to us and we are finding value across the market within this environment.
1
Still, there remains a great deal of macro uncertainty so we anticipate market volatility remaining high next year as investors react to continual bursts of news out of Europe, Asia and the U.S. Nonetheless, we set our view of the world aside when we evaluate investments, for we believe, as noted, that valuation discrepancies always exist in the market and our strategy is to identify and capitalize on these discrepancies to create a portfolio of stocks that we think can provide favorable returns throughout the economic cycle and in the face of an ever-changing macro landscape.
Sincerely,
Eli M. Salzmann
Portfolio Manager
Information about the principal risks of investing in the Portfolio is set forth in the prospectus and statement of additional information.
The composition, industries and holdings of the Portfolio are subject to change.
2
Partners Portfolio (Unaudited)
SECTOR ALLOCATION
| (as a % of Total Investments) | |
| Consumer Discretionary | | | 7.8 | % | |
| Consumer Staples | | | 5.6 | | |
| Energy | | | 12.2 | | |
| Financials | | | 24.2 | | |
| Health Care | | | 14.5 | | |
| Industrials | | | 5.1 | | |
| Information Technology | | | 12.6 | | |
| Materials | | | 5.1 | | |
| Telecommunication Services | | | 4.7 | | |
| Utilities | | | 2.4 | | |
| Short-Term Investments | | | 5.8 | | |
| Total | | | 100.0 | % | |
PERFORMANCE HIGHLIGHTS1
| | | | | Average Annual Total Return Ended 12/31/2011 | |
| | | Inception Date | | 1 Year | | 5 Years | | 10 Years | | Life of Fund* | |
| Partners Portolio Class I | | 03/22/1994 | | | –11.36 | % | | | –3.59 | % | | | 3.01 | % | | | 7.01 | % | |
Russell 1000® Value Index2 | | | | | | | 0.39 | % | | | –2.64 | % | | | 3.89 | % | | | 8.18 | % | |
S&P 500 Index2 | | | | | | | 2.11 | % | | | –0.25 | % | | | 2.92 | % | | | 7.73 | % | |
Performance data quoted represent past performance and do not indicate future results. The investment return and principal value of an investment will fluctuate so that an investor's shares, when redeemed, may be worth more or less than their original cost. Results are shown on a "total return" basis and include reinvestment of all income dividends and distributions.
Current performance may be lower or higher than the performance data quoted. For performance data current to the most recent month end, please visit https://www.nb.com.
* Index returns are as of inception date 03/22/1994.
As stated in the Portfolio's most recent prospectus, the total annual operating expense ratio for fiscal year 2010 was 1.11% for Class I shares (prior to any fee waivers and/or expense reimbursements, if any). Neuberger Berman Management LLC has contractually agreed to limit certain expenses of the Portfolio through 12/31/2014 for Class I shares.
The results shown in the table do not reflect the effect of taxes an investor would pay on Portfolio distributions or on the redemption of Portfolio shares.
COMPARISON OF A $10,000 INVESTMENT
The graph shows the change in value of a hypothetical $10,000 investment in the Portfolio over the past 10 fiscal years, or since the Portfolio's inception, if it has not operated for 10 years. The result is compared with benchmarks, which may include a broad-based market index and/or a narrower index. Market indices have not been reduced to reflect any of the fees and costs of investing. All results include the reinvestment of income dividends and distributions. The results shown in the graph do not reflect the effect of taxes that an investor would pay on Portfolio distributions or the redemption of Portfolio shares. Results represent past performance and do not indicate future results.
Please see Endnotes for additional information.
3
Endnotes (Unaudited)
1 "Total Return" includes reinvestment of all income dividends and distributions. Results represent past performance and do not indicate future results. The value of an investment in the Portfolio and the return on the investment both will fluctuate, and redemption proceeds may be higher or lower than an investor's original cost. The performance information does not reflect fees and expenses of the variable annuity and variable life insurance policies or the qualified pension and retirement plans whose proceeds are invested in the Portfolio. Neuberger Berman Management LLC ("NBM LLC") has agreed to absorb certain expenses of the AMT Portfolios, including the Portfolio. Without this arrangement, which is subject to change, the total returns of the Portfolio may have been less.
2 The Russell 1000® Value Index measures the performance of those Russell 1000® companies with lower price-to-book ratios and lower forecasted growth values. The Russell 1000 Index measures the performance of the 1,000 largest companies in the Russell 3000® Index (which measures the performance of the 3,000 largest U.S. companies based on total market capitalization). The Russell 1000 Index represents approximately 92% of the total market capitalization of the Russell 3000 Index. The S&P 500 Index is widely regarded as the standard for measuring large-cap U.S. stock market performance and includes a representative sample of the leading companies in leading industries. Please note that indices do not take into account any fees and expenses of investing in the individual securities that they track and that individuals cannot invest directly in any index. Data about the performance of these indices are prepared or obtained by NBM LLC and include reinvestment of all income dividends and distributions. The Portfolio may invest in securities not included in the above-described indices and may not invest in all securities included in the above-described indices.
Any ratios or other measurements using a factor of forecasted earnings of a company discussed herein are based on consensus estimates, not NBM LLC's own projections, and they may or may not be realized. In addition, any revision to a forecast could affect the market price of a security. By quoting them herein, NBM LLC does not offer an opinion as to the accuracy of and does not guarantee these forecasted numbers.
The investments for the Portfolio are managed by the same portfolio manager(s) who manage(s) one or more other registered funds that have similar names, investment objectives and investment styles as the Portfolio. You should be aware that the Portfolio is likely to differ from the other mutual funds in size, cash flow pattern and tax matters. Accordingly, the holdings and performance can be expected to vary from those of the other mutual funds.
The composition, industries and holdings of the Portfolio are subject to change.
Shares of the separate AMT Portfolios are not available to the general public. Shares of this Portfolio may be purchased only by life insurance companies to be used with their separate accounts that fund variable annuity and variable life insurance policies and by qualified pension and retirement plans.
Statistics and projections in this report are derived from sources deemed to be reliable but cannot be regarded as a representation of future results of the AMT Portfolios. This report is prepared for the general information of shareholders and is not an offer of shares of the AMT Portfolios. Shares of the AMT Portfolios are sold only through the currently effective prospectuses, which must precede or accompany this report.
The "Neuberger Berman" name and logo are registered service marks of Neuberger Berman Group LLC. "Neuberger Berman Management LLC" and the individual Fund names in this piece are either service marks or registered service marks of Neuberger Berman Management LLC.
© 2012 Neuberger Berman Management LLC distributor. All rights reserved.
4
Information About Your Fund's Expenses (Unaudited)
This table is designed to provide information regarding costs related to your investments. All mutual funds incur operating expenses, which include management fees, fees for administrative services and costs of shareholder reports, among others. The following examples are based on an investment of $1,000 made at the beginning of the six month period ended December 31, 2011 and held for the entire period. The table illustrates the fund's costs in two ways:
| Actual Expenses and Performance: | | The first section of the table provides information about actual account values and actual expenses in dollars, based on the fund's actual performance during the period. You may use the information in this line, together with the amount you invested, to estimate the expenses you paid over the period. Simply divide your account value by $1,000 (for example, an $8,600 account value divided by $1,000 = 8.6), then multiply the result by the number in the first section of the table under the heading entitled "Expenses Paid During the Period" to estimate the expenses you paid over the period. | |
| |
Hypothetical Example for Comparison Purposes: | | The second section of the table provides information about hypothetical account values and hypothetical expenses based on the fund's actual expense ratio and an assumed rate of return at 5% per year before expenses. This return is not the fund's actual return. The hypothetical account values and expenses may not be used to estimate the actual ending account balance or expenses you paid for the period. You may use this information to compare the ongoing costs of investing in this fund versus other funds. To do so, compare the expenses shown in this 5% hypothetical example with the 5% hypothetical examples that appear in the shareholder reports of other funds. | |
| |
Please note that the expenses in the table are meant to highlight your ongoing costs only. The table and expense example do not include any transaction costs, such as fees and expenses that are, or may be, imposed under your variable contract or qualified pension plan. Therefore, the information under the heading "Hypothetical (5% annual return before expenses)" is useful in comparing ongoing costs only, and will not help you determine the relative total costs of owning different funds. In addition, if these transaction costs were included, your costs would have been higher.
Expense Information as of 12/31/11
NEUBERGER BERMAN ADVISERS MANAGEMENT TRUST PARTNERS PORTFOLIO
| Actual | | Beginning Account Value 7/1/11 | | Ending Account Value 12/31/11 | | Expenses Paid During the Period* 7/1/11 – 12/31/11 | |
| Class I | | $ | 1,000.00 | | | $ | 852.40 | | | $ | 5.42 | | |
| Hypothetical (5% annual return before expenses)** | |
| Class I | | $ | 1,000.00 | | | $ | 1,019.36 | | | $ | 5.90 | | |
* Expenses are equal to the annualized expense ratio of 1.16%, multiplied by the average account value over the period, multiplied by 184/365 (to reflect the one-half year period shown).
** Hypothetical 5% annual return before expenses is calculated by multiplying the number of days in the most recent half year divided by 365.
5
Schedule of Investments Partners Portfolio
| NUMBER OF SHARES | | | | VALUE† | |
| Common Stocks (94.7%) | | | |
| Aerospace & Defense (0.9%) | | | |
| | 6,603 | | | Boeing Co. | | $ | 484,330 | | |
| | 3,519 | | | Rockwell Collins | | | 194,847 | | |
| | | | 679,177 | | |
| Air Freight & Logistics (0.8%) | | | |
| | 8,514 | | | United Parcel Service Class B | | | 623,140 | | |
| Automobiles (0.4%) | | | |
| | 30,621 | | | Ford Motor | | | 329,482 | * | |
| Biotechnology (1.0%) | | | |
| | 11,400 | | | Amgen Inc. | | | 731,994 | | |
| Capital Markets (5.7%) | | | |
| | 26,215 | | | Bank of New York Mellon | | | 521,940 | | |
| | 22,953 | | | Goldman Sachs Group | | | 2,075,640 | | |
| | 19,235 | | | Invesco Ltd. | | | 386,431 | | |
| | 28,475 | | | Morgan Stanley | | | 430,827 | | |
| | 21,300 | | | State Street | | | 858,603 | | |
| | | | 4,273,441 | | |
| Chemicals (2.0%) | | | |
| | 21,327 | | | Monsanto Co. | | | 1,494,383 | | |
| Commercial Banks (7.1%) | | | |
| | 28,400 | | | Fifth Third Bancorp | | | 361,248 | | |
| | 24,433 | | | KeyCorp | | | 187,890 | | |
| | 8,295 | | | PNC Financial Services Group | | | 478,373 | | |
| | 43,495 | | | U.S. Bancorp | | | 1,176,540 | | |
| | 92,769 | | | Wells Fargo | | | 2,556,713 | | |
| | 34,659 | | | Zions Bancorp | | | 564,248 | | |
| | | | 5,325,012 | | |
| Communications Equipment (2.0%) | | | |
| | 81,498 | | | Cisco Systems | | | 1,473,484 | | |
| Computers & Peripherals (0.6%) | | | |
| | 9,808 | | | SanDisk Corp. | | | 482,652 | * | |
| Diversified Financial Services (6.9%) | | | |
| | 199,506 | | | Bank of America | | | 1,109,253 | | |
| | 54,370 | | | Citigroup Inc. | | | 1,430,475 | | |
| | 62,452 | | | J.P. Morgan Chase | | | 2,076,529 | | |
| | 16,434 | | | Moody's Corp. | | | 553,497 | | |
| | | | 5,169,754 | | |
| NUMBER OF SHARES | | | | VALUE† | |
| Diversified Telecommunication Services (4.7%) | | | |
| | 73,399 | | | AT&T Inc. | | $ | 2,219,586 | | |
| | 33,662 | | | Verizon Communications | | | 1,350,519 | | |
| | | | 3,570,105 | | |
| Electric Utilities (1.2%) | | | |
| | 20,692 | | | Exelon Corp. | | | 897,412 | | |
| Energy Equipment & Services (3.1%) | | | |
| | 16,438 | | | Cameron International | | | 808,585 | * | |
| | 10,899 | | | Halliburton Co. | | | 376,125 | | |
| | 5,360 | | | National Oilwell Varco | | | 364,426 | | |
| | 11,444 | | | Schlumberger Ltd. | | | 781,740 | | |
| | | | 2,330,876 | | |
| Food & Staples Retailing (2.8%) | | | |
| | 52,085 | | | Kroger Co. | | | 1,261,499 | | |
| | 14,428 | | | Wal-Mart Stores | | | 862,217 | | |
| | | | 2,123,716 | | |
| Health Care Equipment & Supplies (2.5%) | | | |
| | 29,820 | | | Medtronic, Inc. | | | 1,140,615 | | |
| | 13,296 | | | Zimmer Holdings | | | 710,272 | * | |
| | | | 1,850,887 | | |
| Health Care Providers & Services (1.3%) | | | |
| | 23,584 | | | Aetna Inc. | | | 995,009 | | |
| Hotels, Restaurants & Leisure (2.3%) | | | |
| | 27,837 | | | Carnival Corp. | | | 908,600 | | |
| | 19,578 | | | Las Vegas Sands | | | 836,568 | * | |
| | | | 1,745,168 | | |
| Household Products (2.1%) | | | |
| | 8,203 | | | Colgate-Palmolive | | | 757,875 | | |
| | 11,665 | | | Kimberly-Clark | | | 858,078 | | |
| | | | 1,615,953 | | |
| Industrial Conglomerates (1.9%) | | | |
| | 78,211 | | | General Electric | | | 1,400,759 | | |
| Insurance (3.9%) | | | |
| | 15,597 | | | AFLAC, Inc. | | | 674,726 | | |
| | 7,722 | | | Berkshire Hathaway Class B | | | 589,189 | * | |
| | 6,914 | | | Marsh & McLennan | | | 218,621 | | |
| | 12,880 | | | MetLife, Inc. | | | 401,598 | | |
| | 11,207 | | | Reinsurance Group of America | | | 585,566 | | |
| | 8,250 | | | Travelers Cos. | | | 488,152 | | |
| | | | 2,957,852 | | |
See Notes to Schedule of Investments
6
| NUMBER OF SHARES | | | | VALUE† | |
| Internet Software & Services (2.1%) | | | |
| | 2,475 | | | Google Inc. Class A | | $ | 1,598,603 | * | |
| Machinery (1.5%) | | | |
| | 7,112 | | | Cummins Inc. | | | 625,998 | | |
| | 6,994 | | | Joy Global | | | 524,340 | | |
| | | | 1,150,338 | | |
| Media (3.5%) | | | |
| | 25,959 | | | Comcast Corp. Class A | | | 615,488 | | |
| | 57,920 | | | News Corp. Class B | | | 1,052,986 | | |
| | 26,022 | | | Time Warner | | | 940,435 | | |
| | | | 2,608,909 | | |
| Metals & Mining (3.2%) | | | |
| | 6,939 | | | Barrick Gold | | | 313,990 | | |
| | 28,408 | | | Freeport-McMoRan | | | 1,045,130 | | |
| | | | | Copper & Gold | | | | | |
| | 17,121 | | | Newmont Mining | | | 1,027,431 | | |
| | | | 2,386,551 | | |
| Multi-Utilities (1.2%) | | | |
| | 3,363 | | | Dominion Resources | | | 178,508 | | |
| | 13,808 | | | Sempra Energy | | | 759,440 | | |
| | | | 937,948 | | |
| Multiline Retail (1.6%) | | | |
| | 23,865 | | | Target Corp. | | | 1,222,365 | | |
| Oil, Gas & Consumable Fuels (9.3%) | | | |
| | 5,240 | | | Anadarko Petroleum | | | 399,969 | | |
| | 4,180 | | | Apache Corp. | | | 378,624 | | |
| | 20,512 | | | Chevron Corp. | | | 2,182,477 | | |
| | 25,562 | | | Exxon Mobil | | | 2,166,635 | | |
| | 4,854 | | | Occidental Petroleum | | | 454,820 | | |
| | 22,448 | | | Range Resources | | | 1,390,429 | | |
| | | | 6,972,954 | | |
| Pharmaceuticals (9.9%) | | | |
| | 19,116 | | | Bristol-Myers Squibb | | | 673,648 | | |
| | 17,817 | | | Eli Lilly | | | 740,474 | | |
| | 28,772 | | | Johnson & Johnson | | | 1,886,868 | | |
| | 19,831 | | | Merck & Co. | | | 747,629 | | |
| | 158,496 | | | Pfizer Inc. | | | 3,429,853 | | |
| | | | 7,478,472 | | |
Semiconductors & Semiconductor Equipment (3.7%) | | | |
| | 9,354 | | | Cymer, Inc. | | | 465,455 | * | |
| | 78,654 | | | Intel Corp. | | | 1,907,359 | | |
| | 9,202 | | | KLA-Tencor | | | 443,997 | | |
| | | | 2,816,811 | | |
| NUMBER OF SHARES | | | | VALUE† | |
| Software (4.2%) | | | |
| | 50,463 | | | Activision Blizzard | | $ | 621,704 | | |
| | 50,911 | | | Microsoft Corp. | | | 1,321,650 | | |
| | 28,930 | | | Oracle Corp. | | | 742,054 | | |
| | 28,010 | | | Symantec Corp. | | | 438,357 | * | |
| | | | 3,123,765 | | |
| Tobacco (0.7%) | | | |
| | 6,230 | | | Philip Morris International | | | 488,930 | | |
| Wireless Telecommunication Services (0.6%) | | | |
| | 7,401 | | | American Tower Class A | | | 444,134 | | |
| | | | | Total Common Stocks (Cost $67,276,334) | | | 71,300,036 | | |
| Exchange Traded Funds (0.5%) | | | |
| | 17,306 | | | UltraShort S&P500 ProShares (Cost $346,243) | | | 333,314 | * | |
| Short-Term Investments (5.8%) | | | |
| | 4,383,082 | | | State Street Institutional Liquid Reserves Fund Institutional Class (Cost $4,383,082) | | | 4,383,082 | | |
| | | | | Total Investments (101.0%) (Cost $72,005,659) | | | 76,016,432 | ## | |
| | | | | Liabilities, less cash, receivables and other assets [(1.0%)] | | | (732,275 | ) | |
| | | | | Total Net Assets (100.0%) | | $ | 75,284,157 | | |
See Notes to Schedule of Investments
7
Notes to Schedule of Investments Partners Portfolio
† In accordance with Accounting Standards Codification ("ASC") 820 "Fair Value Measurements and Disclosures" ("ASC 820"), all investments held by Neuberger Berman Advisers Management Trust Partners Portfolio (the "Fund") are carried at the value that Neuberger Berman Management LLC ("Management") believes the Fund would receive upon selling an investment in an orderly transaction to an independent buyer in the principal or most advantageous market for the investment under current market conditions. Various inputs, including the volume and level of activity for the asset or liability in the market, are considered in valuing the Fund's investments, some of which are discussed below. Significant management judgment may be necessary to value investments in accordance with ASC 820.
ASC 820 established a three-tier hierarchy of inputs to create a classification of value measurements for disclosure purposes. The three-tier hierarchy of inputs is summarized in the three broad Levels listed below.
• Level 1 – quoted prices in active markets for identical investments
• Level 2 – other significant observable inputs (including quoted prices for similar investments, interest rates, prepayment speeds, credit risk, amortized cost, etc.)
• Level 3 – significant unobservable inputs (including the Fund's own assumptions in determining the fair value of investments)
The inputs or methodology used for valuing an investment are not necessarily an indication of the risk associated with investing in those securities.
The value of the Fund's investments in equity securities and exchange traded funds, for which market quotations are readily available, is generally determined by Management by obtaining valuations from an independent pricing service based on the latest sale price quoted on a principal exchange or market for that security (Level 1 inputs). Securities traded primarily on the NASDAQ Stock Market are normally valued by the Fund at the NASDAQ Official Closing Price ("NOCP") provided by NASDAQ each business day. The NOCP is the most recently reported price as of 4:00:02 p.m., Eastern time, unless that price is outside the range of the "inside" bid and asked prices (i.e., the bid and asked prices that dealers quote to each other when trading for their own accounts); in that case, NASDAQ will adjust the price to equal the inside bid or asked price, whichever is closer. Because of delays in reporting trades, the NOCP may not be based on the price of the last trade to occur before the market closes. If there is no reported sale of a security on a particular day, the independent pricing service may value the security based on reported market quotations.
Management has developed a process to periodically review information provided by independent pricing services for all types of securities.
Investments in State Street Institutional Liquid Reserves Fund Institutional Class are valued using the fund's daily calculated net asset value per share (Level 2 inputs).
If a valuation is not available from an independent pricing service, or if Management has reason to believe that the valuation received does not represent the amount the Fund might reasonably expect to receive on a current sale in an orderly transaction, the Fund seeks to obtain quotations from principal market makers (generally considered Level 3 inputs). If such quotations are not readily available, the security is valued using methods the Neuberger Berman Advisers Management Trust's Board of Trustees (the "Board") has approved on the belief that they reflect fair value. Numerous factors may be considered when determining the fair value of a security based on Level 2 or 3 inputs, including available analyst, media or other reports, trading in futures or ADRs and whether the issuer of the security being fair valued has other securities outstanding.
The value of the Fund's investments in foreign securities is generally determined using the same valuation methods and inputs as other Fund investments, as discussed above. Foreign security prices expressed in local currency values are translated from the local currency into U.S. dollars using the exchange rates as of 4:00 p.m., Eastern time. The Board has approved the use of Interactive Data Pricing and Reference Data, Inc. ("Interactive") to assist in
See Notes to Financial Statements
8
Notes to Schedule of Investments Partners Portfolio (cont'd)
determining the fair value of foreign equity securities when changes in the value of a certain index suggest that the closing prices on the foreign exchanges may no longer represent the amount that the Fund could expect to receive for those securities. In this event, Interactive will provide adjusted prices for certain foreign equity securities using a statistical analysis of historical correlations of multiple factors (Level 2 inputs). In the absence of precise information about the market values of these foreign securities as of the close of the New York Stock Exchange, the Board has determined on the basis of available data that prices adjusted in this way are likely to be closer to the prices the Fund could realize on a current sale than are the prices of those securities established at the close of the foreign markets in which the securities primarily trade.
Fair value prices are necessarily estimates, and there is no assurance that such a price will be at or close to the price at which the security is next quoted or next trades.
The following is a summary, categorized by Level, of inputs used to value the Fund's investments as of December 31, 2011:
| Asset Valuation Inputs | | Level 1 | | Level 2 | | Level 3 | | Total | |
| Investments: | |
| Common Stocks^ | | $ | 71,300,036 | | | $ | — | | | $ | — | | | $ | 71,300,036 | | |
| Exchange Traded Funds | | | 333,314 | | | | — | | | | — | | | | 333,314 | | |
| Short-Term Investments | | | — | | | | 4,383,082 | | | | — | | | | 4,383,082 | | |
| Total Investments | | $ | 71,633,350 | | | $ | 4,383,082 | | | $ | — | | | $ | 76,016,432 | | |
^ The Schedule of Investments provides information on the industry categorization for the portfolio.
The Fund had no significant transfers between Levels 1 and 2 during the year ended December 31, 2011.
## At December 31, 2011, the cost of investments for U.S. federal income tax purposes was $72,531,278. Gross unrealized appreciation of investments was $4,725,121 and gross unrealized depreciation of investments was $1,239,967, resulting in net unrealized appreciation of $3,485,154, based on cost for U.S. federal income tax purposes.
* Security did not produce income during the last twelve months.
See Notes to Financial Statements
9
Statement of Assets and Liabilities
Neuberger Berman Advisers Management Trust
| | | PARTNERS PORTFOLIO | |
| | | December 31, 2011 | |
| Assets | |
| Investments in securities, at value * (Note A)—see Schedule of Investments: | |
| Unaffiliated issuers | | $ | 76,016,432 | | |
| Cash | | | 5,559 | | |
| Foreign currency | | | 35,717 | | |
| Dividends and interest receivable | | | 70,502 | | |
| Receivable for securities sold | | | 396,281 | | |
| Receivable for Fund shares sold | | | 37,359 | | |
| Prepaid expenses and other assets | | | 15,719 | | |
| Total Assets | | | 76,577,569 | | |
| Liabilities | |
| Payable for securities purchased | | | 1,132,030 | | |
| Payable for Fund shares redeemed | | | 37,481 | | |
| Payable to investment manager (Note B) | | | 35,250 | | |
| Payable to administrator (Note B) | | | 19,227 | | |
| Accrued expenses and other payables | | | 69,424 | | |
| Total Liabilities | | | 1,293,412 | | |
| Net Assets at value | | $ | 75,284,157 | | |
| Net Assets consist of: | |
| Paid-in capital | | $ | 94,478,474 | | |
| Undistributed net investment income (loss) | | | 254,682 | | |
| Accumulated net realized gains (losses) on investments | | | (23,465,442 | ) | |
| Net unrealized appreciation (depreciation) in value of investments | | | 4,016,443 | | |
| Net Assets at value | | $ | 75,284,157 | | |
| Shares Outstanding ($.001 par value; unlimited shares authorized) | | | 7,537,591 | | |
| Net Asset Value, offering and redemption price per share | | $ | 9.99 | | |
| *Cost of Investments: | |
| Unaffiliated issuers | | $ | 72,005,659 | | |
| Total cost of foreign currency | | $ | 30,101 | | |
See Notes to Financial Statements
10
Statement of Operations
Neuberger Berman Advisers Management Trust
| | | PARTNERS PORTFOLIO | |
| | | For the Year Ended December 31, 2011 | |
| Investment Income: | |
| Income (Note A): | |
| Dividend income—unaffiliated issuers | | $ | 1,313,774 | | |
| Interest income—unaffiliated issuers | | | 4,880 | | |
| Foreign taxes withheld | | | (39,592 | ) | |
| Total income | | $ | 1,279,062 | | |
| Expenses: | |
| Investment management fees (Note B) | | | 494,770 | | |
| Administration fees (Note B) | | | 269,875 | | |
| Audit fees | | | 41,935 | | |
| Custodian fees (Note A) | | | 46,614 | | |
| Insurance expense | | | 5,739 | | |
| Legal fees | | | 49,141 | | |
| Shareholder reports | | | 46,948 | | |
| Trustees' fees and expenses | | | 55,592 | | |
| Miscellaneous | | | 6,328 | | |
| Total expenses | | | 1,016,942 | | |
| Expenses reduced by custodian fee expense offset arrangement (Note A) | | | (3 | ) | |
| Total net expenses | | | 1,016,939 | | |
| Net investment income (loss) | | $ | 262,123 | | |
| Realized and Unrealized Gain (Loss) on Investments (Note A): | |
| Net realized gain (loss) on: | |
| Sales of investment securities of unaffiliated issuers | | | 16,248,575 | | |
| Foreign currency | | | (1,776 | ) | |
| Change in net unrealized appreciation (depreciation) in value of: | |
| Unaffiliated investment securities | | | (26,555,600 | ) | |
| Foreign currency | | | (217 | ) | |
| Net gain (loss) on investments | | | (10,309,018 | ) | |
| Net increase (decrease) in net assets resulting from operations | | $ | (10,046,895 | ) | |
See Notes to Financial Statements
11
Statements of Changes in Net Assets
Neuberger Berman Advisers Management Trust
| | | PARTNERS PORTFOLIO | |
| | | Year Ended December 31, 2011 | | Year Ended December 31, 2010 | |
| Increase (Decrease) in Net Assets: | |
| From Operations (Note A): | |
| Net investment income (loss) | | $ | 262,123 | | | $ | (17,786 | ) | |
| Net realized gain (loss) on investments | | | 16,246,799 | | | | 13,223,401 | | |
| Change in net unrealized appreciation (depreciation) of investments | | | (26,555,817 | ) | | | 21,972 | | |
| Net increase (decrease) in net assets resulting from operations | | | (10,046,895 | ) | | | 13,227,587 | | |
| Distributions to Shareholders From (Note A): | |
| Net investment income | | | — | | | | (618,077 | ) | |
| From Fund Share Transactions (Note D): | |
| Proceeds from shares sold | | | 14,160,515 | | | | 16,087,325 | | |
| Proceeds from reinvestment of dividends and distributions | | | — | | | | 618,077 | | |
| Payments for shares redeemed | | | (25,985,207 | ) | | | (28,906,444 | ) | |
| Net increase (decrease) from Fund share transactions | | | (11,824,692 | ) | | | (12,201,042 | ) | |
| Net Increase (Decrease) in Net Assets | | | (21,871,587 | ) | | | 408,468 | | |
| Net Assets: | |
| Beginning of year | | | 97,155,744 | | | | 96,747,276 | | |
| End of year | | $ | 75,284,157 | | | $ | 97,155,744 | | |
| Undistributed net investment income (loss) at end of year | | $ | 254,682 | | | $ | — | | |
| Distributions in excess of net investment income at end of year | | $ | — | | | $ | (590 | ) | |
See Notes to Financial Statements
12
Notes to Financial Statements Partners Portfolio
Note A—Summary of Significant Accounting Policies:
1 General: The Fund is a separate operating series of Neuberger Berman Advisers Management Trust (the "Trust"), a Delaware statutory trust organized pursuant to a Trust Instrument dated May 23, 1994. The Trust is currently comprised of ten separate operating series (each individually a "Series," and collectively the "Funds") each of which is diversified. The Trust is registered as an open-end management investment company under the Investment Company Act of 1940, as amended (the "1940 Act"), and its shares are registered under the Securities Act of 1933, as amended. The Fund currently offers only Class I shares. The Board may establish additional series or classes of shares without the approval of shareholders.
The assets of each Series belong only to that Series, and the liabilities of each Series are borne solely by that Series and no other.
The preparation of financial statements in accordance with U.S. generally accepted accounting principles ("GAAP") requires Management to make estimates and assumptions at the date of the financial statements. Actual results could differ from those estimates.
2 Portfolio valuation: Investment securities are valued as indicated in the notes following the Schedule of Investments.
3 Foreign currency translation: The accounting records of the Fund are maintained in U.S. dollars. Foreign currency amounts are translated into U.S. dollars using the exchange rate as of 4:00 p.m., Eastern time, to determine the value of investments, other assets and liabilities. Purchase and sale prices of securities, and income and expenses, are translated into U.S. dollars at the prevailing rate of exchange on the respective dates of such transactions. Net unrealized foreign currency gain (loss), if any, arises from changes in the value of assets and liabilities, other than investments in securities, as a result of changes in exchange rates and is stated separately in the Statement of Operations.
4 Securities transactions and investment income: Securities transactions are recorded on trade date for financial reporting purposes. Dividend income is recorded on the ex-dividend date or, for certain foreign dividends, as soon as the Fund becomes aware of the dividends. Non-cash dividends included in dividend income, if any, are recorded at the fair market value of the securities received. Interest income, including accretion of original issue discount, where applicable, and accretion of discount on short-term investments, if any, is recorded on the accrual basis. Realized gains and losses from securities transactions and foreign currency transactions, if any, are recorded on the basis of identified cost and stated separately in the Statement of Operations. Included in net realized gain (loss) on investments are proceeds from the settlements of class action litigation in which the Fund participated as a class member. The amount of such proceeds for the year ended December 31, 2011 was $153,339.
5 Income tax information: The Funds are treated as separate entities for U.S. federal income tax purposes. It is the policy of the Fund to continue to qualify as a regulated investment company by complying with the requirements of the U.S. Internal Revenue Code applicable to regulated investment companies and to distribute substantially all of its earnings to its shareholders. To the extent the Fund distributes substantially all of its earnings to shareholders, no federal income or excise tax provision is required.
The Fund has adopted the provisions of ASC 740 "Income Taxes" ("ASC 740"). ASC 740 sets forth a minimum threshold for financial statement recognition of a tax position taken, or expected to be taken, in a tax return. The Fund recognizes interest and penalties, if any, related to unrecognized tax positions as an income tax expense in the Statement of Operations. The Fund is subject to examination by U.S. federal and state tax authorities for returns filed for the prior three fiscal years 2008—2010. As of December 31, 2011, the Fund did not have any unrecognized tax positions.
Income distributions and capital gain distributions are determined in accordance with income tax regulations, which may differ from GAAP. These differences are primarily due to differing treatments of income and gains on
13
various investment securities held by the Fund, timing differences and differing characterization of distributions made by the Fund as a whole. The Fund may also utilize earnings and profits distributed to shareholders on redemption of shares as a part of the dividends paid deduction for income tax purposes.
As determined on December 31, 2011, permanent differences resulting primarily from different book and tax accounting for foreign currency gains and losses and non-taxable dividend adjustments to income were reclassified at fiscal year-end. These reclassifications had no effect on net income, net asset value ("NAV") or NAV per share of the Fund. For the year ended December 31, 2011, the Fund recorded the following permanent reclassifications:
| Paid-in Capital | | Undistributed Net Investment Income (Loss) | | Accumulated Net Realized Gains (Losses) on Investments | |
| $ | — | | | $ | (6,851 | ) | | $ | 6,851 | | |
For tax purposes, short-term gains are considered ordinary income.
The tax character of distributions paid during the years ended December 31, 2011 and December 31, 2010 was as follows:
| | | Distributions Paid From: | |
| | | Ordinary Income | | Long- Term Capital Gain | | Total | |
| | | 2011 | | 2010 | | 2011 | | 2010 | | 2011 | | 2010 | |
| | | | | $ | — | | | $ | 618,077 | | | $ | — | | | $ | — | | | $ | — | | | $ | 618,077 | | |
As of December 31, 2011, the components of distributable earnings (accumulated losses) on a U.S. federal income tax basis were as follows:
Undistributed Ordinary Income | | Undistributed Long- Term Gain | | Unrealized Appreciation (Depreciation) | | Loss Carryforwards and Deferrals | | Other Temporary Differences | | Total | |
| $ | 254,682 | | | $ | — | | | $ | 3,490,824 | | | $ | (22,939,823 | ) | | $ | — | | | $ | (19,194,317 | ) | |
The difference between book basis and tax basis distributable earnings is attributable primarily to timing differences of wash sales and capital loss carryforwards.
To the extent the Fund's net realized capital gains, if any, can be offset by capital loss carryforwards, it is the policy of the Fund not to distribute such gains. The Regulated Investment Company ("RIC") Modernization Act of 2010 (the "Act") became effective for the Fund on January 1, 2011. The Act modernizes several of the federal income and excise tax provisions related to RICs. Among the changes made are changes to the capital loss carryforward rules allowing for RICs to carry forward capital losses indefinitely and to retain the character of capital loss carryforwards as short-term or long-term ("Post-Enactment"). Rules in effect previously limited the carryforward period to eight years and all carryforwards were considered short-term in character ("Pre-Enactment"). As determined at December 31, 2011, the Fund had unused capital loss carryforwards available for federal income tax purposes to offset net realized capital gains, if any, as follows:
| | | Pre-Enactment | | Post-Enactment (No Expiration Date) | |
| | | Expiring in: 2017 | | Long-Term | | Short-Term | |
| | | | | $ | 22,939,823 | | | $ | — | | | $ | — | | |
Post-Enactment capital loss carryforwards must be fully used before Pre-Enactment capital loss carryforwards; therefore, under certain circumstances, Pre-Enactment capital loss carryforwards available as of the report date may expire unused.
During the year ended December 31, 2011, the Fund utilized capital loss carryforwards of $16,035,732.
14
6 Distributions to shareholders: The Fund may earn income, net of expenses, daily on its investments. Distributions from net investment income and net realized capital gains, if any, generally are distributed once a year (usually in October). Income distributions and capital gain distributions to shareholders are recorded on the ex-date.
7 Foreign taxes: Foreign taxes withheld represent amounts withheld by foreign tax authorities, net of refunds recoverable.
8 Expense allocation: Certain expenses are applicable to multiple funds. Expenses directly attributable to a Series are charged to that Series. Expenses of the Trust that are not directly attributable to a particular series of the Trust (e.g., the Fund) are allocated among the series of the Trust, on the basis of relative net assets, except where a more appropriate allocation of expenses to each of the series can otherwise be made fairly. Expenses borne by the complex of related investment companies, which includes open-end and closed-end investment companies for which Management serves as investment manager, that are not directly attributable to a particular investment company in the complex (e.g., the Trust) or series thereof are allocated among the investment companies in the complex or series thereof, on the basis of relative net assets, except where a more appropriate allocation of expenses to each of the investment companies in the complex or series thereof can otherwise be made fairly.
9 Investments in foreign securities: Investing in foreign securities may involve certain sovereign and other risks, in addition to the credit and market risks normally associated with domestic securities. These additional risks include the possibility of adverse political and economic developments (including political instability, nationalization, expropriation, or confiscatory taxation) and the potentially adverse effects of unavailability of public information regarding issuers, less governmental supervision and regulation of financial markets, reduced liquidity of certain financial markets, and the lack of uniform accounting, auditing, and financial reporting standards or the application of standards that are different or less stringent than those applied in the United States. Foreign securities also may experience greater price volatility, higher rates of inflation, and delays in settlement.
10 Derivative instruments: The Fund has adopted the provisions of ASC 815 "Derivatives and Hedging" ("ASC 815"). The disclosure requirements of ASC 815 distinguish between derivatives that qualify for hedge accounting and those that do not. Because investment companies value their derivatives at fair value and recognize changes in fair value through the Statement of Operations, they do not qualify for hedge accounting. Accordingly, even though the Fund's investments in derivatives may represent economic hedges, they are considered non-hedge transactions for purposes of this disclosure.
Premiums paid by the Fund upon purchasing a covered call option is recorded in the asset section of the Fund's Statement of Assets and Liabilities and are subsequently adjusted to the current market value. When an option is exercised, closed, or expired, the Fund realizes a gain or loss and the asset is eliminated. For purchased call options, the Fund's loss is limited to the amount of the option premium paid.
Management has concluded that the Fund did not hold any derivative instruments during the year ended December 31, 2011 that require additional disclosures pursuant to ASC 815.
11 Indemnifications: Like many other companies, the Trust's organizational documents provide that its officers and trustees are indemnified against certain liabilities arising out of the performance of their duties to the Trust. In addition, both in some of its principal service contracts and in the normal course of its business, the Trust enters into contracts that provide indemnifications to other parties for certain types of losses or liabilities. The Trust's maximum exposure under these arrangements is unknown as this could involve future claims against the Trust.
12 Expense offset arrangement: The Fund has an expense offset arrangement in connection with its custodian contract. For the year ended December 31, 2011, the impact of this arrangement was a reduction of expenses of $3.
15
Note B—Management Fees, Administration Fees, Distribution Arrangements, and Other Transactions with Affiliates:
Fund shares are issued and redeemed in connection with investments in and payments under certain variable annuity contracts and variable life insurance policies issued through separate accounts of life insurance companies and are also offered directly to certain qualified pension and retirement plans.
The Fund retains Management as its investment manager under a Management Agreement. For such investment management services, the Fund pays Management a fee at the annual rate of 0.55% of the first $250 million of the Fund's average daily net assets, 0.525% of the next $250 million, 0.50% of the next $250 million, 0.475% of the next $250 million, 0.45% of the next $500 million, 0.425% of the next $2.5 billion, and 0.40% of average daily net assets in excess of $4 billion.
The Fund retains Management as its administrator under an Administration Agreement. The Fund pays Management an administration fee at the annual rate of 0.30% of its average daily net assets under this agreement. Additionally, Management retains State Street Bank and Trust Company ("State Street") as its sub-administrator under a Sub-Administration Agreement. Management pays State Street a fee for all services received under this agreement.
The Board adopted a non-fee distribution plan for the Fund.
Management has contractually undertaken through December 31, 2014 to forgo current payment of fees and/or reimburse the Fund for its operating expenses (excluding fees payable to Management, interest, taxes, brokerage commissions, extraordinary expenses, transaction costs and dividend expense on short sales, if any) ("Operating Expenses") which exceed, in the aggregate, 1.00% per annum of the Fund's average daily net assets (the "Expense Limitation"). For the year ended December 31, 2011, no reimbursement to the Fund was required. The Fund has agreed to repay Management through December 31, 2017 for fees and expenses foregone and/or its excess Operating Expenses previously reimbursed by Management, so long as its annual Operating Expenses during that period do not exceed its Expense Limitation, and the repayment is made within three years after the year in which Management issued the reimbursement or waived fees. During the year ended December 31, 2011, there was no repayment to Management under its contractual expense limitation. At December 31, 2011, the Fund had no contingent liability to Management under its contractual expense limitation.
Neuberger Berman LLC ("Neuberger") is retained by Management to furnish it with investment recommendations and research information without added cost to the Fund. Several individuals who are officers and/or trustees of the Trust are also employees of Neuberger and/or Management.
Management and Neuberger are indirect subsidiaries of Neuberger Berman Group LLC ("NBG," and together with its consolidated subsidiaries "NB Group"). The voting equity of NBG is owned by NBSH Acquisition, LLC ("NBSH"), which was formed to facilitate the May 4, 2009 management buyout of the businesses conducted by NB Group, and Lehman Brothers Holdings Inc. ("LBHI"). NBSH, which is owned by portfolio managers, members of the NB Group management team and certain of NB Group's key employees and senior professionals, owns approximately 52% of the voting equity of NBG, and LBHI and certain of its subsidiaries own the remaining 48% of NBG's voting equity.
On December 14, 2011, the United States Bankruptcy Court for the Southern District of New York approved a motion filed by LBHI and certain of its subsidiaries, as debtors and debtors in possession, (collectively, the "Lehman Brothers Estate") that will provide NBG with the opportunity to purchase the Lehman Brothers Estate's interest in preferred and common equity of NBG. The proposed transactions, which are subject to the Lehman Brothers Estate and NBG signing definitive documentation, as well as to market conditions, would, if successfully implemented, enable NBG to have a lower cost capital structure and set it on a path to 100% employee ownership within the next five to six years.
16
Note C—Securities Transactions:
During the year ended December 31, 2011, there were purchase and sale transactions (excluding short-term securities) of $89,535,791 and $102,351,204, respectively.
During the year ended December 31, 2011, no brokerage commissions on securities transactions were paid to affiliated brokers.
Note D—Fund Share Transactions:
Share activity for the years ended December 31, 2011 and December 31, 2010 was as follows:
| | | For the Year Ended December 31, | |
| | | 2011 | | 2010 | |
| Shares Sold | | | 1,276,805 | | | | 1,574,233 | | |
| Shares Issued on Reinvestment of Dividends and Distributions | | | — | | | | 60,008 | | |
| Shares Redeemed | | | (2,359,718 | ) | | | (2,869,528 | ) | |
| Total | | | (1,082,913 | ) | | | (1,235,287 | ) | |
Note E—Line of Credit:
At December 31, 2011, the Fund was a participant in a single committed, unsecured $200,000,000 line of credit with State Street, to be used only for temporary or emergency purposes. Other investment companies managed by Management also participate in this line of credit on the same terms. Interest is charged on borrowings under this line of credit at the higher of (a) the Federal Funds Rate plus 1.25% per annum or (b) the Overnight LIBOR Rate plus 1.25% per annum. A commitment fee of 0.10% (0.125% prior to September 16, 2011) per annum of the available line of credit is charged, of which each participating Fund has agreed to pay its pro rata share, based on the ratio of its individual net assets to the net assets of all participants at the time the fee is due and payable. The fee is paid quarterly in arrears. Because several mutual funds participate, there is no assurance that an individual Fund will have access to all or any part of the $200,000,000 at any particular time. There were no loans outstanding pursuant to this line of credit at December 31, 2011. During the year ended December 31, 2011, the Fund did not utilize this line of credit.
Note F—Recent Accounting Pronouncement:
In May 2011, the Financial Accounting Standards Board ("FASB") issued Accounting Standards Update ("ASU") No. 2011-04 "Amendments to Achieve Common Fair Value Measurement and Disclosure Requirements in U.S. GAAP and International Financial Reporting Standards ("IFRS")." ASU No. 2011-04 amends ASC 820 to establish common requirements for measuring fair value and for disclosing information about fair value measurements in accordance with GAAP and IFRS. It will not affect the fair valuation of the Fund's investments, but rather the quantitative and qualitative disclosures in the financial statements. ASU No. 2011-04 is effective for fiscal years beginning after December 15, 2011 and for interim periods within those fiscal years. Management is currently evaluating the impact of the adoption of ASU No. 2011-04 on the Fund's financial statement disclosures.
17
Financial Highlights
Partners Portfolio
The following table includes selected data for a share outstanding throughout each year and other performance information derived from the Financial Statements. Per share amounts that round to less than $.01 or $(.01) per share are presented as $.00 or $(.00), respectively.
| | | Year Ended December 31, | |
| | | 2011 | | 2010 | | 2009 | | 2008 | | 2007 | |
| Net Asset Value, Beginning of Year | | $ | 11.27 | | | $ | 9.82 | | | $ | 7.11 | | | $ | 20.76 | | | $ | 21.16 | | |
| Income From Investment Operations: | |
Net Investment Income (Loss)‡ | | | .03 | | | | (.00 | ) | | | .03 | | | | .08 | | | | .07 | | |
Net Gains or Losses on Securities (both realized and unrealized) | | | (1.31 | ) | | | 1.52 | | | | 3.98 | | | | (10.78 | ) | | | 1.95 | | |
| Total From Investment Operations | | | (1.28 | ) | | | 1.52 | | | | 4.01 | | | | (10.70 | ) | | | 2.02 | | |
| Less Distributions From: | |
| Net Investment Income | | | — | | | | (.07 | ) | | | (.24 | ) | | | (.09 | ) | | | (.15 | ) | |
| Net Capital Gains | | | — | | | | — | | | | (1.06 | ) | | | (2.86 | ) | | | (2.27 | ) | |
| Total Distributions | | | — | | | | (.07 | ) | | | (1.30 | ) | | | (2.95 | ) | | | (2.42 | ) | |
| Net Asset Value, End of Year | | $ | 9.99 | | | $ | 11.27 | | | $ | 9.82 | | | $ | 7.11 | | | $ | 20.76 | | |
Total Return†† | | | (11.36 | )% | | | 15.55 | % | | | 56.23 | % | | | (52.37 | )% | | | 9.28 | % | |
| Ratios/Supplemental Data | |
| Net Assets, End of Year (in millions) | | $ | 75.3 | | | $ | 97.2 | | | $ | 96.7 | | | $ | 217.9 | | | $ | 526.7 | | |
Ratio of Gross Expenses to Average Net Assets# | | | 1.13 | % | | | 1.11 | % | | | 1.05 | % | | | .95 | % | | | .91 | % | |
| Ratio of Net Expenses to Average Net Assets | | | 1.13 | % | | | 1.11 | % | | | 1.05 | %§ | | | .94 | %§ | | | .90 | %§ | |
Ratio of Net Investment Income (Loss) to Average Net Assets | | | .29 | % | | | (.02 | )% | | | .34 | % | | | .53 | % | | | .33 | % | |
| Portfolio Turnover Rate | | | 102 | % | | | 43 | % | | | 41 | % | | | 38 | % | | | 43 | % | |
See Notes to Financial Highlights
18
Notes to Financial Highlights Partners Portfolio
†† Total return based on per share NAV reflects the effects of changes in NAV on the performance of the Fund during each fiscal period and assumes income dividends and other distributions, if any, were reinvested. Results represent past performance and do not indicate future results. Current returns may be lower or higher than the performance data quoted. Investment returns and principal may fluctuate and shares when redeemed may be worth more or less than original cost. Total return would have been lower if Management had not waived certain expenses. The total return information shown does not reflect charges and other expenses that apply to the separate account or the related insurance policies, and the inclusion of these charges and other expenses would reduce the total return for all fiscal periods shown.
# The Fund is required to calculate an expense ratio without taking into consideration any expense reductions related to expense offset arrangements.
‡ Calculated based on the average number of shares outstanding during each fiscal period.
§ After utilization of the Line of Credit (2007) and/or waiver of a portion of the investment management fee by Management. Had Management not undertaken such action, and the Fund had not utilized the Line of Credit the annualized ratios of net expenses to average daily net assets would have been:
| | | Year Ended December 31, | |
| | | 2009 | | 2008 | | 2007 | |
| | | | | | 1.06 | % | | | .94 | % | | | .90 | % | |
19
Report of Independent Registered Public Accounting Firm
To the Board of Trustees of
Neuberger Berman Advisers Management Trust and
Shareholders of Partners Portfolio
We have audited the accompanying statement of assets and liabilities, including the schedule of investments, of Partners Portfolio, one of the series constituting Neuberger Berman Advisers Management Trust (the "Trust"), as of December 31, 2011, and the related statement of operations for the year then ended, the statements of changes in net assets for each of the two years in the period then ended, and the financial highlights for each of the five years in the period then ended. These financial statements and financial highlights are the responsibility of the Trust's management. Our responsibility is to express an opinion on these financial statements and financial highlights based on our audits.
We conducted our audits in accordance with the standards of the Public Company Accounting Oversight Board (United States). Those standards require that we plan and perform the audit to obtain reasonable assurance about whether the financial statements and financial highlights are free of material misstatement. We were not engaged to perform an audit of the Trust's internal control over financial reporting. Our audits included consideration of internal control over financial reporting as a basis for designing audit procedures that are appropriate in the circumstances, but not for the purpose of expressing an opinion on the effectiveness of the Trust's internal control over financial reporting. Accordingly, we express no such opinion. An audit also includes examining, on a test basis, evidence supporting the amounts and disclosures in the financial statements and financial highlights, assessing the accounting principles used and significant estimates made by management, and evaluating the overall financial statement presentation. Our procedures included confirmation of securities owned as of December 31, 2011 by correspondence with the custodian and brokers or by other appropriate auditing procedures where replies from brokers were not received. We believe that our audits provide a reasonable basis for our opinion.
In our opinion, the financial statements and financial highlights referred to above present fairly, in all material respects, the financial position of Partners Portfolio, a series of Neuberger Berman Advisers Management Trust, at December 31, 2011, the results of its operations for the year then ended, the changes in its net assets for each of the two years in the period then ended, and the financial highlights for each of the five years in the period then ended, in conformity with U.S. generally accepted accounting principles.
Boston, Massachusetts
February 10, 2012
20
Trustee and Officer Information
The following tables set forth information concerning the trustees ("Trustees") and officers ("Officers") of the Trust. All persons named as Trustees and Officers also serve in similar capacities for other funds administered or managed by Management, Neuberger and Neuberger Berman Fixed Income LLC ("NBFI"). The Statement of Additional Information includes additional information about Trustees and is available upon request, without charge, by calling (800) 877-9700.
Information about the Board of Trustees
Name, (Year of Birth), and Address(1) | | Position and Length of Time Served(2) | | Principal Occupation(s)(3) | | Number of Funds in Fund Complex Overseen by Fund Trustee | | Other Directorships Held Outside Fund Complex by Fund Trustee | |
| Independent Trustees | |
| |
| John Cannon (1930) | | Trustee since 2000 | | Consultant; formerly, Chairman, CDC Investment Advisers (registered investment adviser), 1993 to January 1999; formerly, President and Chief Executive Officer, AMA Investment Advisors, an affiliate of the American Medical Association. | | | 47 | | | Formerly, Independent Trustee or Director of three series of Oppenheimer Funds: Oppenheimer Limited Term New York Municipal Fund, Rochester Fund Municipals, and Oppenheimer Convertible Securities Fund, 1992 to 2009. | |
| |
| Faith Colish (1935) | | Trustee since 1982 | | Counsel, Carter Ledyard & Milburn LLP (law firm) since October 2002; formerly, Attorney-at-Law and President, Faith Colish, A Professional Corporation, 1980 to 2002. | | | 47 | | | Formerly, Director, 1997 to 2003, and Advisory Director, 2003 to 2006, ABA Retirement Funds (formerly, American Bar Retirement Association) (not-for-profit membership corporation). | |
| |
21
Name, (Year of Birth), and Address(1) | | Position and Length of Time Served(2) | | Principal Occupation(s)(3) | | Number of Funds in Fund Complex Overseen by Fund Trustee | | Other Directorships Held Outside Fund Complex by Fund Trustee | |
| Martha C. Goss (1949) | | Trustee since 2007 | | President, Woodhill Enterprises Inc./Chase Hollow Associates LLC (personal investment vehicle), since 2006; Chief Operating and Financial Officer, Hopewell Holdings LLC/ Amwell Holdings, LLC (a holding company for a healthcare reinsurance company start-up), since 2003; formerly, Consultant, Resources Connection (temporary staffing), 2002 to 2006. | | | 47 | | | Director, American Water (water utility), since 2003; Director, Channel Reinsurance (financial guaranty reinsurance), since 2006; Director, Allianz Life of New York (insurance), since 2005; Director, Financial Women's Association of New York (not-for-profit association), since 2003; Trustee Emerita, Brown University, since 1998; formerly, Director, Ocwen Financial Corporation (mortgage servicing), 2005 to 2010; formerly, Advisory Board Member, Attensity (software developer), 2005 to 2007; formerly, Director, Bank Leumi (commercial bank), 2005 to 2007; formerly, Director, Claire's Stores, Inc. (retailer), 2005 to 2007. | |
| |
| C. Anne Harvey (1937) | | Trustee since 1998 | | President, C.A. Harvey Associates, since October 2001; formerly, Director, AARP, 1978 to December 2001. | | | 47 | | | Formerly, President, Board of Associates to The National Rehabilitation Hospital's Board of Directors, 2001 to 2002; formerly, Member, Individual Investors Advisory Committee to the New York Stock Exchange Board of Directors, 1998 to 2002. | |
| |
22
Name, (Year of Birth), and Address(1) | | Position and Length of Time Served(2) | | Principal Occupation(s)(3) | | Number of Funds in Fund Complex Overseen by Fund Trustee | | Other Directorships Held Outside Fund Complex by Fund Trustee | |
| Robert A. Kavesh (1927) | | Trustee since 2000 | | Retired, since 2002; Marcus Nadler Professor Emeritus of Finance and Economics, New York University Stern School of Business; formerly, Executive Secretary-Treasurer, American Finance Association, 1961 to 1979. | | | 47 | | | Formerly, Director, The Caring Community (not-for-profit), 1997 to 2006; formerly, Director, DEL Laboratories, Inc. (cosmetics and pharmaceuticals), 1978 to 2004; formerly, Director, Apple Bank for Savings, 1979 to 1990; formerly, Director, Western Pacific Industries, Inc., (public company), 1972 to 1986. | |
| |
| Michael M. Knetter (1960) | | Trustee since 2007 | | President and Chief Executive Officer, University of Wisconsin Foundation, since October 2010; formerly, Dean, School of Business, University of Wisconsin - Madison; formerly, Professor of International Economics and Associate Dean, Amos Tuck School of Business - Dartmouth College, 1998 to 2002. | | | 47 | | | Director, American Family Insurance (a mutual company, not publicly traded), since March 2009; formerly, Trustee, Northwestern Mutual Series Fund, Inc., 2007 to 2010; formerly, Director, Wausau Paper, 2005 to 2011; formerly, Director, Great Wolf Resorts, 2004 to 2009. | |
| |
| Howard A. Mileaf (1937) | | Trustee since 1999 | | Retired; formerly, Vice President and General Counsel, WHX Corporation (holding company), 1993 to 2001. | | | 47 | | | Formerly, Director, Webfinancial Corporation (holding company), 2002 to 2008; formerly, Director, WHX Corporation (holding company), 2002 to 2005; formerly, Director, State Theatre of New Jersey (not-for-profit theatre), 2000 to 2005. | |
| |
23
Name, (Year of Birth), and Address(1) | | Position and Length of Time Served(2) | | Principal Occupation(s)(3) | | Number of Funds in Fund Complex Overseen by Fund Trustee | | Other Directorships Held Outside Fund Complex by Fund Trustee | |
| George W. Morriss (1947) | | Trustee since 2007 | | Retired; formerly, Executive Vice President and Chief Financial Officer, People's Bank, Connecticut (a financial services company), 1991 to 2001. | | | 47 | | | Manager, Larch Lane Multi-Strategy Fund complex (which currently consists of three funds), since 2006; formerly, Member, NASDAQ Issuers' Affairs Committee, 1995 to 2003. | |
| |
| Edward I. O'Brien (1928) | | Trustee since 2000 | | Private Investor; formerly, Member, Investment Policy Committee, Edward Jones, 1993 to 2001; President, Securities Industry Association ("SIA") (securities industry's representative in government relations and regulatory matters at the federal and state levels), 1974 to 1992; Adviser to SIA, November 1992 to November 1993. | | | 47 | | | Formerly, Director, Legg Mason, Inc. (financial services holding company), 1993 to July 2008; formerly, Director, Boston Financial Group (real estate and tax shelters), 1993 to 1999. | |
| |
| Jack L. Rivkin (1940) | | Trustee since 2002; President, 2002 to 2008 | | Formerly, Executive Vice President and Chief Investment Officer, Neuberger Berman Holdings LLC (holding company), 2002 to August 2008 and 2003 to August 2008, respectively; formerly, Managing Director and Chief Investment Officer, Neuberger, December 2005 to August 2008 and 2003 to August 2008, respectively; formerly, Executive Vice President, Neuberger, December 2002 to 2005; formerly, Director and Chairman, Management, December 2002 to August 2008; formerly, Executive Vice President, Citigroup Investments, Inc., September 1995 to February 2002; formerly, Executive Vice President, Citigroup Inc., September 1995 to February 2002. | | | 47 | | | Director, Idealab (private company), since 2009; Director, Distributed World Power (private company), since 2009; Director, Dale Carnegie and Associates, Inc. (private company), since 1999; Director, Solbright, Inc. (private company), since 1998; Director, SA Agricultural Fund, since 2009; Chairman and Director, Essential Brands (consumer products) since 2008; formerly, Director, New York Society of Security Analysts, 2006 to 2008. | |
| |
24
Name, (Year of Birth), and Address(1) | | Position and Length of Time Served(2) | | Principal Occupation(s)(3) | | Number of Funds in Fund Complex Overseen by Fund Trustee | | Other Directorships Held Outside Fund Complex by Fund Trustee | |
| Cornelius T. Ryan (1931) | | Trustee since 2000 | | General Partner and Adviser, TD2, TD3, and TOF1 Healthcare Venture Capital Partnerships; formerly, Founding General Partner, Oxford Partners and Oxford Bioscience Partners (venture capital investing) and President, Oxford Venture Corporation, 1981 to 2010. | | | 47 | | | Trustee, Norwalk Hospital Foundation, since 2000; Director, Supply Pro (privately held company), since 2008; formerly, Trustee, Norwalk Hospital, 1995 to 2004; formerly, President and Director, Randolph Computer Corp., 1966 to 1984; formerly, Director of numerous privately held portfolio companies of Oxford Partners and Oxford Bioscience Partners, 1981 to 2005. | |
| |
| Tom D. Seip (1950) | | Trustee since 2000; Chairman of the Board since 2008; Lead Independent Trustee from 2006 to 2008 | | General Partner, Ridgefield Farm LLC (a private investment vehicle); formerly, President and CEO, Westaff, Inc. (temporary staffing), May 2001 to January 2002; formerly, Senior Executive, The Charles Schwab Corporation, 1983 to 1998, including Chief Executive Officer, Charles Schwab Investment Management, Inc.; Trustee, Schwab Family of Funds and Schwab Investments, 1997 to 1998; and Executive Vice President-Retail Brokerage, Charles Schwab & Co., Inc., 1994 to 1997. | | | 47 | | | Director, H&R Block, Inc. (financial services company), since May 2001; formerly, Chairman, Compensation Committee, H&R Block, Inc., 2006 to 2010; formerly, Director, Forward Management, Inc. (asset management company), 1999 to 2006. | |
| |
25
Name, (Year of Birth), and Address(1) | | Position and Length of Time Served(2) | | Principal Occupation(s)(3) | | Number of Funds in Fund Complex Overseen by Fund Trustee | | Other Directorships Held Outside Fund Complex by Fund Trustee | |
| Candace L. Straight (1947) | | Trustee since 1999 | | Private investor and consultant specializing in the insurance industry; formerly, Advisory Director, Securitas Capital LLC (a global private equity investment firm dedicated to making investments in the insurance sector), 1998 to December 2003. | | | 47 | | | Public Member, Board of Governors and Board of Trustees, Rutgers University, since 2011; Director, Montpelier Re Holdings Ltd. (reinsurance company), since 2006; formerly, Director, National Atlantic Holdings Corporation (property and casualty insurance company), 2004 to 2008; formerly, Director, The Proformance Insurance Company (property and casualty insurance company), 2004 to 2008; formerly, Director, Providence Washington Insurance Company (property and casualty insurance company), 1998 to 2006; formerly, Director, Summit Global Partners (insurance brokerage firm), 2000 to 2005. | |
| |
| Peter P. Trapp (1944) | | Trustee since 1984 | | Retired; formerly, Regional Manager for Mid-Southern Region, Ford Motor Credit Company, September 1997 to 2007; formerly, President, Ford Life Insurance Company, April 1995 to August 1997. | | | 47 | | | None. | |
| |
26
Name, (Year of Birth), and Address(1) | | Position and Length of Time Served(2) | | Principal Occupation(s)(3) | | Number of Funds in Fund Complex Overseen by Fund Trustee | | Other Directorships Held Outside Fund Complex by Fund Trustee | |
| Trustees who are "Interested Persons" | |
| |
| Joseph V. Amato* (1962) | | Trustee since 2009 | | President and Director, Neuberger Berman Group LLC, since 2009; President and Chief Executive Officer, Neuberger and Neuberger Berman Holdings LLC (including its predecessor, Neuberger Berman Inc.), since 2007; Chief Investment Officer, Neuberger, since 2009; Chief Investment Officer (Equities) and Managing Director, Management, since 2009; Managing Director, Neuberger Berman Fixed Income LLC ("NBFI") since 2007; Board member of NBFI since 2006; formerly, Global Head of Asset Management of Lehman Brothers Holdings Inc.'s ("LBHI") Investment Management Division, 2006 to 2009; formerly, member of LBHI's Investment Management Division's Executive Management Committee, 2006 to 2009; formerly, Managing Director, Lehman Brothers Inc. ("LBI"), 2006 to 2008; formerly, Chief Recruiting and Development Officer, LBI, 2005 to 2006; formerly, Global Head of LBI's Equity Sales and a Member of its Equities Division Executive Committee, 2003 to 2005. | | | 47 | | | Member of Board of Advisors, McDonough School of Business, Georgetown University, since 2001; Member of New York City Board of Advisors, Teach for America, since 2005; Trustee, Montclair Kimberley Academy (private school), since 2007. | |
| |
27
Name, (Year of Birth), and Address(1) | | Position and Length of Time Served(2) | | Principal Occupation(s)(3) | | Number of Funds in Fund Complex Overseen by Fund Trustee | | Other Directorships Held Outside Fund Complex by Fund Trustee | |
| Robert Conti* (1956) | | Chief Executive Officer, President and Trustee since 2008; prior thereto, Executive Vice President in 2008 and Vice President, 2000 to 2008 | | Managing Director, Neuberger, since 2007; formerly, Senior Vice President, Neuberger, 2003 to 2006; formerly, Vice President, Neuberger, 1999 to 2003; President and Chief Executive Officer, Management, since 2008; formerly, Senior Vice President, Management, 2000 to 2008. | | | 47 | | | Director since 1994 and formerly, Chairman of the Board, 2008 to 2010, Staten Island Mental Health Society, Inc. | |
| |
(1) The business address of each listed person is 605 Third Avenue, New York, New York 10158.
(2) Pursuant to the Trust's Trust Instrument, each of these Trustees shall hold office for life or until his or her successor is elected or the Trust terminates; except that (a) any Trustee may resign by delivering a written resignation; (b) any Trustee may be removed with or without cause at any time by a written instrument signed by at least two-thirds of the other Trustees; (c) any Trustee who requests to be retired, or who has become unable to serve, may be retired by a written instrument signed by a majority of the other Trustees; and (d) any Trustee may be removed at any shareholder meeting by a vote of at least two-thirds of the outstanding shares.
(3) Except as otherwise indicated, each individual has held the positions shown for at least the last five years.
* Indicates a Trustee who is an "interested person" within the meaning of the 1940 Act. Mr. Amato and Mr. Conti are interested persons of the Trust by virtue of the fact that each is an officer of Management, Neuberger and/or their affiliates.
28
Information about the Officers of the Trust
Name, (Year of Birth), and Address(1) | | Position and Length of Time Served(2) | | Principal Occupation(s)(3) | |
| Andrew B. Allard (1961) | | Anti-Money Laundering Compliance Officer since 2002 | | Senior Vice President, Neuberger, since 2006 and Employee since 1999; Deputy General Counsel, Neuberger, since 2004; formerly, Vice President, Neuberger, 2000 to 2005; formerly, Employee, Management, 1994 to 1999; Anti-Money Laundering Compliance Officer, nine registered investment companies for which Management acts as investment manager and administrator (six since 2002, one since 2003, one since 2005 and one since 2006). | |
| |
| Claudia A. Brandon (1956) | | Executive Vice President since 2008 and Secretary since 1985 | | Senior Vice President, Neuberger, since 2007 and Employee since 1999; Senior Vice President, Management, since 2008 and Assistant Secretary since 2004; formerly, Vice President, Neuberger, 2002 to 2006; formerly, Vice President-Mutual Fund Board Relations, Management, 2000 to 2008; formerly, Vice President, Management, 1986 to 1999 and Employee 1984 to 1999; Executive Vice President, nine registered investment companies for which Management acts as investment manager and administrator (nine since 2008); Secretary, nine registered investment companies for which Management acts as investment manager and administrator (three since 1985, three since 2002, one since 2003, one since 2005 and one since 2006). | |
| |
| Anthony DiBernardo (1979) | | Assistant Treasurer since 2011 | | Vice President, Neuberger, since 2009; Employee, Management, since 2003; Assistant Treasurer, nine registered investment companies for which Management acts as investment manager and administrator. | |
| |
| Maxine L. Gerson (1950) | | Executive Vice President since 2008 and Chief Legal Officer since 2005 (only for purposes of sections 307 and 406 of the Sarbanes-Oxley Act of 2002) | | Managing Director, Neuberger, since 2009, and Deputy General Counsel and Assistant Secretary, Neuberger, since 2001; Managing Director, Management, since 2009, and Secretary and General Counsel, Management, since 2004; formerly, Senior Vice President, Neuberger, 2002 to 2009; formerly, Senior Vice President, Management, 2006 to 2009; Executive Vice President, nine registered investment companies for which Management acts as investment manager and administrator (nine since 2008); Chief Legal Officer (only for purposes of sections 307 and 406 of the Sarbanes-Oxley Act of 2002), nine registered investment companies for which Management acts as investment manager and administrator (eight since 2005 and one since 2006). | |
| |
| Sheila R. James (1965) | | Assistant Secretary since 2002 | | Vice President, Neuberger, since 2008 and Employee since 1999; formerly, Assistant Vice President, Neuberger, 2007; formerly, Employee, Management, 1991 to 1999; Assistant Secretary, nine registered investment companies for which Management acts as investment manager and administrator (six since 2002, one since 2003, one since 2005 and one since 2006). | |
| |
| Brian Kerrane (1969) | | Vice President since 2008 | | Senior Vice President, Neuberger, since 2006; formerly, Vice President, Neuberger, 2002 to 2006; Vice President, Management, since 2008 and Employee since 1991; Vice President, nine registered investment companies for which Management acts as investment manager and administrator (nine since 2008). | |
| |
29
Name, (Year of Birth), and Address(1) | | Position and Length of Time Served(2) | | Principal Occupation(s)(3) | |
| Kevin Lyons (1955) | | Assistant Secretary since 2003 | | Assistant Vice President, Neuberger, since 2008 and Employee since 1999; formerly, Employee, Management, 1993 to 1999; Assistant Secretary, nine registered investment companies for which Management acts as investment manager and administrator (seven since 2003, one since 2005 and one since 2006). | |
| |
| Owen F. McEntee, Jr. (1961) | | Vice President since 2008 | | Vice President, Neuberger, since 2006; Employee, Management, since 1992; Vice President, nine registered investment companies for which Management acts as investment manager and administrator (nine since 2008). | |
| |
| John M. McGovern (1970) | | Treasurer and Principal Financial and Accounting Officer since 2005 | | Senior Vice President, Neuberger, since 2007; formerly, Vice President, Neuberger, 2004 to 2006; Employee, Management, since 1993; Treasurer and Principal Financial and Accounting Officer, nine registered investment companies for which Management acts as investment manager and administrator (eight since 2005 and one since 2006); formerly, Assistant Treasurer, eight registered investment companies for which Management acts as investment manager and administrator, 2002 to 2005. | |
| |
| Frank Rosato (1971) | | Assistant Treasurer since 2005 | | Vice President, Neuberger, since 2006; Employee, Management, since 1995; Assistant Treasurer, nine registered investment companies for which Management acts as investment manager and administrator (eight since 2005 and one since 2006). | |
| |
| Neil S. Siegel (1967) | | Vice President since 2008 | | Managing Director, Management, since 2008; Managing Director, Neuberger, since 2006; formerly, Senior Vice President, Neuberger, 2004 to 2006; Vice President, nine registered investment companies for which Management acts as investment manager and administrator (nine since 2008). | |
| |
| Chamaine Williams (1971) | | Chief Compliance Officer since 2005 | | Senior Vice President, Neuberger, since 2007; Chief Compliance Officer, Management, since 2006; Chief Compliance Officer, nine registered investment companies for which Management acts as investment manager and administrator (eight since 2005 and one since 2006); formerly, Senior Vice President, LBI, 2007 to 2008; formerly, Vice President, LBI, 2003 to 2006; formerly, Chief Compliance Officer, Lehman Brothers Asset Management Inc., 2003 to 2007; formerly, Chief Compliance Officer, Lehman Brothers Alternative Investment Management LLC, 2003 to 2007. | |
| |
(1) The business address of each listed person is 605 Third Avenue, New York, New York 10158.
(2) Pursuant to the By-Laws of the Trust, each officer elected by the Trustees shall hold office until his or her successor shall have been elected and qualified or until his or her earlier death, inability to serve, or resignation. Officers serve at the pleasure of the Trustees and may be removed at any time with or without cause.
(3) Except as otherwise indicated, each individual has held the positions shown for at least the last five years.
30
Proxy Voting Policies and Procedures
A description of the policies and procedures that the Trust uses to determine how to vote proxies relating to portfolio securities is available, without charge, by calling 1-800-877-9700 (toll-free) and on the website of the Securities and Exchange Commission, at www.sec.gov. Information regarding how the Trust voted proxies relating to portfolio securities during the most recent 12-month period ended June 30 is also available, without charge, by calling 1-800-877-9700 (toll-free), on the website of the Securities and Exchange Commission at www.sec.gov, and on Management's website at www.nb.com.
Quarterly Portfolio Schedule
The Trust files a complete schedule of portfolio holdings for the Fund with the Securities and Exchange Commission for the first and third quarters of each fiscal year on Form N-Q. The Trust's Forms N-Q are available on the Securities and Exchange Commission's website at www.sec.gov and may be reviewed and copied at the Securities and Exchange Commission's Public Reference Room in Washington, DC. Information on the operation of the Public Reference Room may be obtained by calling 1-800-SEC-0330. The information on Form N-Q is available upon request, without charge, by calling 1-800-877-9700 (toll-free).
Notice to Shareholders
100.00% of the dividends earned during the fiscal year ended December 31, 2011 qualifies for the dividends received deduction for corporate shareholders.
Board Consideration of the Management and Sub-Advisory Agreements
At a meeting held on October 13, 2011, the Board, including the Trustees who are not "interested persons" of Management (including its affiliates) or Neuberger Berman Advisers Management Trust ("Independent Fund Trustees"), approved the continuance of the Management and Sub-Advisory Agreements ("Agreements") for the Fund.
In evaluating the Agreements, the Board, including the Independent Fund Trustees, reviewed materials furnished by Management and Neuberger in response to questions submitted by counsel for the Independent Fund Trustees, and met with senior representatives of Management and Neuberger regarding their personnel and operations. The Independent Fund Trustees were advised by counsel that is experienced in Investment Company Act of 1940 matters and that is independent of Management and Neuberger. The Independent Fund Trustees received a memorandum from independent counsel discussing the legal standards for their consideration of the proposed continuance of the Agreements. They met with such counsel separately from representatives of Management to discuss the annual contract review. The annual contract review extends over three regular meetings of the Board, including one meeting devoted primarily to reviewing and discussing Fund performance, to ensure that Management and Neuberger have time to respond to any questions the Independent Fund Trustees may have on their initial review of the report and that the Independent Fund Trustees have time to consider those responses.
The Board considered the following factors, among others, in connection with its approval of the continuance of the Agreements: (1) the nature, extent, and quality of the services provided by Management and Neuberger; (2) the performance of the Fund compared to a relevant market index and a peer group of investment companies; (3) the costs of the services provided and profits or losses realized by Management and its affiliates from their relationship with the Fund; (4) the extent to which economies of scale might be realized as the Fund grows; and (5) whether fee levels reflect any such potential economies of scale for the benefit of investors in the Fund. In their deliberations, the Board members did not identify any particular information that was all-important or controlling, and each Trustee may have attributed different weights to the various factors.
31
The Board evaluated the terms of the Agreements, the overall fairness of the Agreements to the Fund and whether the Agreements were in the best interests of the Fund and its shareholders.
With respect to the nature, extent and quality of the services provided, the Board considered the performance of the Fund and the experience and staffing of the portfolio management and investment research personnel of Management and Neuberger who perform services for the Fund. The Board noted that Management also provides certain administrative services, including fund accounting and compliance oversight. The Board also considered Management's and Neuberger's policies and practices regarding brokerage and the allocation of portfolio transactions. The Board's Portfolio Transactions and Pricing Committee from time to time reviewed the quality of the execution services that Management and Neuberger had provided, and periodically reviews studies by an independent firm engaged to review and evaluate the quality of brokerage execution received by the Fund. The Board also reviewed whether Management and Neuberger used brokers to execute Fund transactions that provide research and other services to Management and Neuberger, and the types of benefits potentially derived from such services by Management, Neuberger, the Fund and other clients of Management and Neuberger. In addition, the Board noted the positive compliance history of Management and Neuberger, as each firm has been free of significant reported compliance problems.
The Board considered the performance of the Fund relative to its benchmark and the average performance of a composite peer group of investment companies dedicated to insurance products pursuing broadly similar strategies. The Board also reviewed performance in relation to certain measures of the degree of investment risk undertaken by the portfolio managers, during the period. The Board also considered Management's resources and responsiveness with respect to the Fund.
With respect to the overall fairness of the Agreements, the Board considered the fee structure for the Fund under the Agreements as compared to a peer group of comparable funds and any fall-out benefits likely to accrue to Management or Neuberger or their affiliates from their relationship with the Fund. The Board also considered the profitability of Management and its affiliates from their association with the Fund.
The Board reviewed a comparison of the Fund's management fee and overall expense ratio to a peer group of broadly comparable funds. The Board considered the mean and median of the management fees and expense ratios of the peer group. The Board noted that the Fund's management fee was higher than the peer group mean and median. The Board considered whether specific portfolio management or administration needs contributed to the management fee. With regard to the sub-advisory fee paid to Neuberger, the Board noted that this fee is "at cost." In addition, the Board considered the contractual limit on Fund expenses undertaken by Management.
The Board considered whether there were other funds that were advised or sub-advised by Management or its affiliates or separate accounts managed by Management or its affiliates with similar investment objectives, policies and strategies to the Fund. The Board noted that there were no comparable separate accounts. The Board compared the fees charged to the Fund to the fees charged to a registered fund and a sub-advised fund, each managed by Management in a similar style to the Fund. The Board considered the appropriateness and reasonableness of any differences between the fees charged to the Fund and the other funds and determined that the differences in fees were consistent with the management and other services provided.
The Board also evaluated any apparent or anticipated economies of scale in relation to the services Management provides to the Fund. The Board considered whether the Fund's fee structure provides for a reduction of payments resulting from the use of breakpoints and whether those breakpoints are set at appropriate asset levels. In concluding that the benefits accruing to Management and its affiliates by virtue of their relationship to the Fund were reasonable in comparison with the costs of providing the investment advisory services and the benefits accruing to the Fund, the Board reviewed specific data as to Management's profit on the Fund for a recent period and the trend in profit or loss over recent years. The Board also carefully examined Management's cost allocation methodology. The Board recognized that Management should be entitled to earn a reasonable level of profits for services it provides to the Fund and, based on its review, concluded that Management's level of profitability was not excessive.
32
Conclusions
In approving the Agreements, the Board concluded that the terms of each Agreement are fair and reasonable and that approval of the Agreements is in the best interests of the Fund and its shareholders. In reaching this determination, the Board considered that Management and Neuberger could be expected to provide a high level of service to the Fund; that the performance of the Fund was satisfactory over time; that the Fund's fee structure appeared to the Board to be reasonable given the nature and quality of services provided; and that the benefits accruing to Management and its affiliates by virtue of their relationship to the Fund were reasonable in comparison with the benefits accruing to the Fund.
33
Neuberger Berman
Advisers Management Trust
Regency Portfolio
I Class Shares
S Class Shares
Annual Report
December 31, 2011
B1012 02/12
Regency Portfolio Commentary (Unaudited)
The Neuberger Berman Advisers Management Trust (AMT) Regency Portfolio Class I posted a –6.50% total return for the fiscal year ended December 31, 2011, lagging its benchmark, the Russell Midcap® Value Index, which delivered a –1.38% return for the period. Returns for the Portfolio's Class I and Class S shares are provided on page 3.
During the year, the Health Care sector had the most positive impact on the Portfolio's performance relative to the benchmark while the largest detractors from performance were the Consumer Discretionary and Financial Services sectors.
Management of the Portfolio was transferred from another portfolio manager on December 9, at which time we began to position the Portfolio in accordance with our team's investment philosophy. We use bottom-up, fundamental research to identify high-quality companies that are trading at a substantial discount to their intrinsic value,1 defined as our estimate of a company's true long-term economic worth, where there is a strategic plan or event that we expect to both enhance value and narrow the value/price gap. Applying a consistent, private equity-style investment framework, we focus our research efforts on a company's long-term outlook and strategic catalysts that can potentially unlock value. Our team's approach emphasizes asset values and cash flows, directly engaging a company's management team to evaluate its strategic direction, execution abilities and direct incentive compensation.
Throughout 2011, the stock market was focused on global macro issues, including the European sovereign debt crisis, its impact on the solvency of European banks, the downgrading of U.S. sovereign debt by Standard & Poor's, and the failure of the U.S. federal government to address its growing fiscal issues. This created a market that was very highly correlated and volatile and, for the most part, ignored fundamentals within individual companies, particularly in the second half of the year. Until these macro issues are resolved, we believe that volatility and a highly correlated, "risk on, risk off" type of market environment is likely to continue.
When the market perceives that the negative macro issues are being addressed, it can rally as it did during the last quarter of 2011. However, we believe that the European debt crisis is far from resolved and that more issues will surface during the year. In fact, an immediate hurdle is the refinancing of over 200 billion euros worth of European bank debt, which is set to roll over during the first quarter. In addition, given that the U.S. is in the midst of a presidential election year, it is doubtful, in our opinion, that much progress will be made in addressing growing budgetary issues here at home. As a result, the market will likely continue to focus on both macro and political issues during 2012.
Notwithstanding the difficult macro environment, we believe that the Portfolio's current valuation, based on its discount to intrinsic value and free cash flow yield, is extremely attractive. As of December 31, 2011, the Portfolio's free-cash-flow yield was approximately 10% (excluding Utilities and Financials) and in many instances, this excess cash is being returned to shareholders in the form of increased dividends and/or share repurchase programs. In this difficult market environment and slow growth domestic economy, we continue to emphasize high-quality, cash-generating franchise companies whose managements are focused on creating value for shareholders. Several of the Portfolio's current holdings announced value enhancing events (i.e., spin-offs, restructurings) in 2011. In our opinion, these events should help returns in 2012 and in several instances we see an opportunity to make meaningful investments in some of the divisions that are expected to be spun-off in 2012.
Worldwide economic growth remains sluggish and we believe that the deleveraging cycle that began in 2008 will continue. Domestically, we are concerned with the lack of growth in real disposable income and believe that the consumer savings rate will rise. Since consumers account for about 70% of GDP, this will likely create a drag on domestic growth in 2012. Even if the European Central Bank is successful in avoiding a major crisis in Europe, the austerity measures that are being put in place may create a much larger recession there than is now being forecast. Finally, the growth rate in China has been slowing as a result of the government's efforts to contain the inflation rate and, we believe, most emerging markets are not immune to the credit crunch in Europe.
1 Intrinsic value reflects the team's analysis and estimates. There is no guarantee that any intrinsic values will be realized; security prices may decrease regardless of intrinsic values.
1
In 2012, we anticipate equity markets to remain volatile and reactive to headline news, especially out of Europe. While recent economic statistics indicate a slowly improving domestic economy and corporate balance sheets appear to be in excellent shape, operating profits are already at record highs and it is difficult to envision substantial continued U.S. growth without accelerated growth in other economies. On the other hand, in light of very low interest rates, valuations remain extremely attractive.
With this macro backdrop, we have positioned the Portfolio conservatively. We are currently focusing on companies that are selling at a substantial discount to our intrinsic value estimates with an emphasis on those generating excess cash flow. In this uncertain, slow-growth environment, our strategy is to invest in companies whose management teams are focused on creating shareholder value through distribution of dividends and share repurchase programs. Given the attractive valuation of the Portfolio as measured by its discount to intrinsic value and free cash flow yield, we believe there is substantial appreciation potential once the macro economic environment stabilizes.
Sincerely,
Michael C. Greene
Portfolio Manager
Information about the principal risks of investing in the Portfolio is set forth in the prospectus and statement of additional information.
The composition, industries and holdings of the Portfolio are subject to change.
2
Regency Portfolio (Unaudited)
SECTOR ALLOCATION
| (as a % of Total Investments) | |
| Consumer Discretionary | | | 14.6 | % | |
| Consumer Staples | | | 9.9 | | |
| Energy | | | 5.7 | | |
| Financials | | | 9.5 | | |
| Health Care | | | 7.9 | | |
| Industrials | | | 21.2 | | |
| Information Technology | | | 14.7 | | |
| Materials | | | 4.4 | | |
| Utilities | | | 6.0 | | |
| Short-Term Investments | | | 6.1 | | |
| Total | | | 100.0 | % | |
PERFORMANCE HIGHLIGHTS1
| | | | | Average Annual Total Return Ended 12/31/2011 | |
| | | Inception Date | | 1 Year | | 5 Years | | 10 Years | | Life of Fund* | |
Regency Portfolio Class I | | | 08/22/2001 | | | | –6.50 | % | | | –0.65 | % | | | 6.00 | % | | | 5.75 | % | |
Regency Portfolio Class S2 | | | 04/29/2005 | | | | –6.70 | % | | | –0.88 | % | | | 5.86 | % | | | 5.62 | % | |
Russell Midcap® Value Index3 | | | | | | | –1.38 | % | | | 0.04 | % | | | 7.67 | % | | | 7.41 | % | |
Russell Midcap® Index3 | | | | | | | –1.55 | % | | | 1.41 | % | | | 6.99 | % | | | 7.01 | % | |
Performance data quoted represent past performance and do not indicate future results. The investment return and principal value of an investment will fluctuate so that an investor's shares, when redeemed, may be worth more or less than their original cost. Results are shown on a "total return" basis and include reinvestment of all income dividends and distributions. Current performance may be lower or higher than the performance data quoted. For performance data current to the most recent month end, please visit https://www.nb.com.
* Index returns are as of inception date 08/22/2001.
As stated in the Portfolio's most recent prospectus, the total annual operating expense ratios for fiscal year 2010 were 1.06% and 1.31% for Class I and Class S shares, respectively (prior to any fee waivers and/or expense reimbursements, if any). The expense ratio net of waivers and/or reimbursements was 1.26% for Class S shares. Neuberger Berman Management LLC has contractually agreed to limit certain expenses of the Portfolio through 12/31/2014 for Class I shares and through 12/31/2020 for Class S shares.
The results shown in the table do not reflect the effect of taxes an investor would pay on Portfolio distributions or on the redemption of Portfolio shares.
COMPARISON OF A $10,000 INVESTMENT
The graph shows the change in value of a hypothetical $10,000 investment in the Portfolio over the past 10 fiscal years, or since the Portfolio's inception, if it has not operated for 10 years. The graph is based on Class I shares only; performance of other classes will vary due to differences in fee structures (see Performance Highlights chart above). The result is compared with benchmarks, which may include a broad-based market index and/or a narrower index. Market indices have not been reduced to reflect any of the fees and costs of investing. All results include the reinvestment of income dividends and distributions. The results shown in the graph do not reflect the effect of taxes that an investor would pay on Portfolio distributions or the redemption of Portfolio shares. Results represent past performance and do not indicate future results.
Please see Endnotes for additional information.
3
Endnotes (Unaudited)
1 "Total Return" includes reinvestment of all income dividends and distributions. Results represent past performance and do not indicate future results. The value of an investment in the Portfolio and the return on the investment both will fluctuate, and redemption proceeds may be higher or lower than an investor's original cost. The performance information does not reflect fees and expenses of the variable annuity and variable life insurance policies or the qualified pension and retirement plans whose proceeds are invested in the Portfolio. Neuberger Berman Management LLC ("NBM LLC") has agreed to absorb certain expenses of the AMT Portfolios, including the Portfolio. Without this arrangement, which is subject to change, the total returns of the Portfolio may have been less.
2 Performance shown prior to April 29, 2005 for the Class S shares is that of the Class I shares, which has lower expenses and correspondingly higher returns than Class S shares.
3 The Russell Midcap® Value Index measures the performance of those Russell Midcap® Index companies with lower price-to-book ratios and lower forecasted growth values. The Russell Midcap Index measures the performance of the 800 smallest companies in the Russell 1000® Index, which represents approximately 31% of the total market capitalization of the Russell 1000 Index (which, in turn, consists of the 1,000 largest U.S. companies, based on market capitalization). Please note that indices do not take into account any fees and expenses of investing in the individual securities that they track and that individuals cannot invest directly in any index. Data about the performance of these indices are prepared or obtained by NBM LLC and include reinvestment of all income dividends and distributions. The Portfolio may invest in securities not included in the above-described indices and may not invest in all securities included in the above-described indices.
Any ratios or other measurements using a factor of forecasted earnings of a company discussed herein are based on consensus estimates, not NBM LLC's own projections, and they may or may not be realized. In addition, any revision to a forecast could affect the market price of a security. By quoting them herein, NBM LLC does not offer an opinion as to the accuracy of and does not guarantee these forecasted numbers.
The investments for the Portfolio are managed by the same portfolio manager(s) who manage(s) one or more other registered funds that have similar names, investment objectives and investment styles as the Portfolio. You should be aware that the Portfolio is likely to differ from the other mutual funds in size, cash flow pattern and tax matters. Accordingly, the holdings and performance can be expected to vary from those of the other mutual funds.
The composition, industries and holdings of the Portfolio are subject to change.
Shares of the separate AMT Portfolios are not available to the general public. Shares of this Portfolio may be purchased only by life insurance companies to be used with their separate accounts that fund variable annuity and variable life insurance policies and by qualified pension and retirement plans.
Statistics and projections in this report are derived from sources deemed to be reliable but cannot be regarded as a representation of future results of the AMT Portfolios. This report is prepared for the general information of shareholders and is not an offer of shares of the AMT Portfolios. Shares of the AMT Portfolios are sold only through the currently effective prospectuses, which must precede or accompany this report.
The "Neuberger Berman" name and logo are registered service marks of Neuberger Berman Group LLC. "Neuberger Berman Management LLC" and the individual Fund names in this piece are either service marks or registered service marks of Neuberger Berman Management LLC.
© 2012 Neuberger Berman Management LLC distributor. All rights reserved.
4
Information About Your Fund's Expenses (Unaudited)
This table is designed to provide information regarding costs related to your investments. All mutual funds incur operating expenses, which include management fees, fees for administrative services and costs of shareholder reports, among others. The following examples are based on an investment of $1,000 made at the beginning of the six month period ended December 31, 2011 and held for the entire period. The table illustrates the fund's costs in two ways:
| Actual Expenses and Performance: | | The first section of the table provides information about actual account values and actual expenses in dollars, based on the fund's actual performance during the period. You may use the information in this line, together with the amount you invested, to estimate the expenses you paid over the period. Simply divide your account value by $1,000 (for example, an $8,600 account value divided by $1,000 = 8.6), then multiply the result by the number in the first section of the table under the heading entitled "Expenses Paid During the Period" to estimate the expenses you paid over the period. | |
| |
Hypothetical Example for Comparison Purposes: | | The second section of the table provides information about hypothetical account values and hypothetical expenses based on the fund's actual expense ratio and an assumed rate of return at 5% per year before expenses. This return is not the fund's actual return. The hypothetical account values and expenses may not be used to estimate the actual ending account balance or expenses you paid for the period. You may use this information to compare the ongoing costs of investing in this fund versus other funds. To do so, compare the expenses shown in this 5% hypothetical example with the 5% hypothetical examples that appear in the shareholder reports of other funds. | |
| |
Please note that the expenses in the table are meant to highlight your ongoing costs only. The table and expense example do not include any transaction costs, such as fees and expenses that are, or may be, imposed under your variable contract or qualified pension plan. Therefore, the information under the heading "Hypothetical (5% annual return before expenses)" is useful in comparing ongoing costs only, and will not help you determine the relative total costs of owning different funds. In addition, if these transaction costs were included, your costs would have been higher.
Expense Information as of 12/31/11
NEUBERGER BERMAN ADVISERS MANAGEMENT TRUST REGENCY PORTFOLIO
| Actual | | Beginning Account Value 7/1/11 | | Ending Account Value 12/31/11 | | Expenses Paid During the Period* 7/1/11 – 12/31/11 | | Expense Ratio | |
| Class I | | $ | 1,000.00 | | | $ | 883.30 | | | $ | 5.03 | | | | 1.06 | % | |
| Class S | | $ | 1,000.00 | | | $ | 881.90 | | | $ | 5.93 | | | | 1.25 | % | |
| Hypothetical (5% annual return before expenses)** | |
| Class I | | $ | 1,000.00 | | | $ | 1,019.86 | | | $ | 5.40 | | | | 1.06 | % | |
| Class S | | $ | 1,000.00 | | | $ | 1,018.90 | | | $ | 6.36 | | | | 1.25 | % | |
* For each class, expenses are equal to the annualized expense ratio for the class, multiplied by the average account value over the period, multiplied by 184/365 (to reflect the one-half year period shown).
** Hypothetical 5% annual return before expenses is calculated by multiplying the number of days in the most recent half year divided by 365.
5
Schedule of Investments Regency Portfolio
| NUMBER OF SHARES | | | | VALUE† | |
| Common Stocks (93.9%) | | | |
| Aerospace & Defense (4.7%) | | | |
| | 45,900 | | | General Dynamics | | $ | 3,048,219 | | |
| | 51,400 | | | Rockwell Collins | | | 2,846,018 | | |
| | | | 5,894,237 | | |
| Beverages (2.2%) | | | |
| | 131,900 | | | Constellation Brands Class A | | | 2,726,373 | * | |
| Capital Markets (1.9%) | | | |
| | 60,200 | | | State Street | | | 2,426,662 | | |
| Chemicals (4.4%) | | | |
| | 32,100 | | | Air Products & Chemicals | | | 2,734,599 | | |
| | 56,900 | | | Akzo Nobel ADR | | | 2,748,270 | | |
| | | | 5,482,869 | | |
| Commercial Banks (3.5%) | | | |
| | 52,800 | | | BB&T Corp. | | | 1,328,976 | | |
| | 53,400 | | | Comerica Inc. | | | 1,377,720 | | |
| | 305,400 | | | Huntington Bancshares | | | 1,676,646 | | |
| | | | 4,383,342 | | |
| Commercial Services & Supplies (8.4%) | | | |
| | 73,100 | | | Avery Dennison | | | 2,096,508 | | |
| | 95,400 | | | Brink's Co. | | | 2,564,352 | | |
| | 132,700 | | | Corrections Corporation of America | | | 2,703,099 | * | |
| | 139,500 | | | Covanta Holding | | | 1,909,755 | | |
| | 45,200 | | | Republic Services | | | 1,245,260 | | |
| | | | 10,518,974 | | |
| Communications Equipment (2.0%) | | | |
| | 55,000 | | | Motorola Solutions | | | 2,545,950 | | |
| Construction & Engineering (1.0%) | | | |
| | 45,900 | | | KBR, Inc. | | | 1,279,233 | | |
| Electric Utilities (1.9%) | | | |
| | 145,600 | | | NV Energy | | | 2,380,560 | | |
Electronic Equipment, Instruments & Components (2.1%) | | | |
| | 31,600 | | | Dolby Laboratories Class A | | | 964,116 | * | |
| | 294,300 | | | Flextronics International | | | 1,665,738 | * | |
| | | | 2,629,854 | | |
| Energy Equipment & Services (1.0%) | | | |
| | 25,300 | | | Dresser-Rand Group | | | 1,262,723 | * | |
| NUMBER OF SHARES | | | | VALUE† | |
| Food & Staples Retailing (6.5%) | | | |
| | 92,200 | | | CVS Caremark | | $ | 3,759,916 | | |
| | 210,200 | | | Safeway Inc. | | | 4,422,608 | | |
| | | | 8,182,524 | | |
| Health Care Equipment & Supplies (4.2%) | | | |
| | 49,800 | | | Covidien PLC | | | 2,241,498 | | |
| | 57,100 | | | Zimmer Holdings | | | 3,050,282 | * | |
| | | | 5,291,780 | | |
| Health Care Providers & Services (1.7%) | | | |
| | 60,100 | | | Omnicare, Inc. | | | 2,070,445 | | |
| Hotels, Restaurants & Leisure (5.0%) | | | |
| | 532,600 | | | Wendy's Co. | | | 2,854,736 | | |
| | 89,500 | | | Wyndham Worldwide | | | 3,385,785 | | |
| | | | 6,240,521 | | |
| Industrial Conglomerates (2.2%) | | | |
| | 58,800 | | | Tyco International | | | 2,746,548 | | |
| Insurance (1.1%) | | | |
| | 31,300 | | | Torchmark Corp. | | | 1,358,107 | | |
| IT Services (6.5%) | | | |
| | 80,300 | | | Amdocs Ltd. | | | 2,290,959 | * | |
| | 120,500 | | | Fidelity National Information Services | | | 3,204,095 | | |
| | 141,800 | | | Western Union | | | 2,589,268 | | |
| | | | 8,084,322 | | |
| Machinery (4.5%) | | | |
| | 39,500 | | | Ingersoll-Rand PLC | | | 1,203,565 | | |
| | 108,300 | | | ITT Corp. | | | 2,093,439 | | |
| | 61,500 | | | Navistar International | | | 2,329,620 | * | |
| | | | 5,626,624 | | |
| Marine (0.4%) | | | |
| | 38,476 | | | Seaspan Corp. | | | 526,352 | | |
| Media (2.1%) | | | |
| | 125,100 | | | Virgin Media | | | 2,674,638 | | |
| Multi-Utilities (4.1%) | | | |
| | 153,700 | | | CenterPoint Energy | | | 3,087,833 | | |
| | 37,000 | | | Sempra Energy | | | 2,035,000 | | |
| | | | 5,122,833 | | |
See Notes to Schedule of Investments
6
| NUMBER OF SHARES | | | | VALUE† | |
| Oil, Gas & Consumable Fuels (4.7%) | | | |
| | 67,400 | | | Southwestern Energy | | $ | 2,152,756 | * | |
| | 91,200 | | | Sunoco, Inc. | | | 3,741,024 | | |
| | | | 5,893,780 | | |
| Personal Products (1.2%) | | | |
| | 88,400 | | | Avon Products | | | 1,544,348 | | |
| Pharmaceuticals (2.0%) | | | |
| | 81,600 | | | Hospira, Inc. | | | 2,478,192 | * | |
| Real Estate Investment Trusts (1.0%) | | | |
| | 67,500 | | | Starwood Property Trust | | | 1,249,425 | | |
Semiconductors & Semiconductor Equipment (1.1%) | | | |
| | 103,100 | | | Freescale Semiconductor Holdings | | | 1,304,215 | * | |
| Software (3.0%) | | | |
| | 48,400 | | | Nuance Communications | | | 1,217,744 | * | |
| | 163,200 | | | Symantec Corp. | | | 2,554,080 | * | |
| | | | 3,771,824 | | |
| Specialty Retail (7.5%) | | | |
| | 46,800 | | | Advance Auto Parts | | | 3,258,684 | | |
| | 152,800 | | | Best Buy | | | 3,570,936 | | |
| | 226,900 | | | Chico's FAS | | | 2,527,666 | | |
| | | | 9,357,286 | | |
| Thrifts & Mortgage Finance (2.0%) | | | |
| | 195,900 | | | People's United Financial | | | 2,517,315 | | |
| | | | | Total Common Stocks (Cost $115,579,290) | | | 117,571,856 | | |
| Short-Term Investments (6.1%) | | | |
| | | | | State Street Institutional Liquid Reserves Fund Institutional Class (Cost $7,626,099) | | | 7,626,099 | | |
| | | | | Total Investments (100.0%) (Cost $123,205,389) | | | 125,197,955 | ## | |
| | | | | Cash, receivables and other assets, less liabilities (0.0%) | | | 3,972 | | |
| | | | | Total Net Assets (100.0%) | | $ | 125,201,927 | | |
See Notes to Schedule of Investments
7
Notes to Schedule of Investments Regency Portfolio
† In accordance with Accounting Standards Codification ("ASC") 820 "Fair Value Measurements and Disclosures" ("ASC 820"), all investments held by Neuberger Berman Advisers Management Trust Regency Portfolio (the "Fund") are carried at the value that Neuberger Berman Management LLC ("Management") believes the Fund would receive upon selling an investment in an orderly transaction to an independent buyer in the principal or most advantageous market for the investment under current market conditions. Various inputs, including the volume and level of activity for the asset or liability in the market, are considered in valuing the Fund's investments, some of which are discussed below. Significant management judgment may be necessary to value investments in accordance with ASC 820.
ASC 820 established a three-tier hierarchy of inputs to create a classification of value measurements for disclosure purposes. The three-tier hierarchy of inputs is summarized in the three broad Levels listed below.
• Level 1 – quoted prices in active markets for identical investments
• Level 2 – other significant observable inputs (including quoted prices for similar investments, interest rates, prepayment speeds, credit risk, amortized cost, etc.)
• Level 3 – significant unobservable inputs (including the Fund's own assumptions in determining the fair value of investments)
The inputs or methodology used for valuing an investment are not necessarily an indication of the risk associated with investing in those securities.
The value of the Fund's investments in equity securities, for which market quotations are readily available, is generally determined by Management by obtaining valuations from an independent pricing service based on the latest sale price quoted on a principal exchange or market for that security (Level 1 inputs). Securities traded primarily on the NASDAQ Stock Market are normally valued by the Fund at the NASDAQ Official Closing Price ("NOCP") provided by NASDAQ each business day. The NOCP is the most recently reported price as of 4:00:02 p.m., Eastern time, unless that price is outside the range of the "inside" bid and asked prices (i.e., the bid and asked prices that dealers quote to each other when trading for their own accounts); in that case, NASDAQ will adjust the price to equal the inside bid or asked price, whichever is closer. Because of delays in reporting trades, the NOCP may not be based on the price of the last trade to occur before the market closes. If there is no reported sale of a security on a particular day, the independent pricing service may value the security based on reported market quotations.
Management has developed a process to periodically review information provided by independent pricing services for all types of securities.
Investments in State Street Institutional Liquid Reserves Fund Institutional Class are valued using the fund's daily calculated net asset value per share (Level 2 inputs).
If a valuation is not available from an independent pricing service, or if Management has reason to believe that the valuation received does not represent the amount the Fund might reasonably expect to receive on a current sale in an orderly transaction, the Fund seeks to obtain quotations from principal market makers (generally considered Level 3 inputs). If such quotations are not readily available, the security is valued using methods the Neuberger Berman Advisers Management Trust's Board of Trustees (the "Board") has approved on the belief that they reflect fair value. Numerous factors may be considered when determining the fair value of a security based on Level 2 or 3 inputs, including available analyst, media or other reports, trading in futures or ADRs and whether the issuer of the security being fair valued has other securities outstanding.
The value of the Fund's investments in foreign securities is generally determined using the same valuation methods and inputs as other Fund investments, as discussed above. Foreign security prices expressed in local currency values are translated from the local currency into U.S. dollars using the exchange rates as of 4:00 p.m., Eastern time. The Board has approved the use of Interactive Data Pricing and Reference Data, Inc. ("Interactive") to assist in
See Notes to Financial Statements
8
Notes to Schedule of Investments Regency Portfolio (cont'd)
determining the fair value of foreign equity securities when changes in the value of a certain index suggest that the closing prices on the foreign exchanges may no longer represent the amount that the Fund could expect to receive for those securities. In this event, Interactive will provide adjusted prices for certain foreign equity securities using a statistical analysis of historical correlations of multiple factors (Level 2 inputs). In the absence of precise information about the market values of these foreign securities as of the close of the New York Stock Exchange, the Board has determined on the basis of available data that prices adjusted in this way are likely to be closer to the prices the Fund could realize on a current sale than are the prices of those securities established at the close of the foreign markets in which the securities primarily trade.
Fair value prices are necessarily estimates, and there is no assurance that such a price will be at or close to the price at which the security is next quoted or next trades.
The following is a summary, categorized by Level, of inputs used to value the Fund's investments as of December 31, 2011:
| Asset Valuation Inputs | | Level 1 | | Level 2 | | Level 3 | | Total | |
| Investments: | |
| Common Stocks^ | | $ | 117,571,856 | | | $ | — | | | $ | — | | | $ | 117,571,856 | | |
| Short-Term Investments | | | — | | | | 7,626,099 | | | | — | | | | 7,626,099 | | |
| Total Investments | | $ | 117,571,856 | | | $ | 7,626,099 | | | $ | — | | | $ | 125,197,955 | | |
^ The Schedule of Investments provides information on the industry categorization for the portfolio.
The Fund had no significant transfers between Levels 1 and 2 during the year ended December 31, 2011.
## At December 31, 2011, the cost of investments for U.S. federal income tax purposes was $123,226,992. Gross unrealized appreciation of investments was $4,225,719 and gross unrealized depreciation of investments was $2,254,756, resulting in net unrealized appreciation of $1,970,963, based on cost for U.S. federal income tax purposes.
* Security did not produce income during the last twelve months.
See Notes to Financial Statements
9
Statement of Assets and Liabilities
Neuberger Berman Advisers Management Trust
| | | REGENCY PORTFOLIO | |
| | | December 31, 2011 | |
| Assets | |
| Investments in securities, at value* (Note A)—see Schedule of Investments: | |
| Unaffiliated issuers | | $ | 125,197,955 | | |
| Dividends and interest receivable | | | 187,876 | | |
| Receivable for Fund shares sold | | | 15,151 | | |
| Prepaid expenses and other assets | | | 3,873 | | |
| Total Assets | | | 125,404,855 | | |
| Liabilities | |
| Payable for Fund shares redeemed | | | 25,792 | | |
| Payable to investment manager (Note B) | | | 58,121 | | |
| Payable to administrator—net (Note B) | | | 41,493 | | |
| Accrued expenses and other payables | | | 77,522 | | |
| Total Liabilities | | | 202,928 | | |
| Net Assets at value | | $ | 125,201,927 | | |
| Net Assets consist of: | |
| Paid-in capital | | $ | 136,273,550 | | |
| Undistributed net investment income (loss) | | | 604,304 | | |
| Accumulated net realized gains (losses) on investments | | | (13,668,493 | ) | |
| Net unrealized appreciation (depreciation) in value of investments | | | 1,992,566 | | |
| Net Assets at value | | $ | 125,201,927 | | |
| Net Assets | |
| Class I | | $ | 70,022,034 | | |
| Class S | | | 55,179,893 | | |
| Shares Outstanding ($.001 par value; unlimited shares authorized) | |
| Class I | | | 4,911,409 | | |
| Class S | | | 3,580,569 | | |
| Net Asset Value, offering and redemption price per share | |
| Class I | | $ | 14.26 | | |
| Class S | | | 15.41 | | |
| *Cost of Investments: | |
| Unaffiliated issuers | | $ | 123,205,389 | | |
See Notes to Financial Statements
10
Statement of Operations
Neuberger Berman Advisers Management Trust
| | | REGENCY PORTFOLIO | |
| | | For the Year Ended December 31, 2011 | |
| Investment Income: | |
| Income (Note A): | |
| Dividend income—unaffiliated issuers | | $ | 2,460,137 | | |
| Interest income—unaffiliated issuers | | | 9,966 | | |
| Foreign taxes withheld | | | (14,387 | ) | |
| Total income | | $ | 2,455,716 | | |
| Expenses: | |
| Investment management fees (Note B) | | | 889,673 | | |
| Administration fees (Note B): | |
| Class I | | | 307,806 | | |
| Class S | | | 177,470 | | |
| Distribution fees (Note B): | |
| Class S | | | 147,891 | | |
| Audit fees | | | 41,935 | | |
| Custodian fees (Note A) | | | 70,375 | | |
| Insurance expense | | | 10,651 | | |
| Legal fees | | | 88,700 | | |
| Shareholder reports | | | 75,138 | | |
| Trustees' fees and expenses | | | 55,592 | | |
| Miscellaneous | | | 11,792 | | |
| Total expenses | | | 1,877,023 | | |
| Expenses reimbursed by Management (Note B) | | | (41,438 | ) | |
| Expenses reduced by custodian fee expense offset arrangement (Note A) | | | (2 | ) | |
| Total net expenses | | | 1,835,583 | | |
| Net investment income (loss) | | $ | 620,133 | | |
| Realized and Unrealized Gain (Loss) on Investments (Note A): | |
| Net realized gain (loss) on: | |
| Sales of investment securities of unaffiliated issuers | | | 50,071,688 | | |
| Foreign currency | | | 283 | | |
| Change in net unrealized appreciation (depreciation) in value of: | |
| Unaffiliated investment securities | | | (56,616,556 | ) | |
| Foreign currency | | | (190 | ) | |
| Net gain (loss) on investments | | | (6,544,775 | ) | |
| Net increase (decrease) in net assets resulting from operations | | $ | (5,924,642 | ) | |
See Notes to Financial Statements
11
Statements of Changes in Net Assets
Neuberger Berman Advisers Management Trust
| | | REGENCY PORTFOLIO | |
| | | Year Ended December 31, 2011 | | Year Ended December 31, 2010 | |
| Increase (Decrease) in Net Assets: | |
| From Operations (Note A): | |
| Net investment income (loss) | | $ | 620,133 | | | $ | 752,698 | | |
| Net realized gain (loss) on investments | | | 50,071,971 | | | | 16,436,554 | | |
| Change in net unrealized appreciation (depreciation) of investments | | | (56,616,746 | ) | | | 24,835,018 | | |
| Net increase (decrease) in net assets resulting from operations | | | (5,924,642 | ) | | | 42,024,270 | | |
| Distributions to Shareholders From (Note A): | |
| Net investment income: | |
| Class I | | | (495,806 | ) | | | (895,174 | ) | |
| Class S | | | (233,831 | ) | | | (191,283 | ) | |
| Total distributions to shareholders | | | (729,637 | ) | | | (1,086,457 | ) | |
| From Fund Share Transactions (Note D): | |
| Proceeds from shares sold: | |
| Class I | | | 9,740,700 | | | | 49,423,172 | | |
| Class S | | | 11,448,964 | | | | 11,006,720 | | |
| Proceeds from reinvestment of dividends and distributions: | |
| Class I | | | 495,806 | | | | 895,174 | | |
| Class S | | | 233,831 | | | | 191,283 | | |
| Payments for shares redeemed: | |
| Class I | | | (71,547,917 | ) | | | (28,829,668 | ) | |
| Class S | | | (15,624,875 | ) | | | (20,364,903 | ) | |
| Net increase (decrease) from Fund share transactions | | | (65,253,491 | ) | | | 12,321,778 | | |
| Net Increase (Decrease) in Net Assets | | | (71,907,770 | ) | | | 53,259,591 | | |
| Net Assets: | |
| Beginning of year | | | 197,109,697 | | | | 143,850,106 | | |
| End of year | | $ | 125,201,927 | | | $ | 197,109,697 | | |
| Undistributed net investment income (loss) at end of year | | $ | 604,304 | | | $ | 675,930 | | |
See Notes to Financial Statements
12
Notes to Financial Statements Regency Portfolio
Note A—Summary of Significant Accounting Policies:
1 General: The Fund is a separate operating series of Neuberger Berman Advisers Management Trust (the "Trust"), a Delaware statutory trust organized pursuant to a Trust Instrument dated May 23, 1994. The Trust is currently comprised of ten separate operating series (each individually a "Series," and collectively the "Funds") each of which is diversified. The Trust is registered as an open-end management investment company under the Investment Company Act of 1940, as amended (the "1940 Act"), and its shares are registered under the Securities Act of 1933, as amended. The Fund currently offers Class I and Class S shares. The Board may establish additional series or classes of shares without the approval of shareholders.
The assets of each Series belong only to that Series, and the liabilities of each Series are borne solely by that Series and no other.
The preparation of financial statements in accordance with U.S. generally accepted accounting principles ("GAAP") requires Management to make estimates and assumptions at the date of the financial statements. Actual results could differ from those estimates.
2 Portfolio valuation: Investment securities are valued as indicated in the notes following the Schedule of Investments.
3 Foreign currency translation: The accounting records of the Fund are maintained in U.S. dollars. Foreign currency amounts are translated into U.S. dollars using the exchange rate as of 4:00 p.m., Eastern time, to determine the value of investments, other assets and liabilities. Purchase and sale prices of securities, and income and expenses, are translated into U.S. dollars at the prevailing rate of exchange on the respective dates of such transactions. Net unrealized foreign currency gain (loss), if any, arises from changes in the value of assets and liabilities, other than investments in securities, as a result of changes in exchange rates and is stated separately in the Statement of Operations.
4 Securities transactions and investment income: Securities transactions are recorded on trade date for financial reporting purposes. Dividend income is recorded on the ex-dividend date or, for certain foreign dividends, as soon as the Fund becomes aware of the dividends. Non-cash dividends included in dividend income, if any, are recorded at the fair market value of the securities received. Interest income, including accretion of original issue discount, where applicable, and accretion of discount on short-term investments, if any, is recorded on the accrual basis. Realized gains and losses from securities transactions and foreign currency transactions, if any, are recorded on the basis of identified cost and stated separately in the Statement of Operations. Included in net realized gain (loss) on investments are proceeds from the settlements of class action litigation in which the Fund participated as a class member. The amount of such proceeds for the year ended December 31, 2011 was $128,638.
5 Income tax information: The Funds are treated as separate entities for U.S. federal income tax purposes. It is the policy of the Fund to continue to qualify as a regulated investment company by complying with the requirements of the U.S. Internal Revenue Code applicable to regulated investment companies and to distribute substantially all of its earnings to its shareholders. To the extent the Fund distributes substantially all of its earnings to shareholders, no federal income or excise tax provision is required.
The Fund has adopted the provisions of ASC 740 "Income Taxes" ("ASC 740"). ASC 740 sets forth a minimum threshold for financial statement recognition of a tax position taken, or expected to be taken, in a tax return. The Fund recognizes interest and penalties, if any, related to unrecognized tax positions as an income tax expense in the Statement of Operations. The Fund is subject to examination by U.S. federal and state tax authorities for returns filed for the prior three fiscal years 2008 - 2010. As of December 31, 2011, the Fund did not have any unrecognized tax positions.
13
Income distributions and capital gain distributions are determined in accordance with income tax regulations, which may differ from GAAP. These differences are primarily due to differing treatments of income and gains on various investment securities held by the Fund, timing differences and differing characterization of distributions made by the Fund as a whole. The Fund may also utilize earnings and profits distributed to shareholders on redemption of shares as a part of the dividends paid deduction for income tax purposes.
As determined on December 31, 2011, permanent differences resulting primarily from different book and tax accounting for foreign currency gains and losses and return of capital non-taxable dividend adjustments to income were reclassified at fiscal year-end. These reclassifications had no effect on net income, net asset value ("NAV") or NAV per share of the Fund. For the year ended December 31, 2011, the Fund recorded the following permanent reclassifications:
| Paid-in Capital | | Undistributed Net Investment Income (Loss) | | Accumulated Net Realized Gains (Losses) on Investments | |
| $ | — | | | $ | 37,878 | | | $ | (37,878 | ) | |
For tax purposes, short-term gains are considered ordinary income.
The tax character of distributions paid during the years ended December 31, 2011 and December 31, 2010 was as follows:
| | | Distributions Paid From: | |
| | | Ordinary Income | | Long-Term Capital Gain | | Total | |
| | | 2011 | | 2010 | | 2011 | | 2010 | | 2011 | | 2010 | |
| | | | | $ | 729,637 | | | $ | 1,086,457 | | | $ | — | | | $ | — | | | $ | 729,637 | | | $ | 1,086,457 | | |
As of December 31, 2011, components of distributable earnings (accumulated losses) on a U.S. federal income tax basis were as follows:
Undistributed Ordinary Income | | Undistributed Long-Term Gain | | Unrealized Appreciation (Depreciation) | | Loss Carryforwards and Deferrals | | Other Temporary Differences | | Total | |
| $ | 604,304 | | | $ | 30,612,792 | | | $ | 1,970,963 | | | $ | (44,259,682 | ) | | $ | — | | | $ | (11,071,623 | ) | |
The difference between book basis and tax basis distributable earnings is attributable primarily to timing differences of wash sales, capital loss carryforwards, and non-real estate investment trusts return of capital basis adjustments.
To the extent the Fund's net realized capital gains, if any, can be offset by capital loss carryforwards, it is the policy of the Fund not to distribute such gains. The Regulated Investment Company ("RIC") Modernization Act of 2010 (the "Act") became effective for the Fund on January 1, 2011. The Act modernizes several of the federal income and excise tax provisions related to RICs. Among the changes made are changes to the capital loss carryforward rules allowing for RICs to carry forward capital losses indefinitely and to retain the character of capital loss carryforwards as short-term or long-term ("Post-Enactment"). Rules in effect previously limited the carryforward period to eight years and all carryforwards were considered short-term in character ("Pre-Enactment"). As determined at December 31, 2011, the Fund had unused capital loss carryforwards available for federal income tax purposes to offset net realized capital gains, if any, as follows:
| | | Pre-Enactment | | Post-Enactment (No Expiration Date) | |
| | | Expiring in: 2017 | | Long-Term | | Short-Term | |
| | | | | $ | 44,259,682 | | | | — | | | | — | | |
14
Post-Enactment capital loss carryforwards must be fully used before Pre-Enactment capital loss carryforwards; therefore, under certain circumstances, Pre-Enactment capital loss carryforwards available as of the report date may expire unused.
During the year ended December 31, 2011, the Fund utilized capital loss carryforwards of $15,451,623.
6 Distributions to shareholders: The Fund may earn income, net of expenses, daily on its investments. Distributions from net investment income and net realized capital gains, if any, generally are distributed once a year (usually in October). Income distributions and capital gain distributions to shareholders are recorded on the ex-date.
It is the policy of the Fund to pass through to its shareholders substantially all REIT distributions and other income it receives, less operating expenses. The distributions the Fund receives from REITs are generally comprised of income, capital gains, and/or return of capital, but the REITs do not report this information to the Fund until the following calendar year. At December 31, 2011, the Fund estimated these amounts within the financial statements since the information is not available from the REITs until after the Fund's fiscal year-end. For the year ended December 31, 2011, the character of distributions paid to shareholders disclosed within the Statements of Changes in Net Assets is based on estimates made at the time. As a result, the Fund will estimate these amounts when reporting the character of income and distributions within the financial statements. All estimates are based upon REIT information sources available to the Fund together with actual IRS Forms 1099DIV received to date. Based on past experience, it is possible that a portion of the Fund's distributions during the current fiscal year will be considered tax return of capital but the actual amount of the tax return of capital, if any, is not determinable until after the Fund's fiscal year-end. After calendar year-end, when the Fund learns the nature of the distributions paid by REITs during that year, distributions previously identified as income are often re-characterized as return of capital and/or capital gain. After all applicable REITs have informed the Fund of the actual breakdown of distributions paid to the Fund during its fiscal year, estimates previously recorded are adjusted on the books of the Fund to reflect actual results. As a result, the composition of the Fund's distributions as reported herein may differ from the final composition determined after calendar year-end and reported to Fund shareholders on IRS Form 1099DIV, where applicable.
7 Foreign taxes: Foreign taxes withheld represent amounts withheld by foreign tax authorities, net of refunds recoverable.
8 Expense allocation: Certain expenses are applicable to multiple funds. Expenses directly attributable to a Series are charged to that Series. Expenses of the Trust that are not directly attributable to a particular series of the Trust (e.g., the Fund) are allocated among the series of the Trust, on the basis of relative net assets, except where a more appropriate allocation of expenses to each of the series can otherwise be made fairly. Expenses borne by the complex of related investment companies, which includes open-end and closed-end investment companies for which Management serves as investment manager, that are not directly attributable to a particular investment company in the complex (e.g., the Trust) or series thereof are allocated among the investment companies in the complex or series thereof, on the basis of relative net assets, except where a more appropriate allocation of expenses to each of the investment companies in the complex or series thereof can otherwise be made fairly. The Fund's expenses (other than those specific to each class) are allocated proportionally each day between the classes based upon the relative net assets of each class.
9 Investments in foreign securities: Investing in foreign securities may involve certain sovereign and other risks, in addition to the credit and market risks normally associated with domestic securities. These additional risks include the possibility of adverse political and economic developments (including political instability, nationalization, expropriation, or confiscatory taxation) and the potentially adverse effects of unavailability of public information regarding issuers, less governmental supervision and regulation of financial markets, reduced liquidity of certain financial markets, and the lack of uniform accounting, auditing, and financial reporting standards or the application of standards that are different or less stringent than those applied in the United States. Foreign securities also may experience greater price volatility, higher rates of inflation, and delays in settlement.
15
10 Indemnifications: Like many other companies, the Trust's organizational documents provide that its officers and trustees are indemnified against certain liabilities arising out of the performance of their duties to the Trust. In addition, both in some of its principal service contracts and in the normal course of its business, the Trust enters into contracts that provide indemnifications to other parties for certain types of losses or liabilities. The Trust's maximum exposure under these arrangements is unknown as this could involve future claims against the Trust.
11 Expense offset arrangement: The Fund has an expense offset arrangement in connection with its custodian contract. For the year ended December 31, 2011, the impact of this arrangement was a reduction of expenses of $2.
12 Other: All net investment income and realized and unrealized capital gains and losses of the Fund are allocated, on the basis of relative net assets, pro rata among its respective classes.
Note B—Management Fees, Administration Fees, Distribution Arrangements, and Other Transactions with Affiliates:
Fund shares are issued and redeemed in connection with investments in and payments under certain variable annuity contracts and variable life insurance policies issued through separate accounts of life insurance companies and are also offered directly to certain qualified pension and retirement plans.
The Fund retains Management as its investment manager under a Management Agreement. For such investment management services, the Fund pays Management a fee at the annual rate of 0.55% of the first $250 million of the Fund's average daily net assets, 0.525% of the next $250 million, 0.50% of the next $250 million, 0.475% of the next $250 million, 0.45% of the next $500 million, 0.425% of the next $2.5 billion, and 0.40% of average daily net assets in excess of $4 billion.
The Fund retains Management as its administrator under an Administration Agreement. Each class pays Management an administration fee at the annual rate of 0.30% of its average daily net assets under this agreement. Additionally, Management retains State Street Bank and Trust Company ("State Street") as its sub-administrator under a Sub-Administration Agreement. Management pays State Street a fee for all services received under this agreement.
The Board adopted a non-fee distribution plan for the Fund's Class I.
For the Fund's Class S, Management acts as agent in arranging for the sale of class shares without commission and bears advertising and promotion expenses. The Board has adopted a distribution plan (the "Plan") with respect to this class, pursuant to Rule 12b-1 under the 1940 Act. The Plan provides that, as compensation for administrative and other services provided to this class, Management's activities and expenses related to the sale and distribution of this class of shares, and ongoing services provided to investors in this class, Management receives from this class a fee at the annual rate of 0.25% of Class S's average daily net assets. Management receives this amount to provide distribution and shareholder servicing for this class and pays a portion of it to institutions that provide such services. Those institutions may use the payments for, among other purposes, compensating employees engaged in sales and/or shareholder servicing. The amount of fees paid by this class during any year could have been more or less than the cost of distribution and other services provided to this class. FINRA rules limit the amount of annual distribution fees that may be paid by a mutual fund and impose a ceiling on the cumulative distribution fees paid. The Trust's Plan complies with those rules.
Management has contractually undertaken to forgo current payment of fees and/or reimburse the Fund's Class I and Class S shares for their operating expenses (including fees payable to Management but excluding interest, taxes,
16
brokerage commissions, extraordinary expenses, transaction costs and dividend expense on short sales, if any) ("Operating Expenses") which exceed the expense limitation as detailed in the following table:
| | | Expense Limitation(1) | | Expiration | | Reimbursement from Management for the Year Ended December 31, 2011 | |
| Class I | | | 1.50 | % | | 12/31/14 | | $ | — | | |
| Class S | | | 1.25 | % | | 12/31/20 | | | 41,438 | | |
(1) Expense limitation per annum of the respective class' average daily net assets.
Each respective class has agreed to repay Management for fees and expenses foregone and/or its excess Operating Expenses previously reimbursed by Management, so long as its annual Operating Expenses during that period do not exceed its expense limitation, and the repayment is made within three years after the year in which Management issued the reimbursement or waived fees. During the year ended December 31, 2011, there was no repayment to Management under its contractual expense limitation. At December 31, 2011, the Fund's Class I shares had no contingent liability to Management under its contractual expense limitation. At December 31, 2011, the Fund's Class S shares contingent liabilities to Management under its contractual expense limitation were as follows:
| | | Expiring in: | | | |
| | | 2012 | | 2013 | | 2014 | | Total | |
| Class S | | $ | 32,214 | | | $ | 31,454 | | | $ | 41,438 | | | $ | 105,106 | | |
Neuberger Berman LLC ("Neuberger") is retained by Management to furnish it with investment recommendations and research information without added cost to the Fund. Several individuals who are officers and/or trustees of the Trust are also employees of Neuberger and/or Management.
Management and Neuberger are indirect subsidiaries of Neuberger Berman Group LLC ("NBG," and together with its consolidated subsidiaries "NB Group"). The voting equity of NBG is owned by NBSH Acquisition, LLC ("NBSH"), which was formed to facilitate the May 4, 2009 management buyout of the businesses conducted by NB Group, and Lehman Brothers Holdings Inc. ("LBHI"). NBSH, which is owned by portfolio managers, members of the NB Group management team and certain of NB Group's key employees and senior professionals, owns approximately 52% of the voting equity of NBG, and LBHI and certain of its subsidiaries own the remaining 48% of NBG's voting equity.
On December 14, 2011, the United States Bankruptcy Court for the Southern District of New York approved a motion filed by LBHI and certain of its subsidiaries, as debtors and debtors in possession, (collectively, the "Lehman Brothers Estate") that will provide NBG with the opportunity to purchase the Lehman Brothers Estate's interest in preferred and common equity of NBG. The proposed transactions, which are subject to the Lehman Brothers Estate and NBG signing definitive documentation, as well as to market conditions, would, if successfully implemented, enable NBG to have a lower cost capital structure and set it on a path to 100% employee ownership within the next five to six years.
Note C—Securities Transactions:
During the year ended December 31, 2011, there were purchase and sale transactions (excluding short-term securities) of $148,676,396 and $216,698,326, respectively.
During the year ended December 31, 2011, no brokerage commissions on securities transactions were paid to affiliated brokers.
17
Note D—Fund Share Transactions:
Share activity for the years ended December 31, 2011 and December 31, 2010 was as follows:
For the Year Ended December 31, 2011
| | | Shares Sold | | Shares Issued on Reinvestment of Dividends and Distributions | | Shares Redeemed | | Total | |
| Class I | | | 632,083 | | | | 36,296 | | | | (4,520,876 | ) | | | (3,852,497 | ) | |
| Class S | | | 736,152 | | | | 15,821 | | | | (941,055 | ) | | | (189,082 | ) | |
For the Year Ended December 31, 2010
| | | Shares Sold | | Shares Issued on Reinvestment of Dividends and Distributions | | Shares Redeemed | | Total | |
| Class I | | | 3,846,396 | | | | 64,401 | | | | (2,170,042 | ) | | | 1,740,755 | | |
| Class S | | | 785,229 | | | | 12,735 | | | | (1,400,742 | ) | | | (602,778 | ) | |
Note E—Line of Credit:
At December 31, 2011, the Fund was a participant in a single committed, unsecured $200,000,000 line of credit with State Street, to be used only for temporary or emergency purposes. Other investment companies managed by Management also participate in this line of credit on the same terms. Interest is charged on borrowings under this line of credit at the higher of (a) the Federal Funds Rate plus 1.25% per annum or (b) the Overnight LIBOR Rate plus 1.25% per annum. A commitment fee of 0.10% (0.125% prior to September 16, 2011) per annum of the available line of credit is charged, of which each participating Fund has agreed to pay its pro rata share, based on the ratio of its individual net assets to the net assets of all participants at the time the fee is due and payable. The fee is paid quarterly in arrears. Because several mutual funds participate, there is no assurance that an individual Fund will have access to all or any part of the $200,000,000 at any particular time. There were no loans outstanding pursuant to this line of credit at December 31, 2011. During the year ended December 31, 2011, the Fund did not utilize this line of credit.
Note F—Recent Accounting Pronouncement:
In May 2011, the Financial Accounting Standards Board ("FASB") issued Accounting Standards Update ("ASU") No. 2011-04 "Amendments to Achieve Common Fair Value Measurement and Disclosure Requirements in U.S. GAAP and International Financial Reporting Standards ("IFRS")." ASU No. 2011-04 amends ASC 820 to establish common requirements for measuring fair value and for disclosing information about fair value measurements in accordance with GAAP and IFRS. It will not affect the fair valuation of the Fund's investments, but rather the quantitative and qualitative disclosures in the financial statements. ASU No. 2011-04 is effective for fiscal years beginning after December 15, 2011 and for interim periods within those fiscal years. Management is currently evaluating the impact of the adoption of ASU No. 2011-04 on the Fund's financial statement disclosures.
18
Financial Highlights
Regency Portfolio
The following tables include selected data for a share outstanding throughout each year and other performance information derived from the Financial Statements. Per share amounts that round to less than $.01 or $(.01) per share are presented as $.00 or $(.00), respectively.
| Class I | |
| | | Year Ended December 31, | |
| | | 2011 | | 2010 | | 2009 | | 2008 | | 2007 | |
| Net Asset Value, Beginning of Year | | $ | 15.36 | | | $ | 12.26 | | | $ | 8.60 | | | $ | 16.23 | | | $ | 16.21 | | |
| Income From Investment Operations: | |
Net Investment Income (Loss)‡ | | | .06 | | | | .07 | | | | .07 | | | | .10 | | | | .17 | | |
Net Gains or Losses on Securities (both realized and unrealized) | | | (1.06 | ) | | | 3.13 | | | | 3.93 | | | | (7.53 | ) | | | .39 | | |
| Total From Investment Operations | | | (1.00 | ) | | | 3.20 | | | | 4.00 | | | | (7.43 | ) | | | .56 | | |
| Less Distributions From: | |
| Net Investment Income | | | (.10 | ) | | | (.10 | ) | | | (.18 | ) | | | (.17 | ) | | | (.08 | ) | |
| Net Capital Gains | | | — | | | | — | | | | (.16 | ) | | | (.03 | ) | | | (.46 | ) | |
| Total Distributions | | | (.10 | ) | | | (.10 | ) | | | (.34 | ) | | | (.20 | ) | | | (.54 | ) | |
| Net Asset Value, End of Year | | $ | 14.26 | | | $ | 15.36 | | | $ | 12.26 | | | $ | 8.60 | | | $ | 16.23 | | |
Total Return†† | | | (6.50 | )% | | | 26.18 | % | | | 46.56 | % | | | (45.82 | )% | | | 3.30 | % | |
| Ratios/Supplemental Data | |
| Net Assets, End of Year (in millions) | | $ | 70.0 | | | $ | 134.6 | | | $ | 86.1 | | | $ | 74.8 | | | $ | 217.3 | | |
Ratio of Gross Expenses to Average Net Assets# | | | 1.07 | % | | | 1.06 | % | | | 1.06 | % | | | .97 | % | | | .93 | % | |
| Ratio of Net Expenses to Average Net Assets | | | 1.07 | % | | | 1.06 | % | | | 1.06 | %§ | | | .96 | %§ | | | .92 | %§ | |
Ratio of Net Investment Income (Loss) to Average Net Assets | | | .42 | % | | | .54 | % | | | .67 | % | | | .76 | % | | | 1.03 | % | |
| Portfolio Turnover Rate | | | 95 | % | | | 39 | % | | | 51 | % | | | 66 | % | | | 58 | % | |
See Notes to Financial Highlights
19
Financial Highlights (cont'd)
| Class S | |
| | | Year Ended December 31, | |
| | | 2011 | | 2010 | | 2009 | | 2008 | | 2007 | |
| Net Asset Value, Beginning of Year | | $ | 16.59 | | | $ | 13.21 | | | $ | 9.22 | | | $ | 17.37 | | | $ | 17.35 | | |
| Income From Investment Operations: | |
Net Investment Income (Loss)‡ | | | .05 | | | | .04 | | | | .06 | | | | .08 | | | | .14 | | |
Net Gains or Losses on Securities (both realized and unrealized) | | | (1.16 | ) | | | 3.39 | | | | 4.20 | | | | (8.06 | ) | | | .41 | | |
| Total From Investment Operations | | | (1.11 | ) | | | 3.43 | | | | 4.26 | | | | (7.98 | ) | | | .55 | | |
| Less Distributions From: | |
| Net Investment Income | | | (.07 | ) | | | (.05 | ) | | | (.11 | ) | | | (.14 | ) | | | (.07 | ) | |
| Net Capital Gains | | | — | | | | — | | | | (.16 | ) | | | (.03 | ) | | | (.46 | ) | |
| Total Distributions | | | (.07 | ) | | | (.05 | ) | | | (.27 | ) | | | (.17 | ) | | | (.53 | ) | |
| Net Asset Value, End of Year | | $ | 15.41 | | | $ | 16.59 | | | $ | 13.21 | | | $ | 9.22 | | | $ | 17.37 | | |
Total Return†† | | | (6.70 | )% | | | 25.99 | % | | | 46.16 | % | | | (45.95 | )% | | | 3.05 | % | |
| Ratios/Supplemental Data | |
| Net Assets, End of Year (in millions) | | $ | 55.2 | | | $ | 62.5 | | | $ | 57.8 | | | $ | 119.7 | | | $ | 151.3 | | |
Ratio of Gross Expenses to Average Net Assets# | | | 1.25 | % | | | 1.25 | % | | | 1.25 | % | | | 1.23 | % | | | 1.19 | % | |
Ratio of Net Expenses to Average Net Assets§ | | | 1.25 | % | | | 1.25 | % | | | 1.25 | % | | | 1.22 | % | | | 1.18 | % | |
Ratio of Net Investment Income (Loss) to Average Net Assets | | | .32 | % | | | .30 | % | | | .61 | % | | | .58 | % | | | .80 | % | |
| Portfolio Turnover Rate | | | 95 | % | | | 39 | % | | | 51 | % | | | 66 | % | | | 58 | % | |
See Notes to Financial Highlights
20
Notes to Financial Highlights Regency Portfolio
†† Total return based on per share NAV reflects the effects of changes in NAV on the performance of the Fund during each fiscal period and assumes income dividends and other distributions, if any, were reinvested. Results represent past performance and do not indicate future results. Current returns may be lower or higher than the performance data quoted. Investment returns and principal may fluctuate and shares when redeemed may be worth more or less than original cost. Total return would have been lower if Management had not reimbursed and/or waived certain expenses. Total return would have been higher if Management had not recouped previously reimbursed expenses. The total return information shown does not reflect charges and other expenses that apply to the separate account or the related insurance policies, and the inclusion of these charges and other expenses would reduce the total return for all fiscal periods shown.
# The Fund is required to calculate an expense ratio without taking into consideration any expense reductions related to expense offset arrangements.
‡ Calculated based on the average number of shares outstanding during each fiscal period.
§ After reimbursement of expenses and/or waiver of a portion of the investment management fee by Management. Had Management not undertaken such actions, the annualized ratios of net expenses to average daily net assets would have been:
| | | Year Ended December 31, | |
| | | 2011 | | 2010 | | 2009 | | 2008 | | 2007 | |
| Regency Portfolio Class I | | | — | | | | — | | | | 1.06 | % | | | .96 | % | | | .93 | % | |
| Regency Portfolio Class S | | | 1.32 | % | | | 1.30 | % | | | 1.29 | % | | | 1.22 | % | | | 1.18 | % | |
21
Report of Independent Registered Public Accounting Firm
To the Board of Trustees of
Neuberger Berman Advisers Management Trust and
Shareholders of Regency Portfolio
We have audited the accompanying statement of assets and liabilities, including the schedule of investments, of Regency Portfolio, one of the series constituting Neuberger Berman Advisers Management Trust (the "Trust"), as of December 31, 2011, and the related statement of operations for the year then ended, the statements of changes in net assets for each of the two years in the period then ended, and the financial highlights for each of the five years in the period then ended. These financial statements and financial highlights are the responsibility of the Trust's management. Our responsibility is to express an opinion on these financial statements and financial highlights based on our audits.
We conducted our audits in accordance with the standards of the Public Company Accounting Oversight Board (United States). Those standards require that we plan and perform the audit to obtain reasonable assurance about whether the financial statements and financial highlights are free of material misstatement. We were not engaged to perform an audit of the Trust's internal control over financial reporting. Our audits included consideration of internal control over financial reporting as a basis for designing audit procedures that are appropriate in the circumstances, but not for the purpose of expressing an opinion on the effectiveness of the Trust's internal control over financial reporting. Accordingly, we express no such opinion. An audit also includes examining, on a test basis, evidence supporting the amounts and disclosures in the financial statements and financial highlights, assessing the accounting principles used and significant estimates made by management, and evaluating the overall financial statement presentation. Our procedures included confirmation of securities owned as of December 31, 2011 by correspondence with the custodian and brokers or by other appropriate auditing procedures where replies from brokers were not received. We believe that our audits provide a reasonable basis for our opinion.
In our opinion, the financial statements and financial highlights referred to above present fairly, in all material respects, the financial position of Regency Portfolio, a series of Neuberger Berman Advisers Management Trust, at December 31, 2011, the results of its operations for the year then ended, the changes in its net assets for each of the two years in the period then ended, and the financial highlights for each of the five years in the period then ended, in conformity with U.S. generally accepted accounting principles.
Boston, Massachusetts
February 10, 2012
22
Trustee and Officer Information
The following tables set forth information concerning the trustees ("Trustees") and officers ("Officers") of the Trust. All persons named as Trustees and Officers also serve in similar capacities for other funds administered or managed by Management, Neuberger and Neuberger Berman Fixed Income LLC ("NBFI"). The Statement of Additional Information includes additional information about Trustees and is available upon request, without charge, by calling (800) 877-9700.
Information about the Board of Trustees
Name, (Year of Birth), and Address(1) | | Position and Length of Time Served(2) | | Principal Occupation(s)(3) | | Number of Funds in Fund Complex Overseen by Fund Trustee | | Other Directorships Held Outside Fund Complex by Fund Trustee | |
| Independent Trustees | |
| |
| John Cannon (1930) | | Trustee since 2000 | | Consultant; formerly, Chairman, CDC Investment Advisers (registered investment adviser), 1993 to January 1999; formerly, President and Chief Executive Officer, AMA Investment Advisors, an affiliate of the American Medical Association. | | | 47 | | | Formerly, Independent Trustee or Director of three series of Oppenheimer Funds: Oppenheimer Limited Term New York Municipal Fund, Rochester Fund Municipals, and Oppenheimer Convertible Securities Fund, 1992 to 2009. | |
| |
| Faith Colish (1935) | | Trustee since 1982 | | Counsel, Carter Ledyard & Milburn LLP (law firm) since October 2002; formerly, Attorney-at-Law and President, Faith Colish, A Professional Corporation, 1980 to 2002. | | | 47 | | | Formerly, Director, 1997 to 2003, and Advisory Director, 2003 to 2006, ABA Retirement Funds (formerly, American Bar Retirement Association) (not-for-profit membership corporation). | |
| |
23
Name, (Year of Birth), and Address(1) | | Position and Length of Time Served(2) | | Principal Occupation(s)(3) | | Number of Funds in Fund Complex Overseen by Fund Trustee | | Other Directorships Held Outside Fund Complex by Fund Trustee | |
| Martha C. Goss (1949) | | Trustee since 2007 | | President, Woodhill Enterprises Inc./Chase Hollow Associates LLC (personal investment vehicle), since 2006; Chief Operating and Financial Officer, Hopewell Holdings LLC/ Amwell Holdings, LLC (a holding company for a healthcare reinsurance company start-up), since 2003; formerly, Consultant, Resources Connection (temporary staffing), 2002 to 2006. | | | 47 | | | Director, American Water (water utility), since 2003; Director, Channel Reinsurance (financial guaranty reinsurance), since 2006; Director, Allianz Life of New York (insurance), since 2005; Director, Financial Women's Association of New York (not-for-profit association), since 2003; Trustee Emerita, Brown University, since 1998; formerly, Director, Ocwen Financial Corporation (mortgage servicing), 2005 to 2010; formerly, Advisory Board Member, Attensity (software developer), 2005 to 2007; formerly, Director, Bank Leumi (commercial bank), 2005 to 2007; formerly, Director, Claire's Stores, Inc. (retailer), 2005 to 2007. | |
| |
| C. Anne Harvey (1937) | | Trustee since 1998 | | President, C.A. Harvey Associates, since October 2001; formerly, Director, AARP, 1978 to December 2001. | | | 47 | | | Formerly, President, Board of Associates to The National Rehabilitation Hospital's Board of Directors, 2001 to 2002; formerly, Member, Individual Investors Advisory Committee to the New York Stock Exchange Board of Directors, 1998 to 2002. | |
| |
24
Name, (Year of Birth), and Address(1) | | Position and Length of Time Served(2) | | Principal Occupation(s)(3) | | Number of Funds in Fund Complex Overseen by Fund Trustee | | Other Directorships Held Outside Fund Complex by Fund Trustee | |
| Robert A. Kavesh (1927) | | Trustee since 2000 | | Retired, since 2002; Marcus Nadler Professor Emeritus of Finance and Economics, New York University Stern School of Business; formerly, Executive Secretary-Treasurer, American Finance Association, 1961 to 1979. | | | 47 | | | Formerly, Director, The Caring Community (not-for-profit), 1997 to 2006; formerly, Director, DEL Laboratories, Inc. (cosmetics and pharmaceuticals), 1978 to 2004; formerly, Director, Apple Bank for Savings, 1979 to 1990; formerly, Director, Western Pacific Industries, Inc., (public company), 1972 to 1986. | |
| |
| Michael M. Knetter (1960) | | Trustee since 2007 | | President and Chief Executive Officer, University of Wisconsin Foundation, since October 2010; formerly, Dean, School of Business, University of Wisconsin - Madison; formerly, Professor of International Economics and Associate Dean, Amos Tuck School of Business - Dartmouth College, 1998 to 2002. | | | 47 | | | Director, American Family Insurance (a mutual company, not publicly traded), since March 2009; formerly, Trustee, Northwestern Mutual Series Fund, Inc., 2007 to 2010; formerly, Director, Wausau Paper, 2005 to 2011; formerly, Director, Great Wolf Resorts, 2004 to 2009. | |
| |
| Howard A. Mileaf (1937) | | Trustee since 1999 | | Retired; formerly, Vice President and General Counsel, WHX Corporation (holding company), 1993 to 2001. | | | 47 | | | Formerly, Director, Webfinancial Corporation (holding company), 2002 to 2008; formerly, Director, WHX Corporation (holding company), 2002 to 2005; formerly, Director, State Theatre of New Jersey (not-for-profit theatre), 2000 to 2005. | |
| |
| George W. Morriss (1947) | | Trustee since 2007 | | Retired; formerly, Executive Vice President and Chief Financial Officer, People's Bank, Connecticut (a financial services company), 1991 to 2001. | | | 47 | | | Manager, Larch Lane Multi-Strategy Fund complex (which currently consists of three funds), since 2006; formerly, Member, NASDAQ Issuers' Affairs Committee, 1995 to 2003. | |
| |
25
Name, (Year of Birth), and Address(1) | | Position and Length of Time Served(2) | | Principal Occupation(s)(3) | | Number of Funds in Fund Complex Overseen by Fund Trustee | | Other Directorships Held Outside Fund Complex by Fund Trustee | |
| Edward I. O'Brien (1928) | | Trustee since 2000 | | Private Investor; formerly, Member, Investment Policy Committee, Edward Jones, 1993 to 2001; President, Securities Industry Association ("SIA") (securities industry's representative in government relations and regulatory matters at the federal and state levels), 1974 to 1992; Adviser to SIA, November 1992 to November 1993. | | | 47 | | | Formerly, Director, Legg Mason, Inc. (financial services holding company), 1993 to July 2008; formerly, Director, Boston Financial Group (real estate and tax shelters), 1993 to 1999. | |
| |
| Jack L. Rivkin (1940) | | Trustee since 2002; President, 2002 to 2008 | | Formerly, Executive Vice President and Chief Investment Officer, Neuberger Berman Holdings LLC (holding company), 2002 to August 2008 and 2003 to August 2008, respectively; formerly, Managing Director and Chief Investment Officer, Neuberger, December 2005 to August 2008 and 2003 to August 2008, respectively; formerly, Executive Vice President, Neuberger, December 2002 to 2005; formerly, Director and Chairman, Management, December 2002 to August 2008; formerly, Executive Vice President, Citigroup Investments, Inc., September 1995 to February 2002; formerly, Executive Vice President, Citigroup Inc., September 1995 to February 2002. | | | 47 | | | Director, Idealab (private company), since 2009; Director, Distributed World Power (private company), since 2009; Director, Dale Carnegie and Associates, Inc. (private company), since 1999; Director, Solbright, Inc. (private company), since 1998; Director, SA Agricultural Fund, since 2009; Chairman and Director, Essential Brands (consumer products) since 2008; formerly, Director, New York Society of Security Analysts, 2006 to 2008. | |
| |
26
Name, (Year of Birth), and Address(1) | | Position and Length of Time Served(2) | | Principal Occupation(s)(3) | | Number of Funds in Fund Complex Overseen by Fund Trustee | | Other Directorships Held Outside Fund Complex by Fund Trustee | |
| Cornelius T. Ryan (1931) | | Trustee since 2000 | | General Partner and Adviser, TD2, TD3, and TOF1 Healthcare Venture Capital Partnerships; formerly, Founding General Partner, Oxford Partners and Oxford Bioscience Partners (venture capital investing) and President, Oxford Venture Corporation, 1981 to 2010. | | | 47 | | | Trustee, Norwalk Hospital Foundation, since 2000; Director, Supply Pro (privately held company), since 2008; formerly, Trustee, Norwalk Hospital, 1995 to 2004; formerly, President and Director, Randolph Computer Corp., 1966 to 1984; formerly, Director of numerous privately held portfolio companies of Oxford Partners and Oxford Bioscience Partners, 1981 to 2005. | |
| |
| Tom D. Seip (1950) | | Trustee since 2000; Chairman of the Board since 2008; Lead Independent Trustee from 2006 to 2008 | | General Partner, Ridgefield Farm LLC (a private investment vehicle); formerly, President and CEO, Westaff, Inc. (temporary staffing), May 2001 to January 2002; formerly, Senior Executive, The Charles Schwab Corporation, 1983 to 1998, including Chief Executive Officer, Charles Schwab Investment Management, Inc.; Trustee, Schwab Family of Funds and Schwab Investments, 1997 to 1998; and Executive Vice President-Retail Brokerage, Charles Schwab & Co., Inc., 1994 to 1997. | | | 47 | | | Director, H&R Block, Inc. (financial services company), since May 2001; formerly, Chairman, Compensation Committee, H&R Block, Inc., 2006 to 2010; formerly, Director, Forward Management, Inc. (asset management company), 1999 to 2006. | |
| |
27
Name, (Year of Birth), and Address(1) | | Position and Length of Time Served(2) | | Principal Occupation(s)(3) | | Number of Funds in Fund Complex Overseen by Fund Trustee | | Other Directorships Held Outside Fund Complex by Fund Trustee | |
| Candace L. Straight (1947) | | Trustee since 1999 | | Private investor and consultant specializing in the insurance industry; formerly, Advisory Director, Securitas Capital LLC (a global private equity investment firm dedicated to making investments in the insurance sector), 1998 to December 2003. | | | 47 | | | Public Member, Board of Governors and Board of Trustees, Rutgers University, since 2011; Director, Montpelier Re Holdings Ltd. (reinsurance company), since 2006; formerly, Director, National Atlantic Holdings Corporation (property and casualty insurance company), 2004 to 2008; formerly, Director, The Proformance Insurance Company (property and casualty insurance company), 2004 to 2008; formerly, Director, Providence Washington Insurance Company (property and casualty insurance company), 1998 to 2006; formerly, Director, Summit Global Partners (insurance brokerage firm), 2000 to 2005. | |
| |
| Peter P. Trapp (1944) | | Trustee since 1984 | | Retired; formerly, Regional Manager for Mid-Southern Region, Ford Motor Credit Company, September 1997 to 2007; formerly, President, Ford Life Insurance Company, April 1995 to August 1997. | | | 47 | | | None. | |
| |
28
Name, (Year of Birth), and Address(1) | | Position and Length of Time Served(2) | | Principal Occupation(s)(3) | | Number of Funds in Fund Complex Overseen by Fund Trustee | | Other Directorships Held Outside Fund Complex by Fund Trustee | |
| Trustees who are "Interested Persons" | |
| |
| Joseph V. Amato* (1962) | | Trustee since 2009 | | President and Director, Neuberger Berman Group LLC, since 2009; President and Chief Executive Officer, Neuberger and Neuberger Berman Holdings LLC (including its predecessor, Neuberger Berman Inc.), since 2007; Chief Investment Officer, Neuberger, since 2009; Chief Investment Officer (Equities) and Managing Director, Management, since 2009; Managing Director, Neuberger Berman Fixed Income LLC ("NBFI") since 2007; Board member of NBFI since 2006; formerly, Global Head of Asset Management of Lehman Brothers Holdings Inc.'s ("LBHI") Investment Management Division, 2006 to 2009; formerly, member of LBHI's Investment Management Division's Executive Management Committee, 2006 to 2009; formerly, Managing Director, Lehman Brothers Inc. ("LBI"), 2006 to 2008; formerly, Chief Recruiting and Development Officer, LBI, 2005 to 2006; formerly, Global Head of LBI's Equity Sales and a Member of its Equities Division Executive Committee, 2003 to 2005. | | | 47 | | | Member of Board of Advisors, McDonough School of Business, Georgetown University, since 2001; Member of New York City Board of Advisors, Teach for America, since 2005; Trustee, Montclair Kimberley Academy (private school), since 2007. | |
| |
29
Name, (Year of Birth), and Address(1) | | Position and Length of Time Served(2) | | Principal Occupation(s)(3) | | Number of Funds in Fund Complex Overseen by Fund Trustee | | Other Directorships Held Outside Fund Complex by Fund Trustee | |
| Robert Conti* (1956) | | Chief Executive Officer, President and Trustee since 2008; prior thereto, Executive Vice President in 2008 and Vice President, 2000 to 2008 | | Managing Director, Neuberger, since 2007; formerly, Senior Vice President, Neuberger, 2003 to 2006; formerly, Vice President, Neuberger, 1999 to 2003; President and Chief Executive Officer, Management, since 2008; formerly, Senior Vice President, Management, 2000 to 2008. | | | 47 | | | Director since 1994 and formerly, Chairman of the Board, 2008 to 2010, Staten Island Mental Health Society, Inc. | |
| |
(1) The business address of each listed person is 605 Third Avenue, New York, New York 10158.
(2) Pursuant to the Trust's Trust Instrument, each of these Trustees shall hold office for life or until his or her successor is elected or the Trust terminates; except that (a) any Trustee may resign by delivering a written resignation; (b) any Trustee may be removed with or without cause at any time by a written instrument signed by at least two-thirds of the other Trustees; (c) any Trustee who requests to be retired, or who has become unable to serve, may be retired by a written instrument signed by a majority of the other Trustees; and (d) any Trustee may be removed at any shareholder meeting by a vote of at least two-thirds of the outstanding shares.
(3) Except as otherwise indicated, each individual has held the positions shown for at least the last five years.
* Indicates a Trustee who is an "interested person" within the meaning of the 1940 Act. Mr. Amato and Mr. Conti are interested persons of the Trust by virtue of the fact that each is an officer of Management, Neuberger and/or their affiliates.
30
Information about the Officers of the Trust
Name, (Year of Birth), and Address(1) | | Position and Length of Time Served(2) | | Principal Occupation(s)(3) | |
| Andrew B. Allard (1961) | | Anti-Money Laundering Compliance Officer since 2002 | | Senior Vice President, Neuberger, since 2006 and Employee since 1999; Deputy General Counsel, Neuberger, since 2004; formerly, Vice President, Neuberger, 2000 to 2005; formerly, Employee, Management, 1994 to 1999; Anti-Money Laundering Compliance Officer, nine registered investment companies for which Management acts as investment manager and administrator (six since 2002, one since 2003, one since 2005 and one since 2006). | |
| |
| Claudia A. Brandon (1956) | | Executive Vice President since 2008 and Secretary since 1985 | | Senior Vice President, Neuberger, since 2007 and Employee since 1999; Senior Vice President, Management, since 2008 and Assistant Secretary since 2004; formerly, Vice President, Neuberger, 2002 to 2006; formerly, Vice President-Mutual Fund Board Relations, Management, 2000 to 2008; formerly, Vice President, Management, 1986 to 1999 and Employee 1984 to 1999; Executive Vice President, nine registered investment companies for which Management acts as investment manager and administrator (nine since 2008); Secretary, nine registered investment companies for which Management acts as investment manager and administrator (three since 1985, three since 2002, one since 2003, one since 2005 and one since 2006). | |
| |
| Anthony DiBernardo (1979) | | Assistant Treasurer since 2011 | | Vice President, Neuberger, since 2009; Employee, Management, since 2003; Assistant Treasurer, nine registered investment companies for which Management acts as investment manager and administrator. | |
| |
| Maxine L. Gerson (1950) | | Executive Vice President since 2008 and Chief Legal Officer since 2005 (only for purposes of sections 307 and 406 of the Sarbanes-Oxley Act of 2002) | | Managing Director, Neuberger, since 2009, and Deputy General Counsel and Assistant Secretary, Neuberger, since 2001; Managing Director, Management, since 2009, and Secretary and General Counsel, Management, since 2004; formerly, Senior Vice President, Neuberger, 2002 to 2009; formerly, Senior Vice President, Management, 2006 to 2009; Executive Vice President, nine registered investment companies for which Management acts as investment manager and administrator (nine since 2008); Chief Legal Officer (only for purposes of sections 307 and 406 of the Sarbanes-Oxley Act of 2002), nine registered investment companies for which Management acts as investment manager and administrator (eight since 2005 and one since 2006). | |
| |
| Sheila R. James (1965) | | Assistant Secretary since 2002 | | Vice President, Neuberger, since 2008 and Employee since 1999; formerly, Assistant Vice President, Neuberger, 2007; formerly, Employee, Management, 1991 to 1999; Assistant Secretary, nine registered investment companies for which Management acts as investment manager and administrator (six since 2002, one since 2003, one since 2005 and one since 2006). | |
| |
| Brian Kerrane (1969) | | Vice President since 2008 | | Senior Vice President, Neuberger, since 2006; formerly, Vice President, Neuberger, 2002 to 2006; Vice President, Management, since 2008 and Employee since 1991; Vice President, nine registered investment companies for which Management acts as investment manager and administrator (nine since 2008). | |
| |
31
Name, (Year of Birth), and Address(1) | | Position and Length of Time Served(2) | | Principal Occupation(s)(3) | |
| Kevin Lyons (1955) | | Assistant Secretary since 2003 | | Assistant Vice President, Neuberger, since 2008 and Employee since 1999; formerly, Employee, Management, 1993 to 1999; Assistant Secretary, nine registered investment companies for which Management acts as investment manager and administrator (seven since 2003, one since 2005 and one since 2006). | |
| |
| Owen F. McEntee, Jr. (1961) | | Vice President since 2008 | | Vice President, Neuberger, since 2006; Employee, Management, since 1992; Vice President, nine registered investment companies for which Management acts as investment manager and administrator (nine since 2008). | |
| |
| John M. McGovern (1970) | | Treasurer and Principal Financial and Accounting Officer since 2005 | | Senior Vice President, Neuberger, since 2007; formerly, Vice President, Neuberger, 2004 to 2006; Employee, Management, since 1993; Treasurer and Principal Financial and Accounting Officer, nine registered investment companies for which Management acts as investment manager and administrator (eight since 2005 and one since 2006); formerly, Assistant Treasurer, eight registered investment companies for which Management acts as investment manager and administrator, 2002 to 2005. | |
| |
| Frank Rosato (1971) | | Assistant Treasurer since 2005 | | Vice President, Neuberger, since 2006; Employee, Management, since 1995; Assistant Treasurer, nine registered investment companies for which Management acts as investment manager and administrator (eight since 2005 and one since 2006). | |
| |
| Neil S. Siegel (1967) | | Vice President since 2008 | | Managing Director, Management, since 2008; Managing Director, Neuberger, since 2006; formerly, Senior Vice President, Neuberger, 2004 to 2006; Vice President, nine registered investment companies for which Management acts as investment manager and administrator (nine since 2008). | |
| |
| Chamaine Williams (1971) | | Chief Compliance Officer since 2005 | | Senior Vice President, Neuberger, since 2007; Chief Compliance Officer, Management, since 2006; Chief Compliance Officer, nine registered investment companies for which Management acts as investment manager and administrator (eight since 2005 and one since 2006); formerly, Senior Vice President, LBI, 2007 to 2008; formerly, Vice President, LBI, 2003 to 2006; formerly, Chief Compliance Officer, Lehman Brothers Asset Management Inc., 2003 to 2007; formerly, Chief Compliance Officer, Lehman Brothers Alternative Investment Management LLC, 2003 to 2007. | |
| |
(1) The business address of each listed person is 605 Third Avenue, New York, New York 10158.
(2) Pursuant to the By-Laws of the Trust, each officer elected by the Trustees shall hold office until his or her successor shall have been elected and qualified or until his or her earlier death, inability to serve, or resignation. Officers serve at the pleasure of the Trustees and may be removed at any time with or without cause.
(3) Except as otherwise indicated, each individual has held the positions shown for at least the last five years.
32
Proxy Voting Policies and Procedures
A description of the policies and procedures that the Trust uses to determine how to vote proxies relating to portfolio securities is available, without charge, by calling 1-800-877-9700 (toll-free) and on the website of the Securities and Exchange Commission, at www.sec.gov. Information regarding how the Trust voted proxies relating to portfolio securities during the most recent 12-month period ended June 30 is also available, without charge, by calling 1-800-877-9700 (toll-free), on the website of the Securities and Exchange Commission at www.sec.gov, and on Management's website at www.nb.com.
Quarterly Portfolio Schedule
The Trust files a complete schedule of portfolio holdings for the Fund with the Securities and Exchange Commission for the first and third quarters of each fiscal year on Form N-Q. The Trust's Forms N-Q are available on the Securities and Exchange Commission's website at www.sec.gov and may be reviewed and copied at the Securities and Exchange Commission's Public Reference Room in Washington, DC. Information on the operation of the Public Reference Room may be obtained by calling 1-800-SEC-0330. The information on Form N-Q is available upon request, without charge, by calling 1-800-877-9700 (toll free).
Notice to Shareholders
100.00% of the dividends earned during the fiscal year ended December 31, 2011 qualifies for the dividends received deduction for corporate shareholders.
Board Consideration of the Management and Sub-Advisory Agreements
At a meeting held on October 13, 2011, the Board, including the Trustees who are not "interested persons" of Management (including its affiliates) or Neuberger Berman Advisers Management Trust ("Independent Fund Trustees"), approved the continuance of the Management and Sub-Advisory Agreements ("Agreements") for the Fund.
In evaluating the Agreements, the Board, including the Independent Fund Trustees, reviewed materials furnished by Management and Neuberger in response to questions submitted by counsel for the Independent Fund Trustees, and met with senior representatives of Management and Neuberger regarding their personnel and operations. The Independent Fund Trustees were advised by counsel that is experienced in Investment Company Act of 1940 matters and that is independent of Management and Neuberger. The Independent Fund Trustees received a memorandum from independent counsel discussing the legal standards for their consideration of the proposed continuance of the Agreements. They met with such counsel separately from representatives of Management to discuss the annual contract review. The annual contract review extends over three regular meetings of the Board, including one meeting devoted primarily to reviewing and discussing Fund performance, to ensure that Management and Neuberger have time to respond to any questions the Independent Fund Trustees may have on their initial review of the report and that the Independent Fund Trustees have time to consider those responses.
The Board considered the following factors, among others, in connection with its approval of the continuance of the Agreements: (1) the nature, extent, and quality of the services provided by Management and Neuberger; (2) the performance of the Fund compared to a relevant market index and a peer group of investment companies; (3) the costs of the services provided and profits or losses realized by Management and its affiliates from their relationship with the Fund; (4) the extent to which economies of scale might be realized as the Fund grows; and (5) whether fee levels reflect any such potential economies of scale for the benefit of investors in the Fund. In their deliberations, the Board members did not identify any particular information that was all-important or controlling, and each Trustee may have attributed different weights to the various factors.
The Board evaluated the terms of the Agreements, the overall fairness of the Agreements to the Fund and whether the Agreements were in the best interests of the Fund and its shareholders.
33
With respect to the nature, extent and quality of the services provided, the Board considered the performance of the Fund and the experience and staffing of the portfolio management and investment research personnel of Management and Neuberger who perform services for the Fund. The Board noted that Management also provides certain administrative services, including fund accounting and compliance oversight. The Board also considered Management's and Neuberger's policies and practices regarding brokerage and the allocation of portfolio transactions. The Board's Portfolio Transactions and Pricing Committee from time to time reviewed the quality of the execution services that Management and Neuberger had provided, and periodically reviews studies by an independent firm engaged to review and evaluate the quality of brokerage execution received by the Fund. The Board also reviewed whether Management and Neuberger used brokers to execute Fund transactions that provide research and other services to Management and Neuberger, and the types of benefits potentially derived from such services by Management, Neuberger, the Fund and other clients of Management and Neuberger. In addition, the Board noted the positive compliance history of Management and Neuberger, as each firm has been free of significant reported compliance problems.
The Board considered the performance of the Fund relative to its benchmark and the average performance of a composite peer group of investment companies dedicated to insurance products pursuing broadly similar strategies. The Board also reviewed performance in relation to certain measures of the degree of investment risk undertaken by the portfolio managers, during the period. The Board also considered Management's resources and responsiveness with respect to the Fund.
With respect to the overall fairness of the Agreements, the Board considered the fee structure for the Fund under the Agreements as compared to a peer group of comparable funds and any fall-out benefits likely to accrue to Management or Neuberger or their affiliates from their relationship with the Fund. The Board also considered the profitability of Management and its affiliates from their association with the Fund.
The Board reviewed a comparison of the Fund's management fee and overall expense ratio to a peer group of broadly comparable funds. The Board considered the mean and median of the management fees and expense ratios of the peer group. The Board noted that the Fund's management fee was higher than the peer group mean and median. The Board considered whether specific administration needs contributed to the management fee. With regard to the sub-advisory fee paid to Neuberger, the Board noted that this fee is "at cost." In addition, the Board considered the contractual limit on Fund expenses undertaken by Management.
The Board considered whether there were other funds that were advised or sub-advised by Management or its affiliates or separate accounts managed by Management or its affiliates with similar investment objectives, policies and strategies to the Fund. The Board compared the fees charged to the Fund to the fees charged to a registered fund, a sub-advised fund and a separate account, each managed by Management in a similar style to the Fund. The Board considered the appropriateness and reasonableness of any differences between the fees charged to the Fund and the other funds and account and determined that the differences in fees were consistent with the management and other services provided.
The Board also evaluated any apparent or anticipated economies of scale in relation to the services Management provides to the Fund. The Board considered whether the Fund's fee structure provides for a reduction of payments resulting from the use of breakpoints and whether those breakpoints are set at appropriate asset levels. In concluding that the benefits accruing to Management and its affiliates by virtue of their relationship to the Fund were reasonable in comparison with the costs of providing the investment advisory services and the benefits accruing to the Fund, the Board reviewed specific data as to Management's profit on the Fund for a recent period and the trend in profit or loss over recent years. The Board also carefully examined Management's cost allocation methodology. The Board recognized that Management should be entitled to earn a reasonable level of profits for services it provides to the Fund and, based on its review, concluded that Management's level of profitability was not excessive.
34
Conclusions
In approving the Agreements, the Board concluded that the terms of each Agreement are fair and reasonable and that approval of the Agreements is in the best interests of the Fund and its shareholders. In reaching this determination, the Board considered that Management and Neuberger could be expected to provide a high level of service to the Fund; that the performance of the Fund was satisfactory over time; that the Fund's fee structure appeared to the Board to be reasonable given the nature and quality of services provided; and that the benefits accruing to Management and its affiliates by virtue of their relationship to the Fund were reasonable in comparison with the benefits accruing to the Fund.
35

Neuberger Berman
Advisers Management Trust
Short Duration Bond Portfolio
I Class Shares
Annual Report
December 31, 2011
B1011 02/12
Short Duration Bond Portfolio Commentary (Unaudited)
The Neuberger Berman Advisers Management Trust (AMT) Short Duration Bond Portfolio Class I posted a 0.29% total return for the fiscal year ended December 31, 2011, underperforming its benchmark, the Barclays Capital 1-3 Year U.S. Government/Credit Index, which returned 1.59% for the same period.
The fixed income market experienced periods of heightened volatility during the year, as a number of macro issues fueled a "risk-on, risk-off" mentality among investors. Daily headlines often trumped underlying fundamentals, as investors attempted to keep up with an array of issues and headlines. These included the Arab Spring, devastating natural disasters, the ongoing European sovereign debt crisis, global economic concerns and the contentious debt ceiling debate and subsequent Standard & Poor's downgrade of U.S. Treasuries.
After generating relatively solid results during the first quarter of 2011, non-Treasury sectors performed poorly over the next two quarters. During that time, investor risk aversion increased and there were several extreme flights to quality given concerns over a double-dip recession and the fears of contagion from the European sovereign debt crisis. The year ended on a positive note for non-Treasuries, however, as risk aversion was often replaced with an increase in risk appetite during the fourth quarter. The change in investor sentiment was triggered by economic data that was often better than expected and hopes of progress in the ongoing European sovereign debt crisis. All told, non-Treasuries generated positive absolute returns in 2011, but most sectors lagged equal-duration Treasuries.
Throughout the reporting period, the Portfolio maintained an overweight to non-Treasuries compared to the benchmark. While this was beneficial at times, overall it negatively impacted performance. In particular, our allocations to non-agency mortgage-backed securities (MBS), asset-backed securities (ABS) and investment grade corporate bonds were not rewarded. On the upside, our exposure to commercial mortgage-backed securities (CMBS) contributed positively to performance. Elsewhere, our yield curve positioning enhanced the Portfolio's results, as our exposure to the two-year and longer portion of the yield curve performed well during the fiscal year. This more than offset the negative impact of the Portfolio's overall defensive duration posture.
A number of adjustments were made to the Portfolio during the reporting period. We significantly reduced our allocation to Treasuries in order to increase our exposures to investment grade corporate bonds, agency MBS, ABS and CMBS. We maintained the Portfolio's defensive duration posture as we felt that interest rates were unsustainably low. Treasury futures were used to assist in managing our duration positioning.
We anticipate U.S. growth to remain modest but generally positive in 2012, as the economy adjusts to tighter fiscal conditions. Accommodative monetary conditions, ample liquidity and stronger balance sheets for both consumers and corporations should, in our view, provide an improved environment for consumer spending and, thus, U.S. growth. We are generally positive on the outlook for non-Treasury sectors in 2012. While the near-term outlook is cloudy, we feel the intermediate- to longer-term picture remains bright. Near-term, a number of macro factors could overshadow generally strong fundamentals which typically drive the performance of non-Treasuries. When some of the uncertainties regarding the macro headwinds lift, investor sentiment could improve, providing a tailwind for these sectors. In addition, the combination of positive economic growth and relatively benign inflation could support a tightening in the spreads in yield between Treasuries and other fixed income investments in 2012.
Sincerely,
Thomas Sontag, Michael Foster and Richard Grau
Portfolio Co-Managers
Information about the principal risks of investing in the Portfolio is set forth in the prospectus and statement of additional information.
The composition, industries and holdings of the Portfolio are subject to change.
1
Short Duration Bond Portfolio (Unaudited)
PORTFOLIO BY TYPE OF SECURITY
| (as a % of Total Net Assets) | |
| Asset-Backed Securities | | | 14.8 | % | |
| Corporate Debt Securities | | | 35.2 | | |
| Mortgage-Backed Securities | | | 42.7 | | |
| U.S. Government Agency Securities | | | 4.9 | | |
| U.S. Treasury Securities | | | 0.2 | | |
| Short-Term Investments | | | 2.0 | | |
| Cash, receivables and other assets, less liabilities | | | 0.2 | | |
| Total | | | 100.0 | % | |
PERFORMANCE HIGHLIGHTS1
| | | | | Average Annual Total Return Ended 12/31/2011 | |
| | | Inception Date | | 1 Year | | 5 Years | | 10 Years | | Life of Fund* | |
Short Duration Bond Portfolio Class I | | | 09/10/1984 | | | | 0.29 | % | | | 1.65 | % | | | 2.24 | % | | | 5.54 | % | |
Barclays Capital 1-3 Year U.S. Government/Credit Index2 | | | | | 1.59 | % | | | 3.99 | % | | | 3.63 | % | | | 6.36 | % | |
Performance data quoted represent past performance and do not indicate future results. The investment return and principal value of an investment will fluctuate so that an investor's shares, when redeemed, may be worth more or less than their original cost. Results are shown on a "total return" basis and include reinvestment of all income dividends and distributions.
Current performance may be lower or higher than the performance data quoted. For performance data current to the most recent month end, please visit https://www.nb.com.
* Index returns are as of the inception date 09/10/1984.
As stated in the Portfolio's most recent prospectus, the total annual operating expense ratio for fiscal year 2010 was 0.81% for Class I shares (prior to any fee waivers and/or expense reimbursements, if any). Neuberger Berman Management LLC has contractually agreed to limit certain expenses of the Portfolio through 12/31/2014.
The results shown in the table do not reflect the effect of taxes an investor would pay on Portfolio distributions or on the redemption of Portfolio shares.
COMPARISON OF A $10,000 INVESTMENT
This graph shows the change in value of a hypothetical $10,000 investment in the Portfolio over the past 10 fiscal years, or since the Portfolio's inception if it has not operated for 10 years. The result is compared with benchmarks, which include a broad-based market index and may include a more narrowly based index. Market indices have not been reduced to reflect any of the fees and costs of investing. All results include the reinvestment of income dividends and distributions. The results shown in the graph do not reflect the effect of taxes an investor would pay on Portfolio distributions or on the redemption of Portfolio shares. Results represent past performance and do not indicate future results
Please see Endnotes for additional information.
2
Endnotes (Unaudited)
1 "Total Return" includes reinvestment of all income dividends and distributions. Results represent past performance and do not indicate future results. The value of an investment in the Portfolio and the return on the investment both will fluctuate, and redemption proceeds may be higher or lower than an investor's original cost. The performance information does not reflect fees and expenses of the variable annuity and variable life insurance policies or the qualified pension and retirement plans whose proceeds are invested in the Portfolio. Neuberger Berman Management LLC ("NBM LLC") has agreed to absorb certain expenses of the AMT Portfolios, including the Portfolio. Without this arrangement, which is subject to change, the total returns of the Portfolio may have been less.
2 The Barclays Capital 1-3 Year U.S. Government/Credit Index is an unmanaged index that includes all bonds in the U.S. Government/Credit Index with at least one to three years to maturity. The U.S. Government/Credit Index includes all securities in the Government and Credit Indices. The Government Index includes Treasuries (i.e., public obligations of the U.S. Treasury that have remaining maturities of more than one year) and agencies (i.e., publicly issued debt of U.S. Government agencies, quasi-federal corporations, and corporate or foreign debt guaranteed by the U.S. Government). The Credit Index includes publicly issued U.S. corporate and foreign debentures and secured notes that meet specified maturity, liquidity, and quality requirements. All bonds in the index must meet the following additional criteria: must have at least one year to final maturity regardless of call features; must have at least $250 million par amount outstanding; must be rated investment-grade (Baa3/BBB- or higher) by at least two of the following ratings agencies: Standard & Poor's, Moody's Investors Services, Inc., and Fitch, Inc.; must be fixed rate; must be dollar-denominated and non-convertible; and must be publicly issued. Please note that indices do not take into account any fees and expenses of investing in the individual securities that they track and that individuals cannot invest directly in any index. Data about the performance of this index is prepared or obtained by NBM LLC and include reinvestment of all income dividends and distributions. The Portfolio may invest in securities not included in the above-described index and may not invest in all securities included in the above-described index.
Any ratios or other measurements using a factor of forecasted earnings of a company discussed herein are based on consensus estimates, not NBM LLC's own projections, and they may or may not be realized. In addition, any revision to a forecast could affect the market price of a security. By quoting them herein, NBM LLC does not offer an opinion as to the accuracy of and does not guarantee these forecasted numbers.
The investments for the Portfolio are managed by the same portfolio manager(s) who manage(s) one or more other registered funds that have similar names, investment objectives and investment styles as the Portfolio. You should be aware that the Portfolio is likely to differ from the other mutual funds in size, cash flow pattern and tax matters. Accordingly, the holdings and performance can be expected to vary from those of the other mutual funds.
The composition, industries and holdings of the Portfolio are subject to change.
Shares of the separate AMT Portfolios are not available to the general public. Shares of this Portfolio may be purchased only by life insurance companies to be used in their separate accounts that fund variable annuity and variable life insurance policies and by qualified pension and retirement plans.
Statistics and projections in this report are derived from sources deemed to be reliable but cannot be regarded as a representation of future results of the AMT Portfolios. This report is prepared for the general information of shareholders and is not an offer of shares of the AMT Portfolios. Shares of the AMT Portfolios are sold only through the currently effective prospectuses, which must precede or accompany this report.
The "Neuberger Berman" name and logo are registered service marks of Neuberger Berman Group LLC. "Neuberger Berman Management LLC" and the individual Fund names in this piece are either service marks or registered service marks of Neuberger Berman Management LLC.
© 2012 Neuberger Berman Management LLC distributor. All rights reserved.
3
Information About Your Fund's Expenses (Unaudited)
This table is designed to provide information regarding costs related to your investments. All mutual funds incur operating expenses, which include management fees, fees for administrative services and costs of shareholder reports, among others. The following examples are based on an investment of $1,000 made at the beginning of the six month period ended December 31, 2011 and held for the entire period. The table illustrates the fund's costs in two ways:
| Actual Expenses and Performance: | | The first section of the table provides information about actual account values and actual expenses in dollars, based on the fund's actual performance during the period. You may use the information in this line, together with the amount you invested, to estimate the expenses you paid over the period. Simply divide your account value by $1,000 (for example, an $8,600 account value divided by $1,000 = 8.6), then multiply the result by the number in the first section of the table under the heading entitled "Expenses Paid During the Period" to estimate the expenses you paid over the period. | |
| |
Hypothetical Example for Comparison Purposes: | | The second section of the table provides information about hypothetical account values and hypothetical expenses based on the fund's actual expense ratio and an assumed rate of return at 5% per year before expenses. This return is not the fund's actual return. The hypothetical account values and expenses may not be used to estimate the actual ending account balance or expenses you paid for the period. You may use this information to compare the ongoing costs of investing in this fund versus other funds. To do so, compare the expenses shown in this 5% hypothetical example with the 5% hypothetical examples that appear in the shareholder reports of other funds. | |
| |
Please note that the expenses in the table are meant to highlight your ongoing costs only. The table and expense example do not include any transaction costs, such as fees and expenses that are, or may be, imposed under your variable contract or qualified pension plan. Therefore, the information under the heading "Hypothetical (5% annual return before expenses)" is useful in comparing ongoing costs only, and will not help you determine the relative total costs of owning different funds. In addition, if these transaction costs were included, your costs would have been higher.
Expense Information as of 12/31/11
NEUBERGER BERMAN ADVISERS MANAGEMENT TRUST SHORT DURATION BOND PORTFOLIO
| Actual | | Beginning Account Value 7/1/11 | | Ending Account Value 12/31/11 | | Expenses Paid During the Period* 7/1/11 – 12/31/11 | |
| Class I | | $ | 1,000.00 | | | $ | 991.40 | | | $ | 4.07 | | |
| Hypothetical (5% annual return before expenses)** | |
| Class I | | $ | 1,000.00 | | | $ | 1,021.12 | | | $ | 4.13 | | |
* Expenses are equal to the annualized expense ratio of .81%, multiplied by the average account value over the period, multiplied by 184/365 (to reflect the one-half year period shown).
** Hypothetical 5% annual return before expenses is calculated by multiplying the number of days in the most recent half year divided by 365.
4
Schedule of Investments Short Duration Bond Portfolio
| PRINCIPAL AMOUNT | | | | VALUE† | |
| U.S. Treasury Securities-Backed by the Full Faith and Credit of the U.S. Government (0.2%) | | | |
| $ | 500,000 | | | U.S. Treasury Notes, 2.13%, due 11/30/14 (Cost $524,339) | | $ | 525,156 | | |
| U.S. Government Agency Securities (4.9%) | | | |
| | 8,500,000 | | | Citigroup Funding, Inc., Guaranteed FDIC Floating Rate Medium-Term Notes, 0.88%, due 3/30/12 | | | 8,502,193 | µ@ | |
| | 3,450,000 | | | Wells Fargo & Co., Guaranteed FDIC Floating Rate Notes, 0.77%, due 6/15/12 | | | 3,458,387 | µ@ | |
| | | | | Total U.S. Government Agency Securities (Cost $11,950,000) | | | 11,960,580 | | |
| Mortgage-Backed Securities (42.7%) | | | |
| Adjustable Alt-B Mixed Balance (0.4%) | | | |
| | 1,275,044 | | | Lehman XS Trust, Floating Rate, Ser. 2005-1, Class 2A1, 1.76%, due 7/25/35 | | | 918,806 | µ | |
| Adjustable Jumbo Balance (7.9%) | | | |
| | 3,427,574 | | | GMAC Mortgage Corp. Loan Trust, Ser. 2006-AR1, Class 1A1, 3.03%, due 4/19/36 | | | 2,341,038 | µ | |
| | 2,720,302 | | | Merrill Lynch Mortgage Investors Trust, Ser. 2005-A1, Class 2A1, 2.60%, due 12/25/34 | | | 2,590,195 | µ | |
| | 18,000,000 | | | Wells Fargo Mortgage Backed Securities Trust, Ser. 2005-AR16, Class 4A2, 2.72%, due 10/25/35 | | | 14,405,922 | µ | |
| | | | 19,337,155 | | |
| Adjustable Mixed Balance (2.3%) | | | |
| | 3,295,161 | | | Countrywide Home Loan Mortgage Pass-Through Trust, Ser. 2006-HYB5, Class 2A1, 2.77%, due 9/20/36 | | | 1,648,154 | µ | |
| | 2,208,475 | | | Credit Suisse First Boston Mortgage Securities Corp., Ser. 2004-AR4, Class 2A1, 2.70%, due 5/25/34 | | | 1,733,540 | µ | |
| | 2,632,596 | | | First Horizon Mortgage Pass-Through Trust, Ser. 2005-AR5, Class 2A1, 2.62%, due 11/25/35 | | | 1,938,544 | µ | |
| | 526,036 | | | Harborview Mortgage Loan Trust, Ser. 2004-4, Class 3A, 1.02%, due 6/19/34 | | | 386,818 | µ | |
| | | | 5,707,056 | | |
| Commercial Mortgage-Backed (21.9%) | | | |
| | 6,294,094 | | | Bear Stearns Commercial Mortgage Securities, Inc., Ser. 2005-PWR8, Class AAB, 4.58%, due 6/11/41 | | | 6,442,804 | | |
| | 2,450,000 | | | Citigroup Commercial Mortgage Trust, Ser. 2006-C4, Class A2, 5.92%, due 3/15/49 | | | 2,577,603 | µ | |
| | 663,438 | | | Citigroup/Deutsche Bank Commercial Mortgage Trust, Ser. 2006-CD2, Class AAB, 5.53%, due 1/15/46 | | | 685,201 | µ | |
| | 4,650,000 | | | Commercial Mortgage Pass-Through Certificates, Ser. 2003-LB1A, Class C, 4.23%, due 6/10/38 | | | 4,662,746 | | |
| | 2,808,021 | | | GMAC Commercial Mortgage Securities, Inc., Ser. 2004-C3, Class AAB, 4.70%, due 12/10/41 | | | 2,905,757 | | |
| | 4,895,558 | | | JP Morgan Chase Commercial Mortgage Securities Corp., Ser. 2011-C3, Class A1, 1.87%, due 2/15/46 | | | 4,908,761 | ñ | |
| | 4,225,000 | | | LB-UBS Commercial Mortgage Trust, Ser. 2003-C7, Class C, 5.19%, due 7/15/37 | | | 4,327,545 | µ | |
| | 2,959,434 | | | Morgan Stanley Capital I, Ser. 2011-C1, Class A1, 2.60%, due 9/15/47 | | | 3,003,453 | ñ | |
| | 5,342,259 | | | Morgan Stanley Capital I, Ser. 2011-C3, Class A1, 2.18%, due 7/15/49 | | | 5,390,131 | | |
| | 1,999,000 | | | Prudential Commercial Mortgage Trust, Ser. 2003-PWR1, Class A2, 4.49%, due 2/11/36 | | | 2,050,948 | | |
| | 7,250,000 | | | Wachovia Bank Commercial Mortgage Trust, Ser. 2003-C6, Class D, 5.13%, due 8/15/35 | | | 7,499,001 | µ | |
| | 1,661,354 | | | Wachovia Bank Commercial Mortgage Trust, Ser. 2003-C7, Class A1, 4.24%, due 10/15/35 | | | 1,671,745 | ñ | |
| | 4,220,000 | | | Wachovia Bank Commercial Mortgage Trust, Ser. 2005-C22, Class A3, 5.46%, due 12/15/44 | | | 4,299,906 | µ | |
| | 3,339,769 | | | WF-RBS Commercial Mortgage Trust, Ser. 2011-C2, Class A1, 2.50%, due 2/15/44 | | | 3,401,194 | ñ | |
| | | | 53,826,795 | | |
See Notes to Schedule of Investments
5
| PRINCIPAL AMOUNT | | | | VALUE† | |
| Mortgage-Backed Non-Agency (2.0%) | | | |
| $ | 1,148,334 | | | Countrywide Home Loans, Ser. 2005-R2, Class 2A4, 8.50%, due 6/25/35 | | $ | 1,181,758 | ñ | |
| | 2,925,119 | | | GSMPS Mortgage Loan Trust, Ser. 2005-RP2, Class 1A4, 8.50%, due 3/25/35 | | | 3,047,238 | ñ | |
| | 586,629 | | | GSMPS Mortgage Loan Trust, Ser. 2005-RP3, Class 1A4, 8.50%, due 9/25/35 | | | 612,664 | ñ | |
| | | | 4,841,660 | | |
| Fannie Mae (3.9%) | | | |
| | 761,827 | | | Fannie Mae Grantor Trust, Ser. 2003-T4, Class 1A, 0.51%, due 9/26/33 | | | 751,410 | µ | |
| | 7,049,457 | | | Pass-Through Certificates, 4.50%, due 5/1/41 | | | 7,507,530 | | |
| | 1,191,341 | | | Whole Loan, Ser. 2004-W8, Class PT, 11.19%, due 6/25/44 | | | 1,337,642 | µ | |
| | | | 9,596,582 | | |
| Freddie Mac (4.3%) | | | |
| | 9,430 | | | Pass-Through Certificates, 10.00%, due 4/1/20 | | | 9,460 | | |
| | 1,655,786 | | | Pass-Through Certificates, 8.00%, due 11/1/26 | | | 1,956,195 | | |
| | 1,126,940 | | | Pass-Through Certificates, 8.50%, due 10/1/30 | | | 1,343,407 | | |
| | 6,957,502 | | | Pass-Through Certificates, 4.50%, due 11/1/39 | | | 7,378,845 | | |
| | | | 10,687,907 | | |
| | | | | Total Mortgage-Backed Securities (Cost $112,520,867) | | | 104,915,961 | | |
| Corporate Debt Securities (35.2%) | | | |
| Banks (11.3%) | | | |
| | 5,700,000 | | | Citigroup, Inc., Senior Unsecured Notes, 6.00%, due 12/13/13 | | | 5,898,126 | Ø | |
| | 4,250,000 | | | Goldman Sachs Group, Inc., Senior Unsecured Notes, 5.25%, due 10/15/13 | | | 4,336,420 | | |
| | 6,500,000 | | | JP Morgan Chase & Co., Senior Unsecured Medium-Term Notes, 2.05%, due 1/24/14 | | | 6,504,914 | Ø | |
| | 5,200,000 | | | Morgan Stanley, Senior Unsecured Notes, 2.88%, due 1/24/14 | | | 4,980,518 | | |
| | 6,000,000 | | | Westpac Banking Corp., Senior Unsecured Notes, 1.85%, due 12/9/13 | | | 6,005,526 | | |
| | | | 27,725,504 | | |
| Beverages (1.7%) | | | |
| | 3,350,000 | | | Anheuser-Busch Cos., Inc., Guaranteed Unsecured Notes, 4.95%, due 1/15/14 | | | 3,610,315 | | |
| | 475,000 | | | Anheuser-Busch Inbev Worldwide, Inc., Guaranteed Notes, 1.50%, due 7/14/14 | | | 478,395 | | |
| | | | 4,088,710 | | |
| Computers (2.1%) | | | |
| | 5,050,000 | | | IBM Corp., Senior Unsecured Notes, 0.88%, due 10/31/14 | | | 5,051,818 | | |
| Diversified Financial Services (8.4%) | | | |
| | 4,240,000 | | | American Express Credit Corp., Senior Unsecured Medium-Term Notes, Ser. C, 5.88%, due 5/2/13 | | | 4,456,897 | | |
| | 2,165,000 | | | Caterpillar Financial Services Corp., Senior Unsecured Notes, 1.65%, due 4/1/14 | | | 2,194,078 | | |
| | 875,000 | | | Caterpillar Financial Services Corp., Senior Unsecured Medium-Term Notes, 1.13%, due 12/15/14 | | | 876,088 | | |
| | 1,760,000 | | | ERAC USA Finance Co., Guaranteed Notes, 2.25%, due 1/10/14 | | | 1,752,700 | ñ | |
| | 6,500,000 | | | General Electric Capital Corp., Senior Unsecured Notes, 5.90%, due 5/13/14 | | | 7,118,488 | | |
| | 4,075,000 | | | Merrill Lynch & Co., Inc., Senior Unsecured Medium-Term Notes, Ser. C, 6.05%, due 8/15/12 | | | 4,133,847 | | |
| | | | 20,532,098 | | |
| Food (0.7%) | | | |
| | 1,720,000 | | | Kraft Foods, Inc., Senior Unsecured Notes, 6.25%, due 6/1/12 | | | 1,757,465 | | |
| Insurance (0.5%) | | | |
| | 1,310,000 | | | Berkshire Hathaway Finance Corp., Guaranteed Notes, 1.50%, due 1/10/14 | | | 1,324,567 | | |
See Notes to Schedule of Investments
6
| PRINCIPAL AMOUNT | | | | VALUE† | |
| Media (4.6%) | | | |
| $ | 3,250,000 | | | DIRECTTV Holdings LLC, Guaranteed Notes, 4.75%, due 10/1/14 | | $ | 3,510,536 | | |
| | 3,430,000 | | | NBC Universal Media LLC, Senior Unsecured Notes, 2.10%, due 4/1/14 | | | 3,486,509 | | |
| | 4,240,000 | | | Time Warner Cable, Inc., Guaranteed Notes, 5.40%, due 7/2/12 | | | 4,335,604 | | |
| | | | 11,332,649 | | |
| Mining (0.5%) | | | |
| | 1,280,000 | | | BHP Billiton Finance USA Ltd., Guaranteed Notes, 1.13%, due 11/21/14 | | | 1,283,004 | | |
| Office-Business Equipment (1.2%) | | | |
| | 2,990,000 | | | Xerox Corp., Senior Unsecured Notes, 5.50%, due 5/15/12 | | | 3,039,577 | | |
| Retail (1.4%) | | | |
| | 3,100,000 | | | Home Depot, Inc., Senior Unsecured Notes, 5.25%, due 12/16/13 | | | 3,366,309 | | |
| Telecommunications (2.8%) | | | |
| | 3,495,000 | | | Telefonica Emisiones SAU, Guaranteed Notes, 2.58%, due 4/26/13 | | | 3,410,411 | | |
| | 3,380,000 | | | Verizon Communications, Inc., Senior Unsecured Notes, 1.95%, due 3/28/14 | | | 3,449,817 | | |
| | | | 6,860,228 | | |
| | | | | Total Corporate Debt Securities (Cost $86,201,324) | | | 86,361,929 | | |
| Asset-Backed Securities (14.8%) | | | |
| | 1,938,471 | | | ACE Securities Corp. Home Equity Loan Trust, Ser. 2006-OP1, Class A2C, 0.44%, due 4/25/36 | | | 1,297,738 | µ | |
| | 2,387,169 | | | ACE Securities Corp. Home Equity Loan Trust, Ser. 2006-ASP5, Class A2B, 0.42%, due 10/25/36 | | | 921,225 | µ | |
| | 3,425,000 | | | Ally Auto Receivables Trust, Ser. 2010-4, Class A3, 0.91%, due 11/17/14 | | | 3,428,220 | | |
| | 3,300,000 | | | Ally Auto Receivables Trust, Ser. 2011-1, Class A3, 1.38%, due 1/15/15 | | | 3,320,778 | | |
| | 1,753,000 | | | Bear Stearns Asset Backed Securities Trust, Ser. 2006-HE9, Class 1A2, 0.44%, due 11/25/36 | | | 710,989 | µ | |
| | 2,038,076 | | | Carrington Mortgage Loan Trust, Ser. 2006-OPT1, Class A3, 0.47%, due 2/25/36 | | | 1,531,938 | µ | |
| | 4,000,000 | | | Carrington Mortgage Loan Trust, Ser. 2007-FRE1, Class A3, 0.55%, due 2/25/37 | | | 1,363,808 | µ | |
| | 1,732,385 | | | Countrywide Asset-Backed Certificates Trust, Ser. 2006-3, Class 2A2, 0.47%, due 6/25/36 | | | 1,365,766 | µ | |
| | 1,092,509 | | | Countrywide Asset-Backed Certificates Trust, Ser. 2006-5, Class 2A2, 0.47%, due 8/25/36 | | | 886,175 | µ | |
| | 1,897,316 | | | Countrywide Asset-Backed Certificates Trust, Ser. 2006-6, Class 2A2, 0.47%, due 9/25/36 | | | 1,490,324 | µ | |
| | 8,325,000 | | | Ford Credit Auto Owner Trust, Ser. 2011-A, Class A3, 0.97%, due 1/15/15 | | | 8,342,503 | | |
| | 5,885,000 | | | Hyundai Auto Receivables Trust, Ser. 2011-A, Class A3, 1.16%, due 4/15/15 | | | 5,903,854 | | |
| | 42,584 | | | Impac Secured Assets Corp., Ser. 2006-3, Class A4, 0.38%, due 11/25/36 | | | 41,948 | µ | |
| | 2,042,761 | | | Knollwood CDO Ltd., Ser. 2006-2A, Class A2J, 0.82%, due 7/13/46 | | | 0 | #µ* | |
| | 1,900,000 | | | Mercedes-Benz Auto Receivables Trust, Ser. 2011-1, Class A3, 0.85%, due 3/16/15 | | | 1,901,480 | | |
| | 3,279 | | | Merrill Lynch Mortgage Investors Trust, Ser. 2006-MLN1, Class A2A, 0.36%, due 7/25/37 | | | 3,238 | µ | |
| | 1,625,955 | | | Residential Asset Mortgage Products, Inc., Ser. 2006-RS1, Class AI2, 0.52%, due 1/25/36 | | | 1,133,581 | µ | |
| | 4,651,033 | | | Soundview Home Equity Loan Trust, Ser. 2006-OPT3, Class 2A3, 0.46%, due 6/25/36 | | | 2,845,837 | µ | |
| | | | | Total Asset-Backed Securities (Cost $46,840,901) | | | 36,489,402 | | |
| NUMBER OF SHARES | | | | | |
| Short-Term Investments (2.0%) | | | |
| | 4,850,417 | | | State Street Institutional Liquid Reserves Fund Institutional Class (Cost $4,850,417) | | | 4,850,417 | | |
| | | | | Total Investments (99.8%) (Cost $262,887,848) | | | 245,103,445 | ## | |
| | | | | Cash, receivables and other assets, less liabilities (0.2%) | | | 461,311 | | |
| | | | | Total Net Assets (100.0%) | | $ | 245,564,756 | | |
See Notes to Schedule of Investments
7
Notes to Schedule of Investments Short Duration Bond Portfolio
† In accordance with Accounting Standards Codification ("ASC") 820 "Fair Value Measurements and Disclosures" ("ASC 820"), all investments held by Neuberger Berman Advisers Management Trust Short Duration Bond Portfolio (the "Fund") are carried at the value that Neuberger Berman Management LLC ("Management") believes the Fund would receive upon selling an investment in an orderly transaction to an independent buyer in the principal or most advantageous market for the investment under current market conditions. Various inputs, including the volume and level of activity for the asset or liability in the market, are considered in valuing the Fund's investments, some of which are discussed below. Significant management judgment may be necessary to value investments in accordance with ASC 820.
ASC 820 established a three-tier hierarchy of inputs to create a classification of value measurements for disclosure purposes. The three-tier hierarchy of inputs is summarized in the three broad Levels listed below.
• Level 1 – quoted prices in active markets for identical investments
• Level 2 – other significant observable inputs (including quoted prices for similar investments, interest rates, prepayment speeds, credit risk, amortized cost, etc.)
• Level 3 – significant unobservable inputs (including the Fund's own assumptions in determining the fair value of investments)
The inputs or methodology used for valuing an investment are not necessarily an indication of the risk associated with investing in those securities.
The value of the Fund's investments in debt securities is determined by Management primarily by obtaining valuations from independent pricing services based on readily available bid quotations, or if quotations are not available, by methods which include various considerations based on security type (generally Level 2 inputs). In addition to the consideration of yields or prices of securities of comparable quality, coupon, maturity and type; indications as to values from dealers; and general market conditions, the following is a description of other Level 2 inputs and related valuation techniques used by an independent pricing service to value certain types of debt securities of the Fund:
Corporate Debt Securities. Inputs used to value corporate debt securities generally include relative credit information, observed market movements, sector news, spread to the U.S. Treasury market, and other market information which may include benchmark yields, reported trades, broker-dealer quotes, issuer spreads, benchmark securities, bids, offers, and reference data, such as market research publications, when available ("Other Market Information").
U.S. Treasury Securities. Inputs used to value U.S. Treasury securities generally include quotes from several inter-dealer brokers and Other Market Information.
Asset-Backed Securities and Mortgage-Backed Securities. Inputs used to value asset-backed securities and mortgage-backed securities generally include models that consider a number of factors, which may include the following: prepayment speeds, cash flows, spread adjustments and Other Market Information.
High Yield Securities. Inputs used to value high yield securities generally include a number of observations of equity and credit default swap curves related to the issuer and Other Market Information.
Financial futures contracts are determined by obtaining valuations from independent pricing services at the settlement price at the market close (Level 1 inputs).
Management has developed a process to periodically review information provided by independent pricing services for all types of securities.
See Notes to Financial Statements
8
Notes to Schedule of Investments Short Duration Bond Portfolio (cont'd)
Investments in State Street Institutional Liquid Reserves Fund Institutional Class are valued using the fund's daily calculated net asset value per share (Level 2 inputs).
If a valuation is not available from an independent pricing service, or if Management has reason to believe that the valuation received does not represent the amount the Fund might reasonably expect to receive on a current sale in an orderly transaction, the Fund seeks to obtain quotations from principal market makers (generally considered Level 3 inputs). If such quotations are not readily available, the security is valued using methods the Neuberger Berman Advisers Management Trust's Board of Trustees (the "Board") has approved on the belief that they reflect fair value. Numerous factors may be considered when determining the fair value of a security based on Level 2 or 3 inputs, including available analyst, media or other reports, trading in futures or ADRs and whether the issuer of the security being fair valued has other securities outstanding.
Fair value prices are necessarily estimates, and there is no assurance that such a price will be at or close to the price at which the security is next quoted or next trades.
The following is a summary, categorized by Level, of inputs used to value the Fund's investments as of December 31, 2011:
| Asset Valuation Inputs | | Level 1 | | Level 2 | | Level 3§ | | Total | |
| Investments: | |
U.S. Treasury Securities-Backed by the Full Faith and Credit of the U.S. Government | | $ | — | | | $ | 525,156 | | | $ | — | | | $ | 525,156 | | |
| U.S. Government Agency Securities | | | — | | | | 11,960,580 | | | | — | | | | 11,960,580 | | |
| Mortgage-Backed Securities^ | | | — | | | | 104,915,961 | | | | — | | | | 104,915,961 | | |
| Corporate Debt Securities^ | | | — | | | | 86,361,929 | | | | — | | | | 86,361,929 | | |
| Asset-Backed Securities | | | — | | | | 36,489,402 | | | | 0 | | | | 36,489,402 | | |
| Short-Term Investments | | | — | | | | 4,850,417 | | | | — | | | | 4,850,417 | | |
| Total Investments | | $ | — | | | $ | 245,103,445 | | | $ | 0 | | | $ | 245,103,445 | | |
^ The Schedule of Investments provides information on the industry categorization for the portfolio.
§ The following is a reconciliation between the beginning and ending balances of investments in which significant unobservable inputs (Level 3) were used in determining value:
Investments in Securities: | | Beginning balance, as of 1/1/11 | | Accrued discounts/ (premiums) | | Realized gain/loss and change in unrealized appreciation/ (depreciation) | | Purchases | | Sales | | Transfers in to Level 3 | | Transfers out of Level 3 | | Balance, as of 12/31/11 | | Net change in unrealized appreciation/ (depreciation) from investments still held as of 12/31/11 | |
Asset-Backed Securities | | $ | 0 | | | $ | — | | | $ | — | | | $ | — | | | $ | — | | | $ | — | | | $ | — | | | $ | 0 | | | $ | — | | |
The Fund had no significant transfers between Levels 1 and 2 during the year ended December 31, 2011.
See Notes to Financial Statements
9
Notes to Schedule of Investments Short Duration Bond Portfolio (cont'd)
The following is a summary, categorized by Level, of inputs used to value the Fund's derivatives as of December 31, 2011:
| | | Level 1 | | Level 2 | | Level 3 | | Total | |
| Futures Contracts | | $ | 2,109 | | | $ | — | | | $ | — | | | $ | 2,109 | | |
## At December 31, 2011, the cost of investments for U.S. federal income tax purposes was $264,804,100. Gross unrealized appreciation of investments was $958,158 and gross unrealized depreciation of investments was $20,658,813, resulting in net unrealized depreciation of $19,700,655, based on cost for U.S. federal income tax purposes.
# Restricted security subject to restrictions on resale under federal securities laws. These securities may be resold in transactions exempt from registration, normally to qualified institutional buyers under Rule 144A under the Securities Act of 1933, as amended, and have been deemed by the investment manager to be illiquid. At December 31, 2011, these securities amounted to approximately $0 or 0.0% of net assets for the Fund.
| Restricted Security | | Acquisition Date | | Acquisition Cost | | Acquisition Cost Percentage of Net Assets as of Acquisition Date | | Value as of December 31, 2011 | | Fair Value Percentage of Net Assets as of December 31, 2011 | |
Knollwood CDO Ltd., Ser. 2006-2A, Class A2J, 0.82%, due 7/13/46 | | 9/14/07 | | $ | 1,123,518 | | | | 0.2 | % | | $ | 0 | | | | 0.0 | % | |
Ø All or a portion of this security is segregated in connection with obligations for financial futures contracts.
µ Floating rate securities are securities whose yields vary with a designated market index or market rate. These securities are shown at their current rates as of December 31, 2011 and their final maturity dates.
@ This debt is guaranteed under the Federal Deposit Insurance Corporation's ("FDIC") Temporary Liquidity Guarantee Program and is backed by the full faith and credit of the United States. At December 31, 2011, these securities amounted to $11,960,580 or 4.9% of net assets for the Fund.
ñ Restricted security subject to restrictions on resale under federal securities laws. These securities may be resold in transactions exempt from registration, normally to qualified institutional buyers under Rule 144A under the Securities Act of 1933, as amended, and have been deemed by the investment manager to be liquid. At December 31, 2011, these securities amounted to $19,579,513 or 8.0% of net assets for the Fund.
* Security did not produce income during the last twelve months.
See Notes to Financial Statements
10
Statement of Assets and Liabilities
Neuberger Berman Advisers Management Trust
| | | SHORT DURATION BOND PORTFOLIO | |
| | | December 31, 2011 | |
| Assets | |
| Investments in securities, at value* (Note A)—see Schedule of Investments: | |
| Unaffiliated issuers | | $ | 245,103,445 | | |
| Cash | | | 14,365 | | |
| Interest receivable | | | 1,695,106 | | |
| Receivable for securities sold | | | 71,652 | | |
| Receivable for Fund shares sold | | | 67,429 | | |
| Receivable for variation margin (Note A) | | | 2,109 | | |
| Prepaid expenses and other assets | | | 6,133 | | |
| Total Assets | | | 246,960,239 | | |
| Liabilities | |
| Payable for Fund shares redeemed | | | 1,169,040 | | |
| Payable to investment manager (Note B) | | | 52,416 | | |
| Payable to administrator (Note B) | | | 83,866 | | |
| Accrued expenses and other payables | | | 90,161 | | |
| Total Liabilities | | | 1,395,483 | | |
| Net Assets at value | | $ | 245,564,756 | | |
| Net Assets consist of: | |
| Paid-in capital | | $ | 331,195,325 | | |
| Undistributed net investment income (loss) | | | 7,045,031 | | |
| Accumulated net realized gains (losses) on investments | | | (74,893,306 | ) | |
| Net unrealized appreciation (depreciation) in value of investments | | | (17,782,294 | ) | |
| Net Assets at value | | $ | 245,564,756 | | |
| Shares Outstanding ($.001 par value; unlimited shares authorized) | | | 22,748,084 | | |
| Net Asset Value, offering and redemption price per share | | $ | 10.79 | | |
| *Cost of Investments: | |
| Unaffiliated issuers | | $ | 262,887,848 | | |
See Notes to Financial Statements
11
Statement of Operations
Neuberger Berman Advisers Management Trust
| | | SHORT DURATION BOND PORTFOLIO | |
| | | For the Year Ended December 31, 2011 | |
| Investment Income: | |
| Income (Note A): | |
| Interest income—unaffiliated issuers | | $ | 6,934,651 | | |
| Expenses: | |
| Investment management fees (Note B) | | | 682,317 | | |
| Administration fees (Note B) | | | 1,091,707 | | |
| Audit fees | | | 43,984 | | |
| Custodian fees (Note A) | | | 96,328 | | |
| Insurance expense | | | 19,020 | | |
| Legal fees | | | 147,393 | | |
| Shareholder reports | | | 61,629 | | |
| Trustees' fees and expenses | | | 55,592 | | |
| Miscellaneous | | | 24,895 | | |
| Total expenses | | | 2,222,865 | | |
| Expenses reduced by custodian fee expense offset arrangement (Note A) | | | (316 | ) | |
| Total net expenses | | | 2,222,549 | | |
| Net investment income (loss) | | $ | 4,712,102 | | |
| Realized and Unrealized Gain (Loss) on Investments (Note A): | |
| Net realized gain (loss) on: | |
| Sales of investment securities of unaffiliated issuers | | | (3,376,981 | ) | |
| Financial futures contracts | | | (35,898 | ) | |
| Change in net unrealized appreciation (depreciation) in value of: | |
| Unaffiliated investment securities | | | (352,131 | ) | |
| Financial futures contracts | | | 2,109 | | |
| Net gain (loss) on investments | | | (3,762,901 | ) | |
| Net increase (decrease) in net assets resulting from operations | | $ | 949,201 | | |
See Notes to Financial Statements
12
Statements of Changes in Net Assets
Neuberger Berman Advisers Management Trust
| | | SHORT DURATION BOND PORTFOLIO | |
| | | Year Ended December 31, 2011 | | Year Ended December 31, 2010 | |
| Increase (Decrease) in Net Assets: | |
| From Operations (Note A): | |
| Net investment income (loss) | | $ | 4,712,102 | | | $ | 6,950,330 | | |
| Net realized gain (loss) on investments | | | (3,412,879 | ) | | | (7,542,158 | ) | |
| Change in net unrealized appreciation (depreciation) of investments | | | (350,022 | ) | | | 18,293,777 | | |
| Net increase (decrease) in net assets resulting from operations | | | 949,201 | | | | 17,701,949 | | |
| Distributions to Shareholders From (Note A): | |
| Net investment income | | | (9,927,354 | ) | | | (16,456,190 | ) | |
| From Fund Share Transactions (Note D): | |
| Proceeds from shares sold | | | 23,227,502 | | | | 50,066,723 | | |
| Proceeds from reinvestment of dividends and distributions | | | 9,927,354 | | | | 16,456,190 | | |
| Payments for shares redeemed | | | (65,920,504 | ) | | | (130,499,796 | ) | |
| Net increase (decrease) from Fund share transactions | | | (32,765,648 | ) | | | (63,976,883 | ) | |
| Net Increase (Decrease) in Net Assets | | | (41,743,801 | ) | | | (62,731,124 | ) | |
| Net Assets: | |
| Beginning of year | | | 287,308,557 | | | | 350,039,681 | | |
| End of year | | $ | 245,564,756 | | | $ | 287,308,557 | | |
| Undistributed net investment income (loss) at end of year | | $ | 7,045,031 | | | $ | 9,926,296 | | |
See Notes to Financial Statements
13
Notes to Financial Statements Short Duration Bond Portfolio
Note A—Summary of Significant Accounting Policies:
1 General: The Fund is a separate operating series of Neuberger Berman Advisers Management Trust (the "Trust"), a Delaware statutory trust organized pursuant to a Trust Instrument dated May 23, 1994. The Trust is currently comprised of ten separate operating series (each individually a "Series," and collectively the "Funds") each of which is diversified. The Trust is registered as an open-end management investment company under the Investment Company Act of 1940, as amended (the "1940 Act"), and its shares are registered under the Securities Act of 1933, as amended. The Fund currently offers only Class I shares. The Board may establish additional series or classes of shares without the approval of shareholders.
The assets of each Series belong only to that Series, and the liabilities of each Series are borne solely by that Series and no other.
The preparation of financial statements in accordance with U.S. generally accepted accounting principles ("GAAP") requires Management to make estimates and assumptions at the date of the financial statements. Actual results could differ from those estimates.
2 Portfolio valuation: Investment securities are valued as indicated in the notes following the Schedule of Investments.
3 Foreign currency translation: The accounting records of the Fund are maintained in U.S. dollars. Foreign currency amounts are translated into U.S. dollars using the exchange rate as of 4:00 p.m., Eastern time, to determine the value of investments, other assets and liabilities. Purchase and sale prices of securities, and income and expenses, are translated into U.S. dollars at the prevailing rate of exchange on the respective dates of such transactions. Net unrealized foreign currency gain (loss), if any, arises from changes in the value of assets and liabilities, other than investments in securities, as a result of changes in exchange rates and is stated separately in the Statement of Operations.
4 Securities transactions and investment income: Securities transactions are recorded on trade date for financial reporting purposes. Interest income, including accretion of discount (adjusted for original issue discount, where applicable) is recorded on the accrual basis. Realized gains and losses from securities transactions and foreign currency transactions, if any, are recorded on the basis of identified cost and stated separately in the Statement of Operations. Included in net realized gain (loss) on investments are proceeds from the settlements of class action litigation in which the Fund participated as a class member. The amount of such proceeds for the year ended December 31, 2011 was $112.
5 Income tax information: The Funds are treated as separate entities for U.S. federal income tax purposes. It is the policy of the Fund to continue to qualify as a regulated investment company by complying with the requirements of the U.S. Internal Revenue Code applicable to regulated investment companies and to distribute substantially all of its earnings to its shareholders. To the extent the Fund distributes substantially all of its earnings to shareholders, no federal income or excise tax provision is required.
The Fund has adopted the provisions of ASC 740 "Income Taxes" ("ASC 740"). ASC 740 sets forth a minimum threshold for financial statement recognition of a tax position taken, or expected to be taken, in a tax return. The Fund recognizes interest and penalties, if any, related to unrecognized tax positions as an income tax expense in the Statement of Operations. The Fund is subject to examination by U.S. federal and state tax authorities for returns filed for the prior three fiscal years 2008 - 2010. As of December 31, 2011, the Fund did not have any unrecognized tax positions.
Income distributions and capital gain distributions are determined in accordance with income tax regulations, which may differ from GAAP. These differences are primarily due to differing treatments of income and gains on
14
various investment securities held by the Fund, timing differences and differing characterization of distributions made by the Fund as a whole. The Fund may also utilize earnings and profits distributed to shareholders on redemption of shares as a part of the dividends paid deduction for income tax purposes.
As determined on December 31, 2011, permanent differences resulting primarily from different book and tax accounting for paydown gains and losses and amortization of bond premium were reclassified at fiscal year-end. These reclassifications had no effect on net income, net asset value ("NAV") or NAV per share of the Fund. For the year ended December 31, 2011, the Fund recorded the following permanent reclassifications:
| Paid-in Capital | | Undistributed Net Investment Income (Loss) | | Accumulated Net Realized Gains (Losses) on Investments | |
| $ | — | | | $ | 2,333,987 | | | $ | (2,333,987 | ) | |
For tax purposes, short-term gains are considered ordinary income.
The tax character of distributions paid during the years ended December 31, 2011 and December 31, 2010 was as follows:
| | | Distributions Paid From: | |
| | | Ordinary Income | | Total | |
| | | 2011 | | 2010 | | 2011 | | 2010 | |
| | | | | $ | 9,927,354 | | | $ | 16,456,190 | | | $ | 9,927,354 | | | $ | 16,456,190 | | |
As of December 31, 2011, the components of distributable earnings (accumulated losses) on a U.S. federal income tax basis were as follows:
Undistributed Ordinary Income | | Unrealized Appreciation (Depreciation) | | Loss Carryforwards and Deferrals | | Other Temporary Differences | | Total | |
| $ | 7,045,031 | | | $ | (19,700,655 | ) | | $ | (72,974,945 | ) | | $ | — | | | $ | (85,630,569 | ) | |
The difference between book basis and tax basis distributable earnings is attributable primarily to timing differences of amortization of bond premium, futures contracts mark to market and capital loss carryforwards.
To the extent the Fund's net realized capital gains, if any, can be offset by capital loss carryforwards, it is the policy of the Fund not to distribute such gains. The Regulated Investment Company ("RIC") Modernization Act of 2010 (the "Act") became effective for the Fund on January 1, 2011. The Act modernizes several of the federal income and excise tax provisions related to RICs. Among the changes made are changes to the capital loss carryforward rules allowing for RICs to carry forward capital losses indefinitely and to retain the character of capital loss carryforwards as short-term or long-term ("Post-Enactment"). Rules in effect previously limited the carryforward period to eight years and all carryforwards were considered short-term in character ("Pre-Enactment"). As determined at December 31, 2011, the Fund had unused capital loss carryforwards available for federal income tax purposes to offset net realized capital gains, if any, as follows:
| | | Pre-Enactment | |
| | | Expiring in: | |
| | | 2012 | | 2013 | | 2014 | | 2015 | | 2016 | | 2017 | | 2018 | |
| | | | | $ | 2,710,070 | | | $ | 4,632,986 | | | $ | 3,820,726 | | | $ | 514,506 | | | $ | — | | | $ | 45,541,698 | | | $ | 7,896,656 | | |
| | | Post-Enactment (No Expiration Date) | |
| | | Long-Term | | Short-Term | |
| | | | | $ | 7,193,871 | | | $ | 664,432 | | |
15
Post-Enactment capital loss carryforwards must be fully used before Pre-Enactment capital loss carryforwards; therefore, under certain circumstances, Pre-Enactment capital loss carryforwards available as of the report date may expire unused.
6 Distributions to shareholders: The Fund may earn income, net of expenses, daily on its investments. Distributions from net investment income and net realized capital gains, if any, generally are distributed once a year (usually in October). Income distributions and capital gain distributions to shareholders are recorded on the ex-date.
7 Foreign taxes: Foreign taxes withheld represent amounts withheld by foreign tax authorities, net of refunds recoverable.
8 Expense allocation: Certain expenses are applicable to multiple funds. Expenses directly attributable to a Series are charged to that Series. Expenses of the Trust that are not directly attributable to a particular series of the Trust (e.g., the Fund) are allocated among the series of the Trust, on the basis of relative net assets, except where a more appropriate allocation of expenses to each of the series can otherwise be made fairly. Expenses borne by the complex of related investment companies, which includes open-end and closed-end investment companies for which Management serves as investment manager, that are not directly attributable to a particular investment company in the complex (e.g., the Trust) or series thereof are allocated among the investment companies in the complex or series thereof, on the basis of relative net assets, except where a more appropriate allocation of expenses to each of the investment companies in the complex or series thereof can otherwise be made fairly.
9 Dollar rolls: The Fund may enter into dollar roll transactions with respect to mortgage-backed securities. In a dollar roll transaction, the Fund sells securities for delivery in the current month and simultaneously agrees to repurchase substantially similar (i.e., same type and coupon) securities on a specified future date from the same party. During the period before the repurchase, the Fund foregoes principal and interest payments on the securities. The Fund is compensated by the difference between the current sales price and the forward price for the future purchase (often referred to as the "drop"), as well as by the interest earned on the cash proceeds of the initial sale. Dollar rolls may increase fluctuations in the Fund's NAV and may be viewed as a form of leverage. There is a risk that the counterparty will be unable or unwilling to complete the transaction as scheduled, which may result in losses to the Fund.
10 Investments in foreign securities: Investing in foreign securities may involve certain sovereign and other risks, in addition to the credit and market risks normally associated with domestic securities. These additional risks include the possibility of adverse political and economic developments (including political instability, nationalization, expropriation, or confiscatory taxation) and the potentially adverse effects of unavailability of public information regarding issuers, less governmental supervision and regulation of financial markets, reduced liquidity of certain financial markets, and the lack of uniform accounting, auditing, and financial reporting standards or the application of standards that are different or less stringent than those applied in the United States. Foreign securities also may experience greater price volatility, higher rates of inflation, and delays in settlement.
11 Derivative instruments: During the year ended December 31, 2011, the Fund's use of derivatives was limited to financial futures contracts. The Fund has adopted the provisions of ASC 815 "Derivatives and Hedging" ("ASC 815"). The disclosure requirements of ASC 815 distinguish between derivatives that qualify for hedge accounting and those that do not. Because investment companies value their derivatives at fair value and recognize changes in fair value through the Statement of Operations, they do not qualify for hedge accounting. Accordingly, even though the Fund's investments in derivatives may represent economic hedges, they are considered non-hedge transactions for purposes of this disclosure.
16
Financial futures contracts: At the time the Fund enters into a financial futures contract, it is required to deposit with the futures commission merchant a specified amount of cash or liquid securities, known as "initial margin," which is a percentage of the value of the financial futures contract being traded that is set by the exchange upon which the futures contract is traded. Each day, the futures contract is valued at the official settlement price of the board of trade or U.S. commodity exchange on which such futures contract is traded. Subsequent payments, known as "variation margin," to and from the broker are made on a daily basis as the market price of the financial futures contract fluctuates. Daily variation margin adjustments, arising from this "mark to market," are recorded by the Fund as unrealized gains or losses.
Although some financial futures contracts by their terms call for actual delivery or acceptance of financial instruments, in most cases the contracts are closed out prior to delivery by offsetting purchases or sales of matching financial futures contracts. When the contracts are closed, the Fund recognizes a gain or loss. Risks of entering into futures contracts include the possibility there may be an illiquid market, possibly at a time of rapidly declining prices, and/or a change in the value of the contract may not correlate with changes in the value of the underlying securities. Futures have minimal counterparty risk to the Fund because the exchange's clearinghouse, as counterparty to all exchange traded futures, guarantees the futures against default.
For U.S. federal income tax purposes, the futures transactions undertaken by the Fund may cause the Fund to recognize gains or losses from marking contracts to market even though its positions have not been sold or terminated, may affect the character of the gains or losses recognized as long-term or short-term, and may affect the timing of some capital gains and losses realized by the Fund. Also, the Fund's losses on transactions involving futures contracts may be deferred rather than being taken into account currently in calculating the Fund's taxable income.
During the year ended December 31, 2011, the Fund entered into financial futures contracts for economic hedging purposes, including as a maturity or duration management device. At December 31, 2011, open positions in financial futures contracts were:
| Expiration | | Open Contracts | | Position | | Unrealized Appreciation | |
| March 2012 | | 45 U.S. Treasury Notes, 2 Year | | Long | | $ | 2,109 | | |
During the year ended December 31, 2011, the average notional amount of financial futures contracts was $200,000.
At December 31, 2011, the Fund had deposited $100,000 in U.S. Treasury Notes, 2.13%, due 11/30/14, to cover margin requirements on open financial futures contracts.
At December 31, 2011, the Fund had the following derivatives (which did not qualify as hedging instruments under ASC 815), grouped by primary risk exposure:
Asset Derivatives
| | | Interest Rate Risk | | Statement of Assets and Liabilities Location | |
| Futures Contracts | | $ | 2,109 | | | Receivable for variation | |
| Total Value | | $ | 2,109 | | | margin(1) | |
(1) Reflected in the Statement of Assets and Liabilities; included under the caption "Net unrealized appreciation (depreciation) in value of investments," and is the cumulative appreciation (depreciation) of futures contracts as of December 31, 2011 as shown in "Futures Contracts" above. The outstanding variation margin as of December 31, 2011, if any, is reflected in the Statement of Assets and Liabilities under the caption "Receivable/Payable for variation margin."
17
The impact of the use of these derivative instruments on the Statement of Operations during the year ended December 31, 2011, was as follows:
Realized Gain (Loss)
| | | Interest Rate Risk | | Statement of Operations Location | |
| Futures Contracts | | $ | (35,898 | ) | | Net realized | |
| Total Realized Gain (Loss) | | $ | (35,898 | ) | | gain (loss) on financial futures contracts | |
| Change in Appreciation (Depreciation) | |
| | | Interest Rate Risk | | | |
| Futures Contracts | | $ | 2,109 | | | Change in net unrealized | |
Total Change in Appreciation (Depreciation) | | $ | 2,109 | | | appreciation (depreciation) in value of financial futures contracts | |
12 Indemnifications: Like many other companies, the Trust's organizational documents provide that its officers and trustees are indemnified against certain liabilities arising out of the performance of their duties to the Trust. In addition, both in some of its principal service contracts and in the normal course of its business, the Trust enters into contracts that provide indemnifications to other parties for certain types of losses or liabilities. The Trust's maximum exposure under these arrangements is unknown as this could involve future claims against the Trust.
13 Expense offset arrangement: The Fund has an expense offset arrangement in connection with its custodian contract. For the year ended December 31, 2011, the impact of this arrangement was a reduction of expenses of $316.
Note B—Management Fees, Administration Fees, Distribution Arrangements, and Other Transactions with Affiliates:
Fund shares are issued and redeemed in connection with investments in and payments under certain variable annuity contracts and variable life insurance policies issued through separate accounts of life insurance companies and are also offered directly to certain qualified pension and retirement plans.
The Fund retains Management as its investment manager under a Management Agreement. For such investment management services, the Fund pays Management a fee at the annual rate of 0.25% of the first $500 million of the Fund's average daily net assets, 0.225% of the next $500 million, 0.20% of the next $500 million, 0.175% of the next $500 million, and 0.15% of average daily net assets in excess of $2 billion. As sub-adviser Neuberger Berman Fixed Income LLC ("NBFI") receives a monthly fee paid by Management. The Fund does not pay a fee directly to NBFI for such services.
The Fund retains Management as its administrator under an Administration Agreement. The Fund pays Management an administration fee at the annual rate of 0.40% of its average daily net assets under this agreement. Additionally, Management retains State Street Bank and Trust Company ("State Street") as its sub-administrator under a Sub-Administration Agreement. Management pays State Street a fee for all services received under this agreement.
The Board adopted a non-fee distribution plan for the Fund.
Management has contractually undertaken through December 31, 2014 to forgo current payment of fees and/or reimburse the Fund for its operating expenses (excluding fees payable to Management, interest, taxes, brokerage commissions, extraordinary expenses, transaction costs and dividend expense on short sales, if any) ("Operating
18
Expenses") which exceed, in the aggregate, 1.00% per annum of the Fund's average daily net assets (the "Expense Limitation"). For the year ended December 31, 2011, no reimbursement to the Fund was required. The Fund has agreed to repay Management through December 31, 2017 for fees and expenses foregone and/or its excess Operating Expenses previously reimbursed by Management, so long as its annual Operating Expenses during that period do not exceed its Expense Limitation, and the repayment is made within three years after the year in which Management issued the reimbursement or waived fees. During the year ended December 31, 2011, there was no repayment to Management under its contractual expense limitation. At December 31, 2011, the Fund had no contingent liability to Management under its contractual expense limitation.
NBFI, sub-adviser to the Fund, is retained by Management to furnish it with investment recommendations and research information without added cost to the Fund. Several individuals who are officers and/or trustees of the Trust are also employees of NBFI and/or Management.
Management and NBFI are indirect subsidiaries of Neuberger Berman Group LLC ("NBG," and together with its consolidated subsidiaries "NB Group"). The voting equity of NBG is owned by NBSH Acquisition, LLC ("NBSH"), which was formed to facilitate the May 4, 2009 management buyout of the businesses conducted by NB Group, and Lehman Brothers Holdings Inc. ("LBHI"). NBSH, which is owned by portfolio managers, members of the NB Group management team and certain of NB Group's key employees and senior professionals, owns approximately 52% of the voting equity of NBG, and LBHI and certain of its subsidiaries own the remaining 48% of NBG's voting equity.
On December 14, 2011, the United States Bankruptcy Court for the Southern District of New York approved a motion filed by LBHI and certain of its subsidiaries, as debtors and debtors in possession, (collectively, the "Lehman Brothers Estate") that will provide NBG with the opportunity to purchase the Lehman Brothers Estate's interest in preferred and common equity of NBG. The proposed transactions, which are subject to the Lehman Brothers Estate and NBG signing definitive documentation, as well as to market conditions, would, if successfully implemented, enable NBG to have a lower cost capital structure and set it on a path to 100% employee ownership within the next five to six years.
Note C—Securities Transactions:
Cost of purchases and proceeds of sales and maturities of long-term securities (excluding financial futures contracts) for the year ended December 31, 2011 were as follows:
Purchases of U.S. Government and Agency Obligations | | Purchases excluding U.S. Government and Agency Obligations | | Sales and Maturities of U.S. Government and Agency Obligations | | Sales and Maturities excluding U.S. Government and Agency Obligations | |
| $ | 86,150,423 | | | $ | 107,815,850 | | | $ | 119,771,380 | | | $ | 109,375,610 | | |
Note D—Fund Share Transactions:
Share activity for the years ended December 31, 2011 and December 31, 2010 was as follows:
| | | For the Year Ended December 31, | |
| | | 2011 | | 2010 | |
| Shares Sold | | | 2,071,645 | | | | 4,345,642 | | |
| Shares Issued on Reinvestment of Dividends and Distributions | | | 924,335 | | | | 1,462,773 | | |
| Shares Redeemed | | | (5,895,200 | ) | | | (11,347,290 | ) | |
| Total | | | (2,899,220 | ) | | | (5,538,875 | ) | |
19
Note E—Line of Credit:
At December 31, 2011, the Fund was a participant in a single committed, unsecured $200,000,000 line of credit with State Street, to be used only for temporary or emergency purposes. Other investment companies managed by Management also participate in this line of credit on the same terms. Interest is charged on borrowings under this line of credit at the higher of (a) the Federal Funds Rate plus 1.25% per annum or (b) the Overnight LIBOR Rate plus 1.25% per annum. A commitment fee of 0.10% (0.125% prior to September 16, 2011) per annum of the available line of credit is charged, of which each participating Fund has agreed to pay its pro rata share, based on the ratio of its individual net assets to the net assets of all participants at the time the fee is due and payable. The fee is paid quarterly in arrears. Because several mutual funds participate, there is no assurance that an individual Fund will have access to all or any part of the $200,000,000 at any particular time. There were no loans outstanding pursuant to this line of credit at December 31, 2011. During the year ended December 31, 2011, the Fund did not utilize this line of credit.
Note F—Recent Accounting Pronouncement:
In May 2011, the Financial Accounting Standards Board ("FASB") issued Accounting Standards Update ("ASU") No. 2011-04 "Amendments to Achieve Common Fair Value Measurement and Disclosure Requirements in U.S. GAAP and International Financial Reporting Standards ("IFRS")." ASU No. 2011-04 amends ASC 820 to establish common requirements for measuring fair value and for disclosing information about fair value measurements in accordance with GAAP and IFRS. It will not affect the fair valuation of the Fund's investments, but rather the quantitative and qualitative disclosures in the financial statements. ASU No. 2011-04 is effective for fiscal years beginning after December 15, 2011 and for interim periods within those fiscal years. Management is currently evaluating the impact of the adoption of ASU No. 2011-04 on the Fund's financial statement disclosures.
20
Financial Highlights
Short Duration Bond Portfolio
The following table includes selected data for a share outstanding throughout each year and other performance information derived from the Financial Statements. Per share amounts that round to less than $.01 or $(.01) per share are presented as $.00 or $(.00), respectively.
| | | Year Ended December 31, | |
| | | 2011 | | 2010 | | 2009 | | 2008 | | 2007 | |
| Net Asset Value, Beginning of Year | | $ | 11.20 | | | $ | 11.22 | | | $ | 10.71 | | | $ | 13.00 | | | $ | 12.76 | | |
| Income From Investment Operations: | |
Net Investment Income (Loss)‡ | | | .19 | | | | .24 | | | | .43 | | | | .53 | | | | .59 | | |
Net Gains or Losses on Securities (both realized and unrealized) | | | (.16 | ) | | | .36 | | | | .98 | | | | (2.23 | ) | | | .02 | | |
| Total From Investment Operations | | | .03 | | | | .60 | | | | 1.41 | | | | (1.70 | ) | | | .61 | | |
| Less Distributions From: | |
| Net Investment Income | | | (.44 | ) | | | (.62 | ) | | | (.90 | ) | | | (.59 | ) | | | (.37 | ) | |
| Net Asset Value, End of Year | | $ | 10.79 | | | $ | 11.20 | | | $ | 11.22 | | | $ | 10.71 | | | $ | 13.00 | | |
Total Return†† | | | .29 | % | | | 5.28 | % | | | 13.33 | % | | | (13.43 | )% | | | 4.77 | % | |
| Ratios/Supplemental Data | |
| Net Assets, End of Year (in millions) | | $ | 245.6 | | | $ | 287.3 | | | $ | 350.0 | | | $ | 445.5 | | | $ | 623.0 | | |
Ratio of Gross Expenses to Average Net Assets# | | | .81 | % | | | .81 | % | | | .79 | % | | | .74 | % | | | .73 | % | |
| Ratio of Net Expenses to Average Net Assets | | | .81 | % | | | .81 | % | | | .79 | %§ | | | .74 | % | | | .73 | % | |
Ratio of Net Investment Income (Loss) to Average Net Assets | | | 1.73 | % | | | 2.07 | % | | | 3.87 | % | | | 4.35 | % | | | 4.51 | % | |
| Portfolio Turnover Rate | | | 74 | % | | | 70 | % | | | 47 | % | | | 46 | % | | | 69 | % | |
See Notes to Financial Highlights
21
Notes to Financial Highlights Short Duration Bond Portfolio
†† Total return based on per share NAV reflects the effects of changes in NAV on the performance of the Fund during each fiscal period and assumes income dividends and other distributions, if any, were reinvested. Results represent past performance and do not indicate future results. Current returns may be lower or higher than the performance data quoted. Investment returns and principal may fluctuate and shares when redeemed may be worth more or less than original cost. Total return would have been lower if Management had not waived certain expenses. The total return information shown does not reflect charges and other expenses that apply to the separate account or the related insurance policies, and the inclusion of these charges and other expenses would reduce the total return for all fiscal periods shown.
# The Fund is required to calculate an expense ratio without taking into consideration any expense reductions related to expense offset arrangements.
‡ Calculated based on the average number of shares outstanding during each fiscal period.
§ After waiver of a portion of the investment management fee by Management. Had Management not undertaken such actions, the annualized ratios of net expenses to average daily net assets would have been:
| | | Year Ended December 31, | |
| | | 2009 | |
| | | | | | .79 | % | |
22
Report of Independent Registered Public Accounting Firm
To the Board of Trustees of
Neuberger Berman Advisers Management Trust and
Shareholders of Short Duration Bond Portfolio
We have audited the accompanying statement of assets and liabilities, including the schedule of investments, of Short Duration Bond Portfolio, one of the series constituting Neuberger Berman Advisers Management Trust (the "Trust"), as of December 31, 2011, and the related statement of operations for the year then ended, the statements of changes in net assets for each of the two years in the period then ended, and the financial highlights for each of the five years in the period then ended. These financial statements and financial highlights are the responsibility of the Trust's management. Our responsibility is to express an opinion on these financial statements and financial highlights based on our audits.
We conducted our audits in accordance with the standards of the Public Company Accounting Oversight Board (United States). Those standards require that we plan and perform the audit to obtain reasonable assurance about whether the financial statements and financial highlights are free of material misstatement. We were not engaged to perform an audit of the Trust's internal control over financial reporting. Our audits included consideration of internal control over financial reporting as a basis for designing audit procedures that are appropriate in the circumstances, but not for the purpose of expressing an opinion on the effectiveness of the Trust's internal control over financial reporting. Accordingly, we express no such opinion. An audit also includes examining, on a test basis, evidence supporting the amounts and disclosures in the financial statements and financial highlights, assessing the accounting principles used and significant estimates made by management, and evaluating the overall financial statement presentation. Our procedures included confirmation of securities owned as of December 31, 2011 by correspondence with the custodian and brokers or by other appropriate auditing procedures where replies from brokers were not received. We believe that our audits provide a reasonable basis for our opinion.
In our opinion, the financial statements and financial highlights referred to above present fairly, in all material respects, the financial position of Short Duration Bond Portfolio, a series of Neuberger Berman Advisers Management Trust, at December 31, 2011, the results of its operations for the year then ended, the changes in its net assets for each of the two years in the period then ended, and the financial highlights for each of the five years in the period then ended, in conformity with U.S. generally accepted accounting principles.
Boston, Massachusetts
February 10, 2012
23
Trustee and Officer Information
The following tables set forth information concerning the trustees ("Trustees") and officers ("Officers") of the Trust. All persons named as Trustees and Officers also serve in similar capacities for other funds administered or managed by Management, Neuberger and NBFI. The Statement of Additional Information includes additional information about Trustees and is available upon request, without charge, by calling (800) 877-9700.
Information about the Board of Trustees
Name, (Year of Birth), and Address(1) | | Position and Length of Time Served(2) | | Principal Occupation(s)(3) | | Number of Funds in Fund Complex Overseen by Fund Trustee | | Other Directorships Held Outside Fund Complex by Fund Trustee | |
| Independent Trustees | |
| |
| John Cannon (1930) | | Trustee since 2000 | | Consultant; formerly, Chairman, CDC Investment Advisers (registered investment adviser), 1993 to January 1999; formerly, President and Chief Executive Officer, AMA Investment Advisors, an affiliate of the American Medical Association. | | | 47 | | | Formerly, Independent Trustee or Director of three series of Oppenheimer Funds: Oppenheimer Limited Term New York Municipal Fund, Rochester Fund Municipals, and Oppenheimer Convertible Securities Fund, 1992 to 2009. | |
| |
| Faith Colish (1935) | | Trustee since 1982 | | Counsel, Carter Ledyard & Milburn LLP (law firm) since October 2002; formerly, Attorney-at-Law and President, Faith Colish, A Professional Corporation, 1980 to 2002. | | | 47 | | | Formerly, Director, 1997 to 2003, and Advisory Director, 2003 to 2006, ABA Retirement Funds (formerly, American Bar Retirement Association) (not-for-profit membership corporation). | |
| |
24
Name, (Year of Birth), and Address(1) | | Position and Length of Time Served(2) | | Principal Occupation(s)(3) | | Number of Funds in Fund Complex Overseen by Fund Trustee | | Other Directorships Held Outside Fund Complex by Fund Trustee | |
| Martha C. Goss (1949) | | Trustee since 2007 | | President, Woodhill Enterprises Inc./Chase Hollow Associates LLC (personal investment vehicle), since 2006; Chief Operating and Financial Officer, Hopewell Holdings LLC/Amwell Holdings, LLC (a holding company for a healthcare reinsurance company start-up), since 2003; formerly, Consultant, Resources Connection (temporary staffing), 2002 to 2006. | | | 47 | | | Director, American Water (water utility), since 2003; Director, Channel Reinsurance (financial guaranty reinsurance), since 2006; Director, Allianz Life of New York (insurance), since 2005; Director, Financial Women's Association of New York (not-for-profit association), since 2003; Trustee Emerita, Brown University, since 1998; formerly, Director, Ocwen Financial Corporation (mortgage servicing), 2005 to 2010; formerly, Advisory Board Member, Attensity (software developer), 2005 to 2007; formerly, Director, Bank Leumi (commercial bank), 2005 to 2007; formerly, Director, Claire's Stores, Inc. (retailer), 2005 to 2007. | |
| |
| C. Anne Harvey (1937) | | Trustee since 1998 | | President, C.A. Harvey Associates, since October 2001; formerly, Director, AARP, 1978 to December 2001. | | | 47 | | | Formerly, President, Board of Associates to The National Rehabilitation Hospital's Board of Directors, 2001 to 2002; formerly, Member, Individual Investors Advisory Committee to the New York Stock Exchange Board of Directors, 1998 to 2002. | |
| |
25
Name, (Year of Birth), and Address(1) | | Position and Length of Time Served(2) | | Principal Occupation(s)(3) | | Number of Funds in Fund Complex Overseen by Fund Trustee | | Other Directorships Held Outside Fund Complex by Fund Trustee | |
| Robert A. Kavesh (1927) | | Trustee since 2000 | | Retired, since 2002; Marcus Nadler Professor Emeritus of Finance and Economics, New York University Stern School of Business; formerly, Executive Secretary-Treasurer, American Finance Association, 1961 to 1979. | | | 47 | | | Formerly, Director, The Caring Community (not-for-profit), 1997 to 2006; formerly, Director, DEL Laboratories, Inc. (cosmetics and pharmaceuticals), 1978 to 2004; formerly, Director, Apple Bank for Savings, 1979 to 1990; formerly, Director, Western Pacific Industries, Inc., (public company), 1972 to 1986. | |
| |
| Michael M. Knetter (1960) | | Trustee since 2007 | | President and Chief Executive Officer, University of Wisconsin Foundation, since October 2010; formerly, Dean, School of Business, University of Wisconsin - Madison; formerly, Professor of International Economics and Associate Dean, Amos Tuck School of Business - Dartmouth College, 1998 to 2002. | | | 47 | | | Director, American Family Insurance (a mutual company, not publicly traded), since March 2009; formerly, Trustee, Northwestern Mutual Series Fund, Inc., 2007 to 2010; formerly, Director, Wausau Paper, 2005 to 2011; formerly, Director, Great Wolf Resorts, 2004 to 2009. | |
| |
| Howard A. Mileaf (1937) | | Trustee since 1999 | | Retired; formerly, Vice President and General Counsel, WHX Corporation (holding company), 1993 to 2001. | | | 47 | | | Formerly, Director, Webfinancial Corporation (holding company), 2002 to 2008; formerly, Director, WHX Corporation (holding company), 2002 to 2005; formerly, Director, State Theatre of New Jersey (not-for-profit theatre), 2000 to 2005. | |
| |
| George W. Morriss (1947) | | Trustee since 2007 | | Retired; formerly, Executive Vice President and Chief Financial Officer, People's Bank, Connecticut (a financial services company), 1991 to 2001. | | | 47 | | | Manager, Larch Lane Multi-Strategy Fund complex (which currently consists of three funds), since 2006; formerly, Member, NASDAQ Issuers' Affairs Committee, 1995 to 2003. | |
| |
26
Name, (Year of Birth), and Address(1) | | Position and Length of Time Served(2) | | Principal Occupation(s)(3) | | Number of Funds in Fund Complex Overseen by Fund Trustee | | Other Directorships Held Outside Fund Complex by Fund Trustee | |
| Edward I. O'Brien (1928) | | Trustee since 2000 | | Private Investor; formerly, Member, Investment Policy Committee, Edward Jones, 1993 to 2001; President, Securities Industry Association ("SIA") (securities industry's representative in government relations and regulatory matters at the federal and state levels), 1974 to 1992; Adviser to SIA, November 1992 to November 1993. | | | 47 | | | Formerly, Director, Legg Mason, Inc. (financial services holding company), 1993 to July 2008; formerly, Director, Boston Financial Group (real estate and tax shelters), 1993 to 1999. | |
| |
| Jack L. Rivkin (1940) | | Trustee since 2002; President, 2002 to 2008 | | Formerly, Executive Vice President and Chief Investment Officer, Neuberger Berman Holdings LLC (holding company), 2002 to August 2008 and 2003 to August 2008, respectively; formerly, Managing Director and Chief Investment Officer, Neuberger, December 2005 to August 2008 and 2003 to August 2008, respectively; formerly, Executive Vice President, Neuberger, December 2002 to 2005; formerly, Director and Chairman, Management, December 2002 to August 2008; formerly, Executive Vice President, Citigroup Investments, Inc., September 1995 to February 2002; formerly, Executive Vice President, Citigroup Inc., September 1995 to February 2002. | | | 47 | | | Director, Idealab (private company), since 2009; Director, Distributed World Power (private company), since 2009; Director, Dale Carnegie and Associates, Inc. (private company), since 1999; Director, Solbright, Inc. (private company), since 1998; Director, SA Agricultural Fund, since 2009; Chairman and Director, Essential Brands (consumer products) since 2008; formerly, Director, New York Society of Security Analysts, 2006 to 2008. | |
| |
27
Name, (Year of Birth), and Address(1) | | Position and Length of Time Served(2) | | Principal Occupation(s)(3) | | Number of Funds in Fund Complex Overseen by Fund Trustee | | Other Directorships Held Outside Fund Complex by Fund Trustee | |
| Cornelius T. Ryan (1931) | | Trustee since 2000 | | General Partner and Adviser, TD2, TD3, and TOF1 Healthcare Venture Capital Partnerships; formerly, Founding General Partner, Oxford Partners and Oxford Bioscience Partners (venture capital investing) and President, Oxford Venture Corporation, 1981 to 2010. | | | 47 | | | Trustee, Norwalk Hospital Foundation, since 2000; Director, Supply Pro (privately held company), since 2008; formerly, Trustee, Norwalk Hospital, 1995 to 2004; formerly, President and Director, Randolph Computer Corp., 1966 to 1984; formerly, Director of numerous privately held portfolio companies of Oxford Partners and Oxford Bioscience Partners, 1981 to 2005. | |
| |
| Tom D. Seip (1950) | | Trustee since 2000; Chairman of the Board since 2008; Lead Independent Trustee from 2006 to 2008 | | General Partner, Ridgefield Farm LLC (a private investment vehicle); formerly, President and CEO, Westaff, Inc. (temporary staffing), May 2001 to January 2002; formerly, Senior Executive, The Charles Schwab Corporation, 1983 to 1998, including Chief Executive Officer, Charles Schwab Investment Management, Inc.; Trustee, Schwab Family of Funds and Schwab Investments, 1997 to 1998; and Executive Vice President-Retail Brokerage, Charles Schwab & Co., Inc., 1994 to 1997. | | | 47 | | | Director, H&R Block, Inc. (financial services company), since May 2001; formerly, Chairman, Compensation Committee, H&R Block, Inc., 2006 to 2010; formerly, Director, Forward Management, Inc. (asset management company), 1999 to 2006. | |
| |
28
Name, (Year of Birth), and Address(1) | | Position and Length of Time Served(2) | | Principal Occupation(s)(3) | | Number of Funds in Fund Complex Overseen by Fund Trustee | | Other Directorships Held Outside Fund Complex by Fund Trustee | |
| Candace L. Straight (1947) | | Trustee since 1999 | | Private investor and consultant specializing in the insurance industry; formerly, Advisory Director, Securitas Capital LLC (a global private equity investment firm dedicated to making investments in the insurance sector), 1998 to December 2003. | | | 47 | | | Public Member, Board of Governors and Board of Trustees, Rutgers University, since 2011; Director, Montpelier Re Holdings Ltd. (reinsurance company), since 2006; formerly, Director, National Atlantic Holdings Corporation (property and casualty insurance company), 2004 to 2008; formerly, Director, The Proformance Insurance Company (property and casualty insurance company), 2004 to 2008; formerly, Director, Providence Washington Insurance Company (property and casualty insurance company), 1998 to 2006; formerly, Director, Summit Global Partners (insurance brokerage firm), 2000 to 2005. | |
| |
| Peter P. Trapp (1944) | | Trustee since 1984 | | Retired; formerly, Regional Manager for Mid-Southern Region, Ford Motor Credit Company, September 1997 to 2007; formerly, President, Ford Life Insurance Company, April 1995 to August 1997. | | | 47 | | | None. | |
| |
29
Name, (Year of Birth), and Address(1) | | Position and Length of Time Served(2) | | Principal Occupation(s)(3) | | Number of Funds in Fund Complex Overseen by Fund Trustee | | Other Directorships Held Outside Fund Complex by Fund Trustee | |
| Trustees who are "Interested Persons" | |
| |
| Joseph V. Amato* (1962) | | Trustee since 2009 | | President and Director, Neuberger Berman Group LLC, since 2009; President and Chief Executive Officer, Neuberger and Neuberger Berman Holdings LLC (including its predecessor, Neuberger Berman Inc.), since 2007; Chief Investment Officer, Neuberger, since 2009; Chief Investment Officer (Equities) and Managing Director, Management, since 2009; Managing Director, Neuberger Berman Fixed Income LLC ("NBFI") since 2007; Board member of NBFI since 2006; formerly, Global Head of Asset Management of Lehman Brothers Holdings Inc.'s ("LBHI") Investment Management Division, 2006 to 2009; formerly, member of LBHI's Investment Management Division's Executive Management Committee, 2006 to 2009; formerly, Managing Director, Lehman Brothers Inc. ("LBI"), 2006 to 2008; formerly, Chief Recruiting and Development Officer, LBI, 2005 to 2006; formerly, Global Head of LBI's Equity Sales and a Member of its Equities Division Executive Committee, 2003 to 2005. | | | 47 | | | Member of Board of Advisors, McDonough School of Business, Georgetown University, since 2001; Member of New York City Board of Advisors, Teach for America, since 2005; Trustee, Montclair Kimberley Academy (private school), since 2007. | |
| |
30
Name, (Year of Birth), and Address(1) | | Position and Length of Time Served(2) | | Principal Occupation(s)(3) | | Number of Funds in Fund Complex Overseen by Fund Trustee | | Other Directorships Held Outside Fund Complex by Fund Trustee | |
| Robert Conti* (1956) | | Chief Executive Officer, President and Trustee since 2008; prior thereto, Executive Vice President in 2008 and Vice President, 2000 to 2008 | | Managing Director, Neuberger, since 2007; formerly, Senior Vice President, Neuberger, 2003 to 2006; formerly, Vice President, Neuberger, 1999 to 2003; President and Chief Executive Officer, Management, since 2008; formerly, Senior Vice President, Management, 2000 to 2008. | | | 47 | | | Director since 1994 and formerly, Chairman of the Board, 2008 to 2010, Staten Island Mental Health Society, Inc. | |
| |
(1) The business address of each listed person is 605 Third Avenue, New York, New York 10158.
(2) Pursuant to the Trust's Trust Instrument, each of these Trustees shall hold office for life or until his or her successor is elected or the Trust terminates; except that (a) any Trustee may resign by delivering a written resignation; (b) any Trustee may be removed with or without cause at any time by a written instrument signed by at least two-thirds of the other Trustees; (c) any Trustee who requests to be retired, or who has become unable to serve, may be retired by a written instrument signed by a majority of the other Trustees; and (d) any Trustee may be removed at any shareholder meeting by a vote of at least two-thirds of the outstanding shares.
(3) Except as otherwise indicated, each individual has held the positions shown for at least the last five years.
* Indicates a Trustee who is an "interested person" within the meaning of the 1940 Act. Mr. Amato and Mr. Conti are interested persons of the Trust by virtue of the fact that each is an officer of Management, Neuberger and/or their affiliates.
31
Information about the Officers of the Trust
Name, (Year of Birth), and Address(1) | | Position and Length of Time Served(2) | | Principal Occupation(s)(3) | |
| Andrew B. Allard (1961) | | Anti-Money Laundering Compliance Officer since 2002 | | Senior Vice President, Neuberger, since 2006 and Employee since 1999; Deputy General Counsel, Neuberger, since 2004; formerly, Vice President, Neuberger, 2000 to 2005; formerly, Employee, Management, 1994 to 1999; Anti-Money Laundering Compliance Officer, nine registered investment companies for which Management acts as investment manager and administrator (six since 2002, one since 2003, one since 2005 and one since 2006). | |
| |
| Claudia A. Brandon (1956) | | Executive Vice President since 2008 and Secretary since 1985 | | Senior Vice President, Neuberger, since 2007 and Employee since 1999; Senior Vice President, Management, since 2008 and Assistant Secretary since 2004; formerly, Vice President, Neuberger, 2002 to 2006; formerly, Vice President-Mutual Fund Board Relations, Management, 2000 to 2008; formerly, Vice President, Management, 1986 to 1999 and Employee 1984 to 1999; Executive Vice President, nine registered investment companies for which Management acts as investment manager and administrator (nine since 2008); Secretary, nine registered investment companies for which Management acts as investment manager and administrator (three since 1985, three since 2002, one since 2003, one since 2005 and one since 2006). | |
| |
| Anthony DiBernardo (1979) | | Assistant Treasurer since 2011 | | Vice President, Neuberger, since 2009; Employee, Management, since 2003; Assistant Treasurer, nine registered investment companies for which Management acts as investment manager and administrator. | |
| |
| Maxine L. Gerson (1950) | | Executive Vice President since 2008 and Chief Legal Officer since 2005 (only for purposes of sections 307 and 406 of the Sarbanes-Oxley Act of 2002) | | Managing Director, Neuberger, since 2009, and Deputy General Counsel and Assistant Secretary, Neuberger, since 2001; Managing Director, Management, since 2009, and Secretary and General Counsel, Management, since 2004; formerly, Senior Vice President, Neuberger, 2002 to 2009; formerly, Senior Vice President, Management, 2006 to 2009; Executive Vice President, nine registered investment companies for which Management acts as investment manager and administrator (nine since 2008); Chief Legal Officer (only for purposes of sections 307 and 406 of the Sarbanes-Oxley Act of 2002), nine registered investment companies for which Management acts as investment manager and administrator (eight since 2005 and one since 2006). | |
| |
| Sheila R. James (1965) | | Assistant Secretary since 2002 | | Vice President, Neuberger, since 2008 and Employee since 1999; formerly, Assistant Vice President, Neuberger, 2007; formerly, Employee, Management, 1991 to 1999; Assistant Secretary, nine registered investment companies for which Management acts as investment manager and administrator (six since 2002, one since 2003, one since 2005 and one since 2006). | |
| |
| Brian Kerrane (1969) | | Vice President since 2008 | | Senior Vice President, Neuberger, since 2006; formerly, Vice President, Neuberger, 2002 to 2006; Vice President, Management, since 2008 and Employee since 1991; Vice President, nine registered investment companies for which Management acts as investment manager and administrator (nine since 2008). | |
| |
32
Name, (Year of Birth), and Address(1) | | Position and Length of Time Served(2) | | Principal Occupation(s)(3) | |
| Kevin Lyons (1955) | | Assistant Secretary since 2003 | | Assistant Vice President, Neuberger, since 2008 and Employee since 1999; formerly, Employee, Management, 1993 to 1999; Assistant Secretary, nine registered investment companies for which Management acts as investment manager and administrator (seven since 2003, one since 2005 and one since 2006). | |
| |
| Owen F. McEntee, Jr. (1961) | | Vice President since 2008 | | Vice President, Neuberger, since 2006; Employee, Management, since 1992; Vice President, nine registered investment companies for which Management acts as investment manager and administrator (nine since 2008). | |
| |
| John M. McGovern (1970) | | Treasurer and Principal Financial and Accounting Officer since 2005 | | Senior Vice President, Neuberger, since 2007; formerly, Vice President, Neuberger, 2004 to 2006; Employee, Management, since 1993; Treasurer and Principal Financial and Accounting Officer, nine registered investment companies for which Management acts as investment manager and administrator (eight since 2005 and one since 2006); formerly, Assistant Treasurer, eight registered investment companies for which Management acts as investment manager and administrator, 2002 to 2005. | |
| |
| Frank Rosato (1971) | | Assistant Treasurer since 2005 | | Vice President, Neuberger, since 2006; Employee, Management, since 1995; Assistant Treasurer, nine registered investment companies for which Management acts as investment manager and administrator (eight since 2005 and one since 2006). | |
| |
| Neil S. Siegel (1967) | | Vice President since 2008 | | Managing Director, Management, since 2008; Managing Director, Neuberger, since 2006; formerly, Senior Vice President, Neuberger, 2004 to 2006; Vice President, nine registered investment companies for which Management acts as investment manager and administrator (nine since 2008). | |
| |
| Chamaine Williams (1971) | | Chief Compliance Officer since 2005 | | Senior Vice President, Neuberger, since 2007; Chief Compliance Officer, Management, since 2006; Chief Compliance Officer, nine registered investment companies for which Management acts as investment manager and administrator (eight since 2005 and one since 2006); formerly, Senior Vice President, LBI, 2007 to 2008; formerly, Vice President, LBI, 2003 to 2006; formerly, Chief Compliance Officer, Lehman Brothers Asset Management Inc., 2003 to 2007; formerly, Chief Compliance Officer, Lehman Brothers Alternative Investment Management LLC, 2003 to 2007. | |
| |
(1) The business address of each listed person is 605 Third Avenue, New York, New York 10158.
(2) Pursuant to the By-Laws of the Trust, each officer elected by the Trustees shall hold office until his or her successor shall have been elected and qualified or until his or her earlier death, inability to serve, or resignation. Officers serve at the pleasure of the Trustees and may be removed at any time with or without cause.
(3) Except as otherwise indicated, each individual has held the positions shown for at least the last five years.
33
Proxy Voting Policies and Procedures
A description of the policies and procedures that the Trust uses to determine how to vote proxies relating to portfolio securities is available, without charge, by calling 1-800-877-9700 (toll-free) and on the website of the Securities and Exchange Commission, at www.sec.gov. Information regarding how the Trust voted proxies relating to portfolio securities during the most recent 12-month period ended June 30 is also available, without charge, by calling 1-800-877-9700 (toll-free), on the website of the Securities and Exchange Commission at www.sec.gov, and on Management's website at www.nb.com.
Quarterly Portfolio Schedule
The Trust files a complete schedule of portfolio holdings for the Fund with the Securities and Exchange Commission for the first and third quarters of each fiscal year on Form N-Q. The Trust's Forms N-Q are available on the Securities and Exchange Commission's website at www.sec.gov and may be reviewed and copied at the Securities and Exchange Commission's Public Reference Room in Washington, DC. Information on the operation of the Public Reference Room may be obtained by calling 1-800-SEC-0330. The information on Form N-Q is available upon request, without charge, by calling 1-800-877-9700 (toll free).
Board Consideration of the Management and Sub-Advisory Agreements
At a meeting held on October 13, 2011, the Board, including the Trustees who are not "interested persons" of Management (including its affiliates) or Neuberger Berman Advisers Management Trust ("Independent Fund Trustees"), approved the continuance of the Management and Sub-Advisory Agreements ("Agreements") for the Fund.
In evaluating the Agreements, the Board, including the Independent Fund Trustees, reviewed materials furnished by Management and NBFI in response to questions submitted by counsel for the Independent Fund Trustees, and met with senior representatives of Management and NBFI regarding their personnel and operations. The Independent Fund Trustees were advised by counsel that is experienced in Investment Company Act of 1940 matters and that is independent of Management and NBFI. The Independent Fund Trustees received a memorandum from independent counsel discussing the legal standards for their consideration of the proposed continuance of the Agreements. They met with such counsel separately from representatives of Management to discuss the annual contract review. The annual contract review extends over three regular meetings of the Board, including one meeting devoted primarily to reviewing and discussing Fund performance, to ensure that Management and NBFI have time to respond to any questions the Independent Fund Trustees may have on their initial review of the report and that the Independent Fund Trustees have time to consider those responses.
The Board considered the following factors, among others, in connection with its approval of the continuance of the Agreements: (1) the nature, extent, and quality of the services provided by Management and NBFI; (2) the performance of the Fund compared to a relevant market index and a peer group of investment companies; (3) the costs of the services provided and profits or losses realized by Management and its affiliates from their relationship with the Fund; (4) the extent to which economies of scale might be realized as the Fund grows; and (5) whether fee levels reflect any such potential economies of scale for the benefit of investors in the Fund. In their deliberations, the Board members did not identify any particular information that was all-important or controlling, and each Trustee may have attributed different weights to the various factors.
The Board evaluated the terms of the Agreements, the overall fairness of the Agreements to the Fund and whether the Agreements were in the best interests of the Fund and its shareholders.
With respect to the nature, extent and quality of the services provided, the Board considered the performance of the Fund and the experience and staffing of the portfolio management and investment research personnel of Management and NBFI who perform services for the Fund. The Board noted that Management also provides certain administrative
34
services, including fund accounting and compliance oversight. In addition, the Board noted the positive compliance history of Management and NBFI, as each firm has been free of significant reported compliance problems.
The Board considered the performance of the Fund relative to its benchmark and the average performance of composite peer groups of investment companies pursuing broadly similar strategies. The Board also reviewed performance in relation to certain measures of the degree of investment risk undertaken by the portfolio managers, during the period. The Board discussed the Fund's performance with Management and discussed steps that Management had taken, or intended to take, to improve the Fund's performance. The Board also considered Management's resources and responsiveness with respect to the Fund.
With respect to the overall fairness of the Agreements, the Board considered the fee structure for the Fund under the Agreements as compared to a peer group of comparable funds and any fall-out benefits likely to accrue to Management or NBFI or their affiliates from their relationship with the Fund. The Board also considered the profitability of Management and its affiliates from their association with the Fund.
The Board reviewed a comparison of the Fund's management fee and overall expense ratio to a peer group of broadly comparable funds. The Board considered the mean and median of the management fees and expense ratios of the peer group. The Board noted that the Fund's management fee was higher than the peer group mean and median. The Board considered whether specific portfolio management or administration needs contributed to the management fee. With regard to the sub-advisory fee paid to NBFI, the Board noted that this fee is "at cost." In addition, the Board considered the contractual limit on Fund expenses undertaken by Management.
The Board considered whether there were other funds that were advised or sub-advised by Management or its affiliates or separate accounts managed by Management or its affiliates with similar investment objectives, policies and strategies to the Fund. The Board noted that there were no comparable sub-advised funds. The Board compared the fees charged to the Fund to the fees charged to a registered fund and a separate account, each managed by Management in a similar style to the Fund. The Board considered the appropriateness and reasonableness of any differences between the fees charged to the Fund and the other fund and the separate account and determined that the differences in fees were consistent with the management and other services provided.
The Board also evaluated any apparent or anticipated economies of scale in relation to the services Management provides to the Fund. The Board considered whether the Fund's fee structure provides for a reduction of payments resulting from the use of breakpoints and whether those breakpoints are set at appropriate asset levels. In concluding that the benefits accruing to Management and its affiliates by virtue of their relationship to the Fund were reasonable in comparison with the costs of providing the investment advisory services and the benefits accruing to the Fund, the Board reviewed specific data as to Management's profit on the Fund for a recent period and the trend in profit or loss over recent years. The Board also carefully examined Management's cost allocation methodology. The Board recognized that Management should be entitled to earn a reasonable level of profits for services it provides to the Fund and, based on its review, concluded that Management's level of profitability was not excessive.
Conclusions
In approving the Agreements, the Board concluded that the terms of each Agreement are fair and reasonable and that approval of the Agreements is in the best interests of the Fund and its shareholders. In reaching this determination, the Board considered that Management and NBFI could be expected to provide a high level of service to the Fund; that it retained confidence in Management's and Neuberger's capabilities to manage the Fund; that the Fund's fee structure appeared to the Board to be reasonable given the nature and quality of services provided; and that the benefits accruing to Management and its affiliates by virtue of their relationship to the Fund were reasonable in comparison with the benefits accruing to the Fund.
35
Neuberger Berman
Advisers Management Trust
Small Cap Growth Portfolio
S Class Shares
Annual Report
December 31, 2011
D0081 02/12
Small Cap Growth Portfolio Commentary (Unaudited)
The Neuberger Berman Advisers Management Trust (AMT) Small Cap Growth Portfolio generated a –1.06% total return for the fiscal year ended December 31, 2011, outperforming its benchmark, the Russell 2000® Growth Index, which returned –2.91% for the same period.
The fourth quarter of 2011 brought to close a year in which macro and political headlines overshadowed fundamentals. Characterized by "risk-on, risk-off" volatility and highly correlated market moves that failed to differentiate between companies, 2011, much like 2010, was plagued by Europe's unresolved debt crisis, political gridlock and acrimony in Washington and concerns over China's management of its growth.
However, despite the broader negative sentiment and legitimate risks to both a domestic and global recovery, there were encouraging signs. While the pace of the U.S. economic recovery remained muted, it nonetheless continued to march in the right direction. Although volatility posed certain problems it also afforded opportunities, as we believe valuations for quality small-cap stocks moved from fair to attractive during the year. Overall, and relative to other options, the U.S. equity market was attractive with corporate balance sheets continuing to gain strength, strong earnings, lean inventories, low leverage and profit margins that, for the most part, held steady.
For the year, the Portfolio outperformed on the basis of stock selection relative to the benchmark, with Health Care, Industrials and Consumer Staples contributing the most to performance and Information Technology detracting the most from results.
With respect to allocation over the year, our overweight in Energy and underweight in Health Care weighed against positive stock selection in both sectors, while our underweight in Materials and Financials and overweight in Consumer Staples and Consumer Discretionary proved additive to returns.
PriceSmart, a business consisting primarily of international membership shopping warehouse clubs similar to warehouse clubs in the United States, was the top-performing holding for the year. PriceSmart, with an emphasis on Latin America, continued to execute and exceed expectations and its performance garnered the market's attention. HMS Holdings, a provider of cost containment and program integrity services for government and private health care payors and sponsors, benefited from its acquisition of a company that focuses on Medicare audits. Zoll Medical, which develops and markets medical devices and software solutions around resuscitation and critical care, such as defibrillators, delivered an excellent fourth quarter and benefited from a positive resolution around reimbursement for its Lifevest product. Heico, a manufacturer of FAA-approved engine and component replacement parts, benefited from the recovery in aviation and airlines' focus on cost.
Velti, a global provider of mobile marketing and advertising solutions, was negatively impacted by code compatibility issues with leading smart phone and tablet manufacturers, and the position was sold. Qlik Technologies, a provider of software solutions for data delivery, analysis and reporting solutions, detracted due to pressures caused by an anticipation of a global slowdown in financial service companies, with Europe a major source of concern, and was sold after the reporting period. Finally, Orient Express Hotels, a hotel and travel company with 50 properties located in 24 countries, was the leading detractor for the year. Despite solid execution, Orient Express, with high-end discretionary properties in Europe and in particular, Italy, was adversely affected by the global slowdown and the region's debt crisis.
At year-end, the Portfolio remained overweighted in Consumer Discretionary and Energy and underweighted in Health Care and Financials. We believe innovation and unique products and services can be catalysts for outperformance in a tough environment and the Portfolio's sector overweights reflect that belief. A lack of compelling growth has led us to underweight Financials and our tendency to shy away from biotech companies, given the volatility typically associated with the bifurcated outcomes of new drug approvals, has the Portfolio underweighted in Health Care.
As we look toward 2012, despite the many threats to both global and domestic financial stability, we remain cautiously optimistic. We anticipate that modest growth in the U.S. economy will continue, with the risk of recession already priced into the market and an economic downtown unlikely, and we believe that stocks can do well, even if the pace of economic growth remains slow. In our view, 2012 will likely be about business confidence and whether we can move beyond the
1
current fragile state and begin to log meaningful gains in hiring and capital expenditures, which in turn could lend support to the consumer. We believe there is pent-up demand, which in many cases has been on hold in developed markets since 2008. If the leaders in Washington and overseas, especially Europe, can turn uncertainties into resolutions, then hopefully companies will have the confidence to put their cash to work, providing the potential for positive momentum in our economy.
Thank you for your continued confidence in our management team. We look forward to serving your investment needs in the future.
Sincerely,
David H. Burshtan
Portfolio Manager
Information about the principal risks of investing in the Portfolio is set forth in the prospectus and statement of additional information.
The composition, industries and holding of the Portfolio are subject to change.
2
Small Cap Growth Portfolio (Unaudited)
SECTOR ALLOCATION
| (as a % of Total Investments) | |
| Consumer Discretionary | | | 15.9 | % | |
| Consumer Staples | | | 4.5 | | |
| Energy | | | 10.1 | | |
| Financials | | | 7.1 | | |
| Health Care | | | 18.0 | | |
| Industrials | | | 17.3 | | |
| Information Technology | | | 23.0 | | |
| Materials | | | 4.1 | | |
| Short-Term Investments | | | 0.0 | | |
| Total | | | 100.0 | % | |
PERFORMANCE HIGHLIGHTS1
| | | Inception | | Average Annual Total Return Ended 12/31/2011 | |
| | | Date | | 1 Year | | 5 Years | | Life of Fund* | |
| Small Cap Growth Portfolio Class S | | 07/12/2002 | | | –1.06 | % | | | –2.44 | % | | | 3.04 | % | |
Russell 2000® Index2 | | | | | –2.91 | % | | | 2.09 | % | | | 8.16 | % | |
Russell 2000® Growth Index2 | | | | | –4.18 | % | | | 0.15 | % | | | 7.65 | % | |
Performance data quoted represent past performance and do not indicate future results. The investment return and principal value of an investment will fluctuate so that an investor's shares, when redeemed, may be worth more or less than their original cost. Results are shown on a "total return" basis and include reinvestment of all income dividends and distributions.
Current performance may be lower or higher than the performance data quoted. For performance data current to the most recent month end, please visit https://www.nb.com.
* Index returns are as of the inception date 07/12/2002.
As stated in the Portfolio's most recent prospectus, the total annual operating expense ratio for fiscal year 2010 was 2.28% for Class S shares (prior to any fee waivers and/or expense reimbursements, if any). The expense ratio net of waivers and/or reimbursements was 1.41% for Class S shares. Neuberger Berman Management LLC has contractually agreed to limit certain expenses of the Portfolio through 12/31/2014.
The results shown in the table do not reflect the effect of taxes an investor would pay on Portfolio distributions or on the redemption of Portfolio shares.
COMPARISON OF A $10,000 INVESTMENT
This graph shows the change in value of a hypothetical $10,000 investment in the Portfolio over the past 10 fiscal years, or since the Portfolio's inception if it has not operated for 10 years. The result is compared with benchmarks, which include a broad-based market index and may include a more narrowly based index. Market indices have not been reduced to reflect any of the fees and costs of investing. All results include the reinvestment of income dividends and distributions. The results shown in the graph do not reflect the effect of taxes an investor would pay on Portfolio distributions or on the redemption of Portfolio shares. Results represent past performance and do not indicate future results
Please see Endnotes for additional information.
3
Endnotes (Unaudited)
1 "Total Return" includes reinvestment of all income dividends and distributions. Results represent past performance and do not indicate future results. The value of an investment in the Portfolio and the return on the investment both will fluctuate, and redemption proceeds may be higher or lower than an investor's original cost. The performance information does not reflect fees and expenses of the variable annuity and variable life insurance policies or the qualified pension and retirement plans whose proceeds are invested in the Portfolio. Neuberger Berman Management LLC ("NBM LLC") has agreed to absorb certain expenses of the AMT Portfolios, including the Portfolio. Without this arrangement, which is subject to change, the total returns of the Portfolio may have been less.
2 The Russell 2000® Growth Index measures the performance of those Russell 2000® Index companies with higher price-to-book ratios and higher forecasted growth values. The Russell 2000 Index is an unmanaged index consisting of the securities of the 2000 issuers having the smallest capitalization in the Russell 3000® Index, representing approximately 10% of the Russell 3000 total market capitalization. As of the latest reconstitution the smallest company's market capitalization was roughly $130 million. Please note that indices do not take into account any fees and expenses of investing in the individual securities that they track and that individuals cannot invest directly in any index. Data about the performance of these indices are prepared or obtained by NBM LLC and include reinvestment of all income dividends and distributions. The Fund may invest in securities not included in the above-described indices and may not invest in all securities included in the above-described indices.
Any ratios or other measurements using a factor of forecasted earnings of a company discussed herein are based on consensus estimates, not NBM LLC's own projections, and they may or may not be realized. In addition, any revision to a forecast could affect the market price of a security. By quoting them herein, NBM LLC does not offer an opinion as to the accuracy of and does not guarantee these forecasted numbers.
The investments for the Portfolio are managed by the same portfolio manager(s) who manage(s) one or more other registered funds that have similar names, investment objectives and investment styles as the Portfolio. You should be aware that the Portfolio is likely to differ from the other mutual funds in size, cash flow pattern and tax matters. Accordingly, the holdings and performance can be expected to vary from those of the other mutual funds.
The composition, industries and holdings of the Portfolio are subject to change.
Shares of the separate AMT Portfolios are not available to the general public. Shares of this Portfolio may be purchased only by life insurance companies to be used with their separate accounts that fund variable annuity and variable life insurance policies and by qualified pension and retirement plans.
Statistics and projections in this report are derived from sources deemed to be reliable but cannot be regarded as a representation of future results of the AMT Portfolios. This report is prepared for the general information of shareholders and is not an offer of shares of the AMT Portfolios. Shares of the AMT Portfolios are sold only through the currently effective prospectuses, which must precede or accompany this report.
The "Neuberger Berman" name and logo are registered service marks of Neuberger Berman Group LLC. "Neuberger Berman Management LLC" and the individual Fund names in this piece are either service marks or registered service marks of Neuberger Berman Management LLC.
© 2012 Neuberger Berman Management LLC distributor. All rights reserved.
4
Information About Your Fund's Expenses (Unaudited)
This table is designed to provide information regarding costs related to your investments. All mutual funds incur operating expenses, which include management fees, fees for administrative services and costs of shareholder reports, among others. The following examples are based on an investment of $1,000 made at the beginning of the six month period ended December 31, 2011 and held for the entire period. The table illustrates the fund's costs in two ways:
| Actual Expenses and Performance: | | The first section of the table provides information about actual account values and actual expenses in dollars, based on the fund's actual performance during the period. You may use the information in this line, together with the amount you invested, to estimate the expenses you paid over the period. Simply divide your account value by $1,000 (for example, an $8,600 account value divided by $1,000 = 8.6), then multiply the result by the number in the first section of the table under the heading entitled "Expenses Paid During the Period" to estimate the expenses you paid over the period. | |
| |
Hypothetical Example for Comparison Purposes: | | The second section of the table provides information about hypothetical account values and hypothetical expenses based on the fund's actual expense ratio and an assumed rate of return at 5% per year before expenses. This return is not the fund's actual return. The hypothetical account values and expenses may not be used to estimate the actual ending account balance or expenses you paid for the period. You may use this information to compare the ongoing costs of investing in this fund versus other funds. To do so, compare the expenses shown in this 5% hypothetical example with the 5% hypothetical examples that appear in the shareholder reports of other funds. | |
| |
Please note that the expenses in the table are meant to highlight your ongoing costs only. The table and expense example do not include any transaction costs, such as fees and expenses that are, or may be, imposed under your variable contract or qualified pension plan. Therefore, the information under the heading "Hypothetical (5% annual return before expenses)" is useful in comparing ongoing costs only, and will not help you determine the relative total costs of owning different funds. In addition, if these transaction costs were included, your costs would have been higher.
Expense Information as of 12/31/11
NEUBERGER BERMAN ADVISERS MANAGEMENT TRUST SMALL CAP GROWTH PORTFOLIO
| Actual | | Beginning Account Value 7/1/11 | | Ending Account Value 12/31/11 | | Expenses Paid During the Period* 7/1/11 – 12/31/11 | |
| Class S | | $ | 1,000.00 | | | $ | 891.30 | | | $ | 6.82 | | |
| Hypothetical (5% annual return before expenses)** | |
| Class S | | $ | 1,000.00 | | | $ | 1,018.00 | | | $ | 7.27 | | |
* Expenses are equal to the annualized expense ratio of 1.43%, multiplied by the average account value over the period, multiplied by 184/365 (to reflect the one-half year period shown).
** Hypothetical 5% annual return before expenses is calculated by multiplying the number of days in the most recent half year divided by 365.
5
Schedule of Investments Small Cap Growth Portfolio
| NUMBER OF SHARES | | | | VALUE† | |
| Common Stocks (99.8%) | | | |
| Aerospace & Defense (4.2%) | | | |
| | 6,943 | | | HEICO Corp. | | $ | 406,027 | | |
| | 5,000 | | | Triumph Group | | | 292,250 | | |
| | | | 698,277 | | |
| Air Freight & Logistics (1.2%) | | | |
| | 6,300 | | | Hub Group Class A | | | 204,309 | * | |
| Biotechnology (2.9%) | | | |
| | 7,800 | | | Cubist Pharmaceuticals | | | 309,036 | * | |
| | 3,700 | | | Onyx Pharmaceuticals | | | 162,615 | * | |
| | | | 471,651 | | |
| Building Products (1.1%) | | | �� |
| | 10,700 | | | Fortune Brands Home & Security | | | 182,221 | * | |
| Capital Markets (2.4%) | | | |
| | 8,900 | | | Lazard Ltd. Class A | | | 232,379 | | |
| | 5,300 | | | Stifel Financial | | | 169,865 | * | |
| | | | 402,244 | | |
| Chemicals (1.0%) | | | |
| | 4,200 | | | Balchem Corp. | | | 170,268 | | |
| Commercial Banks (2.4%) | | | |
| | 7,400 | | | Texas Capital Bancshares | | | 226,514 | * | |
| | 13,000 | | | Umpqua Holdings | | | 161,070 | | |
| | | | 387,584 | | |
| Commercial Services & Supplies (1.4%) | | | |
| | 3,500 | | | Clean Harbors | | | 223,055 | * | |
| Consumer Finance (1.2%) | | | |
| | 5,700 | | | First Cash Financial Services | | | 200,013 | * | |
| Containers & Packaging (1.5%) | | | |
| | 6,400 | | | Silgan Holdings | | | 247,296 | | |
| Diversified Consumer Services (1.3%) | | | |
| | 4,700 | | | Steiner Leisure | | | 213,333 | * | |
| Electrical Equipment (1.0%) | | | |
| | 3,200 | | | Regal-Beloit | | | 163,104 | | |
| NUMBER OF SHARES | | | | VALUE† | |
| Energy Equipment & Services (2.9%) | | | |
| | 2,700 | | | Dril-Quip Inc. | | $ | 177,714 | * | |
| | 5,000 | | | Hornbeck Offshore Services | | | 155,100 | * | |
| | 2,100 | | | Lufkin Industries | | | 141,351 | | |
| | | | 474,165 | | |
| Food & Staples Retailing (1.8%) | | | |
| | 4,200 | | | PriceSmart, Inc. | | | 292,278 | | |
| Health Care Equipment & Supplies (3.1%) | | | |
| | 6,100 | | | Align Technology | | | 144,722 | * | |
| | 5,900 | | | Zoll Medical | | | 372,762 | * | |
| | | | 517,484 | | |
| Health Care Providers & Services (7.0%) | | | |
| | 3,600 | | | Air Methods | | | 304,020 | * | |
| | 5,700 | | | Centene Corp. | | | 225,663 | * | |
| | 7,300 | | | HMS Holdings | | | 233,454 | * | |
| | 10,900 | | | U.S. Physical Therapy | | | 214,512 | | |
| | 3,200 | | | WellCare Health Plans | | | 168,000 | * | |
| | | | 1,145,649 | | |
| Health Care Technology (1.6%) | | | |
| | 4,800 | | | SXC Health Solutions | | | 271,104 | * | |
| Hotels, Restaurants & Leisure (5.9%) | | | |
| | 5,400 | | | Bally Technologies | | | 213,624 | * | |
| | 2,800 | | | Buffalo Wild Wings | | | 189,028 | * | |
| | 10,200 | | | Marriott Vacations Worldwide | | | 175,032 | * | |
| | 25,100 | | | Orient-Express Hotels Class A | | | 187,497 | * | |
| | 3,200 | | | Peet's Coffee & Tea | | | 200,576 | * | |
| | | | 965,757 | | |
| Internet Software & Services (4.3%) | | | |
| | 7,400 | | | DealerTrack Holdings | | | 201,724 | * | |
| | 4,400 | | | Keynote Systems | | | 90,376 | | |
| | 15,300 | | | LivePerson, Inc. | | | 192,015 | * | |
| | 5,200 | | | Rackspace Hosting | | | 223,652 | * | |
| | | | 707,767 | | |
| IT Services (3.6%) | | | |
| | 1,000 | | | Cardtronics, Inc. | | | 27,060 | * | |
| | 12,700 | | | Echo Global Logistics | | | 205,105 | * | |
| | 7,800 | | | Heartland Payment Systems | | | 190,008 | | |
| | 10,700 | | | ServiceSource International | | | 167,883 | * | |
| | | | 590,056 | | |
| Machinery (2.7%) | | | |
| | 13,700 | | | Actuant Corp. Class A | | | 310,853 | | |
| | 2,600 | | | CLARCOR Inc. | | | 129,974 | | |
| | | | 440,827 | | |
See Notes to Schedule of Investments
6
| NUMBER OF SHARES | | | | VALUE† | |
| Metals & Mining (1.6%) | | | |
| | 5,000 | | | Carpenter Technology | | $ | 257,400 | | |
| Oil, Gas & Consumable Fuels (7.2%) | | | |
| | 8,900 | | | Carrizo Oil & Gas | | | 234,515 | * | |
| | 8,200 | | | Northern Oil and Gas | | | 196,636 | * | |
| | 8,800 | | | Oasis Petroleum | | | 255,992 | * | |
| | 10,100 | | | Rex Energy | | | 149,076 | * | |
| | 4,000 | | | Rosetta Resources | | | 174,000 | * | |
| | 4,100 | | | World Fuel Services | | | 172,118 | | |
| | | | 1,182,337 | | |
| Personal Products (2.7%) | | | |
| | 7,000 | | | Elizabeth Arden | | | 259,280 | * | |
| | 3,800 | | | Nu Skin Asia Pacific | | | 184,566 | | |
| | | | 443,846 | | |
| Pharmaceuticals (3.4%) | | | |
| | 19,000 | | | Akorn, Inc. | | | 211,280 | * | |
| | 3,600 | | | Questcor Pharmaceuticals | | | 149,688 | * | |
| | 4,000 | | | Salix Pharmaceuticals | | | 191,400 | * | |
| | | | 552,368 | | |
| Professional Services (2.6%) | | | |
| | 3,200 | | | CoStar Group | | | 213,536 | * | |
| | 5,400 | | | Huron Consulting Group | | | 209,196 | * | |
| | | | 422,732 | | |
Real Estate Management & Development (1.1%) | | | |
| | 2,900 | | | Jones Lang LaSalle | | | 177,654 | | |
| Road & Rail (1.7%) | | | |
| | 6,900 | | | Old Dominion Freight Line | | | 279,657 | * | |
Semiconductors & Semiconductor Equipment (6.0%) | | | |
| | 8,400 | | | Cavium Inc. | | | 238,812 | * | |
| | 5,700 | | | CEVA, Inc. | | | 172,482 | * | |
| | 6,200 | | | Mellanox Technologies | | | 201,438 | * | |
| | 6,500 | | | Semtech Corp. | | | 161,330 | * | |
| | 8,300 | | | Volterra Semiconductor | | | 212,563 | * | |
| | | | 986,625 | | |
| Software (9.0%) | | | |
| | 3,700 | | | Ariba, Inc. | | | 103,896 | * | |
| | 3,600 | | | CommVault Systems | | | 153,792 | * | |
| | 4,500 | | | Concur Technologies | | | 228,555 | * | |
| | 5,000 | | | Imperva Inc. | | | 174,050 | * | |
| | 3,400 | | | QLIK Technologies | | | 82,280 | * | |
| | 8,300 | | | Taleo Corp. Class A | | | 321,127 | * | |
| | 6,500 | | | Ultimate Software Group | | | 423,280 | * | |
| | | | 1,486,980 | | |
| NUMBER OF SHARES | | | | VALUE† | |
| Specialty Retail (8.7%) | | | |
| | 2,600 | | | DSW Inc. Class A | | $ | 114,946 | | |
| | 2,800 | | | Genesco Inc. | | | 172,872 | * | |
| | 5,400 | | | Hibbett Sports | | | 243,972 | * | |
| | 7,900 | | | Sally Beauty Holdings | | | 166,927 | * | |
| | 3,200 | | | Tractor Supply | | | 224,480 | | |
| | 4,100 | | | Ulta Salon, Cosmetics & Fragrance | | | 266,172 | * | |
| | 6,200 | | | Vitamin Shoppe | | | 247,256 | * | |
| | | | 1,436,625 | | |
| Trading Companies & Distributors (1.3%) | | | |
| | 2,900 | | | MSC Industrial Direct Class A | | | 207,495 | | |
| | | | | Total Common Stocks (Cost $15,726,901) | | | 16,402,161 | | |
| Short-Term Investments (0.0%) | | | |
| | 1 | | | State Street Institutional Liquid Reserves Fund Institutional Class (Cost $1) | | | 1 | | |
| | | | | Total Investments (99.8%) (Cost $15,726,902) | | | 16,402,162## | | |
| | | | | Cash, receivables and other assets, less liabilities (0.2%) | | | 26,210 | | |
| | | | | Total Net Assets (100.0%) | | $ | 16,428,372 | | |
See Notes to Schedule of Investments
7
Notes to Schedule of Investments Small Cap Growth Portfolio
† In accordance with Accounting Standards Codification ("ASC") 820 "Fair Value Measurements and Disclosures" ("ASC 820"), all investments held by Neuberger Berman Advisers Management Trust Small Cap Growth Portfolio (the "Fund") are carried at the value that Neuberger Berman Management LLC ("Management") believes the Fund would receive upon selling an investment in an orderly transaction to an independent buyer in the principal or most advantageous market for the investment under current market conditions. Various inputs, including the volume and level of activity for the asset or liability in the market, are considered in valuing the Fund's investments, some of which are discussed below. Significant management judgment may be necessary to value investments in accordance with ASC 820.
ASC 820 established a three-tier hierarchy of inputs to create a classification of value measurements for disclosure purposes. The three-tier hierarchy of inputs is summarized in the three broad Levels listed below.
• Level 1 – quoted prices in active markets for identical investments
• Level 2 – other significant observable inputs (including quoted prices for similar investments, interest rates, prepayment speeds, credit risk, amortized cost, etc.)
• Level 3 – significant unobservable inputs (including the Fund's own assumptions in determining the fair value of investments)
The inputs or methodology used for valuing an investment are not necessarily an indication of the risk associated with investing in those securities.
The value of the Fund's investments in equity securities, for which market quotations are readily available, is generally determined by Management by obtaining valuations from an independent pricing service based on the latest sale price quoted on a principal exchange or market for that security (Level 1 inputs). Securities traded primarily on the NASDAQ Stock Market are normally valued by the Fund at the NASDAQ Official Closing Price ("NOCP") provided by NASDAQ each business day. The NOCP is the most recently reported price as of 4:00:02 p.m., Eastern time, unless that price is outside the range of the "inside" bid and asked prices (i.e., the bid and asked prices that dealers quote to each other when trading for their own accounts); in that case, NASDAQ will adjust the price to equal the inside bid or asked price, whichever is closer. Because of delays in reporting trades, the NOCP may not be based on the price of the last trade to occur before the market closes. If there is no reported sale of a security on a particular day, the independent pricing service may value the security based on reported market quotations.
Management has developed a process to periodically review information provided by independent pricing services for all types of securities.
Investments in State Street Institutional Liquid Reserves Fund Institutional Class are valued using the fund's daily calculated net asset value per share (Level 2 inputs).
If a valuation is not available from an independent pricing service, or if Management has reason to believe that the valuation received does not represent the amount the Fund might reasonably expect to receive on a current sale in an orderly transaction, the Fund seeks to obtain quotations from principal market makers (generally considered Level 3 inputs). If such quotations are not readily available, the security is valued using methods the Neuberger Berman Advisers Management Trust's Board of Trustees (the "Board") has approved on the belief that they reflect fair value. Numerous factors may be considered when determining the fair value of a security based on Level 2 or 3 inputs, including available analyst, media or other reports, trading in futures or ADRs and whether the issuer of the security being fair valued has other securities outstanding.
The value of the Fund's investments in foreign securities is generally determined using the same valuation methods and inputs as other Fund investments, as discussed above. Foreign security prices expressed in local currency values
See Notes to Financial Statements
8
Notes to Schedule of Investments Small Cap Growth Portfolio (cont'd)
are translated from the local currency into U.S. dollars using the exchange rates as of 4:00 p.m., Eastern time. The Board has approved the use of Interactive Data Pricing and Reference Data, Inc. ("Interactive") to assist in determining the fair value of foreign equity securities when changes in the value of a certain index suggest that the closing prices on the foreign exchanges may no longer represent the amount that the Fund could expect to receive for those securities. In this event, Interactive will provide adjusted prices for certain foreign equity securities using a statistical analysis of historical correlations of multiple factors (Level 2 inputs). In the absence of precise information about the market values of these foreign securities as of the close of the New York Stock Exchange, the Board has determined on the basis of available data that prices adjusted in this way are likely to be closer to the prices the Fund could realize on a current sale than are the prices of those securities established at the close of the foreign markets in which the securities primarily trade.
Fair value prices are necessarily estimates, and there is no assurance that such a price will be at or close to the price at which the security is next quoted or next trades.
The following is a summary, categorized by Level, of inputs used to value the Fund's investments as of December 31, 2011:
| Asset Valuation Inputs | | Level 1 | | Level 2 | | Level 3 | | Total | |
| Investments: | |
| Common Stocks^ | | $ | 16,402,161 | | | $ | — | | | $ | — | | | $ | 16,402,161 | | |
| Short-Term Investments | | | — | | | | 1 | | | | — | | | | 1 | | |
| Total Investments | | $ | 16,402,161 | | | $ | 1 | | | $ | — | | | $ | 16,402,162 | | |
^ The Schedule of Investments provides information on the industry categorization for the portfolio.
The Fund had no significant transfers between Levels 1 and 2 during the year ended December 31, 2011.
## At December 31, 2011, the cost of investments for U.S. federal income tax purposes was $15,851,140. Gross unrealized appreciation of investments was $985,386 and gross unrealized depreciation of investments was $434,364, resulting in net unrealized appreciation of $551,022, based on cost for U.S. federal income tax purposes.
* Security did not produce income during the last twelve months.
See Notes to Financial Statements
9
Statement of Assets and Liabilities
Neuberger Berman Advisers Management Trust
| | | SMALL CAP GROWTH PORTFOLIO | |
| | | December 31, 2011 | |
| Assets | |
| Investments in securities, at value* (Note A)—see Schedule of Investments: | |
| Unaffiliated issuers | | $ | 16,402,162 | | |
| Dividends and interest receivable | | | 2,410 | | |
| Receivable for securities sold | | | 164,749 | | |
| Receivable for Fund shares sold | | | 1,658 | | |
| Receivable from Management—net (Note B) | | | 6,362 | | |
| Prepaid expenses and other assets | | | 463 | | |
| Total Assets | | | 16,577,804 | | |
| Liabilities | |
| Due to custodian | | | 12,987 | | |
| Payable for securities purchased | | | 33,221 | | |
| Payable for Fund shares redeemed | | | 36,547 | | |
| Payable to investment manager (Note B) | | | 12,087 | | |
| Accrued expenses and other payables | | | 54,590 | | |
| Total Liabilities | | | 149,432 | | |
| Net Assets at value | | $ | 16,428,372 | | |
| Net Assets consist of: | |
| Paid-in capital | | $ | 19,967,099 | | |
| Accumulated net realized gains (losses) on investments | | | (4,213,987 | ) | |
| Net unrealized appreciation (depreciation) in value of investments | | | 675,260 | | |
| Net Assets at value | | $ | 16,428,372 | | |
| Shares Outstanding ($.001 par value; unlimited shares authorized) | | | 1,354,720 | | |
| Net Asset Value, offering and redemption price per share | | $ | 12.13 | | |
| *Cost of Investments: | |
| Unaffiliated issuers | | $ | 15,726,902 | | |
See Notes to Financial Statements
10
Statement of Operations
Neuberger Berman Advisers Management Trust
| | | SMALL CAP GROWTH PORTFOLIO | |
| | | For the Year Ended December 31, 2011 | |
| Investment Income: | |
| Income (Note A): | |
| Dividend income—unaffiliated issuers | | $ | 58,347 | | |
| Interest income—unaffiliated issuers | | | 912 | | |
| Foreign taxes withheld | | | (840 | ) | |
| Total income | | $ | 58,419 | | |
| Expenses: | |
| Investment management fees (Note B) | | | 166,256 | | |
| Administration fees (Note B) | | | 58,678 | | |
| Distribution fees (Note B) | | | 48,899 | | |
| Audit fees | | | 41,935 | | |
| Custodian fees (Note A) | | | 20,033 | | |
| Insurance expense | | | 1,303 | | |
| Legal fees | | | 10,836 | | |
| Shareholder reports | | | 22,336 | | |
| Trustees' fees and expenses | | | 55,592 | | |
| Miscellaneous | | | 3,764 | | |
| Total expenses | | | 429,632 | | |
| Expenses reimbursed by Management (Note B) | | | (153,311 | ) | |
| Expenses reduced by custodian fee expense offset arrangement (Note A) | | | (4 | ) | |
| Total net expenses | | | 276,317 | | |
| Net investment income (loss) | | $ | (217,898 | ) | |
| Realized and Unrealized Gain (Loss) on Investments (Note A): | |
| Net realized gain (loss) on: | |
| Sales of investment securities of unaffiliated issuers | | | 2,755,275 | | |
| Change in net unrealized appreciation (depreciation) in value of: | |
| Unaffiliated investment securities | | | (3,317,347 | ) | |
| Net gain (loss) on investments | | | (562,072 | ) | |
| Net increase (decrease) in net assets resulting from operations | | $ | (779,970 | ) | |
See Notes to Financial Statements
11
Statements of Changes in Net Assets
Neuberger Berman Advisers Management Trust
| | | SMALL CAP GROWTH PORTFOLIO | |
| | | Year Ended December 31, 2011 | | Year Ended December 31, 2010 | |
| Increase (Decrease) in Net Assets: | |
| From Operations (Note A): | |
| Net investment income (loss) | | $ | (217,898 | ) | | $ | (182,947 | ) | |
| Net realized gain (loss) on investments | | | 2,755,275 | | | | 2,393,863 | | |
| Change in net unrealized appreciation (depreciation) of investments | | | (3,317,347 | ) | | | 424,741 | | |
| Net increase (decrease) in net assets resulting from operations | | | (779,970 | ) | | | 2,635,657 | | |
| From Fund Share Transactions (Note D): | |
| Proceeds from shares sold | | | 16,549,002 | | | | 10,057,048 | | |
| Payments for shares redeemed | | | (20,324,016 | ) | | | (7,722,546 | ) | |
| Net increase (decrease) from Fund share transactions | | | (3,775,014 | ) | | | 2,334,502 | | |
| Net Increase (Decrease) in Net Assets | | | (4,554,984 | ) | | | 4,970,159 | | |
| Net Assets: | |
| Beginning of year | | | 20,983,356 | | | | 16,013,197 | | |
| End of year | | $ | 16,428,372 | | | $ | 20,983,356 | | |
| Undistributed net investment income (loss) at end of year | | $ | — | | | $ | — | | |
See Notes to Financial Statements
12
Notes to Financial Statements Small Cap Growth Portfolio
Note A—Summary of Significant Accounting Policies:
1 General: The Fund is a separate operating series of Neuberger Berman Advisers Management Trust (the "Trust"), a Delaware statutory trust organized pursuant to a Trust Instrument dated May 23, 1994. The Trust is currently comprised of ten separate operating series (each individually a "Series," and collectively the "Funds") each of which is diversified. The Trust is registered as an open-end management investment company under the Investment Company Act of 1940, as amended (the "1940 Act"), and its shares are registered under the Securities Act of 1933, as amended. The Fund currently offers only Class S shares. The Board may establish additional series or classes of shares without the approval of shareholders.
The assets of each Series belong only to that Series, and the liabilities of each Series are borne solely by that Series and no other.
The preparation of financial statements in accordance with U.S. generally accepted accounting principles ("GAAP") requires Management to make estimates and assumptions at the date of the financial statements. Actual results could differ from those estimates.
2 Portfolio valuation: Investment securities are valued as indicated in the notes following the Schedule of Investments.
3 Foreign currency translation: The accounting records of the Fund are maintained in U.S. dollars. Foreign currency amounts are translated into U.S. dollars using the exchange rate as of 4:00 p.m., Eastern time, to determine the value of investments, other assets and liabilities. Purchase and sale prices of securities, and income and expenses, are translated into U.S. dollars at the prevailing rate of exchange on the respective dates of such transactions. Net unrealized foreign currency gain (loss), if any, arises from changes in the value of assets and liabilities, other than investments in securities, as a result of changes in exchange rates and is stated separately in the Statement of Operations.
4 Securities transactions and investment income: Securities transactions are recorded on trade date for financial reporting purposes. Dividend income is recorded on the ex-dividend date or, for certain foreign dividends, as soon as the Fund becomes aware of the dividends. Non-cash dividends included in dividend income, if any, are recorded at the fair market value of the securities received. Interest income, including accretion of original issue discount, where applicable, and accretion of discount on short-term investments, if any, is recorded on the accrual basis. Realized gains and losses from securities transactions and foreign currency transactions, if any, are recorded on the basis of identified cost and stated separately in the Statement of Operations. Included in net realized gain (loss) on investments are proceeds from the settlements of class action litigation in which the Fund participated as a class member. The amount of such proceeds for the year ended December 31, 2011 was $538.
5 Income tax information: The Funds are treated as separate entities for U.S. federal income tax purposes. It is the policy of the Fund to continue to qualify as a regulated investment company by complying with the requirements of the U.S. Internal Revenue Code applicable to regulated investment companies and to distribute substantially all of its earnings to its shareholders. To the extent the Fund distributes substantially all of its earnings to shareholders, no federal income or excise tax provision is required.
The Fund has adopted the provisions of ASC 740 "Income Taxes" ("ASC 740"). ASC 740 sets forth a minimum threshold for financial statement recognition of a tax position taken, or expected to be taken, in a tax return. The Fund recognizes interest and penalties, if any, related to unrecognized tax positions as an income tax expense in the Statement of Operations. The Fund is subject to examination by U.S. federal and state tax authorities for returns filed for the prior three fiscal years 2008 - 2010. As of December 31, 2011, the Fund did not have any unrecognized tax positions.
13
Income distributions and capital gain distributions are determined in accordance with income tax regulations, which may differ from GAAP. These differences are primarily due to differing treatments of income and gains on various investment securities held by the Fund, timing differences and differing characterization of distributions made by the Fund as a whole. The Fund may also utilize earnings and profits distributed to shareholders on redemption of shares as a part of the dividends paid deduction for income tax purposes.
As determined on December 31, 2011, permanent differences resulting primarily from different book and tax accounting for net operating losses and non-taxable dividend adjustments to income were reclassified at fiscal year-end. These reclassifications had no effect on net income, net asset value ("NAV") or NAV per share of the Fund. For the year ended December 31, 2011, the Fund recorded the following permanent reclassifications:
| Paid-in Capital | | Undistributed Net Investment Income (Loss) | | Accumulated Net Realized Gains (Losses) on Investments | |
| $ | (218,193 | ) | | $ | 217,898 | | | $ | 295 | | |
For tax purposes, short-term gains are considered ordinary income.
As of December 31, 2011, the components of distributable earnings (accumulated losses) on a U.S. federal income tax basis were as follows:
Undistributed Long-Term Gain | | Unrealized Appreciation (Depreciation) | | Loss Carryforwards and Deferrals | | Other Temporary Differences | | Total | |
| $ | — | | | $ | 551,022 | | | $ | (4,089,749 | ) | | $ | — | | | $ | (3,538,727 | ) | |
The difference between book basis and tax basis distributable earnings is attributable primarily to timing differences of wash sales and capital loss carryforwards.
To the extent the Fund's net realized capital gains, if any, can be offset by capital loss carryforwards, it is the policy of the Fund not to distribute such gains. The Regulated Investment Company ("RIC") Modernization Act of 2010 (the "Act") became effective for the Fund on January 1, 2011. The Act modernizes several of the federal income and excise tax provisions related to RICs. Among the changes made are changes to the capital loss carryforward rules allowing for RICs to carry forward capital losses indefinitely and to retain the character of capital loss carryforwards as short-term or long-term ("Post-Enactment"). Rules in effect previously limited the carryforward period to eight years and all carryforwards were considered short-term in character ("Pre-Enactment"). As determined at December 31, 2011, the Fund had unused capital loss carryforwards available for federal income tax purposes to offset net realized capital gains, if any, as follows:
| Pre-Enactment | | Post-Enactment (No Expiration Date) | |
| Expiring in: | | Long-Term | | Short-Term | |
| 2016 | | 2017 | | | | | |
| $ | 47,947 | | | $ | 4,041,802 | | | $ | — | | | $ | — | | |
Post-Enactment capital loss carryforwards must be fully used before Pre-Enactment capital loss carryforwards; therefore, under certain circumstances, Pre-Enactment capital loss carryforwards available as of the report date may expire unused.
During the year ended December 31, 2011, the Fund utilized capital loss carryforwards of $2,771,478.
6 Distributions to shareholders: The Fund may earn income, net of expenses, daily on its investments. Distributions from net investment income and net realized capital gains, if any, generally are distributed once a year (usually in October). Income distributions and capital gain distributions to shareholders are recorded on the ex-date.
14
7 Foreign taxes: Foreign taxes withheld represent amounts withheld by foreign tax authorities, net of refunds recoverable.
8 Expense allocation: Certain expenses are applicable to multiple funds. Expenses directly attributable to a Series are charged to that Series. Expenses of the Trust that are not directly attributable to a particular series of the Trust (e.g., the Fund) are allocated among the series of the Trust, on the basis of relative net assets, except where a more appropriate allocation of expenses to each of the series can otherwise be made fairly. Expenses borne by the complex of related investment companies, which includes open-end and closed-end investment companies for which Management serves as investment manager, that are not directly attributable to a particular investment company in the complex (e.g., the Trust) or series thereof are allocated among the investment companies in the complex or series thereof, on the basis of relative net assets, except where a more appropriate allocation of expenses to each of the investment companies in the complex or series thereof can otherwise be made fairly.
9 Investments in foreign securities: Investing in foreign securities may involve certain sovereign and other risks, in addition to the credit and market risks normally associated with domestic securities. These additional risks include the possibility of adverse political and economic developments (including political instability, nationalization, expropriation, or confiscatory taxation) and the potentially adverse effects of unavailability of public information regarding issuers, less governmental supervision and regulation of financial markets, reduced liquidity of certain financial markets, and the lack of uniform accounting, auditing, and financial reporting standards or the application of standards that are different or less stringent than those applied in the United States. Foreign securities also may experience greater price volatility, higher rates of inflation, and delays in settlement.
10 Indemnifications: Like many other companies, the Trust's organizational documents provide that its officers and trustees are indemnified against certain liabilities arising out of the performance of their duties to the Trust. In addition, both in some of its principal service contracts and in the normal course of its business, the Trust enters into contracts that provide indemnifications to other parties for certain types of losses or liabilities. The Trust's maximum exposure under these arrangements is unknown as this could involve future claims against the Trust.
11 Expense offset arrangement: The Fund has an expense offset arrangement in connection with its custodian contract. For the year ended December 31, 2011, the impact of this arrangement was a reduction of expenses of $4.
Note B—Management Fees, Administration Fees, Distribution Arrangements, and Other Transactions with Affiliates:
Fund shares are issued and redeemed in connection with investments in and payments under certain variable annuity contracts and variable life insurance policies issued through separate accounts of life insurance companies and are also offered directly to certain qualified pension and retirement plans.
The Fund retains Management as its investment manager under a Management Agreement. For such investment management services, the Fund pays Management a fee at the annual rate of 0.85% of the first $500 million of the Fund's average daily net assets, 0.825% of the next $500 million, 0.80% of the next $500 million, 0.775% of the next $500 million, 0.75% of the next $500 million, and 0.725% of average daily net assets in excess of $2.5 billion.
The Fund retains Management as its administrator under an Administration Agreement. The Fund pays Management an administration fee at the annual rate of 0.30% of its average daily net assets under this agreement. Additionally, Management retains State Street Bank and Trust Company ("State Street") as its sub-administrator under a Sub-Administration Agreement. Management pays State Street a fee for all services received under this agreement.
Management acts as agent in arranging for the sale of Fund shares without commission and bears advertising and promotion expenses. The Board has adopted a distribution plan (the "Plan") with respect to the Fund, pursuant to Rule 12b-1 under the 1940 Act. The Plan provides that, as compensation for administrative and other services provided to the Fund, Management's activities and expenses related to the sale and distribution of the Fund's
15
shares, and ongoing services provided to investors in the Fund, Management receives from the Fund a fee at the annual rate of 0.25% of the Fund's average daily net assets. Management receives this amount to provide distribution and shareholder servicing for the Fund and pays a portion of it to institutions that provide such services. Those institutions may use the payments for, among other purposes, compensating employees engaged in sales and/or shareholder servicing. The amount of fees paid by the Fund during any year could have been more or less than the cost of distribution and other services provided to the Fund. FINRA rules limit the amount of annual distribution fees that may be paid by a mutual fund and impose a ceiling on the cumulative distribution fees paid. The Trust's Plan complies with those rules.
Management has contractually undertaken through December 31, 2014 to forgo current payment of fees and/or reimburse the Fund for its operating expenses (including fees payable to Management but excluding interest, taxes, brokerage commissions, extraordinary expenses, transaction costs and dividend expense on short sales, if any) ("Operating Expenses") which exceed, in the aggregate, 1.40% per annum of the Fund's average daily net assets (the "Expense Limitation"). For the year ended December 31, 2011, such excess expenses amounted to $153,311. The Fund has agreed to repay Management through December 31, 2017 for fees and expenses foregone and/or its excess Operating Expenses previously reimbursed by Management, so long as its annual Operating Expenses during that period do not exceed its Expense Limitation, and the repayment is made within three years after the year in which Management issued the reimbursement or waived fees. During the year ended December 31, 2011, there was no repayment to Management under its contractual expense limitation. At December 31, 2011, contingent liabilities to Management under its contractual expense limitation were as follows:
| Expiring in: | | | |
| 2012 | | 2013 | | 2014 | | Total | |
| $ | 142,078 | | | $ | 137,598 | | | $ | 153,311 | | | $ | 432,987 | | |
Neuberger Berman LLC ("Neuberger") is retained by Management to furnish it with investment recommendations and research information without added cost to the Fund. Several individuals who are officers and/or trustees of the Trust are also employees of Neuberger and/or Management.
Management and Neuberger are indirect subsidiaries of Neuberger Berman Group LLC ("NBG," and together with its consolidated subsidiaries "NB Group"). The voting equity of NBG is owned by NBSH Acquisition, LLC ("NBSH"), which was formed to facilitate the May 4, 2009 management buyout of the businesses conducted by NB Group, and Lehman Brothers Holdings Inc. ("LBHI"). NBSH, which is owned by portfolio managers, members of the NB Group management team and certain of NB Group's key employees and senior professionals, owns approximately 52% of the voting equity of NBG, and LBHI and certain of its subsidiaries own the remaining 48% of NBG's voting equity.
On December 14, 2011, the United States Bankruptcy Court for the Southern District of New York approved a motion filed by LBHI and certain of its subsidiaries, as debtors and debtors in possession, (collectively, the "Lehman Brothers Estate") that will provide NBG with the opportunity to purchase the Lehman Brothers Estate's interest in preferred and common equity of NBG. The proposed transactions, which are subject to the Lehman Brothers Estate and NBG signing definitive documentation, as well as to market conditions, would, if successfully implemented, enable NBG to have a lower cost capital structure and set it on a path to 100% employee ownership within the next five to six years.
Note C—Securities Transactions:
During the year ended December 31, 2011, there were purchase and sale transactions (excluding short-term securities) of $53,518,512 and $55,293,574 , respectively.
During the year ended December 31, 2011, no brokerage commissions on securities transactions were paid to affiliated brokers.
16
Note D—Fund Share Transactions:
Share activity for the years ended December 31, 2011 and December 31, 2010 was as follows:
| | | For the Year Ended December 31, | |
| | | 2011 | | 2010 | |
| Shares Sold | | | 1,265,572 | | | | 891,181 | | |
| Shares Redeemed | | | (1,621,981 | ) | | | (742,695 | ) | |
| Total | | | (356,409 | ) | | | 148,486 | | |
Note E—Line of Credit:
At December 31, 2011, the Fund was a participant in a single committed, unsecured $200,000,000 line of credit with State Street, to be used only for temporary or emergency purposes. Other investment companies managed by Management also participate in this line of credit on the same terms. Interest is charged on borrowings under this line of credit at the higher of (a) the Federal Funds Rate plus 1.25% per annum or (b) the Overnight LIBOR Rate plus 1.25% per annum. A commitment fee of 0.10% (0.125% prior to September 16, 2011) per annum of the available line of credit is charged, of which each participating Fund has agreed to pay its pro rata share, based on the ratio of its individual net assets to the net assets of all participants at the time the fee is due and payable. The fee is paid quarterly in arrears. Because several mutual funds participate, there is no assurance that an individual Fund will have access to all or any part of the $200,000,000 at any particular time. There were no loans outstanding pursuant to this line of credit at December 31, 2011. During the year ended December 31, 2011, the Fund did not utilize this line of credit.
Note F—Recent Accounting Pronouncement:
In May 2011, the Financial Accounting Standards Board ("FASB") issued Accounting Standards Update ("ASU") No. 2011-04 "Amendments to Achieve Common Fair Value Measurement and Disclosure Requirements in U.S. GAAP and International Financial Reporting Standards ("IFRS")." ASU No. 2011-04 amends ASC 820 to establish common requirements for measuring fair value and for disclosing information about fair value measurements in accordance with GAAP and IFRS. It will not affect the fair valuation of the Fund's investments, but rather the quantitative and qualitative disclosures in the financial statements. ASU No. 2011-04 is effective for fiscal years beginning after December 15, 2011 and for interim periods within those fiscal years. Management is currently evaluating the impact of the adoption of ASU No. 2011-04 on the Fund's financial statement disclosures.
17
Financial Highlights
Small Cap Growth Portfolio
The following table includes selected data for a share outstanding throughout each year and other performance information derived from the Financial Statements. Per share amounts that round to less than $.01 or $(.01) per share are presented as $.00 or $(.00), respectively.
| | | Year Ended December 31, | |
| | | 2011 | | 2010 | | 2009 | | 2008 | | 2007 | |
| Net Asset Value, Beginning of Year | | $ | 12.26 | | | $ | 10.25 | | | $ | 8.35 | | | $ | 14.50 | | | $ | 14.53 | | |
| Income From Investment Operations: | |
Net Investment Income (Loss)‡ | | | (.14 | ) | | | (.12 | ) | | | (.09 | ) | | | (.11 | ) | | | (.06 | ) | |
Net Gains or Losses on Securities (both realized and unrealized) | | | .01 | | | | 2.13 | | | | 1.99 | | | | (5.60 | )§§ | | | .14 | | |
| Total From Investment Operations | | | (.13 | ) | | | 2.01 | | | | 1.90 | | | | (5.71 | ) | | | .08 | | |
| Less Distributions From: | |
| Net Capital Gains | | | — | | | | — | | | | — | | | | (.44 | ) | | | (.11 | ) | |
| Tax Return of Capital | | | — | | | | — | | | | — | | | | (.00 | ) | | | — | | |
| Total Distributions | | | — | | | | — | | | | — | | | | (.44 | ) | | | (.11 | ) | |
| Net Asset Value, End of Year | | $ | 12.13 | | | $ | 12.26 | | | $ | 10.25 | | | $ | 8.35 | | | $ | 14.50 | | |
Total Return†† | | | (1.06 | )% | | | 19.61 | % | | | 22.75 | % | | | (39.47 | )% | | | .52 | % | |
| Ratios/Supplemental Data | |
| Net Assets, End of Year (in millions) | | $ | 16.4 | | | $ | 21.0 | | | $ | 16.0 | | | $ | 12.6 | | | $ | 26.7 | | |
Ratio of Gross Expenses to Average Net Assets# | | | 1.41 | % | | | 1.40 | % | | | 1.42 | % | | | 1.43 | % | | | 1.40 | % | |
Ratio of Net Expenses to Average Net Assets§ | | | 1.41 | % | | | 1.40 | % | | | 1.42 | % | | | 1.42 | % | | | 1.39 | % | |
Ratio of Net Investment Income (Loss) to Average Net Assets | | | (1.11 | )% | | | (1.15 | )% | | | (1.08 | )% | | | (.92 | )% | | | (.42 | )% | |
| Portfolio Turnover Rate | | | 279 | % | | | 243 | % | | | 300 | % | | | 323 | % | | | 38 | % | |
See Notes to Financial Highlights
18
Notes to Financial Highlights Small Cap Growth Portfolio
†† Total return based on per share NAV reflects the effects of changes in NAV on the performance of the Fund during each fiscal period and assumes income dividends and other distributions, if any, were reinvested. Results represent past performance and do not indicate future results. Current returns may be lower or higher than the performance data quoted. Investment returns and principal may fluctuate and shares when redeemed may be worth more or less than original cost. Total return would have been lower if Management had not reimbursed and/or waived certain expenses. The total return information shown does not reflect charges and other expenses that apply to the separate account or the related insurance policies, and the inclusion of these charges and other expenses would reduce the total return for all fiscal periods shown.
# The Fund is required to calculate an expense ratio without taking into consideration any expense reductions related to expense offset arrangements.
‡ Calculated based on the average number of shares outstanding during each fiscal period.
§ After reimbursement of expenses and/or waiver of a portion of the investment management fee by Management. Had Management not undertaken such actions, the annualized ratios of net expenses to average daily net assets would have been:
| | | Year Ended December 31, | |
| | | 2011 | | 2010 | | 2009 | | 2008 | | 2007 | |
| | | | | | 2.20 | % | | | 2.27 | % | | | 2.46 | % | | | 1.97 | % | | | 1.87 | % | |
§§ Included in this net loss is a voluntary reimbursement from Management for brokerage commissions from March 25, 2008 to April 15, 2008, to facilitate a restructuring of the portfolio following a change in the Fund's portfolio manager.
19
Report of Independent Registered Public Accounting Firm
To the Board of Trustees of
Neuberger Berman Advisers Management Trust and
Shareholders of Small Cap Growth Portfolio
We have audited the accompanying statement of assets and liabilities, including the schedule of investments, of Small Cap Growth Portfolio, one of the series constituting Neuberger Berman Advisers Management Trust (the "Trust"), as of December 31, 2011, and the related statement of operations for the year then ended, the statements of changes in net assets for each of the two years in the period then ended, and the financial highlights for each of the five years in the period then ended. These financial statements and financial highlights are the responsibility of the Trust's management. Our responsibility is to express an opinion on these financial statements and financial highlights based on our audits.
We conducted our audits in accordance with the standards of the Public Company Accounting Oversight Board (United States). Those standards require that we plan and perform the audit to obtain reasonable assurance about whether the financial statements and financial highlights are free of material misstatement. We were not engaged to perform an audit of the Trust's internal control over financial reporting. Our audits included consideration of internal control over financial reporting as a basis for designing audit procedures that are appropriate in the circumstances, but not for the purpose of expressing an opinion on the effectiveness of the Trust's internal control over financial reporting. Accordingly, we express no such opinion. An audit also includes examining, on a test basis, evidence supporting the amounts and disclosures in the financial statements and financial highlights, assessing the accounting principles used and significant estimates made by management, and evaluating the overall financial statement presentation. Our procedures included confirmation of securities owned as of December 31, 2011 by correspondence with the custodian and brokers or by other appropriate auditing procedures where replies from brokers were not received. We believe that our audits provide a reasonable basis for our opinion.
In our opinion, the financial statements and financial highlights referred to above present fairly, in all material respects, the financial position of Small Cap Growth Portfolio, a series of Neuberger Berman Advisers Management Trust, at December 31, 2011, the results of its operations for the year then ended, the changes in its net assets for each of the two years in the period then ended, and the financial highlights for each of the five years in the period then ended, in conformity with U.S. generally accepted accounting principles.
Boston, Massachusetts
February 10, 2012
20
Trustee and Officer Information
The following tables set forth information concerning the trustees ("Trustees") and officers ("Officers") of the Trust. All persons named as Trustees and Officers also serve in similar capacities for other funds administered or managed by Management, Neuberger and Neuberger Berman Fixed Income LLC ("NBFI"). The Statement of Additional Information includes additional information about Trustees and is available upon request, without charge, by calling (800) 877-9700.
Information about the Board of Trustees
Name, (Year of Birth), and Address(1) | | Position and Length of Time Served(2) | | Principal Occupation(s)(3) | | Number of Funds in Fund Complex Overseen by Fund Trustee | | Other Directorships Held Outside Fund Complex by Fund Trustee | |
| Independent Trustees | |
| |
| John Cannon (1930) | | Trustee since 2000 | | Consultant; formerly, Chairman, CDC Investment Advisers (registered investment adviser), 1993 to January 1999; formerly, President and Chief Executive Officer, AMA Investment Advisors, an affiliate of the American Medical Association. | | | 47 | | | Formerly, Independent Trustee or Director of three series of Oppenheimer Funds: Oppenheimer Limited Term New York Municipal Fund, Rochester Fund Municipals, and Oppenheimer Convertible Securities Fund, 1992 to 2009. | |
| |
| Faith Colish (1935) | | Trustee since 1982 | | Counsel, Carter Ledyard & Milburn LLP (law firm) since October 2002; formerly, Attorney-at-Law and President, Faith Colish, A Professional Corporation, 1980 to 2002. | | | 47 | | | Formerly, Director, 1997 to 2003, and Advisory Director, 2003 to 2006, ABA Retirement Funds (formerly, American Bar Retirement Association) (not-for-profit membership corporation). | |
| |
21
Name, (Year of Birth), and Address(1) | | Position and Length of Time Served(2) | | Principal Occupation(s)(3) | | Number of Funds in Fund Complex Overseen by Fund Trustee | | Other Directorships Held Outside Fund Complex by Fund Trustee | |
| Martha C. Goss (1949) | | Trustee since 2007 | | President, Woodhill Enterprises Inc./Chase Hollow Associates LLC (personal investment vehicle), since 2006; Chief Operating and Financial Officer, Hopewell Holdings LLC/Amwell Holdings, LLC (a holding company for a healthcare reinsurance company start-up), since 2003; formerly, Consultant, Resources Connection (temporary staffing), 2002 to 2006. | | | 47 | | | Director, American Water (water utility), since 2003; Director, Channel Reinsurance (financial guaranty reinsurance), since 2006; Director, Allianz Life of New York (insurance), since 2005; Director, Financial Women's Association of New York (not-for-profit association), since 2003; Trustee Emerita, Brown University, since 1998; formerly, Director, Ocwen Financial Corporation (mortgage servicing), 2005 to 2010; formerly, Advisory Board Member, Attensity (software developer), 2005 to 2007; formerly, Director, Bank Leumi (commercial bank), 2005 to 2007; formerly, Director, Claire's Stores, Inc. (retailer), 2005 to 2007. | |
| |
| C. Anne Harvey (1937) | | Trustee since 1998 | | President, C.A. Harvey Associates, since October 2001; formerly, Director, AARP, 1978 to December 2001. | | | 47 | | | Formerly, President, Board of Associates to The National Rehabilitation Hospital's Board of Directors, 2001 to 2002; formerly, Member, Individual Investors Advisory Committee to the New York Stock Exchange Board of Directors, 1998 to 2002. | |
| |
22
Name, (Year of Birth), and Address(1) | | Position and Length of Time Served(2) | | Principal Occupation(s)(3) | | Number of Funds in Fund Complex Overseen by Fund Trustee | | Other Directorships Held Outside Fund Complex by Fund Trustee | |
| Robert A. Kavesh (1927) | | Trustee since 2000 | | Retired, since 2002; Marcus Nadler Professor Emeritus of Finance and Economics, New York University Stern School of Business; formerly, Executive Secretary-Treasurer, American Finance Association, 1961 to 1979. | | | 47 | | | Formerly, Director, The Caring Community (not-for-profit), 1997 to 2006; formerly, Director, DEL Laboratories, Inc. (cosmetics and pharmaceuticals), 1978 to 2004; formerly, Director, Apple Bank for Savings, 1979 to 1990; formerly, Director, Western Pacific Industries, Inc., (public company), 1972 to 1986. | |
| |
| Michael M. Knetter (1960) | | Trustee since 2007 | | President and Chief Executive Officer, University of Wisconsin Foundation, since October 2010; formerly, Dean, School of Business, University of Wisconsin - Madison; formerly, Professor of International Economics and Associate Dean, Amos Tuck School of Business - Dartmouth College, 1998 to 2002. | | | 47 | | | Director, American Family Insurance (a mutual company, not publicly traded), since March 2009; formerly, Trustee, Northwestern Mutual Series Fund, Inc., 2007 to 2010; formerly, Director, Wausau Paper, 2005 to 2011; formerly, Director, Great Wolf Resorts, 2004 to 2009. | |
| |
| Howard A. Mileaf (1937) | | Trustee since 1999 | | Retired; formerly, Vice President and General Counsel, WHX Corporation (holding company), 1993 to 2001. | | | 47 | | | Formerly, Director, Webfinancial Corporation (holding company), 2002 to 2008; formerly, Director, WHX Corporation (holding company), 2002 to 2005; formerly, Director, State Theatre of New Jersey (not-for-profit theatre), 2000 to 2005. | |
| |
| George W. Morriss (1947) | | Trustee since 2007 | | Retired; formerly, Executive Vice President and Chief Financial Officer, People's Bank, Connecticut (a financial services company), 1991 to 2001. | | | 47 | | | Manager, Larch Lane Multi-Strategy Fund complex (which currently consists of three funds), since 2006; formerly, Member, NASDAQ Issuers' Affairs Committee, 1995 to 2003. | |
| |
23
Name, (Year of Birth), and Address(1) | | Position and Length of Time Served(2) | | Principal Occupation(s)(3) | | Number of Funds in Fund Complex Overseen by Fund Trustee | | Other Directorships Held Outside Fund Complex by Fund Trustee | |
| Edward I. O'Brien (1928) | | Trustee since 2000 | | Private Investor; formerly, Member, Investment Policy Committee, Edward Jones, 1993 to 2001; President, Securities Industry Association ("SIA") (securities industry's representative in government relations and regulatory matters at the federal and state levels), 1974 to 1992; Adviser to SIA, November 1992 to November 1993. | | | 47 | | | Formerly, Director, Legg Mason, Inc. (financial services holding company), 1993 to July 2008; formerly, Director, Boston Financial Group (real estate and tax shelters), 1993 to 1999. | |
| |
| Jack L. Rivkin (1940) | | Trustee since 2002; President, 2002 to 2008 | | Formerly, Executive Vice President and Chief Investment Officer, Neuberger Berman Holdings LLC (holding company), 2002 to August 2008 and 2003 to August 2008, respectively; formerly, Managing Director and Chief Investment Officer, Neuberger, December 2005 to August 2008 and 2003 to August 2008, respectively; formerly, Executive Vice President, Neuberger, December 2002 to 2005; formerly, Director and Chairman, Management, December 2002 to August 2008; formerly, Executive Vice President, Citigroup Investments, Inc., September 1995 to February 2002; formerly, Executive Vice President, Citigroup Inc., September 1995 to February 2002. | | | 47 | | | Director, Idealab (private company), since 2009; Director, Distributed World Power (private company), since 2009; Director, Dale Carnegie and Associates, Inc. (private company), since 1999; Director, Solbright, Inc. (private company), since 1998; Director, SA Agricultural Fund, since 2009; Chairman and Director, Essential Brands (consumer products) since 2008; formerly, Director, New York Society of Security Analysts, 2006 to 2008. | |
| |
24
Name, (Year of Birth), and Address(1) | | Position and Length of Time Served(2) | | Principal Occupation(s)(3) | | Number of Funds in Fund Complex Overseen by Fund Trustee | | Other Directorships Held Outside Fund Complex by Fund Trustee | |
| Cornelius T. Ryan (1931) | | Trustee since 2000 | | General Partner and Adviser, TD2, TD3, and TOF1 Healthcare Venture Capital Partnerships; formerly, Founding General Partner, Oxford Partners and Oxford Bioscience Partners (venture capital investing) and President, Oxford Venture Corporation, 1981 to 2010. | | | 47 | | | Trustee, Norwalk Hospital Foundation, since 2000; Director, Supply Pro (privately held company), since 2008; formerly, Trustee, Norwalk Hospital, 1995 to 2004; formerly, President and Director, Randolph Computer Corp., 1966 to 1984; formerly, Director of numerous privately held portfolio companies of Oxford Partners and Oxford Bioscience Partners, 1981 to 2005. | |
| |
| Tom D. Seip (1950) | | Trustee since 2000; Chairman of the Board since 2008; Lead Independent Trustee from 2006 to 2008 | | General Partner, Ridgefield Farm LLC (a private investment vehicle); formerly, President and CEO, Westaff, Inc. (temporary staffing), May 2001 to January 2002; formerly, Senior Executive, The Charles Schwab Corporation, 1983 to 1998, including Chief Executive Officer, Charles Schwab Investment Management, Inc.; Trustee, Schwab Family of Funds and Schwab Investments, 1997 to 1998; and Executive Vice President-Retail Brokerage, Charles Schwab & Co., Inc., 1994 to 1997. | | | 47 | | | Director, H&R Block, Inc. (financial services company), since May 2001; formerly, Chairman, Compensation Committee, H&R Block, Inc., 2006 to 2010; formerly, Director, Forward Management, Inc. (asset management company), 1999 to 2006. | |
| |
25
Name, (Year of Birth), and Address(1) | | Position and Length of Time Served(2) | | Principal Occupation(s)(3) | | Number of Funds in Fund Complex Overseen by Fund Trustee | | Other Directorships Held Outside Fund Complex by Fund Trustee | |
| Candace L. Straight (1947) | | Trustee since 1999 | | Private investor and consultant specializing in the insurance industry; formerly, Advisory Director, Securitas Capital LLC (a global private equity investment firm dedicated to making investments in the insurance sector), 1998 to December 2003. | | | 47 | | | Public Member, Board of Governors and Board of Trustees, Rutgers University, since 2011; Director, Montpelier Re Holdings Ltd. (reinsurance company), since 2006; formerly, Director, National Atlantic Holdings Corporation (property and casualty insurance company), 2004 to 2008; formerly, Director, The Proformance Insurance Company (property and casualty insurance company), 2004 to 2008; formerly, Director, Providence Washington Insurance Company (property and casualty insurance company), 1998 to 2006; formerly, Director, Summit Global Partners (insurance brokerage firm), 2000 to 2005. | |
| |
| Peter P. Trapp (1944) | | Trustee since 1984 | | Retired; formerly, Regional Manager for Mid-Southern Region, Ford Motor Credit Company, September 1997 to 2007; formerly, President, Ford Life Insurance Company, April 1995 to August 1997. | | | 47 | | | None. | |
| |
26
Name, (Year of Birth), and Address(1) | | Position and Length of Time Served(2) | | Principal Occupation(s)(3) | | Number of Funds in Fund Complex Overseen by Fund Trustee | | Other Directorships Held Outside Fund Complex by Fund Trustee | |
| Trustees who are "Interested Persons" | |
| |
| Joseph V. Amato* (1962) | | Trustee since 2009 | | President and Director, Neuberger Berman Group LLC, since 2009; President and Chief Executive Officer, Neuberger and Neuberger Berman Holdings LLC (including its predecessor, Neuberger Berman Inc.), since 2007; Chief Investment Officer, Neuberger, since 2009; Chief Investment Officer (Equities) and Managing Director, Management, since 2009; Managing Director, Neuberger Berman Fixed Income LLC ("NBFI") since 2007; Board member of NBFI since 2006; formerly, Global Head of Asset Management of Lehman Brothers Holdings Inc.'s ("LBHI") Investment Management Division, 2006 to 2009; formerly, member of LBHI's Investment Management Division's Executive Management Committee, 2006 to 2009; formerly, Managing Director, Lehman Brothers Inc. ("LBI"), 2006 to 2008; formerly, Chief Recruiting and Development Officer, LBI, 2005 to 2006; formerly, Global Head of LBI's Equity Sales and a Member of its Equities Division Executive Committee, 2003 to 2005. | | | 47 | | | Member of Board of Advisors, McDonough School of Business, Georgetown University, since 2001; Member of New York City Board of Advisors, Teach for America, since 2005; Trustee, Montclair Kimberley Academy (private school), since 2007. | |
| |
27
Name, (Year of Birth), and Address(1) | | Position and Length of Time Served(2) | | Principal Occupation(s)(3) | | Number of Funds in Fund Complex Overseen by Fund Trustee | | Other Directorships Held Outside Fund Complex by Fund Trustee | |
| Robert Conti* (1956) | | Chief Executive Officer, President and Trustee since 2008; prior thereto, Executive Vice President in 2008 and Vice President, 2000 to 2008 | | Managing Director, Neuberger, since 2007; formerly, Senior Vice President, Neuberger, 2003 to 2006; formerly, Vice President, Neuberger, 1999 to 2003; President and Chief Executive Officer, Management, since 2008; formerly, Senior Vice President, Management, 2000 to 2008. | | | 47 | | | Director since 1994 and formerly, Chairman of the Board, 2008 to 2010, Staten Island Mental Health Society, Inc. | |
| |
(1) The business address of each listed person is 605 Third Avenue, New York, New York 10158.
(2) Pursuant to the Trust's Trust Instrument, each of these Trustees shall hold office for life or until his or her successor is elected or the Trust terminates; except that (a) any Trustee may resign by delivering a written resignation; (b) any Trustee may be removed with or without cause at any time by a written instrument signed by at least two-thirds of the other Trustees; (c) any Trustee who requests to be retired, or who has become unable to serve, may be retired by a written instrument signed by a majority of the other Trustees; and (d) any Trustee may be removed at any shareholder meeting by a vote of at least two-thirds of the outstanding shares.
(3) Except as otherwise indicated, each individual has held the positions shown for at least the last five years.
* Indicates a Trustee who is an "interested person" within the meaning of the 1940 Act. Mr. Amato and Mr. Conti are interested persons of the Trust by virtue of the fact that each is an officer of Management, Neuberger and/or their affiliates.
28
Information about the Officers of the Trust
Name, (Year of Birth), and Address(1) | | Position and Length of Time Served(2) | | Principal Occupation(s)(3) | |
| Andrew B. Allard (1961) | | Anti-Money Laundering Compliance Officer since 2002 | | Senior Vice President, Neuberger, since 2006 and Employee since 1999; Deputy General Counsel, Neuberger, since 2004; formerly, Vice President, Neuberger, 2000 to 2005; formerly, Employee, Management, 1994 to 1999; Anti-Money Laundering Compliance Officer, nine registered investment companies for which Management acts as investment manager and administrator (six since 2002, one since 2003, one since 2005 and one since 2006). | |
| |
| Claudia A. Brandon (1956) | | Executive Vice President since 2008 and Secretary since 1985 | | Senior Vice President, Neuberger, since 2007 and Employee since 1999; Senior Vice President, Management, since 2008 and Assistant Secretary since 2004; formerly, Vice President, Neuberger, 2002 to 2006; formerly, Vice President-Mutual Fund Board Relations, Management, 2000 to 2008; formerly, Vice President, Management, 1986 to 1999 and Employee 1984 to 1999; Executive Vice President, nine registered investment companies for which Management acts as investment manager and administrator (nine since 2008); Secretary, nine registered investment companies for which Management acts as investment manager and administrator (three since 1985, three since 2002, one since 2003, one since 2005 and one since 2006). | |
| |
| Anthony DiBernardo (1979) | | Assistant Treasurer since 2011 | | Vice President, Neuberger, since 2009; Employee, Management, since 2003; Assistant Treasurer, nine registered investment companies for which Management acts as investment manager and administrator. | |
| |
| Maxine L. Gerson (1950) | | Executive Vice President since 2008 and Chief Legal Officer since 2005 (only for purposes of sections 307 and 406 of the Sarbanes-Oxley Act of 2002) | | Managing Director, Neuberger, since 2009, and Deputy General Counsel and Assistant Secretary, Neuberger, since 2001; Managing Director, Management, since 2009, and Secretary and General Counsel, Management, since 2004; formerly, Senior Vice President, Neuberger, 2002 to 2009; formerly, Senior Vice President, Management, 2006 to 2009; Executive Vice President, nine registered investment companies for which Management acts as investment manager and administrator (nine since 2008); Chief Legal Officer (only for purposes of sections 307 and 406 of the Sarbanes-Oxley Act of 2002), nine registered investment companies for which Management acts as investment manager and administrator (eight since 2005 and one since 2006). | |
| |
| Sheila R. James (1965) | | Assistant Secretary since 2002 | | Vice President, Neuberger, since 2008 and Employee since 1999; formerly, Assistant Vice President, Neuberger, 2007; formerly, Employee, Management, 1991 to 1999; Assistant Secretary, nine registered investment companies for which Management acts as investment manager and administrator (six since 2002, one since 2003, one since 2005 and one since 2006). | |
| |
| Brian Kerrane (1969) | | Vice President since 2008 | | Senior Vice President, Neuberger, since 2006; formerly, Vice President, Neuberger, 2002 to 2006; Vice President, Management, since 2008 and Employee since 1991; Vice President, nine registered investment companies for which Management acts as investment manager and administrator (nine since 2008). | |
| |
29
Name, (Year of Birth), and Address(1) | | Position and Length of Time Served(2) | | Principal Occupation(s)(3) | |
| Kevin Lyons (1955) | | Assistant Secretary since 2003 | | Assistant Vice President, Neuberger, since 2008 and Employee since 1999; formerly, Employee, Management, 1993 to 1999; Assistant Secretary, nine registered investment companies for which Management acts as investment manager and administrator (seven since 2003, one since 2005 and one since 2006). | |
| |
| Owen F. McEntee, Jr. (1961) | | Vice President since 2008 | | Vice President, Neuberger, since 2006; Employee, Management, since 1992; Vice President, nine registered investment companies for which Management acts as investment manager and administrator (nine since 2008). | |
| |
| John M. McGovern (1970) | | Treasurer and Principal Financial and Accounting Officer since 2005 | | Senior Vice President, Neuberger, since 2007; formerly, Vice President, Neuberger, 2004 to 2006; Employee, Management, since 1993; Treasurer and Principal Financial and Accounting Officer, nine registered investment companies for which Management acts as investment manager and administrator (eight since 2005 and one since 2006); formerly, Assistant Treasurer, eight registered investment companies for which Management acts as investment manager and administrator, 2002 to 2005. | |
| |
| Frank Rosato (1971) | | Assistant Treasurer since 2005 | | Vice President, Neuberger, since 2006; Employee, Management, since 1995; Assistant Treasurer, nine registered investment companies for which Management acts as investment manager and administrator (eight since 2005 and one since 2006). | |
| |
| Neil S. Siegel (1967) | | Vice President since 2008 | | Managing Director, Management, since 2008; Managing Director, Neuberger, since 2006; formerly, Senior Vice President, Neuberger, 2004 to 2006; Vice President, nine registered investment companies for which Management acts as investment manager and administrator (nine since 2008). | |
| |
| Chamaine Williams (1971) | | Chief Compliance Officer since 2005 | | Senior Vice President, Neuberger, since 2007; Chief Compliance Officer, Management, since 2006; Chief Compliance Officer, nine registered investment companies for which Management acts as investment manager and administrator (eight since 2005 and one since 2006); formerly, Senior Vice President, LBI, 2007 to 2008; formerly, Vice President, LBI, 2003 to 2006; formerly, Chief Compliance Officer, Lehman Brothers Asset Management Inc., 2003 to 2007; formerly, Chief Compliance Officer, Lehman Brothers Alternative Investment Management LLC, 2003 to 2007. | |
| |
(1) The business address of each listed person is 605 Third Avenue, New York, New York 10158.
(2) Pursuant to the By-Laws of the Trust, each officer elected by the Trustees shall hold office until his or her successor shall have been elected and qualified or until his or her earlier death, inability to serve, or resignation. Officers serve at the pleasure of the Trustees and may be removed at any time with or without cause.
(3) Except as otherwise indicated, each individual has held the positions shown for at least the last five years.
30
Proxy Voting Policies and Procedures
A description of the policies and procedures that the Trust uses to determine how to vote proxies relating to portfolio securities is available, without charge, by calling 1-800-877-9700 (toll-free) and on the website of the Securities and Exchange Commission, at www.sec.gov. Information regarding how the Trust voted proxies relating to portfolio securities during the most recent 12-month period ended June 30 is also available, without charge, by calling 1-800-877-9700 (toll-free), on the website of the Securities and Exchange Commission at www.sec.gov, and on Management's website at www.nb.com.
Quarterly Portfolio Schedule
The Trust files a complete schedule of portfolio holdings for the Fund with the Securities and Exchange Commission for the first and third quarters of each fiscal year on Form N-Q. The Trust's Forms N-Q are available on the Securities and Exchange Commission's website at www.sec.gov and may be reviewed and copied at the Securities and Exchange Commission's Public Reference Room in Washington, DC. Information on the operation of the Public Reference Room may be obtained by calling 1-800-SEC-0330. The information on Form N-Q is available upon request, without charge, by calling 1-800-877-9700 (toll free).
Board Consideration of the Management and Sub-Advisory Agreements
At a meeting held on October 13, 2011, the Board, including the Trustees who are not "interested persons" of Management (including its affiliates) or Neuberger Berman Advisers Management Trust ("Independent Fund Trustees"), approved the continuance of the Management and Sub-Advisory Agreements ("Agreements") for the Fund.
In evaluating the Agreements, the Board, including the Independent Fund Trustees, reviewed materials furnished by Management and Neuberger in response to questions submitted by counsel for the Independent Fund Trustees, and met with senior representatives of Management and Neuberger regarding their personnel and operations. The Independent Fund Trustees were advised by counsel that is experienced in Investment Company Act of 1940 matters and that is independent of Management and Neuberger. The Independent Fund Trustees received a memorandum from independent counsel discussing the legal standards for their consideration of the proposed continuance of the Agreements. They met with such counsel separately from representatives of Management to discuss the annual contract review. The annual contract review extends over three regular meetings of the Board, including one meeting devoted primarily to reviewing and discussing Fund performance, to ensure that Management and Neuberger have time to respond to any questions the Independent Fund Trustees may have on their initial review of the report and that the Independent Fund Trustees have time to consider those responses.
The Board considered the following factors, among others, in connection with its approval of the continuance of the Agreements: (1) the nature, extent, and quality of the services provided by Management and Neuberger; (2) the performance of the Fund compared to a relevant market index and a peer group of investment companies; (3) the costs of the services provided and profits or losses realized by Management and its affiliates from their relationship with the Fund; (4) the extent to which economies of scale might be realized as the Fund grows; and (5) whether fee levels reflect any such potential economies of scale for the benefit of investors in the Fund. In their deliberations, the Board members did not identify any particular information that was all-important or controlling, and each Trustee may have attributed different weights to the various factors.
The Board evaluated the terms of the Agreements, the overall fairness of the Agreements to the Fund and whether the Agreements were in the best interests of the Fund and its shareholders.
With respect to the nature, extent and quality of the services provided, the Board considered the performance of the Fund and the experience and staffing of the portfolio management and investment research personnel of Management and Neuberger who perform services for the Fund. The Board noted that Management also provides certain administrative services, including fund accounting and compliance oversight. The Board also considered Management's and Neuberger's
31
policies and practices regarding brokerage and the allocation of portfolio transactions. The Board's Portfolio Transactions and Pricing Committee from time to time reviewed the quality of the execution services that Management and Neuberger had provided, and periodically reviews studies by an independent firm engaged to review and evaluate the quality of brokerage execution received by the Fund. The Board also reviewed whether Management and Neuberger used brokers to execute Fund transactions that provide research and other services to Management and Neuberger, and the types of benefits potentially derived from such services by Management, Neuberger, the Fund and other clients of Management and Neuberger. In addition, the Board noted the positive compliance history of Management and Neuberger, as each firm has been free of significant reported compliance problems.
The Board considered the performance of the Fund relative to its benchmark and the average performance of composite peer groups of investment companies pursuing broadly similar strategies. The Board also reviewed performance in relation to certain measures of the degree of investment risk undertaken by the portfolio manager, during the period. The Board discussed the Fund's performance with Management and discussed steps that Management had taken, or intended to take, to improve the Fund's performance. The Board also considered Management's resources and responsiveness with respect to the Fund.
With respect to the overall fairness of the Agreements, the Board considered the fee structure for the Fund under the Agreements and any fall-out benefits likely to accrue to Management or Neuberger or their affiliates from their relationship with the Fund. The Board also considered the contractual limit on Fund expenses undertaken by Management and the actual expenses reimbursed and investment management fees waived by Management. With regard to the sub-advisory fee paid to Neuberger, the Board noted that this fee is "at cost." In addition, the Board considered the profitability of Management and its affiliates from their association with the Fund and noted that Management incurred a loss on the Fund.
The Board considered whether there were other funds that were advised or sub-advised by Management or its affiliates or separate accounts managed by Management or its affiliates with similar investment objectives, policies and strategies to the Fund. The Board noted that there were no comparable separate accounts. The Board compared the fees charged to the Fund at various asset levels to the fees charged to registered fund and sub-advised funds, each managed by Management in a similar style to the Fund. The Board considered the appropriateness and reasonableness of any differences between the fees charged to the Fund and the other funds and determined that the differences in fees were consistent with the management and other services provided.
The Board also evaluated any apparent or anticipated economies of scale in relation to the services Management provides to the Fund. The Board considered whether the Fund's fee structure provides for a reduction of payments resulting from the use of breakpoints and whether those breakpoints are set at appropriate asset levels. In concluding that the benefits accruing to Management and its affiliates by virtue of their relationship to the Fund were reasonable in comparison with the costs of providing the investment advisory services and the benefits accruing to the Fund, the Board reviewed specific data as to Management's loss on the Fund for a recent period and the trend in profit or loss over recent years. The Board also carefully examined Management's cost allocation methodology.
Conclusions
In approving the Agreements, the Board concluded that the terms of each Agreement are fair and reasonable and that approval of the Agreements is in the best interests of the Fund and its shareholders. In reaching this determination, the Board considered that Management and Neuberger could be expected to provide a high level of service to the Fund; that it retained confidence in Management's and Neuberger's capabilities to manage the Fund; that the Fund's fee structure appeared to the Board to be reasonable given the nature and quality of services provided; and that the benefits accruing to Management and its affiliates by virtue of their relationship to the Fund were reasonable in comparison with the benefits accruing to the Fund.
32
Neuberger Berman
Advisers Management Trust
Socially Responsive Portfolio
I Class Shares
S Class Shares
Annual Report
December 31, 2011
B1017 02/12
Socially Responsive Portfolio Commentary (Unaudited)
The Neuberger Berman Advisers Management Trust (AMT) Socially Responsive Portfolio Class I generated a total return of –3.08% for the fiscal year ended December 31, 2011, underperforming its benchmark, the S&P 500 Index, which returned 2.11% for the same period. Returns for the Portfolio's Class I and Class S shares are provided on page 3.
The S&P 500 Index's nearly flat performance belies the dramatic events and extreme equity market volatility that characterized the year. As 2011 began, the general tone of the economy was positive, but, as the year progressed, a harsh winter impacted macro demand, the Arab Spring added to volatility, and, by April, the economic effects of the disaster in Japan began to be felt. Supply chain disruptions impacted industrial production on a global basis, with a meaningful dampening effect on second quarter results. Late in the second quarter, sovereign debt pressures in Greece roiled the financial markets as the European Union and International Monetary Fund debated bailout terms and Greece's future in the eurozone. By late summer, worries extended to the future of the greater eurozone, the euro, and eurozone banks. At the same time, a damaging political stalemate around the U.S. debt ceiling resulted in a downgrade of the credit rating on U.S. Treasuries by Standard & Poor's.
As investors struggled to digest this news, fears of a double-dip recession reappeared and global financial markets became incredibly volatile. Credit spreads widened during this period of heightened uncertainty. The U.S. equity market, which peaked for the year in early May, hit its low in early October and then, with continued high volatility, market performance improved over the course of the fourth quarter to finish relatively flat for the year. Within the S&P 500 Index, defensive sectors, including Utilities, Consumer Staples, and Health Care, were performance leaders. Financials and Materials stocks posted losses.
From a return perspective, the Portfolio saw strong performance during the first half of the year, and weaker performance during the second. However, the businesses within our Portfolio generally performed extremely well throughout the year, consistently delivering earnings regardless of the difficult environment.
Two stocks delivered the bulk of our underperformance for the year. Newfield Exploration declined as Wall Street, in our opinion, overreacted to the company's decision to reallocate its capital budget to maximize returns on capital. This decision modestly impacted 2011 production growth, but in our opinion positions the company for accelerated production growth with improving margins as management executes its revised business plan. Newfield continues to be a top holding, and we have taken advantage of the price disruption to add to our position. Hospira, a position we sold after the reporting period, declined after the company announced that ongoing FDA compliance and manufacturing issues were going to limit revenue and lead to higher costs.
From a sector perspective, Energy and Health Care were our weakest areas relative to the index this year, primarily as a result of these specific disappointments. To a lesser extent, Charles Schwab and Bank of New York Mellon, which was sold during the period, were also detrimental to performance. Information Technology was far and away our strongest sector for the year. Top performers included MasterCard, Google and National Instruments.
In October, while the market was under pressure, we initiated a position in Unilever, a company that had long been on our radar. A global company, half of Unilever's business comes from the growing middle class consumer within emerging markets. Unilever has grown revenues and earnings against rising commodity costs, and within a "slow growth" global recovery. With new management, we anticipate a real turnaround. One of the top-ranked food and beverage companies in Newsweek's 2011 Green Rankings, Unilever has a commitment to health, sustainable product development, the environment and its communities.
After an extremely tumultuous year, with significant impacts on business and investor sentiment, we exited 2011 with a better tone to the U.S. macro economy. Since 2008, our view has been that the debt situation in the western world would dampen economic growth and create market volatility. 2011 proved consistent with this view. As of this writing, we still lack a holistic solution in Europe—although the European Central Bank and other central banks have taken aggressive actions to add liquidity to the system to help counter stresses in the credit markets.
1
However, surprisingly, economic growth in the fourth quarter appears to have been higher than recent quarters, and third quarter growth was nominally positive against a headwind of severe inventory liquidations. We've been in this position twice before since 2008—where inventories have been drawn down because of fear, the economy ultimately finds its footing, and the base level of production needed to satisfy end-market demand helps drive growth.
From a Portfolio perspective, by and large, the businesses in our Portfolio performed significantly better than what was reflected by their stock prices in 2011. Going into 2012, valuations generally reflect the broader macroeconomic uncertainty. To the extent that the Portfolio's companies have executed against a tough environment largely as we would have expected, we feel constructive about what we own and the forward prospects for their stocks should sentiment improve. We are also excited that we had the ability to add great names like Google, Ecolab and Unilever over the past year—businesses that had been on our prospect list for a very long time.
As always, we look forward to continuing to serve your investment needs.
Sincerely,
Arthur Moretti and Ingrid Dyott
Portfolio Co-Managers
Information about the principal risks of investing in the Portfolio is set forth in the prospectus and statement of additional information.
The composition, industries and holding of the Portfolio are subject to change.
2
Socially Responsive Portfolio (Unaudited)
SECTOR ALLOCATION
| (as a % of Total Investments) | |
| Consumer Discretionary | | | 8.5 | % | |
| Consumer Staples | | | 10.6 | | |
| Energy | | | 13.7 | | |
| Financials | | | 11.0 | | |
| Health Care | | | 12.4 | | |
| Industrials | | | 13.7 | | |
| Information Technology | | | 20.2 | | |
| Materials | | | 5.9 | | |
| Short-Term Investments | | | 4.0 | | |
| Total | | | 100.0 | % | |
PERFORMANCE HIGHLIGHTS1
| | | Inception | | Average Annual Total Return Ended 12/31/11 | |
| | | Date | | 1 Year | | 5 Years | | 10 Years | | Life of Fund* | |
Socially Responsive Portfolio Class I | | 02/18/1999 | | | –3.08 | % | | | 0.39 | % | | | 4.86 | % | | | 4.49 | % | |
Socially Responsive Portfolio Class S2 | | 05/01/2006 | | | –3.15 | % | | | 0.30 | % | | | 4.81 | % | | | 4.44 | % | |
S&P 500 Index3 | | | | | | | 2.11 | % | | | –0.25 | % | | | 2.92 | % | | | 2.03 | % | |
Performance data quoted represent past performance and do not indicate future results. The investment return and principal value of an investment will fluctuate so that an investor's shares, when redeemed, may be worth more or less than their original cost. Results are shown on a "total return" basis and include reinvestment of all income dividends and distributions.
Current performance may be lower or higher than the performance data quoted. For performance data current to the most recent month end, please visit https://www.nb.com.
* Index returns are as of inception date 02/18/1999.
As stated in the Portfolio's most recent prospectus, the total annual operating expense ratios for fiscal year 2010 were 1.08% and 1.34% for Class I and Class S shares, respectively (prior to any fee waivers and/or expense reimbursements, if any). The expense ratio net of waivers and/or reimbursements was 1.18% for Class S shares. Neuberger Berman Management LLC has contractually agreed to limit certain expenses of the Portfolio through 12/31/2014 for Class I and Class S shares.
The results shown in the table do not reflect the effect of taxes an investor would pay on Portfolio distributions or on the redemption of Portfolio shares.
COMPARISON OF A $10,000 INVESTMENT
The graph shows the change in value of a hypothetical $10,000 investment in the Portfolio over the past 10 fiscal years, or since the Portfolio's inception, if it has not operated for 10 years. The graph is based on Class I shares only; performance of other classes will vary due to differences in fee structures (see Performance Highlights chart above). The result is compared with benchmarks, which may include a broad-based market index and/or a narrower index. Market indices have not been reduced to reflect any of the fees and costs of investing. All results include the reinvestment of income dividends and distributions. The results shown in the graph do not reflect the effect of taxes that an investor would pay on Portfolio distributions or the redemption of Portfolio shares. Results represent past performance and do not indicate future results.
Please see Endnotes for additional information.
3
Endnotes (Unaudited)
1 "Total Return" includes reinvestment of all income dividends and distributions. Results represent past performance and do not indicate future results. The value of an investment in the Portfolio and the return on the investment both will fluctuate, and redemption proceeds may be higher or lower than an investor's original cost. The performance information does not reflect fees and expenses of the variable annuity and variable life insurance policies or the qualified pension and retirement plans whose proceeds are invested in the Portfolio. Neuberger Berman Management LLC ("NBM LLC") has agreed to absorb certain expenses of the AMT Portfolios, including the Portfolio. Without this arrangement, which is subject to change, the total returns of the Portfolio may have been less.
2 Performance shown prior to May 1, 2006 for the Class S shares is that of the Class I shares, which has lower expenses and correspondingly higher returns than Class S shares.
3 The S&P 500 Index is widely regarded as the standard for measuring large-cap U.S. stock market performance and includes a representative sample of leading companies in leading industries. Please note that indices do not take into account any fees and expenses of investing in the individual securities that they track and that individuals cannot invest directly in any index. Data about the performance of this index are prepared or obtained by NBM LLC and include reinvestment of all income dividends and distributions. The Portfolio may invest in securities not included in the above-described index or may not invest in all securities included in the above-described index.
Any ratios or other measurements using a factor of forecasted earnings of a company discussed herein are based on consensus estimates, not NBM LLC's own projections, and they may or may not be realized. In addition, any revision to a forecast could affect the market price of a security. By quoting them herein, NBM LLC does not offer an opinion as to the accuracy of and does not guarantee these forecasted numbers.
The investments for the Portfolio are managed by the same portfolio manager(s) who manage(s) one or more other registered funds that have similar names, investment objectives and investment styles as the Portfolio. You should be aware that the Portfolio is likely to differ from the other mutual funds in size, cash flow pattern and tax matters. Accordingly, the holdings and performance can be expected to vary from those of the other mutual funds.
The composition, industries and holdings of the Portfolio are subject to change.
Shares of the separate AMT Portfolios are not available to the general public. Shares of this Portfolio may be purchased only by life insurance companies to be used with their separate accounts that fund variable annuity and variable life insurance policies and by qualified pension and retirement plans.
Statistics and projections in this report are derived from sources deemed to be reliable but cannot be regarded as a representation of future results of the AMT Portfolios. This report is prepared for the general information of shareholders and is not an offer of shares of the AMT Portfolios. Shares of the AMT Portfolios are sold only through the currently effective prospectuses, which must precede or accompany this report.
The "Neuberger Berman" name and logo are registered service marks of Neuberger Berman Group LLC. "Neuberger Berman Management LLC" and the individual Fund names in this piece are either service marks or registered service marks of Neuberger Berman Management LLC.
© 2012 Neuberger Berman Management LLC distributor. All rights reserved.
4
Information About Your Fund's Expenses (Unaudited)
This table is designed to provide information regarding costs related to your investments. All mutual funds incur operating expenses, which include management fees, fees for administrative services and costs of shareholder reports, among others. The following examples are based on an investment of $1,000 made at the beginning of the six month period ended December 31, 2011 and held for the entire period. The table illustrates the fund's costs in two ways:
| Actual Expenses and Performance: | | The first section of the table provides information about actual account values and actual expenses in dollars, based on the fund's actual performance during the period. You may use the information in this line, together with the amount you invested, to estimate the expenses you paid over the period. Simply divide your account value by $1,000 (for example, an $8,600 account value divided by $1,000 = 8.6), then multiply the result by the number in the first section of the table under the heading entitled "Expenses Paid During the Period" to estimate the expenses you paid over the period. | |
| |
Hypothetical Example for Comparison Purposes: | | The second section of the table provides information about hypothetical account values and hypothetical expenses based on the fund's actual expense ratio and an assumed rate of return at 5% per year before expenses. This return is not the fund's actual return. The hypothetical account values and expenses may not be used to estimate the actual ending account balance or expenses you paid for the period. You may use this information to compare the ongoing costs of investing in this fund versus other funds. To do so, compare the expenses shown in this 5% hypothetical example with the 5% hypothetical examples that appear in the shareholder reports of other funds. | |
| |
Please note that the expenses in the table are meant to highlight your ongoing costs only. The table and expense example do not include any transaction costs, such as fees and expenses that are, or may be, imposed under your variable contract or qualified pension plan. Therefore, the information under the heading "Hypothetical (5% annual return before expenses)" is useful in comparing ongoing costs only, and will not help you determine the relative total costs of owning different funds. In addition, if these transaction costs were included, your costs would have been higher.
Expense Information as of 12/31/11
NEUBERGER BERMAN ADVISERS MANAGEMENT TRUST SOCIALLY RESPONSIVE PORTFOLIO
| Actual | | Beginning Account Value 7/1/11 | | Ending Account Value 12/31/11 | | Expenses Paid During the Period* 7/1/11 – 12/31/11 | | Expense Ratio | |
| Class I | | $ | 1,000.00 | | | $ | 912.10 | | | $ | 5.11 | | | | 1.06 | % | |
| Class S | | $ | 1,000.00 | | | $ | 911.60 | | | $ | 5.64 | | | | 1.17 | % | |
| Hypothetical (5% annual return before expenses)** | |
| Class I | | $ | 1,000.00 | | | $ | 1,019.86 | | | $ | 5.40 | | | | 1.06 | % | |
| Class S | | $ | 1,000.00 | | | $ | 1,019.31 | | | $ | 5.96 | | | | 1.17 | % | |
* For each class, expenses are equal to the annualized expense ratio for the class, multiplied by the average account value over the period, multiplied by 184/365 (to reflect the one-half year period shown).
** Hypothetical 5% annual return before expenses is calculated by multiplying the number of days in the most recent half year divided by 365.
5
Schedule of Investments Socially Responsive Portfolio
| NUMBER OF SHARES | | | | VALUE† | |
| Common Stocks (96.5%) | | | |
| Capital Markets (6.9%) | | | |
| | 31,720 | | | BlackRock, Inc. | | $ | 5,653,773 | | |
| | 597,134 | | | Charles Schwab | | | 6,723,729 | | |
| | | | 12,377,502 | | |
| Chemicals (3.1%) | | | |
| | 94,725 | | | Ecolab Inc. | | | 5,476,052 | | |
| Commercial Services & Supplies (1.6%) | | | |
| | 158,135 | | | Herman Miller | | | 2,917,591 | | |
Electronic Equipment, Instruments & Components (5.0%) | | | |
| | 74,085 | | | Anixter International | | | 4,418,429 | * | |
| | 173,820 | | | National Instruments | | | 4,510,629 | | |
| | | | 8,929,058 | | |
| Food Products (6.7%) | | | |
| | 34,255 | | | J.M. Smucker | | | 2,677,714 | | |
| | 112,500 | | | McCormick & Company | | | 5,672,250 | | |
| | 106,225 | | | Unilever NV | | | 3,650,953 | | |
| | | | 12,000,917 | | |
| Health Care Equipment & Supplies (5.7%) | | | |
| | 68,475 | | | Becton, Dickinson & Co. | | | 5,116,452 | | |
| | 113,615 | | | Covidien PLC | | | 5,113,811 | | |
| | | | 10,230,263 | | |
| Household Products (3.9%) | | | |
| | 104,625 | | | Procter & Gamble | | | 6,979,534 | | |
| Industrial Conglomerates (7.5%) | | | |
| | 64,950 | | | 3M Co. | | | 5,308,364 | | |
| | 170,910 | | | Danaher Corp. | | | 8,039,606 | | |
| | | | 13,347,970 | | |
| Industrial Gases (2.1%) | | | |
| | 34,505 | | | Praxair, Inc. | | | 3,688,584 | | |
| Insurance (4.1%) | | | |
| | 379,410 | | | Progressive Corp. | | | 7,402,289 | | |
| Internet Software & Services (4.5%) | | | |
| | 12,515 | | | Google Inc. Class A | | | 8,083,438 | * | |
| IT Services (2.4%) | | | |
| | 11,515 | | | MasterCard, Inc. Class A | | | 4,293,022 | | |
| NUMBER OF SHARES | | | | VALUE† | |
| Media (5.7%) | | | |
| | 153,322 | | | Comcast Corp. | | $ | 3,612,266 | | |
| | | | | Class A Special | | | | | |
| | 155,035 | | | Scripps Networks Interactive Class A | | | 6,576,585 | | |
| | | | 10,188,851 | | |
| Multiline Retail (2.8%) | | | |
| | 99,295 | | | Target Corp. | | | 5,085,890 | | |
| Oil, Gas & Consumable Fuels (13.8%) | | | |
| | 341,122 | | | BG Group | | | 7,292,180 | | |
| | 83,950 | | | Cimarex Energy | | | 5,196,505 | | |
| | 214,445 | | | Newfield Exploration | | | 8,091,010 | * | |
| | 44,325 | | | Noble Energy | | | 4,183,837 | | |
| | | | 24,763,532 | | |
| Pharmaceuticals (6.7%) | | | |
| | 116,880 | | | Hospira, Inc. | | | 3,549,646 | * | |
| | 28,616 | | | Novo Nordisk A/S ADR | | | 3,298,280 | | |
| | 30,501 | | | Roche Holding | | | 5,169,551 | | |
| | | | 12,017,477 | | |
| Professional Services (1.1%) | | | |
| | 80,955 | | | ICF International | | | 2,006,065 | * | |
| Road & Rail (1.6%) | | | |
| | 35,875 | | | Canadian National Railway | | | 2,818,340 | | |
Semiconductors & Semiconductor Equipment (8.4%) | | | |
| | 207,790 | | | Altera Corp. | | | 7,709,009 | | |
| | 252,925 | | | Texas Instruments | | | 7,362,647 | | |
| | | | 15,071,656 | | |
| Specialty Chemicals (0.9%) | | | |
| | 49,425 | | | Novozymes A/S | | | 1,525,787 | | |
| Trading Companies & Distributors (2.0%) | | | |
| | 18,830 | | | W.W. Grainger | | | 3,524,788 | | |
| | | | | Total Common Stocks (Cost $155,149,807) | | | 172,728,606 | | |
| Short-Term Investments (3.9%) | | | |
| | 6,979,793 | | | State Street Institutional Treasury Money Market Fund Institutional Class (Cost $6,979,793) | | | 6,979,793 | | |
See Notes to Schedule of Investments
6
| PRINCIPAL AMOUNT | | | | VALUE† | |
| Certificates of Deposit (0.1%) | | | |
| $ | 200,000 | | | Self Help Credit Union, | | $ | 200,000 | # | |
| | | | | 0.75%, due 01/29/12 | | | |
| | | | | (Cost $200,000) | | | | | |
| | | | | Total Investments (100.5%) (Cost $162,329,600) | | | 179,908,399 | ## | |
| | | | | Liabilities, less cash, receivables and other assets [(0.5%)] | | | (875,678 | ) | |
| | | | | Total Net Assets (100.0%) | | $ | 179,032,721 | | |
See Notes to Schedule of Investments
7
Notes to Schedule of Investments Socially Responsive Portfolio
† In accordance with Accounting Standards Codification ("ASC") 820 "Fair Value Measurements and Disclosures" ("ASC 820"), all investments held by Neuberger Berman Advisers Management Trust Socially Responsive Portfolio (the "Fund") are carried at the value that Neuberger Berman Management LLC ("Management") believes the Fund would receive upon selling an investment in an orderly transaction to an independent buyer in the principal or most advantageous market for the investment under current market conditions. Various inputs, including the volume and level of activity for the asset or liability in the market, are considered in valuing the Fund's investments, some of which are discussed below. Significant management judgment may be necessary to value investments in accordance with ASC 820.
ASC 820 established a three-tier hierarchy of inputs to create a classification of value measurements for disclosure purposes. The three-tier hierarchy of inputs is summarized in the three broad Levels listed below.
• Level 1 – quoted prices in active markets for identical investments
• Level 2 – other significant observable inputs (including quoted prices for similar investments, interest rates, prepayment speeds, credit risk, amortized cost, etc.)
• Level 3 – significant unobservable inputs (including the Fund's own assumptions in determining the fair value of investments)
The inputs or methodology used for valuing an investment are not necessarily an indication of the risk associated with investing in those securities.
The value of the Fund's investments in equity securities, for which market quotations are readily available, is generally determined by Management by obtaining valuations from an independent pricing service based on the latest sale price quoted on a principal exchange or market for that security (Level 1 inputs). Securities traded primarily on the NASDAQ Stock Market are normally valued by the Fund at the NASDAQ Official Closing Price ("NOCP") provided by NASDAQ each business day. The NOCP is the most recently reported price as of 4:00:02 p.m., Eastern time, unless that price is outside the range of the "inside" bid and asked prices (i.e., the bid and asked prices that dealers quote to each other when trading for their own accounts); in that case, NASDAQ will adjust the price to equal the inside bid or asked price, whichever is closer. Because of delays in reporting trades, the NOCP may not be based on the price of the last trade to occur before the market closes. If there is no reported sale of a security on a particular day, the independent pricing service may value the security based on reported market quotations.
Management has developed a process to periodically review information provided by independent pricing services for all types of securities.
Certificates of Deposit are valued at amortized cost. Investments in State Street Institutional Treasury Money Market Fund Institutional Class are valued using the fund's daily calculated net asset value per share (Level 2 inputs).
If a valuation is not available from an independent pricing service, or if Management has reason to believe that the valuation received does not represent the amount the Fund might reasonably expect to receive on a current sale in an orderly transaction, the Fund seeks to obtain quotations from principal market makers (generally considered Level 3 inputs). If such quotations are not readily available, the security is valued using methods the Neuberger Berman Advisers Management Trust's Board of Trustees (the "Board") has approved on the belief that they reflect fair value. Numerous factors may be considered when determining the fair value of a security based on Level 2 or 3 inputs, including available analyst, media or other reports, trading in futures or ADRs and whether the issuer of the security being fair valued has other securities outstanding.
The value of the Fund's investments in foreign securities is generally determined using the same valuation methods and inputs as other Fund investments, as discussed above. Foreign security prices expressed in local currency values
See Notes to Financial Statements
8
Notes to Schedule of Investments Socially Responsive Portfolio (cont'd)
are translated from the local currency into U.S. dollars using the exchange rate as of 4:00 p.m., Eastern time. The Board has approved the use of Interactive Data Pricing and Reference Data, Inc. ("Interactive") to assist in determining the fair value of foreign equity securities when changes in the value of a certain index suggest that the closing prices on the foreign exchanges may no longer represent the amount that the Fund could expect to receive for those securities. In this event, Interactive will provide adjusted prices for certain foreign equity securities using a statistical analysis of historical correlations of multiple factors (Level 2 inputs). In the absence of precise information about the market values of these foreign securities as of the close of the New York Stock Exchange, the Board has determined on the basis of available data that prices adjusted in this way are likely to be closer to the prices the Fund could realize on a current sale than are the prices of those securities established at the close of the foreign markets in which the securities primarily trade.
Fair value prices are necessarily estimates, and there is no assurance that such a price will be at or close to the price at which the security is next quoted or next trades.
The following is a summary, categorized by Level, of inputs used to value the Fund's investments as of December 31, 2011:
| Asset Valuation Inputs | | Level 1 | | Level 2 | | Level 3 | | Total | |
| Investments: | |
| Common Stocks^ | | $ | 172,728,606 | | | $ | — | | | $ | — | | | $ | 172,728,606 | | |
| Short-Term Investments | | | — | | | | 6,979,793 | | | | — | | | | 6,979,793 | | |
| Certificates of Deposit | | | — | | | | 200,000 | | | | — | | | | 200,000 | | |
| Total Investments | | $ | 172,728,606 | | | $ | 7,179,793 | | | $ | — | | | $ | 179,908,399 | | |
^ The Schedule of Investments provides information on the industry categorization for the portfolio.
The Fund had no significant transfers between Levels 1 and 2 during the year ended December 31, 2011.
# At cost, which approximates market value.
## At December 31, 2011, the cost of investments for U.S. federal income tax purposes was $162,788,321. Gross unrealized appreciation of investments was $24,429,235 and gross unrealized depreciation of investments was $7,309,157, resulting in net unrealized appreciation of $17,120,078, based on cost for U.S. federal income tax purposes.
* Security did not produce income during the last twelve months.
See Notes to Financial Statements
9
Statement of Assets and Liabilities
Neuberger Berman Advisers Management Trust
| | | SOCIALLY RESPONSIVE PORTFOLIO | |
| | | December 31, 2011 | |
| Assets | |
| Investments in securities, at value* (Note A)—see Schedule of Investments: | |
| Unaffiliated issuers | | $ | 179,908,399 | | |
| Cash | | | 9,824 | | |
| Dividends and interest receivable | | | 125,319 | | |
| Receivable for Fund shares sold | | | 171,340 | | |
| Prepaid expenses and other assets | | | 3,277 | | |
| Total Assets | | | 180,218,159 | | |
| Liabilities | |
| Payable for securities purchased | | | 866,971 | | |
| Payable for Fund shares redeemed | | | 117,946 | | |
| Payable to investment manager (Note B) | | | 81,812 | | |
| Payable to administrator—net (Note B) | | | 45,588 | | |
| Accrued expenses and other payables | | | 73,121 | | |
| Total Liabilities | | | 1,185,438 | | |
| Net Assets at value | | $ | 179,032,721 | | |
| Net Assets consist of: | |
| Paid-in capital | | $ | 184,211,975 | | |
| Undistributed net investment income (loss) | | | 384,437 | | |
| Accumulated net realized gains (losses) on investments | | | (23,142,053 | ) | |
| Net unrealized appreciation (depreciation) in value of investments | | | 17,578,362 | | |
| Net Assets at value | | $ | 179,032,721 | | |
| Net Assets | |
| Class I | | $ | 108,386,121 | | |
| Class S | | | 70,646,600 | | |
| Shares Outstanding ($.001 par value; unlimited shares authorized) | |
| Class I | | | 7,550,616 | | |
| Class S | | | 4,910,544 | | |
| Net Asset Value, offering and redemption price per share | |
| Class I | | $ | 14.35 | | |
| Class S | | | 14.39 | | |
| *Cost of Investments: | |
| Unaffiliated issuers | | $ | 162,329,600 | | |
See Notes to Financial Statements
10
Statement of Operations
Neuberger Berman Advisers Management Trust
| | | SOCIALLY RESPONSIVE PORTFOLIO | |
| | | For the Year Ended December 31, 2011 | |
| Investment Income: | |
| Income (Note A): | |
| Dividend income—unaffiliated issuers | | $ | 2,380,082 | | |
| Interest income—unaffiliated issuers | | | 2,311 | | |
| Foreign taxes withheld | | | (57,163 | ) | |
| Total income | | $ | 2,325,230 | | |
| Expenses: | |
| Investment management fees (Note B) | | | 940,412 | | |
| Administration fees (Note B): | |
| Class I | | | 292,682 | | |
| Class S | | | 220,270 | | |
| Distribution fees (Note B): | |
| Class S | | | 183,558 | | |
| Audit fees | | | 41,935 | | |
| Custodian fees (Note A) | | | 75,593 | | |
| Insurance expense | | | 10,240 | | |
| Legal fees | | | 93,706 | | |
| Shareholder reports | | | 66,185 | | |
| Trustees' fees and expenses | | | 55,592 | | |
| Miscellaneous | | | 10,277 | | |
| Total expenses | | | 1,990,450 | | |
| Expenses reimbursed by Management (Note B) | | | (99,870 | ) | |
| Expenses reduced by custodian fee expense offset arrangement (Note A) | | | (9 | ) | |
| Total net expenses | | | 1,890,571 | | |
| Net investment income (loss) | | $ | 434,659 | | |
| Realized and Unrealized Gain (Loss) on Investments (Note A): | |
| Net realized gain (loss) on: | |
| Sales of investment securities of unaffiliated issuers | | | 2,485,069 | | |
| Foreign currency | | | (49,867 | ) | |
| Change in net unrealized appreciation (depreciation) in value of: | |
| Unaffiliated investment securities | | | (9,286,799 | ) | |
| Foreign currency | | | (635 | ) | |
| Net gain (loss) on investments | | | (6,852,232 | ) | |
| Net increase (decrease) in net assets resulting from operations | | $ | (6,417,573 | ) | |
See Notes to Financial Statements
11
Statements of Changes in Net Assets
Neuberger Berman Advisers Management Trust
| | | SOCIALLY RESPONSIVE PORTFOLIO | |
| | | Year Ended December 31, 2011 | | Year Ended December 31, 2010 | |
| Increase (Decrease) in Net Assets: | |
| From Operations (Note A): | |
| Net investment income (loss) | | $ | 434,659 | | | $ | 557,687 | | |
| Net realized gain (loss) on investments | | | 2,435,202 | | | | 3,674,922 | | |
| Change in net unrealized appreciation (depreciation) of investments | | | (9,287,434 | ) | | | 22,860,236 | | |
| Net increase (decrease) in net assets resulting from operations | | | (6,417,573 | ) | | | 27,092,845 | | |
| Distributions to Shareholders From (Note A): | |
| Net investment income: | |
| Class I | | | (361,073 | ) | | | (24,642 | ) | |
| Class S | | | (194,031 | ) | | | (13,035 | ) | |
| Total distributions to shareholders | | | (555,104 | ) | | | (37,677 | ) | |
| From Fund Share Transactions (Note D): | |
| Proceeds from shares sold: | |
| Class I | | | 47,741,592 | | | | 24,146,233 | | |
| Class S | | | 15,494,093 | | | | 13,662,499 | | |
| Proceeds from reinvestment of dividends and distributions: | |
| Class I | | | 361,073 | | | | 24,642 | | |
| Class S | | | 194,031 | | | | 13,035 | | |
| Payments for shares redeemed: | |
| Class I | | | (18,963,501 | ) | | | (19,380,091 | ) | |
| Class S | | | (14,940,554 | ) | | | (12,122,302 | ) | |
| Net increase (decrease) from Fund share transactions | | | 29,886,734 | | | | 6,344,016 | | |
| Net Increase (Decrease) in Net Assets | | | 22,914,057 | | | | 33,399,184 | | |
| Net Assets: | |
| Beginning of year | | | 156,118,664 | | | | 122,719,480 | | |
| End of year | | $ | 179,032,721 | | | $ | 156,118,664 | | |
| Undistributed net investment income (loss) at end of year | | $ | 384,437 | | | $ | 554,749 | | |
See Notes to Financial Statements
12
Notes to Financial Statements Socially Responsive Portfolio
Note A—Summary of Significant Accounting Policies:
1 General: The Fund is a separate operating series of Neuberger Berman Advisers Management Trust (the "Trust"), a Delaware statutory trust organized pursuant to a Trust Instrument dated May 23, 1994. The Trust is currently comprised of ten separate operating series (each individually a "Series," and collectively the "Funds") each of which is diversified. The Trust is registered as an open-end management investment company under the Investment Company Act of 1940, as amended (the "1940 Act"), and its shares are registered under the Securities Act of 1933, as amended. The Fund currently offers Class I and Class S shares. The Board may establish additional series or classes of shares without the approval of shareholders.
The assets of each Series belong only to that Series, and the liabilities of each Series are borne solely by that Series and no other.
The preparation of financial statements in accordance with U.S. generally accepted accounting principles ("GAAP") requires Management to make estimates and assumptions at the date of the financial statements. Actual results could differ from those estimates.
2 Portfolio valuation: Investment securities are valued as indicated in the notes following the Schedule of Investments.
3 Foreign currency translation: The accounting records of the Fund are maintained in U.S. dollars. Foreign currency amounts are translated into U.S. dollars using the exchange rate as of 4:00 p.m., Eastern time, to determine the value of investments, other assets and liabilities. Purchase and sale prices of securities, and income and expenses, are translated into U.S. dollars at the prevailing rate of exchange on the respective dates of such transactions. Net unrealized foreign currency gain (loss), if any, arises from changes in the value of assets and liabilities, other than investments in securities, as a result of changes in exchange rates and is stated separately in the Statement of Operations.
4 Securities transactions and investment income: Securities transactions are recorded on trade date for financial reporting purposes. Dividend income is recorded on the ex-dividend date or, for certain foreign dividends, as soon as the Fund becomes aware of the dividends. Non-cash dividends included in dividend income, if any, are recorded at the fair market value of the securities received. Interest income, including accretion of original issue discount, where applicable, and accretion of discount on short-term investments, if any, is recorded on the accrual basis. Realized gains and losses from securities transactions and foreign currency transactions, if any, are recorded on the basis of identified cost and stated separately in the Statement of Operations. Included in net realized gain (loss) on investments are proceeds from the settlements of class action litigation in which the Fund participated as a class member. The amount of such proceeds for the year ended December 31, 2011 was $157,476.
5 Income tax information: The Funds are treated as separate entities for U.S. federal income tax purposes. It is the policy of the Fund to continue to qualify as a regulated investment company by complying with the requirements of the U.S. Internal Revenue Code applicable to regulated investment companies and to distribute substantially all of its earnings to its shareholders. To the extent the Fund distributes substantially all of its earnings to shareholders, no federal income or excise tax provision is required.
The Fund has adopted the provisions of ASC 740 "Income Taxes" ("ASC 740"). ASC 740 sets forth a minimum threshold for financial statement recognition of a tax position taken, or expected to be taken, in a tax return. The Fund recognizes interest and penalties, if any, related to unrecognized tax positions as an income tax expense in the Statement of Operations. The Fund is subject to examination by U.S. federal and state tax authorities for returns filed for the prior three fiscal years 2008 - 2010. As of December 31, 2011, the Fund did not have any unrecognized tax positions.
13
Income distributions and capital gain distributions are determined in accordance with income tax regulations, which may differ from GAAP. These differences are primarily due to differing treatments of income and gains on various investment securities held by the Fund, timing differences and differing characterization of distributions made by the Fund as a whole. The Fund may also utilize earnings and profits distributed to shareholders on redemption of shares as a part of the dividends paid deduction for income tax purposes.
As determined on December 31, 2011, permanent differences resulting primarily from different book and tax accounting for foreign currency gains and losses were reclassified at fiscal year-end. These reclassifications had no effect on net income, net asset value ("NAV") or NAV per share of the Fund. For the year ended December 31, 2011, the Fund recorded the following permanent reclassifications:
| Paid-in Capital | | Undistributed Net Investment Income (Loss) | | Accumulated Net Realized Gains (Losses) on Investments | |
| $ | — | | | $ | (49,867 | ) | | $ | 49,867 | | |
For tax purposes, short-term gains are considered ordinary income.
The tax character of distributions paid during the years ended December 31, 2011 and December 31, 2010 was as follows:
| | | Distributions Paid From: | |
| | | Ordinary Income | | Long-Term Capital Gain | | Total | |
| | | 2011 | | 2010 | | 2011 | | 2010 | | 2011 | | 2010 | |
| | | | | $ | 555,104 | | | $ | 37,677 | | | $ | — | | | $ | — | | | $ | 555,104 | | | $ | 37,677 | | |
As of December 31, 2011, the components of distributable earnings (accumulated losses) on a U.S. federal income tax basis were as follows:
Undistributed Ordinary Income | | Unrealized Appreciation (Depreciation) | | Loss Carryforwards and Deferrals | | Other Temporary Differences | | Total | |
| $ | 384,437 | | | $ | 17,119,641 | | | $ | (22,683,332 | ) | | $ | — | | | $ | (5,179,254 | ) | |
The difference between book basis and tax basis distributable earnings is attributable primarily to timing differences of wash sales and capital loss carryforwards.
To the extent the Fund's net realized capital gains, if any, can be offset by capital loss carryforwards, it is the policy of the Fund not to distribute such gains. The Regulated Investment Company ("RIC") Modernization Act of 2010 (the "Act") became effective for the Fund on January 1, 2011. The Act modernizes several of the federal income and excise tax provisions related to RICs. Among the changes made are changes to the capital loss carryforward rules allowing for RICs to carry forward capital losses indefinitely and to retain the character of capital loss carryforwards as short-term or long-term ("Post-Enactment"). Rules in effect previously limited the carryforward period to eight years and all carryforwards were considered short-term in character ("Pre-Enactment"). As determined at December 31, 2011, the Fund had unused capital loss carryforwards available for federal income tax purposes to offset net realized capital gains, if any, as follows:
| | | Pre-Enactment | | Post-Enactment (No Expiration Date) | |
| | | Expiring in: | | Long-Term | | Short-Term | |
| | | 2016 | | 2017 | | | | | |
| | | | | $ | 3,706,201 | | | $ | 18,977,131 | | | $ | — | | | $ | — | | |
14
Post-Enactment capital loss carryforwards must be fully used before Pre-Enactment capital loss carryforwards; therefore, under certain circumstances, Pre-Enactment capital loss carryforwards available as of the report date may expire unused.
During the year ended December 31, 2011, the Fund utilized capital loss carryforwards of $2,482,112.
6 Distributions to shareholders: The Fund may earn income, net of expenses, daily on its investments. Distributions from net investment income and net realized capital gains, if any, generally are distributed once a year (usually in October). Income distributions and capital gain distributions to shareholders are recorded on the ex-date.
7 Foreign taxes: Foreign taxes withheld represent amounts withheld by foreign tax authorities, net of refunds recoverable.
8 Expense allocation: Certain expenses are applicable to multiple funds. Expenses directly attributable to a Series are charged to that Series. Expenses of the Trust that are not directly attributable to a particular series of the Trust (e.g., the Fund) are allocated among the series of the Trust, on the basis of relative net assets, except where a more appropriate allocation of expenses to each of the series can otherwise be made fairly. Expenses borne by the complex of related investment companies, which includes open-end and closed-end investment companies for which Management serves as investment manager, that are not directly attributable to a particular investment company in the complex (e.g., the Trust) or series thereof are allocated among the investment companies in the complex or series thereof, on the basis of relative net assets, except where a more appropriate allocation of expenses to each of the investment companies in the complex or series thereof can otherwise be made fairly. The Fund's expenses (other than those specific to each class) are allocated proportionally each day between the classes based upon the relative net assets of each class.
9 Investments in foreign securities: Investing in foreign securities may involve certain sovereign and other risks, in addition to the credit and market risks normally associated with domestic securities. These additional risks include the possibility of adverse political and economic developments (including political instability, nationalization, expropriation, or confiscatory taxation) and the potentially adverse effects of unavailability of public information regarding issuers, less governmental supervision and regulation of financial markets, reduced liquidity of certain financial markets, and the lack of uniform accounting, auditing, and financial reporting standards or the application of standards that are different or less stringent than those applied in the United States. Foreign securities also may experience greater price volatility, higher rates of inflation, and delays in settlement.
10 Indemnifications: Like many other companies, the Trust's organizational documents provide that its officers and trustees are indemnified against certain liabilities arising out of the performance of their duties to the Trust. In addition, both in some of its principal service contracts and in the normal course of its business, the Trust enters into contracts that provide indemnifications to other parties for certain types of losses or liabilities. The Trust's maximum exposure under these arrangements is unknown as this could involve future claims against the Trust.
11 Expense offset arrangement: The Fund has an expense offset arrangement in connection with its custodian contract. For the year ended December 31, 2011, the impact of this arrangement was a reduction of expenses of $9.
12 Other: All net investment income and realized and unrealized capital gains and losses of the Fund are allocated, on the basis of relative net assets, pro rata among its respective classes.
Note B—Management Fees, Administration Fees, Distribution Arrangements, and Other Transactions with Affiliates:
Fund shares are issued and redeemed in connection with investments in and payments under certain variable annuity contracts and variable life insurance policies issued through separate accounts of life insurance companies and are also offered directly to certain qualified pension and retirement plans.
15
The Fund retains Management as its investment manager under a Management Agreement. For such investment management services, the Fund pays Management a fee at the annual rate of 0.55% of the first $250 million of the Fund's average daily net assets, 0.525% of the next $250 million, 0.50% of the next $250 million, 0.475% of the next $250 million, 0.45% of the next $500 million, 0.425% of the next $2.5 billion, and 0.40% of average daily net assets in excess of $4 billion.
The Fund retains Management as its administrator under an Administration Agreement. Each class pays Management an administration fee at the annual rate of 0.30% of its average daily net assets under this agreement. Additionally, Management retains State Street Bank and Trust Company ("State Street") as its sub-administrator under a Sub-Administration Agreement. Management pays State Street a fee for all services received under this agreement.
The Board adopted a non-fee distribution plan for the Fund's Class I.
For the Fund's Class S, Management acts as agent in arranging for the sale of class shares without commission and bears advertising and promotion expenses. The Board has adopted a distribution plan (the "Plan") with respect to this class, pursuant to Rule 12b-1 under the 1940 Act. The Plan provides that, as compensation for administrative and other services provided to this class, Management's activities and expenses related to the sale and distribution of this class of shares, and ongoing services provided to investors in this class, Management receives from this class a fee at the annual rate of 0.25% of Class S's average daily net assets. Management receives this amount to provide distribution and shareholder servicing for this class and pays a portion of it to institutions that provide such services. Those institutions may use the payments for, among other purposes, compensating employees engaged in sales and/or shareholder servicing. The amount of fees paid by this class during any year could have been more or less than the cost of distribution and other services provided to this class. FINRA rules limit the amount of annual distribution fees that may be paid by a mutual fund and impose a ceiling on the cumulative distribution fees paid. The Trust's Plan complies with those rules.
Management has contractually undertaken to forgo current payment of fees and/or reimburse the Fund's Class I and Class S shares for their operating expenses (exclusive of interest, taxes, brokerage commissions, extraordinary expenses, transaction costs and dividend expense on short sales, if any) ("Operating Expenses") which exceed the expense limitation as detailed in the following table:
| | | Expense Limitation(1) | | Expiration | | Reimbursement from Management for the Year Ended December 31, 2011 | |
| Class I | | | 1.30 | % | | 12/31/14 | | $ | — | | |
| Class S | | | 1.17 | % | | 12/31/14 | | | 99,870 | | |
(1) Expense limitation per annum of the respective class' average daily net assets.
Each respective class has agreed to repay Management through December 31, 2017 for fees and expenses foregone and/or its excess Operating Expenses previously reimbursed by Management, so long as its annual Operating Expenses during that period do not exceed its expense limitation, and the repayment is made within three years after the year in which Management issued the reimbursement or waived fees. During the year ended December 31, 2011, there was no repayment to Management under its contractual expense limitation. At December 31, 2011, the Fund's Class I shares had no contingent liability to Management under its contractual expense limitation. At December 31, 2011, the Fund's Class S shares contingent liabilities to Management under its contractual expense limitation were as follows:
| | | Expiring in: | | | |
| | | 2012 | | 2013 | | 2014 | | Total | |
| Class S | | $ | 117,793 | | | $ | 99,087 | | | $ | 99,870 | | | $ | 316,750 | | |
16
Neuberger Berman LLC ("Neuberger") is retained by Management to furnish it with investment recommendations and research information without added cost to the Fund. Several individuals who are officers and/or trustees of the Trust are also employees of Neuberger and/or Management.
Management and Neuberger are indirect subsidiaries of Neuberger Berman Group LLC ("NBG," and together with its consolidated subsidiaries "NB Group"). The voting equity of NBG is owned by NBSH Acquisition, LLC ("NBSH"), which was formed to facilitate the May 4, 2009 management buyout of the businesses conducted by NB Group, and Lehman Brothers Holdings Inc. ("LBHI"). NBSH, which is owned by portfolio managers, members of the NB Group management team and certain of NB Group's key employees and senior professionals, owns approximately 52% of the voting equity of NBG, and LBHI and certain of its subsidiaries own the remaining 48% of NBG's voting equity.
On December 14, 2011, the United States Bankruptcy Court for the Southern District of New York approved a motion filed by LBHI and certain of its subsidiaries, as debtors and debtors in possession, (collectively, the "Lehman Brothers Estate") that will provide NBG with the opportunity to purchase the Lehman Brothers Estate's interest in preferred and common equity of NBG. The proposed transactions, which are subject to the Lehman Brothers Estate and NBG signing definitive documentation, as well as to market conditions, would, if successfully implemented, enable NBG to have a lower cost capital structure and set it on a path to 100% employee ownership within the next five to six years.
Note C—Securities Transactions:
During the year ended December 31, 2011, there were purchase and sale transactions (excluding short-term securities) of $63,704,184 and $33,498,201, respectively.
During the year ended December 31, 2011, no brokerage commissions on securities transactions were paid to affiliated brokers.
Note D—Fund Share Transactions:
Share activity for the years ended December 31, 2011 and December 31, 2010 was as follows:
For the Year Ended December 31, 2011
| | | Shares Sold | | Shares Issued on Reinvestment of Dividends and Distributions | | Shares Redeemed | | Total | |
| Class I | | | 3,225,244 | | | | 25,791 | | | | (1,301,064 | ) | | | 1,949,971 | | |
| Class S | | | 1,021,698 | | | | 13,820 | | | | (1,019,325 | ) | | | 16,193 | | |
For the Year Ended December 31, 2010
| | | Shares Sold | | Shares Issued on Reinvestment of Dividends and Distributions | | Shares Redeemed | | Total | |
| Class I | | | 1,798,275 | | | | 1,811 | | | | (1,532,598 | ) | | | 267,488 | | |
| Class S | | | 1,037,001 | | | | 956 | | | | (938,668 | ) | | | 99,289 | | |
Note E—Line of Credit:
At December 31, 2011, the Fund was a participant in a single committed, unsecured $200,000,000 line of credit with State Street, to be used only for temporary or emergency purposes. Other investment companies managed by
17
Management also participate in this line of credit on the same terms. Interest is charged on borrowings under this line of credit at the higher of (a) the Federal Funds Rate plus 1.25% per annum or (b) the Overnight LIBOR Rate plus 1.25% per annum. A commitment fee of 0.10% (0.125% prior to September 16, 2011) per annum of the available line of credit is charged, of which each participating Fund has agreed to pay its pro rata share, based on the ratio of its individual net assets to the net assets of all participants at the time the fee is due and payable. The fee is paid quarterly in arrears. Because several mutual funds participate, there is no assurance that an individual Fund will have access to all or any part of the $200,000,000 at any particular time. There were no loans outstanding pursuant to this line of credit at December 31, 2011. During the year ended December 31, 2011, the Fund did not utilize this line of credit.
Note F—Recent Accounting Pronouncement:
In May 2011, the Financial Accounting Standards Board ("FASB") issued Accounting Standards Update ("ASU") No. 2011-04 "Amendments to Achieve Common Fair Value Measurement and Disclosure Requirements in U.S. GAAP and International Financial Reporting Standards ("IFRS")." ASU No. 2011-04 amends ASC 820 to establish common requirements for measuring fair value and for disclosing information about fair value measurements in accordance with GAAP and IFRS. It will not affect the fair valuation of the Fund's investments, but rather the quantitative and qualitative disclosures in the financial statements. ASU No. 2011-04 is effective for fiscal years beginning after December 15, 2011 and for interim periods within those fiscal years. Management is currently evaluating the impact of the adoption of ASU No. 2011-04 on the Fund's financial statement disclosures.
18
Financial Highlights
Socially Responsive Portfolio
The following tables include selected data for a share outstanding throughout each year and other performance information derived from the Financial Statements. Per share amounts that round to less than $.01 or $(.01) per share are presented as $.00 or $(.00), respectively.
| Class I | |
| | | Year Ended December 31, | |
| | | 2011 | | 2010 | | 2009 | | 2008 | | 2007 | |
| Net Asset Value, Beginning of Year | | $ | 14.86 | | | $ | 12.10 | | | $ | 9.39 | | | $ | 17.91 | | | $ | 16.71 | | |
| Income From Investment Operations: | |
Net Investment Income (Loss)‡ | | | .04 | | | | .06 | | | | .01 | | | | .11 | | | | .12 | | |
Net Gains or Losses on Securities (both realized and unrealized) | | | (.50 | ) | | | 2.70 | | | | 2.93 | | | | (7.13 | ) | | | 1.16 | | |
| Total From Investment Operations | | | (.46 | ) | | | 2.76 | | | | 2.94 | | | | (7.02 | ) | | | 1.28 | | |
| Less Distributions From: | |
| Net Investment Income | | | (.05 | ) | | | (.00 | ) | | | (.23 | ) | | | (.34 | ) | | | (.02 | ) | |
| Net Capital Gains | | | — | | | | — | | | | — | | | | (1.16 | ) | | | (.06 | ) | |
| Total Distributions | | | (.05 | ) | | | (.00 | ) | | | (.23 | ) | | | (1.50 | ) | | | (.08 | ) | |
| Net Asset Value, End of Year | | $ | 14.35 | | | $ | 14.86 | | | $ | 12.10 | | | $ | 9.39 | | | $ | 17.91 | | |
Total Return†† | | | (3.08 | )% | | | 22.85 | % | | | 31.43 | % | | | (39.44 | )% | | | 7.61 | % | |
| Ratios/Supplemental Data | |
| Net Assets, End of Year (in millions) | | $ | 108.4 | | | $ | 83.2 | | | $ | 64.5 | | | $ | 51.6 | | | $ | 557.9 | | |
Ratio of Gross Expenses to Average Net Assets# | | | 1.06 | % | | | 1.08 | % | | | 1.15 | % | | | .92 | % | | | .92 | % | |
| Ratio of Net Expenses to Average Net Assets | | | 1.06 | % | | | 1.08 | % | | | 1.15 | % | | | .92 | % | | | .91 | % | |
Ratio of Net Investment Income (Loss) to Average Net Assets | | | .29 | % | | | .48 | % | | | .06 | % | | | .70 | % | | | .65 | % | |
| Portfolio Turnover Rate | | | 20 | % | | | 41 | % | | | 34 | % | | | 41 | % | | | 26 | % | |
See Notes to Financial Highlights
19
Financial Highlights (cont'd)
| Class S | |
| | | Year Ended December 31, | |
| | | 2011 | | 2010 | | 2009 | | 2008 | | 2007 | |
| Net Asset Value, Beginning of Year | | $ | 14.90 | | | $ | 12.14 | | | $ | 9.41 | | | $ | 17.86 | | | $ | 16.69 | | |
| Income From Investment Operations: | |
Net Investment Income (Loss)‡ | | | .03 | | | | .05 | | | | .00 | | | | .06 | | | | .06 | | |
Net Gains or Losses on Securities (both realized and unrealized) | | | (.50 | ) | | | 2.71 | | | | 2.94 | | | | (7.06 | ) | | | 1.17 | | |
| Total From Investment Operations | | | (.47 | ) | | | 2.76 | | | | 2.94 | | | | (7.00 | ) | | | 1.23 | | |
| Less Distributions From: | |
| Net Investment Income | | | (.04 | ) | | | (.00 | ) | | | (.21 | ) | | | (.29 | ) | | | (.00 | ) | |
| Net Capital Gains | | | — | | | | — | | | | — | | | | (1.16 | ) | | | (.06 | ) | |
| Total Distributions | | | (.04 | ) | | | (.00 | ) | | | (.21 | ) | | | (1.45 | ) | | | (.06 | ) | |
| Net Asset Value, End of Year | | $ | 14.39 | | | $ | 14.90 | | | $ | 12.14 | | | $ | 9.41 | | | $ | 17.86 | | |
Total Return†† | | | (3.15 | )% | | | 22.76 | % | | | 31.31 | % | | | (39.43 | )% | | | 7.37 | % | |
| Ratios/Supplemental Data | |
| Net Assets, End of Year (in millions) | | $ | 70.6 | | | $ | 72.9 | | | $ | 58.2 | | | $ | 50.1 | | | $ | 90.2 | | |
Ratio of Gross Expenses to Average Net Assets# | | | 1.17 | % | | | 1.17 | % | | | 1.18 | % | | | 1.17 | % | | | 1.17 | % | |
Ratio of Net Expenses to Average Net Assets§ | | | 1.17 | % | | | 1.17 | % | | | 1.18 | % | | | 1.17 | % | | | 1.16 | % | |
Ratio of Net Investment Income (Loss) to Average Net Assets | | | .20 | % | | | .39 | % | | | .05 | % | | | .40 | % | | | .37 | % | |
| Portfolio Turnover Rate | | | 20 | % | | | 41 | % | | | 34 | % | | | 41 | % | | | 26 | % | |
See Notes to Financial Highlights
20
Notes to Financial Highlights Socially Responsive Portfolio
†† Total return based on per share NAV reflects the effects of changes in NAV on the performance of the Fund during each fiscal period and assumes income dividends and other distributions, if any, were reinvested. Results represent past performance and do not indicate future results. Current returns may be lower or higher than the performance data quoted. Investment returns and principal may fluctuate and shares when redeemed may be worth more or less than original cost. Total return would have been lower if Management had not reimbursed certain expenses. Total return would have been higher if Management had not recouped previously reimbursed expenses. The total return information shown does not reflect charges and other expenses that apply to the separate account or the related insurance policies, and the inclusion of these charges and other expenses would reduce the total return for all fiscal periods shown.
# The Fund is required to calculate an expense ratio without taking into consideration any expense reductions related to expense offset arrangements.
‡ Calculated based on the average number of shares outstanding during each fiscal period.
§ After reimbursement of expenses by Management. Had Management not undertaken such action, the annualized ratios of net expenses to average daily net assets would have been:
| | | Year Ended December 31, | |
| | | 2011 | | 2010 | | 2009 | | 2008 | | 2007 | |
| Socially Responsive Portfolio Class S | | | 1.31 | % | | | 1.33 | % | | | 1.40 | % | | | 1.26 | % | | | — | | |
After reimbursement of expenses previously paid by Management. Had the Fund not made such reimbursements, the annualized ratio of net expenses to average daily net assets would have been:
| | | Year Ended December 31, 2007 | |
| Socially Responsive Portfolio Class S | | | 1.16 | % | |
21
Report of Independent Registered Public Accounting Firm
To the Board of Trustees of
Neuberger Berman Advisers Management Trust and
Shareholders of Socially Responsive Portfolio
We have audited the accompanying statement of assets and liabilities, including the schedule of investments, of Socially Responsive Portfolio, one of the series constituting Neuberger Berman Advisers Management Trust (the "Trust"), as of December 31, 2011, and the related statement of operations for the year then ended, the statements of changes in net assets for each of the two years in the period then ended, and the financial highlights for each of the five years in the period then ended. These financial statements and financial highlights are the responsibility of the Trust's management. Our responsibility is to express an opinion on these financial statements and financial highlights based on our audits.
We conducted our audits in accordance with the standards of the Public Company Accounting Oversight Board (United States). Those standards require that we plan and perform the audit to obtain reasonable assurance about whether the financial statements and financial highlights are free of material misstatement. We were not engaged to perform an audit of the Trust's internal control over financial reporting. Our audits included consideration of internal control over financial reporting as a basis for designing audit procedures that are appropriate in the circumstances, but not for the purpose of expressing an opinion on the effectiveness of the Trust's internal control over financial reporting. Accordingly, we express no such opinion. An audit also includes examining, on a test basis, evidence supporting the amounts and disclosures in the financial statements and financial highlights, assessing the accounting principles used and significant estimates made by management, and evaluating the overall financial statement presentation. Our procedures included confirmation of securities owned as of December 31, 2011 by correspondence with the custodian and brokers or by other appropriate auditing procedures where replies from brokers were not received. We believe that our audits provide a reasonable basis for our opinion.
In our opinion, the financial statements and financial highlights referred to above present fairly, in all material respects, the financial position of Socially Responsive Portfolio, a series of Neuberger Berman Advisers Management Trust, at December 31, 2011, the results of its operations for the year then ended, the changes in its net assets for each of the two years in the period then ended, and the financial highlights for each of the five years in the period then ended, in conformity with U.S. generally accepted accounting principles.
Boston, Massachusetts
February 10, 2012
22
Trustee and Officer Information
The following tables set forth information concerning the trustees ("Trustees") and officers ("Officers") of the Trust. All persons named as Trustees and Officers also serve in similar capacities for other funds administered or managed by Management, Neuberger and Neuberger Berman Fixed Income LLC ("NBFI"). The Statement of Additional Information includes additional information about Trustees and is available upon request, without charge, by calling (800) 877-9700.
Information about the Board of Trustees
Name, (Year of Birth), and Address(1) | | Position and Length of Time Served(2) | | Principal Occupation(s)(3) | | Number of Funds in Fund Complex Overseen by Fund Trustee | | Other Directorships Held Outside Fund Complex by Fund Trustee | |
| Independent Trustees | |
| |
| John Cannon (1930) | | Trustee since 2000 | | Trustee since 2000 Consultant; formerly, Chairman, CDC Investment Advisers (registered investment adviser), 1993 to January 1999; formerly, President and Chief Executive Officer, AMA Investment Advisors, an affiliate of the American Medical Association. | | | 47 | | | Formerly, Independent Trustee or Director of three series of Oppenheimer Funds: Oppenheimer Limited Term New York Municipal Fund, Rochester Fund Municipals, and Oppenheimer Convertible Securities Fund, 1992 to 2009. | |
| |
| Faith Colish (1935) | | Trustee since 1982 | | Counsel, Carter Ledyard & Milburn LLP (law firm) since October 2002; formerly, Attorney-at-Law and President, Faith Colish, A Professional Corporation, 1980 to 2002. | | | 47 | | | Formerly, Director, 1997 to 2003, and Advisory Director, 2003 to 2006, ABA Retirement Funds (formerly, American Bar Retirement Association) (not-for-profit membership corporation). | |
| |
23
Name, (Year of Birth), and Address(1) | | Position and Length of Time Served(2) | | Principal Occupation(s)(3) | | Number of Funds in Fund Complex Overseen by Fund Trustee | | Other Directorships Held Outside Fund Complex by Fund Trustee | |
| Martha C. Goss (1949) | | Trustee since 2007 | | President, Woodhill Enterprises Inc./Chase Hollow Associates LLC (personal investment vehicle), since 2006; Chief Operating and Financial Officer, Hopewell Holdings LLC/ Amwell Holdings, LLC (a holding company for a healthcare reinsurance company start-up), since 2003; formerly, Consultant, Resources Connection (temporary staffing), 2002 to 2006. | | | 47 | | | Director, American Water (water utility), since 2003; Director, Channel Reinsurance (financial guaranty reinsurance), since 2006; Director, Allianz Life of New York (insurance), since 2005; Director, Financial Women's Association of New York (not-for-profit association), since 2003; Trustee Emerita, Brown University, since 1998; formerly, Director, Ocwen Financial Corporation (mortgage servicing), 2005 to 2010; formerly, Advisory Board Member, Attensity (software developer), 2005 to 2007; formerly, Director, Bank Leumi (commercial bank), 2005 to 2007; formerly, Director, Claire's Stores, Inc. (retailer), 2005 to 2007. | |
| |
| C. Anne Harvey (1937) | | Trustee since 1998 | | President, C.A. Harvey Associates, since October 2001; formerly, Director, AARP, 1978 to December 2001. | | | 47 | | | Formerly, President, Board of Associates to The National Rehabilitation Hospital's Board of Directors, 2001 to 2002; formerly, Member, Individual Investors Advisory Committee to the New York Stock Exchange Board of Directors, 1998 to 2002. | |
| |
| Robert A. Kavesh (1927) | | Trustee since 2000 | | Retired, since 2002; Marcus Nadler Professor Emeritus of Finance and Economics, New York University Stern School of Business; formerly, Executive Secretary-Treasurer, American Finance Association, 1961 to 1979. | | | 47 | | | Formerly, Director, The Caring Community (not-for-profit), 1997 to 2006; formerly, Director, DEL Laboratories, Inc. (cosmetics and pharmaceuticals), 1978 to 2004; formerly, Director, Apple Bank for Savings, 1979 to 1990; formerly, Director, Western Pacific Industries, Inc., (public company), 1972 to 1986. | |
| |
24
Name, (Year of Birth), and Address(1) | | Position and Length of Time Served(2) | | Principal Occupation(s)(3) | | Number of Funds in Fund Complex Overseen by Fund Trustee | | Other Directorships Held Outside Fund Complex by Fund Trustee | |
| Michael M. Knetter (1960) | | Trustee since 2007 | | President and Chief Executive Officer, University of Wisconsin Foundation, since October 2010; formerly, Dean, School of Business, University of Wisconsin - Madison; formerly, Professor of International Economics and Associate Dean, Amos Tuck School of Business - Dartmouth College, 1998 to 2002. | | | 47 | | | Director, American Family Insurance (a mutual company, not publicly traded), since March 2009; formerly, Trustee, Northwestern Mutual Series Fund, Inc., 2007 to 2010; formerly, Director, Wausau Paper, 2005 to 2011; formerly, Director, Great Wolf Resorts, 2004 to 2009. | |
| |
| Howard A. Mileaf (1937) | | Trustee since 1999 | | Retired; formerly, Vice President and General Counsel, WHX Corporation (holding company), 1993 to 2001. | | | 47 | | | Formerly, Director, Webfinancial Corporation (holding company), 2002 to 2008; formerly, Director, WHX Corporation (holding company), 2002 to 2005; formerly, Director, State Theatre of New Jersey (not-for-profit theatre), 2000 to 2005. | |
| |
| George W. Morriss (1947) | | Trustee since 2007 | | Retired; formerly, Executive Vice President and Chief Financial Officer, People's Bank, Connecticut (a financial services company), 1991 to 2001. | | | 47 | | | Manager, Larch Lane Multi-Strategy Fund complex (which currently consists of three funds), since 2006; formerly, Member, NASDAQ Issuers' Affairs Committee, 1995 to 2003. | |
| |
| Edward I. O'Brien (1928) | | Trustee since 2000 | | Private Investor; formerly, Member, Investment Policy Committee, Edward Jones, 1993 to 2001; President, Securities Industry Association ("SIA") (securities industry's representative in government relations and regulatory matters at the federal and state levels), 1974 to 1992; Adviser to SIA, November 1992 to November 1993. | | | 47 | | | Formerly, Director, Legg Mason, Inc. (financial services holding company), 1993 to July 2008; formerly, Director, Boston Financial Group (real estate and tax shelters), 1993 to 1999. | |
| |
25
Name, (Year of Birth), and Address(1) | | Position and Length of Time Served(2) | | Principal Occupation(s)(3) | | Number of Funds in Fund Complex Overseen by Fund Trustee | | Other Directorships Held Outside Fund Complex by Fund Trustee | |
| Jack L. Rivkin (1940) | | Trustee since 2002; President, 2002 to 2008 | | Formerly, Executive Vice President and Chief Investment Officer, Neuberger Berman Holdings LLC (holding company), 2002 to August 2008 and 2003 to August 2008, respectively; formerly, Managing Director and Chief Investment Officer, Neuberger, December 2005 to August 2008 and 2003 to August 2008, respectively; formerly, Executive Vice President, Neuberger, December 2002 to 2005; formerly, Director and Chairman, Management, December 2002 to August 2008; formerly, Executive Vice President, Citigroup Investments, Inc., September 1995 to February 2002; formerly, Executive Vice President, Citigroup Inc., September 1995 to February 2002. | | | 47 | | | Director, Idealab (private company), since 2009; Director, Distributed World Power (private company), since 2009; Director, Dale Carnegie and Associates, Inc. (private company), since 1999; Director, Solbright, Inc. (private company), since 1998; Director, SA Agricultural Fund, since 2009; Chairman and Director, Essential Brands (consumer products) since 2008; formerly, Director, New York Society of Security Analysts, 2006 to 2008. | |
| |
| Cornelius T. Ryan (1931) | | Trustee since 2000 | | General Partner and Adviser, TD2, TD3, and TOF1 Healthcare Venture Capital Partnerships; formerly, Founding General Partner, Oxford Partners and Oxford Bioscience Partners (venture capital investing) and President, Oxford Venture Corporation, 1981 to 2010. | | | 47 | | | Trustee, Norwalk Hospital Foundation, since 2000; Director, Supply Pro (privately held company), since 2008; formerly, Trustee, Norwalk Hospital, 1995 to 2004; formerly, President and Director, Randolph Computer Corp., 1966 to 1984; formerly, Director of numerous privately held portfolio companies of Oxford Partners and Oxford Bioscience Partners, 1981 to 2005. | |
| |
26
Name, (Year of Birth), and Address(1) | | Position and Length of Time Served(2) | | Principal Occupation(s)(3) | | Number of Funds in Fund Complex Overseen by Fund Trustee | | Other Directorships Held Outside Fund Complex by Fund Trustee | |
| Tom D. Seip (1950) | | Trustee since 2000; Chairman of the Board since 2008; Lead Independent Trustee from 2006 to 2008 | | General Partner, Ridgefield Farm LLC (a private investment vehicle); formerly, President and CEO, Westaff, Inc. (temporary staffing), May 2001 to January 2002; formerly, Senior Executive, The Charles Schwab Corporation, 1983 to 1998, including Chief Executive Officer, Charles Schwab Investment Management, Inc.; Trustee, Schwab Family of Funds and Schwab Investments, 1997 to 1998; and Executive Vice President - Retail Brokerage, Charles Schwab & Co., Inc., 1994 to 1997. | | | 47 | | | Director, H&R Block, Inc. (financial services company), since May 2001; formerly, Chairman, Compensation Committee, H&R Block, Inc., 2006 to 2010; formerly, Director, Forward Management, Inc. (asset management company), 1999 to 2006. | |
| |
| Candace L. Straight (1947) | | Trustee since 1999 | | Private investor and consultant specializing in the insurance industry; formerly, Advisory Director, Securitas Capital LLC (a global private equity investment firm dedicated to making investments in the insurance sector), 1998 to December 2003. | | | 47 | | | Public Member, Board of Governors and Board of Trustees, Rutgers University, since 2011; Director, Montpelier Re Holdings Ltd. (reinsurance company), since 2006; formerly, Director, National Atlantic Holdings Corporation (property and casualty insurance company), 2004 to 2008; formerly, Director, The Proformance Insurance Company (property and casualty insurance company), 2004 to 2008; formerly, Director, Providence Washington Insurance Company (property and casualty insurance company), 1998 to 2006; formerly, Director, Summit Global Partners (insurance brokerage firm), 2000 to 2005. | |
| |
27
Name, (Year of Birth), and Address(1) | | Position and Length of Time Served(2) | | Principal Occupation(s)(3) | | Number of Funds in Fund Complex Overseen by Fund Trustee | | Other Directorships Held Outside Fund Complex by Fund Trustee | |
| Peter P. Trapp (1944) | | Trustee since 1984 | | Retired; formerly, Regional Manager for Mid-Southern Region, Ford Motor Credit Company, September 1997 to 2007; formerly, President, Ford Life Insurance Company, April 1995 to August 1997. | | | 47 | | | | None. | | |
| |
| Trustees who are "Interested Persons" | |
| |
| Joseph V. Amato* (1962) | | Trustee since 2009 | | President and Director, Neuberger Berman Group LLC, since 2009; President and Chief Executive Officer, Neuberger and Neuberger Berman Holdings LLC (including its predecessor, Neuberger Berman Inc.), since 2007; Chief Investment Officer, Neuberger, since 2009; Chief Investment Officer (Equities) and Managing Director, Management, since 2009; Managing Director, Neuberger Berman Fixed Income LLC ("NBFI") since 2007; Board member of NBFI since 2006; formerly, Global Head of Asset Management of Lehman Brothers Holdings Inc.'s ("LBHI") Investment Management Division, 2006 to 2009; formerly, member of LBHI's Investment Management Division's Executive Management Committee, 2006 to 2009; formerly, Managing Director, Lehman Brothers Inc. ("LBI"), 2006 to 2008; formerly, Chief Recruiting and Development Officer, LBI, 2005 to 2006; formerly, Global Head of LBI's Equity Sales and a Member of its Equities Division Executive Committee, 2003 to 2005. | | | 47 | | | Member of Board of Advisors, McDonough School of Business, Georgetown University, since 2001; Member of New York City Board of Advisors, Teach for America, since 2005; Trustee, Montclair Kimberley Academy (private school), since 2007. | |
| |
28
Name, (Year of Birth), and Address(1) | | Position and Length of Time Served(2) | | Principal Occupation(s)(3) | | Number of Funds in Fund Complex Overseen by Fund Trustee | | Other Directorships Held Outside Fund Complex by Fund Trustee | |
| Robert Conti* (1956) | | Chief Executive Officer, President and Trustee since 2008; prior thereto, Executive Vice President in 2008 and Vice President, 2000 to 2008 | | Managing Director, Neuberger, since 2007; formerly, Senior Vice President, Neuberger, 2003 to 2006; formerly, Vice President, Neuberger, 1999 to 2003; President and Chief Executive Officer, Management, since 2008; formerly, Senior Vice President, Management, 2000 to 2008. | | | 47 | | | Director since 1994 and formerly, Chairman of the Board, 2008 to 2010, Staten Island Mental Health Society, Inc. | |
| |
(1) The business address of each listed person is 605 Third Avenue, New York, New York 10158.
(2) Pursuant to the Trust's Trust Instrument, each of these Trustees shall hold office for life or until his or her successor is elected or the Trust terminates; except that (a) any Trustee may resign by delivering a written resignation; (b) any Trustee may be removed with or without cause at any time by a written instrument signed by at least two-thirds of the other Trustees; (c) any Trustee who requests to be retired, or who has become unable to serve, may be retired by a written instrument signed by a majority of the other Trustees; and (d) any Trustee may be removed at any shareholder meeting by a vote of at least two-thirds of the outstanding shares.
(3) Except as otherwise indicated, each individual has held the positions shown for at least the last five years.
* Indicates a Trustee who is an "interested person" within the meaning of the 1940 Act. Mr. Amato and Mr. Conti are interested persons of the Trust by virtue of the fact that each is an officer of Management, Neuberger and/or their affiliates.
29
Information about the Officers of the Trust
Name, (Year of Birth), and Address(1) | | Position and Length of Time Served(2) | | Principal Occupation(s)(3) | |
| Andrew B. Allard (1961) | | Anti-Money Laundering Compliance Officer since 2002 | | Senior Vice President, Neuberger, since 2006 and Employee since 1999; Deputy General Counsel, Neuberger, since 2004; formerly, Vice President, Neuberger, 2000 to 2005; formerly, Employee, Management, 1994 to 1999; Anti-Money Laundering Compliance Officer, nine registered investment companies for which Management acts as investment manager and administrator (six since 2002, one since 2003, one since 2005 and one since 2006). | |
| |
| Claudia A. Brandon (1956) | | Executive Vice President since 2008 and Secretary since 1985 | | Senior Vice President, Neuberger, since 2007 and Employee since 1999; Senior Vice President, Management, since 2008 and Assistant Secretary since 2004; formerly, Vice President, Neuberger, 2002 to 2006; formerly, Vice President-Mutual Fund Board Relations, Management, 2000 to 2008; formerly, Vice President, Management, 1986 to 1999 and Employee 1984 to 1999; Executive Vice President, nine registered investment companies for which Management acts as investment manager and administrator (nine since 2008); Secretary, nine registered investment companies for which Management acts as investment manager and administrator (three since 1985, three since 2002, one since 2003, one since 2005 and one since 2006). | |
| |
| Anthony DiBernardo (1979) | | Assistant Treasurer since 2011 | | Vice President, Neuberger, since 2009; Employee, Management, since 2003; Assistant Treasurer, nine registered investment companies for which Management acts as investment manager and administrator. | |
| |
| Maxine L. Gerson (1950) | | Executive Vice President since 2008 and Chief Legal Officer since 2005 (only for purposes of sections 307 and 406 of the Sarbanes-Oxley Act of 2002) | | Managing Director, Neuberger, since 2009, and Deputy General Counsel and Assistant Secretary, Neuberger, since 2001; Managing Director, Management, since 2009, and Secretary and General Counsel, Management, since 2004; formerly, Senior Vice President, Neuberger, 2002 to 2009; formerly, Senior Vice President, Management, 2006 to 2009; Executive Vice President, nine registered investment companies for which Management acts as investment manager and administrator (nine since 2008); Chief Legal Officer (only for purposes of sections 307 and 406 of the Sarbanes-Oxley Act of 2002), nine registered investment companies for which Management acts as investment manager and administrator (eight since 2005 and one since 2006). | |
| |
| Sheila R. James (1965) | | Assistant Secretary since 2002 | | Vice President, Neuberger, since 2008 and Employee since 1999; formerly, Assistant Vice President, Neuberger, 2007; formerly, Employee, Management, 1991 to 1999; Assistant Secretary, nine registered investment companies for which Management acts as investment manager and administrator (six since 2002, one since 2003, one since 2005 and one since 2006). | |
| |
| Brian Kerrane (1969) | | Vice President since 2008 | | Senior Vice President, Neuberger, since 2006; formerly, Vice President, Neuberger, 2002 to 2006; Vice President, Management, since 2008 and Employee since 1991; Vice President, nine registered investment companies for which Management acts as investment manager and administrator (nine since 2008). | |
| |
30
Name, (Year of Birth), and Address(1) | | Position and Length of Time Served(2) | | Principal Occupation(s)(3) | |
| Kevin Lyons (1955) | | Assistant Secretary since 2003 | | Assistant Vice President, Neuberger, since 2008 and Employee since 1999; formerly, Employee, Management, 1993 to 1999; Assistant Secretary, nine registered investment companies for which Management acts as investment manager and administrator (seven since 2003, one since 2005 and one since 2006). | |
| |
| Owen F. McEntee, Jr. (1961) | | Vice President since 2008 | | Vice President, Neuberger, since 2006; Employee, Management, since 1992; Vice President, nine registered investment companies for which Management acts as investment manager and administrator (nine since 2008). | |
| |
| John M. McGovern (1970) | | Treasurer and Principal Financial and Accounting Officer since 2005 | | Senior Vice President, Neuberger, since 2007; formerly, Vice President, Neuberger, 2004 to 2006; Employee, Management, since 1993; Treasurer and Principal Financial and Accounting Officer, nine registered investment companies for which Management acts as investment manager and administrator (eight since 2005 and one since 2006); formerly, Assistant Treasurer, eight registered investment companies for which Management acts as investment manager and administrator, 2002 to 2005. | |
| |
| Frank Rosato (1971) | | Assistant Treasurer since 2005 | | Vice President, Neuberger, since 2006; Employee, Management, since 1995; Assistant Treasurer, nine registered investment companies for which Management acts as investment manager and administrator (eight since 2005 and one since 2006). | |
| |
| Neil S. Siegel (1967) | | Vice President since 2008 | | Managing Director, Management, since 2008; Managing Director, Neuberger, since 2006; formerly, Senior Vice President, Neuberger, 2004 to 2006; Vice President, nine registered investment companies for which Management acts as investment manager and administrator (nine since 2008). | |
| |
| Chamaine Williams (1971) | | Chief Compliance Officer since 2005 | | Senior Vice President, Neuberger, since 2007; Chief Compliance Officer, Management, since 2006; Chief Compliance Officer, nine registered investment companies for which Management acts as investment manager and administrator (eight since 2005 and one since 2006); formerly, Senior Vice President, LBI, 2007 to 2008; formerly, Vice President, LBI, 2003 to 2006; formerly, Chief Compliance Officer, Lehman Brothers Asset Management Inc., 2003 to 2007; formerly, Chief Compliance Officer, Lehman Brothers Alternative Investment Management LLC, 2003 to 2007. | |
| |
(1) The business address of each listed person is 605 Third Avenue, New York, New York 10158.
(2) Pursuant to the By-Laws of the Trust, each officer elected by the Trustees shall hold office until his or her successor shall have been elected and qualified or until his or her earlier death, inability to serve, or resignation. Officers serve at the pleasure of the Trustees and may be removed at any time with or without cause.
(3) Except as otherwise indicated, each individual has held the positions shown for at least the last five years.
31
Proxy Voting Policies and Procedures
A description of the policies and procedures that the Trust uses to determine how to vote proxies relating to portfolio securities is available, without charge, by calling 1-800-877-9700 (toll-free) and on the website of the Securities and Exchange Commission, at www.sec.gov. Information regarding how the Trust voted proxies relating to portfolio securities during the most recent 12-month period ended June 30 is also available, without charge, by calling 1-800-877-9700 (toll-free), on the website of the Securities and Exchange Commission at www.sec.gov, and on Management's website at www.nb.com.
Quarterly Portfolio Schedule
The Trust files a complete schedule of portfolio holdings for the Fund with the Securities and Exchange Commission for the first and third quarters of each fiscal year on Form N-Q. The Trust's Forms N-Q are available on the Securities and Exchange Commission's website at www.sec.gov and may be reviewed and copied at the Securities and Exchange Commission's Public Reference Room in Washington, DC. Information on the operation of the Public Reference Room may be obtained by calling 1-800-SEC-0330. The information on Form N-Q is available upon request, without charge, by calling 1-800-877-9700 (toll free).
Notice to Shareholders
100.00% of the dividends earned during the fiscal year ended December 31, 2011 qualifies for the dividends received deduction for corporate shareholders.
Board Consideration of the Management and Sub-Advisory Agreements
At a meeting held on October 13, 2011, the Board, including the Trustees who are not "interested persons" of Management (including its affiliates) or Neuberger Berman Advisers Management Trust ("Independent Fund Trustees"), approved the continuance of the Management and Sub-Advisory Agreements ("Agreements") for the Fund.
In evaluating the Agreements, the Board, including the Independent Fund Trustees, reviewed materials furnished by Management and Neuberger in response to questions submitted by counsel for the Independent Fund Trustees, and met with senior representatives of Management and Neuberger regarding their personnel and operations. The Independent Fund Trustees were advised by counsel that is experienced in Investment Company Act of 1940 matters and that is independent of Management and Neuberger. The Independent Fund Trustees received a memorandum from independent counsel discussing the legal standards for their consideration of the proposed continuance of the Agreements. They met with such counsel separately from representatives of Management to discuss the annual contract review. The annual contract review extends over three regular meetings of the Board, including one meeting devoted primarily to reviewing and discussing Fund performance, to ensure that Management and Neuberger have time to respond to any questions the Independent Fund Trustees may have on their initial review of the report and that the Independent Fund Trustees have time to consider those responses.
The Board considered the following factors, among others, in connection with its approval of the continuance of the Agreements: (1) the nature, extent, and quality of the services provided by Management and Neuberger; (2) the performance of the Fund compared to a relevant market index and a peer group of investment companies; (3) the costs of the services provided and profits or losses realized by Management and its affiliates from their relationship with the Fund; (4) the extent to which economies of scale might be realized as the Fund grows; and (5) whether fee levels reflect any such potential economies of scale for the benefit of investors in the Fund. In their deliberations, the Board members did not identify any particular information that was all-important or controlling, and each Trustee may have attributed different weights to the various factors.
The Board evaluated the terms of the Agreements, the overall fairness of the Agreements to the Fund and whether the Agreements were in the best interests of the Fund and its shareholders.
32
With respect to the nature, extent and quality of the services provided, the Board considered the performance of the Fund and the experience and staffing of the portfolio management and investment research personnel of Management and Neuberger who perform services for the Fund. The Board noted that Management also provides certain administrative services, including fund accounting and compliance oversight. The Board also considered Management's and Neuberger's policies and practices regarding brokerage and the allocation of portfolio transactions. The Board's Portfolio Transactions and Pricing Committee from time to time reviewed the quality of the execution services that Management and Neuberger had provided, and periodically reviews studies by an independent firm engaged to review and evaluate the quality of brokerage execution received by the Fund. The Board also reviewed whether Management and Neuberger used brokers to execute Fund transactions that provide research and other services to Management and Neuberger, and the types of benefits potentially derived from such services by Management, Neuberger, the Fund and other clients of Management and Neuberger. In addition, the Board noted the positive compliance history of Management and Neuberger, as each firm has been free of significant reported compliance problems.
The Board considered the performance of the Fund relative to its benchmark and the average performance of composite peer groups of investment companies dedicated to insurance products pursuing broadly similar strategies. The Board also reviewed performance in relation to certain measures of the degree of investment risk undertaken by the portfolio managers, during the period. The Board also considered Management's resources and responsiveness with respect to the Fund.
With respect to the overall fairness of the Agreements, the Board considered the fee structure for the Fund under the Agreements as compared to a peer group of comparable funds and any fall-out benefits likely to accrue to Management or Neuberger or their affiliates from their relationship with the Fund. The Board also considered the profitability of Management and its affiliates from their association with the Fund.
The Board reviewed a comparison of the Fund's management fee and overall expense ratio to a peer group of broadly comparable funds. The Board considered the mean and median of the management fees and expense ratios of the peer group. The Board noted that the Fund's management fee was higher than the peer group mean and median, but that the Fund's overall expense ratio was lower compared to the peer group mean and median. With regard to the sub-advisory fee paid to Neuberger, the Board noted that this fee is "at cost." In addition, the Board considered the contractual limit on Fund expenses undertaken by Management. The Board also noted that Management incurred a loss on the Fund.
The Board considered whether there were other funds that were advised or sub-advised by Management or its affiliates or separate accounts managed by Management or its affiliates with similar investment objectives, policies and strategies to the Fund. The Board compared the fees charged to the Fund to the fees charged to a registered fund, a sub-advised fund and a separate account, each managed by Management in a similar style to the Fund. The Board considered the appropriateness and reasonableness of any differences between the fees charged to the Fund and the other funds and account and determined that the differences in fees were consistent with the management and other services provided.
The Board also evaluated any apparent or anticipated economies of scale in relation to the services Management provides to the Fund. The Board considered whether the Fund's fee structure provides for a reduction of payments resulting from the use of breakpoints and whether those breakpoints are set at appropriate asset levels. In concluding that the benefits accruing to Management and its affiliates by virtue of their relationship to the Fund were reasonable in comparison with the costs of providing the investment advisory services and the benefits accruing to the Fund, the Board reviewed specific data as to Management's profit or loss on the Fund for a recent period and the trend in profit or loss over recent years. The Board also carefully examined Management's cost allocation methodology.
Conclusions
In approving the Agreements, the Board concluded that the terms of each Agreement are fair and reasonable and that approval of the Agreements is in the best interests of the Fund and its shareholders. In reaching this determination, the Board considered that Management and Neuberger could be expected to provide a high level of service to the Fund; that the performance of the Fund was satisfactory over time; that the Fund's fee structure appeared to the Board to be reasonable given the nature and quality of services provided; and that the benefits accruing to Management and its affiliates by virtue of their relationship to the Fund were reasonable in comparison with the benefits accruing to the Fund.
33
`
The Registrant’s Board of Trustees (“Board”) adopted a code of ethics that applies to the Registrant's principal executive officer, principal financial officer, principal accounting officer or controller, or persons performing similar functions (“Code of Ethics”). For the period covered by this Form N-CSR, there were no amendments to the Code of Ethics and there were no waivers from the Code of Ethics granted to the Registrant's principal executive officer, principal financial officer, principal accounting officer or controller, or persons performing similar functions.
A copy of the Code of Ethics was included as an exhibit to Registrant's Form N-CSR filed on February 28, 2007. The Code of Ethics is also available, without charge, by calling 1-800-877-9700 (toll-free).
The Board has determined that the Registrant has two audit committee financial experts serving on its audit committee. The Registrant's audit committee financial experts are Martha C. Goss and George W. Morriss. Ms. Goss and Mr. Morriss are independent trustees as defined by Form N-CSR.
The financial information provided below is that of the Registrant. This Form N-CSR relates only to the Balanced, Small-Cap Growth, Growth, Guardian, International, Short Duration Bond, Mid-Cap Growth, Partners, Regency and Socially Responsive Portfolios (collectively, the “Funds”). Ernst & Young, LLP (“E&Y”) serves as the principal accountant for the Funds.
Audit Fees include amounts related to the audit of the Registrant's annual financial statements and services normally provided by the principal accountant in connection with statutory and regulatory filings. Audit-Related Fees include amounts for attest services not required by statute or regulation. Tax Fees include amounts related to tax compliance, tax planning, and tax advice. All Other Fees include amounts for products and services not reported in Audit Fees, Audit-Related Fees and Tax Fees.