As filed with the Securities and Exchange Commission on March 2, 2011
UNITED STATES
SECURITIES AND EXCHANGE COMMISSION
Washington, D.C. 20549
FORM N-CSR
CERTIFIED SHAREHOLDER REPORT OF
REGISTERED MANAGEMENT INVESTMENT COMPANIES
Investment Company Act File Number: 811-4255
NEUBERGER BERMAN ADVISERS MANAGEMENT TRUST
(Exact Name of the Registrant as Specified in Charter)
605 Third Avenue, 2nd Floor
New York, New York 10158-0180
(Address of Principal Executive Offices - Zip Code)
Robert Conti, Chief Executive Officer
Neuberger Berman Advisers Management Trust
605 Third Avenue, 2nd Floor
New York, New York 10158-0180
Jeffrey S. Puretz, Esq.
Dechert LLP
1775 I Street, N.W.
Washington, D.C. 20006
(Names and Addresses of agents for service)
Registrant's Telephone Number, including area code: (212) 476-8800
Date of fiscal year end: December 31
Date of reporting period: December 31, 2010
Form N-CSR is to be used by management investment companies to file reports with the Commission not later than 10 days after the transmission to stockholders of any report that is required to be transmitted to stockholders under Rule 30e-1 under the Investment Company Act of 1940 (the "Act") (17 CFR 270.30e-1). The Commission may use the information provided on Form N-CSR in its regulatory, disclosure review, inspection, and policymaking roles.
A registrant is required to disclose the information specified by Form N-CSR, and the Commission will make this information public. A registrant is not required to respond to the collection of information contained in Form N-CSR unless the Form displays a currently valid Office of Management and Budget ("OMB") control number. Please direct comments concerning the accuracy of the information collection burden estimate and any suggestions for reducing the burden to Secretary, Securities and Exchange Commission, 100 F Street, NE, Washington, DC 20549. The OMB has reviewed this collection of information under the clearance requirements of 44 U.S.C. Section 3507.
ITEM 1. REPORTS TO SHAREHOLDERS
The following are copies of the annual reports transmitted to shareholders pursuant to Rule 30e-1 under the Act.

Neuberger Berman
Advisers Management Trust
Balanced Portfolio
I Class Shares
Annual Report
December 31, 2010
Balanced Portfolio Managers' Commentary
The Neuberger Berman Advisors Management Trust (AMT) Balanced Portfolio posted a positive return for full-year 2010. The Portfolio's equity component turned in solid results, posting a positive return and outperforming the Russell Midcap(R) Growth Index. Its fixed income component posted a favorable absolute return and outperformed its benchmark, the BofA Merrill Lynch 1-3 Year Treasury Index.
Equities
2010 started on a positive note, with many of 2009's market advances remaining in place. Markets saw the continuation of the type of low quality rally that is typical for a period following a recession. Within mid-cap stocks, however, the market's character began to change fairly soon. As early as March and April, the difference in performance between lower and higher quality stocks had declined significantly. As the higher-quality growth stocks that we tend to own came back in favor, stock selection began to make more of an impact on performance.
In late spring and early summer, the European sovereign debt crisis and other concerns caused a sharp correction, but by August, the worst of the market anxiety was gone. This was supported by the European Union's actions to attempt to resolve the crisis, reduced concern about slower growth in China, and improving economic indicators. One of the most important catalysts, however, was Federal Reserve Chairman Bernanke's proposal of additional quantitative easing (QE2) aimed at underpinning the recovery. This prospect cheered the markets as growth for the rest of 2010 and 2011 began to look more promising. For the full year, the Russell Midcap Growth Index advanced by over 26%.
Corporate earnings were strong throughout 2010, and the rally was relatively broad-based, with the Consumer Discretionary, Industrials and Materials sectors benefiting the most for the year. Within the equity segment of the Portfolio, strong stock selection allowed us to add value in eight of 10 industry sectors, with particular strength in Information Technology (IT), Energy and Industrials.
Entering 2011, domestic economic growth currently appears stronger, with many economists raising forecasts, and emerging markets growth continues, even as China works to contain inflation. Capital spending is on an uptick, domestically and globally, driving much of the growth. In the second half of the year, we anticipate the economy and earnings may decelerate somewhat, but with fewer headwinds now than in 2010. As a result, we are cautiously optimistic for the market. A combination of fair valuations, positive economic growth, and low interest rates and inflation is typically a formula for improving stock prices. In our opinion, unemployment is likely to remain uncomfortably high as companies accustomed to lean operations may be slow to add jobs. We also believe housing continues to be a concern, as does the European sovereign debt situation.
Within the Portfolio's equity segment, at year-end we were overweighted in IT, Industrials, Health Care and Energy, which modestly positioned us for a better economy. We were underweighted in Financials, Materials and Consumer Discretionary due to concerns about unemployment and having already taken profits in its strength. As always, our focus is on identifying companies with strong top line growth and competitive products and services relative to peers, with the management teams, operating models, and balance sheet strength needed to execute in the global economy.
Fixed Income
To a great extent, risk appetite was robust during the reporting period as investors were drawn to investments that offered relatively high yields in the low interest rate environment. However, there were several occasions during the year when risk aversion increased. Two such instances took place in late April and May, and again in November, when concerns regarding the European sovereign debt crisis escalated. However, these proved to be only temporary setbacks and risk aversion was quickly replaced by continued strong demand for non-Treasury fixed income securities. Also supporting non-Treasuries were strengthening corporate balance sheets and better-than-expected corporate profits, continued low interest rates, benign inflation and indications that the Federal Reserve would introduce additional quantitative easing to support the economy.
1
The Portfolio's fixed income segment was well positioned for an environment that favored non-Treasuries. In particular, holdings in commercial mortgage-backed securities (CMBS), non-agency mortgage-backed securities, investment grade corporate bonds and asset-backed securities enhanced results as their spreads (the difference in yield between Treasuries and other bond sectors) narrowed during the 12-month reporting period. Within the corporate sector, our financial bonds produced strong results.
Detracting somewhat from results was the Portfolio segment's defensive duration positioning. When the reporting period began, duration was marginally shorter than that of the BofA Merrill Lynch index. We adjusted duration to an even shorter degree in May as interest rates fell sharply, given that we did not believe they would move substantially lower. However, this positioning was not rewarded as short-term rates fell to historically low levels in October given expectations for QE2. While the short duration was beneficial during the last two months of the year when interest rates moved higher, overall it was a negative for performance as rates declined during the 12-month period as a whole. From time to time during the reporting period, we used Treasury futures to manage the Portfolio's duration positioning, which had a slightly positive impact to total return.
We made a number of adjustments to the Portfolio during the reporting period, such as opportunistically reducing its weighting in non-agency mortgage-backed securities to take advantage of strengthening prices. The Portfolio's exposure to CMBS was also pared given their strong results. This was primarily done as a number of the Portfolio's CMBS positions matured. We largely reinvested the proceeds in a combination of fixed rate asset-backed securities and corporate bonds, where, in our opinion, we found attractively valued opportunities.
Looking ahead, we believe the economy has enough momentum to avoid a double-dip recession and that relatively low interest rates will help the economy continue its recovery. Low rates should also help corporations enjoy low borrowing costs and may spur an increase in home refinancing, which would put extra money in consumers' pockets. In addition, the "shadow" stimulus of the extension of the Bush-era tax cuts and payroll tax reduction could serve to support consumer spending, which accounts for roughly 70% of GDP. While we expect to see positive growth in 2011, it could remain below average versus other periods coming out of a severe economic downturn.
Against this backdrop, we believe that demand for non-Treasuries will remain strong. We currently feel the Portfolio's fixed income segment is appropriately positioned for such an environment with our emphasis in non-Treasuries as we seek to generate solid risk-adjusted returns.
Sincerely,
Kenneth J. Turek, Thomas Sontag
Michael Foster and Richard Grau
Portfolio Co-Managers
The risks involved in seeking capital appreciation from investments primarily in mid-cap stocks and in investment grade bonds and other debt securities from U.S. government and corporate issuers are set forth in the prospectus and statement of additional information.
Mid-capitalization stocks are more vulnerable to financial risks and other risks than stocks of larger companies. They also trade less frequently and in lower volume than larger company stocks, so their market prices tend to be more volatile.
The composition, industries and holdings of the Portfolio are subject to change.
2
Balanced Portfolio (Unaudited)
PORTFOLIO BY TYPE OF SECURITY
| (% of Total Net Assets) | |
| Adjustable Rate Mortgages | | | 4.0 | % | |
| Asset-Backed | | | 3.1 | | |
| Commercial Mortgage-Backed | | | 1.0 | | |
| Common Stock | | | 64.4 | | |
| Corporate Debt | | | 8.5 | | |
| Non-Agency Mortgage-Backed | | | 0.8 | | |
| U.S. Government Agency Mortgage-Backed | | | 2.1 | | |
| U.S. Treasury | | | 13.1 | | |
| Short-Term | | | 3.8 | | |
Liabilities, less cash, receivables and
other assets | | | (0.8 | ) | |
| Total | | | 100.0 | % | |
PERFORMANCE HIGHLIGHTS1
| | | Inception | | Average Annual Total Return
Ended 12/31/2010 | |
| | | Date | | 1 Year | | 5 Years | | 10 Years | | Life of Fund* | |
Balanced Portfolio
Class I | | 02/28/1989 | | | 18.83 | % | | | 2.53 | % | | | 1.22 | % | | | 6.70 | % | |
BofA Merrill Lynch
1-3 Year Treasury
Index2 | | | | | | | 2.35 | % | | | 4.17 | % | | | 3.92 | % | | | 5.62 | % | |
Russell Midcap(R)
Growth Index2 | | | | | 26.38 | % | | | 4.88 | % | | | 3.12 | % | | | 10.30 | % | |
Russell Midcap(R)
Index2 | | | | | | | 25.48 | % | | | 4.66 | % | | | 6.54 | % | | | 11.44 | % | |
Performance data quoted represent past performance, which is no guarantee of future results. The investment return and principal value of an investment will fluctuate so that an investor's shares, when redeemed, may be worth more or less than their original cost. Results are shown on a "total return" basis and include reinvestment of all income dividends and distributions.
Current performance may be lower or higher than the performance data quoted. For performance data current to the most recent month end, please visit https://www.nb.com.
* Index returns are as of the inception date 02/28/1989.
As stated in the Portfolio's most recent prospectus, the total annual operating expense ratio for fiscal year 2009 was 2.05% for Class I shares (prior to any fee waivers or expense reimbursements). Neuberger Berman Management LLC has contractually agreed to limit certain expenses of the Portfolio through 12/31/2013.
COMPARISON OF A $10,000 INVESTMENT
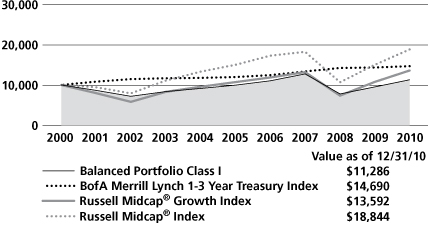
This chart shows the value of a hypothetical $10,000 investment in the Portfolio over the past 10 fiscal years, or since the Portfolio's inception, if it has not operated for 10 years. The result is compared with one or more benchmarks, which may include a broad-based market index and/or a narrower index. Please note that market indices have not been reduced to reflect any of the fees and costs of investing. All results include the reinvestment of income dividends and distributions. Neither the Portfolio's returns nor the market indices shown in the graph and table reflect the effect of taxes an investor would pay on Portfolio distributions or on the redemption of Portfolio shares. Results represent past performance and do not indicate future results.
Please see Endnotes for additional information.
3
Endnotes
1 "Total Return" includes reinvestment of all income dividends and distributions. Results represent past performance and do not indicate future results. The value of an investment in the Portfolio and the return on the investment both will fluctuate, and redemption proceeds may be higher or lower than an investor's original cost. The performance information does not reflect fees and expenses of the variable annuity and variable life insurance policies or the qualified pension and retirement plans whose proceeds are invested in the Portfolio. Neuberger Berman Management LLC ("NBM LLC") has agreed to absorb certain expenses of the AMT Portfolios, including the Portfolio. Without this arrangement, which is subject to change, the total returns of the Portfolio may have been less.
2 The Russell Midcap(R) Growth Index measures the performance of those Russell Midcap(R) Index companies with higher price-to-book ratios and higher forecasted growth values. The Russell Midcap Index measures the performance of the 800 smallest companies in the Russell 1000(R) Index, which represents approximately 27% of the total market capitalization of the Russell 1000 Index (which, in turn, consists of the 1,000 largest U.S. companies, based on the market capitalization). The BofA Merrill Lynch 1-3 Year Treasury Index is an unmanaged total return market value index consisting of all coupon-bearing U.S. Treasury publicly placed debt securities with maturities between 1 to 3 years. Please note that indices do not take into account any fees and expenses of investing in the individual securities that they track and that individuals cannot invest directly in any index. Data about the performance of these indices are prepared or obtained by NBM LLC and include reinvestment of all income dividends and distributions. The Portfolio may invest in many securities not included in the above-described indices or may not invest in all securities included in the above-described indices.
Any ratios or other measurements using a factor of forecasted earnings of a company discussed herein are based on consensus estimates, not NBM LLC's own projections, and they may or may not be realized. In addition, any revision to a forecast could affect the market price of a security. By quoting them herein, NBM LLC does not offer an opinion as to the accuracy of and does not guarantee these forecasted numbers.
The investments for the Portfolio are managed by the same portfolio manager(s) who may manage one or more other mutual funds that have similar names, investment objectives and investment styles as the Portfolio. You should be aware that the Portfolio is likely to differ from the other mutual funds in size, cash flow pattern and tax matters. Accordingly, the holdings and performance can be expected to vary from those of the other mutual funds.
The composition, industries and holdings of the Portfolio are subject to change.
Shares of the separate AMT Portfolios are not available to the general public. Shares of this Portfolio may be purchased only by life insurance companies to be used with their separate accounts that fund variable annuity and variable life insurance policies and by qualified pension and retirement plans.
Statistics and projections in this report are derived from sources deemed to be reliable but cannot be regarded as a representation of future results of the AMT Portfolios. This report is prepared for the general information of shareholders and is not an offer of shares of the AMT Portfolios. Shares of the AMT Portfolios are sold only through the currently effective prospectuses, which must precede or accompany this report.
The "Neuberger Berman" name and logo are registered service marks of Neuberger Berman Group LLC. "Neuberger Berman Management LLC" and the individual Fund names in this piece are either service marks or registered service marks of Neuberger Berman Management LLC.
(c) 2011 Neuberger Berman Management LLC distributor. All rights reserved.
4
Information About Your Fund's Expenses
This table is designed to provide information regarding costs related to your investments. All mutual funds incur operating expenses, which include management fees, fees for administrative services and costs of shareholder reports, among others. The following examples are based on an investment of $1,000 made at the beginning of the six month period ended December 31, 2010 and held for the entire period. The table illustrates the fund's costs in two ways:
| Actual Expenses and Performance: | | The first section of the table provides information about actual account values and actual expenses in dollars, based on the fund's actual performance during the period. You may use the information in this line, together with the amount you invested, to estimate the expenses you paid over the period. Simply divide your account value by $1,000 (for example, an $8,600 account value divided by $1,000 = 8.6), then multiply the result by the number in the first section of the table under the heading entitled "Expenses Paid During the Period" to estimate the expenses you paid over the period. | |
|
Hypothetical Example for
Comparison Purposes: | | The second section of the table provides information about hypothetical account values and hypothetical expenses based on the fund's actual expense ratio and an assumed rate of return at 5% per year before expenses. This return is not the fund's actual return. The hypothetical account values and expenses may not be used to estimate the actual ending account balance or expenses you paid for the period. You may use this information to compare the ongoing costs of investing in this fund versus other funds. To do so, compare the expenses shown in this 5% hypothetical example with the 5% hypothetical examples that appear in the shareholder reports of other funds. | |
|
Please note that the expenses in the table are meant to highlight your ongoing costs only. The table and expense example do not include any transaction costs, such as fees and expenses that are, or may be, imposed under your variable contract or qualified pension plan. Therefore, the information under the heading "Hypothetical (5% annual return before expenses)" is useful in comparing ongoing costs only, and will not help you determine the relative total costs of owning different funds. In addition, if these transaction costs were included, your costs would have been higher.
Expense Information as of 12/31/10 (Unaudited)
NEUBERGER BERMAN ADVISERS MANAGEMENT TRUST BALANCED PORTFOLIO
| Actual | | Beginning Account
Value
7/1/10 | | Ending Account
Value
12/31/10 | | Expenses Paid During
the Period*
7/1/10 - 12/31/10 | |
| Class I | | $ | 1,000.00 | | | $ | 1,175.20 | | | $ | 10.14 | | |
| Hypothetical (5% annual return before expenses)** | |
| Class I | | $ | 1,000.00 | | | $ | 1,015.88 | | | $ | 9.40 | | |
* Expenses are equal to the annualized expense ratio of 1.85%, multiplied by the average account value over the period, multiplied by 184/365 (to reflect the one-half year period shown).
** Hypothetical 5% annual return before expenses is calculated by multiplying the number of days in the most recent half year divided by 365.
5
Schedule of Investments Balanced Portfolio
| NUMBER OF SHARES | | | | VALUEt | |
| Common Stocks (64.4%) | | | |
| Aerospace & Defense (1.4%) | | | |
| | 2,000 | | | BE Aerospace | | $ | 74,060 | * | |
| | 1,250 | | | HEICO Corp. | | | 63,788 | | |
| | 800 | | | Precision Castparts | | | 111,368 | | |
| | | | 249,216 | | |
| Air Freight & Logistics (1.1%) | | | |
| | 2,400 | | | C.H. Robinson Worldwide | | | 192,456 | | |
| Auto Components (1.3%) | | | |
| | 1,750 | | | BorgWarner, Inc. | | | 126,630 | * | |
| | 3,400 | | | Gentex Corp. | | | 100,504 | | |
| | | | 227,134 | | |
| Biotechnology (0.9%) | | | |
| | 2,000 | | | Alexion Pharmaceuticals | | | 161,100 | * | |
| Capital Markets (1.2%) | | | |
| | 1,300 | | | Affiliated Managers Group | | | 128,986 | * | |
| | 3,400 | | | SEI Investments | | | 80,886 | | |
| | | | 209,872 | | |
| Chemicals (0.9%) | | | |
| | 2,650 | | | Nalco Holding | | | 84,641 | | |
| | 1,000 | | | Sigma-Aldrich | | | 66,560 | | |
| | | | 151,201 | | |
| Commercial Services & Supplies (1.3%) | | | |
| | 2,900 | | | Stericycle, Inc. | | | 234,668 | * | |
| Communications Equipment (1.2%) | | | |
| | 1,000 | | | F5 Networks | | | 130,160 | * | |
| | 2,000 | | | Juniper Networks | | | 73,840 | * | |
| | | | 204,000 | | |
| Computers & Peripherals (0.8%) | | | |
| | 2,400 | | | NetApp, Inc. | | | 131,904 | * | |
| Diversified Consumer Services (0.3%) | | | |
| | 1,050 | | | DeVry, Inc. | | | 50,379 | | |
| Diversified Financial Services (1.4%) | | | |
| | 1,000 | | | IntercontinentalExchange Inc. | | | 119,150 | * | |
| | 3,400 | | | MSCI Inc. Class A | | | 132,464 | * | |
| | | | 251,614 | | |
| NUMBER OF SHARES | | | | VALUEt | |
| Electrical Equipment (2.7%) | | | |
| | 3,600 | | | AMETEK, Inc. | | $ | 141,300 | | |
| | 1,250 | | | Polypore International | | | 50,913 | * | |
| | 1,750 | | | Roper Industries | | | 133,752 | | |
| | 4,900 | | | Sensata Technologies Holding | | | 147,539 | * | |
| | | | 473,504 | | |
Electronic Equipment, Instruments &
Components (3.1%) | | | |
| | 2,000 | | | Amphenol Corp. Class A | | | 105,560 | | |
| | 2,400 | | | Dolby Laboratories Class A | | | 160,080 | * | |
| | 3,400 | | | National Instruments | | | 127,976 | | |
| | 3,900 | | | Trimble Navigation | | | 155,727 | * | |
| | | | 549,343 | | |
| Energy Equipment & Services (2.6%) | | | |
| | 1,700 | | | Cameron International | | | 86,241 | * | |
| | 1,500 | | | CARBO Ceramics | | | 155,310 | | |
| | 1,700 | | | Core Laboratories N.V. | | | 151,385 | | |
| | 1,000 | | | Oil States International | | | 64,090 | * | |
| | | | 457,026 | | |
| Food & Staples Retailing (0.4%) | | | |
| | 400 | | | Fresh Market | | | 16,480 | * | |
| | 1,000 | | | Whole Foods Market | | | 50,590 | * | |
| | | | 67,070 | | |
| Food Products (0.6%) | | | |
| | 1,700 | | | Mead Johnson Nutrition | | | 105,825 | | |
| Health Care Equipment & Supplies (2.8%) | | | |
| | 2,000 | | | Edwards Lifesciences | | | 161,680 | * | |
| | 250 | | | Intuitive Surgical | | | 64,438 | * | |
| | 3,900 | | | NxStage Medical | | | 97,032 | * | |
| | 1,800 | | | ResMed Inc. | | | 62,352 | * | |
| | 3,650 | | | Volcano Corp. | | | 99,681 | * | |
| | | | 485,183 | | |
| Health Care Providers & Services (1.6%) | | | |
| | 2,700 | | | Express Scripts | | | 145,935 | * | |
| | 2,050 | | | HMS Holdings | | | 132,779 | * | |
| | | | 278,714 | | |
| Health Care Technology (1.2%) | | | |
| | 1,400 | | | Cerner Corp. | | | 132,636 | * | |
| | 1,000 | | | Quality Systems | | | 69,820 | | |
| | | | 202,456 | | |
See Notes to Schedule of Investments
6
| NUMBER OF SHARES | | | | VALUEt | |
| Hotels, Restaurants & Leisure (1.3%) | | | |
| | 1,750 | | | Hyatt Hotels Class A | | $ | 80,080 | * | |
| | 3,400 | | | WMS Industries | | | 153,816 | * | |
| | | | 233,896 | | |
| Household Products (0.6%) | | | |
| | 1,400 | | | Church & Dwight | | | 96,628 | | |
| Internet Software & Services (0.6%) | | | |
| | 2,000 | | | GSI Commerce | | | 46,400 | * | |
| | 2,000 | | | Rackspace Hosting | | | 62,820 | * | |
| | | | 109,220 | | |
| IT Services (1.9%) | | | |
| | 2,400 | | | Cognizant Technology
Solutions Class A | | | 175,896 | * | |
| | 3,900 | | | Sapient Corp. | | | 47,190 | | |
| | 2,900 | | | VeriFone Systems | | | 111,824 | * | |
| | | | 334,910 | | |
| Leisure Equipment & Products (0.5%) | | | |
| | 2,000 | | | Hasbro, Inc. | | | 94,360 | | |
| Life Science Tools & Services (0.4%) | | | |
| | 1,000 | | | Illumina, Inc. | | | 63,340 | * | |
| Machinery (3.0%) | | | |
| | 1,300 | | | Cummins Inc. | | | 143,013 | | |
| | 2,700 | | | Danaher Corp. | | | 127,359 | | |
| | 1,100 | | | Donaldson Co. | | | 64,108 | | |
| | 750 | | | Flowserve Corp. | | | 89,415 | | |
| | 2,000 | | | Pall Corp. | | | 99,160 | | |
| | | | 523,055 | | |
| Media (1.4%) | | | |
| | 2,300 | | | Discovery Communications
Class A | | | 95,910
| * | |
| | 2,250 | | | Focus Media Holding ADR | | | 49,343 | * | |
| | 2,100 | | | Scripps Networks Interactive
Class A | | | 108,675 | | |
| | | | 253,928 | | |
| Metals & Mining (0.4%) | | | |
| | 1,000 | | | Cliffs Natural Resources | | | 78,010 | | |
| Multiline Retail (1.4%) | | | |
| | 2,525 | | | Dollar Tree | | | 141,602 | * | |
| | 2,500 | | | Nordstrom, Inc. | | | 105,950 | | |
| | | | 247,552 | | |
| NUMBER OF SHARES | | | | VALUEt | |
| Oil, Gas & Consumable Fuels (2.0%) | | | |
| | 2,600 | | | Concho Resources | | $ | 227,942 | * | |
| | 1,100 | | | Whiting Petroleum | | | 128,909 | * | |
| | | | 356,851 | | |
| Pharmaceuticals (1.8%) | | | |
| | 1,750 | | | Perrigo Co. | | | 110,827 | | |
| | 2,650 | | | Salix Pharmaceuticals | | | 124,444 | * | |
| | 1,500 | | | Watson Pharmaceuticals | | | 77,475 | * | |
| | | | 312,746 | | |
| Professional Services (1.1%) | | | |
| | 1,000 | | | Manpower Inc. | | | 62,760 | | |
| | 3,900 | | | Verisk Analytics Class A | | | 132,912 | * | |
| | | | 195,672 | | |
Real Estate Management &
Development (0.7%) | | | |
| | 1,500 | | | Jones Lang LaSalle | | | 125,880 | | |
| Road & Rail (0.7%) | | | |
| | 2,900 | | | J.B. Hunt Transport Services | | | 118,349 | | |
Semiconductors & Semiconductor
Equipment (3.1%) | | | |
| | 2,600 | | | Analog Devices | | | 97,942 | | |
| | 4,400 | | | Avago Technologies | | | 125,268 | | |
| | 5,400 | | | Marvell Technology Group | | | 100,170 | * | |
| | 3,400 | | | Microchip Technology | | | 116,314 | | |
| | 2,900 | | | Varian Semiconductor
Equipment Associates | | | 107,213 | * | |
| | | | 546,907 | | |
| Software (7.1%) | | | |
| | 1,750 | | | Adobe Systems | | | 53,865 | * | |
| | 2,900 | | | ANSYS, Inc. | | | 151,003 | * | |
| | 1,000 | | | BMC Software | | | 47,140 | * | |
| | 2,250 | | | Check Point Software
Technologies | | | 104,085 | * | |
| | 2,000 | | | Citrix Systems | | | 136,820 | * | |
| | 3,650 | | | Informatica Corp. | | | 160,709 | * | |
| | 2,000 | | | MICROS Systems | | | 87,720 | * | |
| | 2,400 | | | QLIK Technologies | | | 61,944 | * | |
| | 1,500 | | | RealD Inc. | | | 38,880 | * | |
| | 3,400 | | | Rovi Corp. | | | 210,834 | * | |
| | 850 | | | Salesforce.com, Inc. | | | 112,200 | * | |
| | 1,500 | | | Solera Holdings | | | 76,980 | | |
| | | | 1,242,180 | | |
| Specialty Retail (3.8%) | | | |
| | 2,500 | | | Bed Bath & Beyond | | | 122,875 | * | |
| | 2,000 | | | Dick's Sporting Goods | | | 75,000 | * | |
| | 1,250 | | | Jo-Ann Stores | | | 75,275 | * | |
| | 1,000 | | | O'Reilly Automotive | | | 60,420 | * | |
See Notes to Schedule of Investments
7
| NUMBER OF SHARES | | | | VALUEt | |
| | 2,000 | | | Ross Stores | | $ | 126,500 | | |
| | 3,400 | | | Urban Outfitters | | | 121,754 | * | |
| | 2,400 | | | Williams-Sonoma | | | 85,656 | | |
| | | | 667,480 | | |
| Textiles, Apparel & Luxury Goods (1.3%) | | | |
| | 2,250 | | | Coach, Inc. | | | 124,448 | | |
| | 1,500 | | | Phillips-Van Heusen | | | 94,515 | | |
| | | | 218,963 | | |
| Trading Companies & Distributors (1.8%) | | | |
| | 2,700 | | | Fastenal Co. | | | 161,757 | | |
| | 850 | | | MSC Industrial Direct Class A | | | 54,986 | | |
| | 700 | | | W.W. Grainger | | | 96,677 | | |
| | | | 313,420 | | |
| Wireless Telecommunication Services (2.7%) | | | |
| | 2,250 | | | American Tower Class A | | | 116,190 | * | |
| | 3,150 | | | NII Holdings | | | 140,679 | * | |
| | 5,400 | | | SBA Communications Class A | | | 221,076 | * | |
| | | | 477,945 | | |
| | | | | Total Common Stocks
(Cost $7,155,584) | | | 11,293,957 | | |
See Notes to Schedule of Investments
8
| PRINCIPAL AMOUNT | | | | VALUEt | |
| U.S. Treasury Securities-Backed by the Full Faith and Credit of the U.S. Government (13.1%) | | | |
| $ | 725,000 | | | U.S. Treasury Notes, 1.38%, due 4/15/12 | | $ | 734,260 | | |
| | 375,000 | | | U.S. Treasury Notes, 3.88%, due 10/31/12 | | | 397,837 | | |
| | 1,135,000 | | | U.S. Treasury Notes, 2.00%, due 11/30/13 | | | 1,168,518 | | |
| | | | | Total U.S. Treasury Securities-Backed by the Full Faith and Credit of the U.S. Government
(Cost $2,294,861) | | | 2,300,615 | | |
| Mortgage-Backed Securities (7.9%) | | | |
| Adjustable Alt-B Mixed Balance (0.4%) | | | |
| | 91,836 | | | Lehman XS Trust, Floating Rate, Ser. 2005-1, Class 2A1, 1.76%, due 7/25/35 | | | 70,668 | m | |
| Adjustable Jumbo Balance (0.9%) | | | |
| | 211,429 | | | GMAC Mortgage Corp. Loan Trust, Ser. 2006-AR1, Class 1A1, 4.65%, due 4/19/36 | | | 163,681 | m | |
| Adjustable Mixed Balance (2.7%) | | | |
| | 168,054 | | | Banc of America Funding Corp., Ser. 2006-A, Class 3A2, 3.74%, due 2/20/36 | | | 99,598 | m | |
| | 204,586 | | | Credit Suisse First Boston Mortgage Securities Corp., Ser. 2004-AR4, Class 2A1,
2.89%, due 5/25/34 | | | 184,956 | m | |
| | 215,163 | | | First Horizon Mortgage Pass-Through Trust, Ser. 2005-AR5, Class 2A1, 2.76%, due 11/25/35 | | | 182,805 | m | |
| | 11,612 | | | Harborview Mortgage Loan Trust, Ser. 2004-4, Class 3A, 1.38%, due 6/19/34 | | | 9,340 | m | |
| | | | 476,699 | | |
| Commercial Mortgage-Backed (1.0%) | | | |
| | 169,257 | | | Bear Stearns Commercial Mortgage Securities, Inc., Ser. 2005-PWR8, Class AAB,
4.58%, due 6/11/41 | | | 174,949 | | |
| Non-Agency Mortgage-Backed (0.8%) | | | |
| | 95,808 | | | Countrywide Home Loans, Ser. 2005-R2, Class 2A4, 8.50%, due 6/25/35 | | | 86,874 | n | |
| | 48,136 | | | GSMPS Mortgage Loan Trust, Ser. 2005-RP3, Class 1A4, 8.50%, due 9/25/35 | | | 46,660 | n | |
| | | | 133,534 | | |
| Fannie Mae (0.6%) | | | |
| | 98,913 | | | Whole Loan, Ser. 2004-W8, Class PT, 10.94%, due 6/25/44 | | | 109,726 | m | |
| Freddie Mac (1.5%) | | | |
| | 129,079 | | | Pass-Through Certificates, 8.00%, due 11/1/26 | | | 150,746 | | |
| | 95,394 | | | Pass-Through Certificates, 8.50%, due 10/1/30 | | | 113,275 | | |
| | | | 264,021 | | |
| | | | | Total Mortgage-Backed Securities (Cost $1,582,849) | | | 1,393,278 | | |
| Corporate Debt Securities (8.5%) | | | |
| Banks (4.1%) | | | |
| | 75,000 | | | Bank of America Corp., Senior Unsecured Notes, 6.25%, due 4/15/12 | | | 79,000 | | |
| | 100,000 | | | Bear Stearns Cos. LLC, Senior Unsecured Notes, 5.35%, due 2/1/12 | | | 104,642 | | |
| | 30,000 | | | Bear Stearns Cos. LLC, Senior Unsecured Medium-Term Notes, Ser. B, 6.95%, due 8/10/12 | | | 32,730 | | |
| | 105,000 | | | Citigroup, Inc., Senior Unsecured Notes, 6.00%, due 12/13/13 | | | 114,737 | | |
| | 125,000 | | | Goldman Sachs Group, Inc., Senior Unsecured Notes, 6.60%, due 1/15/12 | | | 132,183 | | |
| | 125,000 | | | Morgan Stanley, Senior Unsecured Notes, 6.75%, due 4/15/11 | | | 127,085 | | |
| | 125,000 | | | Westpac Banking Corp., Senior Unsecured Notes, 1.85%, due 12/9/13 | | | 125,337 | | |
| | | | 715,714 | | |
See Notes to Schedule of Investments
9
| PRINCIPAL AMOUNT | | | | VALUEt | |
| Beverages (0.5%) | | | |
| $ | 75,000 | | | Anheuser-Busch Cos., Inc., Guaranteed Unsecured Notes, 4.95%, due 1/15/14 | | $ | 80,703 | | |
| Diversified Financial Services (1.6%) | | | |
| | 85,000 | | | American Express Credit Corp., Senior Unsecured Medium-Term Notes, Ser. C, 5.88%, due 5/2/13 | | | 92,441 | | |
| | 35,000 | | | Caterpillar Financial Services Corp., Unsecured Medium-Term Notes, Ser. F, 4.70%, due 3/15/12 | | | 36,547 | | |
| | 145,000 | | | General Electric Capital Corp., Senior Unsecured Global Medium-Term Notes, 5.00%, due 4/10/12 | | | 152,126 | | |
| | | | 281,114 | | |
| Food (0.2%) | | | |
| | 31,000 | | | Kraft Foods, Inc., Senior Unsecured Notes, 6.25%, due 6/1/12 | | | 33,162 | | |
| Media (1.1%) | | | |
| | 70,000 | | | Comcast Cable Communications LLC, Guaranteed Notes, 6.75%, due 1/30/11 | | | 70,288 | | |
| | 45,000 | | | NBC Universal, Inc., Senior Unsecured Notes, 2.10%, due 4/1/14 | | | 44,867 | n | |
| | 75,000 | | | Time Warner Cable, Inc., Guaranteed Notes, 5.40%, due 7/2/12 | | | 79,622 | | |
| | | | 194,777 | | |
| Office/Business Equipment (0.4%) | | | |
| | 60,000 | | | Xerox Corp., Senior Unsecured Notes, 5.50%, due 5/15/12 | | | 63,373 | | |
| Retail (0.3%) | | | |
| | 55,000 | | | Home Depot, Inc., Senior Unsecured Notes, 5.25%, due 12/16/13 | | | 60,365 | | |
| Telecommunications (0.3%) | | | |
| | 55,000 | | | Telecom Italia Capital SA, Guaranteed Notes, 5.25%, due 11/15/13 | | | 57,299 | | |
| | | | | Total Corporate Debt Securities (Cost $1,466,716) | | | 1,486,507 | | |
| Asset-Backed Securities (3.1%) | | | |
| | 100,000 | | | ACE Securities Corp. Home Equity Loan Trust, Ser. 2006-OP1, Class A2C, 0.41%, due 4/25/36 | | | 64,119 | m | |
| | 162,781 | | | ACE Securities Corp. Home Equity Loan Trust, Ser. 2006-ASP5, Class A2B, 0.39%, due 10/25/36 | | | 112,765 | m | |
| | 75,000 | | | Ally Auto Receivables Trust, Ser. 2010-4, Class A3, 0.91%, due 11/17/14 | | | 74,520 | | |
| | 200,000 | | | Carrington Mortgage Loan Trust, Ser. 2007-FRE1, Class A3, 0.52%, due 2/25/37 | | | 91,164 | m | |
| | 100,000 | | | Honda Auto Receivables Owner Trust, Ser. 2010-3, Class A3, 0.70%, due 4/21/14 | | | 99,617 | | |
| | 30,370 | | | Impac Secured Assets Corp., Ser. 2006-3, Class A4, 0.35%, due 11/25/36 | | | 28,385 | m | |
| | 107,019 | | | Residential Asset Mortgage Products, Inc., Ser. 2006-RS1, Class AI2, 0.49%, due 1/25/36 | | | 79,671 | m | |
| | | | | Total Asset-Backed Securities (Cost $766,721) | | | 550,241 | | |
| NUMBER OF SHARES | |
| Short-Term Investments (3.8%) | | | |
| | 665,612 | | | State Street Institutional Liquid Reserves Fund Institutional Class (Cost $665,612) | | | 665,612 | | |
| | | | | Total Investments (100.8%) (Cost $13,932,343) | | | 17,690,210 | ## | |
| | | | | Liabilities, less cash, receivables and other assets [(0.8%)] | | | (138,265 | ) | |
| | | | | Total Net Assets (100.0%) | | $ | 17,551,945 | | |
See Notes to Schedule of Investments
10
Notes to Schedule of Investments Balanced Portfolio
t In accordance with Accounting Standards Codification ("ASC") 820 "Fair Value Measurements and Disclosures" ("ASC 820"), all investments held by Neuberger Berman Advisers Management Trust Balanced Portfolio (the "Fund") are carried at the value that Neuberger Berman Management LLC ("Management") believes the Fund would receive upon selling an investment in an orderly transaction to an independent buyer in the principal or most advantageous market for the investment under current market conditions. Various inputs, including the volume and level of activity for the asset or liability in the market, are considered in valuing the Fund's investments, some of which are discussed below. Significant management judgment may be necessary to value investments in accordance with ASC 820.
ASC 820 established a three-tier hierarchy of inputs to create a classification of value measurements for disclosure purposes. The three-tier hierarchy of inputs is summarized in the three broad Levels listed below.
. Level 1 - quoted prices in active markets for identical investments
. Level 2 - other significant observable inputs (including quoted prices for similar investments, interest rates, prepayment speeds, credit risk, amortized cost, etc.)
. Level 3 - significant unobservable inputs (including the Fund's own assumptions in determining the fair value of investments)
The inputs or methodology used for valuing an investment are not necessarily an indication of the risk associated with investing in those securities.
The value of the Fund's investments in equity securities, for which market quotations are readily available, is generally determined by Management by obtaining valuations from an independent pricing service based on the latest sale price quoted in active markets (Level 1 inputs). Securities traded primarily on the NASDAQ Stock Market are normally valued by the Fund at the NASDAQ Official Closing Price ("NOCP") provided by NASDAQ each business day. The NOCP is the most recently reported price as of 4:00:02 p.m., Eastern time, unless that price is outside the range of the "inside" bid and asked prices (i.e., the bid and asked prices that dealers quote to each other when trading for their own accounts); in that case, NASDAQ will adjust the price to equal the inside bid or asked price, whichever is closer. Because of delays in reporting trades, the NOCP may not be based on the price of the last trade to occur before the market closes. If there is no reported sale of a security on a particular day, the independent pricing service may value the security based on reported market quotations.
The value of the Fund's investments in debt securities is determined by Management primarily by obtaining valuations from independent pricing services based on readily available bid quotations, or if quotations are not available, by methods which include various considerations based on security type (generally level 2 inputs). In addition to the consideration of yields or prices of securities of comparable quality, coupon, maturity and type; indications as to values from dealers; and general market conditions, the following is a description of other Level 2 inputs and related valuation techniques used by an independent pricing service to value certain types of debt securities of the Fund:
Corporate Debt Securities. Inputs used to value corporate debt securities generally include relative credit information, observed market movements, sector news, spread to the U.S. Treasury market, and other market information which may include benchmark yields, reported trades, broker/dealer quotes, issuer spreads, benchmark securities, bids, offers, and reference data, such as market research publications, when available ("Other Market Information").
U.S. Treasury Securities. Inputs used to value U.S. Treasury securities generally include quotes from several inter-dealer brokers and Other Market Information.
Asset-Backed Securities and Mortgage Backed Securities. Inputs used to value asset-backed securities and mortgage backed securities generally include models that consider a number of factors, which may include the following: prepayment speeds, cash flows, spread adjustments and Other Market Information.
See Notes to Financial Statements
11
Notes to Schedule of Investments Balanced Portfolio (cont'd)
High Yield Securities. Inputs used to value high yield securities generally include a number of observations of equity and credit default swap curves related to the issuer and Other Market Information.
Financial futures contracts are determined by obtaining valuations from independent pricing services at the settlement price at the market close.
Management has developed a process to periodically review information provided by independent pricing services for all types of securities.
Investments in State Street Institutional Liquid Reserves Fund Institutional Class are valued using the fund's daily calculated net asset value ("NAV").
For both debt and equity securities, if a valuation is not available from an independent pricing service, or if Management has reason to believe that the valuation received does not represent the amount the Fund might reasonably expect to receive on a current sale in an orderly transaction, the Fund seeks to obtain quotations from principal market makers (generally considered Level 3 inputs). If such quotations are not readily available, the security is valued using methods the Board of Trustees of Neuberger Berman Advisers Management Trust (the "Board") has approved on the belief that they reflect fair value. Numerous factors may be considered when determining the fair value of a security based on Level 2 or 3 inputs, including available analyst, media or other reports, trading in futures or ADRs and whether the issuer of the security being fair valued has other securities outstanding.
The value of the Fund's investments in foreign securities is generally determined using the same valuation methods and inputs as other Fund investments, as discussed above. Foreign security prices are expressed in local currency values and are translated from the local currency into U.S. dollars using the exchange rates as of 4:00 p.m., Eastern time. The Board has approved the use of Interactive Data Pricing and Reference Data, Inc. ("Interactive") to assist in determining the fair value of foreign equity securities when changes in the value of a certain index suggest that the closing prices on the foreign exchanges may no longer represent the amount that the Fund could expect to receive for those securities. In this event, Interactive will provide adjusted prices for certain foreign equity securities using a statistical analysis of historical correlations of multiple factors (Level 2 inputs). In the absence of precise information about the market values of these foreign securities as of the close of the New York Stock Exchange, the Board has determined on the basis of available data that prices adjusted in this way are likely to be closer to the prices the Fund could realize on a current sale than are the prices of those securities established at the close of the foreign markets in which the securities primarily trade. These fair value prices are necessarily estimates, and there is no assurance that such a price will be at or close to the price at which the security is next quoted or next trades.
The following is a summary, categorized by Level, of inputs used to value the Fund's investments as of December 31, 2010:
| Asset Valuation Inputs | | Level 1 | | Level 2 | | Level 3 | | Total | |
| Investments: | |
| Common Stocks^ | | $ | 11,293,957 | | | $ | -- | | | $ | -- | | | $ | 11,293,957 | | |
U.S. Treasury Securities-Backed by the Full Faith and
Credit of the U.S. Government | | | -- | | | | 2,300,615 | | | | -- | | | | 2,300,615 | | |
| Mortgage-Backed Securities^ | | | -- | | | | 1,393,278 | | | | -- | | | | 1,393,278 | | |
| Corporate Debt Securities^ | | | -- | | | | 1,486,507 | | | | -- | | | | 1,486,507 | | |
| Asset-Backed Securities | | | -- | | | | 550,241 | | | | -- | | | | 550,241 | | |
| Short-Term Investments | | | -- | | | | 665,612 | | | | -- | | | | 665,612 | | |
| Total Investments | | $ | 11,293,957 | | | $ | 6,396,253 | | | $ | -- | | | $ | 17,690,210 | | |
See Notes to Financial Statements
12
Notes to Schedule of Investments Balanced Portfolio (cont'd)
^ The Schedule of Investments provides information on the industry categorization for the portfolio.
The Fund had no significant transfers between Levels 1 and 2 during the year ended December 31, 2010.
## At December 31, 2010, the cost of investments for U.S. federal income tax purposes was $14,016,645. Gross unrealized appreciation of investments was $4,145,790, and gross unrealized depreciation of investments was $472,225, resulting in net unrealized appreciation of $3,673,565, based on cost for U.S. federal income tax purposes.
* Security did not produce income during the last twelve months.
n Restricted security subject to restrictions on resale under federal securities laws. These securities may be resold in transactions exempt from registration, normally to qualified institutional buyers under Rule 144A under the Securities Act of 1933, as amended, and have been deemed by the investment manager to be liquid. At December 31, 2010, these securities amounted to $178,401 or 1.0% of net assets.
m Floating rate securities are securities whose yields vary with a designated market index or market rate. These securities are shown at their current rates as of December 31, 2010 and their final maturity dates.
See Notes to Financial Statements
13
Statement of Assets and Liabilities
Neuberger Berman Advisers Management Trust
| | | BALANCED
PORTFOLIO | |
| | | December 31, 2010 | |
| Assets | |
| Investments in securities, at value* (Notes A & F)--see Schedule of Investments: | |
| Unaffiliated issuers | | $ | 17,690,210 | | |
| Cash | | | 1 | | |
| Foreign currency | | | 10,497 | | |
| Dividends and interest receivable | | | 39,888 | | |
| Receivable for securities sold | | | 7,901 | | |
| Receivable for Fund shares sold | | | 685 | | |
| Prepaid expenses and other assets | | | 1,748 | | |
| Total Assets | | | 17,750,930 | | |
| Liabilities | |
| Payable for securities purchased | | | 102,918 | | |
| Payable for Fund shares redeemed | | | 25,016 | | |
| Payable to investment manager (Notes A & B) | | | 8,184 | | |
| Payable to administrator--net (Note B) | | | 1,487 | | |
| Accrued expenses and other payables | | | 61,380 | | |
| Total Liabilities | | | 198,985 | | |
| Net Assets at value | | $ | 17,551,945 | | |
| Net Assets consist of: | |
| Paid-in capital | | $ | 16,607,664 | | |
| Undistributed net investment income (loss) | | | 44,371 | | |
| Accumulated net realized gains (losses) on investments | | | (2,858,767 | ) | |
| Net unrealized appreciation (depreciation) in value of investments | | | 3,758,677 | | |
| Net Assets at value | | $ | 17,551,945 | | |
| Shares Outstanding ($.001 par value; unlimited shares authorized) | | | 1,657,173 | | |
| Net Asset Value, offering and redemption price per share | | $ | 10.59 | | |
| *Cost of Investments: | | | |
| Unaffiliated issuers | | $ | 13,932,343 | | |
| Total cost of foreign currency | | $ | 9,687 | | |
See Notes to Financial Statements
14
Statement of Operations
Neuberger Berman Advisers Management Trust
| | | BALANCED
PORTFOLIO | |
| | | For the
Year Ended
December 31, 2010 | |
| Investment Income: | |
| Income (Note A): | |
| Dividend income-unaffiliated issuers | | $ | 65,294 | | |
| Interest income-unaffiliated issuers | | | 180,419 | | |
| Foreign taxes withheld | | | (241 | ) | |
| Total income | | $ | 245,472 | | |
| Expenses: | |
| Investment management fees (Notes A & B) | | | 90,781 | | |
| Administration fees (Note B) | | | 49,517 | | |
| Audit fees | | | 42,900 | | |
| Custodian fees (Note B) | | | 26,948 | | |
| Insurance expense | | | 834 | | |
| Legal fees | | | 7,618 | | |
| Registration and filing fees | | | 22,969 | | |
| Shareholder reports | | | 20,248 | | |
| Trustees' fees and expenses | | | 52,331 | | |
| Miscellaneous | | | 2,685 | | |
| Total expenses | | | 316,831 | | |
| Expenses reimbursed by Management (Note B) | | | (11,078 | ) | |
| Expenses reduced by custodian fee expense offset arrangement (Note B) | | | (5 | ) | |
| Total net expenses | | | 305,748 | | |
| Net investment income (loss) | | $ | (60,276 | ) | |
| Realized and Unrealized Gain (Loss) on Investments (Note A) | |
| Net realized gain (loss) on: | |
| Sales of investment securities of unaffiliated issuers | | | 287,173 | | |
| Financial futures contracts | | | 2,553 | | |
| Change in net unrealized appreciation (depreciation) in value of: | |
| Unaffiliated investment securities | | | 2,660,249 | | |
| Financial futures contracts | | | 1,172 | | |
| Foreign currency | | | 517 | | |
| Net gain (loss) on investments | | | 2,951,664 | | |
| Net increase (decrease) in net assets resulting from operations | | $ | 2,891,388 | | |
See Notes to Financial Statements
15
Statements of Changes in Net Assets
Neuberger Berman Advisers Management Trust
| | | BALANCED PORTFOLIO | |
| | | Year Ended
December 31,
2010 | | Year Ended
December 31,
2009 | |
| Increase (Decrease) in Net Assets: | |
| From Operations (Note A): | |
| Net investment income (loss) | | $ | (60,276 | ) | | $ | 101,237 | | |
| Net realized gain (loss) on investments | | | 289,726 | | | | (2,246,432 | ) | |
| Change in net unrealized appreciation (depreciation) of investments | | | 2,661,938 | | | | 5,290,981 | | |
| Net increase (decrease) in net assets resulting from operations | | | 2,891,388 | | | | 3,145,786 | | |
| Distributions to Shareholders From (Note A): | |
| Net investment income | | | (163,192 | ) | | | (502,617 | ) | |
| From Fund Share Transactions (Note D): | |
| Proceeds from shares sold | | | 390,902 | | | | 351,956 | | |
| Proceeds from reinvestment of dividends and distributions | | | 163,192 | | | | 502,617 | | |
| Payments for shares redeemed | | | (2,144,729 | ) | | | (2,588,215 | ) | |
| Net increase (decrease) from Fund share transactions | | | (1,590,635 | ) | | | (1,733,642 | ) | |
| Net Increase (Decrease) in Net Assets | | | 1,137,561 | | | | 909,527 | | |
| Net Assets: | |
| Beginning of year | | | 16,414,384 | | | | 15,504,857 | | |
| End of year | | $ | 17,551,945 | | | $ | 16,414,384 | | |
| Undistributed net investment income (loss) at end of year | | $ | 44,371 | | | $ | 162,225 | | |
See Notes to Financial Statements
16
Notes to Financial Statements Balanced Portfolio
Note A--Summary of Significant Accounting Policies:
1 General: The Fund is a separate operating series of Neuberger Berman Advisers Management Trust (the "Trust"), a Delaware statutory trust organized pursuant to a Trust Instrument dated May 23, 1994. The Trust is currently comprised of ten separate operating series (each individually a "Series," and collectively the "Funds") each of which is diversified. The Trust is registered as an open-end management investment company under the Investment Company Act of 1940, as amended (the "1940 Act"), and its shares are registered under the Securities Act of 1933, as amended. The Fund currently offers only Class I shares. The Board may establish additional series or classes of shares without the approval of shareholders.
The assets of each Series belong only to that Series, and the liabilities of each Series are borne solely by that Series and no other.
The preparation of financial statements in accordance with U.S. generally accepted accounting principles requires Management to make estimates and assumptions at the date of the financial statements. Actual results could differ from those estimates.
2 Portfolio valuation: Investment securities are valued as indicated in the notes following the Schedule of Investments.
3 Foreign currency translation: The accounting records of the Fund are maintained in U.S. dollars. Foreign currency amounts are translated into U.S. dollars using the exchange rates as of 4:00 p.m., Eastern time, to determine the value of investments, other assets and liabilities. Purchase and sale prices of securities, and income and expenses, are translated into U.S. dollars at the prevailing rate of exchange on the respective dates of such transactions. Net unrealized foreign currency gain (loss), if any, arises from changes in the value of assets and liabilities, other than investments in securities, as a result of changes in exchange rates and is stated separately in the Statement of Operations.
4 Securities transactions and investment income: Securities transactions are recorded on trade date for financial reporting purposes. Dividend income is recorded on the ex-dividend date or, for certain foreign dividends, as soon as the Fund becomes aware of the dividends. Non-cash dividends included in dividend income, if any, are recorded at the fair market value of the securities received. Interest income, including accretion of discount (adjusted for original issue discount, where applicable), and accretion of market discount on long-term bonds and short-term investments, if any, is recorded on the accrual basis. Realized gains and losses from securities transactions and foreign currency transactions, if any, are recorded on the basis of identified cost and stated separately in the Statement of Operations. Included in net realized gain (loss) on investments are proceeds from the settlements of class action litigation in which the Fund participated as a class member. The amount of such proceeds for the year ended December 31, 2010 was $34,364.
5 Income tax information: The Funds are treated as separate entities for U.S. federal income tax purposes. It is the policy of the Fund to continue to qualify as a regulated investment company by complying with the requirements of the U.S. Internal Revenue Code applicable to regulated investment companies and to distribute substantially all of its earnings to its shareholders. To the extent the Fund distributes substantially all of its earnings to shareholders, no federal income or excise tax provision is required.
The Fund has adopted the provisions of ASC 740 "Income Taxes" ("ASC 740"). ASC 740 sets forth a minimum threshold for financial statement recognition of a tax position taken, or expected to be taken, in a tax return. The Fund recognizes interest and penalties, if any, related to unrecognized tax positions as an income tax expense in the Statement of Operations. The Fund is subject to examination by U.S. federal and state tax authorities for returns filed for the prior three fiscal years 2007 - 2009. As of December 31, 2010, the Fund did not have any unrecognized tax positions.
17
Income distributions and capital gain distributions are determined in accordance with income tax regulations, which may differ from U.S. generally accepted accounting principles. These differences are primarily due to differing treatments of income and gains on various investment securities held by the Fund, timing differences and differing characterization of distributions made by the Fund as a whole. The Fund may also utilize earnings and profits distributed to shareholders on redemption of shares as a part of the dividends paid deduction for income tax purposes.
As determined on December 31, 2010, permanent differences resulting primarily from different book and tax accounting for paydown gains and losses, amortization of bond premium and expiration of capital loss carryforwards, were reclassified at fiscal year-end. These reclassifications had no effect on net income, NAV or NAV per share of the Fund.
The tax character of distributions paid during the years ended December 31, 2010 and December 31, 2009 was as follows:
| | | Distributions Paid From: | |
| | | Ordinary Income | | Total | |
| | | 2010 | | 2009 | | 2010 | | 2009 | |
| | | $ | 163,192 | | | $ | 502,617 | | | $ | 163,192 | | | $ | 502,617 | | |
As of December 31, 2010, the components of distributable earnings (accumulated losses) on a U.S. federal income tax basis were as follows:
Undistributed
Ordinary
Income | | Unrealized
Appreciation
(Depreciation) | | Loss
Carryforwards
and Deferrals | | Total | |
| $ | 44,371 | | | $ | 3,674,375 | | | $ | (2,774,465 | ) | | $ | 944,281 | | |
The difference between book basis and tax basis distributable earnings is attributable primarily to timing differences of wash sales, amortization of bond premium, post October loss deferrals and capital loss carryforwards.
To the extent the Fund's net realized capital gains, if any, can be offset by capital loss carryforwards, it is the policy of the Fund not to distribute such gains. Under current tax law, the use of these losses to offset future gains may be limited. As determined at December 31, 2010, the Fund had unused capital loss carryforwards available for federal income tax purposes to offset net realized capital gains, if any, as follows:
| | | Expiring in: | |
| | | 2017 | |
| | | $ | 2,723,032 | | |
During the year ended December 31, 2010, the Fund utilized capital loss carryforwards of $237,164.
The Fund had $13,496,847 of capital loss carryforwards that expired during the year ended December 31, 2010.
Under current tax law, certain net capital and net foreign currency losses realized after October 31 within the taxable year may be deferred and treated as occurring on the first day of the following tax year. For the year ended December 31, 2010, the Fund elected to defer $51,433 of net capital losses arising between November 1, 2010 and December 31, 2010.
6 Distributions to shareholders: The Fund may earn income, net of expenses, daily on its investments. Distributions from net investment income and net realized capital gains, if any, generally are distributed once a year (usually in October). Income distributions and capital gain distributions to shareholders are recorded on the ex-date.
7 Foreign taxes: Foreign taxes withheld represent amounts withheld by foreign tax authorities, net of refunds recoverable.
18
8 Expense allocation: Certain expenses are applicable to multiple funds. Expenses directly attributable to a Series are charged to that Series. Expenses of the Trust that are not directly attributable to a particular series of the Trust (e.g., the Fund) are allocated among the series of the Trust, on the basis of relative net assets, except where a more appropriate allocation of expenses to each of the series can otherwise be made fairly. Expenses borne by the complex of related investment companies, which includes open-end and closed-end investment companies for which Management serves as investment manager, that are not directly attributable to a particular investment company in the complex (e.g., the Trust) or series thereof are allocated among the investment companies in the complex or series thereof, on the basis of relative net assets, except where a more appropriate allocation of expenses to each investment company in the complex or series thereof can otherwise be made fairly.
9 Security lending: A third party, eSecLending, has assisted the Fund in conducting a bidding process to try to identify a principal that would pay a guaranteed amount to the Fund in consideration of the Fund entering into an exclusive securities lending arrangement. During the fiscal year, eSecLending served as exclusive lending agent for the Fund. As a result of a bidding process on October 1, 2009, no principal had an exclusive securities lending arrangement with the Fund during the fiscal year; as such, the Fund was not guaranteed any particular level of income during the fiscal year. As of August 27, 2010, the Fund no longer participates in a securities lending program.
Under the securities lending arrangement, the Fund received cash collateral at the beginning of each transaction equal to at least 102% of the prior day's market value of the loaned securities (105% in the case of international securities). The Fund invested all the cash collateral in Neuberger Berman Securities Lending Quality Fund, LLC ("Quality Fund"), a fund managed by Neuberger Berman Fixed Income LLC ("NBFI"), an affiliate of Management, and sub-advised by Dwight Asset Management Company LLC. Quality Fund was not a money market fund registered under the 1940 Act and did not operate in accordance with all requirements of Rule 2a-7 under the 1940 Act. The Fund redeemed all of its investments in Quality Fund, if any, as of August 27, 2010.
Net income from the lending program represents any amounts received from a principal, plus income earned on the cash collateral invested in Quality Fund or in other investments, if applicable, less cash collateral fees and other expenses associated with the loans. For the fiscal year ended December 31, 2010, the amount of net income received under the securities lending arrangement, and the amount of interest income that was earned from Quality Fund are as follows:
Net Income
Received under
the Securities
Lending
Arrangement | | Interest Income
Earned from the
Quality Fund | |
| $ | -- | | | $ | 29 | | |
10 Dollar rolls: The Fund may enter into dollar roll transactions with respect to mortgage-backed securities. In a dollar roll transaction, the Fund sells securities for delivery in the current month and simultaneously agrees to repurchase substantially similar (i.e., same type and coupon) securities on a specified future date from the same party. During the period before this repurchase, the Fund foregoes principal and interest payments on the securities. The Fund is compensated by the difference between the current sales price and the forward price for the future purchase (often referred to as the "drop"), as well as by the interest earned on the cash proceeds of the initial sale. Dollar rolls may increase fluctuations in the Fund's NAV and may be viewed as a form of leverage. There is a risk that the counterparty will be unable or unwilling to complete the transaction as scheduled, which may result in losses to the Fund.
11 Investments in foreign securities: Investing in foreign securities may involve certain sovereign and other risks, in addition to the credit and market risks normally associated with domestic securities. These additional risks include the possibility of adverse political and economic developments (including political instability, nationalization, expropriation, or confiscatory taxation) and the potentially adverse effects of unavailability of public information regarding issuers, less government supervision and regulation of financial markets, reduced liquidity of certain financial markets, and the lack of uniform accounting, auditing, and financial reporting standards or the
19
application of standards that are different or less stringent than those applied in the United States. Foreign securities also may experience greater price volatility, higher rates of inflation, and delays in settlement.
12 Derivative instruments: During the year ended December 31, 2010, the Fund's use of derivatives was limited to financial futures contracts. The Fund has adopted the provisions of ASC 815 "Derivatives and Hedging" ("ASC 815"). The disclosure requirements of ASC 815 distinguish between derivatives that qualify for hedge accounting and those that do not. Because investment companies value their derivatives at fair value and recognize changes in fair value through the Statement of Operations, they do not qualify for hedge accounting. Accordingly, even though the Fund's investments in derivatives may represent economic hedges, they are considered non-hedge transactions for purposes of this disclosure.
Financial futures contracts: At the time the Fund enters into a financial futures contract, it is required to deposit with the futures commission merchant a specified amount of cash or liquid securities, known as "initial margin," ranging upward from 1.1% of the value of the financial futures contract being traded. Each day, the futures contract is valued at the official settlement price of the board of trade or U.S. commodity exchange on which such futures contract is traded. Subsequent payments, known as "variation margin," to and from the broker are made on a daily basis as the market price of the financial futures contract fluctuates. Daily variation margin adjustments, arising from this "mark to market," are recorded by the Fund as unrealized gains or losses.
Although some financial futures contracts by their terms call for actual delivery or acceptance of financial instruments, in most cases the contracts are closed out prior to delivery by offsetting purchases or sales of matching financial futures contracts. When the contracts are closed, the Fund recognizes a gain or loss. Risks of entering into futures contracts include the possibility there may be an illiquid market, possibly at a time of rapidly declining prices, and/or a change in the value of the contract may not correlate with changes in the value of the underlying securities. Futures have minimal counterparty risk to the Fund because the exchange's clearinghouse, as counterparty to all exchange traded futures, guarantees the futures against default.
For U.S. federal income tax purposes, the futures transactions undertaken by the Fund may cause the Fund to recognize gains or losses from marking contracts to market even though its positions have not been sold or terminated, may affect the character of the gains or losses recognized as long-term or short-term, and may affect the timing of some capital gains and losses realized by the Fund. Also, the Fund's losses on transactions involving futures contracts may be deferred rather than being taken into account currently in calculating the Fund's taxable income.
During the year ended December 31, 2010, the Fund entered into financial futures contracts for economic hedging purposes, including as a maturity or duration management device. At December 31, 2010, there were no open positions in financial futures contracts.
The impact of the use of these derivative instruments on the Statement of Operations during the year ended December 31, 2010, was as follows:
Realized Gain (Loss)(1)
| | | Interest Rate
Risk | |
| Futures Contracts | | $ | 2,553 | | |
| Total Realized Gain (Loss) | | $ | 2,553 | | |
Change in Appreciation (Depreciation)(2)
| | | Interest Rate
Risk | |
| Futures Contracts | | $ | 1,172 | | |
| Total Change in Appreciation (Depreciation) | | $ | 1,172 | | |
(1) Reflected in the Statement of Operations under the caption "Net realized gain (loss) on financial futures contracts."
(2) Reflected in the Statement of Operations under the caption "Change in net unrealized appreciation (depreciation) in value of financial futures contracts."
20
13 Indemnifications: Like many other companies, the Trust's organizational documents provide that its officers and trustees are indemnified against certain liabilities arising out of the performance of their duties to the Trust. In addition, both in some of its principal service contracts and in the normal course of its business, the Trust enters into contracts that provide indemnifications to other parties for certain types of losses or liabilities. The Trust's maximum exposure under these arrangements is unknown as this could involve future claims against the Trust.
Note B--Management Fees, Administration Fees, Distribution Arrangements, and Other Transactions with Affiliates:
Fund shares are issued and redeemed in connection with investments in and payments under certain variable annuity contracts and variable life insurance policies issued through separate accounts of life insurance companies and are also offered directly to certain qualified pension and retirement plans.
The Fund retains Management as its investment manager under a Management Agreement. For such investment management services, the Fund pays Management a fee at the annual rate of 0.55% of the first $250 million of the Fund's average daily net assets, 0.525% of the next $250 million, 0.50% of the next $250 million, 0.475% of the next $250 million, 0.45% of the next $500 million, 0.425% of the next $2.5 billion, and 0.40% of average daily net assets in excess of $4 billion.
The Fund retains Management as its administrator under an Administration Agreement. The Fund pays Management an administration fee at the annual rate of 0.30% of its average daily net assets under this agreement. Additionally, Management retains State Street Bank and Trust Company ("State Street") as its sub-administrator under a Sub-Administration Agreement. Management pays State Street a fee for all services received under this agreement.
The Board adopted a non-fee distribution plan for the Fund.
Management has contractually undertaken through December 31, 2013 to forgo current payment of fees and/or reimburse the Fund for its operating expenses (excluding fees payable to Management, interest, taxes, brokerage commissions, extraordinary expenses, and transaction costs) ("Operating Expenses") which exceed, in the aggregate, 1.00% per annum of the Fund's average daily net assets (the "Expense Limitation"). For the year ended December 31, 2010, such excess expenses amounted to $11,078. The Fund has agreed to repay Management through December 31, 2016 for fees and expenses foregone and/or its excess Operating Expenses previously reimbursed by Management, so long as its annual Operating Expenses during that period do not exceed its Expense Limitation, and the repayment is made within three years after the year in which Management issued the reimbursement or waived fees. During the year ended December 31, 2010, there was no repayment to Management under its contractual expense limitation. At December 31, 2010, contingent liabilities to Management under its contractual expense limitation were as follows:
| | | Expiring in: | |
| | | 2012 | | 2013 | | Total | |
| | | $ | 27,368 | | | $ | 11,078 | | | $ | 38,446 | | |
Neuberger Berman LLC ("Neuberger") is retained by Management to furnish it with investment recommendations and research information without added cost to the Fund. Several individuals who are officers and/or trustees of the Trust are also employees of Neuberger and/or Management.
On May 4, 2009, NBSH Acquisition, LLC ("NBSH"), an entity organized by key members of senior management of Neuberger Berman Group LLC ("NBG") and its consolidated subsidiaries (NBG, and together with its consolidated subsidiaries "NB Group") acquired a majority interest in the business conducted by Management and Neuberger, as well as the fixed income and certain alternative asset management businesses of Lehman Brothers Holdings Inc.'s Investment Management Division (together with Management and Neuberger, the "Acquired Businesses") (the "Acquisition"). Prior to that date, Neuberger and the predecessor in interest of Management were indirect wholly owned subsidiaries of Lehman Brothers Holdings Inc. ("LBHI"). On September 15, 2008, LBHI filed a voluntary
21
petition under Chapter 11 of the U.S. Bankruptcy Code, and on December 22, 2008, the bankruptcy court having jurisdiction over the LBHI matter approved the sale of the Acquired Businesses to NBSH (or its successor or assign).
Through NBSH, portfolio managers, NB Group's management team, and certain of its key employees and senior professionals now indirectly own 52% of the voting equity of NBG. LBHI and certain affiliates of LBHI own the remaining 48% of NBG's voting equity. The closing of the Acquisition resulted in an "assignment" of the Fund's Management Agreement and Sub-Advisory Agreement. Such an assignment, by law, automatically terminated those agreements. Accordingly, prior to the closing, the Board, including the Trustees who are not "interested persons" of the Fund's investment manager and its affiliates or the Fund, considered and approved a new Management Agreement and Sub-Advisory Agreement for the Fund. The new agreements, which are virtually identical to those previously in effect, were also approved by a vote of the Fund's shareholders.
These events did not have a material impact on the Fund or its operations. Management and Neuberger continue to operate in the ordinary course of business as the investment manager and sub-adviser of the Fund.
Other non-affiliated service provider: The Fund has an expense offset arrangement in connection with its custodian contract. For the year ended December 31, 2010, the impact of this arrangement was a reduction of expenses of $5.
Note C--Securities Transactions:
Cost of purchases and proceeds of sales and maturities of long-term securities (excluding short-term securities and financial futures contracts) for the year ended December 31, 2010 were as follows:
Purchases of
U.S. Government
and Agency
Obligations | | Purchases excluding
U.S. Government
and Agency
Obligations | | Sales and Maturities
of U.S. Government
and Agency
Obligations | | Sales and Maturities
excluding
U.S. Government
and Agency
Obligations | |
| $ | 3,278,454 | | | $ | 5,640,816 | | | $ | 3,677,348 | | | $ | 6,176,010 | | |
During the year ended December 31, 2010, no brokerage commissions on securities transactions were paid to affiliated brokers.
Note D--Fund Share Transactions:
Share activity for the years ended December 31, 2010 and December 31, 2009 was as follows:
| | | For the Year Ended December 31, | |
| | | 2010 | | 2009 | |
| Shares Sold | | | 40,424 | | | | 42,797 | | |
| Shares Issued on Reinvestment of Dividends and Distributions | | | 16,551 | | | | 57,377 | | |
| Shares Redeemed | | | (224,488 | ) | | | (321,180 | ) | |
| Total | | | (167,513 | ) | | | (221,006 | ) | |
Note E--Line of Credit:
At December 31, 2010, the Fund was a participant in a single committed, unsecured $200,000,000 ($150,000,000 prior to September 17, 2010) line of credit with State Street, to be used only for temporary or emergency purposes. Other investment companies managed by Management also participate in this line of credit on the same terms. Interest is charged on borrowings under this line of credit at the higher of (a) the Federal Funds Rate plus 1.25% per annum or (b) the Overnight LIBOR Rate plus 1.25% per annum. A commitment fee of 0.125% (0.15% prior to
22
September 17, 2010) per annum of the available line of credit is charged, of which each participating Fund has agreed to pay its pro rata share, based on the ratio of its individual net assets to the net assets of all participants at the time the fee is due and payable. The fee is paid quarterly in arrears. Because several mutual funds participate, there is no assurance that an individual Fund will have access to all or any part of the $200,000,000 ($150,000,000 prior to September 17, 2010) at any particular time. There were no loans outstanding pursuant to this line of credit at December 31, 2010. During the year ended December 31, 2010, the Fund did not utilize this line of credit.
Note F--Investments in Affiliates:
| Name of Issuer | | Balance of
Shares
Held
December 31,
2009 | | Gross
Purchases
and
Additions | | Gross
Sales
and
Reductions | | Balance of
Shares
Held
December 31,
2010 | | Value
December 31,
2010 | | Income from
Investments in
Affiliated
Issuers
Included in
Total Income | |
Neuberger Berman Securities
Lending Quality Fund, LLC* | | | 161,031 | | | | 39,756 | | | | 200,787 | | | | -- | | | $ | -- | | | $ | 29 | | |
* Quality Fund, a fund that was managed by NBFI, an affiliate of Management, was used to invest cash the Fund received as collateral for securities loaned as approved by the Board. Because all shares of Quality Fund were held by funds in the related investment management complex, Quality Fund may have been considered an affiliate of the Fund.
23
Financial Highlights
Balanced Portfolio
The following table includes selected data for a share outstanding throughout each year and other performance information derived from the Financial Statements.
| | | Year Ended December 31, | |
| | | 2010 | | 2009 | | 2008 | | 2007 | | 2006 | |
| Net Asset Value, Beginning of Year | | $ | 9.00 | | | $ | 7.58 | | | $ | 13.08 | | | $ | 11.44 | | | $ | 10.42 | | |
| Income From Investment Operations: | |
| Net Investment Income (Loss)t | | | (.03 | ) | | | .05 | | | | .09 | | | | .12 | | | | .11 | | |
Net Gains or Losses on Securities
(both realized and unrealized) | | | 1.72 | | | | 1.65 | | | | (5.17 | ) | | | 1.67 | | | | 1.00 | | |
| Total From Investment Operations | | | 1.69 | | | | 1.70 | | | | (5.08 | ) | | | 1.79 | | | | 1.11 | | |
| Less Distributions From: | |
| Net Investment Income | | | (.10 | ) | | | (.28 | ) | | | (.42 | ) | | | (.15 | ) | | | (.09 | ) | |
| Net Asset Value, End of Year | | $ | 10.59 | | | $ | 9.00 | | | $ | 7.58 | | | $ | 13.08 | | | $ | 11.44 | | |
| Total Returntt | | | 18.83 | % | | | 22.47 | % | | | (39.15 | )% | | | 15.60 | % | | | 10.67 | % | |
| Ratios/Supplemental Data | |
| Net Assets, End of Year (in millions) | | $ | 17.6 | | | $ | 16.4 | | | $ | 15.5 | | | $ | 78.4 | | | $ | 72.3 | | |
| Ratio of Gross Expenses to Average Net Assets# | | | 1.85 | % | | | 1.86 | % | | | 1.29 | % | | | 1.16 | % | | | 1.19 | % | |
| Ratio of Net Expenses to Average Net AssetsS | | | 1.85 | % | | | 1.86 | % | | | 1.29 | % | | | 1.16 | % | | | 1.18 | % | |
Ratio of Net Investment Income (Loss) to Average
Net Assets | | | (.37 | )% | | | .66 | % | | | .81 | % | | | 1.00 | % | | | 1.01 | % | |
| Portfolio Turnover Rate | | | 58 | % | | | 85 | % | | | 57 | % | | | 54 | % | | | 62 | % | |
See Notes to Financial Highlights
24
Notes to Financial Highlights Balanced Portfolio
tt Total return based on per share NAV reflects the effects of changes in NAV on the performance of the Fund during each fiscal period and assumes income dividends and other distributions, if any, were reinvested. Results represent past performance and do not guarantee future results. Current returns may be lower or higher than the performance data quoted. Investment returns and principal may fluctuate and shares when redeemed may be worth more or less than original cost. Total return would have been lower if Management had not reimbursed and/or waived certain expenses. The total return information shown does not reflect charges and other expenses that apply to the separate account or the related insurance policies, and the inclusion of these charges and other expenses would reduce the total return for all fiscal periods shown. For the year ended December 31, 2006, Management reimbursed the Fund for losses incurred in connection with the disposition of foreign currency contracts, which had no impact on total return.
# The Fund is required to calculate an expense ratio without taking into consideration any expense reductions related to expense offset arrangements.
t Calculated based on the average number of shares outstanding during each fiscal period.
S After reimbursement and/or waiver of a portion of the investment management fee by Management. Had Management not undertaken such actions, the annualized ratios of net expenses to average net assets would have been:
| | | Year Ended December 31, | |
| 2010 | | 2009 | | 2008 | | 2007 | | 2006 | |
| | 1.92 | % | | | 2.04 | % | | | 1.29 | % | | | 1.16 | % | | | 1.18 | % | |
25
Report of Independent Registered Public Accounting Firm
To the Board of Trustees of
Neuberger Berman Advisers Management Trust and
Shareholders of Balanced Portfolio
We have audited the accompanying statement of assets and liabilities, including the schedule of investments, of Balanced Portfolio, one of the series constituting Neuberger Berman Advisers Management Trust (the "Trust"), as of December 31, 2010, and the related statement of operations for the year then ended, the statements of changes in net assets for each of the two years in the period then ended, and the financial highlights for each of the five years in the period then ended. These financial statements and financial highlights are the responsibility of the Trust's management. Our responsibility is to express an opinion on these financial statements and financial highlights based on our audits.
We conducted our audits in accordance with the standards of the Public Company Accounting Oversight Board (United States). Those standards require that we plan and perform the audit to obtain reasonable assurance about whether the financial statements and financial highlights are free of material misstatement. We were not engaged to perform an audit of the Trust's internal control over financial reporting. Our audits included consideration of internal control over financial reporting as a basis for designing audit procedures that are appropriate in the circumstances, but not for the purpose of expressing an opinion on the effectiveness of the Trust's internal control over financial reporting. Accordingly, we express no such opinion. An audit also includes examining, on a test basis, evidence supporting the amounts and disclosures in the financial statements and financial highlights, assessing the accounting principles used and significant estimates made by management, and evaluating the overall financial statement presentation. Our procedures included confirmation of securities owned as of December 31, 2010 by correspondence with the custodian and brokers or by other appropriate auditing procedures where replies from brokers were not received. We believe that our audits provide a reasonable basis for our opinion.
In our opinion, the financial statements and financial highlights referred to above present fairly, in all material respects, the financial position of Balanced Portfolio, a series of Neuberger Berman Advisers Management Trust, at December 31, 2010, the results of its operations for the year then ended, the changes in its net assets for each of the two years in the period then ended, and the financial highlights for each of the five years in the period then ended, in conformity with U.S. generally accepted accounting principles.

Boston, Massachusetts
February 10, 2011
26
Trustee and Officer Information
The following tables set forth information concerning the trustees and officers of the Trust. All persons named as trustees and officers also serve in similar capacities for other funds administered or managed by Management, Neuberger and NBFI. The Statement of Additional Information includes additional information about trustees and is available upon request, without charge, by calling (800) 877-9700.
Information about the Board of Trustees
Name, (Year of Birth),
and Address(1) | | Position and
Length of
Time Served(2) | | Principal Occupation(s)(3) | | Number of
Funds in Fund
Complex
Overseen by
Trustee | | Other Directorships
Held Outside Fund
Complex by Trustee | |
| Independent Trustees | |
|
| John Cannon (1930) | | Trustee since 2000 | | Consultant; formerly, Chairman, CDC Investment Advisers (registered investment adviser), 1993 to January 1999; formerly, President and Chief Executive Officer, AMA Investment Advisors, an affiliate of the American Medical Association. | | | 43 | | | Formerly, Independent Trustee or Director of three series of Oppenheimer Funds: Oppenheimer Limited Term New York Municipal Fund, Rochester Fund Municipals, and Oppenheimer Convertible Securities Fund, 1992 to 2009. | |
|
| Faith Colish (1935) | | Trustee since 1982 | | Counsel, Carter Ledyard & Milburn LLP (law firm) since October 2002; formerly, Attorney-at-Law and President, Faith Colish, A Professional Corporation, 1980 to 2002. | | | 43 | | | Formerly, Director, 1997 to 2003, and Advisory Director, 2003 to 2006; ABA Retirement Funds (formerly, American Bar Retirement Association) (not-for-profit membership corporation). | |
|
27
Name, (Year of Birth),
and Address(1) | | Position and
Length of
Time Served(2) | | Principal Occupation(s)(3) | | Number of
Funds in Fund
Complex
Overseen by
Trustee | | Other Directorships
Held Outside Fund
Complex by Trustee | |
| Martha C. Goss (1949) | | Trustee since 2007 | | President, Woodhill Enterprises Inc./Chase Hollow Associates LLC (personal investment vehicle), since 2006; Chief Operating and Financial Officer, Hopewell Holdings LLC/Amwell Holdings, LLC (a holding company for a healthcare reinsurance company start-up), since 2003; formerly, Consultant, Resources Connection (temporary staffing), 2002 to 2006. | | | 43 | | | Director, Ocwen Financial Corporation (mortgage servicing), since 2005; Director, American Water (water utility), since 2003; Director, Channel Reinsurance (financial guaranty reinsurance), since 2006; Director, Allianz Life of New York (insurance), since 2005; Director, Financial Women's Association of New York (not-for-profit association), since 2003; Trustee Emerita, Brown University, since 1998; formerly, Advisory Board Member, Attensity (software developer), 2005 to 2007; formerly, Director, Bank Leumi (commercial bank), 2005 to 2007; formerly, Director, Claire's Stores, Inc. (retailer), 2005 to 2007. | |
|
| C. Anne Harvey (1937) | | Trustee since 1998 | | President, C.A. Harvey Associates, since October 2001; formerly, Director, AARP, 1978 to December 2001. | | | 43 | | | Formerly, President, Board of Associates to The National Rehabilitation Hospital's Board of Directors, 2001 to 2002; formerly, Member, Individual Investors Advisory Committee to the New York Stock Exchange Board of Directors, 1998 to 2002. | |
|
28
Name, (Year of Birth),
and Address(1) | | Position and
Length of
Time Served(2) | | Principal Occupation(s)(3) | | Number of
Funds in Fund
Complex
Overseen by
Trustee | | Other Directorships
Held Outside Fund
Complex by Trustee | |
| Robert A. Kavesh (1927) | | Trustee since 2000 | | Retired; Marcus Nadler Professor Emeritus of Finance and Economics, New York University Stern School of Business; formerly, Executive Secretary-Treasurer, American Finance Association, 1961 to 1979. | | | 43 | | | Formerly, Director, The Caring Community (not-for-profit), 1997 to 2006; formerly, Director, DEL Laboratories, Inc. (cosmetics and pharmaceuticals), 1978 to 2004; formerly, Director, Apple Bank for Savings, 1979 to 1990; formerly, Director, Western Pacific Industries, Inc., (public company), 1972 to 1986. | |
|
| Michael M. Knetter (1960) | | Trustee since 2007 | | President and Chief Executive Officer, University of Wisconsin Foundation, October 2010 to Present; formerly, Dean, School of Business, University of Wisconsin - Madison; formerly, Professor of International Economics and Associate Dean, Amos Tuck School of Business - Dartmouth College, 1998 to 2002. | | | 43 | | | Director, American Family Insurance (a mutual company, not publicly traded), since March 2009; Trustee, Northwestern Mutual Series Fund, Inc., since February 2007; Director, Wausau Paper, since 2005; formerly, Director, Great Wolf Resorts, 2004 to 2009. | |
|
| Howard A. Mileaf (1937) | | Trustee since 1999 | | Retired; formerly, Vice President and General Counsel, WHX Corporation (holding company), 1993 to 2001. | | | 43 | | | Formerly, Director, Webfinancial Corporation (holding company), 2002 to 2008; formerly, Director, WHX Corporation (holding company), 2002 to 2005; formerly, Director, State Theatre of New Jersey (not-for-profit theatre), 2000 to 2005. | |
|
| George W. Morriss (1947) | | Trustee since 2007 | | Retired; formerly, Executive Vice President and Chief Financial Officer, People's Bank, Connecticut (a financial services company), 1991 to 2001. | | | 43 | | | Manager, Old Mutual Funds of Hedge Funds fund complex (consisting of six funds), since 2006 for four funds and since 2007 for two funds; formerly, Member NASDAQ Issuers' Affairs Committee, 1995 to 2003. | |
|
29
Name, (Year of Birth),
and Address(1) | | Position and
Length of
Time Served(2) | | Principal Occupation(s)(3) | | Number of
Funds in Fund
Complex
Overseen by
Trustee | | Other Directorships
Held Outside Fund
Complex by Trustee | |
| Edward I. O'Brien (1928) | | Trustee since 2000 | | Retired; formerly, Member, Investment Policy Committee, Edward Jones, 1993 to 2001; President, Securities Industry Association ("SIA") (securities industry's representative in government relations and regulatory matters at the federal and state levels), 1974 to 1992; Adviser to SIA, November 1992 to November 1993. | | | 43 | | | Formerly, Director, Legg Mason, Inc. (financial services holding company), 1993 to July 2008; formerly, Director, Boston Financial Group (real estate and tax shelters), 1993 to 1999. | |
|
| Cornelius T. Ryan (1931) | | Trustee since 2000 | | General Partner and Adviser, TD2, TD3, and TOF1 Healthcare Venture Capital Partnerships; Founding General Partner, Oxford Partners and Oxford Bioscience Partners (venture capital investing) and President, Oxford Venture Corporation, since 1981. | | | 43 | | | Trustee, Norwalk Hospital Foundation, since 2000; Director, Supply Pro (privately held company), since 2008; formerly, Trustee, Norwalk Hospital, 1995 to 2004; formerly, President and Director, Randolph Computer Corp., 1966 to 1984; formerly, Director of numerous privately held portfolio companies of Oxford Partners and Oxford Bioscience Partners, 1981 to 2005. | |
|
| Tom D. Seip (1950) | | Trustee since 2000; Chairman of the Board since 2008; Lead Independent Trustee from 2006 to 2008 | | General Partner, Seip Investments LP (a private investment partnership); formerly, President and CEO, Westaff, Inc. (temporary staffing), May 2001 to January 2002; formerly, Senior Executive, The Charles Schwab Corporation, 1983 to 1998, including Chief Executive Officer, Charles Schwab Investment Management, Inc.; Trustee, Schwab Family of Funds and Schwab Investments, 1997 to 1998; and Executive Vice President-Retail Brokerage, Charles Schwab & Co., Inc., 1994 to 1997. | | | 43 | | | Director, H&R Block, Inc. (financial services company), since May 2001; Chairman, Compensation Committee, H&R Block, Inc., since 2006; formerly, Director, Forward Management, Inc. (asset management company), 1999 to 2006. | |
|
30
Name, (Year of Birth),
and Address(1) | | Position and
Length of
Time Served(2) | | Principal Occupation(s)(3) | | Number of
Funds in Fund
Complex
Overseen by
Trustee | | Other Directorships
Held Outside Fund
Complex by Trustee | |
| Candace L. Straight (1947) | | Trustee since 1999 | | Private investor and consultant specializing in the insurance industry; formerly, Advisory Director, Securitas Capital LLC (a global private equity investment firm dedicated to making investments in the insurance sector), 1998 to December 2003. | | | 43 | | | Director, Montpelier Re Holdings Ltd. (reinsurance company), since 2006; formerly, Director, National Atlantic Holdings Corporation (property and casualty insurance company), 2004 to 2008; formerly, Director, The Proformance Insurance Company (property and casualty insurance company), 2004 to 2008; formerly, Director, Providence Washington Insurance Company (property and casualty insurance company), 1998 to 2006; formerly, Director, Summit Global Partners (insurance brokerage firm), 2000 to 2005. | |
|
| Peter P. Trapp (1944) | | Trustee since 1984 | | Retired; formerly, Regional Manager for Mid-Southern Region, Ford Motor Credit Company, September 1997 to 2007; formerly, President, Ford Life Insurance Company, April 1995 to August 1997. | | | 43 | | | None. | |
|
31
Name, (Year of Birth),
and Address(1) | | Position and
Length of
Time Served(2) | | Principal Occupation(s)(3) | | Number of
Funds in Fund
Complex
Overseen by
Trustee | | Other Directorships
Held Outside Fund
Complex by Trustee | |
| Trustees who are "Interested Persons" | |
|
| Joseph V. Amato* (1962) | | Trustee since 2009 | | President and Director, Neuberger Berman Group LLC, since 2009; President and Chief Executive Officer, Neuberger and Neuberger Berman Holdings LLC (including its predecessor, Neuberger Berman Inc.), since 2007; Chief Investment Officer, Neuberger, since 2009; Chief Investment Officer (Equities) and Managing Director, Management, since 2009; Managing Director, NBFI, since 2007; Board member of NBFI since 2006; formerly, Global Head of Asset Management of LBHI's Investment Management Division, 2006 to 2009; formerly, member of LBHI's Investment Management Division's Executive Management Committee, 2006 to 2009; formerly, Managing Director, Lehman Brothers Inc. ("LBI"), 2006 to 2008; formerly, Chief Recruiting and Development Officer, LBI, 2005 to 2006; formerly, Global Head of LBI's Equity Sales and a Member of its Equities Division Executive Committee, 2003 to 2005. | | | 43 | | | Member of Board of Advisors, McDonough School of Business, Georgetown University, since 2001; Member of New York City Board of Advisors, Teach for America, since 2005; Trustee, Montclair Kimberley Academy (private school), since 2007. | |
|
32
Name, (Year of Birth),
and Address(1) | | Position and
Length of
Time Served(2) | | Principal Occupation(s)(3) | | Number of
Funds in Fund
Complex
Overseen by
Trustee | | Other Directorships
Held Outside Fund
Complex by Trustee | |
| Robert Conti* (1956) | | Chief Executive Officer, President and Trustee since 2008; prior thereto, Executive Vice President in 2008 and Vice President, 2000 to 2008 | | Managing Director, Neuberger, since 2007; formerly, Senior Vice President, Neuberger, 2003 to 2006; formerly, Vice President, Neuberger, 1999 to 2003; President and Chief Executive Officer, Management, since 2008; formerly, Senior Vice President, Management, 2000 to 2008. | | | 43 | | | Chairman of the Board, Staten Island Mental Health Society since 2008. | |
|
| Jack L. Rivkin* (1940) | | Trustee since 2002; President, 2002 to 2008 | | Formerly, Executive Vice President and Chief Investment Officer, Neuberger Berman Holdings LLC (holding company), 2002 to August 2008 and 2003 to August 2008, respectively; formerly, Managing Director and Chief Investment Officer, Neuberger, December 2005 to August 2008 and 2003 to August 2008, respectively; formerly, Executive Vice President, Neuberger, December 2002 to 2005; formerly, Director and Chairman, Management, December 2002 to August 2008; formerly, Executive Vice President, Citigroup Investments, Inc., September 1995 to February 2002; formerly, Executive Vice President, Citigroup Inc., September 1995 to February 2002. | | | 43 | | | Director, Idealab (private company), since 2009; Director, Distributed World Power (private company), since 2009; Director, Dale Carnegie and Associates, Inc. (private company), since 1999; Director, Solbright, Inc. (private company), since 1998; Director, SA Agricultural Fund, since 2009; Chairman and Director, Essential Brands (consumer products) since 2008; formerly, Director, New York Society of Security Analysts, 2006 to 2008. | |
|
(1) The business address of each listed person is 605 Third Avenue, New York, New York 10158.
(2) Pursuant to the Trust's Trust Instrument, each of these Trustees shall hold office for life or until his or her successor is elected or the Trust terminates; except that (a) any Trustee may resign by delivering a written resignation; (b) any Trustee may be removed with or without cause at any time by a written instrument signed by at least two-thirds of the other Trustees; (c) any Trustee who requests to be retired, or who has become unable to serve, may be retired by a written instrument signed by a majority of the other Trustees; and (d) any Trustee may be removed at any shareholder meeting by a vote of at least two-thirds of the outstanding shares.
33
(3) Except as otherwise indicated, each individual has held the positions shown for at least the last five years.
* Indicates a Trustee who is an "interested person" within the meaning of the 1940 Act. Mr. Amato and Mr. Conti are interested persons of the Trust by virtue of the fact that each is an officer of Management, Neuberger and/or their affiliates. Mr. Rivkin may be deemed an interested person of the Trust by virtue of the fact that, until August 2008, he was a director of Management and an officer of Neuberger.
34
Information about the Officers of the Trust
Name, (Year of Birth),
and Address(1) | | Position and
Length of Time
Served(2) | | Principal Occupation(s)(3) | |
| Andrew B. Allard (1961) | | Anti-Money Laundering Compliance Officer since 2002 | | Senior Vice President, Neuberger, since 2006; Deputy General Counsel, Neuberger, since 2004; formerly, Vice President, Neuberger, 2000 to 2005; Anti-Money Laundering Compliance Officer, nine registered investment companies for which Management acts as investment manager and administrator (six since 2002, one since 2003, one since 2005 and one since 2006). | |
|
| Claudia A. Brandon (1956) | | Executive Vice President since 2008 and Secretary since 1985 | | Senior Vice President, Neuberger, since 2007 and Employee since 1999; Senior Vice President, Management, since 2008 and Assistant Secretary since 2004; formerly, Vice President, Neuberger, 2002 to 2006; formerly, Vice President-Mutual Fund Board Relations, Management, 2000 to 2008; Executive Vice President, nine registered investment companies for which Management acts as investment manager and administrator (nine since 2008); Secretary, nine registered investment companies for which Management acts as investment manager and administrator (three since 1985, three since 2002, one since 2003, one since 2005 and one since 2006). | |
|
| Maxine L. Gerson (1950) | | Executive Vice President since 2008 and Chief Legal Officer since 2005 (only for purposes of sections 307 and 406 of the Sarbanes-Oxley Act of 2002) | | Managing Director, Neuberger, since 2009, and Deputy General Counsel and Assistant Secretary Neuberger since 2001; Managing Director, Management, since 2009, and Secretary and General Counsel, Management, since 2004; formerly, Senior Vice President, Neuberger, 2002 to 2009; formerly, Senior Vice President, Management, 2006 to 2009; Executive Vice President, nine registered investment companies for which Management acts as investment manager and administrator (nine since 2008); Chief Legal Officer (only for purposes of sections 307 and 406 of the Sarbanes-Oxley Act of 2002), nine registered investment companies for which Management acts as investment manager and administrator (eight since 2005 and one since 2006). | |
|
| Sheila R. James (1965) | | Assistant Secretary since 2002 | | Vice President, Neuberger, since 2008 and Employee since 1999; formerly, Assistant Vice President, Neuberger, 2007; Assistant Secretary, nine registered investment companies for which Management acts as investment manager and administrator (six since 2002, one since 2003, one since 2005 and one since 2006). | |
|
| Brian Kerrane (1969) | | Vice President since 2008 | | Senior Vice President, Neuberger, since 2006; formerly, Vice President, Neuberger, 2002 to 2006; Vice President, Management, since 2008 and Employee since 1991; Vice President, nine registered investment companies for which Management acts as investment manager and administrator (nine since 2008). | |
|
| Kevin Lyons (1955) | | Assistant Secretary since 2003 | | Assistant Vice President, Neuberger, since 2008 and Employee since 1999; Assistant Secretary, nine registered investment companies for which Management acts as investment manager and administrator (seven since 2003, one since 2005 and one since 2006). | |
|
35
Name, (Year of Birth),
and Address(1)�� | | Position and
Length of Time
Served(2) | | Principal Occupation(s)(3) | |
| Owen F. McEntee, Jr. (1961) | | Vice President since 2008 | | Vice President, Neuberger, since 2006; Employee, Management, since 1992; Vice President, nine registered investment companies for which Management acts as investment manager and administrator (nine since 2008). | |
|
| John M. McGovern (1970) | | Treasurer and Principal Financial and Accounting Officer since 2005 | | Senior Vice President, Neuberger, since 2007; formerly, Vice President, Neuberger, 2004 to 2006; Employee, Management, since 1993; Treasurer and Principal Financial and Accounting Officer, nine registered investment companies for which Management acts as investment manager and administrator (eight since 2005 and one since 2006); formerly, Assistant Treasurer, eight registered investment companies for which Management acts as investment manager and administrator, 2002 to 2005. | |
|
| Andrew Provencher (1965) | | Vice President since 2008 | | Managing Director, Management, since 2008; Managing Director, Neuberger, since 2005; formerly, Senior Vice President, Neuberger, 2003 to 2005; Vice President, nine registered investment companies for which Management acts as investment manager and administrator (nine since 2008). | |
|
| Frank Rosato (1971) | | Assistant Treasurer since 2005 | | Vice President, Neuberger, since 2006; Employee, Management, since 1995; Assistant Treasurer, nine registered investment companies for which Management acts as investment manager and administrator (eight since 2005 and one since 2006). | |
|
| Neil S. Siegel (1967) | | Vice President since 2008 | | Managing Director, Management, since 2008; Managing Director, Neuberger, since 2006; formerly, Senior Vice President, Neuberger, 2004 to 2006; Vice President, nine registered investment companies for which Management acts as investment manager and administrator (nine since 2008). | |
|
| Chamaine Williams (1971) | | Chief Compliance Officer since 2005 | | Senior Vice President, Neuberger, since 2007; Chief Compliance Officer, Management, since 2006; Chief Compliance Officer, nine registered investment companies for which Management acts as investment manager and administrator (eight since 2005 and one since 2006); formerly, Senior Vice President, LBI, 2007 to 2008; formerly, Vice President, LBI, 2003 to 2006; formerly, Chief Compliance Officer, Lehman Brothers Asset Management Inc., 2003 to 2007; formerly, Chief Compliance Officer, Lehman Brothers Alternative Investment Management LLC, 2003 to 2007. | |
|
(1) The business address of each listed person is 605 Third Avenue, New York, New York 10158.
(2) Pursuant to the By-Laws of the Trust, each officer elected by the Trustees shall hold office until his or her successor shall have been elected and qualified or until his or her earlier death, inability to serve, or resignation. Officers serve at the pleasure of the Trustees and may be removed at any time with or without cause.
(3) Except as otherwise indicated, each individual has held the positions shown for at least the last five years.
36
Proxy Voting Policies and Procedures
A description of the policies and procedures that the Trust uses to determine how to vote proxies relating to portfolio securities is available, without charge, by calling 1-800-877-9700 (toll-free) and on the website of the Securities and Exchange Commission, at www.sec.gov. Information regarding how the Trust voted proxies relating to portfolio securities during the most recent 12-month period ended June 30 is also available, without charge, by calling 1-800-877-9700 (toll-free), on the website of the Securities and Exchange Commission at www.sec.gov, and on Management's website at www.nb.com.
Quarterly Portfolio Schedule
The Trust files a complete schedule of portfolio holdings for the Fund with the Securities and Exchange Commission for the first and third quarters of each fiscal year on Form N-Q. The Trust's Forms N-Q are available on the Securities and Exchange Commission's website at www.sec.gov and may be reviewed and copied at the Securities and Exchange Commission's Public Reference Room in Washington, DC. Information on the operation of the Public Reference Room may be obtained by calling 1-800-SEC-0330. The information on Form N-Q is available upon request, without charge, by calling 1-800-877-9700 (toll free).
Notice to Shareholders (Unaudited)
100.00% of the dividends distributed during the fiscal year ended December 31, 2010 qualifies for the dividends received deduction for corporate shareholders.
Board Consideration of the Management and Sub-Advisory Agreements
At a meeting held on October 14, 2010, the Board, including the Trustees who are not "interested persons" of Management (including its affiliates) or Neuberger Berman Advisers Management Trust ("Independent Fund Trustees"), approved the continuance of the Management and Sub-Advisory Agreements ("Agreements") for the Fund.
In evaluating the Agreements, the Board, including the Independent Fund Trustees, reviewed materials furnished by Management and Neuberger in response to questions submitted by counsel for the Independent Fund Trustees, and met with senior representatives of Management and Neuberger regarding their personnel and operations. The Independent Fund Trustees were advised by counsel that is experienced in 1940 Act matters and that is independent of Management and Neuberger. The Independent Fund Trustees received a memorandum from independent counsel discussing the legal standards for their consideration of the proposed continuance of the Agreements. They met with such counsel separately from representatives of Management to discuss the annual contract review. The annual contract review extends over two regular meetings of the Board to ensure that Management and Neuberger have time to respond to any questions the Independent Fund Trustees may have on their initial review of the report and that the Independent Fund Trustees have time to consider those responses. In addition, during this process, the Board held a separate meeting devoted primarily to reviewing and discussing Fund performance.
The Board considered the following factors, among others, in connection with its approval of the continuance of the Agreements: (1) the nature, extent, and quality of the services provided by Management and Neuberger; (2) the performance of the Fund compared to a relevant market index and a peer group of investment companies; (3) the costs of the services provided and profits or losses realized by Management and its affiliates from their relationship with the Fund; (4) the extent to which economies of scale might be realized as the Fund grows; and (5) whether fee levels reflect any such potential economies of scale for the benefit of investors in the Fund. In their deliberations, the Board members did not identify any particular information that was all-important or controlling, and each Trustee may have attributed different weights to the various factors.
The Board evaluated the terms of the Agreements, the overall fairness of the Agreements to the Fund and whether the Agreements were in the best interests of the Fund and its shareholders.
37
With respect to the nature, extent and quality of the services provided, the Board considered the performance of the Fund and the experience and staffing of the portfolio management and investment research personnel of Management and Neuberger who perform services for the Fund. The Board noted that Management also provides certain administrative services, including fund accounting and compliance oversight. The Board also considered Management's and Neuberger's policies and practices regarding brokerage and the quality of brokerage execution obtained by Management. The Board's Portfolio Transactions and Pricing Committee from time to time reviewed the quality of the execution services that Management and Neuberger had provided, and periodically reviews studies by an independent firm engaged to review and evaluate the quality of brokerage execution received by the Fund. The Board also reviewed whether Management and Neuberger used brokers to execute Fund transactions that provide research and other services to Management and Neuberger, and the types of benefits potentially derived from such services by Management, Neuberger, the Fund and other clients of Management and Neuberger. In addition, the Board noted the positive compliance history of Management and Neuberger, as each firm has been free of significant reported compliance problems.
The Board considered the performance of the Fund relative to its benchmark and a peer group of investment companies dedicated to insurance products pursuing broadly similar strategies. The Board also considered performance in relation to certain measures of the degree of investment risk undertaken by the portfolio managers. The Board discussed the Fund's performance with Management and discussed steps that Management had taken, or intended to take, to improve the Fund's performance. The Board also considered Management's resources and responsiveness with respect to the Fund.
With respect to the overall fairness of the Agreements, the Board considered the fee structure for the Fund under the Agreements and any fall-out benefits likely to accrue to Management or Neuberger or their affiliates from their relationship with the Fund. The Board also considered the contractual limit on Fund expenses undertaken by Management and the actual expenses reimbursed and investment management fees waived by Management. With regard to the sub-advisory fee paid to Neuberger, the Board noted that this fee is "at cost." In addition, the Board considered the profitability of Management and its affiliates from their association with the Fund and noted that Management incurred a loss on the Fund.
The Board considered whether there were other funds that were advised or sub-advised by Management or its affiliates or separate accounts managed by Management or its affiliates with similar investment objectives, policies and strategies to the Fund. The Board noted that there were no comparable advised or sub-advised funds. The Board considered the appropriateness and reasonableness of any differences between the fees charged to the Fund and the separate accounts and determined that the differences in fees were consistent with the management and other services provided.
The Board also evaluated any apparent or anticipated economies of scale in relation to the services Management provides to the Fund. The Board considered whether the Fund's fee structure provides for a reduction of payments resulting from the use of breakpoints and whether those breakpoints are set at appropriate asset levels.
The Board also considered changes in management, staffing, resources and operations accompanying the separation of the Neuberger Berman entities from the LBHI bankruptcy estate.
In concluding that the benefits accruing to Management and its affiliates by virtue of their relationship to the Fund were reasonable in comparison with the costs of providing the investment advisory services and the benefits accruing to the Fund, the Board reviewed specific data as to Management's profit or loss on the Fund for a recent period and the trend in profit or loss over recent years. The Board also carefully examined Management's cost allocation methodology. The Board recognized that Management should be entitled to earn a reasonable level of profits for services it provides to the Fund and, based on its review, concluded that Management's level of profitability was not excessive.
Conclusions
In approving the Agreements, the Board concluded that the terms of each Agreement are fair and reasonable and that approval of the Agreements is in the best interests of the Fund and its shareholders. In reaching this determination, the Board considered that Management and Neuberger could be expected to provide a high level of service to the Fund; that it retained confidence in Management's and Neuberger's capabilities to manage the Fund; that the Fund's fee structure
38
appeared to the Board to be reasonable given the nature and quality of services provided; and that the benefits accruing to Management and its affiliates by virtue of their relationship to the Fund were reasonable in comparison with the benefits accruing to the Fund.
39

Neuberger Berman
Advisers Management Trust
Growth Portfolio
I Class Shares
Annual Report
December 31, 2010
Growth Portfolio Manager's Commentary
The Neuberger Berman Advisers Management Trust (AMT) Growth Portfolio turned in solid results for full-year 2010, posting a positive return and outperforming its benchmark, the Russell Midcap(R) Growth Index.
The year started on a positive note, with many of 2009's market advances remaining in place. Markets saw the continuation of the type of low quality rally that is typical for a period following a recession. Within mid-cap stocks, however, the market's character began to change fairly soon. As early as March and April, the difference in performance between lower and higher quality stocks had declined significantly. As the higher-quality growth stocks that we tend to own came back in favor, stock selection began to make more of an impact on performance.
In late spring and early summer, the European sovereign debt crisis and other concerns caused a sharp correction, but by August, the overhang was gone. This was supported by the European Union's resolve, reduced concern about slower growth in China, and improving economic indicators. One of the most important catalysts, however, was Federal Reserve Chairman Bernanke's proposal of additional quantitative easing aimed at underpinning the recovery. This prospect cheered the markets as growth for the rest of 2010 and 2011 began to look more promising. For the full year, the Russell Midcap Growth Index had advanced by over 26%.
Corporate earnings were strong throughout 2010, and the rally was relatively broad-based, with the Consumer Discretionary, Industrials and Materials sectors benefiting the most for the year. Within the Portfolio, strong stock selection allowed us to add value in nine of 10 industry sectors, with particular strength in Information Technology (IT), Energy and Industrials.
Within IT, contributors included F5 Networks, a network optimization company, and Rovi, a digital entertainment company that is focused on improving digital media experiences. Dolby Labs, a large holding within the sector, also outperformed. Enterprise database management companies Informatica and Sybase were also additive. Informatica remains a large holding, while Sybase was purchased by SAP. Disappointments included VistaPrint, an online stationery and marketing materials publisher that underperformed as new business formation slowed. Projected weak earnings worked against our belief that the company's competitive offering would insulate it, and the position was sold. After a good first half, data center Equinix declined sharply in October and was sold as questions arose around their pricing model and demand.
Within Energy, Concho Resources was a significant contributor to our outperformance this year. An exploration and production company, Concho benefited from both increased production and higher oil prices. CARBO Ceramics, a manufacturer of proppants used in extracting oil and gas from shale, advanced on both growth in shale drilling and competitive advantages. Underperformers included Southwestern Energy and Range Resources due to a decline in natural gas prices. As a result, both were sold.
In the Industrials sector, standout performers included long-term holding Stericycle, a medical waste company. A niche business under an excellent management team, Stericycle continues to deliver steady results. Broad-based industrial companies AMETEK and Roper also performed well, enjoying an uptick in business from the improving economy.
Two Health Care holdings bear mentioning. Alexion, a biotech firm focused on rare but serious diseases, was a top contributor. Its successful pulmonary disease treatment is in clinical trials as a treatment for a rare kidney disease. Edwards Lifesciences was another standout performer. Promising clinical trial results suggest its heart valve, delivered via catheter rather than open-heart surgery, could be a breakthrough product.
Within Consumer Discretionary, the only area of the Portfolio that underperformed significantly was for-profit education. Both Strayer and DeVry were down sharply due to regulatory pressures although their fundamentals were positive for most of the year. These formerly large positions were reduced or sold as the year progressed.
Entering 2011, domestic economic growth appears stronger, with many economists raising forecasts, and emerging markets growth continues, even as China works to contain inflation. Capital spending is on an uptick, domestically and globally, driving much of the growth. In the second half of the year, we anticipate that the economy and earnings may
1
decelerate somewhat, but with fewer headwinds than in 2010. As a result, we currently are cautiously optimistic for the market. A combination of fair valuations, positive economic growth, and low interest rates and inflation is typically a formula for improving stock prices. In our opinion, unemployment is likely to remain uncomfortably high as companies accustomed to lean operations may be slow to add jobs. We also believe housing continues to be a concern, as does the European sovereign debt situation.
Within the Portfolio, at year-end we were overweighted in Information Technology, Industrials, Health Care and Energy versus the benchmark, which we believe modestly positioned the Portfolio for a better economy. We were underweighted in Financials, Materials and Consumer Discretionary due to concerns about unemployment and having already taken profits in its strength. As always, our focus is on identifying companies with strong top line growth and competitive products and services relative to peers, with the management teams, operating models, and balance sheet strength needed to execute in today's global economy.
Sincerely,

Kenneth J. Turek
Portfolio Manager
The risks involved in seeking capital appreciation from investments primarily in companies with mid-market capitalization are set forth in the prospectus and statement of additional information.
Mid-capitalization stocks are more vulnerable to financial risks and other risks than stocks of larger companies. They also trade less frequently and in lower volume than larger company stocks, so their market prices tend to be more volatile.
The composition, industries and holdings of the Portfolio are subject to change. The AMT Growth Portfolio is invested in a wide array of stocks and no single holding makes up a significant portion of the Portfolio's total assets.
2
Growth Portfolio (Unaudited)
SECTOR ALLOCATION
| (% of Total Investments) | |
| Consumer Discretionary | | | 17.6 | % | |
| Consumer Staples | | | 2.6 | | |
| Energy | | | 6.8 | | |
| Financials | | | 5.5 | | |
| Health Care | | | 13.2 | | |
| Industrials | | | 19.4 | | |
| Information Technology | | | 28.0 | | |
| Materials | | | 2.0 | | |
| Telecommunication Services | | | 4.0 | | |
| Short-Term | | | 0.9 | | |
| Total | | | 100.0 | % | |
PERFORMANCE HIGHLIGHTS1
| | |
| | Average Annual Total Return
Ended 12/31/2010 | |
| | | Inception
Date | | 1 Year | | 5 Years | | 10 Years | | Life of
Fund* | |
| Growth Portfolio Class I | | 09/10/1984 | | | 31.06 | % | | | 6.18 | % | | | 1.18 | % | | | 9.07 | % | |
Russell Midcap(R)
Growth Index2 | | | | | | | 26.38 | % | | | 4.88 | % | | | 3.12 | % | | | N/A | | |
| Russell Midcap(R) Index2 | | | | | | | 25.48 | % | | | 4.66 | % | | | 6.54 | % | | | 12.43 | % | |
Performance data quoted represent past performance, which is no guarantee of future results. The investment return and principal value of an investment will fluctuate so that an investor's shares, when redeemed, may be worth more or less than their original cost. Results are shown on a "total return" basis and include reinvestment of all income dividends and distributions.
Current performance may be higher or lower than the performance data quoted. For performance data current to the most recent month end, please visit https://www.nb.com.
* Index returns are as of the inception date 09/10/1984.
As stated in the Portfolio's most recent prospectus, the total annual operating expense ratio for fiscal year 2009 was 1.27% for Class I shares (prior to any fee waivers or expense reimbursements). Neuberger Berman Management LLC has contractually agreed to limit certain expenses of the Portfolio through 12/31/2013.
COMPARISON OF A $10,000 INVESTMENT
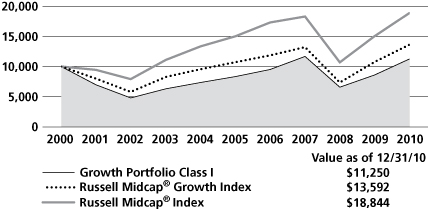
This chart shows the value of a hypothetical $10,000 investment in the Portfolio over the past 10 fiscal years, or since the Portfolio's inception, if it has not operated for 10 years. The result is compared with one or more benchmarks, which may include a broad-based market index and/or a narrower index. Please note that market indices have not been reduced to reflect any of the fees and costs of investing. All results include the reinvestment of income dividends and distributions. Neither the Portfolio's returns nor the market indices shown in the graph and table reflect the effect of taxes an investor would pay on Portfolio distributions or on the redemption of Portfolio shares. Results represent past performance and do not indicate future results.
Please see Endnotes for additional information.
3
Endnotes
1 "Total Return" includes reinvestment of all income dividends and distributions. Results represent past performance and do not indicate future results. The value of an investment in the Portfolio and the return on the investment both will fluctuate, and redemption proceeds may be higher or lower than an investor's original cost. The performance information does not reflect fees and expenses of the variable annuity and variable life insurance policies or the qualified pension and retirement plans whose proceeds are invested in the Portfolio. Neuberger Berman Management LLC ("NBM LLC") has agreed to absorb certain expenses of the AMT Portfolios, including the Portfolio. Without this arrangement, which is subject to change, the total returns of the Portfolio may have been less.
2 The Russell Midcap(R) Growth Index measures the performance of those Russell Midcap(R) Index companies with higher price-to-book ratios and higher forecasted growth values. The Russell Midcap Index measures the performance of the 800 smallest companies in the Russell 1000(R) Index, which represents approximately 27% of the total market capitalization of the Russell 1000 Index (which, in turn, consists of the 1,000 largest U.S. companies, based on market capitalization). Please note that indices do not take into account any fees and expenses of investing in the individual securities that they track and that individuals cannot invest directly in any index. Data about the performance of these indices are prepared or obtained by NBM LLC and include reinvestment of all income dividends and distributions. The Portfolio may invest in many securities not included in the above-described indices or may not invest in all securities included in the above-described indices.
Any ratios or other measurements using a factor of forecasted earnings of a company discussed herein are based on consensus estimates, not NBM LLC's own projections, and they may or may not be realized. In addition, any revision to a forecast could affect the market price of a security. By quoting them herein, NBM LLC does not offer an opinion as to the accuracy of and does not guarantee these forecasted numbers.
The investments for the Portfolio are managed by the same portfolio manager(s) who manage one or more other mutual funds that have similar names, investment objectives and investment styles as the Portfolio. You should be aware that the Portfolio is likely to differ from the other mutual funds in size, cash flow pattern and tax matters. Accordingly, the holdings and performance can be expected to vary from those of the other mutual funds.
The composition, industries and holdings of the Portfolio are subject to change.
Shares of the separate AMT Portfolios are not available to the general public. Shares of this Portfolio may be purchased only by life insurance companies to be used with their separate accounts that fund variable annuity and variable life insurance policies and by qualified pension and retirement plans.
Statistics and projections in this report are derived from sources deemed to be reliable but cannot be regarded as a representation of future results of the AMT Portfolios. This report is prepared for the general information of shareholders and is not an offer of shares of the AMT Portfolios. Shares of the AMT Portfolios are sold only through the currently effective prospectuses, which must precede or accompany this report.
The "Neuberger Berman" name and logo are registered service marks of Neuberger Berman Group LLC. "Neuberger Berman Management LLC" and the individual Fund names in this piece are either service marks or registered service marks of Neuberger Berman Management LLC.
(c) 2011 Neuberger Berman Management LLC distributor. All rights reserved.
4
Information About Your Fund's Expenses
This table is designed to provide information regarding costs related to your investments. All mutual funds incur operating expenses, which include management fees, fees for administrative services and costs of shareholder reports, among others. The following examples are based on an investment of $1,000 made at the beginning of the six month period ended December 31, 2010 and held for the entire period. The table illustrates the fund's costs in two ways:
| Actual Expenses and Performance: | | The first section of the table provides information about actual account values and actual expenses in dollars, based on the fund's actual performance during the period. You may use the information in this line, together with the amount you invested, to estimate the expenses you paid over the period. Simply divide your account value by $1,000 (for example, an $8,600 account value divided by $1,000 = 8.6), then multiply the result by the number in the first section of the table under the heading entitled "Expenses Paid During the Period" to estimate the expenses you paid over the period. | |
|
| Hypothetical Example for Comparison Purposes: | | The second section of the table provides information about hypothetical account values and hypothetical expenses based on the fund's actual expense ratio and an assumed rate of return at 5% per year before expenses. This return is not the fund's actual return. The hypothetical account values and expenses may not be used to estimate the actual ending account balance or expenses you paid for the period. You may use this information to compare the ongoing costs of investing in this fund versus other funds. To do so, compare the expenses shown in this 5% hypothetical example with the 5% hypothetical examples that appear in the shareholder reports of other funds. | |
|
Please note that the expenses in the table are meant to highlight your ongoing costs only. The table and expense example do not include any transaction costs, such as fees and expenses that are, or may be, imposed under your variable contract or qualified pension plan. Therefore, the information under the heading "Hypothetical (5% annual return before expenses)" is useful in comparing ongoing costs only, and will not help you determine the relative total costs of owning different funds. In addition, if these transaction costs were included, your costs would have been higher.
Expense Information as of 12/31/10 (Unaudited)
NEUBERGER BERMAN ADVISERS MANAGEMENT TRUST GROWTH PORTFOLIO
| Actual | | Beginning Account
Value
7/1/10 | | Ending Account
Value
12/31/10 | | Expenses Paid
During the Period*
7/1/10-12/31/10 | |
| Class I | | $ | 1,000.00 | | | $ | 1,302.30 | | | $ | 10.74 | | |
| Hypothetical (5% annual return before expenses)** | | | | | | | | | |
| Class I | | $ | 1,000.00 | | | $ | 1,015.88 | | | $ | 9.40 | | |
* Expenses are equal to the annualized expense ratio of 1.85%, multiplied by the average account value over the period, multiplied by 184/365 (to reflect the one-half year period shown).
** Hypothetical 5% annual return before expenses is calculated by multiplying the number of days in the most recent half year divided by 365.
5
Schedule of Investments Growth Portfolio
| NUMBER OF SHARES | | | | VALUEt | |
| Common Stocks (99.5%) | | | |
| Aerospace & Defense (1.3%) | | | |
| | 1,500 | | | BE Aerospace | | $ | 55,545 | * | |
| | 1,000 | | | HEICO Corp. | | | 51,030 | | |
| | | | 106,575 | | |
| Air Freight & Logistics (1.4%) | | | |
| | 1,500 | | | C.H. Robinson Worldwide | | | 120,285 | | |
| Auto Components (1.8%) | | | |
| | 1,000 | | | BorgWarner, Inc. | | | 72,360 | * | |
| | 2,650 | | | Gentex Corp. | | | 78,334 | | |
| | | | 150,694 | | |
| Biotechnology (1.4%) | | | |
| | 1,500 | | | Alexion Pharmaceuticals | | | 120,825 | * | |
| Capital Markets (2.0%) | | | |
| | 1,100 | | | Affiliated Managers Group | | | 109,142 | * | |
| | 2,400 | | | SEI Investments | | | 57,096 | | |
| | | | 166,238 | | |
| Chemicals (1.3%) | | | |
| | 2,000 | | | Nalco Holding | | | 63,880 | | |
| | 750 | | | Sigma-Aldrich | | | 49,920 | | |
| | | | 113,800 | | |
| Commercial Services & Supplies (1.9%) | | | |
| | 2,000 | | | Stericycle, Inc. | | | 161,840 | * | |
| Communications Equipment (1.8%) | | | |
| | 750 | | | F5 Networks | | | 97,620 | * | |
| | 1,500 | | | Juniper Networks | | | 55,380 | * | |
| | | | 153,000 | | |
| Computers & Peripherals (1.2%) | | | |
| | 1,900 | | | NetApp, Inc. | | | 104,424 | * | |
| Diversified Consumer Services (0.6%) | | | |
| | 1,000 | | | DeVry, Inc. | | | 47,980 | | |
| Diversified Financial Services (2.3%) | | | |
| | 750 | | | IntercontinentalExchange Inc. | | | 89,363 | * | |
| | 2,800 | | | MSCI Inc. Class A | | | 109,088 | * | |
| | | | 198,451 | | |
| NUMBER OF SHARES | | | | VALUEt | |
| Electrical Equipment (4.4%) | | | |
| | 2,700 | | | AMETEK, Inc. | | $ | 105,975 | | |
| | 1,000 | | | Polypore International | | | 40,730 | * | |
| | 1,500 | | | Roper Industries | | | 114,645 | | |
| | 3,600 | | | Sensata Technologies Holding | | | 108,396 | * | |
| | | | 369,746 | | |
Electronic Equipment, Instruments &
Components (4.6%) | | | |
| | 1,550 | | | Amphenol Corp. Class A | | | 81,809 | | |
| | 1,600 | | | Dolby Laboratories Class A | | | 106,720 | * | |
| | 2,400 | | | National Instruments | | | 90,336 | | |
| | 2,800 | | | Trimble Navigation | | | 111,804 | * | |
| | | | 390,669 | | |
| Energy Equipment & Services (3.9%) | | | |
| | 1,250 | | | Cameron International | | | 63,412 | * | |
| | 1,100 | | | CARBO Ceramics | | | 113,894 | | |
| | 1,200 | | | Core Laboratories N.V. | | | 106,860 | | |
| | 750 | | | Oil States International | | | 48,068 | * | |
| | | | 332,234 | | |
| Food & Staples Retailing (0.6%) | | | |
| | 300 | | | Fresh Market | | | 12,360 | * | |
| | 700 | | | Whole Foods Market | | | 35,413 | * | |
| | | | 47,773 | | |
| Food Products (1.1%) | | | |
| | 1,500 | | | Mead Johnson Nutrition | | | 93,375 | | |
| Health Care Equipment & Supplies (4.2%) | | | |
| | 1,250 | | | Edwards Lifesciences | | | 101,050 | * | |
| | 200 | | | Intuitive Surgical | | | 51,550 | * | |
| | 2,900 | | | NxStage Medical | | | 72,152 | * | |
| | 1,600 | | | ResMed Inc. | | | 55,424 | * | |
| | 2,900 | | | Volcano Corp. | | | 79,199 | * | |
| | | | 359,375 | | |
| Health Care Providers & Services (2.5%) | | | |
| | 2,000 | | | Express Scripts | | | 108,100 | * | |
| | 1,650 | | | HMS Holdings | | | 106,871 | * | |
| | | | 214,971 | | |
| Health Care Technology (1.8%) | | | |
| | 1,000 | | | Cerner Corp. | | | 94,740 | * | |
| | 800 | | | Quality Systems | | | 55,856 | | |
| | | | 150,596 | | |
| Hotels, Restaurants & Leisure (2.1%) | | | |
| | 1,500 | | | Hyatt Hotels Class A | | | 68,640 | * | |
| | 2,400 | | | WMS Industries | | | 108,576 | * | |
| | | | 177,216 | | |
See Notes to Schedule of Investments
6
| NUMBER OF SHARES | | | | VALUEt | |
| Household Products (1.0%) | | | |
| | 1,200 | | | Church & Dwight | | $ | 82,824 | | |
| Internet Software & Services (1.0%) | | | |
| | 1,500 | | | GSI Commerce | | | 34,800 | * | |
| | 1,500 | | | Rackspace Hosting | | | 47,115 | * | |
| | | | 81,915 | | |
| IT Services (3.0%) | | | |
| | 1,900 | | | Cognizant Technology Solutions
Class A | | | 139,251 | * | |
| | 2,900 | | | Sapient Corp. | | | 35,090 | | |
| | 2,000 | | | VeriFone Systems | | | 77,120 | * | |
| | | | 251,461 | | |
| Leisure Equipment & Products (0.8%) | | | |
| | 1,500 | | | Hasbro, Inc. | | | 70,770 | | |
| Life Science Tools & Services (0.6%) | | | |
| | 750 | | | Illumina, Inc. | | | 47,505 | * | |
| Machinery (4.9%) | | | |
| | 950 | | | Cummins Inc. | | | 104,509 | | |
| | 2,500 | | | Danaher Corp. | | | 117,925 | | |
| | 800 | | | Donaldson Co. | | | 46,624 | | |
| | 600 | | | Flowserve Corp. | | | 71,532 | | |
| | 1,550 | | | Pall Corp. | | | 76,849 | | |
| | | | 417,439 | | |
| Media (2.3%) | | | |
| | 1,750 | | | Discovery Communications
Class A | | | 72,975 | * | |
| | 1,750 | | | Focus Media Holding ADR | | | 38,378 | * | |
| | 1,600 | | | Scripps Networks Interactive
Class A | | | 82,800 | | |
| | | | 194,153 | | |
| Metals & Mining (0.7%) | | | |
| | 700 | | | Cliffs Natural Resources | | | 54,607 | | |
| Multiline Retail (2.4%) | | | |
| | 2,100 | | | Dollar Tree | | | 117,768 | * | |
| | 2,100 | | | Nordstrom, Inc. | | | 88,998 | | |
| | | | 206,766 | | |
| Oil, Gas & Consumable Fuels (2.9%) | | | |
| | 1,750 | | | Concho Resources | | | 153,422 | * | |
| | 800 | | | Whiting Petroleum | | | 93,752 | * | |
| | | | 247,174 | | |
| NUMBER OF SHARES | | | | VALUEt | |
| Pharmaceuticals (2.7%) | | | |
| | 1,250 | | | Perrigo Co. | | $ | 79,162 | | |
| | 2,000 | | | Salix Pharmaceuticals | | | 93,920 | * | |
| | 1,150 | | | Watson Pharmaceuticals | | | 59,398 | * | |
| | | | 232,480 | | |
| Professional Services (1.6%) | | | |
| | 750 | | | Manpower Inc. | | | 47,070 | | |
| | 2,600 | | | Verisk Analytics Class A | | | 88,608 | * | |
| | | | 135,678 | | |
Real Estate Management &
Development (1.2%) | | | |
| | 1,200 | | | Jones Lang LaSalle | | | 100,704 | | |
| Road & Rail (1.1%) | | | |
| | 2,300 | | | J.B. Hunt Transport Services | | | 93,863 | | |
Semiconductors & Semiconductor
Equipment (5.4%) | | | |
| | 2,400 | | | Analog Devices | | | 90,408 | | |
| | 3,800 | | | Avago Technologies | | | 108,186 | | |
| | 3,900 | | | Marvell Technology Group | | | 72,345 | * | |
| | 2,800 | | | Microchip Technology | | | 95,788 | | |
| | 2,400 | | | Varian Semiconductor Equipment
Associates | | | 88,728 | * | |
| | | | 455,455 | | |
| Software (11.2%) | | | |
| | 1,250 | | | Adobe Systems | | | 38,475 | * | |
| | 2,200 | | | ANSYS, Inc. | | | 114,554 | * | |
| | 1,750 | | | Check Point Software
Technologies | | | 80,955 | * | |
| | 1,500 | | | Citrix Systems | | | 102,615 | * | |
| | 2,900 | | | Informatica Corp. | | | 127,687 | * | |
| | 1,650 | | | MICROS Systems | | | 72,369 | * | |
| | 2,000 | | | QLIK Technologies | | | 51,620 | * | |
| | 1,000 | | | RealD Inc. | | | 25,920 | * | |
| | 500 | | | Red Hat | | | 22,825 | * | |
| | 2,650 | | | Rovi Corp. | | | 164,326 | * | |
| | 600 | | | Salesforce.com, Inc. | | | 79,200 | * | |
| | 1,250 | | | Solera Holdings | | | 64,150 | | |
| | | | 944,696 | | |
| Specialty Retail (5.8%) | | | |
| | 1,700 | | | Bed Bath & Beyond | | | 83,555 | * | |
| | 1,100 | | | Dick's Sporting Goods | | | 41,250 | * | |
| | 1,250 | | | Jo-Ann Stores | | | 75,275 | * | |
| | 700 | | | O'Reilly Automotive | | | 42,294 | * | |
| | 1,500 | | | Ross Stores | | | 94,875 | | |
| | 2,400 | | | Urban Outfitters | | | 85,944 | * | |
| | 2,000 | | | Williams-Sonoma | | | 71,380 | | |
| | | | 494,573 | | |
See Notes to Schedule of Investments
7
| NUMBER OF SHARES | | | | VALUEt | |
| Textiles, Apparel & Luxury Goods (1.8%) | | | |
| | 1,550 | | | Coach, Inc. | | $ | 85,731 | | |
| | 1,100 | | | Phillips-Van Heusen | | | 69,311 | | |
| | | | 155,042 | | |
| Trading Companies & Distributors (2.9%) | | | |
| | 2,200 | | | Fastenal Co. | | | 131,802 | | |
| | 650 | | | MSC Industrial Direct Class A | | | 42,048 | | |
| | 500 | | | W.W. Grainger | | | 69,055 | | |
| | | | 242,905 | | |
| Wireless Telecommunication Services (4.0%) | | | |
| | 1,650 | | | American Tower Class A | | | 85,206 | * | |
| | 2,400 | | | NII Holdings | | | 107,184 | * | |
| | 3,650 | | | SBA Communications Class A | | | 149,431 | * | |
| | | | 341,821 | | |
| | | | | Total Common Stocks
(Cost $5,138,569) | | | 8,431,898 | | |
| Short-Term Investments (1.0%) | | | |
| | | | | State Street Institutional
Liquid Reserves Fund
Institutional Class
(Cost $79,688) | | | 79,688 | | |
| | | | | Total Investments (100.5%)
(Cost $5,218,257) | | | 8,511,586 | ## | |
| | | | | Liabilities, less cash, receivables and
other assets [(0.5%)] | | | (39,859 | ) | |
| | | | | Total Net Assets (100.0%) | | $ | 8,471,727 | | |
See Notes to Schedule of Investments
8
Notes to Schedule of Investments Growth Portfolio
t In accordance with Accounting Standards Codification ("ASC") 820 "Fair Value Measurements and Disclosures" ("ASC 820"), all investments held by Neuberger Berman Advisers Management Trust Growth Portfolio (the "Fund") are carried at the value that Neuberger Berman Management LLC ("Management") believes the Fund would receive upon selling an investment in an orderly transaction to an independent buyer in the principal or most advantageous market for the investment under current market conditions. Various inputs, including the volume and level of activity for the asset or liability in the market, are considered in valuing the Fund's investments, some of which are discussed below. Significant management judgment may be necessary to value investments in accordance with ASC 820.
ASC 820 established a three-tier hierarchy of inputs to create a classification of value measurements for disclosure purposes. The three-tier hierarchy of inputs is summarized in the three broad Levels listed below.
. Level 1 - quoted prices in active markets for identical investments
. Level 2 - other significant observable inputs (including quoted prices for similar investments, interest rates, prepayment speeds, credit risk, amortized cost, etc.)
. Level 3 - significant unobservable inputs (including the Fund's own assumptions in determining the fair value of investments)
The inputs or methodology used for valuing an investment are not necessarily an indication of the risk associated with investing in those securities.
The value of the Fund's investments in equity securities, for which market quotations are readily available, is generally determined by Management by obtaining valuations from an independent pricing service based on the latest sale price quoted in active markets (Level 1 inputs). Securities traded primarily on the NASDAQ Stock Market are normally valued by the Fund at the NASDAQ Official Closing Price ("NOCP") provided by NASDAQ each business day. The NOCP is the most recently reported price as of 4:00:02 p.m., Eastern time, unless that price is outside the range of the "inside" bid and asked prices (i.e., the bid and asked prices that dealers quote to each other when trading for their own accounts); in that case, NASDAQ will adjust the price to equal the inside bid or asked price, whichever is closer. Because of delays in reporting trades, the NOCP may not be based on the price of the last trade to occur before the market closes. If there is no reported sale of a security on a particular day, the independent pricing service may value the security based on reported market quotations.
Management has developed a process to periodically review information provided by independent pricing services for all types of securities.
Investments in State Street Institutional Liquid Reserves Fund Institutional Class are valued using the fund's daily calculated net asset value ("NAV").
For equity securities, if a valuation is not available from an independent pricing service, or if Management has reason to believe that the valuation received does not represent the amount the Fund might reasonably expect to receive on a current sale in an orderly transaction, the Fund seeks to obtain quotations from principal market makers (generally considered Level 3 inputs). If such quotations are not readily available, the security is valued using methods the Board of Trustees of Neuberger Berman Advisers Management Trust (the "Board") has approved on the belief that they reflect fair value. Numerous factors may be considered when determining the fair value of a security based on Level 2 or 3 inputs, including available analyst, media or other reports, trading in futures or ADRs and whether the issuer of the security being fair valued has other securities outstanding.
The value of the Fund's investments in foreign securities is generally determined using the same valuation methods and inputs as other Fund investments, as discussed above. Foreign security prices are expressed in local currency values and are translated from the local currency into U.S. dollars using the exchange rates as of 4:00 p.m., Eastern time. The Board has approved the use of Interactive Data Pricing and Reference Data, Inc. ("Interactive") to assist in determining the fair value of foreign equity securities when changes in the value of a certain index suggest that the closing prices on the foreign exchanges may no longer represent the amount that the Fund could expect to
See Notes to Financial Statements
9
Notes to Schedule of Investments Growth Portfolio (cont'd)
receive for those securities. In this event, Interactive will provide adjusted prices for certain foreign equity securities using a statistical analysis of historical correlations of multiple factors (Level 2 inputs). In the absence of precise information about the market values of these foreign securities as of the close of the New York Stock Exchange, the Board has determined on the basis of available data that prices adjusted in this way are likely to be closer to the prices the Fund could realize on a current sale than are the prices of those securities established at the close of the foreign markets in which the securities primarily trade. These fair value prices are necessarily estimates, and there is no assurance that such a price will be at or close to the price at which the security is next quoted or next trades.
The following is a summary, categorized by Level, of inputs used to value the Fund's investments as of December 31, 2010:
| Asset Valuation Inputs | | Level 1 | | Level 2 | | Level 3 | | Total | |
| Investments: | |
| Common Stocks^ | | $ | 8,431,898 | | | $ | -- | | | $ | -- | | | $ | 8,431,898 | | |
| Short-Term Investments | | | -- | | | | 79,688 | | | | -- | | | | 79,688 | | |
| Total Investments | | $ | 8,431,898 | | | $ | 79,688 | | | $ | -- | | | $ | 8,511,586 | | |
^ The Schedule of Investments provides information on the industry categorization for the portfolio.
The Fund had no significant transfers between Levels 1 and 2 during the year ended December 31, 2010.
## At December 31, 2010, the cost of investments for U.S. federal income tax purposes was $5,223,657. Gross unrealized appreciation of investments was $3,295,989 and gross unrealized depreciation of investments was $8,060, resulting in net unrealized appreciation of $3,287,929, based on cost for U.S. federal income tax purposes.
* Security did not produce income during the last twelve months.
See Notes to Financial Statements
10
Statement of Assets and Liabilities
Neuberger Berman Advisers Management Trust
| | | GROWTH
PORTFOLIO | |
| | | December 31, 2010 | |
| Assets | |
| Investments in securities, at value* (Note A)--see Schedule of Investments: | |
| Unaffiliated issuers | | $ | 8,511,586 | | |
| Cash | | | 1 | | |
| Dividends and interest receivable | | | 1,703 | | |
| Receivable for Fund shares sold | | | 9,248 | | |
| Receivable from Management--net (Note B) | | | 2,484 | | |
| Prepaid expenses and other assets | | | 4,551 | | |
| Total Assets | | | 8,529,573 | | |
| Liabilities | |
| Payable for Fund shares redeemed | | | 5,718 | | |
| Payable to investment manager (Notes A & B) | | | 3,906 | | |
| Accrued expenses and other payables | | | 48,222 | | |
| Total Liabilities | | | 57,846 | | |
| Net Assets at value | | $ | 8,471,727 | | |
| Net Assets consist of: | |
| Paid-in capital | | $ | 16,508,973 | | |
| Accumulated net realized gains (losses) on investments | | | (11,330,575 | ) | |
| Net unrealized appreciation (depreciation) in value of investments | | | 3,293,329 | | |
| Net Assets at value | | $ | 8,471,727 | | |
| Shares Outstanding ($.001 par value; unlimited shares authorized) | | | 455,153 | | |
| Net Asset Value, offering and redemption price per share | | $ | 18.61 | | |
| *Cost of Investments: | | | |
| Unaffiliated issuers | | $ | 5,218,257 | | |
See Notes to Financial Statements
11
Statement of Operations
Neuberger Berman Advisers Management Trust
| | | GROWTH
PORTFOLIO | |
| | | For the
Year Ended
December 31, 2010 | |
| Investment Income: | |
| Income (Note A): | |
| Dividend income--unaffiliated issuers | | $ | 38,875 | | |
| Interest income--unaffiliated issuers | | | 91 | | |
| Foreign taxes withheld | | | (166 | ) | |
| Total income | | $ | 38,800 | | |
| Expenses: | |
| Investment management fees (Notes A & B) | | | 41,019 | | |
| Administration fees (Note B) | | | 22,374 | | |
| Audit fees | | | 40,900 | | |
| Custodian fees (Note B) | | | 13,487 | | |
| Insurance expense | | | 2,431 | | |
| Legal fees | | | 3,376 | | |
| Shareholder reports | | | 19,556 | | |
| Trustees' fees and expenses | | | 52,324 | | |
| Miscellaneous | | | 1,187 | | |
| Total expenses | | | 196,654 | | |
| Expenses reimbursed by Management (Note B) | | | (58,438 | ) | |
| Total net expenses | | | 138,216 | | |
| Net investment income (loss) | | $ | (99,416 | ) | |
| Realized and Unrealized Gain (Loss) on Investments (Note A) | |
| Net realized gain (loss) on: | |
| Sales of investment securities of unaffiliated issuers | | | 1,089,306 | | |
| Change in net unrealized appreciation (depreciation) in value of: | |
| Unaffiliated investment securities | | | 1,080,252 | | |
| Net gain (loss) on investments | | | 2,169,558 | | |
| Net increase (decrease) in net assets resulting from operations | | $ | 2,070,142 | | |
See Notes to Financial Statements
12
Statements of Changes in Net Assets
Neuberger Berman Advisers Management Trust
| | | GROWTH PORTFOLIO | |
| | | Year Ended
December 31,
2010 | | Year Ended
December 31,
2009 | |
| Increase (Decrease) in Net Assets: | |
| From Operations (Note A): | |
| Net investment income (loss) | | $ | (99,416 | ) | | $ | (252,100 | ) | |
| Net realized gain (loss) on investments | | | 1,089,306 | | | | 2,936,944 | | |
| Change in net unrealized appreciation (depreciation) of investments | | | 1,080,252 | | | | 8,606,753 | | |
| Net increase (decrease) in net assets resulting from operations | | | 2,070,142 | | | | 11,291,597 | | |
| From Fund Share Transactions (Note D): | |
| Proceeds from shares sold | | | 426,297 | | | | 654,776 | | |
| Payments for shares redeemed | | | (1,481,815 | ) | | | (86,519,376 | ) | |
| Net increase (decrease) from Fund share transactions | | | (1,055,518 | ) | | | (85,864,600 | ) | |
| Net Increase (Decrease) in Net Assets | | | 1,014,624 | | | | (74,573,003 | ) | |
| Net Assets: | |
| Beginning of year | | | 7,457,103 | | | | 82,030,106 | | |
| End of year | | $ | 8,471,727 | | | $ | 7,457,103 | | |
| Undistributed net investment income (loss) at end of year | | $ | -- | | | $ | -- | | |
See Notes to Financial Statements
13
Notes to Financial Statements Growth Portfolio
Note A--Summary of Significant Accounting Policies:
1 General: The Fund is a separate operating series of Neuberger Berman Advisers Management Trust (the "Trust"), a Delaware statutory trust organized pursuant to a Trust Instrument dated May 23, 1994. The Trust is currently comprised of ten separate operating series (each individually a "Series," and collectively the "Funds") each of which is diversified. The Trust is registered as an open-end management investment company under the Investment Company Act of 1940, as amended (the "1940 Act"), and its shares are registered under the Securities Act of 1933, as amended. The Fund currently offers only Class I shares. The Board may establish additional series or classes of shares without the approval of shareholders.
The assets of each Series belong only to that Series, and the liabilities of each Series are borne solely by that Series and no other.
The preparation of financial statements in accordance with U.S. generally accepted accounting principles requires Management to make estimates and assumptions at the date of the financial statements. Actual results could differ from those estimates.
2 Portfolio valuation: Investment securities are valued as indicated in the notes following the Schedule of Investments.
3 Foreign currency translation: The accounting records of the Fund are maintained in U.S. dollars. Foreign currency amounts are translated daily into U.S. dollars using the exchange rates as of 4:00 p.m., Eastern time, to determine the value of investments, other assets and liabilities. Purchase and sale prices of securities, and income and expenses, are translated into U.S. dollars at the prevailing rate of exchange on the respective dates of such transactions. Net unrealized foreign currency gain (loss), if any, arises from changes in the value of assets and liabilities, other than investments in securities, as a result of changes in exchange rates and is stated separately in the Statement of Operations.
4 Securities transactions and investment income: Securities transactions are recorded on trade date for financial reporting purposes. Dividend income is recorded on the ex-dividend date or, for certain foreign dividends, as soon as the Fund becomes aware of the dividends. Non-cash dividends included in dividend income, if any, are recorded at the fair market value of the securities received. Interest income, including accretion of original issue discount, where applicable, and accretion of discount on short-term investments, if any, is recorded on the accrual basis. Realized gains and losses from securities transactions and foreign currency transactions, if any, are recorded on the basis of identified cost and stated separately in the Statement of Operations. Included in net realized gain (loss) on investments are proceeds from the settlements of class action litigation in which the Fund participated as a class member. The amount of such proceeds for the year ended December 31, 2010 was $182,951.
5 Income tax information: The Funds are treated as separate entities for U.S. federal income tax purposes. It is the policy of the Fund to continue to qualify as a regulated investment company by complying with the requirements of the U.S. Internal Revenue Code applicable to regulated investment companies and to distribute substantially all of its earnings to its shareholders. To the extent the Fund distributes substantially all of its earnings to shareholders, no federal income or excise tax provision is required.
The Fund has adopted the provisions of ASC 740 "Income Taxes" ("ASC 740"). ASC 740 sets forth a minimum threshold for financial statement recognition of a tax position taken, or expected to be taken, in a tax return. The Fund recognizes interest and penalties, if any, related to unrecognized tax positions as an income tax expense in the Statement of Operations. The Fund is subject to examination by U.S. federal and state tax authorities for returns filed for the prior three fiscal years 2007 - 2009. As of December 31, 2010, the Fund did not have any unrecognized tax positions.
Income distributions and capital gain distributions are determined in accordance with income tax regulations, which may differ from U.S. generally accepted accounting principles. These differences are primarily due to
14
differing treatments of income and gains on various investment securities held by the Fund, timing differences and differing characterization of distributions made by the Fund as a whole. The Fund may also utilize earnings and profits distributed to shareholders on redemption of shares as a part of the dividends paid deduction for income tax purposes.
As determined on December 31, 2010, permanent differences resulting primarily from different book and tax accounting for net operating losses and expiration of capital loss carryforwards were reclassified at fiscal year-end. These reclassifications had no effect on net income, NAV or NAV per share of the Fund.
As of December 31, 2010, the components of distributable earnings (accumulated losses) on a U.S. federal income tax basis were as follows:
Undistributed
Ordinary
Income (Loss) | | Unrealized
Appreciation
(Depreciation) | | Loss
Carryforwards
and Deferrals | | Total | |
| $ | -- | | | $ | 3,287,929 | | | $ | (11,325,175 | ) | | $ | (8,037,246 | ) | |
The differences between book basis and tax basis distributable earnings are attributable primarily to timing differences of wash sales and capital loss carryforwards.
To the extent the Fund's net realized capital gains, if any, can be offset by capital loss carryforwards, it is the policy of the Fund not to distribute such gains. Under current tax law, the use of these losses to offset future gains may be limited. As determined at December 31, 2010, the Fund had unused capital loss carryforwards available for federal income tax purposes to offset net realized capital gains, if any, as follows:
| | | Expiring in: | |
| | | 2017 | |
| | | $ | 11,325,175 | | |
During the year ended December 31, 2010, the Fund utilized capital loss carryforwards of $1,078,091.
The Fund had $69,041,706 of capital loss carryforwards that expired during the year ended December 31, 2010.
6 Distributions to shareholders: The Fund may earn income, net of expenses, daily on its investments. Distributions from net investment income and net realized capital gains, if any, generally are distributed once a year (usually in October). Income distributions and capital gain distributions to shareholders are recorded on the ex-date.
7 Foreign taxes: Foreign taxes withheld represent amounts withheld by foreign tax authorities, net of refunds recoverable.
8 Expense allocation: Certain expenses are applicable to multiple funds. Expenses directly attributable to a Series are charged to that Series. Expenses of the Trust that are not directly attributable to a particular series of the Trust (e.g., the Fund) are allocated among the series of the Trust, on the basis of relative net assets, except where a more appropriate allocation of expenses to each of the series can otherwise be made fairly. Expenses borne by the complex of related investment companies, which includes open-end and closed-end investment companies for which Management serves as investment manager, that are not directly attributable to a particular investment company in the complex (e.g., the Trust) or series thereof are allocated among the investment companies in the complex or series thereof, on the basis of relative net assets, except where a more appropriate allocation of expenses to each investment company in the complex or series thereof can otherwise be made fairly.
9 Security lending: A third party, eSecLending, has assisted the Fund in conducting a bidding process to try to identify a principal that would pay a guaranteed amount to the Fund in consideration of the Fund entering into an exclusive securities lending arrangement. During the fiscal year, eSecLending served as exclusive lending agent for the Fund. As a result of a bidding process on October 1, 2009, no principal had an exclusive securities lending arrangement with the Fund during the fiscal year; as such, the Fund was not guaranteed any particular level of
15
income during the fiscal year. As of August 27, 2010, the Fund no longer participates in a securities lending program.
Under the securities lending arrangement, the Fund received cash collateral at the beginning of each transaction equal to at least 102% of the prior day's market value of the loaned securities (105% in the case of international securities). The Fund invested all the cash collateral in Neuberger Berman Securities Lending Quality Fund, LLC ("Quality Fund"), a fund managed by Neuberger Berman Fixed Income LLC ("NBFI"), an affiliate of Management, and sub-advised by Dwight Asset Management Company LLC. Quality Fund was not a money market fund registered under the 1940 Act and did not operate in accordance with all requirements of Rule 2a-7 under the 1940 Act. The Fund redeemed all of its investments in Quality Fund, if any, as of August 27, 2010.
Net income from the lending program represents any amounts received from a principal, plus income earned on the cash collateral invested in Quality Fund or in other investments, if applicable, less cash collateral fees and other expenses associated with the loans. For the fiscal year ended December 31, 2010, the Fund did not receive net income under the securities lending arrangement.
10 Investments in foreign securities: Investing in foreign securities may involve certain sovereign and other risks, in addition to the credit and market risks normally associated with domestic securities. These additional risks include the possibility of adverse political and economic developments (including political instability, nationalization, expropriation, or confiscatory taxation) and the potentially adverse effects of unavailability of public information regarding issuers, less government supervision and regulation of financial markets, reduced liquidity of certain financial markets, and the lack of uniform accounting, auditing, and financial reporting standards or the application of standards that are different or less stringent than those applied in the United States. Foreign securities also may experience greater price volatility, higher rates of inflation, and delays in settlement.
11 Indemnifications: Like many other companies, the Trust's organizational documents provide that its officers and trustees are indemnified against certain liabilities arising out of the performance of their duties to the Trust. In addition, both in some of its principal service contracts and in the normal course of its business, the Trust enters into contracts that provide indemnifications to other parties for certain types of losses or liabilities. The Trust's maximum exposure under these arrangements is unknown as this could involve future claims against the Trust.
Note B--Management Fees, Administration Fees, Distribution Arrangements, and Other Transactions with Affiliates:
Fund shares are issued and redeemed in connection with investments in and payments under certain variable annuity contracts and variable life insurance policies issued through separate accounts of life insurance companies and are also offered directly to certain qualified pension and retirement plans.
The Fund retains Management as its investment manager under a Management Agreement. For such investment management services, the Fund pays Management a fee at the annual rate of 0.55% of the first $250 million of the Fund's average daily net assets, 0.525% of the next $250 million, 0.50% of the next $250 million, 0.475% of the next $250 million, 0.45% of the next $500 million, 0.425% of the next $2.5 billion, and 0.40% of average daily net assets in excess of $4 billion.
The Fund retains Management as its administrator under an Administration Agreement. The Fund pays Management an administration fee at the annual rate of 0.30% of its average daily net assets under this agreement. Additionally, Management retains State Street Bank and Trust Company ("State Street") as its sub-administrator under a Sub-Administration Agreement. Management pays State Street a fee for all services received under this agreement.
The Board adopted a non-fee distribution plan for the Fund.
Management has contractually undertaken through December 31, 2013 to forgo current payment of fees and/or reimburse the Fund for its operating expenses (excluding fees payable to Management, interest, taxes, brokerage
16
commissions, extraordinary expenses, and transaction costs) ("Operating Expenses") which exceed, in the aggregate, 1.00% per annum of the Fund's average daily net assets (the "Expense Limitation"). For the year ended December 31, 2010, such excess expenses amounted to $58,438. The Fund has agreed to repay Management through December 31, 2016 for fees and expenses foregone and/or its excess Operating Expenses previously reimbursed by Management, so long as its annual Operating Expenses during that period do not exceed its Expense Limitation, and the repayment is made within three years after the year in which Management issued the reimbursement or waived fees. During the year ended December 31, 2010, there was no repayment to Management under its contractual expense limitation. At December 31, 2010, contingent liabilities to Management under its contractual expense limitation were as follows:
| | | Expiring in: | |
| | | 2013 | |
| | | $ | 58,438 | | |
Neuberger Berman LLC ("Neuberger") is retained by Management to furnish it with investment recommendations and research information without added cost to the Fund. Several individuals who are officers and/or trustees of the Trust are also employees of Neuberger and/or Management.
On May 4, 2009, NBSH Acquisition, LLC ("NBSH"), an entity organized by key members of senior management of Neuberger Berman Group LLC ("NBG") and its consolidated subsidiaries (NBG, and together with its consolidated subsidiaries "NB Group") acquired a majority interest in the business conducted by Management and Neuberger, as well as the fixed income and certain alternative asset management businesses of Lehman Brothers Holdings Inc.'s Investment Management Division (together with Management and Neuberger, the "Acquired Businesses") (the "Acquisition"). Prior to that date, Neuberger and the predecessor in interest of Management were indirect wholly owned subsidiaries of Lehman Brothers Holdings Inc. ("LBHI"). On September 15, 2008, LBHI filed a voluntary petition under Chapter 11 of the U.S. Bankruptcy Code, and on December 22, 2008, the bankruptcy court having jurisdiction over the LBHI matter approved the sale of the Acquired Businesses to NBSH (or its successor or assign).
Through NBSH, portfolio managers, NB Group's management team, and certain of its key employees and senior professionals now indirectly own 52% of the voting equity of NBG. LBHI and certain affiliates of LBHI own the remaining 48% of NBG's voting equity. The closing of the Acquisition resulted in an "assignment" of the Fund's Management Agreement and Sub-Advisory Agreement. Such an assignment, by law, automatically terminated those agreements. Accordingly, prior to the closing, the Board, including the Trustees who are not "interested persons" of the Fund's investment manager and its affiliates or the Fund, considered and approved a new Management Agreement and Sub-Advisory Agreement for the Fund. The new agreements, which are virtually identical to those previously in effect, were also approved by a vote of the Fund's shareholders.
These events did not have a material impact on the Fund or its operations. Management and Neuberger continue to operate in the ordinary course of business as the investment manager and sub-adviser of the Fund.
Other non-affiliated service provider: The Fund has an expense offset arrangement in connection with its custodian contract. For the year ended December 31, 2010, there was no reduction of expense under this arrangement.
Note C--Securities Transactions:
During the year ended December 31, 2010, there were purchase and sale transactions (excluding short-term securities) of $3,632,271 and $4,611,483, respectively.
During the year ended December 31, 2010, no brokerage commissions on securities transactions were paid to affiliated brokers.
17
Note D--Fund Share Transactions:
Share activity for the years ended December 31, 2010 and December 31, 2009 was as follows:
| | | For the Year Ended December 31, | |
| | | 2010 | | 2009 | |
| Shares Sold | | | 26,076 | | | | 56,733 | | |
| Shares Redeemed | | | (96,132 | ) | | | (7,077,691 | ) | |
| Total | | | (70,056 | ) | | | (7,020,958 | ) | |
Note E--Line of Credit:
At December 31, 2010, the Fund was a participant in a single committed, unsecured $200,000,000 ($150,000,000 prior to September 17, 2010) line of credit with State Street, to be used only for temporary or emergency purposes. Other investment companies managed by Management also participate in this line of credit on the same terms. Interest is charged on borrowings under this line of credit at the higher of (a) the Federal Funds Rate plus 1.25% per annum or (b) the Overnight LIBOR Rate plus 1.25% per annum. A commitment fee of 0.125% (0.15% prior to September 17, 2010) per annum of the available line of credit is charged, of which each participating Fund has agreed to pay its pro rata share, based on the ratio of its individual net assets to the net assets of all participants at the time the fee is due and payable. The fee is paid quarterly in arrears. Because several mutual funds participate, there is no assurance that an individual Fund will have access to all or any part of the $200,000,000 ($150,000,000 prior to September 17, 2010) at any particular time. There were no loans outstanding pursuant to this line of credit at December 31, 2010. During the year ended December 31, 2010, the Fund did not utilize this line of credit.
18
Financial Highlights
Growth Portfolio
The following table includes selected data for a share outstanding throughout each year and other performance information derived from the Financial Statements.
| | | Year Ended December 31, | |
| | | 2010 | | 2009 | | 2008 | | 2007 | | 2006 | |
| Net Asset Value, Beginning of Year | | $ | 14.20 | | | $ | 10.87 | | | $ | 19.30 | | | $ | 15.73 | | | $ | 13.79 | | |
| Income From Investment Operations: | |
| Net Investment Income (Loss)t | | | (.21 | ) | | | (.05 | ) | | | (.10 | ) | | | (.11 | ) | | | (.05 | ) | |
Net Gains or Losses on Securities
(both realized and unrealized) | | | 4.62 | | | | 3.38 | | | | (8.33 | ) | | | 3.68 | | | | 1.99 | | |
| Total From Investment Operations | | | 4.41 | | | | 3.33 | | | | (8.43 | ) | | | 3.57 | | | | 1.94 | | |
| Net Asset Value, End of Year | | $ | 18.61 | | | $ | 14.20 | | | $ | 10.87 | | | $ | 19.30 | | | $ | 15.73 | | |
| Total Returntt | | | 31.06 | % | | | 30.63 | % | | | (43.68 | )% | | | 22.70 | % | | | 14.07 | % | |
| Ratios/Supplemental Data | |
| Net Assets, End of Year (in millions) | | $ | 8.5 | | | $ | 7.5 | | | $ | 82.0 | | | $ | 172.6 | | | $ | 167.7 | | |
| Ratio of Gross Expenses to Average Net Assets# | | | 1.85 | % | | | 1.27 | % | | | 1.04 | % | | | 1.00 | % | | | 1.00 | % | |
| Ratio of Net Expenses to Average Net AssetsS | | | 1.85 | % | | | 1.27 | % | | | 1.04 | % | | | .99 | % | | | .99 | % | |
Ratio of Net Investment Income (Loss) to Average
Net Assets | | | (1.33)% | | | | (.49)% | | | | (.63)% | | | | (.61)% | | | | (.35)% | | |
| Portfolio Turnover Rate | | | 49 | % | | | 68 | % | | | 63 | % | | | 48 | % | | | 40 | % | |
See Notes to Financial Highlights
19
Notes to Financial Highlights Growth Portfolio
tt Total return based on per share NAV reflects the effects of changes in NAV on the performance of the Fund during each fiscal period and assumes income dividends and other distributions, if any, were reinvested. Results represent past performance and do not guarantee future results. Current returns may be lower or higher than the performance data quoted. Investment returns and principal may fluctuate and shares when redeemed may be worth more or less than original cost. Total return would have been lower if Management had not reimbursed and/or waived certain expenses. The total return information shown does not reflect charges and other expenses that apply to the separate account or the related insurance policies, and the inclusion of these charges and other expenses would reduce the total return for all fiscal periods shown. For the year ended December 31, 2010, the Fund received proceeds from the settlements of class action litigation in which it participated as a class member, which had an approximate impact on total return of 2.91%.
# The Fund is required to calculate an expense ratio without taking into consideration any expense reductions related to expense offset arrangements.
t Calculated based on the average number of shares outstanding during each fiscal period.
S After reimbursement of expenses and/or waiver of a portion of the investment management fee by Management. Had Management not undertaken such actions, the annualized ratios of net expenses to average daily net assets would have been:
| | | Year Ended December 31, | |
| | | 2010 | | 2009 | | 2008 | | 2007 | | 2006 | |
| | | | | | 2.64 | % | | | 1.27 | % | | | 1.04 | % | | | .99 | % | | | .99 | % | |
20
Report of Independent Registered Public Accounting Firm
To the Board of Trustees of
Neuberger Berman Advisers Management Trust and
Shareholders of Growth Portfolio
We have audited the accompanying statement of assets and liabilities, including the schedule of investments, of Growth Portfolio, one of the series constituting Neuberger Berman Advisers Management Trust (the "Trust"), as of December 31, 2010, and the related statement of operations for the year then ended, the statements of changes in net assets for each of the two years in the period then ended, and the financial highlights for each of the five years in the period then ended. These financial statements and financial highlights are the responsibility of the Trust's management. Our responsibility is to express an opinion on these financial statements and financial highlights based on our audits.
We conducted our audits in accordance with the standards of the Public Company Accounting Oversight Board (United States). Those standards require that we plan and perform the audit to obtain reasonable assurance about whether the financial statements and financial highlights are free of material misstatement. We were not engaged to perform an audit of the Trust's internal control over financial reporting. Our audits included consideration of internal control over financial reporting as a basis for designing audit procedures that are appropriate in the circumstances, but not for the purpose of expressing an opinion on the effectiveness of the Trust's internal control over financial reporting. Accordingly, we express no such opinion. An audit also includes examining, on a test basis, evidence supporting the amounts and disclosures in the financial statements and financial highlights, assessing the accounting principles used and significant estimates made by management, and evaluating the overall financial statement presentation. Our procedures included confirmation of securities owned as of December 31, 2010 by correspondence with the custodian and brokers or by other appropriate auditing procedures where replies from brokers were not received. We believe that our audits provide a reasonable basis for our opinion.
In our opinion, the financial statements and financial highlights referred to above present fairly, in all material respects, the financial position of Growth Portfolio, a series of Neuberger Berman Advisers Management Trust, at December 31, 2010, the results of its operations for the year then ended, the changes in its net assets for each of the two years in the period then ended, and the financial highlights for each of the five years in the period then ended, in conformity with U.S. generally accepted accounting principles.

Boston, Massachusetts
February 10, 2011
21
Trustee and Officer Information
The following tables set forth information concerning the trustees and officers of the Trust. All persons named as trustees and officers also serve in similar capacities for other funds administered or managed by Management, Neuberger and NBFI. The Statement of Additional Information includes additional information about trustees and is available upon request, without charge, by calling (800) 877-9700.
Information about the Board of Trustees
Name, (Year of Birth),
and Address(1) | | Position and
Length of
Time Served(2) | | Principal Occupation(s)(3) | | Number of
Funds in Fund
Complex
Overseen by
Trustee | | Other Directorships
Held Outside Fund
Complex by Trustee
| |
| Independent Trustees | |
|
| John Cannon (1930) | | Trustee since 2000 | | Consultant; formerly, Chairman, CDC Investment Advisers (registered investment adviser), 1993 to January 1999; formerly, President and Chief Executive Officer, AMA Investment Advisors, an affiliate of the American Medical Association. | | | 43 | | | Formerly, Independent Trustee or Director of three series of Oppenheimer Funds: Oppenheimer Limited Term New York Municipal Fund, Rochester Fund Municipals, and Oppenheimer Convertible Securities Fund, 1992 to 2009. | |
|
| Faith Colish (1935) | | Trustee since 1982 | | Counsel, Carter Ledyard & Milburn LLP (law firm) since October 2002; formerly, Attorney-at-Law and President, Faith Colish, A Professional Corporation, 1980 to 2002. | | | 43 | | | Formerly, Director, 1997 to 2003, and Advisory Director, 2003 to 2006; ABA Retirement Funds (formerly, American Bar Retirement Association) (not-for-profit membership corporation). | |
|
22
Name, (Year of Birth),
and Address(1) | | Position and
Length of
Time Served(2) | | Principal Occupation(s)(3) | | Number of
Funds in Fund
Complex
Overseen by
Trustee | | Other Directorships
Held Outside Fund
Complex by Trustee
| |
| Martha C. Goss (1949) | | Trustee since 2007 | | President, Woodhill Enterprises Inc./Chase Hollow Associates LLC (personal investment vehicle), since 2006; Chief Operating and Financial Officer, Hopewell Holdings LLC/ Amwell Holdings, LLC (a holding company for a healthcare reinsurance company start-up), since 2003; formerly, Consultant, Resources Connection (temporary staffing), 2002 to 2006. | | | 43 | | | Director, Ocwen Financial Corporation (mortgage servicing), since 2005; Director, American Water (water utility), since 2003; Director, Channel Reinsurance (financial guaranty reinsurance), since 2006; Director, Allianz Life of New York (insurance), since 2005; Director, Financial Women's Association of New York (not-for-profit association), since 2003; Trustee Emerita, Brown University, since 1998; formerly, Advisory Board Member, Attensity (software developer), 2005 to 2007; formerly, Director, Bank Leumi (commercial bank), 2005 to 2007; formerly, Director, Claire's Stores, Inc. (retailer), 2005 to 2007. | |
|
| C. Anne Harvey (1937) | | Trustee since 1998 | | President, C.A. Harvey Associates, since October 2001; formerly, Director, AARP, 1978 to December 2001. | | | 43 | | | Formerly, President, Board of Associates to The National Rehabilitation Hospital's Board of Directors, 2001 to 2002; formerly, Member, Individual Investors Advisory Committee to the New York Stock Exchange Board of Directors, 1998 to 2002. | |
|
23
Name, (Year of Birth),
and Address(1) | | Position and
Length of
Time Served(2) | | Principal Occupation(s)(3) | | Number of
Funds in Fund
Complex
Overseen by
Trustee | | Other Directorships
Held Outside Fund
Complex by Trustee
| |
| Robert A. Kavesh (1927) | | Trustee since 2000 | | Retired; Marcus Nadler Professor Emeritus of Finance and Economics, New York University Stern School of Business; formerly, Executive Secretary-Treasurer, American Finance Association, 1961 to 1979. | | | 43 | | | Formerly, Director, The Caring Community (not-for-profit), 1997 to 2006; formerly, Director, DEL Laboratories, Inc. (cosmetics and pharmaceuticals), 1978 to 2004; formerly, Director, Apple Bank for Savings, 1979 to 1990; formerly, Director, Western Pacific Industries, Inc., (public company), 1972 to 1986. | |
|
| Michael M. Knetter (1960) | | Trustee since 2007 | | President and Chief Executive Officer, University of Wisconsin Foundation, October 2010 to Present; formerly, Dean, School of Business, University of Wisconsin - Madison; formerly, Professor of International Economics and Associate Dean, Amos Tuck School of Business - Dartmouth College, 1998 to 2002. | | | 43 | | | Director, American Family Insurance (a mutual company, not publicly traded), since March 2009; Trustee, Northwestern Mutual Series Fund, Inc., since February 2007; Director, Wausau Paper, since 2005; formerly, Director, Great Wolf Resorts, 2004 to 2009. | |
|
| Howard A. Mileaf (1937) | | Trustee since 1999 | | Retired; formerly, Vice President and General Counsel, WHX Corporation (holding company), 1993 to 2001. | | | 43 | | | Formerly, Director, Webfinancial Corporation (holding company), 2002 to 2008; formerly, Director, WHX Corporation (holding company), 2002 to 2005; formerly, Director, State Theatre of New Jersey (not-for-profit theatre), 2000 to 2005. | |
|
24
Name, (Year of Birth),
and Address(1) | | Position and
Length of
Time Served(2) | | Principal Occupation(s)(3) | | Number of
Funds in Fund
Complex
Overseen by
Trustee | | Other Directorships
Held Outside Fund
Complex by Trustee
| |
| George W. Morriss (1947) | | Trustee since 2007 | | Retired; formerly, Executive Vice President and Chief Financial Officer, People's Bank, Connecticut (a financial services company), 1991 to 2001. | | | 43 | | | Manager, Old Mutual Funds of Hedge Funds fund complex (consisting of six funds), since 2006 for four funds and since 2007 for two funds; formerly, Member NASDAQ Issuers' Affairs Committee, 1995 to 2003. | |
|
| Edward I. O'Brien (1928) | | Trustee since 2000 | | Retired; formerly, Member, Investment Policy Committee, Edward Jones, 1993 to 2001; President, Securities Industry Association ("SIA") (securities industry's representative in government relations and regulatory matters at the federal and state levels), 1974 to 1992; Adviser to SIA, November 1992 to November 1993. | | | 43 | | | Formerly, Director, Legg Mason, Inc. (financial services holding company), 1993 to July 2008; formerly, Director, Boston Financial Group (real estate and tax shelters), 1993 to 1999. | |
|
| Cornelius T. Ryan (1931) | | Trustee since 2000 | | General Partner and Adviser, TD2, TD3, and TOF1 Healthcare Venture Capital Partnerships; Founding General Partner, Oxford Partners and Oxford Bioscience Partners (venture capital investing) and President, Oxford Venture Corporation, since 1981. | | | 43 | | | Trustee, Norwalk Hospital Foundation, since 2000; Director, Supply Pro (privately held company), since 2008; formerly, Trustee, Norwalk Hospital, 1995 to 2004; formerly, President and Director, Randolph Computer Corp., 1966 to 1984; formerly, Director of numerous privately held portfolio companies of Oxford Partners and Oxford Bioscience Partners, 1981 to 2005. | |
|
25
Name, (Year of Birth),
and Address(1) | | Position and
Length of
Time Served(2) | | Principal Occupation(s)(3) | | Number of
Funds in Fund
Complex
Overseen by
Trustee | | Other Directorships
Held Outside Fund
Complex by Trustee
| |
| Tom D. Seip (1950) | | Trustee since 2000; Chairman of the Board since 2008; Lead Independent Trustee from 2006 to 2008 | | General Partner, Seip Investments LP (a private investment partnership); formerly, President and CEO, Westaff, Inc. (temporary staffing), May 2001 to January 2002; formerly, Senior Executive, The Charles Schwab Corporation, 1983 to 1998, including Chief Executive Officer, Charles Schwab Investment Management, Inc.; Trustee, Schwab Family of Funds and Schwab Investments, 1997 to 1998; and Executive Vice President-Retail Brokerage, Charles Schwab & Co., Inc., 1994 to 1997. | | | 43 | | | Director, H&R Block, Inc. (financial services company), since May 2001; Chairman, Compensation Committee, H&R Block, Inc., since 2006; formerly, Director, Forward Management, Inc. (asset management company), 1999 to 2006. | |
|
| Candace L. Straight (1947) | | Trustee since 1999 | | Private investor and consultant specializing in the insurance industry; formerly, Advisory Director, Securitas Capital LLC (a global private equity investment firm dedicated to making investments in the insurance sector), 1998 to December 2003. | | | 43 | | | Director, Montpelier Re Holdings Ltd. (reinsurance company), since 2006; formerly, Director, National Atlantic Holdings Corporation (property and casualty insurance company), 2004 to 2008; formerly, Director, The Proformance Insurance Company (property and casualty insurance company), 2004 to 2008; formerly, Director, Providence Washington Insurance Company (property and casualty insurance company), 1998 to 2006; formerly, Director, Summit Global Partners (insurance brokerage firm), 2000 to 2005. | |
|
| Peter P. Trapp (1944) | | Trustee since 1984 | | Retired; formerly, Regional Manager for Mid-Southern Region, Ford Motor Credit Company, September 1997 to 2007; formerly, President, Ford Life Insurance Company, April 1995 to August 1997. | | | 43 | | | | None. | | |
|
26
Name, (Year of Birth),
and Address(1) | | Position and
Length of
Time Served(2) | | Principal Occupation(s)(3) | | Number of
Funds in Fund
Complex
Overseen by
Trustee | | Other Directorships
Held Outside Fund
Complex by Trustee
| |
| Trustees who are "Interested Persons" | |
|
| Joseph V. Amato* (1962) | | Trustee since 2009 | | President and Director, Neuberger Berman Group LLC, since 2009; President and Chief Executive Officer, Neuberger and Neuberger Berman Holdings LLC (including its predecessor, Neuberger Berman Inc.), since 2007; Chief Investment Officer, Neuberger, since 2009; Chief Investment Officer (Equities) and Managing Director, Management, since 2009; Managing Director, NBFI, since 2007; Board member of NBFI since 2006; formerly, Global Head of Asset Management of LBHI's Investment Management Division, 2006 to 2009; formerly, member of LBHI's Investment Management Division's Executive Management Committee, 2006 to 2009; formerly, Managing Director, Lehman Brothers Inc. ("LBI"), 2006 to 2008; formerly, Chief Recruiting and Development Officer, LBI, 2005 to 2006; formerly, Global Head of LBI's Equity Sales and a Member of its Equities Division Executive Committee, 2003 to 2005. | | | 43 | | | Member of Board of Advisors, McDonough School of Business, Georgetown University, since 2001; Member of New York City Board of Advisors, Teach for America, since 2005; Trustee, Montclair Kimberley Academy (private school), since 2007. | |
|
| Robert Conti* (1956) | | Chief Executive Officer, President and Trustee since 2008; prior thereto, Executive Vice President in 2008 and Vice President, 2000 to 2008 | | Managing Director, Neuberger, since 2007; formerly, Senior Vice President, Neuberger, 2003 to 2006; formerly, Vice President, Neuberger, 1999 to 2003; President and Chief Executive Officer, Management, since 2008; formerly, Senior Vice President, Management, 2000 to 2008. | | | 43 | | | Chairman of the Board, Staten Island Mental Health Society since 2008. | |
|
27
Name, (Year of Birth),
and Address(1) | | Position and
Length of
Time Served(2) | | Principal Occupation(s)(3) | | Number of
Funds in Fund
Complex
Overseen by
Trustee | | Other Directorships
Held Outside Fund
Complex by Trustee
| |
| Jack L. Rivkin* (1940) | | Trustee since 2002; President, 2002 to 2008 | | Formerly, Executive Vice President and Chief Investment Officer, Neuberger Berman Holdings LLC (holding company), 2002 to August 2008 and 2003 to August 2008, respectively; formerly, Managing Director and Chief Investment Officer, Neuberger, December 2005 to August 2008 and 2003 to August 2008, respectively; formerly, Executive Vice President, Neuberger, December 2002 to 2005; formerly, Director and Chairman, Management, December 2002 to August 2008; formerly, Executive Vice President, Citigroup Investments, Inc., September 1995 to February 2002; formerly, Executive Vice President, Citigroup Inc., September 1995 to February 2002. | | | 43 | | | Director, Idealab (private company), since 2009; Director, Distributed World Power (private company), since 2009; Director, Dale Carnegie and Associates, Inc. (private company), since 1999; Director, Solbright, Inc. (private company), since 1998; Director, SA Agricultural Fund, since 2009; Chairman and Director, Essential Brands (consumer products) since 2008; formerly, Director, New York Society of Security Analysts, 2006 to 2008. | |
|
(1) The business address of each listed person is 605 Third Avenue, New York, New York 10158.
(2) Pursuant to the Trust's Trust Instrument, each of these Trustees shall hold office for life or until his or her successor is elected or the Trust terminates; except that (a) any Trustee may resign by delivering a written resignation; (b) any Trustee may be removed with or without cause at any time by a written instrument signed by at least two-thirds of the other Trustees; (c) any Trustee who requests to be retired, or who has become unable to serve, may be retired by a written instrument signed by a majority of the other Trustees; and (d) any Trustee may be removed at any shareholder meeting by a vote of at least two-thirds of the outstanding shares.
(3) Except as otherwise indicated, each individual has held the positions shown for at least the last five years.
* Indicates a Trustee who is an "interested person" within the meaning of the 1940 Act. Mr. Amato and Mr. Conti are interested persons of the Trust by virtue of the fact that each is an officer of Management, Neuberger and/or their affiliates. Mr. Rivkin may be deemed an interested person of the Trust by virtue of the fact that, until August 2008, he was a director of Management and an officer of Neuberger.
28
Information about the Officers of the Trust
Name, (Year of Birth),
and Address(1) | | Position and
Served(2) | | Principal Occupation(s)(3)
Length of Time | |
| Andrew B. Allard (1961) | | Anti-Money Laundering Compliance Officer since 2002 | | Senior Vice President, Neuberger, since 2006; Deputy General Counsel, Neuberger, since 2004; formerly, Vice President, Neuberger, 2000 to 2005; Anti-Money Laundering Compliance Officer, nine registered investment companies for which Management acts as investment manager and administrator (six since 2002, one since 2003, one since 2005 and one since 2006). | |
|
| Claudia A. Brandon (1956) | | Executive Vice President since 2008 and Secretary since 1985 | | Senior Vice President, Neuberger, since 2007 and Employee since 1999; Senior Vice President, Management, since 2008 and Assistant Secretary since 2004; formerly, Vice President, Neuberger, 2002 to 2006; formerly, Vice President-Mutual Fund Board Relations, Management, 2000 to 2008; Executive Vice President, nine registered investment companies for which Management acts as investment manager and administrator (nine since 2008); Secretary, nine registered investment companies for which Management acts as investment manager and administrator (three since 1985, three since 2002, one since 2003, one since 2005 and one since 2006). | |
|
| Maxine L. Gerson (1950) | | Executive Vice President since 2008 and Chief Legal Officer since 2005 (only for purposes of sections 307 and 406 of the Sarbanes-Oxley Act of 2002) | | Managing Director, Neuberger, since 2009, and Deputy General Counsel and Assistant Secretary Neuberger since 2001; Managing Director, Management, since 2009, and Secretary and General Counsel, Management, since 2004; formerly, Senior Vice President, Neuberger, 2002 to 2009; formerly, Senior Vice President, Management, 2006 to 2009; Executive Vice President, nine registered investment companies for which Management acts as investment manager and administrator (nine since 2008); Chief Legal Officer (only for purposes of sections 307 and 406 of the Sarbanes-Oxley Act of 2002), nine registered investment companies for which Management acts as investment manager and administrator (eight since 2005 and one since 2006). | |
|
| Sheila R. James (1965) | | Assistant Secretary since 2002 | | Vice President, Neuberger, since 2008 and Employee since 1999; formerly, Assistant Vice President, Neuberger, 2007; Assistant Secretary, nine registered investment companies for which Management acts as investment manager and administrator (six since 2002, one since 2003, one since 2005 and one since 2006). | |
|
| Brian Kerrane (1969) | | Vice President since 2008 | | Senior Vice President, Neuberger, since 2006; formerly, Vice President, Neuberger, 2002 to 2006; Vice President, Management, since 2008 and Employee since 1991; Vice President, nine registered investment companies for which Management acts as investment manager and administrator (nine since 2008). | |
|
| Kevin Lyons (1955) | | Assistant Secretary since 2003 | | Assistant Vice President, Neuberger, since 2008 and Employee since 1999; Assistant Secretary, nine registered investment companies for which Management acts as investment manager and administrator (seven since 2003, one since 2005 and one since 2006). | |
|
29
Name, (Year of Birth),
and Address(1) | | Position and
Served(2) | | Principal Occupation(s)(3)
Length of Time | |
| Owen F. McEntee, Jr. (1961) | | Vice President since 2008 | | Vice President, Neuberger, since 2006; Employee, Management, since 1992; Vice President, nine registered investment companies for which Management acts as investment manager and administrator (nine since 2008). | |
|
| John M. McGovern (1970) | | Treasurer and Principal Financial and Accounting Officer since 2005 | | Senior Vice President, Neuberger, since 2007; formerly, Vice President, Neuberger, 2004 to 2006; Employee, Management, since 1993; Treasurer and Principal Financial and Accounting Officer, nine registered investment companies for which Management acts as investment manager and administrator (eight since 2005 and one since 2006); formerly, Assistant Treasurer, eight registered investment companies for which Management acts as investment manager and administrator, 2002 to 2005. | |
|
| Andrew Provencher (1965) | | Vice President since 2008 | | Managing Director, Management, since 2008; Managing Director, Neuberger, since 2005; formerly, Senior Vice President, Neuberger, 2003 to 2005; Vice President, nine registered investment companies for which Management acts as investment manager and administrator (nine since 2008). | |
|
| Frank Rosato (1971) | | Assistant Treasurer since 2005 | | Vice President, Neuberger, since 2006; Employee, Management, since 1995; Assistant Treasurer, nine registered investment companies for which Management acts as investment manager and administrator (eight since 2005 and one since 2006). | |
|
| Neil S. Siegel (1967) | | Vice President since 2008 | | Managing Director, Management, since 2008; Managing Director, Neuberger, since 2006; formerly, Senior Vice President, Neuberger, 2004 to 2006; Vice President, nine registered investment companies for which Management acts as investment manager and administrator (nine since 2008). | |
|
| Chamaine Williams (1971) | | Chief Compliance Officer since 2005 | | Senior Vice President, Neuberger, since 2007; Chief Compliance Officer, Management, since 2006; Chief Compliance Officer, nine registered investment companies for which Management acts as investment manager and administrator (eight since 2005 and one since 2006); formerly, Senior Vice President, LBI, 2007 to 2008; formerly, Vice President, LBI, 2003 to 2006; formerly, Chief Compliance Officer, Lehman Brothers Asset Management Inc., 2003 to 2007; formerly, Chief Compliance Officer, Lehman Brothers Alternative Investment Management LLC, 2003 to 2007. | |
|
(1) The business address of each listed person is 605 Third Avenue, New York, New York 10158.
(2) Pursuant to the By-Laws of the Trust, each officer elected by the Trustees shall hold office until his or her successor shall have been elected and qualified or until his or her earlier death, inability to serve, or resignation. Officers serve at the pleasure of the Trustees and may be removed at any time with or without cause.
(3) Except as otherwise indicated, each individual has held the positions shown for at least the last five years.
30
Proxy Voting Policies and Procedures
A description of the policies and procedures that the Trust uses to determine how to vote proxies relating to portfolio securities is available, without charge, by calling 1-800-877-9700 (toll-free) and on the website of the Securities and Exchange Commission, at www.sec.gov. Information regarding how the Trust voted proxies relating to portfolio securities during the most recent 12-month period ended June 30 is also available, without charge, by calling 1-800-877-9700 (toll-free), on the website of the Securities and Exchange Commission at www.sec.gov, and on Management's website at www.nb.com.
Quarterly Portfolio Schedule
The Trust files a complete schedule of portfolio holdings for the Fund with the Securities and Exchange Commission for the first and third quarters of each fiscal year on Form N-Q. The Trust's Forms N-Q are available on the Securities and Exchange Commission's website at www.sec.gov and may be reviewed and copied at the Securities and Exchange Commission's Public Reference Room in Washington, DC. Information on the operation of the Public Reference Room may be obtained by calling 1-800-SEC-0330. The information on Form N-Q is available upon request, without charge, by calling 1-800-877-9700 (toll free).
Board Consideration of the Management and Sub-Advisory Agreements
At a meeting held on October 14, 2010, the Board, including the Trustees who are not "interested persons" of Management (including its affiliates) or Neuberger Berman Advisers Management Trust ("Independent Fund Trustees"), approved the continuance of the Management and Sub-Advisory Agreements ("Agreements") for the Fund.
In evaluating the Agreements, the Board, including the Independent Fund Trustees, reviewed materials furnished by Management and Neuberger in response to questions submitted by counsel for the Independent Fund Trustees, and met with senior representatives of Management and Neuberger regarding their personnel and operations. The Independent Fund Trustees were advised by counsel that is experienced in 1940 Act matters and that is independent of Management and Neuberger. The Independent Fund Trustees received a memorandum from independent counsel discussing the legal standards for their consideration of the proposed continuance of the Agreements. They met with such counsel separately from representatives of Management to discuss the annual contract review. The annual contract review extends over two regular meetings of the Board to ensure that Management and Neuberger have time to respond to any questions the Independent Fund Trustees may have on their initial review of the report and that the Independent Fund Trustees have time to consider those responses. In addition, during this process, the Board held a separate meeting devoted primarily to reviewing and discussing Fund performance.
The Board considered the following factors, among others, in connection with its approval of the continuance of the Agreements: (1) the nature, extent, and quality of the services provided by Management and Neuberger; (2) the performance of the Fund compared to a relevant market index and a peer group of investment companies; (3) the costs of the services provided and profits or losses realized by Management and its affiliates from their relationship with the Fund; (4) the extent to which economies of scale might be realized as the Fund grows; and (5) whether fee levels reflect any such potential economies of scale for the benefit of investors in the Fund. In their deliberations, the Board members did not identify any particular information that was all-important or controlling, and each Trustee may have attributed different weights to the various factors.
The Board evaluated the terms of the Agreements, the overall fairness of the Agreements to the Fund and whether the Agreements were in the best interests of the Fund and its shareholders.
With respect to the nature, extent and quality of the services provided, the Board considered the performance of the Fund and the experience and staffing of the portfolio management and investment research personnel of Management and Neuberger who perform services for the Fund. The Board noted that Management also provides certain administrative services, including fund accounting and compliance oversight. The Board also considered Management's and Neuberger's
31
policies and practices regarding brokerage and the quality of brokerage execution obtained by Management. The Board's Portfolio Transactions and Pricing Committee from time to time reviewed the quality of the execution services that Management and Neuberger had provided, and periodically reviews studies by an independent firm engaged to review and evaluate the quality of brokerage execution received by the Fund. The Board also reviewed whether Management and Neuberger used brokers to execute Fund transactions that provide research and other services to Management and Neuberger, and the types of benefits potentially derived from such services by Management, Neuberger, the Fund and other clients of Management and Neuberger. In addition, the Board noted the positive compliance history of Management and Neuberger, as each firm has been free of significant reported compliance problems.
The Board considered the performance of the Fund relative to its benchmark and a peer group of investment companies dedicated to insurance products pursuing broadly similar strategies. The Board also considered performance in relation to certain measures of the degree of investment risk undertaken by the portfolio manager. The Board discussed the Fund's performance with Management and discussed steps that Management had taken, or intended to take, to improve the Fund's performance. The Board also considered Management's resources and responsiveness with respect to the Fund.
With respect to the overall fairness of the Agreements, the Board considered the fee structure for the Fund under the Agreements and any fall-out benefits likely to accrue to Management or Neuberger or their affiliates from their relationship with the Fund. The Board also considered the contractual limit on Fund expenses undertaken by Management. With regard to the sub-advisory fee paid to Neuberger, the Board noted that this fee is "at cost." In addition, the Board considered the profitability of Management and its affiliates from their association with the Fund and noted that Management incurred a loss on the Fund.
The Board considered whether there were other funds that were advised or sub-advised by Management or its affiliates or separate accounts managed by Management or its affiliates with similar investment objectives, policies and strategies to the Fund. The Board compared the fees charged to the Fund to the fees charged to an advised fund, a sub-advised fund and a separate account, each managed in a similar style to the Fund. The Board considered the appropriateness and reasonableness of any differences between the fees charged to the Fund and the other funds and account and determined that the differences in fees were consistent with the management and other services provided.
The Board also evaluated any apparent or anticipated economies of scale in relation to the services Management provides to the Fund. The Board considered whether the Fund's fee structure provides for a reduction of payments resulting from the use of breakpoints and whether those breakpoints are set at appropriate asset levels.
The Board also considered changes in management, staffing, resources and operations accompanying the separation of the Neuberger Berman entities from the LBHI bankruptcy estate.
In concluding that the benefits accruing to Management and its affiliates by virtue of their relationship to the Fund were reasonable in comparison with the costs of providing the investment advisory services and the benefits accruing to the Fund, the Board reviewed specific data as to Management's profit or loss on the Fund for a recent period and the trend in profit or loss over recent years. The Board also carefully examined Management's cost allocation methodology. The Board recognized that Management should be entitled to earn a reasonable level of profits for services it provides to the Fund and, based on its review, concluded that Management's level of profitability was not excessive.
Conclusions
In approving the Agreements, the Board concluded that the terms of each Agreement are fair and reasonable and that approval of the Agreements is in the best interests of the Fund and its shareholders. In reaching this determination, the Board considered that Management and Neuberger could be expected to provide a high level of service to the Fund; that it retained confidence in Management's and Neuberger's capabilities to manage the Fund; that the Fund's fee structure appeared to the Board to be reasonable given the nature and quality of services provided; and that the benefits accruing to Management and its affiliates by virtue of their relationship to the Fund were reasonable in comparison with the benefits accruing to the Fund.
32

Neuberger Berman
Advisers Management Trust
Guardian Portfolio
I Class Shares
S Class Shares
Annual Report
December 31, 2010
Guardian Portfolio Manager's Commentary
We are pleased to report that the Neuberger Berman Advisers Management Trust (AMT) Guardian Portfolio generated a positive return for full-year 2010 and outperformed its benchmark, the S&P 500 Index.
Just as we thought the markets had overemphasized positive news from the market low through early 2010, our view during the summer's decline was that sentiment was overly negative given the economic environment. Although housing remained weak and unemployment was high, in our view the issues that could have tipped the economy back into another recession were not present. We did not observe serious imbalances in inventories or manufacturing capacity; moreover, corporate earnings and balance sheets were strong, and valuations were in our opinion relatively low.
During the fourth quarter of 2010, sentiment did improve, and the market rallied. Economic growth across Europe was better than generally expected and in September the Federal Reserve indicated the potential for a second round of quantitative easing (announced in November), which renewed faith in economic expansion and stability. The S&P 500 closed the year with its best December since 1991.
Within the Portfolio, top contributors included semiconductor stock Altera and software company Intuit (the position was sold after the reporting period). Altera, a large holding, has benefited from the cyclical recovery and secular advantages. An innovative company, in our opinion, Altera has enjoyed significant market share expansion within the growing FPGA (Field-Programmable Gate Array) chip category, and meaningfully outperformed analysts' expectations during the year. In our opinion, Intuit executed incredibly well and grew its business through the recession, thus showing the integrity of its business model. As earnings improved with the recovery, the stock benefited.
Our Energy stocks also performed very well for the year, with Newfield Exploration, an oil and natural gas exploration and production company, providing a significant contribution to returns. New technology has allowed companies like Newfield to realize more value from existing oil and natural gas reserves as well as reserves that previously were economically unfeasible, which has accelerated the company's growth profile. While Newfield's stock is up significantly, we believe it is not yet priced to match its true value.
On the other hand, The Washington Post, which we owned due to its Kaplan education business, was a disappointment. While we got the company-specific fundamentals right--Kaplan met our expectations for dramatic and contra-cyclical growth--the regulatory environment changed dramatically. Proposed regulations threatened Kaplan's business model, and, with our investment premise challenged, we eliminated the position.
SAIC was another disappointment this period. With investors focused on cyclical growth stocks, steady growth stocks like SAIC tended to be overlooked as they underperformed. In addition, the fact that the government is one of its larger clients gave investors pause. We continue to own SAIC given our view that the company has relatively favorable prospects in cyber-security services.
Health Care stocks generally underperformed in 2010 largely because investors gravitated toward more cyclical exposure, but also because of uncertainty around health care reform. Large-cap pharmaceutical companies had an added headwind with worries over the European debt crisis since governments are their primary payers. Roche underperformed for all of these reasons, as well as for certain execution challenges. Our investment premise for Roche has not changed, however. In our opinion, the stock has underperformed compared to the quality of its business and we continue to own it.
Looking ahead, absent any surprises, we believe the economic backdrop appears relatively favorable. Many causes of the past year's uncertainty have been somewhat resolved. We now have near-term clarity on tax rates, meaning that businesses can make decisions they may have been delaying regarding mergers and acquisitions, share repurchases and/or dividends. Potential constructive discussions addressing longer-term fiscal deficits could improve investor sentiment in capital markets.
The risk we see is that if Congress and the Obama administration do not find common ground on key policy issues, or if Europe has another test of its resolve in addressing sovereign debt problems, this could create volatility, damage investor sentiment and threaten some of the momentum we have seen recently.
1
In managing the Portfolio, our focus has been on good quality businesses positioned for advantaged growth. Investors did not discriminate much between stocks from 2006 through early 2010 as they were biased towards a narrow set of cyclical beneficiaries. As a result, returns were narrow by sector and highly correlated. As the economy stalled in the third quarter of 2010 and then found its footing in the fourth quarter, investors appeared to re-focus on businesses that were doing well but whose shares had underperformed. When that happened, our relative performance benefited. This, more than anything, makes us optimistic from a portfolio perspective going forward. Even with modest economic growth, if we can identify good businesses that are increasing their market share, this should create opportunity to deliver favorable relative performance.
Sincerely,

Arthur Moretti
Portfolio Manager
The risks involved in seeking capital appreciation from investments primarily in mid- to large-cap stocks are set forth in the prospectus and statement of additional information.
Mid-capitalization stocks are more vulnerable to financial risks and other risks than larger stocks. They also trade less frequently and in lower volume than larger company stocks, so their market prices tend to be more volatile. Large-cap stocks are subject to all the risks of stock market investing, including the risk that they may lose value due to overall market or economic conditions.
The composition, industries and holdings of the Portfolio are subject to change. The AMT Guardian Portfolio is invested in a wide array of stocks and no single holding makes up a significant portion of the Portfolio's total assets.
2
Guardian Portfolio (Unaudited)
SECTOR ALLOCATION
| (% of Total Investments) | |
| Consumer Discretionary | | | 5.4 | % | |
| Consumer Staples | | | 10.8 | | |
| Energy | | | 14.3 | | |
| Financials | | | 15.1 | | |
| Health Care | | | 12.2 | | |
| Industrials | | | 14.5 | | |
| Information Technology | | | 22.8 | | |
| Materials | | | 2.0 | | |
| Short-Term | | | 2.9 | | |
| Total | | | 100.0 | % | |
PERFORMANCE HIGHLIGHTS1
| | | Inception | | Average Annual Total
Return Ended 12/31/2010 | |
| | | Date | | 1 Year | | 5 Years | | 10 Years | | Life of Fund* | |
| Guardian Portfolio Class I | | 11/03/1997 | | | 19.01 | % | | | 3.35 | % | | | 3.52 | % | | | 6.44 | % | |
| Guardian Portfolio Class S2 | | 08/02/2002 | | | 18.94 | % | | | 3.16 | % | | | 3.34 | % | | | 6.30 | % | |
| S&P 500 Index3 | | | | | | | 15.06 | % | | | 2.29 | % | | | 1.41 | % | | | 4.26 | % | |
Performance data quoted represent past performance, which is no guarantee of future results. The investment return and principal value of an investment will fluctuate so that an investor's shares, when redeemed, may be worth more or less than their original cost. Results are shown on a "total return" basis and include reinvestment of all income dividends and distributions.
Current performance may be lower or higher than the performance data quoted. For performance data current to the most recent month end, please visit https://www.nb.com.
* Index returns are as of the inception date 11/03/1997.
As stated in the Portfolio's most recent prospectus, the total annual operating expense ratios for fiscal year 2009 were 1.10% and 1.38% for Class I and Class S shares, respectively (prior to any fee waivers or expense reimbursements). The net expense ratio was 1.25% for Class S shares. Neuberger Berman Management LLC has contractually agreed to limit certain expenses of the Portfolio through 12/31/2013.
COMPARISON OF A $10,000 INVESTMENT
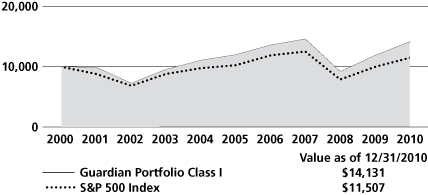
This chart shows the value of a hypothetical $10,000 investment in the Portfolio over the past 10 fiscal years, or since the Portfolio's inception, if it has not operated for 10 years. The graph is based on Class I shares only; performance of other classes will vary due to differences in fee structures (see Performance Highlights chart above). The results are compared with one or more benchmarks, which may include a broad-based market index and/or a narrower index. Please note that market indices have not been reduced to reflect any of the fees and costs of investing. All results include the reinvestment of income dividends and distributions. Neither the Portfolio's returns nor the market index shown in the graph and table reflect the effect of taxes an investor would pay on Portfolio distributions or on the redemption of Portfolio shares. Results represent past performance and do not indicate future results.
Please see Endnotes for additional information.
3
Endnotes
1 "Total Return" includes reinvestment of all income dividends and distributions. Results represent past performance and do not indicate future results. The value of an investment in the Portfolio and the return on the investment both will fluctuate, and redemption proceeds may be higher or lower than an investor's original cost. The performance information does not reflect fees and expenses of the variable annuity and variable life insurance policies or the qualified pension and retirement plans whose proceeds are invested in the Portfolio. Neuberger Berman Management LLC ("NBM LLC") has agreed to absorb certain expenses of the AMT Portfolios, including the Portfolio. Without this arrangement, which is subject to change, the total returns of the Portfolio may have been less.
2 Performance shown prior to August 2, 2002 for the Class S shares is that of the Class I shares, which have lower expenses and correspondingly higher returns than Class S shares.
3 The S&P 500 Index is widely regarded as the standard for measuring large-cap U.S. stock market performance and includes a representative sample of leading companies in leading industries. Please note that indices do not take into account any fees and expenses of investing in the individual securities that they track and that individuals cannot invest directly in any index. Data about the performance of this index is prepared or obtained by NBM LLC and include reinvestment of all income dividends and distributions. The Portfolio may invest in many securities not included in the above-described index or may not invest in all securities included in the above-described index.
Any ratios or other measurements using a factor of forecasted earnings of a company discussed herein are based on consensus estimates, not NBM LLC's own projections, and they may or may not be realized. In addition, any revision to a forecast could affect the market price of a security. By quoting them herein, NBM LLC does not offer an opinion as to the accuracy of and does not guarantee these forecasted numbers.
The investments for the Portfolio are managed by the same portfolio manager(s) who manage one or more other mutual funds that have similar names, investment objectives and investment styles as the Portfolio. You should be aware that the Portfolio is likely to differ from the other mutual funds in size, cash flow pattern and tax matters. Accordingly, the holdings and performance can be expected to vary from those of the other mutual funds.
The composition, industries and holdings of the Portfolio are subject to change.
Shares of the separate AMT Portfolios are not available to the general public. Shares of this Portfolio may be purchased only by life insurance companies to be used with their separate accounts that fund variable annuity and variable life insurance policies and by qualified pension and retirement plans.
Statistics and projections in this report are derived from sources deemed to be reliable but cannot be regarded as a representation of future results of the AMT Portfolios. This report is prepared for the general information of shareholders and is not an offer of shares of the AMT Portfolios. Shares of the AMT Portfolios are sold only through the currently effective prospectuses, which must precede or accompany this report.
The "Neuberger Berman" name and logo are registered service marks of Neuberger Berman Group LLC. "Neuberger Berman Management LLC" and the individual Fund names in this piece are either service marks or registered service marks of Neuberger Berman Management LLC.
(c) 2011 Neuberger Berman Management LLC distributor. All rights reserved.
4
Information About Your Fund's Expenses
This table is designed to provide information regarding costs related to your investments. All mutual funds incur operating expenses, which include management fees, fees for administrative services and costs of shareholder reports, among others. The following examples are based on an investment of $1,000 made at the beginning of the six month period ended December 31, 2010 and held for the entire period. The table illustrates the fund's costs in two ways:
| Actual Expenses and Performance: | | The first section of the table provides information about actual account values and actual expenses in dollars, based on the fund's actual performance during the period. You may use the information in this line, together with the amount you invested, to estimate the expenses you paid over the period. Simply divide your account value by $1,000 (for example, an $8,600 account value divided by $1,000 = 8.6), then multiply the result by the number in the first section of the table under the heading entitled "Expenses Paid During the Period" to estimate the expenses you paid over the period. | |
|
Hypothetical Example for
Comparison Purposes: | | The second section of the table provides information about hypothetical account values and hypothetical expenses based on the fund's actual expense ratio and an assumed rate of return at 5% per year before expenses. This return is not the fund's actual return. The hypothetical account values and expenses may not be used to estimate the actual ending account balance or expenses you paid for the period. You may use this information to compare the ongoing costs of investing in this fund versus other funds. To do so, compare the expenses shown in this 5% hypothetical example with the 5% hypothetical examples that appear in the shareholder reports of other funds. | |
|
Please note that the expenses in the table are meant to highlight your ongoing costs only. The table and expense example do not include any transaction costs, such as fees and expenses that are, or may be, imposed under your variable contract or qualified pension plan. Therefore, the information under the heading "Hypothetical (5% annual return before expenses)" is useful in comparing ongoing costs only, and will not help you determine the relative total costs of owning different funds. In addition, if these transaction costs were included, your costs would have been higher.
Expense Information as of 12/31/10 (Unaudited)
NEUBERGER BERMAN ADVISERS MANAGEMENT TRUST GUARDIAN PORTFOLIO
| Actual | | Beginning Account
Value
7/1/10 | | Ending Account
Value
12/31/10 | | Expenses Paid
During the Period*
7/1/10 - 12/31/10 | | Expense
Ratio | |
| Class I | | $ | 1,000.00 | | | $ | 1,233.30 | | | $ | 6.42 | | | | 1.14 | % | |
| Class S | | $ | 1,000.00 | | | $ | 1,232.80 | | | $ | 7.03 | | | | 1.25 | % | |
| Hypothetical (5% annual return before expenses)** | |
| Class I | | $ | 1,000.00 | | | $ | 1,019.46 | | | $ | 5.80 | | | | 1.14 | % | |
| Class S | | $ | 1,000.00 | | | $ | 1,018.90 | | | $ | 6.36 | | | | 1.25 | % | |
* For each class, expenses are equal to the annualized expense ratio for the class, multiplied by the average account value over the period, multiplied by 184/365 (to reflect the one-half year period shown).
** Hypothetical 5% annual return before expenses is calculated by multiplying the number of days in the most recent half year divided by 365.
5
Schedule of Investments Guardian Portfolio
| NUMBER OF SHARES | | | | VALUEt | |
| Common Stocks (97.3%) | | | |
| Beverages (2.3%) | | | |
| | 32,613 | | | Coca-Cola | | $ | 2,144,957 | | |
| Capital Markets (10.3%) | | | |
| | 97,303 | | | Bank of New York Mellon | | | 2,938,550 | | |
| | 13,800 | | | BlackRock, Inc. | | | 2,630,004 | | |
| | 232,125 | | | Charles Schwab | | | 3,971,659 | | |
| | | | 9,540,213 | | |
| Commercial Services & Supplies (3.0%) | | | |
| | 93,956 | | | Republic Services | | | 2,805,526 | | |
Electronic Equipment, Instruments &
Components (6.0%) | | | |
| | 45,998 | | | Anixter International | | | 2,747,461 | | |
| | 73,675 | | | National Instruments | | | 2,773,127 | | |
| | | | 5,520,588 | | |
| Energy Equipment & Services (6.2%) | | | |
| | 40,595 | | | Cameron International | | | 2,059,384 | * | |
| | 43,442 | | | Schlumberger Ltd. | | | 3,627,407 | | |
| | | | 5,686,791 | | |
| Food & Staples Retailing (2.1%) | | | |
| | 27,342 | | | Costco Wholesale | | | 1,974,366 | | |
| Food Products (2.8%) | | | |
| | 39,939 | | | J.M. Smucker | | | 2,621,995 | | |
| Health Care Equipment & Supplies (6.5%) | | | |
| | 33,870 | | | C.R. Bard | | | 3,108,250 | | |
| | 64,026 | | | Covidien PLC | | | 2,923,427 | | |
| | | | 6,031,677 | | |
| Household Products (3.5%) | | | |
| | 50,551 | | | Procter & Gamble | | | 3,251,946 | | |
| Industrial Conglomerates (3.3%) | | | |
| | 35,354 | | | 3M Co. | | | 3,051,050 | | |
| Industrial Gases (2.0%) | | | |
| | 19,113 | | | Praxair, Inc. | | | 1,824,718 | | |
| Insurance (4.8%) | | | |
| | 4,792 | | | Markel Corp. | | | 1,811,999 | * | |
| | 132,550 | | | Progressive Corp. | | | 2,633,769 | | |
| | | | 4,445,768 | | |
| NUMBER OF SHARES | | | | VALUEt | |
| Internet Software & Services (3.8%) | | | |
| | 211,962 | | | Yahoo! Inc. | | $ | 3,524,928 | * | |
| IT Services (4.5%) | | | |
| | 11,400 | | | MasterCard, Inc. Class A | | | 2,554,854 | | |
| | 98,035 | | | SAIC, Inc. | | | 1,554,835 | * | |
| | | | 4,109,689 | | |
| Machinery (4.7%) | | | |
| | 91,411 | | | Danaher Corp. | | | 4,311,857 | | |
| Media (5.4%) | | | |
| | 112,140 | | | Comcast Corp. Class A Special | | | 2,333,633 | | |
| | 51,364 | | | Scripps Networks Interactive
Class A | | | 2,658,087 | | |
| | | | 4,991,720 | | |
| Oil, Gas & Consumable Fuels (8.1%) | | | |
| | 190,324 | | | BG Group PLC | | | 3,845,672 | | |
| | 50,815 | | | Newfield Exploration | | | 3,664,270 | * | |
| | | | 7,509,942 | | |
| Pharmaceuticals (5.7%) | | | |
| | 48,610 | | | Hospira, Inc. | | | 2,707,091 | * | |
| | 17,428 | | | Roche Holding AG | | | 2,553,621 | | |
| | | | 5,260,712 | | |
| Road & Rail (1.5%) | | | |
| | 20,324 | | | Canadian National Railway | | | 1,350,936 | | |
Semiconductors & Semiconductor
Equipment (7.5%) | | | |
| | 77,119 | | | Altera Corp. | | | 2,743,894 | | |
| | 127,843 | | | Texas Instruments | | | 4,154,898 | | |
| | | | 6,898,792 | | |
| Software (1.3%) | | | |
| | 19,152 | | | Intuit Inc. | | | 944,194 | * | |
| | 8,100 | | | Sourcefire Inc. | | | 210,033 | * | |
| | | | 1,154,227 | | |
| Trading Companies & Distributors (2.0%) | | | |
| | 13,481 | | | W.W. Grainger | | | 1,861,861 | | |
| | | | | Total Common Stocks
(Cost $67,385,968) | | | 89,874,259 | | |
See Notes to Schedule of Investments
6
| NUMBER OF SHARES | | | | VALUEt | |
| Short-Term Investments (2.9%) | | | |
| | 2,635,933 | | | State Street Institutional | | $ | 2,635,933 | | |
| | | | | Liquid Reserves Fund | |
| |
| | | | | Institutional Class | |
| |
| | | | | (Cost $2,635,933) | | | | | |
| | | | | Total Investments (100.2%)
(Cost $70,021,901) | | | 92,510,192 | ## | |
| | | | | Liabilities, less cash, receivables and
other assets [(0.2%)] | | | (187,498 | ) | |
| | | | | Total Net Assets (100.0%) | | $ | 92,322,694 | | |
See Notes to Schedule of Investments
7
Notes to Schedule of Investments Guardian Portfolio
t In accordance with Accounting Standards Codification ("ASC") 820 "Fair Value Measurements and Disclosures" ("ASC 820"), all investments held by Neuberger Berman Advisers Management Trust Guardian Portfolio (the "Fund") are carried at the value that Neuberger Berman Management LLC ("Management") believes the Fund would receive upon selling an investment in an orderly transaction to an independent buyer in the principal or most advantageous market for the investment under current market conditions. Various inputs, including the volume and level of activity for the asset or liability in the market, are considered in valuing the Fund's investments, some of which are discussed below. Significant management judgment may be necessary to value investments in accordance with ASC 820.
ASC 820 established a three-tier hierarchy of inputs to create a classification of value measurements for disclosure purposes. The three-tier hierarchy of inputs is summarized in the three broad Levels listed below.
. Level 1 - quoted prices in active markets for identical investments
. Level 2 - other significant observable inputs (including quoted prices for similar investments, interest rates, prepayment speeds, credit risk, amortized cost, etc.)
. Level 3 - significant unobservable inputs (including the Fund's own assumptions in determining the fair value of investments)
The inputs or methodology used for valuing an investment are not necessarily an indication of the risk associated with investing in those securities.
The value of the Fund's investments in equity securities, for which market quotations are readily available, is generally determined by Management by obtaining valuations from an independent pricing service based on the latest sale price quoted in active markets (Level 1 inputs). Securities traded primarily on the NASDAQ Stock Market are normally valued by the Fund at the NASDAQ Official Closing Price ("NOCP") provided by NASDAQ each business day. The NOCP is the most recently reported price as of 4:00:02 p.m., Eastern time, unless that price is outside the range of the "inside" bid and asked prices (i.e., the bid and asked prices that dealers quote to each other when trading for their own accounts); in that case, NASDAQ will adjust the price to equal the inside bid or asked price, whichever is closer. Because of delays in reporting trades, the NOCP may not be based on the price of the last trade to occur before the market closes. If there is no reported sale of a security on a particular day, the independent pricing service may value the security based on reported market quotations.
Management has developed a process to periodically review information provided by independent pricing services for all types of securities.
Investments in State Street Institutional Liquid Reserves Fund Institutional Class are valued using the fund's daily calculated net asset value ("NAV").
For equity securities, if a valuation is not available from an independent pricing service, or if Management has reason to believe that the valuation received does not represent the amount the Fund might reasonably expect to receive on a current sale in an orderly transaction, the Fund seeks to obtain quotations from principal market makers (generally considered Level 3 inputs). If such quotations are not readily available, the security is valued using methods the Board of Trustees of Neuberger Berman Advisers Management Trust (the "Board") has approved on the belief that they reflect fair value. Numerous factors may be considered when determining the fair value of a security based on Level 2 or 3 inputs, including available analyst, media or other reports, trading in futures or ADRs and whether the issuer of the security being fair valued has other securities outstanding.
The value of the Fund's investments in foreign securities is generally determined using the same valuation methods and inputs as other Fund investments, as discussed above. Foreign security prices are expressed in local currency values and are translated from the local currency into U.S. dollars using the exchange rates as of 4:00 p.m., Eastern
See Notes to Financial Statements
8
Notes to Schedule of Investments Guardian Portfolio (cont'd)
time. The Board has approved the use of Interactive Data Pricing and Reference Data, Inc. ("Interactive") to assist in determining the fair value of foreign equity securities when changes in the value of a certain index suggest that the closing prices on the foreign exchanges may no longer represent the amount that the Fund could expect to receive for those securities. In this event, Interactive will provide adjusted prices for certain foreign equity securities using a statistical analysis of historical correlations of multiple factors (Level 2 inputs). In the absence of precise information about the market values of these foreign securities as of the close of the New York Stock Exchange, the Board has determined on the basis of available data that prices adjusted in this way are likely to be closer to the prices the Fund could realize on a current sale than are the prices of those securities established at the close of the foreign markets in which the securities primarily trade. These fair value prices are necessarily estimates, and there is no assurance that such a price will be at or close to the price at which the security is next quoted or next trades.
The following is a summary, categorized by Level, of inputs used to value the Fund's investments as of December 31, 2010:
| Asset Valuation Inputs | | Level 1 | | Level 2 | | Level 3 | | Total | |
| Investments: | |
| Common Stocks^ | | $ | 89,874,259 | | | $ | -- | | | $ | -- | | | $ | 89,874,259 | | |
| Short-Term Investments | | | -- | | | | 2,635,933 | | | | -- | | | | 2,635,933 | | |
| Total Investments | | $ | 89,874,259 | | | $ | 2,635,933 | | | $ | -- | | | $ | 92,510,192 | | |
^ The Schedule of Investments provides information on the industry categorization for the portfolio.
The Fund had no significant transfers between Levels 1 and 2 during the year ended December 31, 2010.
## At December 31, 2010, the cost of investments for U.S. federal income tax purposes was $70,420,694. Gross unrealized appreciation of investments was $22,807,042 and gross unrealized depreciation of investments was $717,544, resulting in net unrealized appreciation of $22,089,498, based on cost for U.S. federal income tax purposes.
* Security did not produce income during the last twelve months.
See Notes to Financial Statements
9
Statement of Assets and Liabilities
Neuberger Berman Advisers Management Trust
| | | GUARDIAN
PORTFOLIO | |
| | | December 31, 2010 | |
| Assets | |
| Investments in securities, at value* (Note A)-see Schedule of Investments: | |
| Unaffiliated issuers | | $ | 92,510,192 | | |
| Cash | | | 4,690 | | |
| Dividends and interest receivable | | | 50,122 | | |
| Receivable for Fund shares sold | | | 18,544 | | |
| Prepaid expenses and other assets | | | 2,126 | | |
| Total Assets | | | 92,585,674 | | |
| Liabilities | |
| Payable for securities purchased | | | 95,468 | | |
| Payable for Fund shares redeemed | | | 38,177 | | |
| Payable to investment manager (Notes A & B) | | | 42,811 | | |
| Payable to administrator-net (Note B) | | | 30,849 | | |
| Accrued expenses and other payables | | | 55,675 | | |
| Total Liabilities | | | 262,980 | | |
| Net Assets at value | | $ | 92,322,694 | | |
| Net Assets consist of: | |
| Paid-in capital | | $ | 74,107,862 | | |
| Undistributed net investment income (loss) | | | 334,878 | | |
| Accumulated net realized gains (losses) on investments | | | (4,610,903 | ) | |
| Net unrealized appreciation (depreciation) in value of investments | | | 22,490,857 | | |
| Net Assets at value | | $ | 92,322,694 | | |
| Net Assets | |
| Class I | | $ | 15,288,861 | | |
| Class S | | | 77,033,833 | | |
| Shares Outstanding ($.001 par value; unlimited shares authorized) | |
| Class I | | | 807,125 | | |
| Class S | | | 4,088,362 | | |
| Net Asset Value, offering and redemption price per share | |
| Class I | | $ | 18.94 | | |
| Class S | | | 18.84 | | |
| *Cost of Investments: | |
| Unaffiliated issuers | | $ | 70,021,901 | | |
See Notes to Financial Statements
10
Statement of Operations
Neuberger Berman Advisers Management Trust
| | | GUARDIAN
PORTFOLIO | |
| | | For the
Year Ended
December 31, 2010 | |
| Investment Income: | |
| Income (Note A): | |
| Dividend income-unaffiliated issuers | | $ | 1,392,277 | | |
| Interest income-unaffiliated issuers | | | 4,339 | | |
| Foreign taxes withheld | | | (17,041 | ) | |
| Total income | | $ | 1,379,575 | | |
| Expenses: | |
| Investment management fees (Notes A & B) | | | 467,212 | | |
| Administration fees (Note B): | |
| Class I | | | 40,948 | | |
| Class S | | | 213,895 | | |
| Distribution fees (Note B): | |
| Class S | | | 178,246 | | |
| Audit fees | | | 40,900 | | |
| Custodian fees (Note B) | | | 48,986 | | |
| Insurance expense | | | 7,573 | | |
| Legal fees | | | 39,335 | | |
| Shareholder reports | | | 39,861 | | |
| Trustees' fees and expenses | | | 52,324 | | |
| Miscellaneous | | | 8,096 | | |
| Total expenses | | | 1,137,376 | | |
| Expenses reimbursed by Management (Note B) | | | (91,992 | ) | |
| Expenses reduced by custodian fee expense offset arrangement (Note B) | | | (12 | ) | |
| Total net expenses | | | 1,045,372 | | |
| Net investment income (loss) | | $ | 334,203 | | |
| Realized and Unrealized Gain (Loss) on Investments (Note A) | |
| Net realized gain (loss) on: | |
| Sales of investment securities of unaffiliated issuers | | | 8,272,252 | | |
| Foreign currency | | | 820 | | |
| Change in net unrealized appreciation (depreciation) in value of: | |
| Unaffiliated investment securities | | | 6,389,580 | | |
| Foreign currency | | | 4,417 | | |
| Net gain (loss) on investments | | | 14,667,069 | | |
| Net increase (decrease) in net assets resulting from operations | | $ | 15,001,272 | | |
See Notes to Financial Statements
11
Statements of Changes in Net Assets
Neuberger Berman Advisers Management Trust
| | | GUARDIAN PORTFOLIO | |
| | | Year Ended
December 31,
2010 | | Year Ended
December 31,
2009 | |
| Increase (Decrease) in Net Assets: | |
| From Operations (Note A): | |
| Net investment income (loss) | | $ | 334,203 | | | $ | 265,407 | | |
| Net realized gain (loss) on investments | | | 8,273,072 | | | | (10,638,101 | ) | |
| Change in net unrealized appreciation (depreciation) of investments | | | 6,393,997 | | | | 37,458,198 | | |
| Net increase (decrease) in net assets resulting from operations | | | 15,001,272 | | | | 27,085,504 | | |
| Distributions to Shareholders From (Note A): | |
| Net investment income: | |
| Class I | | | (57,381 | ) | | | (142,454 | ) | |
| Class S | | | (226,058 | ) | | | (622,197 | ) | |
| Total distributions to shareholders | | | (283,439 | ) | | | (764,651 | ) | |
| From Fund Share Transactions (Note D): | |
| Proceeds from shares sold: | |
| Class I | | | 4,398,162 | | | | 6,274,989 | | |
| Class S | | | 2,324,104 | | | | 11,636,789 | | |
| Proceeds from reinvestment of dividends and distributions: | |
| Class I | | | 57,381 | | | | 142,454 | | |
| Class S | | | 226,058 | | | | 622,197 | | |
| Payments for shares redeemed: | |
| Class I | | | (5,360,459 | ) | | | (69,776,705 | ) | |
| Class S | | | (9,355,363 | ) | | | (5,505,098 | ) | |
| Net increase (decrease) from Fund share transactions | | | (7,710,117 | ) | | | (56,605,374 | ) | |
| Net Increase (Decrease) in Net Assets | | | 7,007,716 | | | | (30,284,521 | ) | |
| Net Assets: | |
| Beginning of year | | | 85,314,978 | | | | 115,599,499 | | |
| End of year | | $ | 92,322,694 | | | $ | 85,314,978 | | |
| Undistributed net investment income (loss) at end of year | | $ | 334,878 | | | $ | 283,294 | | |
See Notes to Financial Statements
12
Notes to Financial Statements Guardian Portfolio
Note A--Summary of Significant Accounting Policies:
1 General: The Fund is a separate operating series of Neuberger Berman Advisers Management Trust (the "Trust"), a Delaware statutory trust organized pursuant to a Trust Instrument dated May 23, 1994. The Trust is currently comprised of ten separate operating series (each individually a "Series," and collectively the "Funds") each of which is diversified. The Trust is registered as an open-end management investment company under the Investment Company Act of 1940, as amended (the "1940 Act"), and its shares are registered under the Securities Act of 1933, as amended. The Fund currently offers Class I and Class S shares. The Board may establish additional series or classes of shares without the approval of shareholders.
The assets of each Series belong only to that Series, and the liabilities of each Series are borne solely by that Series and no other.
The preparation of financial statements in accordance with U.S. generally accepted accounting principles requires Management to make estimates and assumptions at the date of the financial statements. Actual results could differ from those estimates.
2 Portfolio valuation: Investment securities are valued as indicated in the notes following the Schedule of Investments.
3 Foreign currency translation: The accounting records of the Fund are maintained in U.S. dollars. Foreign currency amounts are translated into U.S. dollars using the exchange rates as of 4:00 p.m., Eastern time, to determine the value of investments, other assets and liabilities. Purchase and sale prices of securities, and income and expenses, are translated into U.S. dollars at the prevailing rate of exchange on the respective dates of such transactions. Net unrealized foreign currency gain (loss), if any, arises from changes in the value of assets and liabilities, other than investments in securities, as a result of changes in exchange rates and is stated separately in the Statement of Operations.
4 Securities transactions and investment income: Securities transactions are recorded on trade date for financial reporting purposes. Dividend income is recorded on the ex-dividend date or, for certain foreign dividends, as soon as the Fund becomes aware of the dividends. Non-cash dividends included in dividend income, if any, are recorded at the fair market value of the securities received. Interest income, including accretion of original issue discount, where applicable, and accretion of discount on short-term investments, if any, is recorded on the accrual basis. Realized gains and losses from securities transactions and foreign currency transactions, if any, are recorded on the basis of identified cost and stated separately in the Statement of Operations. Included in net realized gain (loss) on investments are proceeds from the settlements of class action litigation in which the Fund participated as a class member. The amount of such proceeds for the year ended December 31, 2010 was $43,002.
5 Income tax information: The Funds are treated as separate entities for U.S. federal income tax purposes. It is the policy of the Fund to continue to qualify as a regulated investment company by complying with the requirements of the U.S. Internal Revenue Code applicable to regulated investment companies and to distribute substantially all of its earnings to its shareholders. To the extent the Fund distributes substantially all of its earnings to shareholders, no federal income or excise tax provision is required.
The Fund has adopted the provisions of ASC 740 "Income Taxes" ("ASC 740"). ASC 740 sets forth a minimum threshold for financial statement recognition of a tax position taken, or expected to be taken, in a tax return. The Fund recognizes interest and penalties, if any, related to unrecognized tax positions as an income tax expense in the Statement of Operations. The Fund is subject to examination by U.S. federal and state tax authorities for returns filed for the prior three fiscal years 2007 - 2009. As of December 31, 2010, the Fund did not have any unrecognized tax positions.
13
Income distributions and capital gain distributions are determined in accordance with income tax regulations, which may differ from U.S. generally accepted accounting principles. These differences are primarily due to differing treatments of income and gains on various investment securities held by the Fund, timing differences and differing characterization of distributions made by the Fund as a whole. The Fund may also utilize earnings and profits distributed to shareholders on redemption of shares as a part of the dividends paid deduction for income tax purposes.
As determined on December 31, 2010, permanent differences resulting primarily from different book and tax accounting for foreign currency gains and losses were reclassified at fiscal year-end. These reclassifications had no effect on net income, NAV or NAV per share of the Fund.
The tax character of distributions paid during the years ended December 31, 2010 and December 31, 2009 was as follows:
| | | Distributions Paid From: | | | |
| Ordinary Income | | Long-Term Gains | | Total | |
| 2010 | | 2009 | | 2010 | | 2009 | | 2010 | | 2009 | |
| $ | 283,439 | | | $ | 764,651 | | | $ | -- | | | $ | -- | | | $ | 283,439 | | | $ | 764,651 | | |
As of December 31, 2010, the components of distributable earnings (accumulated losses) on a U.S. federal income tax basis were as follows:
Undistributed
Ordinary
Income | | Undistributed
Long-Term
Gain | | Unrealized
Appreciation
(Depreciation) | | Loss
Carryforwards
and Deferrals | | Total | |
| $ | 334,878 | | | $ | -- | | | $ | 22,092,064 | | | $ | (4,212,110 | ) | | $ | 18,214,832 | | |
The difference between book basis and tax basis distributable earnings is attributable primarily to timing differences of wash sales and capital loss carryforwards.
To the extent the Fund's net realized capital gains, if any, can be offset by capital loss carryforwards, it is the policy of the Fund not to distribute such gains. Under current tax law, the use of these losses to offset future gains may be limited. As determined at December 31, 2010, the Fund had unused capital loss carryforwards available for federal income tax purposes to offset net realized capital gains, if any, as follows:
| | | Expiring in: | |
| | | 2017 | |
| | | $ | 4,212,110 | | |
During the year ended December 31, 2010, the Fund utilized capital loss carryforwards of $7,500,163.
6 Distributions to shareholders: The Fund may earn income, net of expenses, daily on its investments. Distributions from net investment income and net realized capital gains, if any, generally are distributed once a year (usually in October). Income distributions and capital gain distributions to shareholders are recorded on the ex-date.
7 Foreign taxes: Foreign taxes withheld represent amounts withheld by foreign tax authorities, net of refunds recoverable.
8 Expense allocation: Certain expenses are applicable to multiple funds. Expenses directly attributable to a Series are charged to that Series. Expenses of the Trust that are not directly attributable to a particular series of the Trust (e.g., the Fund) are allocated among the series of the Trust, on the basis of relative net assets, except where a more appropriate allocation of expenses to each of the series can otherwise be made fairly. Expenses borne by the complex of related investment companies, which includes open-end and closed-end investment companies for which Management serves as investment manager, that are not directly attributable to a particular investment company in the complex (e.g., the Trust) or series thereof are allocated among the investment companies in the complex or series thereof, on the basis of relative net assets, except where a more appropriate allocation of expenses to each investment company in the complex or series thereof can otherwise be made fairly. The Fund's expenses
14
(other than those specific to each class) are allocated proportionally each day between the classes based upon the relative net assets of each class.
9 Security lending: A third party, eSecLending, has assisted the Fund in conducting a bidding process to try to identify a principal that would pay a guaranteed amount to the Fund in consideration of the Fund entering into an exclusive securities lending arrangement. During the fiscal year, eSecLending served as exclusive lending agent for the Fund. As a result of a bidding process on October 1, 2009, no principal had an exclusive securities lending arrangement with the Fund during the fiscal year; as such, the Fund was not guaranteed any particular level of income during the fiscal year. As of August 27, 2010, the Fund no longer participates in a securities lending program.
Under the securities lending arrangement, the Fund received cash collateral at the beginning of each transaction equal to at least 102% of the prior day's market value of the loaned securities (105% in the case of international securities). The Fund invested all the cash collateral in Neuberger Berman Securities Lending Quality Fund, LLC ("Quality Fund"), a fund managed by Neuberger Berman Fixed Income LLC ("NBFI"), an affiliate of Management, and sub-advised by Dwight Asset Management Company LLC. Quality Fund was not a money market fund registered under the 1940 Act and did not operate in accordance with all requirements of Rule 2a-7 under the 1940 Act. The Fund redeemed all of its investments in Quality Fund, if any, as of August 27, 2010.
Net income from the lending program represents any amounts received from a principal, plus income earned on the cash collateral invested in Quality Fund or in other investments, if applicable, less cash collateral fees and other expenses associated with the loans. For the fiscal year ended December 31, 2010, the Fund did not receive net income under the securities lending arrangement.
10 Investments in foreign securities: Investing in foreign securities may involve certain sovereign and other risks, in addition to the credit and market risks normally associated with domestic securities. These additional risks include the possibility of adverse political and economic developments (including political instability, nationalization, expropriation, or confiscatory taxation) and the potentially adverse effects of unavailability of public information regarding issuers, less government supervision and regulation of financial markets, reduced liquidity of certain financial markets, and the lack of uniform accounting, auditing, and financial reporting standards or the application of standards that are different or less stringent than those applied in the United States. Foreign securities also may experience greater price volatility, higher rates of inflation, and delays in settlement.
11 Indemnifications: Like many other companies, the Trust's organizational documents provide that its officers and trustees are indemnified against certain liabilities arising out of the performance of their duties to the Trust. In addition, both in some of its principal service contracts and in the normal course of its business, the Trust enters into contracts that provide indemnifications to other parties for certain types of losses or liabilities. The Trust's maximum exposure under these arrangements is unknown as this could involve future claims against the Trust.
12 Other: All net investment income and realized and unrealized capital gains and losses of the Fund are allocated, on the basis of relative net assets, pro rata among its respective classes.
Note B--Management Fees, Administration Fees, Distribution Arrangements, and Other Transactions with Affiliates:
Fund shares are issued and redeemed in connection with investments in and payments under certain variable annuity contracts and variable life insurance policies issued through separate accounts of life insurance companies and are also offered directly to qualified pension and retirement plans.
The Fund retains Management as its investment manager under a Management Agreement. For such investment management services, the Fund pays Management a fee at the annual rate of 0.55% of the first $250 million of the Fund's average daily net assets, 0.525% of the next $250 million, 0.50% of the next $250 million, 0.475% of the
15
next $250 million, 0.45% of the next $500 million, 0.425% of the next $2.5 billion, and 0.40% of average daily net assets in excess of $4 billion.
The Fund retains Management as its administrator under an Administration Agreement. Each class pays Management an administration fee at the annual rate of 0.30% of its average daily net assets under this agreement. Additionally, Management retains State Street Bank and Trust Company ("State Street") as its sub-administrator under a Sub-Administration Agreement. Management pays State Street a fee for all services received under this agreement.
The Board adopted a non-fee distribution plan for the Fund's Class I.
For the Fund's Class S, Management acts as agent in arranging for the sale of class shares without commission and bears advertising and promotion expenses. The Board has adopted a distribution plan (the "Plan") with respect to this class, pursuant to Rule 12b-1 under the 1940 Act. The Plan provides that, as compensation for administrative and other services provided to this class, Management's activities and expenses related to the sale and distribution of this class of shares, and ongoing services provided to investors in this class, Management receives from this class a fee at the annual rate of 0.25% of Class S's average daily net assets. Management receives this amount to provide distribution and shareholder servicing for this class and pays a portion of it to institutions that provide such services. Those institutions may use the payments for, among other purposes, compensating employees engaged in sales and/or shareholder servicing. The amount of fees paid by this class during any year could have been more or less than the cost of distribution and other services provided to this class. FINRA rules limit the amount of annual distribution fees that may be paid by a mutual fund and impose a ceiling on the cumulative distribution fees paid. The Trust's Plan complies with those rules.
Management has contractually undertaken to forgo current payment of fees and/or reimburse the Fund's Class I and Class S shares for their operating expenses (excluding fees payable to Management (including fees payable to Management with respect to the Fund's Class S shares), but excluding interest, taxes, brokerage commissions, extraordinary expenses, and transaction costs) ("Operating Expenses") which exceed the expense limitation as detailed in the following table:
| | | Expense Limitation(1) | | Expiration | | Reimbursement from
Management for the
Year Ended
December 31, 2010 | |
| Class I | | | 1.00 | % | | 12/31/13 | | $ | -- | | |
| Class S | | | 1.25 | % | | 12/31/13 | | | 91,992 | | |
(1) Expense limitation per annum of the respective class' average daily net assets.
Each respective class has agreed to repay Management through December 31, 2016 for fees and expenses foregone and/or its excess Operating Expenses previously reimbursed by Management, so long as its annual Operating Expenses during that period do not exceed its expense limitation, and the repayment is made within three years after the year in which Management issued the reimbursement or waived fees. During the year ended December 31, 2010, there was no repayment to Management under its contractual expense limitation. At December 31, 2010, the Fund's Class I shares had no contingent liability to Management under its contractual expense limitation. At December 31, 2010, the Fund's Class S shares contingent liabilities to Management under its contractual expense limitation were as follows:
| | | Expiring in: | | | |
| | | 2011 | | 2012 | | 2013 | | Total | |
| Class S | | $ | 10,820 | | | $ | 79,295 | | | $ | 91,992 | | | $ | 182,107 | | |
16
Neuberger Berman LLC ("Neuberger") is retained by Management to furnish it with investment recommendations and research information without added cost to the Fund. Several individuals who are officers and/or trustees of the Trust are also employees of Neuberger and/or Management.
On May 4, 2009, NBSH Acquisition, LLC ("NBSH"), an entity organized by key members of senior management of Neuberger Berman Group LLC ("NBG") and its consolidated subsidiaries (NBG, and together with its consolidated subsidiaries "NB Group") acquired a majority interest in the business conducted by Management and Neuberger, as well as the fixed income and certain alternative asset management businesses of Lehman Brothers Holdings Inc.'s Investment Management Division (together with Management and Neuberger, the "Acquired Businesses") (the "Acquisition"). Prior to that date, Neuberger and the predecessor in interest of Management were indirect wholly owned subsidiaries of Lehman Brothers Holdings Inc. ("LBHI"). On September 15, 2008, LBHI filed a voluntary petition under Chapter 11 of the U.S. Bankruptcy Code, and on December 22, 2008, the bankruptcy court having jurisdiction over the LBHI matter approved the sale of the Acquired Businesses to NBSH (or its successor or assign).
Through NBSH, portfolio managers, NB Group's management team, and certain of its key employees and senior professionals now indirectly own 52% of the voting equity of NBG. LBHI and certain affiliates of LBHI own the remaining 48% of NBG's voting equity. The closing of the Acquisition resulted in an "assignment" of the Fund's Management Agreement and Sub-Advisory Agreement. Such an assignment, by law, automatically terminated those agreements. Accordingly, prior to the closing, the Board, including the Trustees who are not "interested persons" of the Fund's investment manager and its affiliates or the Fund, considered and approved a new Management Agreement and Sub-Advisory Agreement for the Fund. The new agreements, which are virtually identical to those previously in effect, were also approved by a vote of the Fund's shareholders.
These events did not have a material impact on the Fund or its operations. Management and Neuberger continue to operate in the ordinary course of business as the investment manager and sub-adviser of the Fund.
Other non-affiliated service provider: The Fund has an expense offset arrangement in connection with its custodian contract. For the year ended December 31, 2010, the impact of this arrangement was a reduction of expenses of $12.
Note C--Securities Transactions:
During the year ended December 31, 2010, there were purchase and sale transactions (excluding short-term securities) of $28,997,022 and $37,034,645, respectively.
During the year ended December 31, 2010, no brokerage commissions on securities transactions were paid to affiliated brokers.
Note D--Fund Share Transactions:
Share activity for the years ended December 31, 2010 and December 31, 2009 was as follows:
For the Year Ended December 31, 2010
| | | Shares Sold | | Shares Issued on
Reinvestment of
Dividends and
Distributions | | Shares
Redeemed | | Total | |
| Class I | | | 259,281 | | | | 3,309 | | | | (315,796 | ) | | | (53,206 | ) | |
| Class S | | | 136,987 | | | | 13,105 | | | | (564,453 | ) | | | (414,361 | ) | |
17
For the Year Ended December 31, 2009
| | | Shares Sold | | Shares Issued on
Reinvestment of
Dividends and
Distributions | | Shares
Redeemed | | Total | |
| Class I | | | 478,419 | | | | 9,215 | | | | (5,010,166 | ) | | | (4,522,532 | ) | |
| Class S | | | 947,072 | | | | 40,455 | | | | (409,938 | ) | | | 577,589 | | |
Note E--Line of Credit:
At December 31, 2010, the Fund was a participant in a single committed, unsecured $200,000,000 ($150,000,000 prior to September 17, 2010) line of credit with State Street, to be used only for temporary or emergency purposes. Other investment companies managed by Management also participate in this line of credit on the same terms. Interest is charged on borrowings under this line of credit at the higher of (a) the Federal Funds Rate plus 1.25% per annum or (b) the Overnight LIBOR Rate plus 1.25% per annum. A commitment fee of 0.125% (0.15% prior to September 17, 2010) per annum of the available line of credit is charged, of which each participating Fund has agreed to pay its pro rata share, based on the ratio of its individual net assets to the net assets of all participants at the time the fee is due and payable. The fee is paid quarterly in arrears. Because several mutual funds participate, there is no assurance that an individual Fund will have access to all or any part of the $200,000,000 ($150,000,000 prior to September 17, 2010) at any particular time. There were no loans outstanding pursuant to this line of credit at December 31, 2010. During the year ended December 31, 2010, the Fund did not utilize this line of credit.
18
Financial Highlights
Guardian Portfolio
The following tables include selected data for a share outstanding throughout each year and other performance information derived from the Financial Statements.
| Class I | |
| | | Year Ended December 31, | |
| | | 2010 | | 2009 | | 2008 | | 2007 | | 2006 | |
| Net Asset Value, Beginning of Year | | $ | 15.98 | | | $ | 12.45 | | | $ | 21.11 | | | $ | 19.71 | | | $ | 17.50 | | |
| Income From Investment Operations: | |
| Net Investment Income (Loss)t | | | .08 | | | | .05 | | | | .12 | | | | .11 | | | | .05 | | |
Net Gains or Losses on Securities
(both realized and unrealized) | | | 2.95 | | | | 3.64 | | | | (7.97 | ) | | | 1.35 | | | | 2.29 | | |
| Total From Investment Operations | | | 3.03 | | | | 3.69 | | | | (7.85 | ) | | | 1.46 | | | | 2.34 | | |
| Less Distributions From: | |
| Net Investment Income | | | (.07 | ) | | | (.16 | ) | | | (.10 | ) | | | (.06 | ) | | | (.13 | ) | |
| Net Capital Gains | | | -- | | | | -- | | | | (.71 | ) | | | -- | | | | -- | | |
| Total Distributions | | | (.07 | ) | | | (.16 | ) | | | (.81 | ) | | | (.06 | ) | | | (.13 | ) | |
| Net Asset Value, End of Year | | $ | 18.94 | | | $ | 15.98 | | | $ | 12.45 | | | $ | 21.11 | | | $ | 19.71 | | |
| Total Returntt | | | 19.01 | % | | | 29.69 | % | | | (37.24 | )% | | | 7.39 | % | | | 13.38 | % | |
| Ratios/Supplemental Data | |
| Net Assets, End of Year (in millions) | | $ | 15.3 | | | $ | 13.7 | | | $ | 67.0 | | | $ | 129.1 | | | $ | 155.0 | | |
| Ratio of Gross Expenses to Average Net Assets# | | | 1.13 | % | | | 1.10 | % | | | 1.01 | % | | | .99 | % | | | .99 | % | |
| Ratio of Net Expenses to Average Net Assets | | | 1.13 | % | | | 1.10 | %S | | | 1.01 | %S | | | .99 | %S | | | .99 | %S | |
Ratio of Net Investment Income (Loss) to Average
Net Assets | | | .50 | % | | | .39 | % | | | .65 | % | | | .55 | % | | | .29 | % | |
| Portfolio Turnover Rate | | | 35 | % | | | 30 | % | | | 32 | % | | | 38 | % | | | 23 | % | |
See Notes to Financial Highlights
19
Financial Highlights (cont'd)
| Class S | |
| | | Year Ended December 31, | |
| | | 2010 | | 2009 | | 2008 | | 2007 | | 2006 | |
| Net Asset Value, Beginning of Year | | $ | 15.89 | | | $ | 12.38 | | | $ | 21.02 | | | $ | 19.67 | | | $ | 17.52 | | |
| Income From Investment Operations: | |
| Net Investment Income (Loss)t | | | .06 | | | | .02 | | | | .08 | | | | .09 | | | | .02 | | |
Net Gains or Losses on Securities
(both realized and unrealized) | | | 2.94 | | | | 3.63 | | | | (7.92 | ) | | | 1.32 | | | | 2.26 | | |
| Total From Investment Operations | | | 3.00 | | | | 3.65 | | | | (7.84 | ) | | | 1.41 | | | | 2.28 | | |
| Less Distributions From: | |
| Net Investment Income | | | (.05 | ) | | | (.14 | ) | | | (.09 | ) | | | (.06 | ) | | | (.13 | ) | |
| Net Capital Gains | | | -- | | | | -- | | | | (.71 | ) | | | -- | | | | -- | | |
| Total Distributions | | | (.05 | ) | | | (.14 | ) | | | (.80 | ) | | | (.06 | ) | | | (.13 | ) | |
| Net Asset Value, End of Year | | $ | 18.84 | | | $ | 15.89 | | | $ | 12.38 | | | $ | 21.02 | | | $ | 19.67 | | |
| Total Returntt | | | 18.94 | % | | | 29.50 | % | | | (37.36 | )% | | | 7.14 | % | | | 13.02 | % | |
| Ratios/Supplemental Data | |
| Net Assets, End of Year (in millions) | | $ | 77.0 | | | $ | 71.6 | | | $ | 48.6 | | | $ | 32.5 | | | $ | 1.5 | | |
| Ratio of Gross Expenses to Average Net Assets# | | | 1.25 | % | | | 1.25 | % | | | 1.25 | % | | | 1.24 | % | | | 1.25 | % | |
| Ratio of Net Expenses to Average Net AssetsS | | | 1.25 | % | | | 1.25 | % | | | 1.25 | % | | | 1.24 | % | | | 1.25 | % | |
Ratio of Net Investment Income (Loss) to Average
Net Assets | | | .37 | % | | | .16 | % | | | .48 | % | | | .42 | % | | | .11 | % | |
| Portfolio Turnover Rate | | | 35 | % | | | 30 | % | | | 32 | % | | | 38 | % | | | 23 | % | |
See Notes to Financial Highlights
20
Notes to Financial Highlights Guardian Portfolio
tt Total return based on per share NAV reflects the effects of changes in NAV on the performance of the Fund during each fiscal period and assumes income dividends and other distributions, if any, were reinvested. Results represent past performance and do not guarantee future results. Current returns may be lower or higher than the performance data quoted. Investment returns and principal may fluctuate and shares when redeemed may be worth more or less than original cost. Total return would have been lower if Management had not reimbursed and/or waived certain expenses. Total return would have been higher if Management had not recouped previously reimbursed expenses. The total return information shown does not reflect charges and other expenses that apply to the separate account or the related insurance policies, and the inclusion of these charges and other expenses would reduce the total return for all fiscal periods shown.
# The Fund is required to calculate an expense ratio without taking into consideration any expense reductions related to expense offset arrangements.
S After reimbursement of expenses and/or waiver of a portion of the investment management fee by Management. Had Management not undertaken such actions, the annualized ratios of net expenses to average daily net assets would have been:
| | | Year Ended December 31, | |
| | | 2010 | | 2009 | | 2008 | | 2007 | | 2006 | |
| Guardian Portfolio Class I | | | -- | | | | 1.10 | % | | | 1.01 | % | | | .99 | % | | | .99 | % | |
| Guardian Portfolio Class S | | | 1.38 | % | | | 1.38 | % | | | 1.27 | % | | | 1.24 | % | | | 1.25 | % | |
After reimbursement of expenses previously paid by Management and/or waiver of a portion of the investment management fee by Management. Had the Fund not made such reimbursements or Management not undertaken such actions, the annualized ratio of net expenses to average daily net assets would have been:
| | | Year Ended
December 31,
2007 | |
| Guardian Portfolio Class S | | | 1.24 | % | |
t Calculated based on the average number of shares outstanding during each fiscal period.
21
Report of Independent Registered Public Accounting Firm
To the Board of Trustees of
Neuberger Berman Advisers Management Trust and
Shareholders of Guardian Portfolio
We have audited the accompanying statement of assets and liabilities, including the schedule of investments, of Guardian Portfolio, one of the series constituting Neuberger Berman Advisers Management Trust (the "Trust"), as of December 31, 2010, and the related statement of operations for the year then ended, the statements of changes in net assets for each of the two years in the period then ended, and the financial highlights for each of the five years in the period then ended. These financial statements and financial highlights are the responsibility of the Trust's management. Our responsibility is to express an opinion on these financial statements and financial highlights based on our audits.
We conducted our audits in accordance with the standards of the Public Company Accounting Oversight Board (United States). Those standards require that we plan and perform the audit to obtain reasonable assurance about whether the financial statements and financial highlights are free of material misstatement. We were not engaged to perform an audit of the Trust's internal control over financial reporting. Our audits included consideration of internal control over financial reporting as a basis for designing audit procedures that are appropriate in the circumstances, but not for the purpose of expressing an opinion on the effectiveness of the Trust's internal control over financial reporting. Accordingly, we express no such opinion. An audit also includes examining, on a test basis, evidence supporting the amounts and disclosures in the financial statements and financial highlights, assessing the accounting principles used and significant estimates made by management, and evaluating the overall financial statement presentation. Our procedures included confirmation of securities owned as of December 31, 2010 by correspondence with the custodian and brokers or by other appropriate auditing procedures where replies from brokers were not received. We believe that our audits provide a reasonable basis for our opinion.
In our opinion, the financial statements and financial highlights referred to above present fairly, in all material respects, the financial position of Guardian Portfolio, a series of Neuberger Berman Advisers Management Trust, at December 31, 2010, the results of its operations for the year then ended, the changes in its net assets for each of the two years in the period then ended, and the financial highlights for each of the five years in the period then ended, in conformity with U.S. generally accepted accounting principles.

Boston, Massachusetts
February 10, 2011
22
Trustee and Officer Information
The following tables set forth information concerning the trustees and officers of the Trust. All persons named as trustees and officers also serve in similar capacities for other funds administered or managed by Management, Neuberger and NBFI. The Statement of Additional Information includes additional information about trustees and is available upon request, without charge, by calling (800) 877-9700.
Information about the Board of Trustees
Name, (Year of Birth),
and Address(1) | | Position and
Length of
Time Served(2) | | Principal Occupation(s)(3) | | Number of
Funds in Fund
Complex
Overseen by
Trustee | | Other Directorships
Held Outside Fund
Complex by Trustee | |
| Independent Trustees | |
|
| John Cannon (1930) | | Trustee since 2000 | | Consultant; formerly, Chairman, CDC Investment Advisers (registered investment adviser), 1993 to January 1999; formerly, President and Chief Executive Officer, AMA Investment Advisors, an affiliate of the American Medical Association. | | | 43 | | | Formerly, Independent Trustee or Director of three series of Oppenheimer Funds: Oppenheimer Limited Term New York Municipal Fund, Rochester Fund Municipals, and Oppenheimer Convertible Securities Fund, 1992 to 2009. | |
|
| Faith Colish (1935) | | Trustee since 1982 | | Counsel, Carter Ledyard & Milburn LLP (law firm) since October 2002; formerly, Attorney-at-Law and President, Faith Colish, A Professional Corporation, 1980 to 2002. | | | 43 | | | Formerly, Director, 1997 to 2003, and Advisory Director, 2003 to 2006; ABA Retirement Funds (formerly, American Bar Retirement Association) (not-for-profit membership corporation). | |
|
23
Name, (Year of Birth),
and Address(1) | | Position and
Length of
Time Served(2) | | Principal Occupation(s)(3) | | Number of
Funds in Fund
Complex
Overseen by
Trustee | | Other Directorships
Held Outside Fund
Complex by Trustee | |
| Martha C. Goss (1949) | | Trustee since 2007 | | President, Woodhill Enterprises Inc./Chase Hollow Associates LLC (personal investment vehicle), since 2006; Chief Operating and Financial Officer, Hopewell Holdings LLC/Amwell Holdings, LLC (a holding company for a healthcare reinsurance company start-up), since 2003; formerly, Consultant, Resources Connection (temporary staffing), 2002 to 2006. | | | 43 | | | Director, Ocwen Financial Corporation (mortgage servicing), since 2005; Director, American Water (water utility), since 2003; Director, Channel Reinsurance (financial guaranty reinsurance), since 2006; Director, Allianz Life of New York (insurance), since 2005; Director, Financial Women's Association of New York (not-for-profit association), since 2003; Trustee Emerita, Brown University, since 1998; formerly, Advisory Board Member, Attensity (software developer), 2005 to 2007; formerly, Director, Bank Leumi (commercial bank), 2005 to 2007; formerly, Director, Claire's Stores, Inc. (retailer), 2005 to 2007. | |
|
| C. Anne Harvey (1937) | | Trustee since 1998 | | President, C.A. Harvey Associates, since October 2001; formerly, Director, AARP, 1978 to December 2001. | | | 43 | | | Formerly, President, Board of Associates to The National Rehabilitation Hospital's Board of Directors, 2001 to 2002; formerly, Member, Individual Investors Advisory Committee to the New York Stock Exchange Board of Directors, 1998 to 2002. | |
|
24
Name, (Year of Birth),
and Address(1) | | Position and
Length of
Time Served(2) | | Principal Occupation(s)(3) | | Number of
Funds in Fund
Complex
Overseen by
Trustee | | Other Directorships
Held Outside Fund
Complex by Trustee | |
| Robert A. Kavesh (1927) | | Trustee since 2000 | | Retired; Marcus Nadler Professor Emeritus of Finance and Economics, New York University Stern School of Business; formerly, Executive Secretary-Treasurer, American Finance Association, 1961 to 1979. | | | 43 | | | Formerly, Director, The Caring Community (not-for-profit), 1997 to 2006; formerly, Director, DEL Laboratories, Inc. (cosmetics and pharmaceuticals), 1978 to 2004; formerly, Director, Apple Bank for Savings, 1979 to 1990; formerly, Director, Western Pacific Industries, Inc., (public company), 1972 to 1986. | |
|
| Michael M. Knetter (1960) | | Trustee since 2007 | | President and Chief Executive Officer, University of Wisconsin Foundation, October 2010 to Present; formerly, Dean, School of Business, University of Wisconsin - Madison; formerly, Professor of International Economics and Associate Dean, Amos Tuck School of Business - Dartmouth College, 1998 to 2002. | | | 43 | | | Director, American Family Insurance (a mutual company, not publicly traded), since March 2009; Trustee, Northwestern Mutual Series Fund, Inc., since February 2007; Director, Wausau Paper, since 2005; formerly, Director, Great Wolf Resorts, 2004 to 2009. | |
|
| Howard A. Mileaf (1937) | | Trustee since 1999 | | Retired; formerly, Vice President and General Counsel, WHX Corporation (holding company), 1993 to 2001. | | | 43 | | | Formerly, Director, Webfinancial Corporation (holding company), 2002 to 2008; formerly, Director, WHX Corporation (holding company), 2002 to 2005; formerly, Director, State Theatre of New Jersey (not-for-profit theatre), 2000 to 2005. | |
|
| George W. Morriss (1947) | | Trustee since 2007 | | Retired; formerly, Executive Vice President and Chief Financial Officer, People's Bank, Connecticut (a financial services company), 1991 to 2001. | | | 43 | | | Manager, Old Mutual Funds of Hedge Funds fund complex (consisting of six funds), since 2006 for four funds and since 2007 for two funds; formerly, Member NASDAQ Issuers' Affairs Committee, 1995 to 2003. | |
|
25
Name, (Year of Birth),
and Address(1) | | Position and
Length of
Time Served(2) | | Principal Occupation(s)(3) | | Number of
Funds in Fund
Complex
Overseen by
Trustee | | Other Directorships
Held Outside Fund
Complex by Trustee | |
| Edward I. O'Brien (1928) | | Trustee since 2000 | | Retired; formerly, Member, Investment Policy Committee, Edward Jones, 1993 to 2001; President, Securities Industry Association ("SIA") (securities industry's representative in government relations and regulatory matters at the federal and state levels), 1974 to 1992; Adviser to SIA, November 1992 to November 1993. | | | 43 | | | Formerly, Director, Legg Mason, Inc. (financial services holding company), 1993 to July 2008; formerly, Director, Boston Financial Group (real estate and tax shelters), 1993 to 1999. | |
|
| Cornelius T. Ryan (1931) | | Trustee since 2000 | | General Partner and Adviser, TD2, TD3, and TOF1 Healthcare Venture Capital Partnerships; Founding General Partner, Oxford Partners and Oxford Bioscience Partners (venture capital investing) and President, Oxford Venture Corporation, since 1981. | | | 43 | | | Trustee, Norwalk Hospital Foundation, since 2000; Director, Supply Pro (privately held company), since 2008; formerly, Trustee, Norwalk Hospital, 1995 to 2004; formerly, President and Director, Randolph Computer Corp., 1966 to 1984; formerly, Director of numerous privately held portfolio companies of Oxford Partners and Oxford Bioscience Partners, 1981 to 2005. | |
|
| Tom D. Seip (1950) | | Trustee since 2000; Chairman of the Board since 2008; Lead Independent Trustee from 2006 to 2008 | | General Partner, Seip Investments LP (a private investment partnership); formerly, President and CEO, Westaff, Inc. (temporary staffing), May 2001 to January 2002; formerly, Senior Executive, The Charles Schwab Corporation, 1983 to 1998, including Chief Executive Officer, Charles Schwab Investment Management, Inc.; Trustee, Schwab Family of Funds and Schwab Investments, 1997 to 1998; and Executive Vice President-Retail Brokerage, Charles Schwab & Co., Inc., 1994 to 1997. | | | 43 | | | Director, H&R Block, Inc. (financial services company), since May 2001; Chairman, Compensation Committee, H&R Block, Inc., since 2006; formerly, Director, Forward Management, Inc. (asset management company), 1999 to 2006. | |
|
26
Name, (Year of Birth),
and Address(1) | | Position and
Length of
Time Served(2) | | Principal Occupation(s)(3) | | Number of
Funds in Fund
Complex
Overseen by
Trustee | | Other Directorships
Held Outside Fund
Complex by Trustee | |
| Candace L. Straight (1947) | | Trustee since 1999 | | Private investor and consultant specializing in the insurance industry; formerly, Advisory Director, Securitas Capital LLC (a global private equity investment firm dedicated to making investments in the insurance sector), 1998 to December 2003. | | | 43 | | | Director, Montpelier Re Holdings Ltd. (reinsurance company), since 2006; formerly, Director, National Atlantic Holdings Corporation (property and casualty insurance company), 2004 to 2008; formerly, Director, The Proformance Insurance Company (property and casualty insurance company), 2004 to 2008; formerly, Director, Providence Washington Insurance Company (property and casualty insurance company), 1998 to 2006; formerly, Director, Summit Global Partners (insurance brokerage firm), 2000 to 2005. | |
|
| Peter P. Trapp (1944) | | Trustee since 1984 | | Retired; formerly, Regional Manager for Mid-Southern Region, Ford Motor Credit Company, September 1997 to 2007; formerly, President, Ford Life Insurance Company, April 1995 to August 1997. | | | 43 | | | None. | |
|
27
Name, (Year of Birth),
and Address(1) | | Position and
Length of
Time Served(2) | | Principal Occupation(s)(3) | | Number of
Funds in Fund
Complex
Overseen by
Trustee | | Other Directorships
Held Outside Fund
Complex by Trustee | |
| Trustees who are "Interested Persons" | |
|
| Joseph V. Amato* (1962) | | Trustee since 2009 | | President and Director, Neuberger Berman Group LLC, since 2009; President and Chief Executive Officer, Neuberger and Neuberger Berman Holdings LLC (including its predecessor, Neuberger Berman Inc.), since 2007; Chief Investment Officer, Neuberger, since 2009; Chief Investment Officer (Equities) and Managing Director, Management, since 2009; Managing Director, NBFI, since 2007; Board member of NBFI since 2006; formerly, Global Head of Asset Management of LBHI's Investment Management Division, 2006 to 2009; formerly, member of LBHI's Investment Management Division's Executive Management Committee, 2006 to 2009; formerly, Managing Director, Lehman Brothers Inc. ("LBI"), 2006 to 2008; formerly, Chief Recruiting and Development Officer, LBI, 2005 to 2006; formerly, Global Head of LBI's Equity Sales and a Member of its Equities Division Executive Committee, 2003 to 2005. | | | 43 | | | Member of Board of Advisors, McDonough School of Business, Georgetown University, since 2001; Member of New York City Board of Advisors, Teach for America, since 2005; Trustee, Montclair Kimberley Academy (private school), since 2007. | |
|
28
Name, (Year of Birth),
and Address(1) | | Position and
Length of
Time Served(2) | | Principal Occupation(s)(3) | | Number of
Funds in Fund
Complex
Overseen by
Trustee | | Other Directorships
Held Outside Fund
Complex by Trustee | |
| Robert Conti* (1956) | | Chief Executive Officer, President and Trustee since 2008; prior thereto, Executive Vice President in 2008 and Vice President, 2000 to 2008 | | Managing Director, Neuberger, since 2007; formerly, Senior Vice President, Neuberger, 2003 to 2006; formerly, Vice President, Neuberger, 1999 to 2003; President and Chief Executive Officer, Management, since 2008; formerly, Senior Vice President, Management, 2000 to 2008. | | | 43 | | | Chairman of the Board, Staten Island Mental Health Society since 2008. | |
|
| Jack L. Rivkin* (1940) | | Trustee since 2002; President, 2002 to 2008 | | Formerly, Executive Vice President and Chief Investment Officer, Neuberger Berman Holdings LLC (holding company), 2002 to August 2008 and 2003 to August 2008, respectively; formerly, Managing Director and Chief Investment Officer, Neuberger, December 2005 to August 2008 and 2003 to August 2008, respectively; formerly, Executive Vice President, Neuberger, December 2002 to 2005; formerly, Director and Chairman, Management, December 2002 to August 2008; formerly, Executive Vice President, Citigroup Investments, Inc., September 1995 to February 2002; formerly, Executive Vice President, Citigroup Inc., September 1995 to February 2002. | | | 43 | | | Director, Idealab (private company), since 2009; Director, Distributed World Power (private company), since 2009; Director, Dale Carnegie and Associates, Inc. (private company), since 1999; Director, Solbright, Inc. (private company), since 1998; Director, SA Agricultural Fund, since 2009; Chairman and Director, Essential Brands (consumer products) since 2008; formerly, Director, New York Society of Security Analysts, 2006 to 2008. | |
|
(1) The business address of each listed person is 605 Third Avenue, New York, New York 10158.
(2) Pursuant to the Trust's Trust Instrument, each of these Trustees shall hold office for life or until his or her successor is elected or the Trust terminates; except that (a) any Trustee may resign by delivering a written resignation; (b) any Trustee may be removed with or without cause at any time by a written instrument signed by at least two-thirds of the other Trustees; (c) any Trustee who requests to be retired, or who has become unable to serve, may be retired by a written instrument signed by a majority of the other Trustees; and (d) any Trustee may be removed at any shareholder meeting by a vote of at least two-thirds of the outstanding shares.
29
(3) Except as otherwise indicated, each individual has held the positions shown for at least the last five years.
* Indicates a Trustee who is an "interested person" within the meaning of the 1940 Act. Mr. Amato and Mr. Conti are interested persons of the Trust by virtue of the fact that each is an officer of Management, Neuberger and/or their affiliates. Mr. Rivkin may be deemed an interested person of the Trust by virtue of the fact that, until August 2008, he was a director of Management and an officer of Neuberger.
30
Information about the Officers of the Trust
Name, (Year of Birth),
and Address(1) | | Position and
Length of Time
Served(2) | | Principal Occupation(s)(3) | |
| Andrew B. Allard (1961) | | Anti-Money Laundering Compliance Officer since 2002 | | Senior Vice President, Neuberger, since 2006; Deputy General Counsel, Neuberger, since 2004; formerly, Vice President, Neuberger, 2000 to 2005; Anti-Money Laundering Compliance Officer, nine registered investment companies for which Management acts as investment manager and administrator (six since 2002, one since 2003, one since 2005 and one since 2006). | |
|
| Claudia A. Brandon (1956) | | Executive Vice President since 2008 and Secretary since 1985 | | Senior Vice President, Neuberger, since 2007 and Employee since 1999; Senior Vice President, Management, since 2008 and Assistant Secretary since 2004; formerly, Vice President, Neuberger, 2002 to 2006; formerly, Vice President-Mutual Fund Board Relations, Management, 2000 to 2008; Executive Vice President, nine registered investment companies for which Management acts as investment manager and administrator (nine since 2008); Secretary, nine registered investment companies for which Management acts as investment manager and administrator (three since 1985, three since 2002, one since 2003, one since 2005 and one since 2006). | |
|
| Maxine L. Gerson (1950) | | Executive Vice President since 2008 and Chief Legal Officer since 2005 (only for purposes of sections 307 and 406 of the Sarbanes-Oxley Act of 2002) | | Managing Director, Neuberger, since 2009, and Deputy General Counsel and Assistant Secretary Neuberger since 2001; Managing Director, Management, since 2009, and Secretary and General Counsel, Management, since 2004; formerly, Senior Vice President, Neuberger, 2002 to 2009; formerly, Senior Vice President, Management, 2006 to 2009; Executive Vice President, nine registered investment companies for which Management acts as investment manager and administrator (nine since 2008); Chief Legal Officer (only for purposes of sections 307 and 406 of the Sarbanes-Oxley Act of 2002), nine registered investment companies for which Management acts as investment manager and administrator (eight since 2005 and one since 2006). | |
|
| Sheila R. James (1965) | | Assistant Secretary since 2002 | | Vice President, Neuberger, since 2008 and Employee since 1999; formerly, Assistant Vice President, Neuberger, 2007; Assistant Secretary, nine registered investment companies for which Management acts as investment manager and administrator (six since 2002, one since 2003, one since 2005 and one since 2006). | |
|
| Brian Kerrane (1969) | | Vice President since 2008 | | Senior Vice President, Neuberger, since 2006; formerly, Vice President, Neuberger, 2002 to 2006; Vice President, Management, since 2008 and Employee since 1991; Vice President, nine registered investment companies for which Management acts as investment manager and administrator (nine since 2008). | |
|
| Kevin Lyons (1955) | | Assistant Secretary since 2003 | | Assistant Vice President, Neuberger, since 2008 and Employee since 1999; Assistant Secretary, nine registered investment companies for which Management acts as investment manager and administrator (seven since 2003, one since 2005 and one since 2006). | |
|
31
Name, (Year of Birth),
and Address(1) | | Position and
Length of Time
Served(2) | | Principal Occupation(s)(3) | |
| Owen F. McEntee, Jr. (1961) | | Vice President since 2008 | | Vice President, Neuberger, since 2006; Employee, Management, since 1992; Vice President, nine registered investment companies for which Management acts as investment manager and administrator (nine since 2008). | |
|
| John M. McGovern (1970) | | Treasurer and Principal Financial and Accounting Officer since 2005 | | Senior Vice President, Neuberger, since 2007; formerly, Vice President, Neuberger, 2004 to 2006; Employee, Management, since 1993; Treasurer and Principal Financial and Accounting Officer, nine registered investment companies for which Management acts as investment manager and administrator (eight since 2005 and one since 2006); formerly, Assistant Treasurer, eight registered investment companies for which Management acts as investment manager and administrator, 2002 to 2005. | |
|
| Andrew Provencher (1965) | | Vice President since 2008 | | Managing Director, Management, since 2008; Managing Director, Neuberger, since 2005; formerly, Senior Vice President, Neuberger, 2003 to 2005; Vice President, nine registered investment companies for which Management acts as investment manager and administrator (nine since 2008). | |
|
| Frank Rosato (1971) | | Assistant Treasurer since 2005 | | Vice President, Neuberger, since 2006; Employee, Management, since 1995; Assistant Treasurer, nine registered investment companies for which Management acts as investment manager and administrator (eight since 2005 and one since 2006). | |
|
| Neil S. Siegel (1967) | | Vice President since 2008 | | Managing Director, Management, since 2008; Managing Director, Neuberger, since 2006; formerly, Senior Vice President, Neuberger, 2004 to 2006; Vice President, nine registered investment companies for which Management acts as investment manager and administrator (nine since 2008). | |
|
| Chamaine Williams (1971) | | Chief Compliance Officer since 2005 | | Senior Vice President, Neuberger, since 2007; Chief Compliance Officer, Management, since 2006; Chief Compliance Officer, nine registered investment companies for which Management acts as investment manager and administrator (eight since 2005 and one since 2006); formerly, Senior Vice President, LBI, 2007 to 2008; formerly, Vice President, LBI, 2003 to 2006; formerly, Chief Compliance Officer, Lehman Brothers Asset Management Inc., 2003 to 2007; formerly, Chief Compliance Officer, Lehman Brothers Alternative Investment Management LLC, 2003 to 2007. | |
|
(1) The business address of each listed person is 605 Third Avenue, New York, New York 10158.
(2) Pursuant to the By-Laws of the Trust, each officer elected by the Trustees shall hold office until his or her successor shall have been elected and qualified or until his or her earlier death, inability to serve, or resignation. Officers serve at the pleasure of the Trustees and may be removed at any time with or without cause.
(3) Except as otherwise indicated, each individual has held the positions shown for at least the last five years.
32
Proxy Voting Policies and Procedures
A description of the policies and procedures that the Trust uses to determine how to vote proxies relating to portfolio securities is available, without charge, by calling 1-800-877-9700 (toll-free) and on the website of the Securities and Exchange Commission, at www.sec.gov. Information regarding how the Trust voted proxies relating to portfolio securities during the most recent 12-month period ended June 30 is also available, without charge, by calling 1-800-877-9700 (toll-free), on the website of the Securities and Exchange Commission at www.sec.gov, and on Management's website at www.nb.com.
Quarterly Portfolio Schedule
The Trust files a complete schedule of portfolio holdings for the Fund with the Securities and Exchange Commission for the first and third quarters of each fiscal year on Form N-Q. The Trust's Forms N-Q are available on the Securities and Exchange Commission's website at www.sec.gov and may be reviewed and copied at the Securities and Exchange Commission's Public Reference Room in Washington, DC. Information on the operation of the Public Reference Room may be obtained by calling 1-800-SEC-0330. The information on Form N-Q is available upon request, without charge, by calling 1-800-877-9700 (toll free).
Notice to Shareholders (Unaudited)
100.00% of the dividends distributed during the fiscal year ended December 31, 2010 qualifies for the dividend received deduction for corporate shareholders.
Board Consideration of the Management and Sub-Advisory Agreements
At a meeting held on October 14, 2010, the Board, including the Trustees who are not "interested persons" of Management (including its affiliates) or Neuberger Berman Advisers Management Trust ("Independent Fund Trustees"), approved the continuance of the Management and Sub-Advisory Agreements ("Agreements") for the Fund.
In evaluating the Agreements, the Board, including the Independent Fund Trustees, reviewed materials furnished by Management and Neuberger in response to questions submitted by counsel for the Independent Fund Trustees, and met with senior representatives of Management and Neuberger regarding their personnel and operations. The Independent Fund Trustees were advised by counsel that is experienced in 1940 Act matters and that is independent of Management and Neuberger. The Independent Fund Trustees received a memorandum from independent counsel discussing the legal standards for their consideration of the proposed continuance of the Agreements. They met with such counsel separately from representatives of Management to discuss the annual contract review. The annual contract review extends over two regular meetings of the Board to ensure that Management and Neuberger have time to respond to any questions the Independent Fund Trustees may have on their initial review of the report and that the Independent Fund Trustees have time to consider those responses. In addition, during this process, the Board held a separate meeting devoted primarily to reviewing and discussing Fund performance.
The Board considered the following factors, among others, in connection with its approval of the continuance of the Agreements: (1) the nature, extent, and quality of the services provided by Management and Neuberger; (2) the performance of the Fund compared to a relevant market index and a peer group of investment companies; (3) the costs of the services provided and profits or losses realized by Management and its affiliates from their relationship with the Fund; (4) the extent to which economies of scale might be realized as the Fund grows; and (5) whether fee levels reflect any such potential economies of scale for the benefit of investors in the Fund. In their deliberations, the Board members did not identify any particular information that was all-important or controlling, and each Trustee may have attributed different weights to the various factors.
The Board evaluated the terms of the Agreements, the overall fairness of the Agreements to the Fund and whether the Agreements were in the best interests of the Fund and its shareholders.
33
With respect to the nature, extent and quality of the services provided, the Board considered the performance of the Fund and the experience and staffing of the portfolio management and investment research personnel of Management and Neuberger who perform services for the Fund. The Board noted that Management also provides certain administrative services, including fund accounting and compliance oversight. The Board also considered Management's and Neuberger's policies and practices regarding brokerage and the quality of brokerage execution obtained by Management. The Board's Portfolio Transactions and Pricing Committee from time to time reviewed the quality of the execution services that Management and Neuberger had provided, and periodically reviews studies by an independent firm engaged to review and evaluate the quality of brokerage execution received by the Fund. The Board also reviewed whether Management and Neuberger used brokers to execute Fund transactions that provide research and other services to Management and Neuberger, and the types of benefits potentially derived from such services by Management, Neuberger, the Fund and other clients of Management and Neuberger. In addition, the Board noted the positive compliance history of Management and Neuberger, as each firm has been free of significant reported compliance problems.
The Board considered the performance of the Fund relative to its benchmark and a peer group of investment companies dedicated to insurance products pursuing broadly similar strategies. The Board also considered performance in relation to certain measures of the degree of investment risk undertaken by the portfolio managers. The Board discussed the Fund's performance with Management and discussed steps that Management had taken, or intended to take, to improve the Fund's performance. The Board also considered Management's resources and responsiveness with respect to the Fund.
With respect to the overall fairness of the Agreements, the Board considered the fee structure for the Fund under the Agreements as compared to a peer group of comparable funds dedicated to insurance products and any fall-out benefits likely to accrue to Management or Neuberger or their affiliates from their relationship with the Fund. The Board also considered the profitability of Management and its affiliates from their association with the Fund.
The Board reviewed a comparison of the Fund's management fee and overall expense ratio to a peer group of broadly comparable funds dedicated to insurance products. The Board considered the mean and median of the management fees and expense ratios of the peer group. The Board noted that the Fund's management fee was higher than the peer group mean and/or median. The Board considered whether specific portfolio management or administration needs contributed to the management fee. With regard to the sub-advisory fee paid to Neuberger, the Board noted that this fee is "at cost." In addition, the Board considered the contractual limit on Fund expenses undertaken by Management.
The Board considered whether there were other funds that were advised or sub-advised by Management or its affiliates or separate accounts managed by Management or its affiliates with similar investment objectives, policies and strategies to the Fund. The Board noted that there were no comparable sub-advised funds or separate accounts. The Board compared the fees charged to the Fund to the fees charged to an advised fund managed in a similar style to the Fund. The Board considered the appropriateness and reasonableness of any differences between the fees charged to the Fund and the other fund and determined that the differences in fees were consistent with the management and other services provided.
The Board also evaluated any apparent or anticipated economies of scale in relation to the services Management provides to the Fund. The Board considered whether the Fund's fee structure provides for a reduction of payments resulting from the use of breakpoints and whether those breakpoints are set at appropriate asset levels.
The Board also considered changes in management, staffing, resources and operations accompanying the separation of the Neuberger Berman entities from the LBHI bankruptcy estate.
In concluding that the benefits accruing to Management and its affiliates by virtue of their relationship to the Fund were reasonable in comparison with the costs of providing the investment advisory services and the benefits accruing to the Fund, the Board reviewed specific data as to Management's profit on the Fund for a recent period and the trend in profit or loss over recent years. The Board also carefully examined Management's cost allocation methodology. The Board recognized that Management should be entitled to earn a reasonable level of profits for services it provides to the Fund and, based on its review, concluded that Management's level of profitability was not excessive.
34
Conclusions
In approving the Agreements, the Board concluded that the terms of each Agreement are fair and reasonable and that approval of the Agreements is in the best interests of the Fund and its shareholders. In reaching this determination, the Board considered that Management and Neuberger could be expected to provide a high level of service to the Fund; that it retained confidence in Management's and Neuberger's capabilities to manage the Fund; that the Fund's fee structure appeared to the Board to be reasonable given the nature and quality of services provided; and that the benefits accruing to Management and its affiliates by virtue of their relationship to the Fund were reasonable in comparison with the benefits accruing to the Fund.
35

Neuberger Berman
Advisers Management Trust
International Portfolio
S Class Shares
Annual Report
December 31, 2010
International Portfolio Manager's Commentary
The Neuberger Berman Advisers Management Trust (AMT) International Portfolio generated a positive return for full-year 2010 and outperformed its benchmark, the MSCI EAFE(R) Index.
The international equity market closed 2010 in positive territory, with the MSCI EAFE Index up by over 8%. While during the second and third quarters of 2010 there were periods of extreme volatility--the index saw a drop of over 19% in April and May on concerns over European sovereign debt, efforts in China to slow growth and curb inflation, and a slowing U.S. economy--the market subsequently saw significant advances on better-than-expected growth in each of those regions. For the year, the best performing sectors included Industrials, Consumer Discretionary and Materials. Utilities and Financials declined, and Energy and Health Care stocks were weak. From a country perspective, Sweden and Denmark reported the strongest results. Not surprisingly, the troubled "PIIGS" economies--Portugal, Ireland, Italy, Greece and Spain--were weakest for the year.
Within the Portfolio, stock, sector and country allocations, as well as market cap decisions, were advantageous to performance. In terms of country allocation, Canada's commodities-driven economy outperformed even the best EAFE markets for the year, as did Chile. Exposure to these areas was a benefit. As for market cap, we saw opportunity in smaller stocks, which significantly outperformed larger issues. While the MSCI EAFE was up 8.21% for the year, the MSCI EAFE Small Cap Index was up 22.40%.
The most significant benefits resulted from strong stock and sector selection. Guided by our Quality at a Reasonable Price (QuaRP) discipline, we added value to the Portfolio in seven of 10 industry sectors. Materials and Financials were standout areas, and Energy was also positive.
Within Materials, companies including Silver Wheaton, a Canadian silver streaming company with performance driven by both operational successes and continued strength in silver prices, Croda International, a U.K.-based global specialty chemical company in the personal care, health care and home care markets, and Arkema, a French specialty chemical company benefitting from analyst upgrades, were among top contributors.
In Financials, the Portfolio's underweight (relative to the benchmark) in European names was beneficial as the market worried about sovereign debt contagion. Kenedix, a high dividend yield, high cash flow Japanese Real Estate Investment Trust (JREIT), was among top contributors. JREITs generally benefitted in 2010 from an improvement in the fundamentals driving the real estate sector in Japan.
Within Energy, Canadian oil and gas firm Pacific Rubiales was a top contributor, with appreciation driven by continued exploration success. Fugro, a Dutch oil services company, was another. The elimination of BP from the portfolio before most of the decline from the Gulf of Mexico spill was another relative benefit.
While outperformers dwarfed disappointing sectors in 2010, the Portfolio experienced underperformance in three areas-Consumer Staples, Consumer Discretionary and Health Care. Within Consumer Staples, we sold PureCircle, a Malaysian company and leading manufacturer of a stevia-based sugar alternative, due to underperformance after the loss of a significant customer. In the strong Consumer Discretionary sector, our relative disadvantage was primarily the result of an underweight. Within Health Care, Ipsen, the French specialty pharmaceuticals company, declined due to the announced delay of a diabetes drug after clinical trial difficulties. Nobel Biocare, a Swiss dental implants firm, declined on consecutive earnings disappointments. Both companies, along with iSOFT, an Australia-based health care software company, were significant detractors and were eliminated from the Portfolio.
Looking ahead, despite concerns about global economic growth, we currently believe the outlook for individual companies is positive. Many balance sheets have been repaired to pre-crisis levels and cash flow generation is strong due to restrained investments. As a result, on both profit and cash flow-based valuation measures, international markets appear to be attractively valued in our opinion.
Within Europe, local concerns suggest a continued focus on global companies with emerging markets exposure. We have limited exposure to the economies we consider weakest. We remain underweighted in Japan, where we struggle to find
1
quality companies, and Australia, based on valuations. We have retained our emerging markets exposure despite the recent run. We continue to believe most emerging markets are reasonably valued considering their expected growth rates. As for China, we see select opportunities among domestically oriented companies. Considerable policy noise has put downward pressure on the market, and while some inflation-related risk is real, we think it has been overemphasized.
From a sector perspective, we were overweighted in Information Technology and Industrials, areas where we expected to see increased demand. Our largest underweight was in Financials, where in the U.S. we continued to see a risk to profits from increasing regulation and slow demand, and also in European financials due to sovereign debt issues.
Overall, we believe the most exciting opportunities are best identified through fundamental research. From our perspective, the likely winners will be companies offering a compelling product or service that will generate demand, pricing, earnings and cash flow.
Sincerely,

Benjamin Segal
Portfolio Manager
The risks involved in seeking capital appreciation from investments primarily in companies based outside the United States are set forth in the prospectus and statement of additional information.
Investing in foreign securities involves greater risks than investing in securities of U.S. issuers, including currency fluctuations, changes in local economic and political conditions, and the need to operate in less regulated financial markets. These risks are typically heightened for investments in emerging markets.
The composition, industries and holdings of the Portfolio are subject to change. In an attempt to reduce overall volatility, the AMT International Portfolio diversifies its holdings over a wide array of countries and individual stocks.
2
International Portfolio (Unaudited)
SECTOR ALLOCATION
| (% of Total Investments) | |
| Consumer Discretionary | | | 9.2 | % | |
| Consumer Staples | | | 10.4 | | |
| Energy | | | 9.7 | | |
| Financials | | | 15.6 | | |
| Health Care | | | 6.4 | | |
| Industrials | | | 16.9 | | |
| Information Technology | | | 8.2 | | |
| Materials | | | 13.5 | | |
| Telecommunication Services | | | 8.1 | | |
| Short-Term | | | 2.0 | | |
| Total | | | 100.0 | % | |
PERFORMANCE HIGHLIGHTS1
| | |
| | Average Annual Total Return
Ended 12/31/2010 | |
| | | Inception
Date | | 1 Year | | 5 Years | | Life of
Fund* | |
| International Portfolio Class S | | 04/29/2005 | | | 22.01 | % | | | 2.30 | % | | | 4.96 | % | |
| MSCI EAFE(R) Index2 | | | | | | | 8.21 | % | | | 2.94 | % | | | 5.48 | % | |
Performance data quoted represent past performance, which is no guarantee of future results. The investment return and principal value of an investment will fluctuate so that an investor's shares, when redeemed, may be worth more or less than their original cost. Results are shown on a "total return" basis and include reinvestment of all income dividends and distributions.
Current performance may be lower or higher than the performance data quoted. For performance data current to the most recent month end, please visit https://www.nb.com.
* Index returns are as of the inception date 04/29/2005.
As stated in the Portfolio's most recent prospectus, the total annual operating expense ratio for fiscal year 2009 was 2.01% for Class S shares (prior to any fee waivers or expense reimbursements). Neuberger Berman Management LLC has contractually agreed to limit certain expenses of the Portfolio through 12/31/2013.
COMPARISON OF A $10,000 INVESTMENT
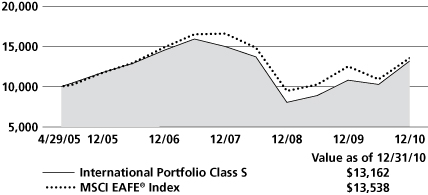
This chart shows the value of a hypothetical $10,000 investment in the Portfolio over the past 10 fiscal years, or since the Portfolio's inception, if it has not operated for 10 years. The result is compared with one or more benchmarks, which may include a broad-based market index and/or a narrower index. Please note that market indices have not been reduced to reflect any of the fees and costs of investing. All results include the reinvestment of income dividends and distributions. Neither the Portfolio's returns nor the market indices shown in the graph and table reflect the effect of taxes that an investor would pay on Portfolio distributions or on the redemption of Portfolio shares. Results represent past performance and do not indicate future results.
Please see Endnotes for additional information.
3
Endnotes
1 "Total Return" includes reinvestment of all income dividends and distributions. Results represent past performance and do not indicate future results. The value of an investment in the Portfolio and the return on the investment both will fluctuate, and redemption proceeds may be higher or lower than an investor's original cost. The performance information does not reflect fees and expenses of the variable annuity and variable life insurance policies or the qualified pension and retirement plans whose proceeds are invested in the Portfolio. Neuberger Berman Management LLC ("NBM LLC") has agreed to absorb certain expenses of the AMT Portfolios, including the Portfolio. Without this arrangement, which is subject to change, the total returns of the Portfolio may have been less.
2 The MSCI EAFE(R) Index (Europe, Australasia, Far East) is a free float-adjusted market capitalization index that is designed to measure the equity market performance of developed markets, excluding the U.S. & Canada. As of May 2010, the MSCI EAFE Index consisted of the following 22 developed market country indices: Australia, Austria, Belgium, Denmark, Finland, France, Germany, Greece, Hong Kong, Ireland, Israel, Italy, Japan, the Netherlands, New Zealand, Norway, Portugal, Singapore, Spain, Sweden, Switzerland and the United Kingdom. The index is translated into U.S. dollars. Please note that indices do not take into account any fees and expenses of investing in the individual securities that they track and that individuals cannot invest directly in any index. Data about the performance of this index is prepared or obtained by NBM LLC and include reinvestment of all income dividends and distributions. The Portfolio may invest in many securities not included in the above-described index or may not invest in all securities included in the above-described index.
Any ratios or other measurements using a factor of forecasted earnings of a company discussed herein are based on consensus estimates, not NBM LLC's own projections, and they may or may not be realized. In addition, any revision to a forecast could affect the market price of a security. By quoting them herein, NBM LLC does not offer an opinion as to the accuracy of and does not guarantee these forecasted numbers.
The investments for the Portfolio are managed by the same portfolio manager(s) who manage one or more other mutual funds that have similar names, investment objectives and investment styles as the Portfolio. You should be aware that the Portfolio is likely to differ from the other mutual funds in size, cash flow pattern and tax matters. Accordingly, the holdings and performance can be expected to vary from those of the other mutual funds.
The composition, industries and holdings of the Portfolio are subject to change.
Shares of the separate AMT Portfolios are not available to the general public. Shares of this Portfolio may be purchased only by life insurance companies to be used with their separate accounts that fund variable annuity and variable life insurance policies and by qualified pension and retirement plans.
Statistics and projections in this report are derived from sources deemed to be reliable but cannot be regarded as a representation of future results of the AMT Portfolios. This report is prepared for the general information of shareholders and is not an offer of shares of the AMT Portfolios. Shares of the AMT Portfolios are sold only through the currently effective prospectuses, which must precede or accompany this report.
The "Neuberger Berman" name and logo are registered service marks of Neuberger Berman Group LLC. "Neuberger Berman Management LLC" and the individual Fund names in this piece are either service marks or registered service marks of Neuberger Berman Management LLC.
(c) 2011 Neuberger Berman Management LLC distributor. All rights reserved.
4
Information About Your Fund's Expenses
This table is designed to provide information regarding costs related to your investments. All mutual funds incur operating expenses, which include management fees, fees for administrative services and costs of shareholder reports, among others. The following examples are based on an investment of $1,000 made at the beginning of the six month period ended December 31, 2010 and held for the entire period. The table illustrates the fund's costs in two ways:
| Actual Expenses and Performance: | | The first section of the table provides information about actual account values and actual expenses in dollars, based on the fund's actual performance during the period. You may use the information in this line, together with the amount you invested, to estimate the expenses you paid over the period. Simply divide your account value by $1,000 (for example, an $8,600 account value divided by $1,000 = 8.6), then multiply the result by the number in the first section of the table under the heading entitled "Expenses Paid During the Period" to estimate the expenses you paid over the period. | |
|
| Hypothetical Example for Comparison Purposes: | | The second section of the table provides information about hypothetical account values and hypothetical expenses based on the fund's actual expense ratio and an assumed rate of return at 5% per year before expenses. This return is not the fund's actual return. The hypothetical account values and expenses may not be used to estimate the actual ending account balance or expenses you paid for the period. You may use this information to compare the ongoing costs of investing in this fund versus other funds. To do so, compare the expenses shown in this 5% hypothetical example with the 5% hypothetical examples that appear in the shareholder reports of other funds. | |
|
Please note that the expenses in the table are meant to highlight your ongoing costs only. The table and expense example do not include any transaction costs, such as fees and expenses that are, or may be, imposed under your variable contract or qualified pension plan. Therefore, the information under the heading "Hypothetical (5% annual return before expenses)" is useful in comparing ongoing costs only, and will not help you determine the relative total costs of owning different funds. In addition, if these transaction costs were included, your costs would have been higher.
Expense Information as of 12/31/10 (Unaudited)
NEUBERGER BERMAN ADVISERS MANAGEMENT TRUST INTERNATIONAL PORTFOLIO
| Actual | | Beginning Account
Value
7/1/10 | | Ending Account
Value
12/31/10 | | Expenses Paid During
the Period*
7/1/10 - 12/31/10 | |
| Class S | | $ | 1,000.00 | | | $ | 1,283.60 | | | $ | 8.69 | | |
| Hypothetical (5% annual return before expenses)** | |
| Class S | | $ | 1,000.00 | | | $ | 1,017.59 | | | $ | 7.68 | | |
* Expenses are equal to the annualized expense ratio of 1.51%, multiplied by the average account value over the period, multiplied by 184/365 (to reflect the one-half year period shown).
** Hypothetical 5% annual return before expenses is calculated by multiplying the number of days in the most recent half year divided by 365.
5
Schedule of Investments International Portfolio
| NUMBER OF SHARES | | | | VALUEt | |
| Common Stocks (97.7%) | | | |
| Australia (1.4%) | | | |
| | 83,600 | | | Centamin Egypt | | $ | 233,740 | * | |
| | 17,700 | | | Whitehaven Coal | | | 121,656 | | |
| | | | 355,396 | | |
| Austria (0.7%) | | | |
| | 3,320 | | | Vienna Insurance Group Wiener
Staedtische Versicherung | | | 172,558 | | |
| Belgium (2.9%) | | | |
| | 2,684 | | | Anheuser-Busch InBev | | | 153,508 | | |
| | 3,775 | | | Colruyt SA | | | 191,944 | | |
| | 1,455 | | | Omega Pharma | | | 69,801 | | |
| | 7,875 | | | Telenet Group Holding | | | 310,229 | | |
| | | | 725,482 | | |
| Brazil (2.5%) | | | |
| | 10,100 | | | Banco Santander Brasil ADR | | | 137,360 | | |
| | 18,100 | | | Porto Seguro | | | 308,572 | | |
| | 1,740 | | | TOTVS SA | | | 177,145 | | |
| | | | 623,077 | | |
| Canada (8.2%) | | | |
| | 20,000 | | | Bankers Petroleum | | | 152,871 | * | |
| | 10,902 | | | Corus Entertainment, B Shares | | | 242,863 | | |
| | 13,200 | | | Eldorado Gold | | | 245,600 | | |
| | 7,083 | | | MacDonald, Dettwiler | | | 360,241 | * | |
| | 25,500 | | | Neo Material Technologies | | | 201,066 | * | |
| | 12,700 | | | Pacific Rubiales Energy | | | 431,082 | | |
| | 10,300 | | | Silver Wheaton | | | 403,796 | * | |
| | | | 2,037,519 | | |
| Chile (1.4%) | | | |
| | 5,710 | | | Sociedad Quimica y Minera de
Chile ADR, B Shares | | | 333,578 | | |
| China (2.5%) | | | |
| | 488,000 | | | Bank of China, H Shares | | | 258,038 | | |
| | 302,500 | | | China Liansu Group Holdings | | | 243,236 | * | |
| | 87,000 | | | China Vanke, B Shares | | | 107,452 | | |
| | | | 608,726 | | |
| Denmark (1.9%) | | | |
| | 2,375 | | | Novo Nordisk Class B | | | 267,813 | | |
| | 4,541 | | | Tryg A/S | | | 209,627 | | |
| | | | 477,440 | | |
| France (6.5%) | | | |
| | 76,810 | | | Alcatel-Lucent | | | 223,758 | * | |
| | 3,710 | | | Arkema | | | 267,070 | | |
| NUMBER OF SHARES | | | | VALUEt | |
| | 3,474 | | | BNP Paribas | | $ | 221,020 | | |
| | 1,600 | | | Cie Generale des Etablissements
Michelin Class B | | | 114,815 | | |
| | 8,523 | | | CNP Assurances | | | 153,812 | | |
| | 6,855 | | | Eutelsat Communications | | | 250,902 | | |
| | 5,559 | | | Sodexo | | | 383,087 | | |
| | | | 1,614,464 | | |
| Germany (5.1%) | | | |
| | 4,206 | | | Deutsche Boerse | | | 291,141 | | |
| | 3,720 | | | Fresenius Medical Care | | | 214,898 | | |
| | 1,792 | | | Linde AG | | | 271,912 | | |
| | 1,195 | | | SMA Solar Technology | | | 110,983 | | |
| | 13,965 | | | Tognum AG | | | 368,097 | | |
| | | | 1,257,031 | | |
| Hong Kong (2.2%) | | | |
| | 4,550 | | | China Mobile ADR | | | 225,771 | | |
| | 88,000 | | | CNOOC Ltd. | | | 209,901 | | |
| | 23,000 | | | Kerry Properties | | | 119,249 | | |
| | | | 554,921 | | |
| Ireland (1.0%) | | | |
| | 8,172 | | | DCC PLC | | | 256,060 | | |
| Israel (0.6%) | | | |
| | 2,900 | | | Teva Pharmaceutical
Industries ADR | | | 151,177 | | |
| Japan (12.8%) | | | |
| | 18,700 | | | Brother Industries | | | 277,310 | | |
| | 12,300 | | | Circle K Sunkus | | | 197,400 | | |
| | 37,400 | | | GMO Internet | | | 187,944 | | |
| | 364 | | | Jupiter Telecommunications | | | 382,875 | | |
| | 50 | | | KDDI Corp. | | | 288,829 | | |
| | 61 | | | Kenedix Realty Investment | | | 286,630 | | |
| | 5,500 | | | Makita Corp. | | | 224,904 | | |
| | 9,900 | | | Nifco Inc. | | | 268,382 | | |
| | 12,600 | | | Nihon Kohden | | | 271,585 | | |
| | 24,500 | | | Nippon Electric Glass | | | 353,664 | | |
| | 3,800 | | | Sankyo Co. | | | 214,595 | | |
| | 7,900 | | | Sundrug Co. | | | 230,413 | | |
| | | | 3,184,531 | | |
| Korea (0.9%) | | | |
| | 535 | | | Samsung Electronics GDR | | | 225,717 | n | |
| Netherlands (10.5%) | | | |
| | 4,770 | | | Akzo Nobel | | | 296,302 | | |
| | 4,336 | | | Fugro NV | | | 356,343 | | |
| | 21,895 | | | Koninklijke Ahold | | | 288,955 | | |
| | 5,269 | | | Nutreco Holding | | | 399,856 | | |
| | 8,431 | | | Sligro Food Group | | | 261,435 | | |
| | 11,655 | | | TNT NV | | | 307,598 | | |
See Notes to Schedule of Investments
6
| NUMBER OF SHARES | | | | VALUEt | |
| | 14,918 | | | Unilever NV | | $ | 464,484 | | |
| | 11,575 | | | USG People | | | 235,109 | * | |
| | | | 2,610,082 | | |
| Norway (2.4%) | | | |
| | 24,101 | | | DnB NOR | | | 338,279 | | |
| | 30,769 | | | Prosafe ASA | | | 244,673 | | |
| | | | 582,952 | | |
| South Africa (1.2%) | | | |
| | 14,711 | | | MTN Group | | | 300,183 | | |
| Sweden (1.5%) | | | |
| | 3,725 | | | Elekta AB, B Shares | | | 143,336 | | |
| | 7,330 | | | Svenska Handelsbanken,
A Shares | | | 234,211 | | |
| | | | 377,547 | | |
| Switzerland (9.2%) | | | |
| | 1,438 | | | Bucher Industries | | | 268,683 | | |
| | 5,274 | | | Credit Suisse Group | | | 212,483 | | |
| | 248 | | | Givaudan SA | | | 267,628 | | |
| | 6,654 | | | Nestle SA | | | 389,633 | | |
| | 1,932 | | | Roche Holding | | | 283,084 | | |
| | 202 | | | SGS SA | | | 338,971 | | |
| | 3,415 | | | Sulzer AG | | | 520,468 | | |
| | | | 2,280,950 | | |
| United Kingdom (22.3%) | | | |
| | 50,838 | | | Amlin PLC | | | 324,100 | | |
| | 10,867 | | | Antofagasta PLC | | | 273,117 | | |
| | 12,595 | | | Avanti Communications Group | | | 133,138 | * | |
| | 9,415 | | | BG Group | | | 190,239 | | |
| | 44,565 | | | Cairn Energy | | | 291,821 | * | |
| | 8,955 | | | Chemring Group | | | 405,449 | | |
| | 11,179 | | | Croda International | | | 281,655 | | |
| | 33,455 | | | Experian Group | | | 416,234 | | |
| | 5,071 | | | Fidessa Group | | | 122,546 | | |
| | 22,189 | | | HSBC Holdings | | | 227,520 | | |
| | 28,001 | | | Informa PLC | | | 177,900 | | |
| | 10,800 | | | Jazztel PLC | | | 51,234 | n* | |
| | 41,630 | | | Jazztel PLC | | | 197,487 | * | |
| | 55,695 | | | Mitie Group | | | 203,365 | | |
| | 28,521 | | | Reed Elsevier | | | 240,789 | | |
| | 3,600 | | | Rio Tinto ADR | | | 257,976 | | |
| | 60,594 | | | RPS Group | | | 217,664 | | |
| | 16,127 | | | Smith & Nephew | | | 170,096 | | |
| | 8,600 | | | Subsea 7 | | | 223,878 | * | |
| | 1,100 | | | Synergy Health | | | 15,049 | | |
| | 9,160 | | | Travis Perkins | | | 151,097 | | |
| | 9,420 | | | Tullow Oil | | | 185,199 | | |
| | 196,775 | | | Vodafone Group | | | 508,661 | | |
| | 7,400 | | | Willis Group Holdings | | | 256,262 | | |
| | | | 5,522,476 | | |
| | | | | Total Common Stocks
(Cost $20,469,009) | | | 24,251,867 | | |
| NUMBER OF SHARES | | | | VALUEt | |
| Rights (0.0%) | | | |
| Belgium (0.0%) | | | |
| | 77,560 | | | Ageas VVPR Strip | | $ | 104 | * | |
| | 112,269 | | | Anheuser-Busch InBev
VVPR Strip | | | 600 | * | |
| | | | | Total Rights
(Cost $43) | | | 704 | | |
| Warrants (0.0%) | | | |
| Italy (0.0%) | | | |
| | 124,793 | | | UBI Banca (Cost $0) | | | 534 | * | |
| Short-Term Investments (2.0%) | | | |
| | 488,025 | | | State Street Institutional Liquid
Reserves Fund Institutional Class
(Cost $488,025) | | | 488,025 | | |
| | | | | Total Investments (99.7%)
(Cost $20,957,077) | | | 24,741,130 | ## | |
| | | | | Cash, receivables and other assets,
less liabilities (0.3%) | | | 85,596 | | |
| | | | | Total Net Assets (100.0%) | | $ | 24,826,726 | | |
See Notes to Schedule of Investments
7
SUMMARY SCHEDULE OF INVESTMENTS BY INDUSTRY INTERNATIONAL PORTFOLIO
| Industry | | Valuet | | Percentage of
Net Assets | |
| Chemicals | | $ | 1,919,211 | | | | 7.7 | % | |
| Oil, Gas & Consumable Fuels | | | 1,582,769 | | | | 6.4 | % | |
| Insurance | | | 1,425,035 | | | | 5.7 | % | |
| Commercial Banks | | | 1,416,962 | | | | 5.7 | % | |
| Metals & Mining | | | 1,414,229 | | | | 5.7 | % | |
| Wireless Telecommunication Services | | | 1,323,444 | | | | 5.3 | % | |
| Media | | | 1,295,329 | | | | 5.2 | % | |
| Food Products | | | 1,253,973 | | | | 5.1 | % | |
| Food & Staples Retailing | | | 1,170,147 | | | | 4.7 | % | |
| Machinery | | | 1,014,055 | | | | 4.1 | % | |
| Professional Services | | | 990,314 | | | | 4.0 | % | |
| Energy Equipment & Services | | | 824,894 | | | | 3.3 | % | |
| Pharmaceuticals | | | 702,074 | | | | 2.8 | % | |
| Diversified Telecommunication Services | | | 692,088 | | | | 2.8 | % | |
| Software | | | 659,932 | | | | 2.7 | % | |
| Health Care Equipment & Supplies | | | 654,818 | | | | 2.6 | % | |
| Commercial Services & Supplies | | | 421,029 | | | | 1.7 | % | |
| Aerospace & Defense | | | 405,449 | | | | 1.6 | % | |
| Auto Components | | | 383,197 | | | | 1.5 | % | |
| Hotels, Restaurants & Leisure | | | 383,087 | | | | 1.5 | % | |
| Electrical Equipment | | | 368,097 | | | | 1.5 | % | |
| Electronic Equipment, Instruments & Components | | | 353,664 | | | | 1.4 | % | |
| Semiconductors & Semiconductor Equipment | | | 336,700 | | | | 1.4 | % | |
| Air Freight & Logistics | | | 307,598 | | | | 1.3 | % | |
| Diversified Financial Services | | | 291,141 | | | | 1.2 | % | |
| Real Estate Investment Trusts | | | 286,630 | | | | 1.2 | % | |
| Office Electronics | | | 277,310 | | | | 1.1 | % | |
| Industrial Conglomerates | | | 256,060 | | | | 1.0 | % | |
| Building Products | | | 243,236 | | | | 1.0 | % | |
| Health Care Providers & Services | | | 229,947 | | | | 0.9 | % | |
| Real Estate Management & Development | | | 226,701 | | | | 0.9 | % | |
| Communications Equipment | | | 223,758 | | | | 0.9 | % | |
| Leisure Equipment & Products | | | 214,595 | | | | 0.9 | % | |
| Capital Markets | | | 212,483 | | | | 0.9 | % | |
| Internet Software & Services | | | 187,944 | | | | 0.8 | % | |
| Beverages | | | 154,108 | | | | 0.6 | % | |
| Trading Companies & Distributors | | | 151,097 | | | | 0.6 | % | |
| Short-Term Investments and Other Assets-Net | | | 573,621 | | | | 2.3 | % | |
| | | $ | 24,826,726 | | | | 100.0 | % | |
See Notes to Schedule of Investments
8
Notes to Schedule of Investments International Portfolio
t In accordance with Accounting Standards Codification ("ASC") 820 "Fair Value Measurements and Disclosures" ("ASC 820"), all investments held by Neuberger Berman Advisers Management Trust International Portfolio (the "Fund") are carried at the value that Neuberger Berman Management LLC ("Management") believes the Fund would receive upon selling the investment in an orderly transaction to an independent buyer in the principal or most advantageous market for the investment under current market conditions. Various inputs, including the volume and level of activity for the asset or liability in the market, are considered in valuing the Fund's investments, some of which are discussed below. Significant management judgment may be necessary to value investments in accordance with ASC 820.
ASC 820 established a three-tier hierarchy of inputs to create a classification of value measurements for disclosure purposes. The three-tier hierarchy of inputs is summarized in the three broad Levels listed below.
. Level 1 - quoted prices in active markets for identical investments
. Level 2 - other significant observable inputs (including quoted prices for similar investments, interest rates, prepayment speeds, credit risk, amortized cost, etc.)
. Level 3 - significant unobservable inputs (including the Fund's own assumptions in determining the fair value of investments)
The inputs or methodology used for valuing an investment are not necessarily an indication of the risk associated with investing in those securities.
The value of the Fund's investments in equity securities, for which market quotations are readily available, is generally determined by Management by obtaining valuations from an independent pricing service based on the latest sale price quoted in active markets (Level 1 inputs). Securities traded primarily on the NASDAQ Stock Market are normally valued by the Fund at the NASDAQ Official Closing Price ("NOCP") provided by NASDAQ each business day. The NOCP is the most recently reported price as of 4:00:02 p.m., Eastern time, unless that price is outside the range of the "inside" bid and asked prices (i.e., the bid and asked prices that dealers quote to each other when trading for their own accounts); in that case, NASDAQ will adjust the price to equal the inside bid or asked price, whichever is closer. Because of delays in reporting trades, the NOCP may not be based on the price of the last trade to occur before the market closes. If there is no reported sale of a security on a particular day, the independent pricing service may value the security based on reported market quotations.
Management has developed a process to periodically review information provided by independent pricing services for all types of securities.
Investments in State Street Institutional Liquid Reserves Fund Institutional Class are valued using the fund's daily calculated net asset value ("NAV").
For equity securities, if a valuation is not available from an independent pricing service, or if Management has reason to believe that the valuation received does not represent the amount the Fund might reasonably expect to receive on a current sale in an orderly transaction, the Fund seeks to obtain quotations from principal market makers (generally considered Level 3 inputs). If such quotations are not readily available, the security is valued using methods the Board of Trustees of Neuberger Berman Advisers Management Trust (the "Board") has approved on the belief that they reflect fair value. Numerous factors may be considered when determining the fair value of a security based on Level 2 or 3 inputs, including available analyst, media or other reports, trading in futures or ADRs and whether the issuer of the security being fair valued has other securities outstanding.
The value of the Fund's investments in foreign securities is generally determined using the same valuation methods and inputs as other Fund investments, as discussed above. Foreign security prices are expressed in local currency values and are translated from the local currency into U.S. dollars using the exchange rates as of 4:00 p.m., Eastern time. The Board has approved the use of Interactive Data Pricing and Reference Data, Inc. ("Interactive") to assist in determining the fair value of foreign equity securities when changes in the value of a certain index suggest that
See Notes to Financial Statements
9
Notes to Schedule of Investments International Portfolio (cont'd)
the closing prices on the foreign exchanges may no longer represent the amount that the Fund could expect to receive for those securities. In this event, Interactive will provide adjusted prices for certain foreign equity securities using a statistical analysis of historical correlations of multiple factors (Level 2 inputs). In the absence of precise information about the market values of these foreign securities as of the close of the New York Stock Exchange, the Board has determined on the basis of available data that prices adjusted in this way are likely to be closer to the prices the Fund could realize on a current sale than are the prices of those securities established at the close of the foreign markets in which the securities primarily trade. These fair value prices are necessarily estimates, and there is no assurance that such a price will be at or close to the price at which the security is next quoted or next trades.
The following is a summary, categorized by Level, of inputs used to value the Fund's investments as of December 31, 2010:
| Asset Valuation Inputs | | Level 1 | | Level 2 | | Level 3 | | Total | |
| Investments: | |
| Common Stocks^ | | $ | 24,251,867 | | | $ | -- | | | $ | -- | | | $ | 24,251,867 | | |
| Rights^ | | | 704 | | | | -- | | | | -- | | | | 704 | | |
| Warrants^ | | | 534 | | | | -- | | | | -- | | | | 534 | | |
| Short-Term Investments | | | -- | | | | 488,025 | | | | -- | | | | 488,025 | | |
| Total Investments | | $ | 24,253,105 | | | $ | 488,025 | | | $ | -- | | | $ | 24,741,130 | | |
^ The Schedule of Investments and Summary Schedule of Investments by Industry provide information on the country and industry categorization for the portfolio.
The Fund had no significant transfers between Levels 1 and 2 during the year ended December 31, 2010.
## At December 31, 2010, the cost of investments for U.S. federal income tax purposes was $21,946,754. Gross unrealized appreciation of investments was $3,081,648 and gross unrealized depreciation of investments was $287,272, resulting in net unrealized appreciation of $2,794,376 based on cost for U.S. federal income tax purposes.
n Restricted security subject to restrictions on resale under federal securities laws. These securities may be resold in transactions exempt from registration, normally to qualified institutional buyers under Rule 144A under the Securities Act of 1933, as amended, and have been deemed by the investment manager to be liquid. At December 31, 2010, these securities amounted to $276,951 or 1.1% of net assets for the Fund.
* Security did not produce income during the last twelve months.
See Notes to Financial Statements
10
Statement of Assets and Liabilities
Neuberger Berman Advisers Management Trust
| | | INTERNATIONAL
PORTFOLIO | |
| | | December 31, 2010 | |
| Assets | |
| Investments in securities, at value * (Notes A & F)--see Schedule of Investments: | |
| Unaffiliated issuers | | $ | 24,741,130 | | |
| Dividends and interest receivable | | | 264,395 | | |
| Receivable for securities sold | | | 12,906 | | |
| Receivable for Fund shares sold | | | 1 | | |
| Receivable from Management--net (Note B) | | | 9,832 | | |
| Prepaid expenses and other assets | | | 4,302 | | |
| Total Assets | | | 25,032,566 | | |
| Liabilities | |
| Due to custodian | | | 1,667 | | |
| Payable for securities purchased | | | 5,819 | | |
| Payable for Fund shares redeemed | | | 124,368 | | |
| Payable to investment manager (Notes A & B) | | | 17,582 | | |
| Accrued expenses and other payables | | | 56,404 | | |
| Total Liabilities | | | 205,840 | | |
| Net Assets at value | | $ | 24,826,726 | | |
| Net Assets consist of: | |
| Paid-in capital | | $ | 154,122,073 | | |
| Undistributed net investment income (loss) | | | 1,333,733 | | |
| Accumulated net realized gains (losses) on investments | | | (134,442,595 | ) | |
| Net unrealized appreciation (depreciation) in value of investments | | | 3,813,515 | | |
| Net Assets at value | | $ | 24,826,726 | | |
| Shares Outstanding ($.001 par value; unlimited shares authorized) | | | 2,401,215 | | |
| Net Asset Value, offering and redemption price per share | | $ | 10.34 | | |
| *Cost of Investments: | |
| Unaffiliated issuers | | $ | 20,957,077 | | |
See Notes to Financial Statements
11
Statement of Operations
Neuberger Berman Advisers Management Trust
| | | INTERNATIONAL
PORTFOLIO | |
| | | For the
Year Ended
December 31, 2010 | |
| Investment Income: | |
| Income (Note A): | |
| Dividend income-unaffiliated issuers | | $ | 4,634,424 | | |
| Interest income-unaffiliated issuers | | | 10,462 | | |
| Income from securities loaned-net (Note F) | | | 121,789 | | |
| Foreign taxes withheld | | | (431,637 | ) | |
| Total income | | $ | 4,335,038 | | |
| Expenses: | |
| Investment management fees (Notes A & B) | | | 1,253,989 | | |
| Administration fees (Note B) | | | 445,481 | | |
| Distribution fees (Note B) | | | 371,235 | | |
| Audit fees | | | 40,900 | | |
| Custodian fees (Note B) | | | 145,834 | | |
| Insurance expense | | | 15,410 | | |
| Legal fees | | | 76,692 | | |
| Shareholder reports | | | 15,021 | | |
| Trustees' fees and expenses | | | 52,347 | | |
| Miscellaneous | | | 31,426 | | |
| Total expenses | | | 2,448,335 | | |
| Expenses reimbursed by Management (Note B) | | | (217,800 | ) | |
| Expenses reduced by custodian fee expense offset arrangement (Note B) | | | (22 | ) | |
| Total net expenses | | | 2,230,513 | | |
| Net investment income (loss) | | $ | 2,104,525 | | |
| Realized and Unrealized Gain (Loss) on Investments (Note A) | |
| Net realized gain (loss) on: | |
| Sales of investment securities of unaffiliated issuers | | | 38,990,416 | | |
| Sales of investment securities of affiliated issuers | | | 4,146 | | |
| Foreign currency | | | (934,873 | ) | |
| Change in net unrealized appreciation (depreciation) in value of: | |
| Unaffiliated investment securities | | | (51,922,344 | ) | |
| Foreign currency | | | 35,158 | | |
| Net gain (loss) on investments | | | (13,827,497 | ) | |
| Net increase (decrease) in net assets resulting from operations | | $ | (11,722,972 | ) | |
See Notes to Financial Statements
12
Statements of Changes in Net Assets
Neuberger Berman Advisers Management Trust
| | | INTERNATIONAL PORTFOLIO | |
| | | Year Ended
December 31,
2010 | | Year Ended
December 31,
2009 | |
| Increase (Decrease) in Net Assets: | |
| From Operations (Note A): | |
| Net investment income (loss) | | $ | 2,104,525 | | | $ | 3,139,595 | | |
| Net realized gain (loss) on investments | | | 38,059,689 | | | | (28,647,693 | ) | |
| Net increase from payments by affiliates (Note B) | | | -- | | | | 31,690 | | |
| Change in net unrealized appreciation (depreciation) of investments | | | (51,887,186 | ) | | | 112,382,195 | | |
| Net increase (decrease) in net assets resulting from operations | | | (11,722,972 | ) | | | 86,905,787 | | |
| Distributions to Shareholders From (Note A): | |
| Net investment income | | | (2,679,376 | ) | | | (10,084,277 | ) | |
| From Fund Share Transactions (Note D): | |
| Proceeds from shares sold | | | 14,509,693 | | | | 56,338,583 | | |
| Proceeds from reinvestment of dividends and distributions | | | 2,679,376 | | | | 10,084,277 | | |
| Payments for shares redeemed | | | (308,068,821 | ) | | | (60,070,670 | ) | |
| Redemption fees retained | | | 711 | | | | 828 | | |
| Net increase (decrease) from Fund share transactions | | | (290,879,041 | ) | | | 6,353,018 | | |
| Net Increase (Decrease) in Net Assets | | | (305,281,389 | ) | | | 83,174,528 | | |
| Net Assets: | |
| Beginning of year | | | 330,108,115 | | | | 246,933,587 | | |
| End of year | | $ | 24,826,726 | | | $ | 330,108,115 | | |
| Undistributed net investment income (loss) at end of year | | $ | 1,333,733 | | | $ | 2,640,484 | | |
See Notes to Financial Statements
13
Notes to Financial Statements International Portfolio
Note A--Summary of Significant Accounting Policies:
1 General: The Fund is a separate operating series of Neuberger Berman Advisers Management Trust (the "Trust"), a Delaware statutory trust organized pursuant to a Trust Instrument dated May 23, 1994. The Trust is currently comprised of ten separate operating series (each individually a "Series," and collectively the "Funds") each of which is diversified. The Trust is registered as an open-end management investment company under the Investment Company Act of 1940, as amended (the "1940 Act"), and its shares are registered under the Securities Act of 1933, as amended. The Fund currently offers only Class S shares. The Board may establish additional series or classes of shares without the approval of shareholders.
The assets of each Series belong only to that Series, and the liabilities of each Series are borne solely by that Series and no other.
The preparation of financial statements in accordance with U.S. generally accepted accounting principles requires Management to make estimates and assumptions at the date of the financial statements. Actual results could differ from those estimates.
2 Portfolio valuation: Investment securities are valued as indicated in the notes following the Schedule of Investments.
3 Foreign currency translation: The accounting records of the Fund are maintained in U.S. dollars. Foreign currency amounts are translated into U.S. dollars using the exchange rates as of 4:00 p.m., Eastern time, to determine the value of investments, other assets and liabilities. Purchase and sale prices of securities, and income and expenses, are translated into U.S. dollars at the prevailing rate of exchange on the respective dates of such transactions. Net unrealized foreign currency gain (loss), if any, arises from changes in the value of assets and liabilities, other than investments in securities, as a result of changes in exchange rates and is stated separately in the Statement of Operations.
4 Securities transactions and investment income: Securities transactions are recorded on trade date for financial reporting purposes. Dividend income is recorded on the ex-dividend date or, for certain foreign dividends, as soon as the Fund becomes aware of the dividends. Non-cash dividends included in dividend income, if any, are recorded at the fair market value of the securities received. Interest income, including accretion of original issue discount, where applicable, and accretion of discount on short-term investments, if any, is recorded on the accrual basis. Realized gains and losses from securities transactions and foreign currency transactions, if any, are recorded on the basis of identified cost and stated separately in the Statement of Operations.
5 Income tax information: The Funds are treated as separate entities for U.S. federal income tax purposes. It is the policy of the Fund to continue to qualify as a regulated investment company by complying with the requirements of the U.S. Internal Revenue Code applicable to regulated investment companies and to distribute substantially all of its earnings to its shareholders. To the extent the Fund distributes substantially all of its earnings to shareholders, no federal income or excise tax provision is required.
The Fund has adopted the provisions of ASC 740 "Income Taxes" ("ASC 740"). ASC 740 sets forth a minimum threshold for financial statement recognition of a tax position taken, or expected to be taken, in a tax return. The Fund recognizes interest and penalties, if any, related to unrecognized tax positions as an income tax expense in the Statement of Operations. The Fund is subject to examination by U.S. federal and state tax authorities for returns filed for the prior three fiscal years 2007 - 2009. As of December 31, 2010, the Fund did not have any unrecognized tax positions.
Income distributions and capital gain distributions are determined in accordance with income tax regulations, which may differ from U.S. generally accepted accounting principles. These differences are primarily due to differing treatments of income and gains on various investment securities held by the Fund, timing differences and differing characterization of distributions made by the Fund as a whole. The Fund may also utilize earnings and
14
profits distributed to shareholders on redemption of shares as a part of the dividends paid deduction for income tax purposes.
As determined on December 31, 2010, permanent differences resulting primarily from different book and tax accounting for foreign currency gains and losses, non-taxable dividend income adjustments and passive foreign investment company gains and losses were reclassified at fiscal year-end. These reclassifications had no effect on the net income, NAV or NAV per share of the Fund.
The tax character of distributions paid during the years ended December 31, 2010 and December 31, 2009 was as follows:
| | | Distributions Paid From: | |
| | | Ordinary Income | | Total | |
| | | 2010 | | 2009 | | 2010 | | 2009 | |
| | | $ | 2,679,376 | | | $ | 10,084,277 | | | $ | 2,679,376 | | | $ | 10,084,277 | | |
As of December 31, 2010, the components of distributable earnings (accumulated losses) on a U.S. federal income tax basis were as follows:
Undistributed
Ordinary
Income | | Unrealized
Appreciation
(Depreciation) | | Loss
Carryforwards
and Deferrals | | Total | |
| $ | 1,454,120 | | | $ | 2,823,927 | | | $ | (133,573,394 | ) | | $ | (129,295,347 | ) | |
The difference between book basis and tax basis distributable earnings is attributable primarily to timing differences of wash sales, forward contracts mark to market, passive foreign investment companies and capital loss carryforwards.
To the extent the Fund's net realized capital gains, if any, can be offset by capital loss carryforwards, it is the policy of the Fund not to distribute such gains. Under current tax law, the use of these losses to offset future gains may be limited. As determined at December 31, 2010, the Fund had unused capital loss carryforwards available for federal income tax purposes to offset net realized capital gains, if any, as follows:
| | | Expiring in: | |
| | | 2016 | | 2017 | |
| | | $ | 69,986,646 | | | $ | 63,586,748 | | |
During the year ended December 31, 2010, the Fund utilized capital loss carryforwards of $30,638,282.
6 Distributions to shareholders: The Fund may earn income, net of expenses, daily on its investments. Distributions from net investment income and net realized capital gains, if any, generally are distributed once a year (usually in October). Income distributions and capital gain distributions to shareholders are recorded on the ex-date.
7 Foreign taxes: Foreign taxes withheld represent amounts withheld by foreign tax authorities, net of refunds recoverable.
8 Expense allocation: Certain expenses are applicable to multiple funds. Expenses directly attributable to a Series are charged to that Series. Expenses of the Trust that are not directly attributable to a particular series of the Trust (e.g., the Fund) are allocated among the series of the Trust, on the basis of relative net assets, except where a more appropriate allocation of expenses to each of the series can otherwise be made fairly. Expenses borne by the complex of related investment companies, which includes open-end and closed-end investment companies for which Management serves as investment manager, that are not directly attributable to a particular investment company in the complex (e.g., the Trust) or series thereof are allocated among the investment companies in the complex or series thereof, on the basis of relative net assets, except where a more appropriate allocation of expenses to each investment company in the complex or series thereof can otherwise be made fairly.
15
9 Security lending: A third party, eSecLending, has assisted the Fund in conducting a bidding process to try to identify a principal that would pay a guaranteed amount to the Fund in consideration of the Fund entering into an exclusive securities lending arrangement. During the fiscal year, eSecLending served as exclusive lending agent for the Fund. As a result of a bidding process on October 1, 2009, no principal had an exclusive securities lending arrangement with the Fund during the fiscal year; as such, the Fund was not guaranteed any particular level of income during the fiscal year. As of August 27, 2010, the Fund no longer participates in a securities lending program.
Under the securities lending arrangement, the Fund received cash collateral at the beginning of each transaction equal to at least 102% of the prior day's market value of the loaned securities (105% in the case of international securities). The Fund invested all the cash collateral in Neuberger Berman Securities Lending Quality Fund, LLC ("Quality Fund"), a fund managed by Neuberger Berman Fixed Income LLC ("NBFI"), an affiliate of Management, and sub-advised by Dwight Asset Management Company LLC. Quality Fund was not a money market fund registered under the 1940 Act and did not operate in accordance with all requirements of Rule 2a-7 under the 1940 Act. The Fund redeemed all of its investments in Quality Fund, if any, as of August 27, 2010.
Net income from the lending program represents any amounts received from a principal, plus income earned on the cash collateral invested in Quality Fund or in other investments, if applicable, less cash collateral fees and other expenses associated with the loans. For the fiscal year ended December 31, 2010, the Fund received net income under the securities lending arrangement of $121,789, which is reflected in the Statement of Operations under the caption "Income from securities loaned - net," which includes $12,436 of interest income that was earned from the Quality Fund.
10 Redemption of fund shares: The Fund charges a redemption fee of 2% on shares redeemed or exchanged for shares of another fund within 60 days or less of the purchase date. All redemption fees are paid to and recorded by the Fund as Paid-in capital. For the year ended December 31, 2010, the Fund received $711 in redemption fees.
11 Investments in foreign securities: Investing in foreign securities may involve certain sovereign and other risks, in addition to the credit and market risks normally associated with domestic securities. These additional risks include the possibility of adverse political and economic developments (including political instability, nationalization, expropriation, or confiscatory taxation) and the potentially adverse effects of unavailability of public information regarding issuers, less government supervision and regulation of financial markets, reduced liquidity of certain financial markets, and the lack of uniform accounting, auditing, and financial reporting standards or the application of standards that are different or less stringent than those applied in the United States. Foreign securities also may experience greater price volatility, higher rates of inflation, and delays in settlement.
12 Indemnifications: Like many other companies, the Trust's organizational documents provide that its officers and trustees are indemnified against certain liabilities arising out of the performance of their duties to the Trust. In addition, both in some of its principal service contracts and in the normal course of its business, the Trust enters into contracts that provide indemnifications to other parties for certain types of losses or liabilities. The Trust's maximum exposure under these arrangements is unknown as this could involve future claims against the Trust.
Note B--Management Fees, Administration Fees, Distribution Arrangements, and Other Transactions with Affiliates:
Fund shares are issued and redeemed in connection with investments in and payments under certain variable annuity contracts and variable life insurance policies issued through separate accounts of life insurance companies and are also offered directly to certain qualified pension and retirement plans.
The Fund retains Management as its investment manager under a Management Agreement. For such investment management services, the Fund pays Management a fee at the annual rate of 0.85% of the first $250 million of the Fund's average daily net assets, 0.825% of the next $250 million, 0.80% of the next $250 million, 0.775% of the
16
next $250 million, 0.75% of the next $500 million, 0.725% of the next $1 billion, and 0.70% of average daily net assets in excess of $2.5 billion.
The Fund retains Management as its administrator under an Administration Agreement. The Fund pays Management an administration fee at the annual rate of 0.30% of its average daily net assets under this agreement. Additionally, Management retains State Street Bank and Trust Company ("State Street") as its sub-administrator under a Sub-Administration Agreement. Management pays State Street a fee for all services received under this agreement.
Management acts as agent in arranging for the sale of Fund shares without commission and bears advertising and promotion expenses. The Board has adopted a distribution plan (the "Plan") with respect to the Fund, pursuant to Rule 12b-1 under the 1940 Act. The Plan provides that, as compensation for administrative and other services provided to the Fund, Management's activities and expenses related to the sale and distribution of the Fund's shares, and ongoing services provided to investors in the Fund, Management receives from the Fund a fee at the annual rate of 0.25% of the Fund's average daily net assets. Management receives this amount to provide distribution and shareholder servicing for the Fund and pays a portion of it to institutions that provide such services. Those institutions may use the payments for, among other purposes, compensating employees engaged in sales and/or shareholder servicing. The amount of fees paid by the Fund during any year could have been more or less than the cost of distribution and other services provided to the Fund. FINRA rules limit the amount of annual distribution fees that may be paid by a mutual fund and impose a ceiling on the cumulative distribution fees paid. The Trust's Plan complies with those rules.
Management has contractually undertaken through December 31, 2013 to forgo current payment of fees and/or reimburse the Fund for its operating expenses (including fees payable to Management but excluding interest, taxes, brokerage commissions, extraordinary expenses, and transaction costs) ("Operating Expenses") which exceed, in the aggregate, 2.00% per annum of the Fund's average daily net assets (the "Expense Limitation"). Moreover, Management has voluntarily committed to reimburse certain expenses, as stated above, for an additional 0.50% per annum of the Fund's average daily net assets to maintain the Fund's Operating Expense at 1.50%. Management may, at its sole discretion, terminate this voluntary reimbursement commitment without notice. For the year ended December 31, 2010, Management voluntarily reimbursed the Fund $217,800. The Fund has agreed to repay Management through December 31, 2016 for fees and expenses foregone and/or its excess Operating Expenses previously reimbursed by Management under the contractual Expense Limitation, so long as its annual Operating Expenses during that period do not exceed its Expense Limitation, and the repayment is made within three years after the year in which Management issued the reimbursement or waived fees. During the year ended December 31, 2010, there was no repayment to Management under its contractual expense limitation. At December 31, 2010, the Fund had no contingent liabilities to Management under its contractual expense limitation.
For the year ended December 31, 2009, the Fund recorded a capital contribution from Management in the amount of $31,690. This amount was paid in connection with losses outside the Fund's direct control incurred in the disposition of foreign currency contracts. Management does not normally make payments for losses incurred in the disposition of foreign currency contracts.
Neuberger Berman LLC ("Neuberger") is retained by Management to furnish it with investment recommendations and research information without added cost to the Fund. Several individuals who are officers and/or trustees of the Trust are also employees of Neuberger and/or Management.
On May 4, 2009, NBSH Acquisition, LLC ("NBSH"), an entity organized by key members of senior management of Neuberger Berman Group LLC ("NBG") and its consolidated subsidiaries (NBG, and together with its consolidated subsidiaries "NB Group") acquired a majority interest in the business conducted by Management and Neuberger, as well as the fixed income and certain alternative asset management businesses of Lehman Brothers Holdings Inc.'s Investment Management Division (together with Management and Neuberger, the "Acquired Businesses") (the "Acquisition"). Prior to that date, Neuberger and the predecessor in interest of Management were indirect wholly owned subsidiaries of Lehman Brothers Holdings Inc. ("LBHI"). On September 15, 2008, LBHI filed a voluntary
17
petition under Chapter 11 of the U.S. Bankruptcy Code, and on December 22, 2008, the bankruptcy court having jurisdiction over the LBHI matter approved the sale of the Acquired Businesses to NBSH (or its successor or assign).
Through NBSH, portfolio managers, NB Group's management team, and certain of its key employees and senior professionals now indirectly own 52% of the voting equity of NBG. LBHI and certain affiliates of LBHI own the remaining 48% of NBG's voting equity. The closing of the Acquisition resulted in an "assignment" of the Fund's Management Agreement and Sub-Advisory Agreement. Such an assignment, by law, automatically terminated those agreements. Accordingly, prior to the closing, the Board, including the Trustees who are not "interested persons" of the Fund's investment manager and its affiliates or the Fund, considered and approved a new Management Agreement and Sub-Advisory Agreement for the Fund. The new agreements, which are virtually identical to those previously in effect, were also approved by a vote of the Fund's shareholders.
These events did not have a material impact on the Fund or its operations. Management and Neuberger continue to operate in the ordinary course of business as the investment manager and sub-adviser of the Fund.
Other non-affiliated service provider: The Fund has an expense offset arrangement in connection with its custodian contract. For the year ended December 31, 2010, the impact of this arrangement was a reduction of expenses of $22.
Note C--Securities Transactions:
During the year ended December 31, 2010, there were purchase and sale transactions (excluding short-term securities) of $85,195,655 and $366,379,514, respectively.
During the year ended December 31, 2010, no brokerage commissions on securities transactions were paid to affiliated brokers.
Note D--Fund Share Transactions:
Share activity for the years ended December 31, 2010 and December 31, 2009 was as follows:
| | | For the Year Ended December 31, | |
| | | 2010 | | 2009 | |
| Shares Sold | | | 1,513,829 | | | | 7,117,025 | | |
| Shares Issued on Reinvestment of Dividends and Distributions | | | 272,571 | | | | 1,058,161 | | |
| Shares Redeemed | | | (34,113,468 | ) | | | (7,304,006 | ) | |
| Total | | | (32,327,068 | ) | | | 871,180 | | |
Note E--Line of Credit:
At December 31, 2010, the Fund was a participant in a single committed, unsecured $200,000,000 ($150,000,000 prior to September 17, 2010) line of credit with State Street, to be used only for temporary or emergency purposes. Other investment companies managed by Management also participate in this line of credit on the same terms. Interest is charged on borrowings under this line of credit at the higher of (a) the Federal Funds Rate plus 1.25% per annum or (b) the Overnight LIBOR Rate plus 1.25% per annum. A commitment fee of 0.125% (0.15% prior to September 17, 2010) per annum of the available line of credit is charged, of which each participating Fund has agreed to pay its pro rata share, based on the ratio of its individual net assets to the net assets of all participants at the time the fee is due and payable. The fee is paid quarterly in arrears. Because several mutual funds participate, there is no assurance that an individual Fund will have access to all or any part of the $200,000,000 ($150,000,000 prior to September 17, 2010) at any particular time.
18
At December 31, 2010, the Fund was one of five holders of a single uncommitted, secured $100,000,000 line of credit with State Street to be used only for temporary or emergency purposes or for leverage. Other investment companies managed by Management also participate in this line of credit on the same terms. Interest is charged at LIBOR, or the overnight Federal Funds Rate, plus a spread to be determined at the time of borrowing. Because several mutual funds participate, there is no assurance that the Fund will have access to all or any part of the $100,000,000 at any particular time.
The Fund had no loans outstanding pursuant to these lines of credit at December 31, 2010. During the year ended December 31, 2010, the Fund did not utilize these lines of credit.
Note F--Investments in Affiliates:
| Name of Issuer | | Balance of
Shares
Held
December 31,
2009 | | Gross
Purchases
and
Additions | | Gross
Sales
and
Reductions | | Balance of
Shares
Held
December 31,
2010 | | Value
December 31,
2010 | | Income from
Investments in
Affiliated
Issuers
Included in
Total Income | |
Neuberger Berman Securities
Lending Quality Fund, LLC* | | | 20,201,248 | | | | 85,054,869 | | | | 105,256,117 | | | | -- | | | $ | -- | | | $ | 12,436 | | |
* Quality Fund, a fund that was managed by NBFI, an affiliate of Management, was used to invest cash the Fund received as collateral for securities loaned as approved by the Board. Because all shares of Quality Fund were held by funds in the related investment management complex, Quality Fund may have been considered an affiliate of the Fund.
19
Financial Highlights
International Portfolio
The following table includes selected data for a share outstanding throughout each year and other performance information derived from the Financial Statements.
| | | Year Ended December 31, | |
| | | 2010 | | 2009 | | 2008 | | 2007 | | 2006 | |
| Net Asset Value, Beginning of Year | | $ | 9.51 | | | $ | 7.29 | | | $ | 13.61 | | | $ | 14.29 | | | $ | 11.68 | | |
| Income From Investment Operations: | |
| Net Investment Income (Loss)O | | | .13 | | | | .09 | | | | .32 | | | | .13 | | | | .10 | | |
Net Gains or Losses on Securities
(both realized and unrealized) | | | 1.90 | | | | 2.43 | | | | (6.64 | ) | | | .30 | | | | 2.64 | | |
| Total From Investment Operations | | | 2.03 | | | | 2.52 | | | | (6.32 | ) | | | .43 | | | | 2.74 | | |
| Less Distributions From: | |
| Net Investment Income | | | (1.20 | ) | | | (.30 | ) | | | - | | | | (.24 | ) | | | (.03 | ) | |
| Net Capital Gains | | | - | | | | - | | | | - | | | | (.87 | ) | | | (.10 | ) | |
| Total Distributions | | | (1.20 | ) | | | (.30 | ) | | | - | | | | (1.11 | ) | | | (.13 | ) | |
| Redemption FeesO | | | .00 | | | | .00 | | | | .00 | | | | .00 | | | | .00 | | |
| Net Asset Value, End of Year | | $ | 10.34 | | | $ | 9.51 | | | $ | 7.29 | | | $ | 13.61 | | | $ | 14.29 | | |
| Total Returntt | | | 22.01 | % | | | 34.51 | % | | | (46.44 | )% | | | 3.21 | % | | | 23.45 | % | |
| Ratios/Supplemental Data | |
| Net Assets, End of Year (in millions) | | $ | 24.8 | | | $ | 330.1 | | | $ | 246.9 | | | $ | 653.7 | | | $ | 338.6 | | |
| Ratio of Gross Expenses to Average Net Assets# | | | 1.50 | % | | | 1.50 | % | | | 1.53 | % | | | 1.51 | % | | | 1.50 | % | |
| Ratio of Net Expenses to Average Net Assetst | | | 1.50 | % | | | 1.50 | % | | | 1.53 | % | | | 1.50 | % | | | 1.50 | % | |
Ratio of Net Investment Income (Loss) to Average
Net Assets | | | 1.42 | % | | | 1.13 | % | | | 2.78 | % | | | .85 | % | | | .75 | % | |
| Portfolio Turnover Rate | | | 61 | % | | | 80 | % | | | 149 | % | | | 43 | % | | | 39 | % | |
See Notes to Financial Highlights
20
Notes to Financial Highlights International Portfolio
tt Total return based on per share NAV reflects the effects of changes in NAV on the performance of the Fund during each fiscal period and assumes income dividends and other distributions, if any, were reinvested. Results represent past performance and do not guarantee future results. Current returns may be lower or higher than the performance data quoted. Investment returns and principal may fluctuate and shares when redeemed may be worth more or less than original cost. Total return would have been lower if Management had not reimbursed and/or waived certain expenses. The total return information shown does not reflect charges and other expenses that apply to the separate account or the related insurance policies, and the inclusion of these charges and other expenses would reduce the total return for all fiscal periods shown. For the year ended December 31, 2009, Management reimbursed the Fund for losses incurred in connection with the disposition of foreign currency contracts, which had a .01% impact on total return.
# The Fund is required to calculate an expense ratio without taking into consideration any expense reductions related to expense offset arrangements.
t After reimbursement of expenses and/or waiver of a portion of the investment management fee by Management. Had Management not undertaken such actions, the annualized ratios of net expenses to average daily net assets would have been:
| | | Year Ended December 31, | |
| 2010 | | 2009 | | 2008 | | 2007 | | 2006 | |
| | 1.65 | % | | | 1.66 | % | | | 1.59 | % | | | 1.53 | % | | | 1.67 | % | |
a Calculated based on the average number of shares outstanding during the fiscal period.
21
Report of Independent Registered Public Accounting Firm
To the Board of Trustees of
Neuberger Berman Advisers Management Trust and
Shareholders of International Portfolio
We have audited the accompanying statement of assets and liabilities, including the schedule of investments, of International Portfolio, one of the series constituting Neuberger Berman Advisers Management Trust (the "Trust"), as of December 31, 2010, and the related statement of operations for the year then ended, the statements of changes in net assets for each of the two years in the period then ended, and the financial highlights for each of the five years in the period then ended. These financial statements and financial highlights are the responsibility of the Trust's management. Our responsibility is to express an opinion on these financial statements and financial highlights based on our audits.
We conducted our audits in accordance with the standards of the Public Company Accounting Oversight Board (United States). Those standards require that we plan and perform the audit to obtain reasonable assurance about whether the financial statements and financial highlights are free of material misstatement. We were not engaged to perform an audit of the Trust's internal control over financial reporting. Our audits included consideration of internal control over financial reporting as a basis for designing audit procedures that are appropriate in the circumstances, but not for the purpose of expressing an opinion on the effectiveness of the Trust's internal control over financial reporting. Accordingly, we express no such opinion. An audit also includes examining, on a test basis, evidence supporting the amounts and disclosures in the financial statements and financial highlights, assessing the accounting principles used and significant estimates made by management, and evaluating the overall financial statement presentation. Our procedures included confirmation of securities owned as of December 31, 2010 by correspondence with the custodian and brokers or by other appropriate auditing procedures where replies from brokers were not received. We believe that our audits provide a reasonable basis for our opinion.
In our opinion, the financial statements and financial highlights referred to above present fairly, in all material respects, the financial position of International Portfolio, a series of Neuberger Berman Advisers Management Trust, at December 31, 2010, the results of its operations for the year then ended, the changes in its net assets for each of the two years in the period then ended, and the financial highlights for each of the five years in the period then ended, in conformity with U.S. generally accepted accounting principles.

Boston, Massachusetts
February 10, 2011
22
Trustee and Officer Information
The following tables set forth information concerning the trustees and officers of the Trust. All persons named as trustees and officers also serve in similar capacities for other funds administered or managed by Management, Neuberger and NBFI. The Statement of Additional Information includes additional information about trustees and is available upon request, without charge, by calling (800) 877-9700.
Information about the Board of Trustees
Name, (Year of Birth),
and Address(1) | | Position and
Length of
Time Served(2) | | Principal Occupation(s)(3) | | Number of
Funds in Fund
Complex
Overseen by
Trustee | | Other Directorships
Held Outside Fund
Complex by Trustee | |
| Independent Trustees | |
|
| John Cannon (1930) | | Trustee since 2000 | | Consultant; formerly, Chairman, CDC Investment Advisers (registered investment adviser), 1993 to January 1999; formerly, President and Chief Executive Officer, AMA Investment Advisors, an affiliate of the American Medical Association. | | | 43 | | | Formerly, Independent Trustee or Director of three series of Oppenheimer Funds: Oppenheimer Limited Term New York Municipal Fund, Rochester Fund Municipals, and Oppenheimer Convertible Securities Fund, 1992 to 2009. | |
|
| Faith Colish (1935) | | Trustee since 1982 | | Counsel, Carter Ledyard & Milburn LLP (law firm) since October 2002; formerly, Attorney-at-Law and President, Faith Colish, A Professional Corporation, 1980 to 2002. | | | 43 | | | Formerly, Director, 1997 to 2003, and Advisory Director, 2003 to 2006; ABA Retirement Funds (formerly, American Bar Retirement Association) (not-for-profit membership corporation). | |
|
23
Name, (Year of Birth),
and Address(1) | | Position and
Length of
Time Served(2) | | Principal Occupation(s)(3) | | Number of
Funds in Fund
Complex
Overseen by
Trustee | | Other Directorships
Held Outside Fund
Complex by Trustee | |
| Martha C. Goss (1949) | | Trustee since 2007 | | President, Woodhill Enterprises Inc./Chase Hollow Associates LLC (personal investment vehicle), since 2006; Chief Operating and Financial Officer, Hopewell Holdings LLC/Amwell Holdings, LLC (a holding company for a healthcare reinsurance company start-up), since 2003; formerly, Consultant, Resources Connection (temporary staffing), 2002 to 2006. | | | 43 | | | Director, Ocwen Financial Corporation (mortgage servicing), since 2005; Director, American Water (water utility), since 2003; Director, Channel Reinsurance (financial guaranty reinsurance), since 2006; Director, Allianz Life of New York (insurance), since 2005; Director, Financial Women's Association of New York (not-for-profit association), since 2003; Trustee Emerita, Brown University, since 1998; formerly, Advisory Board Member, Attensity (software developer), 2005 to 2007; formerly, Director, Bank Leumi (commercial bank), 2005 to 2007; formerly, Director, Claire's Stores, Inc. (retailer), 2005 to 2007. | |
|
| C. Anne Harvey (1937) | | Trustee since 1998 | | President, C.A. Harvey Associates, since October 2001; formerly, Director, AARP, 1978 to December 2001. | | | 43 | | | Formerly, President, Board of Associates to The National Rehabilitation Hospital's Board of Directors, 2001 to 2002; formerly, Member, Individual Investors Advisory Committee to the New York Stock Exchange Board of Directors, 1998 to 2002. | |
|
24
Name, (Year of Birth),
and Address(1) | | Position and
Length of
Time Served(2) | | Principal Occupation(s)(3) | | Number of
Funds in Fund
Complex
Overseen by
Trustee | | Other Directorships
Held Outside Fund
Complex by Trustee | |
| Robert A. Kavesh (1927) | | Trustee since 2000 | | Retired; Marcus Nadler Professor Emeritus of Finance and Economics, New York University Stern School of Business; formerly, Executive Secretary-Treasurer, American Finance Association, 1961 to 1979. | | | 43 | | | Formerly, Director, The Caring Community (not-for-profit), 1997 to 2006; formerly, Director, DEL Laboratories, Inc. (cosmetics and pharmaceuticals), 1978 to 2004; formerly, Director, Apple Bank for Savings, 1979 to 1990; formerly, Director, Western Pacific Industries, Inc., (public company), 1972 to 1986. | |
|
| Michael M. Knetter (1960) | | Trustee since 2007 | | President and Chief Executive Officer, University of Wisconsin Foundation, October 2010 to Present; formerly, Dean, School of Business, University of Wisconsin - Madison; formerly, Professor of International Economics and Associate Dean, Amos Tuck School of Business - Dartmouth College, 1998 to 2002. | | | 43 | | | Director, American Family Insurance (a mutual company, not publicly traded), since March 2009; Trustee, Northwestern Mutual Series Fund, Inc., since February 2007; Director, Wausau Paper, since 2005; formerly, Director, Great Wolf Resorts, 2004 to 2009. | |
|
| Howard A. Mileaf (1937) | | Trustee since 1999 | | Retired; formerly, Vice President and General Counsel, WHX Corporation (holding company), 1993 to 2001. | | | 43 | | | Formerly, Director, Webfinancial Corporation (holding company), 2002 to 2008; formerly, Director, WHX Corporation (holding company), 2002 to 2005; formerly, Director, State Theatre of New Jersey (not-for-profit theatre), 2000 to 2005. | |
|
| George W. Morriss (1947) | | Trustee since 2007 | | Retired; formerly, Executive Vice President and Chief Financial Officer, People's Bank, Connecticut (a financial services company), 1991 to 2001. | | | 43 | | | Manager, Old Mutual Funds of Hedge Funds fund complex (consisting of six funds), since 2006 for four funds and since 2007 for two funds; formerly, Member NASDAQ Issuers' Affairs Committee, 1995 to 2003. | |
|
25
Name, (Year of Birth),
and Address(1) | | Position and
Length of
Time Served(2) | | Principal Occupation(s)(3) | | Number of
Funds in Fund
Complex
Overseen by
Trustee | | Other Directorships
Held Outside Fund
Complex by Trustee | |
| Edward I. O'Brien (1928) | | Trustee since 2000 | | Retired; formerly, Member, Investment Policy Committee, Edward Jones, 1993 to 2001; President, Securities Industry Association ("SIA") (securities industry's representative in government relations and regulatory matters at the federal and state levels), 1974 to 1992; Adviser to SIA, November 1992 to November 1993. | | | 43 | | | Formerly, Director, Legg Mason, Inc. (financial services holding company), 1993 to July 2008; formerly, Director, Boston Financial Group (real estate and tax shelters), 1993 to 1999. | |
|
| Cornelius T. Ryan (1931) | | Trustee since 2000 | | General Partner and Adviser, TD2, TD3, and TOF1 Healthcare Venture Capital Partnerships; Founding General Partner, Oxford Partners and Oxford Bioscience Partners (venture capital investing) and President, Oxford Venture Corporation, since 1981. | | | 43 | | | Trustee, Norwalk Hospital Foundation, since 2000; Director, Supply Pro (privately held company), since 2008; formerly, Trustee, Norwalk Hospital, 1995 to 2004; formerly, President and Director, Randolph Computer Corp., 1966 to 1984; formerly, Director of numerous privately held portfolio companies of Oxford Partners and Oxford Bioscience Partners, 1981 to 2005. | |
|
| Tom D. Seip (1950) | | Trustee since 2000; Chairman of the Board since 2008; Lead Independent Trustee from 2006 to 2008 | | General Partner, Seip Investments LP (a private investment partnership); formerly, President and CEO, Westaff, Inc. (temporary staffing), May 2001 to January 2002; formerly, Senior Executive, The Charles Schwab Corporation, 1983 to 1998, including Chief Executive Officer, Charles Schwab Investment Management, Inc.; Trustee, Schwab Family of Funds and Schwab Investments, 1997 to 1998; and Executive Vice President-Retail Brokerage, Charles Schwab & Co., Inc., 1994 to 1997. | | | 43 | | | Director, H&R Block, Inc. (financial services company), since May 2001; Chairman, Compensation Committee, H&R Block, Inc., since 2006; formerly, Director, Forward Management, Inc. (asset management company), 1999 to 2006. | |
|
26
Name, (Year of Birth),
and Address(1) | | Position and
Length of
Time Served(2) | | Principal Occupation(s)(3) | | Number of
Funds in Fund
Complex
Overseen by
Trustee | | Other Directorships
Held Outside Fund
Complex by Trustee | |
| Candace L. Straight (1947) | | Trustee since 1999 | | Private investor and consultant specializing in the insurance industry; formerly, Advisory Director, Securitas Capital LLC (a global private equity investment firm dedicated to making investments in the insurance sector), 1998 to December 2003. | | | 43 | | | Director, Montpelier Re Holdings Ltd. (reinsurance company), since 2006; formerly, Director, National Atlantic Holdings Corporation (property and casualty insurance company), 2004 to 2008; formerly, Director, The Proformance Insurance Company (property and casualty insurance company), 2004 to 2008; formerly, Director, Providence Washington Insurance Company (property and casualty insurance company), 1998 to 2006; formerly, Director, Summit Global Partners (insurance brokerage firm), 2000 to 2005. | |
|
| Peter P. Trapp (1944) | | Trustee since 1984 | | Retired; formerly, Regional Manager for Mid-Southern Region, Ford Motor Credit Company, September 1997 to 2007; formerly, President, Ford Life Insurance Company, April 1995 to August 1997. | | | 43 | | | None. | |
|
27
Name, (Year of Birth),
and Address(1) | | Position and
Length of
Time Served(2) | | Principal Occupation(s)(3) | | Number of
Funds in Fund
Complex
Overseen by
Trustee | | Other Directorships
Held Outside Fund
Complex by Trustee | |
| Trustees who are "Interested Persons" | |
|
| Joseph V. Amato* (1962) | | Trustee since 2009 | | President and Director, Neuberger Berman Group LLC, since 2009; President and Chief Executive Officer, Neuberger and Neuberger Berman Holdings LLC (including its predecessor, Neuberger Berman Inc.), since 2007; Chief Investment Officer, Neuberger, since 2009; Chief Investment Officer (Equities) and Managing Director, Management, since 2009; Managing Director, NBFI, since 2007; Board member of NBFI since 2006; formerly, Global Head of Asset Management of LBHI's Investment Management Division, 2006 to 2009; formerly, member of LBHI's Investment Management Division's Executive Management Committee, 2006 to 2009; formerly, Managing Director, Lehman Brothers Inc. ("LBI"), 2006 to 2008; formerly, Chief Recruiting and Development Officer, LBI, 2005 to 2006; formerly, Global Head of LBI's Equity Sales and a Member of its Equities Division Executive Committee, 2003 to 2005. | | | 43 | | | Member of Board of Advisors, McDonough School of Business, Georgetown University, since 2001; Member of New York City Board of Advisors, Teach for America, since 2005; Trustee, Montclair Kimberley Academy (private school), since 2007. | |
|
28
Name, (Year of Birth),
and Address(1) | | Position and
Length of
Time Served(2) | | Principal Occupation(s)(3) | | Number of
Funds in Fund
Complex
Overseen by
Trustee | | Other Directorships
Held Outside Fund
Complex by Trustee | |
| Robert Conti* (1956) | | Chief Executive Officer, President and Trustee since 2008; prior thereto, Executive Vice President in 2008 and Vice President, 2000 to 2008 | | Managing Director, Neuberger, since 2007; formerly, Senior Vice President, Neuberger, 2003 to 2006; formerly, Vice President, Neuberger, 1999 to 2003; President and Chief Executive Officer, Management, since 2008; formerly, Senior Vice President, Management, 2000 to 2008. | | | 43 | | | Chairman of the Board, Staten Island Mental Health Society since 2008. | |
|
| Jack L. Rivkin* (1940) | | Trustee since 2002; President, 2002 to 2008 | | Formerly, Executive Vice President and Chief Investment Officer, Neuberger Berman Holdings LLC (holding company), 2002 to August 2008 and 2003 to August 2008, respectively; formerly, Managing Director and Chief Investment Officer, Neuberger, December 2005 to August 2008 and 2003 to August 2008, respectively; formerly, Executive Vice President, Neuberger, December 2002 to 2005; formerly, Director and Chairman, Management, December 2002 to August 2008; formerly, Executive Vice President, Citigroup Investments, Inc., September 1995 to February 2002; formerly, Executive Vice President, Citigroup Inc., September 1995 to February 2002. | | | 43 | | | Director, Idealab (private company), since 2009; Director, Distributed World Power (private company), since 2009; Director, Dale Carnegie and Associates, Inc. (private company), since 1999; Director, Solbright, Inc. (private company), since 1998; Director, SA Agricultural Fund, since 2009; Chairman and Director, Essential Brands (consumer products) since 2008; formerly, Director, New York Society of Security Analysts, 2006 to 2008. | |
|
(1) The business address of each listed person is 605 Third Avenue, New York, New York 10158.
(2) Pursuant to the Trust's Trust Instrument, each of these Trustees shall hold office for life or until his or her successor is elected or the Trust terminates; except that (a) any Trustee may resign by delivering a written resignation; (b) any Trustee may be removed with or without cause at any time by a written instrument signed by at least two-thirds of the other Trustees; (c) any Trustee who requests to be retired, or who has become unable to serve, may be retired by a written instrument signed by a majority of the other Trustees; and (d) any Trustee may be removed at any shareholder meeting by a vote of at least two-thirds of the outstanding shares.
29
(3) Except as otherwise indicated, each individual has held the positions shown for at least the last five years.
* Indicates a Trustee who is an "interested person" within the meaning of the 1940 Act. Mr. Amato and Mr. Conti are interested persons of the Trust by virtue of the fact that each is an officer of Management, Neuberger and/or their affiliates. Mr. Rivkin may be deemed an interested person of the Trust by virtue of the fact that, until August 2008, he was a director of Management and an officer of Neuberger.
30
Information about the Officers of the Trust
Name, (Year of Birth),
and Address(1) | | Position and
Length of Time
Served(2) | | Principal Occupation(s)(3) | |
| Andrew B. Allard (1961) | | Anti-Money Laundering Compliance Officer since 2002 | | Senior Vice President, Neuberger, since 2006; Deputy General Counsel, Neuberger, since 2004; formerly, Vice President, Neuberger, 2000 to 2005; Anti-Money Laundering Compliance Officer, nine registered investment companies for which Management acts as investment manager and administrator (six since 2002, one since 2003, one since 2005 and one since 2006). | |
|
| Claudia A. Brandon (1956) | | Executive Vice President since 2008 and Secretary since 1985 | | Senior Vice President, Neuberger, since 2007 and Employee since 1999; Senior Vice President, Management, since 2008 and Assistant Secretary since 2004; formerly, Vice President, Neuberger, 2002 to 2006; formerly, Vice President-Mutual Fund Board Relations, Management, 2000 to 2008; Executive Vice President, nine registered investment companies for which Management acts as investment manager and administrator (nine since 2008); Secretary, nine registered investment companies for which Management acts as investment manager and administrator (three since 1985, three since 2002, one since 2003, one since 2005 and one since 2006). | |
|
| Maxine L. Gerson (1950) | | Executive Vice President since 2008 and Chief Legal Officer since 2005 (only for purposes of sections 307 and 406 of the Sarbanes-Oxley Act of 2002) | | Managing Director, Neuberger, since 2009, and Deputy General Counsel and Assistant Secretary Neuberger since 2001; Managing Director, Management, since 2009, and Secretary and General Counsel, Management, since 2004; formerly, Senior Vice President, Neuberger, 2002 to 2009; formerly, Senior Vice President, Management, 2006 to 2009; Executive Vice President, nine registered investment companies for which Management acts as investment manager and administrator (nine since 2008); Chief Legal Officer (only for purposes of sections 307 and 406 of the Sarbanes-Oxley Act of 2002), nine registered investment companies for which Management acts as investment manager and administrator (eight since 2005 and one since 2006). | |
|
| Sheila R. James (1965) | | Assistant Secretary since 2002 | | Vice President, Neuberger, since 2008 and Employee since 1999; formerly, Assistant Vice President, Neuberger, 2007; Assistant Secretary, nine registered investment companies for which Management acts as investment manager and administrator (six since 2002, one since 2003, one since 2005 and one since 2006). | |
|
| Brian Kerrane (1969) | | Vice President since 2008 | | Senior Vice President, Neuberger, since 2006; formerly, Vice President, Neuberger, 2002 to 2006; Vice President, Management, since 2008 and Employee since 1991; Vice President, nine registered investment companies for which Management acts as investment manager and administrator (nine since 2008). | |
|
| Kevin Lyons (1955) | | Assistant Secretary since 2003 | | Assistant Vice President, Neuberger, since 2008 and Employee since 1999; Assistant Secretary, nine registered investment companies for which Management acts as investment manager and administrator (seven since 2003, one since 2005 and one since 2006). | |
|
31
Name, (Year of Birth),
and Address(1) | | Position and
Length of Time
Served(2) | | Principal Occupation(s)(3) | |
| Owen F. McEntee, Jr. (1961) | | Vice President since 2008 | | Vice President, Neuberger, since 2006; Employee, Management, since 1992; Vice President, nine registered investment companies for which Management acts as investment manager and administrator (nine since 2008). | |
|
| John M. McGovern (1970) | | Treasurer and Principal Financial and Accounting Officer since 2005 | | Senior Vice President, Neuberger, since 2007; formerly, Vice President, Neuberger, 2004 to 2006; Employee, Management, since 1993; Treasurer and Principal Financial and Accounting Officer, nine registered investment companies for which Management acts as investment manager and administrator (eight since 2005 and one since 2006); formerly, Assistant Treasurer, eight registered investment companies for which Management acts as investment manager and administrator, 2002 to 2005. | |
|
| Andrew Provencher (1965) | | Vice President since 2008 | | Managing Director, Management, since 2008; Managing Director, Neuberger, since 2005; formerly, Senior Vice President, Neuberger, 2003 to 2005; Vice President, nine registered investment companies for which Management acts as investment manager and administrator (nine since 2008). | |
|
| Frank Rosato (1971) | | Assistant Treasurer since 2005 | | Vice President, Neuberger, since 2006; Employee, Management, since 1995; Assistant Treasurer, nine registered investment companies for which Management acts as investment manager and administrator (eight since 2005 and one since 2006). | |
|
| Neil S. Siegel (1967) | | Vice President since 2008 | | Managing Director, Management, since 2008; Managing Director, Neuberger, since 2006; formerly, Senior Vice President, Neuberger, 2004 to 2006; Vice President, nine registered investment companies for which Management acts as investment manager and administrator (nine since 2008). | |
|
| Chamaine Williams (1971) | | Chief Compliance Officer since 2005 | | Senior Vice President, Neuberger, since 2007; Chief Compliance Officer, Management, since 2006; Chief Compliance Officer, nine registered investment companies for which Management acts as investment manager and administrator (eight since 2005 and one since 2006); formerly, Senior Vice President, LBI, 2007 to 2008; formerly, Vice President, LBI, 2003 to 2006; formerly, Chief Compliance Officer, Lehman Brothers Asset Management Inc., 2003 to 2007; formerly, Chief Compliance Officer, Lehman Brothers Alternative Investment Management LLC, 2003 to 2007. | |
|
(1) The business address of each listed person is 605 Third Avenue, New York, New York 10158.
(2) Pursuant to the By-Laws of the Trust, each officer elected by the Trustees shall hold office until his or her successor shall have been elected and qualified or until his or her earlier death, inability to serve, or resignation. Officers serve at the pleasure of the Trustees and may be removed at any time with or without cause.
(3) Except as otherwise indicated, each individual has held the positions shown for at least the last five years.
32
Proxy Voting Policies and Procedures
A description of the policies and procedures that the Trust uses to determine how to vote proxies relating to portfolio securities is available, without charge, by calling 1-800-877-9700 (toll-free) and on the website of the Securities and Exchange Commission, at www.sec.gov. Information regarding how the Trust voted proxies relating to portfolio securities during the most recent 12-month period ended June 30 is also available, without charge, by calling 1-800-877-9700 (toll-free), on the website of the Securities and Exchange Commission at www.sec.gov, and on Management's website at www.nb.com.
Quarterly Portfolio Schedule
The Trust files a complete schedule of portfolio holdings for the Fund with the Securities and Exchange Commission for the first and third quarters of each fiscal year on Form N-Q. The Trust's Forms N-Q are available on the Securities and Exchange Commission's website at www.sec.gov and may be reviewed and copied at the Securities and Exchange Commission's Public Reference Room in Washington, DC. Information on the operation of the Public Reference Room may be obtained by calling 1-800-SEC-0330. The information on Form N-Q is available upon request, without charge, by calling 1-800-877-9700 (toll free).
Notice to Shareholders (Unaudited)
The Fund has elected to pass through to its shareholders the credits for taxes paid to foreign countries. For the fiscal year ended December 31, 2010, the Fund designates $298,869, or $0.12 per share outstanding, foreign taxes paid and $4,634,424, or $1.93 per share outstanding, foreign source income earned for Federal income tax purposes.
Board Consideration of the Management and Sub-Advisory Agreements
At a meeting held on October 14, 2010, the Board, including the Trustees who are not "interested persons" of Management (including its affiliates) or Neuberger Berman Advisers Management Trust ("Independent Fund Trustees"), approved the continuance of the Management and Sub-Advisory Agreements ("Agreements") for the Fund.
In evaluating the Agreements, the Board, including the Independent Fund Trustees, reviewed materials furnished by Management and Neuberger in response to questions submitted by counsel for the Independent Fund Trustees, and met with senior representatives of Management and Neuberger regarding their personnel and operations. The Independent Fund Trustees were advised by counsel that is experienced in 1940 Act matters and that is independent of Management and Neuberger. The Independent Fund Trustees received a memorandum from independent counsel discussing the legal standards for their consideration of the proposed continuance of the Agreements. They met with such counsel separately from representatives of Management to discuss the annual contract review. The annual contract review extends over two regular meetings of the Board to ensure that Management and Neuberger have time to respond to any questions the Independent Fund Trustees may have on their initial review of the report and that the Independent Fund Trustees have time to consider those responses. In addition, during this process, the Board held a separate meeting devoted primarily to reviewing and discussing Fund performance.
The Board considered the following factors, among others, in connection with its approval of the continuance of the Agreements: (1) the nature, extent, and quality of the services provided by Management and Neuberger; (2) the performance of the Fund compared to a relevant market index and a peer group of investment companies; (3) the costs of the services provided and profits or losses realized by Management and its affiliates from their relationship with the Fund; (4) the extent to which economies of scale might be realized as the Fund grows; and (5) whether fee levels reflect any such potential economies of scale for the benefit of investors in the Fund. In their deliberations, the Board members did not identify any particular information that was all-important or controlling, and each Trustee may have attributed different weights to the various factors.
33
The Board evaluated the terms of the Agreements, the overall fairness of the Agreements to the Fund and whether the Agreements were in the best interests of the Fund and its shareholders.
With respect to the nature, extent and quality of the services provided, the Board considered the performance of the Fund and the experience and staffing of the portfolio management and investment research personnel of Management and Neuberger who perform services for the Fund. The Board noted that Management also provides certain administrative services, including fund accounting and compliance oversight. The Board also considered Management's and Neuberger's policies and practices regarding brokerage and the quality of brokerage execution obtained by Management. The Board's Portfolio Transactions and Pricing Committee from time to time reviewed the quality of the execution services that Management and Neuberger had provided, and periodically reviews studies by an independent firm engaged to review and evaluate the quality of brokerage execution received by the Fund. The Board also reviewed whether Management and Neuberger used brokers to execute Fund transactions that provide research and other services to Management and Neuberger, and the types of benefits potentially derived from such services by Management, Neuberger, the Fund and other clients of Management and Neuberger. In addition, the Board noted the positive compliance history of Management and Neuberger, as each firm has been free of significant reported compliance problems.
The Board considered the performance of the Fund relative to its benchmark and a peer group of investment companies dedicated to insurance products pursuing broadly similar strategies. The Board also considered performance in relation to certain measures of the degree of investment risk undertaken by the portfolio managers. The Board discussed the Fund's performance with Management and discussed steps that Management had taken, or intended to take, to improve the Fund's performance. The Board also considered Management's resources and responsiveness with respect to the Fund.
With respect to the overall fairness of the Agreements, the Board considered the fee structure for the Fund under the Agreements as compared to a peer group of comparable funds dedicated to insurance products and any fall-out benefits likely to accrue to Management or Neuberger or their affiliates from their relationship with the Fund. The Board also considered the profitability of Management and its affiliates from their association with the Fund.
The Board reviewed a comparison of the Fund's management fee and overall expense ratio to a peer group of broadly comparable funds dedicated to insurance products. The Board considered the mean and median of the management fees and expense ratios of the peer group. The Board noted that the Fund's management fee was higher than the peer group mean and median. The Board considered whether specific portfolio management or administration needs contributed to the management fee. With regard to the sub-advisory fee paid to Neuberger, the Board noted that this fee is "at cost." In addition, the Board considered the contractual and voluntary limits on Fund expenses undertaken by Management.
The Board considered whether there were other funds that were advised or sub-advised by Management or its affiliates or separate accounts managed by Management or its affiliates with similar investment objectives, policies and strategies to the Fund. The Board compared the fees charged to the Fund to the fees charged to advised funds, a sub-advised fund and a separate account, each managed in a similar style to the Fund. The Board considered the appropriateness and reasonableness of any differences between the fees charged to the Fund and the other funds and account and determined that the differences in fees were consistent with the management and other services provided.
The Board also evaluated any apparent or anticipated economies of scale in relation to the services Management provides to the Fund. The Board considered whether the Fund's fee structure provides for a reduction of payments resulting from the use of breakpoints and whether those breakpoints are set at appropriate asset levels.
The Board also considered changes in management, staffing, resources and operations accompanying the separation of the Neuberger Berman entities from the LBHI bankruptcy estate.
In concluding that the benefits accruing to Management and its affiliates by virtue of their relationship to the Fund were reasonable in comparison with the costs of providing the investment advisory services and the benefits accruing to the Fund, the Board reviewed specific data as to Management's profit on the Fund for a recent period and the trend in profit or loss over recent years. The Board also carefully examined Management's cost allocation methodology. The Board recognized that Management should be entitled to earn a reasonable level of profits for services it provides to the Fund and, based on its review, concluded that Management's level of profitability was not excessive.
34
Conclusions
In approving the Agreements, the Board concluded that the terms of each Agreement are fair and reasonable and that approval of the Agreements is in the best interests of the Fund and its shareholders. In reaching this determination, the Board considered that Management and Neuberger could be expected to provide a high level of service to the Fund; that it retained confidence in Management's and Neuberger's capabilities to manage the Fund; that the Fund's fee structure appeared to the Board to be reasonable given the nature and quality of services provided; and that the benefits accruing to Management and its affiliates by virtue of their relationship to the Fund were reasonable in comparison with the benefits accruing to the Fund.
35

Neuberger Berman
Advisers Management Trust
Mid-Cap Growth Portfolio
I Class Shares
S Class Shares
Annual Report
December 31, 2010
Mid-Cap Growth Portfolio Manager's Commentary
The Neuberger Berman Advisers Management Trust (AMT) Mid-Cap Growth Portfolio turned in solid results for full-year 2010, posting a positive return and outperforming its benchmark, the Russell Midcap(R) Growth Index.
The year started on a positive note, with many of the market advances in 2009 remaining in place. Markets saw the continuation of the type of low quality rally that is typical for a period following a recession. Within mid-cap stocks, however, the market's character began to change fairly soon. As early as March and April, the difference in performance between lower and higher quality stocks had declined significantly. As the higher-quality growth stocks that the Portfolio tends to own came back in favor, stock selection began to make more of an impact on performance.
In late spring and early summer, the European sovereign debt crisis and other concerns caused a sharp correction, but by August, the overhang was gone. This was supported by the European Union's resolve, reduced concern about slower growth in China, and improving economic indicators. One of the most important catalysts, however, was Federal Reserve Chairman Bernanke's proposal of additional quantitative easing aimed at underpinning the recovery. This prospect cheered the markets as growth for the rest of 2010 and 2011 began to look more promising. For the full year, the Russell Midcap Growth Index had advanced by over 26%.
Corporate earnings were strong throughout 2010, and the rally was relatively broad-based, with the Consumer Discretionary, Industrials and Materials sectors benefiting the most for the year. Within the Portfolio, strong stock selection allowed us to add value in eight of 10 industry sectors, with particular strength in Information Technology (IT), Energy and Industrials.
Within IT, contributors included F5 Networks, a network optimization company, and Juniper Networks, a similar "picks and shovels" type company. Rovi, within our Digital Media/Cloud theme, was also strong. Rovi is focused on improving digital media experiences. Dolby Labs, a large holding within the theme, also outperformed. Enterprise database management companies Informatica and Sybase were also additive. Informatica remains a large holding, while Sybase was purchased by SAP. Disappointments included VistaPrint, an online stationery and marketing materials publisher that underperformed as new business formation slowed. Projected weak earnings worked against our belief that the company's competitive offering would insulate it, and the position was sold. After a good first half, data center Equinix declined sharply in October and was sold as questions arose around their pricing model and demand.
Within Energy, Concho Resources was a significant contributor to our outperformance this year. An exploration and production company, Concho benefited from both increased production and higher oil prices. CARBO Ceramics, a manufacturer of proppants used in extracting oil and gas from shale, advanced on both growth in shale drilling and competitive advantages. Underperformers included Southwestern Energy and Range Resources due to a decline in natural gas prices. As a result, both were sold.
In the Industrials sector, standout performers included long-term holding Stericycle, a medical waste company. A niche business under an excellent management team, Stericycle continues to deliver steady results. Broad-based industrial companies AMETEK and Roper also performed well, enjoying an uptick in business from the improving economy.
Two Health Care sector holdings bear mentioning. Alexion, a biotech firm focused on rare but serious diseases, was a top contributor. Its successful pulmonary disease treatment is in clinical trials as a treatment for a rare kidney disease. Edwards Lifesciences was another standout performer. Promising clinical trial results suggest its heart valve, delivered via catheter rather than open-heart surgery, could be a breakthrough product.
Within Consumer Discretionary, the only area of the Portfolio that underperformed significantly was for-profit education. Both Strayer and DeVry were down sharply due to regulatory pressures although their fundamentals were positive for most of the year. These formerly large positions were reduced or sold as the year progressed.
Entering 2011, domestic economic growth appears stronger, with many economists raising forecasts, and emerging markets growth continues, even as China works to contain inflation. Capital spending is on an uptick, domestically and globally, driving much of the growth. In the second half of the year, we anticipate that the economy and earnings may decelerate
1
somewhat, but with fewer headwinds than in 2010. As a result, we are cautiously optimistic for the market. A combination of fair valuations, positive economic growth, and low interest rates and inflation is typically a formula for improving stock prices. In our opinion, unemployment is likely to remain uncomfortably high as companies accustomed to lean operations may be slow to add jobs. We also believe housing continues to be a concern, as does the European sovereign debt situation.
Within the Portfolio, at year-end we were overweighted in Information Technology, Industrials, Health Care and Energy versus the benchmark, which we believe modestly positioned the Portfolio for a better economy. We were underweighted in Financials, Materials and Consumer Discretionary due to concerns about unemployment and having already taken profits in its strength. As always, our focus is on identifying unique companies with strong top line growth and exceptional products and services, with the management teams, operating models, and balance sheet strength needed to execute in a competitive global economy.
Sincerely,

Kenneth J. Turek
Portfolio Manager
The risks involved in seeking capital appreciation from investments primarily in companies with mid-market capitalization are set forth in the prospectus and statement of additional information.
Mid-capitalization stocks are more vulnerable to financial risks and other risks than stocks of larger companies. They also trade less frequently and in lower volume than larger company stocks, so their market prices tend to be more volatile.
The composition, industries and holdings of the Portfolio are subject to change. The AMT Mid-Cap Growth Portfolio is invested in a wide array of stocks and no single holding makes up a significant portion of the Portfolio's total assets.
2
Mid-Cap Growth Portfolio (Unaudited)
SECTOR ALLOCATION
| (% of Total Investments) | |
| Consumer Discretionary | | | 17.3 | % | |
| Consumer Staples | | | 2.8 | | |
| Energy | | | 7.2 | | |
| Financials | | | 5.1 | | |
| Health Care | | | 13.5 | | |
| Industrials | | | 19.5 | | |
| Information Technology | | | 27.7 | | |
| Materials | | | 1.8 | | |
| Telecommunication Services | | | 4.1 | | |
| Short-Term | | | 1.0 | | |
| Total | | | 100.0 | % | |
PERFORMANCE HIGHLIGHTS1
| | | Inception | | Average Annual Total
Return Ended 12/31/2010 | |
| | | Date | | 1 Year | | 5 Years | | 10 Years | | Life of Fund* | |
Mid-Cap Growth
Portfolio Class I | | |
11/03/1997 | | | | 29.04 | % | | | 6.22 | % | | | 2.01 | % | | | 8.24 | % | |
Mid-Cap Growth
Portfolio Class S2 | | |
02/18/2003 | | | | 28.75 | % | | | 5.97 | % | | | 1.80 | % | | | 8.07 | % | |
Russell Midcap(R)
Growth Index3 | | | | | | | 26.38 | % | | | 4.88 | % | | | 3.12 | % | | | 6.13 | % | |
Russell Midcap(R)
Index3 | | | | | | | 25.48 | % | | | 4.66 | % | | | 6.54 | % | | | 8.11 | % | |
Performance data quoted represent past performance, which is no guarantee of future results. The investment return and principal value of an investment will fluctuate so that an investor's shares, when redeemed, may be worth more or less than their original cost. Results are shown on a "total return" basis and include reinvestment of all income dividends and distributions.
Current performance may be lower or higher than the performance data quoted. For performance data current to the most recent month end, please visit https://www.nb.com.
* Index returns are as of the inception date 11/03/1997.
As stated in the Portfolio's most recent prospectus, the total annual operating expense ratio for fiscal year 2009 was 1.01% and 1.27% for Class I and Class S shares, respectively (prior to any fee waivers or expense reimbursements). The expense ratio net of waivers and reimbursements was 1.25% for Class S shares. Neuberger Berman Management LLC has contractually agreed to limit certain expenses of the Portfolio through 12/31/2013 for Class I and Class S shares.
COMPARISON OF A $10,000 INVESTMENT
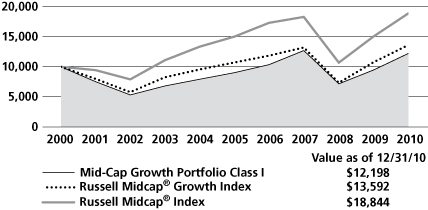
This chart shows the value of a hypothetical $10,000 investment in the Portfolio over the past 10 fiscal years, or since the Portfolio's inception, if it has not operated for 10 years. The graph is based on Class I shares only; performance of other classes will vary due to differences in fee structures (see Performance Highlights chart above). The result is compared with one or more benchmarks, which may include a broad-based market index and/or a narrower index. Please note that market indices have not been reduced to reflect any of the fees and costs of investing. All results include the reinvestment of income dividends and distributions. Neither the Portfolio's returns nor the market indices shown in the graph and table reflect the effect of taxes an investor would pay on Portfolio distributions or on the redemption of Portfolio shares. Results represent past performance and do not indicate future results.
Please see Endnotes for additional information.
3
Endnotes
1 "Total Return" includes reinvestment of all income dividends and distributions. Results represent past performance and do not indicate future results. The value of an investment in the Portfolio and the return on the investment both will fluctuate, and redemption proceeds may be higher or lower than an investor's original cost. The performance information does not reflect fees and expenses of the variable annuity and variable life insurance policies or the qualified pension retirement plans whose proceeds are invested in the Portfolio. Neuberger Berman Management LLC ("NBM LLC") has agreed to absorb certain expenses of the AMT Portfolios, including the Portfolio. Without this arrangement, which is subject to change, the total returns of the Portfolio may have been less.
2 Performance shown prior to February 18, 2003 for the Class S shares is of the Class I shares, which have lower expenses and correspondingly higher returns than the Class S shares.
3 The Russell Midcap(R) Growth Index measures the performance of those Russell Midcap(R) Index companies with higher price-to-book ratios and higher forecasted growth values. The Russell Midcap Index measures the performance of the 800 smallest companies in the Russell 1000(R) Index, which represents approximately 27% of the total market capitalization of the Russell 1000 Index (which, in turn, consists of the 1,000 largest U.S. companies, based on market capitalization). Please note that indices do not take into account any fees and expenses of investing in the individual securities that they track and that individuals cannot invest directly in any index. Data about the performance of these indices are prepared or obtained by NBM LLC and include reinvestment of all income dividends and distributions. The Portfolio may invest in many securities not included in the above-described indices or may not invest in all securities included in the above-described indices.
Any ratios or other measurements using a factor of forecasted earnings of a company discussed herein are based on consensus estimates, not NBM LLC's own projections, and they may or may not be realized. In addition, any revision to a forecast could affect the market price of a security. By quoting them herein, NBM LLC does not offer an opinion as to the accuracy of and does not guarantee these forecasted numbers.
The investments for the Portfolio are managed by the same portfolio manager(s) who manage one or more other mutual funds that have similar names, investment objectives and investment styles as the Portfolio. You should be aware that the Portfolio is likely to differ from the other mutual funds in size, cash flow pattern and tax matters. Accordingly, the holdings and performance of the Portfolio can be expected to vary from those of the other mutual funds.
The composition, industries and holdings of the Portfolio are subject to change.
Shares of the separate AMT Portfolios are not available to the general public. Shares of this Portfolio may be purchased only by life insurance companies to be used with their separate accounts that fund variable annuity and variable life insurance policies and by qualified pension and retirement plans.
Statistics and projections in this report are derived from sources deemed to be reliable but cannot be regarded as a representation of future results of the AMT Portfolios. This report is prepared for the general information of shareholders and is not an offer of shares of the AMT Portfolios. Shares of the AMT Portfolios are sold only through the currently effective prospectuses, which must precede or accompany this report.
The "Neuberger Berman" name and logo are registered service marks of Neuberger Berman Group LLC. "Neuberger Berman Management LLC" and the individual Fund names in this piece are either service marks or registered service marks of Neuberger Berman Management LLC.
(c) 2011 Neuberger Berman Management LLC distributor. All rights reserved.
4
Information About Your Fund's Expenses
This table is designed to provide information regarding costs related to your investments. All mutual funds incur operating expenses, which include management fees, fees for administrative services and costs of shareholder reports, among others. The following examples are based on an investment of $1,000 made at the beginning of the six month period ended December 31, 2010 and held for the entire period. The table illustrates the fund's costs in two ways:
| Actual Expenses and Performance: | | The first section of the table provides information about actual account values and actual expenses in dollars, based on the fund's actual performance during the period. You may use the information in this line, together with the amount you invested, to estimate the expenses you paid over the period. Simply divide your account value by $1,000 (for example, an $8,600 account value divided by $1,000 = 8.6), then multiply the result by the number in the first section of the table under the heading entitled "Expenses Paid During the Period" to estimate the expenses you paid over the period. | |
|
Hypothetical Example for
Comparison Purposes: | | The second section of the table provides information about hypothetical account values and hypothetical expenses based on the fund's actual expense ratio and an assumed rate of return at 5% per year before expenses. This return is not the fund's actual return. The hypothetical account values and expenses may not be used to estimate the actual ending account balance or expenses you paid for the period. You may use this information to compare the ongoing costs of investing in this fund versus other funds. To do so, compare the expenses shown in this 5% hypothetical example with the 5% hypothetical examples that appear in the shareholder reports of other funds. | |
|
Please note that the expenses in the table are meant to highlight your ongoing costs only. The table and expense example do not include any transaction costs, such as fees and expenses that are, or may be, imposed under your variable contract or qualified pension plan. Therefore, the information under the heading "Hypothetical (5% annual return before expenses)" is useful in comparing ongoing costs only, and will not help you determine the relative total costs of owning different funds. In addition, if these transaction costs were included, your costs would have been higher.
Expense Information as of 12/31/10 (Unaudited)
NEUBERGER BERMAN ADVISERS MANAGEMENT TRUST MID-CAP GROWTH PORTFOLIO
| Actual | | Beginning Account
Value
7/1/10 | | Ending Account
Value
12/31/10 | | Expenses Paid
During the Period*
7/1/10 - 12/31/10 | | Expense
Ratio | |
| Class I | | $ | 1,000.00 | | | $ | 1,295.80 | | | $ | 5.96 | | | | 1.03 | % | |
| Class S | | $ | 1,000.00 | | | $ | 1,294.30 | | | $ | 7.23 | | | | 1.25 | % | |
| Hypothetical (5% annual return before expenses)** | |
| Class I | | $ | 1,000.00 | | | $ | 1,020.01 | | | $ | 5.24 | | | | 1.03 | % | |
| Class S | | $ | 1,000.00 | | | $ | 1,018.90 | | | $ | 6.36 | | | | 1.25 | % | |
* For each class, expenses are equal to the annualized expense ratio for the class, multiplied by the average account value over the period, multiplied by 184/365 (to reflect the one-half year period shown).
** Hypothetical 5% annual return before expenses is calculated by multiplying the number of days in the most recent half year divided by 365.
5
Schedule of Investments Mid-Cap Growth Portfolio
| NUMBER OF SHARES | | | | VALUEt | |
| Common Stocks (99.1%) | | | |
| Aerospace & Defense (2.1%) | | | |
| | 56,400 | | | BE Aerospace | | $ | 2,088,492 | * | |
| | 29,900 | | | HEICO Corp. | | | 1,525,797 | | |
| | 22,100 | | | Precision Castparts | | | 3,076,541 | | |
| | | | 6,690,830 | | |
| Air Freight & Logistics (1.9%) | | | |
| | 78,900 | | | C.H. Robinson Worldwide | | | 6,326,991 | | |
| Auto Components (1.9%) | | | |
| | 45,000 | | | BorgWarner, Inc. | | | 3,256,200 | * | |
| | 98,000 | | | Gentex Corp. | | | 2,896,880 | | |
| | | | 6,153,080 | | |
| Biotechnology (2.0%) | | | |
| | 65,000 | | | Alexion Pharmaceuticals | | | 5,235,750 | * | |
| | 44,100 | | | BioMarin Pharmaceutical | | | 1,187,613 | * | |
| | | | 6,423,363 | | |
| Capital Markets (1.9%) | | | |
| | 38,700 | | | Affiliated Managers Group | | | 3,839,814 | * | |
| | 93,100 | | | SEI Investments | | | 2,214,849 | | |
| | | | 6,054,663 | | |
| Chemicals (1.2%) | | | |
| | 68,600 | | | Nalco Holding | | | 2,191,084 | | |
| | 27,900 | | | Sigma-Aldrich | | | 1,857,024 | | |
| | | | 4,048,108 | | |
| Commercial Services & Supplies (2.0%) | | | |
| | 80,900 | | | Stericycle, Inc. | | | 6,546,428 | * | |
| Communications Equipment (1.9%) | | | |
| | 30,000 | | | F5 Networks | | | 3,904,800 | * | |
| | 60,000 | | | Juniper Networks | | | 2,215,200 | * | |
| | | | 6,120,000 | | |
| Computers & Peripherals (1.1%) | | | |
| | 63,700 | | | NetApp, Inc. | | | 3,500,952 | * | |
| Diversified Consumer Services (0.4%) | | | |
| | 29,400 | | | DeVry, Inc. | | | 1,410,612 | | |
| Diversified Financial Services (2.2%) | | | |
| | 27,400 | | | IntercontinentalExchange Inc. | | | 3,264,710 | * | |
| | 98,000 | | | MSCI Inc. Class A | | | 3,818,080 | * | |
| | | | 7,082,790 | | |
| NUMBER OF SHARES | | | | VALUEt | |
| Electrical Equipment (3.9%) | | | |
| | 102,900 | | | AMETEK, Inc. | | $ | 4,038,825 | | |
| | 30,900 | | | Polypore International | | | 1,258,557 | * | |
| | 49,000 | | | Roper Industries | | | 3,745,070 | | |
| | 125,000 | | | Sensata Technologies Holding | | | 3,763,750 | * | |
| | | | 12,806,202 | | |
Electronic Equipment, Instruments &
Components (5.0%) | | | |
| | 61,300 | | | Amphenol Corp. Class A | | | 3,235,414 | | |
| | 71,100 | | | Dolby Laboratories Class A | | | 4,742,370 | * | |
| | 98,000 | | | National Instruments | | | 3,688,720 | | |
| | 112,700 | | | Trimble Navigation | | | 4,500,111 | * | |
| | | | 16,166,615 | | |
| Energy Equipment & Services (4.1%) | | | |
| | 44,100 | | | Cameron International | | | 2,237,193 | * | |
| | 42,500 | | | CARBO Ceramics | | | 4,400,450 | | |
| | 51,000 | | | Core Laboratories N.V. | | | 4,541,550 | | |
| | 34,300 | | | Oil States International | | | 2,198,287 | * | |
| | | | 13,377,480 | | |
| Food & Staples Retailing (0.5%) | | | |
| | 10,200 | | | Fresh Market | | | 420,240 | * | |
| | 26,000 | | | Whole Foods Market | | | 1,315,340 | * | |
| | | | 1,735,580 | | |
| Food Products (1.4%) | | | |
| | 72,000 | | | Mead Johnson Nutrition | | | 4,482,000 | | |
| Health Care Equipment & Supplies (4.1%) | | | |
| | 51,500 | | | Edwards Lifesciences | | | 4,163,260 | * | |
| | 7,300 | | | Intuitive Surgical | | | 1,881,575 | * | |
| | 102,900 | | | NxStage Medical | | | 2,560,152 | * | |
| | 54,900 | | | ResMed Inc. | | | 1,901,736 | * | |
| | 107,800 | | | Volcano Corp. | | | 2,944,018 | * | |
| | | | 13,450,741 | | |
| Health Care Providers & Services (2.5%) | | | |
| | 80,900 | | | Express Scripts | | | 4,372,645 | * | |
| | 58,800 | | | HMS Holdings | | | 3,808,476 | * | |
| | | | 8,181,121 | | |
| Health Care Technology (1.7%) | | | |
| | 39,200 | | | Cerner Corp. | | | 3,713,808 | * | |
| | 24,500 | | | Quality Systems | | | 1,710,590 | | |
| | | | 5,424,398 | | |
See Notes to Schedule of Investments
6
| NUMBER OF SHARES | | | | VALUEt | |
| Hotels, Restaurants & Leisure (2.1%) | | | |
| | 49,000 | | | Hyatt Hotels Class A | | $ | 2,242,240 | * | |
| | 98,000 | | | WMS Industries | | | 4,433,520 | * | |
| | | | 6,675,760 | | |
| Household Products (0.9%) | | | |
| | 43,100 | | | Church & Dwight | | | 2,974,762 | | |
| Internet Software & Services (0.5%) | | | |
| | 53,900 | | | Rackspace Hosting | | | 1,692,999 | * | |
| IT Services (2.9%) | | | |
| | 66,600 | | | Cognizant Technology | | | 4,881,114 | * | |
| | | | | Solutions Class A | | | | | |
| | 117,600 | | | Sapient Corp. | | | 1,422,960 | | |
| | 83,300 | | | VeriFone Systems | | | 3,212,048 | * | |
| | | | 9,516,122 | | |
| Leisure Equipment & Products (0.8%) | | | |
| | 56,400 | | | Hasbro, Inc. | | | 2,660,952 | | |
| Life Science Tools & Services (0.4%) | | | |
| | 21,100 | | | Illumina, Inc. | | | 1,336,474 | * | |
| Machinery (4.8%) | | | |
| | 36,800 | | | Cummins Inc. | | | 4,048,368 | | |
| | 88,200 | | | Danaher Corp. | | | 4,160,394 | | |
| | 30,000 | | | Donaldson Co. | | | 1,748,400 | | |
| | 22,100 | | | Flowserve Corp. | | | 2,634,762 | | |
| | 58,800 | | | Pall Corp. | | | 2,915,304 | | |
| | | | 15,507,228 | | |
| Media (2.2%) | | | |
| | 63,700 | | | Discovery Communications | | | 2,656,290 | * | |
| | | | | Class A | | | | | |
| | 67,500 | | | Focus Media Holding ADR | | | 1,480,275 | * | |
| | 58,800 | | | Scripps Networks Interactive | | | 3,042,900 | | |
| | | | | Class A | | | | | |
| | | | 7,179,465 | | |
| Metals & Mining (0.6%) | | | |
| | 24,500 | | | Cliffs Natural Resources | | | 1,911,245 | | |
| Multiline Retail (2.3%) | | | |
| | 75,000 | | | Dollar Tree | | | 4,206,000 | * | |
| | 77,400 | | | Nordstrom, Inc. | | | 3,280,212 | | |
| | | | 7,486,212 | | |
| Oil, Gas & Consumable Fuels (3.1%) | | | |
| | 78,400 | | | Concho Resources | | | 6,873,328 | * | |
| | 27,000 | | | Whiting Petroleum | | | 3,164,130 | * | |
| | | | 10,037,458 | | |
| NUMBER OF SHARES | | | | VALUEt | |
| Pharmaceuticals (2.8%) | | | |
| | 50,000 | | | Perrigo Co. | | $ | 3,166,500 | | |
| | 76,000 | | | Salix Pharmaceuticals | | | 3,568,960 | * | |
| | 44,100 | | | Watson Pharmaceuticals | | | 2,277,765 | * | |
| | | | 9,013,225 | | |
| Professional Services (1.6%) | | | |
| | 30,000 | | | Manpower Inc. | | | 1,882,800 | | |
| | 98,000 | | | Verisk Analytics Class A | | | 3,339,840 | * | |
| | | | 5,222,640 | | |
Real Estate Management &
Development (1.0%) | | | |
| | 39,200 | | | Jones Lang LaSalle | | | 3,289,664 | | |
| Road & Rail (1.1%) | | | |
| | 85,300 | | | J.B. Hunt Transport Services | | | 3,481,093 | | |
Semiconductors & Semiconductor
Equipment (5.1%) | | | |
| | 79,400 | | | Analog Devices | | | 2,990,998 | | |
| | 143,100 | | | Avago Technologies | | | 4,074,057 | | |
| | 156,800 | | | Marvell Technology Group | | | 2,908,640 | * | |
| | 107,800 | | | Microchip Technology | | | 3,687,838 | | |
| | 83,300 | | | Varian Semiconductor | | | 3,079,601 | * | |
| | | | | Equipment Associates | | | | | |
| | | | 16,741,134 | | |
| Software (11.2%) | | | |
| | 50,000 | | | Adobe Systems | | | 1,539,000 | * | |
| | 88,200 | | | ANSYS, Inc. | | | 4,592,574 | * | |
| | 22,500 | | | BMC Software | | | 1,060,650 | * | |
| | 58,800 | | | Check Point Software | | | 2,720,088 | * | |
| | | | | Technologies | | | | | |
| | 53,900 | | | Citrix Systems | | | 3,687,299 | * | |
| | 107,800 | | | Informatica Corp. | | | 4,746,434 | * | |
| | 61,300 | | | MICROS Systems | | | 2,688,618 | * | |
| | 71,100 | | | QLIK Technologies | | | 1,835,091 | * | |
| | 33,800 | | | RealD Inc. | | | 876,096 | * | |
| | 30,000 | | | Red Hat | | | 1,369,500 | * | |
| | 98,000 | | | Rovi Corp. | | | 6,076,980 | * | |
| | 22,100 | | | Salesforce.com, Inc. | | | 2,917,200 | * | |
| | 44,100 | | | Solera Holdings | | | 2,263,212 | | |
| | | | 36,372,742 | | |
| Specialty Retail (5.8%) | | | |
| | 80,400 | | | Bed Bath & Beyond | | | 3,951,660 | * | |
| | 53,900 | | | Dick's Sporting Goods | | | 2,021,250 | * | |
| | 35,000 | | | Jo-Ann Stores | | | 2,107,700 | * | |
| | 25,000 | | | O'Reilly Automotive | | | 1,510,500 | * | |
| | 53,900 | | | Ross Stores | | | 3,409,175 | | |
| | 93,100 | | | Urban Outfitters | | | 3,333,911 | * | |
| | 68,600 | | | Williams-Sonoma | | | 2,448,334 | | |
| | | | 18,782,530 | | |
See Notes to Schedule of Investments
7
| NUMBER OF SHARES | | | | VALUEt | |
| Textiles, Apparel & Luxury Goods (1.8%) | | | |
| | 63,700 | | | Coach, Inc. | | $ | 3,523,247 | | |
| | 39,200 | | | Phillips-Van Heusen | | | 2,469,992 | | |
| | | | 5,993,239 | | |
| Trading Companies & Distributors (2.1%) | | | |
| | 84,300 | | | Fastenal Co. | | | 5,050,413 | | |
| | 12,300 | | | W.W. Grainger | | | 1,698,753 | | |
| | | | 6,749,166 | | |
| Wireless Telecommunication Services (4.2%) | | | |
| | 63,700 | | | American Tower Class A | | | 3,289,468 | * | |
| | 90,700 | | | NII Holdings | | | 4,050,662 | * | |
| | 151,900 | | | SBA Communications Class A | | | 6,218,786 | * | |
| | | | 13,558,916 | | |
| | | | | Total Common Stocks
(Cost $196,050,728) | | | 322,164,980 | | |
| Short-Term Investments (0.9%) | | | |
| 3,094,249
| | | State Street Institutional
Liquid Reserves Fund
Institutional Class
(Cost $3,094,249) | | | 3,094,249
| | |
| | | | | Total Investments (100.0%)
(Cost $199,144,977) | | | 325,259,229 | ## | |
| | | | | Liabilities, less cash, receivables and
other assets [(0.0%)] | | | (42,240 | ) | |
| | | | | Total Net Assets (100.0%) | | $ | 325,216,989 | | |
See Notes to Schedule of Investments
8
Notes to Schedule of Investments Mid-Cap Growth Portfolio
t In accordance with Accounting Standards Codification ("ASC") 820 "Fair Value Measurements and Disclosures" ("ASC 820"), all investments held by Neuberger Berman Advisers Management Trust Mid-Cap Growth Portfolio (the "Fund") are carried at the value that Neuberger Berman Management LLC ("Management") believes the Fund would receive upon selling an investment in an orderly transaction to an independent buyer in the principal or most advantageous market for the investment under current market conditions. Various inputs, including the volume and level of activity for the asset or liability in the market, are considered in valuing the Fund's investments, some of which are discussed below. Significant management judgment may be necessary to value investments in accordance with ASC 820.
ASC 820 established a three-tier hierarchy of inputs to create a classification of value measurements for disclosure purposes. The three-tier hierarchy of inputs is summarized in the three broad Levels listed below.
. Level 1 - quoted prices in active markets for identical investments
. Level 2 - other significant observable inputs (including quoted prices for similar investments, interest rates, prepayment speeds, credit risk, amortized cost, etc.)
. Level 3 - significant unobservable inputs (including the Fund's own assumptions in determining the fair value of investments)
The inputs or methodology used for valuing an investment are not necessarily an indication of the risk associated with investing in those securities.
The value of the Fund's investments in equity securities, for which market quotations are readily available, is generally determined by Management by obtaining valuations from an independent pricing service based on the latest sale price quoted in active markets (Level 1 inputs). Securities traded primarily on the NASDAQ Stock Market are normally valued by the Fund at the NASDAQ Official Closing Price ("NOCP") provided by NASDAQ each business day. The NOCP is the most recently reported price as of 4:00:02 p.m., Eastern time, unless that price is outside the range of the "inside" bid and asked prices (i.e., the bid and asked prices that dealers quote to each other when trading for their own accounts); in that case, NASDAQ will adjust the price to equal the inside bid or asked price, whichever is closer. Because of delays in reporting trades, the NOCP may not be based on the price of the last trade to occur before the market closes. If there is no reported sale of a security on a particular day, the independent pricing service may value the security based on reported market quotations.
Management has developed a process to periodically review information provided by independent pricing services for all types of securities.
Investments in State Street Institutional Liquid Reserves Fund Institutional Class are valued using the fund's daily calculated net asset value ("NAV").
For equity securities, if a valuation is not available from an independent pricing service, or if Management has reason to believe that the valuation received does not represent the amount the Fund might reasonably expect to receive on a current sale in an orderly transaction, the Fund seeks to obtain quotations from principal market makers (generally considered Level 3 inputs). If such quotations are not readily available, the security is valued using methods the Board of Trustees of Neuberger Berman Advisers Management Trust (the "Board") has approved on the belief that they reflect fair value. Numerous factors may be considered when determining the fair value of a security based on Level 2 or 3 inputs, including available analyst, media or other reports, trading in futures or ADRs and whether the issuer of the security being fair valued has other securities outstanding.
The value of the Fund's investments in foreign securities is generally determined using the same valuation methods and inputs as other Fund investments, as discussed above. Foreign security prices are expressed in local currency values and are translated from the local currency into U.S. dollars using the exchange rates as of 4:00 p.m., Eastern
See Notes to Financial Statements
9
Notes to Schedule of Investments Mid-Cap Growth Portfolio (cont'd)
time. The Board has approved the use of Interactive Data Pricing and Reference Data, Inc. ("Interactive") to assist in determining the fair value of foreign equity securities when changes in the value of a certain index suggest that the closing prices on the foreign exchanges may no longer represent the amount that the Fund could expect to receive for those securities. In this event, Interactive will provide adjusted prices for certain foreign equity securities using a statistical analysis of historical correlations of multiple factors (Level 2 inputs). In the absence of precise information about the market values of these foreign securities as of the close of the New York Stock Exchange, the Board has determined on the basis of available data that prices adjusted in this way are likely to be closer to the prices the Fund could realize on a current sale than are the prices of those securities established at the close of the foreign markets in which the securities primarily trade. These fair value prices are necessarily estimates, and there is no assurance that such a price will be at or close to the price at which the security is next quoted or next trades.
The following is a summary, categorized by Level, of inputs used to value the Fund's investments as of December 31, 2010:
| Asset Valuation Inputs | | Level 1 | | Level 2 | | Level 3 | | Total | |
| Investments: | |
| Common Stocks^ | | $ | 322,164,980 | | | $ | -- | | | $ | -- | | | $ | 322,164,980 | | |
| Short-Term Investments | | | -- | | | | 3,094,249 | | | | -- | | | | 3,094,249 | | |
| Total Investments | | $ | 322,164,980 | | | $ | 3,094,249 | | | $ | -- | | | $ | 325,259,229 | | |
^ The Schedule of Investments provides information on the industry categorization for the portfolio.
The Fund had no significant transfers between Levels 1 and 2 during the year ended December 31, 2010.
## At December 31, 2010, the cost of investments for U.S. federal income tax purposes was $200,387,997. Gross unrealized appreciation of investments was $125,233,323 and gross unrealized depreciation of investments was $362,091, resulting in net unrealized appreciation of $124,871,232, based on cost for U.S. federal income tax purposes.
* Security did not produce income during the last twelve months.
See Notes to Financial Statements
10
Statement of Assets and Liabilities
Neuberger Berman Advisers Management Trust
| | | MID-CAP GROWTH
PORTFOLIO | |
| | | December 31, 2010 | |
| Assets | |
| Investments in securities, at value* (Notes A & F)--see Schedule of Investments: | |
| Unaffiliated issuers | | $ | 325,259,229 | | |
| Cash | | | 1 | | |
| Dividends and interest receivable | | | 72,256 | | |
| Receivable for securities sold | | | 210,776 | | |
| Receivable for Fund shares sold | | | 31,955 | | |
| Prepaid expenses and other assets | | | 6,874 | | |
| Total Assets | | | 325,581,091 | | |
| Liabilities | |
| Payable for Fund shares redeemed | | | 55,343 | | |
| Payable to investment manager (Notes A & B) | | | 148,434 | | |
| Payable to administrator--net (Note B) | | | 91,581 | | |
| Accrued expenses and other payables | | | 68,744 | | |
| Total Liabilities | | | 364,102 | | |
| Net Assets at value | | $ | 325,216,989 | | |
| Net Assets consist of: | |
| Paid-in capital | | $ | 282,055,550 | | |
| Accumulated net realized gains (losses) on investments | | | (82,952,813 | ) | |
| Net unrealized appreciation (depreciation) in value of investments | | | 126,114,252 | | |
| Net Assets at value | | $ | 325,216,989 | | |
| Net Assets | |
| Class I | | $ | 265,986,405 | | |
| Class S | | | 59,230,584 | | |
| Shares Outstanding ($.001 par value; unlimited shares authorized) | |
| Class I | | | 9,701,759 | | |
| Class S | | | 2,203,998 | | |
| Net Asset Value, offering and redemption price per share | |
| Class I | | $ | 27.42 | | |
| Class S | | | 26.87 | | |
| *Cost of Investments: | | | |
| Unaffiliated issuers | | $ | 199,144,977 | | |
See Notes to Financial Statements
11
Statement of Operations
Neuberger Berman Advisers Management Trust
| | | MID-CAP GROWTH
PORTFOLIO | |
| | | For the
Year Ended
December 31, 2010 | |
| Investment Income: | |
| Income (Note A): | |
| Dividend income--unaffiliated issuers | | $ | 1,461,276 | | |
| Interest Income--unaffiliated issuers | | | 6,851 | | |
| Income from securities loaned--net (Note F) | | | 43,506 | | |
| Foreign taxes withheld | | | (6,942 | ) | |
| Total income | | $ | 1,504,691 | | |
| Expenses: | |
| Investment management fees (Notes A & B) | | | 1,575,977 | | |
| Administration fees (Note B): | |
| Class I | | | 721,206 | | |
| Class S | | | 143,638 | | |
| Distribution fees (Note B): | |
| Class S | | | 119,698 | | |
| Audit fees | | | 40,900 | | |
| Custodian fees (Note B) | | | 97,779 | | |
| Insurance expense | | | 22,118 | | |
| Legal fees | | | 134,438 | | |
| Shareholder reports | | | 108,420 | | |
| Trustees' fees and expenses | | | 52,324 | | |
| Miscellaneous | | | 30,104 | | |
| Total expenses | | | 3,046,602 | | |
| Expenses reimbursed by Management (Note B) | | | (7,615 | ) | |
| Expenses reduced by custodian fee expense offset arrangement (Note B) | | | (8 | ) | |
| Total net expenses | | | 3,038,979 | | |
| Net investment income (loss) | | $ | (1,534,288 | ) | |
| Realized and Unrealized Gain (Loss) on Investments (Note A) | |
| Net realized gain (loss) on: | |
| Sales of investment securities of unaffiliated issuers | | | 26,136,617 | | |
| Sales of investment securities of affiliated issuers | | | 14,189 | | |
| Change in net unrealized appreciation (depreciation) in value of: | |
| Unaffiliated investment securities | | | 49,484,663 | | |
| Net gain (loss) on investments | | | 75,635,469 | | |
| Net increase (decrease) in net assets resulting from operations | | $ | 74,101,181 | | |
See Notes to Financial Statements
12
Statements of Changes in Net Assets
Neuberger Berman Advisers Management Trust
| | | MID-CAP GROWTH PORTFOLIO | |
| | | Year Ended
December 31,
2010 | | Year Ended
December 31,
2009 | |
| Increase (Decrease) in Net Assets: | |
| From Operations (Note A): | |
| Net investment income (loss) | | $ | (1,534,288 | ) | | $ | (618,958 | ) | |
| Net realized gain (loss) on investments | | | 26,150,806 | | | | (22,907,308 | ) | |
| Change in net unrealized appreciation (depreciation) of investments | | | 49,484,663 | | | | 108,221,548 | | |
| Net increase (decrease) in net assets resulting from operations | | | 74,101,181 | | | | 84,695,282 | | |
| From Fund Share Transactions (Note D): | |
| Proceeds from shares sold: | |
| Class I | | | 15,025,210 | | | | 9,223,332 | | |
| Class S | | | 15,437,784 | | | | 6,171,251 | | |
| Payments for shares redeemed: | |
| Class I | | | (44,837,450 | ) | | | (194,245,844 | ) | |
| Class S | | | (11,719,211 | ) | | | (12,485,211 | ) | |
| Net increase (decrease) from Fund share transactions | | | (26,093,667 | ) | | | (191,336,472 | ) | |
| Net Increase (Decrease) in Net Assets | | | 48,007,514 | | | | (106,641,190 | ) | |
| Net Assets: | |
| Beginning of year | | | 277,209,475 | | | | 383,850,665 | | |
| End of year | | $ | 325,216,989 | | | $ | 277,209,475 | | |
| Undistributed net investment income (loss) at end of year | | $ | - | | | $ | -- | | |
See Notes to Financial Statements
13
Notes to Financial Statements Mid-Cap Growth Portfolio
Note A--Summary of Significant Accounting Policies:
1 General: The Fund is a separate operating series of Neuberger Berman Advisers Management Trust (the "Trust"), a Delaware statutory trust organized pursuant to a Trust Instrument dated May 23, 1994. The Trust is currently comprised of ten separate operating series (each individually a "Series," and collectively the "Funds") each of which is diversified. The Trust is registered as an open-end management investment company under the Investment Company Act of 1940, as amended (the "1940 Act"), and its shares are registered under the Securities Act of 1933, as amended. The Fund currently offers Class I and Class S shares. The Board may establish additional series or classes of shares without the approval of shareholders.
The assets of each Series belong only to that Series, and the liabilities of each Series are borne solely by that Series and no other.
The preparation of financial statements in accordance with U.S. generally accepted accounting principles requires Management to make estimates and assumptions at the date of the financial statements. Actual results could differ from those estimates.
2 Portfolio valuation: Investment securities are valued as indicated in the notes following the Schedule of Investments.
3 Foreign currency translation: The accounting records of the Fund are maintained in U.S. dollars. Foreign currency amounts are translated into U.S. dollars using the exchange rates as of 4:00 p.m., Eastern time, to determine the value of investments, other assets and liabilities. Purchase and sale prices of securities, and income and expenses, are translated into U.S. dollars at the prevailing rate of exchange on the respective dates of such transactions. Net unrealized foreign currency gain (loss), if any, arises from changes in the value of assets and liabilities, other than investments in securities, as a result of changes in exchange rates and is stated separately in the Statement of Operations.
4 Securities transactions and investment income: Securities transactions are recorded on trade date for financial reporting purposes. Dividend income is recorded on the ex-dividend date or, for certain foreign dividends, as soon as the Fund becomes aware of the dividends. Non-cash dividends included in dividend income, if any, are recorded at the fair market value of the securities received. Interest income, including accretion of original issue discount, where applicable, and accretion of discount on short-term investments, if any, is recorded on the accrual basis. Realized gains and losses from securities transactions and foreign currency transactions, if any, are recorded on the basis of identified cost and stated separately in the Statement of Operations. Included in net realized gain (loss) on investments are proceeds from the settlements of class action litigation in which the Fund participated as a class member. The amount of such proceeds for the year ended December 31, 2010 was $210,923.
5 Income tax information: The Funds are treated as separate entities for U.S. federal income tax purposes. It is the policy of the Fund to continue to qualify as a regulated investment company by complying with the requirements of the U.S. Internal Revenue Code applicable to regulated investment companies and to distribute substantially all of its earnings to its shareholders. To the extent the Fund distributes substantially all of its earnings to shareholders, no federal income or excise tax provision is required.
The Fund has adopted the provisions of ASC 740 "Income Taxes"("ASC 740"). ASC 740 sets forth a minimum threshold for financial statement recognition of a tax position taken, or expected to be taken, in a tax return. The Fund recognizes interest and penalties, if any, related to unrecognized tax positions as an income tax expense in the Statement of Operations. The Fund is subject to examination by U.S. federal and state tax authorities for returns filed for the prior three fiscal years 2007 - 2009. As of December 31, 2010, the Fund did not have any unrecognized tax positions.
14
Income distributions and capital gain distributions are determined in accordance with income tax regulations, which may differ from U.S. generally accepted accounting principles. These differences are primarily due to differing treatments of income and gains on various investment securities held by the Fund, timing differences and differing characterization of distributions made by the Fund as a whole. The Fund may also utilize earnings and profits distributed to shareholders on redemption of shares as a part of the dividends paid deduction for income tax purposes.
As determined on December 31, 2010, permanent differences resulting primarily from different book and tax accounting for net operating losses, expiration of capital loss carryforwards and partnership basis adjustments were reclassified at fiscal year-end. These reclassifications had no effect on net income, NAV or NAV per share of the Fund.
As of December 31, 2010, the components of distributable earnings (accumulated losses) on a U.S. federal income tax basis were as follows:
Unrealized
Appreciation
(Depreciation) | | Loss
Carryforwards
and Deferrals | | Total | |
| $ | 124,871,232 | | | $ | (81,709,793 | ) | | $ | 43,161,439 | | |
The difference between book basis and tax basis distributable earnings is attributable primarily to timing differences of wash sales and capital loss carryforwards.
To the extent the Fund's net realized capital gains, if any, can be offset by capital loss carryforwards, it is the policy of the Fund not to distribute such gains. Under current tax law, the use of these losses to offset future gains may be limited. As determined at December 31, 2010, the Fund had unused capital loss carryforwards available for federal income tax purposes to offset net realized capital gains, if any, as follows:
| | | Expiring in: | |
| | | 2011 | | 2016 | | 2017 | |
| | | | | $ | 11,059,422 | | | $ | 21,770,564 | | | $ | 48,879,807 | | |
The Fund had $87,479,341 of capital loss carryforwards that expired during the year ended December 31, 2010.
During the year ended December 31, 2010, the Fund utilized capital loss carryforwards of $25,943,777.
6 Distributions to shareholders: The Fund may earn income, net of expenses, daily on its investments. Distributions from net investment income and net realized capital gains, if any, generally are distributed once a year (usually in October). Income distributions and capital gain distributions to shareholders are recorded on the ex-date.
7 Foreign taxes: Foreign taxes withheld represent amounts withheld by foreign tax authorities, net of refunds recoverable.
8 Expense allocation: Certain expenses are applicable to multiple funds. Expenses directly attributable to a Series are charged to that Series. Expenses of the Trust that are not directly attributable to a particular series of the Trust (e.g., the Fund) are allocated among the series of the Trust, on the basis of relative net assets, except where a more appropriate allocation of expenses to each of the series can otherwise be made fairly. Expenses borne by the complex of related investment companies, which includes open-end and closed-end investment companies for which Management serves as investment manager, that are not directly attributable to a particular investment company in the complex (e.g., the Trust) or series thereof are allocated among the investment companies in the complex or series thereof, on the basis of relative net assets, except where a more appropriate allocation of expenses to each investment company in the complex or series thereof can otherwise be made fairly. The Fund's expenses (other than those specific to each class) are allocated proportionally each day between the classes based upon the relative net assets of each class.
9 Security lending: A third party, eSecLending, has assisted the Fund in conducting a bidding process to try to identify a principal that would pay a guaranteed amount to the Fund in consideration of the Fund entering into an
15
exclusive securities lending arrangement. During the fiscal year, eSecLending served as exclusive lending agent for the Fund. As a result of a bidding process on October 1, 2009, no principal had an exclusive securities lending arrangement with the Fund during the fiscal year; as such, the Fund was not guaranteed any particular level of income during the fiscal year. As of August 27, 2010, the Fund no longer participates in a securities lending program.
Under the securities lending arrangement, the Fund received cash collateral at the beginning of each transaction equal to at least 102% of the prior day's market value of the loaned securities (105% in the case of international securities). The Fund invested all the cash collateral in Neuberger Berman Securities Lending Quality Fund, LLC ("Quality Fund"), a fund managed by Neuberger Berman Fixed Income LLC ("NBFI"), an affiliate of Management, and sub-advised by Dwight Asset Management Company LLC. Quality Fund was not a money market fund registered under the 1940 Act and did not operate in accordance with all requirements of Rule 2a-7 under the 1940 Act. The Fund redeemed all of its investments in Quality Fund, if any, as of August 27, 2010.
Net income from the lending program represents any amounts received from a principal, plus income earned on the cash collateral invested in Quality Fund or in other investments, if applicable, less cash collateral fees and other expenses associated with the loans. For the fiscal year ended December 31, 2010, the Fund received net income under the securities lending arrangement of $43,506, which is reflected in the Statement of Operations under the caption "Income from securities loaned - net," which includes $8,748 of interest income that was earned from the Quality Fund.
10 Investments in foreign securities: Investing in foreign securities may involve certain sovereign and other risks, in addition to the credit and market risks normally associated with domestic securities. These additional risks include the possibility of adverse political and economic developments (including political instability, nationalization, expropriation, or confiscatory taxation) and the potentially adverse effects of unavailability of public information regarding issuers, less government supervision and regulation of financial markets, reduced liquidity of certain financial markets, and the lack of uniform accounting, auditing, and financial reporting standards or the application of standards that are different or less stringent than those applied in the United States. Foreign securities also may experience greater price volatility, higher rates of inflation, and delays in settlement.
11 Indemnifications: Like many other companies, the Trust's organizational documents provide that its officers and trustees are indemnified against certain liabilities arising out of the performance of their duties to the Trust. In addition, both in some of its principal service contracts and in the normal course of its business, the Trust enters into contracts that provide indemnifications to other parties for certain types of losses or liabilities. The Trust's maximum exposure under these arrangements is unknown as this could involve future claims against the Trust.
12 Other: All net investment income and realized and unrealized capital gains and losses of the Fund are allocated, on the basis of relative net assets, pro rata among its respective classes.
Note B--Management Fees, Administration Fees, Distribution Arrangements, and Other Transactions with Affiliates:
Fund shares are issued and redeemed in connection with investments in and payments under certain variable annuity contracts and variable life insurance policies issued through separate accounts of life insurance companies and are also offered directly to certain qualified pension and retirement plans.
The Fund retains Management as its investment manager under a Management Agreement. For such investment management services, the Fund pays Management a fee at the annual rate of 0.55% of the first $250 million of the Fund's average daily net assets, 0.525% of the next $250 million, 0.50% of the next $250 million, 0.475% of the next $250 million, 0.45% of the next $500 million, 0.425% of the next $2.5 billion, and 0.40% of average daily net assets in excess of $4 billion.
16
The Fund retains Management as its administrator under an Administration Agreement. Each class pays Management an administration fee at the annual rate of 0.30% of its average daily net assets under this agreement. Additionally, Management retains State Street Bank and Trust Company ("State Street") as its sub-administrator under a Sub-Administration Agreement. Management pays State Street a fee for all services received under this agreement.
The Board adopted a non-fee distribution plan for the Fund's Class I.
For the Fund's Class S, Management acts as agent in arranging for the sale of class shares without commission and bears advertising and promotion expenses. The Board has adopted a distribution plan (the "Plan") with respect to this class, pursuant to Rule 12b-1 under the 1940 Act. The Plan provides that, as compensation for administrative and other services provided to this class, Management's activities and expenses related to the sale and distribution of this class of shares, and ongoing services provided to investors in this class, Management receives from this class a fee at the annual rate of 0.25% of Class S's average daily net assets. Management receives this amount to provide distribution and shareholder servicing for this class and pays a portion of it to institutions that provide such services. Those institutions may use the payments for, among other purposes, compensating employees engaged in sales and/or shareholder servicing. The amount of fees paid by this class during any year could have been more or less than the cost of distribution and other services provided to this class. FINRA rules limit the amount of annual distribution fees that may be paid by a mutual fund and impose a ceiling on the cumulative distribution fees paid. The Trust's Plan complies with those rules.
Management has contractually undertaken to forgo current payment of fees and/or reimburse the Fund's Class I and Class S shares for their operating expenses (excluding fees payable to Management (including fees payable to Management with respect to the Fund's Class S shares), interest, taxes, brokerage commissions, extraordinary expenses, and transaction costs) ("Operating Expenses") which exceed the expense limitation as detailed in the following table:
| | | Expense Limitation(1) | | Expiration | | Reimbursement from
Management for the
Year Ended
December 31, 2010 | |
| Class I | | | 1.00 | % | | 12/31/13 | | $ | -- | | |
| Class S | | | 1.25 | % | | 12/31/13 | | | 7,615 | | |
(1) Expense limitation per annum of the respective class' average daily net assets.
Each respective class has agreed to repay Management through December 31, 2016 for fees and expenses foregone and/or its excess Operating Expenses previously reimbursed by Management, so long as its annual Operating Expenses during that period do not exceed its expense limitation, and the repayment is made within three years after the year in which Management issued the reimbursement or waived fees. During the year ended December 31, 2010, there was no repayment to Management under its contractual expense limitation. At December 31, 2010, the Fund's Class I shares had no contingent liability to Management under its contractual expense limitation. At December 31, 2010, the Fund's Class S shares contingent liabilities to Management under its contractual expense limitation were as follows:
| | | Expiring in: | | | |
| | | 2012 | | 2013 | | Total | |
| Class S | | $ | 6,114 | | | $ | 7,615 | | | $ | 13,729 | | |
Neuberger Berman LLC ("Neuberger") is retained by Management to furnish it with investment recommendations and research information without added cost to the Fund. Several individuals who are officers and/or trustees of the Trust are also employees of Neuberger and/or Management.
17
On May 4, 2009, NBSH Acquisition, LLC ("NBSH"), an entity organized by key members of senior management of Neuberger Berman Group LLC ("NBG") and its consolidated subsidiaries (NBG, and together with its consolidated subsidiaries "NB Group") acquired a majority interest in the business conducted by Management and Neuberger, as well as the fixed income and certain alternative asset management businesses of Lehman Brothers Holdings Inc.'s Investment Management Division (together with Management and Neuberger, the "Acquired Businesses") (the "Acquisition"). Prior to that date, Neuberger and the predecessor in interest of Management were indirect wholly owned subsidiaries of Lehman Brothers Holdings Inc. ("LBHI"). On September 15, 2008, LBHI filed a voluntary petition under Chapter 11 of the U.S. Bankruptcy Code, and on December 22, 2008, the bankruptcy court having jurisdiction over the LBHI matter approved the sale of the Acquired Businesses to NBSH (or its successor or assign).
Through NBSH, portfolio managers, NB Group's management team, and certain of its key employees and senior professionals now indirectly own 52% of the voting equity of NBG. LBHI and certain affiliates of LBHI own the remaining 48% of NBG's voting equity. The closing of the Acquisition resulted in an "assignment" of the Fund's Management Agreement and Sub-Advisory Agreement. Such an assignment, by law, automatically terminated those agreements. Accordingly, prior to the closing, the Board, including the Trustees who are not "interested persons" of the Fund's investment manager and its affiliates or the Fund, considered and approved a new Management Agreement and Sub-Advisory Agreement for the Fund. The new agreements, which are virtually identical to those previously in effect, were also approved by a vote of the Fund's shareholders.
These events did not have a material impact on the Fund or its operations. Management and Neuberger continue to operate in the ordinary course of business as the investment manager and sub-adviser of the Fund.
Other non-affiliated service provider: The Fund has an expense offset arrangement in connection with its custodian contract. For the year ended December 31, 2010, the impact of this arrangement was a reduction of expenses of $8.
Note C--Securities Transactions:
During the year ended December 31, 2010, there were purchase and sale transactions (excluding short-term securities) of $131,022,047 and $160,487,979, respectively.
During the year ended December 31, 2010, no brokerage commissions on securities transactions were paid to affiliated brokers.
Note D--Fund Share Transactions:
Share activity for the years ended December 31, 2010 and December 31, 2009 was as follows:
For the Year Ended December 31, 2010
| | | Shares Sold | | Shares Redeemed | | Total | |
| Class I | | | 645,657 | | | | (1,960,763 | ) | | | (1,315,106 | ) | |
| Class S | | | 667,353 | | | | (530,610 | ) | | | 136,743 | | |
For the Year Ended December 31, 2009
| | | Shares Sold | | Shares Redeemed | | Total | |
| Class I | | | 542,645 | | | | (10,913,134 | ) | | | (10,370,489 | ) | |
| Class S | | | 362,763 | | | | (732,753 | ) | | | (369,990 | ) | |
Note E--Line of Credit:
At December 31, 2010, the Fund was a participant in a single committed, unsecured $200,000,000 ($150,000,000 prior to September 17, 2010) line of credit with State Street, to be used only for temporary or emergency purposes.
18
Other investment companies managed by Management also participate in this line of credit on the same terms. Interest is charged on borrowings under this line of credit at the higher of (a) the Federal Funds Rate plus 1.25% per annum or (b) the Overnight LIBOR Rate plus 1.25% per annum. A commitment fee of 0.125% (0.15% prior to September 17, 2010) per annum of the available line of credit is charged, of which each participating Fund has agreed to pay its pro rata share, based on the ratio of its individual net assets to the net assets of all participants at the time the fee is due and payable. The fee is paid quarterly in arrears. Because several mutual funds participate, there is no assurance that an individual Fund will have access to all or any part of the $200,000,000 ($150,000,000 prior to September 17, 2010) at any particular time. There were no loans outstanding pursuant to this line of credit at December 31, 2010. During the year ended December 31, 2010, the Fund did not utilize this line of credit.
Note F--Investments in Affiliates:
| Name of Issuer | | Balance of
Shares
Held
December 31,
2009 | | Gross
Purchases
and
Additions | | Gross
Sales
and
Reductions | | Balance of
Shares
Held
December 31,
2010 | | Value
December 31,
2010 | | Income from
Investments in
Affiliated
Issuers
Included in
Total Income | |
Neuberger Berman Securities
Lending Quality Fund, LLC* | | | 9,226,325 | | | | 49,654,355 | | | | 58,880,680 | | | | -- | | | $ | -- | | | $ | 8,748 | | |
* Quality Fund, a fund that was managed by NBFI, an affiliate of Management, was used to invest cash the Fund received as collateral for securities loaned as approved by the Board. Because all shares of Quality Fund were held by funds in the related investment management complex, Quality Fund may have been considered an affiliate of the Fund.
19
Financial Highlights
Mid-Cap Growth Portfolio
The following tables include selected data for a share outstanding throughout each year and other performance information derived from the Financial Statements.
| Class I | |
| | | Year Ended December 31, | |
| | | 2010 | | 2009 | | 2008 | | 2007 | | 2006 | |
| Net Asset Value, Beginning of Year | | $ | 21.25 | | | $ | 16.14 | | | $ | 28.50 | | | $ | 23.26 | | | $ | 20.28 | | |
| Income From Investment Operations: | |
| Net Investment Income (Loss)t | | | (.11 | ) | | | (.03 | ) | | | (.12 | ) | | | (.05 | ) | | | (.02 | ) | |
Net Gains or Losses on Securities
(both realized and unrealized) | | | 6.28 | | | | 5.14 | | | | (12.24 | ) | | | 5.29 | | | | 3.00 | | |
| Total From Investment Operations | | | 6.17 | | | | 5.11 | | | | (12.36 | ) | | | 5.24 | | | | 2.98 | | |
| Net Asset Value, End of Year | | $ | 27.42 | | | $ | 21.25 | | | $ | 16.14 | | | $ | 28.50 | | | $ | 23.26 | | |
| Total Returntt | | | 29.04 | % | | | 31.66 | % | | | (43.37 | )% | | | 22.53 | % | | | 14.69 | % | |
| Ratios/Supplemental Data | |
| Net Assets, End of Year (in millions) | | $ | 266.0 | | | $ | 234.1 | | | $ | 345.1 | | | $ | 819.0 | | | $ | 668.1 | | |
| Ratio of Gross Expenses to Average Net Assets# | | | 1.02 | % | | | 1.01 | % | | | .92 | % | | | .88 | % | | | .90 | % | |
| Ratio of Net Expenses to Average Net Assets | | | 1.02 | % | | | 1.01 | %S | | | .92 | %S | | | .88 | %S | | | .90 | %S | |
Ratio of Net Investment Income (Loss) to Average
Net Assets | | | (.49 | )% | | | (.16 | )% | | | (.51 | )% | | | (.20 | )% | | | (.10 | )% | |
| Portfolio Turnover Rate | | | 46 | % | | | 67 | % | | | 62 | % | | | 56 | % | | | 48 | % | |
See Notes to Financial Highlights
20
Financial Highlights (cont'd)
| Class S | |
| | | Year Ended December 31, | |
| | | 2010 | | 2009 | | 2008 | | 2007 | | 2006 | |
| Net Asset Value, Beginning of Year | | $ | 20.87 | | | $ | 15.89 | | | $ | 28.13 | | | $ | 23.02 | | | $ | 20.11 | | |
| Income From Investment Operations: | |
| Net Investment Income (Loss)t | | | (.16 | ) | | | (.08 | ) | | | (.17 | ) | | | (.12 | ) | | | (.08 | ) | |
Net Gains or Losses on Securities
(both realized and unrealized) | | | 6.16 | | | | 5.06 | | | | (12.07 | ) | | | 5.23 | | | | 2.99 | | |
| Total From Investment Operations | | | 6.00 | | | | 4.98 | | | | (12.24 | ) | | | 5.11 | | | | 2.91 | | |
| Net Asset Value, End of Year | | $ | 26.87 | | | $ | 20.87 | | | $ | 15.89 | | | $ | 28.13 | | | $ | 23.02 | | |
| Total Returntt | | | 28.75 | % | | | 31.34 | % | | | (43.51 | )% | | | 22.20 | % | | | 14.47 | % | |
| Ratios/Supplemental Data | |
| Net Assets, End of Year (in millions) | | $ | 59.2 | | | $ | 43.2 | | | $ | 38.7 | | | $ | 68.9 | | | $ | 35.6 | | |
| Ratio of Gross Expenses to Average Net Assets# | | | 1.25 | % | | | 1.25 | % | | | 1.18 | % | | | 1.14 | % | | | 1.15 | % | |
| Ratio of Net Expenses to Average Net AssetsS | | | 1.25 | % | | | 1.25 | % | | | 1.17 | % | | | 1.13 | % | | | 1.15 | % | |
Ratio of Net Investment Income (Loss) to Average
Net Assets | | | (.73 | )% | | | (.44 | )% | | | (.77 | )% | | | (.47 | )% | | | (.36 | )% | |
| Portfolio Turnover Rate | | | 46 | % | | | 67 | % | | | 62 | % | | | 56 | % | | | 48 | % | |
See Notes to Financial Highlights
21
Notes to Financial Highlights Mid-Cap Growth Portfolio
tt Total return based on per share NAV reflects the effects of changes in NAV on the performance of the Fund during each fiscal period and assumes income dividends and other distributions, if any, were reinvested. Results represent past performance and do not guarantee future results. Current returns may be lower or higher than the performance data quoted. Investment returns and principal may fluctuate and shares when redeemed may be worth more or less than original cost. Total return would have been lower if Management had not reimbursed and/or waived certain expenses. The total return information shown does not reflect charges and other expenses that apply to the separate account or the related insurance policies, and the inclusion of these charges and other expenses would reduce the total return for all fiscal periods shown.
# The Fund is required to calculate an expense ratio without taking into consideration any expense reductions related to expense offset arrangements.
S After reimbursement of expenses and/or waiver of a portion of the investment management fee by Management. Had Management not undertaken such actions, the annualized ratios of net expenses to average daily net assets would have been:
| | | Year Ended December 31, | |
| | | 2010 | | 2009 | | 2008 | | 2007 | | 2006 | |
| Mid-Cap Growth Portfolio Class I | | | -- | | | | 1.01 | % | | | .92 | % | | | .88 | % | | | .90 | % | |
| Mid-Cap Growth Portfolio Class S | | | 1.27 | % | | | 1.27 | % | | | 1.17 | % | | | 1.13 | % | | | 1.15 | % | |
t Calculated based on the average number of shares outstanding during each fiscal period.
22
Report of Independent Registered Public Accounting Firm
To the Board of Trustees of
Neuberger Berman Advisers Management Trust and
Shareholders of Mid-Cap Growth Portfolio
We have audited the accompanying statement of assets and liabilities, including the schedule of investments, of Mid-Cap Growth Portfolio, one of the series constituting Neuberger Berman Advisers Management Trust (the "Trust"), as of December 31, 2010, and the related statement of operations for the year then ended, the statements of changes in net assets for each of the two years in the period then ended, and the financial highlights for each of the five years in the period then ended. These financial statements and financial highlights are the responsibility of the Trust's management. Our responsibility is to express an opinion on these financial statements and financial highlights based on our audits.
We conducted our audits in accordance with the standards of the Public Company Accounting Oversight Board (United States). Those standards require that we plan and perform the audit to obtain reasonable assurance about whether the financial statements and financial highlights are free of material misstatement. We were not engaged to perform an audit of the Trust's internal control over financial reporting. Our audits included consideration of internal control over financial reporting as a basis for designing audit procedures that are appropriate in the circumstances, but not for the purpose of expressing an opinion on the effectiveness of the Trust's internal control over financial reporting. Accordingly, we express no such opinion. An audit also includes examining, on a test basis, evidence supporting the amounts and disclosures in the financial statements and financial highlights, assessing the accounting principles used and significant estimates made by management, and evaluating the overall financial statement presentation. Our procedures included confirmation of securities owned as of December 31, 2010 by correspondence with the custodian and brokers or by other appropriate auditing procedures where replies from brokers were not received. We believe that our audits provide a reasonable basis for our opinion.
In our opinion, the financial statements and financial highlights referred to above present fairly, in all material respects, the financial position of Mid-Cap Growth Portfolio, a series of Neuberger Berman Advisers Management Trust, at December 31, 2010, the results of its operations for the year then ended, the changes in its net assets for each of the two years in the period then ended, and the financial highlights for each of the five years in the period then ended, in conformity with U.S. generally accepted accounting principles.

Boston, Massachusetts
February 10, 2011
23
Trustee and Officer Information
The following tables set forth information concerning the trustees and officers of the Trust. All persons named as trustees and officers also serve in similar capacities for other funds administered or managed by Management, Neuberger and NBFI. The Statement of Additional Information includes additional information about trustees and is available upon request, without charge, by calling (800) 877-9700.
Information about the Board of Trustees
Name, (Year of Birth),
and Address(1) | | Position and
Length of
Time Served(2) | | Principal Occupation(s)(3) | | Number of
Funds in Fund
Complex
Overseen by
Trustee | | Other Directorships
Held Outside Fund
Complex by Trustee | |
| Independent Trustees | |
|
| John Cannon (1930) | | Trustee since 2000 | | Consultant; formerly, Chairman, CDC Investment Advisers (registered investment adviser), 1993 to January 1999; formerly, President and Chief Executive Officer, AMA Investment Advisors, an affiliate of the American Medical Association. | | | 43 | | | Formerly, Independent Trustee or Director of three series of Oppenheimer Funds: Oppenheimer Limited Term New York Municipal Fund, Rochester Fund Municipals, and Oppenheimer Convertible Securities Fund, 1992 to 2009. | |
|
| Faith Colish (1935) | | Trustee since 1982 | | Counsel, Carter Ledyard & Milburn LLP (law firm) since October 2002; formerly, Attorney-at-Law and President, Faith Colish, A Professional Corporation, 1980 to 2002. | | | 43 | | | Formerly, Director, 1997 to 2003, and Advisory Director, 2003 to 2006; ABA Retirement Funds (formerly, American Bar Retirement Association) (not-for-profit membership corporation). | |
|
24
Name, (Year of Birth),
and Address(1) | | Position and
Length of
Time Served(2) | | Principal Occupation(s)(3) | | Number of
Funds in Fund
Complex
Overseen by
Trustee | | Other Directorships
Held Outside Fund
Complex by Trustee | |
| Martha C. Goss (1949) | | Trustee since 2007 | | President, Woodhill Enterprises Inc./Chase Hollow Associates LLC (personal investment vehicle), since 2006; Chief Operating and Financial Officer, Hopewell Holdings LLC/Amwell Holdings, LLC (a holding company for a healthcare reinsurance company start-up), since 2003; formerly, Consultant, Resources Connection (temporary staffing), 2002 to 2006. | | | 43 | | | Director, Ocwen Financial Corporation (mortgage servicing), since 2005; Director, American Water (water utility), since 2003; Director, Channel Reinsurance (financial guaranty reinsurance), since 2006; Director, Allianz Life of New York (insurance), since 2005; Director, Financial Women's Association of New York (not-for-profit association), since 2003; Trustee Emerita, Brown University, since 1998; formerly, Advisory Board Member, Attensity (software developer), 2005 to 2007; formerly, Director, Bank Leumi (commercial bank), 2005 to 2007; formerly, Director, Claire's Stores, Inc. (retailer), 2005 to 2007. | |
|
| C. Anne Harvey (1937) | | Trustee since 1998 | | President, C.A. Harvey Associates, since October 2001; formerly, Director, AARP, 1978 to December 2001. | | | 43 | | | Formerly, President, Board of Associates to The National Rehabilitation Hospital's Board of Directors, 2001 to 2002; formerly, Member, Individual Investors Advisory Committee to the New York Stock Exchange Board of Directors, 1998 to 2002. | |
|
25
Name, (Year of Birth),
and Address(1) | | Position and
Length of
Time Served(2) | | Principal Occupation(s)(3) | | Number of
Funds in Fund
Complex
Overseen by
Trustee | | Other Directorships
Held Outside Fund
Complex by Trustee | |
| Robert A. Kavesh (1927) | | Trustee since 2000 | | Retired; Marcus Nadler Professor Emeritus of Finance and Economics, New York University Stern School of Business; formerly, Executive Secretary-Treasurer, American Finance Association, 1961 to 1979. | | | 43 | | | Formerly, Director, The Caring Community (not-for-profit), 1997 to 2006; formerly, Director, DEL Laboratories, Inc. (cosmetics and pharmaceuticals), 1978 to 2004; formerly, Director, Apple Bank for Savings, 1979 to 1990; formerly, Director, Western Pacific Industries, Inc., (public company), 1972 to 1986. | |
|
| Michael M. Knetter (1960) | | Trustee since 2007 | | President and Chief Executive Officer, University of Wisconsin Foundation, October 2010 to Present; formerly, Dean, School of Business, University of Wisconsin - Madison; formerly, Professor of International Economics and Associate Dean, Amos Tuck School of Business - Dartmouth College, 1998 to 2002. | | | 43 | | | Director, American Family Insurance (a mutual company, not publicly traded), since March 2009; Trustee, Northwestern Mutual Series Fund, Inc., since February 2007; Director, Wausau Paper, since 2005; formerly, Director, Great Wolf Resorts, 2004 to 2009. | |
|
| Howard A. Mileaf (1937) | | Trustee since 1999 | | Retired; formerly, Vice President and General Counsel, WHX Corporation (holding company), 1993 to 2001. | | | 43 | | | Formerly, Director, Webfinancial Corporation (holding company), 2002 to 2008; formerly, Director, WHX Corporation (holding company), 2002 to 2005; formerly, Director, State Theatre of New Jersey (not-for-profit theatre), 2000 to 2005. | |
|
| George W. Morriss (1947) | | Trustee since 2007 | | Retired; formerly, Executive Vice President and Chief Financial Officer, People's Bank, Connecticut (a financial services company), 1991 to 2001. | | | 43 | | | Manager, Old Mutual Funds of Hedge Funds fund complex (consisting of six funds), since 2006 for four funds and since 2007 for two funds; formerly, Member NASDAQ Issuers' Affairs Committee, 1995 to 2003. | |
|
26
Name, (Year of Birth),
and Address(1) | | Position and
Length of
Time Served(2) | | Principal Occupation(s)(3) | | Number of
Funds in Fund
Complex
Overseen by
Trustee | | Other Directorships
Held Outside Fund
Complex by Trustee | |
| Edward I. O'Brien (1928) | | Trustee since 2000 | | Retired; formerly, Member, Investment Policy Committee, Edward Jones, 1993 to 2001; President, Securities Industry Association ("SIA") (securities industry's representative in government relations and regulatory matters at the federal and state levels), 1974 to 1992; Adviser to SIA, November 1992 to November 1993. | | | 43 | | | Formerly, Director, Legg Mason, Inc. (financial services holding company), 1993 to July 2008; formerly, Director, Boston Financial Group (real estate and tax shelters), 1993 to 1999. | |
|
| Cornelius T. Ryan (1931) | | Trustee since 2000 | | General Partner and Adviser, TD2, TD3, and TOF1 Healthcare Venture Capital Partnerships; Founding General Partner, Oxford Partners and Oxford Bioscience Partners (venture capital investing) and President, Oxford Venture Corporation, since 1981. | | | 43 | | | Trustee, Norwalk Hospital Foundation, since 2000; Director, Supply Pro (privately held company), since 2008; formerly, Trustee, Norwalk Hospital, 1995 to 2004; formerly, President and Director, Randolph Computer Corp., 1966 to 1984; formerly, Director of numerous privately held portfolio companies of Oxford Partners and Oxford Bioscience Partners, 1981 to 2005. | |
|
| Tom D. Seip (1950) | | Trustee since 2000; Chairman of the Board since 2008; Lead Independent Trustee from 2006 to 2008 | | General Partner, Seip Investments LP (a private investment partnership); formerly, President and CEO, Westaff, Inc. (temporary staffing), May 2001 to January 2002; formerly, Senior Executive, The Charles Schwab Corporation, 1983 to 1998, including Chief Executive Officer, Charles Schwab Investment Management, Inc.; Trustee, Schwab Family of Funds and Schwab Investments, 1997 to 1998; and Executive Vice President-Retail Brokerage, Charles Schwab & Co., Inc., 1994 to 1997. | | | 43 | | | Director, H&R Block, Inc. (financial services company), since May 2001; Chairman, Compensation Committee, H&R Block, Inc., since 2006; formerly, Director, Forward Management, Inc. (asset management company), 1999 to 2006. | |
|
27
Name, (Year of Birth),
and Address(1) | | Position and
Length of
Time Served(2) | | Principal Occupation(s)(3) | | Number of
Funds in Fund
Complex
Overseen by
Trustee | | Other Directorships
Held Outside Fund
Complex by Trustee | |
| Candace L. Straight (1947) | | Trustee since 1999 | | Private investor and consultant specializing in the insurance industry; formerly, Advisory Director, Securitas Capital LLC (a global private equity investment firm dedicated to making investments in the insurance sector), 1998 to December 2003. | | | 43 | | | Director, Montpelier Re Holdings Ltd. (reinsurance company), since 2006; formerly, Director, National Atlantic Holdings Corporation (property and casualty insurance company), 2004 to 2008; formerly, Director, The Proformance Insurance Company (property and casualty insurance company), 2004 to 2008; formerly, Director, Providence Washington Insurance Company (property and casualty insurance company), 1998 to 2006; formerly, Director, Summit Global Partners (insurance brokerage firm), 2000 to 2005. | |
|
| Peter P. Trapp (1944) | | Trustee since 1984 | | Retired; formerly, Regional Manager for Mid-Southern Region, Ford Motor Credit Company, September 1997 to 2007; formerly, President, Ford Life Insurance Company, April 1995 to August 1997. | | | 43 | | | None. | |
|
28
Name, (Year of Birth),
and Address(1) | | Position and
Length of
Time Served(2) | | Principal Occupation(s)(3) | | Number of
Funds in Fund
Complex
Overseen by
Trustee | | Other Directorships
Held Outside Fund
Complex by Trustee | |
| Trustees who are "Interested Persons" | |
|
| Joseph V. Amato* (1962) | | Trustee since 2009 | | President and Director, Neuberger Berman Group LLC, since 2009; President and Chief Executive Officer, Neuberger and Neuberger Berman Holdings LLC (including its predecessor, Neuberger Berman Inc.), since 2007; Chief Investment Officer, Neuberger, since 2009; Chief Investment Officer (Equities) and Managing Director, Management, since 2009; Managing Director, NBFI, since 2007; Board member of NBFI since 2006; formerly, Global Head of Asset Management of LBHI's Investment Management Division, 2006 to 2009; formerly, member of LBHI's Investment Management Division's Executive Management Committee, 2006 to 2009; formerly, Managing Director, Lehman Brothers Inc. ("LBI"), 2006 to 2008; formerly, Chief Recruiting and Development Officer, LBI, 2005 to 2006; formerly, Global Head of LBI's Equity Sales and a Member of its Equities Division Executive Committee, 2003 to 2005. | | | 43 | | | Member of Board of Advisors, McDonough School of Business, Georgetown University, since 2001; Member of New York City Board of Advisors, Teach for America, since 2005; Trustee, Montclair Kimberley Academy (private school), since 2007. | |
|
29
Name, (Year of Birth),
and Address(1) | | Position and
Length of
Time Served(2) | | Principal Occupation(s)(3) | | Number of
Funds in Fund
Complex
Overseen by
Trustee | | Other Directorships
Held Outside Fund
Complex by Trustee | |
| Robert Conti* (1956) | | Chief Executive Officer, President and Trustee since 2008; prior thereto, Executive Vice President in 2008 and Vice President, 2000 to 2008 | | Managing Director, Neuberger, since 2007; formerly, Senior Vice President, Neuberger, 2003 to 2006; formerly, Vice President, Neuberger, 1999 to 2003; President and Chief Executive Officer, Management, since 2008; formerly, Senior Vice President, Management, 2000 to 2008. | | | 43 | | | Chairman of the Board, Staten Island Mental Health Society since 2008. | |
|
| Jack L. Rivkin* (1940) | | Trustee since 2002; President, 2002 to 2008 | | Formerly, Executive Vice President and Chief Investment Officer, Neuberger Berman Holdings LLC (holding company), 2002 to August 2008 and 2003 to August 2008, respectively; formerly, Managing Director and Chief Investment Officer, Neuberger, December 2005 to August 2008 and 2003 to August 2008, respectively; formerly, Executive Vice President, Neuberger, December 2002 to 2005; formerly, Director and Chairman, Management, December 2002 to August 2008; formerly, Executive Vice President, Citigroup Investments, Inc., September 1995 to February 2002; formerly, Executive Vice President, Citigroup Inc., September 1995 to February 2002. | | | 43 | | | Director, Idealab (private company), since 2009; Director, Distributed World Power (private company), since 2009; Director, Dale Carnegie and Associates, Inc. (private company), since 1999; Director, Solbright, Inc. (private company), since 1998; Director, SA Agricultural Fund, since 2009; Chairman and Director, Essential Brands (consumer products) since 2008; formerly, Director, New York Society of Security Analysts, 2006 to 2008. | |
|
(1) The business address of each listed person is 605 Third Avenue, New York, New York 10158.
(2) Pursuant to the Trust's Trust Instrument, each of these Trustees shall hold office for life or until his or her successor is elected or the Trust terminates; except that (a) any Trustee may resign by delivering a written resignation; (b) any Trustee may be removed with or without cause at any time by a written instrument signed by at least two-thirds of the other Trustees; (c) any Trustee who requests to be retired, or who has become unable to serve, may be retired by a written instrument signed by a majority of the other Trustees; and (d) any Trustee may be removed at any shareholder meeting by a vote of at least two-thirds of the outstanding shares.
30
(3) Except as otherwise indicated, each individual has held the positions shown for at least the last five years.
* Indicates a Trustee who is an "interested person" within the meaning of the 1940 Act. Mr. Amato and Mr. Conti are interested persons of the Trust by virtue of the fact that each is an officer of Management, Neuberger and/or their affiliates. Mr. Rivkin may be deemed an interested person of the Trust by virtue of the fact that, until August 2008, he was a director of Management and an officer of Neuberger.
31
Information about the Officers of the Trust
Name, (Year of Birth),
and Address(1) | | Position and
Length of Time
Served(2) | | Principal Occupation(s)(3) | |
| Andrew B. Allard (1961) | | Anti-Money Laundering Compliance Officer since 2002 | | Senior Vice President, Neuberger, since 2006; Deputy General Counsel, Neuberger, since 2004; formerly, Vice President, Neuberger, 2000 to 2005; Anti-Money Laundering Compliance Officer, nine registered investment companies for which Management acts as investment manager and administrator (six since 2002, one since 2003, one since 2005 and one since 2006). | |
|
| Claudia A. Brandon (1956) | | Executive Vice President since 2008 and Secretary since 1985 | | Senior Vice President, Neuberger, since 2007 and Employee since 1999; Senior Vice President, Management, since 2008 and Assistant Secretary since 2004; formerly, Vice President, Neuberger, 2002 to 2006; formerly, Vice President-Mutual Fund Board Relations, Management, 2000 to 2008; Executive Vice President, nine registered investment companies for which Management acts as investment manager and administrator (nine since 2008); Secretary, nine registered investment companies for which Management acts as investment manager and administrator (three since 1985, three since 2002, one since 2003, one since 2005 and one since 2006). | |
|
| Maxine L. Gerson (1950) | | Executive Vice President since 2008 and Chief Legal Officer since 2005 (only for purposes of sections 307 and 406 of the Sarbanes-Oxley Act of 2002) | | Managing Director, Neuberger, since 2009, and Deputy General Counsel and Assistant Secretary Neuberger since 2001; Managing Director, Management, since 2009, and Secretary and General Counsel, Management, since 2004; formerly, Senior Vice President, Neuberger, 2002 to 2009; formerly, Senior Vice President, Management, 2006 to 2009; Executive Vice President, nine registered investment companies for which Management acts as investment manager and administrator (nine since 2008); Chief Legal Officer (only for purposes of sections 307 and 406 of the Sarbanes-Oxley Act of 2002), nine registered investment companies for which Management acts as investment manager and administrator (eight since 2005 and one since 2006). | |
|
| Sheila R. James (1965) | | Assistant Secretary since 2002 | | Vice President, Neuberger, since 2008 and Employee since 1999; formerly, Assistant Vice President, Neuberger, 2007; Assistant Secretary, nine registered investment companies for which Management acts as investment manager and administrator (six since 2002, one since 2003, one since 2005 and one since 2006). | |
|
| Brian Kerrane (1969) | | Vice President since 2008 | | Senior Vice President, Neuberger, since 2006; formerly, Vice President, Neuberger, 2002 to 2006; Vice President, Management, since 2008 and Employee since 1991; Vice President, nine registered investment companies for which Management acts as investment manager and administrator (nine since 2008). | |
|
| Kevin Lyons (1955) | | Assistant Secretary since 2003 | | Assistant Vice President, Neuberger, since 2008 and Employee since 1999; Assistant Secretary, nine registered investment companies for which Management acts as investment manager and administrator (seven since 2003, one since 2005 and one since 2006). | |
|
32
Name, (Year of Birth),
and Address(1) | | Position and
Length of Time
Served(2) | | Principal Occupation(s)(3) | |
| Owen F. McEntee, Jr. (1961) | | Vice President since 2008 | | Vice President, Neuberger, since 2006; Employee, Management, since 1992; Vice President, nine registered investment companies for which Management acts as investment manager and administrator (nine since 2008). | |
|
| John M. McGovern (1970) | | Treasurer and Principal Financial and Accounting Officer since 2005 | | Senior Vice President, Neuberger, since 2007; formerly, Vice President, Neuberger, 2004 to 2006; Employee, Management, since 1993; Treasurer and Principal Financial and Accounting Officer, nine registered investment companies for which Management acts as investment manager and administrator (eight since 2005 and one since 2006); formerly, Assistant Treasurer, eight registered investment companies for which Management acts as investment manager and administrator, 2002 to 2005. | |
|
| Andrew Provencher (1965) | | Vice President since 2008 | | Managing Director, Management, since 2008; Managing Director, Neuberger, since 2005; formerly, Senior Vice President, Neuberger, 2003 to 2005; Vice President, nine registered investment companies for which Management acts as investment manager and administrator (nine since 2008). | |
|
| Frank Rosato (1971) | | Assistant Treasurer since 2005 | | Vice President, Neuberger, since 2006; Employee, Management, since 1995; Assistant Treasurer, nine registered investment companies for which Management acts as investment manager and administrator (eight since 2005 and one since 2006). | |
|
| Neil S. Siegel (1967) | | Vice President since 2008 | | Managing Director, Management, since 2008; Managing Director, Neuberger, since 2006; formerly, Senior Vice President, Neuberger, 2004 to 2006; Vice President, nine registered investment companies for which Management acts as investment manager and administrator (nine since 2008). | |
|
| Chamaine Williams (1971) | | Chief Compliance Officer since 2005 | | Senior Vice President, Neuberger, since 2007; Chief Compliance Officer, Management, since 2006; Chief Compliance Officer, nine registered investment companies for which Management acts as investment manager and administrator (eight since 2005 and one since 2006); formerly, Senior Vice President, LBI, 2007 to 2008; formerly, Vice President, LBI, 2003 to 2006; formerly, Chief Compliance Officer, Lehman Brothers Asset Management Inc., 2003 to 2007; formerly, Chief Compliance Officer, Lehman Brothers Alternative Investment Management LLC, 2003 to 2007. | |
|
(1) The business address of each listed person is 605 Third Avenue, New York, New York 10158.
(2) Pursuant to the By-Laws of the Trust, each officer elected by the Trustees shall hold office until his or her successor shall have been elected and qualified or until his or her earlier death, inability to serve, or resignation. Officers serve at the pleasure of the Trustees and may be removed at any time with or without cause.
(3) Except as otherwise indicated, each individual has held the positions shown for at least the last five years.
33
Proxy Voting Policies and Procedures
A description of the policies and procedures that the Trust uses to determine how to vote proxies relating to portfolio securities is available, without charge, by calling 1-800-877-9700 (toll-free) and on the website of the Securities and Exchange Commission, at www.sec.gov. Information regarding how the Trust voted proxies relating to portfolio securities during the most recent 12-month period ended June 30 is also available, without charge, by calling 1-800-877-9700 (toll-free), on the website of the Securities and Exchange Commission at www.sec.gov, and on Management's website at www.nb.com.
Quarterly Portfolio Schedule
The Trust files a complete schedule of portfolio holdings for the Fund with the Securities and Exchange Commission for the first and third quarters of each fiscal year on Form N-Q. The Trust's Forms N-Q are available on the Securities and Exchange Commission's website at www.sec.gov and may be reviewed and copied at the Securities and Exchange Commission's Public Reference Room in Washington, DC. Information on the operation of the Public Reference Room may be obtained by calling 1-800-SEC-0330. The information on Form N-Q is available upon request, without charge, by calling 1-800-877-9700 (toll free).
Board Consideration of the Management and Sub-Advisory Agreements
At a meeting held on October 14, 2010, the Board, including the Trustees who are not "interested persons" of Management (including its affiliates) or Neuberger Berman Advisers Management Trust ("Independent Fund Trustees"), approved the continuance of the Management and Sub-Advisory Agreements ("Agreements") for the Fund.
In evaluating the Agreements, the Board, including the Independent Fund Trustees, reviewed materials furnished by Management and Neuberger in response to questions submitted by counsel for the Independent Fund Trustees, and met with senior representatives of Management and Neuberger regarding their personnel and operations. The Independent Fund Trustees were advised by counsel that is experienced in 1940 Act matters and that is independent of Management and Neuberger. The Independent Fund Trustees received a memorandum from independent counsel discussing the legal standards for their consideration of the proposed continuance of the Agreements. They met with such counsel separately from representatives of Management to discuss the annual contract review. The annual contract review extends over two regular meetings of the Board to ensure that Management and Neuberger have time to respond to any questions the Independent Fund Trustees may have on their initial review of the report and that the Independent Fund Trustees have time to consider those responses. In addition, during this process, the Board held a separate meeting devoted primarily to reviewing and discussing Fund performance.
The Board considered the following factors, among others, in connection with its approval of the continuance of the Agreements: (1) the nature, extent, and quality of the services provided by Management and Neuberger; (2) the performance of the Fund compared to a relevant market index and a peer group of investment companies; (3) the costs of the services provided and profits or losses realized by Management and its affiliates from their relationship with the Fund; (4) the extent to which economies of scale might be realized as the Fund grows; and (5) whether fee levels reflect any such potential economies of scale for the benefit of investors in the Fund. In their deliberations, the Board members did not identify any particular information that was all-important or controlling, and each Trustee may have attributed different weights to the various factors.
The Board evaluated the terms of the Agreements, the overall fairness of the Agreements to the Fund and whether the Agreements were in the best interests of the Fund and its shareholders.
With respect to the nature, extent and quality of the services provided, the Board considered the performance of the Fund and the experience and staffing of the portfolio management and investment research personnel of Management and Neuberger who perform services for the Fund. The Board noted that Management also provides certain administrative services, including fund accounting and compliance oversight. The Board also considered Management's and Neuberger's policies and practices regarding brokerage and the quality of brokerage execution obtained by Management. The Board's
34
Portfolio Transactions and Pricing Committee from time to time reviewed the quality of the execution services that Management and Neuberger had provided, and periodically reviews studies by an independent firm engaged to review and evaluate the quality of brokerage execution received by the Fund. The Board also reviewed whether Management and Neuberger used brokers to execute Fund transactions that provide research and other services to Management and Neuberger, and the types of benefits potentially derived from such services by Management, Neuberger, the Fund and other clients of Management and Neuberger. In addition, the Board noted the positive compliance history of Management and Neuberger, as each firm has been free of significant reported compliance problems.
The Board considered the performance of the Fund relative to its benchmark and a peer group of investment companies dedicated to insurance products pursuing broadly similar strategies. The Board also considered performance in relation to certain measures of the degree of investment risk undertaken by the portfolio manager. The Board discussed the Fund's performance with Management and discussed steps that Management had taken, or intended to take, to improve the Fund's performance. The Board also considered Management's resources and responsiveness with respect to the Fund.
With respect to the overall fairness of the Agreements, the Board considered the fee structure for the Fund under the Agreements as compared to a peer group of comparable funds dedicated to insurance products and any fall-out benefits likely to accrue to Management or Neuberger or their affiliates from their relationship with the Fund. The Board also considered the profitability of Management and its affiliates from their association with the Fund.
The Board reviewed a comparison of the Fund's management fee and overall expense ratio to a peer group of broadly comparable funds dedicated to insurance products. The Board considered the mean and median of the management fees and expense ratios of the peer group. With regard to the sub-advisory fee paid to Neuberger, the Board noted that this fee is "at cost." In addition, the Board considered the contractual limit on Fund expenses undertaken by Management.
The Board considered whether there were other funds that were advised or sub-advised by Management or its affiliates or separate accounts managed by Management or its affiliates with similar investment objectives, policies and strategies to the Fund. The Board compared the fees charged to the Fund to the fees charged to an advised fund, a sub-advised fund and a separate account, each managed in a similar style to the Fund. The Board considered the appropriateness and reasonableness of any differences between the fees charged to the Fund and the other funds and account and determined that the differences in fees were consistent with the management and other services provided.
The Board also evaluated any apparent or anticipated economies of scale in relation to the services Management provides to the Fund. The Board considered whether the Fund's fee structure provides for a reduction of payments resulting from the use of breakpoints and whether those breakpoints are set at appropriate asset levels.
The Board also considered changes in management, staffing, resources and operations accompanying the separation of the Neuberger Berman entities from the LBHI bankruptcy estate.
In concluding that the benefits accruing to Management and its affiliates by virtue of their relationship to the Fund were reasonable in comparison with the costs of providing the investment advisory services and the benefits accruing to the Fund, the Board reviewed specific data as to Management's profit on the Fund for a recent period and the trend in profit or loss over recent years. The Board also carefully examined Management's cost allocation methodology. The Board recognized that Management should be entitled to earn a reasonable level of profits for services it provides to the Fund and, based on its review, concluded that Management's level of profitability was not excessive.
Conclusions
In approving the Agreements, the Board concluded that the terms of each Agreement are fair and reasonable and that approval of the Agreements is in the best interests of the Fund and its shareholders. In reaching this determination, the Board considered that Management and Neuberger could be expected to provide a high level of service to the Fund; that it retained confidence in Management's and Neuberger's capabilities to manage the Fund; that the Fund's fee structure appeared to the Board to be reasonable given the nature and quality of services provided; and that the benefits accruing to Management and its affiliates by virtue of their relationship to the Fund were reasonable in comparison with the benefits accruing to the Fund.
35

Neuberger Berman
Advisers Management Trust
Partners Portfolio
I Class Shares
Annual Report
December 31, 2010
Partners Portfolio Manager's Commentary
We are pleased to report that the Neuberger Berman Advisers Management Trust (AMT) Partners Portfolio delivered a positive return for full-year 2010, outperforming its benchmarks, the S&P 500 Index and the Russell 1000(R) Value Index.
Despite the lackluster U.S. economic recovery, the still soft labor and housing markets, and a European debt crisis that threatened global economic growth, 2010 was a good year for stocks. All 10 S&P 500 sectors posted gains, with four of the 10 sectors rising by more than 20%. Consumer Discretionary, Industrials, Materials, Energy and Telecommunications Services were the best performing sectors for the year. Stocks enjoyed a particularly strong fourth quarter due to the stabilization of European debt markets, the Federal Reserve's continued commitment to quantitative easing (which diminished fears of a double-dip recession), positive manufacturing data, growth in private payrolls, and a change in the balance of power in Washington, DC that eased concerns of further restrictive government regulation.
In 2010, the AMT Partners Portfolio had stronger performance than the S&P 500 in five of 10 sectors. Although stock selection contributed to superior relative performance, sector allocation had a greater impact on relative returns. The Portfolio was overweighted in Industrials and Materials (the second and third best performing S&P 500 sectors) and underweighted in Utilities and Information Technology (the second and third worst performing sectors).
Investments in the Materials, Consumer Staples and Industrials sectors had the most favorable impact on relative returns. As mentioned, the Portfolio was overweighted in Materials, with stocks such as diversified resources company Teck Resources, metallurgical coal producer Walter Energy and Freeport-McMoRan Copper & Gold being stellar performers. The Portfolio was underweighted in Consumer Staples, but the exceptional performance of vitamin company NBTY, which we sold when it received a premium takeover bid from a private equity group, helped produce strong returns in this sector. The Portfolio was overweighted in Industrials and standouts such as innovative automation and power systems producer ABB, engineering and construction firm Chicago Bridge & Iron, and mining equipment manufacturer Bucyrus International contributed to returns.
Other relative performance contributors include retailer Macy's and drilling rig component manufacturer National Oilwell Varco, which benefited from an anticipated resurgence in orders for new rigs for drilling in North American shale deposits.
Energy, Consumer Discretionary and Telecommunications investments penalized relative returns for the year. Although our Energy investments produced solid gains, our bias toward natural gas producers, such as disappointing performer Southwestern Energy, penalized relative returns. Similarly, our Consumer Discretionary holdings also produced strong gains, but lagged the corresponding benchmark sector component. The Portfolio had only modest exposure in the Telecommunications sector, with a new position in Telefonica established in the fourth quarter. We think this is an attractively valued company with good international franchises but, in the short time we owned it during the reporting period, Telefonica posted only a small single-digit percentage gain versus a low teen percentage return for S&P 500 Telecommunications stocks. Other performance detractors included Brazilian oil giant Petroleo Brasileiro, which sold off due to a major recapitalization, and mortgage servicing company Lender Processing Services, which was hurt by alleged problems with its foreclosure policies. We believe this issue will pass and the stock will rebound.
Although we have added new positions and eliminated some holdings, the Portfolio's sector allocation remains approximately the same as at the start of 2010. Currently, we are finding attractive opportunities in health care, consumer durables and technology stocks.
While equities in general enjoyed a good year and a very good fourth quarter, many investors remain risk averse, preferring the shelter of Treasury securities and corporate bonds to stocks. Consequently, relative to bonds, equities in our opinion are still quite attractively valued. We believe the Federal Reserve's ongoing commitment to quantitative easing has given investors confidence that a double-dip recession is unlikely and the most recent economic data point to slowly improving economic conditions. In our opinion, the recent increase in 10-year Treasury yields may be foreshadowing greater investor participation in the equity markets, perhaps providing a tailwind for stocks.
1
Of course, there are no guarantees that the economy will continue to improve or that equities will continue to advance in 2011. However, we believe the Portfolio's holdings remain undervalued based on normalized earnings and that our strategy of buying high-quality companies at low multiples to normalized earnings should pay off if the economy continues to recover and should also provide downside protection should it falter.
Sincerely,

S. Basu Mullick
Portfolio Manager
The risks involved in seeking capital appreciation from investments primarily in mid- to large-cap stocks are set forth in the prospectus and statement of additional information.
Mid-capitalization stocks are more vulnerable to financial risks and other risks than larger stocks. They also trade less frequently and in lower volume than larger company stocks, so their market prices tend to be more volatile. Large-cap stocks are subject to all the risks of stock market investing, including the risk that they may lose value due to overall market or economic conditions.
The composition, industries and holdings of the Portfolio are subject to change. The AMT Partners Portfolio is invested in a wide array of stocks and no single holding makes up a significant portion of the Portfolio's total assets.
2
Partners Portfolio (Unaudited)
SECTOR ALLOCATION
| (% of Total Investments) | |
| Consumer Discretionary | | | 12.6 | % | |
| Consumer Staples | | | 4.9 | | |
| Energy | | | 15.3 | | |
| Financials | | | 25.3 | | |
| Health Care | | | 12.6 | | |
| Industrials | | | 12.1 | | |
| Information Technology | | | 7.9 | | |
| Materials | | | 5.4 | | |
| Telecommunication Services | | | 1.3 | | |
| Utilities | | | 0.3 | | |
| Short-Term | | | 2.3 | | |
| Total | | | 100.0 | % | |
PERFORMANCE HIGHLIGHTS1
| | | | | Average Annual Total Return
Ended 12/31/2010 | |
| | | Inception
Date | | 1 Year | | 5 Years | | 10 Years | | Life of
Fund* | |
| Partners Portfolio Class I | | 03/22/1994 | | | 15.55 | % | | | 1.07 | % | | | 3.96 | % | | | 8.22 | % | |
Russell 1000R)
Value Index2 | | | | | | | 15.51 | % | | | 1.28 | % | | | 3.26 | % | | | 8.66 | % | |
| S&P 500 Index2 | | | | | | | 15.06 | % | | | 2.29 | % | | | 1.41 | % | | | 8.07 | % | |
Performance data quoted represent past performance, which is no guarantee of future results. The investment return and principal value of an investment will fluctuate so that an investor's shares, when redeemed, may be worth more or less than their original cost. Results are shown on a "total return" basis and include reinvestment of all income dividends and distributions.
Current performance may be lower or higher than the performance data quoted. For performance data current to the most recent month end, please visit https://www.nb.com.
* Index returns are as of inception date 03/22/1994.
As stated in the Portfolio's most recent prospectus, the total annual operating expense ratio for fiscal year 2009 was 1.06% for Class I shares, (prior to any fee waivers or expense reimbursements). Neuberger Berman Management LLC has contractually agreed to limit certain expenses of the Portfolio through 12/31/2013.
COMPARISON OF A $10,000 INVESTMENT
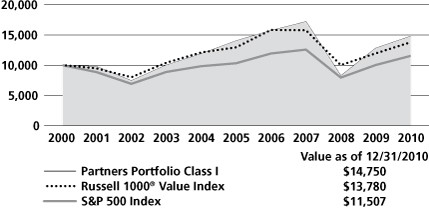
This chart shows the value of a hypothetical $10,000 investment in the Portfolio over the past 10 fiscal years, or since the Portfolio's inception, if it has not operated for 10 years. The result is compared with one or more benchmarks, which may include a broad-based market index and/or a narrower index. Please note that market indices have not been reduced to reflect any of the fees and costs of investing. All results include the reinvestment of income dividends and distributions. Neither the Portfolio's returns nor the market indices shown in the graph and table reflect the effect of taxes an investor would pay on Portfolio distributions or on the redemption of Portfolio shares. Results represent past performance and do not indicate future results.
Please see Endnotes for additional information.
3
Endnotes
1 "Total Return" includes reinvestment of all income dividends and distributions. Results represent past performance and do not indicate future results. The value of an investment in the Portfolio and the return on the investment both will fluctuate, and redemption proceeds may be higher or lower than an investor's original cost. The performance information does not reflect fees and expenses of the variable annuity and variable life insurance policies or the qualified pension and retirement plans whose proceeds are invested in the Portfolio. Neuberger Berman Management LLC ("NBM LLC") has agreed to absorb certain expenses of the AMT Portfolios, including the Portfolio. Without this arrangement, which is subject to change, the total returns of the Portfolio may have been less.
2 The Russell 1000(R) Value Index measures the performance of those Russell 1000(R) companies with lower price-to-book ratios and lower forecasted growth values. The Russell 1000 Index measures the performance of the 1,000 largest companies in the Russell 3000(R) Index (which measures the performance of the 3,000 largest U.S. companies based on total market capitalization). The Russell 1000 Index represents approximately 92% of the total market capitalization of the Russell 3000 Index. The S&P 500 Index is widely regarded as the standard for measuring large-cap U.S. stock market performance and includes a representative sample of the leading companies in leading industries. Please note that indices do not take into account any fees and expenses of investing in the individual securities that they track and that individuals cannot invest directly in any index. Data about the performance of these indices are prepared or obtained by NBM LLC and include reinvestment of all income dividends and distributions. The Portfolio may invest in many securities not included in the above-described indices or may not invest in all securities included in the above-described indices.
Any ratios or other measurements using a factor of forecasted earnings of a company discussed herein are based on consensus estimates, not NBM LLC's own projections, and they may or may not be realized. In addition, any revision to a forecast could affect the market price of a security. By quoting them herein, NBM LLC does not offer an opinion as to the accuracy of and does not guarantee these forecasted numbers.
The investments for the Portfolio are managed by the same portfolio manager(s) who manage one or more other mutual funds that have similar names, investment objectives and investment styles as the Portfolio. You should be aware that the Portfolio is likely to differ from the other mutual funds in size, cash flow pattern and tax matters. Accordingly, the holdings and performance can be expected to vary from those of the other mutual funds.
The composition, industries and holdings of the Portfolio are subject to change.
Shares of the separate AMT Portfolios are not available to the general public. Shares of this Portfolio may be purchased only by life insurance companies to be used with their separate accounts that fund variable annuity and variable life insurance policies and by qualified pension and retirement plans.
Statistics and projections in this report are derived from sources deemed to be reliable but cannot be regarded as a representation of future results of the AMT Portfolios. This report is prepared for the general information of shareholders and is not an offer of shares of the AMT Portfolios. Shares of the AMT Portfolios are sold only through the currently effective prospectuses, which must precede or accompany this report.
The "Neuberger Berman" name and logo are registered service marks of Neuberger Berman Group LLC. "Neuberger Berman Management LLC" and the individual Fund names in this piece are either service marks or registered service marks of Neuberger Berman Management LLC.
(c) 2011 Neuberger Berman Management LLC distributor. All rights reserved.
4
Information About Your Fund's Expenses
This table is designed to provide information regarding costs related to your investments. All mutual funds incur operating expenses, which include management fees, fees for administrative services and costs of shareholder reports, among others. The following examples are based on an investment of $1,000 made at the beginning of the six month period ended December 31, 2010 and held for the entire period. The table illustrates the fund's costs in two ways:
| Actual Expenses and Performance: | | The first section of the table provides information about actual account values and actual expenses in dollars, based on the fund's actual performance during the period. You may use the information in this line, together with the amount you invested, to estimate the expenses you paid over the period. Simply divide your account value by $1,000 (for example, an $8,600 account value divided by $1,000 = 8.6), then multiply the result by the number in the first section of the table under the heading entitled "Expenses Paid During the Period" to estimate the expenses you paid over the period. | |
|
Hypothetical Example for
Comparison Purposes: | | The second section of the table provides information about hypothetical account values and hypothetical expenses based on the fund's actual expense ratio and an assumed rate of return at 5% per year before expenses. This return is not the fund's actual return. The hypothetical account values and expenses may not be used to estimate the actual ending account balance or expenses you paid for the period. You may use this information to compare the ongoing costs of investing in this fund versus other funds. To do so, compare the expenses shown in this 5% hypothetical example with the 5% hypothetical examples that appear in the shareholder reports of other funds. | |
|
Please note that the expenses in the table are meant to highlight your ongoing costs only. The table and expense example do not include any transaction costs, such as fees and expenses that are, or may be, imposed under your variable contract or qualified pension plan. Therefore, the information under the heading "Hypothetical (5% annual return before expenses)" is useful in comparing ongoing costs only, and will not help you determine the relative total costs of owning different funds. In addition, if these transaction costs were included, your costs would have been higher.
Expense Information as of 12/31/10 (Unaudited)
NEUBERGER BERMAN ADVISERS MANAGEMENT TRUST PARTNERS PORTFOLIO
| Actual | | Beginning Account
Value
7/1/10 | | Ending Account
Value
12/31/10 | | Expenses Paid During
the Period*
7/1/10 - 12/31/10 | |
| Class I | | $ | 1,000.00 | | | $ | 1,270.60 | | | $ | 6.30 | | |
| Hypothetical (5% annual return before expenses)** | |
| Class I | | $ | 1,000.00 | | | $ | 1,019.66 | | | $ | 5.60 | | |
* Expenses are equal to the annualized expense ratio of 1.10%, multiplied by the average account value over the period, multiplied by 184/365 (to reflect the one-half year period shown).
** Hypothetical 5% annual return before expenses is calculated by multiplying the number of days in the most recent half year divided by 365.
5
Schedule of Investments Partners Portfolio
| NUMBER OF SHARES | | | | VALUEt | |
| Common Stocks (97.9%) | | | |
| Aerospace & Defense (2.2%) | | | |
| | 33,100 | | | Boeing Co. | | $ | 2,160,106 | | |
| Auto Components (0.7%) | | | |
| | 7,100 | | | Lear Corp. | | | 700,841 | * | |
| Automobiles (1.5%) | | | |
| | 21,500 | | | General Motors | | | 792,490 | * | |
| | 18,000 | | | Harley-Davidson | | | 624,060 | | |
| | | | 1,416,550 | | |
| Beverages (0.8%) | | | |
| | 11,500 | | | Coca-Cola | | | 756,355 | | |
| Biotechnology (1.0%) | | | |
| | 17,400 | | | Amgen Inc. | | | 955,260 | * | |
| Building Products (3.0%) | | | |
| | 68,500 | | | Masco Corp. | | | 867,210 | | |
| | 65,500 | | | Owens Corning | | | 2,040,325 | * | |
| | | | 2,907,535 | | |
| Capital Markets (5.1%) | | | |
| | 10,000 | | | Goldman Sachs Group | | | 1,681,600 | | |
| | 80,900 | | | Invesco Ltd. | | | 1,946,454 | | |
| | 28,100 | | | State Street | | | 1,302,154 | | |
| | | | 4,930,208 | | |
| Commercial Banks (4.9%) | | | |
| | 95,600 | | | Fifth Third Bancorp | | | 1,403,408 | | |
| | 39,000 | | | SunTrust Banks | | | 1,150,890 | | |
| | 72,700 | | | Wells Fargo | | | 2,252,973 | | |
| | | | 4,807,271 | | |
| Communications Equipment (1.4%) | | | |
| | 23,100 | | | Research In Motion | | | 1,342,803 | * | |
| Computers & Peripherals (1.6%) | | | |
| | 37,400 | | | Hewlett-Packard | | | 1,574,540 | | |
| Construction & Engineering (1.1%) | | | |
| | 33,200 | | | Chicago Bridge & Iron | | | 1,092,280 | * | |
| Consumer Finance (2.6%) | | | |
| | 43,000 | | | American Express | | | 1,845,560 | | |
| | 16,500 | | | Capital One Financial | | | 702,240 | | |
| | | | 2,547,800 | | |
| NUMBER OF SHARES | | | | VALUEt | |
| Diversified Financial Services (8.8%) | | | |
| | 194,900 | | | Bank of America | | $ | 2,599,966 | | |
| | 382,623 | | | Citigroup Inc. | | | 1,809,807 | * | |
| | 48,100 | | | J.P. Morgan Chase | | | 2,040,402 | | |
| | 80,700 | | | Moody's Corp. | | | 2,141,778 | | |
| | | | 8,591,953 | | |
Diversified Telecommunication
Services (1.3%) | | | |
| | 18,900 | | | Telefonica SA ADR | | | 1,293,138 | | |
| Electric Utilities (0.3%) | | | |
| | 19,000 | | | NV Energy | | | 266,950 | | |
| Electrical Equipment (1.7%) | | | |
| | 75,600 | | | ABB Ltd. ADR | | | 1,697,220 | | |
| Energy Equipment & Services (5.2%) | | | |
| | 36,300 | | | Halliburton Co. | | | 1,482,129 | | |
| | 49,200 | | | McDermott International | | | 1,017,948 | * | |
| | 20,900 | | | National Oilwell Varco | | | 1,405,525 | | |
| | 48,300 | | | Weatherford International | | | 1,101,240 | * | |
| | | | 5,006,842 | | |
| Food & Staples Retailing (1.2%) | | | |
| | 32,300 | | | CVS Caremark | | | 1,123,071 | | |
| Health Care Equipment & Supplies (3.1%) | | | |
| | 34,200 | | | Covidien PLC | | | 1,561,572 | | |
| | 27,000 | | | Zimmer Holdings | | | 1,449,360 | * | |
| | | | 3,010,932 | | |
| Health Care Providers & Services (5.3%) | | | |
| | 38,700 | | | Aetna Inc. | | | 1,180,737 | | |
| | 13,800 | | | AmerisourceBergen Corp. | | | 470,856 | | |
| | 31,800 | | | Medco Health Solutions | | | 1,948,386 | * | |
| | 27,200 | | | WellPoint Inc. | | | 1,546,592 | * | |
| | | | 5,146,571 | | |
| Household Durables (2.0%) | | | |
| | 750 | | | NVR, Inc. | | | 518,265 | * | |
| | 15,900 | | | Whirlpool Corp. | | | 1,412,397 | | |
| | | | 1,930,662 | | |
| Household Products (1.5%) | | | |
| | 20,100 | | | Energizer Holdings | | | 1,465,290 | * | |
| Industrial Conglomerates (1.0%) | | | |
| | 40,300 | | | Textron Inc. | | | 952,692 | | |
See Notes to Schedule of Investments
6
| NUMBER OF SHARES | | | | VALUEt | |
| Insurance (3.9%) | | | |
| | 29,000 | | | Berkshire Hathaway Class B | | $ | 2,323,190 | * | |
| | 32,400 | | | MetLife, Inc. | | | 1,439,856 | | |
| | | | 3,763,046 | | |
| IT Services (2.1%) | | | |
| | 59,100 | | | Lender Processing Services | | | 1,744,632 | | |
| | 1,400 | | | MasterCard, Inc. Class A | | | 313,754 | | |
| | | | 2,058,386 | | |
| Machinery (3.0%) | | | |
| | 8,200 | | | Bucyrus International | | | 733,080 | | |
| | 27,800 | | | Ingersoll-Rand PLC | | | 1,309,102 | | |
| | 29,000 | | | Terex Corp. | | | 900,160 | * | |
| | | | 2,942,342 | | |
| Media (2.1%) | | | |
| | 57,000 | | | McGraw-Hill Cos. | | | 2,075,370 | | |
| Metals & Mining (5.0%) | | | |
| | 11,100 | | | Cliffs Natural Resources | | | 865,911 | | |
| | 7,100 | | | Freeport-McMoRan | | | 852,639 | | |
| | | | | Copper & Gold | | | | | |
| | 26,600 | | | Teck Resources Class B | | | 1,644,678 | | |
| | 5,900 | | | Walter Energy | | | 754,256 | | |
| | 32,100 | | | Xstrata PLC | | | 753,459 | | |
| | | | 4,870,943 | | |
| Multiline Retail (2.2%) | | | |
| | 26,700 | | | J.C. Penney | | | 862,677 | | |
| | 51,200 | | | Macy's, Inc. | | | 1,295,360 | | |
| | | | 2,158,037 | | |
| Oil, Gas & Consumable Fuels (10.2%) | | | |
| | 6,400 | | | Alpha Natural Resources | | | 384,192 | * | |
| | 43,300 | | | Canadian Natural Resources | | | 1,923,386 | | |
| | 46,600 | | | Cenovus Energy | | | 1,548,984 | | |
| | 17,100 | | | EOG Resources | | | 1,563,111 | | |
| | 11,500 | | | Peabody Energy | | | 735,770 | | |
| | 48,700 | | | Petroleo Brasileiro ADR | | | 1,842,808 | | |
| | 32,100 | | | Southwestern Energy | | | 1,201,503 | * | |
| | 31,900 | | | Talisman Energy | | | 707,861 | | |
| | | | 9,907,615 | | |
| Paper & Forest Products (0.4%) | | | |
| | 12,700 | | | International Paper | | | 345,948 | | |
| Personal Products (1.4%) | | | |
| | 48,300 | | | Avon Products | | | 1,403,598 | | |
| Pharmaceuticals (3.3%) | | | |
| | 64,200 | | | Pfizer Inc. | | | 1,124,142 | | |
| | 28,900 | | | Shire PLC ADR | | | 2,091,782 | | |
| | | | 3,215,924 | | |
| NUMBER OF SHARES | | | | VALUEt | |
Semiconductors & Semiconductor
Equipment (0.9%) | | | |
| | 39,900 | | | Intel Corp. | | $ | 839,097 | | |
| Software (2.0%) | | | |
| | 20,600 | | | Check Point Software | | | 952,956 | * | |
| | | | | Technologies | | | | | |
| | 31,100 | | | Oracle Corp. | | | 973,430 | | |
| | | | 1,926,386 | | |
| Specialty Retail (4.1%) | | | |
| | 30,500 | | | Aeropostale, Inc. | | | 751,520 | * | |
| | 33,600 | | | Best Buy | | | 1,152,144 | | |
| | 19,300 | | | Limited Brands | | | 593,089 | | |
| | 58,900 | | | Lowe's Cos. | | | 1,477,212 | | |
| | | | 3,973,965 | | |
| | | | | Total Common Stocks
(Cost $64,591,154) | | | 95,157,527 | | |
| Short-Term Investments (2.4%) | | | |
| | | | | State Street Institutional
Liquid Reserves Fund
Institutional Class
(Cost $2,288,782) | | | 2,288,782 | | |
| | | | | Total Investments (100.3%)
(Cost $66,879,936) | | | 97,446,309 | ## | |
| | | | | Liabilities, less cash, receivables and
other assets [(0.3%)] | | | (290,565 | ) | |
| | | | | Total Net Assets (100.0%) | | $ | 97,155,744 | | |
See Notes to Schedule of Investments
7
Notes to Schedule of Investments Partners Portfolio
t In accordance with Accounting Standards Codification ("ASC") 820 "Fair Value Measurements and Disclosures" ("ASC 820"), all investments held by Neuberger Berman Advisers Management Trust Partners Portfolio (the "Fund") are carried at the value that Neuberger Berman Management LLC ("Management") believes the Fund would receive upon selling an investment in an orderly transaction to an independent buyer in the principal or most advantageous market for the investment under current market conditions. Various inputs, including the volume and level of activity for the asset or liability in the market, are considered in valuing the Fund's investments, some of which are discussed below. Significant management judgment may be necessary to value investments in accordance with ASC 820.
ASC 820 established a three-tier hierarchy of inputs to create a classification of value measurements for disclosure purposes. The three-tier hierarchy of inputs is summarized in the three broad Levels listed below.
. Level 1 - quoted prices in active markets for identical investments
. Level 2 - other significant observable inputs (including quoted prices for similar investments, interest rates, prepayment speeds, credit risk, amortized cost, etc.)
. Level 3 - significant unobservable inputs (including the Fund's own assumptions in determining the fair value of investments)
The inputs or methodology used for valuing an investment are not necessarily an indication of the risk associated with investing in those securities.
The value of the Fund's investments in equity securities and purchased option contracts, for which market quotations are readily available, is generally determined by Management by obtaining valuations from an independent pricing service based on the latest sale price quoted in active markets (Level 1 inputs). Securities traded primarily on the NASDAQ Stock Market are normally valued by the Fund at the NASDAQ Official Closing Price ("NOCP") provided by NASDAQ each business day. The NOCP is the most recently reported price as of 4:00:02 p.m., Eastern time, unless that price is outside the range of the "inside" bid and asked prices (i.e., the bid and asked prices that dealers quote to each other when trading for their own accounts); in that case, NASDAQ will adjust the price to equal the inside bid or asked price, whichever is closer. Because of delays in reporting trades, the NOCP may not be based on the price of the last trade to occur before the market closes. If there is no reported sale of a security on a particular day, the independent pricing service may value the security based on reported market quotations.
Management has developed a process to periodically review information provided by independent pricing services for all types of securities.
Investments in State Street Institutional Liquid Reserves Fund Institutional Class are valued using the fund's daily calculated net asset value ("NAV").
For equity securities, if a valuation is not available from an independent pricing service, or if Management has reason to believe that the valuation received does not represent the amount the Fund might reasonably expect to receive on a current sale in an orderly transaction, the Fund seeks to obtain quotations from principal market makers (generally considered Level 3 inputs). If such quotations are not readily available, the security is valued using methods the Board of Trustees of Neuberger Berman Advisers Management Trust (the "Board") has approved on the belief that they reflect fair value. Numerous factors may be considered when determining the fair value of a security based on Level 2 or 3 inputs, including available analyst, media or other reports, trading in futures or ADRs and whether the issuer of the security being fair valued has other securities outstanding.
The value of the Fund's investments in foreign securities is generally determined using the same valuation methods and inputs as other Fund investments, as discussed above. Foreign security prices are expressed in local currency
See Notes to Financial Statements
8
Notes to Schedule of Investments Partners Portfolio (cont'd)
values and are translated from the local currency into U.S. dollars using the exchange rates as of 4:00 p.m., Eastern time. The Board has approved the use of Interactive Data Pricing and Reference Data, Inc. ("Interactive") to assist in determining the fair value of foreign equity securities when changes in the value of a certain index suggest that the closing prices on the foreign exchanges may no longer represent the amount that the Fund could expect to receive for those securities. In this event, Interactive will provide adjusted prices for certain foreign equity securities using a statistical analysis of historical correlations of multiple factors (Level 2 inputs). In the absence of precise information about the market values of these foreign securities as of the close of the New York Stock Exchange, the Board has determined on the basis of available data that prices adjusted in this way are likely to be closer to the prices the Fund could realize on a current sale than are the prices of those securities established at the close of the foreign markets in which the securities primarily trade. These fair value prices are necessarily estimates, and there is no assurance that such a price will be at or close to the price at which the security is next quoted or next trades.
The following is a summary, categorized by Level, of inputs used to value the Fund's investments as of December 31, 2010:
| Asset Valuation Inputs | | Level 1 | | Level 2 | | Level 3 | | Total | |
| Investments: | |
| Common Stocks^ | | $ | 95,157,527 | | | $ | -- | | | $ | -- | | | $ | 95,157,527 | | |
| Short-Term Investments | | | -- | | | | 2,288,782 | | | | -- | | | | 2,288,782 | | |
| Total Investments | | $ | 95,157,527 | | | $ | 2,288,782 | | | $ | -- | | | $ | 97,446,309 | | |
^ The Schedule of Investments provides information on the industry categorization for the portfolio.
The Fund had no significant transfers between Levels 1 and 2 during the year ended December 31, 2010.
## At December 31, 2010, the cost of investments for U.S. federal income tax purposes was $67,623,473. Gross unrealized appreciation of investments was $29,934,074 and gross unrealized depreciation of investments was $111,238, resulting in net unrealized appreciation of $29,822,836, based on cost for U.S. federal income tax purposes.
* Security did not produce income during the last twelve months.
See Notes to Financial Statements
9
Statement of Assets and Liabilities
Neuberger Berman Advisers Management Trust
| | | PARTNERS
PORTFOLIO | |
| | | December 31, 2010 | |
| Assets | |
| Investments in securities, at value* (Notes A & F)--see Schedule of Investments: | |
| Unaffiliated issuers | | $ | 97,446,309 | | |
| Cash | | | 11,330 | | |
| Foreign currency | | | 35,881 | | |
| Dividends and interest receivable | | | 34,236 | | |
| Receivable for securities sold | | | 69,994 | | |
| Receivable for Fund shares sold | | | 113,676 | | |
| Prepaid expenses and other assets | | | 15,890 | | |
| Total Assets | | | 97,727,316 | | |
| Liabilities | |
| Payable for Fund shares redeemed | | | 446,327 | | |
| Payable to investment manager (Notes A & B) | | | 44,731 | | |
| Payable to administrator (Note B) | | | 24,399 | | |
| Accrued expenses and other payables | | | 56,115 | | |
| Total Liabilities | | | 571,572 | | |
| Net Assets at value | | $ | 97,155,744 | | |
| Net Assets consist of: | |
| Paid-in capital | | $ | 106,303,166 | | |
| Distributions in excess of net investment income | | | (590 | ) | |
| Accumulated net realized gains (losses) on investments | | | (39,719,092 | ) | |
| Net unrealized appreciation (depreciation) in value of investments | | | 30,572,260 | | |
| Net Assets at value | | $ | 97,155,744 | | |
| Shares Outstanding ($.001 par value; unlimited shares authorized) | | | 8,620,504 | | |
| Net Asset Value, offering and redemption price per share | | $ | 11.27 | | |
| *Cost of Investments: | |
| Unaffiliated issuers | | $ | 66,879,936 | | |
| Total cost of foreign currency | | $ | 30,101 | | |
See Notes to Financial Statements
10
Statement of Operations
Neuberger Berman Advisers Management Trust
| | | PARTNERS
PORTFOLIO | |
| | | For the
Year Ended
December 31, 2010 | |
| Investment Income: | |
| Income (Note A): | |
| Dividend income--unaffiliated issuers | | $ | 1,031,013 | | |
| Interest income--unaffiliated issuers | | | 4,586 | | |
| Income from securities loaned--net (Note F) | | | 1,035 | | |
| Foreign taxes withheld | | | (16,572 | ) | |
| Total income | | $ | 1,020,062 | | |
| Expenses: | |
| Investment management fees (Notes A & B) | | | 515,679 | | |
| Administration fees (Note B) | | | 281,280 | | |
| Audit fees | | | 40,900 | | |
| Custodian fees (Note B) | | | 42,743 | | |
| Insurance expense | | | 10,220 | | |
| Legal fees | | | 43,797 | | |
| Shareholder reports | | | 41,779 | | |
| Trustees' fees and expenses | | | 52,324 | | |
| Miscellaneous | | | 9,142 | | |
| Total expenses | | | 1,037,864 | | |
| Expenses reduced by custodian fee expense offset arrangement (Note B) | | | (16 | ) | |
| Total net expenses | | | 1,037,848 | | |
| Net investment income (loss) | | $ | (17,786 | ) | |
| Realized and Unrealized Gain (Loss) on Investments (Note A) | |
| Net realized gain (loss) on: | |
| Sales of investment securities of unaffiliated issuers | | | 13,227,322 | | |
| Foreign currency | | | (3,921 | ) | |
| Change in net unrealized appreciation (depreciation) in value of: | |
| Unaffiliated investment securities | | | 16,126 | | |
| Foreign currency | | | 5,846 | | |
| Net gain (loss) on investments | | | 13,245,373 | | |
| Net increase (decrease) in net assets resulting from operations | | $ | 13,227,587 | | |
See Notes to Financial Statements
11
Statements of Changes in Net Assets
Neuberger Berman Advisers Management Trust
| | | PARTNERS PORTFOLIO | |
| | | Year Ended
December 31,
2010 | | Year Ended
December 31,
2009 | |
| Increase (Decrease) in Net Assets: | |
| From Operations (Note A): | |
| Net investment income (loss) | | $ | (17,786 | ) | | $ | 587,217 | | |
| Net realized gain (loss) on investments | | | 13,223,401 | | | | (47,548,731 | ) | |
| Change in net unrealized appreciation (depreciation) of investments | | | 21,972 | | | | 133,748,801 | | |
| Net increase (decrease) in net assets resulting from operations | | | 13,227,587 | | | | 86,787,287 | | |
| Distributions to Shareholders From (Note A): | |
| Net investment income | | | (618,077 | ) | | | (2,064,013 | ) | |
| Net realized gain on investments | | | -- | | | | (9,167,082 | ) | |
| Total distributions to shareholders | | | (618,077 | ) | | | (11,231,095 | ) | |
| From Fund Share Transactions (Note D): | |
| Proceeds from shares sold | | | 16,087,325 | | | | 29,636,602 | | |
| Proceeds from reinvestment of dividends and distributions | | | 618,077 | | | | 11,231,095 | | |
| Payments for shares redeemed | | | (28,906,444 | ) | | | (237,555,835 | ) | |
| Net increase (decrease) from Fund share transactions | | | (12,201,042 | ) | | | (196,688,138 | ) | |
| Net Increase (Decrease) in Net Assets | | | 408,468 | | | | (121,131,946 | ) | |
| Net Assets: | |
| Beginning of year | | | 96,747,276 | | | | 217,879,222 | | |
| End of year | | $ | 97,155,744 | | | $ | 96,747,276 | | |
| Undistributed net investment income (loss) at end of year | | $ | -- | | | $ | 631,363 | | |
| Distributions in excess of net investment income at end of year | | $ | (590 | ) | | $ | -- | | |
See Notes to Financial Statements
12
Notes to Financial Statements Partners Portfolio
Note A--Summary of Significant Accounting Policies:
1 General: The Fund is a separate operating series of Neuberger Berman Advisers Management Trust (the "Trust"), a Delaware statutory trust organized pursuant to a Trust Instrument dated May 23, 1994. The Trust is currently comprised of ten separate operating series (each individually a "Series," and collectively the "Funds") each of which is diversified. The Trust is registered as an open-end management investment company under the Investment Company Act of 1940, as amended (the "1940 Act"), and its shares are registered under the Securities Act of 1933, as amended. The Fund currently offers only Class I shares. The Board may establish additional series or classes of shares without the approval of shareholders.
The assets of each Series belong only to that Series, and the liabilities of each Series are borne solely by that Series and no other.
The preparation of financial statements in accordance with U.S. generally accepted accounting principles requires Management to make estimates and assumptions at the date of the financial statements. Actual results could differ from those estimates.
2 Portfolio valuation: Investment securities are valued as indicated in the notes following the Schedule of Investments.
3 Foreign currency translation: The accounting records of the Fund are maintained in U.S. dollars. Foreign currency amounts are translated into U.S. dollars using the exchange rates as of 4:00 p.m., Eastern time, to determine the value of investments, other assets and liabilities. Purchase and sale prices of securities, and income and expenses, are translated into U.S. dollars at the prevailing rate of exchange on the respective dates of such transactions. Net unrealized foreign currency gain (loss), if any, arises from changes in the value of assets and liabilities, other than investments in securities, as a result of changes in exchange rates and is stated separately in the Statement of Operations.
4 Securities transactions and investment income: Securities transactions are recorded on trade date for financial reporting purposes. Dividend income is recorded on the ex-dividend date or, for certain foreign dividends, as soon as the Fund becomes aware of the dividends. Non-cash dividends included in dividend income, if any, are recorded at the fair market value of the securities received. Interest income, including accretion of original issue discount, where applicable, and accretion of discount on short-term investments, if any, is recorded on the accrual basis. Realized gains and losses from securities transactions and foreign currency transactions, if any, are recorded on the basis of identified cost and stated separately in the Statement of Operations. Included in net realized gain (loss) on investments are proceeds from the settlements of class action litigation in which the Fund participated as a class member. The amount of such proceeds for the year ended December 31, 2010 was $141,817.
5 Income tax information: The Funds are treated as separate entities for U.S. federal income tax purposes. It is the policy of the Fund to continue to qualify as a regulated investment company by complying with the requirements of the U.S. Internal Revenue Code applicable to regulated investment companies and to distribute substantially all of its earnings to its shareholders. To the extent the Fund distributes substantially all of its earnings to shareholders, no federal income or excise tax provision is required.
The Fund has adopted the provisions of ASC 740 "Income Taxes" ("ASC 740"). ASC 740 sets forth a minimum threshold for financial statement recognition of a tax position taken, or expected to be taken, in a tax return. The Fund recognizes interest and penalties, if any, related to unrecognized tax positions as an income tax expense in the Statement of Operations. The Fund is subject to examination by U.S. federal and state tax authorities for returns filed for the prior three fiscal years 2007 - 2009. As of December 31, 2010, the Fund did not have any unrecognized tax positions.
Income distributions and capital gain distributions are determined in accordance with income tax regulations, which may differ from U.S. generally accepted accounting principles. These differences are primarily due to
13
differing treatments of income and gains on various investment securities held by the Fund, timing differences and differing characterization of distributions made by the Fund as a whole. The Fund may also utilize earnings and profits distributed to shareholders on redemption of shares as a part of the dividends paid deduction for income tax purposes.
As determined on December 31, 2010, permanent differences resulting primarily from different book and tax accounting for net operating losses, foreign currency gains and losses, return of capital adjustments and distributions in excess of current earnings were reclassified at fiscal year-end. These reclassifications had no effect on net income, NAV or NAV per share of the Fund.
The tax character of distributions paid during the years ended December 31, 2010 and December 31, 2009 was as follows:
| | | Distributions Paid From: | | | |
| Ordinary Income | | Long-Term Capital Gain | | Total | |
| 2010 | | 2009 | | 2010 | | 2009 | | 2010 | | 2009 | |
| $ | 618,077 | | | $ | 2,064,013 | | | $ | -- | | | $ | 9,167,082 | | | $ | 618,077 | | | $ | 11,231,095 | | |
As of December 31, 2010, the components of distributable earnings (accumulated losses) on a U.S. federal income tax basis were as follows:
Undistributed
Ordinary
Income | | Undistributed
Long-Term
Gain | | Unrealized
Appreciation
(Depreciation) | | Loss
Carryforwards
and Deferrals | | Total | |
| $ | -- | | | $ | -- | | | $ | 29,828,723 | | | $ | (38,976,145 | ) | | $ | (9,147,422 | ) | |
The difference between book basis and tax basis distributable earnings is attributable primarily to timing differences of wash sales, return of capital adjustment, post October loss deferrals and capital loss carryforwards.
To the extent the Fund's net realized capital gains, if any, can be offset by capital loss carryforwards, it is the policy of the Fund not to distribute such gains. Under current tax law, the use of these losses to offset future gains may be limited. As determined at December 31, 2010, the Fund had unused capital loss carryforwards available for federal income tax purposes to offset net realized capital gains, if any, as follows:
| | | Expiring in: | |
| | | 2017 | |
| | | $ | 38,975,555 | | |
During the year ended December 31, 2010, the Fund utilized capital loss carryforwards of $11,430,911.
Under current tax law, certain net capital and net foreign currency losses realized after October 31 within the taxable year may be deferred and treated as occurring on the first day of the following tax year. For the year ended December 31, 2010, the Fund elected to defer $590 of net foreign currency losses arising between November 1, 2010 and December 31, 2010.
6 Distributions to shareholders: The Fund may earn income, net of expenses, daily on its investments. Distributions from net investment income and net realized capital gains, if any, generally are distributed once a year (usually in October). Income distributions and capital gain distributions to shareholders are recorded on the ex-date.
7 Foreign taxes: Foreign taxes withheld represent amounts withheld by foreign tax authorities, net of refunds recoverable.
8 Expense allocation: Certain expenses are applicable to multiple funds. Expenses directly attributable to a Series are charged to that Series. Expenses of the Trust that are not directly attributable to a particular series of the Trust (e.g., the Fund) are allocated among the series of the Trust, on the basis of relative net assets, except where a more appropriate allocation of expenses to each of the series can otherwise be made fairly. Expenses borne by the
14
complex of related investment companies, which includes open-end and closed-end investment companies for which Management serves as investment manager, that are not directly attributable to a particular investment company in the complex (e.g., the Trust) or series thereof are allocated among the investment companies in the complex or series thereof, on the basis of relative net assets, except where a more appropriate allocation of expenses to each investment company in the complex or series thereof can otherwise be made fairly.
9 Security lending: A third party, eSecLending, has assisted the Fund in conducting a bidding process to try to identify a principal that would pay a guaranteed amount to the Fund in consideration of the Fund entering into an exclusive securities lending arrangement. During the fiscal year, eSecLending served as exclusive lending agent for the Fund. As a result of a bidding process on October 1, 2009, no principal had an exclusive securities lending arrangement with the Fund during the fiscal year; as such, the Fund was not guaranteed any particular level of income during the fiscal year. As of August 27, 2010, the Fund no longer participates in a securities lending program.
Under the securities lending arrangement, the Fund received cash collateral at the beginning of each transaction equal to at least 102% of the prior day's market value of the loaned securities (105% in the case of international securities). The Fund invested all the cash collateral in Neuberger Berman Securities Lending Quality Fund, LLC ("Quality Fund"), a fund managed by Neuberger Berman Fixed Income LLC ("NBFI"), an affiliate of Management, and sub-advised by Dwight Asset Management Company LLC. Quality Fund was not a money market fund registered under the 1940 Act and did not operate in accordance with all requirements of Rule 2a-7 under the 1940 Act. The Fund redeemed all of its investments in Quality Fund, if any, as of August 27, 2010.
Net income from the lending program represents any amounts received from a principal, plus income earned on the cash collateral invested in Quality Fund or in other investments, if applicable, less cash collateral fees and other expenses associated with the loans. For the fiscal year ended December 31, 2010, the Fund received net income under the securities lending arrangement of $1,035, which is reflected in the Statement of Operations under the caption "Income from securities loaned -- net," which includes $171 of interest income that was earned from the Quality Fund.
10 Investments in foreign securities: Investing in foreign securities may involve certain sovereign and other risks, in addition to the credit and market risks normally associated with domestic securities. These additional risks include the possibility of adverse political and economic developments (including political instability, nationalization, expropriation, or confiscatory taxation) and the potentially adverse effects of unavailability of public information regarding issuers, less government supervision and regulation of financial markets, reduced liquidity of certain financial markets, and the lack of uniform accounting, auditing, and financial reporting standards or the application of standards that are different or less stringent than those applied in the United States. Foreign securities also may experience greater price volatility, higher rates of inflation, and delays in settlement.
11 Derivative instruments: During the year ended December 31, 2010, the Fund's use of derivatives was limited to purchased option transactions. The Fund has adopted the provisions of ASC 815 "Derivatives and Hedging" ("ASC 815"). The disclosure requirements of ASC 815 distinguish between derivatives that qualify for hedge accounting and those that do not. Because investment companies value their derivatives at fair value and recognize changes in fair value through the Statement of Operations, they do not qualify for hedge accounting. Accordingly, even though the Fund's investments in derivatives may represent economic hedges, they are considered non-hedge transactions for purposes of this disclosure.
Premiums paid by the Fund upon purchasing a covered call option is recorded in the asset section of the Fund's Statement of Assets and Liabilities and are subsequently adjusted to the current market value. When an option is exercised, closed, or expired, the Fund realizes a gain or loss and the asset is eliminated.
For purchased call options, the Fund's loss is limited to the amount of the option premium paid.
15
Purchased option transactions were used for hedging purposes for the year ended December 31, 2010. There were no purchased options outstanding at December 31, 2010. Purchased option transactions for the year ended December 31, 2010 were:
| | | Call Options | |
| | | Number | | Value When
Purchased | |
| Contracts outstanding 1/1/2010 | | | -- | | | $ | -- | | |
| Contracts purchased | | | 80 | | | | 17,020 | | |
| Contracts expired | | | -- | | | | -- | | |
| Contracts exercised | | | -- | | | | -- | | |
| Contracts closed | | | (80 | ) | | | (17,020 | ) | |
| Contracts outstanding 12/31/2010 | | | -- | | | $ | -- | | |
The impact of the use of these derivative instruments on the Statement of Operations during the year ended December 31, 2010 was as follows:
Realized Gain (Loss)(1)
| | | Equity Contracts
Risk | |
| Option Contracts Purchased | | $ | (10,202 | ) | |
| Total Realized Gain (Loss) | | $ | (10,202 | ) | |
(1) Reflected in the Statement of Operations under the caption "Net realized gain (loss) on sales of investment securities of unaffiliated issuers."
12 Indemnifications: Like many other companies, the Trust's organizational documents provide that its officers and trustees are indemnified against certain liabilities arising out of the performance of their duties to the Trust. In addition, both in some of its principal service contracts and in the normal course of its business, the Trust enters into contracts that provide indemnifications to other parties for certain types of losses or liabilities. The Trust's maximum exposure under these arrangements is unknown as this could involve future claims against the Trust.
Note B--Management Fees, Administration Fees, Distribution Arrangements, and Other Transactions with Affiliates:
Fund shares are issued and redeemed in connection with investments in and payments under certain variable annuity contracts and variable life insurance policies issued through separate accounts of life insurance companies and are also offered directly to certain qualified pension and retirement plans.
The Fund retains Management as its investment manager under a Management Agreement. For such investment management services, the Fund pays Management a fee at the annual rate of 0.55% of the first $250 million of the Fund's average daily net assets, 0.525% of the next $250 million, 0.50% of the next $250 million, 0.475% of the next $250 million, 0.45% of the next $500 million, 0.425% of the next $2.5 billion, and 0.40% of average daily net assets in excess of $4 billion.
The Fund retains Management as its administrator under an Administration Agreement. The Fund pays Management an administration fee at the annual rate of 0.30% of its average daily net assets under this agreement. Additionally, Management retains State Street Bank and Trust Company ("State Street") as its sub-administrator under a Sub-Administration Agreement. Management pays State Street a fee for all services received under this agreement. The Board adopted a non-fee distribution plan for the Fund.
16
Management has contractually undertaken through December 31, 2013 to forgo current payment of fees and/or reimburse the Fund for its operating expenses (excluding fees payable to Management, interest, taxes, brokerage commissions, extraordinary expenses, and transaction costs) ("Operating Expenses") which exceed, in the aggregate, 1.00% per annum of the Fund's average daily net assets (the "Expense Limitation"). For the year ended December 31, 2010, no reimbursement to the Fund was required. The Fund has agreed to repay Management through December 31, 2016 for fees and expenses foregone and/or its excess Operating Expenses previously reimbursed by Management, so long as its annual Operating Expenses during that period do not exceed its Expense Limitation, and the repayment is made within three years after the year in which Management issued the reimbursement or waived fees. During the year ended December 31, 2010, there was no repayment to Management under its contractual expense limitation. At December 31, 2010, the Fund had no contingent liability to Management under its contractual expense limitation.
Neuberger Berman LLC ("Neuberger") is retained by Management to furnish it with investment recommendations and research information without added cost to the Fund. Several individuals who are officers and/or trustees of the Trust are also employees of Neuberger and/or Management.
On May 4, 2009, NBSH Acquisition, LLC ("NBSH"), an entity organized by key members of senior management of Neuberger Berman Group LLC ("NBG") and its consolidated subsidiaries (NBG, and together with its consolidated subsidiaries "NB Group") acquired a majority interest in the business conducted by Management and Neuberger, as well as the fixed income and certain alternative asset management businesses of Lehman Brothers Holdings Inc.'s Investment Management Division (together with Management and Neuberger, the "Acquired Businesses") (the "Acquisition"). Prior to that date, Neuberger and the predecessor in interest of Management were indirect wholly owned subsidiaries of Lehman Brothers Holdings Inc. ("LBHI"). On September 15, 2008, LBHI filed a voluntary petition under Chapter 11 of the U.S. Bankruptcy Code, and on December 22, 2008, the bankruptcy court having jurisdiction over the LBHI matter approved the sale of the Acquired Businesses to NBSH (or its successor or assign).
Through NBSH, portfolio managers, NB Group's management team, and certain of its key employees and senior professionals now indirectly own 52% of the voting equity of NBG. LBHI and certain affiliates of LBHI own the remaining 48% of NBG's voting equity. The closing of the Acquisition resulted in an "assignment" of the Fund's Management Agreement and Sub-Advisory Agreement. Such an assignment, by law, automatically terminated those agreements. Accordingly, prior to the closing, the Board, including the Trustees who are not "interested persons" of the Fund's investment manager and its affiliates or the Fund, considered and approved a new Management Agreement and Sub-Advisory Agreement for the Fund. The new agreements, which are virtually identical to those previously in effect, were also approved by a vote of the Fund's shareholders.
These events did not have a material impact on the Fund or its operations. Management and Neuberger continue to operate in the ordinary course of business as the investment manager and sub-adviser of the Fund.
Other non-affiliated service provider: The Fund has an expense offset arrangement in connection with its custodian contract. For the year ended December 31, 2010, the impact of this arrangement was a reduction of expenses of $16.
Note C--Securities Transactions:
During the year ended December 31, 2010, there were purchase and sale transactions (excluding short-term securities and option contracts) of $38,741,421 and $49,440,181, respectively.
During the year ended December 31, 2010, no brokerage commissions on securities transactions were paid to affiliated brokers.
17
Note D--Fund Share Transactions:
Share activity for the years ended December 31, 2010 and December 31, 2009 was as follows:
| | | For the Year Ended December 31, | |
| | | 2010 | | 2009 | |
| Shares Sold | | | 1,574,233 | | | | 3,400,067 | | |
| Shares Issued on Reinvestment of Dividends and Distributions | | | 60,008 | | | | 1,135,601 | | |
| Shares Redeemed | | | (2,869,528 | ) | | | (25,327,354 | ) | |
| Total | | | (1,235,287 | ) | | | (20,791,686 | ) | |
Note E--Line of Credit:
At December 31, 2010, the Fund was a participant in a single committed, unsecured $200,000,000 ($150,000,000 prior to September 17, 2010) line of credit with State Street, to be used only for temporary or emergency purposes. Other investment companies managed by Management also participate in this line of credit on the same terms. Interest is charged on borrowings under this line of credit at the higher of (a) the Federal Funds Rate plus 1.25% per annum or (b) the Overnight LIBOR Rate plus 1.25% per annum. A commitment fee of 0.125% (0.15% prior to September 17, 2010) per annum of the available line of credit is charged, of which each participating Fund has agreed to pay its pro rata share, based on the ratio of its individual net assets to the net assets of all participants at the time the fee is due and payable. The fee is paid quarterly in arrears. Because several mutual funds participate, there is no assurance that an individual Fund will have access to all or any part of the $200,000,000 ($150,000,000 prior to September 17, 2010) at any particular time. There were no loans outstanding pursuant to this line of credit at December 31, 2010. During the year ended December 31, 2010, the Fund did not utilize this line of credit.
Note F--Investments in Affiliates:
| Name of Issuer | | Balance of
Shares
Held
December 31,
2009 | | Gross
Purchases
and
Additions | | Gross
Sales
and
Reductions | | Balance of
Shares
Held
December 31,
2010 | | Value
December 31,
2010 | | Income from
Investments in
Affiliated
Issuers
Included in
Total Income | |
Neuberger Berman Securities
Lending Quality Fund, LLC* | | | 455,882 | | | | 912,206 | | | | 1,368,088 | | | | -- | | | $ | -- | | | $ | 171 | | |
* Quality Fund, a fund that was managed by NBFI, an affiliate of Management, was used to invest cash the Fund received as collateral for securities loaned as approved by the Board. Because all shares of Quality Fund were held by funds in the related investment management complex, Quality Fund may have been considered an affiliate of the Fund.
18
Financial Highlights
Partners Portfolio
The following table includes selected data for a share outstanding throughout each year and other performance information derived from the Financial Statements.
| | | Year Ended December 31, | |
| | | 2010 | | 2009 | | 2008 | | 2007 | | 2006 | |
| Net Asset Value, Beginning of Year | | $ | 9.82 | | | $ | 7.11 | | | $ | 20.76 | | | $ | 21.16 | | | $ | 21.41 | | |
| Income From Investment Operations: | |
| Net Investment Income (Loss)tt | | | (.00 | ) | | | .03 | | | | .08 | | | | .07 | | | | .12 | | |
Net Gains or Losses on Securities
(both realized and unrealized) | | | 1.52 | | | | 3.98 | | | | (10.78 | ) | | | 1.95 | | | | 2.33 | | |
| Total From Investment Operations | | | 1.52 | | | | 4.01 | | | | (10.70 | ) | | | 2.02 | | | | 2.45 | | |
| Less Distributions From: | |
| Net Investment Income | | | (.07 | ) | | | (.24 | ) | | | (.09 | ) | | | (.15 | ) | | | (.16 | ) | |
| Net Capital Gains | | | -- | | | | (1.06 | ) | | | (2.86 | ) | | | (2.27 | ) | | | (2.54 | ) | |
| Total Distributions | | | (.07 | ) | | | (1.30 | ) | | | (2.95 | ) | | | (2.42 | ) | | | (2.70 | ) | |
| Net Asset Value, End of Year | | $ | 11.27 | | | $ | 9.82 | | | $ | 7.11 | | | $ | 20.76 | | | $ | 21.16 | | |
| Total Returntt | | | 15.55 | % | | | 56.23 | % | | | (52.37 | )% | | | 9.28 | % | | | 12.24 | % | |
| Ratios/Supplemental Data | |
| Net Assets, End of Year (in millions) | | $ | 97.2 | | | $ | 96.7 | | | $ | 217.9 | | | $ | 526.7 | | | $ | 631.2 | | |
| Ratio of Gross Expenses to Average Net Assets# | | | 1.11 | % | | | 1.05 | % | | | .95 | % | | | .91 | % | | | .91 | % | |
| Ratio of Net Expenses to Average Net Assets | | | 1.11 | % | | | 1.05 | %S | | | .94 | %S | | | .90 | %S | | | .91 | %S | |
Ratio of Net Investment Income (Loss) to Average
Net Assets | | | (.02 | )% | | | .34 | % | | | .53 | % | | | .33 | % | | | .57 | % | |
| Portfolio Turnover Rate | | | 43 | % | | | 41 | % | | | 38 | % | | | 43 | % | | | 36 | % | |
See Notes to Financial Highlights
19
Notes to Financial Highlights Partners Portfolio
tt Total return based on per share NAV reflects the effects of changes in NAV on the performance of the Fund during each fiscal period and assumes income dividends and other distributions, if any, were reinvested. Results represent past performance and do not guarantee future results. Current returns may be lower or higher than the performance data quoted. Investment returns and principal may fluctuate and shares when redeemed may be worth more or less than original cost. Total return would have been lower if Management had not waived certain expenses. The total return information shown does not reflect charges and other expenses that apply to the separate account or the related insurance policies, and the inclusion of these charges and other expenses would reduce the total return for all fiscal periods shown.
# The Fund is required to calculate an expense ratio without taking into consideration any expense reductions related to expense offset arrangements.
t Calculated based on the average number of shares outstanding during each fiscal period.
S After utilization of the Line of Credit (2007) and/or waiver of a portion of the investment management fee by Management. Had Management not undertaken such action, and the Fund had not utilized the Line of Credit the annualized ratios of net expenses to average daily net assets would have been:
| | | Year Ended December 31, | |
| 2009 | | 2008 | | 2007 | | 2006 | |
| | 1.06 | % | | | .94 | % | | | .90 | % | | | .91 | % | |
20
Report of Independent Registered Public Accounting Firm
To the Board of Trustees of
Neuberger Berman Advisers Management Trust and
Shareholders of Partners Portfolio
We have audited the accompanying statement of assets and liabilities, including the schedule of investments, of Partners Portfolio, one of the series constituting Neuberger Berman Advisers Management Trust (the "Trust"), as of December 31, 2010, and the related statement of operations for the year then ended, the statements of changes in net assets for each of the two years in the period then ended, and the financial highlights for each of the five years in the period then ended. These financial statements and financial highlights are the responsibility of the Trust's management. Our responsibility is to express an opinion on these financial statements and financial highlights based on our audits.
We conducted our audits in accordance with the standards of the Public Company Accounting Oversight Board (United States). Those standards require that we plan and perform the audit to obtain reasonable assurance about whether the financial statements and financial highlights are free of material misstatement. We were not engaged to perform an audit of the Trust's internal control over financial reporting. Our audits included consideration of internal control over financial reporting as a basis for designing audit procedures that are appropriate in the circumstances, but not for the purpose of expressing an opinion on the effectiveness of the Trust's internal control over financial reporting. Accordingly, we express no such opinion. An audit also includes examining, on a test basis, evidence supporting the amounts and disclosures in the financial statements and financial highlights, assessing the accounting principles used and significant estimates made by management, and evaluating the overall financial statement presentation. Our procedures included confirmation of securities owned as of December 31, 2010 by correspondence with the custodian and brokers or by other appropriate auditing procedures where replies from brokers were not received. We believe that our audits provide a reasonable basis for our opinion.
In our opinion, the financial statements and financial highlights referred to above present fairly, in all material respects, the financial position of Partners Portfolio, a series of Neuberger Berman Advisers Management Trust, at December 31, 2010, the results of its operations for the year then ended, the changes in its net assets for each of the two years in the period then ended, and the financial highlights for each of the five years in the period then ended, in conformity with U.S. generally accepted accounting principles.

Boston, Massachusetts
February 10, 2011
21
Trustee and Officer Information
The following tables set forth information concerning the trustees and officers of the Trust. All persons named as trustees and officers also serve in similar capacities for other funds administered or managed by Management, Neuberger and NBFI. The Statement of Additional Information includes additional information about trustees and is available upon request, without charge, by calling (800) 877-9700.
Information about the Board of Trustees
Name, (Year of Birth),
and Address(1) | | Position and
Length of
Time Served(2) | | Principal Occupation(s)(3) | | Number of
Funds in Fund
Complex
Overseen by
Trustee | | Other Directorships
Held Outside Fund
Complex by Trustee | |
| Independent Trustees | |
|
| John Cannon (1930) | | Trustee since 2000 | | Consultant; formerly, Chairman, CDC Investment Advisers (registered investment adviser), 1993 to January 1999; formerly, President and Chief Executive Officer, AMA Investment Advisors, an affiliate of the American Medical Association. | | | 43 | | | Formerly, Independent Trustee or Director of three series of Oppenheimer Funds: Oppenheimer Limited Term New York Municipal Fund, Rochester Fund Municipals, and Oppenheimer Convertible Securities Fund, 1992 to 2009. | |
|
| Faith Colish (1935) | | Trustee since 1982 | | Counsel, Carter Ledyard & Milburn LLP (law firm) since October 2002; formerly, Attorney-at-Law and President, Faith Colish, A Professional Corporation, 1980 to 2002. | | | 43 | | | Formerly, Director, 1997 to 2003, and Advisory Director, 2003 to 2006; ABA Retirement Funds (formerly, American Bar Retirement Association) (not-for-profit membership corporation). | |
|
22
Name, (Year of Birth),
and Address(1) | | Position and
Length of
Time Served(2) | | Principal Occupation(s)(3) | | Number of
Funds in Fund
Complex
Overseen by
Trustee | | Other Directorships
Held Outside Fund
Complex by Trustee | |
| Martha C. Goss (1949) | | Trustee since 2007 | | President, Woodhill Enterprises Inc./Chase Hollow Associates LLC (personal investment vehicle), since 2006; Chief Operating and Financial Officer, Hopewell Holdings LLC/Amwell Holdings, LLC (a holding company for a healthcare reinsurance company start-up), since 2003; formerly, Consultant, Resources Connection (temporary staffing), 2002 to 2006. | | | 43 | | | Director, Ocwen Financial Corporation (mortgage servicing), since 2005; Director, American Water (water utility), since 2003; Director, Channel Reinsurance (financial guaranty reinsurance), since 2006; Director, Allianz Life of New York (insurance), since 2005; Director, Financial Women's Association of New York (not-for-profit association), since 2003; Trustee Emerita, Brown University, since 1998; formerly, Advisory Board Member, Attensity (software developer), 2005 to 2007; formerly, Director, Bank Leumi (commercial bank), 2005 to 2007; formerly, Director, Claire's Stores, Inc. (retailer), 2005 to 2007. | |
|
| C. Anne Harvey (1937) | | Trustee since 1998 | | President, C.A. Harvey Associates, since October 2001; formerly, Director, AARP, 1978 to December 2001. | | | 43 | | | Formerly, President, Board of Associates to The National Rehabilitation Hospital's Board of Directors, 2001 to 2002; formerly, Member, Individual Investors Advisory Committee to the New York Stock Exchange Board of Directors, 1998 to 2002. | |
|
23
Name, (Year of Birth),
and Address(1) | | Position and
Length of
Time Served(2) | | Principal Occupation(s)(3) | | Number of
Funds in Fund
Complex
Overseen by
Trustee | | Other Directorships
Held Outside Fund
Complex by Trustee | |
| Robert A. Kavesh (1927) | | Trustee since 2000 | | Retired; Marcus Nadler Professor Emeritus of Finance and Economics, New York University Stern School of Business; formerly, Executive Secretary-Treasurer, American Finance Association, 1961 to 1979. | | | 43 | | | Formerly, Director, The Caring Community (not-for-profit), 1997 to 2006; formerly, Director, DEL Laboratories, Inc. (cosmetics and pharmaceuticals), 1978 to 2004; formerly, Director, Apple Bank for Savings, 1979 to 1990; formerly, Director, Western Pacific Industries, Inc., (public company), 1972 to 1986. | |
|
| Michael M. Knetter (1960) | | Trustee since 2007 | | President and Chief Executive Officer, University of Wisconsin Foundation, October 2010 to Present; formerly, Dean, School of Business, University of Wisconsin - Madison; formerly, Professor of International Economics and Associate Dean, Amos Tuck School of Business - Dartmouth College, 1998 to 2002. | | | 43 | | | Director, American Family Insurance (a mutual company, not publicly traded), since March 2009; Trustee, Northwestern Mutual Series Fund, Inc., since February 2007; Director, Wausau Paper, since 2005; formerly, Director, Great Wolf Resorts, 2004 to 2009. | |
|
| Howard A. Mileaf (1937) | | Trustee since 1999 | | Retired; formerly, Vice President and General Counsel, WHX Corporation (holding company), 1993 to 2001. | | | 43 | | | Formerly, Director, Webfinancial Corporation (holding company), 2002 to 2008; formerly, Director, WHX Corporation (holding company), 2002 to 2005; formerly, Director, State Theatre of New Jersey (not-for-profit theatre), 2000 to 2005. | |
|
| George W. Morriss (1947) | | Trustee since 2007 | | Retired; formerly, Executive Vice President and Chief Financial Officer, People's Bank, Connecticut (a financial services company), 1991 to 2001. | | | 43 | | | Manager, Old Mutual Funds of Hedge Funds fund complex (consisting of six funds), since 2006 for four funds and since 2007 for two funds; formerly, Member NASDAQ Issuers' Affairs Committee, 1995 to 2003. | |
|
24
Name, (Year of Birth),
and Address(1) | | Position and
Length of
Time Served(2) | | Principal Occupation(s)(3) | | Number of
Funds in Fund
Complex
Overseen by
Trustee | | Other Directorships
Held Outside Fund
Complex by Trustee | |
| Edward I. O'Brien (1928) | | Trustee since 2000 | | Retired; formerly, Member, Investment Policy Committee, Edward Jones, 1993 to 2001; President, Securities Industry Association ("SIA") (securities industry's representative in government relations and regulatory matters at the federal and state levels), 1974 to 1992; Adviser to SIA, November 1992 to November 1993. | | | 43 | | | Formerly, Director, Legg Mason, Inc. (financial services holding company), 1993 to July 2008; formerly, Director, Boston Financial Group (real estate and tax shelters), 1993 to 1999. | |
|
| Cornelius T. Ryan (1931) | | Trustee since 2000 | | General Partner and Adviser, TD2, TD3, and TOF1 Healthcare Venture Capital Partnerships; Founding General Partner, Oxford Partners and Oxford Bioscience Partners (venture capital investing) and President, Oxford Venture Corporation, since 1981. | | | 43 | | | Trustee, Norwalk Hospital Foundation, since 2000; Director, Supply Pro (privately held company), since 2008; formerly, Trustee, Norwalk Hospital, 1995 to 2004; formerly, President and Director, Randolph Computer Corp., 1966 to 1984; formerly, Director of numerous privately held portfolio companies of Oxford Partners and Oxford Bioscience Partners, 1981 to 2005. | |
|
| Tom D. Seip (1950) | | Trustee since 2000; Chairman of the Board since 2008; Lead Independent Trustee from 2006 to 2008 | | General Partner, Seip Investments LP (a private investment partnership); formerly, President and CEO, Westaff, Inc. (temporary staffing), May 2001 to January 2002; formerly, Senior Executive, The Charles Schwab Corporation, 1983 to 1998, including Chief Executive Officer, Charles Schwab Investment Management, Inc.; Trustee, Schwab Family of Funds and Schwab Investments, 1997 to 1998; and Executive Vice President-Retail Brokerage, Charles Schwab & Co., Inc., 1994 to 1997. | | | 43 | | | Director, H&R Block, Inc. (financial services company), since May 2001; Chairman, Compensation Committee, H&R Block, Inc., since 2006; formerly, Director, Forward Management, Inc. (asset management company), 1999 to 2006. | |
|
25
Name, (Year of Birth),
and Address(1) | | Position and
Length of
Time Served(2) | | Principal Occupation(s)(3) | | Number of
Funds in Fund
Complex
Overseen by
Trustee | | Other Directorships
Held Outside Fund
Complex by Trustee | |
| Candace L. Straight (1947) | | Trustee since 1999 | | Private investor and consultant specializing in the insurance industry; formerly, Advisory Director, Securitas Capital LLC (a global private equity investment firm dedicated to making investments in the insurance sector), 1998 to December 2003. | | | 43 | | | Director, Montpelier Re Holdings Ltd. (reinsurance company), since 2006; formerly, Director, National Atlantic Holdings Corporation (property and casualty insurance company), 2004 to 2008; formerly, Director, The Proformance Insurance Company (property and casualty insurance company), 2004 to 2008; formerly, Director, Providence Washington Insurance Company (property and casualty insurance company), 1998 to 2006; formerly, Director, Summit Global Partners (insurance brokerage firm), 2000 to 2005. | |
|
| Peter P. Trapp (1944) | | Trustee since 1984 | | Retired; formerly, Regional Manager for Mid-Southern Region, Ford Motor Credit Company, September 1997 to 2007; formerly, President, Ford Life Insurance Company, April 1995 to August 1997. | | | 43 | | | None. | |
|
26
Name, (Year of Birth),
and Address(1) | | Position and
Length of
Time Served(2) | | Principal Occupation(s)(3) | | Number of
Funds in Fund
Complex
Overseen by
Trustee | | Other Directorships
Held Outside Fund
Complex by Trustee | |
| Trustees who are "Interested Persons" | |
|
| Joseph V. Amato* (1962) | | Trustee since 2009 | | President and Director, Neuberger Berman Group LLC, since 2009; President and Chief Executive Officer, Neuberger and Neuberger Berman Holdings LLC (including its predecessor, Neuberger Berman Inc.), since 2007; Chief Investment Officer, Neuberger, since 2009; Chief Investment Officer (Equities) and Managing Director, Management, since 2009; Managing Director, NBFI, since 2007; Board member of NBFI since 2006; formerly, Global Head of Asset Management of LBHI's Investment Management Division, 2006 to 2009; formerly, member of LBHI's Investment Management Division's Executive Management Committee, 2006 to 2009; formerly, Managing Director, Lehman Brothers Inc. ("LBI"), 2006 to 2008; formerly, Chief Recruiting and Development Officer, LBI, 2005 to 2006; formerly, Global Head of LBI's Equity Sales and a Member of its Equities Division Executive Committee, 2003 to 2005. | | | 43 | | | Member of Board of Advisors, McDonough School of Business, Georgetown University, since 2001; Member of New York City Board of Advisors, Teach for America, since 2005; Trustee, Montclair Kimberley Academy (private school), since 2007. | |
|
27
Name, (Year of Birth),
and Address(1) | | Position and
Length of
Time Served(2) | | Principal Occupation(s)(3) | | Number of
Funds in Fund
Complex
Overseen by
Trustee | | Other Directorships
Held Outside Fund
Complex by Trustee | |
| Robert Conti* (1956) | | Chief Executive Officer, President and Trustee since 2008; prior thereto, Executive Vice President in 2008 and Vice President, 2000 to 2008 | | Managing Director, Neuberger, since 2007; formerly, Senior Vice President, Neuberger, 2003 to 2006; formerly, Vice President, Neuberger, 1999 to 2003; President and Chief Executive Officer, Management, since 2008; formerly, Senior Vice President, Management, 2000 to 2008. | | | 43 | | | Chairman of the Board, Staten Island Mental Health Society since 2008. | |
|
| Jack L. Rivkin* (1940) | | Trustee since 2002; President, 2002 to 2008 | | Formerly, Executive Vice President and Chief Investment Officer, Neuberger Berman Holdings LLC (holding company), 2002 to August 2008 and 2003 to August 2008, respectively; formerly, Managing Director and Chief Investment Officer, Neuberger, December 2005 to August 2008 and 2003 to August 2008, respectively; formerly, Executive Vice President, Neuberger, December 2002 to 2005; formerly, Director and Chairman, Management, December 2002 to August 2008; formerly, Executive Vice President, Citigroup Investments, Inc., September 1995 to February 2002; formerly, Executive Vice President, Citigroup Inc., September 1995 to February 2002. | | | 43 | | | Director, Idealab (private company), since 2009; Director, Distributed World Power (private company), since 2009; Director, Dale Carnegie and Associates, Inc. (private company), since 1999; Director, Solbright, Inc. (private company), since 1998; Director, SA Agricultural Fund, since 2009; Chairman and Director, Essential Brands (consumer products) since 2008; formerly, Director, New York Society of Security Analysts, 2006 to 2008. | |
|
(1) The business address of each listed person is 605 Third Avenue, New York, New York 10158.
(2) Pursuant to the Trust's Trust Instrument, each of these Trustees shall hold office for life or until his or her successor is elected or the Trust terminates; except that (a) any Trustee may resign by delivering a written resignation; (b) any Trustee may be removed with or without cause at any time by a written instrument signed by at least two-thirds of the other Trustees; (c) any Trustee who requests to be retired, or who has become unable to serve, may be retired by a written instrument signed by a majority of the other Trustees; and (d) any Trustee may be removed at any shareholder meeting by a vote of at least two-thirds of the outstanding shares.
28
(3) Except as otherwise indicated, each individual has held the positions shown for at least the last five years.
* Indicates a Trustee who is an "interested person" within the meaning of the 1940 Act. Mr. Amato and Mr. Conti are interested persons of the Trust by virtue of the fact that each is an officer of Management, Neuberger and/or their affiliates. Mr. Rivkin may be deemed an interested person of the Trust by virtue of the fact that, until August 2008, he was a director of Management and an officer of Neuberger.
29
Information about the Officers of the Trust
Name, (Year of Birth),
and Address(1) | | Position and
Length of Time
Served(2) | | Principal Occupation(s)(3) | |
| Andrew B. Allard (1961) | | Anti-Money Laundering Compliance Officer since 2002 | | Senior Vice President, Neuberger, since 2006; Deputy General Counsel, Neuberger, since 2004; formerly, Vice President, Neuberger, 2000 to 2005; Anti-Money Laundering Compliance Officer, nine registered investment companies for which Management acts as investment manager and administrator (six since 2002, one since 2003, one since 2005 and one since 2006). | |
|
| Claudia A. Brandon (1956) | | Executive Vice President since 2008 and Secretary since 1985 | | Senior Vice President, Neuberger, since 2007 and Employee since 1999; Senior Vice President, Management, since 2008 and Assistant Secretary since 2004; formerly, Vice President, Neuberger, 2002 to 2006; formerly, Vice President-Mutual Fund Board Relations, Management, 2000 to 2008; Executive Vice President, nine registered investment companies for which Management acts as investment manager and administrator (nine since 2008); Secretary, nine registered investment companies for which Management acts as investment manager and administrator (three since 1985, three since 2002, one since 2003, one since 2005 and one since 2006). | |
|
| Maxine L. Gerson (1950) | | Executive Vice President since 2008 and Chief Legal Officer since 2005 (only for purposes of sections 307 and 406 of the Sarbanes-Oxley Act of 2002) | | Managing Director, Neuberger, since 2009, and Deputy General Counsel and Assistant Secretary Neuberger since 2001; Managing Director, Management, since 2009, and Secretary and General Counsel, Management, since 2004; formerly, Senior Vice President, Neuberger, 2002 to 2009; formerly, Senior Vice President, Management, 2006 to 2009; Executive Vice President, nine registered investment companies for which Management acts as investment manager and administrator (nine since 2008); Chief Legal Officer (only for purposes of sections 307 and 406 of the Sarbanes-Oxley Act of 2002), nine registered investment companies for which Management acts as investment manager and administrator (eight since 2005 and one since 2006). | |
|
| Sheila R. James (1965) | | Assistant Secretary since 2002 | | Vice President, Neuberger, since 2008 and Employee since 1999; formerly, Assistant Vice President, Neuberger, 2007; Assistant Secretary, nine registered investment companies for which Management acts as investment manager and administrator (six since 2002, one since 2003, one since 2005 and one since 2006). | |
|
| Brian Kerrane (1969) | | Vice President since 2008 | | Senior Vice President, Neuberger, since 2006; formerly, Vice President, Neuberger, 2002 to 2006; Vice President, Management, since 2008 and Employee since 1991; Vice President, nine registered investment companies for which Management acts as investment manager and administrator (nine since 2008). | |
|
| Kevin Lyons (1955) | | Assistant Secretary since 2003 | | Assistant Vice President, Neuberger, since 2008 and Employee since 1999; Assistant Secretary, nine registered investment companies for which Management acts as investment manager and administrator (seven since 2003, one since 2005 and one since 2006). | |
|
30
Name, (Year of Birth),
and Address(1) | | Position and
Length of Time
Served(2) | | Principal Occupation(s)(3) | |
| Owen F. McEntee, Jr. (1961) | | Vice President since 2008 | | Vice President, Neuberger, since 2006; Employee, Management, since 1992; Vice President, nine registered investment companies for which Management acts as investment manager and administrator (nine since 2008). | |
|
| John M. McGovern (1970) | | Treasurer and Principal Financial and Accounting Officer since 2005 | | Senior Vice President, Neuberger, since 2007; formerly, Vice President, Neuberger, 2004 to 2006; Employee, Management, since 1993; Treasurer and Principal Financial and Accounting Officer, nine registered investment companies for which Management acts as investment manager and administrator (eight since 2005 and one since 2006); formerly, Assistant Treasurer, eight registered investment companies for which Management acts as investment manager and administrator, 2002 to 2005. | |
|
| Andrew Provencher (1965) | | Vice President since 2008 | | Managing Director, Management, since 2008; Managing Director, Neuberger, since 2005; formerly, Senior Vice President, Neuberger, 2003 to 2005; Vice President, nine registered investment companies for which Management acts as investment manager and administrator (nine since 2008). | |
|
| Frank Rosato (1971) | | Assistant Treasurer since 2005 | | Vice President, Neuberger, since 2006; Employee, Management, since 1995; Assistant Treasurer, nine registered investment companies for which Management acts as investment manager and administrator (eight since 2005 and one since 2006). | |
|
| Neil S. Siegel (1967) | | Vice President since 2008 | | Managing Director, Management, since 2008; Managing Director, Neuberger, since 2006; formerly, Senior Vice President, Neuberger, 2004 to 2006; Vice President, nine registered investment companies for which Management acts as investment manager and administrator (nine since 2008). | |
|
| Chamaine Williams (1971) | | Chief Compliance Officer since 2005 | | Senior Vice President, Neuberger, since 2007; Chief Compliance Officer, Management, since 2006; Chief Compliance Officer, nine registered investment companies for which Management acts as investment manager and administrator (eight since 2005 and one since 2006); formerly, Senior Vice President, LBI, 2007 to 2008; formerly, Vice President, LBI, 2003 to 2006; formerly, Chief Compliance Officer, Lehman Brothers Asset Management Inc., 2003 to 2007; formerly, Chief Compliance Officer, Lehman Brothers Alternative Investment Management LLC, 2003 to 2007. | |
|
(1) The business address of each listed person is 605 Third Avenue, New York, New York 10158.
(2) Pursuant to the By-Laws of the Trust, each officer elected by the Trustees shall hold office until his or her successor shall have been elected and qualified or until his or her earlier death, inability to serve, or resignation. Officers serve at the pleasure of the Trustees and may be removed at any time with or without cause.
(3) Except as otherwise indicated, each individual has held the positions shown for at least the last five years.
31
Proxy Voting Policies and Procedures
A description of the policies and procedures that the Trust uses to determine how to vote proxies relating to portfolio securities is available, without charge, by calling 1-800-877-9700 (toll-free) and on the website of the Securities and Exchange Commission, at www.sec.gov. Information regarding how the Trust voted proxies relating to portfolio securities during the most recent 12-month period ended June 30 is also available, without charge, by calling 1-800-877-9700 (toll-free), on the website of the Securities and Exchange Commission at www.sec.gov, and on Management's website at www.nb.com.
Quarterly Portfolio Schedule
The Trust files a complete schedule of portfolio holdings for the Fund with the Securities and Exchange Commission for the first and third quarters of each fiscal year on Form N-Q. The Trust's Forms N-Q are available on the Securities and Exchange Commission's website at www.sec.gov and may be reviewed and copied at the Securities and Exchange Commission's Public Reference Room in Washington, DC. Information on the operation of the Public Reference Room may be obtained by calling 1-800-SEC-0330. The information on Form N-Q is available upon request, without charge, by calling 1-800-877-9700 (toll-free).
Board Consideration of the Management and Sub-Advisory Agreements
At a meeting held on October 14, 2010, the Board, including the Trustees who are not "interested persons" of Management (including its affiliates) or Neuberger Berman Advisers Management Trust ("Independent Fund Trustees"), approved the continuance of the Management and Sub-Advisory Agreements ("Agreements") for the Fund.
In evaluating the Agreements, the Board, including the Independent Fund Trustees, reviewed materials furnished by Management and Neuberger in response to questions submitted by counsel for the Independent Fund Trustees, and met with senior representatives of Management and Neuberger regarding their personnel and operations. The Independent Fund Trustees were advised by counsel that is experienced in 1940 Act matters and that is independent of Management and Neuberger. The Independent Fund Trustees received a memorandum from independent counsel discussing the legal standards for their consideration of the proposed continuance of the Agreements. They met with such counsel separately from representatives of Management to discuss the annual contract review. The annual contract review extends over two regular meetings of the Board to ensure that Management and Neuberger have time to respond to any questions the Independent Fund Trustees may have on their initial review of the report and that the Independent Fund Trustees have time to consider those responses. In addition, during this process, the Board held a separate meeting devoted primarily to reviewing and discussing Fund performance.
The Board considered the following factors, among others, in connection with its approval of the continuance of the Agreements: (1) the nature, extent, and quality of the services provided by Management and Neuberger; (2) the performance of the Fund compared to a relevant market index and a peer group of investment companies; (3) the costs of the services provided and profits or losses realized by Management and its affiliates from their relationship with the Fund; (4) the extent to which economies of scale might be realized as the Fund grows; and (5) whether fee levels reflect any such potential economies of scale for the benefit of investors in the Fund. In their deliberations, the Board members did not identify any particular information that was all-important or controlling, and each Trustee may have attributed different weights to the various factors.
The Board evaluated the terms of the Agreements, the overall fairness of the Agreements to the Fund and whether the Agreements were in the best interests of the Fund and its shareholders.
With respect to the nature, extent and quality of the services provided, the Board considered the performance of the Fund and the experience and staffing of the portfolio management and investment research personnel of Management and Neuberger who perform services for the Fund. The Board noted that Management also provides certain administrative services, including fund accounting and compliance oversight. The Board also considered Management's and Neuberger's policies and practices regarding brokerage and the quality of brokerage execution obtained by Management. The Board's
32
Portfolio Transactions and Pricing Committee from time to time reviewed the quality of the execution services that Management and Neuberger had provided, and periodically reviews studies by an independent firm engaged to review and evaluate the quality of brokerage execution received by the Fund. The Board also reviewed whether Management and Neuberger used brokers to execute Fund transactions that provide research and other services to Management and Neuberger, and the types of benefits potentially derived from such services by Management, Neuberger, the Fund and other clients of Management and Neuberger. In addition, the Board noted the positive compliance history of Management and Neuberger, as each firm has been free of significant reported compliance problems.
The Board considered the performance of the Fund relative to its benchmark and a peer group of investment companies dedicated to insurance products pursuing broadly similar strategies. The Board also considered performance in relation to certain measures of the degree of investment risk undertaken by the portfolio manager.
With respect to the overall fairness of the Agreements, the Board considered the fee structure for the Fund under the Agreements as compared to a peer group of comparable funds dedicated to insurance products and any fall-out benefits likely to accrue to Management or Neuberger or their affiliates from their relationship with the Fund. The Board also considered the profitability of Management and its affiliates from their association with the Fund.
The Board reviewed a comparison of the Fund's management fee and overall expense ratio to a peer group of broadly comparable funds dedicated to insurance products. The Board considered the mean and median of the management fees and expense ratios of the peer group. With regard to the sub-advisory fee paid to Neuberger, the Board noted that this fee is "at cost." In addition, the Board considered the contractual limit on Fund expenses undertaken by Management.
The Board considered whether there were other funds that were advised or sub-advised by Management or its affiliates or separate accounts managed by Management or its affiliates with similar investment objectives, policies and strategies to the Fund. The Board noted that there were no comparable separate accounts. The Board compared the fees charged to the Fund to the fees charged to an advised fund and a sub-advised fund, each managed in a similar style to the Fund. The Board considered the appropriateness and reasonableness of any differences between the fees charged to the Fund and the other funds and determined that the differences in fees were consistent with the management and other services provided.
The Board also evaluated any apparent or anticipated economies of scale in relation to the services Management provides to the Fund. The Board considered whether the Fund's fee structure provides for a reduction of payments resulting from the use of breakpoints and whether those breakpoints are set at appropriate asset levels.
The Board also considered changes in management, staffing, resources and operations accompanying the separation of the Neuberger Berman entities from the LBHI bankruptcy estate.
In concluding that the benefits accruing to Management and its affiliates by virtue of their relationship to the Fund were reasonable in comparison with the costs of providing the investment advisory services and the benefits accruing to the Fund, the Board reviewed specific data as to Management's profit on the Fund for a recent period and the trend in profit or loss over recent years. The Board also carefully examined Management's cost allocation methodology. The Board recognized that Management should be entitled to earn a reasonable level of profits for services it provides to the Fund and, based on its review, concluded that Management's level of profitability was not excessive.
Conclusions
In approving the Agreements, the Board concluded that the terms of each Agreement are fair and reasonable and that approval of the Agreements is in the best interests of the Fund and its shareholders. In reaching this determination, the Board considered that Management and Neuberger could be expected to provide a high level of service to the Fund; that the performance of the Fund was satisfactory over time; that the Fund's fee structure appeared to the Board to be reasonable given the nature and quality of services provided; and that the benefits accruing to Management and its affiliates by virtue of their relationship to the Fund were reasonable in comparison with the benefits accruing to the Fund.
33

Neuberger Berman
Advisers Management Trust
Regency Portfolio
I Class Shares
S Class Shares
Annual Report
December 31, 2010
Regency Portfolio Manager's Commentary
We are pleased to report that the Neuberger Berman Advisers Management Trust (AMT) Regency Portfolio generated a positive return and outperformed its benchmark, the Russell Midcap(R) Value Index, for full-year 2010.
Despite the lackluster U.S. recovery, the continuing soft labor and housing markets, and a European debt crisis that threatened global economic growth, 2010 was a good year for mid-cap value stocks. All 10 Russell Midcap Value Index sectors posted gains, with six of the 10 sectors rising by more than 25%. Telecommunication Services was the strongest performing sector, followed by Energy, Consumer Discretionary, Industrials and Materials. Lagging sectors included Utilities, Information Technology and Health Care.
Stocks enjoyed a particularly strong fourth quarter due to the stabilization of European debt markets, the Federal Reserve's continued commitment to quantitative easing (which reduced fears of a double-dip recession), positive manufacturing data from the Institute for Supply Management, private payroll growth, and a change in the balance of power in Washington, DC that eased concerns about further restrictive government regulation.
In 2010, the Portfolio had superior performance relative to its benchmark in six of the nine sectors in which it was invested. Stock selection was largely responsible for the Portfolio's outperformance relative to the benchmark index. Sector allocation hurt performance. Highlighted by the strong returns from stocks such as European commercial vehicle component manufacturer WABCO Holdings, mining equipment leader Bucyrus International, which was acquired at a 30% premium by Catepillar, and engineering and construction firm Chicago Bridge & Iron, Industrials sector investments made the largest contribution to relative returns. The solid performance of vitamin producer NBTY, which we sold when it received a premium bid from a private equity firm, helped produce strong relative returns in Consumer Staples. Retailer Limited Brands, department store chain Macy's and auto component maker Lear Corp. propelled returns in the Consumer Discretionary sector. Overweights in Consumer Discretionary and Industrials, the Russell Midcap Value Index's third and fourth best performing sectors, complimented positive stock selection. Other top performers this year include diversified resources company Teck Resources, which benefited from strong global demand for copper and metallurgical coal, and crude oil oriented exploration and production company Whiting Petroleum, which benefited from rising oil prices and increased production from oil shale deposits.
Energy investments detracted from relative returns. Although our Energy holdings delivered above index average returns, our bias toward natural gas producers and the disappointing performance of stocks such as Southwestern Energy and Cabot Oil & Gas (the position was sold prior to the end of the reporting period) resulted in a relative performance shortfall. The Portfolio was overweighted in Health Care, a below-benchmark performing sector, and the poor performance of stocks such as HMO Aetna hampered returns. Our total lack of exposure in Telecommunications, the benchmark's top performing sector, also penalized relative returns. Other notable laggards included mortgage services provider Lender Processing Services, which declined due to alleged misdeeds in its foreclosure operations, independent power producer NRG Energy, a victim of soft power prices, and U.S. Steel, where lower capacity utilization will likely pinch profit margins.
There has been relatively modest turnover in the Portfolio and, at year-end, sector allocation had changed little. Today, we are finding attractive opportunities in the Health Care and Information Technology sectors.
While equities have generally enjoyed a good year and a good fourth quarter, many investors remain risk averse, preferring the shelter of Treasury securities and corporate bonds to stocks. Consequently, relative to bonds, equities are still quite attractively valued in our opinion. We believe the Federal Reserve's ongoing commitment to quantitative easing has given investors confidence that a double-dip recession is unlikely and the most recent economic data point to slowly improving economic conditions. In our view, the recent back-up of 10-year Treasury bond yields may be foreshadowing greater investor participation in the equities market, perhaps providing a tailwind for stocks.
1
Of course, there are no guarantees that the economy will continue to improve or that equities will continue to advance in 2011. However, we believe the portfolio's holdings remain undervalued based on normalized earnings and that our strategy of buying what we believe are high-quality companies at low multiples to normalized earnings should pay off if the economy continues to recover and should also provide downside protection should the economy falter.
Sincerely,

S. Basu Mullick
Portfolio Manager
The risks involved in seeking capital appreciation from investments primarily in mid-cap stocks are set forth in the prospectus and statement of additional information.
Mid-capitalization stocks are more vulnerable to financial risks and other risks than stocks of larger companies. They also trade less frequently and in lower volume than larger company stocks, so their market prices tend to be more volatile.
The composition, industries and holdings of the Portfolio are subject to change. The AMT Regency Portfolio is invested in a wide array of stocks and no single holding makes up a significant portion of the Portfolio's total assets.
2
Regency Portfolio (Unaudited)
SECTOR ALLOCATION
| (% of Total Investments) | |
| Consumer Discretionary | | | 13.6 | % | |
| Consumer Staples | | | 2.9 | | |
| Energy | | | 13.4 | | |
| Financials | | | 24.8 | | |
| Health Care | | | 8.2 | | |
| Industrials | | | 14.2 | | |
| Information Technology | | | 6.4 | | |
| Materials | | | 4.8 | | |
| Utilities | | | 8.0 | | |
| Short-Term | | | 3.7 | | |
| Total | | | 100.0 | % | |
PERFORMANCE HIGHLIGHTS1
| | | Inception | | Average Annual Total Return
Ended 12/31/2010 | |
| | | Date | | 1 Year | | 5 Years | | Life of Fund* | |
| Regency Portfolio Class I | | 08/22/2001 | | | 26.18 | % | | | 2.85 | % | | | 7.15 | % | |
| Regency Portfolio Class S2 | | 04/29/2005 | | | 25.99 | % | | | 2.62 | % | | | 7.02 | % | |
| Russell Midcap(R) Value Index3 | | | | | | | 24.75 | % | | | 4.08 | % | | | 8.40 | % | |
| Russell Midcap(R) Index3 | | | | | | | 25.48 | % | | | 4.66 | % | | | 7.96 | % | |
Performance data quoted represent past performance, which is no guarantee of future results. The investment return and principal value of an investment will fluctuate so that an investor's shares, when redeemed, may be worth more or less than their original cost. Results are shown on a "total return" basis and include reinvestment of all income dividends and distributions. Current performance may be lower or higher than the performance data quoted. For performance data current to the most recent month end, please visit https://www.nb.com.
* Index returns are as of inception date 08/22/2001.
As stated in the Portfolio's most recent prospectus, the total annual operating expense ratios for fiscal year 2009 were 1.08% and 1.30% for Class I and Class S shares, respectively (prior to any fee waivers or expense reimbursements). The net expense ratio was 1.27% for Class S shares. Neuberger Berman Management LLC has contractually agreed to limit certain expenses of the Portfolio through 12/31/2013 for Class I shares and through 12/31/2020 for Class S shares.
COMPARISON OF A $10,000 INVESTMENT
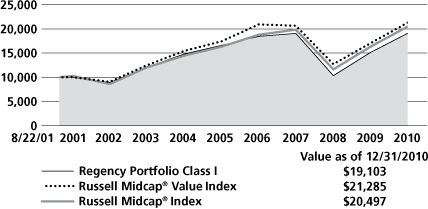
This chart shows the value of a hypothetical $10,000 investment in the Portfolio over the past 10 fiscal years, or since the Portfolio's inception, if it has not operated for 10 years. The graph is based on Class I shares only; performance of other classes will vary due to differences in fee structures (see Performance Highlights chart above). The results are compared with one or more benchmarks, which may include a broad-based market index and/or a narrower index. Please note that market indices have not been reduced to reflect any of the fees and costs of investing. All results include the reinvestment of income dividends and distributions. Neither the Portfolio's returns nor the market indices shown in the graph and table reflect the effect of taxes an investor would pay on Portfolio distributions or on the redemption of Portfolio shares. Results represent past performance and do not indicate future results.
Please see Endnotes for additional information.
3
Endnotes
1 "Total Return" includes reinvestment of all income dividends and distributions. Results represent past performance and do not indicate future results. The value of an investment in the Portfolio and the return on the investment both will fluctuate, and redemption proceeds may be higher or lower than an investor's original cost. The performance information does not reflect fees and expenses of the variable annuity and variable life insurance policies or the qualified pension and retirement plans whose proceeds are invested in the Portfolio. Neuberger Berman Management LLC ("NBM LLC") has agreed to absorb certain expenses of the AMT Portfolios, including the Portfolio. Without this arrangement, which is subject to change, the total returns of the Portfolio may have been less.
2 Performance shown prior to April 29, 2005 for the Class S shares is that of the Class I shares, which have lower expenses and correspondingly higher returns than Class S shares.
3 The Russell Midcap(R) Value Index measures the performance of those Russell Midcap(R) Index companies with lower price-to-book ratios and lower forecasted growth values. The Russell Midcap Index measures the performance of the 800 smallest companies in the Russell 1000(R) Index, which represents approximately 27% of the total market capitalization of the Russell 1000 Index (which, in turn, consists of the 1,000 largest U.S. companies, based on market capitalization). Please note that indices do not take into account any fees and expenses of investing in the individual securities that they track and that individuals cannot invest directly in any index. Data about the performance of these indices are prepared or obtained by NBM LLC and include reinvestment of all income dividends and distributions. The Portfolio may invest in many securities not included in the above-described indices or may not invest in all securities included in the above-described indices.
Any ratios or other measurements using a factor of forecasted earnings of a company discussed herein are based on consensus estimates, not NBM LLC's own projections, and they may or may not be realized. In addition, any revision to a forecast could affect the market price of a security. By quoting them herein, NBM LLC does not offer an opinion as to the accuracy of and does not guarantee these forecasted numbers.
The investments for the Portfolio are managed by the same portfolio manager(s) who manage one or more other mutual funds that have similar names, investment objectives and investment styles as the Portfolio. You should be aware that the Portfolio is likely to differ from the other mutual funds in size, cash flow pattern and tax matters. Accordingly, the holdings and performance can be expected to vary from those of the other mutual funds.
The composition, industries and holdings of the Portfolio are subject to change.
Shares of the separate AMT Portfolios are not available to the general public. Shares of this Portfolio may be purchased only by life insurance companies to be used with their separate accounts that fund variable annuity and variable life insurance policies and by qualified pension and retirement plans.
Statistics and projections in this report are derived from sources deemed to be reliable but cannot be regarded as a representation of future results of the AMT Portfolios. This report is prepared for the general information of shareholders and is not an offer of shares of the AMT Portfolios. Shares of the AMT Portfolios are sold only through the currently effective prospectuses, which must precede or accompany this report.
The "Neuberger Berman" name and logo are registered service marks of Neuberger Berman Group LLC. "Neuberger Berman Management LLC" and the individual Fund names in this piece are either service marks or registered service marks of Neuberger Berman Management LLC.
(c) 2011 Neuberger Berman Management LLC distributor. All rights reserved.
4
Information About Your Fund's Expenses
This table is designed to provide information regarding costs related to your investments. All mutual funds incur operating expenses, which include management fees, fees for administrative services and costs of shareholder reports, among others. The following examples are based on an investment of $1,000 made at the beginning of the six month period ended December 31, 2010 and held for the entire period. The table illustrates the fund's costs in two ways:
| Actual Expenses and Performance: | | The first section of the table provides information about actual account values and actual expenses in dollars, based on the fund's actual performance during the period. You may use the information in this line, together with the amount you invested, to estimate the expenses you paid over the period. Simply divide your account value by $1,000 (for example, an $8,600 account value divided by $1,000 = 8.6), then multiply the result by the number in the first section of the table under the heading entitled "Expenses Paid During the Period" to estimate the expenses you paid over the period. | |
|
Hypothetical Example for
Comparison Purposes: | | The second section of the table provides information about hypothetical account values and hypothetical expenses based on the fund's actual expense ratio and an assumed rate of return at 5% per year before expenses. This return is not the fund's actual return. The hypothetical account values and expenses may not be used to estimate the actual ending account balance or expenses you paid for the period. You may use this information to compare the ongoing costs of investing in this fund versus other funds. To do so, compare the expenses shown in this 5% hypothetical example with the 5% hypothetical examples that appear in the shareholder reports of other funds. | |
|
Please note that the expenses in the table are meant to highlight your ongoing costs only. The table and expense example do not include any transaction costs, such as fees and expenses that are, or may be, imposed under your variable contract or qualified pension plan. Therefore, the information under the heading "Hypothetical (5% annual return before expenses)" is useful in comparing ongoing costs only, and will not help you determine the relative total costs of owning different funds. In addition, if these transaction costs were included, your costs would have been higher.
Expense Information as of 12/31/10 (Unaudited)
NEUBERGER BERMAN ADVISERS MANAGEMENT TRUST REGENCY PORTFOLIO
| Actual | | Beginning Account
Value 7/1/10 | | Ending Account
Value 12/31/10 | | Expenses Paid During
the Period*
7/1/10 - 12/31/10 | | Expense
Ratio | |
| Class I | | $ | 1,000.00 | | | $ | 1,300.00 | | | $ | 6.20 | | | | 1.07 | % | |
| Class S | | $ | 1,000.00 | | | $ | 1,299.20 | | | $ | 7.24 | | | | 1.25 | % | |
| Hypothetical (5% annual return before expenses)** | |
| Class I | | $ | 1,000.00 | | | $ | 1,019.81 | | | $ | 5.45 | | | | 1.07 | % | |
| Class S | | $ | 1,000.00 | | | $ | 1,018.90 | | | $ | 6.36 | | | | 1.25 | % | |
* For each class, expenses are equal to the annualized expense ratio for the class, multiplied by the average account value over the period, multiplied by 184/365 (to reflect the one-half year period shown).
** Hypothetical 5% annual return before expenses is calculated by multiplying the number of days in the most recent half year divided by 365.
5
Schedule of Investments Regency Portfolio
| NUMBER OF SHARES | | | | VALUEt | |
| Common Stocks (97.6%) | | | |
| Aerospace & Defense (1.7%) | | | |
| | 66,300 | | | Embraer SA ADR | | $ | 1,949,220 | | |
| 65,600
| | | Spirit Aerosystems Holdings
Class A | | | 1,365,136
| * | |
| | | | 3,314,356 | | |
| Auto Components (1.6%) | | | |
| | 31,800 | | | Lear Corp. | | | 3,138,978 | * | |
| Automobiles (1.3%) | | | |
| | 75,100 | | | Harley-Davidson | | | 2,603,717 | | |
| Beverages (1.0%) | | | |
| | 54,000 | | | Dr. Pepper Snapple Group | | | 1,898,640 | | |
| Building Products (2.9%) | | | |
| | 131,700 | | | Masco Corp. | | | 1,667,322 | | |
| | 132,600 | | | Owens Corning | | | 4,130,490 | * | |
| | | | 5,797,812 | | |
| Capital Markets (1.9%) | | | |
| | 158,800 | | | Invesco Ltd. | | | 3,820,728 | | |
| Commercial Banks (7.9%) | | | |
| | 34,200 | | | Comerica Inc. | | | 1,444,608 | | |
| | 242,100 | | | Fifth Third Bancorp | | | 3,554,028 | | |
| | 81,455 | | | First Horizon National | | | 959,540 | * | |
| | 79,900 | | | KeyCorp | | | 707,115 | | |
| | 361,300 | | | Regions Financial | | | 2,529,100 | | |
| | 107,800 | | | SunTrust Banks | | | 3,181,178 | | |
| | 343,700 | | | Synovus Financial | | | 907,368 | | |
| | 96,800 | | | Zions Bancorp | | | 2,345,464 | | |
| | | | 15,628,401 | | |
| Construction & Engineering (1.6%) | | | |
| | 98,700 | | | Chicago Bridge & Iron | | | 3,247,230 | * | |
| Containers & Packaging (1.4%) | | | |
| | 133,800 | | | Temple-Inland | | | 2,841,912 | | |
| Diversified Financial Services (2.1%) | | | |
| | 157,900 | | | Moody's Corp. | | | 4,190,666 | | |
| Electric Utilities (2.7%) | | | |
| | 93,600 | | | DPL Inc. | | | 2,406,456 | | |
| | 201,100 | | | NV Energy | | | 2,825,455 | | |
| | | | 5,231,911 | | |
| NUMBER OF SHARES | | | | VALUEt | |
Electronic Equipment, Instruments &
Components (3.5%) | | | |
| | 46,600 | | | Anixter International | | $ | 2,783,418 | | |
| | 124,700 | | | Avnet, Inc. | | | 4,118,841 | * | |
| | | | 6,902,259 | | |
| Energy Equipment & Services (5.1%) | | | |
| | 61,500 | | | Complete Production Services | | | 1,817,325 | * | |
| | 121,800 | | | McDermott International | | | 2,520,042 | * | |
| | 34,500 | | | National Oilwell Varco | | | 2,320,125 | | |
| | 41,200 | | | Noble Corp. | | | 1,473,724 | | |
| | 24,900 | | | Oceaneering International | | | 1,833,387 | * | |
| | | | 9,964,603 | | |
| Food Products (0.3%) | | | |
| | 8,100 | | | J.M. Smucker | | | 531,765 | | |
| Gas Utilities (1.0%) | | | |
| | 112,500 | | | Questar Corp. | | | 1,958,625 | | |
| Health Care Providers & Services (6.3%) | | | |
| | 56,200 | | | Aetna Inc. | | | 1,714,662 | | |
| | 95,400 | | | AmerisourceBergen Corp. | | | 3,255,048 | | |
| | 58,100 | | | CIGNA Corp. | | | 2,129,946 | | |
| | 80,300 | | | Coventry Health Care | | | 2,119,920 | * | |
| | 46,500 | | | MEDNAX, Inc. | | | 3,128,985 | * | |
| | | | 12,348,561 | | |
| Household Durables (2.6%) | | | |
| | 152,200 | | | KB HOME | | | 2,053,178 | | |
| | 33,600 | | | Whirlpool Corp. | | | 2,984,688 | | |
| | | | 5,037,866 | | |
| Household Products (1.6%) | | | |
| | 44,400 | | | Energizer Holdings | | | 3,236,760 | * | |
| Insurance (9.1%) | | | |
| | 82,200 | | | Assurant, Inc. | | | 3,166,344 | | |
| 58,800
| | | Fidelity National Financial
Class A | | | 804,384
| | |
| | 118,400 | | | Lincoln National | | | 3,292,704 | | |
| | 27,000 | | | PartnerRe Ltd. | | | 2,169,450 | | |
| | 114,500 | | | Principal Financial Group | | | 3,728,120 | | |
| | 54,200 | | | StanCorp Financial Group | | | 2,446,588 | | |
| | 83,500 | | | W.R. Berkley | | | 2,286,230 | | |
| | | | 17,893,820 | | |
| IT Services (1.8%) | | | |
| | 122,600 | | | Lender Processing Services | | | 3,619,152 | | |
See Notes to Schedule of Investments
6
| NUMBER OF SHARES | | | | VALUEt | |
| Life Science Tools & Services (0.7%) | | | |
| | 25,400 | | | ICON PLC ADR | | $ | 556,260 | * | |
| | 35,700 | | | PAREXEL International | | | 757,911 | * | |
| | | | 1,314,171 | | |
| Machinery (8.2%) | | | |
| | 39,600 | | | AGCO Corp. | | | 2,006,136 | * | |
| | 42,000 | | | Bucyrus International | | | 3,754,800 | | |
| | 66,700 | | | Ingersoll-Rand PLC | | | 3,140,903 | | |
| | 108,300 | | | Terex Corp. | | | 3,361,632 | * | |
| | 62,400 | | | WABCO Holdings | | | 3,802,032 | * | |
| | | | 16,065,503 | | |
| Media (2.3%) | | | |
| | 26,600 | | | Cablevision Systems | | | 900,144 | | |
| | 101,800 | | | McGraw-Hill Cos. | | | 3,706,538 | | |
| | | | 4,606,682 | | |
| Metals & Mining (3.4%) | | | |
| | 32,500 | | | Cliffs Natural Resources | | | 2,535,325 | | |
| | 66,100 | | | Teck Resources Class B | | | 4,086,963 | | |
| | | | 6,622,288 | | |
| Multi-Utilities (4.5%) | | | |
| | 75,300 | | | Alliant Energy | | | 2,768,781 | | |
| | 94,700 | | | CenterPoint Energy | | | 1,488,684 | | |
| | 143,400 | | | CMS Energy | | | 2,667,240 | | |
| | 20,600 | | | DTE Energy | | | 933,592 | | |
| | 22,000 | | | OGE Energy | | | 1,001,880 | | |
| | | | 8,860,177 | | |
| Multiline Retail (2.9%) | | | |
| | 76,200 | | | J.C. Penney | | | 2,462,022 | | |
| | 131,900 | | | Macy's, Inc. | | | 3,337,070 | | |
| | | | 5,799,092 | | |
| Oil, Gas & Consumable Fuels (8.5%) | | | |
| | 137,300 | | | Denbury Resources | | | 2,621,057 | * | |
| | 50,800 | | | Newfield Exploration | | | 3,663,188 | * | |
| | 29,600 | | | Noble Energy | | | 2,547,968 | | |
| | 50,833 | | | Ship Finance International | | | 1,093,926 | | |
| | 47,500 | | | Southwestern Energy | | | 1,777,925 | * | |
| | 32,200 | | | Whiting Petroleum | | | 3,773,518 | * | |
| | 37,900 | | | World Fuel Services | | | 1,370,464 | | |
| | | | 16,848,046 | | |
| Pharmaceuticals (1.4%) | | | |
| | 37,500 | | | Shire PLC ADR | | | 2,714,250 | | |
| NUMBER OF SHARES | | | | VALUEt | |
| Real Estate Investment Trusts (4.1%) | | | |
| 12,800
| | | Alexandria Real
Estate Equities | | $ | 937,728
| | |
| | 91,700 | | | Annaly Capital Management | | | 1,643,264 | | |
| | 17,626 | | | Boston Properties | | | 1,517,599 | | |
| | 40,286 | | | Macerich Co. | | | 1,908,348 | | |
| | 24,004 | | | Vornado Realty Trust | | | 2,000,253 | | |
| | | | 8,007,192 | | |
Semiconductors & Semiconductor
Equipment (1.1%) | | | |
| | 32,000 | | | Lam Research | | | 1,656,960 | * | |
| | 58,600 | | | ON Semiconductor | | | 578,968 | * | |
| | | | 2,235,928 | | |
| Specialty Retail (3.1%) | | | |
| | 74,900 | | | Aeropostale, Inc. | | | 1,845,536 | * | |
| | 148,700 | | | Chico's FAS | | | 1,788,861 | | |
| | 78,300 | | | Limited Brands | | | 2,406,159 | | |
| | | | 6,040,556 | | |
| | | | | Total Common Stocks
(Cost $133,712,525) | | | 192,321,647 | | |
| Short-Term Investments (3.8%) | | | |
| 7,479,450
| | | State Street Institutional
Liquid Reserves Fund
Institutional Class
(Cost $7,479,450) | | | 7,479,450
| | |
| | | | | Total Investments (101.4%)
(Cost $141,191,975) | | | 199,801,097 | ## | |
| | | | | Liabilities, less cash, receivables and
other assets [(1.4%)] | | | (2,691,400 | ) | |
| | | | | Total Net Assets (100.0%) | | $ | 197,109,697 | | |
See Notes to Schedule of Investments
7
Notes to Schedule of Investments Regency Portfolio
t In accordance with Accounting Standards Codification ("ASC") 820 "Fair Value Measurements and Disclosures" ("ASC 820"), all investments held by Neuberger Berman Advisers Management Trust Regency Portfolio (the "Fund") are carried at the value that Neuberger Berman Management LLC ("Management") believes the Fund would receive upon selling an investment in an orderly transaction to an independent buyer in the principal or most advantageous market for the investment under current market conditions. Various inputs, including the volume and level of activity for the asset or liability in the market, are considered in valuing the Fund's investments, some of which are discussed below. Significant management judgment may be necessary to value investments in accordance with ASC 820.
ASC 820 established a three-tier hierarchy of inputs to create a classification of value measurements for disclosure purposes. The three-tier hierarchy of inputs is summarized in the three broad Levels listed below.
. Level 1 - quoted prices in active markets for identical investments
. Level 2 - other significant observable inputs (including quoted prices for similar investments, interest rates, prepayment speeds, credit risk, amortized cost, etc.)
. Level 3 - significant unobservable inputs (including the Fund's own assumptions in determining the fair value of investments)
The inputs or methodology used for valuing an investment are not necessarily an indication of the risk associated with investing in those securities.
The value of the Fund's investments in equity securities, for which market quotations are readily available, is generally determined by Management by obtaining valuations from an independent pricing service based on the latest sale price quoted in active markets (Level 1 inputs). Securities traded primarily on the NASDAQ Stock Market are normally valued by the Fund at the NASDAQ Official Closing Price ("NOCP") provided by NASDAQ each business day. The NOCP is the most recently reported price as of 4:00:02 p.m., Eastern time, unless that price is outside the range of the "inside" bid and asked prices (i.e., the bid and asked prices that dealers quote to each other when trading for their own accounts); in that case, NASDAQ will adjust the price to equal the inside bid or asked price, whichever is closer. Because of delays in reporting trades, the NOCP may not be based on the price of the last trade to occur before the market closes. If there is no reported sale of a security on a particular day, the independent pricing service may value the security based on reported market quotations.
Management has developed a process to periodically review information provided by independent pricing services for all types of securities.
Investments in State Street Institutional Liquid Reserves Fund Institutional Class are valued using the fund's daily calculated net asset value ("NAV").
For equity securities, if a valuation is not available from an independent pricing service, or if Management has reason to believe that the valuation received does not represent the amount the Fund might reasonably expect to receive on a current sale in an orderly transaction, the Fund seeks to obtain quotations from principal market makers (generally considered Level 3 inputs). If such quotations are not readily available, the security is valued using methods the Board of Trustees of Neuberger Berman Advisers Management Trust (the "Board") has approved on the belief that they reflect fair value. Numerous factors may be considered when determining the fair value of a security based on Level 2 or 3 inputs, including available analyst, media or other reports, trading in futures or ADRs and whether the issuer of the security being fair valued has other securities outstanding.
The value of the Fund's investments in foreign securities is generally determined using the same valuation methods and inputs as other Fund investments, as discussed above. Foreign security prices are expressed in local currency values and are translated from the local currency into U.S. dollars using the exchange rates as of 4:00 p.m., Eastern time. The Board has approved the use of Interactive Data Pricing and Reference Data, Inc. ("Interactive") to assist in determining the fair value of foreign equity securities when changes in the value of a certain index suggest that
See Notes to Financial Statements
8
Notes to Schedule of Investments Regency Portfolio (cont'd)
the closing prices on the foreign exchanges may no longer represent the amount that the Fund could expect to receive for those securities. In this event, Interactive will provide adjusted prices for certain foreign equity securities using a statistical analysis of historical correlations of multiple factors (Level 2 inputs). In the absence of precise information about the market values of these foreign securities as of the close of the New York Stock Exchange, the Board has determined on the basis of available data that prices adjusted in this way are likely to be closer to the prices the Fund could realize on a current sale than are the prices of those securities established at the close of the foreign markets in which the securities primarily trade. These fair value prices are necessarily estimates, and there is no assurance that such a price will be at or close to the price at which the security is next quoted or next trades.
The following is a summary, categorized by Level, of inputs used to value the Fund's investments as of December 31, 2010:
| Asset Valuation Inputs | | Level 1 | | Level 2 | | Level 3 | | Total | |
| Investments: | |
| Common Stocks^ | | $ | 192,321,647 | | | $ | -- | | | $ | -- | | | $ | 192,321,647 | | |
| Short-Term Investments | | | -- | | | | 7,479,450 | | | | -- | | | | 7,479,450 | | |
| Total Investments | | $ | 192,321,647 | | | $ | 7,479,450 | | | $ | -- | | | $ | 199,801,097 | | |
^ The Schedule of Investments provides information on the industry categorization for the portfolio.
The Fund had no significant transfers between Levels 1 and 2 during the year ended December 31, 2010.
## At December 31, 2010, the cost of investments for U.S. federal income tax purposes was $145,201,048. Gross unrealized appreciation of investments was $54,849,876 and gross unrealized depreciation of investments was $249,827, resulting in net unrealized appreciation of $54,600,049, based on cost for U.S. federal income tax purposes.
* Security did not produce income during the last twelve months.
See Notes to Financial Statements
9
Statement of Assets and Liabilities
Neuberger Berman Advisers Management Trust
| | | REGENCY
PORTFOLIO | |
| | | December 31, 2010 | |
| Assets | |
| Investments in securities, at value* (Notes A & F)--see Schedule of Investments: | |
| Unaffiliated issuers | | $ | 199,801,097 | | |
| Dividends and interest receivable | | | 167,675 | | |
| Receivable for Fund shares sold | | | 202,772 | | |
| Prepaid expenses and other assets | | | 3,256 | | |
| Total Assets | | | 200,174,800 | | |
| Liabilities | |
| Payable for Fund shares redeemed | | | 2,857,865 | | |
| Payable to investment manager (Notes A & B) | | | 92,079 | | |
| Payable to administrator--net (Note B) | | | 51,207 | | |
| Accrued expenses and other payables | | | 63,952 | | |
| Total Liabilities | | | 3,065,103 | | |
| Net Assets at value | | $ | 197,109,697 | | |
| Net Assets consist of: | |
| Paid-in capital | | $ | 201,527,041 | | |
| Undistributed net investment income (loss) | | | 675,930 | | |
| Accumulated net realized gains (losses) on investments | | | (63,702,586 | ) | |
| Net unrealized appreciation (depreciation) in value of investments | | | 58,609,312 | | |
| Net Assets at value | | $ | 197,109,697 | | |
| Net Assets | |
| Class I | | $ | 134,589,503 | | |
| Class S | | | 62,520,194 | | |
| Shares Outstanding ($.001 par value; unlimited shares authorized) | |
| Class I | | | 8,763,906 | | |
| Class S | | | 3,769,651 | | |
| Net Asset Value, offering and redemption price per share | |
| Class I | | $ | 15.36 | | |
| Class S | | | 16.59 | | |
| *Cost of Investments: | | | |
| Unaffiliated issuers | | $ | 141,191,975 | | |
See Notes to Financial Statements
10
Statement of Operations
Neuberger Berman Advisers Management Trust
| | | REGENCY
PORTFOLIO | |
| | | For the
Year Ended
December 31, 2010 | |
| Investment Income: | |
| Income (Note A): | |
| Dividend income--unaffiliated issuers | | $ | 2,610,407 | | |
| Interest income--unaffiliated issuers | | | 17,337 | | |
| Income from securities loaned--net (Note F) | | | 2,792 | | |
| Foreign taxes withheld | | | (8,806 | ) | |
| Total income | | $ | 2,621,730 | | |
| Expenses: | |
| Investment management fees (Notes A & B) | | | 913,169 | | |
| Administration fees (Note B): | |
| Class I | | | 321,485 | | |
| Class S | | | 176,603 | | |
| Distribution fees (Note B): | |
| Class S | | | 147,170 | | |
| Audit fees | | | 40,900 | | |
| Custodian fees (Note B) | | | 70,941 | | |
| Insurance expense | | | 12,960 | | |
| Legal fees | | | 76,455 | | |
| Shareholder reports | | | 73,725 | | |
| Trustees' fees and expenses | | | 52,324 | | |
| Miscellaneous | | | 14,775 | | |
| Total expenses | | | 1,900,507 | | |
| Expenses reimbursed by Management (Note B) | | | (31,454 | ) | |
| Expenses reduced by custodian fee expense offset arrangement (Note B) | | | (21 | ) | |
| Total net expenses | | | 1,869,032 | | |
| Net investment income (loss) | | $ | 752,698 | | |
| Realized and Unrealized Gain (Loss) on Investments (Note A) | |
| Net realized gain (loss) on: | |
| Sales of investment securities of unaffiliated issuers | | | 16,437,277 | | |
| Foreign currency | | | (723 | ) | |
| Change in net unrealized appreciation (depreciation) in value of: | |
| Unaffiliated investment securities | | | 24,834,828 | | |
| Foreign currency | | | 190 | | |
| Net gain (loss) on investments | | | 41,271,572 | | |
| Net increase (decrease) in net assets resulting from operations | | $ | 42,024,270 | | |
See Notes to Financial Statements
11
Statements of Changes in Net Assets
Neuberger Berman Advisers Management Trust
| | | REGENCY PORTFOLIO | |
| | | Year Ended
December 31,
2010 | | Year Ended
December 31,
2009 | |
| Increase (Decrease) in Net Assets: | |
| From Operations (Note A): | |
| Net investment income (loss) | | $ | 752,698 | | | $ | 1,101,007 | | |
| Net realized gain (loss) on investments | | | 16,436,554 | | | | (61,176,748 | ) | |
| Change in net unrealized appreciation (depreciation) of investments | | | 24,835,018 | | | | 121,360,929 | | |
| Net increase (decrease) in net assets resulting from operations | | | 42,024,270 | | | | 61,285,188 | | |
| Distributions to Shareholders From (Note A): | |
| Net investment income: | |
| Class I | | | (895,174 | ) | | | (1,350,470 | ) | |
| Class S | | | (191,283 | ) | | | (480,269 | ) | |
| Net realized gain on investments: | |
| Class I | | | - | | | | (1,138,831 | ) | |
| Class S | | | - | | | | (698,414 | ) | |
| Total distributions to shareholders | | | (1,086,457 | ) | | | (3,667,984 | ) | |
| From Fund Share Transactions (Note D): | |
| Proceeds from shares sold: | |
| Class I | | | 49,423,172 | | | | 7,819,794 | | |
| Class S | | | 11,006,720 | | | | 50,437,882 | | |
| Proceeds from reinvestment of dividends and distributions: | |
| Class I | | | 895,174 | | | | 2,489,301 | | |
| Class S | | | 191,283 | | | | 1,178,683 | | |
| Payments for shares redeemed: | |
| Class I | | | (28,829,668 | ) | | | (26,673,515 | ) | |
| Class S | | | (20,364,903 | ) | | | (143,603,895 | ) | |
| Net increase (decrease) from Fund share transactions | | | 12,321,778 | | | | (108,351,750 | ) | |
| Net Increase (Decrease) in Net Assets | | | 53,259,591 | | | | (50,734,546 | ) | |
| Net Assets: | |
| Beginning of year | | | 143,850,106 | | | | 194,584,652 | | |
| End of year | | $ | 197,109,697 | | | $ | 143,850,106 | | |
| Undistributed net investment income (loss) at end of year | | $ | 675,930 | | | $ | 1,090,759 | | |
See Notes to Financial Statements
12
Notes to Financial Statements Regency Portfolio
Note A--Summary of Significant Accounting Policies:
1 General: The Fund is a separate operating series of Neuberger Berman Advisers Management Trust (the "Trust"), a Delaware statutory trust organized pursuant to a Trust Instrument dated May 23, 1994. The Trust is currently comprised of ten separate operating series (each individually a "Series," and collectively the "Funds") each of which is diversified. The Trust is registered as an open-end management investment company under the Investment Company Act of 1940, as amended (the "1940 Act"), and its shares are registered under the Securities Act of 1933, as amended. The Fund currently offers Class I and Class S shares. The Board may establish additional series or classes of shares without the approval of shareholders.
The assets of each Series belong only to that Series, and the liabilities of each Series are borne solely by that Series and no other.
The preparation of financial statements in accordance with U.S. generally accepted accounting principles requires Management to make estimates and assumptions at the date of the financial statements. Actual results could differ from those estimates.
2 Portfolio valuation: Investment securities are valued as indicated in the notes following the Schedule of Investments.
3 Foreign currency translation: The accounting records of the Fund are maintained in U.S. dollars. Foreign currency amounts are translated into U.S. dollars using the exchange rates as of 4:00 p.m., Eastern time, to determine the value of investments, other assets and liabilities. Purchase and sale prices of securities, and income and expenses, are translated into U.S. dollars at the prevailing rate of exchange on the respective dates of such transactions. Net unrealized foreign currency gain (loss), if any, arises from changes in the value of assets and liabilities, other than investments in securities, as a result of changes in exchange rates and is stated separately in the Statement of Operations.
4 Securities transactions and investment income: Securities transactions are recorded on trade date for financial reporting purposes. Dividend income is recorded on the ex-dividend date or, for certain foreign dividends, as soon as the Fund becomes aware of the dividends. Non-cash dividends included in dividend income, if any, are recorded at the fair market value of the securities received. Interest income, including accretion of original issue discount, where applicable, and accretion of discount on short-term investments, if any, is recorded on the accrual basis. Realized gains and losses from securities transactions and foreign currency transactions, if any, are recorded on the basis of identified cost and stated separately in the Statement of Operations. Included in net realized gain (loss) on investments are proceeds from the settlements of class action litigation in which the Fund participated as a class member. The amount of such proceeds for the year ended December 31, 2010 was $237,894.
5 Income tax information: The Funds are treated as separate entities for U.S. federal income tax purposes. It is the policy of the Fund to continue to qualify as a regulated investment company by complying with the requirements of the U.S. Internal Revenue Code applicable to regulated investment companies and to distribute substantially all of its earnings to its shareholders. To the extent the Fund distributes substantially all of its earnings to shareholders, no federal income or excise tax provision is required.
The Fund has adopted the provisions of ASC 740 "Income Taxes" ("ASC 740"). ASC 740 sets forth a minimum threshold for financial statement recognition of a tax position taken, or expected to be taken, in a tax return. The Fund recognizes interest and penalties, if any, related to unrecognized tax positions as an income tax expense in the Statement of Operations. The Fund is subject to examination by U.S. federal and state tax authorities for returns filed for the prior three fiscal years 2007 - 2009. As of December 31, 2010, the Fund did not have any unrecognized tax positions.
Income distributions and capital gain distributions are determined in accordance with income tax regulations, which may differ from U.S. generally accepted accounting principles. These differences are primarily due to
13
differing treatments of income and gains on various investment securities held by the Fund, timing differences and differing characterization of distributions made by the Fund as a whole. The Fund may also utilize earnings and profits distributed to shareholders on redemption of shares as a part of the dividends paid deduction for income tax purposes.
As determined on December 31, 2010, permanent differences resulting primarily from different book and tax accounting for foreign currency gains and losses, return of capital distributions from real estate investment trusts ("REITs") and non-taxable dividend adjustments were reclassified at fiscal year-end. These reclassifications had no effect on net income, NAV or NAV per share of the Fund.
The tax character of distributions paid during the years ended December 31, 2010 and December 31, 2009 was as follows:
| | | Distributions Paid From: | | | |
| Ordinary Income | | Long-Term Capital Gain | | Total | |
| 2010 | | 2009 | | 2010 | | 2009 | | 2010 | | 2009 | |
| $ | 1,086,457 | | | $ | 1,830,739 | | | $ | -- | | | $ | 1,837,245 | | | $ | 1,086,457 | | | $ | 3,667,984 | | |
As of December 31, 2010, components of distributable earnings (accumulated losses) on a U.S. federal income tax basis were as follows:
Undistributed
Ordinary
Income | | Undistributed
Long-Term
Gain | | Unrealized
Appreciation
(Depreciation) | | Loss
Carryforwards
and Deferrals | | Total | |
| $ | 675,930 | | | $ | -- | | | $ | 54,600,239 | | | $ | (59,693,513 | ) | | $ | (4,417,344 | ) | |
The difference between book basis and tax basis distributable earnings is attributable primarily to timing differences of wash sales, capital loss carryforwards, REIT basis adjustments and non-taxable dividend adjustments for common stocks.
To the extent the Fund's net realized capital gains, if any, can be offset by capital loss carryforwards, it is the policy of the Fund not to distribute such gains. Under current tax law, the use of these losses to offset future gains may be limited. As determined at December 31, 2010, the Fund had unused capital loss carryforwards available for federal income tax purposes to offset net realized capital gains, if any, as follows:
| | | Expiring in: | |
| | | 2017 | |
| | | $ | 59,693,513 | | |
During the year ended December 31, 2010, the Fund utilized capital loss carryforwards of $15,050,561.
6 Distributions to shareholders: The Fund may earn income, net of expenses, daily on its investments. Distributions from net investment income and net realized capital gains, if any, generally are distributed once a year (usually in October). Income distributions and capital gain distributions to shareholders are recorded on the ex-date.
It is the policy of the Fund to pass through to its shareholders substantially all REIT distributions and other income it receives, less operating expenses. The distributions the Fund receives from REITs are generally comprised of income, capital gains, and return of REIT capital, but the REITs do not report this information to the Fund until the following calendar year. At December 31, 2010, the Fund estimated these amounts within the financial statements since the information is not available from the REITs until after the Fund's fiscal year-end. For the year ended December 31, 2010, the character of distributions paid to shareholders disclosed within the Statements of Changes in Net Assets is based on estimates made at that time. All estimates are based upon REIT information sources available to the Fund together with actual IRS Forms 1099DIV received to date. Based on past experience it is possible that a portion of the Fund's distributions during the current fiscal year will be considered tax return of capital but the actual amount of tax return of capital, if any, is not determinable until after the Fund's fiscal
14
year-end. After calendar year-end, when the Fund learns the nature of the distributions paid by REITs during that year, distributions previously identified as income are often recharacterized as return of capital and/or capital gain. After all applicable REITs have informed the Fund of the actual breakdown of distributions paid to the Fund during its fiscal year, estimates previously recorded are adjusted on the books of the Fund to reflect actual results. As a result, the composition of the Fund's distributions as reported herein may differ from the final composition determined after calendar year-end and reported to Fund shareholders on IRS Form 1099DIV, where applicable.
7 Foreign taxes: Foreign taxes withheld represent amounts withheld by foreign tax authorities, net of refunds recoverable.
8 Expense allocation: Certain expenses are applicable to multiple funds. Expenses directly attributable to a Series are charged to that Series. Expenses of the Trust that are not directly attributable to a particular series of the Trust (e.g., the Fund) are allocated among the series of the Trust, on the basis of relative net assets, except where a more appropriate allocation of expenses to each of the series can otherwise be made fairly. Expenses borne by the complex of related investment companies, which includes open-end and closed-end investment companies for which Management serves as investment manager, that are not directly attributable to a particular investment company in the complex (e.g., the Trust) or series thereof are allocated among the investment companies in the complex or series thereof, on the basis of relative net assets, except where a more appropriate allocation of expenses to each investment company in the complex or series thereof can otherwise be made fairly. The Fund's expenses (other than those specific to each class) are allocated proportionally each day between the classes based upon the relative net assets of each class.
9 Security lending: A third party, eSecLending, has assisted the Fund in conducting a bidding process to try to identify a principal that would pay a guaranteed amount to the Fund in consideration of the Fund entering into an exclusive securities lending arrangement. During the fiscal year, eSecLending served as exclusive lending agent for the Fund. As a result of a bidding process on October 1, 2009, no principal had an exclusive securities lending arrangement with the Fund during the fiscal year; as such, the Fund was not guaranteed any particular level of income during the fiscal year. As of August 27, 2010, the Fund no longer participates in a securities lending program.
Under the securities lending arrangement, the Fund received cash collateral at the beginning of each transaction equal to at least 102% of the prior day's market value of the loaned securities (105% in the case of international securities). The Fund invested all the cash collateral in Neuberger Berman Securities Lending Quality Fund, LLC ("Quality Fund"), a fund managed by Neuberger Berman Fixed Income LLC ("NBFI"), an affiliate of Management, and sub-advised by Dwight Asset Management Company LLC. Quality Fund was not a money market fund registered under the 1940 Act and did not operate in accordance with all requirements of Rule 2a-7 under the 1940 Act. The Fund redeemed all of its investments in Quality Fund, if any, as of August 27, 2010.
Net income from the lending program represents any amounts received from a principal, plus income earned on the cash collateral invested in Quality Fund or in other investments, if applicable, less cash collateral fees and other expenses associated with the loans. For the fiscal year ended December 31, 2010, the Fund received net income under the securities lending arrangement of $2,792, which is reflected in the Statement of Operations under the caption "Income from securities loaned-net," which includes $2,684 of interest income that was earned from the Quality Fund.
10 Investments in foreign securities: Investing in foreign securities may involve certain sovereign and other risks, in addition to the credit and market risks normally associated with domestic securities. These additional risks include the possibility of adverse political and economic developments (including political instability, nationalization, expropriation, or confiscatory taxation) and the potentially adverse effects of unavailability of public information regarding issuers, less government supervision and regulation of financial markets, reduced liquidity of certain financial markets, and the lack of uniform accounting, auditing, and financial reporting standards or the application of standards that are different or less stringent than those applied in the United States. Foreign securities also may experience greater price volatility, higher rates of inflation, and delays in settlement.
15
11 Indemnifications: Like many other companies, the Trust's organizational documents provide that its officers and trustees are indemnified against certain liabilities arising out of the performance of their duties to the Trust. In addition, both in some of its principal service contracts and in the normal course of its business, the Trust enters into contracts that provide indemnifications to other parties for certain types of losses or liabilities. The Trust's maximum exposure under these arrangements is unknown as this could involve future claims against the Trust.
12 Other: All net investment income and realized and unrealized capital gains and losses of the Fund are allocated, on the basis of relative net assets, pro rata among its respective classes.
Note B--Management Fees, Administration Fees, Distribution Arrangements, and Other Transactions with Affiliates:
Fund shares are issued and redeemed in connection with investments in and payments under certain variable annuity contracts and variable life insurance policies issued through separate accounts of life insurance companies and are also offered directly to certain qualified pension and retirement plans.
The Fund retains Management as its investment manager under a Management Agreement. For such investment management services, the Fund pays Management a fee at the annual rate of 0.55% of the first $250 million of the Fund's average daily net assets, 0.525% of the next $250 million, 0.50% of the next $250 million, 0.475% of the next $250 million, 0.45% of the next $500 million, 0.425% of the next $2.5 billion, and 0.40% of average daily net assets in excess of $4 billion.
The Fund retains Management as its administrator under an Administration Agreement. Each class pays Management an administration fee at the annual rate of 0.30% of its average daily net assets under this agreement. Additionally, Management retains State Street Bank and Trust Company ("State Street") as its sub-administrator under a Sub-Administration Agreement. Management pays State Street a fee for all services received under this agreement.
The Board adopted a non-fee distribution plan for the Fund's Class I.
For the Fund's Class S, Management acts as agent in arranging for the sale of class shares without commission and bears advertising and promotion expenses. The Board has adopted a distribution plan (the "Plan") with respect to this class, pursuant to Rule 12b-1 under the 1940 Act. The Plan provides that, as compensation for administrative and other services provided to this class, Management's activities and expenses related to the sale and distribution of this class of shares, and ongoing services provided to investors in this class, Management receives from this class a fee at the annual rate of 0.25% of Class S's average daily net assets. Management receives this amount to provide distribution and shareholder servicing for this class and pays a portion of it to institutions that provide such services. Those institutions may use the payments for, among other purposes, compensating employees engaged in sales and/or shareholder servicing. The amount of fees paid by this class during any year could have been more or less than the cost of distribution and other services provided to this class. FINRA rules limit the amount of annual distribution fees that may be paid by a mutual fund and impose a ceiling on the cumulative distribution fees paid. The Trust's Plan complies with those rules.
Management has contractually undertaken to forgo current payment of fees and/or reimburse the Fund's Class I and Class S shares for their operating expenses (including fees payable to Management but excluding interest, taxes, brokerage commissions, extraordinary expenses, and transaction costs) ("Operating Expenses") which exceed the expense limitation as detailed in the following table:
| | | Expense Limitation(1) | | Expiration | | Reimbursement from
Management for the
Year Ended
December 31, 2010 | |
| Class I | | | 1.50 | % | | 12/31/13 | | $ | -- | | |
| Class S | | | 1.25 | % | | 12/31/20 | | | 31,454 | | |
16
(1) Expense limitation per annum of the respective class' average daily net assets.
Each respective class has agreed to repay Management for fees and expenses foregone and/or its excess Operating Expenses previously reimbursed by Management, so long as its annual Operating Expenses during that period do not exceed its expense limitation, and the repayment is made within three years after the year in which Management issued the reimbursement or waived fees. During the year ended December 31, 2010, there was no repayment to Management under its contractual expense limitation. At December 31, 2010, the Fund's Class I shares had no contingent liability to Management under its contractual expense limitation. At December 31, 2010, the Fund's Class S shares contingent liabilities to Management under its contractual expense limitation were as follows:
| | | Expiring in: | | | |
| | | 2012 | | 2013 | | Total | |
| Class S | | $ | 32,214 | | | $ | 31,454 | | | $ | 63,668 | | |
Neuberger Berman LLC ("Neuberger") is retained by Management to furnish it with investment recommendations and research information without added cost to the Fund. Several individuals who are officers and/or trustees of the Trust are also employees of Neuberger and/or Management.
On May 4, 2009, NBSH Acquisition, LLC ("NBSH"), an entity organized by key members of senior management of Neuberger Berman Group LLC ("NBG") and its consolidated subsidiaries (NBG, and together with its consolidated subsidiaries "NB Group") acquired a majority interest in the business conducted by Management and Neuberger, as well as the fixed income and certain alternative asset management businesses of Lehman Brothers Holdings Inc.'s Investment Management Division (together with Management and Neuberger, the "Acquired Businesses") (the "Acquisition"). Prior to that date, Neuberger and the predecessor in interest of Management were indirect wholly owned subsidiaries of Lehman Brothers Holdings Inc. ("LBHI"). On September 15, 2008, LBHI filed a voluntary petition under Chapter 11 of the U.S. Bankruptcy Code, and on December 22, 2008, the bankruptcy court having jurisdiction over the LBHI matter approved the sale of the Acquired Businesses to NBSH (or its successor or assign).
Through NBSH, portfolio managers, NB Group's management team, and certain of its key employees and senior professionals now indirectly own 52% of the voting equity of NBG. LBHI and certain affiliates of LBHI own the remaining 48% of NBG's voting equity. The closing of the Acquisition resulted in an "assignment" of the Fund's Management Agreement and Sub-Advisory Agreement. Such an assignment, by law, automatically terminated those agreements. Accordingly, prior to the closing, the Board, including the Trustees who are not "interested persons" of the Fund's investment manager and its affiliates or the Fund, considered and approved a new Management Agreement and Sub-Advisory Agreement for the Fund. The new agreements, which are virtually identical to those previously in effect, were also approved by a vote of the Fund's shareholders.
These events did not have a material impact on the Fund or its operations. Management and Neuberger continue to operate in the ordinary course of business as the investment manager and sub-adviser of the Fund.
Other non-affiliated service provider: The Fund has an expense offset arrangement in connection with its custodian contract. For the year ended December 31, 2010, the impact of this arrangement was a reduction of expenses of $21.
Note C--Securities Transactions:
During the year ended December 31, 2010, there were purchase and sale transactions (excluding short-term securities) of $72,180,979 and $61,300,327, respectively.
During the year ended December 31, 2010, no brokerage commissions on securities transactions were paid to affiliated brokers.
17
Note D--Fund Share Transactions:
Share activity for the years ended December 31, 2010 and December 31, 2009 was as follows:
For the Year Ended December 31, 2010
| | | Shares Sold | | Shares Issued on
Reinvestment of
Dividends and
Distributions | | Shares
Redeemed | | Total | |
| Class I | | | 3,846,396 | | | | 64,401 | | | | (2,170,042 | ) | | | 1,740,755 | | |
| Class S | | | 785,229 | | | | 12,735 | | | | (1,400,742 | ) | | | (602,778 | ) | |
For the Year Ended December 31, 2009
| | | Shares Sold | | Shares Issued on
Reinvestment of
Dividends and
Distributions | | Shares
Redeemed | | Total | |
| Class I | | | 786,392 | | | | 205,898 | | | | (2,669,503 | ) | | | (1,677,213 | ) | |
| Class S | | | 5,312,175 | | | | 90,459 | | | | (14,020,598 | ) | | | (8,617,964 | ) | |
Note E--Line of Credit:
At December 31, 2010, the Fund was a participant in a single committed, unsecured $200,000,000 ($150,000,000 prior to September 17, 2010) line of credit with State Street, to be used only for temporary or emergency purposes. Other investment companies managed by Management also participate in this line of credit on the same terms. Interest is charged on borrowings under this line of credit at the higher of (a) the Federal Funds Rate plus 1.25% per annum or (b) the Overnight LIBOR Rate plus 1.25% per annum. A commitment fee of 0.125% (0.15% prior to September 17, 2010) per annum of the available line of credit is charged, of which each participating Fund has agreed to pay its pro rata share, based on the ratio of its individual net assets to the net assets of all participants at the time the fee is due and payable. The fee is paid quarterly in arrears. Because several mutual funds participate, there is no assurance that an individual Fund will have access to all or any part of the $200,000,000 ($150,000,000 prior to September 17, 2010) at any particular time. There were no loans outstanding pursuant to this line of credit at December 31, 2010. During the year ended December 31, 2010, the Fund did not utilize this line of credit.
Note F--Investments in Affiliates:
| Name of Issuer | |
Balance of
Shares
Held
December 31,
2009 | |
Gross
Purchases
and
Additions | |
Gross
Sales
and
Reductions | |
Balance of
Shares
Held
December 31,
2010 | |
Value
December 31,
2010 | | Income from
Investments in
Affiliated
Issuers
Included in
Total Income | |
Neuberger Berman Securities
Lending Quality Fund, LLC* | | | 6,542,514 | | | | 17,157,452 | | | | 23,699,966 | | | | -- | | | $ | -- | | | $ | 2,684 | | |
* Quality Fund, a fund that was managed by NBFI, an affiliate of Management, was used to invest cash the Fund received as collateral for securities loaned as approved by the Board. Because all shares of Quality Fund were held by funds in the related investment management complex, Quality Fund may have been considered an affiliate of the Fund.
18
Financial Highlights
Regency Portfolio
The following tables include selected data for a share outstanding throughout each year and other performance information derived from the Financial Statements.
| Class I | |
| | | Year Ended December 31, | |
| | | 2010 | | 2009 | | 2008 | | 2007 | | 2006 | |
| Net Asset Value, Beginning of Year | | $ | 12.26 | | | $ | 8.60 | | | $ | 16.23 | | | $ | 16.21 | | | $ | 15.50 | | |
| Income From Investment Operations: | |
| Net Investment Income (Loss)t | | | .07 | | | | .07 | | | | .10 | | | | .17 | | | | .13 | | |
Net Gains or Losses on Securities
(both realized and unrealized) | | | 3.13 | | | | 3.93 | | | | (7.53 | ) | | | .39 | | | | 1.55 | | |
| Total From Investment Operations | | | 3.20 | | | | 4.00 | | | | (7.43 | ) | | | .56 | | | | 1.68 | | |
| Less Distributions From: | |
| Net Investment Income | | | (.10 | ) | | | (.18 | ) | | | (.17 | ) | | | (.08 | ) | | | (.07 | ) | |
| Net Capital Gains | | | - | | | | (.16 | ) | | | (.03 | ) | | | (.46 | ) | | | (.90 | ) | |
| Total Distributions | | | (.10 | ) | | | (.34 | ) | | | (.20 | ) | | | (.54 | ) | | | (.97 | ) | |
| Net Asset Value, End of Year | | $ | 15.36 | | | $ | 12.26 | | | $ | 8.60 | | | $ | 16.23 | | | $ | 16.21 | | |
| Total Returntt | | | 26.18 | % | | | 46.56 | % | | | (45.82 | )% | | | 3.30 | % | | | 11.17 | % | |
| Ratios/Supplemental Data | |
| Net Assets, End of Year (in millions) | | $ | 134.6 | | | $ | 86.1 | | | $ | 74.8 | | | $ | 217.3 | | | $ | 242.0 | | |
| Ratio of Gross Expenses to Average Net Assets# | | | 1.06 | % | | | 1.06 | % | | | .97 | % | | | .93 | % | | | .96 | % | |
| Ratio of Net Expenses to Average Net Assets | | | 1.06 | % | | | 1.06 | %S | | | .96 | %S | | | .92 | %S | | | .95 | %S | |
Ratio of Net Investment Income (Loss) to Average
Net Assets | | | .54 | % | | | .67 | % | | | .76 | % | | | 1.03 | % | | | .80 | % | |
| Portfolio Turnover Rate | | | 39 | % | | | 51 | % | | | 66 | % | | | 58 | % | | | 53 | % | |
See Notes to Financial Highlights
19
Financial Highlights (cont'd)
| Class S | |
| | | Year Ended December 31, | |
| | | 2010 | | 2009 | | 2008 | | 2007 | | 2006 | |
| Net Asset Value, Beginning of Year | | $ | 13.21 | | | $ | 9.22 | | | $ | 17.37 | | | $ | 17.35 | | | $ | 16.56 | | |
| Income From Investment Operations: | |
| Net Investment Income (Loss)t | | | .04 | | | | .06 | | | | .08 | | | | .14 | | | | .10 | | |
Net Gains or Losses on Securities
(both realized and unrealized) | | | 3.39 | | | | 4.20 | | | | (8.06 | ) | | | .41 | | | | 1.66 | | |
| Total From Investment Operations | | | 3.43 | | | | 4.26 | | | | (7.98 | ) | | | .55 | | | | 1.76 | | |
| Less Distributions From: | |
| Net Investment Income | | | (.05 | ) | | | (.11 | ) | | | (.14 | ) | | | (.07 | ) | | | (.07 | ) | |
| Net Capital Gains | | | - | | | | (.16 | ) | | | (.03 | ) | | | (.46 | ) | | | (.90 | ) | |
| Total Distributions | | | (.05 | ) | | | (.27 | ) | | | (.17 | ) | | | (.53 | ) | | | (.97 | ) | |
| Net Asset Value, End of Year | | $ | 16.59 | | | $ | 13.21 | | | $ | 9.22 | | | $ | 17.37 | | | $ | 17.35 | | |
| Total Returntt | | | 25.99 | % | | | 46.16 | % | | | (45.95 | )% | | | 3.05 | % | | | 10.94 | % | |
| Ratios/Supplemental Data | |
| Net Assets, End of Year (in millions) | | $ | 62.5 | | | $ | 57.8 | | | $ | 119.7 | | | $ | 151.3 | | | $ | 55.7 | | |
| Ratio of Gross Expenses to Average Net Assets# | | | 1.25 | % | | | 1.25 | % | | | 1.23 | % | | | 1.19 | % | | | 1.23 | % | |
| Ratio of Net Expenses to Average Net AssetsS | | | 1.25 | % | | | 1.25 | % | | | 1.22 | % | | | 1.18 | % | | | 1.23 | % | |
Ratio of Net Investment Income (Loss) to Average
Net Assets | | | .30 | % | | | .61 | % | | | .58 | % | | | .80 | % | | | .56 | % | |
| Portfolio Turnover Rate | | | 39 | % | | | 51 | % | | | 66 | % | | | 58 | % | | | 53 | % | |
See Notes to Financial Highlights
20
Notes to Financial Highlights Regency Portfolio
tt Total return based on per share NAV reflects the effects of changes in NAV on the performance of the Fund during each fiscal period and assumes income dividends and other distributions, if any, were reinvested. Results represent past performance and do not guarantee future results. Current returns may be lower or higher than the performance data quoted. Investment returns and principal may fluctuate and shares when redeemed may be worth more or less than original cost. Total return would have been lower if Management had not reimbursed and/or waived certain expenses. Total return would have been higher if Management had not recouped previously reimbursed expenses. The total return information shown does not reflect charges and other expenses that apply to the separate account or the related insurance policies, and the inclusion of these charges and other expenses would reduce the total return for all fiscal periods shown.
# The Fund is required to calculate an expense ratio without taking into consideration any expense reductions related to expense offset arrangements.
t Calculated based on the average number of shares outstanding during each fiscal period.
S After reimbursement of expenses previously paid by Management. Had Management not been reimbursed, the ratios of net expenses to average daily net assets would have been:
| | | Year Ended
December 31, 2006 | |
| Regency Portfolio Class S | | | 1.22 | % | |
After reimbursement of expenses and/or waiver of a portion of the investment management fee by Management. Had Management not undertaken such actions, the annualized ratios of net expenses to average daily net assets would have been:
| | | Year Ended December 31, | |
| | | 2010 | | 2009 | | 2008 | | 2007 | | 2006 | |
| Regency Portfolio Class I | | | - | | | | 1.06 | % | | | .96 | % | | | .93 | % | | | .95 | % | |
| Regency Portfolio Class S | | | 1.30 | % | | | 1.29 | % | | | 1.22 | % | | | 1.18 | % | | | 1.23 | % | |
21
Report of Independent Registered Public Accounting Firm
To the Board of Trustees of
Neuberger Berman Advisers Management Trust and
Shareholders of Regency Portfolio
We have audited the accompanying statement of assets and liabilities, including the schedule of investments, of Regency Portfolio, one of the series constituting Neuberger Berman Advisers Management Trust (the "Trust"), as of December 31, 2010, and the related statement of operations for the year then ended, the statements of changes in net assets for each of the two years in the period then ended, and the financial highlights for each of the five years in the period then ended. These financial statements and financial highlights are the responsibility of the Trust's management. Our responsibility is to express an opinion on these financial statements and financial highlights based on our audits.
We conducted our audits in accordance with the standards of the Public Company Accounting Oversight Board (United States). Those standards require that we plan and perform the audit to obtain reasonable assurance about whether the financial statements and financial highlights are free of material misstatement. We were not engaged to perform an audit of the Trust's internal control over financial reporting. Our audits included consideration of internal control over financial reporting as a basis for designing audit procedures that are appropriate in the circumstances, but not for the purpose of expressing an opinion on the effectiveness of the Trust's internal control over financial reporting. Accordingly, we express no such opinion. An audit also includes examining, on a test basis, evidence supporting the amounts and disclosures in the financial statements and financial highlights, assessing the accounting principles used and significant estimates made by management, and evaluating the overall financial statement presentation. Our procedures included confirmation of securities owned as of December 31, 2010 by correspondence with the custodian and brokers. We believe that our audits provide a reasonable basis for our opinion.
In our opinion, the financial statements and financial highlights referred to above present fairly, in all material respects, the financial position of Regency Portfolio, a series of Neuberger Berman Advisers Management Trust, at December 31, 2010, the results of its operations for the year then ended, the changes in its net assets for each of the two years in the period then ended, and the financial highlights for each of the five years in the period then ended, in conformity with U.S. generally accepted accounting principles.

Boston, Massachusetts
February 10, 2011
22
Trustee and Officer Information
The following tables set forth information concerning the trustees and officers of the Trust. All persons named as trustees and officers also serve in similar capacities for other funds administered or managed by Management, Neuberger and NBFI. The Statement of Additional Information includes additional information about trustees and is available upon request, without charge, by calling (800) 877-9700.
Information about the Board of Trustees
Name, (Year of Birth),
and Address(1) | | Position and
Length of
Time Served(2) | | Principal Occupation(s)(3) | | Number of
Funds in Fund
Complex
Overseen by
Trustee | | Other Directorships
Held Outside Fund
Complex by Trustee | |
| Independent Trustees | |
|
| John Cannon (1930) | | Trustee since 2000 | | Consultant; formerly, Chairman, CDC Investment Advisers (registered investment adviser), 1993 to January 1999; formerly, President and Chief Executive Officer, AMA Investment Advisors, an affiliate of the American Medical Association. | | | 43 | | | Formerly, Independent Trustee or Director of three series of Oppenheimer Funds: Oppenheimer Limited Term New York Municipal Fund, Rochester Fund Municipals, and Oppenheimer Convertible Securities Fund, 1992 to 2009. | |
|
| Faith Colish (1935) | | Trustee since 1982 | | Counsel, Carter Ledyard & Milburn LLP (law firm) since October 2002; formerly, Attorney-at-Law and President, Faith Colish, A Professional Corporation, 1980 to 2002. | | | 43 | | | Formerly, Director, 1997 to 2003, and Advisory Director, 2003 to 2006; ABA Retirement Funds (formerly, American Bar Retirement Association) (not-for-profit membership corporation). | |
|
23
Name, (Year of Birth),
and Address(1) | | Position and
Length of
Time Served(2) | | Principal Occupation(s)(3) | | Number of
Funds in Fund
Complex
Overseen by
Trustee | | Other Directorships
Held Outside Fund
Complex by Trustee | |
| Martha C. Goss (1949) | | Trustee since 2007 | | President, Woodhill Enterprises Inc./Chase Hollow Associates LLC (personal investment vehicle), since 2006; Chief Operating and Financial Officer, Hopewell Holdings LLC/Amwell Holdings, LLC (a holding company for a healthcare reinsurance company start-up), since 2003; formerly, Consultant, Resources Connection (temporary staffing), 2002 to 2006. | | | 43 | | | Director, Ocwen Financial Corporation (mortgage servicing), since 2005; Director, American Water (water utility), since 2003; Director, Channel Reinsurance (financial guaranty reinsurance), since 2006; Director, Allianz Life of New York (insurance), since 2005; Director, Financial Women's Association of New York (not-for-profit association), since 2003; Trustee Emerita, Brown University, since 1998; formerly, Advisory Board Member, Attensity (software developer), 2005 to 2007; formerly, Director, Bank Leumi (commercial bank), 2005 to 2007; formerly, Director, Claire's Stores, Inc. (retailer), 2005 to 2007. | |
|
| C. Anne Harvey (1937) | | Trustee since 1998 | | President, C.A. Harvey Associates, since October 2001; formerly, Director, AARP, 1978 to December 2001. | | | 43 | | | Formerly, President, Board of Associates to The National Rehabilitation Hospital's Board of Directors, 2001 to 2002; formerly, Member, Individual Investors Advisory Committee to the New York Stock Exchange Board of Directors, 1998 to 2002. | |
|
24
Name, (Year of Birth),
and Address(1) | | Position and
Length of
Time Served(2) | | Principal Occupation(s)(3) | | Number of
Funds in Fund
Complex
Overseen by
Trustee | | Other Directorships
Held Outside Fund
Complex by Trustee | |
| Robert A. Kavesh (1927) | | Trustee since 2000 | | Retired; Marcus Nadler Professor Emeritus of Finance and Economics, New York University Stern School of Business; formerly, Executive Secretary-Treasurer, American Finance Association, 1961 to 1979. | | | 43 | | | Formerly, Director, The Caring Community (not-for-profit), 1997 to 2006; formerly, Director, DEL Laboratories, Inc. (cosmetics and pharmaceuticals), 1978 to 2004; formerly, Director, Apple Bank for Savings, 1979 to 1990; formerly, Director, Western Pacific Industries, Inc., (public company), 1972 to 1986. | |
|
| Michael M. Knetter (1960) | | Trustee since 2007 | | President and Chief Executive Officer, University of Wisconsin Foundation, October 2010 to Present; formerly, Dean, School of Business, University of Wisconsin - Madison; formerly, Professor of International Economics and Associate Dean, Amos Tuck School of Business - Dartmouth College, 1998 to 2002. | | | 43 | | | Director, American Family Insurance (a mutual company, not publicly traded), since March 2009; Trustee, Northwestern Mutual Series Fund, Inc., since February 2007; Director, Wausau Paper, since 2005; formerly, Director, Great Wolf Resorts, 2004 to 2009. | |
|
| Howard A. Mileaf (1937) | | Trustee since 1999 | | Retired; formerly, Vice President and General Counsel, WHX Corporation (holding company), 1993 to 2001. | | | 43 | | | Formerly, Director, Webfinancial Corporation (holding company), 2002 to 2008; formerly, Director, WHX Corporation (holding company), 2002 to 2005; formerly, Director, State Theatre of New Jersey (not-for-profit theatre), 2000 to 2005. | |
|
25
Name, (Year of Birth),
and Address(1) | | Position and
Length of
Time Served(2) | | Principal Occupation(s)(3) | | Number of
Funds in Fund
Complex
Overseen by
Trustee | | Other Directorships
Held Outside Fund
Complex by Trustee | |
| George W. Morriss (1947) | | Trustee since 2007 | | Retired; formerly, Executive Vice President and Chief Financial Officer, People's Bank, Connecticut (a financial services company), 1991 to 2001. | | | 43 | | | Manager, Old Mutual Funds of Hedge Funds fund complex (consisting of six funds), since 2006 for four funds and since 2007 for two funds; formerly, Member NASDAQ Issuers' Affairs Committee, 1995 to 2003. | |
|
| Edward I. O'Brien (1928) | | Trustee since 2000 | | Retired; formerly, Member, Investment Policy Committee, Edward Jones, 1993 to 2001; President, Securities Industry Association ("SIA") (securities industry's representative in government relations and regulatory matters at the federal and state levels), 1974 to 1992; Adviser to SIA, November 1992 to November 1993. | | | 43 | | | Formerly, Director, Legg Mason, Inc. (financial services holding company), 1993 to July 2008; formerly, Director, Boston Financial Group (real estate and tax shelters), 1993 to 1999. | |
|
| Cornelius T. Ryan (1931) | | Trustee since 2000 | | General Partner and Adviser, TD2, TD3, and TOF1 Healthcare Venture Capital Partnerships; Founding General Partner, Oxford Partners and Oxford Bioscience Partners (venture capital investing) and President, Oxford Venture Corporation, since 1981. | | | 43 | | | Trustee, Norwalk Hospital Foundation, since 2000; Director, Supply Pro (privately held company), since 2008; formerly, Trustee, Norwalk Hospital, 1995 to 2004; formerly, President and Director, Randolph Computer Corp., 1966 to 1984; formerly, Director of numerous privately held portfolio companies of Oxford Partners and Oxford Bioscience Partners, 1981 to 2005. | |
|
26
Name, (Year of Birth),
and Address(1) | | Position and
Length of
Time Served(2) | | Principal Occupation(s)(3) | | Number of
Funds in Fund
Complex
Overseen by
Trustee | | Other Directorships
Held Outside Fund
Complex by Trustee | |
| Tom D. Seip (1950) | | Trustee since 2000; Chairman of the Board since 2008; Lead Independent Trustee from 2006 to 2008 | | General Partner, Seip Investments LP (a private investment partnership); formerly, President and CEO, Westaff, Inc. (temporary staffing), May 2001 to January 2002; formerly, Senior Executive, The Charles Schwab Corporation, 1983 to 1998, including Chief Executive Officer, Charles Schwab Investment Management, Inc.; Trustee, Schwab Family of Funds and Schwab Investments, 1997 to 1998; and Executive Vice President-Retail Brokerage, Charles Schwab & Co., Inc., 1994 to 1997. | | | 43 | | | Director, H&R Block, Inc. (financial services company), since May 2001; Chairman, Compensation Committee, H&R Block, Inc., since 2006; formerly, Director, Forward Management, Inc. (asset management company), 1999 to 2006. | |
|
| Candace L. Straight (1947) | | Trustee since 1999 | | Private investor and consultant specializing in the insurance industry; formerly, Advisory Director, Securitas Capital LLC (a global private equity investment firm dedicated to making investments in the insurance sector), 1998 to December 2003. | | | 43 | | | Director, Montpelier Re Holdings Ltd. (reinsurance company), since 2006; formerly, Director, National Atlantic Holdings Corporation (property and casualty insurance company), 2004 to 2008; formerly, Director, The Proformance Insurance Company (property and casualty insurance company), 2004 to 2008; formerly, Director, Providence Washington Insurance Company (property and casualty insurance company), 1998 to 2006; formerly, Director, Summit Global Partners (insurance brokerage firm), 2000 to 2005. | |
|
| Peter P. Trapp (1944) | | Trustee since 1984 | | Retired; formerly, Regional Manager for Mid-Southern Region, Ford Motor Credit Company, September 1997 to 2007; formerly, President, Ford Life Insurance Company, April 1995 to August 1997. | | | 43 | | | None. | |
|
27
Name, (Year of Birth),
and Address(1) | | Position and
Length of
Time Served(2) | | Principal Occupation(s)(3) | | Number of
Funds in Fund
Complex
Overseen by
Trustee | | Other Directorships
Held Outside Fund
Complex by Trustee | |
| Trustees who are "Interested Persons" | |
|
| Joseph V. Amato* (1962) | | Trustee since 2009 | | President and Director, Neuberger Berman Group LLC, since 2009; President and Chief Executive Officer, Neuberger and Neuberger Berman Holdings LLC (including its predecessor, Neuberger Berman Inc.), since 2007; Chief Investment Officer, Neuberger, since 2009; Chief Investment Officer (Equities) and Managing Director, Management, since 2009; Managing Director, NBFI, since 2007; Board member of NBFI since 2006; formerly, Global Head of Asset Management of LBHI's Investment Management Division, 2006 to 2009; formerly, member of LBHI's Investment Management Division's Executive Management Committee, 2006 to 2009; formerly, Managing Director, Lehman Brothers Inc. ("LBI"), 2006 to 2008; formerly, Chief Recruiting and Development Officer, LBI, 2005 to 2006; formerly, Global Head of LBI's Equity Sales and a Member of its Equities Division Executive Committee, 2003 to 2005. | | | 43 | | | Member of Board of Advisors, McDonough School of Business, Georgetown University, since 2001; Member of New York City Board of Advisors, Teach for America, since 2005; Trustee, Montclair Kimberley Academy (private school), since 2007. | |
|
| Robert Conti* (1956) | | Chief Executive Officer, President and Trustee since 2008; prior thereto, Executive Vice President in 2008 and Vice President, 2000 to 2008 | | Managing Director, Neuberger, since 2007; formerly, Senior Vice President, Neuberger, 2003 to 2006; formerly, Vice President, Neuberger, 1999 to 2003; President and Chief Executive Officer, Management, since 2008; formerly, Senior Vice President, Management, 2000 to 2008. | | | 43 | | | Chairman of the Board, Staten Island Mental Health Society since 2008. | |
|
28
Name, (Year of Birth),
and Address(1) | | Position and
Length of
Time Served(2) | | Principal Occupation(s)(3) | | Number of
Funds in Fund
Complex
Overseen by
Trustee | | Other Directorships
Held Outside Fund
Complex by Trustee | |
| Jack L. Rivkin* (1940) | | Trustee since 2002; President, 2002 to 2008 | | Formerly, Executive Vice President and Chief Investment Officer, Neuberger Berman Holdings LLC (holding company), 2002 to August 2008 and 2003 to August 2008, respectively; formerly, Managing Director and Chief Investment Officer, Neuberger, December 2005 to August 2008 and 2003 to August 2008, respectively; formerly, Executive Vice President, Neuberger, December 2002 to 2005; formerly, Director and Chairman, Management, December 2002 to August 2008; formerly, Executive Vice President, Citigroup Investments, Inc., September 1995 to February 2002; formerly, Executive Vice President, Citigroup Inc., September 1995 to February 2002. | | | 43 | | | Director, Idealab (private company), since 2009; Director, Distributed World Power (private company), since 2009; Director, Dale Carnegie and Associates, Inc. (private company), since 1999; Director, Solbright, Inc. (private company), since 1998; Director, SA Agricultural Fund, since 2009; Chairman and Director, Essential Brands (consumer products) since 2008; formerly, Director, New York Society of Security Analysts, 2006 to 2008. | |
|
(1) The business address of each listed person is 605 Third Avenue, New York, New York 10158.
(2) Pursuant to the Trust's Trust Instrument, each of these Trustees shall hold office for life or until his or her successor is elected or the Trust terminates; except that (a) any Trustee may resign by delivering a written resignation; (b) any Trustee may be removed with or without cause at any time by a written instrument signed by at least two-thirds of the other Trustees; (c) any Trustee who requests to be retired, or who has become unable to serve, may be retired by a written instrument signed by a majority of the other Trustees; and (d) any Trustee may be removed at any shareholder meeting by a vote of at least two-thirds of the outstanding shares.
(3) Except as otherwise indicated, each individual has held the positions shown for at least the last five years.
* Indicates a Trustee who is an "interested person" within the meaning of the 1940 Act. Mr. Amato and Mr. Conti are interested persons of the Trust by virtue of the fact that each is an officer of Management, Neuberger and/or their affiliates. Mr. Rivkin may be deemed an interested person of the Trust by virtue of the fact that, until August 2008, he was a director of Management and an officer of Neuberger.
29
Information about the Officers of the Trust
Name, (Year of Birth),
and Address(1) | | Position and
Length of Time
Served(2) | | Principal Occupation(s)(3) | |
| Andrew B. Allard (1961) | | Anti-Money Laundering Compliance Officer since 2002 | | Senior Vice President, Neuberger, since 2006; Deputy General Counsel, Neuberger, since 2004; formerly, Vice President, Neuberger, 2000 to 2005; Anti-Money Laundering Compliance Officer, nine registered investment companies for which Management acts as investment manager and administrator (six since 2002, one since 2003, one since 2005 and one since 2006). | |
|
| Claudia A. Brandon (1956) | | Executive Vice President since 2008 and Secretary since 1985 | | Senior Vice President, Neuberger, since 2007 and Employee since 1999; Senior Vice President, Management, since 2008 and Assistant Secretary since 2004; formerly, Vice President, Neuberger, 2002 to 2006; formerly, Vice President-Mutual Fund Board Relations, Management, 2000 to 2008; Executive Vice President, nine registered investment companies for which Management acts as investment manager and administrator (nine since 2008); Secretary, nine registered investment companies for which Management acts as investment manager and administrator (three since 1985, three since 2002, one since 2003, one since 2005 and one since 2006). | |
|
| Maxine L. Gerson (1950) | | Executive Vice President since 2008 and Chief Legal Officer since 2005 (only for purposes of sections 307 and 406 of the Sarbanes-Oxley Act of 2002) | | Managing Director, Neuberger, since 2009, and Deputy General Counsel and Assistant Secretary Neuberger since 2001; Managing Director, Management, since 2009, and Secretary and General Counsel, Management, since 2004; formerly, Senior Vice President, Neuberger, 2002 to 2009; formerly, Senior Vice President, Management, 2006 to 2009; Executive Vice President, nine registered investment companies for which Management acts as investment manager and administrator (nine since 2008); Chief Legal Officer (only for purposes of sections 307 and 406 of the Sarbanes-Oxley Act of 2002), nine registered investment companies for which Management acts as investment manager and administrator (eight since 2005 and one since 2006). | |
|
| Sheila R. James (1965) | | Assistant Secretary since 2002 | | Vice President, Neuberger, since 2008 and Employee since 1999; formerly, Assistant Vice President, Neuberger, 2007; Assistant Secretary, nine registered investment companies for which Management acts as investment manager and administrator (six since 2002, one since 2003, one since 2005 and one since 2006). | |
|
| Brian Kerrane (1969) | | Vice President since 2008 | | Senior Vice President, Neuberger, since 2006; formerly, Vice President, Neuberger, 2002 to 2006; Vice President, Management, since 2008 and Employee since 1991; Vice President, nine registered investment companies for which Management acts as investment manager and administrator (nine since 2008). | |
|
| Kevin Lyons (1955) | | Assistant Secretary since 2003 | | Assistant Vice President, Neuberger, since 2008 and Employee since 1999; Assistant Secretary, nine registered investment companies for which Management acts as investment manager and administrator (seven since 2003, one since 2005 and one since 2006). | |
|
30
Name, (Year of Birth),
and Address(1) | | Position and
Length of Time
Served(2) | | Principal Occupation(s)(3) | |
| Owen F. McEntee, Jr. (1961) | | Vice President since 2008 | | Vice President, Neuberger, since 2006; Employee, Management, since 1992; Vice President, nine registered investment companies for which Management acts as investment manager and administrator (nine since 2008). | |
|
| John M. McGovern (1970) | | Treasurer and Principal Financial and Accounting Officer since 2005 | | Senior Vice President, Neuberger, since 2007; formerly, Vice President, Neuberger, 2004 to 2006; Employee, Management, since 1993; Treasurer and Principal Financial and Accounting Officer, nine registered investment companies for which Management acts as investment manager and administrator (eight since 2005 and one since 2006); formerly, Assistant Treasurer, eight registered investment companies for which Management acts as investment manager and administrator, 2002 to 2005. | |
|
| Andrew Provencher (1965) | | Vice President since 2008 | | Managing Director, Management, since 2008; Managing Director, Neuberger, since 2005; formerly, Senior Vice President, Neuberger, 2003 to 2005; Vice President, nine registered investment companies for which Management acts as investment manager and administrator (nine since 2008). | |
|
| Frank Rosato (1971) | | Assistant Treasurer since 2005 | | Vice President, Neuberger, since 2006; Employee, Management, since 1995; Assistant Treasurer, nine registered investment companies for which Management acts as investment manager and administrator (eight since 2005 and one since 2006). | |
|
| Neil S. Siegel (1967) | | Vice President since 2008 | | Managing Director, Management, since 2008; Managing Director, Neuberger, since 2006; formerly, Senior Vice President, Neuberger, 2004 to 2006; Vice President, nine registered investment companies for which Management acts as investment manager and administrator (nine since 2008). | |
|
| Chamaine Williams (1971) | | Chief Compliance Officer since 2005 | | Senior Vice President, Neuberger, since 2007; Chief Compliance Officer, Management, since 2006; Chief Compliance Officer, nine registered investment companies for which Management acts as investment manager and administrator (eight since 2005 and one since 2006); formerly, Senior Vice President, LBI, 2007 to 2008; formerly, Vice President, LBI, 2003 to 2006; formerly, Chief Compliance Officer, Lehman Brothers Asset Management Inc., 2003 to 2007; formerly, Chief Compliance Officer, Lehman Brothers Alternative Investment Management LLC, 2003 to 2007. | |
|
(1) The business address of each listed person is 605 Third Avenue, New York, New York 10158.
(2) Pursuant to the By-Laws of the Trust, each officer elected by the Trustees shall hold office until his or her successor shall have been elected and qualified or until his or her earlier death, inability to serve, or resignation. Officers serve at the pleasure of the Trustees and may be removed at any time with or without cause.
(3) Except as otherwise indicated, each individual has held the positions shown for at least the last five years.
31
Proxy Voting Policies and Procedures
A description of the policies and procedures that the Trust uses to determine how to vote proxies relating to portfolio securities is available, without charge, by calling 1-800-877-9700 (toll-free) and on the website of the Securities and Exchange Commission, at www.sec.gov. Information regarding how the Trust voted proxies relating to portfolio securities during the most recent 12-month period ended June 30 is also available, without charge, by calling 1-800-877-9700 (toll-free), on the website of the Securities and Exchange Commission at www.sec.gov, and on Management's website at www.nb.com.
Quarterly Portfolio Schedule
The Trust files a complete schedule of portfolio holdings for the Fund with the Securities and Exchange Commission for the first and third quarters of each fiscal year on Form N-Q. The Trust's Forms N-Q are available on the Securities and Exchange Commission's website at www.sec.gov and may be reviewed and copied at the Securities and Exchange Commission's Public Reference Room in Washington, DC. Information on the operation of the Public Reference Room may be obtained by calling 1-800-SEC-0330. The information on Form N-Q is available upon request, without charge, by calling 1-800-877-9700 (toll free).
Notice to Shareholders (Unaudited)
100.00% of the dividends distributed during the fiscal year ended December 31, 2010 qualifies for the dividends received deduction for corporate shareholders.
Board Consideration of the Management and Sub-Advisory Agreements
At a meeting held on October 14, 2010, the Board, including the Trustees who are not "interested persons" of Management (including its affiliates) or Neuberger Berman Advisers Management Trust ("Independent Fund Trustees"), approved the continuance of the Management and Sub-Advisory Agreements ("Agreements") for the Fund.
In evaluating the Agreements, the Board, including the Independent Fund Trustees, reviewed materials furnished by Management and Neuberger in response to questions submitted by counsel for the Independent Fund Trustees, and met with senior representatives of Management and Neuberger regarding their personnel and operations. The Independent Fund Trustees were advised by counsel that is experienced in 1940 Act matters and that is independent of Management and Neuberger. The Independent Fund Trustees received a memorandum from independent counsel discussing the legal standards for their consideration of the proposed continuance of the Agreements. They met with such counsel separately from representatives of Management to discuss the annual contract review. The annual contract review extends over two regular meetings of the Board to ensure that Management and Neuberger have time to respond to any questions the Independent Fund Trustees may have on their initial review of the report and that the Independent Fund Trustees have time to consider those responses. In addition, during this process, the Board held a separate meeting devoted primarily to reviewing and discussing Fund performance.
The Board considered the following factors, among others, in connection with its approval of the continuance of the Agreements: (1) the nature, extent, and quality of the services provided by Management and Neuberger; (2) the performance of the Fund compared to a relevant market index and a peer group of investment companies; (3) the costs of the services provided and profits or losses realized by Management and its affiliates from their relationship with the Fund; (4) the extent to which economies of scale might be realized as the Fund grows; and (5) whether fee levels reflect any such potential economies of scale for the benefit of investors in the Fund. In their deliberations, the Board members did not identify any particular information that was all-important or controlling, and each Trustee may have attributed different weights to the various factors.
32
The Board evaluated the terms of the Agreements, the overall fairness of the Agreements to the Fund and whether the Agreements were in the best interests of the Fund and its shareholders.
With respect to the nature, extent and quality of the services provided, the Board considered the performance of the Fund and the experience and staffing of the portfolio management and investment research personnel of Management and Neuberger who perform services for the Fund. The Board noted that Management also provides certain administrative services, including fund accounting and compliance oversight. The Board also considered Management's and Neuberger's policies and practices regarding brokerage and the quality of brokerage execution obtained by Management. The Board's Portfolio Transactions and Pricing Committee from time to time reviewed the quality of the execution services that Management and Neuberger had provided, and periodically reviews studies by an independent firm engaged to review and evaluate the quality of brokerage execution received by the Fund. The Board also reviewed whether Management and Neuberger used brokers to execute Fund transactions that provide research and other services to Management and Neuberger, and the types of benefits potentially derived from such services by Management, Neuberger, the Fund and other clients of Management and Neuberger. In addition, the Board noted the positive compliance history of Management and Neuberger, as each firm has been free of significant reported compliance problems.
The Board considered the performance of the Fund relative to its benchmark and a peer group of investment companies dedicated to insurance products pursuing broadly similar strategies. The Board also considered performance in relation to certain measures of the degree of investment risk undertaken by the portfolio manager.
With respect to the overall fairness of the Agreements, the Board considered the fee structure for the Fund under the Agreements as compared to a peer group of comparable funds dedicated to insurance products and any fall-out benefits likely to accrue to Management or Neuberger or their affiliates from their relationship with the Fund. The Board also considered the profitability of Management and its affiliates from their association with the Fund.
The Board reviewed a comparison of the Fund's management fee and overall expense ratio to a peer group of broadly comparable funds dedicated to insurance products. The Board considered the mean and median of the management fees and expense ratios of the peer group. The Board noted that the Fund's management fee was higher than the peer group mean and median. The Board considered whether specific portfolio management or administration needs contributed to the management fee. With regard to the sub-advisory fee paid to Neuberger, the Board noted that this fee is "at cost." In addition, the Board considered the contractual limit on Fund expenses undertaken by Management.
The Board considered whether there were other funds that were advised or sub-advised by Management or its affiliates or separate accounts managed by Management or its affiliates with similar investment objectives, policies and strategies to the Fund. The Board compared the fees charged to the Fund to the fees charged to an advised fund, a sub-advised fund and a separate account, each managed in a similar style to the Fund. The Board considered the appropriateness and reasonableness of any differences between the fees charged to the Fund and the other funds and account and determined that the differences in fees were consistent with the management and other services provided.
The Board also evaluated any apparent or anticipated economies of scale in relation to the services Management provides to the Fund. The Board considered whether the Fund's fee structure provides for a reduction of payments resulting from the use of breakpoints and whether those breakpoints are set at appropriate asset levels.
The Board also considered changes in management, staffing, resources and operations accompanying the separation of the Neuberger Berman entities from the LBHI bankruptcy estate.
In concluding that the benefits accruing to Management and its affiliates by virtue of their relationship to the Fund were reasonable in comparison with the costs of providing the investment advisory services and the benefits accruing to the Fund, the Board reviewed specific data as to Management's profit on the Fund for a recent period and the trend in profit or loss over recent years. The Board also carefully examined Management's cost allocation methodology. The Board recognized that Management should be entitled to earn a reasonable level of profits for services it provides to the Fund and, based on its review, concluded that Management's level of profitability was not excessive.
33
Conclusions
In approving the Agreements, the Board concluded that the terms of each Agreement are fair and reasonable and that approval of the Agreements is in the best interests of the Fund and its shareholders. In reaching this determination, the Board considered that Management and Neuberger could be expected to provide a high level of service to the Fund; that the performance of the Fund was satisfactory over time; that the Fund's fee structure appeared to the Board to be reasonable given the nature and quality of services provided; and that the benefits accruing to Management and its affiliates by virtue of their relationship to the Fund were reasonable in comparison with the benefits accruing to the Fund.
34

Neuberger Berman
Advisers Management Trust
Short Duration Bond Portfolio
I Class Shares
Annual Report
December 31, 2010
Short Duration Bond Portfolio Managers' Commentary
The Neuberger Berman Advisers Management Trust (AMT) Short Duration Bond Portfolio posted a solid absolute return for full-year 2010 and outperformed its benchmark, the Barclays Capital 1-3 Year U.S. Government/Credit Index, as well as its previous benchmark, the BofA Merrill Lynch 1-3 Year Treasury Index.*
To a great extent, risk appetite was robust during the reporting period as investors were drawn to investments that offered relatively high yields in the low interest rate environment. However, there were several occasions during the year when risk aversion increased. Two such instances took place in late April and May, and again in November, when concerns regarding the European sovereign debt crisis escalated. Risk aversion was also elevated in August, as moderating economic data led to fears of a double-dip recession and investors flocked to the perceived safety of U.S. Treasuries. However, these proved to be only temporary setbacks and risk aversion was quickly replaced by continued strong demand for non-Treasury fixed income securities. Also supporting non-Treasuries were strengthening corporate balance sheets and better-than-expected corporate profits, continued low interest rates, benign inflation and indications that the Federal Reserve would introduce another round of quantitative easing (QE2) to support the economy. Against this backdrop, non-Treasuries generally outperformed equal-duration Treasuries during the reporting period.
The Portfolio was well positioned for an environment that favored non-Treasuries. In particular, the Portfolio's commercial mortgage-backed securities (CMBS), non-agency mortgage-backed securities, investment grade corporate bonds and asset-backed securities enhanced results as their spreads (the difference in yield between Treasuries and other bond sectors) significantly narrowed during the 12-month reporting period. Within the corporate sector, the Portfolio's financial bonds produced the best results.
Detracting somewhat from results was the Portfolio's defensive duration positioning. When the reporting period began, the Portfolio's duration was marginally shorter than that of its benchmark. We adjusted duration to an even shorter degree in May as interest rates fell sharply, given that we did not believe they would move substantially lower. However, this positioning was not rewarded as short-term rates fell to historically low levels in October given expectations for QE2. While the Portfolio's short duration was beneficial during the last two months of the year when interest rates moved higher, overall it was a negative for performance as rates declined during the 12-month period as a whole. From time to time during the reporting period, we used financial futures contracts (for economic hedging purposes) to manage the Portfolio's duration positioning, which had a slightly positive impact to total return.
We made a number of adjustments to the Portfolio during the reporting period, such as opportunistically reducing its weighting in non-agency mortgage-backed securities to take advantage of strengthening prices. The Portfolio's exposure to CMBS was also pared given their strong results. This was primarily done as a number of the Portfolio's CMBS positions matured. We largely reinvested the proceeds in a combination of fixed rate asset-backed securities and corporate bonds, where, in our opinion, we found attractively valued opportunities.
Looking ahead, we believe the economy has enough momentum to avoid a double-dip recession and that relatively low interest rates will help the economy continue its recovery. Low rates should also help corporations enjoy low borrowing costs and may spur an increase in home refinancing, which would put extra money in consumers' pockets. In addition, the "shadow" stimulus of the extension of the Bush-era tax cuts and payroll tax reduction could serve to support consumer spending, which accounts for roughly 70% of GDP. While we expect to see positive growth in 2011, it could remain below average versus other periods coming out of a severe economic downturn.
1
Against this backdrop, we believe that demand for non-Treasuries will remain strong. We currently feel the Portfolio is appropriately positioned for such an environment with our overweight versus the benchmark in non-Treasuries as we seek to generate solid risk-adjusted returns.
Sincerely,


Thomas Sontag, Michael Foster and Richard Grau
Portfolio Co-Managers
* As of April 30, 2010, the Portfolio's broad-based index used for comparison purposes was changed to the Barclays Capital 1-3 Year U.S. Government/Credit Index, which more closely resembles the characteristics of the Portfolio's investments.
Information about the principal risks of investing in the Portfolio is set forth in the prospectus and statement of additional information.
The composition, industries and holdings of the Portfolio are subject to change.
2
Short Duration Bond Portfolio (Unaudited)
PORTFOLIO BY TYPE OF SECURITY
| (% of Total Net Assets) | |
| Adjustable Rate Mortgages | | | 12.6 | % | |
| Asset-Backed | | | 10.0 | | |
| Commercial Mortgage-Backed | | | 16.4 | | |
| Corporate Debt | | | 27.3 | | |
| Non-Agency Mortgage-Backed | | | 1.8 | | |
| U.S. Government Agency Mortgage-Backed | | | 1.8 | | |
| U.S. Government Agency | | | 4.2 | | |
| U.S. Treasury | | | 24.2 | | |
| Short-Term | | | 2.3 | | |
Liabilities, less cash, receivables and
other assets | | | (0.6 | ) | |
| Total | | | 100.0 | % | |
PERFORMANCE HIGHLIGHTS1
| | | | | Average Annual Total Return
Ended 12/31/2010 | |
| | | Inception
Date | | 1 Year | | 5 Years | | 10 Years | | Life of
Fund* | |
Short Duration Bond
Portfolio Class I | | |
09/10/1984 | | | | 5.28 | % | | | 2.43 | % | | | 3.07 | % | | | 5.75 | % | |
Barclays Capital 1-3 Year
U.S. Government/Credit
Index2** | | | | | 2.80 | % | | | 4.53 | % | | | 4.34 | % | | | 6.54 | % | |
BofA Merrill Lynch
1-3 Year Treasury
Index2 | | | | | | | 2.35 | % | | | 4.17 | % | | | 3.92 | % | | | 6.35 | % | |
Performance data quoted represent past performance, which is no guarantee of future results. The investment return and principal value of an investment will fluctuate so that an investor's shares, when redeemed, may be worth more or less than their original cost. Results are shown on a "total return" basis and include reinvestment of all income dividends and distributions.
Current performance may be lower or higher than the performance data quoted. For performance data current to the most recent month end, please visit https://www.nb.com.
* Index returns are as of the inception date 09/10/1984.
** As of April 30, 2010, the Portfolio board-based index used for comparison purposes was changed to the Barclays Capital 1-3 Year U.S. Government/Credit Index, which more closely resembles the characteristics of the Portfolio's investments.
As stated in the Portfolio's most recent prospectus, the total annual operating expense ratio for fiscal year 2009 was 0.79% for Class I shares, (prior to any fee waivers or expense reimbursements). Neuberger Berman Management LLC has contractually agreed to limit certain expenses of the Portfolio through 12/31/2013.
COMPARISON OF A $10,000 INVESTMENT
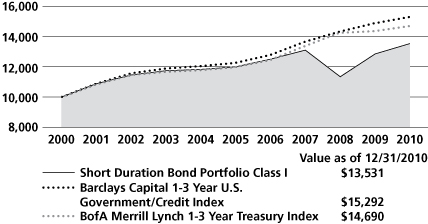
This chart shows the value of a hypothetical $10,000 investment in the Portfolio over the past 10 fiscal years, or since the Portfolio's inception, if it has not operated for 10 years. The result is compared with one or more benchmarks, which may include a broad-based market index and/or a narrower index. Please note that market indices have not been reduced to reflect any of the fees and costs of investing. All results include the reinvestment of income dividends and distributions. Neither the Portfolio's returns nor the market indices shown in the graph and table reflect the effect of taxes an investor would pay on Portfolio distributions or on the redemption of Portfolio shares. Results represent past performance and do not indicate future results.
Please see Endnotes for additional information.
3
Endnotes
1 "Total Return" includes reinvestment of all income dividends and distributions. Results represent past performance and do not indicate future results. The value of an investment in the Portfolio and the return on the investment both will fluctuate, and redemption proceeds may be higher or lower than an investor's original cost. The performance information does not reflect fees and expenses of the variable annuity and variable life insurance policies or the qualified pension and retirement plans whose proceeds are invested in the Portfolio. Neuberger Berman Management LLC ("NBM LLC") has agreed to absorb certain expenses of the AMT Portfolios, including the Portfolio. Without this arrangement, which is subject to change, the total returns of the Portfolio may have been less.
2 The Barclays Capital 1-3 Year U.S. Government/Credit Index includes all bonds in the U.S. Government/Credit Index with at least one to three years to maturity. The U.S. Government Credit/Index includes all securities in the Government and Credit Indices. The Government Index includes treasuries (i.e., public obligations of the U.S. Treasury that have remaining maturities of more than one year) and agencies (i.e., publicly issued debt of U.S. Government agencies, quasi-federal corporations, and corporate or foreign debt guaranteed by the U.S. Government). The Credit Index includes publicly issued U.S. corporate and foreign debentures and secured notes that meet specified maturity, liquidity, and quality requirements. All bonds in the index must meet the following additional criteria: must have at least one year to final maturity regardless of call features; must have at least $250 million par amount outstanding; must be rated investment-grade (Baa3/BBB- or higher) by at least two of the following ratings agencies: Standard & Poor's, Moody's Investors Services, Inc., and Fitch Inc.; must be fixed rate; must be dollar-denominated and non-convertible; and must be publicly issued. The BofA Merrill Lynch 1-3 Year Treasury Index is an unmanaged total return market value index consisting of all coupon bearing U.S. Treasury publicly placed debt securities with maturities between 1 to 3 years. Please note that indices do not take into account any fees and expenses of investing in the individual securities that they track and that individuals cannot invest directly in any index. Data about the performance of these indices are prepared or obtained by NBM LLC and include reinvestment of all income dividends and distributions. The Portfolio may invest in many securities not included in the above-described indices or may not invest in all securities included in the above-described indices.
Any ratios or other measurements using a factor of forecasted earnings of a company discussed herein are based on consensus estimates, not NBM LLC's own projections, and they may or may not be realized. In addition, any revision to a forecast could affect the market price of a security. By quoting them herein, NBM LLC does not offer an opinion as to the accuracy of and does not guarantee these forecasted numbers.
The investments for the Portfolio are managed by the same portfolio manager(s) who manage one or more other mutual funds that have similar names, investment objectives and investment styles as the Portfolio. You should be aware that the Portfolio is likely to differ from the other mutual funds in size, cash flow pattern and tax matters. Accordingly, the holdings and performance can be expected to vary from those of the other mutual funds.
The composition, industries and holdings of the Portfolio are subject to change.
Shares of the separate AMT Portfolios are not available to the general public. Shares of this Portfolio may be purchased only by life insurance companies to be used in their separate accounts that fund variable annuity and variable life insurance policies and by qualified pension and retirement plans.
Statistics and projections in this report are derived from sources deemed to be reliable but cannot be regarded as a representation of future results of the AMT Portfolios. This report is prepared for the general information of shareholders and is not an offer of shares of the AMT Portfolios. Shares of the AMT Portfolios are sold only through the currently effective prospectuses, which must precede or accompany this report.
The "Neuberger Berman" name and logo are registered service marks of Neuberger Berman Group LLC. "Neuberger Berman Management LLC" and the individual Fund names in this piece are either service marks or registered service marks of Neuberger Berman Management LLC.
(c) 2011 Neuberger Berman Management LLC distributor. All rights reserved.
4
Information About Your Fund's Expenses
This table is designed to provide information regarding costs related to your investments. All mutual funds incur operating expenses, which include management fees, fees for administrative services and costs of shareholder reports, among others. The following examples are based on an investment of $1,000 made at the beginning of the six month period ended December 31, 2010 and held for the entire period. The table illustrates the fund's costs in two ways:
| Actual Expenses and Performance: | | The first section of the table provides information about actual account values and actual expenses in dollars, based on the fund's actual performance during the period. You may use the information in this line, together with the amount you invested, to estimate the expenses you paid over the period. Simply divide your account value by $1,000 (for example, an $8,600 account value divided by $1,000 = 8.6), then multiply the result by the number in the first section of the table under the heading entitled "Expenses Paid During the Period" to estimate the expenses you paid over the period. | |
|
Hypothetical Example for
Comparison Purposes: | | The second section of the table provides information about hypothetical account values and hypothetical expenses based on the fund's actual expense ratio and an assumed rate of return at 5% per year before expenses. This return is not the fund's actual return. The hypothetical account values and expenses may not be used to estimate the actual ending account balance or expenses you paid for the period. You may use this information to compare the ongoing costs of investing in this fund versus other funds. To do so, compare the expenses shown in this 5% hypothetical example with the 5% hypothetical examples that appear in the shareholder reports of other funds. | |
|
Please note that the expenses in the table are meant to highlight your ongoing costs only. The table and expense example do not include any transaction costs, such as fees and expenses that are, or may be, imposed under your variable contract or qualified pension plan. Therefore, the information under the heading "Hypothetical (5% annual return before expenses)" is useful in comparing ongoing costs only, and will not help you determine the relative total costs of owning different funds. In addition, if these transaction costs were included, your costs would have been higher.
Expense Information as of 12/31/10 (Unaudited)
NEUBERGER BERMAN ADVISERS MANAGEMENT TRUST SHORT DURATION BOND PORTFOLIO
| Actual | | Beginning Account
Value
7/1/10 | | Ending Account
Value
12/31/10 | | Expenses Paid During
the Period*
7/1/10 - 12/31/10 | |
| Class I | | $ | 1,000.00 | | | $ | 1,017.50 | | | $ | 4.22 | | |
| Hypothetical (5% annual return before expenses)** | |
| Class I | | $ | 1,000.00 | | | $ | 1,021.02 | | | $ | 4.23 | | |
* Expenses are equal to the annualized expense ratio of .83%, multiplied by the average account value over the period, multiplied by 184/365 (to reflect the one-half year period shown).
** Hypothetical 5% annual return before expenses is calculated by multiplying the number of days in the most recent half year divided by 365.
5
Schedule of Investments Short Duration Bond Portfolio
| PRINCIPAL AMOUNT | | | | VALUEt | |
| U.S. Treasury Securities-Backed by the Full Faith and Credit of the U.S. Government (24.2%) | | | |
| $ | 7,000,000 | | | U.S. Treasury Notes, 1.38%, due 4/15/12 | | $ | 7,089,411 | | |
| | 23,160,000 | | | U.S. Treasury Notes, 3.88%, due 10/31/12 | | | 24,570,398 | | |
| | 36,725,000 | | | U.S. Treasury Notes, 2.00%, due 11/30/13 | | | 37,809,526 | | |
| | | | | Total U.S. Treasury Securities-Backed by the Full Faith and Credit of the U.S. Government
(Cost $69,375,527) | | | 69,469,335 | | |
| U.S. Government Agency Securities (4.2%) | | | |
| | 8,500,000 | | | Citigroup Funding, Inc., Guaranteed FDIC Floating Rate Medium-Term Notes,
0.60%, due 3/30/12 | | | 8,549,071 | ma | |
| | 3,450,000 | | | Wells Fargo & Co., Guaranteed FDIC Floating Rate Notes, 0.52%, due 6/15/12 | | | 3,462,382 | ma | |
| | | | | Total U.S. Government Agency Securities (Cost $11,950,000) | | | 12,011,453 | | |
| Mortgage-Backed Securities (32.6%) | | | |
| Adjustable Alt-A Jumbo Balance (2.2%) | | | |
| | 11,028,359 | | | Bear Stearns ALT-A Trust, Ser. 2007-1, Class 21A1, 5.33%, due 1/25/47 | | | 6,511,706 | m | |
| Adjustable Alt-B Mixed Balance (0.4%) | | | |
| | 1,439,320 | | | Lehman XS Trust, Floating Rate, Ser. 2005-1, Class 2A1, 1.76%, due 7/25/35 | | | 1,107,557 | m | |
| Adjustable Jumbo Balance (7.4%) | | | |
| | 3,818,159 | | | GMAC Mortgage Corp. Loan Trust, Ser. 2006-AR1, Class 1A1, 4.65%, due 4/19/36 | | | 2,955,896 | m | |
| | 3,195,526 | | | Merrill Lynch Mortgage Investors Trust, Ser. 2005-A1, Class 2A1, 2.84%, due 12/25/34 | | | 3,095,340 | m | |
| | 18,000,000 | | | Wells Fargo Mortgage Backed Securities Trust, Ser. 2005-AR16, Class 4A2,
2.89%, due 10/25/35 | | | 15,126,444 | m | |
| | | | 21,177,680 | | |
| Adjustable Mixed Balance (2.6%) | | | |
| | 3,620,933 | | | Countrywide Home Loan Mortgage Pass-Through Trust, Ser. 2006-HYB5, Class 2A1,
5.45%, due 9/20/36 | | | 2,249,913 | m | |
| | 2,379,041 | | | Credit Suisse First Boston Mortgage Securities Corp., Ser. 2004-AR4, Class 2A1,
2.89%, due 5/25/34 | | | 2,150,777 | m | |
| | 3,000,331 | | | First Horizon Mortgage Pass-Through Trust, Ser. 2005-AR5, Class 2A1, 2.76%, due 11/25/35 | | | 2,549,108 | m | |
| | 577,960 | | | Harborview Mortgage Loan Trust, Ser. 2004-4, Class 3A, 1.38%, due 6/19/34 | | | 464,885 | m | |
| | | | 7,414,683 | | |
| Commercial Mortgage-Backed (16.4%) | | | |
| | 4,055,017 |
| | Bear Stearns Commercial Mortgage Securities, Inc., Ser. 2006-PW14, Class A1,
5.04%, due 12/11/38 | | | 4,114,489 | | |
| | 8,341,968 |
| | Bear Stearns Commercial Mortgage Securities, Inc., Ser. 2005-PWR8, Class AAB,
4.58%, due 6/11/41 | | | 8,622,479 | | |
| | 4,650,000 | | | Commercial Mortgage Pass-Through Certificates, Ser. 2003-LB1A, Class C, 4.23%, due 6/10/38 | | | 4,698,960 | | |
| | 4,014,510 | | | Credit Suisse Mortgage Capital Certificates, Ser. 2007-C5, Class A1, 5.10%, due 9/15/40 | | | 4,087,286 | | |
| | 4,232,728 | | | GE Capital Commercial Mortgage Corp., Ser. 2002-2A, Class A2, 4.97%, due 8/11/36 | | | 4,343,861 | | |
| | 3,252,304 | | | GMAC Commercial Mortgage Securities, Inc., Ser. 2004-C3, Class AAB, 4.70%, due 12/10/41 | | | 3,396,860 | | |
| | 993,651 | | | Greenwich Capital Commercial Funding Corp., Ser. 2002-C1, Class A3, 4.50%, due 1/11/17 | | | 1,009,375 | | |
| | 1,549,722 |
| | JP Morgan Chase Commercial Mortgage Securities Corp., Ser. 2007-LD11, Class A1,
5.65%, due 6/15/49 | | | 1,564,972 | | |
| | 112,497 | | | LB-UBS Commercial Mortgage Trust, Ser. 2006-C3, Class A1, 5.48%, due 3/15/32 | | | 112,564 | | |
| | 4,225,000 | | | LB-UBS Commercial Mortgage Trust, Ser. 2003-C7, Class C, 5.02%, due 7/15/37 | | | 4,401,005 | m | |
| | 1,101,586 | | | Merrill Lynch/Countrywide Commercial Mortgage Trust, Ser. 2007-5, Class A1,
4.28%, due 8/12/48 | | | 1,103,602 | | |
See Notes to Schedule of Investments
6
| PRINCIPAL AMOUNT | | | | VALUEt | |
| $ | 7,250,000 | | | Wachovia Bank Commercial Mortgage Trust, Ser. 2003-C6, Class D, 5.13%, due 8/15/35 | | $ | 7,453,528 | | |
| | 2,116,539 | | | Wachovia Bank Commercial Mortgage Trust, Ser. 2003-C7, Class A1, 4.24%, due 10/15/35 | | | 2,132,831 | n | |
| | | | 47,041,812 | | |
| Non-Agency Mortgage-Backed (1.8%) | | | |
| | 1,257,483 | | | Countrywide Home Loans, Ser. 2005-R2, Class 2A4, 8.50%, due 6/25/35 | | | 1,140,219 | n | |
| | 3,299,786 | | | GSMPS Mortgage Loan Trust, Ser. 2005-RP2, Class 1A4, 8.50%, due 3/25/35 | | | 3,329,676 | n | |
| | 644,677 | | | GSMPS Mortgage Loan Trust, Ser. 2005-RP3, Class 1A4, 8.50%, due 9/25/35 | | | 624,907 | n | |
| | | | 5,094,802 | | |
| Fannie Mae (0.5%) | | | |
| | 1,442,653 | | | Whole Loan, Ser. 2004-W8, Class PT, 10.94%, due 6/25/44 | | | 1,600,355 | m | |
| Freddie Mac (1.3%) | | | |
| | 10,084 | | | Pass-Through Certificates, 10.00%, due 4/1/20 | | | 11,665 | | |
| | 1,949,403 | | | Pass-Through Certificates, 8.00%, due 11/1/26 | | | 2,276,614 | | |
| | 1,343,319 | | | Pass-Through Certificates, 8.50%, due 10/1/30 | | | 1,595,112 | | |
| | | | 3,883,391 | | |
| | | | | Total Mortgage-Backed Securities (Cost $104,155,325) | | | 93,831,986 | | |
| Corporate Debt Securities (27.3%) | | | |
| Banks (12.3%) | | | |
| | 4,100,000 | | | Bear Stearns Cos. LLC, Senior Unsecured Notes, 5.35%, due 2/1/12 | | | 4,290,310 | | |
| | 2,200,000 | | | Bear Stearns Cos. LLC, Senior Unsecured Medium-Term Notes, Ser. B, 6.95%, due 8/10/12 | | | 2,400,191 | | |
| | 5,700,000 | | | Citigroup, Inc., Senior Unsecured Notes, 6.00%, due 12/13/13 | | | 6,228,589 | | |
| | 1,250,000 | | | Goldman Sachs Group, Inc., Senior Unsecured Notes, 6.88%, due 1/15/11 | | | 1,252,029 | | |
| | 4,250,000 | | | Goldman Sachs Group, Inc., Senior Unsecured Notes, 5.25%, due 10/15/13 | | | 4,599,427 | | |
| | 4,075,000 | | | Merrill Lynch & Co., Inc., Senior Unsecured Medium-Term Notes, Ser. C, 6.05%, due 8/15/12 | | | 4,315,013 | | |
| | 5,750,000 | | | Morgan Stanley, Senior Unsecured Global Medium-Term Notes, Ser. F, 5.75%, due 8/31/12 | | | 6,148,642 | | |
| | 6,000,000 | | | Westpac Banking Corp., Senior Unsecured Notes, 1.85%, due 12/9/13 | | | 6,016,170 | | |
| | | | 35,250,371 | | |
| Beverages (1.3%) | | | |
| | 3,350,000 | | | Anheuser-Busch Cos., Inc., Guaranteed Unsecured Notes, 4.95%, due 1/15/14 | | | 3,604,737 | | |
| Diversified Financial Services (4.8%) | | | |
| | 4,240,000 | | | American Express Credit Corp., Senior Unsecured Medium-Term Notes, Ser. C, 5.88%, due 5/2/13 | | | 4,611,161 | | |
| | 1,990,000 | | | Caterpillar Financial Services Corp., Unsecured Medium-Term Notes, Ser. F, 4.70%, due 3/15/12 | | | 2,077,960 | | |
| | 6,500,000 | | | General Electric Capital Corp., Senior Unsecured Notes, 5.90%, due 5/13/14 | | | 7,193,934 | | |
| | | | 13,883,055 | | |
| Food (0.6%) | | | |
| | 1,720,000 | | | Kraft Foods, Inc., Senior Unsecured Notes, 6.25%, due 6/1/12 | | | 1,839,929 | | |
| Media (3.7%) | | | |
| | 3,630,000 | | | Comcast Cable Communications LLC, Guaranteed Notes, 6.75%, due 1/30/11 | | | 3,644,938 | | |
| | 2,430,000 | | | NBC Universal, Inc., Senior Unsecured Notes, 2.10%, due 4/1/14 | | | 2,422,800 | n | |
| | 4,240,000 | | | Time Warner Cable, Inc., Guaranteed Notes, 5.40%, due 7/2/12 | | | 4,501,315 | | |
| | | | 10,569,053 | | |
| Office/Business Equipment (1.1%) | | | |
| | 2,990,000 | | | Xerox Corp., Senior Unsecured Notes, 5.50%, due 5/15/12 | | | 3,158,077 | | |
See Notes to Schedule of Investments
7
| PRINCIPAL AMOUNT | | | | VALUEt | |
| Retail (1.2%) | | | |
| $ | 3,100,000 | | | Home Depot, Inc., Senior Unsecured Notes, 5.25%, due 12/16/13 | | $ | 3,402,392 | | |
| Telecommunications (2.3%) | | | |
| | 3,000,000 | | | Telecom Italia Capital SA, Guaranteed Notes, 5.25%, due 11/15/13 | | | 3,125,418 | | |
| | 3,495,000 | | | Telefonica Emisiones SAU, Guaranteed Notes, 2.58%, due 4/26/13 | | | 3,497,813 | | |
| | | | 6,623,231 | | |
| | | | | Total Corporate Debt Securities (Cost $77,568,264) | | | 78,330,845 | | |
| Asset-Backed Securities (10.0%) | | | |
| | 2,000,000 | | | ACE Securities Corp. Home Equity Loan Trust, Ser. 2006-OP1, Class A2C, 0.41%, due 4/25/36 | | | 1,282,388 | m | |
| | 3,092,843 | | | ACE Securities Corp. Home Equity Loan Trust, Ser. 2006-ASP5, Class A2B, 0.39%, due 10/25/36 | | | 2,142,533 | m | |
| | 3,425,000 | | | Ally Auto Receivables Trust, Ser. 2010-4, Class A3, 0.91%, due 11/17/14 | | | 3,403,074 | | |
| | 1,753,000 | | | Bear Stearns Asset Backed Securities Trust, Ser. 2006-HE9, Class 1A2, 0.41%, due 11/25/36 | | | 944,178 | m | |
| | 2,469,224 | | | Carrington Mortgage Loan Trust, Ser. 2006-OPT1, Class A3, 0.44%, due 2/25/36 | | | 2,185,646 | m | |
| | 4,000,000 | | | Carrington Mortgage Loan Trust, Ser. 2007-FRE1, Class A3, 0.52%, due 2/25/37 | | | 1,823,272 | m | |
| | 2,186,177 | | | Countrywide Asset-Backed Certificates Trust, Ser. 2006-3, Class 2A2, 0.44%, due 6/25/36 | | | 1,915,284 | m | |
| | 1,281,221 | | | Countrywide Asset-Backed Certificates Trust, Ser. 2006-5, Class 2A2, 0.44%, due 8/25/36 | | | 1,120,668 | m | |
| | 2,324,842 | | | Countrywide Asset-Backed Certificates Trust, Ser. 2006-6, Class 2A2, 0.44%, due 9/25/36 | | | 1,969,794 | m | |
| | 5,200,000 | | | Honda Auto Receivables Owner Trust, Ser. 2010-3, Class A3, 0.70%, due 4/21/14 | | | 5,180,063 | | |
| | 587,148 | | | Impac Secured Assets Corp., Ser. 2006-3, Class A4, 0.35%, due 11/25/36 | | | 548,785 | m | |
| | 2,042,761 | | | Knollwood CDO Ltd., Ser. 2006-2A, Class A2J, 0.71%, due 7/13/46 | | | 0 | #m* | |
| | 115,948 | | | Merrill Lynch Mortgage Investors Trust, Ser. 2006-MLN1, Class A2A, 0.33%, due 7/25/37 | | | 115,140 | m | |
| | 2,004,169 | | | Residential Asset Mortgage Products, Inc., Ser. 2006-RS1, Class AI2, 0.49%, due 1/25/36 | | | 1,492,026 | m | |
| | 5,175,000 | | | Soundview Home Equity Loan Trust, Ser. 2006-OPT3, Class 2A3, 0.43%, due 6/25/36 | | | 4,249,850 | m | |
| | 506,554 | | | Structured Asset Investment Loan Trust, Ser. 2006-3, Class A4, 0.35%, due 6/25/36 | | | 503,962 | m | |
| | | | | Total Asset-Backed Securities (Cost $36,903,438) | | | 28,876,663 | | |
| NUMBER OF SHARES | | | | | |
| Short-Term Investments (2.3%) | | | |
| | 6,546,503 | | | State Street Institutional Liquid Reserves Fund Institutional Class (Cost $6,546,503) | | | 6,546,503 | | |
| | | | | Total Investments (100.6%) (Cost $306,499,057) | | | 289,066,785 | ## | |
| | | | | Liabilities, less cash, receivables and other assets [(0.6%)] | | | (1,758,228 | ) | |
| | | | | Total Net Assets (100.0%) | | $ | 287,308,557 | | |
See Notes to Schedule of Investments
8
Notes to Schedule of Investments Short Duration
Bond Portfolio
t In accordance with Accounting Standards Codification ("ASC") 820 "Fair Value Measurements and Disclosures" ("ASC 820"), all investments held by Neuberger Berman Advisers Management Trust Short Duration Bond Portfolio (the "Fund") are carried at the value that Neuberger Berman Management LLC ("Management") believes the Fund would receive upon selling an investment in an orderly transaction to an independent buyer in the principal or most advantageous market for the investment under current market conditions. Various inputs, including the volume and level of activity for the asset or liability in the market, are considered in valuing the Fund's investments, some of which are discussed below. Significant management judgment may be necessary to value investments in accordance with ASC 820.
ASC 820 established a three-tier hierarchy of inputs to create a classification of value measurements for disclosure purposes. The three-tier hierarchy of inputs is summarized in the three broad Levels listed below.
. Level 1 - quoted prices in active markets for identical investments
. Level 2 - other significant observable inputs (including quoted prices for similar investments, interest rates, prepayment speeds, credit risk, amortized cost, etc.)
. Level 3 - significant unobservable inputs (including the Fund's own assumptions in determining the fair value of investments)
The inputs or methodology used for valuing an investment are not necessarily an indication of the risk associated with investing in those securities.
The value of the Fund's investments in debt securities is determined by Management primarily by obtaining valuations from independent pricing services based on readily available bid quotations, or if quotations are not available, by methods which include various considerations based on security type (generally Level 2 inputs). In addition to the consideration of yields or prices of securities of comparable quality, coupon, maturity and type; indications as to values from dealers; and general market conditions, the following is a description of other Level 2 inputs and related valuation techniques used by an independent pricing service to value certain types of debt securities of the Fund:
Corporate Debt Securities. Inputs used to value corporate debt securities generally include relative credit information, observed market movements, sector news, spread to the U.S. Treasury market, and other market information which may include benchmark yields, reported trades, broker/dealer quotes, issuer spreads, benchmark securities, bids, offers, and reference data, such as market research publications, when available ("Other Market Information").
U.S. Treasury Securities. Inputs used to value U.S. Treasury securities generally include quotes from several inter-dealer brokers and Other Market Information.
Asset-Backed Securities and Mortgage Backed Securities. Inputs used to value asset-backed securities and mortgage backed securities generally include models that consider a number of factors, which may include the following: prepayment speeds, cash flows, spread adjustments and Other Market Information.
High Yield Securities. Inputs used to value high yield securities generally include a number of observations of equity and credit default swap curves related to the issuer and Other Market Information.
Financial futures contracts are determined by obtaining valuations from independent pricing services at the settlement price at market close.
Management has developed a process to periodically review information provided by independent pricing services for all types of securities.
See Notes to Financial Statements
9
Notes to Schedule of Investments Short Duration
Bond Portfolio (cont'd)
Investments in State Street Institutional Liquid Reserves Fund Institutional Class are valued using the fund's daily calculated net asset value ("NAV").
For debt securities, if a valuation is not available from an independent pricing service, or if Management has reason to believe that the valuation received does not represent the amount the Fund might reasonably expect to receive on a current sale in an orderly transaction, the Fund seeks to obtain quotations from principal market makers (generally considered Level 3 inputs). If such quotations are not readily available, the security is valued using methods the Board of Trustees of Neuberger Berman Advisers Management Trust (the "Board") has approved on the belief that they reflect fair value. Numerous factors may be considered when determining the fair value of a security based on Level 2 or 3 inputs, including available analyst, media or other reports, trading in futures or ADRs and whether the issuer of the security being fair valued has other securities outstanding. These fair value prices are necessarily estimates, and there is no assurance that such a price will be at or close to the price at which the security is next quoted or next trades.
The following is a summary, categorized by Level, of inputs used to value the Fund's investments as of December 31, 2010:
| Asset Valuation Inputs | | Level 1 | | Level 2 | | Level 3S | | Total | |
| Investments: | |
U.S. Treasury Securities-Backed by the
Full Faith and Credit of the
U.S. Government | | $ | -- | | | $ | 69,469,335 | | | $ | -- | | | $ | 69,469,335 | | |
| U.S. Government Agency Securities | | | -- | | | | 12,011,453 | | | | -- | | | | 12,011,453 | | |
| Mortgage-Backed Securities^ | | | -- | | | | 93,831,986 | | | | -- | | | | 93,831,986 | | |
| Corporate Debt Securities^ | | | -- | | | | 78,330,845 | | | | -- | | | | 78,330,845 | | |
| Asset-Backed Securities | | | -- | | | | 28,876,663 | | | | 0 | | | | 28,876,663 | | |
| Short-Term Investments | | | -- | | | | 6,546,503 | | | | -- | | | | 6,546,503 | | |
| Total Investments | | $ | -- | | | $ | 289,066,785 | | | $ | 0 | | | $ | 289,066,785 | | |
^ The Schedule of Investments provides information on the industry categorization for the portfolio.
S The following is a reconciliation between the beginning and ending balances of investments in which significant unobservable inputs (Level 3) were used in determining value:
Investments in
Securities | | Beginning
balance, as
of 1/1/10 | | Accrued
discounts/
(premiums) | | Realized
gain/loss
and change
in unrealized
appreciation/
(depreciation) | | Net
purchases/
(sales) | | Net
transfers in
and/or out
of Level 3 | | Balance, as
of 12/31/10 | | Net change in
unrealized
appreciation/
(depreciation)
from
investments
still held
as of 12/31/10 | |
Asset-Backed
Securities | | $ | 0 | | | $ | -- | | | $ | -- | | | $ | -- | | | $ | -- | | | $ | 0 | | | $ | -- | | |
The Fund had no significant transfers between Levels 1 and 2 during the year ended December 31, 2010.
See Notes to Financial Statements
10
Notes to Schedule of Investments Short Duration
Bond Portfolio (cont'd)
## At December 31, 2010, the cost of investments for U.S. federal income tax purposes was $308,632,370. Gross unrealized appreciation of investments was $1,202,711 and gross unrealized depreciation of investments was $20,768,296, resulting in net unrealized depreciation of $19,565,585, based on cost for U.S. federal income tax purposes.
# Restricted security subject to restrictions on resale under federal securities laws. These securities may be resold in transactions exempt from registration, normally to qualified institutional buyers under Rule 144A under the Securities Act of 1933, as amended, and have been deemed by the investment manager to be illiquid and restricted. At December 31, 2010, these securities amounted to approximately $0 or 0.0% of net assets for the Fund.
| Restricted Security | | Acquisition
Date | | Acquisition
Cost | | Acquisition Cost
Percentage of
Net Assets as of
Acquisition Date | | Value as of
December 31, 2010 | | Fair Value
Percentage
of Net
Assets as of
December 31, 2010 | |
Knollwood CDO Ltd.,
Ser. 2006-2A, Class A2J,
0.71%, due 7/13/46 | | 9/14/2007 | | $ | 1,123,518 | | | | 0.2 | % | | $ | 0 | | | | 0.0 | % | |
m Floating rate securities are securities whose yields vary with a designated market index or market rate. These securities are shown at their current rates as of December 31, 2010 and their final maturity dates.
a This debt is guaranteed under the Federal Deposit Insurance Corporation's ("FDIC") Temporary Liquidity Guarantee Program and is backed by the full faith and credit of the United States. At December 31, 2010, these securities amounted to approximately $12,011,453 or 4.2% of net assets for the Fund.
n Restricted security subject to restrictions on resale under federal securities laws. These securities may be resold in transactions exempt from registration, normally to qualified institutional buyers under Rule 144A under the Securities Act of 1933, as amended, and have been deemed by the investment manager to be liquid. At December 31, 2010, these securities amounted to $9,650,433 or 3.4% of net assets for the Fund.
* Security did not produce income during the last eleven months.
See Notes to Financial Statements
11
Statement of Assets and Liabilities
Neuberger Berman Advisers Management Trust
| | | SHORT DURATION
BOND PORTFOLIO | |
| | | December 31, 2010 | |
| Assets | |
| Investments in securities, at value* (Note A)-see Schedule of Investments: | |
| Unaffiliated issuers | | $ | 289,066,785 | | |
| Cash | | | 1 | | |
| Interest receivable | | | 1,684,963 | | |
| Receivable for securities sold | | | 3,082,294 | | |
| Receivable for Fund shares sold | | | 220,850 | | |
| Prepaid expenses and other assets | | | 9,170 | | |
| Total Assets | | | 294,064,063 | | |
| Liabilities | |
| Payable for securities purchased | | | 6,175,057 | | |
| Payable for Fund shares redeemed | | | 352,165 | | |
| Payable to investment manager (Notes A & B) | | | 61,745 | | |
| Payable to administrator (Note B) | | | 98,793 | | |
| Accrued expenses and other payables | | | 67,746 | | |
| Total Liabilities | | | 6,755,506 | | |
| Net Assets at value | | $ | 287,308,557 | | |
| Net Assets consist of: | |
| Paid-in capital | | $ | 363,960,973 | | |
| Undistributed net investment income (loss) | | | 9,926,296 | | |
| Accumulated net realized gains (losses) on investments | | | (69,146,440 | ) | |
| Net unrealized appreciation (depreciation) in value of investments | | | (17,432,272 | ) | |
| Net Assets at value | | $ | 287,308,557 | | |
| Shares Outstanding ($.001 par value; unlimited shares authorized) | | | 25,647,304 | | |
| Net Asset Value, offering and redemption price per share | | $ | 11.20 | | |
| *Cost of Investments: | |
| Unaffiliated issuers | | $ | 306,499,057 | | |
See Notes to Financial Statements
12
Statement of Operations
Neuberger Berman Advisers Management Trust
| | | SHORT DURATION
BOND PORTFOLIO | |
| | | For the
Year Ended
December 31, 2010 | |
| Investment Income: | |
| Income (Note A): | |
| Interest income-unaffiliated issuers | | $ | 9,655,744 | | |
| Foreign taxes withheld | | | (2,308 | ) | |
| Total income | | $ | 9,653,436 | | |
| Expenses: | |
| Investment management fees (Notes A & B) | | | 838,432 | | |
| Administration fees (Note B) | | | 1,341,491 | | |
| Audit fees | | | 42,900 | | |
| Custodian fees (Note B) | | | 107,284 | | |
| Insurance expense | | | 27,311 | | |
| Legal fees | | | 159,260 | | |
| Shareholder reports | | | 90,363 | | |
| Trustees' fees and expenses | | | 52,324 | | |
| Miscellaneous | | | 44,094 | | |
| Total expenses | | | 2,703,459 | | |
| Expenses reduced by custodian fee expense offset arrangement (Note B) | | | (353 | ) | |
| Total net expenses | | | 2,703,106 | | |
| Net investment income (loss) | | $ | 6,950,330 | | |
| Realized and Unrealized Gain (Loss) on Investments (Note A) | |
| Net realized gain (loss) on: | |
| Sales of investment securities of unaffiliated issuers | | | (8,803,470 | ) | |
| Financial futures contracts | | | 1,261,312 | | |
| Change in net unrealized appreciation (depreciation) in value of: | |
| Unaffiliated investment securities | | | 17,937,761 | | |
| Financial futures contracts | | | 356,016 | | |
| Net gain (loss) on investments | | | 10,751,619 | | |
| Net increase (decrease) in net assets resulting from operations | | $ | 17,701,949 | | |
See Notes to Financial Statements
13
Statements of Changes in Net Assets
Neuberger Berman Advisers Management Trust
| | | SHORT DURATION
BOND PORTFOLIO | |
| | | Year Ended
December 31,
2010 | | Year Ended
December 31,
2009 | |
| Increase (Decrease) in Net Assets: | |
| From Operations (Note A): | |
| Net investment income (loss) | | $ | 6,950,330 | | | $ | 14,545,274 | | |
| Net realized gain (loss) on investments | | | (7,542,158 | ) | | | (41,793,445 | ) | |
| Change in net unrealized appreciation (depreciation) of investments | | | 18,293,777 | | | | 73,547,507 | | |
| Net increase (decrease) in net assets resulting from operations | | | 17,701,949 | | | | 46,299,336 | | |
| Distributions to Shareholders From (Note A): | |
| Net Investment Income | | | (16,456,190 | ) | | | (26,930,221 | ) | |
| From Fund Share Transactions (Note D): | |
| Proceeds from shares sold | | | 50,066,723 | | | | 78,622,503 | | |
| Proceeds from reinvestment of dividends and distributions | | | 16,456,190 | | | | 26,930,221 | | |
| Payments for shares redeemed | | | (130,499,796 | ) | | | (220,360,057 | ) | |
| Net increase (decrease) from Fund share transactions | | | (63,976,883 | ) | | | (114,807,333 | ) | |
| Net Increase (Decrease) in Net Assets | | | (62,731,124 | ) | | | (95,438,218 | ) | |
| Net Assets: | |
| Beginning of year | | | 350,039,681 | | | | 445,477,899 | | |
| End of year | | $ | 287,308,557 | | | $ | 350,039,681 | | |
| Undistributed net investment income (loss) at end of year | | $ | 9,926,296 | | | $ | 16,485,725 | | |
See Notes to Financial Statements
14
Notes to Financial Statements Short Duration Bond Portfolio
Note A--Summary of Significant Accounting Policies:
1 General: The Fund is a separate operating series of Neuberger Berman Advisers Management Trust (the "Trust"), a Delaware statutory trust organized pursuant to a Trust Instrument dated May 23, 1994. The Trust is currently comprised of ten separate operating series (each individually a "Series," and collectively the "Funds") each of which is diversified. The Trust is registered as an open-end management investment company under the Investment Company Act of 1940, as amended (the "1940 Act"), and its shares are registered under the Securities Act of 1933, as amended. The Fund currently offers only Class I shares. The Board may establish additional series or classes of shares without the approval of shareholders.
The assets of each Series belong only to that Series, and the liabilities of each Series are borne solely by that Series and no other.
The preparation of financial statements in accordance with U.S. generally accepted accounting principles requires Management to make estimates and assumptions at the date of the financial statements. Actual results could differ from those estimates.
2 Portfolio valuation: Investment securities are valued as indicated in the notes following the Schedule of Investments.
3 Foreign currency translation: The accounting records of the Fund are maintained in U.S. dollars. Foreign currency amounts are translated into U.S. dollars using the exchange rates as of 4:00 p.m., Eastern time, to determine the value of investments, other assets and liabilities. Purchase and sale prices of securities, and income and expenses, are translated into U.S. dollars at the prevailing rate of exchange on the respective dates of such transactions. Net unrealized foreign currency gain (loss), if any, arises from changes in the value of assets and liabilities, other than investments in securities, as a result of changes in exchange rates and is stated separately in the Statement of Operations.
4 Securities transactions and investment income: Securities transactions are recorded on trade date for financial reporting purposes. Interest income, including accretion of discount (adjusted for original issue discount, where applicable) is recorded on the accrual basis. Realized gains and losses from securities transactions and foreign currency transactions, if any, are recorded on the basis of identified cost and stated separately in the Statement of Operations. Included in net realized gain (loss) on investments are proceeds from the settlements of class action litigation in which the Fund participated as a class member. The amount of such proceeds for the year ended December 31, 2010 was $31,480.
5 Income tax information: The Funds are treated as separate entities for U.S. federal income tax purposes. It is the policy of the Fund to continue to qualify as a regulated investment company by complying with the requirements of the U.S. Internal Revenue Code applicable to regulated investment companies and to distribute substantially all of its earnings to its shareholders. To the extent the Fund distributes substantially all of its earnings to shareholders, no federal income or excise tax provision is required.
The Fund has adopted the provisions of ASC 740 "Income Taxes" ("ASC 740"). ASC 740 sets forth a minimum threshold for financial statement recognition of a tax position taken, or expected to be taken, in a tax return. The Fund recognizes interest and penalties, if any, related to unrecognized tax positions as an income tax expense in the Statement of Operations. The Fund is subject to examination by U.S. federal and state tax authorities for returns filed for the prior three fiscal years 2007 - 2009. As of December 31, 2010, the Fund did not have any unrecognized tax positions.
Income distributions and capital gain distributions are determined in accordance with income tax regulations, which may differ from U.S. generally accepted accounting principles. These differences are primarily due to differing treatments of income and gains on various investment securities held by the Fund, timing differences and
15
differing characterization of distributions made by the Fund as a whole. The Fund may also utilize earnings and profits distributed to shareholders on redemption of shares as a part of the dividends paid deduction for income tax purposes.
As determined on December 31, 2010, permanent differences resulting primarily from different book and tax accounting for paydown gains and losses and amortization of bond premium were reclassified at fiscal year-end. These reclassifications had no effect on net income, NAV or NAV per share of the Fund.
The tax character of distributions paid during the years ended December 31, 2010 and December 31, 2009 was as follows:
| | | Distributions Paid From: | |
| | | Ordinary Income | | Total | |
| | | 2010 | | 2009 | | 2010 | | 2009 | |
| | | $ | 16,456,190 | | | $ | 26,930,221 | | | $ | 16,456,190 | | | $ | 26,930,221 | | |
As of December 31, 2010, the components of distributable earnings (accumulated losses) on a U.S. federal income tax basis were as follows:
Undistributed
Ordinary
Income | | Unrealized
Appreciation
(Depreciation) | | Loss
Carryforwards
and Deferrals | | Total | |
| $ | 9,926,296 | | | $ | (19,565,585 | ) | | $ | (67,013,127 | ) | | $ | (76,652,416 | ) | |
The difference between book basis and tax basis distributable earnings is attributable primarily to timing differences of wash sales, amortization of bond premium, post October loss deferrals and capital loss carryforwards.
To the extent the Fund's net realized capital gains, if any, can be offset by capital loss carryforwards, it is the policy of the Fund not to distribute such gains. Under current tax law, the use of these losses to offset future gains may be limited. As determined at December 31, 2010, the Fund had unused capital loss carryforwards available for federal income tax purposes to offset net realized capital gains, if any, as follows:
| | | Expiring in: | |
| | | 2012 | | 2013 | | 2014 | | 2015 | | 2016 | | 2017 | | 2018 | |
| | | $ | 2,710,070 | | | $ | 4,632,986 | | | $ | 3,820,726 | | | $ | 514,506 | | | $ | -- | | | $ | 45,541,698 | | | $ | 7,896,656 | | |
Under current tax law, certain net capital and net foreign currency losses realized after October 31 within the taxable year may be deferred and treated as occurring on the first day of the following tax year. For the year ended December 31, 2010, the Fund elected to defer $1,896,485 of net capital losses arising between November 1, 2010 and December 31, 2010.
6 Distributions to shareholders: The Fund may earn income, net of expenses, daily on its investments. Distributions from net investment income and net realized capital gains, if any, generally are distributed once a year (usually in October). Income distributions and capital gain distributions to shareholders are recorded on the ex-date.
7 Foreign taxes: Foreign taxes withheld represent amounts withheld by foreign tax authorities, net of refunds recoverable.
8 Expense allocation: Certain expenses are applicable to multiple funds. Expenses directly attributable to a Series are charged to that Series. Expenses of the Trust that are not directly attributable to a particular series of the Trust (e.g., the Fund) are allocated among the series of the Trust, on the basis of relative net assets, except where a more appropriate allocation of expenses to each of the series can otherwise be made fairly. Expenses borne by the complex of related investment companies, which includes open-end and closed-end investment companies for which Management serves as investment manager, that are not directly attributable to a particular investment company in the complex (e.g., the Trust) or series thereof are allocated among the investment companies in the
16
complex or series thereof, on the basis of relative net assets, except where a more appropriate allocation of expenses to each investment company in the complex or series thereof can otherwise be made fairly.
9 Security lending: A third party, eSecLending, has assisted the Fund in conducting a bidding process to try to identify a principal that would pay a guaranteed amount to the Fund in consideration of the Fund entering into an exclusive securities lending arrangement. During the fiscal year, eSecLending served as exclusive lending agent for the Fund. As a result of a bidding process on October 1, 2009, no principal had an exclusive securities lending arrangement with the Fund during the fiscal year; as such, the Fund was not guaranteed any particular level of income during the fiscal year. As of August 27, 2010, the Fund no longer participates in a securities lending program.
Under the securities lending arrangement, the Fund received cash collateral at the beginning of each transaction equal to at least 102% of the prior day's market value of the loaned securities (105% in the case of international securities). The Fund invested all the cash collateral in Neuberger Berman Securities Lending Quality Fund, LLC ("Quality Fund"), a fund managed by Neuberger Berman Fixed Income LLC ("NBFI"), an affiliate of Management, and sub-advised by Dwight Asset Management Company LLC. Quality Fund was not a money market fund registered under the 1940 Act and did not operate in accordance with all requirements of Rule 2a-7 under the 1940 Act. The Fund redeemed all of its investments in Quality Fund, if any, as of August 27, 2010.
Net income from the lending program represents any amounts received from a principal, plus income earned on the cash collateral invested in Quality Fund or in other investments, if applicable, less cash collateral fees and other expenses associated with the loans. For the fiscal year ended December 31, 2010, the Fund did not receive net income under the securities lending arrangement.
10 Dollar rolls: The Fund may enter into dollar roll transactions with respect to mortgage-backed securities. In a dollar roll transaction, the Fund sells securities for delivery in the current month and simultaneously agrees to repurchase substantially similar (i.e., same type and coupon) securities on a specified future date from the same party. During the period before the repurchase, the Fund foregoes principal and interest payments on the securities. The Fund is compensated by the difference between the current sales price and the forward price for the future purchase (often referred to as the "drop"), as well as by the interest earned on the cash proceeds of the initial sale. Dollar rolls may increase fluctuations in the Fund's NAV and may be viewed as a form of leverage. There is a risk that the counterparty will be unable or unwilling to complete the transaction as scheduled, which may result in losses to the Fund.
11 Investments in foreign securities: Investing in foreign securities may involve certain sovereign and other risks, in addition to the credit and market risks normally associated with domestic securities. These additional risks include the possibility of adverse political and economic developments (including political instability, nationalization, expropriation, or confiscatory taxation) and the potentially adverse effects of unavailability of public information regarding issuers, less government supervision and regulation of financial markets, reduced liquidity of certain financial markets, and the lack of uniform accounting, auditing, and financial reporting standards or the application of standards that are different or less stringent than those applied in the United States. Foreign securities also may experience greater price volatility, higher rates of inflation, and delays in settlement. At December 31, 2010, the Fund did not own any foreign securities.
12 Derivative instruments: During the year ended December 31, 2010, the Fund's use of derivatives was limited to financial futures contracts. The Fund has adopted the provisions of ASC 815 "Derivatives and Hedging" ("ASC 815"). The disclosure requirements of ASC 815 distinguish between derivatives that qualify for hedge accounting and those that do not. Because investment companies value their derivatives at fair value and recognize changes in fair value through the Statement of Operations, they do not qualify for hedge accounting. Accordingly, even though the Fund's investments in derivatives may represent economic hedges, they are considered non-hedge transactions for purposes of this disclosure.
Financial futures contracts: At the time the Fund enters into a financial futures contract, it is required to deposit with the futures commission merchant a specified amount of cash or liquid securities, known as "initial margin,"
17
ranging upward from 1.1% of the value of the financial futures contract being traded. Each day, the futures contract is valued at the official settlement price of the board of trade or U.S. commodity exchange on which such futures contract is traded. Subsequent payments, known as "variation margin," to and from the broker are made on a daily basis as the market price of the financial futures contract fluctuates. Daily variation margin adjustments, arising from this "mark to market," are recorded by the Fund as unrealized gains or losses.
Although some financial futures contracts by their terms call for actual delivery or acceptance of financial instruments, in most cases the contracts are closed out prior to delivery by offsetting purchases or sales of matching financial futures contracts. When the contracts are closed, the Fund recognizes a gain or loss. Risks of entering into futures contracts include the possibility there may be an illiquid market, possibly at a time of rapidly declining prices, and/or a change in the value of the contract may not correlate with changes in the value of the underlying securities. Futures have minimal counterparty risk to the Fund because the exchange's clearinghouse, as counterparty to all exchange traded futures, guarantees the futures against default.
For U.S. federal income tax purposes, the futures transactions undertaken by the Fund may cause the Fund to recognize gains or losses from marking contracts to market even though its positions have not been sold or terminated, may affect the character of the gains or losses recognized as long-term or short-term, and may affect the timing of some capital gains and losses realized by the Fund. Also, the Fund's losses on transactions involving futures contracts may be deferred rather than being taken into account currently in calculating the Fund's taxable income.
During the year ended December 31, 2010, the Fund entered into financial futures contracts for economic hedging purposes, including as a maturity or duration management device. At December 31, 2010, there were no open positions in financial futures contracts.
The impact of the use of derivative instruments on the Statement of Operations during the year ended December 31, 2010, was as follows:
Realized Gain (Loss)(1)
| | | Interest Rate
Risk | |
| Futures Contracts | | $ | 1,261,312 | | |
| Total Realized Gain (Loss) | | $ | 1,261,312 | | |
Change in Appreciation (Depreciation)(2)
| | | Interest Rate
Risk | |
| Futures Contracts | | $ | 356,016 | | |
| Total Change in Appreciation (Depreciation) | | $ | 356,016 | | |
(1) Reflected in the Statement of Operations under the caption "Net realized gain (loss) on financial futures contracts."
(2) Reflected in the Statement of Operations under the caption "Change in net unrealized appreciation (depreciation) in value of financial futures contracts."
13 Indemnifications: Like many other companies, the Trust's organizational documents provide that its officers and trustees are indemnified against certain liabilities arising out of the performance of their duties to the Trust. In addition, both in some of its principal service contracts and in the normal course of its business, the Trust enters into contracts that provide indemnifications to other parties for certain types of losses or liabilities. The Trust's maximum exposure under these arrangements is unknown as this could involve future claims against the Trust.
18
Note B--Management Fees, Administration Fees, Distribution Arrangements, and Other Transactions with Affiliates:
Fund shares are issued and redeemed in connection with investments in and payments under certain variable annuity contracts and variable life insurance policies issued through separate accounts of life insurance companies and are also offered directly to certain qualified pension and retirement plans.
The Fund retains Management as its investment manager under a Management Agreement. For such investment management services, the Fund pays Management a fee at the annual rate of 0.25% of the first $500 million of the Fund's average daily net assets, 0.225% of the next $500 million, 0.20% of the next $500 million, 0.175% of the next $500 million, and 0.15% of average daily net assets in excess of $2 billion. As sub-adviser NBFI receives a monthly fee paid by Management. The Fund does not pay a fee directly to NBFI for such services.
The Fund retains Management as its administrator under an Administration Agreement. The Fund pays Management an administration fee at the annual rate of 0.40% of its average daily net assets under this agreement. Additionally, Management retains State Street Bank and Trust Company ("State Street") as its sub-administrator under a Sub-Administration Agreement. Management pays State Street a fee for all services received under this agreement.
The Board adopted a non-fee distribution plan for the Fund.
Management has contractually undertaken through December 31, 2013 to forgo current payment of fees and/or reimburse the Fund for its operating expenses (excluding fees payable to Management, interest, taxes, brokerage commissions, extraordinary expenses, and transaction costs) ("Operating Expenses") which exceed, in the aggregate, 1.00% per annum of the Fund's average daily net assets (the "Expense Limitation"). During the year ended December 31, 2010, no reimbursement to the Fund was required. The Fund has agreed to repay Management through December 31, 2016 for fees and expenses foregone and/or its excess Operating Expenses previously reimbursed by Management, so long as its annual Operating Expenses during that period do not exceed its Expense Limitation, and the repayment is made within three years after the year in which Management issued the reimbursement or waived fees. During the year ended December 31, 2010, there was no repayment to Management under its contractual expense limitation. At December 31, 2010, the Fund had no contingent liability to Management under its contractual expense limitation.
NBFI, sub-adviser to the Fund, is retained by Management to furnish it with investment recommendations and research information without added cost to the Fund. Several individuals who are officers and/or trustees of the Trust are also employees of NBFI and/or Management.
On May 4, 2009, NBSH Acquisition, LLC ("NBSH"), an entity organized by key members of senior management of Neuberger Berman Group LLC ("NBG") and its consolidated subsidiaries (NBG, and together with its consolidated subsidiaries "NB Group") acquired a majority interest in the business conducted by Management and NBFI, as well as the fixed income and certain alternative asset management businesses of Lehman Brother Holdings Inc.'s Investment Management Division (together with Management and NBFI, the "Acquired Businesses") (the "Acquisition"). Prior to that date, NBFI and the predecessor in interest of Management were indirect wholly owned subsidiaries of Lehman Brothers Holdings Inc. ("LBHI"). On September 15, 2008, LBHI filed a voluntary petition under Chapter 11 of the U.S. Bankruptcy Code, and on December 22, 2008, the bankruptcy court having jurisdiction over the LBHI matter approved the sale of the Acquired Businesses to NBSH (or its successor or assign).
Through NBSH, portfolio managers, NB Group's management team, and certain of its key employees and senior professionals now indirectly own 52% of the voting equity of NBG. LBHI and certain affiliates of LBHI own the remaining 48% of NBG's voting equity. The closing of the Acquisition resulted in an "assignment" of the Fund's Management Agreement and Sub-Advisory Agreement. Such an assignment, by law, automatically terminated those agreements. Accordingly, prior to the closing, the Board, including the Trustees who are not "interested persons" of the Fund's investment manager and its affiliates or the Fund, considered and approved a new
19
Management Agreement and Sub-Advisory Agreement for the Fund. The new agreements, which are virtually identical to those previously in effect, were also approved by a vote of the Fund's shareholders.
These events did not have a material impact on the Fund or its operations. Management and NBFI continue to operate in the ordinary course of business as the investment manager and sub-adviser of the Fund.
Other non-affiliated service provider: The Fund has an expense offset arrangement in connection with its custodian contract. For the year ended December 31, 2010, the impact of this arrangement was a reduction of expenses of $353.
Note C--Securities Transactions:
Cost of purchases and proceeds of sales and maturities of long-term securities (excluding short-term securities and financial futures contracts) for the year ended December 31, 2010 were as follows:
Purchases of
U.S. Government
and Agency
Obligations | | Purchases excluding
U.S. Government
and Agency
Obligations | | Sales and Maturities
of U.S. Government
and Agency
Obligations | | Sales and Maturities
excluding
U.S. Government
and Agency
Obligations | |
| $ | 140,962,016 | | | $ | 106,897,064 | | | $ | 88,561,690 | | | $ | 136,224,388 | | |
Note D--Fund Share Transactions:
Share activity for the years ended December 31, 2010 and December 31, 2009 was as follows:
| | | For the Year Ended December 31, | |
| | | 2010 | | 2009 | |
| Shares Sold | | | 4,345,642 | | | | 6,933,770 | | |
| Shares Issued on Reinvestment of Dividends and Distributions | | | 1,462,773 | | | | 2,443,758 | | |
| Shares Redeemed | | | (11,347,290 | ) | | | (19,767,237 | ) | |
| Total | | | (5,538,875 | ) | | | (10,389,709 | ) | |
Note E--Line of Credit:
At December 31, 2010, the Fund was a participant in a single committed, unsecured $200,000,000 ($150,000,000 prior to September 17, 2010) line of credit with State Street, to be used only for temporary or emergency purposes. Other investment companies managed by Management also participate in this line of credit on the same terms. Interest is charged on borrowings under this line of credit at the higher of (a) the Federal Funds Rate plus 1.25% per annum or (b) the Overnight LIBOR Rate plus 1.25% per annum. A commitment fee of 0.125% (0.15% prior to September 17, 2010) per annum of the available line of credit is charged, of which each participating Fund has agreed to pay its pro rata share, based on the ratio of its individual net assets to the net assets of all participants at the time the fee is due and payable. The fee is paid quarterly in arrears. Because several mutual funds participate, there is no assurance that an individual Fund will have access to all or any part of the $200,000,000 ($150,000,000 prior to September 17, 2010) at any particular time. There were no loans outstanding pursuant to this line of credit at December 31, 2010. During the year ended December 31, 2010, the Fund did not utilize this line of credit.
20
Financial Highlights
Short Duration Bond Portfolio
The following table includes selected data for a share outstanding throughout each year and other performance information derived from the Financial Statements.
| | | Year Ended December 31, | |
| | | 2010 | | 2009 | | 2008 | | 2007 | | 2006 | |
| Net Asset Value, Beginning of Year | | $ | 11.22 | | | $ | 10.71 | | | $ | 13.00 | | | $ | 12.76 | | | $ | 12.64 | | |
| Income From Investment Operations: | |
| Net Investment Income (Loss)t | | | .24 | | | | .43 | | | | .53 | | | | .59 | | | | .51 | | |
Net Gains or Losses on Securities
(both realized and unrealized) | | | .36 | | | | .98 | | | | (2.23 | ) | | | .02 | | | | .02 | | |
| Total From Investment Operations | | | .60 | | | | 1.41 | | | | (1.70 | ) | | | .61 | | | | .53 | | |
| Less Distributions From: | |
| Net Investment Income | | | (.62 | ) | | | (.90 | ) | | | (.59 | ) | | | (.37 | ) | | | (.41 | ) | |
| Net Asset Value, End of Year | | $ | 11.20 | | | $ | 11.22 | | | $ | 10.71 | | | $ | 13.00 | | | $ | 12.76 | | |
| Total Returntt | | | 5.28 | % | | | 13.33 | % | | | (13.43 | )% | | | 4.77 | % | | | 4.20 | % | |
| Ratios/Supplemental Data | |
| Net Assets, End of Year (in millions) | | $ | 287.3 | | | $ | 350.0 | | | $ | 445.5 | | | $ | 623.0 | | | $ | 418.7 | | |
| Ratio of Gross Expenses to Average Net Assets# | | | .81 | % | | | .79 | % | | | .74 | % | | | .73 | % | | | .75 | % | |
| Ratio of Net Expenses to Average Net Assets | | | .81 | % | | | .79 | %S | | | .74 | % | | | .73 | % | | | .75 | %S | |
Ratio of Net Investment Income (Loss) to Average
Net Assets | | | 2.07 | % | | | 3.87 | % | | | 4.35 | % | | | 4.51 | % | | | 3.97 | % | |
| Portfolio Turnover Rate | | | 70 | % | | | 47 | % | | | 46 | % | | | 69 | % | | | 86 | % | |
See Notes to Financial Highlights
21
Notes to Financial Highlights Short Duration Bond Portfolio
tt Total return based on per share NAV reflects the effects of changes in NAV on the performance of the Fund during each fiscal period and assumes income dividends and other distributions, if any, were reinvested. Results represent past performance and do not guarantee future results. Current returns may be lower or higher than the performance data quoted. Investment returns and principal may fluctuate and shares when redeemed may be worth more or less than original cost. Total return would have been lower if Management had not waived certain expenses. The total return information shown does not reflect charges and other expenses that apply to the separate account or the related insurance policies, and the inclusion of these charges and other expenses would reduce the total return for all fiscal periods shown. For the year ended December 31, 2006, Management reimbursed the Fund for losses incurred in connection with the disposition of foreign currency contracts, which had no impact on total return.
# The Fund is required to calculate an expense ratio without taking into consideration any expense reductions related to expense offset arrangements.
t Calculated based on the average number of shares outstanding during each fiscal period.
S After utilization of the Line of Credit (2006) and/or waiver of a portion of the investment management fee by Management. Had Management not undertaken such actions, and the Fund had not utilized the Line of Credit, the annualized ratios of net expenses to average daily net assets would have been:
| | | Year Ended December 31, | |
| 2009 | | 2008 | | 2007 | | 2006 | |
| | .79 | % | | | -- | | | | -- | | | | .75 | % | |
22
Report of Independent Registered Public Accounting Firm
To the Board of Trustees of
Neuberger Berman Advisers Management Trust and
Shareholders of Short Duration Bond Portfolio
We have audited the accompanying statement of assets and liabilities, including the schedule of investments, of Short Duration Bond Portfolio, one of the series constituting Neuberger Berman Advisers Management Trust (the "Trust"), as of December 31, 2010, and the related statement of operations for the year then ended, the statements of changes in net assets for each of the two years in the period then ended, and the financial highlights for each of the five years in the period then ended. These financial statements and financial highlights are the responsibility of the Trust's management. Our responsibility is to express an opinion on these financial statements and financial highlights based on our audits.
We conducted our audits in accordance with the standards of the Public Company Accounting Oversight Board (United States). Those standards require that we plan and perform the audit to obtain reasonable assurance about whether the financial statements and financial highlights are free of material misstatement. We were not engaged to perform an audit of the Trust's internal control over financial reporting. Our audits included consideration of internal control over financial reporting as a basis for designing audit procedures that are appropriate in the circumstances, but not for the purpose of expressing an opinion on the effectiveness of the Trust's internal control over financial reporting. Accordingly, we express no such opinion. An audit also includes examining, on a test basis, evidence supporting the amounts and disclosures in the financial statements and financial highlights, assessing the accounting principles used and significant estimates made by management, and evaluating the overall financial statement presentation. Our procedures included confirmation of securities owned as of December 31, 2010 by correspondence with the custodian and brokers or by other appropriate auditing procedures where replies from brokers were not received. We believe that our audits provide a reasonable basis for our opinion.
In our opinion, the financial statements and financial highlights referred to above present fairly, in all material respects, the financial position of Short Duration Bond Portfolio, a series of Neuberger Berman Advisers Management Trust, at December 31, 2010, the results of its operations for the year then ended, the changes in its net assets for each of the two years in the period then ended, and the financial highlights for each of the five years in the period then ended, in conformity with U.S. generally accepted accounting principles.

Boston, Massachusetts
February 10, 2011
23
Trustee and Officer Information
The following tables set forth information concerning the trustees and officers of the Trust. All persons named as trustees and officers also serve in similar capacities for other funds administered or managed by Management, Neuberger and NBFI. The Statement of Additional Information includes additional information about trustees and is available upon request, without charge, by calling (800) 877-9700.
Information about the Board of Trustees
Name, (Year of Birth),
and Address(1) | | Position and
Length of
Time Served(2) | | Principal Occupation(s)(3) | | Number of
Funds in Fund
Complex
Overseen by
Trustee | | Other Directorships
Held Outside Fund
Complex by Trustee | |
| Independent Trustees | |
|
| John Cannon (1930) | | Trustee since 2000 | | Consultant; formerly, Chairman, CDC Investment Advisers (registered investment adviser), 1993 to January 1999; formerly, President and Chief Executive Officer, AMA Investment Advisors, an affiliate of the American Medical Association. | | | 43 | | | Formerly, Independent Trustee or Director of three series of Oppenheimer Funds: Oppenheimer Limited Term New York Municipal Fund, Rochester Fund Municipals, and Oppenheimer Convertible Securities Fund, 1992 to 2009. | |
|
| Faith Colish (1935) | | Trustee since 1982 | | Counsel, Carter Ledyard & Milburn LLP (law firm) since October 2002; formerly, Attorney-at-Law and President, Faith Colish, A Professional Corporation, 1980 to 2002. | | | 43 | | | Formerly, Director, 1997 to 2003, and Advisory Director, 2003 to 2006; ABA Retirement Funds (formerly, American Bar Retirement Association) (not-for-profit membership corporation). | |
|
24
Name, (Year of Birth),
and Address(1) | | Position and
Length of
Time Served(2) | | Principal Occupation(s)(3) | | Number of
Funds in Fund
Complex
Overseen by
Trustee | | Other Directorships
Held Outside Fund
Complex by Trustee | |
| Martha C. Goss (1949) | | Trustee since 2007 | | President, Woodhill Enterprises Inc./Chase Hollow Associates LLC (personal investment vehicle), since 2006; Chief Operating and Financial Officer, Hopewell Holdings LLC/Amwell Holdings, LLC (a holding company for a healthcare reinsurance company start-up), since 2003; formerly, Consultant, Resources Connection (temporary staffing), 2002 to 2006. | | | 43 | | | Director, Ocwen Financial Corporation (mortgage servicing), since 2005; Director, American Water (water utility), since 2003; Director, Channel Reinsurance (financial guaranty reinsurance), since 2006; Director, Allianz Life of New York (insurance), since 2005; Director, Financial Women's Association of New York (not-for-profit association), since 2003; Trustee Emerita, Brown University, since 1998; formerly, Advisory Board Member, Attensity (software developer), 2005 to 2007; formerly, Director, Bank Leumi (commercial bank), 2005 to 2007; formerly, Director, Claire's Stores, Inc. (retailer), 2005 to 2007. | |
|
| C. Anne Harvey (1937) | | Trustee since 1998 | | President, C.A. Harvey Associates, since October 2001; formerly, Director, AARP, 1978 to December 2001. | | | 43 | | | Formerly, President, Board of Associates to The National Rehabilitation Hospital's Board of Directors, 2001 to 2002; formerly, Member, Individual Investors Advisory Committee to the New York Stock Exchange Board of Directors, 1998 to 2002. | |
|
25
Name, (Year of Birth),
and Address(1) | | Position and
Length of
Time Served(2) | | Principal Occupation(s)(3) | | Number of
Funds in Fund
Complex
Overseen by
Trustee | | Other Directorships
Held Outside Fund
Complex by Trustee | |
| Robert A. Kavesh (1927) | | Trustee since 2000 | | Retired; Marcus Nadler Professor Emeritus of Finance and Economics, New York University Stern School of Business; formerly, Executive Secretary-Treasurer, American Finance Association, 1961 to 1979. | | | 43 | | | Formerly, Director, The Caring Community (not-for-profit), 1997 to 2006; formerly, Director, DEL Laboratories, Inc. (cosmetics and pharmaceuticals), 1978 to 2004; formerly, Director, Apple Bank for Savings, 1979 to 1990; formerly, Director, Western Pacific Industries, Inc., (public company), 1972 to 1986. | |
|
| Michael M. Knetter (1960) | | Trustee since 2007 | | President and Chief Executive Officer, University of Wisconsin Foundation, October 2010 to Present; formerly, Dean, School of Business, University of Wisconsin - Madison; formerly, Professor of International Economics and Associate Dean, Amos Tuck School of Business - Dartmouth College, 1998 to 2002. | | | 43 | | | Director, American Family Insurance (a mutual company, not publicly traded), since March 2009; Trustee, Northwestern Mutual Series Fund, Inc., since February 2007; Director, Wausau Paper, since 2005; formerly, Director, Great Wolf Resorts, 2004 to 2009. | |
|
| Howard A. Mileaf (1937) | | Trustee since 1999 | | Retired; formerly, Vice President and General Counsel, WHX Corporation (holding company), 1993 to 2001. | | | 43 | | | Formerly, Director, Webfinancial Corporation (holding company), 2002 to 2008; formerly, Director, WHX Corporation (holding company), 2002 to 2005; formerly, Director, State Theatre of New Jersey (not-for-profit theatre), 2000 to 2005. | |
|
| George W. Morriss (1947) | | Trustee since 2007 | | Retired; formerly, Executive Vice President and Chief Financial Officer, People's Bank, Connecticut (a financial services company), 1991 to 2001. | | | 43 | | | Manager, Old Mutual Funds of Hedge Funds fund complex (consisting of six funds), since 2006 for four funds and since 2007 for two funds; formerly, Member NASDAQ Issuers' Affairs Committee, 1995 to 2003. | |
|
26
Name, (Year of Birth),
and Address(1) | | Position and
Length of
Time Served(2) | | Principal Occupation(s)(3) | | Number of
Funds in Fund
Complex
Overseen by
Trustee | | Other Directorships
Held Outside Fund
Complex by Trustee | |
| Edward I. O'Brien (1928) | | Trustee since 2000 | | Retired; formerly, Member, Investment Policy Committee, Edward Jones, 1993 to 2001; President, Securities Industry Association ("SIA") (securities industry's representative in government relations and regulatory matters at the federal and state levels), 1974 to 1992; Adviser to SIA, November 1992 to November 1993. | | | 43 | | | Formerly, Director, Legg Mason, Inc. (financial services holding company), 1993 to July 2008; formerly, Director, Boston Financial Group (real estate and tax shelters), 1993 to 1999. | |
|
| Cornelius T. Ryan (1931) | | Trustee since 2000 | | General Partner and Adviser, TD2, TD3, and TOF1 Healthcare Venture Capital Partnerships; Founding General Partner, Oxford Partners and Oxford Bioscience Partners (venture capital investing) and President, Oxford Venture Corporation, since 1981. | | | 43 | | | Trustee, Norwalk Hospital Foundation, since 2000; Director, Supply Pro (privately held company), since 2008; formerly, Trustee, Norwalk Hospital, 1995 to 2004; formerly, President and Director, Randolph Computer Corp., 1966 to 1984; formerly, Director of numerous privately held portfolio companies of Oxford Partners and Oxford Bioscience Partners, 1981 to 2005. | |
|
| Tom D. Seip (1950) | | Trustee since 2000; Chairman of the Board since 2008; Lead Independent Trustee from 2006 to 2008 | | General Partner, Seip Investments LP (a private investment partnership); formerly, President and CEO, Westaff, Inc. (temporary staffing), May 2001 to January 2002; formerly, Senior Executive, The Charles Schwab Corporation, 1983 to 1998, including Chief Executive Officer, Charles Schwab Investment Management, Inc.; Trustee, Schwab Family of Funds and Schwab Investments, 1997 to 1998; and Executive Vice President-Retail Brokerage, Charles Schwab & Co., Inc., 1994 to 1997. | | | 43 | | | Director, H&R Block, Inc. (financial services company), since May 2001; Chairman, Compensation Committee, H&R Block, Inc., since 2006; formerly, Director, Forward Management, Inc. (asset management company), 1999 to 2006. | |
|
27
Name, (Year of Birth),
and Address(1) | | Position and
Length of
Time Served(2) | | Principal Occupation(s)(3) | | Number of
Funds in Fund
Complex
Overseen by
Trustee | | Other Directorships
Held Outside Fund
Complex by Trustee | |
| Candace L. Straight (1947) | | Trustee since 1999 | | Private investor and consultant specializing in the insurance industry; formerly, Advisory Director, Securitas Capital LLC (a global private equity investment firm dedicated to making investments in the insurance sector), 1998 to December 2003. | | | 43 | | | Director, Montpelier Re Holdings Ltd. (reinsurance company), since 2006; formerly, Director, National Atlantic Holdings Corporation (property and casualty insurance company), 2004 to 2008; formerly, Director, The Proformance Insurance Company (property and casualty insurance company), 2004 to 2008; formerly, Director, Providence Washington Insurance Company (property and casualty insurance company), 1998 to 2006; formerly, Director, Summit Global Partners (insurance brokerage firm), 2000 to 2005. | |
|
| Peter P. Trapp (1944) | | Trustee since 1984 | | Retired; formerly, Regional Manager for Mid-Southern Region, Ford Motor Credit Company, September 1997 to 2007; formerly, President, Ford Life Insurance Company, April 1995 to August 1997. | | | 43 | | | None. | |
|
28
Name, (Year of Birth),
and Address(1) | | Position and
Length of
Time Served(2) | | Principal Occupation(s)(3) | | Number of
Funds in Fund
Complex
Overseen by
Trustee | | Other Directorships
Held Outside Fund
Complex by Trustee | |
| Trustees who are "Interested Persons" | |
|
| Joseph V. Amato* (1962) | | Trustee since 2009 | | President and Director, Neuberger Berman Group LLC, since 2009; President and Chief Executive Officer, Neuberger and Neuberger Berman Holdings LLC (including its predecessor, Neuberger Berman Inc.), since 2007; Chief Investment Officer, Neuberger, since 2009; Chief Investment Officer (Equities) and Managing Director, Management, since 2009; Managing Director, NBFI, since 2007; Board member of NBFI since 2006; formerly, Global Head of Asset Management of LBHI's Investment Management Division, 2006 to 2009; formerly, member of LBHI's Investment Management Division's Executive Management Committee, 2006 to 2009; formerly, Managing Director, Lehman Brothers Inc. ("LBI"), 2006 to 2008; formerly, Chief Recruiting and Development Officer, LBI, 2005 to 2006; formerly, Global Head of LBI's Equity Sales and a Member of its Equities Division Executive Committee, 2003 to 2005. | | | 43 | | | Member of Board of Advisors, McDonough School of Business, Georgetown University, since 2001; Member of New York City Board of Advisors, Teach for America, since 2005; Trustee, Montclair Kimberley Academy (private school), since 2007. | |
|
29
Name, (Year of Birth),
and Address(1) | | Position and
Length of
Time Served(2) | | Principal Occupation(s)(3) | | Number of
Funds in Fund
Complex
Overseen by
Trustee | | Other Directorships
Held Outside Fund
Complex by Trustee | |
| Robert Conti* (1956) | | Chief Executive Officer, President and Trustee since 2008; prior thereto, Executive Vice President in 2008 and Vice President, 2000 to 2008 | | Managing Director, Neuberger, since 2007; formerly, Senior Vice President, Neuberger, 2003 to 2006; formerly, Vice President, Neuberger, 1999 to 2003; President and Chief Executive Officer, Management, since 2008; formerly, Senior Vice President, Management, 2000 to 2008. | | | 43 | | | Chairman of the Board, Staten Island Mental Health Society since 2008. | |
|
| Jack L. Rivkin* (1940) | | Trustee since 2002; President, 2002 to 2008 | | Formerly, Executive Vice President and Chief Investment Officer, Neuberger Berman Holdings LLC (holding company), 2002 to August 2008 and 2003 to August 2008, respectively; formerly, Managing Director and Chief Investment Officer, Neuberger, December 2005 to August 2008 and 2003 to August 2008, respectively; formerly, Executive Vice President, Neuberger, December 2002 to 2005; formerly, Director and Chairman, Management, December 2002 to August 2008; formerly, Executive Vice President, Citigroup Investments, Inc., September 1995 to February 2002; formerly, Executive Vice President, Citigroup Inc., September 1995 to February 2002. | | | 43 | | | Director, Idealab (private company), since 2009; Director, Distributed World Power (private company), since 2009; Director, Dale Carnegie and Associates, Inc. (private company), since 1999; Director, Solbright, Inc. (private company), since 1998; Director, SA Agricultural Fund, since 2009; Chairman and Director, Essential Brands (consumer products) since 2008; formerly, Director, New York Society of Security Analysts, 2006 to 2008. | |
|
(1) The business address of each listed person is 605 Third Avenue, New York, New York 10158.
(2) Pursuant to the Trust's Trust Instrument, each of these Trustees shall hold office for life or until his or her successor is elected or the Trust terminates; except that (a) any Trustee may resign by delivering a written resignation; (b) any Trustee may be removed with or without cause at any time by a written instrument signed by at least two-thirds of the other Trustees; (c) any Trustee who requests to be retired, or who has become unable to serve, may be retired by a written instrument signed by a majority of the other Trustees; and (d) any Trustee may be removed at any shareholder meeting by a vote of at least two-thirds of the outstanding shares.
30
(3) Except as otherwise indicated, each individual has held the positions shown for at least the last five years.
* Indicates a Trustee who is an "interested person" within the meaning of the 1940 Act. Mr. Amato and Mr. Conti are interested persons of the Trust by virtue of the fact that each is an officer of Management, Neuberger and/or their affiliates. Mr. Rivkin may be deemed an interested person of the Trust by virtue of the fact that, until August 2008, he was a director of Management and an officer of Neuberger.
31
Information about the Officers of the Trust
Name, (Year of Birth),
and Address(1) | | Position and
Length of Time
Served(2) | | Principal Occupation(s)(3) | |
| Andrew B. Allard (1961) | | Anti-Money Laundering Compliance Officer since 2002 | | Senior Vice President, Neuberger, since 2006; Deputy General Counsel, Neuberger, since 2004; formerly, Vice President, Neuberger, 2000 to 2005; Anti-Money Laundering Compliance Officer, nine registered investment companies for which Management acts as investment manager and administrator (six since 2002, one since 2003, one since 2005 and one since 2006). | |
|
| Claudia A. Brandon (1956) | | Executive Vice President since 2008 and Secretary since 1985 | | Senior Vice President, Neuberger, since 2007 and Employee since 1999; Senior Vice President, Management, since 2008 and Assistant Secretary since 2004; formerly, Vice President, Neuberger, 2002 to 2006; formerly, Vice President-Mutual Fund Board Relations, Management, 2000 to 2008; Executive Vice President, nine registered investment companies for which Management acts as investment manager and administrator (nine since 2008); Secretary, nine registered investment companies for which Management acts as investment manager and administrator (three since 1985, three since 2002, one since 2003, one since 2005 and one since 2006). | |
|
| Maxine L. Gerson (1950) | | Executive Vice President since 2008 and Chief Legal Officer since 2005 (only for purposes of sections 307 and 406 of the Sarbanes-Oxley Act of 2002) | | Managing Director, Neuberger, since 2009, and Deputy General Counsel and Assistant Secretary Neuberger since 2001; Managing Director, Management, since 2009, and Secretary and General Counsel, Management, since 2004; formerly, Senior Vice President, Neuberger, 2002 to 2009; formerly, Senior Vice President, Management, 2006 to 2009; Executive Vice President, nine registered investment companies for which Management acts as investment manager and administrator (nine since 2008); Chief Legal Officer (only for purposes of sections 307 and 406 of the Sarbanes-Oxley Act of 2002), nine registered investment companies for which Management acts as investment manager and administrator (eight since 2005 and one since 2006). | |
|
| Sheila R. James (1965) | | Assistant Secretary since 2002 | | Vice President, Neuberger, since 2008 and Employee since 1999; formerly, Assistant Vice President, Neuberger, 2007; Assistant Secretary, nine registered investment companies for which Management acts as investment manager and administrator (six since 2002, one since 2003, one since 2005 and one since 2006). | |
|
| Brian Kerrane (1969) | | Vice President since 2008 | | Senior Vice President, Neuberger, since 2006; formerly, Vice President, Neuberger, 2002 to 2006; Vice President, Management, since 2008 and Employee since 1991; Vice President, nine registered investment companies for which Management acts as investment manager and administrator (nine since 2008). | |
|
| Kevin Lyons (1955) | | Assistant Secretary since 2003 | | Assistant Vice President, Neuberger, since 2008 and Employee since 1999; Assistant Secretary, nine registered investment companies for which Management acts as investment manager and administrator (seven since 2003, one since 2005 and one since 2006). | |
|
32
Name, (Year of Birth),
and Address(1) | | Position and
Length of Time
Served(2) | | Principal Occupation(s)(3) | |
| Owen F. McEntee, Jr. (1961) | | Vice President since 2008 | | Vice President, Neuberger, since 2006; Employee, Management, since 1992; Vice President, nine registered investment companies for which Management acts as investment manager and administrator (nine since 2008). | |
|
| John M. McGovern (1970) | | Treasurer and Principal Financial and Accounting Officer since 2005 | | Senior Vice President, Neuberger, since 2007; formerly, Vice President, Neuberger, 2004 to 2006; Employee, Management, since 1993; Treasurer and Principal Financial and Accounting Officer, nine registered investment companies for which Management acts as investment manager and administrator (eight since 2005 and one since 2006); formerly, Assistant Treasurer, eight registered investment companies for which Management acts as investment manager and administrator, 2002 to 2005. | |
|
| Andrew Provencher (1965) | | Vice President since 2008 | | Managing Director, Management, since 2008; Managing Director, Neuberger, since 2005; formerly, Senior Vice President, Neuberger, 2003 to 2005; Vice President, nine registered investment companies for which Management acts as investment manager and administrator (nine since 2008). | |
|
| Frank Rosato (1971) | | Assistant Treasurer since 2005 | | Vice President, Neuberger, since 2006; Employee, Management, since 1995; Assistant Treasurer, nine registered investment companies for which Management acts as investment manager and administrator (eight since 2005 and one since 2006). | |
|
| Neil S. Siegel (1967) | | Vice President since 2008 | | Managing Director, Management, since 2008; Managing Director, Neuberger, since 2006; formerly, Senior Vice President, Neuberger, 2004 to 2006; Vice President, nine registered investment companies for which Management acts as investment manager and administrator (nine since 2008). | |
|
| Chamaine Williams (1971) | | Chief Compliance Officer since 2005 | | Senior Vice President, Neuberger, since 2007; Chief Compliance Officer, Management, since 2006; Chief Compliance Officer, nine registered investment companies for which Management acts as investment manager and administrator (eight since 2005 and one since 2006); formerly, Senior Vice President, LBI, 2007 to 2008; formerly, Vice President, LBI, 2003 to 2006; formerly, Chief Compliance Officer, Lehman Brothers Asset Management Inc., 2003 to 2007; formerly, Chief Compliance Officer, Lehman Brothers Alternative Investment Management LLC, 2003 to 2007. | |
|
(1) The business address of each listed person is 605 Third Avenue, New York, New York 10158.
(2) Pursuant to the By-Laws of the Trust, each officer elected by the Trustees shall hold office until his or her successor shall have been elected and qualified or until his or her earlier death, inability to serve, or resignation. Officers serve at the pleasure of the Trustees and may be removed at any time with or without cause.
(3) Except as otherwise indicated, each individual has held the positions shown for at least the last five years.
33
Proxy Voting Policies and Procedures
A description of the policies and procedures that the Trust uses to determine how to vote proxies relating to portfolio securities is available, without charge, by calling 1-800-877-9700 (toll-free) and on the website of the Securities and Exchange Commission, at www.sec.gov. Information regarding how the Trust voted proxies relating to portfolio securities during the most recent 12-month period ended June 30 is also available, without charge, by calling 1-800-877-9700 (toll-free), on the website of the Securities and Exchange Commission at www.sec.gov, and on Management's website at www.nb.com.
Quarterly Portfolio Schedule
The Trust files a complete schedule of portfolio holdings for the Fund with the Securities and Exchange Commission for the first and third quarters of each fiscal year on Form N-Q. The Trust's Forms N-Q are available on the Securities and Exchange Commission's website at www.sec.gov and may be reviewed and copied at the Securities and Exchange Commission's Public Reference Room in Washington, DC. Information on the operation of the Public Reference Room may be obtained by calling 1-800-SEC-0330. The information on Form N-Q is available upon request, without charge, by calling 1-800-877-9700 (toll free).
Board Consideration of the Management and Sub-Advisory Agreements
At a meeting held on October 14, 2010, the Board, including the Trustees who are not "interested persons" of Management (including its affiliates) or Neuberger Berman Advisers Management Trust ("Independent Fund Trustees"), approved the continuance of the Management and Sub-Advisory Agreements ("Agreements") for the Fund.
In evaluating the Agreements, the Board, including the Independent Fund Trustees, reviewed materials furnished by Management and NBFI in response to questions submitted by counsel for the Independent Fund Trustees, and met with senior representatives of Management and NBFI regarding their personnel and operations. The Independent Fund Trustees were advised by counsel that is experienced in 1940 Act matters and that is independent of Management and NBFI. The Independent Fund Trustees received a memorandum from independent counsel discussing the legal standards for their consideration of the proposed continuance of the Agreements. They met with such counsel separately from representatives of Management to discuss the annual contract review. The annual contract review extends over two regular meetings of the Board to ensure that Management and NBFI have time to respond to any questions the Independent Fund Trustees may have on their initial review of the report and that the Independent Fund Trustees have time to consider those responses. In addition, during this process, the Board held a separate meeting devoted primarily to reviewing and discussing Fund performance.
The Board considered the following factors, among others, in connection with its approval of the continuance of the Agreements: (1) the nature, extent, and quality of the services provided by Management and NBFI; (2) the performance of the Fund compared to a relevant market index and a peer group of investment companies; (3) the costs of the services provided and profits or losses realized by Management and its affiliates from their relationship with the Fund; (4) the extent to which economies of scale might be realized as the Fund grows; and (5) whether fee levels reflect any such potential economies of scale for the benefit of investors in the Fund. In their deliberations, the Board members did not identify any particular information that was all-important or controlling, and each Trustee may have attributed different weights to the various factors.
The Board evaluated the terms of the Agreements, the overall fairness of the Agreements to the Fund and whether the Agreements were in the best interests of the Fund and its shareholders.
With respect to the nature, extent and quality of the services provided, the Board considered the performance of the Fund and the experience and staffing of the portfolio management and investment research personnel of Management and NBFI who perform services for the Fund. The Board noted that Management also provides certain administrative
34
services, including fund accounting and compliance oversight. In addition, the Board noted the positive compliance history of Management and NBFI, as each firm has been free of significant reported compliance problems.
The Board considered the performance of the Fund relative to its benchmark and a peer group of investment companies dedicated to insurance products pursuing broadly similar strategies. The Board also considered performance in relation to certain measures of the degree of investment risk undertaken by the portfolio managers.
With respect to the overall fairness of the Agreements, the Board considered the fee structure for the Fund under the Agreements as compared to a peer group of comparable funds dedicated to insurance products and any fall-out benefits likely to accrue to Management or NBFI or their affiliates from their relationship with the Fund. The Board also considered the profitability of Management and its affiliates from their association with the Fund.
The Board reviewed a comparison of the Fund's management fee and overall expense ratio to a peer group of broadly comparable funds dedicated to insurance products. The Board considered the mean and median of the management fees and expense ratios of the peer group. The Board noted that the Fund's management fee was higher than the peer group mean and median. The Board considered whether specific portfolio management or administration needs contributed to the management fee. With regard to the sub-advisory fee paid to NBFI, the Board noted that this fee is "at cost." In addition, the Board considered the contractual limit on Fund expenses undertaken by Management.
The Board considered whether there were other funds that were advised or sub-advised by Management or its affiliates or separate accounts managed by Management or its affiliates with similar investment objectives, policies and strategies to the Fund. The Board noted that there were no comparable sub-advised funds. The Board compared the fees charged to the Fund to the fees charged to an advised fund and a separate account, each managed in a similar style to the Fund. The Board considered the appropriateness and reasonableness of any differences between the fees charged to the Fund and the other fund and the separate account and determined that the differences in fees were consistent with the management and other services provided.
The Board also evaluated any apparent or anticipated economies of scale in relation to the services Management provides to the Fund. The Board considered whether the Fund's fee structure provides for a reduction of payments resulting from the use of breakpoints and whether those breakpoints are set at appropriate asset levels.
The Board also considered changes in management, staffing, resources and operations accompanying the separation of the Neuberger Berman entities from the LBHI bankruptcy estate.
In concluding that the benefits accruing to Management and its affiliates by virtue of their relationship to the Fund were reasonable in comparison with the costs of providing the investment advisory services and the benefits accruing to the Fund, the Board reviewed specific data as to Management's profit on the Fund for a recent period and the trend in profit or loss over recent years. The Board also carefully examined Management's cost allocation methodology. The Board recognized that Management should be entitled to earn a reasonable level of profits for services it provides to the Fund and, based on its review, concluded that Management's level of profitability was not excessive.
Conclusions
In approving the Agreements, the Board concluded that the terms of each Agreement are fair and reasonable and that approval of the Agreements is in the best interests of the Fund and its shareholders. In reaching this determination, the Board considered that Management and NBFI could be expected to provide a high level of service to the Fund; that the performance of the Fund was satisfactory over time; that the Fund's fee structure appeared to the Board to be reasonable given the nature and quality of services provided; and that the benefits accruing to Management and its affiliates by virtue of their relationship to the Fund were reasonable in comparison with the benefits accruing to the Fund.
35

Neuberger Berman
Advisers Management Trust
Small-Cap Growth Portfolio
S Class Shares
Annual Report
December 31, 2010
Small-Cap Growth Portfolio Manager's Commentary
The Neuberger Berman Advisers Management Trust (AMT) Small-Cap Growth Portfolio posted a strong absolute return for full-year 2010 but underperformed its benchmark, the Russell 2000(R) Growth Index.
2010 was volatile for small-cap stocks, with three distinct periods. In the first few months of the year, the Russell 2000 Growth Index rose meaningfully, as many of the factors powering 2009 results extended into 2010. The index gave back these gains in the late spring and summer as concern over the weakening Euro and European sovereign debt weighed heavily on the domestic market. Then in the fall, remarks from Federal Reserve Chairman Bernanke about a second round of quantitative easing, a more neutral regulatory stance from Washington following November's elections, and the extension of Bush-era tax cuts re-ignited the markets, especially for asset classes such as small-cap stocks.
The Portfolio underperformed its benchmark for the year primarily because lower quality factors continued to dominate index returns. For example, as we prefer more seasoned companies with longer track records, approximately 70% of the holdings in the Portfolio had a market cap greater than $1 billion, compared to only about 50% for the index. The larger market cap names underperformed the market, presenting a clear headwind relative to the index. Additionally, the correlation among returns for small cap stocks was at a 25-year high, meaning that the market was not compensating investors for stock picking skills. For a strategy like ours--which benefits from identifying companies with long-term growth prospects, fundamentals, and earnings--close correlation was another relative disadvantage.
Though most of what we do is individual stock selection, we were overweighted in several themes, relative to the benchmark, this period. Within Energy, our focus was on-shore rapid production growth companies, and in Information Technology (IT), it was IT outsourcing and mobile computing. We were underweighted in Financials, as is typical, as there are few high growth opportunities within the sector.
For the year, holdings within Health Care, Energy and Consumer Staples outperformed, but their positive effect was offset by disappointments within the Consumer Discretionary and IT sectors.
Within Consumer Discretionary, one area that hurt performance was the longer-term education theme. For-profit secondary education names such as Capella Education, which we sold, have been under intense regulatory scrutiny, impacting growth and performance. Auction house Sotheby's was another disappointment within the sector and we sold the position.
Within IT, although a number of our top contributors came from the themes already mentioned, Compellent Technologies, a data storage company that we sold, was the biggest detractor for the year. Compellent reported disappointing earnings as price competition increased. Atheros, GSI Commerce and Plexus also underperformed, which pressured performance in the sector overall.
Positive sectors included Health Care, with the Portfolio benefiting from a variety of holdings, including ev3 and Odyssey Healthcare, which were taken over, as well as Cyberonics, an epilepsy-focused firm, and Alexion, a biotech manufacturer of long-patent orphan drugs.
Within Energy, our bias toward lower-risk, on-shore higher production growth rate names paid off. Rosetta Resources, Brigham Exploration and Concho Resources did well primarily on the strength of their businesses and increasing oil prices.
In Consumer Staples, where we typically have a harder time finding growth rates that meet our requirements, selected names including Diamond Foods, TreeHouse Foods and Fresh Market showed nice appreciation and made positive contributions to results.
As we look across our sector weights and individual holdings, we are currently optimistic that the Portfolio should do well going forward. We had previously expected 2010 to look like 2004, another second year of a recovery, in which higher-quality growth strategies such as ours outperformed. Instead, in our opinion, the steep bear market in 2008 combined with a very accommodative stance by the Federal Reserve led to an extended rally in lower-quality equities during 2010. Many of
1
these lower-quality stocks have appreciated significantly over the past couple of years--historically the point in the cycle when the market shifts toward higher-quality names.
Despite recent progress, we think economic growth may be uneven as the easy gains coming out of the recession have already been realized. While we think GDP will continue to rise in 2011--albeit at a slower rate than in past recovery periods--we also expect that earnings growth will be a little harder to come by. In such an environment, we expect the market should gravitate toward companies that can grow earnings organically. We believe the less cyclical, higher-quality organic growth companies we target are likely to be well rewarded in what we foresee will be a more fundamentals-driven year for the small-cap growth market.
Sincerely,

David H. Burshtan
Portfolio Manager
The risks involved in seeking capital appreciation from investments primarily in companies with small-market capitalization are set forth in the prospectus and statement of additional information.
Small-capitalization stocks are more vulnerable to financial risks and other risks than larger stocks. They are generally less liquid than larger stocks, so their market prices tend to be more volatile.
The composition, industries and holdings of the Portfolio are subject to change. The AMT Small-Cap Growth Portfolio is invested in a wide array of stocks and no single holding makes up a significant portion of the Portfolio's total assets.
2
Small-Cap Growth Portfolio (Unaudited)
SECTOR ALLOCATION
| (% of Total Investments) | |
| Consumer Discretionary | | | 15.8 | % | |
| Consumer Staples | | | 3.9 | | |
| Energy | | | 5.9 | | |
| Financials | | | 1.9 | | |
| Health Care | | | 15.4 | | |
| Industrials | | | 15.8 | | |
| Information Technology | | | 24.5 | | |
| Materials | | | 5.5 | | |
| Short-Term | | | 11.3 | | |
| Total | | | 100.0 | % | |
PERFORMANCE HIGHLIGHTS1
| | |
| | Average Annual Total Return
Ended 12/31/2010 | |
| | | Inception
Date | | 1 Year | | 5 Years | | Life of
Fund* | |
| Small-Cap Growth Portfolio Class S | | 07/12/2002 | | | 19.61 | % | | | -1.23 | % | | | 3.54 | % | |
| Russell 2000(R) Growth Index2 | | | | | | | 29.09 | % | | | 5.30 | % | | | 9.54 | % | |
| Russell 2000(R) Index2 | | | | | | | 26.85 | % | | | 4.47 | % | | | 9.14 | % | |
Performance data quoted represent past performance, which is no guarantee of future results. The investment return and principal value of an investment will fluctuate so that an investor's shares, when redeemed, may be worth more or less than their original cost. Results are shown on a "total return" basis and include reinvestment of all income dividends and distributions.
Current performance may be lower or higher than the performance data quoted. For performance data current to the most recent month end, please visit https://www.nb.com.
* Index returns are as of the inception date 07/12/2002.
As stated in the Portfolio's most recent prospectus, the total annual operating expense ratio for fiscal year 2009 was 2.47% for Class S shares (prior to any fee waivers or expense reimbursements). Neuberger Berman Management LLC has contractually agreed to limit certain expenses of the Portfolio through 12/31/2013.
COMPARISON OF A $10,000 INVESTMENT
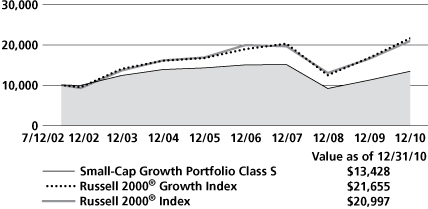
This chart shows the value of a hypothetical $10,000 investment in the Portfolio over the past 10 fiscal years, or since the Portfolio's inception, if it has not operated for 10 years. The result is compared with one or more benchmarks, which may include a broad-based market index and/or a narrower index. Please note that market indices have not been reduced to reflect any of the fees and costs of investing. All results include the reinvestment of income dividends and distributions. Neither the Portfolio's returns nor the market indices shown in the graph and table reflect the effect of taxes an investor would pay on Portfolio distributions or on the redemption of Portfolio shares. Results represent past performance and do not indicate future results.
Please see Endnotes for additional information.
3
Endnotes
1 "Total Return" includes reinvestment of all income dividends and distributions. Results represent past performance and do not indicate future results. The value of an investment in the Portfolio and the return on the investment both will fluctuate, and redemption proceeds may be higher or lower than an investor's original cost. The performance information does not reflect fees and expenses of the variable annuity and variable life insurance policies or the qualified pension and retirement plans whose proceeds are invested in the Portfolio. Neuberger Berman Management LLC ("NBM LLC") has agreed to absorb certain expenses of the AMT Portfolios, including the Portfolio. Without this arrangement, which is subject to change, the total returns of the Portfolio may have been less.
2 The Russell 2000(R) Growth Index measures the performance of those Russell 2000(R) Index companies with higher price-to-book ratios and higher forecasted growth values. The Russell 2000 Index is an unmanaged index consisting of the securities of the 2000 issuers having the smallest capitalization in the Russell 3000(R) Index, representing approximately 8% of the Russell 3000 total market capitalization. As of the latest reconstitution the smallest company's market capitalization was roughly $112 million. Please note that indices do not take into account any fees and expenses of investing in the individual securities that they track and that individuals cannot invest directly in any index. Data about the performance of these indices are prepared or obtained by NBM LLC and include reinvestment of all income dividends and distributions. The Fund may invest in many securities not included in the above-described indices or may not invest in all securities included in the above-described indices.
Any ratios or other measurements using a factor of forecasted earnings of a company discussed herein are based on consensus estimates, not NBM LLC's own projections, and they may or may not be realized. In addition, any revision to a forecast could affect the market price of a security. By quoting them herein, NBM LLC does not offer an opinion as to the accuracy of and does not guarantee these forecasted numbers.
The investments for the Portfolio are managed by the same portfolio manager(s) who manage one or more other mutual funds that have similar names, investment objectives and investment styles as the Portfolio. You should be aware that the Portfolio is likely to differ from the other mutual funds in size, cash flow pattern and tax matters. Accordingly, the holdings and performance can be expected to vary from those of the other mutual funds.
The composition, industries and holdings of the Portfolio are subject to change.
Shares of the separate AMT Portfolios are not available to the general public. Shares of this Portfolio may be purchased only by life insurance companies to be used with their separate accounts that fund variable annuity and variable life insurance policies and by qualified pension and retirement plans.
Statistics and projections in this report are derived from sources deemed to be reliable but cannot be regarded as a representation of future results of the AMT Portfolios. This report is prepared for the general information of shareholders and is not an offer of shares of the AMT Portfolios. Shares of the AMT Portfolios are sold only through the currently effective prospectuses, which must precede or accompany this report.
The "Neuberger Berman" name and logo are registered service marks of Neuberger Berman Group LLC. "Neuberger Berman Management LLC" and the individual Fund names in this piece are either service marks or registered service marks of Neuberger Berman Management LLC.
(c) 2011 Neuberger Berman Management LLC distributor. All rights reserved.
4
Information About Your Fund's Expenses
This table is designed to provide information regarding costs related to your investments. All mutual funds incur operating expenses, which include management fees, fees for administrative services and costs of shareholder reports, among others. The following examples are based on an investment of $1,000 made at the beginning of the six month period ended December 31, 2010 and held for the entire period. The table illustrates the fund's costs in two ways:
| Actual Expenses and Performance: | | The first section of the table provides information about actual account values and actual expenses in dollars, based on the fund's actual performance during the period. You may use the information in this line, together with the amount you invested, to estimate the expenses you paid over the period. Simply divide your account value by $1,000 (for example, an $8,600 account value divided by $1,000 = 8.6), then multiply the result by the number in the first section of the table under the heading entitled "Expenses Paid During the Period" to estimate the expenses you paid over the period. | |
|
Hypothetical Example for
Comparison Purposes: | | The second section of the table provides information about hypothetical account values and hypothetical expenses based on the fund's actual expense ratio and an assumed rate of return at 5% per year before expenses. This return is not the fund's actual return. The hypothetical account values and expenses may not be used to estimate the actual ending account balance or expenses you paid for the period. You may use this information to compare the ongoing costs of investing in this fund versus other funds. To do so, compare the expenses shown in this 5% hypothetical example with the 5% hypothetical examples that appear in the shareholder reports of other funds. | |
|
Please note that the expenses in the table are meant to highlight your ongoing costs only. The table and expense example do not include any transaction costs, such as fees and expenses that are, or may be, imposed under your variable contract or qualified pension plan. Therefore, the information under the heading "Hypothetical (5% annual return before expenses)" is useful in comparing ongoing costs only, and will not help you determine the relative total costs of owning different funds. In addition, if these transaction costs were included, your costs would have been higher.
Expense Information as of 12/31/10 (Unaudited)
NEUBERGER BERMAN ADVISERS MANAGEMENT TRUST SMALL-CAP GROWTH PORTFOLIO
| Actual | | Beginning Account
Value
7/1/10 | | Ending Account
Value
12/31/10 | | Expenses Paid During
the Period*
7/1/10 - 12/31/10 | |
| Class S | | $ | 1,000.00 | | | $ | 1,273.10 | | | $ | 8.02 | | |
| Hypothetical (5% annual return before expenses)** | |
| Class S | | $ | 1,000.00 | | | $ | 1,018.15 | | | $ | 7.12 | | |
* Expenses are equal to the annualized expense ratio of 1.40%, multiplied by the average account value over the period, multiplied by 184/365 (to reflect the one-half year period shown).
** Hypothetical 5% annual return before expenses is calculated by multiplying the number of days in the most recent half year divided by 365.
5
Schedule of Investments Small-Cap Growth Portfolio
| NUMBER OF SHARES | | | | VALUEt | |
| Common Stocks (89.3%) | | | |
| Aerospace & Defense (4.7%) | | | |
| | 7,300 | | | BE Aerospace | | $ | 270,319 | * | |
| | 15,200 | | | Global Defense Technology &
Systems | | | 256,272 | * | |
| | 9,175 | | | HEICO Corp. | | | 468,200 | | |
| | | | 994,791 | | |
| Air Freight & Logistics (1.3%) | | | |
| | 7,900 | | | Hub Group Class A | | | 277,606 | * | |
| Biotechnology (1.0%) | | | |
| | 2,700 | | | Alexion Pharmaceuticals | | | 217,485 | * | |
| Capital Markets (0.8%) | | | |
| | 17,200 | | | HFF Inc. Class A | | | 166,152 | * | |
| Chemicals (3.4%) | | | |
| | 12,300 | | | Ferro Corporation | | | 180,072 | * | |
| | 7,400 | | | Sensient Technologies | | | 271,802 | | |
| | 11,600 | | | Solutia Inc. | | | 267,728 | * | |
| | | | 719,602 | | |
| Commercial Services & Supplies (1.1%) | | | |
| | 9,500 | | | Team, Inc. | | | 229,900 | * | |
| Communications Equipment (4.1%) | | | |
| | 9,800 | | | Aruba Networks | | | 204,624 | * | |
| | 7,300 | | | NETGEAR, Inc. | | | 245,864 | * | |
| | 5,200 | | | RADWARE Ltd. | | | 195,052 | * | |
| | 5,900 | | | Riverbed Technology | | | 207,503 | * | |
| | | | 853,043 | | |
| Diversified Consumer Services (1.7%) | | | |
| | 7,700 | | | Steiner Leisure | | | 359,590 | * | |
| Diversified Financial Services (1.1%) | | | |
| | 3,000 | | | Portfolio Recovery Associates | | | 225,600 | * | |
| Electrical Equipment (2.2%) | | | |
| | 10,000 | | | GrafTech International | | | 198,400 | * | |
| | 6,200 | | | Polypore International | | | 252,526 | * | |
| | | | 450,926 | | |
Electronic Equipment, Instruments &
Components (2.6%) | | | |
| | 5,100 | | | DTS, Inc. | | | 250,155 | * | |
| | 17,500 | | | Newport Corp. | | | 303,975 | * | |
| | | | 554,130 | | |
| NUMBER OF SHARES | | | | VALUEt | |
| Energy Equipment & Services (1.0%) | | | |
| | 5,700 | | | Superior Energy Services | | $ | 199,443 | * | |
| Food & Staples Retailing (1.4%) | | | |
| | 7,200 | | | Fresh Market | | | 296,640 | * | |
| Food Products (2.5%) | | | |
| | 6,200 | | | Diamond Foods | | | 329,716 | | |
| | 3,900 | | | TreeHouse Foods | | | 199,251 | * | |
| | | | 528,967 | | |
| Health Care Equipment & Supplies (6.9%) | | | |
| | 8,600 | | | Cyberonics, Inc. | | | 266,772 | * | |
| | 5,400 | | | Neogen Corporation | | | 221,562 | * | |
| | 8,700 | | | Sirona Dental Systems | | | 363,486 | * | |
| | 10,200 | | | Volcano Corp. | | | 278,562 | * | |
| | 8,600 | | | Zoll Medical | | | 320,178 | * | |
| | | | 1,450,560 | | |
| Health Care Providers & Services (4.7%) | | | |
| | 5,200 | | | Air Methods | | | 292,604 | * | |
| | 4,600 | | | HMS Holdings | | | 297,942 | * | |
| | 10,100 | | | IPC The Hospitalist | | | 394,001 | * | |
| | | | 984,547 | | |
| Health Care Technology (1.5%) | | | |
| | 7,200 | | | SXC Health Solutions | | | 308,592 | * | |
| Hotels, Restaurants & Leisure (4.9%) | | | |
| | 10,300 | | | 7 Days Group Holdings ADR | | | 219,390 | * | |
| | 10,800 | | | Gaylord Entertainment | | | 388,152 | * | |
| | 16,700 | | | Orient-Express Hotels Class A | | | 216,933 | * | |
| | 12,100 | | | Texas Roadhouse | | | 207,757 | * | |
| | | | 1,032,232 | | |
| Internet Software & Services (6.0%) | | | |
| | 8,200 | | | IAC/ InterActiveCorp | | | 235,340 | * | |
| | 23,100 | | | LivePerson, Inc. | | | 261,030 | * | |
| | 6,200 | | | LogMeIn, Inc. | | | 274,908 | * | |
| | 3,200 | | | OpenTable, Inc. | | | 225,536 | * | |
| | 8,100 | | | Rackspace Hosting | | | 254,421 | * | |
| | | | 1,251,235 | | |
| IT Services (2.1%) | | | |
| | 9,900 | | | Camelot Information
Systems ADR | | | 236,808 | * | |
| | 5,200 | | | VeriFone Systems | | | 200,512 | * | |
| | | | 437,320 | | |
See Notes to Schedule of Investments
6
| NUMBER OF SHARES | | | | VALUEt | |
| Machinery (2.5%) | | | |
| | 11,700 | | | Actuant Corp. Class A | | $ | 311,454 | | |
| | 2,300 | | | Nordson Corp. | | | 211,324 | | |
| | | | 522,778 | | |
| Metals & Mining (2.1%) | | | |
| | 10,600 | | | Globe Specialty Metals | | | 181,154 | | |
| | 14,100 | | | Worthington Industries | | | 259,440 | | |
| | | | 440,594 | | |
| Oil, Gas & Consumable Fuels (5.0%) | | | |
| | 10,500 | | | Brigham Exploration | | | 286,020 | * | |
| | 3,200 | | | Clayton Williams Energy | | | 268,704 | * | |
| | 2,400 | | | Concho Resources | | | 210,408 | * | |
| | 7,500 | | | Rosetta Resources | | | 282,300 | * | |
| | | | 1,047,432 | | |
| Pharmaceuticals (1.4%) | | | |
| | 6,400 | | | Salix Pharmaceuticals | | | 300,544 | * | |
| Professional Services (1.3%) | | | |
| | 7,000 | | | Corporate Executive Board | | | 262,850 | | |
| Road & Rail (0.9%) | | | |
| | 5,800 | | | Old Dominion Freight Line | | | 185,542 | * | |
Semiconductors & Semiconductor
Equipment (2.9%) | | | |
| | 5,100 | | | Cavium Networks | | | 192,168 | * | |
| | 4,000 | | | Hittite Microwave | | | 244,160 | * | |
| | 6,000 | | | OmniVision Technologies | | | 177,660 | * | |
| | | | 613,988 | | |
| Software (7.0%) | | | |
| | 6,400 | | | Fortinet Inc. | | | 207,040 | * | |
| | 16,600 | | | SS&C Technologies Holdings | | | 340,466 | * | |
| | 9,900 | | | TIBCO Software | | | 195,129 | * | |
| | 11,600 | | | Ultimate Software Group | | | 564,108 | * | |
| | 4,700 | | | VanceInfo Technologies ADR | | | 162,338 | * | |
| | | | 1,469,081 | | |
| Specialty Retail (6.6%) | | | |
| | 6,600 | | | hhgregg, Inc. | | | 138,270 | * | |
| | 9,300 | | | Hibbett Sports | | | 343,170 | * | |
| | 23,700 | | | PEP Boys-Manny, Moe & Jack | | | 318,291 | | |
| | 6,200 | | | Tractor Supply | | | 300,638 | | |
| | 8,500 | | | Vitamin Shoppe | | | 285,940 | * | |
| | | | 1,386,309 | | |
| Textiles, Apparel & Luxury Goods (2.7%) | | | |
| | 2,700 | | | Deckers Outdoor | | | 215,298 | * | |
| | 4,250 | | | Steven Madden | | | 177,310 | * | |
| | 3,200 | | | Warnaco Group | | | 176,224 | * | |
| | | | 568,832 | | |
| NUMBER OF SHARES | | | | VALUEt | |
| Trading Companies & Distributors (1.9%) | | | |
| | 3,800 | | | MSC Industrial Direct Class A | | $ | 245,822 | | |
| | 2,500 | | | Watsco, Inc. | | | 157,700 | | |
| | | | 403,522 | | |
| | | | | Total Common Stocks
(Cost $14,747,226) | | | 18,739,833 | | |
| Short-Term Investments (11.4%) | | | |
| | | | | State Street Institutional
Liquid Reserves Fund
Institutional Class
(Cost $2,382,453) | | | 2,382,453 | | |
| | | | | Total Investments (100.7%)
(Cost $17,129,679) | | | 21,122,286 | ## | |
| | | | | Liabilities, less cash, receivables and
other assets [(0.7%)] | | | (138,930 | ) | |
| | | | | Total Net Assets (100.0%) | | $ | 20,983,356 | | |
See Notes to Schedule of Investments
7
Notes to Schedule of Investments Small-Cap Growth Portfolio
t In accordance with Accounting Standards Codification ("ASC") 820 "Fair Value Measurements and Disclosures" ("ASC 820"), all investments held by Neuberger Berman Advisers Management Trust Small-Cap Growth Portfolio (the "Fund") are carried at the value that Neuberger Berman Management LLC ("Management") believes the Fund would receive upon selling an investment in an orderly transaction to an independent buyer in the principal or most advantageous market for the investment under current market conditions. Various inputs, including the volume and level of activity for the asset or liability in the market, are considered in valuing the Fund's investments, some of which are discussed below. Significant management judgment may be necessary to value investments in accordance with ASC 820.
ASC 820 established a three-tier hierarchy of inputs to create a classification of value measurements for disclosure purposes. The three-tier hierarchy of inputs is summarized in the three broad Levels listed below.
. Level 1 - quoted prices in active markets for identical investments
. Level 2 - other significant observable inputs (including quoted prices for similar investments, interest rates, prepayment speeds, credit risk, amortized cost, etc.)
. Level 3 - significant unobservable inputs (including the Fund's own assumptions in determining the fair value of investments)
The inputs or methodology used for valuing an investment are not necessarily an indication of the risk associated with investing in those securities.
The value of the Fund's investments in equity securities, for which market quotations are readily available, is generally determined by Management by obtaining valuations from an independent pricing service based on the latest sale price quoted in active markets (Level 1 inputs). Securities traded primarily on the NASDAQ Stock Market are normally valued by the Fund at the NASDAQ Official Closing Price ("NOCP") provided by NASDAQ each business day. The NOCP is the most recently reported price as of 4:00:02 p.m., Eastern time, unless that price is outside the range of the "inside" bid and asked prices (i.e., the bid and asked prices that dealers quote to each other when trading for their own accounts); in that case, NASDAQ will adjust the price to equal the inside bid or asked price, whichever is closer. Because of delays in reporting trades, the NOCP may not be based on the price of the last trade to occur before the market closes. If there is no reported sale of a security on a particular day, the independent pricing service may value the security based on reported market quotations.
Management has developed a process to periodically review information provided by independent pricing services for all types of securities.
Investments in State Street Institutional Liquid Reserves Fund Institutional Class are valued using the fund's daily calculated net asset value ("NAV").
For equity securities, if a valuation is not available from an independent pricing service, or if Management has reason to believe that the valuation received does not represent the amount the Fund might reasonably expect to receive on a current sale in an orderly transaction, the Fund seeks to obtain quotations from principal market makers (generally considered Level 3 inputs). If such quotations are not readily available, the security is valued using methods the Board of Trustees of Neuberger Berman Advisers Management Trust (the "Board") has approved on the belief that they reflect fair value. Numerous factors may be considered when determining the fair value of a security based on Level 2 or 3 inputs, including available analyst, media or other reports, trading in futures or ADRs and whether the issuer of the security being fair valued has other securities outstanding.
The value of the Fund's investments in foreign securities is generally determined using the same valuation methods and inputs as other Fund investments, as discussed above. Foreign security prices are expressed in local currency values and are translated from the local currency into U.S. dollars using the exchange rates as of 4:00 p.m., Eastern
See Notes to Financial Statements
8
Notes to Schedule of Investments Small-Cap Growth Portfolio (cont'd)
time. The Board has approved the use of Interactive Data Pricing and Reference Data, Inc. ("Interactive") to assist in determining the fair value of foreign equity securities when changes in the value of a certain index suggest that the closing prices on the foreign exchanges may no longer represent the amount that the Fund could expect to receive for those securities. In this event, Interactive will provide adjusted prices for certain foreign equity securities using a statistical analysis of historical correlations of multiple factors (Level 2 inputs). In the absence of precise information about the market values of these foreign securities as of the close of the New York Stock Exchange, the Board has determined on the basis of available data that prices adjusted in this way are likely to be closer to the prices the Fund could realize on a current sale than are the prices of those securities established at the close of the foreign markets in which the securities primarily trade. These fair value prices are necessarily estimates, and there is no assurance that such a price will be at or close to the price at which the security is next quoted or next trades.
The following is a summary, categorized by Level, of inputs used to value the Fund's investments as of December 31, 2010:
| Asset Valuation Inputs | | Level 1 | | Level 2 | | Level 3 | | Total | |
| Investments: | |
| Common Stocks^ | | $ | 18,739,833 | | | $ | -- | | | $ | -- | | | $ | 18,739,833 | | |
| Short-Term Investments | | | -- | | | | 2,382,453 | | | | -- | | | | 2,382,453 | | |
| Total Investments | | $ | 18,739,833 | | | $ | 2,382,453 | | | $ | -- | | | $ | 21,122,286 | | |
^ The Schedule of Investments provides information on the industry categorization for the portfolio.
The Fund had no significant transfers between Levels 1 and 2 during the year ended December 31, 2010.
## At December 31, 2010, the cost of investments for U.S. federal income tax purposes was $17,238,009. Gross unrealized appreciation of investments was $3,902,526 and gross unrealized depreciation of investments was $18,249, resulting in net unrealized appreciation of $3,884,277, based on cost for U.S. federal income tax purposes.
* Security did not produce income during the last twelve months.
See Notes to Financial Statements
9
Statement of Assets and Liabilities
Neuberger Berman Advisers Management Trust
| | | SMALL-CAP
GROWTH
PORTFOLIO | |
| | | December 31, 2010 | |
| Assets | | | | | |
| Investments in securities, at value* (Notes A & F)-see Schedule of Investments: | |
| Unaffiliated issuers | | $ | 21,122,286 | | |
| Cash | | | 1 | | |
| Dividends and interest receivable | | | 892 | | |
| Receivable for securities sold | | | 159,111 | | |
| Receivable for Fund shares sold | | | 4,850 | | |
| Receivable from Management--net (Note B) | | | 2,820 | | |
| Prepaid expenses and other assets | | | 423 | | |
| Total Assets | | | 21,290,383 | | |
| Liabilities | | | | | |
| Payable for securities purchased | | | 124,407 | | |
| Payable for Fund shares redeemed | | | 120,695 | | |
| Payable to investment manager (Notes A & B) | | | 13,110 | | |
| Accrued expenses and other payables | | | 48,815 | | |
| Total Liabilities | | | 307,027 | | |
| Net Assets at value | | $ | 20,983,356 | | |
| Net Assets consist of: | | | | | |
| Paid-in capital | | $ | 23,960,306 | | |
| Accumulated net realized gains (losses) on investments | | | (6,969,557 | ) | |
| Net unrealized appreciation (depreciation) in value of investments | | | 3,992,607 | | |
| Net Assets at value | | $ | 20,983,356 | | |
| Shares Outstanding ($.001 par value; unlimited shares authorized) | | | 1,711,129 | | |
| Net Asset Value, offering and redemption price per share | | $ | 12.26 | | |
| *Cost of Investments: | | | | | |
| Unaffiliated issuers | | $ | 17,129,679 | | |
See Notes to Financial Statements
10
Statement of Operations
Neuberger Berman Advisers Management Trust
| | | SMALL-CAP
GROWTH
PORTFOLIO | |
| | | For the
Year Ended
December 31, 2010 | |
| Investment Income: | |
| Income (Note A): | |
| Dividend income--unaffiliated issuers | | $ | 37,096 | | |
| Interest Income--unaffiliated issuers | | | 972 | | |
| Income from securities loaned-net (Note F) | | | 1,920 | | |
| Total income | | $ | 39,988 | | |
| Expenses: | |
| Investment management fees (Notes A & B) | | | 135,132 | | |
| Administration fees (Note B) | | | 47,694 | | |
| Distribution fees (Note B) | | | 39,745 | | |
| Audit fees | | | 40,900 | | |
| Custodian fees (Note B) | | | 18,201 | | |
| Insurance expense | | | 1,050 | | |
| Legal fees | | | 7,283 | | |
| Shareholder reports | | | 16,077 | | |
| Trustees' fees and expenses | | | 52,324 | | |
| Miscellaneous | | | 2,132 | | |
| Total expenses | | | 360,538 | | |
| Expenses reimbursed by Management (Note B) | | | (137,598 | ) | |
| Expenses reduced by custodian fee expense offset arrangement (Note B) | | | (5 | ) | |
| Total net expenses | | | 222,935 | | |
| Net investment income (loss) | | $ | (182,947 | ) | |
| Realized and Unrealized Gain (Loss) on Investments (Note A) | |
| Net realized gain (loss) on: | |
| Sales of investment securities of unaffiliated issuers | | | 2,391,706 | | |
| Sales of investment securities of affiliated issuers | | | 2,157 | | |
| Change in net unrealized appreciation (depreciation) in value of: | |
| Unaffiliated investment securities | | | 424,741 | | |
| Net gain (loss) on investments | | | 2,818,604 | | |
| Net increase (decrease) in net assets resulting from operations | | $ | 2,635,657 | | |
See Notes to Financial Statements
11
Statements of Changes in Net Assets
Neuberger Berman Advisers Management Trust
| | | SMALL-CAP GROWTH PORTFOLIO | |
| | | Year Ended
December 31,
2010 | | Year Ended
December 31,
2009 | |
| Increase (Decrease) in Net Assets: | |
| From Operations (Note A): | |
| Net investment income (loss) | | $ | (182,947 | ) | | $ | (148,074 | ) | |
| Net realized gain (loss) on investments | | | 2,393,863 | | | | (743,203 | ) | |
| Change in net unrealized appreciation (depreciation) of investments | | | 424,741 | | | | 3,918,093 | | |
| Net increase (decrease) in net assets resulting from operations | | | 2,635,657 | | | | 3,026,816 | | |
| From Fund Share Transactions (Note D): | |
| Proceeds from shares sold | | | 10,057,048 | | | | 8,974,667 | | |
| Payments for shares redeemed | | | (7,722,546 | ) | | | (8,543,746 | ) | |
| Net increase (decrease) from Fund share transactions | | | 2,334,502 | | | | 430,921 | | |
| Net Increase (Decrease) in Net Assets | | | 4,970,159 | | | | 3,457,737 | | |
| Net Assets: | |
| Beginning of year | | | 16,013,197 | | | | 12,555,460 | | |
| End of year | | $ | 20,983,356 | | | $ | 16,013,197 | | |
| Undistributed net investment income (loss) at end of year | | $ | -- | | | $ | -- | | |
See Notes to Financial Statements
12
Notes to Financial Statements Small-Cap Growth Portfolio
Note A--Summary of Significant Accounting Policies:
1 General: The Fund is a separate operating series of Neuberger Berman Advisers Management Trust (the "Trust"), a Delaware statutory trust organized pursuant to a Trust Instrument dated May 23, 1994. The Trust is currently comprised of ten separate operating series (each individually a "Series," and collectively the "Funds") each of which is diversified. The Trust is registered as an open-end management investment company under the Investment Company Act of 1940, as amended (the "1940 Act"), and its shares are registered under the Securities Act of 1933, as amended. The Fund currently offers only Class S shares. The Board may establish additional series or classes of shares without the approval of shareholders.
The assets of each Series belong only to that Series, and the liabilities of each Series are borne solely by that Series and no other.
The preparation of financial statements in accordance with U.S. generally accepted accounting principles requires Management to make estimates and assumptions at the date of the financial statements. Actual results could differ from those estimates.
2 Portfolio valuation: Investment securities are valued as indicated in the notes following the Schedule of Investments.
3 Foreign currency translation: The accounting records of the Fund are maintained in U.S. dollars. Foreign currency amounts are translated into U.S. dollars using the exchange rates as of 4:00 p.m., Eastern time, to determine the value of investments, other assets and liabilities. Purchase and sale prices of securities, and income and expenses, are translated into U.S. dollars at the prevailing rate of exchange on the respective dates of such transactions. Net unrealized foreign currency gain (loss), if any, arises from changes in the value of assets and liabilities, other than investments in securities, as a result of changes in exchange rates and is stated separately in the Statement of Operations.
4 Securities transactions and investment income: Securities transactions are recorded on trade date for financial reporting purposes. Dividend income is recorded on the ex-dividend date or, for certain foreign dividends, as soon as the Fund becomes aware of the dividends. Non-cash dividends included in dividend income, if any, are recorded at the fair market value of the securities received. Interest income, including accretion of original issue discount, where applicable, and accretion of discount on short-term investments, if any, is recorded on the accrual basis. Realized gains and losses from securities transactions and foreign currency transactions, if any, are recorded on the basis of identified cost and stated separately in the Statement of Operations.
5 Income tax information: The Funds are treated as separate entities for U.S. federal income tax purposes. It is the policy of the Fund to continue to qualify as a regulated investment company by complying with the requirements of the U.S. Internal Revenue Code applicable to regulated investment companies and to distribute substantially all of its earnings to its shareholders. To the extent the Fund distributes substantially all of its earnings to shareholders, no federal income or excise tax provision is required.
The Fund has adopted the provisions of ASC 740 "Income Taxes" ("ASC 740"). ASC 740 sets forth a minimum threshold for financial statement recognition of a tax position taken, or expected to be taken, in a tax return. The Fund recognizes interest and penalties, if any, related to unrecognized tax positions as an income tax expense in the Statement of Operations. The Fund is subject to examination by U.S. federal and state tax authorities for returns filed for the prior three fiscal years 2007 - 2009. As of December 31, 2010, the Fund did not have any unrecognized tax positions.
Income distributions and capital gain distributions are determined in accordance with income tax regulations, which may differ from U.S. generally accepted accounting principles. These differences are primarily due to differing treatments of income and gains on various investment securities held by the Fund, timing differences and differing characterization of distributions made by the Fund as a whole. The Fund may also utilize earnings and
13
profits distributed to shareholders on redemption of shares as a part of the dividends paid deduction for income tax purposes.
As determined on December 31, 2010, permanent differences resulting primarily from different book and tax accounting for net operating losses were reclassified at fiscal year-end. These reclassifications had no effect on net income, NAV or NAV per share of the Fund.
As of December 31, 2010, the components of distributable earnings (accumulated losses) on a U.S. federal income tax basis were as follows:
Undistributed
Long-Term
Gain | | Unrealized
Appreciation
(Depreciation) | | Loss
Carryforwards
and Deferrals | | Total | |
| $ | -- | | | $ | 3,884,277 | | | $ | (6,861,227 | ) | | $ | (2,976,950 | ) | |
The difference between book basis and tax basis distributable earnings is attributable primarily to timing differences of wash sales and capital loss carryforwards.
To the extent the Fund's net realized capital gains, if any, can be offset by capital loss carryforwards, it is the policy of the Fund not to distribute such gains. Under current tax law, the use of these losses to offset future gains may be limited. As determined at December 31, 2010, the Fund had unused capital loss carryforwards available for federal income tax purposes to offset net realized capital gains, if any, as follows:
| | | Expiring in: | |
| | | 2016 | | 2017 | |
| | | $ | 2,819,425 | | | $ | 4,041,802 | | |
During the year ended December 31, 2010, the Fund utilized capital loss carryforwards of $2,154,792.
6 Distributions to shareholders: The Fund may earn income, net of expenses, daily on its investments. Distributions from net investment income and net realized capital gains, if any, generally are distributed once a year (usually in October). Income distributions and capital gain distributions to shareholders are recorded on the ex-date.
7 Foreign taxes: Foreign taxes withheld represent amounts withheld by foreign tax authorities, net of refunds recoverable.
8 Expense allocation: Certain expenses are applicable to multiple funds. Expenses directly attributable to a Series are charged to that Series. Expenses of the Trust that are not directly attributable to a particular series of the Trust (e.g., the Fund) are allocated among the series of the Trust, on the basis of relative net assets, except where a more appropriate allocation of expenses to each of the series can otherwise be made fairly. Expenses borne by the complex of related investment companies, which includes open-end and closed-end investment companies for which Management serves as investment manager, that are not directly attributable to a particular investment company in the complex (e.g., the Trust) or series thereof are allocated among the investment companies in the complex or series thereof, on the basis of relative net assets, except where a more appropriate allocation of expenses to each investment company in the complex or series thereof can otherwise be made fairly.
9 Security lending: A third party, eSecLending, has assisted the Fund in conducting a bidding process to try to identify a principal that would pay a guaranteed amount to the Fund in consideration of the Fund entering into an exclusive securities lending arrangement. During the fiscal year, eSecLending served as exclusive lending agent for the Fund. As a result of a bidding process on October 1, 2009, no principal had an exclusive securities lending arrangement with the Fund during the fiscal year; as such, the Fund was not guaranteed any particular level of income during the fiscal year. As of August 27, 2010, the Fund no longer participates in a securities lending program.
Under the securities lending arrangement, the Fund received cash collateral at the beginning of each transaction equal to at least 102% of the prior day's market value of the loaned securities (105% in the case of international
14
securities). The Fund invested all the cash collateral in Neuberger Berman Securities Lending Quality Fund, LLC ("Quality Fund"), a fund managed by Neuberger Berman Fixed Income LLC ("NBFI"), an affiliate of Management, and sub-advised by Dwight Asset Management Company LLC. Quality Fund was not a money market fund registered under the 1940 Act and did not operate in accordance with all requirements of Rule 2a-7 under the 1940 Act. The Fund redeemed all of its investments in Quality Fund, if any, as of August 27, 2010.
Net income from the lending program represents any amounts received from a principal, plus income earned on the cash collateral invested in Quality Fund or in other investments, if applicable, less cash collateral fees and other expenses associated with the loans. For the fiscal year ended December 31, 2010, the Fund received net income under the securities lending arrangement of $1,920, which is reflected in the Statement of Operations under the caption "Income from securities loaned-net," which includes $20 of interest income that was earned from the Quality Fund.
10 Investments in foreign securities: Investing in foreign securities may involve certain sovereign and other risks, in addition to the credit and market risks normally associated with domestic securities. These additional risks include the possibility of adverse political and economic developments (including political instability, nationalization, expropriation, or confiscatory taxation) and the potentially adverse effects of unavailability of public information regarding issuers, less government supervision and regulation of financial markets, reduced liquidity of certain financial markets, and the lack of uniform accounting, auditing, and financial reporting standards or the application of standards that are different or less stringent than those applied in the United States. Foreign securities also may experience greater price volatility, higher rates of inflation, and delays in settlement.
11 Indemnifications: Like many other companies, the Trust's organizational documents provide that its officers and trustees are indemnified against certain liabilities arising out of the performance of their duties to the Trust. In addition, both in some of its principal service contracts and in the normal course of its business, the Trust enters into contracts that provide indemnifications to other parties for certain types of losses or liabilities. The Trust's maximum exposure under these arrangements is unknown as this could involve future claims against the Trust.
Note B--Management Fees, Administration Fees, Distribution Arrangements, and Other Transactions with Affiliates:
Fund shares are issued and redeemed in connection with investments in and payments under certain variable annuity contracts and variable life insurance policies issued through separate accounts of life insurance companies and are also offered directly to certain qualified pension and retirement plans.
The Fund retains Management as its investment manager under a Management Agreement. For such investment management services, the Fund pays Management a fee at the annual rate of 0.85% of the first $500 million of the Fund's average daily net assets, 0.825% of the next $500 million, 0.80% of the next $500 million, 0.775% of the next $500 million, 0.75% of the next $500 million, and 0.725% of average daily net assets in excess of $2.5 billion.
The Fund retains Management as its administrator under an Administration Agreement. The Fund pays Management an administration fee at the annual rate of 0.30% of its average daily net assets under this agreement. Additionally, Management retains State Street Bank and Trust Company ("State Street") as its sub-administrator under a Sub-Administration Agreement. Management pays State Street a fee for all services received under this agreement.
Management acts as agent in arranging for the sale of Fund shares without commission and bears advertising and promotion expenses. The Board has adopted a distribution plan (the "Plan") with respect to the Fund, pursuant to Rule 12b-1 under the 1940 Act. The Plan provides that, as compensation for administrative and other services provided to the Fund, Management's activities and expenses related to the sale and distribution of the Fund's shares, and ongoing services provided to investors in the Fund, Management receives from the Fund a fee at the annual rate of 0.25% of the Fund's average daily net assets. Management receives this amount to provide distribution and shareholder servicing for the Fund and pays a portion of it to institutions that provide such
15
services. Those institutions may use the payments for, among other purposes, compensating employees engaged in sales and/or shareholder servicing. The amount of fees paid by the Fund during any year could have been more or less than the cost of distribution and other services provided to the Fund. FINRA rules limit the amount of annual distribution fees that may be paid by a mutual fund and impose a ceiling on the cumulative distribution fees paid. The Trust's Plan complies with those rules.
Management has contractually undertaken through December 31, 2013 to forgo current payment of fees and/or reimburse the Fund for its operating expenses (including fees payable to Management but excluding interest, taxes, brokerage commissions, extraordinary expenses, and transaction costs) ("Operating Expenses") which exceed, in the aggregate, 1.40% per annum of the Fund's average daily net assets (the "Expense Limitation"). For the year ended December 31, 2010, such excess expenses amounted to $137,598. The Fund has agreed to repay Management through December 31, 2016 for fees and expenses foregone and/or its excess Operating Expenses previously reimbursed by Management, so long as its annual Operating Expenses during that period do not exceed its Expense Limitation, and the repayment is made within three years after the year in which Management issued the reimbursement or waived fees. During the year ended December 31, 2010, there was no repayment to Management under its contractual expense limitation. At December 31, 2010, contingent liabilities to Management under its contractual expense limitation were as follows:
| | | Expiring in: | | | |
| | | 2011 | | 2012 | | 2013 | | Total | |
| | | $ | 129,472 | | | $ | 142,078 | | | $ | 137,598 | | | $ | 409,148 | | |
Neuberger Berman LLC ("Neuberger") is retained by Management to furnish it with investment recommendations and research information without added cost to the Fund. Several individuals who are officers and/or trustees of the Trust are also employees of Neuberger and/or Management.
On May 4, 2009, NBSH Acquisition, LLC ("NBSH"), an entity organized by key members of senior management of Neuberger Berman Group LLC ("NBG") and its consolidated subsidiaries (NBG, and together with its consolidated subsidiaries "NB Group") acquired a majority interest in the business conducted by Management and Neuberger, as well as the fixed income and certain alternative asset management businesses of Lehman Brothers Holdings Inc.'s Investment Management Division (together with Management and Neuberger, the "Acquired Businesses") (the "Acquisition"). Prior to that date, Neuberger and the predecessor in interest of Management were indirect wholly owned subsidiaries of Lehman Brothers Holdings Inc. ("LBHI"). On September 15, 2008, LBHI filed a voluntary petition under Chapter 11 of the U.S. Bankruptcy Code, and on December 22, 2008, the bankruptcy court having jurisdiction over the LBHI matter approved the sale of the Acquired Businesses to NBSH (or its successor or assign).
Through NBSH, portfolio managers, NB Group's management team, and certain of its key employees and senior professionals now indirectly own 52% of the voting equity of NBG. LBHI and certain affiliates of LBHI own the remaining 48% of NBG's voting equity. The closing of the Acquisition resulted in an "assignment" of the Fund's Management Agreement and Sub-Advisory Agreement. Such an assignment, by law, automatically terminated those agreements. Accordingly, prior to the closing, the Board, including the Trustees who are not "interested persons" of the Fund's investment manager and its affiliates or the Fund, considered and approved a new Management Agreement and Sub-Advisory Agreement for the Fund. The new agreements, which are virtually identical to those previously in effect, were also approved by a vote of the Fund's shareholders.
These events did not have a material impact on the Fund or its operations. Management and Neuberger continue to operate in the ordinary course of business as the investment manager and sub-adviser of the Fund.
Other non-affiliated service provider: The Fund has an expense offset arrangement in connection with its custodian contract. For the year ended December 31, 2010, the impact of this arrangement was a reduction of expenses of $5.
16
Note C--Securities Transactions:
During the year ended December 31, 2010, there were purchase and sale transactions (excluding short-term securities) of $38,250,882 and $37,561,748, respectively.
During the year ended December 31, 2010, no brokerage commissions on securities transactions were paid to affiliated brokers.
Note D--Fund Share Transactions:
Share activity for the years ended December 31, 2010 and December 31, 2009 was as follows:
| | | For the Year Ended December 31, | |
| | | 2010 | | 2009 | |
| Shares Sold | | | 891,181 | | | | 1,051,811 | | |
| Shares Redeemed | | | (742,695 | ) | | | (992,399 | ) | |
| Total | | | 148,486 | | | | 59,412 | | |
Note E--Line of Credit:
At December 31, 2010, the Fund was a participant in a single committed, unsecured $200,000,000 ($150,000,000 prior to September 17, 2010) line of credit with State Street, to be used only for temporary or emergency purposes. Other investment companies managed by Management also participate in this line of credit on the same terms. Interest is charged on borrowings under this line of credit at the higher of (a) the Federal Funds Rate plus 1.25% per annum or (b) the Overnight LIBOR Rate plus 1.25% per annum. A commitment fee of 0.125% (0.15% prior to September 17, 2010) per annum of the available line of credit is charged, of which each participating Fund has agreed to pay its pro rata share, based on the ratio of its individual net assets to the net assets of all participants at the time the fee is due and payable. The fee is paid quarterly in arrears. Because several mutual funds participate, there is no assurance that an individual Fund will have access to all or any part of the $200,000,000 ($150,000,000 prior to September 17, 2010) at any particular time. There were no loans outstanding pursuant to this line of credit at December 31, 2010. During the year ended December 31, 2010, the Fund did not utilize this line of credit.
Note F--Investments in Affiliates:
| Name of Issuer | | Balance of
Shares
Held
December 31,
2009 | | Gross
Purchases
and
Additions | | Gross
Sales
and
Reductions | | Balance of
Shares
Held
December 31,
2010 | | Value
December 31,
2010 | | Income from
Investments in
Affiliated
Issuers
Included in
Total Income | |
Neuberger Berman Securities
Lending Quality Fund, LLC* | | | - | | | | 670,761 | | | | 670,761 | | | | - | | | $ | - | | | $ | 20 | | |
* Quality Fund, a fund that was managed by NBFI, an affiliate of Management, was used to invest cash the Fund received as collateral for securities loaned as approved by the Board. Because all shares of Quality Fund were held by funds in the related investment management complex, Quality Fund may have been considered an affiliate of the Fund.
17
Financial Highlights
Small-Cap Growth Portfolio
The following table includes selected data for a share outstanding throughout each year and other performance information derived from the Financial Statements.
| | | Year Ended December 31, | |
| | | 2010 | | 2009 | | 2008 | | 2007 | | 2006 | |
| Net Asset Value, Beginning of Year | | $ | 10.25 | | | $ | 8.35 | | | $ | 14.50 | | | $ | 14.53 | | | $ | 14.16 | | |
| Income From Investment Operations: | |
| Net Investment Income (Loss)t | | | (.12 | ) | | | (.09 | ) | | | (.11 | ) | | | (.06 | ) | | | (.05 | ) | |
Net Gains or Losses on Securities
(both realized and unrealized) | | | 2.13 | | | | 1.99 | | | | (5.60 | )SS | | | .14 | | | | .79 | | |
| Total From Investment Operations | | | 2.01 | | | | 1.90 | | | | (5.71 | ) | | | .08 | | | | .74 | | |
| Less Distributions From: | |
| Net Capital Gains | | | -- | | | | -- | | | | (.44 | ) | | | (.11 | ) | | | (.37 | ) | |
| Tax Return of Capital | | | -- | | | | -- | | | | (.00 | ) | | | -- | | | | -- | | |
| Total Distributions | | | -- | | | | -- | | | | (.44 | ) | | | (.11 | ) | | | (.37 | ) | |
| Net Asset Value, End of Year | | $ | 12.26 | | | $ | 10.25 | | | $ | 8.35 | | | $ | 14.50 | | | $ | 14.53 | | |
| Total Returntt | | | 19.61 | % | | | 22.75 | % | | | (39.47 | )% | | | .52 | % | | | 5.25 | % | |
| Ratios/Supplemental Data | |
| Net Assets, End of Year (in millions) | | $ | 21.0 | | | $ | 16.0 | | | $ | 12.6 | | | $ | 26.7 | | | $ | 24.2 | | |
| Ratio of Gross Expenses to Average Net Assets# | | | 1.40 | % | | | 1.42 | % | | | 1.43 | % | | | 1.40 | % | | | 1.40 | % | |
| Ratio of Net Expenses to Average Net AssetsS | | | 1.40 | % | | | 1.42 | % | | | 1.42 | % | | | 1.39 | % | | | 1.40 | % | |
Ratio of Net Investment Income (Loss) to Average
Net Assets | | | (1.15 | )% | | | (1.08 | )% | | | (.92 | )% | | | (.42 | )% | | | (.33 | )% | |
| Portfolio Turnover Rate | | | 243 | % | | | 300 | % | | | 323 | % | | | 38 | % | | | 30 | % | |
See Notes to Financial Highlights
18
Notes to Financial Highlights Small-Cap Growth Portfolio
tt Total return based on per share NAV reflects the effects of changes in NAV on the performance of the Fund during each fiscal period and assumes income dividends and other distributions, if any, were reinvested. Results represent past performance and do not guarantee future results. Current returns may be lower or higher than the performance data quoted. Investment returns and principal may fluctuate and shares when redeemed may be worth more or less than original cost. Total return would have been lower if Management had not reimbursed and/or waived certain expenses. The total return information shown does not reflect charges and other expenses that apply to the separate account or the related insurance policies, and the inclusion of these charges and other expenses would reduce the total return for all fiscal periods shown.
# The Fund is required to calculate an expense ratio without taking into consideration any expense reductions related to expense offset arrangements.
t Calculated based on the average number of shares outstanding during each fiscal period.
S After reimbursement of expenses and/or waiver of a portion of the investment management fee by Management. Had Management not undertaken such actions, the annualized ratios of net expenses to average daily net assets would have been:
| | | Year Ended December 31, | |
| 2010 | | 2009 | | 2008 | | 2007 | | 2006 | |
| | 2.27 | % | | | 2.46 | % | | | 1.97 | % | | | 1.87 | % | | | 2.00 | % | |
SS Included in this net loss is a voluntary reimbursement from Management for brokerage commissions from March 25, 2008 to April 15, 2008, to facilitate a restructuring of the portfolio following a change in the Fund's portfolio manager.
19
Report of Independent Registered Public Accounting Firm
To the Board of Trustees of
Neuberger Berman Advisers Management Trust and
Shareholders of Small-Cap Growth Portfolio
We have audited the accompanying statement of assets and liabilities, including the schedule of investments, of Small-Cap Growth Portfolio, one of the series constituting Neuberger Berman Advisers Management Trust (the "Trust"), as of December 31, 2010, and the related statement of operations for the year then ended, the statements of changes in net assets for each of the two years in the period then ended, and the financial highlights for each of the five years in the period then ended. These financial statements and financial highlights are the responsibility of the Trust's management. Our responsibility is to express an opinion on these financial statements and financial highlights based on our audits.
We conducted our audits in accordance with the standards of the Public Company Accounting Oversight Board (United States). Those standards require that we plan and perform the audit to obtain reasonable assurance about whether the financial statements and financial highlights are free of material misstatement. We were not engaged to perform an audit of the Trust's internal control over financial reporting. Our audits included consideration of internal control over financial reporting as a basis for designing audit procedures that are appropriate in the circumstances, but not for the purpose of expressing an opinion on the effectiveness of the Trust's internal control over financial reporting. Accordingly, we express no such opinion. An audit also includes examining, on a test basis, evidence supporting the amounts and disclosures in the financial statements and financial highlights, assessing the accounting principles used and significant estimates made by management, and evaluating the overall financial statement presentation. Our procedures included confirmation of securities owned as of December 31, 2010 by correspondence with the custodian and brokers or by other appropriate auditing procedures where replies from brokers were not received. We believe that our audits provide a reasonable basis for our opinion.
In our opinion, the financial statements and financial highlights referred to above present fairly, in all material respects, the financial position of Small-Cap Growth Portfolio, a series of Neuberger Berman Advisers Management Trust, at December 31, 2010, the results of its operations for the year then ended, the changes in its net assets for each of the two years in the period then ended, and the financial highlights for each of the five years in the period then ended, in conformity with U.S. generally accepted accounting principles.

Boston, Massachusetts
February 10, 2011
20
Trustee and Officer Information
The following tables set forth information concerning the trustees and officers of the Trust. All persons named as trustees and officers also serve in similar capacities for other funds administered or managed by Management, Neuberger and NBFI. The Statement of Additional Information includes additional information about trustees and is available upon request, without charge, by calling (800) 877-9700.
Information about the Board of Trustees
Name, (Year of Birth),
and Address(1) | | Position and
Length of
Time Served(2) | | Principal Occupation(s)(3) | | Number of
Funds in Fund
Complex
Overseen by
Trustee | | Other Directorships
Held Outside Fund
Complex by Trustee | |
| Independent Trustees | |
|
| John Cannon (1930) | | Trustee since 2000 | | Consultant; formerly, Chairman, CDC Investment Advisers (registered investment adviser), 1993 to January 1999; formerly, President and Chief Executive Officer, AMA Investment Advisors, an affiliate of the American Medical Association. | | | 43 | | | Formerly, Independent Trustee or Director of three series of Oppenheimer Funds: Oppenheimer Limited Term New York Municipal Fund, Rochester Fund Municipals, and Oppenheimer Convertible Securities Fund, 1992 to 2009. | |
|
| Faith Colish (1935) | | Trustee since 1982 | | Counsel, Carter Ledyard & Milburn LLP (law firm) since October 2002; formerly, Attorney-at-Law and President, Faith Colish, A Professional Corporation, 1980 to 2002. | | | 43 | | | Formerly, Director, 1997 to 2003, and Advisory Director, 2003 to 2006; ABA Retirement Funds (formerly, American Bar Retirement Association) (not-for-profit membership corporation). | |
|
21
Name, (Year of Birth),
and Address(1) | | Position and
Length of
Time Served(2) | | Principal Occupation(s)(3) | | Number of
Funds in Fund
Complex
Overseen by
Trustee | | Other Directorships
Held Outside Fund
Complex by Trustee | |
| Martha C. Goss (1949) | | Trustee since 2007 | | President, Woodhill Enterprises Inc./Chase Hollow Associates LLC (personal investment vehicle), since 2006; Chief Operating and Financial Officer, Hopewell Holdings LLC/Amwell Holdings, LLC (a holding company for a healthcare reinsurance company start-up), since 2003; formerly, Consultant, Resources Connection (temporary staffing), 2002 to 2006. | | | 43 | | | Director, Ocwen Financial Corporation (mortgage servicing), since 2005; Director, American Water (water utility), since 2003; Director, Channel Reinsurance (financial guaranty reinsurance), since 2006; Director, Allianz Life of New York (insurance), since 2005; Director, Financial Women's Association of New York (not-for-profit association), since 2003; Trustee Emerita, Brown University, since 1998; formerly, Advisory Board Member, Attensity (software developer), 2005 to 2007; formerly, Director, Bank Leumi (commercial bank), 2005 to 2007; formerly, Director, Claire's Stores, Inc. (retailer), 2005 to 2007. | |
|
| C. Anne Harvey (1937) | | Trustee since 1998 | | President, C.A. Harvey Associates, since October 2001; formerly, Director, AARP, 1978 to December 2001. | | | 43 | | | Formerly, President, Board of Associates to The National Rehabilitation Hospital's Board of Directors, 2001 to 2002; formerly, Member, Individual Investors Advisory Committee to the New York Stock Exchange Board of Directors, 1998 to 2002. | |
|
22
Name, (Year of Birth),
and Address(1) | | Position and
Length of
Time Served(2) | | Principal Occupation(s)(3) | | Number of
Funds in Fund
Complex
Overseen by
Trustee | | Other Directorships
Held Outside Fund
Complex by Trustee | |
| Robert A. Kavesh (1927) | | Trustee since 2000 | | Retired; Marcus Nadler Professor Emeritus of Finance and Economics, New York University Stern School of Business; formerly, Executive Secretary-Treasurer, American Finance Association, 1961 to 1979. | | | 43 | | | Formerly, Director, The Caring Community (not-for-profit), 1997 to 2006; formerly, Director, DEL Laboratories, Inc. (cosmetics and pharmaceuticals), 1978 to 2004; formerly, Director, Apple Bank for Savings, 1979 to 1990; formerly, Director, Western Pacific Industries, Inc., (public company), 1972 to 1986. | |
|
| Michael M. Knetter (1960) | | Trustee since 2007 | | President and Chief Executive Officer, University of Wisconsin Foundation, October 2010 to Present; formerly, Dean, School of Business, University of Wisconsin - Madison; formerly, Professor of International Economics and Associate Dean, Amos Tuck School of Business - Dartmouth College, 1998 to 2002. | | | 43 | | | Director, American Family Insurance (a mutual company, not publicly traded), since March 2009; Trustee, Northwestern Mutual Series Fund, Inc., since February 2007; Director, Wausau Paper, since 2005; formerly, Director, Great Wolf Resorts, 2004 to 2009. | |
|
| Howard A. Mileaf (1937) | | Trustee since 1999 | | Retired; formerly, Vice President and General Counsel, WHX Corporation (holding company), 1993 to 2001. | | | 43 | | | Formerly, Director, Webfinancial Corporation (holding company), 2002 to 2008; formerly, Director, WHX Corporation (holding company), 2002 to 2005; formerly, Director, State Theatre of New Jersey (not-for-profit theatre), 2000 to 2005. | |
|
| George W. Morriss (1947) | | Trustee since 2007 | | Retired; formerly, Executive Vice President and Chief Financial Officer, People's Bank, Connecticut (a financial services company), 1991 to 2001. | | | 43 | | | Manager, Old Mutual Funds of Hedge Funds fund complex (consisting of six funds), since 2006 for four funds and since 2007 for two funds; formerly, Member NASDAQ Issuers' Affairs Committee, 1995 to 2003. | |
|
23
Name, (Year of Birth),
and Address(1) | | Position and
Length of
Time Served(2) | | Principal Occupation(s)(3) | | Number of
Funds in Fund
Complex
Overseen by
Trustee | | Other Directorships
Held Outside Fund
Complex by Trustee | |
| Edward I. O'Brien (1928) | | Trustee since 2000 | | Retired; formerly, Member, Investment Policy Committee, Edward Jones, 1993 to 2001; President, Securities Industry Association ("SIA") (securities industry's representative in government relations and regulatory matters at the federal and state levels), 1974 to 1992; Adviser to SIA, November 1992 to November 1993. | | | 43 | | | Formerly, Director, Legg Mason, Inc. (financial services holding company), 1993 to July 2008; formerly, Director, Boston Financial Group (real estate and tax shelters), 1993 to 1999. | |
|
| Cornelius T. Ryan (1931) | | Trustee since 2000 | | General Partner and Adviser, TD2, TD3, and TOF1 Healthcare Venture Capital Partnerships; Founding General Partner, Oxford Partners and Oxford Bioscience Partners (venture capital investing) and President, Oxford Venture Corporation, since 1981. | | | 43 | | | Trustee, Norwalk Hospital Foundation, since 2000; Director, Supply Pro (privately held company), since 2008; formerly, Trustee, Norwalk Hospital, 1995 to 2004; formerly, President and Director, Randolph Computer Corp., 1966 to 1984; formerly, Director of numerous privately held portfolio companies of Oxford Partners and Oxford Bioscience Partners, 1981 to 2005. | |
|
| Tom D. Seip (1950) | | Trustee since 2000; Chairman of the Board since 2008; Lead Independent Trustee from 2006 to 2008 | | General Partner, Seip Investments LP (a private investment partnership); formerly, President and CEO, Westaff, Inc. (temporary staffing), May 2001 to January 2002; formerly, Senior Executive, The Charles Schwab Corporation, 1983 to 1998, including Chief Executive Officer, Charles Schwab Investment Management, Inc.; Trustee, Schwab Family of Funds and Schwab Investments, 1997 to 1998; and Executive Vice President-Retail Brokerage, Charles Schwab & Co., Inc., 1994 to 1997. | | | 43 | | | Director, H&R Block, Inc. (financial services company), since May 2001; Chairman, Compensation Committee, H&R Block, Inc., since 2006; formerly, Director, Forward Management, Inc. (asset management company), 1999 to 2006. | |
|
24
Name, (Year of Birth),
and Address(1) | | Position and
Length of
Time Served(2) | | Principal Occupation(s)(3) | | Number of
Funds in Fund
Complex
Overseen by
Trustee | | Other Directorships
Held Outside Fund
Complex by Trustee | |
| Candace L. Straight (1947) | | Trustee since 1999 | | Private investor and consultant specializing in the insurance industry; formerly, Advisory Director, Securitas Capital LLC (a global private equity investment firm dedicated to making investments in the insurance sector), 1998 to December 2003. | | | 43 | | | Director, Montpelier Re Holdings Ltd. (reinsurance company), since 2006; formerly, Director, National Atlantic Holdings Corporation (property and casualty insurance company), 2004 to 2008; formerly, Director, The Proformance Insurance Company (property and casualty insurance company), 2004 to 2008; formerly, Director, Providence Washington Insurance Company (property and casualty insurance company), 1998 to 2006; formerly, Director, Summit Global Partners (insurance brokerage firm), 2000 to 2005. | |
|
| Peter P. Trapp (1944) | | Trustee since 1984 | | Retired; formerly, Regional Manager for Mid-Southern Region, Ford Motor Credit Company, September 1997 to 2007; formerly, President, Ford Life Insurance Company, April 1995 to August 1997. | | | 43 | | | None. | |
|
25
Name, (Year of Birth),
and Address(1) | | Position and
Length of
Time Served(2) | | Principal Occupation(s)(3) | | Number of
Funds in Fund
Complex
Overseen by
Trustee | | Other Directorships
Held Outside Fund
Complex by Trustee | |
| Trustees who are "Interested Persons" | |
|
| Joseph V. Amato* (1962) | | Trustee since 2009 | | President and Director, Neuberger Berman Group LLC, since 2009; President and Chief Executive Officer, Neuberger and Neuberger Berman Holdings LLC (including its predecessor, Neuberger Berman Inc.), since 2007; Chief Investment Officer, Neuberger, since 2009; Chief Investment Officer (Equities) and Managing Director, Management, since 2009; Managing Director, NBFI, since 2007; Board member of NBFI since 2006; formerly, Global Head of Asset Management of LBHI's Investment Management Division, 2006 to 2009; formerly, member of LBHI's Investment Management Division's Executive Management Committee, 2006 to 2009; formerly, Managing Director, Lehman Brothers Inc. ("LBI"), 2006 to 2008; formerly, Chief Recruiting and Development Officer, LBI, 2005 to 2006; formerly, Global Head of LBI's Equity Sales and a Member of its Equities Division Executive Committee, 2003 to 2005. | | | 43 | | | Member of Board of Advisors, McDonough School of Business, Georgetown University, since 2001; Member of New York City Board of Advisors, Teach for America, since 2005; Trustee, Montclair Kimberley Academy (private school), since 2007. | |
|
26
Name, (Year of Birth),
and Address(1) | | Position and
Length of
Time Served(2) | | Principal Occupation(s)(3) | | Number of
Funds in Fund
Complex
Overseen by
Trustee | | Other Directorships
Held Outside Fund
Complex by Trustee | |
| Robert Conti* (1956) | | Chief Executive Officer, President and Trustee since 2008; prior thereto, Executive Vice President in 2008 and Vice President, 2000 to 2008 | | Managing Director, Neuberger, since 2007; formerly, Senior Vice President, Neuberger, 2003 to 2006; formerly, Vice President, Neuberger, 1999 to 2003; President and Chief Executive Officer, Management, since 2008; formerly, Senior Vice President, Management, 2000 to 2008. | | | 43 | | | Chairman of the Board, Staten Island Mental Health Society since 2008. | |
|
| Jack L. Rivkin* (1940) | | Trustee since 2002; President, 2002 to 2008 | | Formerly, Executive Vice President and Chief Investment Officer, Neuberger Berman Holdings LLC (holding company), 2002 to August 2008 and 2003 to August 2008, respectively; formerly, Managing Director and Chief Investment Officer, Neuberger, December 2005 to August 2008 and 2003 to August 2008, respectively; formerly, Executive Vice President, Neuberger, December 2002 to 2005; formerly, Director and Chairman, Management, December 2002 to August 2008; formerly, Executive Vice President, Citigroup Investments, Inc., September 1995 to February 2002; formerly, Executive Vice President, Citigroup Inc., September 1995 to February 2002. | | | 43 | | | Director, Idealab (private company), since 2009; Director, Distributed World Power (private company), since 2009; Director, Dale Carnegie and Associates, Inc. (private company), since 1999; Director, Solbright, Inc. (private company), since 1998; Director, SA Agricultural Fund, since 2009; Chairman and Director, Essential Brands (consumer products) since 2008; formerly, Director, New York Society of Security Analysts, 2006 to 2008. | |
|
(1) The business address of each listed person is 605 Third Avenue, New York, New York 10158.
(2) Pursuant to the Trust's Trust Instrument, each of these Trustees shall hold office for life or until his or her successor is elected or the Trust terminates; except that (a) any Trustee may resign by delivering a written resignation; (b) any Trustee may be removed with or without cause at any time by a written instrument signed by at least two-thirds of the other Trustees; (c) any Trustee who requests to be retired, or who has become unable to serve, may be retired by a written instrument signed by a majority of the other Trustees; and (d) any Trustee may be removed at any shareholder meeting by a vote of at least two-thirds of the outstanding shares.
27
(3) Except as otherwise indicated, each individual has held the positions shown for at least the last five years.
* Indicates a Trustee who is an "interested person" within the meaning of the 1940 Act. Mr. Amato and Mr. Conti are interested persons of the Trust by virtue of the fact that each is an officer of Management, Neuberger and/or their affiliates. Mr. Rivkin may be deemed an interested person of the Trust by virtue of the fact that, until August 2008, he was a director of Management and an officer of Neuberger.
28
Information about the Officers of the Trust
Name, (Year of Birth),
and Address(1) | | Position and
Length of Time
Served(2) | | Principal Occupation(s)(3) | |
| Andrew B. Allard (1961) | | Anti-Money Laundering Compliance Officer since 2002 | | Senior Vice President, Neuberger, since 2006; Deputy General Counsel, Neuberger, since 2004; formerly, Vice President, Neuberger, 2000 to 2005; Anti-Money Laundering Compliance Officer, nine registered investment companies for which Management acts as investment manager and administrator (six since 2002, one since 2003, one since 2005 and one since 2006). | |
|
| Claudia A. Brandon (1956) | | Executive Vice President since 2008 and Secretary since 1985 | | Senior Vice President, Neuberger, since 2007 and Employee since 1999; Senior Vice President, Management, since 2008 and Assistant Secretary since 2004; formerly, Vice President, Neuberger, 2002 to 2006; formerly, Vice President-Mutual Fund Board Relations, Management, 2000 to 2008; Executive Vice President, nine registered investment companies for which Management acts as investment manager and administrator (nine since 2008); Secretary, nine registered investment companies for which Management acts as investment manager and administrator (three since 1985, three since 2002, one since 2003, one since 2005 and one since 2006). | |
|
| Maxine L. Gerson (1950) | | Executive Vice President since 2008 and Chief Legal Officer since 2005 (only for purposes of sections 307 and 406 of the Sarbanes-Oxley Act of 2002) | | Managing Director, Neuberger, since 2009, and Deputy General Counsel and Assistant Secretary Neuberger since 2001; Managing Director, Management, since 2009, and Secretary and General Counsel, Management, since 2004; formerly, Senior Vice President, Neuberger, 2002 to 2009; formerly, Senior Vice President, Management, 2006 to 2009; Executive Vice President, nine registered investment companies for which Management acts as investment manager and administrator (nine since 2008); Chief Legal Officer (only for purposes of sections 307 and 406 of the Sarbanes-Oxley Act of 2002), nine registered investment companies for which Management acts as investment manager and administrator (eight since 2005 and one since 2006). | |
|
| Sheila R. James (1965) | | Assistant Secretary since 2002 | | Vice President, Neuberger, since 2008 and Employee since 1999; formerly, Assistant Vice President, Neuberger, 2007; Assistant Secretary, nine registered investment companies for which Management acts as investment manager and administrator (six since 2002, one since 2003, one since 2005 and one since 2006). | |
|
| Brian Kerrane (1969) | | Vice President since 2008 | | Senior Vice President, Neuberger, since 2006; formerly, Vice President, Neuberger, 2002 to 2006; Vice President, Management, since 2008 and Employee since 1991; Vice President, nine registered investment companies for which Management acts as investment manager and administrator (nine since 2008). | |
|
| Kevin Lyons (1955) | | Assistant Secretary since 2003 | | Assistant Vice President, Neuberger, since 2008 and Employee since 1999; Assistant Secretary, nine registered investment companies for which Management acts as investment manager and administrator (seven since 2003, one since 2005 and one since 2006). | |
|
29
Name, (Year of Birth),
and Address(1) | | Position and
Length of Time
Served(2) | | Principal Occupation(s)(3) | |
| Owen F. McEntee, Jr. (1961) | | Vice President since 2008 | | Vice President, Neuberger, since 2006; Employee, Management, since 1992; Vice President, nine registered investment companies for which Management acts as investment manager and administrator (nine since 2008). | |
|
| John M. McGovern (1970) | | Treasurer and Principal Financial and Accounting Officer since 2005 | | Senior Vice President, Neuberger, since 2007; formerly, Vice President, Neuberger, 2004 to 2006; Employee, Management, since 1993; Treasurer and Principal Financial and Accounting Officer, nine registered investment companies for which Management acts as investment manager and administrator (eight since 2005 and one since 2006); formerly, Assistant Treasurer, eight registered investment companies for which Management acts as investment manager and administrator, 2002 to 2005. | |
|
| Andrew Provencher (1965) | | Vice President since 2008 | | Managing Director, Management, since 2008; Managing Director, Neuberger, since 2005; formerly, Senior Vice President, Neuberger, 2003 to 2005; Vice President, nine registered investment companies for which Management acts as investment manager and administrator (nine since 2008). | |
|
| Frank Rosato (1971) | | Assistant Treasurer since 2005 | | Vice President, Neuberger, since 2006; Employee, Management, since 1995; Assistant Treasurer, nine registered investment companies for which Management acts as investment manager and administrator (eight since 2005 and one since 2006). | |
|
| Neil S. Siegel (1967) | | Vice President since 2008 | | Managing Director, Management, since 2008; Managing Director, Neuberger, since 2006; formerly, Senior Vice President, Neuberger, 2004 to 2006; Vice President, nine registered investment companies for which Management acts as investment manager and administrator (nine since 2008). | |
|
| Chamaine Williams (1971) | | Chief Compliance Officer since 2005 | | Senior Vice President, Neuberger, since 2007; Chief Compliance Officer, Management, since 2006; Chief Compliance Officer, nine registered investment companies for which Management acts as investment manager and administrator (eight since 2005 and one since 2006); formerly, Senior Vice President, LBI, 2007 to 2008; formerly, Vice President, LBI, 2003 to 2006; formerly, Chief Compliance Officer, Lehman Brothers Asset Management Inc., 2003 to 2007; formerly, Chief Compliance Officer, Lehman Brothers Alternative Investment Management LLC, 2003 to 2007. | |
|
(1) The business address of each listed person is 605 Third Avenue, New York, New York 10158.
(2) Pursuant to the By-Laws of the Trust, each officer elected by the Trustees shall hold office until his or her successor shall have been elected and qualified or until his or her earlier death, inability to serve, or resignation. Officers serve at the pleasure of the Trustees and may be removed at any time with or without cause.
(3) Except as otherwise indicated, each individual has held the positions shown for at least the last five years.
30
Proxy Voting Policies and Procedures
A description of the policies and procedures that the Trust uses to determine how to vote proxies relating to portfolio securities is available, without charge, by calling 1-800-877-9700 (toll-free) and on the website of the Securities and Exchange Commission, at www.sec.gov. Information regarding how the Trust voted proxies relating to portfolio securities during the most recent 12-month period ended June 30 is also available, without charge, by calling 1-800-877-9700 (toll-free), on the website of the Securities and Exchange Commission at www.sec.gov, and on Management's website at www.nb.com.
Quarterly Portfolio Schedule
The Trust files a complete schedule of portfolio holdings for the Fund with the Securities and Exchange Commission for the first and third quarters of each fiscal year on Form N-Q. The Trust's Forms N-Q are available on the Securities and Exchange Commission's website at www.sec.gov and may be reviewed and copied at the Securities and Exchange Commission's Public Reference Room in Washington, DC. Information on the operation of the Public Reference Room may be obtained by calling 1-800-SEC-0330. The information on Form N-Q is available upon request, without charge, by calling 1-800-877-9700 (toll free).
Board Consideration of the Management and Sub-Advisory Agreements
At a meeting held on October 14, 2010, the Board, including the Trustees who are not "interested persons" of Management (including its affiliates) or Neuberger Berman Advisers Management Trust ("Independent Fund Trustees"), approved the continuance of the Management and Sub-Advisory Agreements ("Agreements") for the Fund.
In evaluating the Agreements, the Board, including the Independent Fund Trustees, reviewed materials furnished by Management and Neuberger in response to questions submitted by counsel for the Independent Fund Trustees, and met with senior representatives of Management and Neuberger regarding their personnel and operations. The Independent Fund Trustees were advised by counsel that is experienced in 1940 Act matters and that is independent of Management and Neuberger. The Independent Fund Trustees received a memorandum from independent counsel discussing the legal standards for their consideration of the proposed continuance of the Agreements. They met with such counsel separately from representatives of Management to discuss the annual contract review. The annual contract review extends over two regular meetings of the Board to ensure that Management and Neuberger have time to respond to any questions the Independent Fund Trustees may have on their initial review of the report and that the Independent Fund Trustees have time to consider those responses. In addition, during this process, the Board held a separate meeting devoted primarily to reviewing and discussing Fund performance.
The Board considered the following factors, among others, in connection with its approval of the continuance of the Agreements: (1) the nature, extent, and quality of the services provided by Management and Neuberger; (2) the performance of the Fund compared to a relevant market index and a peer group of investment companies; (3) the costs of the services provided and profits or losses realized by Management and its affiliates from their relationship with the Fund; (4) the extent to which economies of scale might be realized as the Fund grows; and (5) whether fee levels reflect any such potential economies of scale for the benefit of investors in the Fund. In their deliberations, the Board members did not identify any particular information that was all-important or controlling, and each Trustee may have attributed different weights to the various factors.
The Board evaluated the terms of the Agreements, the overall fairness of the Agreements to the Fund and whether the Agreements were in the best interests of the Fund and its shareholders.
With respect to the nature, extent and quality of the services provided, the Board considered the performance of the Fund and the experience and staffing of the portfolio management and investment research personnel of Management and Neuberger who perform services for the Fund. The Board noted that Management also provides certain administrative services, including fund accounting and compliance oversight. The Board also considered Management's and Neuberger's policies and practices regarding brokerage and the quality of brokerage execution obtained by Management. The Board's
31
Portfolio Transactions and Pricing Committee from time to time reviewed the quality of the execution services that Management and Neuberger had provided, and periodically reviews studies by an independent firm engaged to review and evaluate the quality of brokerage execution received by the Fund. The Board also reviewed whether Management and Neuberger used brokers to execute Fund transactions that provide research and other services to Management and Neuberger, and the types of benefits potentially derived from such services by Management, Neuberger, the Fund and other clients of Management and Neuberger. In addition, the Board noted the positive compliance history of Management and Neuberger, as each firm has been free of significant reported compliance problems.
The Board considered the performance of the Fund relative to its benchmark and a peer group of investment companies dedicated to insurance products pursuing broadly similar strategies. The Board also considered performance in relation to certain measures of the degree of investment risk undertaken by the portfolio manager. The Board discussed the Fund's performance with Management and discussed steps that Management had taken, or intended to take, to improve the Fund's performance. The Board also considered Management's resources and responsiveness with respect to the Fund.
With respect to the overall fairness of the Agreements, the Board considered the fee structure for the Fund under the Agreements and any fall-out benefits likely to accrue to Management or Neuberger or their affiliates from their relationship with the Fund. The Board also considered the contractual limit on Fund expenses undertaken by Management and the actual expenses reimbursed and investment management fees waived by Management. With regard to the sub-advisory fee paid to Neuberger, the Board noted that this fee is "at cost." In addition, the Board considered the profitability of Management and its affiliates from their association with the Fund and noted that Management incurred a loss on the Fund in each of the last four years.
The Board considered whether there were other funds that were advised or sub-advised by Management or its affiliates or separate accounts managed by Management or its affiliates with similar investment objectives, policies and strategies to the Fund. The Board noted that there were no comparable separate accounts. The Board compared the fees charged to the Fund at various asset levels to the fees charged to an advised fund and sub-advised funds, each managed in a similar style to the Fund. The Board considered the appropriateness and reasonableness of any differences between the fees charged to the Fund and the other funds and determined that the differences in fees were consistent with the management and other services provided.
The Board also evaluated any apparent or anticipated economies of scale in relation to the services Management provides to the Fund. The Board considered whether the Fund's fee structure provides for a reduction of payments resulting from the use of breakpoints and whether those breakpoints are set at appropriate asset levels.
The Board also considered changes in management, staffing, resources and operations accompanying the separation of the Neuberger Berman entities from the LBHI bankruptcy estate.
In concluding that the benefits accruing to Management and its affiliates by virtue of their relationship to the Fund were reasonable in comparison with the costs of providing the investment advisory services and the benefits accruing to the Fund, the Board reviewed specific data as to Management's loss on the Fund for a recent period and the trend in profit or loss over recent years. The Board also carefully examined Management's cost allocation methodology. The Board recognized that Management should be entitled to earn a reasonable level of profits for services it provides to the Fund and, based on its review, concluded that Management's level of profitability was not excessive.
Conclusions
In approving the Agreements, the Board concluded that the terms of each Agreement are fair and reasonable and that approval of the Agreements is in the best interests of the Fund and its shareholders. In reaching this determination, the Board considered that Management and Neuberger could be expected to provide a high level of service to the Fund; that it retained confidence in Management's and Neuberger's capabilities to manage the Fund; that the Fund's fee structure appeared to the Board to be reasonable given the nature and quality of services provided; and that the benefits accruing to Management and its affiliates by virtue of their relationship to the Fund were reasonable in comparison with the benefits accruing to the Fund.
32

Neuberger Berman
Advisers Management Trust
Socially Responsive Portfolio
I Class Shares
S Class Shares
Annual Report
December 31, 2010
Socially Responsive Portfolio Managers' Commentary
We are pleased to report that the Neuberger Berman Advisers Management Trust (AMT) Socially Responsive Portfolio generated a positive return for full-year 2010 and outperformed its benchmark, the S&P 500 Index.
Just as we thought the markets had overemphasized positive news from the market low through early 2010, our view during the summer's decline was that sentiment was overly negative given the economic environment. Although housing remained weak and unemployment was high, in our view, the issues that could have tipped the economy back into another recession were not present. We did not observe serious imbalances in inventories or manufacturing capacity; moreover, corporate earnings and balance sheets were strong, and valuations were, in our opinion, relatively low.
During the fourth quarter, sentiment did improve, and the market rallied. Economic growth across Europe was better than generally expected and in September the Federal Reserve indicated the potential for a second round of quantitative easing (announced in November), which renewed faith in economic expansion and stability. The S&P 500 closed the year with its best December since 1991.
Within the Portfolio, top contributors included semiconductor stock Altera and software company Intuit (the position was sold after the reporting period). Altera, a large holding, has benefited from the cyclical recovery and secular advantages. An innovative company, in our opinion, Altera has enjoyed significant market share expansion within the growing FPGA (Field-Programmable Gate Array) chip category, and meaningfully outperformed analysts' expectations during the year. In our opinion, Intuit executed incredibly well and grew its business through the recession, thus showing the integrity of its business model. As earnings improved with the recovery, the stock benefited.
Our Energy stocks also performed very well for the year, with Newfield Exploration, an oil and natural gas exploration and production company, providing a significant contribution to returns. New technology has allowed companies like Newfield to realize more value from existing oil and natural gas reserves as well as reserves that previously were economically unfeasible, which has accelerated the company's growth profile. While Newfield's stock is up significantly, we believe it is not yet priced to match its true value.
On the other hand, The Washington Post, which we owned due to its Kaplan education business, was a disappointment. While we got the company-specific fundamentals right--Kaplan met our expectations for dramatic and contra-cyclical growth--the regulatory environment changed dramatically. Proposed regulations threatened Kaplan's business model, and, with our investment premise challenged, we eliminated the position.
Health Care generally underperformed in 2010 as investors gravitated toward more cyclical exposure, but also because of uncertainty around health care reform. Large-cap pharmaceutical companies had an added headwind over the European debt crisis since governments are their primary payers. Roche underperformed for all of these reasons, as well as for certain execution challenges. Our investment premise has not changed, however. In our opinion, the stock has underperformed compared to the quality of its business and we continue to own it.
Charles Schwab, another laggard, remains a large holding. Schwab has grown its business effectively over the past several years, as both a low-cost, high value-added retail broker and as a back-office infrastructure solutions provider to independent brokers. Client assets have grown, increasing earnings potential, and we think the company stands to benefit in the event interest rates eventually rise.
Looking ahead, absent any surprises, we believe the economic backdrop appears relatively favorable. Many causes of the past year's uncertainty have been somewhat resolved. We now have near-term clarity on tax rates, meaning that businesses can make decisions they may have been delaying regarding mergers and acquisitions, share repurchases and/or dividends. Potential constructive discussions addressing longer-term fiscal deficits could improve investor sentiment in the capital markets.
The risk we see is that if Congress and the Obama administration do not find common ground on key policy issues, or if Europe has another test of its resolve in addressing sovereign debt problems, this could create volatility, damage investor sentiment and threaten some of the momentum we have seen recently.
1
In managing the Portfolio, our focus has been on quality businesses positioned for advantaged growth that have demonstrated good corporate citizenship. Investors did not discriminate much between stocks from 2006 through early 2010 as they were biased towards a narrow set of cyclical beneficiaries. As a result, returns were narrow by sector and highly correlated. As the economy stalled in the third quarter of 2010 and then found its footing in the fourth quarter, investors appeared to re-focus on businesses that were doing well but whose shares had underperformed. When that happened, our relative performance benefited. This, more than anything, makes us optimistic from a portfolio perspective going forward. Even with modest economic growth, if we can identify good businesses that are increasing their market share, it should create opportunity to deliver favorable relative performance.
Sincerely,
Arthur Moretti and Ingrid Dyott
Portfolio Co-Managers
The risks involved in seeking capital appreciation from investments in mid- to large-cap stocks that meet the Fund's financial criteria and social policy are set forth in the prospectus and statement of additional information.
Mid-capitalization stocks are more vulnerable to financial risks and other risks than larger stocks. They are generally less liquid than larger stocks, so their market prices tend to be more volatile. Large-cap stocks are subject to all the risks of stock market investing, including the risk that they may lose value.
The Portfolio's social policy could cause it to underperform similar funds that do not have a social policy. The composition, industries and holdings of the Portfolio are subject to change. The AMT Socially Responsive Portfolio is invested in a wide array of stocks and no single holding makes up a significant portion of the Portfolio's total assets.
2
Socially Responsive Portfolio (Unaudited)
SECTOR ALLOCATION
| (% of Total Investments) | |
| Consumer Discretionary | | | 5.0 | % | |
| Consumer Staples | | | 10.2 | | |
| Energy | | | 11.5 | | |
| Financials | | | 14.8 | | |
| Health Care | | | 13.7 | | |
| Industrials | | | 14.7 | | |
| Information Technology | | | 21.3 | | |
| Materials | | | 3.0 | | |
| Short-Term | | | 5.8 | | |
| Total | | | 100.0 | % | |
PERFORMANCE HIGHLIGHTS1
| | | Inception | | Average Annual Total
Return Ended 12/31/2010 | |
| | | Date | | 1 Year | | 5 Years | | 10 Years | | Life of Fund* | |
Socially Responsive
Portfolio Class I | | |
02/18/1999 | | | | 22.85 | % | | | 3.65 | % | | | 4.81 | % | | | 5.15 | % | |
Socially Responsive
Portfolio Class S2 | | |
05/01/2006 | | | | 22.76 | % | | | 3.55 | % | | | 4.76 | % | | | 5.11 | % | |
| S&P 500 Index3 | | | | | | | 15.06 | % | | | 2.29 | % | | | 1.41 | % | | | 2.03 | % | |
Performance data quoted represent past performance, which is no guarantee of future results. The investment return and principal value of an investment will fluctuate so that an investor's shares, when redeemed, may be worth more or less than their original cost. Results are shown on a "total return" basis and include reinvestment of all income dividends and distributions.
Current performance may be lower or higher than the performance data quoted. For performance data current to the most recent month end, please visit https://www.nb.com.
* Index returns are as of inception date 02/18/1999.
As stated in the Portfolio's most recent prospectus, the total annual operating expense ratios for fiscal year 2009 were 1.15% and 1.40% for Class I and Class S shares, respectively (prior to any fee waivers or expense reimbursements). The net expense ratio was 1.18% for Class S shares. Neuberger Berman Management LLC has contractually agreed to limit certain expenses of the Portfolio through 12/31/2013 for Class I and Class S Shares.
COMPARISON OF A $10,000 INVESTMENT
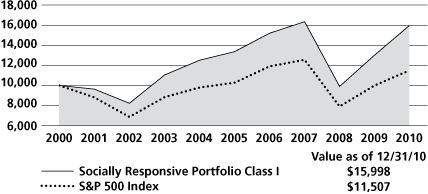
This chart shows the value of a hypothetical $10,000 investment in the Portfolio over the past 10 fiscal years, or since the Portfolio's inception, if it has not operated for 10 years. The graph is based on Class I shares only; performance of other classes will vary due to differences in fee structures (see Performance Highlights chart above). The results are compared with one or more benchmarks, which may include a broad-based market index and/or a narrower index. Please note that market indices have not been reduced to reflect any of the fees and costs of investing. All results include the reinvestment of income dividends and distributions. Neither the Portfolio's returns nor the market index shown in the graph and table reflect the effect of taxes an investor would pay on Portfolio distributions or on the redemption of Portfolio shares. Results represent past performance and do not indicate future results.
Please see Endnotes for additional information.
3
Endnotes
1 "Total Return" includes reinvestment of all income dividends and distributions. Results represent past performance and do not indicate future results. The value of an investment in the Portfolio and the return on the investment both will fluctuate, and redemption proceeds may be higher or lower than an investor's original cost. The performance information does not reflect fees and expenses of the variable annuity and variable life insurance policies or the qualified pension and retirement plans whose proceeds are invested in the Portfolio. Neuberger Berman Management LLC ("NBM LLC") has agreed to absorb certain expenses of the AMT Portfolios, including the Portfolio. Without this arrangement, which is subject to change, the total returns of the Portfolio may have been less.
2 Performance shown prior to May 1, 2006 for the Class S shares is that of the Class I shares, which have lower expenses and correspondingly higher returns than Class S shares.
3 The S&P 500 Index is widely regarded as the standard for measuring large-cap U.S. stock market performance and includes a representative sample of leading companies in leading industries. Please note that indices do not take into account any fees and expenses of investing in the individual securities that they track and that individuals cannot invest directly in any index. Data about the performance of this index is prepared or obtained by NBM LLC and include reinvestment of all income dividends and distributions. The Portfolio may invest in many securities not included in the above-described index or may not invest in all securities included in the above-described index.
Any ratios or other measurements using a factor of forecasted earnings of a company discussed herein are based on consensus estimates, not NBM LLC's own projections, and they may or may not be realized. In addition, any revision to a forecast could affect the market price of a security. By quoting them herein, NBM LLC does not offer an opinion as to the accuracy of and does not guarantee these forecasted numbers.
The investments for the Portfolio are managed by the same portfolio manager(s) who manage one or more other mutual funds that have similar names, investment objectives and investment styles as the Portfolio. You should be aware that the Portfolio is likely to differ from the other mutual funds in size, cash flow pattern and tax matters. Accordingly, the holdings and performance can be expected to vary from those of the other mutual funds.
The composition, industries and holdings of the Portfolio are subject to change.
Shares of the separate AMT Portfolios are not available to the general public. Shares of this Portfolio may be purchased only by life insurance companies to be used with their separate accounts that fund variable annuity and variable life insurance policies and by qualified pension and retirement plans.
Statistics and projections in this report are derived from sources deemed to be reliable but cannot be regarded as a representation of future results of the AMT Portfolios. This report is prepared for the general information of shareholders and is not an offer of shares of the AMT Portfolios. Shares of the AMT Portfolios are sold only through the currently effective prospectuses, which must precede or accompany this report.
The "Neuberger Berman" name and logo are registered service marks of Neuberger Berman Group LLC. "Neuberger Berman Management LLC" and the individual Fund names in this piece are either service marks or registered service marks of Neuberger Berman Management LLC.
(c) 2011 Neuberger Berman Management LLC distributor. All rights reserved.
4
Information About Your Fund's Expenses
This table is designed to provide information regarding costs related to your investments. All mutual funds incur operating expenses, which include management fees, fees for administrative services and costs of shareholder reports, among others. The following examples are based on an investment of $1,000 made at the beginning of the six month period ended December 31, 2010 and held for the entire period. The table illustrates the fund's costs in two ways:
| Actual Expenses and Performance: | | The first section of the table provides information about actual account values and actual expenses in dollars, based on the fund's actual performance during the period. You may use the information in this line, together with the amount you invested, to estimate the expenses you paid over the period. Simply divide your account value by $1,000 (for example, an $8,600 account value divided by $1,000 = 8.6), then multiply the result by the number in the first section of the table under the heading entitled "Expenses Paid During the Period" to estimate the expenses you paid over the period. | |
|
Hypothetical Example for
Comparison Purposes: | | The second section of the table provides information about hypothetical account values and hypothetical expenses based on the fund's actual expense ratio and an assumed rate of return at 5% per year before expenses. This return is not the fund's actual return. The hypothetical account values and expenses may not be used to estimate the actual ending account balance or expenses you paid for the period. You may use this information to compare the ongoing costs of investing in this fund versus other funds. To do so, compare the expenses shown in this 5% hypothetical example with the 5% hypothetical examples that appear in the shareholder reports of other funds. | |
|
Please note that the expenses in the table are meant to highlight your ongoing costs only. The table and expense example do not include any transaction costs, such as fees and expenses that are, or may be, imposed under your variable contract or qualified pension plan. Therefore, the information under the heading "Hypothetical (5% annual return before expenses)" is useful in comparing ongoing costs only, and will not help you determine the relative total costs of owning different funds. In addition, if these transaction costs were included, your costs would have been higher.
Expense Information as of 12/31/10 (Unaudited)
NEUBERGER BERMAN ADVISERS MANAGEMENT TRUST SOCIALLY RESPONSIVE PORTFOLIO
| Actual | | Beginning Account
Value 7/1/10 | | Ending Account
Value 12/31/10 | | Expenses Paid During
the Period*
7/1/10 - 12/31/10 | | Expense
Ratio | |
| Class I | | $ | 1,000.00 | | | $ | 1,234.70 | | | $ | 6.25 | | | | 1.11 | % | |
| Class S | | $ | 1,000.00 | | | $ | 1,233.70 | | | $ | 6.59 | | | | 1.17 | % | |
| Hypothetical (5% annual return before expenses)** | |
| Class I | | $ | 1,000.00 | | | $ | 1,019.61 | | | $ | 5.65 | | | | 1.11 | % | |
| Class S | | $ | 1,000.00 | | | $ | 1,019.31 | | | $ | 5.96 | | | | 1.17 | % | |
* For each class, expenses are equal to the annualized expense ratio for the class, multiplied by the average account value over the period, multiplied by 184/365 (to reflect the one-half year period shown).
** Hypothetical 5% annual return before expenses is calculated by multiplying the number of days in the most recent half year divided by 365.
5
Schedule of Investments Socially Responsive Portfolio
| NUMBER OF SHARES | | | | VALUEt | |
| Common Stocks (95.8%) | | | |
| Capital Markets (10.2%) | | | |
| | 160,335 | | | Bank of New York Mellon | | $ | 4,842,117 | | |
| | 24,620 | | | BlackRock, Inc. | | | 4,692,079 | | |
| | 374,499 | | | Charles Schwab | | | 6,407,678 | | |
| | | | 15,941,874 | | |
| Commercial Services & Supplies (2.3%) | | | |
| | 142,885 | | | Herman Miller | | | 3,614,990 | | |
Electronic Equipment, Instruments &
Components (5.9%) | | | |
| | 78,330 | | | Anixter International | | | 4,678,651 | | |
| | 120,100 | | | National Instruments | | | 4,520,564 | | |
| | | | 9,199,215 | | |
| Food & Staples Retailing (2.1%) | | | |
| | 45,005 | | | Costco Wholesale | | | 3,249,811 | | |
| Food Products (4.8%) | | | |
| | 65,275 | | | J.M. Smucker | | | 4,285,304 | | |
| | 69,400 | | | McCormick & Company | | | 3,229,182 | | |
| | | | 7,514,486 | | |
| Health Care Equipment & Supplies (6.2%) | | | |
| | 55,845 | | | Becton, Dickinson & Co. | | | 4,720,019 | | |
| | 107,940 | | | Covidien PLC | | | 4,928,541 | | |
| | | | 9,648,560 | | |
| Household Products (3.5%) | | | |
| | 85,115 | | | Procter & Gamble | | | 5,475,448 | | |
| Industrial Conglomerates (3.2%) | | | |
| | 57,845 | | | 3M Co. | | | 4,992,023 | | |
| Industrial Gases (2.1%) | | | |
| | 34,545 | | | Praxair, Inc. | | | 3,298,011 | | |
| Insurance (4.9%) | | | |
| | 8,065 | | | Markel Corp. | | | 3,049,618 | * | |
| | 228,300 | | | Progressive Corp. | | | 4,536,321 | | |
| | | | 7,585,939 | | |
| Internet Software & Services (3.8%) | | | |
| | 358,295 | | | Yahoo! Inc. | | | 5,958,446 | * | |
| IT Services (2.7%) | | | |
| | 19,020 | | | MasterCard, Inc. Class A | | | 4,262,572 | | |
| Machinery (4.5%) | | | |
| | 149,435 | | | Danaher Corp. | | | 7,048,849 | | |
| NUMBER OF SHARES | | | | VALUEt | |
| Media (5.1%) | | | |
| | 182,197 | | | Comcast Corp. Class A Special | | $ | 3,791,519 | | |
| | 81,045 | | | Scripps Networks Interactive
Class A | | | 4,194,079 | | |
| | | | 7,985,598 | | |
| Oil, Gas & Consumable Fuels (11.7%) | | | |
| | 320,172 | | | BG Group PLC | | | 6,469,372 | | |
| | 26,860 | | | Cimarex Energy | | | 2,377,916 | | |
| | 86,435 | | | Newfield Exploration | | | 6,232,828 | * | |
| | 35,940 | | | Noble Energy | | | 3,093,715 | | |
| | | | 18,173,831 | | |
| Pharmaceuticals (7.7%) | | | |
| | 84,660 | | | Hospira, Inc. | | | 4,714,715 | * | |
| | 27,091 | | | Novo Nordisk A/S ADR | | | 3,049,634 | | |
| | 29,076 | | | Roche Holding AG | | | 4,260,334 | | |
| | | | 12,024,683 | | |
| Professional Services (1.3%) | | | |
| | 80,455 | | | ICF International | | | 2,069,303 | * | |
| Road & Rail (1.7%) | | | |
| | 38,525 | | | Canadian National Railway | | | 2,560,757 | | |
Semiconductors & Semiconductor
Equipment (7.5%) | | | |
| | 130,475 | | | Altera Corp. | | | 4,642,301 | | |
| | 216,785 | | | Texas Instruments | | | 7,045,512 | | |
| | | | 11,687,813 | | |
| Software (1.7%) | | | |
| | 47,975 | | | Intuit Inc. | | | 2,365,168 | * | |
| | 13,300 | | | Sourcefire Inc. | | | 344,869 | * | |
| | | | 2,710,037 | | |
| Specialty Chemicals (0.9%) | | | |
| | 9,885 | | | Novozymes A/S Class B | | | 1,376,941 | | |
| Trading Companies & Distributors (2.0%) | | | |
| | 22,465 | | | W.W. Grainger | | | 3,102,641 | | |
| | | | | Total Common Stocks
(Cost $122,616,230) | | | 149,481,828 | | |
| Short-Term Investments (5.7%) | | | |
| | 8,965,130 | | | State Street Institutional
Government Money Market
Fund Institutional Class
(Cost $8,965,130) | | | 8,965,130 | | |
See Notes to Schedule of Investments
6
| PRINCIPAL AMOUNT | | | | VALUEt | |
| Certificates of Deposit (0.1%) | | | |
| $ | 200,000 | | | Self Help Credit Union, | | $ | 200,000 | # | |
| | | | | 1.00%, due 1/29/11 | |
| |
| | | | | (Cost $200,000) | | | | | |
| | | | | Total Investments (101.6%)
(Cost $131,781,360) | | | 158,646,958 | ## | |
| | | | | Liabilities, less cash, receivables and
other assets [(1.6%)] | | | (2,528,294 | ) | |
| | | | | Total Net Assets (100.0%) | | $ | 156,118,664 | | |
See Notes to Schedule of Investments
7
Notes to Schedule of Investments Socially Responsive Portfolio
t In accordance with Accounting Standards Codification ("ASC") 820 "Fair Value Measurements and Disclosures" ("ASC 820"), all investments held by Neuberger Berman Advisers Management Trust Socially Responsive Portfolio (the "Fund") are carried at the value that Neuberger Berman Management LLC ("Management") believes the Fund would receive upon selling an investment in an orderly transaction to an independent buyer in the principal or most advantageous market for the investment under current market conditions. Various inputs, including the volume and level of activity for the asset or liability in the market, are considered in valuing the Fund's investments, some of which are discussed below. Significant management judgment may be necessary to value investments in accordance with ASC 820.
ASC 820 established a three-tier hierarchy of inputs to create a classification of value measurements for disclosure purposes. The three-tier hierarchy of inputs is summarized in the three broad Levels listed below.
. Level 1 - quoted prices in active markets for identical investments
. Level 2 - other significant observable inputs (including quoted prices for similar investments, interest rates, prepayment speeds, credit risk, amortized cost, etc.)
. Level 3 - significant unobservable inputs (including the Fund's own assumptions in determining the fair value of investments)
The inputs or methodology used for valuing an investment are not necessarily an indication of the risk associated with investing in those securities.
The value of the Fund's investments in equity securities, for which market quotations are readily available, is generally determined by Management by obtaining valuations from an independent pricing service based on the latest sale price quoted in active markets (Level 1 inputs). Securities traded primarily on the NASDAQ Stock Market are normally valued by the Fund at the NASDAQ Official Closing Price ("NOCP") provided by NASDAQ each business day. The NOCP is the most recently reported price as of 4:00:02 p.m., Eastern time, unless that price is outside the range of the "inside" bid and asked prices (i.e., the bid and asked prices that dealers quote to each other when trading for their own accounts); in that case, NASDAQ will adjust the price to equal the inside bid or asked price, whichever is closer. Because of delays in reporting trades, the NOCP may not be based on the price of the last trade to occur before the market closes. If there is no reported sale of a security on a particular day, the independent pricing service may value the security based on reported market quotations.
Investments in State Street Institutional Government Money Market Fund Institutional Class are valued using the fund's daily calculated net asset value ("NAV"). Certificates of Deposit are valued at amortized cost.
Management has developed a process to periodically review information provided by independent pricing services for all types of securities.
For equity securities, if a valuation is not available from an independent pricing service, or if Management has reason to believe that the valuation received does not represent the amount the Fund might reasonably expect to receive on a current sale in an orderly transaction, the Fund seeks to obtain quotations from principal market makers (generally considered Level 3 inputs). If such quotations are not readily available, the security is valued using methods the Board of Trustees of Neuberger Berman Advisers Management Trust (the "Board") has approved on the belief that they reflect fair value. Numerous factors may be considered when determining the fair value of a security based on Level 2 or 3 inputs, including available analyst, media or other reports, trading in futures or ADRs and whether the issuer of the security being fair valued has other securities outstanding.
The value of the Fund's investments in foreign securities is generally determined using the same valuation methods and inputs as other Fund investments, as discussed above. Foreign security prices are expressed in local currency
See Notes to Financial Statements
8
Notes to Schedule of Investments Socially Responsive Portfolio (cont'd)
values and are translated from the local currency into U.S. dollars using the exchange rates as of 4:00 p.m., Eastern time. The Board has approved the use of Interactive Data Pricing and Reference Data, Inc. ("Interactive") to assist in determining the fair value of foreign equity securities when changes in the value of a certain index suggest that the closing prices on the foreign exchanges may no longer represent the amount that the Fund could expect to receive for those securities. In this event, Interactive will provide adjusted prices for certain foreign equity securities using a statistical analysis of historical correlations of multiple factors (Level 2 inputs). In the absence of precise information about the market values of these foreign securities as of the close of the New York Stock Exchange, the Board has determined on the basis of available data that prices adjusted in this way are likely to be closer to the prices the Fund could realize on a current sale than are the prices of those securities established at the close of the foreign markets in which the securities primarily trade. These fair value prices are necessarily estimates, and there is no assurance that such a price will be at or close to the price at which the security is next quoted or next trades.
The following is a summary, categorized by Level, of inputs used to value the Fund's investments as of December 31, 2010:
| Asset Valuation Inputs | | Level 1 | | Level 2 | | Level 3 | | Total | |
| Investments: | |
| Common Stocks^ | | $ | 149,481,828 | | | $ | -- | | | $ | -- | | | $ | 149,481,828 | | |
| Short-Term Investments | | | -- | | | | 8,965,130 | | | | -- | | | | 8,965,130 | | |
| Certificates of Deposit | | | -- | | | | 200,000 | | | | -- | | | | 200,000 | | |
| Total Investments | | $ | 149,481,828 | | | $ | 9,165,130 | | | $ | -- | | | $ | 158,646,958 | | |
^ The Schedule of Investments provides information on the industry categorization for the portfolio.
The Fund had no significant transfers between Levels 1 and 2 during the year ended December 31, 2010.
# At cost, which approximates market value.
## At December 31, 2010, the cost of investments for U.S. federal income tax purposes was $132,243,038. Gross unrealized appreciation of investments was $27,949,715 and gross unrealized depreciation of investments was $1,545,795, resulting in net unrealized appreciation of $26,403,920, based on cost for U.S. federal income tax purposes.
* Security did not produce income during the last twelve months.
See Notes to Financial Statements
9
Statement of Assets and Liabilities
Neuberger Berman Advisers Management Trust
| | | SOCIALLY RESPONSIVE
PORTFOLIO | |
| | | December 31, 2010 | |
| Assets | |
| Investments in securities, at value* (Notes A & F)--see Schedule of Investments: | |
| Unaffiliated issuers | | $ | 158,646,958 | | |
| Cash | | | 8,889 | | |
| Dividends and interest receivable | | | 54,265 | | |
| Receivable for Fund shares sold | | | 563,583 | | |
| Prepaid expenses and other assets | | | 3,604 | | |
| Total Assets | | | 159,277,299 | | |
| Liabilities | |
| Due to custodian | | | 45 | | |
| Payable for securities purchased | | | 2,473,493 | | |
| Payable for Fund shares redeemed | | | 509,341 | | |
| Payable to investment manager (Notes A & B) | | | 71,239 | | |
| Payable to administrator--net (Note B) | | | 43,914 | | |
| Accrued expenses and other payables | | | 60,603 | | |
| Total Liabilities | | | 3,158,635 | | |
| Net Assets at value | | $ | 156,118,664 | | |
| Net Assets consist of: | |
| Paid-in capital | | $ | 154,325,241 | | |
| Undistributed net investment income (loss) | | | 554,749 | | |
| Accumulated net realized gains (losses) on investments | | | (25,627,122 | ) | |
| Net unrealized appreciation (depreciation) in value of investments | | | 26,865,796 | | |
| Net Assets at value | | $ | 156,118,664 | | |
| Net Assets | |
| Class I | | $ | 83,214,507 | | |
| Class S | | | 72,904,157 | | |
| Shares Outstanding ($.001 par value; unlimited shares authorized) | |
| Class I | | | 5,600,645 | | |
| Class S | | | 4,894,351 | | |
| Net Asset Value, offering and redemption price per share | |
| Class I | | $ | 14.86 | | |
| Class S | | | 14.90 | | |
| *Cost of Investments: | |
| Unaffiliated issuers | | $ | 131,781,360 | | |
See Notes to Financial Statements
10
Statement of Operations
Neuberger Berman Advisers Management Trust
| | | SOCIALLY RESPONSIVE
PORTFOLIO | |
| | | For the
Year Ended
December 31, 2010 | |
| Investment Income: | |
| Income (Note A): | |
| Dividend income--unaffiliated issuers | | $ | 2,041,504 | | |
| Interest income--unaffiliated issuers | | �� | 5,547 | | |
| Income from securities loaned--net (Note F) | | | 1,451 | | |
| Foreign taxes withheld | | | (44,790 | ) | |
| Total income | | $ | 2,003,712 | | |
| Expenses: | |
| Investment management fees (Notes A & B) | | | 708,001 | | |
| Administration fees (Note B): | |
| Class I | | | 198,111 | | |
| Class S | | | 188,071 | | |
| Distribution fees (Note B): | |
| Class S | | | 156,726 | | |
| Audit fees | | | 40,900 | | |
| Custodian fees (Note B) | | | 65,702 | | |
| Insurance expense | | | 5,853 | | |
| Legal fees | | | 59,424 | | |
| Shareholder reports | | | 58,116 | | |
| Trustees' fees and expenses | | | 52,324 | | |
| Miscellaneous | | | 11,946 | | |
| Total expenses | | | 1,545,174 | | |
| Expenses reimbursed by Management (Note B) | | | (99,087 | ) | |
| Expenses reduced by custodian fee expense offset arrangement (Note B) | | | (62 | ) | |
| Total net expenses | | | 1,446,025 | | |
| Net investment income (loss) | | $ | 557,687 | | |
| Realized and Unrealized Gain (Loss) on Investments (Note A) | |
| Net realized gain (loss) on: | |
| Sales of investment securities of unaffiliated issuers | | | 3,677,202 | | |
| Foreign currency | | | (2,280 | ) | |
| Change in net unrealized appreciation (depreciation) in value of: | |
| Unaffiliated investment securities | | | 22,857,422 | | |
| Foreign currency | | | 2,814 | | |
| Net gain (loss) on investments | | | 26,535,158 | | |
| Net increase (decrease) in net assets resulting from operations | | $ | 27,092,845 | | |
See Notes to Financial Statements
11
Statements of Changes in Net Assets
Neuberger Berman Advisers Management Trust
| | | SOCIALLY RESPONSIVE PORTFOLIO | |
| | | Year Ended
December 31,
2010 | | Year Ended
December 31,
2009 | |
| Increase (Decrease) in Net Assets: | |
| From Operations (Note A): | |
| Net investment income (loss) | | $ | 557,687 | | | $ | 60,087 | | |
| Net realized gain (loss) on investments | | | 3,674,922 | | | | (14,002,284 | ) | |
| Change in net unrealized appreciation (depreciation) of investments | | | 22,860,236 | | | | 43,112,718 | | |
| Net increase (decrease) in net assets resulting from operations | | | 27,092,845 | | | | 29,170,521 | | |
| Distributions to Shareholders From (Note A): | |
| Net investment income: | |
| Class I | | | (24,642 | ) | | | (1,217,313 | ) | |
| Class S | | | (13,035 | ) | | | (1,002,052 | ) | |
| Total distributions to shareholders | | | (37,677 | ) | | | (2,219,365 | ) | |
| From Fund Share Transactions (Note D): | |
| Proceeds from shares sold: | |
| Class I | | | 24,146,233 | | | | 8,381,467 | | |
| Class S | | | 13,662,499 | | | | 2,721,404 | | |
| Proceeds from reinvestment of dividends and distributions: | |
| Class I | | | 24,642 | | | | 1,217,313 | | |
| Class S | | | 13,035 | | | | 1,002,052 | | |
| Payments for shares redeemed: | |
| Class I | | | (19,380,091 | ) | | | (10,545,630 | ) | |
| Class S | | | (12,122,302 | ) | | | (8,789,012 | ) | |
| Net increase (decrease) from Fund share transactions | | | 6,344,016 | | | | (6,012,406 | ) | |
| Net Increase (Decrease) in Net Assets | | | 33,399,184 | | | | 20,938,750 | | |
| Net Assets: | |
| Beginning of year | | | 122,719,480 | | | | 101,780,730 | | |
| End of year | | $ | 156,118,664 | | | $ | 122,719,480 | | |
| Undistributed net investment income (loss) at end of year | | $ | 554,749 | | | $ | 37,018 | | |
See Notes to Financial Statements
12
Notes to Financial Statements Socially Responsive Portfolio
Note A--Summary of Significant Accounting Policies:
1 General: The Fund is a separate operating series of Neuberger Berman Advisers Management Trust (the "Trust"), a Delaware statutory trust organized pursuant to a Trust Instrument dated May 23, 1994. The Trust is currently comprised of ten separate operating series (each individually a "Series," and collectively the "Funds") each of which is diversified. The Trust is registered as an open-end management investment company under the Investment Company Act of 1940, as amended (the "1940 Act"), and its shares are registered under the Securities Act of 1933, as amended. The Fund currently offers Class I and Class S shares. The Board may establish additional series or classes of shares without the approval of shareholders.
The assets of each Series belong only to that Series, and the liabilities of each Series are borne solely by that Series and no other.
The preparation of financial statements in accordance with U.S. generally accepted accounting principles requires Management to make estimates and assumptions at the date of the financial statements. Actual results could differ from those estimates.
2 Portfolio valuation: Investment securities are valued as indicated in the notes following the Schedule of Investments.
3 Foreign currency translation: The accounting records of the Fund are maintained in U.S. dollars. Foreign currency amounts are translated into U.S. dollars using the exchange rates as of 4:00 p.m., Eastern time, to determine the value of investments, other assets and liabilities. Purchase and sale prices of securities, and income and expenses, are translated into U.S. dollars at the prevailing rate of exchange on the respective dates of such transactions. Net unrealized foreign currency gain (loss), if any, arises from changes in the value of assets and liabilities, other than investments in securities, as a result of changes in exchange rates and is stated separately in the Statement of Operations.
4 Securities transactions and investment income: Securities transactions are recorded on trade date for financial reporting purposes. Dividend income is recorded on the ex-dividend date or, for certain foreign dividends, as soon as the Fund becomes aware of the dividends. Non-cash dividends included in dividend income, if any, are recorded at the fair market value of the securities received. Interest income, including accretion of original issue discount, where applicable, and accretion of discount on short-term investments, if any, is recorded on the accrual basis. Realized gains and losses from securities transactions and foreign currency transactions, if any, are recorded on the basis of identified cost and stated separately in the Statement of Operations. Included in net realized gain (loss) on investments are proceeds from the settlements of class action litigation in which the Fund participated as a class member. The amount of such proceeds for the year ended December 31, 2010 was $97,282.
5 Income tax information: The Funds are treated as separate entities for U.S. federal income tax purposes. It is the policy of the Fund to continue to qualify as a regulated investment company by complying with the requirements of the U.S. Internal Revenue Code applicable to regulated investment companies and to distribute substantially all of its earnings to its shareholders. To the extent the Fund distributes substantially all of its earnings to shareholders, no federal income or excise tax provision is required.
The Fund has adopted the provisions of ASC 740 "Income Taxes" ("ASC 740"). ASC 740 sets forth a minimum threshold for financial statement recognition of a tax position taken, or expected to be taken, in a tax return. The Fund recognizes interest and penalties, if any, related to unrecognized tax positions as an income tax expense in the Statement of Operations. The Fund is subject to examination by U.S. federal and state tax authorities for returns filed for the prior three fiscal years 2007 - 2009. As of December 31, 2010, the Fund did not have any unrecognized tax positions.
13
Income distributions and capital gain distributions are determined in accordance with income tax regulations, which may differ from U.S. generally accepted accounting principles. These differences are primarily due to differing treatments of income and gains on various investment securities held by the Fund, timing differences and differing characterization of distributions made by the Fund as a whole. The Fund may also utilize earnings and profits distributed to shareholders on redemption of shares as a part of the dividends paid deduction for income tax purposes.
As determined on December 31, 2010, permanent differences resulting primarily from different book and tax accounting for foreign currency gains and losses were reclassified at fiscal year-end. These reclassifications had no effect on net income, NAV or NAV per share of the Fund.
The tax character of distributions paid during the years ended December 31, 2010 and December 31, 2009 was as follows:
| | | Distributions Paid From: | | | |
| Ordinary Income | | Long-Term Capital Gain | | Total | |
| 2010 | | 2009 | | 2010 | | 2009 | | 2010 | | 2009 | |
| $ | 37,677 | | | $ | 2,219,365 | | | $ | -- | | | $ | -- | | | $ | 37,677 | | | $ | 2,219,365 | | |
As of December 31, 2010, the components of distributable earnings (accumulated losses) on a U.S. federal income tax basis were as follows:
Undistributed
Ordinary
Income | | Undistributed
Long-Term
Gain | | Unrealized
Appreciation
(Depreciation) | | Loss
Carryforwards
and Deferrals | | Total | |
| $ | 554,749 | | | $ | -- | | | $ | 26,404,118 | | | $ | (25,165,444 | ) | | $ | 1,793,423 | | |
The difference between book basis and tax basis distributable earnings is attributable primarily to timing differences of wash sales and capital loss carryforwards.
To the extent the Fund's net realized capital gains, if any, can be offset by capital loss carryforwards, it is the policy of the Fund not to distribute such gains. Under current tax law, the use of these losses to offset future gains may be limited. As determined at December 31, 2010, the Fund had unused capital loss carryforwards available for federal income tax purposes to offset net realized capital gains, if any, as follows:
| | | Expiring in: | |
| | | 2016 | | 2017 | |
| | | | $6,188,313 | | | $ | 18,977,131 | | |
During the year ended December 31, 2010, the Fund utilized capital loss carryforwards of $1,873,208.
6 Distributions to shareholders: The Fund may earn income, net of expenses, daily on its investments. Distributions from net investment income and net realized capital gains, if any, generally are distributed once a year (usually in October). Income distributions and capital gain distributions to shareholders are recorded on the ex-date.
7 Foreign taxes: Foreign taxes withheld represent amounts withheld by foreign tax authorities, net of refunds recoverable.
8 Expense allocation: Certain expenses are applicable to multiple funds. Expenses directly attributable to a Series are charged to that Series. Expenses of the Trust that are not directly attributable to a particular series of the Trust (e.g., the Fund) are allocated among the series of the Trust, on the basis of relative net assets, except where a more appropriate allocation of expenses to each of the series can otherwise be made fairly. Expenses borne by the complex of related investment companies, which includes open-end and closed-end investment companies for which Management serves as investment manager, that are not directly attributable to a particular investment company in the complex (e.g., the Trust) or series thereof are allocated among the investment companies in the complex or series thereof, on the basis of relative net assets, except where a more appropriate allocation of expenses
14
to each investment company in the complex or series thereof can otherwise be made fairly. The Fund's expenses (other than those specific to each class) are allocated proportionally each day between the classes based upon the relative net assets of each class.
9 Security lending: A third party, eSecLending, has assisted the Fund in conducting a bidding process to try to identify a principal that would pay a guaranteed amount to the Fund in consideration of the Fund entering into an exclusive securities lending arrangement. During the fiscal year, eSecLending served as exclusive lending agent for the Fund. As a result of a bidding process on October 1, 2009, no principal had an exclusive securities lending arrangement with the Fund during the fiscal year; as such, the Fund was not guaranteed any particular level of income during the fiscal year. As of August 27, 2010, the Fund no longer participates in a securities lending program.
Under the securities lending arrangement, the Fund received cash collateral at the beginning of each transaction equal to at least 102% of the prior day's market value of the loaned securities (105% in the case of international securities). The Fund invested all the cash collateral in Neuberger Berman Securities Lending Quality Fund, LLC ("Quality Fund"), a fund managed by Neuberger Berman Fixed Income LLC ("NBFI"), an affiliate of Management, and sub-advised by Dwight Asset Management Company LLC. Quality Fund was not a money market fund registered under the 1940 Act and did not operate in accordance with all requirements of Rule 2a-7 under the 1940 Act. The Fund redeemed all of its investments in Quality Fund, if any, as of August 27, 2010.
Net income from the lending program represents any amounts received from a principal, plus income earned on the cash collateral invested in Quality Fund or in other investments, if applicable, less cash collateral fees and other expenses associated with the loans. For the fiscal year ended December 31, 2010, the Fund received net income under the securities lending arrangement of $1,451, which is reflected in the Statement of Operations under the caption "Income from securities loaned--net," which includes $1,007 of interest income that was earned from the Quality Fund.
10 Investments in foreign securities: Investing in foreign securities may involve certain sovereign and other risks, in addition to the credit and market risks normally associated with domestic securities. These additional risks include the possibility of adverse political and economic developments (including political instability, nationalization, expropriation, or confiscatory taxation) and the potentially adverse effects of unavailability of public information regarding issuers, less government supervision and regulation of financial markets, reduced liquidity of certain financial markets, and the lack of uniform accounting, auditing, and financial reporting standards or the application of standards that are different or less stringent than those applied in the United States. Foreign securities also may experience greater price volatility, higher rates of inflation, and delays in settlement.
11 Indemnifications: Like many other companies, the Trust's organizational documents provide that its officers and trustees are indemnified against certain liabilities arising out of the performance of their duties to the Trust. In addition, both in some of its principal service contracts and in the normal course of its business, the Trust enters into contracts that provide indemnifications to other parties for certain types of losses or liabilities. The Trust's maximum exposure under these arrangements is unknown as this could involve future claims against the Trust.
12 Other: All net investment income and realized and unrealized capital gains and losses of the Fund are allocated, on the basis of relative net assets, pro rata among its respective classes.
Note B--Management Fees, Administration Fees, Distribution Arrangements, and Other Transactions with Affiliates:
Fund shares are issued and redeemed in connection with investments in and payments under certain variable annuity contracts and variable life insurance policies issued through separate accounts of life insurance companies and are also offered directly to qualified pension and retirement plans.
15
The Fund retains Management as its investment manager under a Management Agreement. For such investment management services, the Fund pays Management a fee at the annual rate of 0.55% of the first $250 million of the Fund's average daily net assets, 0.525% of the next $250 million, 0.50% of the next $250 million, 0.475% of the next $250 million, 0.45% of the next $500 million, 0.425% of the next $2.5 billion, and 0.40% of average daily net assets in excess of $4 billion.
The Fund retains Management as its administrator under an Administration Agreement. Each class pays Management an administration fee at the annual rate of 0.30% of its average daily net assets under this agreement. Additionally, Management retains State Street Bank and Trust Company ("State Street") as its sub-administrator under a Sub-Administration Agreement. Management pays State Street a fee for all services received under this agreement.
The Board adopted a non-fee distribution plan for the Fund's Class I.
For the Fund's Class S, Management acts as agent in arranging for the sale of class shares without commission and bears advertising and promotion expenses. The Board has adopted a distribution plan (the "Plan") with respect to this class, pursuant to Rule 12b-1 under the 1940 Act. The Plan provides that, as compensation for administrative and other services provided to this class, Management's activities and expenses related to the sale and distribution of this class of shares, and ongoing services provided to investors in this class, Management receives from this class a fee at the annual rate of 0.25% of Class S's average daily net assets. Management receives this amount to provide distribution and shareholder servicing for this class and pays a portion of it to institutions that provide such services. Those institutions may use the payments for, among other purposes, compensating employees engaged in sales and/or shareholder servicing. The amount of fees paid by this class during any year could have been more or less than the cost of distribution and other services provided to this class. FINRA rules limit the amount of annual distribution fees that may be paid by a mutual fund and impose a ceiling on the cumulative distribution fees paid. The Trust's Plan complies with those rules.
Management has contractually undertaken to forgo current payment of fees and/or reimburse the Fund's Class I and Class S shares for their operating expenses (exclusive of interest, taxes, brokerage commissions, extraordinary expenses, and transaction costs) ("Operating Expenses") which exceed the expense limitation as detailed in the following table:
| | | Expense Limitation(1) | | Expiration | | Reimbursement from
Management for the
Year Ended
December 31, 2010 | |
| Class I | | | 1.30 | % | | 12/31/13 | | $ | -- | | |
| Class S | | | 1.17 | % | | 12/31/13 | | | 99,087 | | |
(1) Expense limitation per annum of the respective class' average daily net assets.
Each respective class has agreed to repay Management through December 31, 2016 for fees and expenses foregone and/or its excess Operating Expenses previously reimbursed by Management, so long as its annual Operating Expenses during that period do not exceed its expense limitation, and the repayment is made within three years after the year in which Management issued the reimbursement or waived fees. During the year ended December 31, 2010, there was no repayment to Management under its contractual expense limitations. At December 31, 2010 the Fund's Class I shares had no contingent liability to Management under its contractual expense limitation. At December 31, 2010, the Fund's Class S shares contingent liabilities to Management under its contractual expense limitation were as follows:
| | | Expiring in: | | | |
| | | 2011 | | 2012 | | 2013 | | Total | |
| Class S | | $ | 71,032 | | | $ | 117,793 | | | $ | 99,087 | | | $ | 287,912 | | |
16
Neuberger Berman LLC ("Neuberger") is retained by Management to furnish it with investment recommendations and research information without added cost to the Fund. Several individuals who are officers and/or trustees of the Trust are also employees of Neuberger and/or Management.
On May 4, 2009, NBSH Acquisition, LLC ("NBSH"), an entity organized by key members of senior management of Neuberger Berman Group LLC ("NBG") and its consolidated subsidiaries (NBG, and together with its consolidated subsidiaries "NB Group") acquired a majority interest in the business conducted by Management and Neuberger, as well as the fixed income and certain alternative asset management businesses of Lehman Brothers Holdings Inc.'s Investment Management Division (together with Management and Neuberger, the "Acquired Businesses") (the "Acquisition"). Prior to that date, Neuberger and the predecessor in interest of Management were indirect wholly owned subsidiaries of Lehman Brothers Holdings Inc. ("LBHI"). On September 15, 2008, LBHI filed a voluntary petition under Chapter 11 of the U.S. Bankruptcy Code, and on December 22, 2008, the bankruptcy court having jurisdiction over the LBHI matter approved the sale of the Acquired Businesses to NBSH (or its successor or assign).
Through NBSH, portfolio managers, NB Group's management team, and certain of its key employees and senior professionals now indirectly own 52% of the voting equity of NBG. LBHI and certain affiliates of LBHI own the remaining 48% of NBG's voting equity. The closing of the Acquisition resulted in an "assignment" of the Fund's Management Agreement and Sub-Advisory Agreement. Such an assignment, by law, automatically terminated those agreements. Accordingly, prior to the closing, the Board, including the Trustees who are not "interested persons" of the Fund's investment manager and its affiliates or the Fund, considered and approved a new Management Agreement and Sub-Advisory Agreement for the Fund. The new agreements, which are virtually identical to those previously in effect, were also approved by a vote of the Fund's shareholders.
These events did not have a material impact on the Fund or its operations. Management and Neuberger continue to operate in the ordinary course of business as the investment manager and sub-adviser of the Fund.
Other non-affiliated service provider: The Fund has an expense offset arrangement in connection with its custodian contract. For the year ended December 31, 2010, the impact of this arrangement was a reduction of expenses of $62.
Note C--Securities Transactions:
During the year ended December 31, 2010, there were purchase and sale transactions (excluding short-term securities) of $53,741,088 and $50,567,337, respectively.
During the year ended December 31, 2010, no brokerage commissions on securities transactions were paid to affiliated brokers.
Note D--Fund Share Transactions:
Share activity for the years ended December 31, 2010 and December 31, 2009 was as follows:
For the Year Ended December 31, 2010
| | | Shares Sold | | Shares Issued on
Reinvestment of
Dividends and
Distributions | | Shares
Redeemed | | Total | |
| Class I | | | 1,798,275 | | | | 1,811 | | | | (1,532,598 | ) | | | 267,488 | | |
| Class S | | | 1,037,001 | | | | 956 | | | | (938,668 | ) | | | 99,289 | | |
17
For the Year Ended December 31, 2009
| | | Shares Sold | | Shares Issued on
Reinvestment of
Dividends and
Distributions | | Shares
Redeemed | | Total | |
| Class I | | | 796,814 | | | | 103,601 | | | | (1,064,899 | ) | | | (164,484 | ) | |
| Class S | | | 257,870 | | | | 84,992 | | | | (879,211 | ) | | | (536,349 | ) | |
Note E--Line of Credit:
At December 31, 2010, the Fund was a participant in a single committed, unsecured $200,000,000 ($150,000,000 prior to September 17, 2010) line of credit with State Street, to be used only for temporary or emergency purposes. Other investment companies managed by Management also participate in this line of credit on the same terms. Interest is charged on borrowings under this line of credit at the higher of (a) the Federal Funds Rate plus 1.25% per annum or (b) the Overnight LIBOR Rate plus 1.25% per annum. A commitment fee of 0.125% (0.15% prior to September 17, 2010) per annum of the available line of credit is charged, of which each participating Fund has agreed to pay its pro rata share, based on the ratio of its individual net assets to the net assets of all participants at the time the fee is due and payable. The fee is paid quarterly in arrears. Because several mutual funds participate, there is no assurance that an individual Fund will have access to all or any part of the $200,000,000 ($150,000,000 prior to September 17, 2010) at any particular time. There were no loans outstanding pursuant to this line of credit at December 31, 2010. During the year ended December 31, 2010, the Fund did not utilize this line of credit.
Note F--Investments in Affiliates:
| Name of Issuer | | Balance of
Shares
Held
December 31,
2009 | | Gross
Purchases
and
Additions | | Gross
Sales
and
Reductions | | Balance of
Shares
Held
December 31,
2010 | | Value
December 31,
2010 | | Income from
Investments in
Affiliated
Issuers
Included in
Total Income | |
Neuberger Berman Securities
Lending Quality Fund, LLC* | | | 2,561,010 | | | | 5,294,309 | | | | 7,855,319 | | | | -- | | | $ | -- | | | $ | 1,007 | | |
* Quality Fund, a fund that was managed by NBFI, an affiliate of Management, was used to invest cash the Fund received as collateral for securities loaned as approved by the Board. Because all shares of Quality Fund were held by funds in the related investment management complex, Quality Fund may have been considered an affiliate of the Fund.
18
Financial Highlights
Socially Responsive Portfolio
The following tables include selected data for a share outstanding throughout each period and other performance information derived from the Financial Statements.
| Class I | |
| | | Year Ended December 31, | |
| | | 2010 | | 2009 | | 2008 | | 2007 | | 2006 | |
| Net Asset Value, Beginning of Year | | $ | 12.10 | | | $ | 9.39 | | | $ | 17.91 | | | $ | 16.71 | | | $ | 14.91 | | |
| Income From Investment Operations: | |
| Net Investment Income (Loss)t | | | .06 | | | | .01 | | | | .11 | | | | .12 | | | | .05 | | |
Net Gains or Losses on Securities
(both realized and unrealized) | | | 2.70 | | | | 2.93 | | | | (7.13 | ) | | | 1.16 | | | | 1.98 | | |
| Total From Investment Operations | | | 2.76 | | | | 2.94 | | | | (7.02 | ) | | | 1.28 | | | | 2.03 | | |
| Less Distributions From: | |
| Net Investment Income | | | (.00 | ) | | | (.23 | ) | | | (.34 | ) | | | (.02 | ) | | | (.03 | ) | |
| Net Capital Gains | | | -- | | | | -- | | | | (1.16 | ) | | | (.06 | ) | | | (.20 | ) | |
| Total Distributions | | | (.00 | ) | | | (.23 | ) | | | (1.50 | ) | | | (.08 | ) | | | (.23 | ) | |
| Net Asset Value, End of Year | | $ | 14.86 | | | $ | 12.10 | | | $ | 9.39 | | | $ | 17.91 | | | $ | 16.71 | | |
| Total Returntt | | | 22.85 | % | | | 31.43 | % | | | (39.44 | )% | | | 7.61 | % | | | 13.70 | % | |
| Ratios/Supplemental Data | |
| Net Assets, End of Year (in millions) | | $ | 83.2 | | | $ | 64.5 | | | $ | 51.6 | | | $ | 557.9 | | | $ | 262.6 | | |
| Ratio of Gross Expenses to Average Net Assets# | | | 1.08 | % | | | 1.15 | % | | | .92 | % | | | .92 | % | | | 1.07 | % | |
| Ratio of Net Expenses to Average Net Assets | | | 1.08 | % | | | 1.15 | % | | | .92 | % | | | .91 | % | | | 1.06 | %S | |
Ratio of Net Investment Income (Loss) to Average
Net Assets | | | .48 | % | | | .06 | % | | | .70 | % | | | .65 | % | | | .33 | % | |
| Portfolio Turnover Rate | | | 41 | % | | | 34 | % | | | 41 | % | | | 26 | % | | | 56 | % | |
See Notes to Financial Highlights
19
Financial Highlights (cont'd)
| Class S | |
| | |
Year Ended December 31, | | Period from
May 1 2006^
to December 31, | |
| | | 2010 | | 2009 | | 2008 | | 2007 | | 2006 | |
| Net Asset Value, Beginning of Period | | $ | 12.14 | | | $ | 9.41 | | | $ | 17.86 | | | $ | 16.69 | | | $ | 15.59 | | |
| Income From Investment Operations: | |
| Net Investment Income (Loss)t | | | .05 | | | | .00 | | | | .06 | | | | .06 | | | | .02 | | |
Net Gains or Losses on Securities
(both realized and unrealized) | | | 2.71 | | | | 2.94 | | | | (7.06 | ) | | | 1.17 | | | | 1.08 | | |
| Total From Investment Operations | | | 2.76 | | | | 2.94 | | | | (7.00 | ) | | | 1.23 | | | | 1.10 | | |
| Less Distributions From: | |
| Net Investment Income | | | (.00 | ) | | | (.21 | ) | | | (.29 | ) | | | (.00 | ) | | | -- | | |
| Net Capital Gains | | | -- | | | | -- | | | | (1.16 | ) | | | (.06 | ) | | | -- | | |
| Total Distributions | | | (.00 | ) | | | (.21 | ) | | | (1.45 | ) | | | (.06 | ) | | | -- | | |
| Net Asset Value, End of Period | | $ | 14.90 | | | $ | 12.14 | | | $ | 9.41 | | | $ | 17.86 | | | $ | 16.69 | | |
| Total Returntt | | | 22.76 | % | | | 31.31 | % | | | (39.43 | )% | | | 7.37 | % | | | 7.06 | %** | |
| Ratios/Supplemental Data | |
| Net Assets, End of Period (in millions) | | $ | 72.9 | | | $ | 58.2 | | | $ | 50.1 | | | $ | 90.2 | | | $ | 91.6 | | |
| Ratio of Gross Expenses to Average Net Assets# | | | 1.17 | % | | | 1.18 | % | | | 1.17 | % | | | 1.17 | % | | | 1.17 | %* | |
| Ratio of Net Expenses to Average Net AssetsS | | | 1.17 | % | | | 1.18 | % | | | 1.17 | % | | | 1.16 | % | | | 1.16 | %* | |
Ratio of Net Investment Income (Loss) to
Average Net Assets | | | .39 | % | | | .05 | % | | | .40 | % | | | .37 | % | | | .16 | %* | |
| Portfolio Turnover Rate | | | 41 | % | | | 34 | % | | | 41 | % | | | 26 | % | | | 56 | %O | |
See Notes to Financial Highlights
20
Notes to Financial Highlights Socially Responsive Portfolio
tt Total return based on per share NAV reflects the effects of changes in NAV on the performance of the Fund during each fiscal period and assumes income dividends and other distributions, if any, were reinvested. Results represent past performance and do not guarantee future results. Current returns may be lower or higher than the performance data quoted. Investment returns and principal may fluctuate and shares when redeemed may be worth more or less than original cost. Total return would have been lower if Management had not reimbursed certain expenses. Total return would have been higher if Management had not recouped previously reimbursed expenses. The total return information shown does not reflect charges and other expenses that apply to the separate account or the related insurance policies, and the inclusion of these charges and other expenses would reduce the total return for all fiscal periods shown.
# The Fund is required to calculate an expense ratio without taking into consideration any expense reductions related to expense offset arrangements.
S After reimbursement of expenses by Management. Had Management not undertaken such action, the annualized ratios of net expenses to average daily net assets would have been:
| | | Year Ended December 31, | |
| | | 2010 | | 2009 | | 2008 | | 2007 | | 2006 | |
| Socially Responsive Portfolio Class S | | | 1.33 | % | | | 1.40 | % | | | 1.26 | % | | | -- | | | | 1.18 | %(1) | |
(1) Period from May 1, 2006 to December 31, 2006.
After reimbursement of expenses previously paid by Management. Had Management not been reimbursed, the annualized ratio of net expenses to average daily net assets would have been:
| | | Year Ended December 31, | |
| | | 2007 | | 2006 | |
| Socially Responsive Portfolio Class I | | | -- | | | | .97 | % | |
| Socially Responsive Portfolio Class S | | | 1.16 | % | | | -- | | |
t Calculated based on the average number of shares outstanding during each fiscal period.
^ The date investment operations commenced.
O Portfolio turnover is calculated at the Fund level. Percentage indicated was calculated for year ended December 31, 2006.
* Annualized.
** Not annualized.
21
Report of Independent Registered Public Accounting Firm
To the Board of Trustees of
Neuberger Berman Advisers Management Trust and
Shareholders of Socially Responsive Portfolio
We have audited the accompanying statement of assets and liabilities, including the schedule of investments, of Socially Responsive Portfolio, one of the series constituting Neuberger Berman Advisers Management Trust (the "Trust"), as of December 31, 2010, and the related statement of operations for the year then ended, the statements of changes in net assets for each of the two years in the period then ended, and the financial highlights for each of the five years in the period then ended. These financial statements and financial highlights are the responsibility of the Trust's management. Our responsibility is to express an opinion on these financial statements and financial highlights based on our audits.
We conducted our audits in accordance with the standards of the Public Company Accounting Oversight Board (United States). Those standards require that we plan and perform the audit to obtain reasonable assurance about whether the financial statements and financial highlights are free of material misstatement. We were not engaged to perform an audit of the Trust's internal control over financial reporting. Our audits included consideration of internal control over financial reporting as a basis for designing audit procedures that are appropriate in the circumstances, but not for the purpose of expressing an opinion on the effectiveness of the Trust's internal control over financial reporting. Accordingly, we express no such opinion. An audit also includes examining, on a test basis, evidence supporting the amounts and disclosures in the financial statements and financial highlights, assessing the accounting principles used and significant estimates made by management, and evaluating the overall financial statement presentation. Our procedures included confirmation of securities owned as of December 31, 2010 by correspondence with the custodian and brokers or by other appropriate auditing procedures where replies from brokers were not received. We believe that our audits provide a reasonable basis for our opinion.
In our opinion, the financial statements and financial highlights referred to above present fairly, in all material respects, the financial position of Socially Responsive Portfolio, a series of Neuberger Berman Advisers Management Trust, at December 31, 2010, the results of its operations for the year then ended, the changes in its net assets for each of the two years in the period then ended, and the financial highlights for each of the five years in the period then ended, in conformity with U.S. generally accepted accounting principles.

Boston, Massachusetts
February 10, 2011
22
Trustee and Officer Information
The following tables set forth information concerning the trustees and officers of the Trust. All persons named as trustees and officers also serve in similar capacities for other funds administered or managed by Management, Neuberger and NBFI. The Statement of Additional Information includes additional information about trustees and is available upon request, without charge, by calling (800) 877-9700.
Information about the Board of Trustees
Name, (Year of Birth),
and Address(1) | | Position and
Length of
Time Served(2) | | Principal Occupation(s)(3) | | Number of
Funds in Fund
Complex
Overseen by
Trustee | | Other Directorships
Held Outside Fund
Complex by Trustee | |
| Independent Trustees | |
|
| John Cannon (1930) | | Trustee since 2000 | | Consultant; formerly, Chairman, CDC Investment Advisers (registered investment adviser), 1993 to January 1999; formerly, President and Chief Executive Officer, AMA Investment Advisors, an affiliate of the American Medical Association. | | | 43 | | | Formerly, Independent Trustee or Director of three series of Oppenheimer Funds: Oppenheimer Limited Term New York Municipal Fund, Rochester Fund Municipals, and Oppenheimer Convertible Securities Fund, 1992 to 2009. | |
|
| Faith Colish (1935) | | Trustee since 1982 | | Counsel, Carter Ledyard & Milburn LLP (law firm) since October 2002; formerly, Attorney-at-Law and President, Faith Colish, A Professional Corporation, 1980 to 2002. | | | 43 | | | Formerly, Director, 1997 to 2003, and Advisory Director, 2003 to 2006; ABA Retirement Funds (formerly, American Bar Retirement Association) (not-for-profit membership corporation). | |
|
23
Name, (Year of Birth),
and Address(1) | | Position and
Length of
Time Served(2) | | Principal Occupation(s)(3) | | Number of
Funds in Fund
Complex
Overseen by
Trustee | | Other Directorships
Held Outside Fund
Complex by Trustee | |
| Martha C. Goss (1949) | | Trustee since 2007 | | President, Woodhill Enterprises Inc./Chase Hollow Associates LLC (personal investment vehicle), since 2006; Chief Operating and Financial Officer, Hopewell Holdings LLC/Amwell Holdings, LLC (a holding company for a healthcare reinsurance company start-up), since 2003; formerly, Consultant, Resources Connection (temporary staffing), 2002 to 2006. | | | 43 | | | Director, Ocwen Financial Corporation (mortgage servicing), since 2005; Director, American Water (water utility), since 2003; Director, Channel Reinsurance (financial guaranty reinsurance), since 2006; Director, Allianz Life of New York (insurance), since 2005; Director, Financial Women's Association of New York (not-for-profit association), since 2003; Trustee Emerita, Brown University, since 1998; formerly, Advisory Board Member, Attensity (software developer), 2005 to 2007; formerly, Director, Bank Leumi (commercial bank), 2005 to 2007; formerly, Director, Claire's Stores, Inc. (retailer), 2005 to 2007. | |
|
| C. Anne Harvey (1937) | | Trustee since 1998 | | President, C.A. Harvey Associates, since October 2001; formerly, Director, AARP, 1978 to December 2001. | | | 43 | | | Formerly, President, Board of Associates to The National Rehabilitation Hospital's Board of Directors, 2001 to 2002; formerly, Member, Individual Investors Advisory Committee to the New York Stock Exchange Board of Directors, 1998 to 2002. | |
|
24
Name, (Year of Birth),
and Address(1) | | Position and
Length of
Time Served(2) | | Principal Occupation(s)(3) | | Number of
Funds in Fund
Complex
Overseen by
Trustee | | Other Directorships
Held Outside Fund
Complex by Trustee | |
| Robert A. Kavesh (1927) | | Trustee since 2000 | | Retired; Marcus Nadler Professor Emeritus of Finance and Economics, New York University Stern School of Business; formerly, Executive Secretary-Treasurer, American Finance Association, 1961 to 1979. | | | 43 | | | Formerly, Director, The Caring Community (not-for-profit), 1997 to 2006; formerly, Director, DEL Laboratories, Inc. (cosmetics and pharmaceuticals), 1978 to 2004; formerly, Director, Apple Bank for Savings, 1979 to 1990; formerly, Director, Western Pacific Industries, Inc., (public company), 1972 to 1986. | |
|
| Michael M. Knetter (1960) | | Trustee since 2007 | | President and Chief Executive Officer, University of Wisconsin Foundation, October 2010 to Present; formerly, Dean, School of Business, University of Wisconsin - Madison; formerly, Professor of International Economics and Associate Dean, Amos Tuck School of Business - Dartmouth College, 1998 to 2002. | | | 43 | | | Director, American Family Insurance (a mutual company, not publicly traded), since March 2009; Trustee, Northwestern Mutual Series Fund, Inc., since February 2007; Director, Wausau Paper, since 2005; formerly, Director, Great Wolf Resorts, 2004 to 2009. | |
|
| Howard A. Mileaf (1937) | | Trustee since 1999 | | Retired; formerly, Vice President and General Counsel, WHX Corporation (holding company), 1993 to 2001. | | | 43 | | | Formerly, Director, Webfinancial Corporation (holding company), 2002 to 2008; formerly, Director, WHX Corporation (holding company), 2002 to 2005; formerly, Director, State Theatre of New Jersey (not-for-profit theatre), 2000 to 2005. | |
|
| George W. Morriss (1947) | | Trustee since 2007 | | Retired; formerly, Executive Vice President and Chief Financial Officer, People's Bank, Connecticut (a financial services company), 1991 to 2001. | | | 43 | | | Manager, Old Mutual Funds of Hedge Funds fund complex (consisting of six funds), since 2006 for four funds and since 2007 for two funds; formerly, Member NASDAQ Issuers' Affairs Committee, 1995 to 2003. | |
|
25
Name, (Year of Birth),
and Address(1) | | Position and
Length of
Time Served(2) | | Principal Occupation(s)(3) | | Number of
Funds in Fund
Complex
Overseen by
Trustee | | Other Directorships
Held Outside Fund
Complex by Trustee | |
| Edward I. O'Brien (1928) | | Trustee since 2000 | | Retired; formerly, Member, Investment Policy Committee, Edward Jones, 1993 to 2001; President, Securities Industry Association ("SIA") (securities industry's representative in government relations and regulatory matters at the federal and state levels), 1974 to 1992; Adviser to SIA, November 1992 to November 1993. | | | 43 | | | Formerly, Director, Legg Mason, Inc. (financial services holding company), 1993 to July 2008; formerly, Director, Boston Financial Group (real estate and tax shelters), 1993 to 1999. | |
|
| Cornelius T. Ryan (1931) | | Trustee since 2000 | | General Partner and Adviser, TD2, TD3, and TOF1 Healthcare Venture Capital Partnerships; Founding General Partner, Oxford Partners and Oxford Bioscience Partners (venture capital investing) and President, Oxford Venture Corporation, since 1981. | | | 43 | | | Trustee, Norwalk Hospital Foundation, since 2000; Director, Supply Pro (privately held company), since 2008; formerly, Trustee, Norwalk Hospital, 1995 to 2004; formerly, President and Director, Randolph Computer Corp., 1966 to 1984; formerly, Director of numerous privately held portfolio companies of Oxford Partners and Oxford Bioscience Partners, 1981 to 2005. | |
|
| Tom D. Seip (1950) | | Trustee since 2000; Chairman of the Board since 2008; Lead Independent Trustee from 2006 to 2008 | | General Partner, Seip Investments LP (a private investment partnership); formerly, President and CEO, Westaff, Inc. (temporary staffing), May 2001 to January 2002; formerly, Senior Executive, The Charles Schwab Corporation, 1983 to 1998, including Chief Executive Officer, Charles Schwab Investment Management, Inc.; Trustee, Schwab Family of Funds and Schwab Investments, 1997 to 1998; and Executive Vice President-Retail Brokerage, Charles Schwab & Co., Inc., 1994 to 1997. | | | 43 | | | Director, H&R Block, Inc. (financial services company), since May 2001; Chairman, Compensation Committee, H&R Block, Inc., since 2006; formerly, Director, Forward Management, Inc. (asset management company), 1999 to 2006. | |
|
26
Name, (Year of Birth),
and Address(1) | | Position and
Length of
Time Served(2) | | Principal Occupation(s)(3) | | Number of
Funds in Fund
Complex
Overseen by
Trustee | | Other Directorships
Held Outside Fund
Complex by Trustee | |
| Candace L. Straight (1947) | | Trustee since 1999 | | Private investor and consultant specializing in the insurance industry; formerly, Advisory Director, Securitas Capital LLC (a global private equity investment firm dedicated to making investments in the insurance sector), 1998 to December 2003. | | | 43 | | | Director, Montpelier Re Holdings Ltd. (reinsurance company), since 2006; formerly, Director, National Atlantic Holdings Corporation (property and casualty insurance company), 2004 to 2008; formerly, Director, The Proformance Insurance Company (property and casualty insurance company), 2004 to 2008; formerly, Director, Providence Washington Insurance Company (property and casualty insurance company), 1998 to 2006; formerly, Director, Summit Global Partners (insurance brokerage firm), 2000 to 2005. | |
|
| Peter P. Trapp (1944) | | Trustee since 1984 | | Retired; formerly, Regional Manager for Mid-Southern Region, Ford Motor Credit Company, September 1997 to 2007; formerly, President, Ford Life Insurance Company, April 1995 to August 1997. | | | 43 | | | None. | |
|
27
Name, (Year of Birth),
and Address(1) | | Position and
Length of
Time Served(2) | | Principal Occupation(s)(3) | | Number of
Funds in Fund
Complex
Overseen by
Trustee | | Other Directorships
Held Outside Fund
Complex by Trustee | |
| Trustees who are "Interested Persons" | |
|
| Joseph V. Amato* (1962) | | Trustee since 2009 | | President and Director, Neuberger Berman Group LLC, since 2009; President and Chief Executive Officer, Neuberger and Neuberger Berman Holdings LLC (including its predecessor, Neuberger Berman Inc.), since 2007; Chief Investment Officer, Neuberger, since 2009; Chief Investment Officer (Equities) and Managing Director, Management, since 2009; Managing Director, NBFI, since 2007; Board member of NBFI since 2006; formerly, Global Head of Asset Management of LBHI's Investment Management Division, 2006 to 2009; formerly, member of LBHI's Investment Management Division's Executive Management Committee, 2006 to 2009; formerly, Managing Director, Lehman Brothers Inc. ("LBI"), 2006 to 2008; formerly, Chief Recruiting and Development Officer, LBI, 2005 to 2006; formerly, Global Head of LBI's Equity Sales and a Member of its Equities Division Executive Committee, 2003 to 2005. | | | 43 | | | Member of Board of Advisors, McDonough School of Business, Georgetown University, since 2001; Member of New York City Board of Advisors, Teach for America, since 2005; Trustee, Montclair Kimberley Academy (private school), since 2007. | |
|
28
Name, (Year of Birth),
and Address(1) | | Position and
Length of
Time Served(2) | | Principal Occupation(s)(3) | | Number of
Funds in Fund
Complex
Overseen by
Trustee | | Other Directorships
Held Outside Fund
Complex by Trustee | |
| Robert Conti* (1956) | | Chief Executive Officer, President and Trustee since 2008; prior thereto, Executive Vice President in 2008 and Vice President, 2000 to 2008 | | Managing Director, Neuberger, since 2007; formerly, Senior Vice President, Neuberger, 2003 to 2006; formerly, Vice President, Neuberger, 1999 to 2003; President and Chief Executive Officer, Management, since 2008; formerly, Senior Vice President, Management, 2000 to 2008. | | | 43 | | | Chairman of the Board, Staten Island Mental Health Society since 2008. | |
|
| Jack L. Rivkin* (1940) | | Trustee since 2002; President, 2002 to 2008 | | Formerly, Executive Vice President and Chief Investment Officer, Neuberger Berman Holdings LLC (holding company), 2002 to August 2008 and 2003 to August 2008, respectively; formerly, Managing Director and Chief Investment Officer, Neuberger, December 2005 to August 2008 and 2003 to August 2008, respectively; formerly, Executive Vice President, Neuberger, December 2002 to 2005; formerly, Director and Chairman, Management, December 2002 to August 2008; formerly, Executive Vice President, Citigroup Investments, Inc., September 1995 to February 2002; formerly, Executive Vice President, Citigroup Inc., September 1995 to February 2002. | | | 43 | | | Director, Idealab (private company), since 2009; Director, Distributed World Power (private company), since 2009; Director, Dale Carnegie and Associates, Inc. (private company), since 1999; Director, Solbright, Inc. (private company), since 1998; Director, SA Agricultural Fund, since 2009; Chairman and Director, Essential Brands (consumer products) since 2008; formerly, Director, New York Society of Security Analysts, 2006 to 2008. | |
|
(1) The business address of each listed person is 605 Third Avenue, New York, New York 10158.
(2) Pursuant to the Trust's Trust Instrument, each of these Trustees shall hold office for life or until his or her successor is elected or the Trust terminates; except that (a) any Trustee may resign by delivering a written resignation; (b) any Trustee may be removed with or without cause at any time by a written instrument signed by at least two-thirds of the other Trustees; (c) any Trustee who requests to be retired, or who has become unable to serve, may be retired by a written instrument signed by a majority of the other Trustees; and (d) any Trustee may be removed at any shareholder meeting by a vote of at least two-thirds of the outstanding shares.
29
(3) Except as otherwise indicated, each individual has held the positions shown for at least the last five years.
* Indicates a Trustee who is an "interested person" within the meaning of the 1940 Act. Mr. Amato and Mr. Conti are interested persons of the Trust by virtue of the fact that each is an officer of Management, Neuberger and/or their affiliates. Mr. Rivkin may be deemed an interested person of the Trust by virtue of the fact that, until August 2008, he was a director of Management and an officer of Neuberger.
30
Information about the Officers of the Trust
Name, (Year of Birth),
and Address(1) | | Position and
Length of Time
Served(2) | | Principal Occupation(s)(3) | |
| Andrew B. Allard (1961) | | Anti-Money Laundering Compliance Officer since 2002 | | Senior Vice President, Neuberger, since 2006; Deputy General Counsel, Neuberger, since 2004; formerly, Vice President, Neuberger, 2000 to 2005; Anti-Money Laundering Compliance Officer, nine registered investment companies for which Management acts as investment manager and administrator (six since 2002, one since 2003, one since 2005 and one since 2006). | |
|
| Claudia A. Brandon (1956) | | Executive Vice President since 2008 and Secretary since 1985 | | Senior Vice President, Neuberger, since 2007 and Employee since 1999; Senior Vice President, Management, since 2008 and Assistant Secretary since 2004; formerly, Vice President, Neuberger, 2002 to 2006; formerly, Vice President-Mutual Fund Board Relations, Management, 2000 to 2008; Executive Vice President, nine registered investment companies for which Management acts as investment manager and administrator (nine since 2008); Secretary, nine registered investment companies for which Management acts as investment manager and administrator (three since 1985, three since 2002, one since 2003, one since 2005 and one since 2006). | |
|
| Maxine L. Gerson (1950) | | Executive Vice President since 2008 and Chief Legal Officer since 2005 (only for purposes of sections 307 and 406 of the Sarbanes-Oxley Act of 2002) | | Managing Director, Neuberger, since 2009, and Deputy General Counsel and Assistant Secretary Neuberger since 2001; Managing Director, Management, since 2009, and Secretary and General Counsel, Management, since 2004; formerly, Senior Vice President, Neuberger, 2002 to 2009; formerly, Senior Vice President, Management, 2006 to 2009; Executive Vice President, nine registered investment companies for which Management acts as investment manager and administrator (nine since 2008); Chief Legal Officer (only for purposes of sections 307 and 406 of the Sarbanes-Oxley Act of 2002), nine registered investment companies for which Management acts as investment manager and administrator (eight since 2005 and one since 2006). | |
|
| Sheila R. James (1965) | | Assistant Secretary since 2002 | | Vice President, Neuberger, since 2008 and Employee since 1999; formerly, Assistant Vice President, Neuberger, 2007; Assistant Secretary, nine registered investment companies for which Management acts as investment manager and administrator (six since 2002, one since 2003, one since 2005 and one since 2006). | |
|
| Brian Kerrane (1969) | | Vice President since 2008 | | Senior Vice President, Neuberger, since 2006; formerly, Vice President, Neuberger, 2002 to 2006; Vice President, Management, since 2008 and Employee since 1991; Vice President, nine registered investment companies for which Management acts as investment manager and administrator (nine since 2008). | |
|
| Kevin Lyons (1955) | | Assistant Secretary since 2003 | | Assistant Vice President, Neuberger, since 2008 and Employee since 1999; Assistant Secretary, nine registered investment companies for which Management acts as investment manager and administrator (seven since 2003, one since 2005 and one since 2006). | |
|
31
Name, (Year of Birth),
and Address(1) | | Position and
Length of Time
Served(2) | | Principal Occupation(s)(3) | |
| Owen F. McEntee, Jr. (1961) | | Vice President since 2008 | | Vice President, Neuberger, since 2006; Employee, Management, since 1992; Vice President, nine registered investment companies for which Management acts as investment manager and administrator (nine since 2008). | |
|
| John M. McGovern (1970) | | Treasurer and Principal Financial and Accounting Officer since 2005 | | Senior Vice President, Neuberger, since 2007; formerly, Vice President, Neuberger, 2004 to 2006; Employee, Management, since 1993; Treasurer and Principal Financial and Accounting Officer, nine registered investment companies for which Management acts as investment manager and administrator (eight since 2005 and one since 2006); formerly, Assistant Treasurer, eight registered investment companies for which Management acts as investment manager and administrator, 2002 to 2005. | |
|
| Andrew Provencher (1965) | | Vice President since 2008 | | Managing Director, Management, since 2008; Managing Director, Neuberger, since 2005; formerly, Senior Vice President, Neuberger, 2003 to 2005; Vice President, nine registered investment companies for which Management acts as investment manager and administrator (nine since 2008). | |
|
| Frank Rosato (1971) | | Assistant Treasurer since 2005 | | Vice President, Neuberger, since 2006; Employee, Management, since 1995; Assistant Treasurer, nine registered investment companies for which Management acts as investment manager and administrator (eight since 2005 and one since 2006). | |
|
| Neil S. Siegel (1967) | | Vice President since 2008 | | Managing Director, Management, since 2008; Managing Director, Neuberger, since 2006; formerly, Senior Vice President, Neuberger, 2004 to 2006; Vice President, nine registered investment companies for which Management acts as investment manager and administrator (nine since 2008). | |
|
| Chamaine Williams (1971) | | Chief Compliance Officer since 2005 | | Senior Vice President, Neuberger, since 2007; Chief Compliance Officer, Management, since 2006; Chief Compliance Officer, nine registered investment companies for which Management acts as investment manager and administrator (eight since 2005 and one since 2006); formerly, Senior Vice President, LBI, 2007 to 2008; formerly, Vice President, LBI, 2003 to 2006; formerly, Chief Compliance Officer, Lehman Brothers Asset Management Inc., 2003 to 2007; formerly, Chief Compliance Officer, Lehman Brothers Alternative Investment Management LLC, 2003 to 2007. | |
|
(1) The business address of each listed person is 605 Third Avenue, New York, New York 10158.
(2) Pursuant to the By-Laws of the Trust, each officer elected by the Trustees shall hold office until his or her successor shall have been elected and qualified or until his or her earlier death, inability to serve, or resignation. Officers serve at the pleasure of the Trustees and may be removed at any time with or without cause.
(3) Except as otherwise indicated, each individual has held the positions shown for at least the last five years.
32
Proxy Voting Policies and Procedures
A description of the policies and procedures that the Trust uses to determine how to vote proxies relating to portfolio securities is available, without charge, by calling 1-800-877-9700 (toll-free) and on the website of the Securities and Exchange Commission, at www.sec.gov. Information regarding how the Trust voted proxies relating to portfolio securities during the most recent 12-month period ended June 30 is also available, without charge, by calling 1-800-877-9700 (toll-free), on the website of the Securities and Exchange Commission at www.sec.gov, and on Management's website at www.nb.com.
Quarterly Portfolio Schedule
The Trust files a complete schedule of portfolio holdings for the Fund with the Securities and Exchange Commission for the first and third quarters of each fiscal year on Form N-Q. The Trust's Forms N-Q are available on the Securities and Exchange Commission's website at www.sec.gov and may be reviewed and copied at the Securities and Exchange Commission's Public Reference Room in Washington, DC. Information on the operation of the Public Reference Room may be obtained by calling 1-800-SEC-0330. The information on Form N-Q is available upon request, without charge, by calling 1-800-877-9700 (toll free).
Notice to Shareholders (Unaudited)
100.00% of the dividends distributed during the fiscal year ended December 31, 2010 qualifies for the dividends received deduction for corporate shareholders.
Board Consideration of the Management and Sub-Advisory Agreements
At a meeting held on October 14, 2010, the Board, including the Trustees who are not "interested persons" of Management (including its affiliates) or Neuberger Berman Advisers Management Trust ("Independent Fund Trustees"), approved the continuance of the Management and Sub-Advisory Agreements ("Agreements") for the Fund.
In evaluating the Agreements, the Board, including the Independent Fund Trustees, reviewed materials furnished by Management and Neuberger in response to questions submitted by counsel for the Independent Fund Trustees, and met with senior representatives of Management and Neuberger regarding their personnel and operations. The Independent Fund Trustees were advised by counsel that is experienced in 1940 Act matters and that is independent of Management and Neuberger. The Independent Fund Trustees received a memorandum from independent counsel discussing the legal standards for their consideration of the proposed continuance of the Agreements. They met with such counsel separately from representatives of Management to discuss the annual contract review. The annual contract review extends over two regular meetings of the Board to ensure that Management and Neuberger have time to respond to any questions the Independent Fund Trustees may have on their initial review of the report and that the Independent Fund Trustees have time to consider those responses. In addition, during this process, the Board held a separate meeting devoted primarily to reviewing and discussing Fund performance.
The Board considered the following factors, among others, in connection with its approval of the continuance of the Agreements: (1) the nature, extent, and quality of the services provided by Management and Neuberger; (2) the performance of the Fund compared to a relevant market index and a peer group of investment companies; (3) the costs of the services provided and profits or losses realized by Management and its affiliates from their relationship with the Fund; (4) the extent to which economies of scale might be realized as the Fund grows; and (5) whether fee levels reflect any such potential economies of scale for the benefit of investors in the Fund. In their deliberations, the Board members did not identify any particular information that was all-important or controlling, and each Trustee may have attributed different weights to the various factors.
The Board evaluated the terms of the Agreements, the overall fairness of the Agreements to the Fund and whether the Agreements were in the best interests of the Fund and its shareholders.
33
With respect to the nature, extent and quality of the services provided, the Board considered the performance of the Fund and the experience and staffing of the portfolio management and investment research personnel of Management and Neuberger who perform services for the Fund. The Board noted that Management also provides certain administrative services, including fund accounting and compliance oversight. The Board also considered Management's and Neuberger's policies and practices regarding brokerage and the quality of brokerage execution obtained by Management. The Board's Portfolio Transactions and Pricing Committee from time to time reviewed the quality of the execution services that Management and Neuberger had provided, and periodically reviews studies by an independent firm engaged to review and evaluate the quality of brokerage execution received by the Fund. The Board also reviewed whether Management and Neuberger used brokers to execute Fund transactions that provide research and other services to Management and Neuberger, and the types of benefits potentially derived from such services by Management, Neuberger, the Fund and other clients of Management and Neuberger. In addition, the Board noted the positive compliance history of Management and Neuberger, as each firm has been free of significant reported compliance problems.
The Board considered the performance of the Fund relative to its benchmark and a peer group of investment companies dedicated to insurance products pursuing broadly similar strategies. The Board also considered performance in relation to certain measures of the degree of investment risk undertaken by the portfolio managers. The Board discussed the Fund's performance with Management and discussed steps that Management had taken, or intended to take, to improve the Fund's performance. The Board also considered Management's resources and responsiveness with respect to the Fund.
With respect to the overall fairness of the Agreements, the Board considered the fee structure for the Fund under the Agreements as compared to a peer group of comparable funds dedicated to insurance products and any fall-out benefits likely to accrue to Management or Neuberger or their affiliates from their relationship with the Fund. The Board also considered the profitability of Management and its affiliates from their association with the Fund.
The Board reviewed a comparison of the Fund's management fee and overall expense ratio to a peer group of broadly comparable funds dedicated to insurance products. The Board considered the mean and median of the management fees and expense ratios of the peer group. With regard to the sub-advisory fee paid to Neuberger, the Board noted that this fee is "at cost." In addition, the Board considered the contractual limit on Fund expenses undertaken by Management. The Board also noted that Management incurred a loss on the Fund.
The Board considered whether there were other funds that were advised or sub-advised by Management or its affiliates or separate accounts managed by Management or its affiliates with similar investment objectives, policies and strategies to the Fund. The Board compared the fees charged to the Fund to the fees charged to an advised fund, a sub-advised fund and a separate account, each managed in a similar style to the Fund. The Board considered the appropriateness and reasonableness of any differences between the fees charged to the Fund and the other funds and account and determined that the differences in fees were consistent with the management and other services provided.
The Board also evaluated any apparent or anticipated economies of scale in relation to the services Management provides to the Fund. The Board considered whether the Fund's fee structure provides for a reduction of payments resulting from the use of breakpoints and whether those breakpoints are set at appropriate asset levels.
The Board also considered changes in management, staffing, resources and operations accompanying the separation of the Neuberger Berman entities from the LBHI bankruptcy estate.
In concluding that the benefits accruing to Management and its affiliates by virtue of their relationship to the Fund were reasonable in comparison with the costs of providing the investment advisory services and the benefits accruing to the Fund, the Board reviewed specific data as to Management's profit or loss on the Fund for a recent period and the trend in profit or loss over recent years. The Board also carefully examined Management's cost allocation methodology. The Board recognized that Management should be entitled to earn a reasonable level of profits for services it provides to the Fund and, based on its review, concluded that Management's level of profitability was not excessive.
34
Conclusions
In approving the Agreements, the Board concluded that the terms of each Agreement are fair and reasonable and that approval of the Agreements is in the best interests of the Fund and its shareholders. In reaching this determination, the Board considered that Management and Neuberger could be expected to provide a high level of service to the Fund; that it retained confidence in Management's and Neuberger's capabilities to manage the Fund; that the Fund's fee structure appeared to the Board to be reasonable given the nature and quality of services provided; and that the benefits accruing to Management and its affiliates by virtue of their relationship to the Fund were reasonable in comparison with the benefits accruing to the Fund.
35
ITEM 2. CODE OF ETHICS
The Registrant's Board of Trustees ("Board") adopted a code of ethics that applies to the Registrant's principal executive officer, principal financial officer, principal accounting officer or controller, or persons performing similar functions ("Code of Ethics"). For the period covered by this Form N-CSR, there were no amendments to the Code of Ethics and there were no waivers from the Code of Ethics granted to the Registrant's principal executive officer, principal financial officer, principal accounting officer or controller, or persons performing similar functions.
A copy of the Code of Ethics was included as an exhibit to Registrant's Form N-CSR filed on February 28, 2007. The Code of Ethics is also available, without charge, by calling 1-800-877-9700 (toll-free).
ITEM 3. AUDIT COMMITTEE FINANCIAL EXPERT
The Board has determined that the Registrant has two audit committee financial experts serving on its audit committee. The Registrant's audit
committee financial experts are Martha C. Goss and George W. Morriss. Ms. Goss and Mr. Morriss are independent trustees as defined by Form N-CSR.
ITEM 4. PRINCIPAL ACCOUNTANT FEES AND SERVICES
The financial information provided below is that of the Registrant. This Form N-CSR relates only to the Balanced, Small-Cap Growth, Growth, Guardian, International, Short Duration Bond, Mid-Cap Growth, Partners, Regency and Socially Responsive Portfolios (collectively, the "Funds"). Ernst & Young, LLP ("E&Y") serves as the principal accountant for the Funds.
| (a)-(d) | Aggregate fees billed to the Registrant for the last two fiscal years for professional services rendered by E&Y for the Funds are listed below. |
| | |
| | 2010 | 2009 |
| Audit Fees | $339,000 | $339,000 |
| Audit-Related Fees | 0 | 0 |
| Tax Fees | 74,000 | 74,000 |
| All Other Fees | 0 | 0 |
Audit Fees include amounts related to the audit of the Registrant's annual financial statements and services normally provided by the principal accountant in connection with statutory and regulatory filings. Audit-Related Fees include amounts for attest services not required by statute or regulation. Tax Fees include amounts related to tax compliance, tax planning, and tax advice. All Other Fees include amounts for products and services not reported in Audit Fees, Audit-Related Fees and Tax Fees.
| (e)(1) | The Audit Committee's pre-approval policies and procedures for the Registrant to engage an accountant to render audit and non-audit services delegate to each member of the Audit Committee the power to pre-approve services between meetings of the Audit Committee. |
| | |
| (2) | No services included in (b) - (d) above were approved pursuant to paragraph (c)(7)(i)(C) of Rule 2-01 of Regulation S-X. |
| | |
| (f) | Not applicable. |
| | |
| (g) | The aggregate fees billed for the most recent fiscal year and the preceding fiscal year by E&Y for non-audit services rendered to the Registrant, its investment adviser, and any affiliates of its investment adviser that provide ongoing services to the Registrant were $74,000 and $174,000, respectively. |
| | |
| (h) | All non-audit services rendered in (g) above were pre-approved by the Registrant's audit committee pursuant to paragraph (c)(7)(ii) of Rule 2-01 of Regulation S-X. Accordingly, these services were considered by the Registrant's Audit Committee and found to be compatible with maintaining the principal accountant's independence. |
| | |
ITEM 5. AUDIT COMMITTEE OF LISTED REGISTRANTS
Not applicable to the Registrant.
ITEM 6. SCHEDULE OF INVESTMENTS.
The complete schedule of investments for each series is disclosed in the Registrant's annual reports to shareholders, which are included as Item 1 of this Form N-CSR.
| ITEM 7. | DISCLOSURE OF PROXY VOTING POLICIES AND PROCEDURES FOR CLOSED-END MANAGEMENT INVESTMENT COMPANIES. |
| | |
Not applicable to the Registrant.
| ITEM 8. | PORTFOLIO MANAGERS OF CLOSED-END MANAGEMENT INVESTMENT COMPANIES. |
| | |
Not applicable to the Registrant.
| ITEM 9. | PURCHASES OF EQUITY SECURITIES BY CLOSED-END MANAGEMENT INVESTMENT COMPANY AND AFFILIATED PURCHASERS. |
| | |
Not applicable to Registrant.
ITEM 10. SUBMISSION OF MATTERS TO A VOTE OF SECURITY HOLDERS.
There were no material changes to the procedures by which shareholders may recommend nominees to the Board.
ITEM 11. CONTROLS AND PROCEDURES
| (a) | Based on an evaluation of the disclosure controls and procedures (as defined in Rule 30a-2(c) under the Act) as of a date within 90 days of the filing date of this report, the Chief Executive Officer and Treasurer of the Registrant have concluded that such disclosure controls and procedures are effectively designed to ensure that information required to be disclosed by the Registrant is accumulated and communicated to the Registrant's management to allow timely decisions regarding required disclosure. |
| | |
| (b) | There were no significant changes in the Registrant's internal controls over financial reporting (as defined in Rule 30a-3(d) under the Act) that occurred during the Registrant's second fiscal quarter of the period covered by this report that have materially affected, or are reasonably likely to materially affect, the Registrant's internal control over financial reporting. |
| | |
ITEM 12. EXHIBITS
| (a) | (1) A copy of the Code of Ethics was included as an exhibit to Registrant's Form N-CSR filed on February 28, 2007 (Investment Company Act file number 811-4255) and is incorporated herein by reference. |
| | |
| | (2) The certifications required by Rule 30a-2(a) under the Act, are attached hereto. |
| | |
| | (3) Not applicable to the Registrant. |
| | |
| (b) | The certification required by Rule 30a-2(b) under the Act, Rule 13a-14(b) or Rule 15d-14(b) under the Securities Exchange Act of 1934 ("Exchange Act"), and Section 1350 of Chapter 63 of Title 18 of the United States Code are attached hereto. |
| | |
SIGNATURES
Pursuant to the requirements of the Securities Exchange Act of 1934 and the Investment Company Act of 1940, the Registrant has duly caused this report to be signed on its behalf by the undersigned, thereunto duly authorized.
| NEUBERGER BERMAN ADVISERS MANAGEMENT TRUST |
| |
| By: | /s/ Robert Conti |
| | Robert Conti |
| | Chief Executive Officer |
| | |
| Date: | March 2, 2011 |
| |
Pursuant to the requirements of the Securities Exchange Act of 1934 and the Investment Company Act of 1940, this report has been signed below by the following persons on behalf of the Registrant and in the capacities and on the dates indicated.
| By: | /s/ Robert Conti |
| | Robert Conti |
| | Chief Executive Officer |
| | |
| Date: | March 2, 2011 |
| |
| By: | /s/ John M. McGovern |
| | John M. McGovern |
| | Treasurer and Principal Financial |
| | and Accounting Officer |
| | |
| Date: | March 2, 2011 |
| |

