As filed with the Securities and Exchange Commission on February 19, 2013
UNITED STATES
SECURITIES AND EXCHANGE COMMISSION
Washington, D.C. 20549
FORM N-CSR
CERTIFIED SHAREHOLDER REPORT OF
REGISTERED MANAGEMENT INVESTMENT COMPANIES
Investment Company Act File Number: 811-4255
NEUBERGER BERMAN ADVISERS MANAGEMENT TRUST
(Exact Name of the Registrant as Specified in Charter)
605 Third Avenue, 2nd Floor
New York, New York 10158-0180
(Address of Principal Executive Offices - Zip Code)
Robert Conti, Chief Executive Officer
Neuberger Berman Advisers Management Trust
605 Third Avenue, 2nd Floor
New York, New York 10158-0180
Jeffrey S. Puretz, Esq.
Dechert LLP
1900 K Street, N.W.
Washington, D.C. 20006
(Names and Addresses of agents for service)
Registrant’s Telephone Number, including area code: (212) 476-8800
Date of fiscal year end: December 31
Date of reporting period: December 31, 2012
Form N-CSR is to be used by management investment companies to file reports with the Commission not later than 10 days after the transmission to stockholders of any report that is required to be transmitted to stockholders under Rule 30e-1 under the Investment Company Act of 1940 (the “Act”) (17 CFR 270.30e-1). The Commission may use the information provided on Form N-CSR in its regulatory, disclosure review, inspection, and policymaking roles.
A registrant is required to disclose the information specified by Form N-CSR, and the Commission will make this information public. A registrant is not required to respond to the collection of information contained in Form N-CSR unless the Form displays a currently valid Office of Management and Budget (“OMB”) control number. Please direct comments concerning the accuracy of the information collection burden estimate and any suggestions for reducing the burden to Secretary, Securities and Exchange Commission, 100 F Street, NE, Washington, DC 20549. The OMB has reviewed this collection of information under the clearance requirements of 44 U.S.C. Section 3507.
ITEM 1. REPORTS TO SHAREHOLDERS
The following are copies of the annual reports transmitted to shareholders pursuant to Rule 30e-1 under the Act.
Neuberger Berman
Advisers Management Trust
Balanced Portfolio
I Class Shares
Annual Report
December 31, 2012
B1014 02/13
Balanced Portfolio Commentary (Unaudited)
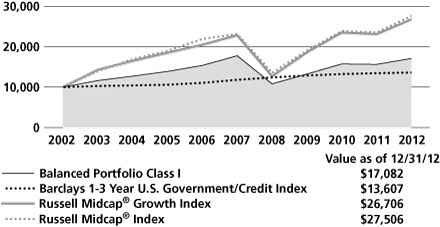
The Neuberger Berman Advisors Management Trust (AMT) Balanced Portfolio posted a 9.34% total return for the fiscal year ended December 31, 2012. The Portfolio's equity component underperformed the Russell Midcap® Growth Index while its fixed income component outperformed the Barclays 1-3 Year U.S. Government/Credit Index for the same period.
Equities
The down-to-the-wire fiscal cliff negotiations and resulting deal were a fitting end to a year plagued by political acrimony and economic uncertainty. While the hard fought, but ultimately underwhelming, compromise does address several pertinent tax and entitlement issues, we believe this "not so grand bargain" falls far short of addressing the broader issues around our country's debt ceiling, budget imbalance and credit rating. From our perspective, the risk was never really about going over the cliff, but rather the failure to reach a comprehensive and forward-thinking solution in a reasonable period of time. Unfortunately, that risk still remains.
While confidence may have ebbed a bit during the year, consumer resiliency and sustainable gains in housing remained bright spots. With fiscal austerity looming, in our assessment the clear prescription for a healthier economy remains a rebound in corporate spending. However, ongoing concerns around the health of Europe's economies, China's growth engine and our government's fiscal game of chicken continue to foster a sub-optimal level of capital reinvestment that could risk competitiveness.
Setting aside the dysfunctional nature of Congress and the seemingly perpetual "walls of worry," it's important to remember that 2012 actually hosted a positive environment for equities. Highlighted by attractive valuations, solid earnings and efficient bottom-lines, the market rewarded the patience of domestic equity investors with attractive returns overall.
For the year as a whole, stock selection was the main driver of the Portfolio's equity segment's underperformance versus the Russell benchmark. With a "shoot first, ask questions later" mentality, we feel the market adopted an over reactionary stance to any fundamental softening.
The leading contributor to equity performance was SBA Communications, an owner and operator of wireless communications towers. SBA benefited from strong top-line growth and better than expected guidance. A few health care names were also top contributors, including Catalyst Health Solutions, a provider of pharmacy benefit management services, which stood out as it agreed to be acquired by another portfolio holding, SXC Health Solutions (which was later renamed Catamaran Corp. after the merger was completed), and Alexion Pharmaceuticals, a biotech company focused on rare, life-threatening disease states that was rewarded for its successful international rollout and positive early stage testing for new drug indications.
Within Information Technology, a strong contribution came from Trimble Navigation, a provider of advanced positioning and resource management solutions that delivered efficiency gains and encouraging guidance during the fourth quarter.
However, Information Technology was also the source of three leading detractors from performance. Finisar Corporation, a provider of data network optical subsystems and components, lagged as an anticipated rebound in telecommunication spending failed to materialize. QLIK Technologies and Informatica Corporation, both business intelligence/information data companies, were negatively impacted by poor execution and concerns over Europe's economic crisis.
Within Consumer Discretionary, PVH Corp., an apparel company with various owned and licensed brands, delivered solid international results and a well-received acquisition of another portfolio holding, Warnaco Group. Unfortunately, this positive couldn't offset underperformance from other Consumer Discretionary names such as Vera Bradley, a designer and retailer of handbags and accessories that was plagued by poor execution, Chipotle Mexican Grill, an operator of over 1,200 restaurants, which tempered future guidance and proposed an unexpected change in
1
organizational structure, and Gentex Corporation, a supplier of camera-based features and specialty rear-view mirrors that was negatively impacted by delays in the implementation of a mandate requiring cars to have back-up cameras.
With the exception of Informatica, we sold all the aforementioned detractors during the year.
Based on our expectations for 2013, our current view is that we are likely to remain overweighted in Industrials, Information Technology and Telecommunication Services and underweighted in Consumer Discretionary, Consumer Staples and Materials.
As we look ahead into the New Year, we just can't quite shake that feeling of déjà vu. We are once again faced with dire deadlines complicated by substantial ideological differences, an acrimonious political environment and an appalling disregard for effective political compromise. While the confidence and market gains from the fiscal cliff deal may prove fleeting, we feel it is important to remember a lesson of 2012—don't underestimate the resiliency of both our economy and the financial markets. We believe valuations are reasonable at this time and that higher-quality companies offering competitive attributes, along with compelling top-line growth that efficiently translates through to the bottom line, may well be rewarded by a market seeking positive differentiation. To that end, and in spite of the uncertainty that lies ahead, we remain cautiously optimistic that 2013 can be another positive year for mid-cap equities.
Fixed Income
Shifting investor sentiment due to mixed economic data, the European sovereign debt crisis and uncertainties regarding future central bank policy resulted in periods of market volatility during the year. However, investors who took on greater risk were generally rewarded. While there were several setbacks in the non-Treasury market, these proved to be only temporary in nature, as demand was typically strong from investors looking to generate incremental yield. Also supporting non-Treasuries were actions taken by the Federal Reserve (Fed) to stimulate the economy. In September 2012, the Fed introduced a third round of quantitative easing (QE3). At its final meeting of the year in December, the Fed announced that it would continue purchasing $40 billion per month of agency mortgage-backed securities (MBS) as well as $45 billion per month of longer-term Treasuries. The Fed also announced that it would keep the federal funds rate on hold as long as the unemployment rate remained above 6.5% and that inflation remained "no more than a half percentage point above the Committee's 2.0% longer-run goal."
The Portfolio's fixed income segment's overweight to non-Treasuries versus the benchmark was the largest driver of its outperformance during the reporting period. The largest contributor to results was the Portfolio's exposure to non-agency MBS, followed by allocations to commercial mortgage-backed securities (CMBS) and investment grade corporate bonds. Within the investment grade corporate bond market, our holdings in the financials subsector was the most beneficial. Elsewhere, the Portfolio's defensive yield curve positioning was rewarded. Detracting slightly from results was the Portfolio's zero allocation to agency debt securities, as they outperformed equal-duration Treasuries.
There were several adjustments made to the Portfolio from a sector perspective during the reporting period. We reduced our exposure to non-agency MBS to capture profits and pare the Portfolio's overall risk exposure. Our allocation to agency MBS was also reduced. In contrast, we increased the allocation to corporate bonds, primarily by taking advantage of opportunities in the new issue market.
The ultimate resolution of the fiscal cliff-related government spending cuts and the raising of the debt ceiling remain wild cards for the U.S. economy in 2013. It's now clear that the grand bargain scenario for the fiscal cliff was wishful thinking and angst regarding the debt ceiling appears likely. As such, it may be some time before we have total clarity on these issues. Regardless of how they play out, certain taxes are increasing and government spending cuts will occur. Both of these factors will weigh on the economy in 2013. Nonetheless, while it is difficult to project with complete confidence, it is our belief that the U.S. economy will continue to modestly expand in 2013.
As we saw during much of 2012, a relatively weak economic backdrop doesn't necessarily mean the fixed income markets will perform poorly in 2013. In fact, at present we believe the spread sectors will generally post positive results in 2013.
2
Given our view that we will have a prolonged period of low interest rates, we believe that spread sector demand will remain solid, albeit punctuated by periods of risk aversion. Given the magnitude of spread tightening since the credit crisis, we currently believe that spread sector returns in 2013 will probably not be as robust as in recent years. However, we anticipate maintaining our long-held strategy of overweighting the spread sectors, as we feel it is a prudent approach for long-term investors.
Sincerely,
KENNETH J. TUREK, THOMAS SONTAG
MICHAEL FOSTER AND RICHARD GRAU
PORTFOLIO CO-MANAGERS
Information about the principal risks of investing in the Portfolio is set forth in the prospectus and statement of additional information.
The portfolio composition, industries and holdings of the Portfolio are subject to change.
Opinions expressed are as of the date herein and are subject to change without notice. This material is not intended to be a formal research report and should not be construed as an offer to sell or the solicitation of an offer to buy any security.
3
Balanced Portfolio (Unaudited)
PORTFOLIO BY TYPE OF SECURITY
| (as a % of Total Net Assets) | |
| Asset-Backed Securities | | | 6.7 | % | |
| Common Stock | | | 59.0 | | |
| Corporate Debt | | | 14.0 | | |
| Mortgage-Backed Securities | | | 6.8 | | |
| U.S. Treasury Securities | | | 13.0 | | |
| Short-Term Investments | | | 0.4 | | |
Cash, receivables and other assets, less liabilities | | | 0.1 | | |
| Total | | | 100.0 | % | |
PERFORMANCE HIGHLIGHTS
| | | Inception | | Average Annual Total Return Ended 12/31/2012 | |
| | | Date | | 1 Year | | 5 Years | | 10 Years | | Life of Fund | |
| Balanced Portfolio Class I | | 02/28/1989 | | | 9.34 | % | | | –0.77 | % | | | 5.50 | % | | | 6.49 | % | |
Barclays 1-3 Year U.S. Government/Credit Index1,2 | | | | | 1.26 | % | | | 2.88 | % | | | 3.13 | % | | | 5.46 | % | |
Russell Midcap® Growth Index1,2 | | | | | | | 15.81 | % | | | 3.23 | % | | | 10.32 | % | | | 9.99 | % | |
Russell Midcap® Index1,2 | | | | | 17.28 | % | | | 3.57 | % | | | 10.65 | % | | | 11.10 | % | |
The performance data quoted represent past performance and do not indicate future results. Current performance may be lower or higher than the performance data quoted. For more current performance data, please visit www.nb.com.
The results shown in the table reflect the reinvestment of income dividends and other distributions, if any. The results do not reflect the effect of taxes a shareholder would pay on Portfolio distributions or on the redemption of Portfolio shares. The results do not reflect fees and expenses of the variable annuity and variable life insurance policies or the qualified pension and retirement plans whose proceeds are invested in the Portfolio.
The investment return and principal value of an investment will fluctuate and shares, when redeemed, may be worth more or less than their original cost.
Returns would have been lower if Neuberger Berman Management LLC ("Management") had not reimbursed certain expenses and/or waived a portion of the investment management fees during certain of the periods shown. Repayment by a class (of expenses previously reimbursed and/or fees previously waived by Management) will decrease the class's returns. Please see Note B in the Notes to Financial Statements for specific information regarding expense reimbursement and/or fee waiver arrangements.
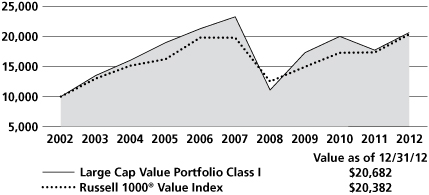
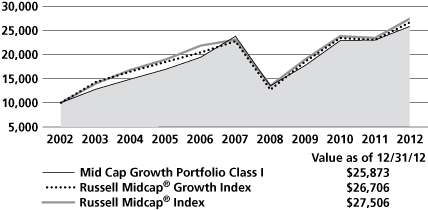
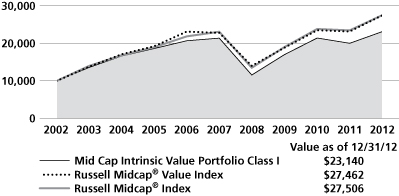
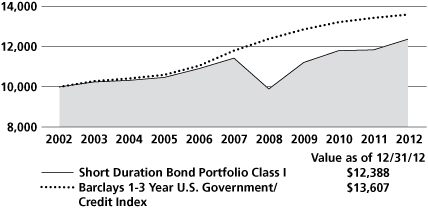
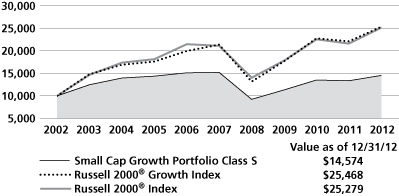
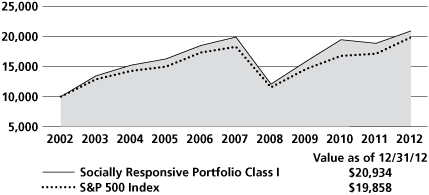
COMPARISON OF A $10,000 INVESTMENT
This graph shows the change in value of a hypothetical $10,000 investment in the Portfolio over the past 10 fiscal years, or since the Portfolio's inception if it has not operated for 10 years. The result is compared with benchmarks, which include a broad-based market index and may include a more narrowly based index. Market indices have not been reduced to reflect any of the fees and costs of investing. The results shown in the graph reflect the reinvestment of income dividends and other distributions, if any. The results do not reflect the effect of taxes a shareholder would pay on Portfolio distributions or on the redemption of Portfolio shares. Results represent past performance and do not indicate future results.
Please see Endnotes for additional information.
4
Endnotes (Unaudited)
1 The date used to calculate Life of Fund performance for the index is the inception date of the oldest share class.
2 The Russell Midcap® Growth Index measures the performance of those Russell Midcap® Index companies with higher price-to-book ratios and higher forecasted growth values. The Russell Midcap Index measures the performance of the 800 smallest companies in the Russell 1000® Index, which represents approximately 31% of the total market capitalization of the Russell 1000 Index (which, in turn, consists of the 1,000 largest U.S. companies, based on the market capitalization). The Barclays 1-3 Year U.S. Government/Credit Index is an unmanaged index that includes all bonds in the U.S. Government/Credit Index with at least one to three years to maturity. The U.S. Government/Credit Index includes all securities in the Government and Credit Indices. The Government Index includes Treasuries (i.e., public obligations of the U.S. Treasury that have remaining maturities of more than one year) and agencies (i.e., publicly issued debt of U.S. Government agencies, quasi-federal corporations, and corporate or foreign debt guaranteed by the U.S. Government). The Credit Index includes publicly issued U.S. corporate and foreign debentures and secured notes that meet specified maturity, liquidity, and quality requirements. All bonds in the Credit Index must meet the following additional criteria: must have at least one year to final maturity regardless of call features; must have at least $250 million par amount outstanding; must be rated investment-grade (Baa3/BBB- or higher) by at least two of the following ratings agencies: Standard & Poor's, Moody's Investors Services, Inc., and Fitch, Inc.; must be fixed rate; must be dollar-denominated and non-convertible; and must be publicly issued. Please note that indices do not take into account any fees, expenses or tax consequences of investing in the individual securities that they track, and individuals cannot invest directly in any index. Data about the performance of an index is prepared or obtained by Neuberger Berman Management LLC ("Management") and reflects the reinvestment of income dividends and other distributions, if any. The Portfolio may invest in securities not included in a described index and/or may not invest in all securities included in a described index.
Any ratios or other measurements using a factor of forecasted earnings of a company discussed herein are based on consensus estimates, not Management's own projections, and they may or may not be realized. In addition, any revision to a forecast could affect the market price of a security. By quoting them herein, Management does not offer an opinion as to the accuracy of, and does not guarantee, these forecasted numbers.
The investments for the Portfolio are managed by the same portfolio manager(s) who manage(s) one or more other registered funds that have names, investment objectives and investment styles that are similar to those of the Portfolio. You should be aware that the Portfolio is likely to differ from the other mutual fund(s) in size, cash flow pattern and tax matters. Accordingly, the holdings and performance of the Portfolio can be expected to vary from those of the other mutual fund(s).
Shares of the separate AMT Portfolios are not available to the general public. Shares of this Portfolio may be purchased only by life insurance companies to be used with their separate accounts that fund variable annuity and variable life insurance policies and by qualified pension and retirement plans.
Statistics and projections in this report are derived from sources deemed to be reliable but cannot be regarded as a representation of future results of the AMT Portfolios. This report is prepared for the general information of shareholders and is not an offer of shares of the AMT Portfolios. Shares of the AMT Portfolios are sold only through the currently effective prospectuses, which must precede or accompany this report.
The "Neuberger Berman" name and logo are registered service marks of Neuberger Berman Group LLC. "Neuberger Berman Management LLC" and the individual Fund name in this piece are either service marks or registered service marks of Neuberger Berman Management LLC.
© 2013 Neuberger Berman Management LLC distributor. All rights reserved.
5
Information About Your Fund's Expenses (Unaudited)
As a Fund shareholder, you incur two types of costs: (1) transaction costs such as fees and expenses that are, or may be, imposed under your variable contract or qualified pension plan; and (2) ongoing costs, including management fees; distribution and/or service (12b-1) fees (if applicable); and other Fund expenses. This example is intended to help you understand your ongoing costs (in dollars) of investing in the Fund and compare these costs with the ongoing costs of investing in other mutual funds.
This table is designed to provide information regarding costs related to your investments. The following examples are based on an investment of $1,000 made at the beginning of the six month period ended December 31, 2012 and held for the entire period. The table illustrates the Fund's costs in two ways:
| Actual Expenses and Performance: | | The first section of the table provides information about actual account values and actual expenses in dollars, based on the Fund's actual performance during the period. You may use the information in this line, together with the amount you invested, to estimate the expenses you paid over the period. Simply divide your account value by $1,000 (for example, an $8,600 account value divided by $1,000 = 8.6), then multiply the result by the number in the first section of the table under the heading entitled "Expenses Paid During the Period" to estimate the expenses you paid over the period. | |
Hypothetical Example for Comparison Purposes: | | The second section of the table provides information about hypothetical account values and hypothetical expenses based on the Fund's actual expense ratio and an assumed rate of return at 5% per year before expenses. This return is not the Fund's actual return. The hypothetical account values and expenses may not be used to estimate the actual ending account balance or expenses you paid for the period. You may use this information to compare the ongoing costs of investing in this Fund versus other funds. To do so, compare the expenses shown in this 5% hypothetical example with the 5% hypothetical examples that appear in the shareholder reports of other funds. | |
Please note that the expenses in the table are meant to highlight your ongoing costs only and do not include any transaction costs, such as fees and expenses that are, or may be imposed under your variable contract or qualified pension plan. Therefore, the information under the heading "Hypothetical (5% annual return before expenses)" is useful in comparing ongoing costs only, and will not help you determine the relative total costs of owning different funds. In addition, if these transaction costs were included, your costs would have been higher.
Expense Information as of 12/31/12
NEUBERGER BERMAN ADVISERS MANAGEMENT TRUST BALANCED PORTFOLIO
| Actual | | Beginning Account Value 7/1/12 | | Ending Account Value 12/31/12 | | Expenses Paid During the Period* 7/1/12 – 12/31/12 | |
| Class I | | $ | 1,000.00 | | | $ | 1,022.30 | | | $ | 9.40 | | |
| Hypothetical (5% annual return before expenses)** | |
| Class I | | $ | 1,000.00 | | | $ | 1,015.84 | | | $ | 9.37 | | |
* Expenses are equal to the annualized expense ratio of 1.85%, multiplied by the average account value over the period, multiplied by 184/366 (to reflect the one-half year period shown).
** Hypothetical 5% annual return before expenses is calculated by multiplying the number of days in the most recent half year divided by 366.
6
Schedule of Investments Balanced Portfolio
| NUMBER OF SHARES | | | | VALUE† | |
| Common Stocks (59.0%) | | | |
| Aerospace & Defense (2.0%) | | | |
| | 2,000 | | | BE Aerospace, Inc. | | $ | 98,800 | * | |
| | 1,702 | | | HEICO Corp. | | | 76,182 | | |
| | 600 | | | Precision Castparts Corp. | | | 113,652 | | |
| | | | 288,634 | | |
| Beverages (0.4%) | | | |
| | 1,000 | | | Beam, Inc. | | | 61,090 | | |
| Biotechnology (2.6%) | | | |
| | 1,500 | | | Alexion Pharmaceuticals, Inc. | | | 140,715 | * | |
| | 1,500 | | | ARIAD Pharmaceuticals, Inc. | | | 28,770 | * | |
| | 500 | | | BioMarin Pharmaceutical, Inc. | | | 24,625 | * | |
| | 1,250 | | | Cepheid, Inc. | | | 42,262 | * | |
| | 1,500 | | | Cubist Pharmaceuticals, Inc. | | | 63,090 | * | |
| | 850 | | | Medivation, Inc. | | | 43,486 | * | |
| | 500 | | | Onyx Pharmaceuticals, Inc. | | | 37,765 | * | |
| | | | 380,713 | | |
| Building Products (0.6%) | | | |
| | 2,750 | | | Fortune Brands Home & Security, Inc. | | | 80,355 | * | |
| Capital Markets (1.4%) | | | |
| | 1,000 | | | Affiliated Managers Group, Inc. | | | 130,150 | * | |
| | 2,000 | | | Raymond James Financial, Inc. | | | 77,060 | | |
| | | | 207,210 | | |
| Chemicals (1.6%) | | | |
| | 1,500 | | | Airgas, Inc. | | | 136,935 | | |
| | 1,200 | | | Ashland, Inc. | | | 96,492 | | |
| | | | 233,427 | | |
| Commercial Services & Supplies (1.5%) | | | |
| | 1,000 | | | Clean Harbors, Inc. | | | 55,010 | * | |
| | 1,800 | | | Stericycle, Inc. | | | 167,886 | * | |
| | | | 222,896 | | |
| Communications Equipment (0.7%) | | | |
| | 1,500 | | | Aruba Networks, Inc. | | | 31,125 | * | |
| | 750 | | | F5 Networks, Inc. | | | 72,863 | * | |
| | | | 103,988 | | |
| Containers & Packaging (0.3%) | | | |
| | 1,000 | | | Packaging Corp. of America | | | 38,470 | | |
| Distributors (0.2%) | | | |
| | 1,350 | | | LKQ Corp. | | | 28,485 | * | |
| NUMBER OF SHARES | | | | VALUE† | |
| Diversified Financial Services (0.7%) | | | |
| | 800 | | | IntercontinentalExchange, Inc. | | $ | 99,048 | * | |
Diversified Telecommunication Services (0.3%) | | | |
| | 2,000 | | | tw telecom, Inc. | | | 50,940 | * | |
| Electrical Equipment (3.0%) | | | |
| | 4,500 | | | AMETEK, Inc. | | | 169,065 | | |
| | 1,250 | | | Generac Holdings, Inc. | | | 42,887 | | |
| | 1,450 | | | Roper Industries, Inc. | | | 161,646 | | |
| | 1,750 | | | Sensata Technologies Holding NV | | | 56,840 | * | |
| | | | 430,438 | | |
Electronic Equipment, Instruments & Components (1.2%) | | | |
| | 3,000 | | | Trimble Navigation Ltd. | | | 179,340 | * | |
| Energy Equipment & Services (1.9%) | | | |
| | 1,200 | | | Cameron International Corp. | | | 67,752 | * | |
| | 450 | | | Core Laboratories NV | | | 49,189 | | |
| | 1,000 | | | Oceaneering International, Inc. | | | 53,790 | | |
| | 1,500 | | | Oil States International, Inc. | | | 107,310 | * | |
| | | | 278,041 | | |
| Food & Staples Retailing (1.3%) | | | |
| | 1,100 | | | PriceSmart, Inc. | | | 84,755 | | |
| | 1,150 | | | Whole Foods Market, Inc. | | | 105,030 | | |
| | | | 189,785 | | |
| Health Care Equipment & Supplies (1.7%) | | | |
| | 650 | | | Cooper Cos., Inc. | | | 60,112 | | |
| | 500 | | | Edwards Lifesciences Corp. | | | 45,085 | * | |
| | 200 | | | Intuitive Surgical, Inc. | | | 98,074 | * | |
| | 2,000 | | | Volcano Corp. | | | 47,220 | * | |
| | | | 250,491 | | |
| Health Care Providers & Services (1.6%) | | | |
| | 3,000 | | | Catamaran Corp. | | | 141,330 | * | |
| | 800 | | | DaVita HealthCare Partners, Inc. | | | 88,424 | * | |
| | | | 229,754 | | |
| Health Care Technology (1.0%) | | | |
| | 1,850 | | | Cerner Corp. | | | 143,634 | * | |
| Hotels, Restaurants & Leisure (0.9%) | | | |
| | 750 | | | Buffalo Wild Wings, Inc. | | | 54,615 | * | |
| | 1,250 | | | Starwood Hotels & Resorts Worldwide, Inc. | | | 71,700 | | |
| | | | 126,315 | | |
See Notes to Schedule of Investments
7
| NUMBER OF SHARES | | | | VALUE† | |
| Household Products (0.8%) | | | |
| | 2,100 | | | Church & Dwight Co., Inc. | | $ | 112,497 | | |
| Internet & Catalog Retail (0.4%) | | | |
| | 950 | | | Expedia, Inc. | | | 58,378 | | |
| Internet Software & Services (1.7%) | | | |
| | 2,100 | | | Liquidity Services, Inc. | | | 85,806 | * | |
| | 2,250 | | | Rackspace Hosting, Inc. | | | 167,107 | * | |
| | | | 252,913 | | |
| IT Services (1.8%) | | | |
| | 750 | | | Alliance Data Systems Corp. | | | 108,570 | * | |
| | 1,450 | | | Cognizant Technology Solutions Corp. Class A | | | 107,372 | * | |
| | 750 | | | Teradata Corp. | | | 46,418 | * | |
| | | | 262,360 | | |
| Life Sciences Tools & Services (0.8%) | | | |
| | 2,000 | | | Illumina, Inc. | | | 111,180 | * | |
| Machinery (1.6%) | | | |
| | 400 | | | Cummins, Inc. | | | 43,340 | | |
| | 2,750 | | | Donaldson Co., Inc. | | | 90,310 | | |
| | 1,550 | | | Pall Corp. | | | 93,403 | | |
| | | | 227,053 | | |
| Media (1.2%) | | | |
| | 2,000 | | | AMC Networks, Inc. Class A | | | 99,000 | * | |
| | 1,300 | | | Discovery Communications, Inc. Class A | | | 82,524 | * | |
| | | | 181,524 | | |
| Metals & Mining (0.2%) | | | |
| | 500 | | | Carpenter Technology Corp. | | | 25,815 | | |
| Multiline Retail (0.6%) | | | |
| | 2,150 | | | Dollar Tree, Inc. | | | 87,204 | * | |
| Oil, Gas & Consumable Fuels (1.8%) | | | |
| | 2,350 | | | Cabot Oil & Gas Corp. | | | 116,889 | | |
| | 550 | | | Concho Resources, Inc. | | | 44,308 | * | |
| | 4,150 | | | Denbury Resources, Inc. | | | 67,230 | * | |
| | 1,000 | | | Oasis Petroleum, Inc. | | | 31,800 | * | |
| | | | 260,227 | | |
| Pharmaceuticals (0.6%) | | | |
| | 850 | | | Perrigo Co. | | | 88,426 | | |
| NUMBER OF SHARES | | | | VALUE† | |
| Professional Services (1.6%) | | | |
| | 1,250 | | | Advisory Board Co. | | $ | 58,488 | * | |
| | 400 | | | Towers Watson & Co. Class A | | | 22,484 | | |
| | 3,000 | | | Verisk Analytics, Inc. Class A | | | 153,000 | * | |
| | | | 233,972 | | |
Real Estate Management & Development (0.7%) | | | |
| | 1,300 | | | Jones Lang LaSalle, Inc. | | | 109,122 | | |
| Road & Rail (1.8%) | | | |
| | 650 | | | Canadian Pacific Railway Ltd. | | | 66,053 | | |
| | 2,000 | | | J.B. Hunt Transport Services, Inc. | | | 119,420 | | |
| | 950 | | | Kansas City Southern | | | 79,306 | | |
| | | | 264,779 | | |
Semiconductors & Semiconductor Equipment (1.7%) | | | |
| | 1,500 | | | Altera Corp. | | | 51,660 | | |
| | 3,500 | | | Avago Technologies Ltd. | | | 110,810 | | |
| | 2,700 | | | Cavium, Inc. | | | 84,267 | * | |
| | | | 246,737 | | |
| Software (5.4%) | | | |
| | 1,750 | | | ANSYS, Inc. | | | 117,845 | * | |
| | 1,950 | | | Aspen Technology, Inc. | | | 53,898 | * | |
| | 1,500 | | | Citrix Systems, Inc. | | | 98,625 | * | |
| | 650 | | | Concur Technologies, Inc. | | | 43,888 | * | |
| | 1,900 | | | Informatica Corp. | | | 57,608 | * | |
| | 1,850 | | | MICROS Systems, Inc. | | | 78,514 | * | |
| | 1,550 | | | Red Hat, Inc. | | | 82,088 | * | |
| | 700 | | | Salesforce.com, Inc. | | | 117,670 | * | |
| | 1,250 | | | Splunk, Inc. | | | 36,275 | * | |
| | 2,100 | | | TIBCO Software, Inc. | | | 46,221 | * | |
| | 500 | | | Ultimate Software Group, Inc. | | | 47,205 | * | |
| | | | 779,837 | | |
| Specialty Retail (5.3%) | | | |
| | 1,400 | | | Cabela's, Inc. | | | 58,450 | * | |
| | 2,400 | | | Dick's Sporting Goods, Inc. | | | 109,176 | | |
| | 1,300 | | | DSW, Inc. Class A | | | 85,397 | | |
| | 1,050 | | | O'Reilly Automotive, Inc. | | | 93,891 | * | |
| | 950 | | | PetSmart, Inc. | | | 64,923 | | |
| | 1,500 | | | Ross Stores, Inc. | | | 81,225 | | |
| | 1,150 | | | Tractor Supply Co. | | | 101,614 | | |
| | 2,550 | | | Urban Outfitters, Inc. | | | 100,368 | * | |
| | 1,750 | | | Williams-Sonoma, Inc. | | | 76,597 | | |
| | | | 771,641 | | |
| Textiles, Apparel & Luxury Goods (1.6%) | | | |
| | 700 | | | Lululemon Athletica, Inc. | | | 53,361 | * | |
| | 1,100 | | | PVH Corp. | | | 122,111 | | |
| | 1,250 | | | Under Armour, Inc. Class A | | | 60,662 | * | |
| | | | 236,134 | | |
See Notes to Schedule of Investments
8
| NUMBER OF SHARES | | | | VALUE† | |
| Thrifts & Mortgage Finance (0.5%) | | | |
| | 2,250 | | | Ocwen Financial Corp. | | $ | 77,828 | * | |
| Trading Companies & Distributors (1.8%) | | | |
| | 2,500 | | | Fastenal Co. | | | 116,725 | | |
| | 1,200 | | | MSC Industrial Direct Co., Inc. Class A | | | 90,456 | | |
| | 1,100 | | | United Rentals, Inc. | | | 50,072 | * | |
| | | | 257,253 | | |
| Wireless Telecommunication Services (2.2%) | | | |
| | 1,850 | | | Crown Castle International Corp. | | | 133,496 | * | |
| | 2,600 | | | SBA Communications Corp. Class A | | | 184,652 | * | |
| | | | 318,148 | | |
| | | | | Total Common Stocks (Cost $6,019,793) | | | 8,586,082 | | |
See Notes to Schedule of Investments
9
| PRINCIPAL AMOUNT | | | | VALUE† | |
| U.S. Treasury Securities-Backed by the Full Faith and Credit of the U.S. Government (13.0%) | | | |
| $ | 715,000 | | | U.S. Treasury Notes, 2.13%, due 11/30/14 | | $ | 740,360 | | |
| | 825,000 | | | U.S. Treasury Notes, 0.25%, due 2/28/14 — 12/15/15 | | | 825,044 | | |
| | 320,000 | | | U.S. Treasury Notes, 0.38%, due 11/15/15 | | | 320,300 | | |
| | 10,000 | | | U.S. Treasury Notes, 1.25%, due 8/31/15 | | | 10,243 | | |
| | | | | Total U.S. Treasury Securities-Backed by the Full Faith and Credit of the U.S. Government (Cost $1,905,699) | | | 1,895,947 | | |
| Mortgage-Backed Securities (6.8%) | | | |
| Adjustable Mixed Balance (2.2%) | | | |
| | 163,010 | | | Credit Suisse First Boston Mortgage Securities Corp., Ser. 2004-AR4, Class 2A1, 2.96%, due 5/25/34 | | | 157,321 | µ | |
| | 173,858 | | | First Horizon Mortgage Pass-Through Trust, Ser. 2005-AR5, Class 2A1, 2.71%, due 11/25/35 | | | 151,455 | µ | |
| | 9,216 | | | Harborview Mortgage Loan Trust, Ser. 2004-4, Class 3A, 1.34%, due 6/19/34 | | | 8,730 | µ | |
| | | | 317,506 | | |
| Commercial Mortgage-Backed (2.5%) | | | |
| | 56,003 | | | Bear Stearns Commercial Mortgage Securities, Inc., Ser. 2005-PWR8, Class AAB, 4.58%, due 6/11/41 | | | 56,140 | | |
| | 12,178 | | | Citigroup Commercial Mortgage Trust, Ser. 2006-C4, Class A2, 5.74%, due 3/15/49 | | | 12,873 | µ | |
| | 12,726 | | | Citigroup/Deutsche Bank Commercial Mortgage Trust, Ser. 2006-CD2, Class AAB, 5.33%, due 1/15/46 | | | 13,065 | µ | |
| | 82,973 | | | JP Morgan Chase Commercial Mortgage Securities Corp., Ser. 2011-C3, Class A1, 1.87%, due 2/15/46 | | | 84,354 | ñ | |
| | 50,595 | | | Morgan Stanley Capital I, Ser. 2011-C1, Class A1, 2.60%, due 9/15/47 | | | 52,105 | ñ | |
| | 86,964 | | | Morgan Stanley Capital I, Ser. 2011-C3, Class A1, 2.18%, due 7/15/49 | | | 89,350 | | |
| | 5,682 | | | Wachovia Bank Commercial Mortgage Trust, Ser. 2005-C22, Class A3, 5.31%, due 12/15/44 | | | 5,680 | µ | |
| | 50,016 | | | WF-RBS Commercial Mortgage Trust, Ser. 2011-C2, Class A1, 2.50%, due 2/15/44 | | | 51,265 | ñ | |
| | | | 364,832 | | |
| Mortgage-Backed Non-Agency (0.8%) | | | |
| | 76,065 | | | Countrywide Home Loans, Ser. 2005-R2, Class 2A4, 8.50%, due 6/25/35 | | | 78,631 | ñ | |
| | 39,769 | | | GSMPS Mortgage Loan Trust, Ser. 2005-RP3, Class 1A4, 8.50%, due 9/25/35 | | | 42,595 | ñ | |
| | | | 121,226 | | |
| Fannie Mae (0.7%) | | | |
| | 86,075 | | | Pass-Through Certificates, 4.50%, due 4/1/39 | | | 93,009 | | |
| Freddie Mac (0.6%) | | | |
| | 85,270 | | | Pass-Through Certificates, 4.50%, due 11/1/39 | | | 91,503 | | |
| | | | | Total Mortgage-Backed Securities (Cost $1,013,814) | | | 988,076 | | |
| Corporate Debt Securities (14.0%) | | | |
| Aerospace & Defense (0.1%) | | | |
| | 10,000 | | | United Technologies Corp., Senior Unsecured Notes, 1.20%, due 6/1/15 | | | 10,143 | | |
| Banks (3.6%) | | | |
| | 90,000 | | | Citigroup, Inc., Senior Unsecured Notes, 2.65%, due 3/2/15 | | | 92,679 | | |
| | 35,000 | | | Goldman Sachs Group, Inc., Senior Unsecured Medium-Term Notes, 1.60%, due 11/23/15 | | | 35,246 | | |
| | 155,000 | | | JPMorgan Chase & Co., Senior Unsecured Medium-Term Notes, 1.88%, due 3/20/15 | | | 157,787 | | |
| | 125,000 | | | Wells Fargo & Co., Senior Unsecured Notes, 1.50%, due 7/1/15 | | | 127,153 | | |
See Notes to Schedule of Investments
10
| PRINCIPAL AMOUNT | | | | VALUE† | |
| $ | 75,000 | | | Westpac Banking Corp., Senior Unsecured Notes, 1.13%, due 9/25/15 | | $ | 75,695 | | |
| | 45,000 | | | Westpac Banking Corp., Senior Unsecured Notes, 1.85%, due 12/9/13 | | | 45,658 | | |
| | | | 534,218 | | |
| Beverages (0.6%) | | | |
| | 75,000 | | | Anheuser-Busch Cos., LLC, Guaranteed Unsecured Notes, 4.95%, due 1/15/14 | | | 78,356 | | |
| | 10,000 | | | Anheuser-Busch InBev Worldwide, Inc., Guaranteed Notes, 0.80%, due 7/15/15 | | | 10,026 | | |
| | 5,000 | | | Heineken NV, Senior Notes, 0.80%, due 10/1/15 | | | 5,009 | ñ | |
| | | | 93,391 | | |
| Commercial Services (0.3%) | | | |
| | 35,000 | | | ERAC USA Finance LLC, Guaranteed Notes, 2.25%, due 1/10/14 | | | 35,357 | ñ | |
| | 10,000 | | | ERAC USA Finance LLC, Guaranteed Notes, 1.40%, due 4/15/16 | | | 10,067 | ñ | |
| | | | 45,424 | | |
| Diversified Financial Services (3.4%) | | | |
| | 85,000 | | | American Express Credit Corp., Senior Unsecured Medium-Term Notes, Ser. C, 5.88%, due 5/2/13 | | | 86,535 | | |
| | 45,000 | | | Caterpillar Financial Services Corp., Senior Unsecured Medium-Term Notes, 1.13%, due 12/15/14 | | | 45,483 | | |
| | 45,000 | | | Caterpillar Financial Services Corp., Senior Unsecured Notes, 1.65%, due 4/1/14 | | | 45,652 | | |
| | 150,000 | | | General Electric Capital Corp., Senior Unsecured Notes, 2.15%, due 1/9/15 | | | 154,070 | | |
| | 35,000 | | | Harley-Davidson Financial Services, Inc., Guaranteed Notes, 1.15%, due 9/15/15 | | | 35,092 | ñ | |
| | 50,000 | | | John Deere Capital Corp., Senior Unsecured Notes, 0.88%, due 4/17/15 | | | 50,220 | | |
| | 80,000 | | | Toyota Motor Credit Corp., Senior Unsecured Medium-Term Notes, 1.00%, due 2/17/15 | | | 80,536 | | |
| | | | 497,588 | | |
| Food (0.1%) | | | |
| | 15,000 | | | Kraft Foods Group, Inc., Senior Unsecured Notes, 1.63%, due 6/4/15 | | | 15,266 | ñ | |
| Insurance (0.4%) | | | |
| | 50,000 | | | Berkshire Hathaway Finance Corp., Guaranteed Notes, 1.50%, due 1/10/14 | | | 50,563 | | |
| Internet (0.2%) | | | |
| | 35,000 | | | Amazon.com, Inc., Senior Unsecured Notes, 0.65%, due 11/27/15 | | | 34,979 | | |
| Media (1.9%) | | | |
| | 95,000 | | | DIRECTV Holdings LLC, Guaranteed Notes, 4.75%, due 10/1/14 | | | 101,433 | | |
| | 90,000 | | | NBC Universal Media LLC, Senior Unsecured Notes, 2.10%, due 4/1/14 | | | 91,647 | | |
| | 75,000 | | | Time Warner Cable, Inc., Guaranteed Notes, 3.50%, due 2/1/15 | | | 79,211 | | |
| | | | 272,291 | | |
| Mining (0.2%) | | | |
| | 25,000 | | | BHP Billiton Finance USA Ltd., Guaranteed Notes, 1.13%, due 11/21/14 | | | 25,301 | | |
| Oil & Gas (0.5%) | | | |
| | 50,000 | | | BP Capital Markets PLC, Guaranteed Notes, 1.70%, due 12/5/14 | | | 51,039 | | |
| | 15,000 | | | Marathon Oil Corp., Senior Unsecured Notes, 0.90%, due 11/1/15 | | | 15,012 | | |
| | | | 66,051 | | |
| Pharmaceuticals (0.9%) | | | |
| | 90,000 | | | AbbVie, Inc., Guaranteed Notes, 1.20%, due 11/6/15 | | | 90,601 | ñ | |
| | 30,000 | | | Express Scripts Holding Co., Guaranteed Notes, 2.10%, due 2/12/15 | | | 30,560 | ñ | |
| | 15,000 | | | McKesson Corp., Senior Unsecured Notes, 0.95%, due 12/4/15 | | | 15,021 | | |
| | | | 136,182 | | |
See Notes to Schedule of Investments
11
| PRINCIPAL AMOUNT | | | | VALUE† | |
| Pipelines (0.4%) | | | |
| $ | 20,000 | | | Enterprise Products Operating LLC, Guaranteed Notes, 1.25%, due 8/13/15 | | $ | 20,123 | | |
| | 30,000 | | | TransCanada PipeLines Ltd., Senior Unsecured Notes, 0.88%, due 3/2/15 | | | 30,170 | | |
| | | | | | | | 50,293 | | |
| Retail (0.4%) | | | |
| | 55,000 | | | Home Depot, Inc., Senior Unsecured Notes, 5.25%, due 12/16/13 | | | 57,544 | | |
| Telecommunications (1.0%) | | | |
| | 80,000 | | | AT&T, Inc., Senior Unsecured Notes, 0.88%, due 2/13/15 | | | 80,375 | | |
| | 60,000 | | | Verizon Communications, Inc., Senior Unsecured Notes, 0.70%, due 11/2/15 | | | 60,015 | | |
| | | | | | | | 140,390 | | |
| | | | | Total Corporate Debt Securities (Cost $1,990,897) | | | 2,029,624 | | |
| Asset-Backed Securities (6.7%) | | | |
| | 29,149 | | | Ally Auto Receivables Trust, Ser. 2010-4, Class A3, 0.91%, due 11/17/14 | | | 29,207 | | |
| | 45,583 | | | Ally Auto Receivables Trust, Ser. 2011-1, Class A3, 1.38%, due 1/15/15 | | | 45,747 | | |
| | 175,000 | | | American Express Credit Account Master Trust, Ser. 2012-4, Class A, 0.45%, due 5/15/20 | | | 175,337 | µ | |
| | 200,000 | | | Carrington Mortgage Loan Trust, Ser. 2007-FRE1, Class A3, 0.47%, due 2/25/37 | | | 98,358 | µ | |
| | 92,130 | | | Ford Credit Auto Owner Trust, Ser. 2011-A, Class A3, 0.97%, due 1/15/15 | | | 92,338 | | |
| | 97,307 | | | Hyundai Auto Receivables Trust, Ser. 2011-A, Class A3, 1.16%, due 4/15/15 | | | 97,683 | | |
| | 100,000 | | | Mercedes-Benz Auto Receivables Trust, Ser. 2012-1, Class A2, 0.37%, due 3/16/15 | | | 100,038 | | |
| | 39,882 | | | Mercedes-Benz Auto Receivables Trust, Ser. 2011-1, Class A3, 0.85%, due 3/16/15 | | | 39,976 | | |
| | 150,000 | | | Nissan Auto Receivables Owner Trust, Ser. 2012-B, Class A2, 0.39%, due 4/15/15 | | | 150,057 | | |
| | 149,579 | | | SLM Student Loan Trust, Ser. 2006-5, Class A4, 0.40%, due 4/25/23 | | | 149,393 | µ | |
| | | | | Total Asset-Backed Securities (Cost $1,075,416) | | | 978,134 | | |
| NUMBER OF SHARES | | | | | |
| Short-Term Investments (0.4%) | | | |
| | 53,169 | | | State Street Institutional Liquid Reserves Fund Institutional Class (Cost $53,169) | | | 53,169 | | |
| | | | | Total Investments (99.9%) (Cost $12,058,788) | | | 14,531,032 | ## | |
| | | | | Cash, receivables and other assets, less liabilities (0.1%) | | | 7,861 | | |
| | | | | Total Net Assets (100.0%) | | $ | 14,538,893 | | |
See Notes to Schedule of Investments
12
Notes to Schedule of Investments Balanced Portfolio
† In accordance with Accounting Standards Codification ("ASC") 820 "Fair Value Measurements and Disclosures" ("ASC 820"), all investments held by Neuberger Berman Advisers Management Trust Balanced Portfolio (the "Fund") are carried at the value that Neuberger Berman Management LLC ("Management") believes the Fund would receive upon selling an investment in an orderly transaction to an independent buyer in the principal or most advantageous market for the investment under current market conditions. Various inputs, including the volume and level of activity for the asset or liability in the market, are considered in valuing the Fund's investments, some of which are discussed below. Significant management judgment may be necessary to value investments in accordance with ASC 820.
ASC 820 established a three-tier hierarchy of inputs to create a classification of value measurements for disclosure purposes. The three-tier hierarchy of inputs is summarized in the three broad Levels listed below.
• Level 1 – quoted prices in active markets for identical investments
• Level 2 – other significant observable inputs (including quoted prices for similar investments, interest rates, prepayment speeds, credit risk, amortized cost, etc.)
• Level 3 – significant unobservable inputs (including the Fund's own assumptions in determining the fair value of investments)
The inputs or methodology used for valuing an investment are not necessarily an indication of the risk associated with investing in those securities.
The value of the Fund's investments in equity securities and exchange traded funds, for which market quotations are readily available, is generally determined by Management by obtaining valuations from an independent pricing service based on the latest sale price quoted on a principal exchange or market for that security (Level 1 inputs). Securities traded primarily on the NASDAQ Stock Market are normally valued by the Fund at the NASDAQ Official Closing Price ("NOCP") provided by NASDAQ each business day. The NOCP is the most recently reported price as of 4:00:02 p.m., Eastern time, unless that price is outside the range of the "inside" bid and asked prices (i.e., the bid and asked prices that dealers quote to each other when trading for their own accounts); in that case, NASDAQ will adjust the price to equal the inside bid or asked price, whichever is closer. Because of delays in reporting trades, the NOCP may not be based on the price of the last trade to occur before the market closes. If there is no reported sale of a security on a particular day, the independent pricing service may value the security based on reported market quotations.
The value of the Fund's investments in debt securities is determined by Management primarily by obtaining valuations from independent pricing services based on readily available bid quotations, or if quotations are not available, by methods which include various considerations based on security type (generally Level 2 inputs). In addition to the consideration of yields or prices of securities of comparable quality, coupon, maturity and type; indications as to values from dealers; and general market conditions, the following is a description of other Level 2 inputs and related valuation techniques used by an independent pricing service to value certain types of debt securities of the Fund:
Corporate Debt Securities. Inputs used to value corporate debt securities generally include relative credit information, observed market movements, sector news, spread to the U.S. Treasury market, and other market information which may include benchmark yields, reported trades, broker-dealer quotes, issuer spreads, benchmark securities, bids, offers, and reference data, such as market research publications, when available ("Other Market Information").
U.S. Treasury Securities. Inputs used to value U.S. Treasury securities generally include quotes from several inter-dealer brokers and Other Market Information.
See Notes to Financial Statements
13
Notes to Schedule of Investments Balanced Portfolio (cont'd)
Asset-Backed Securities and Mortgage-Backed Securities. Inputs used to value asset-backed securities and mortgage- backed securities generally include models that consider a number of factors, which may include the following: prepayment speeds, cash flows, spread adjustments and Other Market Information.
Management has developed a process to periodically review information provided by independent pricing services for all types of securities.
Investments in State Street Institutional Liquid Reserves Fund Institutional Class are valued using the fund's daily calculated net asset value per share (Level 2 inputs).
If a valuation is not available from an independent pricing service, or if Management has reason to believe that the valuation received does not represent the amount the Fund might reasonably expect to receive on a current sale in an orderly transaction, the Fund seeks to obtain quotations from principal market makers (generally considered Level 3 inputs). If such quotations are not readily available, the security is valued using methods the Neuberger Berman Advisers Management Trust's Board of Trustees (the "Board") has approved on the belief that they reflect fair value. Numerous factors may be considered when determining the fair value of a security based on Level 2 or 3 inputs, including available analyst, media or other reports, trading in futures or ADRs and whether the issuer of the security being fair valued has other securities outstanding.
The value of the Fund's investments in foreign securities is generally determined using the same valuation methods and inputs as other Fund investments, as discussed above. Foreign security prices expressed in local currency values are translated from the local currency into U.S. dollars using the exchange rates as of 4:00 p.m., Eastern time. The Board has approved the use of Interactive Data Pricing and Reference Data, Inc. ("Interactive") to assist in determining the fair value of foreign equity securities when changes in the value of a certain index suggest that the closing prices on the foreign exchanges may no longer represent the amount that the Fund could expect to receive for those securities or on days when foreign markets are closed and U.S. markets are open. In each of these events, Interactive will provide adjusted prices for certain foreign equity securities using a statistical analysis of historical correlations of multiple factors (Level 2 inputs). In the absence of precise information about the market values of these foreign securities as of the close of the New York Stock Exchange, the Board has determined on the basis of available data that prices adjusted in this way are likely to be closer to the prices the Fund could realize on a current sale than are the prices of those securities established at the close of the foreign markets in which the securities primarily trade.
Fair value prices are necessarily estimates, and there is no assurance that such a price will be at or close to the price at which the security is next quoted or next trades.
See Notes to Financial Statements
14
Notes to Schedule of Investments Balanced Portfolio (cont'd)
The following is a summary, categorized by Level, of inputs used to value the Fund's investments as of December 31, 2012:
| Asset Valuation Inputs | | Level 1 | | Level 2 | | Level 3 | | Total | |
| Investments: | |
| Common Stocks^ | | $ | 8,586,082 | | | $ | — | | | $ | — | | | $ | 8,586,082 | | |
U.S. Treasury Securities-Backed by the Full Faith and Credit of the U.S. Government | | | — | | | | 1,895,947 | | | | — | | | | 1,895,947 | | |
| Mortgage-Backed Securities^ | | | — | | | | 988,076 | | | | — | | | | 988,076 | | |
| Corporate Debt Securities^ | | | — | | | | 2,029,624 | | | | — | | | | 2,029,624 | | |
| Asset-Backed Securities | | | — | | | | 978,134 | | | | — | | | | 978,134 | | |
| Short-Term Investments | | | — | | | | 53,169 | | | | — | | | | 53,169 | | |
| Total Investments | | $ | 8,586,082 | | | $ | 5,944,950 | | | $ | — | | | $ | 14,531,032 | | |
^ The Schedule of Investments provides information on the industry categorization for the portfolio.
The Fund had no transfers between Levels 1 and 2 during the year ended December 31, 2012.
## At December 31, 2012, the cost of investments for U.S. federal income tax purposes was $12,097,767. Gross unrealized appreciation of investments was $2,693,824 and gross unrealized depreciation of investments was $260,559, resulting in net unrealized appreciation of $2,433,265, based on cost for U.S. federal income tax purposes.
* Security did not produce income during the last twelve months.
µ Floating rate securities are securities whose yields vary with a designated market index or market rate. These securities are shown at their current rates as of December 31, 2012 and their final maturity dates.
ñ Securities were purchased under Rule 144A of the Securities Act of 1933, as amended (the "1933 Act") or are private placements and, unless registered under the 1933 Act or exempted from registration, may only be sold to qualified institutional investors. These securities have been deemed by the investment manager to be liquid. At December 31, 2012, these securities amounted to $530,902 or 3.7% of net assets for the Fund.
See Notes to Financial Statements
15
Statement of Assets and Liabilities
Neuberger Berman Advisers Management Trust
| | | BALANCED PORTFOLIO | |
| | | December 31, 2012 | |
| Assets | |
| Investments in securities, at value* (Note A)—see Schedule of Investments: | |
| Unaffiliated issuers | | $ | 14,531,032 | | |
| Foreign currency | | | 10,492 | | |
| Dividends and interest receivable | | | 48,005 | | |
| Receivable for securities sold | | | 103,455 | | |
| Receivable for Fund shares sold | | | 24,196 | | |
| Receivable from Management—net (Note B) | | | 1,260 | | |
| Prepaid expenses and other assets | | | 11,855 | | |
| Total Assets | | | 14,730,295 | | |
| Liabilities | |
| Payable for securities purchased | | | 115,326 | | |
| Payable for Fund shares redeemed | | | 3,458 | | |
| Payable to investment manager (Note B) | | | 6,758 | | |
| Accrued expenses and other payables | | | 65,860 | | |
| Total Liabilities | | | 191,402 | | |
| Net Assets | | $ | 14,538,893 | | |
| Net Assets consist of: | |
| Paid-in capital | | $ | 12,124,323 | | |
| Accumulated net realized gains (losses) on investments | | | (58,472 | ) | |
| Net unrealized appreciation (depreciation) in value of investments | | | 2,473,042 | | |
| Net Assets | | $ | 14,538,893 | | |
| Shares Outstanding ($.001 par value; unlimited shares authorized) | | | 1,267,271 | | |
| Net Asset Value, offering and redemption price per share | | $ | 11.47 | | |
| *Cost of Investments | | | $12,058,788 | | |
| Total cost of foreign currency | | $ | 9,694 | | |
See Notes to Financial Statements
16
Statement of Operations
Neuberger Berman Advisers Management Trust
| | | BALANCED PORTFOLIO | |
| | | For the Year Ended December 31, 2012 | |
| Investment Income: | |
| Income (Note A): | |
| Dividend income—unaffiliated issuers | | $ | 60,480 | | |
| Interest income—unaffiliated issuers | | | 91,270 | | |
| Foreign taxes withheld | | | (260 | ) | |
| Total income | | $ | 151,490 | | |
| Expenses: | |
| Investment management fees (Note B) | | | 83,753 | | |
| Administration fees (Note B) | | | 45,683 | | |
| Audit fees | | | 53,585 | | |
| Custodian fees | | | 28,089 | | |
| Insurance expense | | | 919 | | |
| Legal fees | | | 7,733 | | |
| Registration and filing fees | | | 16,118 | | |
| Shareholder reports | | | 18,881 | | |
| Trustees' fees and expenses | | | 50,768 | | |
| Miscellaneous | | | 1,459 | | |
| Total expenses | | | 306,988 | | |
| Expenses reimbursed by Management (Note B) | | | (25,078 | ) | |
| Expenses reduced by custodian fee expense offset arrangement (Note A) | | | (3 | ) | |
| Total net expenses | | | 281,907 | | |
| Net investment income (loss) | | $ | (130,417 | ) | |
| Realized and Unrealized Gain (Loss) on Investments (Note A): | |
| Net realized gain (loss) on: | |
| Sales of investment securities of unaffiliated issuers | | | 1,678,062 | | |
| Foreign currency | | | 6 | | |
| Change in net unrealized appreciation (depreciation) in value of: | |
| Unaffiliated investment securities | | | (149,290 | ) | |
| Foreign currency | | | 240 | | |
| Net gain (loss) on investments | | | 1,529,018 | | |
| Net increase (decrease) in net assets resulting from operations | | $ | 1,398,601 | | |
See Notes to Financial Statements
17
Statements of Changes in Net Assets
Neuberger Berman Advisers Management Trust
| | | BALANCED PORTFOLIO | |
| | | Year Ended December 31, 2012 | | Year Ended December 31, 2011 | |
| Increase (Decrease) in Net Assets: | |
| From Operations (Note A): | |
| Net investment income (loss) | | $ | (130,417 | ) | | $ | (127,396 | ) | |
| Net realized gain (loss) on investments | | | 1,678,068 | | | | 1,216,775 | | |
| Change in net unrealized appreciation (depreciation) of investments | | | (149,050 | ) | | | (1,136,585 | ) | |
| Net increase (decrease) in net assets resulting from operations | | | 1,398,601 | | | | (47,206 | ) | |
| Distributions to Shareholders From (Note A): | |
| Net investment income | | | — | | | | (49,434 | ) | |
| From Fund Share Transactions (Note D): | |
| Proceeds from shares sold | | | 160,693 | | | | 381,133 | | |
| Proceeds from reinvestment of dividends and distributions | | | — | | | | 49,434 | | |
| Payments for shares redeemed | | | (2,313,091 | ) | | | (2,593,182 | ) | |
| Net increase (decrease) from Fund share transactions | | | (2,152,398 | ) | | | (2,162,615 | ) | |
| Net Increase (Decrease) in Net Assets | | | (753,797 | ) | | | (2,259,255 | ) | |
| Net Assets: | |
| Beginning of year | | | 15,292,690 | | | | 17,551,945 | | |
| End of year | | $ | 14,538,893 | | | $ | 15,292,690 | | |
| Undistributed net investment income (loss) at end of year | | $ | — | | | $ | — | | |
See Notes to Financial Statements
18
Notes to Financial Statements Balanced Portfolio
Note A—Summary of Significant Accounting Policies:
1 General: Neuberger Berman Advisers Management Trust (the "Trust") is a Delaware statutory trust organized pursuant to a Trust Instrument dated May 23, 1994. The Trust is currently comprised of ten separate operating series (each individually a "Series," and collectively the "Funds") each of which is diversified. The Trust is registered as an open-end management investment company under the Investment Company Act of 1940, as amended (the "1940 Act"), and its shares are registered under the 1933 Act. The Fund currently offers only Class I shares. The Board may establish additional series or classes of shares without the approval of shareholders.
The assets of each Series belong only to that Series, and the liabilities of each Series are borne solely by that Series and no other.
The preparation of financial statements in accordance with U.S. generally accepted accounting principles ("GAAP") requires Management to make estimates and assumptions at the date of the financial statements. Actual results could differ from those estimates.
2 Portfolio valuation: Investment securities are valued as indicated in the notes following the Schedule of Investments.
3 Foreign currency translation: The accounting records of the Fund are maintained in U.S. dollars. Foreign currency amounts are translated into U.S. dollars using the exchange rate as of 4:00 p.m., Eastern time, to determine the value of investments, other assets and liabilities. Purchase and sale prices of securities, and income and expenses, are translated into U.S. dollars at the prevailing rate of exchange on the respective dates of such transactions. Net unrealized foreign currency gain (loss), if any, arises from changes in the value of assets and liabilities, other than investments in securities, as a result of changes in exchange rates and is stated separately in the Statement of Operations.
4 Securities transactions and investment income: Securities transactions are recorded on trade date for financial reporting purposes. Dividend income is recorded on the ex-dividend date or, for certain foreign dividends, as soon as the Fund becomes aware of the dividends. Non-cash dividends included in dividend income, if any, are recorded at the fair market value of the securities received. Interest income, including accretion of discount (adjusted for original issue discount, where applicable), and accretion of market discount on long-term bonds and short-term investments, if any, is recorded on the accrual basis. Realized gains and losses from securities transactions and foreign currency transactions, if any, are recorded on the basis of identified cost and stated separately in the Statement of Operations. Included in net realized gain (loss) on investments are proceeds from the settlements of class action litigation in which the Fund participated as a class member. The amount of such proceeds for the year ended December 31, 2012 was $14,473.
5 Income tax information: The Funds are treated as separate entities for U.S. federal income tax purposes. It is the policy of the Fund to continue to qualify for treatment as a regulated investment company by complying with the requirements of the U.S. Internal Revenue Code applicable to regulated investment companies and to distribute substantially all of its net investment income and net realized capital gains to its shareholders. To the extent the Fund distributes substantially all of its net investment income and net realized capital gains to shareholders, no federal income or excise tax provision is required.
The Fund has adopted the provisions of ASC 740 "Income Taxes" ("ASC 740"). ASC 740 sets forth a minimum threshold for financial statement recognition of a tax position taken, or expected to be taken, in a tax return. The Fund recognizes interest and penalties, if any, related to unrecognized tax positions as an income tax expense in the Statement of Operations. The Fund is subject to examination by U.S. federal and state tax authorities for returns filed for the prior three fiscal years 2009-2011. As of December 31, 2012, the Fund did not have any unrecognized tax positions.
19
Income distributions and capital gain distributions are determined in accordance with income tax regulations, which may differ from GAAP. These differences are primarily due to differing treatments of income and gains on various investment securities held by the Fund, timing differences and differing characterization of distributions made by the Fund. The Fund may also utilize earnings and profits distributed to shareholders on redemption of shares as a part of the dividends-paid deduction for income tax purposes.
As determined on December 31, 2012, permanent differences resulting primarily from different book and tax accounting were reclassified at year end. Such differences may be attributed to one or more of the following: net operating losses, paydown gains and losses, amortization of bond premium, non-taxable dividend adjustments to income and foreign currency gains and losses. These reclassifications had no effect on net income, net asset value ("NAV") or NAV per share of the Fund. For the year ended December 31, 2012, the Fund recorded the following permanent reclassifications:
| Paid-in Capital | | Undistributed Net Investment Income (Loss) | | Accumulated Net Realized Gains (Losses) on Investments | |
| $ | (91,658 | ) | | $ | 130,417 | | | $ | (38,759 | ) | |
For tax purposes, distributions of short-term gains are taxable to shareholders as ordinary income.
The tax character of distributions paid during the years ended December 31, 2012 and December 31, 2011 was as follows:
| Distributions Paid From: | | | |
| Ordinary Income | | Total | | | |
| 2012 | | 2011 | | 2012 | | 2011 | | | |
| $ | — | | | $ | 49,434 | | | $ | — | | | $ | 49,434 | | | | |
As of December 31, 2012, the components of distributable earnings (accumulated losses) on a U.S. federal income tax basis were as follows:
Undistributed Ordinary Income | | Unrealized Appreciation (Depreciation) | | Loss Carryforwards and Deferrals | | Other Temporary Differences | | Total | |
| $ | — | | | $ | 2,434,063 | | | $ | (19,493 | ) | | $ | — | | | $ | 2,414,570 | | |
The difference between book basis and tax basis distributable earnings are primarily due to: timing differences of wash sales, amortization of bond premium and capital loss carryforwards.
To the extent the Fund's net realized capital gains, if any, can be offset by capital loss carryforwards, it is the policy of the Fund not to distribute such gains. The Regulated Investment Company ("RIC") Modernization Act of 2010 (the "Act") became effective for the Fund on January 1, 2011. The Act modernizes several of the federal income and excise tax provisions related to RICs. Among the changes made are changes to the capital loss carryforward rules allowing for RICs to carry forward capital losses indefinitely and to retain the character of capital loss carryforwards as short-term or long-term ("Post-Enactment"). Rules in effect previously limited the carryforward period to eight years and all carryforwards were considered short-term in character ("Pre-Enactment"). As determined at December 31, 2012, the Fund had unused capital loss carryforwards available for federal income tax purposes to offset net realized capital gains, if any, as follows:
| Pre-Enactment | |
| Expiring in: | |
| 2017 | |
| $ | 19,493 | | |
20
Post-Enactment capital loss carryforwards must be fully used before Pre-Enactment capital loss carryforwards; therefore, under certain circumstances, Pre-Enactment capital loss carryforwards available as of the report date may expire unused. As of December 31, 2012, the Fund had no Post-Enactment capital loss carryforwards.
During the year ended December 31, 2012, the Fund utilized capital loss carryforwards of $1,605,850.
6 Distributions to shareholders: The Fund may earn income, net of expenses, daily on its investments. Distributions from net investment income and net realized capital gains, if any, generally are distributed once a year (usually in October). Income distributions and capital gain distributions to shareholders are recorded on the ex-date.
7 Foreign taxes: Foreign taxes withheld represent amounts withheld by foreign tax authorities, net of refunds recoverable.
8 Expense allocation: Certain expenses are applicable to multiple funds. Expenses directly attributable to a Series are charged to that Series. Expenses of the Trust that are not directly attributable to a particular series of the Trust (e.g., the Fund) are allocated among the series of the Trust, on the basis of relative net assets, except where a more appropriate allocation of expenses to each of the series can otherwise be made fairly. Expenses borne by the complex of related investment companies, which includes open-end and closed-end investment companies for which Management serves as investment manager, that are not directly attributable to a particular investment company in the complex (e.g., the Trust) or series thereof are allocated among the investment companies in the complex or series thereof, on the basis of relative net assets, except where a more appropriate allocation of expenses to each of the investment companies in the complex or series thereof can otherwise be made fairly.
9 Dollar rolls: The Fund may enter into dollar roll transactions with respect to mortgage-backed securities. In a dollar roll transaction, the Fund sells securities for delivery in the current month and simultaneously agrees to repurchase substantially similar (i.e., same type and coupon) securities on a specified future date from the same party. During the period before this repurchase, the Fund foregoes principal and interest payments on the securities. The Fund is compensated by the difference between the current sales price and the forward price for the future purchase (often referred to as the "drop"), as well as by the interest earned on the cash proceeds of the initial sale. Dollar rolls may increase fluctuations in the Fund's NAV and may be viewed as a form of leverage. There is a risk that the counterparty will be unable or unwilling to complete the transaction as scheduled, which may result in losses to the Fund.
10 Investments in foreign securities: Investing in foreign securities may involve certain sovereign and other risks, in addition to the credit and market risks normally associated with domestic securities. These additional risks include the possibility of adverse political and economic developments (including political instability, nationalization, expropriation, or confiscatory taxation) and the potentially adverse effects of unavailability of public information regarding issuers, less governmental supervision and regulation of financial markets, reduced liquidity of certain financial markets, and the lack of uniform accounting, auditing, and financial reporting standards or the application of standards that are different or less stringent than those applied in the United States. Foreign securities also may experience greater price volatility, higher rates of inflation, and delays in settlement.
11 Indemnifications: Like many other companies, the Trust's organizational documents provide that its officers and trustees are indemnified against certain liabilities arising out of the performance of their duties to the Trust. In addition, both in some of its principal service contracts and in the normal course of its business, the Trust enters into contracts that provide indemnifications to other parties for certain types of losses or liabilities. The Trust's maximum exposure under these arrangements is unknown as this could involve future claims against the Trust.
12 Expense offset arrangement: The Fund has an expense offset arrangement in connection with its custodian contract. For the year ended December 31, 2012, the impact of this arrangement was a reduction of expenses of $3.
21
Note B—Management Fees, Administration Fees, Distribution Arrangements, and Other Transactions with Affiliates:
Fund shares are issued and redeemed in connection with investments in and payments under certain variable annuity contracts and variable life insurance policies issued through separate accounts of life insurance companies and are also offered directly to certain qualified pension and retirement plans.
The Fund retains Management as its investment manager under a Management Agreement. For such investment management services, the Fund pays Management a fee at the annual rate of 0.55% of the first $250 million of the Fund's average daily net assets, 0.525% of the next $250 million, 0.50% of the next $250 million, 0.475% of the next $250 million, 0.45% of the next $500 million, 0.425% of the next $2.5 billion, and 0.40% of average daily net assets in excess of $4 billion. Accordingly, for the year ended December 31, 2012, the management fee pursuant to the Management Agreement was equivalent to an annual effective rate of 0.55% of the Fund's average daily net assets.
The Fund retains Management as its administrator under an Administration Agreement. The Fund pays Management an administration fee at the annual rate of 0.30% of its average daily net assets under this agreement. Additionally, Management retains State Street Bank and Trust Company ("State Street") as its sub-administrator under a Sub-Administration Agreement. Management pays State Street a fee for all services received under this agreement.
The Board adopted a non-fee distribution plan for the Fund.
Management has contractually undertaken through December 31, 2015 to waive current payment of fees and/or reimburse the Fund for its operating expenses (excluding fees payable to Management, interest, taxes, brokerage commissions, extraordinary expenses, transaction costs and dividend expense on short sales, if any) ("Operating Expenses") which exceed, in the aggregate, 1.00% per annum of the Fund's average daily net assets (the "Expense Limitation"). For the year ended December 31, 2012, such excess expenses amounted to $25,078. The Fund has agreed to repay Management through December 31, 2018 for fees and expenses waived and/or its excess Operating Expenses previously reimbursed by Management, so long as its annual Operating Expenses during that period do not exceed its Expense Limitation in place at the time the fees and expenses were waived or reimbursed, and the repayment is made within three years after the year in which Management issued the reimbursement or waived fees. During the year ended December 31, 2012, there was no repayment to Management under its contractual expense limitation. At December 31, 2012, contingent liabilities to Management under its contractual expense limitation were as follows:
| | | Expiring in: | |
| | | 2013 | | 2014 | | 2015 | | Total | |
| | | | | $ | 11,078 | | | $ | — | | | $ | 25,078 | | | $ | 36,156 | | |
Neuberger Berman LLC ("Neuberger") is retained by Management to furnish it with investment recommendations and research information without added cost to the Fund. Several individuals who are officers and/or trustees of the Trust are also employees of Neuberger and/or Management.
Management and Neuberger are indirect subsidiaries of Neuberger Berman Group LLC (("NBG") and together with its consolidated subsidiaries ("NB Group")). NBSH Acquisition, LLC ("NBSH"), which is owned by portfolio managers, members of the NB Group management team and certain of NB Group's key employees and senior professionals, owns, as of September 30, 2012, approximately 57% of NBG's common units, and Lehman Brothers Holdings Inc. ("LBHI") and certain of its subsidiaries (collectively the "LBHI Parties") own the remaining 43% of such common units. Pursuant to agreements among NBG, NBSH and the LBHI Parties, NBG is entitled to acquire the remaining Class A common units through a process that is expected to end in 2017. In April 2012, NBG exercised its option (the "Redemption Agreement Option") to redeem during 2012 certain of its Class A common units held by the LBHI Parties equal to 10% of NBG's aggregate common units issued and outstanding as of March 16, 2012. The final payment for such Class A common units is due within thirty (30) days of December 31, 2012.
22
Note C—Securities Transactions:
Cost of purchases and proceeds of sales and maturities of long-term securities for the year ended December 31, 2012 were as follows:
Purchases of U.S. Government and Agency Obligations | | Purchases excluding U.S. Government and Agency Obligations | | Sales and Maturities of U.S. Government and Agency Obligations | | Sales and Maturities excluding U.S. Government and Agency Obligations | |
| $ | 2,768,923 | | | $ | 5,423,808 | | | $ | 1,831,190 | | | $ | 8,345,321 | | |
During the year ended December 31, 2012, no brokerage commissions on securities transactions were paid to affiliated brokers.
Note D—Fund Share Transactions:
Share activity for the years ended December 31, 2012 and for the year ended December 31, 2011 was as follows:
| | | For the Year Ended December 31, | |
| | | 2012 | | 2011 | |
| Shares Sold | | | 14,219 | | | | 35,379 | | |
| Shares Issued on Reinvestment of Dividends and Distributions | | | — | | | | 4,699 | | |
| Shares Redeemed | | | (204,093 | ) | | | (240,106 | ) | |
| Total | | | (189,874 | ) | | | (200,028 | ) | |
Note E—Line of Credit:
At December 31, 2012, the Fund was a participant in a single committed, unsecured $200,000,000 line of credit with State Street, to be used only for temporary or emergency purposes. Other investment companies managed by Management also participate in this line of credit on the same terms. Interest is charged on borrowings under this line of credit at the higher of (a) the Federal Funds Rate plus 1.25% per annum or (b) the Overnight LIBOR Rate plus 1.25% per annum. A commitment fee of 0.10% per annum of the available line of credit is charged, of which each participating Fund has agreed to pay its pro rata share, based on the ratio of its individual net assets to the net assets of all participants at the time the fee is due and payable. The fee is paid quarterly in arrears. Because several mutual funds participate, there is no assurance that an individual Fund will have access to all or any part of the $200,000,000 at any particular time. There were no loans outstanding pursuant to this line of credit at December 31, 2012. During the year ended December 31, 2012, the Fund did not utilize this line of credit.
Note F—Recent Accounting Pronouncement:
In December 2011, the Financial Accounting Standards Board issued Accounting Standards Update 2011-11 Disclosures about Offsetting Assets and Liabilities ("ASU 2011-11"). Effective for annual reporting periods beginning on or after January 1, 2013 and interim periods within those annual periods, ASU 2011-11 is intended to enhance disclosure requirements on the offsetting of financial assets and liabilities. At this time, Management is evaluating the implications of ASU 2011-11 and its impact on the financial statements.
23
Financial Highlights
Balanced Portfolio
The following table includes selected data for a share outstanding throughout each year and other performance information derived from the Financial Statements. Per share amounts that round to less than $.01 or $(.01) per share are presented as $.00 or $(.00), respectively.
| | | Year Ended December 31, | |
| | | 2012 | | 2011 | | 2010 | | 2009 | | 2008 | |
| Net Asset Value, Beginning of Year | | $ | 10.49 | | | $ | 10.59 | | | $ | 9.00 | | | $ | 7.58 | | | $ | 13.08 | | |
| Income From Investment Operations: | |
Net Investment Income (Loss)‡ | | | (.10 | ) | | | (.08 | ) | | | (.03 | ) | | | .05 | | | | .09 | | |
Net Gains or Losses on Securities (both realized and unrealized) | | | 1.08 | | | | .01 | | | | 1.72 | | | | 1.65 | | | | (5.17 | ) | |
| Total From Investment Operations | | | .98 | | | | (.07 | ) | | | 1.69 | | | | 1.70 | | | | (5.08 | ) | |
| Less Distributions From: | |
| Net Investment Income | | | — | | | | (.03 | ) | | | (.10 | ) | | | (.28 | ) | | | (.42 | ) | |
| Net Asset Value, End of Year | | $ | 11.47 | | | $ | 10.49 | | | $ | 10.59 | | | $ | 9.00 | | | $ | 7.58 | | |
Total Return†† | | | 9.34 | % | | | (.63 | )% | | | 18.83 | % | | | 22.47 | % | | | (39.15 | )% | |
| Ratios/Supplemental Data | |
| Net Assets, End of Year (in millions) | | $ | 14.5 | | | $ | 15.3 | | | $ | 17.6 | | | $ | 16.4 | | | $ | 15.5 | | |
Ratio of Gross Expenses to Average Net Assets# | | | 2.02 | % | | | 1.85 | % | | | 1.92 | % | | | 2.04 | % | | | 1.29 | % | |
Ratio of Net Expenses to Average Net Assets§ | | | 1.85 | % | | | 1.85 | % | | | 1.85 | % | | | 1.86 | % | | | 1.29 | % | |
Ratio of Net Investment Income (Loss) to Average Net Assets | | | (.86 | )% | | | (.76 | )% | | | (.37 | )% | | | .66 | % | | | .81 | % | |
| Portfolio Turnover Rate | | | 55 | % | | | 52 | % | | | 58 | % | | | 85 | % | | | 57 | % | |
See Notes to Financial Highlights
24
Notes to Financial Highlights Balanced Portfolio
†† Total return based on per share NAV reflects the effects of changes in NAV on the performance of the Fund during each fiscal period and assumes income dividends and other distributions, if any, were reinvested. Results represent past performance and do not indicate future results. Current returns may be lower or higher than the performance data quoted. Investment returns and principal may fluctuate and shares when redeemed may be worth more or less than original cost. Total return would have been lower if Management had not reimbursed and/or waived certain expenses. Total return would have been higher if Management had not recouped previously reimbursed expenses. The total return information shown does not reflect charges and other expenses that apply to the separate account or the related insurance policies, and the inclusion of these charges and other expenses would reduce the total return for all fiscal periods shown. Had the Fund not received the class actions proceeds as listed in Note A-4, total return based on per share NAV for the year ended December 31, 2012 would have been 9.25%.
# Represents the annualized ratios of net expenses to average daily net assets if Management had not reimbursed certain expenses and/or waived a portion of the investment management fee.
‡ Calculated based on the average number of shares outstanding during each fiscal period.
§ After reimbursement and/or waiver of a portion of the investment management fee by Management. The Fund is required to calculate an expense ratio without taking into consideration any expense reductions related to expense offset arrangements. Had the Fund not received expense reductions related to expense offset arrangements, the annualized ratios of net expenses to average net assets would have been:
| | | Year Ended December 31, | |
| 2012 | | 2011 | | 2010 | | 2009 | | 2008 | | | |
| | 1.85 | % | | | 1.85 | % | | | 1.85 | % | | | 1.86 | % | | | 1.29 | % | | | |
After reimbursement of expenses previously paid by Management. Had the Fund not made such reimbursements, the annualized ratio of net expenses to average daily net assets would have been:
| | | Year Ended December 31, | |
| | | 2011 | |
| | | | | | 1.83 | % | |
25
Report of Independent Registered Public Accounting Firm
To the Board of Trustees of
Neuberger Berman Advisers Management Trust and
Shareholders of Balanced Portfolio
We have audited the accompanying statement of assets and liabilities of Balanced Portfolio, one of the series constituting Neuberger Berman Advisers Management Trust (the "Trust"), including the schedule of investments, as of December 31, 2012, and the related statement of operations for the year then ended, the statements of changes in net assets for each of the two years in the period then ended, and the financial highlights for each of the five years in the period then ended. These financial statements and financial highlights are the responsibility of the Trust's management. Our responsibility is to express an opinion on these financial statements and financial highlights based on our audits.
We conducted our audits in accordance with the standards of the Public Company Accounting Oversight Board (United States). Those standards require that we plan and perform the audit to obtain reasonable assurance about whether the financial statements and financial highlights are free of material misstatement. We were not engaged to perform an audit of the Trust's internal control over financial reporting. Our audits included consideration of internal control over financial reporting as a basis for designing audit procedures that are appropriate in the circumstances, but not for the purpose of expressing an opinion on the effectiveness of the Trust's internal control over financial reporting. Accordingly, we express no such opinion. An audit also includes examining, on a test basis, evidence supporting the amounts and disclosures in the financial statements and financial highlights, assessing the accounting principles used and significant estimates made by management, and evaluating the overall financial statement presentation. Our procedures included confirmation of securities owned as of December 31, 2012 by correspondence with the custodian and others or by other appropriate auditing procedures where replies from others were not received. We believe that our audits provide a reasonable basis for our opinion.
In our opinion, the financial statements and financial highlights referred to above present fairly, in all material respects, the financial position of Balanced Portfolio, a series of Neuberger Berman Advisers Management Trust, at December 31, 2012, the results of its operations for the year then ended, the changes in its net assets for each of the two years in the period then ended, and the financial highlights for each of the five years in the period then ended, in conformity with U.S. generally accepted accounting principles.
Boston, Massachusetts
February 7, 2013
26
Trustee and Officer Information
The following tables set forth information concerning the trustees ("Trustees") and officers ("Officers") of the Trust. All persons named as Trustees and Officers also serve in similar capacities for other funds administered or managed by Management, Neuberger and Neuberger Berman Fixed Income LLC ("NBFI"). The Statement of Additional Information includes additional information about Trustees and is available upon request, without charge, by calling (800) 877-9700.
Information about the Board of Trustees
Name, (Year of Birth), and Address(1) | | Position(s) and Length of Time Served(2) | | Principal Occupation(s)(3) | | Number of Funds in Fund Complex Overseen by Fund Trustee | | Other Directorships Held Outside Fund Complex by Fund Trustee(3) | |
| Independent Fund Trustees | |
| Faith Colish (1935) | | Trustee since 1982 | | Counsel, Carter Ledyard & Milburn LLP (law firm) since October 2002; formerly, Attorney-at-Law and President, Faith Colish, A Professional Corporation, 1980 to 2002. | | | 50 | | | Formerly, Director, 1997 to 2003, and Advisory Director, 2003 to 2006, ABA Retirement Funds (formerly, American Bar Retirement Association) (not-for-profit membership corporation). | |
| Martha C. Goss (1949) | | Trustee since 2007 | | President, Woodhill Enterprises Inc./Chase Hollow Associates LLC (personal investment vehicle), since 2006; Chief Operating and Financial Officer, Hopewell Holdings LLC/Amwell Holdings, LLC (a holding company for investments in the healthcare sector), since 2003; formerly, Consultant, Resources Connection (temporary staffing), 2002 to 2006. | | | 50 | | | Director, American Water (water utility), since 2003; Director, Channel Reinsurance (financial guaranty reinsurance), 2006 to 2010; Director, Allianz Life of New York (insurance), since 2005; Director, Financial Women's Association of New York (not-for-profit association), since 2003; Trustee Emerita, Brown University, since 1998; formerly, Director, Ocwen Financial Corporation (mortgage servicing), 2005 to 2010; formerly, Advisory Board Member, Attensity (software developer), 2005 to 2007; formerly, Director, Bank Leumi (commercial bank), 2005 to 2007; formerly, Director, Claire's Stores, Inc. (retailer), 2005 to 2007. | |
27
Name, (Year of Birth), and Address(1) | | Position(s) and Length of Time Served(2) | | Principal Occupation(s)(3) | | Number of Funds in Fund Complex Overseen by Fund Trustee | | Other Directorships Held Outside Fund Complex by Fund Trustee(3) | |
| Michael M. Knetter (1960) | | Trustee since 2007 | | President and Chief Executive Officer, University of Wisconsin Foundation, since October 2010; formerly, Dean, School of Business, University of Wisconsin—Madison; formerly, Professor of International Economics and Associate Dean, Amos Tuck School of Business—Dartmouth College, 1998 to 2002. | | | 50 | | | Director, American Family Insurance (a mutual company, not publicly traded), since March 2009; formerly, Trustee, Northwestern Mutual Series Fund, Inc., 2007 to 2010; formerly, Director, Wausau Paper, 2005 to 2011; formerly, Director, Great Wolf Resorts, 2004 to 2009. | |
| Howard A. Mileaf (1937) | | Trustee since 1999 | | Retired; formerly, Vice President and General Counsel, WHX Corporation (holding company), 1993 to 2001. | | | 50 | | | Formerly, Director, Webfinancial Corporation (holding company), 2002 to 2008; formerly, Director, WHX Corporation (holding company), 2002 to 2005; formerly, Director, State Theatre of New Jersey (not-for-profit theatre), 2000 to 2005. | |
| George W. Morriss (1947) | | Trustee since 2007 | | Adjunct Faculty Member, Columbia University School of International Policy and Administration, since October 2012; formerly, Executive Vice President and Chief Financial Officer, People's Bank, Connecticut (a financial services company), 1991 to 2001. | | | 50 | | | Formerly, Manager, Larch Lane Multi-Strategy Fund complex (which consisted of three funds), 2006 to 2011; formerly, Member, NASDAQ Issuers' Affairs Committee, 1995 to 2003. | |
28
Name, (Year of Birth), and Address(1) | | Position(s) and Length of Time Served(2) | | Principal Occupation(s)(3) | | Number of Funds in Fund Complex Overseen by Fund Trustee | | Other Directorships Held Outside Fund Complex by Fund Trustee(3) | |
| Jack L. Rivkin (1940) | | Trustee since 2002; President 2002 to 2008 | | Formerly, Executive Vice President and Chief Investment Officer, Neuberger Berman Holdings LLC (holding company), 2002 to August 2008 and 2003 to August 2008, respectively; formerly, Managing Director and Chief Investment Officer, Neuberger, December 2005 to August 2008 and 2003 to August 2008, respectively; formerly, Executive Vice President, Neuberger, December 2002 to 2005; formerly, Director and Chairman, Management, December 2002 to August 2008; formerly, Executive Vice President, Citigroup Investments, Inc., September 1995 to February 2002; formerly, Executive Vice President, Citigroup Inc., September 1995 to February 2002. | | | 50 | | | Director, Idealab (private company), since 2009; Director, Distributed World Power (private company), since 2009; Director, Dale Carnegie and Associates, Inc. (private company), since 1999; Director, Solbright, Inc. (private company), since 1998; Director, SA Agricultural Fund, since 2009; Chairman and Director, Essential Brands (consumer products) since 2008; formerly, Director, New York Society of Security Analysts, 2006 to 2008. | |
| Tom D. Seip (1950) | | Trustee since 2000; Chairman of the Board since 2008; Lead Independent Trustee 2006 to 2008 | | General Partner, Ridgefield Farm LLC (a private investment vehicle); formerly, President and CEO, Westaff, Inc. (temporary staffing), May 2001 to January 2002; formerly, Senior Executive, The Charles Schwab Corporation, 1983 to 1998, including Chief Executive Officer, Charles Schwab Investment Management, Inc.; Trustee, Schwab Family of Funds and Schwab Investments, 1997 to 1998; and Executive Vice President—Retail Brokerage, Charles Schwab & Co., Inc., 1994 to 1997. | | | 50 | | | Director, H&R Block, Inc. (financial services company), since May 2001; Chairman, Governance and Nominating Committee, H&R Block, Inc., since 2011; formerly, Chairman, Compensation Committee, H&R Block, Inc., 2006 to 2010; formerly, Director, Forward Management, Inc. (asset management company), 1999 to 2006. | |
29
Name, (Year of Birth), and Address(1) | | Position(s) and Length of Time Served(2) | | Principal Occupation(s)(3) | | Number of Funds in Fund Complex Overseen by Fund Trustee | | Other Directorships Held Outside Fund Complex by Fund Trustee(3) | |
| Candace L. Straight (1947) | | Trustee since 1999 | | Private investor and consultant specializing in the insurance industry; formerly, Advisory Director, Securitas Capital LLC (a global private equity investment firm dedicated to making investments in the insurance sector), 1998 to December 2003. | | | 50 | | | Public Member, Board of Governors and Board of Trustees, Rutgers University, since 2011; Director, Montpelier Re Holdings Ltd. (reinsurance company), since 2006; formerly, Director, National Atlantic Holdings Corporation (property and casualty insurance company), 2004 to 2008; formerly, Director, The Proformance Insurance Company (property and casualty insurance company), 2004 to 2008; formerly, Director, Providence Washington Insurance Company (property and casualty insurance company), 1998 to 2006; formerly, Director, Summit Global Partners (insurance brokerage firm), 2000 to 2005. | |
| Peter P. Trapp (1944) | | Trustee since 1984 | | Retired; formerly, Regional Manager for Mid-Southern Region, Ford Motor Credit Company, September 1997 to 2007; formerly, President, Ford Life Insurance Company, April 1995 to August 1997. | | | 50 | | | None. | |
30
Name, (Year of Birth), and Address(1) | | Position(s) and Length of Time Served(2) | | Principal Occupation(s)(3) | | Number of Funds in Fund Complex Overseen by Fund Trustee | | Other Directorships Held Outside Fund Complex by Fund Trustee(3) | |
| Fund Trustees who are "Interested Persons" | |
| Joseph V. Amato* (1962) | | Trustee since 2009 | | President and Director, Neuberger Berman Group LLC, since 2009; President and Chief Executive Officer, Neuberger and Neuberger Berman Holdings LLC (including its predecessor, Neuberger Berman Inc.), since 2007; Chief Investment Officer, Neuberger, since 2009; Chief Investment Officer (Equities) and Managing Director, Management, since 2009; Managing Director, NBFI, since 2007; Board member of NBFI since 2006; formerly, Global Head of Asset Management of Lehman Brothers Holdings Inc.'s ("LBHI") Investment Management Division, 2006 to 2009; formerly, member of LBHI's Investment Management Division's Executive Management Committee, 2006 to 2009; formerly, Managing Director, Lehman Brothers Inc. ("LBI"), 2006 to 2008; formerly, Chief Recruiting and Development Officer, LBI, 2005 to 2006; formerly, Global Head of LBI's Equity Sales and a Member of its Equities Division Executive Committee, 2003 to 2005. | | | 50 | | | Member of Board of Advisors, McDonough School of Business, Georgetown University, since 2001; Member of New York City Board of Advisors, Teach for America, since 2005; Trustee, Montclair Kimberley Academy (private school), since 2007. | |
31
Name, (Year of Birth), and Address(1) | | Position(s) and Length of Time Served(2) | | Principal Occupation(s)(3) | | Number of Funds in Fund Complex Overseen by Fund Trustee | | Other Directorships Held Outside Fund Complex by Fund Trustee(3) | |
| Robert Conti* (1956) | | Chief Executive Officer, President and Trustee since 2008; prior thereto, Executive Vice President in 2008 and Vice President 2000 to 2008 | | Managing Director, Neuberger, since 2007; formerly, Senior Vice President, Neuberger, 2003 to 2006; formerly, Vice President, Neuberger, 1999 to 2003; President and Chief Executive Officer, Management, since 2008; formerly, Senior Vice President, Management, 2000 to 2008; Managing Director, NBFI, since 2009. | | | 50 | | | Director, Staten Island Mental Health Society, since 1994; formerly, Chairman of the Board, Staten Island Mental Health Society, 2008 to 2011. | |
(1) The business address of each listed person is 605 Third Avenue, New York, New York 10158.
(2) Pursuant to the Trust's Trust Instrument, each of these Fund Trustees shall hold office for life or until his or her successor is elected or the Trust terminates; except that (a) any Fund Trustee may resign by delivering a written resignation; (b) any Fund Trustee may be removed with or without cause at any time by a written instrument signed by at least two-thirds of the other Fund Trustees; (c) any Fund Trustee who requests to be retired, or who has become unable to serve, may be retired by a written instrument signed by a majority of the other Fund Trustees; and (d) any Fund Trustee may be removed at any shareholder meeting by a vote of at least two-thirds of the outstanding shares.
(3) Except as otherwise indicated, each individual has held the positions shown for at least the last five years.
* Indicates a Fund Trustee who is an "interested person" within the meaning of the 1940 Act. Mr. Amato and Mr. Conti are interested persons of the Trust by virtue of the fact that each is an officer of Management, Neuberger and/or their affiliates.
32
Information about the Officers of the Trust
Name, (Year of Birth), and Address(1) | | Position(s) and Length of Time Served(2) | | Principal Occupation(s)(3) | |
| Andrew B. Allard (1961) | | Chief Legal Officer since 2013 (only for purposes of sections 307 and 406 of the Sarbanes-Oxley Act of 2002) and Anti-Money Laundering Compliance Officer since 2002 | | Senior Vice President, Neuberger, since 2006 and Employee since 1999; Deputy General Counsel, Neuberger, since 2004; formerly, Vice President, Neuberger, 2000 to 2005; formerly, Employee, Management, 1994 to 1999; Chief Legal Officer since 2013 (only for purposes of sections 307 and 406 of the Sarbanes-Oxley Act of 2002) and Anti-Money Laundering Compliance Officer since 2002, nine registered investment companies for which Management acts as investment manager and administrator (six since 2002, one since 2003, one since 2005 and one since 2006). | |
| Claudia A. Brandon (1956) | | Executive Vice President since 2008 and Secretary since 1985 | | Senior Vice President, Neuberger, since 2007 and Employee since 1999; Senior Vice President, Management, since 2008 and Assistant Secretary since 2004; formerly, Vice President, Neuberger, 2002 to 2006; formerly, Vice President—Mutual Fund Board Relations, Management, 2000 to 2008; formerly, Vice President, Management, 1986 to 1999 and Employee 1984 to 1999; Executive Vice President, nine registered investment companies for which Management acts as investment manager and administrator (nine since 2008); Secretary, nine registered investment companies for which Management acts as investment manager and administrator (three since 1985, three since 2002, one since 2003, one since 2005 and one since 2006). | |
| Anthony DiBernardo (1979) | | Assistant Treasurer since 2011 | | Vice President, Neuberger, since 2009; Employee, Management, since 2003; Assistant Treasurer, nine registered investment companies for which Management acts as investment manager and administrator (nine since 2011). | |
| Sheila R. James (1965) | | Assistant Secretary since 2002 | | Vice President, Neuberger, since 2008 and Employee since 1999; formerly, Assistant Vice President, Neuberger, 2007; formerly, Employee, Management, 1991 to 1999; Assistant Secretary, nine registered investment companies for which Management acts as investment manager and administrator (six since 2002, one since 2003, one since 2005 and one since 2006). | |
| Brian Kerrane (1969) | | Vice President since 2008 | | Senior Vice President, Neuberger, since 2006; formerly, Vice President, Neuberger, 2002 to 2006; Vice President, Management, since 2008 and Employee since 1991; Vice President, nine registered investment companies for which Management acts as investment manager and administrator (nine since 2008). | |
33
Name, (Year of Birth), and Address(1) | | Position(s) and Length of Time Served(2) | | Principal Occupation(s)(3) | |
| Kevin Lyons (1955) | | Assistant Secretary since 2003 | | Assistant Vice President, Neuberger, since 2008 and Employee since 1999; formerly, Employee, Management, 1993 to 1999; Assistant Secretary, nine registered investment companies for which Management acts as investment manager and administrator (seven since 2003, one since 2005 and one since 2006). | |
| Owen F. McEntee, Jr. (1961) | | Vice President since 2008 | | Vice President, Neuberger, since 2006; Employee, Management, since 1992; Vice President, nine registered investment companies for which Management acts as investment manager and administrator (nine since 2008). | |
| John M. McGovern (1970) | | Treasurer and Principal Financial and Accounting Officer since 2005 | | Senior Vice President, Neuberger, since 2007; formerly, Vice President, Neuberger, 2004 to 2006; Employee, Management, since 1993; Treasurer and Principal Financial and Accounting Officer, nine registered investment companies for which Management acts as investment manager and administrator (eight since 2005 and one since 2006); formerly, Assistant Treasurer, eight registered investment companies for which Management acts as investment manager and administrator, 2002 to 2005. | |
| Frank Rosato (1971) | | Assistant Treasurer since 2005 | | Vice President, Neuberger, since 2006; Employee, Management, since 1995; Assistant Treasurer, nine registered investment companies for which Management acts as investment manager and administrator (eight since 2005 and one since 2006). | |
| Neil S. Siegel (1967) | | Vice President since 2008 | | Managing Director, Management, since 2008; Managing Director, Neuberger, since 2006; formerly, Senior Vice President, Neuberger, 2004 to 2006; Vice President, nine registered investment companies for which Management acts as investment manager and administrator (nine since 2008). | |
| Chamaine Williams (1971) | | Chief Compliance Officer since 2005 | | Senior Vice President, Neuberger, since 2007; Chief Compliance Officer, Management, since 2006; Chief Compliance Officer, nine registered investment companies for which Management acts as investment manager and administrator (eight since 2005 and one since 2006); formerly, Senior Vice President, LBI, 2007 to 2008; formerly, Vice President, LBI, 2003 to 2006; formerly, Chief Compliance Officer, Lehman Brothers Asset Management Inc., 2003 to 2007; formerly, Chief Compliance Officer, Lehman Brothers Alternative Investment Management LLC, 2003 to 2007. | |
(1) The business address of each listed person is 605 Third Avenue, New York, New York 10158.
(2) Pursuant to the By-Laws of the Trust, each officer elected by the Fund Trustees shall hold office until his or her successor shall have been elected and qualified or until his or her earlier death, inability to serve, or resignation. Officers serve at the pleasure of the Fund Trustees and may be removed at any time with or without cause.
(3) Except as otherwise indicated, each individual has held the positions shown for at least the last five years.
34
Proxy Voting Policies and Procedures
A description of the policies and procedures that the Trust uses to determine how to vote proxies relating to portfolio securities is available, without charge, by calling 1-800-877-9700 (toll-free) and on the website of the Securities and Exchange Commission, at www.sec.gov. Information regarding how the Trust voted proxies relating to portfolio securities during the most recent 12-month period ended June 30 is also available, without charge, by calling 1-800-877-9700 (toll-free), on the website of the Securities and Exchange Commission at www.sec.gov, and on Management's website at www.nb.com.
Quarterly Portfolio Schedule
The Trust files a complete schedule of portfolio holdings for the Fund with the Securities and Exchange Commission for the first and third quarters of each fiscal year on Form N-Q. The Trust's Forms N-Q are available on the Securities and Exchange Commission's website at www.sec.gov and may be reviewed and copied at the Securities and Exchange Commission's Public Reference Room in Washington, DC. Information on the operation of the Public Reference Room may be obtained by calling 1-800-SEC-0330. The information on Form N-Q is available upon request, without charge, by calling 1-800-877-9700 (toll free).
Board Consideration of the Management and Sub-Advisory Agreements
At a meeting held on October 25, 2012, the Board of Trustees of Neuberger Berman Advisers Management Trust ("Board"), including the Trustees who are not "interested persons" of Management (including its affiliates) or Neuberger Berman Advisers Management Trust ("Independent Fund Trustees"), approved the continuance of the Management and Sub-Advisory Agreements ("Agreements") for Balanced Portfolio ("Fund").
In evaluating the Agreements, the Board, including the Independent Fund Trustees, reviewed materials furnished by Management in response to questions submitted by counsel for the Independent Fund Trustees, and met with senior representatives of Management regarding their personnel, operations and financial conditions as they relate to the Fund. The Independent Fund Trustees were advised by counsel that is experienced in Investment Company Act of 1940 matters and that is independent of Management. The Independent Fund Trustees received a memorandum from independent counsel discussing the legal standards for their consideration of the proposed continuance of the Agreements. They met with such counsel separately from representatives of Management to discuss the annual contract review. The annual contract review extends over three regular meetings of the Board, including one meeting devoted primarily to reviewing and discussing Fund performance, to ensure that Management has time to respond to any questions the Independent Fund Trustees may have on their initial review of the report and that the Independent Fund Trustees have time to consider those responses.
The Board considered the following factors, among others, in connection with its approval of the continuance of the Agreements: (1) the nature, extent, and quality of the services provided by Management and Neuberger; (2) the performance of the Fund compared to a relevant market index and a peer group of investment companies; (3) the costs of the services provided and profits or losses realized by Management and its affiliates from their relationship with the Fund; (4) the extent to which economies of scale might be realized as the Fund grows; and (5) whether fee levels reflect any such potential economies of scale for the benefit of investors in the Fund. In their deliberations, the Board members did not identify any particular information that was all-important or controlling, and each Trustee may have attributed different weights to the various factors.
The Board evaluated the terms of the Agreements, the overall fairness of the Agreements to the Fund and whether the Agreements were in the best interests of the Fund and its shareholders.
With respect to the nature, extent and quality of the services provided, the Board considered the performance of the Fund and the experience and staffing of the portfolio management personnel of Management and Neuberger who perform services for the Fund. The Board noted that Management also provides certain administrative services,
35
including fund accounting and compliance oversight. The Board also considered Management's and Neuberger's policies and practices regarding brokerage and allocation of portfolio transactions by Management. The Board's Portfolio Transactions and Pricing Committee from time to time reviewed the quality of the execution services that Management and Neuberger had provided, and periodically reviewed studies by an independent firm engaged to review and evaluate the quality of brokerage execution received by the Fund. The Board also reviewed whether Management and Neuberger used brokers to execute Fund transactions that provide research and other services to Management and Neuberger, and the types of benefits potentially derived from such services by Management, Neuberger, the Fund and other clients of Management and Neuberger. In addition, the Board noted the positive compliance history of Management and Neuberger, as each firm has been free of significant reported compliance problems. As in past years, the Board also considered the manner in which Management addressed various non-routine matters that arose during the year, some of them a result of developments in the broader fund industry or the regulations governing it.
The Board considered the performance of the Fund relative to its benchmark and the average performance of composite peer groups of investment companies pursuing broadly similar strategies. The Board also reviewed performance during the period in relation to certain measures of the degree of investment risk undertaken by the portfolio managers. The Board discussed with Management the Fund's performance and steps that Management had under consideration to improve performance. The Board also considered Management's resources and responsiveness with respect to the Fund.
With respect to the overall fairness of the Agreements, the Board considered the fee structure for the Fund under the Agreements and any fall-out benefits likely to accrue to Management or Neuberger or their affiliates from their relationship with the Fund. The Board also considered the contractual limit on Fund expenses undertaken by Management. With regard to the sub-advisory fee paid to Neuberger, the Board noted that this fee is "at cost." In addition, the Board considered the profitability of Management and its affiliates from their association with the Fund and noted that Management incurred a loss on the Fund.
The Board considered whether there were other funds that were advised or sub-advised by Management or its affiliates or separate accounts managed by Management or its affiliates with investment objectives, policies and strategies that were similar to the Fund. If so, the Board compared the fees charged to the Fund to the fees charged to any such other funds and/or separate accounts. The Board considered the appropriateness and reasonableness of any differences between the fees charged to the Fund and any such other funds and/or separate accounts and determined that the differences in fees were consistent with the management and other services provided.
The Board also evaluated any apparent or anticipated economies of scale in relation to the services Management provides to the Fund. The Board considered whether the Fund's fee structure provides for a reduction of payments resulting from the use of breakpoints and whether those breakpoints are set at appropriate asset levels. In concluding that the benefits accruing to Management and its affiliates by virtue of their relationship to the Fund were reasonable in comparison with the costs of providing the investment advisory and other services and the benefits accruing to the Fund, the Board reviewed specific data as to Management's loss on the Fund for a recent period. The Board also carefully examined Management's cost allocation methodology.
Conclusions
In approving the Agreements, the Board concluded that the terms of each Agreement are fair and reasonable and that approval of the Agreements is in the best interests of the Fund and its shareholders. In reaching this determination, the Board considered that Management and Neuberger could be expected to provide a high level of service to the Fund; that it retained confidence in Management's and Neuberger's capabilities to manage the Fund; that the Fund's fee structure appeared to the Board to be reasonable given the nature and quality of services provided; and that the benefits accruing to Management and its affiliates by virtue of their relationship to the Fund were reasonable in comparison with the benefits accruing to the Fund.
36
Neuberger Berman
Advisers Management Trust
Growth Portfolio
I Class Shares
Annual Report
December 31, 2012
B1015 02/13
Growth Portfolio Commentary (Unaudited)
The Neuberger Berman Advisers Management Trust (AMT) Growth Portfolio Class I generated a 12.60% total return for the fiscal year ended December 31, 2012, but underperformed its benchmark, the Russell Midcap® Growth Index, which returned 15.81% for the same period.
The down-to-the-wire fiscal cliff negotiations and resulting deal were a fitting end to a year plagued by political acrimony and economic uncertainty. While the hard fought, but ultimately underwhelming, compromise does address several pertinent tax and entitlement issues, we believe this "not so grand bargain" falls far short of addressing the broader issues around our country's debt ceiling, budget imbalance and credit rating. From our perspective, the risk was never really about going over the cliff, but rather the failure to reach a comprehensive and forward-thinking solution in a reasonable period of time. Unfortunately, that risk still remains.
While confidence may have ebbed a bit during the year, consumer resiliency and sustainable gains in housing remained bright spots. With fiscal austerity looming, in our assessment the clear prescription for a healthier economy remains a rebound in corporate spending. However, ongoing concerns around the health of Europe's economies, China's growth engine and our government's fiscal game of chicken continue to foster a sub-optimal level of capital reinvestment that could risk competitiveness.
Setting aside the dysfunctional nature of Congress and the seemingly perpetual "walls of worry," it is important to remember that 2012 actually hosted a positive environment for equities. Highlighted by attractive valuations, solid earnings and efficient bottom-lines, the market rewarded the patience of domestic equity investors with attractive returns overall.
For the year as a whole, stock selection was the main driver of Portfolio underperformance versus the benchmark. With a "shoot first, ask questions later" mentality, we feel the market adopted an over reactionary stance to any fundamental softening.
The leading contributor to performance was SBA Communications, an owner and operator of wireless communications towers. SBA benefited from strong top-line growth and better than expected guidance. A few health care names were also top contributors, including Catalyst Health Solutions, a provider of pharmacy benefit management services, which stood out as it agreed to be acquired by another portfolio holding, SXC Health Solutions (which was later renamed Catamaran Corp. after the merger was completed), and Alexion Pharmaceuticals, a biotech company focused on rare, life-threatening disease states that was rewarded for its successful international rollout and positive early stage testing for new drug indications.
Within Information Technology, strong contributions came from Trimble Navigation, a provider of advanced positioning and resource management solutions that delivered efficiency gains and encouraging guidance during the fourth quarter, as well as Rackspace Hosting, a provider of cloud hosting services that successfully launched a new product that the market expects will provide momentum going into 2013.
Information Technology was also the source of three leading detractors from performance. Finisar Corporation, a provider of data network optical subsystems and components, lagged as an anticipated rebound in telecommunication spending failed to materialize. QLIK Technologies and Informatica Corporation, both business intelligence/information data companies, were negatively impacted by poor execution and concerns over Europe.
Our Energy holdings struggled as downward pressure on prices and demand hurt both SM Energy, focused on-shore exploration and production, and CARBO Ceramics, a producer of hydraulic fracturing ceramic proppant.
Within Consumer Discretionary, PVH Corp., an apparel company with various owned and licensed brands, delivered solid international results and a well-received acquisition of another portfolio holding, Warnaco Group. Unfortunately, this positive couldn't offset underperformance from other Consumer Discretionary names such as Vera Bradley, a designer and retailer of handbags and accessories that was plagued by poor execution, and Chipotle Mexican Grill, an operator of over 1,200 restaurants, which tempered future guidance and proposed an unexpected change in
1
organizational structure. Additionally, Gentex Corporation, a supplier of camera-based features and specialty rear-view mirrors, was the Portfolio's leading detractor from performance as it was negatively impacted by delays in the implementation of a mandate requiring cars to have back-up cameras.
With the exception of Informatica, we sold all the aforementioned detractors during the year.
Based on our expectations for 2013, our current view is that we are likely to remain overweighted in Industrials, Information Technology and Telecommunication Services and underweighted in Consumer Discretionary, Consumer Staples and Materials.
As we look ahead into the New Year, we just can't quite shake that feeling of déjà vu. We are once again faced with dire deadlines complicated by substantial ideological differences, an acrimonious political environment and an appalling disregard for effective political compromise. While the confidence and market gains from the fiscal cliff deal may prove fleeting, we feel it is important to remember a lesson of 2012—don't underestimate the resiliency of both our economy and the financial markets. We believe valuations are reasonable at this time and that higher-quality companies offering competitive attributes, along with compelling top-line growth that efficiently translates through to the bottom line, may well be rewarded by a market seeking positive differentiation. To that end, and in spite of the uncertainty that lies ahead, we remain cautiously optimistic that 2013 can be another positive year for mid-cap equities.
Sincerely,
KENNETH J. TUREK
PORTFOLIO MANAGER
Information about the principal risks of investing in the Portfolio is set forth in the prospectus and statement of additional information.
The portfolio composition, industries and holdings of the Portfolio are subject to change.
Opinions expressed are as of the date herein and are subject to change without notice. This material is not intended to be a formal research report and should not be construed as an offer to sell or the solicitation of an offer to buy any security.
2
Growth Portfolio (Unaudited)
SECTOR ALLOCATION
| (as a % of Total Investments) | |
| Consumer Discretionary | | | 17.5 | % | |
| Consumer Staples | | | 4.3 | | |
| Energy | | | 6.2 | | |
| Financials | | | 5.9 | | |
| Health Care | | | 13.7 | | |
| Industrials | | | 22.3 | | |
| Information Technology | | | 21.3 | | |
| Materials | | | 3.7 | | |
| Telecommunication Services | | | 4.2 | | |
| Short-Term Investments | | | 0.9 | | |
| Total | | | 100.0 | % | |
PERFORMANCE HIGHLIGHTS
| | | Inception | | Average Annual Total Return Ended 12/31/2012 | |
| | | Date | | 1 Year | | 5 Years | | 10 Years | | Life of Fund | |
Growth Portfolio Class I | | 09/10/1984 | | | 12.60 | % | | | 1.62 | % | | | 10.18 | % | | | 8.85 | % | |
Russell Midcap® Growth Index1,2 | | | | | 15.81 | % | | | 3.23 | % | | | 10.32 | % | | | N/A | | |
Russell Midcap® Index1,2 | | | | | 17.28 | % | | | 3.57 | % | | | 10.65 | % | | | 12.07 | % | |
The performance data quoted represent past performance and do not indicate future results. Current performance may be lower or higher than the performance data quoted. For more current performance data, please visit www.nb.com.
The results shown in the table reflect the reinvestment of income dividends and other distributions, if any. The results do not reflect the effect of taxes a shareholder would pay on Portfolio distributions or on the redemption of Portfolio shares. The results do not reflect fees and expenses of the variable annuity and variable life insurance policies or the qualified pension and retirement plans whose proceeds are invested in the Portfolio.
The investment return and principal value of an investment will fluctuate and shares, when redeemed, may be worth more or less than their original cost.
Returns would have been lower if Neuberger Berman Management LLC ("Management") had not reimbursed certain expenses and/or waived a portion of the investment management fees during certain of the periods shown. Repayment by a class (of expenses previously reimbursed and/or fees previously waived by Management) will decrease the class's returns. Please see Note B in the Notes to Financial Statements for specific information regarding expense reimbursement and/or fee waiver arrangements.
COMPARISON OF A $10,000 INVESTMENT
This graph shows the change in value of a hypothetical $10,000 investment in the Portfolio over the past 10 fiscal years, or since the Portfolio's inception if it has not operated for 10 years. The result is compared with benchmarks, which include a broad-based market index and may include a more narrowly based index. Market indices have not been reduced to reflect any of the fees and costs of investing. The results shown in the graph reflect the reinvestment of income dividends and other distributions, if any. The results do not reflect the effect of taxes a shareholder would pay on Portfolio distributions or on the redemption of Portfolio shares. Results represent past performance and do not indicate future results.
Please see Endnotes for additional information.
3
Endnotes (Unaudited)
1 The date used to calculate Life of Fund performance for the index is the inception date of the oldest share class.
2 The Russell Midcap® Growth Index measures the performance of those Russell Midcap® Index companies with higher price-to-book ratios and higher forecasted growth values. The Russell Midcap Index measures the performance of the 800 smallest companies in the Russell 1000® Index, which represents approximately 31% of the total market capitalization of the Russell 1000 Index (which, in turn, consists of the 1,000 largest U.S. companies, based on market capitalization). Please note that indices do not take into account any fees, expenses or tax consequences of investing in the individual securities that they track, and that individuals cannot invest directly in any index. Data about the performance of an index is prepared or obtained by Neuberger Berman Management LLC ("Management") and reflects the reinvestment of income dividends and other distributions, if any. The Portfolio may invest in securities not included in a described index and/or may not invest in all securities included in a described index.
Any ratios or other measurements using a factor of forecasted earnings of a company discussed herein are based on consensus estimates, not Management's own projections, and they may or may not be realized. In addition, any revision to a forecast could affect the market price of a security. By quoting them herein, Management does not offer an opinion as to the accuracy of and does not guarantee these forecasted numbers.
The investments for the Portfolio are managed by the same portfolio manager(s) who manage(s) one or more other registered funds that have names, investment objectives and investment styles that are similar to those of the Portfolio. You should be aware that the Portfolio is likely to differ from the other mutual fund(s) in size, cash flow pattern and tax matters. Accordingly, the holdings and performance of the Portfolio can be expected to vary from those of the other mutual fund(s).
Shares of the separate AMT Portfolios are not available to the general public. Shares of this Portfolio may be purchased only by life insurance companies to be used with their separate accounts that fund variable annuity and variable life insurance policies and by qualified pension and retirement plans.
Statistics and projections in this report are derived from sources deemed to be reliable but cannot be regarded as a representation of future results of the AMT Portfolios. This report is prepared for the general information of shareholders and is not an offer of shares of the AMT Portfolios. Shares of the AMT Portfolios are sold only through the currently effective prospectuses, which must precede or accompany this report.
The "Neuberger Berman" name and logo are registered service marks of Neuberger Berman Group LLC. "Neuberger Berman Management LLC" and the individual Fund name in this piece are either service marks or registered service marks of Neuberger Berman Management LLC.
© 2013 Neuberger Berman Management LLC distributor. All rights reserved.
4
Information About Your Fund's Expenses (Unaudited)
As a Fund shareholder, you incur two types of costs: (1) transaction costs such as fees and expenses that are, or may be, imposed under your variable contract or qualified pension plan; and (2) ongoing costs, including management fees; distribution and/or service (12b-1) fees (if applicable); and other Fund expenses. This example is intended to help you understand your ongoing costs (in dollars) of investing in the Fund and compare these costs with the ongoing costs of investing in other mutual funds.
This table is designed to provide information regarding costs related to your investments. The following examples are based on an investment of $1,000 made at the beginning of the six month period ended December 31, 2012 and held for the entire period. The table illustrates the Fund's costs in two ways:
| Actual Expenses and Performance: | | The first section of the table provides information about actual account values and actual expenses in dollars, based on the Fund's actual performance during the period. You may use the information in this line, together with the amount you invested, to estimate the expenses you paid over the period. Simply divide your account value by $1,000 (for example, an $8,600 account value divided by $1,000 = 8.6), then multiply the result by the number in the first section of the table under the heading entitled "Expenses Paid During the Period" to estimate the expenses you paid over the period. | |
| Hypothetical Example for Comparison Purposes: | | The second section of the table provides information about hypothetical account values and hypothetical expenses based on the Fund's actual expense ratio and an assumed rate of return at 5% per year before expenses. This return is not the Fund's actual return. The hypothetical account values and expenses may not be used to estimate the actual ending account balance or expenses you paid for the period. You may use this information to compare the ongoing costs of investing in this Fund versus other funds. To do so, compare the expenses shown in this 5% hypothetical example with the 5% hypothetical examples that appear in the shareholder reports of other funds. | |
Please note that the expenses in the table are meant to highlight your ongoing costs only and do not include any transaction costs, such as fees and expenses that are, or may be imposed under your variable contract or qualified pension plan. Therefore, the information under the heading "Hypothetical (5% annual return before expenses)" is useful in comparing ongoing costs only, and will not help you determine the relative total costs of owning different funds. In addition, if these transaction costs were included, your costs would have been higher.
Expense Information as of 12/31/12
NEUBERGER BERMAN ADVISERS MANAGEMENT TRUST GROWTH PORTFOLIO
| Actual | | Beginning Account Value 7/1/12 | | Ending Account Value 12/31/12 | | Expenses Paid During the Period* 7/1/12 – 12/31/12 | |
| Class I | | $ | 1,000.00 | | | $ | 1,032.60 | | | $ | 9.45 | | |
| Hypothetical (5% annual return before expenses)** | | | | | |
| Class I | | $ | 1,000.00 | | | $ | 1,015.84 | | | $ | 9.37 | | |
* Expenses are equal to the annualized expense ratio of 1.85%, multiplied by the average account value over the period, multiplied by 184/366 (to reflect the one-half year period shown).
** Hypothetical 5% annual return before expenses is calculated by multiplying the number of days in the most recent half year divided by 366.
5
Schedule of Investments Growth Portfolio
| NUMBER OF SHARES | | | | VALUE† | |
| Common Stocks (100.2%) | | | |
| Aerospace & Defense (2.5%) | | | |
| | 1,900 | | | BE Aerospace, Inc. | | $ | 93,860 | * | |
| | 1,875 | | | HEICO Corp. | | | 83,925 | | |
| | | | 177,785 | | |
| Beverages (0.8%) | | | |
| | 1,000 | | | Beam, Inc. | | | 61,090 | | |
| Biotechnology (4.4%) | | | |
| | 1,250 | | | Alexion Pharmaceuticals, Inc. | | | 117,262 | * | |
| | 1,250 | | | ARIAD Pharmaceuticals, Inc. | | | 23,975 | * | |
| | 500 | | | BioMarin Pharmaceutical, Inc. | | | 24,625 | * | |
| | 1,000 | | | Cepheid, Inc. | | | 33,810 | * | |
| | 1,250 | | | Cubist Pharmaceuticals, Inc. | | | 52,575 | * | |
| | 750 | | | Medivation, Inc. | | | 38,370 | * | |
| | 400 | | | Onyx Pharmaceuticals, Inc. | | | 30,212 | * | |
| | | | 320,829 | | |
| Building Products (0.9%) | | | |
| | 2,250 | | | Fortune Brands Home & Security, Inc. | | | 65,745 | * | |
| Capital Markets (2.7%) | | | |
| | 1,000 | | | Affiliated Managers Group, Inc. | | | 130,150 | * | |
| | 1,650 | | | Raymond James Financial, Inc. | | | 63,574 | | |
| | | | 193,724 | | |
| Chemicals (3.0%) | | | |
| | 1,500 | | | Airgas, Inc. | | | 136,935 | | |
| | 1,000 | | | Ashland, Inc. | | | 80,410 | | |
| | | | 217,345 | | |
| Commercial Services & Supplies (2.6%) | | | |
| | 850 | | | Clean Harbors, Inc. | | | 46,759 | * | |
| | 1,500 | | | Stericycle, Inc. | | | 139,905 | * | |
| | | | 186,664 | | |
| Communications Equipment (1.2%) | | | |
| | 1,250 | | | Aruba Networks, Inc. | | | 25,938 | * | |
| | 600 | | | F5 Networks, Inc. | | | 58,290 | * | |
| | | | 84,228 | | |
| Containers & Packaging (0.4%) | | | |
| | 750 | | | Packaging Corp. of America | | | 28,853 | | |
| Distributors (0.3%) | | | |
| | 1,200 | | | LKQ Corp. | | | 25,320 | * | |
| NUMBER OF SHARES | | | | VALUE† | |
| Diversified Financial Services (1.3%) | | | |
| | 750 | | | IntercontinentalExchange, Inc. | | $ | 92,858 | * | |
Diversified Telecommunication Services (0.6%) | | | |
| | 1,750 | | | tw telecom, Inc. | | | 44,573 | * | |
| Electrical Equipment (5.1%) | | | |
| | 3,750 | | | AMETEK, Inc. | | | 140,887 | | |
| | 1,250 | | | Generac Holdings, Inc. | | | 42,888 | | |
| | 1,250 | | | Roper Industries, Inc. | | | 139,350 | | |
| | 1,500 | | | Sensata Technologies Holding NV | | | 48,720 | * | |
| | | | 371,845 | | |
Electronic Equipment, Instruments & Components (2.1%) | | | |
| | 2,500 | | | Trimble Navigation Ltd. | | | 149,450 | * | |
| Energy Equipment & Services (3.1%) | | | |
| | 1,050 | | | Cameron International Corp. | | | 59,283 | * | |
| | 350 | | | Core Laboratories NV | | | 38,259 | | |
| | 750 | | | Oceaneering International, Inc. | | | 40,342 | | |
| | 1,250 | | | Oil States International, Inc. | | | 89,425 | * | |
| | | | 227,309 | | |
| Food & Staples Retailing (2.2%) | | | |
| | 900 | | | PriceSmart, Inc. | | | 69,345 | | |
| | 1,000 | | | Whole Foods Market, Inc. | | | 91,330 | | |
| | | | 160,675 | | |
| Health Care Equipment & Supplies (2.8%) | | | |
| | 600 | | | Cooper Cos., Inc. | | | 55,488 | | |
| | 400 | | | Edwards Lifesciences Corp. | | | 36,068 | * | |
| | 150 | | | Intuitive Surgical, Inc. | | | 73,555 | * | |
| | 1,750 | | | Volcano Corp. | | | 41,318 | * | |
| | | | 206,429 | | |
| Health Care Providers & Services (2.7%) | | | |
| | 2,500 | | | Catamaran Corp. | | | 117,775 | * | |
| | 700 | | | DaVita HealthCare Partners, Inc. | | | 77,371 | * | |
| | | | 195,146 | | |
| Health Care Technology (1.8%) | | | |
| | 1,650 | | | Cerner Corp. | | | 128,106 | * | |
| Hotels, Restaurants & Leisure (1.4%) | | | |
| | 650 | | | Buffalo Wild Wings, Inc. | | | 47,333 | * | |
| | 1,000 | | | Starwood Hotels & Resorts Worldwide, Inc. | | | 57,360 | | |
| | | | 104,693 | | |
See Notes to Schedule of Investments
6
| NUMBER OF SHARES | | | | VALUE† | |
| Household Products (1.3%) | | | |
| | 1,800 | | | Church & Dwight Co., Inc. | | $ | 96,426 | | |
| Internet & Catalog Retail (0.7%) | | | |
| | 800 | | | Expedia, Inc. | | | 49,160 | | |
| Internet Software & Services (3.0%) | | | |
| | 1,750 | | | Liquidity Services, Inc. | | | 71,505 | * | |
| | 2,000 | | | Rackspace Hosting, Inc. | | | 148,540 | * | |
| | | | 220,045 | | |
| IT Services (2.9%) | | | |
| | 600 | | | Alliance Data Systems Corp. | | | 86,856 | * | |
| | 1,250 | | | Cognizant Technology Solutions Corp. Class A | | | 92,562 | * | |
| | 550 | | | Teradata Corp. | | | 34,040 | * | |
| | | | 213,458 | | |
| Life Sciences Tools & Services (1.2%) | | | |
| | 1,550 | | | Illumina, Inc. | | | 86,165 | * | |
| Machinery (2.6%) | | | |
| | 350 | | | Cummins, Inc. | | | 37,922 | | |
| | 2,400 | | | Donaldson Co., Inc. | | | 78,816 | | |
| | 1,250 | | | Pall Corp. | | | 75,325 | | |
| | | | 192,063 | | |
| Media (2.1%) | | | |
| | 1,750 | | | AMC Networks, Inc. Class A | | | 86,625 | * | |
| | 1,000 | | | Discovery Communications, Inc. Class A | | | 63,480 | * | |
| | | | 150,105 | | |
| Metals & Mining (0.4%) | | | |
| | 500 | | | Carpenter Technology Corp. | | | 25,815 | | |
| Multiline Retail (1.0%) | | | |
| | 1,850 | | | Dollar Tree, Inc. | | | 75,036 | * | |
| Oil, Gas & Consumable Fuels (3.1%) | | | |
| | 2,000 | | | Cabot Oil & Gas Corp. | | | 99,480 | | |
| | 450 | | | Concho Resources, Inc. | | | 36,252 | * | |
| | 3,500 | | | Denbury Resources, Inc. | | | 56,700 | * | |
| | 1,000 | | | Oasis Petroleum, Inc. | | | 31,800 | * | |
| | | | 224,232 | | |
| Pharmaceuticals (1.0%) | | | |
| | 700 | | | Perrigo Co. | | | 72,821 | | |
| NUMBER OF SHARES | | | | VALUE† | |
| Professional Services (2.6%) | | | |
| | 1,000 | | | Advisory Board Co. | | $ | 46,790 | * | |
| | 350 | | | Towers Watson & Co. Class A | | | 19,673 | | |
| | 2,400 | | | Verisk Analytics, Inc. Class A | | | 122,400 | * | |
| | | | 188,863 | | |
| Real Estate Management & Development (1.2%) | | | |
| | 1,000 | | | Jones Lang LaSalle, Inc. | | | 83,940 | | |
| Road & Rail (3.2%) | | | |
| | 500 | | | Canadian Pacific Railway Ltd. | | | 50,810 | | |
| | 2,000 | | | J.B. Hunt Transport Services, Inc. | | | 119,420 | | |
| | 750 | | | Kansas City Southern | | | 62,610 | | |
| | | | 232,840 | | |
Semiconductors & Semiconductor Equipment (3.1%) | | | |
| | 1,750 | | | Altera Corp. | | | 60,270 | | |
| | 3,000 | | | Avago Technologies Ltd. | | | 94,980 | | |
| | 2,300 | | | Cavium, Inc. | | | 71,783 | * | |
| | | | 227,033 | | |
| Software (9.2%) | | | |
| | 1,500 | | | ANSYS, Inc. | | | 101,010 | * | |
| | 1,700 | | | Aspen Technology, Inc. | | | 46,988 | * | |
| | 1,500 | | | Citrix Systems, Inc. | | | 98,625 | * | |
| | 550 | | | Concur Technologies, Inc. | | | 37,136 | * | |
| | 1,550 | | | Informatica Corp. | | | 46,996 | * | |
| | 1,650 | | | MICROS Systems, Inc. | | | 70,026 | * | |
| | 1,350 | | | Red Hat, Inc. | | | 71,496 | * | |
| | 500 | | | Salesforce.com, Inc. | | | 84,050 | * | |
| | 1,200 | | | Splunk, Inc. | | | 34,824 | * | |
| | 1,800 | | | TIBCO Software, Inc. | | | 39,618 | * | |
| | 400 | | | Ultimate Software Group, Inc. | | | 37,764 | * | |
| | | | 668,533 | | |
| Specialty Retail (9.3%) | | | |
| | 1,200 | | | Cabela's, Inc. | | | 50,100 | * | |
| | 2,100 | | | Dick's Sporting Goods, Inc. | | | 95,529 | | |
| | 1,250 | | | DSW, Inc. Class A | | | 82,112 | | |
| | 900 | | | O'Reilly Automotive, Inc. | | | 80,478 | * | |
| | 800 | | | PETsMART, Inc. | | | 54,672 | | |
| | 1,300 | | | Ross Stores, Inc. | | | 70,395 | | |
| | 1,000 | | | Tractor Supply Co. | | | 88,360 | | |
| | 2,200 | | | Urban Outfitters, Inc. | | | 86,592 | * | |
| | 1,450 | | | Williams-Sonoma, Inc. | | | 63,467 | | |
| | | | 671,705 | | |
| Textiles, Apparel & Luxury Goods (2.8%) | | | |
| | 600 | | | Lululemon Athletica, Inc. | | | 45,738 | * | |
| | 1,000 | | | PVH Corp. | | | 111,010 | | |
| | 1,000 | | | Under Armour, Inc. Class A | | | 48,530 | * | |
| | | | 205,278 | | |
See Notes to Schedule of Investments
7
| NUMBER OF SHARES | | | | VALUE† | |
| Thrifts & Mortgage Finance (0.9%) | | | |
| | 1,900 | | | Ocwen Financial Corp. | | $ | 65,721 | * | |
| Trading Companies & Distributors (3.1%) | | | |
| | 2,250 | | | Fastenal Co. | | | 105,052 | | |
| | 1,000 | | | MSC Industrial Direct Co., Inc. Class A | | | 75,380 | | |
| | 950 | | | United Rentals, Inc. | | | 43,244 | * | |
| | | | 223,676 | | |
| Wireless Telecommunication Services (3.6%) | | | |
| | 1,500 | | | Crown Castle International Corp. | | | 108,240 | * | |
| | 2,150 | | | SBA Communications Corp. Class A | | | 152,693 | * | |
| | | | 260,933 | | |
| | | | | Total Common Stocks (Cost $4,877,552) | | | 7,276,515 | | |
| Short-Term Investments (0.9%) | | | |
| | 64,073 | | | State Street Institutional Liquid Reserves Fund Institutional Class (Cost $64,073) | | | 64,073 | | |
| | | | | Total Investments (101.1%) (Cost $4,941,625) | | | 7,340,588 | ## | |
| | | | | Liabilities, less cash, receivables and other assets [(1.1%)] | | | (81,150 | ) | |
| | | | | Total Net Assets (100.0%) | | $ | 7,259,438 | | |
See Notes to Schedule of Investments
8
Notes to Schedule of Investments Growth Portfolio
† In accordance with Accounting Standards Codification ("ASC") 820 "Fair Value Measurements and Disclosures" ("ASC 820"), all investments held by Neuberger Berman Advisers Management Trust Growth Portfolio (the "Fund") are carried at the value that Neuberger Berman Management LLC ("Management") believes the Fund would receive upon selling an investment in an orderly transaction to an independent buyer in the principal or most advantageous market for the investment under current market conditions. Various inputs, including the volume and level of activity for the asset or liability in the market, are considered in valuing the Fund's investments, some of which are discussed below. Significant management judgment may be necessary to value investments in accordance with ASC 820.
ASC 820 established a three-tier hierarchy of inputs to create a classification of value measurements for disclosure purposes. The three-tier hierarchy of inputs is summarized in the three broad Levels listed below.
• Level 1 – quoted prices in active markets for identical investments
• Level 2 – other significant observable inputs (including quoted prices for similar investments, interest rates, prepayment speeds, credit risk, amortized cost, etc.)
• Level 3 – significant unobservable inputs (including the Fund's own assumptions in determining the fair value of investments)
The inputs or methodology used for valuing an investment are not necessarily an indication of the risk associated with investing in those securities.
The value of the Fund's investments in equity securities and exchange traded funds, for which market quotations are readily available, is generally determined by Management by obtaining valuations from an independent pricing service based on the latest sale price quoted on a principal exchange or market for that security (Level 1 inputs). Securities traded primarily on the NASDAQ Stock Market are normally valued by the Fund at the NASDAQ Official Closing Price ("NOCP") provided by NASDAQ each business day. The NOCP is the most recently reported price as of 4:00:02 p.m., Eastern time, unless that price is outside the range of the "inside" bid and asked prices (i.e., the bid and asked prices that dealers quote to each other when trading for their own accounts); in that case, NASDAQ will adjust the price to equal the inside bid or asked price, whichever is closer. Because of delays in reporting trades, the NOCP may not be based on the price of the last trade to occur before the market closes. If there is no reported sale of a security on a particular day, the independent pricing service may value the security based on reported market quotations.
Management has developed a process to periodically review information provided by independent pricing services for all types of securities.
Investments in State Street Institutional Liquid Reserves Fund Institutional Class are valued using the fund's daily calculated net asset value per share (Level 2 inputs).
If a valuation is not available from an independent pricing service, or if Management has reason to believe that the valuation received does not represent the amount the Fund might reasonably expect to receive on a current sale in an orderly transaction, the Fund seeks to obtain quotations from principal market makers (generally considered Level 3 inputs). If such quotations are not readily available, the security is valued using methods the Neuberger Berman Advisers Management Trust's Board of Trustees (the "Board") has approved on the belief that they reflect fair value. Numerous factors may be considered when determining the fair value of a security based on Level 2 or 3 inputs, including available analyst, media or other reports, trading in futures or ADRs and whether the issuer of the security being fair valued has other securities outstanding.
The value of the Fund's investments in foreign securities is generally determined using the same valuation methods and inputs as other Fund investments, as discussed above. Foreign security prices expressed in local currency values are translated from the local currency into U.S. dollars using the exchange rates as of 4:00 p.m., Eastern time.
See Notes to Financial Statements
9
Notes to Schedule of Investments Growth Portfolio (cont'd)
The Board has approved the use of Interactive Data Pricing and Reference Data, Inc. ("Interactive") to assist in determining the fair value of foreign equity securities when changes in the value of a certain index suggest that the closing prices on the foreign exchanges may no longer represent the amount that the Fund could expect to receive for those securities or on days when foreign markets are closed and U.S. markets are open. In each of these events, Interactive will provide adjusted prices for certain foreign equity securities using a statistical analysis of historical correlations of multiple factors (Level 2 inputs). In the absence of precise information about the market values of these foreign securities as of the close of the New York Stock Exchange, the Board has determined on the basis of available data that prices adjusted in this way are likely to be closer to the prices the Fund could realize on a current sale than are the prices of those securities established at the close of the foreign markets in which the securities primarily trade.
Fair value prices are necessarily estimates, and there is no assurance that such a price will be at or close to the price at which the security is next quoted or next trades.
The following is a summary, categorized by Level, of inputs used to value the Fund's investments as of December 31, 2012:
| Asset Valuation Inputs | | Level 1 | | Level 2 | | Level 3 | | Total | |
| Investments: | |
| Common Stocks^ | | $ | 7,276,515 | | | $ | — | | | $ | — | | | $ | 7,276,515 | | |
| Short-Term Investments | | | — | | | | 64,073 | | | | — | | | | 64,073 | | |
| Total Investments | | $ | 7,276,515 | | | $ | 64,073 | | | $ | — | | | $ | 7,340,588 | | |
^ The Schedule of Investments provides information on the industry categorization for the portfolio.
The Fund had no transfers between Levels 1 and 2 during the year ended December 31, 2012.
## At December 31, 2012, the cost of investments for U.S. federal income tax purposes was $4,948,788. Gross unrealized appreciation of investments was $2,475,368 and gross unrealized depreciation of investments was $83,568, resulting in net unrealized appreciation of $2,391,800, based on cost for U.S. federal income tax purposes.
* Security did not produce income during the last twelve months.
See Notes to Financial Statements
10
Statement of Assets and Liabilities
Neuberger Berman Advisers Management Trust
| | | GROWTH PORTFOLIO | |
| | | December 31, 2012 | |
| Assets | |
| Investments in securities, at value* (Note A)—see Schedule of Investments: | |
| Unaffiliated issuers | | $ | 7,340,588 | | |
| Dividends and interest receivable | | | 387 | | |
| Receivable for securities sold | | | 19,980 | | |
| Receivable for Fund shares sold | | | 595 | | |
| Receivable from Management—net (Note B) | | | 437 | | |
| Prepaid expenses and other assets | | | 4,778 | | |
| Total Assets | | | 7,366,765 | | |
| Liabilities | |
| Payable for securities purchased | | | 30,571 | | |
| Payable for Fund shares redeemed | | | 22,603 | | |
| Payable to investment manager (Note B) | | | 3,374 | | |
| Accrued expenses and other payables | | | 50,779 | | |
| Total Liabilities | | | 107,327 | | |
| Net Assets | | $ | 7,259,438 | | |
| Net Assets consist of: | |
| Paid-in capital | | $ | 14,168,027 | | |
| Accumulated net realized gains (losses) on investments | | | (9,307,552 | ) | |
| Net unrealized appreciation (depreciation) in value of investments | | | 2,398,963 | | |
| Net Assets | | $ | 7,259,438 | | |
| Shares Outstanding ($.001 par value; unlimited shares authorized) | | | 347,246 | | |
| Net Asset Value, offering and redemption price per share | | $ | 20.91 | | |
| * Cost of Investments | | $ | 4,941,625 | | |
See Notes to Financial Statements
11
Statement of Operations
Neuberger Berman Advisers Management Trust
| | | GROWTH PORTFOLIO | |
| | | For the Year Ended December 31, 2012 | |
| Investment Income: | |
| Income (Note A): | |
| Dividend income—unaffiliated issuers | | $ | 51,513 | | |
| Interest income—unaffiliated issuers | | | 74 | | |
| Foreign taxes withheld | | | (184 | ) | |
| Total income | | $ | 51,403 | | |
| Expenses: | |
| Investment management fees (Note B) | | | 41,265 | | |
| Administration fees (Note B) | | | 22,508 | | |
| Audit fees | | | 43,535 | | |
| Custodian fees | | | 13,677 | | |
| Insurance expense | | | 549 | | |
| Legal fees | | | 3,819 | | |
| Shareholder reports | | | 14,845 | | |
| Trustees' fees and expenses | | | 50,751 | | |
| Miscellaneous | | | 558 | | |
| Total expenses | | | 191,507 | | |
| Expenses reimbursed by Management (Note B) | | | (52,518 | ) | |
| Expenses reduced by custodian fee expense offset arrangement (Note A) | | | (1 | ) | |
| Total net expenses | | | 138,988 | | |
| Net investment income (loss) | | $ | (87,585 | ) | |
| Realized and Unrealized Gain (Loss) on Investments (Note A): | |
| Net realized gain (loss) on: | |
| Sales of investment securities of unaffiliated issuers | | | 976,570 | | |
| Change in net unrealized appreciation (depreciation) in value of: | |
| Unaffiliated investment securities | | | 15,446 | | |
| Net gain (loss) on investments | | | 992,016 | | |
| Net increase (decrease) in net assets resulting from operations | | $ | 904,431 | | |
See Notes to Financial Statements
12
Statements of Changes in Net Assets
Neuberger Berman Advisers Management Trust
| | | GROWTH PORTFOLIO | |
| | | Year Ended December 31, 2012 | | Year Ended December 31, 2011 | |
| Increase (Decrease) in Net Assets: | |
| From Operations (Note A): | |
| Net investment income (loss) | | $ | (87,585 | ) | | $ | (111,529 | ) | |
| Net realized gain (loss) on investments | �� | | 976,570 | | | | 1,042,902 | | |
| Change in net unrealized appreciation (depreciation) of investments | | | 15,446 | | | | (909,812 | ) | |
| Net increase (decrease) in net assets resulting from operations | | | 904,431 | | | | 21,561 | | |
| From Fund Share Transactions (Note D): | |
| Proceeds from shares sold | | | 262,265 | | | | 434,595 | | |
| Payments for shares redeemed | | | (1,208,110 | ) | | | (1,627,031 | ) | |
| Net increase (decrease) from Fund share transactions | | | (945,845 | ) | | | (1,192,436 | ) | |
| Net Increase (Decrease) in Net Assets | | | (41,414 | ) | | | (1,170,875 | ) | |
| Net Assets: | |
| Beginning of year | | | 7,300,852 | | | | 8,471,727 | | |
| End of year | | $ | 7,259,438 | | | $ | 7,300,852 | | |
| Undistributed net investment income (loss) at end of year | | $ | — | | | $ | — | | |
See Notes to Financial Statements
13
Notes to Financial Statements Growth Portfolio
Note A—Summary of Significant Accounting Policies:
1 General: Neuberger Berman Advisers Management Trust (the "Trust") is a Delaware statutory trust organized pursuant to a Trust Instrument dated May 23, 1994. The Trust is currently comprised of ten separate operating series (each individually a "Series," and collectively the "Funds") each of which is diversified. The Trust is registered as an open-end management investment company under the Investment Company Act of 1940, as amended (the "1940 Act"), and its shares are registered under the Securities Act of 1933, as amended. The Fund currently offers only Class I shares. The Board may establish additional series or classes of shares without the approval of shareholders.
The assets of each Series belong only to that Series, and the liabilities of each Series are borne solely by that Series and no other.
The preparation of financial statements in accordance with U.S. generally accepted accounting principles ("GAAP") requires Management to make estimates and assumptions at the date of the financial statements. Actual results could differ from those estimates.
2 Portfolio valuation: Investment securities are valued as indicated in the notes following the Schedule of Investments.
3 Foreign currency translation: The accounting records of the Fund are maintained in U.S. dollars. Foreign currency amounts are translated into U.S. dollars using the exchange rate as of 4:00 p.m., Eastern Time, to determine the value of investments, other assets and liabilities. Purchase and sale prices of securities, and income and expenses, are translated into U.S. dollars at the prevailing rate of exchange on the respective dates of such transactions. Net unrealized foreign currency gain (loss), if any, arises from changes in the value of assets and liabilities, other than investments in securities, as a result of changes in exchange rates and is stated separately in the Statement of Operations.
4 Securities transactions and investment income: Securities transactions are recorded on trade date for financial reporting purposes. Dividend income is recorded on the ex-dividend date or, for certain foreign dividends, as soon as the Fund becomes aware of the dividends. Non-cash dividends included in dividend income, if any, are recorded at the fair market value of the securities received. Interest income, including accretion of original issue discount, where applicable, and accretion of discount on short-term investments, if any, is recorded on the accrual basis. Realized gains and losses from securities transactions and foreign currency transactions, if any, are recorded on the basis of identified cost and stated separately in the Statement of Operations. Included in net realized gain (loss) on investments are proceeds from the settlements of class action litigation in which the Fund participated as a class member. The amount of such proceeds for the year ended December 31, 2012 was $63,397.
5 Income tax information: The Funds are treated as separate entities for U.S. federal income tax purposes. It is the policy of the Fund to continue to qualify for treatment as a regulated investment company by complying with the requirements of the U.S. Internal Revenue Code applicable to regulated investment companies and to distribute substantially all of its net investment income and net realized capital gains to its shareholders. To the extent the Fund distributes substantially all of its net investment income and net realized capital gains to shareholders, no federal income or excise tax provision is required.
The Fund has adopted the provisions of ASC 740 "Income Taxes" ("ASC 740"). ASC 740 sets forth a minimum threshold for financial statement recognition of a tax position taken, or expected to be taken, in a tax return. The Fund recognizes interest and penalties, if any, related to unrecognized tax positions as an income tax expense in the Statement of Operations. The Fund is subject to examination by U.S. federal and state tax authorities for returns filed for the prior three fiscal years 2009-2011. As of December 31, 2012, the Fund did not have any unrecognized tax positions.
14
Income distributions and capital gain distributions are determined in accordance with income tax regulations, which may differ from GAAP. These differences are primarily due to differing treatments of income and gains on various investment securities held by the Fund, timing differences and differing characterization of distributions made by the Fund. The Fund may also utilize earnings and profits distributed to shareholders on redemption of shares as a part of the dividends-paid deduction for income tax purposes.
As determined on December 31, 2012, permanent differences resulting primarily from different book and tax accounting were reclassified at year end. Such differences may be attributed to one or more of the following: net operating losses and non-taxable dividend adjustments to income. These reclassifications had no effect on net income, net asset value ("NAV") or NAV per share of the Fund. For the year ended December 31, 2012, the Fund recorded the following permanent reclassifications:
| Paid-in Capital | | Undistributed Net Investment Income (Loss) | | Accumulated Net Realized Gains (Losses) on Investments | |
| $ | (88,898 | ) | | $ | 87,585 | | | $ | 1,313 | | |
As of December 31, 2012, the components of distributable earnings (accumulated losses) on a U.S. federal income tax basis were as follows:
Undistributed Ordinary Income (Loss) | | Unrealized Appreciation (Depreciation) | | Loss Carryforwards and Deferrals | | Other Temporary Differences | | Total | |
| $ | — | | | $ | 2,391,800 | | | $ | (9,300,389 | ) | | $ | — | | | $ | (6,908,589 | ) | |
The differences between book basis and tax basis distributable earnings are primarily due to: timing differences of wash sales and capital loss carryforwards.
To the extent the Fund's net realized capital gains, if any, can be offset by capital loss carryforwards, it is the policy of the Fund not to distribute such gains. The Regulated Investment Company ("RIC") Modernization Act of 2010 (the "Act") became effective for the Fund on January 1, 2011. The Act modernizes several of the federal income and excise tax provisions related to RICs. Among the changes made are changes to the capital loss carryforward rules allowing for RICs to carry forward capital losses indefinitely and to retain the character of capital loss carryforwards as short-term or long-term ("Post-Enactment"). Rules in effect previously limited the carryforward period to eight years and all carryforwards were considered short-term in character ("Pre-Enactment"). As determined at December 31, 2012, the Fund had unused capital loss carryforwards available for federal income tax purposes to offset net realized capital gains, if any, as follows:
| | | Pre-Enactment | |
| | | Expiring in: 2017 | |
| | | | | $ | 9,300,389 | | |
Post-Enactment capital loss carryforwards must be fully used before Pre-Enactment capital loss carryforwards; therefore, under certain circumstances, Pre-Enactment capital loss carryforwards available as of the report date may expire unused. As of December 31, 2012, the Fund had no Post-Enactment capital loss carryforwards.
Under current tax law, the use of these losses to offset future gains may be limited.
During the year ended December 31, 2012, the Fund utilized capital loss carryforwards of $976,898.
6 Distributions to shareholders: The Fund may earn income, net of expenses, daily on its investments. Distributions from net investment income and net realized capital gains, if any, generally are distributed once a year (usually in October). Income distributions and capital gain distributions to shareholders are recorded on the ex-date.
15
7 Foreign taxes: Foreign taxes withheld represent amounts withheld by foreign tax authorities, net of refunds recoverable.
8 Expense allocation: Certain expenses are applicable to multiple funds. Expenses directly attributable to a Series are charged to that Series. Expenses of the Trust that are not directly attributable to a particular series of the Trust (e.g., the Fund) are allocated among the series of the Trust, on the basis of relative net assets, except where a more appropriate allocation of expenses to each of the series can otherwise be made fairly. Expenses borne by the complex of related investment companies, which includes open-end and closed-end investment companies for which Management serves as investment manager, that are not directly attributable to a particular investment company in the complex (e.g., the Trust) or series thereof are allocated among the investment companies in the complex or series thereof, on the basis of relative net assets, except where a more appropriate allocation of expenses to each of the investment companies in the complex or series thereof can otherwise be made fairly.
9 Investments in foreign securities: Investing in foreign securities may involve certain sovereign and other risks, in addition to the credit and market risks normally associated with domestic securities. These additional risks include the possibility of adverse political and economic developments (including political instability, nationalization, expropriation, or confiscatory taxation) and the potentially adverse effects of unavailability of public information regarding issuers, less governmental supervision and regulation of financial markets, reduced liquidity of certain financial markets, and the lack of uniform accounting, auditing, and financial reporting standards or the application of standards that are different or less stringent than those applied in the United States. Foreign securities also may experience greater price volatility, higher rates of inflation, and delays in settlement.
10 Indemnifications: Like many other companies, the Trust's organizational documents provide that its officers and trustees are indemnified against certain liabilities arising out of the performance of their duties to the Trust. In addition, both in some of its principal service contracts and in the normal course of its business, the Trust enters into contracts that provide indemnifications to other parties for certain types of losses or liabilities. The Trust's maximum exposure under these arrangements is unknown as this could involve future claims against the Trust.
11 Expense offset arrangement: The Fund has an expense offset arrangement in connection with its custodian contract. For the year ended December 31, 2012, the impact of this arrangement was a reduction of expenses of $1.
Note B—Management Fees, Administration Fees, Distribution Arrangements, and Other Transactions with Affiliates:
Fund shares are issued and redeemed in connection with investments in and payments under certain variable annuity contracts and variable life insurance policies issued through separate accounts of life insurance companies and are also offered directly to certain qualified pension and retirement plans.
The Fund retains Management as its investment manager under a Management Agreement. For such investment management services, the Fund pays Management a fee at the annual rate of 0.55% of the first $250 million of the Fund's average daily net assets, 0.525% of the next $250 million, 0.50% of the next $250 million, 0.475% of the next $250 million, 0.45% of the next $500 million, 0.425% of the next $2.5 billion, and 0.40% of average daily net assets in excess of $4 billion. Accordingly, for the year ended December 31, 2012, the management fee pursuant to the Management Agreement was equivalent to an annual effective rate of 0.55% of the Fund's average daily net assets.
The Fund retains Management as its administrator under an Administration Agreement. The Fund pays Management an administration fee at the annual rate of 0.30% of its average daily net assets under this agreement. Additionally, Management retains State Street Bank and Trust Company ("State Street") as its sub-administrator under a Sub-Administration Agreement. Management pays State Street a fee for all services received under this agreement.
The Board adopted a non-fee distribution plan for the Fund.
16
Management has contractually undertaken through December 31, 2015 to waive current payment of fees and/or reimburse the Fund for its operating expenses (excluding fees payable to Management, interest, taxes, brokerage commissions, extraordinary expenses, transaction costs and dividend expense on short sales, if any) ("Operating Expenses") which exceed, in the aggregate, 1.00% per annum of the Fund's average daily net assets (the "Expense Limitation"). For the year ended December 31, 2012, such excess expenses amounted to $52,518. The Fund has agreed to repay Management through December 31, 2018 for fees and expenses waived and/or its excess Operating Expenses previously reimbursed by Management, so long as its annual Operating Expenses during that period do not exceed its Expense Limitation in place at the time the fees and expenses were waived or reimbursed, and the repayment is made within three years after the year in which Management issued the reimbursement or waived fees. During the year ended December 31, 2012, there was no repayment to Management under its contractual expense limitation. At December 31, 2012, contingent liabilities to Management under its contractual expense limitation were as follows:
| Expiring in: | | | |
| 2013 | | 2014 | | 2015 | | Total | |
| $ | 58,438 | | | $ | 53,512 | | | $ | 52,518 | | | $ | 164,468 | | |
Neuberger Berman LLC ("Neuberger") is retained by Management to furnish it with investment recommendations and research information without added cost to the Fund. Several individuals who are officers and/or trustees of the Trust are also employees of Neuberger and/or Management.
Management and Neuberger are indirect subsidiaries of Neuberger Berman Group LLC (("NBG") and together with its consolidated subsidiaries ("NB Group")). NBSH Acquisition, LLC ("NBSH"), which is owned by portfolio managers, members of the NB Group management team and certain of NB Group's key employees and senior professionals, owns, as of September 30, 2012, approximately 57% of NBG's common units, and Lehman Brothers Holdings Inc. ("LBHI") and certain of its subsidiaries (collectively the "LBHI Parties") own the remaining 43% of such common units. Pursuant to agreements among NBG, NBSH and the LBHI Parties, NBG is entitled to acquire the remaining Class A common units through a process that is expected to end in 2017. In April 2012, NBG exercised its option (the "Redemption Agreement Option") to redeem during 2012 certain of its Class A common units held by the LBHI Parties equal to 10% of NBG's aggregate common units issued and outstanding as of March 16, 2012. The final payment for such Class A common units is due within thirty (30) days of December 31, 2012.
Note C—Securities Transactions:
During the year ended December 31, 2012, there were purchase and sale transactions (excluding short-term securities) of $2,610,343 and $3,505,173, respectively.
During the year ended December 31, 2012, no brokerage commissions on securities transactions were paid to affiliated brokers.
Note D—Fund Share Transactions:
Share activity for years ended December 31, 2012 and December 31, 2011 was as follows:
| | | For the Year Ended December 31, | |
| | | 2012 | | 2011 | |
| Shares Sold | | | 12,864 | | | | 22,555 | | |
| Shares Redeemed | | | (58,812 | ) | | | (84,514 | ) | |
| Total | | | (45,948 | ) | | | (61,959 | ) | |
17
Note E—Line of Credit:
At December 31, 2012, the Fund was a participant in a single committed, unsecured $200,000,000 line of credit with State Street, to be used only for temporary or emergency purposes. Other investment companies managed by Management also participate in this line of credit on the same terms. Interest is charged on borrowings under this line of credit at the higher of (a) the Federal Funds Rate plus 1.25% per annum or (b) the Overnight LIBOR Rate plus 1.25% per annum. A commitment fee of 0.10% per annum of the available line of credit is charged, of which each participating Fund has agreed to pay its pro rata share, based on the ratio of its individual net assets to the net assets of all participants at the time the fee is due and payable. The fee is paid quarterly in arrears. Because several mutual funds participate, there is no assurance that an individual Fund will have access to all or any part of the $200,000,000 at any particular time. There were no loans outstanding pursuant to this line of credit at December 31, 2012. During the year ended December 31, 2012, the Fund did not utilize this line of credit.
Note F—Recent Accounting Pronouncement:
In December 2011, the Financial Accounting Standards Board issued Accounting Standards Update 2011-11 Disclosures about Offsetting Assets and Liabilities ("ASU 2011-11"). Effective for annual reporting periods beginning on or after January 1, 2013 and interim periods within those annual periods, ASU 2011-11 is intended to enhance disclosure requirements on the offsetting of financial assets and liabilities. At this time, Management is evaluating the implications of ASU 2011-11 and its impact on the financial statements.
18
Financial Highlights
Growth Portfolio
The following table includes selected data for a share outstanding throughout each year and other performance information derived from the Financial Statements. Per share amounts that round to less than $.01 or $(.01) per share are presented as $.00 or $(.00), respectively.
| | | Year Ended December 31, | |
| | | 2012 | | 2011 | | 2010 | | 2009 | | 2008 | |
| Net Asset Value, Beginning of Year | | $ | 18.57 | | | $ | 18.61 | | | $ | 14.20 | | | $ | 10.87 | | | $ | 19.30 | | |
| Income From Investment Operations: | |
Net Investment Income (Loss)‡ | | | (.24 | ) | | | (.26 | ) | | | (.21 | ) | | | (.05 | ) | | | (.10 | ) | |
Net Gains or Losses on Securities (both realized and unrealized) | | | 2.58 | | | | .22 | | | | 4.62 | | | | 3.38 | | | | (8.33 | ) | |
| Total From Investment Operations | | | 2.34 | | | | (.04 | ) | | | 4.41 | | | | 3.33 | | | | (8.43 | ) | |
| Net Asset Value, End of Year | | $ | 20.91 | | | $ | 18.57 | | | $ | 18.61 | | | $ | 14.20 | | | $ | 10.87 | | |
Total Return†† | | | 12.60 | % | | | (.21 | )% | | | 31.06 | % | | | 30.63 | % | | | (43.68 | )% | |
| Ratios/Supplemental Data | |
| Net Assets, End of Year (in millions) | | $ | 7.3 | | | $ | 7.3 | | | $ | 8.5 | | | $ | 7.5 | | | $ | 82.0 | | |
Ratio of Gross Expenses to Average Net Assets# | | | 2.55 | % | | | 2.52 | % | | | 2.64 | % | | | 1.27 | % | | | 1.04 | % | |
Ratio of Net Expenses to Average Net Assets§ | | | 1.85 | % | | | 1.85 | % | | | 1.85 | % | | | 1.27 | % | | | 1.04 | % | |
Ratio of Net Investment Income (Loss) to Average Net Assets | | | (1.17 | )% | | | (1.38 | )% | | | (1.33 | )% | | | (.49 | )% | | | (.63 | )% | |
| Portfolio Turnover Rate | | | 35 | % | | | 33 | % | | | 49 | % | | | 68 | % | | | 63 | % | |
See Notes to Financial Highlights
19
Notes to Financial Highlights Growth Portfolio
†† Total return based on per share NAV reflects the effects of changes in NAV on the performance of the Fund during each fiscal period and assumes income dividends and other distributions, if any, were reinvested. Results represent past performance and do not indicate future results. Current returns may be lower or higher than the performance data quoted. Investment returns and principal may fluctuate and shares when redeemed may be worth more or less than original cost. Total return would have been lower if Management had not reimbursed and/or waived certain expenses. The total return information shown does not reflect charges and other expenses that apply to the separate account or the related insurance policies, and the inclusion of these charges and other expenses would reduce the total return for all fiscal periods shown. Had the Fund not received class actions proceeds, total return based on per share NAV for the year ended December 31, 2010 would have been 28.15%. Had the Fund not received the class actions proceeds as listed in Note A-4, total return based on per share NAV for the year ended December 31, 2012 would have been 11.63%.
# Represents the annualized ratios of net expenses to average daily net assets if Management had not reimbursed certain expenses and/or waived a portion of the investment management fee.
‡ Calculated based on the average number of shares outstanding during each fiscal period.
§ After reimbursement of expenses and/or waiver of a portion of the investment management fee by Management. The Fund is required to calculate an expense ratio without taking into consideration any expense reductions related to expense offset arrangements. Had the Fund not received expense reductions related to expense offset arrangements, the annualized ratios of net expenses to average daily net assets would have been:
| | | Year Ended December 31, | |
| 2012 | | 2011 | | 2010 | | 2009 | | 2008 | | | |
| | 1.85 | % | | | 1.85 | % | | | 1.85 | % | | | 1.27 | % | | | 1.04 | % | | | |
20
Report of Independent Registered Public Accounting Firm
To the Board of Trustees of
Neuberger Berman Advisers Management Trust and
Shareholders of Growth Portfolio
We have audited the accompanying statement of assets and liabilities of Growth Portfolio, one of the series constituting Neuberger Berman Advisers Management Trust (the "Trust"), including the schedule of investments, as of December 31, 2012, and the related statement of operations for the year then ended, the statements of changes in net assets for each of the two years in the period then ended, and the financial highlights for each of the five years in the period then ended. These financial statements and financial highlights are the responsibility of the Trust's management. Our responsibility is to express an opinion on these financial statements and financial highlights based on our audits.
We conducted our audits in accordance with the standards of the Public Company Accounting Oversight Board (United States). Those standards require that we plan and perform the audit to obtain reasonable assurance about whether the financial statements and financial highlights are free of material misstatement. We were not engaged to perform an audit of the Trust's internal control over financial reporting. Our audits included consideration of internal control over financial reporting as a basis for designing audit procedures that are appropriate in the circumstances, but not for the purpose of expressing an opinion on the effectiveness of the Trust's internal control over financial reporting. Accordingly, we express no such opinion. An audit also includes examining, on a test basis, evidence supporting the amounts and disclosures in the financial statements and financial highlights, assessing the accounting principles used and significant estimates made by management, and evaluating the overall financial statement presentation. Our procedures included confirmation of securities owned as of December 31, 2012 by correspondence with the custodian and others or by other appropriate auditing procedures where replies from others were not received. We believe that our audits provide a reasonable basis for our opinion.
In our opinion, the financial statements and financial highlights referred to above present fairly, in all material respects, the financial position of Growth Portfolio, a series of Neuberger Berman Advisers Management Trust, at December 31, 2012, the results of its operations for the year then ended, the changes in its net assets for each of the two years in the period then ended, and the financial highlights for each of the five years in the period then ended, in conformity with U.S. generally accepted accounting principles.
Boston, Massachusetts
February 7, 2013
21
Trustee and Officer Information
The following tables set forth information concerning the trustees ("Trustees") and officers ("Officers") of the Trust. All persons named as Trustees and Officers also serve in similar capacities for other funds administered or managed by Management, Neuberger and Neuberger Berman Fixed Income LLC ("NBFI"). The Statement of Additional Information includes additional information about Trustees and is available upon request, without charge, by calling (800) 877-9700.
Information about the Board of Trustees
Name, (Year of Birth), and Address(1) | | Position(s) and Length of Time Served(2) | | Principal Occupation(s)(3) | | Number of Funds in Fund Complex Overseen by Fund Trustee | | Other Directorships Held Outside Fund Complex by Fund Trustee(3) | |
| Independent Fund Trustees | |
| Faith Colish (1935) | | Trustee since 1982 | | Counsel, Carter Ledyard & Milburn LLP (law firm) since October 2002; formerly, Attorney-at-Law and President, Faith Colish, A Professional Corporation, 1980 to 2002. | | | 50 | | | Formerly, Director, 1997 to 2003, and Advisory Director, 2003 to 2006, ABA Retirement Funds (formerly, American Bar Retirement Association) (not-for-profit membership corporation). | |
| Martha C. Goss (1949) | | Trustee since 2007 | | President, Woodhill Enterprises Inc./Chase Hollow Associates LLC (personal investment vehicle), since 2006; Chief Operating and Financial Officer, Hopewell Holdings LLC/ Amwell Holdings, LLC (a holding company for investments in the healthcare sector), since 2003; formerly, Consultant, Resources Connection (temporary staffing), 2002 to 2006. | | | 50 | | | Director, American Water (water utility), since 2003; Director, Channel Reinsurance (financial guaranty reinsurance), 2006 to 2010; Director, Allianz Life of New York (insurance), since 2005; Director, Financial Women's Association of New York (not-for-profit association), since 2003; Trustee Emerita, Brown University, since 1998; formerly, Director, Ocwen Financial Corporation (mortgage servicing), 2005 to 2010; formerly, Advisory Board Member, Attensity (software developer), 2005 to 2007; formerly, Director, Bank Leumi (commercial bank), 2005 to 2007; formerly, Director, Claire's Stores, Inc. (retailer), 2005 to 2007. | |
22
Name, (Year of Birth), and Address(1) | | Position(s) and Length of Time Served(2) | | Principal Occupation(s)(3) | | Number of Funds in Fund Complex Overseen by Fund Trustee | | Other Directorships Held Outside Fund Complex by Fund Trustee(3) | |
| Michael M. Knetter (1960) | | Trustee since 2007 | | President and Chief Executive Officer, University of Wisconsin Foundation, since October 2010; formerly, Dean, School of Business, University of Wisconsin—Madison; formerly, Professor of International Economics and Associate Dean, Amos Tuck School of Business—Dartmouth College, 1998 to 2002. | | | 50 | | | Director, American Family Insurance (a mutual company, not publicly traded), since March 2009; formerly, Trustee, Northwestern Mutual Series Fund, Inc., 2007 to 2010; formerly, Director, Wausau Paper, 2005 to 2011; formerly, Director, Great Wolf Resorts, 2004 to 2009. | |
| Howard A. Mileaf (1937) | | Trustee since 1999 | | Retired; formerly, Vice President and General Counsel, WHX Corporation (holding company), 1993 to 2001. | | | 50 | | | Formerly, Director, Webfinancial Corporation (holding company), 2002 to 2008; formerly, Director, WHX Corporation (holding company), 2002 to 2005; formerly, Director, State Theatre of New Jersey (not-for-profit theatre), 2000 to 2005. | |
| George W. Morriss (1947) | | Trustee since 2007 | | Adjunct Faculty Member, Columbia University School of International Policy and Administration, since October 2012; formerly, Executive Vice President and Chief Financial Officer, People's Bank, Connecticut (a financial services company), 1991 to 2001. | | | 50 | | | Formerly, Manager, Larch Lane Multi-Strategy Fund complex (which consisted of three funds), 2006 to 2011; formerly, Member, NASDAQ Issuers' Affairs Committee, 1995 to 2003. | |
23
Name, (Year of Birth), and Address(1) | | Position(s) and Length of Time Served(2) | | Principal Occupation(s)(3) | | Number of Funds in Fund Complex Overseen by Fund Trustee | | Other Directorships Held Outside Fund Complex by Fund Trustee(3) | |
| Jack L. Rivkin (1940) | | Trustee since 2002; President 2002 to 2008 | | Formerly, Executive Vice President and Chief Investment Officer, Neuberger Berman Holdings LLC (holding company), 2002 to August 2008 and 2003 to August 2008, respectively; formerly, Managing Director and Chief Investment Officer, Neuberger, December 2005 to August 2008 and 2003 to August 2008, respectively; formerly, Executive Vice President, Neuberger, December 2002 to 2005; formerly, Director and Chairman, Management, December 2002 to August 2008; formerly, Executive Vice President, Citigroup Investments, Inc., September 1995 to February 2002; formerly, Executive Vice President, Citigroup Inc., September 1995 to February 2002. | | | 50 | | | Director, Idealab (private company), since 2009; Director, Distributed World Power (private company), since 2009; Director, Dale Carnegie and Associates, Inc. (private company), since 1999; Director, Solbright, Inc. (private company), since 1998; Director, SA Agricultural Fund, since 2009; Chairman and Director, Essential Brands (consumer products) since 2008; formerly, Director, New York Society of Security Analysts, 2006 to 2008. | |
| Tom D. Seip (1950) | | Trustee since 2000; Chairman of the Board since 2008; Lead Independent Trustee 2006 to 2008 | | General Partner, Ridgefield Farm LLC (a private investment vehicle); formerly, President and CEO, Westaff, Inc. (temporary staffing), May 2001 to January 2002; formerly, Senior Executive, The Charles Schwab Corporation, 1983 to 1998, including Chief Executive Officer, Charles Schwab Investment Management, Inc.; Trustee, Schwab Family of Funds and Schwab Investments, 1997 to 1998; and Executive Vice President-Retail Brokerage, Charles Schwab & Co., Inc., 1994 to 1997. | | | 50 | | | Director, H&R Block, Inc. (financial services company), since May 2001; Chairman, Governance and Nominating Committee, H&R Block, Inc., since 2011; formerly, Chairman, Compensation Committee, H&R Block, Inc., 2006 to 2010; formerly, Director, Forward Management, Inc. (asset management company), 1999 to 2006. | |
24
Name, (Year of Birth), and Address(1) | | Position(s) and Length of Time Served(2) | | Principal Occupation(s)(3) | | Number of Funds in Fund Complex Overseen by Fund Trustee | | Other Directorships Held Outside Fund Complex by Fund Trustee(3) | |
| Candace L. Straight (1947) | | Trustee since 1999 | | Private investor and consultant specializing in the insurance industry; formerly, Advisory Director, Securitas Capital LLC (a global private equity investment firm dedicated to making investments in the insurance sector), 1998 to December 2003. | | | 50 | | | Public Member, Board of Governors and Board of Trustees, Rutgers University, since 2011; Director, Montpelier Re Holdings Ltd. (reinsurance company), since 2006; formerly, Director, National Atlantic Holdings Corporation (property and casualty insurance company), 2004 to 2008; formerly, Director, The Proformance Insurance Company (property and casualty insurance company), 2004 to 2008; formerly, Director, Providence Washington Insurance Company (property and casualty insurance company), 1998 to 2006; formerly, Director, Summit Global Partners (insurance brokerage firm), 2000 to 2005. | |
| Peter P. Trapp (1944) | | Trustee since 1984 | | Retired; formerly, Regional Manager for Mid-Southern Region, Ford Motor Credit Company, September 1997 to 2007; formerly, President, Ford Life Insurance Company, April 1995 to August 1997. | | | 50 | | | None. | |
25
Name, (Year of Birth), and Address(1) | | Position(s) and Length of Time Served(2) | | Principal Occupation(s)(3) | | Number of Funds in Fund Complex Overseen by Fund Trustee | | Other Directorships Held Outside Fund Complex by Fund Trustee(3) | |
| Fund Trustees who are "Interested Persons" | |
| Joseph V. Amato* (1962) | | Trustee since 2009 | | President and Director, Neuberger Berman Group LLC, since 2009; President and Chief Executive Officer, Neuberger and Neuberger Berman Holdings LLC (including its predecessor, Neuberger Berman Inc.), since 2007; Chief Investment Officer, Neuberger, since 2009; Chief Investment Officer (Equities) and Managing Director, Management, since 2009; Managing Director, NBFI, since 2007; Board member of NBFI since 2006; formerly, Global Head of Asset Management of Lehman Brothers Holdings Inc.'s ("LBHI") Investment Management Division, 2006 to 2009; formerly, member of LBHI's Investment Management Division's Executive Management Committee, 2006 to 2009; formerly, Managing Director, Lehman Brothers Inc. ("LBI"), 2006 to 2008; formerly, Chief Recruiting and Development Officer, LBI, 2005 to 2006; formerly, Global Head of LBI's Equity Sales and a Member of its Equities Division Executive Committee, 2003 to 2005. | | | 50 | | | Member of Board of Advisors, McDonough School of Business, Georgetown University, since 2001; Member of New York City Board of Advisors, Teach for America, since 2005; Trustee, Montclair Kimberley Academy (private school), since 2007. | |
26
Name, (Year of Birth), and Address(1) | | Position(s) and Length of Time Served(2) | | Principal Occupation(s)(3) | | Number of Funds in Fund Complex Overseen by Fund Trustee | | Other Directorships Held Outside Fund Complex by Fund Trustee(3) | |
| Robert Conti* (1956) | | Chief Executive Officer, President and Trustee since 2008; prior thereto, Executive Vice President in 2008 and Vice President 2000 to 2008 | | Managing Director, Neuberger, since 2007; formerly, Senior Vice President, Neuberger, 2003 to 2006; formerly, Vice President, Neuberger, 1999 to 2003; President and Chief Executive Officer, Management, since 2008; formerly, Senior Vice President, Management, 2000 to 2008; Managing Director, NBFI, since 2009. | | | 50 | | | Director, Staten Island Mental Health Society, since 1994; formerly, Chairman of the Board, Staten Island Mental Health Society, 2008 to 2011. | |
(1) The business address of each listed person is 605 Third Avenue, New York, New York 10158.
(2) Pursuant to the Trust's Trust Instrument, each of these Fund Trustees shall hold office for life or until his or her successor is elected or the Trust terminates; except that (a) any Fund Trustee may resign by delivering a written resignation; (b) any Fund Trustee may be removed with or without cause at any time by a written instrument signed by at least two-thirds of the other Fund Trustees; (c) any Fund Trustee who requests to be retired, or who has become unable to serve, may be retired by a written instrument signed by a majority of the other Fund Trustees; and (d) any Fund Trustee may be removed at any shareholder meeting by a vote of at least two-thirds of the outstanding shares.
(3) Except as otherwise indicated, each individual has held the positions shown for at least the last five years.
* Indicates a Fund Trustee who is an "interested person" within the meaning of the 1940 Act. Mr. Amato and Mr. Conti are interested persons of the Trust by virtue of the fact that each is an officer of Management, Neuberger and/or their affiliates.
27
Information about the Officers of the Trust
Name, (Year of Birth), and Address(1) | | Position(s) and Length of Time Served(2) | | Principal Occupation(s)(3) | |
| Andrew B. Allard (1961) | | Chief Legal Officer since 2013 (only for purposes of sections 307 and 406 of the Sarbanes-Oxley Act of 2002) and Anti-Money Laundering Compliance Officer since 2002 | | Senior Vice President, Neuberger, since 2006 and Employee since 1999; Deputy General Counsel, Neuberger, since 2004; formerly, Vice President, Neuberger, 2000 to 2005; formerly, Employee, Management, 1994 to 1999; Chief Legal Officer since 2013 (only for purposes of sections 307 and 406 of the Sarbanes-Oxley Act of 2002) and Anti-Money Laundering Compliance Officer since 2002, nine registered investment companies for which Management acts as investment manager and administrator (six since 2002, one since 2003, one since 2005 and one since 2006). | |
| Claudia A. Brandon (1956) | | Executive Vice President since 2008 and Secretary since 1985 | | Senior Vice President, Neuberger, since 2007 and Employee since 1999; Senior Vice President, Management, since 2008 and Assistant Secretary since 2004; formerly, Vice President, Neuberger, 2002 to 2006; formerly, Vice President-Mutual Fund Board Relations, Management, 2000 to 2008; formerly, Vice President, Management, 1986 to 1999 and Employee 1984 to 1999; Executive Vice President, nine registered investment companies for which Management acts as investment manager and administrator (nine since 2008); Secretary, nine registered investment companies for which Management acts as investment manager and administrator (three since 1985, three since 2002, one since 2003, one since 2005 and one since 2006). | |
| Anthony DiBernardo (1979) | | Assistant Treasurer since 2011 | | Vice President, Neuberger, since 2009; Employee, Management, since 2003; Assistant Treasurer, nine registered investment companies for which Management acts as investment manager and administrator (nine since 2011). | |
| Sheila R. James (1965) | | Assistant Secretary since 2002 | | Vice President, Neuberger, since 2008 and Employee since 1999; formerly, Assistant Vice President, Neuberger, 2007; formerly, Employee, Management, 1991 to 1999; Assistant Secretary, nine registered investment companies for which Management acts as investment manager and administrator (six since 2002, one since 2003, one since 2005 and one since 2006). | |
| Brian Kerrane (1969) | | Vice President since 2008 | | Senior Vice President, Neuberger, since 2006; formerly, Vice President, Neuberger, 2002 to 2006; Vice President, Management, since 2008 and Employee since 1991; Vice President, nine registered investment companies for which Management acts as investment manager and administrator (nine since 2008). | |
28
Name, (Year of Birth), and Address(1) | | Position(s) and Length of Time Served(2) | | Principal Occupation(s)(3) | |
| Kevin Lyons (1955) | | Assistant Secretary since 2003 | | Assistant Vice President, Neuberger, since 2008 and Employee since 1999; formerly, Employee, Management, 1993 to 1999; Assistant Secretary, nine registered investment companies for which Management acts as investment manager and administrator (seven since 2003, one since 2005 and one since 2006). | |
| Owen F. McEntee, Jr. (1961) | | Vice President since 2008 | | Vice President, Neuberger, since 2006; Employee, Management, since 1992; Vice President, nine registered investment companies for which Management acts as investment manager and administrator (nine since 2008). | |
| John M. McGovern (1970) | | Treasurer and Principal Financial and Accounting Officer since 2005 | | Senior Vice President, Neuberger, since 2007; formerly, Vice President, Neuberger, 2004 to 2006; Employee, Management, since 1993; Treasurer and Principal Financial and Accounting Officer, nine registered investment companies for which Management acts as investment manager and administrator (eight since 2005 and one since 2006); formerly, Assistant Treasurer, eight registered investment companies for which Management acts as investment manager and administrator, 2002 to 2005. | |
| Frank Rosato (1971) | | Assistant Treasurer since 2005 | | Vice President, Neuberger, since 2006; Employee, Management, since 1995; Assistant Treasurer, nine registered investment companies for which Management acts as investment manager and administrator (eight since 2005 and one since 2006). | |
| Neil S. Siegel (1967) | | Vice President since 2008 | | Managing Director, Management, since 2008; Managing Director, Neuberger, since 2006; formerly, Senior Vice President, Neuberger, 2004 to 2006; Vice President, nine registered investment companies for which Management acts as investment manager and administrator (nine since 2008). | |
| Chamaine Williams (1971) | | Chief Compliance Officer since 2005 | | Senior Vice President, Neuberger, since 2007; Chief Compliance Officer, Management, since 2006; Chief Compliance Officer, nine registered investment companies for which Management acts as investment manager and administrator (eight since 2005 and one since 2006); formerly, Senior Vice President, LBI, 2007 to 2008; formerly, Vice President, LBI, 2003 to 2006; formerly, Chief Compliance Officer, Lehman Brothers Asset Management Inc., 2003 to 2007; formerly, Chief Compliance Officer, Lehman Brothers Alternative Investment Management LLC, 2003 to 2007. | |
(1) The business address of each listed person is 605 Third Avenue, New York, New York 10158.
(2) Pursuant to the By-Laws of the Trust, each officer elected by the Fund Trustees shall hold office until his or her successor shall have been elected and qualified or until his or her earlier death, inability to serve, or resignation. Officers serve at the pleasure of the Fund Trustees and may be removed at any time with or without cause.
(3) Except as otherwise indicated, each individual has held the positions shown for at least the last five years.
29
Proxy Voting Policies and Procedures
A description of the policies and procedures that the Trust uses to determine how to vote proxies relating to portfolio securities is available, without charge, by calling 1-800-877-9700 (toll-free) and on the website of the Securities and Exchange Commission, at www.sec.gov. Information regarding how the Trust voted proxies relating to portfolio securities during the most recent 12-month period ended June 30 is also available, without charge, by calling 1-800-877-9700 (toll-free), on the website of the Securities and Exchange Commission at www.sec.gov, and on Management's website at www.nb.com.
Quarterly Portfolio Schedule
The Trust files a complete schedule of portfolio holdings for the Fund with the Securities and Exchange Commission for the first and third quarters of each fiscal year on Form N-Q. The Trust's Forms N-Q are available on the Securities and Exchange Commission's website at www.sec.gov and may be reviewed and copied at the Securities and Exchange Commission's Public Reference Room in Washington, DC. Information on the operation of the Public Reference Room may be obtained by calling 1-800-SEC-0330. The information on Form N-Q is available upon request, without charge, by calling 1-800-877-9700 (toll free).
Board Consideration of the Management and Sub-Advisory Agreements
At a meeting held on October 25, 2012, the Board of Trustees of Neuberger Berman Advisers Management Trust ("Board"), including the Trustees who are not "interested persons" of Management (including its affiliates) or Neuberger Berman Advisers Management Trust ("Independent Fund Trustees"), approved the continuance of the Management and Sub-Advisory Agreements ("Agreements") for Growth Portfolio ("Fund").
In evaluating the Agreements, the Board, including the Independent Fund Trustees, reviewed materials furnished by Management in response to questions submitted by counsel for the Independent Fund Trustees, and met with senior representatives of Management regarding their personnel, operations and financial conditions as they relate to the Fund. The Independent Fund Trustees were advised by counsel that is experienced in Investment Company Act of 1940 matters and that is independent of Management. The Independent Fund Trustees received a memorandum from independent counsel discussing the legal standards for their consideration of the proposed continuance of the Agreements. They met with such counsel separately from representatives of Management to discuss the annual contract review. The annual contract review extends over three regular meetings of the Board, including one meeting devoted primarily to reviewing and discussing Fund performance, to ensure that Management has time to respond to any questions the Independent Fund Trustees may have on their initial review of the report and that the Independent Fund Trustees have time to consider those responses.
The Board considered the following factors, among others, in connection with its approval of the continuance of the Agreements: (1) the nature, extent, and quality of the services provided by Management and Neuberger; (2) the performance of the Fund compared to a relevant market index and a peer group of investment companies; (3) the costs of the services provided and profits or losses realized by Management and its affiliates from their relationship with the Fund; (4) the extent to which economies of scale might be realized as the Fund grows; and (5) whether fee levels reflect any such potential economies of scale for the benefit of investors in the Fund. In their deliberations, the Board members did not identify any particular information that was all-important or controlling, and each Trustee may have attributed different weights to the various factors.
The Board evaluated the terms of the Agreements, the overall fairness of the Agreements to the Fund and whether the Agreements were in the best interests of the Fund and its shareholders.
With respect to the nature, extent and quality of the services provided, the Board considered the performance of the Fund and the experience and staffing of the portfolio management personnel of Management and Neuberger who perform services for the Fund. The Board noted that Management also provides certain administrative services, including fund accounting and compliance oversight. The Board also considered Management's and Neuberger's policies and practices
30
regarding brokerage and allocation of portfolio transactions by Management. The Board's Portfolio Transactions and Pricing Committee from time to time reviewed the quality of the execution services that Management and Neuberger had provided, and periodically reviewed studies by an independent firm engaged to review and evaluate the quality of brokerage execution received by the Fund. The Board also reviewed whether Management and Neuberger used brokers to execute Fund transactions that provide research and other services to Management and Neuberger, and the types of benefits potentially derived from such services by Management, Neuberger, the Fund and other clients of Management and Neuberger. In addition, the Board noted the positive compliance history of Management and Neuberger, as each firm has been free of significant reported compliance problems. As in past years, the Board also considered the manner in which Management addressed various non-routine matters that arose during the year, some of them a result of developments in the broader fund industry or the regulations governing it.
The Board considered the performance of the Fund relative to its benchmark and the average performance of composite peer groups of investment companies pursuing broadly similar strategies. The Board also reviewed performance during the period in relation to certain measures of the degree of investment risk undertaken by the portfolio manager. The Board discussed with Management the Fund's performance and steps that Management had under consideration to improve performance. The Board also considered Management's resources and responsiveness with respect to the Fund.
With respect to the overall fairness of the Agreements, the Board considered the fee structure for the Fund under the Agreements and any fall-out benefits likely to accrue to Management or Neuberger or their affiliates from their relationship with the Fund. The Board also considered the contractual limit on Fund expenses undertaken by Management. With regard to the sub-advisory fee paid to Neuberger, the Board noted that this fee is "at cost." In addition, the Board considered the profitability of Management and its affiliates from their association with the Fund and noted that Management incurred a loss on the Fund.
The Board considered whether there were other funds that were advised or sub-advised by Management or its affiliates or separate accounts managed by Management or its affiliates with investment objectives, policies and strategies that were similar to the Fund. If so, the Board compared the fees charged to the Fund to the fees charged to any such other funds and/or separate accounts. The Board considered the appropriateness and reasonableness of any differences between the fees charged to the Fund and any such other funds and/or separate accounts and determined that the differences in fees were consistent with the management and other services provided.
The Board also evaluated any apparent or anticipated economies of scale in relation to the services Management provides to the Fund. The Board considered whether the Fund's fee structure provides for a reduction of payments resulting from the use of breakpoints and whether those breakpoints are set at appropriate asset levels. In concluding that the benefits accruing to Management and its affiliates by virtue of their relationship to the Fund were reasonable in comparison with the costs of providing the investment advisory and other services and the benefits accruing to the Fund, the Board reviewed specific data as to Management's loss on the Fund for a recent period. The Board also carefully examined Management's cost allocation methodology.
Conclusions
In approving the Agreements, the Board concluded that the terms of each Agreement are fair and reasonable and that approval of the Agreements is in the best interests of the Fund and its shareholders. In reaching this determination, the Board considered that Management and Neuberger could be expected to provide a high level of service to the Fund; that it retained confidence in Management's and Neuberger's capabilities to manage the Fund; that the Fund's fee structure appeared to the Board to be reasonable given the nature and quality of services provided; and that the benefits accruing to Management and its affiliates by virtue of their relationship to the Fund were reasonable in comparison with the benefits accruing to the Fund.
31
Neuberger Berman
Advisers Management Trust
Guardian Portfolio
I Class Shares
S Class Shares
Annual Report
December 31, 2012
B1016 02/13
Guardian Portfolio Commentary (Unaudited)
The Neuberger Berman Advisers Management Trust (AMT) Guardian Portfolio Class I generated a total return of 12.73% for the fiscal year ended December 31, 2012, but underperformed its benchmark, the S&P 500 Index, which posted a 16.00% return for the same period. Returns for the Portfolio's Class I and Class S shares are provided on page three.
During 2012, the market responded more to macroeconomic events and perceptions than company fundamentals. Instead of rewarding companies performing well as businesses, with fundamentals like balance sheet strength, steady earnings, and high free cash flows that allow them to perform well in a slow growth economy, the market rotated quickly between "risk on" and "risk off" sentiment.
For instance, equity investors sought the visibility of return offered by dividend paying stocks when confronted with the uncertainty created by a potential U.S. debt default or of Greece exiting the eurozone. Conversely, the market favored more cyclical areas as central bank activity and slight improvements in consumer confidence and the housing sector encouraged investors during the fall.
As 2012 ended, our Portfolio began to benefit on a relative basis, potentially an early sign that investor sentiment is now shifting towards businesses that can deliver steady growth in a slow growth environment—a key characteristic of our portfolio companies since this cycle began in 2008.
Throughout the year, we continued to manage a portfolio of very high-quality businesses that, with few exceptions, delivered in line with or exceeded expectations. In light of current global debt issues, we also managed with an eye on "fat tail risk"—the potential for debt-driven deflation and recession on one hand, and for inflation triggered by the policy response to the debt crisis on the other.
We further tightened already high standards for free cash flow and balance sheet strength, focusing on well-funded businesses that we believe could survive without access to new capital, and that potentially could exit a downturn in stronger shape by outperforming weaker competitors. Many of our portfolio companies are also positioned for an inflationary possibility, with business models that we believe allow them to pass through cost increases should price inflation become an issue.
While almost all of our portfolio companies performed well as businesses throughout 2012, the Portfolio benefited most from stock selection within the Consumer Staples sector—where holdings such as Anheuser-Busch InBev and McCormick delivered excellent results. Consumer Discretionary holdings also outperformed, with both Scripps Networks and Comcast being notable performers, as did holdings in Health Care, including Covidien and Roche. Having avoided the very weak Utilities sector was another relative benefit.
Allocations within Energy, Financials and Information Technology (IT) were relative headwinds to performance. In Energy, two holdings disappointed on reduced production guidelines for 2013. In Financials, where credit-sensitive financial firms and money center banks outperformed with a late year rally, our conscious lack of exposure impeded relative performance—an exposure conviction that currently continues due to concerns over regulatory risk, business model risk and transparency. We believe our underperformance was a timing issue and that our mix of Financials holdings—which includes asset managers, insurers and exchanges—could outperform over time. Within IT, not owning Apple was a relative headwind for much of the year.
We managed the portfolio fairly actively this year, especially in recent months. We sold Newfield Exploration, one of our Energy detractors, as well as strong contributors Charles Schwab and Comcast. In Schwab's case, we saw pressure on earnings potential from an extended low interest rate environment. We sold Comcast as its stock, in our estimation, became more fully valued.
New purchases included BorgWarner, Newell Rubbermaid and Berkshire Hathaway. BorgWarner supplies emissions and fuel efficiency components to the automotive sector. With a strong balance sheet and growing global demand for clean combustion and improved fuel efficiency, we presently see the potential for outperformance over time.
1
Newell Rubbermaid—owner of global brands including Rubbermaid, Irwin, Lenox, Parker, Paper-Mate, Sharpie, Graco and more—could become a turnaround story. We currently believe its experienced new management team can successfully restructure the business through moves such as increasing international exposure, reducing redundant overhead and centralizing decision making.
In the case of Berkshire Hathaway, where some see "key man risk" in Warren Buffett, we see a portfolio of best-in-class businesses that should be well positioned to grow while managing the fat tail risks of this economic cycle. At the corporate level, Berkshire maintains a balance sheet with $40 billion in liquidity that can be used to fund organic growth, acquire other cash producing assets, or repurchase stock. We believe the businesses within its portfolio offer strengths such as pass-through pricing potential, exposure to an uptick in housing, and a low-debt approach to pipeline and utility businesses positioned to benefit from the North American energy renaissance—all at reasonable valuations.
While we trailed the index for the year, at present we remain pleased with our portfolio holdings and positioning. By and large, the businesses we own have outperformed in a slow growth world, executing on their strategies and providing steady or growing earnings since the 2008 recession.
As debt issues abroad and in the U.S. are likely to remain with us for the indefinite future, we anticipate ongoing uncertainty will influence near term trends in the financial markets. So while the types of stocks favored by the market may continue to rotate quickly, we will stay focused on quality companies delivering advantaged growth, and which we believe are positioned to outperform as businesses through the environment that unfolds. Within a longer-term strategy, we believe the relatively positive earnings development of our portfolio companies in 2012 may serve as fuel for relative outperformance in the periods ahead, especially in a subdued growth environment.
Sincerely,
ARTHUR MORETTI
PORTFOLIO MANAGER
Information about the principal risks of investing in the Portfolio is set forth in the prospectus and statement of additional information.
The portfolio composition, industries and holdings of the Portfolio are subject to change.
Opinions expressed are as of the date herein and are subject to change without notice. This material is not intended to be a formal research report and should not be construed as an offer to sell or the solicitation of an offer to buy any security.
2
Guardian Portfolio (Unaudited)
SECTOR ALLOCATION
| (as a % of Total Investments) | |
| Consumer Discretionary | | | 11.4 | % | |
| Consumer Staples | | | 11.7 | | |
| Energy | | | 11.5 | | |
| Financials | | | 19.4 | | |
| Health Care | | | 8.5 | | |
| Industrials | | | 14.4 | | |
| Information Technology | | | 17.8 | | |
| Materials | | | 4.0 | | |
| Short-Term Investments | | | 1.3 | | |
| Total | | | 100.0 | % | |
PERFORMANCE HIGHLIGHTS
| | | | | Average Annual Total Return Ended 12/31/2012 | |
| | | Inception Date | | 1 Year | | 5 Years | | 10 Years | | Life of Fund | |
Guardian Portfolio Class I | | | 11/03/1997 | | | | 12.73 | % | | | 1.17 | % | | | 7.88 | % | | | 6.19 | % | |
Guardian Portfolio Class S2 | | | 08/02/2002 | | | | 12.60 | % | | | 1.04 | % | | | 7.67 | % | | | 6.05 | % | |
S&P 500 Index1,3 | | | | | | | 16.00 | % | | | 1.66 | % | | | 7.10 | % | | | 4.85 | % | |
The performance data quoted represent past performance and do not indicate future results. Current performance may be lower or higher than the performance data quoted. For more current performance data, please visit www.nb.com.
The results shown in the table reflect the reinvestment of income dividends and other distributions, if any. The results do not reflect the effect of taxes a shareholder would pay on Portfolio distributions or on the redemption of Portfolio shares. The results do not reflect fees and expenses of the variable annuity and variable life insurance policies or the qualified pension and retirement plans whose proceeds are invested in the Portfolio.
The investment return and principal value of an investment will fluctuate and shares, when redeemed, may be worth more or less than their original cost.
Returns would have been lower if Neuberger Berman Management LLC ("Management") had not reimbursed certain expenses and/or waived a portion of the investment management fees during certain of the periods shown. Repayment by a class (of expenses previously reimbursed and/or fees previously waived by Management) will decrease the class's returns. Please see Note B in the Notes to Financial Statements for specific information regarding expense reimbursement and/or fee waiver arrangements.
COMPARISON OF A $10,000 INVESTMENT
This graph shows the change in value of a hypothetical $10,000 investment in the Portfolio over the past 10 fiscal years, or since the Portfolio's inception if it has not operated for 10 years. The graph is based on Class I shares only; the performance of the Portfolio's share classes will differ primarily due to different class expenses (see Performance Highlights chart above).The result is compared with benchmarks, which include a broad-based market index and may include a more narrowly based index. Market indices have not been reduced to reflect any of the fees and costs of investing. The results shown in the graph reflect the reinvestment of income dividends and other distributions, if any. The results do not reflect the effect of taxes a shareholder would pay on Portfolio distributions or on the redemption of Portfolio shares. Results represent past performance and do not indicate future results.
Please see Endnotes for additional information.
3
Endnotes (Unaudited)
1 The date used to calculate Life of Fund performance for the index is the inception date of the oldest share class.
2 Performance shown prior to August 2, 2002 for Class S shares is that of Class I shares, which have lower expenses and correspondingly higher returns than Class S shares.
3 The S&P 500 Index is widely regarded as the standard for measuring large-cap U.S. stock market performance and includes a representative sample of leading companies in leading industries. Please note that indices do not take into account any fees, expenses or tax consequences of investing in the individual securities that they track, and individuals cannot invest directly in any index. Data about the performance of an index is prepared or obtained by Neuberger Berman Management LLC ("Management") and reflects the reinvestment of income dividends and other distributions, if any. The Portfolio may invest in securities not included in a described index and/or may not invest in all securities included in a described index.
Any ratios or other measurements using a factor of forecasted earnings of a company discussed herein are based on consensus estimates, not Management's own projections, and they may or may not be realized. In addition, any revision to a forecast could affect the market price of a security. By quoting them herein, Management does not offer an opinion as to the accuracy of and does not guarantee these forecasted numbers.
The investments for the Portfolio are managed by the same portfolio manager(s) who manage(s) one or more other registered funds that have names, investment objectives and investment styles that are similar to those of the Portfolio. You should be aware that the Portfolio is likely to differ from the other mutual fund(s) in size, cash flow pattern and tax matters. Accordingly, the holdings and performance of the Portfolio can be expected to vary from those of the other mutual fund(s).
Shares of the separate AMT Portfolios are not available to the general public. Shares of this Portfolio may be purchased only by life insurance companies to be used with their separate accounts that fund variable annuity and variable life insurance policies and by qualified pension and retirement plans.
Statistics and projections in this report are derived from sources deemed to be reliable but cannot be regarded as a representation of future results of the AMT Portfolios. This report is prepared for the general information of shareholders and is not an offer of shares of the AMT Portfolios. Shares of the AMT Portfolios are sold only through the currently effective prospectuses, which must precede or accompany this report.
The "Neuberger Berman" name and logo are registered service marks of Neuberger Berman Group LLC. "Neuberger Berman Management LLC" and the individual Fund names in this piece are either service marks or registered service marks of Neuberger Berman Management LLC.
© 2013 Neuberger Berman Management LLC distributor. All rights reserved.
4
Information About Your Fund's Expenses (Unaudited)
As a Fund shareholder, you incur two types of costs: (1) transaction costs such as fees and expenses that are, or may be, imposed under your variable contract or qualified pension plan; and (2) ongoing costs, including management fees; distribution and/or service (12b-1) fees (if applicable); and other Fund expenses. This example is intended to help you understand your ongoing costs (in dollars) of investing in the Fund and compare these costs with the ongoing costs of investing in other mutual funds.
This table is designed to provide information regarding costs related to your investments. The following examples are based on an investment of $1,000 made at the beginning of the six month period ended December 31, 2012 and held for the entire period. The table illustrates the Fund's costs in two ways:
| Actual Expenses and Performance: | | The first section of the table provides information about actual account values and actual expenses in dollars, based on the Fund's actual performance during the period. You may use the information in this line, together with the amount you invested, to estimate the expenses you paid over the period. Simply divide your account value by $1,000 (for example, an $8,600 account value divided by $1,000 = 8.6), then multiply the result by the number in the first section of the table under the heading entitled "Expenses Paid During the Period" to estimate the expenses you paid over the period. | |
| Hypothetical Example for Comparison Purposes: | | The second section of the table provides information about hypothetical account values and hypothetical expenses based on the Fund's actual expense ratio and an assumed rate of return at 5% per year before expenses. This return is not the Fund's actual return. The hypothetical account values and expenses may not be used to estimate the actual ending account balance or expenses you paid for the period. You may use this information to compare the ongoing costs of investing in this Fund versus other funds. To do so, compare the expenses shown in this 5% hypothetical example with the 5% hypothetical examples that appear in the shareholder reports of other funds. | |
Please note that the expenses in the table are meant to highlight your ongoing costs only and do not include any transaction costs, such as fees and expenses that are, or may be imposed under your variable contract or qualified pension plan. Therefore, the information under the heading "Hypothetical (5% annual return before expenses)" is useful in comparing ongoing costs only, and will not help you determine the relative total costs of owning different funds. In addition, if these transaction costs were included, your costs would have been higher.
Expense Information as of 12/31/12
NEUBERGER BERMAN ADVISERS MANAGEMENT TRUST GUARDIAN PORTFOLIO
| Actual | | Beginning Account Value 7/1/12 | | Ending Account Value 12/31/12 | | Expenses Paid During the Period* 7/1/12 – 12/31/12 | | Expense Ratio | |
| Class I | | $ | 1,000.00 | | | $ | 1,062.80 | | | $ | 5.76 | | | | 1.11 | % | |
| Class S | | $ | 1,000.00 | | | $ | 1,062.40 | | | $ | 6.48 | | | | 1.25 | % | |
| Hypothetical (5% annual return before expenses)** | |
| Class I | | $ | 1,000.00 | | | $ | 1,019.56 | | | $ | 5.63 | | | | 1.11 | % | |
| Class S | | $ | 1,000.00 | | | $ | 1,018.85 | | | $ | 6.34 | | | | 1.25 | % | |
* For each class, expenses are equal to the annualized expense ratio for the class, multiplied by the average account value over the period, multiplied by 184/366 (to reflect the one-half year period shown).
** Hypothetical 5% annual return before expenses is calculated by multiplying the number of days in the most recent half year divided by 366.
5
Schedule of Investments Guardian Portfolio
| NUMBER OF SHARES | | | | VALUE† | |
| Common Stocks (98.8%) | | | |
| Auto Components (2.2%) | | | |
| | 25,345 | | | BorgWarner, Inc. | | $ | 1,815,209 | * | |
| Beverages (6.3%) | | | |
| | 37,375 | | | Anheuser-Busch InBev NV ADR | | | 3,266,949 | | |
| | 52,071 | | | Coca-Cola Co. | | | 1,887,574 | | |
| | | | 5,154,523 | | |
| Capital Markets (4.4%) | | | |
| | 8,091 | | | BlackRock, Inc. | | | 1,672,491 | | |
| | 64,940 | | | Lazard Ltd. Class A | | | 1,937,809 | | |
| | | | 3,610,300 | | |
| Chemicals (2.0%) | | | |
| | 22,748 | | | Ecolab, Inc. | | | 1,635,581 | | |
| Consumer Finance (3.1%) | | | |
| | 43,675 | | | American Express Co. | | | 2,510,439 | | |
| Diversified Financial Services (4.8%) | | | |
| | 30,053 | | | CME Group, Inc. | | | 1,523,988 | | |
| | 19,902 | | | IntercontinentalExchange, Inc. | | | 2,464,066 | * | |
| | | | 3,988,054 | | |
Electronic Equipment, Instruments & Components (2.8%) | | | |
| | 88,982 | | | National Instruments Corp. | | | 2,296,626 | | |
| Energy Equipment & Services (6.7%) | | | |
| | 42,215 | | | Cameron International Corp. | | | 2,383,459 | * | |
| | 44,854 | | | Schlumberger Ltd. | | | 3,107,934 | | |
| | | | 5,491,393 | | |
| Food Products (1.9%) | | | |
| | 24,940 | | | McCormick & Co., Inc. | | | 1,584,438 | | |
| Health Care Equipment & Supplies (5.2%) | | | |
| | 16,957 | | | C.R. Bard, Inc. | | | 1,657,377 | | |
| | 45,140 | | | Covidien PLC | | | 2,606,384 | | |
| | | | 4,263,761 | | |
| Household Durables (2.1%) | | | |
| | 75,800 | | | Newell Rubbermaid, Inc. | | | 1,688,066 | | |
| Household Products (3.5%) | | | |
| | 42,026 | | | Procter & Gamble Co. | | | 2,853,145 | | |
| NUMBER OF SHARES | | | | VALUE† | |
| Industrial Conglomerates (8.3%) | | | |
| | 28,195 | | | 3M Co. | | $ | 2,617,906 | | |
| | 74,776 | | | Danaher Corp. | | | 4,179,978 | | |
| | | | 6,797,884 | | |
| Industrial Gases (2.0%) | | | |
| | 15,013 | | | Praxair, Inc. | | | 1,643,173 | | |
| Insurance (7.1%) | | | |
| | 28,565 | | | Berkshire Hathaway, Inc. Class B | | | 2,562,281 | * | |
| | 155,690 | | | Progressive Corp. | | | 3,285,059 | | |
| | | | 5,847,340 | | |
| Internet Software & Services (3.4%) | | | |
| | 3,931 | | | Google, Inc. Class A | | | 2,788,534 | * | |
| IT Services (1.5%) | | | |
| | 2,580 | | | MasterCard, Inc. Class A | | | 1,267,502 | | |
| Machinery (2.4%) | | | |
| | 32,924 | | | Pall Corp. | | | 1,984,000 | | |
| Media (2.8%) | | | |
| | 39,533 | | | Scripps Networks Interactive, Inc. Class A | | | 2,289,751 | | |
| Multiline Retail (1.9%) | | | |
| | 27,022 | | | Target Corp. | | | 1,598,892 | | |
| Oil, Gas & Consumable Fuels (4.8%) | | | |
| | 161,864 | | | BG Group PLC | | | 2,699,858 | | |
| | 20,290 | | | Marathon Petroleum Corp. | | | 1,278,270 | | |
| | | | 3,978,128 | | |
| Pharmaceuticals (3.3%) | | | |
| | 13,621 | | | Roche Holding AG | | | 2,753,909 | | |
| Road & Rail (1.8%) | | | |
| | 25,170 | | | J.B. Hunt Transport Services, Inc. | | | 1,502,901 | | |
Semiconductors & Semiconductor Equipment (10.1%) | | | |
| | 121,569 | | | Altera Corp. | | | 4,186,836 | | |
| | 133,208 | | | Texas Instruments, Inc. | | | 4,121,456 | | |
| | | | 8,308,292 | | |
| Specialty Retail (2.5%) | | | |
| | 5,838 | | | Autozone, Inc. | | | 2,069,162 | * | |
See Notes to Schedule of Investments
6
| NUMBER OF SHARES | | | | VALUE† | |
| Trading Companies & Distributors (1.9%) | | | |
| | 7,893 | | | W.W. Grainger, Inc. | | $ | 1,597,306 | | |
| | | | | Total Common Stocks (Cost $62,039,526) | | | 81,318,309 | | |
| Short-Term Investments (1.3%) | | | |
| | 1,035,062 | | | State Street Institutional Treasury Money Market Fund Institutional Class (Cost $1,035,062) | | | 1,035,062 | | |
| | | | | Total Investments (100.1%) (Cost $63,074,588) | | | 82,353,371 | ## | |
| | | | | Liabilities, less cash, receivables and other assets [(0.1%)] | | | (111,426 | ) | |
| | | | | Total Net Assets (100.0%) | | $ | 82,241,945 | | |
See Notes to Schedule of Investments
7
Notes to Schedule of Investments Guardian Portfolio
† In accordance with Accounting Standards Codification ("ASC") 820 "Fair Value Measurements and Disclosures" ("ASC 820"), all investments held by Neuberger Berman Advisers Management Trust Guardian Portfolio (the "Fund") are carried at the value that Neuberger Berman Management LLC ("Management") believes the Fund would receive upon selling an investment in an orderly transaction to an independent buyer in the principal or most advantageous market for the investment under current market conditions. Various inputs, including the volume and level of activity for the asset or liability in the market, are considered in valuing the Fund's investments, some of which are discussed below. Significant management judgment may be necessary to value investments in accordance with ASC 820.
ASC 820 established a three-tier hierarchy of inputs to create a classification of value measurements for disclosure purposes. The three-tier hierarchy of inputs is summarized in the three broad Levels listed below.
• Level 1 – quoted prices in active markets for identical investments
• Level 2 – other significant observable inputs (including quoted prices for similar investments, interest rates, prepayment speeds, credit risk, amortized cost, etc.)
• Level 3 – significant unobservable inputs (including the Fund's own assumptions in determining the fair value of investments)
The inputs or methodology used for valuing an investment are not necessarily an indication of the risk associated with investing in those securities.
The value of the Fund's investments in equity securities and exchange traded funds, for which market quotations are readily available, is generally determined by Management by obtaining valuations from an independent pricing service based on the latest sale price quoted on a principal exchange or market for that security (Level 1 inputs). Securities traded primarily on the NASDAQ Stock Market are normally valued by the Fund at the NASDAQ Official Closing Price ("NOCP") provided by NASDAQ each business day. The NOCP is the most recently reported price as of 4:00:02 p.m., Eastern time, unless that price is outside the range of the "inside" bid and asked prices (i.e., the bid and asked prices that dealers quote to each other when trading for their own accounts); in that case, NASDAQ will adjust the price to equal the inside bid or asked price, whichever is closer. Because of delays in reporting trades, the NOCP may not be based on the price of the last trade to occur before the market closes. If there is no reported sale of a security on a particular day, the independent pricing service may value the security based on reported market quotations.
Management has developed a process to periodically review information provided by independent pricing services for all types of securities.
Investments in State Street Institutional Treasury Money Market Fund Institutional Class are valued using the fund's daily calculated net asset value per share (Level 2 inputs).
If a valuation is not available from an independent pricing service, or if Management has reason to believe that the valuation received does not represent the amount the Fund might reasonably expect to receive on a current sale in an orderly transaction, the Fund seeks to obtain quotations from principal market makers (generally considered Level 3 inputs). If such quotations are not readily available, the security is valued using methods the Neuberger Berman Advisers Management Trust's Board of Trustees (the "Board") has approved on the belief that they reflect fair value. Numerous factors may be considered when determining the fair value of a security based on Level 2 or 3 inputs, including available analyst, media or other reports, trading in futures or ADRs and whether the issuer of the security being fair valued has other securities outstanding.
The value of the Fund's investments in foreign securities is generally determined using the same valuation methods and inputs as other Fund investments, as discussed above. Foreign security prices expressed in local currency values are translated from the local currency into U.S. dollars using the exchange rates as of 4:00 p.m., Eastern time. The Board has approved the use of Interactive Data Pricing and Reference Data, Inc. ("Interactive")
See Notes to Financial Statements
8
Notes to Schedule of Investments Guardian Portfolio (cont'd)
to assist in determining the fair value of foreign equity securities when changes in the value of a certain index suggest that the closing prices on the foreign exchanges may no longer represent the amount that the Fund could expect to receive for those securities or on days when foreign markets are closed and U.S. markets are open. In each of these events, Interactive will provide adjusted prices for certain foreign equity securities using a statistical analysis of historical correlations of multiple factors (Level 2 inputs). In the absence of precise information about the market values of these foreign securities as of the close of the New York Stock Exchange, the Board has determined on the basis of available data that prices adjusted in this way are likely to be closer to the prices the Fund could realize on a current sale than are the prices of those securities established at the close of the foreign markets in which the securities primarily trade.
Fair value prices are necessarily estimates, and there is no assurance that such a price will be at or close to the price at which the security is next quoted or next trades.
The following is a summary, categorized by Level, of inputs used to value the Fund's investments as of December 31, 2012:
| Asset Valuation Inputs | | Level 1 | | Level 2 | | Level 3 | | Total | |
| Investments: | |
| Common Stocks | |
| Auto Components | | $ | 1,815,209 | | | $ | — | | | $ | — | | | $ | 1,815,209 | | |
| Beverages | | | 5,154,523 | | | | — | | | | — | | | | 5,154,523 | | |
| Capital Markets | | | 3,610,300 | | | | — | | | | — | | | | 3,610,300 | | |
| Chemicals | | | 1,635,581 | | | | — | | | | — | | | | 1,635,581 | | |
| Consumer Finance | | | 2,510,439 | | | | — | | | | — | | | | 2,510,439 | | |
| Diversified Financial Services | | | 3,988,054 | | | | — | | | | — | | | | 3,988,054 | | |
| Electronic Equipment, Instruments & Components | | | 2,296,626 | | | | — | | | | — | | | | 2,296,626 | | |
| Energy Equipment & Services | | | 5,491,393 | | | | — | | | | — | | | | 5,491,393 | | |
| Food Products | | | 1,584,438 | | | | — | | | | — | | | | 1,584,438 | | |
| Health Care Equipment & Supplies | | | 4,263,761 | | | | — | | | | — | | | | 4,263,761 | | |
| Household Durables | | | 1,688,066 | | | | — | | | | — | | | | 1,688,066 | | |
| Household Products | | | 2,853,145 | | | | — | | | | — | | | | 2,853,145 | | |
| Industrial Conglomerates | | | 6,797,884 | | | | — | | | | — | | | | 6,797,884 | | |
| Industrial Gases | | | 1,643,173 | | | | — | | | | — | | | | 1,643,173 | | |
| Insurance | | | 5,847,340 | | | | — | | | | — | | | | 5,847,340 | | |
| Internet Software & Services | | | 2,788,534 | | | | — | | | | — | | | | 2,788,534 | | |
| IT Services | | | 1,267,502 | | | | — | | | | — | | | | 1,267,502 | | |
| Machinery | | | 1,984,000 | | | | — | | | | — | | | | 1,984,000 | | |
| Media | | | 2,289,751 | | | | — | | | | — | | | | 2,289,751 | | |
| Multiline Retail | | | 1,598,892 | | | | — | | | | — | | | | 1,598,892 | | |
| Oil, Gas & Consumable Fuels | | | 1,278,270 | | | | 2,699,858 | | | | — | | | | 3,978,128 | | |
| Pharmaceuticals | | | — | | | | 2,753,909 | | | | — | | | | 2,753,909 | | |
| Road & Rail | | | 1,502,901 | | | | — | | | | — | | | | 1,502,901 | | |
See Notes to Financial Statements
9
Notes to Schedule of Investments Guardian Portfolio (cont'd)
| Asset Valuation Inputs | | Level 1 | | Level 2 | | Level 3 | | Total | |
| Semiconductors & Semiconductor Equipment | | $ | 8,308,292 | | | $ | — | | | $ | — | | | $ | 8,308,292 | | |
| Specialty Retail | | | 2,069,162 | | | | — | | | | — | | | | 2,069,162 | | |
| Trading Companies & Distributors | | | 1,597,306 | | | | — | | | | — | | | | 1,597,306 | | |
| Total Common Stocks | | | 75,864,542 | | | | 5,453,767 | | | | — | | | | 81,318,309 | | |
| Short-Term Investments | | | — | | | | 1,035,062 | | | | — | | | | 1,035,062 | | |
| Total Investments | | $ | 75,864,542 | | | $ | 6,488,829 | | | $ | — | | | $ | 82,353,371 | | |
As of the year ending December 31, 2012, certain foreign equity securities were transferred from Level 1 to Level 2 as a result of the Fund's procedures for valuing securities, as stated in the description of the valuation methods of foreign equity securities above. Based on beginning of period market values as of December 31, 2011, $5,958,202 was transferred from Level 1 to Level 2.
## At December 31, 2012, the cost of investments for U.S. federal income tax purposes was $63,400,338. Gross unrealized appreciation of investments was $19,384,469 and gross unrealized depreciation of investments was $431,436, resulting in net unrealized appreciation of $18,953,033, based on cost for U.S. federal income tax purposes.
* Security did not produce income during the last twelve months.
See Notes to Financial Statements
10
Statement of Assets and Liabilities
Neuberger Berman Advisers Management Trust
| | | GUARDIAN PORTFOLIO | |
| | | December 31, 2012 | |
| Assets | |
| Investments in securities, at value* (Note A)—see Schedule of Investments: | |
| Unaffiliated issuers | | $ | 82,353,371 | | |
| Cash | | | 3,369 | | |
| Dividends receivable | | | 41,425 | | |
| Receivable for Fund shares sold | | | 3,959 | | |
| Prepaid expenses and other assets | | | 1,247 | | |
| Total Assets | | | 82,403,371 | | |
| Liabilities | |
| Payable for Fund shares redeemed | | | 15,815 | | |
| Payable to investment manager (Note B) | | | 38,427 | | |
| Payable to administrator—net (Note B) | | | 39,778 | | |
| Accrued expenses and other payables | | | 67,406 | | |
| Total Liabilities | | | 161,426 | | |
| Net Assets | | $ | 82,241,945 | | |
| Net Assets consist of: | |
| Paid-in capital | | $ | 58,049,778 | | |
| Undistributed net investment income (loss) | | | 629,451 | | |
| Accumulated net realized gains (losses) on investments | | | 4,284,037 | | |
| Net unrealized appreciation (depreciation) in value of investments | | | 19,278,679 | | |
| Net Assets | | $ | 82,241,945 | | |
| Net Assets | |
| Class I | | $ | 13,285,726 | | |
| Class S | | | 68,956,219 | | |
| Shares Outstanding ($.001 par value; unlimited shares authorized) | |
| Class I | | | 651,299 | | |
| Class S | | | 3,398,832 | | |
| Net Asset Value, offering and redemption price per share | |
| Class I | | $ | 20.40 | | |
| Class S | | | 20.29 | | |
| *Cost of Investments | | $ | 63,074,588 | | |
See Notes to Financial Statements
11
Statement of Operations
Neuberger Berman Advisers Management Trust
| | | GUARDIAN PORTFOLIO | |
| | | For the Year Ended December 31, 2012 | |
| Investment Income: | |
| Income (Note A): | |
| Dividend income—unaffiliated issuers | | $ | 1,689,478 | | |
| Foreign taxes withheld | | | (26,794 | ) | |
| Total income | | $ | 1,662,684 | | |
| Expenses: | |
| Investment management fees (Note B) | | | 462,654 | | |
| Administration fees (Note B): | |
| Class I | | | 42,500 | | |
| Class S | | | 209,857 | | |
| Distribution fees (Note B): | |
| Class S | | | 174,880 | | |
| Audit fees | | | 43,535 | | |
| Custodian fees | | | 48,491 | | |
| Insurance expense | | | 5,159 | | |
| Legal fees | | | 42,678 | | |
| Shareholder reports | | | 25,238 | | |
| Trustees' fees and expenses | | | 50,832 | | |
| Miscellaneous | | | 3,916 | | |
| Total expenses | | | 1,109,740 | | |
| Expenses reimbursed by Management (Note B) | | | (77,887 | ) | |
| Expenses reduced by custodian fee expense offset arrangement (Note A) | | | (10 | ) | |
| Total net expenses | | | 1,031,843 | | |
| Net investment income (loss) | | $ | 630,841 | | |
| Realized and Unrealized Gain (Loss) on Investments (Note A): | |
| Net realized gain (loss) on: | |
| Sales of investment securities of unaffiliated issuers | | | 5,169,746 | | |
| Foreign currency | | | (1,661 | ) | |
| Change in net unrealized appreciation (depreciation) in value of: | |
| Unaffiliated investment securities | | | 4,146,801 | | |
| Foreign currency | | | 118 | | |
| Net gain (loss) on investments | | | 9,315,004 | | |
| Net increase (decrease) in net assets resulting from operations | | $ | 9,945,845 | | |
See Notes to Financial Statements
12
Statements of Changes in Net Assets
Neuberger Berman Advisers Management Trust
| | | GUARDIAN PORTFOLIO | |
| | | Year Ended December 31, 2012 | | Year Ended December 31, 2011 | |
| Increase (Decrease) in Net Assets: | |
| From Operations (Note A): | |
| Net investment income (loss) | | $ | 630,841 | | | $ | 158,660 | | |
| Net realized gain (loss) on investments | | | 5,168,085 | | | | 4,377,091 | | |
| Change in net unrealized appreciation (depreciation) of investments | | | 4,146,919 | | | | (7,359,097 | ) | |
| Net increase (decrease) in net assets resulting from operations | | | 9,945,845 | | | | (2,823,346 | ) | |
| Distributions to Shareholders From (Note A): | |
| Net investment income: | |
| Class I | | | (37,016 | ) | | | (78,575 | ) | |
| Class S | | | (107,574 | ) | | | (256,628 | ) | |
| Net realized gain on investments: | |
| Class I | | | (105,988 | ) | | | — | | |
| Class S | | | (559,383 | ) | | | — | | |
| Total distributions to shareholders | | | (809,961 | ) | | | (335,203 | ) | |
| From Fund Share Transactions (Note D): | |
| Proceeds from shares sold: | |
| Class I | | | 1,129,616 | | | | 8,767,410 | | |
| Class S | | | 704,487 | | | | 2,169,061 | | |
| Proceeds from reinvestment of dividends and distributions: | |
| Class I | | | 143,004 | | | | 78,575 | | |
| Class S | | | 666,957 | | | | 256,628 | | |
| Payments for shares redeemed: | |
| Class I | | | (4,639,775 | ) | | | (8,259,398 | ) | |
| Class S | | | (7,558,188 | ) | | | (9,516,461 | ) | |
| Net increase (decrease) from Fund share transactions | | | (9,553,899 | ) | | | (6,504,185 | ) | |
| Net Increase (Decrease) in Net Assets | | | (418,015 | ) | | | (9,662,734 | ) | |
| Net Assets: | |
| Beginning of year | | | 82,659,960 | | | | 92,322,694 | | |
| End of year | | $ | 82,241,945 | | | $ | 82,659,960 | | |
| Undistributed net investment income (loss) at end of year | | $ | 629,451 | | | $ | 144,861 | | |
See Notes to Financial Statements
13
Notes to Financial Statements Guardian Portfolio
Note A—Summary of Significant Accounting Policies:
1 General: Neuberger Berman Advisers Management Trust (the "Trust") is a Delaware statutory trust organized pursuant to a Trust Instrument dated May 23, 1994. The Trust is currently comprised of ten separate operating series (each individually a "Series," and collectively the "Funds") each of which is diversified. The Trust is registered as an open-end management investment company under the Investment Company Act of 1940, as amended (the "1940 Act"), and its shares are registered under the Securities Act of 1933, as amended. The Fund currently offers Class I and Class S shares. The Board may establish additional series or classes of shares without the approval of shareholders.
The assets of each Series belong only to that Series, and the liabilities of each Series are borne solely by that Series and no other.
The preparation of financial statements in accordance with U.S. generally accepted accounting principles ("GAAP") requires Management to make estimates and assumptions at the date of the financial statements. Actual results could differ from those estimates.
2 Portfolio valuation: Investment securities are valued as indicated in the notes following the Schedule of Investments.
3 Foreign currency translation: The accounting records of the Fund are maintained in U.S. dollars. Foreign currency amounts are translated into U.S. dollars using the exchange rate as of 4:00 p.m., Eastern time, to determine the value of investments, other assets and liabilities. Purchase and sale prices of securities, and income and expenses, are translated into U.S. dollars at the prevailing rate of exchange on the respective dates of such transactions. Net unrealized foreign currency gain (loss), if any, arises from changes in the value of assets and liabilities, other than investments in securities, as a result of changes in exchange rates and is stated separately in the Statement of Operations.
4 Securities transactions and investment income: Securities transactions are recorded on trade date for financial reporting purposes. Dividend income is recorded on the ex-dividend date or, for certain foreign dividends, as soon as the Fund becomes aware of the dividends. Non-cash dividends included in dividend income, if any, are recorded at the fair market value of the securities received. Interest income, including accretion of original issue discount, where applicable, and accretion of discount on short-term investments, if any, is recorded on the accrual basis. Realized gains and losses from securities transactions and foreign currency transactions, if any, are recorded on the basis of identified cost and stated separately in the Statement of Operations. Included in net realized gain (loss) on investments are proceeds from the settlements of class action litigation in which the Fund participated as a class member. The amount of such proceeds for the year ended December 31, 2012 was $103.
5 Income tax information: The Funds are treated as separate entities for U.S. federal income tax purposes. It is the policy of the Fund to continue to qualify for treatment as a regulated investment company by complying with the requirements of the U.S. Internal Revenue Code applicable to regulated investment companies and to distribute substantially all of its net investment income and net realized capital gains to its shareholders. To the extent the Fund distributes substantially all of its net investment income and net realized capital gains to shareholders, no federal income or excise tax provision is required.
The Fund has adopted the provisions of ASC 740 "Income Taxes" ("ASC 740"). ASC 740 sets forth a minimum threshold for financial statement recognition of a tax position taken, or expected to be taken, in a tax return. The Fund recognizes interest and penalties, if any, related to unrecognized tax positions as an income tax expense in the Statement of Operations. The Fund is subject to examination by U.S. federal and state tax authorities for returns filed for the prior three fiscal years 2009-2011. As of December 31, 2012, the Fund did not have any unrecognized tax positions.
14
Income distributions and capital gain distributions are determined in accordance with income tax regulations, which may differ from GAAP. These differences are primarily due to differing treatments of income and gains on various investment securities held by the Fund, timing differences and differing characterization of distributions made by the Fund. The Fund may also utilize earnings and profits distributed to shareholders on redemption of shares as a part of the dividends-paid deduction for income tax purposes.
As determined on December 31, 2012, permanent differences resulting primarily from different book and tax accounting were reclassified at year end. Such differences are attributed to foreign currency gains and losses. These reclassifications had no effect on net income, net asset value ("NAV") or NAV per share of the Fund. For the year ended December 31, 2012, the Fund recorded the following permanent reclassifications:
| | | Paid-in Capital | | Undistributed Net Investment Income (Loss) | | Accumulated Net Realized Gains (Losses) on Investments | |
| | | | | $ | — | | | $ | (1,661 | ) | | $ | 1,661 | | |
For tax purposes, distributions of short-term gains are taxable to shareholders as ordinary income.
The tax character of distributions paid during the years ended December 31, 2012 and December 31, 2011 was as follows:
| | | Distributions Paid From: | |
| | | Ordinary Income | | Long-Term Gains | | Total | |
| | | 2012 | | 2011 | | 2012 | | 2011 | | 2012 | | 2011 | |
| | | | | $ | 144,590 | | | $ | 335,203 | | | $ | 665,371 | | | $ | — | | | $ | 809,961 | | | $ | 335,203 | | |
As of December 31, 2012, the components of distributable earnings (accumulated losses) on a U.S. federal income tax basis were as follows:
| | | Undistributed Ordinary Income | | Undistributed Long-Term Gain | | Unrealized Appreciation (Depreciation) | | Loss Carryforwards and Deferrals | | Other Temporary Differences | | Total | |
| | | | | $ | 629,451 | | | $ | 4,609,787 | | | $ | 18,952,929 | | | $ | — | | | $ | — | | | $ | 24,192,167 | | |
The difference between book basis and tax basis distributable earnings is primarily due to timing differences of wash sales.
To the extent the Fund's net realized capital gains, if any, can be offset by capital loss carryforwards, it is the policy of the Fund not to distribute such gains. The Regulated Investment Company ("RIC") Modernization Act of 2010 (the "Act") became effective for the Fund on January 1, 2011. The Act modernizes several of the federal income and excise tax provisions related to RICs. Among the changes made are changes to the capital loss carryforward rules allowing for RICs to carry forward capital losses indefinitely and to retain the character of capital loss carryforwards as short-term or long-term ("Post-Enactment"). Rules in effect previously limited the carryforward period to eight years and all carryforwards were considered short-term in character ("Pre-Enactment"). As determined at December 31, 2012, the Fund had no unused capital loss carryforwards available for federal income tax purposes to offset net realized capital gains.
Post-Enactment capital loss carryforwards must be fully used before Pre-Enactment capital loss carryforwards; therefore, under certain circumstances, Pre-Enactment capital loss carryforwards available as of the report date may expire unused. As of December 31, 2012, the Fund had no Post-Enactment capital loss carryforwards.
During the year ended December 31, 2012, the Fund utilized capital loss carryforwards of $531,213.
15
6 Distributions to shareholders: The Fund may earn income, net of expenses, daily on its investments. Distributions from net investment income and net realized capital gains, if any, generally are distributed once a year (usually in October). Income distributions and capital gain distributions to shareholders are recorded on the ex-date.
7 Foreign taxes: Foreign taxes withheld represent amounts withheld by foreign tax authorities, net of refunds recoverable.
8 Expense allocation: Certain expenses are applicable to multiple funds. Expenses directly attributable to a Series are charged to that Series. Expenses of the Trust that are not directly attributable to a particular series of the Trust (e.g., the Fund) are allocated among the series of the Trust, on the basis of relative net assets, except where a more appropriate allocation of expenses to each of the series can otherwise be made fairly. Expenses borne by the complex of related investment companies, which includes open-end and closed-end investment companies for which Management serves as investment manager, that are not directly attributable to a particular investment company in the complex (e.g., the Trust) or series thereof are allocated among the investment companies in the complex or series thereof, on the basis of relative net assets, except where a more appropriate allocation of expenses to each of the investment companies in the complex or series thereof can otherwise be made fairly. The Fund's expenses (other than those specific to each class) are allocated proportionally each day between the classes based upon the relative net assets of each class.
9 Investments in foreign securities: Investing in foreign securities may involve certain sovereign and other risks, in addition to the credit and market risks normally associated with domestic securities. These additional risks include the possibility of adverse political and economic developments (including political instability, nationalization, expropriation, or confiscatory taxation) and the potentially adverse effects of unavailability of public information regarding issuers, less governmental supervision and regulation of financial markets, reduced liquidity of certain financial markets, and the lack of uniform accounting, auditing, and financial reporting standards or the application of standards that are different or less stringent than those applied in the United States. Foreign securities also may experience greater price volatility, higher rates of inflation, and delays in settlement.
10 Indemnifications: Like many other companies, the Trust's organizational documents provide that its officers and trustees are indemnified against certain liabilities arising out of the performance of their duties to the Trust. In addition, both in some of its principal service contracts and in the normal course of its business, the Trust enters into contracts that provide indemnifications to other parties for certain types of losses or liabilities. The Trust's maximum exposure under these arrangements is unknown as this could involve future claims against the Trust.
11 Expense offset arrangement: The Fund has an expense offset arrangement in connection with its custodian contract. For the year ended December 31, 2012, the impact of this arrangement was a reduction of expenses of $10.
12 Other: All net investment income and realized and unrealized capital gains and losses of the Fund are allocated, on the basis of relative net assets, pro rata among its respective classes.
Note B—Management Fees, Administration Fees, Distribution Arrangements, and Other Transactions with Affiliates:
Fund shares are issued and redeemed in connection with investments in and payments under certain variable annuity contracts and variable life insurance policies issued through separate accounts of life insurance companies and are also offered directly to certain qualified pension and retirement plans.
The Fund retains Management as its investment manager under a Management Agreement. For such investment management services, the Fund pays Management a fee at the annual rate of 0.55% of the first $250 million of the Fund's average daily net assets, 0.525% of the next $250 million, 0.50% of the next $250 million, 0.475% of the next $250 million, 0.45% of the next $500 million, 0.425% of the next $2.5 billion, and 0.40% of average daily net assets
16
in excess of $4 billion. Accordingly, for the year ended December 31, 2012, the management fee pursuant to the Management Agreement was equivalent to an annual effective rate of 0.55% of the Fund's average daily net assets.
The Fund retains Management as its administrator under an Administration Agreement. Each class pays Management an administration fee at the annual rate of 0.30% of its average daily net assets under this agreement. Additionally, Management retains State Street Bank and Trust Company ("State Street") as its sub-administrator under a Sub-Administration Agreement. Management pays State Street a fee for all services received under this agreement.
The Board adopted a non-fee distribution plan for the Fund's Class I.
For the Fund's Class S, Management acts as agent in arranging for the sale of class shares without commission and bears advertising and promotion expenses. The Board has adopted a distribution plan (the "Plan") with respect to this class, pursuant to Rule 12b-1 under the 1940 Act. The Plan provides that, as compensation for administrative and other services provided to this class, Management's activities and expenses related to the sale and distribution of this class of shares, and ongoing services provided to investors in this class, Management receives from this class a fee at the annual rate of 0.25% of Class S's average daily net assets. Management receives this amount to provide distribution and shareholder servicing for this class and pays a portion of it to institutions that provide such services. Those institutions may use the payments for, among other purposes, compensating employees engaged in sales and/or shareholder servicing. The amount of fees paid by this class during any year may be more or less than the cost of distribution and other services provided to this class. FINRA rules limit the amount of annual distribution fees that may be paid by a mutual fund and impose a ceiling on the cumulative distribution fees paid. The Trust's Plan complies with those rules.
Management has contractually undertaken to waive current payment of fees and/or reimburse the Fund's Class I and Class S shares for their operating expenses (excluding fees payable to Management (including fees payable to Management with respect to the Fund's Class S shares), interest, taxes, brokerage commissions, extraordinary expenses, transaction costs and dividend expense on short sales, if any) ("Operating Expenses") which exceed the expense limitation as detailed in the following table:
| | | Expense Limitation(1) | | Expiration | | Reimbursement from Management for the Year Ended December 31, 2012 | |
| Class I | | | 1.00 | % | | 12/31/15 | | $ | — | | |
| Class S | | | 1.25 | % | | 12/31/15 | | | 77,887 | | |
(1) Expense limitation per annum of the respective class' average daily net assets.
Each respective class has agreed to repay Management through December 31, 2018 for fees and expenses waived and/or its excess Operating Expenses previously reimbursed by Management, so long as its annual Operating Expenses during that period do not exceed its expense limitation in place at the time the fees and expenses were waived or reimbursed, and the repayment is made within three years after the year in which Management issued the reimbursement or waived fees. During the year ended December 31, 2012, there was no repayment to Management under its contractual expense limitation. At December 31, 2012, the Fund's Class I shares had no contingent liability to Management under its contractual expense limitation. At December 31, 2012, the Fund's Class S shares contingent liabilities to Management under its contractual expense limitation were as follows:
| | | Expiring in: | | | |
| | | 2013 | | 2014 | | 2015 | | Total | |
| Class S | | $ | 91,992 | | | $ | 96,517 | | | $ | 77,887 | | | $ | 266,396 | | |
17
Neuberger Berman LLC ("Neuberger") is retained by Management to furnish it with investment recommendations and research information without added cost to the Fund. Several individuals who are officers and/or trustees of the Trust are also employees of Neuberger and/or Management.
Management and Neuberger are indirect subsidiaries of Neuberger Berman Group LLC (("NBG") and together with its consolidated subsidiaries ("NB Group")). NBSH Acquisition, LLC ("NBSH"), which is owned by portfolio managers, members of the NB Group management team and certain of NB Group's key employees and senior professionals, owns, as of September 30, 2012, approximately 57% of NBG's common units, and Lehman Brothers Holdings Inc. ("LBHI") and certain of its subsidiaries (collectively the "LBHI Parties") own the remaining 43% of such common units. Pursuant to agreements among NBG, NBSH and the LBHI Parties, NBG is entitled to acquire the remaining Class A common units through a process that is expected to end in 2017. In April 2012, NBG exercised its option (the "Redemption Agreement Option") to redeem during 2012 certain of its Class A common units held by the LBHI Parties equal to 10% of NBG's aggregate common units issued and outstanding as of March 16, 2012. The final payment for such Class A common units is due within thirty (30) days of December 31, 2012.
Note C—Securities Transactions:
During the year ended December 31, 2012, there were purchase and sale transactions (excluding short-term securities) of $26,200,191 and $35,877,284, respectively.
During the year ended December 31, 2012, no brokerage commissions on securities transactions were paid to affiliated brokers.
Note D—Fund Share Transactions:
Share activity for the years ended December 31, 2012 and December 31, 2011 was as follows:
For the Year Ended December 31, 2012
| | | Shares Sold | | Shares Issued on Reinvestment of Dividends and Distributions | | Shares Redeemed | | Total | |
| Class I | | | 56,872 | | | | 7,013 | | | | (237,405 | ) | | | (173,520 | ) | |
| Class S | | | 35,969 | | | | 32,871 | | | | (384,003 | ) | | | (315,163 | ) | |
For the Year Ended December 31, 2011
| | | Shares Sold | | Shares Issued on Reinvestment of Dividends and Distributions | | Shares Redeemed | | Total | |
| Class I | | | 440,908 | | | | 4,370 | | | | (427,584 | ) | | | 17,694 | | |
| Class S | | | 113,237 | | | | 14,345 | | | | (501,949 | ) | | | (374,367 | ) | |
Note E—Line of Credit:
At December 31, 2012, the Fund was a participant in a single committed, unsecured $200,000,000 line of credit with State Street, to be used only for temporary or emergency purposes. Other investment companies managed by Management also participate in this line of credit on the same terms. Interest is charged on borrowings under this line of credit at the higher of (a) the Federal Funds Rate plus 1.25% per annum or (b) the Overnight LIBOR Rate plus 1.25% per annum. A commitment fee of 0.10% per annum of the available line of credit is charged, of which
18
each participating Fund has agreed to pay its pro rata share, based on the ratio of its individual net assets to the net assets of all participants at the time the fee is due and payable. The fee is paid quarterly in arrears. Because several mutual funds participate, there is no assurance that an individual Fund will have access to all or any part of the $200,000,000 at any particular time. There were no loans outstanding pursuant to this line of credit at December 31, 2012. During the year ended December 31, 2012, the Fund did not utilize this line of credit.
Note F—Recent Accounting Pronouncement:
In December 2011, the Financial Accounting Standards Board issued Accounting Standards Update 2011-11 Disclosures about Offsetting Assets and Liabilities ("ASU 2011-11"). Effective for annual reporting periods beginning on or after January 1, 2013 and interim periods within those annual periods, ASU 2011-11 is intended to enhance disclosure requirements on the offsetting of financial assets and liabilities. At this time, Management is evaluating the implications of ASU 2011-11 and its impact on the financial statements.
19
Financial Highlights
Guardian Portfolio
The following tables include selected data for a share outstanding throughout each year and other performance information derived from the Financial Statements. Per share amounts that round to less than $.01 or $(.01) per share are presented as $.00 or $(.00), respectively.
| Class I | |
| | | Year Ended December 31, | |
| | | 2012 | | 2011 | | 2010 | | 2009 | | 2008 | |
| Net Asset Value, Beginning of Year | | $ | 18.29 | | | $ | 18.94 | | | $ | 15.98 | | | $ | 12.45 | | | $ | 21.11 | | |
| Income From Investment Operations: | |
Net Investment Income (Loss)‡ | | | .17 | | | | .05 | | | | .08 | | | | .05 | | | | .12 | | |
Net Gains or Losses on Securities (both realized and unrealized) | | | 2.16 | | | | (.61 | ) | | | 2.95 | | | | 3.64 | | | | (7.97 | ) | |
| Total From Investment Operations | | | 2.33 | | | | (.56 | ) | | | 3.03 | | | | 3.69 | | | | (7.85 | ) | |
| Less Distributions From: | |
| Net Investment Income | | | (.06 | ) | | | (.09 | ) | | | (.07 | ) | | | (.16 | ) | | | (.10 | ) | |
| Net Capital Gains | | | (.16 | ) | | | — | | | | — | | | | — | | | | (.71 | ) | |
| Total Distributions | | | (.22 | ) | | | (.09 | ) | | | (.07 | ) | | | (.16 | ) | | | (.81 | ) | |
| Net Asset Value, End of Year | | $ | 20.40 | | | $ | 18.29 | | | $ | 18.94 | | | $ | 15.98 | | | $ | 12.45 | | |
Total Return†† | | | 12.73 | % | | | (2.94 | )% | | | 19.01 | % | | | 29.69 | % | | | (37.24 | )% | |
| Ratios/Supplemental Data | |
| Net Assets, End of Year (in millions) | | $ | 13.3 | | | $ | 15.1 | | | $ | 15.3 | | | $ | 13.7 | | | $ | 67.0 | | |
Ratio of Gross Expenses to Average Net Assets# | | | 1.11 | % | | | 1.13 | % | | | 1.13 | % | | | 1.10 | % | | | 1.01 | % | |
Ratio of Net Expenses to Average Net Assets§ | | | 1.11 | % | | | 1.13 | % | | | 1.13 | % | | | 1.10 | % | | | 1.01 | % | |
Ratio of Net Investment Income (Loss) to Average Net Assets | | | .87 | % | | | .26 | % | | | .50 | % | | | .39 | % | | | .65 | % | |
| Portfolio Turnover Rate | | | 32 | % | | | 27 | % | | | 35 | % | | | 30 | % | | | 32 | % | |
See Notes to Financial Highlights
20
Financial Highlights (cont'd)
| Class S | |
| | | Year Ended December 31, | |
| | | 2012 | | 2011 | | 2010 | | 2009 | | 2008 | |
| Net Asset Value, Beginning of Year | | $ | 18.19 | | | $ | 18.84 | | | $ | 15.89 | | | $ | 12.38 | | | $ | 21.02 | | |
| Income From Investment Operations: | |
Net Investment Income (Loss)‡ | | | .14 | | | | .03 | | | | .06 | | | | .02 | | | | .08 | | |
Net Gains or Losses on Securities (both realized and unrealized) | | | 2.15 | | | | (.61 | ) | | | 2.94 | | | | 3.63 | | | | (7.92 | ) | |
| Total From Investment Operations | | | 2.29 | | | | (.58 | ) | | | 3.00 | | | | 3.65 | | | | (7.84 | ) | |
| Less Distributions From: | |
| Net Investment Income | | | (.03 | ) | | | (.07 | ) | | | (.05 | ) | | | (.14 | ) | | | (.09 | ) | |
| Net Capital Gains | | | (.16 | ) | | | — | | | | — | | | | — | | | | (.71 | ) | |
| Total Distributions | | | (.19 | ) | | | (.07 | ) | | | (.05 | ) | | | (.14 | ) | | | (.80 | ) | |
| Net Asset Value, End of Year | | $ | 20.29 | | | $ | 18.19 | | | $ | 18.84 | | | $ | 15.89 | | | $ | 12.38 | | |
Total Return†† | | | 12.60 | % | | | (3.08 | )% | | | 18.94 | % | | | 29.50 | % | | | (37.36 | )% | |
| Ratios/Supplemental Data | |
| Net Assets, End of Year (in millions) | | $ | 69.0 | | | $ | 67.6 | | | $ | 77.0 | | | $ | 71.6 | | | $ | 48.6 | | |
Ratio of Gross Expenses to Average Net Assets# | | | 1.36 | % | | | 1.38 | % | | | 1.38 | % | | | 1.38 | % | | | 1.27 | % | |
Ratio of Net Expenses to Average Net Assets§ | | | 1.25 | % | | | 1.25 | % | | | 1.25 | % | | | 1.25 | % | | | 1.25 | % | |
Ratio of Net Investment Income (Loss) to Average Net Assets | | | .73 | % | | | .16 | % | | | .37 | % | | | .16 | % | | | .48 | % | |
| Portfolio Turnover Rate | | | 32 | % | | | 27 | % | | | 35 | % | | | 30 | % | | | 32 | % | |
See Notes to Financial Highlights
21
Notes to Financial Highlights Guardian Portfolio
†† Total return based on per share NAV reflects the effects of changes in NAV on the performance of the Fund during each fiscal period and assumes income dividends and other distributions, if any, were reinvested. Results represent past performance and do not indicate future results. Current returns may be lower or higher than the performance data quoted. Investment returns and principal may fluctuate and shares when redeemed may be worth more or less than original cost. Total return would have been lower if Management had not reimbursed and/or waived certain expenses. The total return information shown does not reflect charges and other expenses that apply to the separate account or the related insurance policies, and the inclusion of these charges and other expenses would reduce the total return for all fiscal periods shown. The class actions proceeds listed in Note A-4 had no impact on total return.
# Represents the annualized ratios of net expenses to average daily net assets if Management had not reimbursed certain expenses and/or waived a portion of the investment management fee.
‡ Calculated based on the average number of shares outstanding during each fiscal period.
§ After reimbursement of expenses and/or waiver of a portion of the investment management fee by Management. The Fund is required to calculate an expense ratio without taking into consideration any expense reductions related to expense offset arrangements. Had the Fund not received expense reductions related to expense offset arrangements, the annualized ratios of net expenses to average daily net assets would have been:
| | | Year Ended December 31, | |
| | | 2012 | | 2011 | | 2010 | | 2009 | | 2008 | |
| Guardian Portfolio Class I | | | 1.11 | % | | | 1.13 | % | | | 1.13 | % | | | 1.10 | % | | | 1.01 | % | |
| Guardian Portfolio Class S | | | 1.25 | % | | | 1.25 | % | | | 1.25 | % | | | 1.25 | % | | | 1.25 | % | |
22
Report of Independent Registered Public Accounting Firm
To the Board of Trustees of
Neuberger Berman Advisers Management Trust and
Shareholders of Guardian Portfolio
We have audited the accompanying statement of assets and liabilities of Guardian Portfolio, one of the series constituting Neuberger Berman Advisers Management Trust (the "Trust"), including the schedule of investments, as of December 31, 2012, and the related statement of operations for the year then ended, the statements of changes in net assets for each of the two years in the period then ended, and the financial highlights for each of the five years in the period then ended. These financial statements and financial highlights are the responsibility of the Trust's management. Our responsibility is to express an opinion on these financial statements and financial highlights based on our audits.
We conducted our audits in accordance with the standards of the Public Company Accounting Oversight Board (United States). Those standards require that we plan and perform the audit to obtain reasonable assurance about whether the financial statements and financial highlights are free of material misstatement. We were not engaged to perform an audit of the Trust's internal control over financial reporting. Our audits included consideration of internal control over financial reporting as a basis for designing audit procedures that are appropriate in the circumstances, but not for the purpose of expressing an opinion on the effectiveness of the Trust's internal control over financial reporting. Accordingly, we express no such opinion. An audit also includes examining, on a test basis, evidence supporting the amounts and disclosures in the financial statements and financial highlights, assessing the accounting principles used and significant estimates made by management, and evaluating the overall financial statement presentation. Our procedures included confirmation of securities owned as of December 31, 2012 by correspondence with the custodian. We believe that our audits provide a reasonable basis for our opinion.
In our opinion, the financial statements and financial highlights referred to above present fairly, in all material respects, the financial position of Guardian Portfolio, a series of Neuberger Berman Advisers Management Trust, at December 31, 2012, the results of its operations for the year then ended, the changes in its net assets for each of the two years in the period then ended, and the financial highlights for each of the five years in the period then ended, in conformity with U.S. generally accepted accounting principles.
Boston, Massachusetts
February 7, 2013
23
Trustee and Officer Information
The following tables set forth information concerning the trustees ("Trustees") and officers ("Officers") of the Trust. All persons named as Trustees and Officers also serve in similar capacities for other funds administered or managed by Management, Neuberger and Neuberger Berman Fixed Income LLC ("NBFI"). The Statement of Additional Information includes additional information about Trustees and is available upon request, without charge, by calling (800) 877-9700.
Information about the Board of Trustees
Name, (Year of Birth), and Address(1) | | Position(s) and Length of Time Served(2) | | Principal Occupation(s)(3) | | Number of Funds in Fund Complex Overseen by Fund Trustee | | Other Directorships Held Outside Fund Complex by Fund Trustee(3) | |
| Independent Fund Trustees | |
| Faith Colish (1935) | | Trustee since 1982 | | Counsel, Carter Ledyard & Milburn LLP (law firm) since October 2002; formerly, Attorney-at-Law and President, Faith Colish, A Professional Corporation, 1980 to 2002. | | | 50 | | | Formerly, Director, 1997 to 2003, and Advisory Director, 2003 to 2006, ABA Retirement Funds (formerly, American Bar Retirement Association) (not-for-profit membership corporation). | |
| Martha C. Goss (1949) | | Trustee since 2007 | | President, Woodhill Enterprises Inc./Chase Hollow Associates LLC (personal investment vehicle), since 2006; Chief Operating and Financial Officer, Hopewell Holdings LLC/ Amwell Holdings, LLC (a holding company for investments in the healthcare sector), since 2003; formerly, Consultant, Resources Connection (temporary staffing), 2002 to 2006. | | | 50 | | | Director, American Water (water utility), since 2003; Director, Channel Reinsurance (financial guaranty reinsurance), 2006 to 2010; Director, Allianz Life of New York (insurance), since 2005; Director, Financial Women's Association of New York (not-for-profit association), since 2003; Trustee Emerita, Brown University, since 1998; formerly, Director, Ocwen Financial Corporation (mortgage servicing), 2005 to 2010; formerly, Advisory Board Member, Attensity (software developer), 2005 to 2007; formerly, Director, Bank Leumi (commercial bank), 2005 to 2007; formerly, Director, Claire's Stores, Inc. (retailer), 2005 to 2007. | |
24
Name, (Year of Birth), and Address(1) | | Position(s) and Length of Time Served(2) | | Principal Occupation(s)(3) | | Number of Funds in Fund Complex Overseen by Fund Trustee | | Other Directorships Held Outside Fund Complex by Fund Trustee(3) | |
| Michael M. Knetter (1960) | | Trustee since 2007 | | President and Chief Executive Officer, University of Wisconsin Foundation, since October 2010; formerly, Dean, School of Business, University of Wisconsin—Madison; formerly, Professor of International Economics and Associate Dean, Amos Tuck School of Business—Dartmouth College, 1998 to 2002. | | | 50 | | | Director, American Family Insurance (a mutual company, not publicly traded), since March 2009; formerly, Trustee, Northwestern Mutual Series Fund, Inc., 2007 to 2010; formerly, Director, Wausau Paper, 2005 to 2011; formerly, Director, Great Wolf Resorts, 2004 to 2009. | |
| Howard A. Mileaf (1937) | | Trustee since 1999 | | Retired; formerly, Vice President and General Counsel, WHX Corporation (holding company), 1993 to 2001. | | | 50 | | | Formerly, Director, Webfinancial Corporation (holding company), 2002 to 2008; formerly, Director, WHX Corporation (holding company), 2002 to 2005; formerly, Director, State Theatre of New Jersey (not-for-profit theatre), 2000 to 2005. | |
| George W. Morriss (1947) | | Trustee since 2007 | | Adjunct Faculty Member, Columbia University School of International Policy and Administration, since October 2012; formerly, Executive Vice President and Chief Financial Officer, People's Bank, Connecticut (a financial services company), 1991 to 2001. | | | 50 | | | Formerly, Manager, Larch Lane Multi-Strategy Fund complex (which consisted of three funds), 2006 to 2011; formerly, Member, NASDAQ Issuers' Affairs Committee, 1995 to 2003. | |
25
Name, (Year of Birth), and Address(1) | | Position(s) and Length of Time Served(2) | | Principal Occupation(s)(3) | | Number of Funds in Fund Complex Overseen by Fund Trustee | | Other Directorships Held Outside Fund Complex by Fund Trustee(3) | |
| Jack L. Rivkin (1940) | | Trustee since 2002; President 2002 to 2008 | | Formerly, Executive Vice President and Chief Investment Officer, Neuberger Berman Holdings LLC (holding company), 2002 to August 2008 and 2003 to August 2008, respectively; formerly, Managing Director and Chief Investment Officer, Neuberger, December 2005 to August 2008 and 2003 to August 2008, respectively; formerly, Executive Vice President, Neuberger, December 2002 to 2005; formerly, Director and Chairman, Management, December 2002 to August 2008; formerly, Executive Vice President, Citigroup Investments, Inc., September 1995 to February 2002; formerly, Executive Vice President, Citigroup Inc., September 1995 to February 2002. | | | 50 | | | Director, Idealab (private company), since 2009; Director, Distributed World Power (private company), since 2009; Director, Dale Carnegie and Associates, Inc. (private company), since 1999; Director, Solbright, Inc. (private company), since 1998; Director, SA Agricultural Fund, since 2009; Chairman and Director, Essential Brands (consumer products) since 2008; formerly, Director, New York Society of Security Analysts, 2006 to 2008. | |
| Tom D. Seip (1950) | | Trustee since 2000; Chairman of the Board since 2008; Lead Independent Trustee 2006 to 2008 | | General Partner, Ridgefield Farm LLC (a private investment vehicle); formerly, President and CEO, Westaff, Inc. (temporary staffing), May 2001 to January 2002; formerly, Senior Executive, The Charles Schwab Corporation, 1983 to 1998, including Chief Executive Officer, Charles Schwab Investment Management, Inc.; Trustee, Schwab Family of Funds and Schwab Investments, 1997 to 1998; and Executive Vice President—Retail Brokerage, Charles Schwab & Co., Inc., 1994 to 1997. | | | 50 | | | Director, H&R Block, Inc. (financial services company), since May 2001; Chairman, Governance and Nominating Committee, H&R Block, Inc., since 2011; formerly, Chairman, Compensation Committee, H&R Block, Inc., 2006 to 2010; formerly, Director, Forward Management, Inc. (asset management company), 1999 to 2006. | |
26
Name, (Year of Birth), and Address(1) | | Position(s) and Length of Time Served(2) | | Principal Occupation(s)(3) | | Number of Funds in Fund Complex Overseen by Fund Trustee | | Other Directorships Held Outside Fund Complex by Fund Trustee(3) | |
| Candace L. Straight (1947) | | Trustee since 1999 | | Private investor and consultant specializing in the insurance industry; formerly, Advisory Director, Securitas Capital LLC (a global private equity investment firm dedicated to making investments in the insurance sector), 1998 to December 2003. | | | 50 | | | Public Member, Board of Governors and Board of Trustees, Rutgers University, since 2011; Director, Montpelier Re Holdings Ltd. (reinsurance company), since 2006; formerly, Director, National Atlantic Holdings Corporation (property and casualty insurance company), 2004 to 2008; formerly, Director, The Proformance Insurance Company (property and casualty insurance company), 2004 to 2008; formerly, Director, Providence Washington Insurance Company (property and casualty insurance company), 1998 to 2006; formerly, Director, Summit Global Partners (insurance brokerage firm), 2000 to 2005. | |
| Peter P. Trapp (1944) | | Trustee since 1984 | | Retired; formerly, Regional Manager for Mid-Southern Region, Ford Motor Credit Company, September 1997 to 2007; formerly, President, Ford Life Insurance Company, April 1995 to August 1997. | | | 50 | | | None. | |
27
Name, (Year of Birth), and Address(1) | | Position(s) and Length of Time Served(2) | | Principal Occupation(s)(3) | | Number of Funds in Fund Complex Overseen by Fund Trustee | | Other Directorships Held Outside Fund Complex by Fund Trustee(3) | |
| Fund Trustees who are "Interested Persons" | |
| Joseph V. Amato* (1962) | | Trustee since 2009 | | President and Director, Neuberger Berman Group LLC, since 2009; President and Chief Executive Officer, Neuberger and Neuberger Berman Holdings LLC (including its predecessor, Neuberger Berman Inc.), since 2007; Chief Investment Officer, Neuberger, since 2009; Chief Investment Officer (Equities) and Managing Director, Management, since 2009; Managing Director, NBFI, since 2007; Board member of NBFI since 2006; formerly, Global Head of Asset Management of Lehman Brothers Holdings Inc.'s ("LBHI") Investment Management Division, 2006 to 2009; formerly, member of LBHI's Investment Management Division's Executive Management Committee, 2006 to 2009; formerly, Managing Director, Lehman Brothers Inc. ("LBI"), 2006 to 2008; formerly, Chief Recruiting and Development Officer, LBI, 2005 to 2006; formerly, Global Head of LBI's Equity Sales and a Member of its Equities Division Executive Committee, 2003 to 2005. | | | 50 | | | Member of Board of Advisors, McDonough School of Business, Georgetown University, since 2001; Member of New York City Board of Advisors, Teach for America, since 2005; Trustee, Montclair Kimberley Academy (private school), since 2007. | |
28
Name, (Year of Birth), and Address(1) | | Position(s) and Length of Time Served(2) | | Principal Occupation(s)(3) | | Number of Funds in Fund Complex Overseen by Fund Trustee | | Other Directorships Held Outside Fund Complex by Fund Trustee(3) | |
| Robert Conti* (1956) | | Chief Executive Officer, President and Trustee since 2008; prior thereto, Executive Vice President in 2008 and Vice President 2000 to 2008 | | Managing Director, Neuberger, since 2007; formerly, Senior Vice President, Neuberger, 2003 to 2006; formerly, Vice President, Neuberger, 1999 to 2003; President and Chief Executive Officer, Management, since 2008; formerly, Senior Vice President, Management, 2000 to 2008; Managing Director, NBFI, since 2009. | | | 50 | | | Director, Staten Island Mental Health Society, since 1994; formerly, Chairman of the Board, Staten Island Mental Health Society, 2008 to 2011. | |
(1) The business address of each listed person is 605 Third Avenue, New York, New York 10158.
(2) Pursuant to the Trust's Trust Instrument, each of these Fund Trustees shall hold office for life or until his or her successor is elected or the Trust terminates; except that (a) any Fund Trustee may resign by delivering a written resignation; (b) any Fund Trustee may be removed with or without cause at any time by a written instrument signed by at least two-thirds of the other Fund Trustees; (c) any Fund Trustee who requests to be retired, or who has become unable to serve, may be retired by a written instrument signed by a majority of the other Fund Trustees; and (d) any Fund Trustee may be removed at any shareholder meeting by a vote of at least two-thirds of the outstanding shares.
(3) Except as otherwise indicated, each individual has held the positions shown for at least the last five years.
* Indicates a Fund Trustee who is an "interested person" within the meaning of the 1940 Act. Mr. Amato and Mr. Conti are interested persons of the Trust by virtue of the fact that each is an officer of Management, Neuberger and/or their affiliates.
29
Information about the Officers of the Trust
Name, (Year of Birth), and Address(1) | | Position(s) and Length of Time Served(2) | | Principal Occupation(s)(3) | |
| Andrew B. Allard (1961) | | Chief Legal Officer since 2013 (only for purposes of sections 307 and 406 of the Sarbanes-Oxley Act of 2002) and Anti-Money Laundering Compliance Officer since 2002 | | Senior Vice President, Neuberger, since 2006 and Employee since 1999; Deputy General Counsel, Neuberger, since 2004; formerly, Vice President, Neuberger, 2000 to 2005; formerly, Employee, Management, 1994 to 1999; Chief Legal Officer since 2013 (only for purposes of sections 307 and 406 of the Sarbanes-Oxley Act of 2002) and Anti-Money Laundering Compliance Officer since 2002, nine registered investment companies for which Management acts as investment manager and administrator (six since 2002, one since 2003, one since 2005 and one since 2006). | |
| Claudia A. Brandon (1956) | | Executive Vice President since 2008 and Secretary since 1985 | | Senior Vice President, Neuberger, since 2007 and Employee since 1999; Senior Vice President, Management, since 2008 and Assistant Secretary since 2004; formerly, Vice President, Neuberger, 2002 to 2006; formerly, Vice President—Mutual Fund Board Relations, Management, 2000 to 2008; formerly, Vice President, Management, 1986 to 1999 and Employee 1984 to 1999; Executive Vice President, nine registered investment companies for which Management acts as investment manager and administrator (nine since 2008); Secretary, nine registered investment companies for which Management acts as investment manager and administrator (three since 1985, three since 2002, one since 2003, one since 2005 and one since 2006). | |
| Anthony DiBernardo (1979) | | Assistant Treasurer since 2011 | | Vice President, Neuberger, since 2009; Employee, Management, since 2003; Assistant Treasurer, nine registered investment companies for which Management acts as investment manager and administrator (nine since 2011). | |
| Sheila R. James (1965) | | Assistant Secretary since 2002 | | Vice President, Neuberger, since 2008 and Employee since 1999; formerly, Assistant Vice President, Neuberger, 2007; formerly, Employee, Management, 1991 to 1999; Assistant Secretary, nine registered investment companies for which Management acts as investment manager and administrator (six since 2002, one since 2003, one since 2005 and one since 2006). | |
| Brian Kerrane (1969) | | Vice President since 2008 | | Senior Vice President, Neuberger, since 2006; formerly, Vice President, Neuberger, 2002 to 2006; Vice President, Management, since 2008 and Employee since 1991; Vice President, nine registered investment companies for which Management acts as investment manager and administrator (nine since 2008). | |
30
Name, (Year of Birth), and Address(1) | | Position(s) and Length of Time Served(2) | | Principal Occupation(s)(3) | |
| Kevin Lyons (1955) | | Assistant Secretary since 2003 | | Assistant Vice President, Neuberger, since 2008 and Employee since 1999; formerly, Employee, Management, 1993 to 1999; Assistant Secretary, nine registered investment companies for which Management acts as investment manager and administrator (seven since 2003, one since 2005 and one since 2006). | |
| Owen F. McEntee, Jr. (1961) | | Vice President since 2008 | | Vice President, Neuberger, since 2006; Employee, Management, since 1992; Vice President, nine registered investment companies for which Management acts as investment manager and administrator (nine since 2008). | |
| John M. McGovern (1970) | | Treasurer and Principal Financial and Accounting Officer since 2005 | | Senior Vice President, Neuberger, since 2007; formerly, Vice President, Neuberger, 2004 to 2006; Employee, Management, since 1993; Treasurer and Principal Financial and Accounting Officer, nine registered investment companies for which Management acts as investment manager and administrator (eight since 2005 and one since 2006); formerly, Assistant Treasurer, eight registered investment companies for which Management acts as investment manager and administrator, 2002 to 2005. | |
| Frank Rosato (1971) | | Assistant Treasurer since 2005 | | Vice President, Neuberger, since 2006; Employee, Management, since 1995; Assistant Treasurer, nine registered investment companies for which Management acts as investment manager and administrator (eight since 2005 and one since 2006). | |
| Neil S. Siegel (1967) | | Vice President since 2008 | | Managing Director, Management, since 2008; Managing Director, Neuberger, since 2006; formerly, Senior Vice President, Neuberger, 2004 to 2006; Vice President, nine registered investment companies for which Management acts as investment manager and administrator (nine since 2008). | |
| Chamaine Williams (1971) | | Chief Compliance Officer since 2005 | | Senior Vice President, Neuberger, since 2007; Chief Compliance Officer, Management, since 2006; Chief Compliance Officer, nine registered investment companies for which Management acts as investment manager and administrator (eight since 2005 and one since 2006); formerly, Senior Vice President, LBI, 2007 to 2008; formerly, Vice President, LBI, 2003 to 2006; formerly, Chief Compliance Officer, Lehman Brothers Asset Management Inc., 2003 to 2007; formerly, Chief Compliance Officer, Lehman Brothers Alternative Investment Management LLC, 2003 to 2007. | |
(1) The business address of each listed person is 605 Third Avenue, New York, New York 10158.
(2) Pursuant to the By-Laws of the Trust, each officer elected by the Fund Trustees shall hold office until his or her successor shall have been elected and qualified or until his or her earlier death, inability to serve, or resignation. Officers serve at the pleasure of the Fund Trustees and may be removed at any time with or without cause.
(3) Except as otherwise indicated, each individual has held the positions shown for at least the last five years.
31
Proxy Voting Policies and Procedures
A description of the policies and procedures that the Trust uses to determine how to vote proxies relating to portfolio securities is available, without charge, by calling 1-800-877-9700 (toll-free) and on the website of the Securities and Exchange Commission, at www.sec.gov. Information regarding how the Trust voted proxies relating to portfolio securities during the most recent 12-month period ended June 30 is also available, without charge, by calling 1-800-877-9700 (toll-free), on the website of the Securities and Exchange Commission at www.sec.gov, and on Management's website at www.nb.com.
Quarterly Portfolio Schedule
The Trust files a complete schedule of portfolio holdings for the Fund with the Securities and Exchange Commission for the first and third quarters of each fiscal year on Form N-Q. The Trust's Forms N-Q are available on the Securities and Exchange Commission's website at www.sec.gov and may be reviewed and copied at the Securities and Exchange Commission's Public Reference Room in Washington, DC. Information on the operation of the Public Reference Room may be obtained by calling 1-800-SEC-0330. The information on Form N-Q is available upon request, without charge, by calling 1-800-877-9700 (toll free).
Notice to Shareholders
100.00% of the dividends earned during the fiscal year ended December 31, 2012 qualifies for the dividend received deduction for corporate shareholders.
The Fund hereby designates $665,371 as a capital gain distribution.
Board Consideration of the Management and Sub-Advisory Agreements
At a meeting held on October 25, 2012, the Board of Trustees of Neuberger Berman Advisers Management Trust ("Board"), including the Trustees who are not "interested persons" of Neuberger Berman Management LLC ("Management") (including its affiliates) or Neuberger Berman Advisers Management Trust ("Independent Fund Trustees"), approved the continuance of the Management and Sub-Advisory Agreements ("Agreements") for Guardian Portfolio ("Fund").
In evaluating the Agreements, the Board, including the Independent Fund Trustees, reviewed materials furnished by Management in response to questions submitted by counsel for the Independent Fund Trustees, and met with senior representatives of Management regarding their personnel, operations and financial conditions as they relate to the Fund. The Independent Fund Trustees were advised by counsel that is experienced in Investment Company Act of 1940 matters and that is independent of Management. The Independent Fund Trustees received a memorandum from independent counsel discussing the legal standards for their consideration of the proposed continuance of the Agreements. They met with such counsel separately from representatives of Management to discuss the annual contract review. The annual contract review extends over three regular meetings of the Board, including one meeting devoted primarily to reviewing and discussing Fund performance, to ensure that Management has time to respond to any questions the Independent Fund Trustees may have on their initial review of the report and that the Independent Fund Trustees have time to consider those responses.
The Board considered the following factors, among others, in connection with its approval of the continuance of the Agreements: (1) the nature, extent, and quality of the services provided by Management and Neuberger Berman LLC ("Neuberger"); (2) the performance of the Fund compared to a relevant market index and a peer group of investment companies; (3) the costs of the services provided and profits or losses realized by Management and its affiliates from their relationship with the Fund; (4) the extent to which economies of scale might be realized as the Fund grows; and (5) whether fee levels reflect any such potential economies of scale for the benefit of investors in the Fund. In their deliberations, the Board members did not identify any particular information that was all-important or controlling, and each Trustee may have attributed different weights to the various factors.
32
The Board evaluated the terms of the Agreements, the overall fairness of the Agreements to the Fund and whether the Agreements were in the best interests of the Fund and its shareholders.
With respect to the nature, extent and quality of the services provided, the Board considered the performance of the Fund and the experience and staffing of the portfolio management personnel of Management and Neuberger who perform services for the Fund. The Board noted that Management also provides certain administrative services, including fund accounting and compliance oversight. The Board also considered Management's and Neuberger's policies and practices regarding brokerage and allocation of portfolio transactions by Management. The Board's Portfolio Transactions and Pricing Committee from time to time reviewed the quality of the execution services that Management and Neuberger had provided, and periodically reviewed studies by an independent firm engaged to review and evaluate the quality of brokerage execution received by the Fund. The Board also reviewed whether Management and Neuberger used brokers to execute Fund transactions that provide research and other services to Management and Neuberger, and the types of benefits potentially derived from such services by Management, Neuberger, the Fund and other clients of Management and Neuberger. In addition, the Board noted the positive compliance history of Management and Neuberger, as each firm has been free of significant reported compliance problems. As in past years, the Board also considered the manner in which Management addressed various non-routine matters that arose during the year, some of them a result of developments in the broader fund industry or the regulations governing it.
The Board considered the performance of the Fund relative to its benchmark and the average performance of composite peer groups of investment companies dedicated to insurance products pursuing broadly similar strategies. The Board also reviewed performance during the period in relation to certain measures of the degree of investment risk undertaken by the portfolio managers. The Board discussed with Management the Fund's performance and steps that Management had under consideration to improve performance. The Board also considered Management's resources and responsiveness with respect to the Fund.
With respect to the overall fairness of the Agreements, the Board considered the fee structure for the Fund under the Agreements as compared to a peer group of comparable funds and any fall-out benefits likely to accrue to Management or Neuberger or their affiliates from their relationship with the Fund. The Board also considered the profitability of Management and its affiliates from their association with the Fund.
The Board reviewed a comparison of the Fund's management fee and overall expense ratio to a peer group of broadly comparable non-proprietary funds dedicated to insurance products. The Board considered the mean and median of the management fees and expense ratios of the peer group. The Board noted that the Fund's management fee was higher than the peer group mean and median. The Board considered whether specific portfolio management or administration needs contributed to the management fee. The Board also considered the contractual limit on Fund expenses undertaken by Management. With regard to the sub-advisory fee paid to Neuberger, the Board noted that this fee is "at cost."
The Board considered whether there were other funds that were advised or sub-advised by Management or its affiliates or separate accounts managed by Management or its affiliates with investment objectives, policies and strategies that were similar to the Fund. If so, the Board compared the fees charged to the Fund to the fees charged to any such other funds and/or separate accounts. The Board considered the appropriateness and reasonableness of any differences between the fees charged to the Fund and any such other funds and/or separate accounts and determined that the differences in fees were consistent with the management and other services provided.
The Board also evaluated any apparent or anticipated economies of scale in relation to the services Management provides to the Fund. The Board considered whether the Fund's fee structure provides for a reduction of payments resulting from the use of breakpoints and whether those breakpoints are set at appropriate asset levels. In concluding that the benefits accruing to Management and its affiliates by virtue of their relationship to the Fund were reasonable in comparison with the costs of providing the investment advisory and other services and the benefits accruing to the Fund, the Board reviewed specific data as to Management's profit on the Fund for a recent period. The Board also carefully examined Management's cost allocation methodology. The Board recognized that Management should be entitled to earn a reasonable level of profits for services it provides to the Fund and, based on its review, concluded that Management's level of profitability was not excessive.
33
Conclusions
In approving the Agreements, the Board concluded that the terms of each Agreement are fair and reasonable and that approval of the Agreements is in the best interests of the Fund and its shareholders. In reaching this determination, the Board considered that Management and Neuberger could be expected to provide a high level of service to the Fund; that it retained confidence in Management's and Neuberger's capabilities to manage the Fund; that the Fund's fee structure appeared to the Board to be reasonable given the nature and quality of services provided; and that the benefits accruing to Management and its affiliates by virtue of their relationship to the Fund were reasonable in comparison with the benefits accruing to the Fund.
34
Neuberger Berman
Advisers Management Trust
International Portfolio
S Class Shares
Annual Report
December 31, 2012
F0509 02/13
International Portfolio Commentary (Unaudited)The Neuberger Berman Advisers Management Trust (AMT) International Portfolio posted a total return of 18.48% for the fiscal year ended December 31, 2012, and outperformed its benchmark, the MSCI EAFE® Index, which posted a return of 17.90% for the same period.
During 2012, all major indices posted positive returns, with the U.S., international developed and emerging markets (EM) rising by a mid-teens percentage in U.S. dollar and local currency terms. The U.S. was the laggard of the three, while EM was the leader in dollar terms.
Macroeconomic uncertainty colored the markets throughout the year. Markets rallied in the first quarter, gave back most of their early gains in the second quarter, and then finished strongly during the second half of the year. The international markets were buoyed by a variety of positive indicators, such as a more cohesive eurozone and supportive European Central Bank (ECB), with Greece receiving the next tranche of bailout funds; a potentially stronger export-driven Japan aided by a weaker yen; and stabilizing Chinese industrial production.
As the market gained confidence that risk of a eurozone sovereign debt crisis was removed for the short-term, Financials rallied by more than 33%. Consumer Discretionary stocks—led by the automobile industry, which outperformed on growing U.S. and Asian sales—gained over 25%. Many European country indices were up by more than 20%, led by Belgium, Denmark and Germany. While there was some relief during the second half of the year, countries like Spain, Portugal and Greece lagged for the year. Weaker sectors included Telecommunication Services and Energy, which ended the year virtually flat.
Within the Portfolio, most sector, stock selection and allocation decisions were positive relative to the index, with stock selection in Industrials and Health Care being particularly beneficial. Though our Financials holdings were up by over 20% for the year, this sector was our only key area of relative underperformance. The Portfolio underperformed within Financials due to both our underexposure and stock selection away from the most volatile names. At present, we continue to view this area with caution on both regulatory and business model concerns. By country, Japanese holdings were our leading contributors, while German and Canadian holdings hurt relative returns.
Top contributors included Sulzer, Neo Material Technologies (which was sold during the fiscal year) and Samsung Electronics. Sulzer, the global pumps and surface coatings manufacturer, announced a healthy order book that demonstrated accelerating demand for its products. Neo Material Technologies, the rare-earth materials processer, received a takeover bid, and Samsung, the Korean consumer electronics and semiconductor manufacturer, continues to enjoy record sales of its smartphones.
Detractors for the year included Peyto Exploration (which was sold during the fiscal year), Goldcorp (which was sold prior to the end of the fourth quarter) and Willis Group Holdings. Peyto, a low-cost Canadian natural gas producer, was expected to lose its cost advantage to U.S. producers given their closer proximity to gas consumers. Goldcorp, a leading Canadian gold producer, declined on concerns about its 2013 - 2014 production growth and capital expenditure plans. Willis, the corporate insurance broker, disappointed with weaker-than-expected sales. We believe it may benefit from higher insurance rates going forward.
Most markets closed the year on a positive note, following supportive policy news across several geographies. As mentioned above, European markets rebounded on the back of the ECB, International Monetary Fund and European Union agreeing to disburse Greece's next tranche of bailout funds. Japan also rallied as the Liberal Democratic Party regained power with a promise to use looser monetary policy to boost the economy by ending the long-term deflationary environment, thereby weakening the yen and boosting exports. China's latest industrial activity seemed to have bottomed, which in turn galvanized emerging markets more broadly. U.S. markets fluctuated with confidence regarding a potentially sensible resolution of the fiscal cliff, ultimately yielding, what some economist estimated, a conceivable 1.5 - 2.0% drag on U.S. GDP. Although underlying economic growth is relatively weak for this stage in the cycle, markets in 2012 took confidence from central banks' commitment to reduce the "tail risk" of financial crisis in the U.S. and Europe.
1
While the markets may continue to rally on positive headlines, developed markets still face ongoing political and economic uncertainty. As a result, we remain focused on identifying businesses less dependent on an economic rebound, including companies with well-positioned brands and global operations, as we believe these firms are best able to manage through an economic recovery. At present we are finding value in select emerging markets companies that enjoy strong competitive advantages, such as innovative technologies and dominant market share in growing niches.
Industrials is our largest sector overweight, where we hold distribution businesses that we believe have strong recurring revenue streams. Our second leading overweight is in Materials, with a focus on precious metal miners and specialty chemical companies with pricing power and what we believe are relatively stable end markets. We are also slightly overweighted in the Consumer Discretionary sector at this time, where we currently favor auto-parts firms and media names that have historically generated recurring revenue streams. We remain underweighted in Financials, despite the easy monetary conditions that have driven this sector's market-leading performance in 2012. We remain of the view that higher capital requirements and weak demand limit the attractiveness of the major banks and insurers in the developed world. Geographically, our Financials exposure is currently tilted towards to the Nordic and emerging markets, where we believe the economies are on firmer ground and currency fundamentals are more robust than in the eurozone or Japan.
Overall, despite the 2012 market being driven by macroeconomics rather than company earnings, we were pleased with our stock selection and performance during the year. We continue to expect our bottom-up "quality at a reasonable price" discipline to form the foundation of a Portfolio that we believe can outperform over time.
Sincerely,
BENJAMIN SEGAL
PORTFOLIO MANAGER
Information about the principal risks of investing in the Portfolio is set forth in the prospectus and statement of additional information.
The portfolio composition, industries and holdings of the Portfolio are subject to change.
Opinions expressed are as of the date herein and are subject to change without notice. This material is not intended to be a formal research report and should not be construed as an offer to sell or the solicitation of an offer to buy any security.
2
International Portfolio (Unaudited)
SECTOR ALLOCATION
| (as a % of Total Investments) | |
| Consumer Discretionary | | | 12.7 | % | |
| Consumer Staples | | | 10.8 | | |
| Energy | | | 8.3 | | |
| Financials | | | 16.4 | | |
| Health Care | | | 9.7 | | |
| Industrials | | | 17.7 | | |
| Information Technology | | | 4.9 | | |
| Materials | | | 14.2 | | |
| Telecommunication Services | | | 3.8 | | |
| Other | | | 1.4 | | |
| Short-Term Investments | | | 0.1 | | |
| Total | | | 100.0 | % | |
PERFORMANCE HIGHLIGHTS
| | | Inception | | Average Annual Total Return Ended 12/31/2012 | |
| | | Date | | 1 Year | | 5 Years | | Life of Fund | |
| International Portfolio Class S | | 04/29/2005 | | | 18.48 | % | | | –1.80 | % | | | 4.15 | % | |
MSCI EAFE® Index1,2 | | | | | 17.90 | % | | | –3.21 | % | | | 4.56 | % | |
The performance data quoted represent past performance and do not indicate future results. Current performance may be lower or higher than the performance data quoted. For more current performance data, please visit www.nb.com.
The results shown in the table reflect the reinvestment of income dividends and other distributions, if any. The results do not reflect the effect of taxes a shareholder would pay on Portfolio distributions or on the redemption of Portfolio shares. The results do not reflect fees and expenses of the variable annuity and variable life insurance policies or the qualified pension and retirement plans whose proceeds are invested in the Portfolio.
The investment return and principal value of an investment will fluctuate and shares, when redeemed, may be worth more or less than their original cost.
Returns would have been lower if Neuberger Berman Management LLC ("Management") had not reimbursed certain expenses and/or waived a portion of the investment management fees during certain of the periods shown. Repayment by a class (of expenses previously reimbursed and/or fees previously waived by Management) will decrease the class's returns. Please see Note B in the Notes to Financial Statements for specific information regarding expense reimbursement and/or fee waiver arrangements.
COMPARISON OF A $10,000 INVESTMENT
This graph shows the change in value of a hypothetical $10,000 investment in the Portfolio over the past 10 fiscal years, or since the Portfolio's inception if it has not operated for 10 years. The result is compared with benchmarks, which include a broad-based market index and may include a more narrowly based index. Market indices have not been reduced to reflect any of the fees and costs of investing. The results shown in the graph reflect the reinvestment of income dividends and other distributions, if any. The results do not reflect the effect of taxes a shareholder would pay on Portfolio distributions or on the redemption of Portfolio shares. Results represent past performance and do not indicate future results.
Please see Endnotes for additional information.
3
Endnotes (Unaudited)
1 The date used to calculate Life of Fund performance for the index is the inception date of the oldest share class.
2 The MSCI EAFE® Index (Europe, Australasia, Far East) is a free float-adjusted market capitalization index that is designed to measure the equity market performance of developed markets, excluding the U.S. & Canada. As of May 2010, the MSCI EAFE Index consisted of the following 22 developed market country indices: Australia, Austria, Belgium, Denmark, Finland, France, Germany, Greece, Hong Kong, Ireland, Israel, Italy, Japan, the Netherlands, New Zealand, Norway, Portugal, Singapore, Spain, Sweden, Switzerland and the United Kingdom. Please note that indices do not take into account any fees, expenses or tax consequences of investing in the individual securities that they track, and individuals cannot invest directly in any index. Data about the performance of an index is prepared or obtained by Neuberger Berman Management LLC ("Management") and reflects the reinvestment of income dividends and other distributions, if any. The Portfolio may invest in securities not included in a described index and/or may not invest in all securities included in a described index.
Any ratios or other measurements using a factor of forecasted earnings of a company discussed herein are based on consensus estimates, not Management's own projections, and they may or may not be realized. In addition, any revision to a forecast could affect the market price of a security. By quoting them herein, Management does not offer an opinion as to the accuracy of, and does not guarantee, these forecasted numbers.
The investments for the Portfolio are managed by the same portfolio manager(s) who manage(s) one or more other registered funds that have names, investment objectives and investment styles that are similar to those of the Portfolio. You should be aware that the Portfolio is likely to differ from the other mutual fund(s) in size, cash flow pattern and tax matters. Accordingly, the holdings and performance of the Portfolio can be expected to vary from those of the other mutual fund(s).
Shares of the separate AMT Portfolios are not available to the general public. Shares of this Portfolio may be purchased only by life insurance companies to be used with their separate accounts that fund variable annuity and variable life insurance policies and by qualified pension and retirement plans.
Statistics and projections in this report are derived from sources deemed to be reliable but cannot be regarded as a representation of future results of the AMT Portfolios. This report is prepared for the general information of shareholders and is not an offer of shares of the AMT Portfolios. Shares of the AMT Portfolios are sold only through the currently effective prospectuses, which must precede or accompany this report.
The "Neuberger Berman" name and logo are registered service marks of Neuberger Berman Group LLC. "Neuberger Berman Management LLC" and the individual Fund names in this piece are either service marks or registered service marks of Neuberger Berman Management LLC.
© 2013 Neuberger Berman Management LLC distributor. All rights reserved.
4
Information About Your Fund's Expenses (Unaudited)
As a Fund shareholder, you incur two types of costs: (1) transaction costs such as fees and expenses that are, or may be, imposed under your variable contract or qualified pension plan; and (2) ongoing costs, including management fees; distribution and/or service (12b-1) fees (if applicable); and other Fund expenses. This example is intended to help you understand your ongoing costs (in dollars) of investing in the Fund and compare these costs with the ongoing costs of investing in other mutual funds.
This table is designed to provide information regarding costs related to your investments. The following examples are based on an investment of $1,000 made at the beginning of the six month period ended December 31, 2012 and held for the entire period. The table illustrates the Fund's costs in two ways:
| Actual Expenses and Performance: | | The first section of the table provides information about actual account values and actual expenses in dollars, based on the Fund's actual performance during the period. You may use the information in this line, together with the amount you invested, to estimate the expenses you paid over the period. Simply divide your account value by $1,000 (for example, an $8,600 account value divided by $1,000 = 8.6), then multiply the result by the number in the first section of the table under the heading entitled "Expenses Paid During the Period" to estimate the expenses you paid over the period. | |
Hypothetical Example for Comparison Purposes: | | The second section of the table provides information about hypothetical account values and hypothetical expenses based on the Fund's actual expense ratio and an assumed rate of return at 5% per year before expenses. This return is not the Fund's actual return. The hypothetical account values and expenses may not be used to estimate the actual ending account balance or expenses you paid for the period. You may use this information to compare the ongoing costs of investing in this Fund versus other funds. To do so, compare the expenses shown in this 5% hypothetical example with the 5% hypothetical examples that appear in the shareholder reports of other funds. | |
Please note that the expenses in the table are meant to highlight your ongoing costs only and do not include any transaction costs, such as fees and expenses that are, or may be imposed under your variable contract or qualified pension plan. Therefore, the information under the heading "Hypothetical (5% annual return before expenses)" is useful in comparing ongoing costs only, and will not help you determine the relative total costs of owning different funds. In addition, if these transaction costs were included, your costs would have been higher.
Expense Information as of 12/31/12
NEUBERGER BERMAN ADVISERS MANAGEMENT TRUST INTERNATIONAL PORTFOLIO
| Actual | | Beginning Account Value 7/1/12 | | Ending Account Value 12/31/12 | | Expenses Paid During the Period* 7/1/12 – 12/31/12 | |
| Class S | | $ | 1,000.00 | | | $ | 1,127.40 | | | $ | 8.02 | | |
| Hypothetical (5% annual return before expenses)** | |
| Class S | | $ | 1,000.00 | | | $ | 1,017.60 | | | $ | 7.61 | | |
* Expenses are equal to the annualized expense ratio of 1.50%, multiplied by the average account value over the period, multiplied by 184/366 (to reflect the one-half year period shown).
** Hypothetical 5% annual return before expenses is calculated by multiplying the number of days in the most recent half year divided by 366.
5
Schedule of Investments International Portfolio
| NUMBER OF SHARES | | | | VALUE† | |
| Common Stocks (98.4%) | | | |
| Australia (1.9%) | | | |
| | 3,025 | | | CSL Ltd. | | $ | 170,783 | | |
| | 13,450 | | | Iluka Resources Ltd. | | | 129,981 | | |
| | 42,020 | | | Imdex Ltd. | | | 75,284 | | |
| | | | 376,048 | | |
| Belgium (1.9%) | | | |
| | 1,934 | | | Anheuser-Busch InBev NV | | | 168,422 | | |
| | 4,090 | | | Colruyt SA | | | 202,803 | | |
| | | | 371,225 | | |
| Canada (7.2%) | | | |
| | 4,042 | | | Cenovus Energy, Inc. | | | 135,275 | | |
| | 9,682 | | | Corus Entertainment, Inc., B Shares | | | 239,252 | | |
| | 2,780 | | | Home Capital Group, Inc. | | | 165,090 | | |
| | 3,488 | | | MacDonald, Dettwiler & Associates Ltd. | | | 196,229 | | |
| | 22,550 | | | New Gold, Inc. | | | 249,598 | * | |
| | 7,325 | | | Silver Wheaton Corp. | | | 264,074 | | |
| | 3,132 | | | Vermilion Energy, Inc. | | | 163,637 | | |
| | | | 1,413,155 | | |
| Chile (1.0%) | | | |
| | 3,430 | | | Sociedad Quimica y Minera de Chile SA ADR | | | 197,705 | | |
| China (2.8%) | | | |
| | 295,900 | | | China Liansu Group Holdings Ltd. | | | 206,750 | | |
| | 3,250 | | | China Mobile Ltd. ADR | | | 190,840 | | |
| | 207,000 | | | Industrial & Commercial Bank of China Ltd., H Shares | | | 149,408 | | |
| | | | 546,998 | | |
| Czech Republic (0.2%) | | | |
| | 145 | | | Komercni Banka A/S | | | 30,653 | | |
| Denmark (2.7%) | | | |
| | 874 | | | Novo Nordisk A/S Class B | | | 142,319 | | |
| | 7,755 | | | Sydbank A/S | | | 137,474 | * | |
| | 3,276 | | | Tryg A/S | | | 247,944 | | |
| | | | 527,737 | | |
| France (6.0%) | | | |
| | 2,530 | | | Arkema SA | | | 265,647 | | |
| | 4,303 | | | Eutelsat Communications SA | | | 143,119 | | |
| | 1,295 | | | Pernod-Ricard SA | | | 150,247 | | |
| | 12,960 | | | Rexel SA | | | 265,067 | | |
| | 4,096 | | | Sodexo | | | 346,106 | | |
| | | | 1,170,186 | | |
| NUMBER OF SHARES | | | | VALUE† | |
| Germany (7.8%) | | | |
| | 1,955 | | | Brenntag AG | | $ | 257,562 | | |
| | 990 | | | Continental AG | | | 115,388 | | |
| | 3,801 | | | Deutsche Boerse AG | | | 233,085 | | |
| | 12,415 | | | Deutsche Telekom AG | | | 141,319 | | |
| | 2,130 | | | Fresenius Medical Care AG & Co. | | | 146,995 | | |
| | 3,833 | | | Gerresheimer AG | | | 203,666 | * | |
| | 1,571 | | | Linde AG | | | 274,844 | | |
| | 5,805 | | | NORMA Group | | | 161,046 | ñ | |
| | | | 1,533,905 | | |
| Indonesia (0.8%) | | | |
| | 175,400 | | | PT Bank Mandiri (Persero)Tbk | | | 148,163 | | |
| Ireland (0.7%) | | | |
| | 4,450 | | | DCC PLC | | | 145,670 | | |
| Israel (1.6%) | | | |
| | 83,335 | | | Bezeq Israeli Telecommunication Corp. Ltd. | | | 96,527 | | |
| | 4,620 | | | Check Point Software Technologies Ltd. | | | 220,097 | * | |
| | | | 316,624 | | |
| Japan (14.2%) | | | |
| | 6,000 | | | DAIKIN INDUSTRIES Ltd. | | | 206,095 | | |
| | 1,100 | | | FANUC Corp. | | | 204,654 | | |
| | 396 | | | Jupiter Telecommunications Co. Ltd. | | | 491,026 | | |
| | 18,600 | | | KANSAI PAINT Co. Ltd. | | | 200,450 | | |
| | 49 | | | Kenedix Realty Investment Corp. | | | 170,817 | | |
| | 700 | | | KEYENCE Corp. | | | 194,127 | | |
| | 7,600 | | | Nihon Kohden Corp. | | | 230,917 | | |
| | 3,100 | | | PIGEON Corp. | | | 148,356 | | |
| | 1,200 | | | SMC Corp. | | | 217,985 | | |
| | 2,300 | | | SOFTBANK Corp. | | | 84,275 | | |
| | 4,800 | | | SUGI HOLDINGS Co. Ltd. | | | 169,341 | | |
| | 7,800 | | | Sundrug Co. Ltd. | | | 266,794 | | |
| | 4,600 | | | TOYOTA MOTOR Corp. | | | 214,802 | | |
| | | | 2,799,639 | | |
| Korea (3.6%) | | | |
| | 719 | | | Hyundai Mobis | | | 195,071 | * | |
| | 475 | | | Samsung Electronics Co. Ltd. GDR | | | 340,957 | | |
| | 4,460 | | | Shinhan Financial Group Ltd. ADR | | | 163,415 | * | |
| | | | 699,443 | | |
| Netherlands (5.2%) | | | |
| | 3,616 | | | Akzo Nobel NV | | | 239,367 | | |
| | 15,790 | | | Koninklijke Ahold NV | | | 211,728 | | |
| | 3,060 | | | Nutreco NV | | | 260,139 | | |
| | 8,280 | | | Unilever NV | | | 316,823 | | |
| | | | 1,028,057 | | |
See Notes to Schedule of Investments
6
| NUMBER OF SHARES | | | | VALUE† | |
| Norway (2.6%) | | | |
| | 18,516 | | | DnB ASA | | | 236,665 | | |
| | 59,500 | | | Norwegian Property ASA | | | 92,117 | | |
| | 22,189 | | | ProSafe SE | | | 190,388 | | |
| | | | 519,170 | | |
| Russia (1.6%) | | | |
| | 1,015 | | | NovaTek OAO GDR | | | 124,000 | | |
| | 14,985 | | | Sberbank of Russia ADR | | | 187,868 | | |
| | | | 311,868 | | |
| Singapore (1.0%) | | | |
| | 12,000 | | | United Overseas Bank Ltd. | | | 196,848 | | |
| Sweden (3.3%) | | | |
| | 2,135 | | | Autoliv, Inc. | | | 143,878 | | |
| | 14,557 | | | Elekta AB, B Shares | | | 226,979 | | |
| | 9,325 | | | Nordea Bank AB | | | 89,696 | | |
| | 18,595 | | | Telefonaktiebolaget LM Ericsson, B Shares | | | 187,833 | | |
| | | | 648,386 | | |
| Switzerland (12.5%) | | | |
| | 1,041 | | | Bucher Industries AG | | | 205,943 | | |
| | 244 | | | Givaudan SA | | | 257,856 | * | |
| | 245 | | | Kaba Holding AG | | | 103,960 | * | |
| | 3,484 | | | Nestle SA | | | 227,308 | | |
| | 3,057 | | | Novartis AG | | | 193,121 | | |
| | 865 | | | Partners Group Holding AG | | | 199,970 | | |
| | 1,661 | | | Roche Holding AG | | | 335,823 | | |
| | 147 | | | SGS SA | | | 326,496 | | |
| | 93 | | | Sika AG | | | 215,104 | | |
| | 2,465 | | | Sulzer AG | | | 390,133 | | |
| | | | 2,455,714 | | |
| Turkey (0.5%) | | | |
| | 124,063 | | | Sinpas Gayrimenkul Yatirim Ortakligi A/S | | | 98,704 | | |
| United Kingdom (19.3%) | | | |
| | 65,810 | | | Afren PLC | | | 142,807 | * | |
| | 40,152 | | | Amlin PLC | | | 249,612 | | |
| | 7,940 | | | BG Group PLC | | | 132,438 | | |
| | 6,230 | | | BHP Billiton PLC | | | 219,754 | | |
| | 13,533 | | | Bunzl PLC | | | 223,995 | | |
| | 24,735 | | | Cairn Energy PLC | | | 108,013 | * | |
| | 16,820 | | | Diploma PLC | | | 151,507 | | |
| | 18,800 | | | Direct Line Insurance Group PLC | | | 66,088 | * | |
| | 11,057 | | | Experian PLC | | | 178,205 | | |
| | 26,600 | | | ICAP PLC | | | 134,507 | | |
| | 20,473 | | | Informa PLC | | | 150,928 | | |
| | 48,549 | | | Mitie Group PLC | | | 208,698 | | |
| | 8,830 | | | Petrofac Ltd. | | | 235,990 | | |
| | 9,879 | | | Reed Elsevier PLC | | | 104,299 | | |
| | 3,600 | | | Rio Tinto PLC | | | 209,972 | | |
| | 50,155 | | | RPS Group PLC | | | 173,397 | | |
| | 9,364 | | | Subsea 7 SA | | | 225,038 | | |
| NUMBER OF SHARES | | | | VALUE† | |
| | 13,985 | | | Synergy Health PLC | | $ | 248,086 | | |
| | 8,448 | | | Tullow Oil PLC | | | 176,119 | | |
| | 91,826 | | | Vodafone Group PLC | | | 231,150 | | |
| | 7,130 | | | Willis Group Holdings PLC | | | 239,069 | | |
| | | | 3,809,672 | | |
| | | | | Total Common Stocks (Cost $16,701,447) | | | 19,345,570 | | |
| Exchange Traded Funds (1.3%) | | | |
| | 5,300 | | | ProShares UltraShort Yen (Cost $255,186) | | | 269,081 | * | |
| Rights (0.0%) | | | |
| Belgium (0.0%) | | | |
| | 112,269 | | | Anheuser-Busch InBev NV VVPR Strip (Cost $43) | | | 148 | * | |
| Short-Term Investments (0.1%) | | | |
| | 10,589 | | | State Street Institutional Treasury Money Market Fund Institutional Class (Cost $10,589) | | | 10,589 | | |
| | | | | Total Investments (99.8%) (Cost $16,967,265) | | | 19,625,388 | ## | |
| | | | | Cash, receivables and other assets, less liabilities (0.2%) | | | 33,829 | | |
| | | | | Total Net Assets (100.0%) | | $ | 19,659,217 | | |
See Notes to Schedule of Investments
7
SUMMARY SCHEDULE OF INVESTMENTS BY INDUSTRY INTERNATIONAL PORTFOLIO (UNAUDITED)
| Industry | | Value† | | Percentage of Net Assets | |
| Chemicals | | $ | 1,650,973 | | | | 8.4 | % | |
| Commercial Banks | | | 1,340,190 | | | | 6.8 | % | |
| Machinery | | | 1,179,761 | | | | 6.0 | % | |
| Metals & Mining | | | 1,148,663 | | | | 5.8 | % | |
| Media | | | 1,128,624 | | | | 5.8 | % | |
| Oil, Gas & Consumable Fuels | | | 982,289 | | | | 5.0 | % | |
| Food & Staples Retailing | | | 850,666 | | | | 4.3 | % | |
| Food Products | | | 804,270 | | | | 4.1 | % | |
| Insurance | | | 802,713 | | | | 4.1 | % | |
| Trading Companies & Distributors | | | 746,624 | | | | 3.8 | % | |
| Pharmaceuticals | | | 671,263 | | | | 3.4 | % | |
| Energy Equipment & Services | | | 651,416 | | | | 3.3 | % | |
| Building Products | | | 516,805 | | | | 2.6 | % | |
| Wireless Telecommunication Services | | | 506,265 | | | | 2.6 | % | |
| Professional Services | | | 504,701 | | | | 2.6 | % | |
| Health Care Equipment & Supplies | | | 457,896 | | | | 2.3 | % | |
| Auto Components | | | 454,337 | | | | 2.3 | % | |
| Software | | | 416,326 | | | | 2.1 | % | |
| Health Care Providers & Services | | | 395,081 | | | | 2.0 | % | |
| Commercial Services & Supplies | | | 382,095 | | | | 2.0 | % | |
| Hotels, Restaurants & Leisure | | | 346,106 | | | | 1.8 | % | |
| Electronic Equipment, Instruments & Components | | | 345,634 | | | | 1.8 | % | |
| Semiconductors & Semiconductor Equipment | | | 340,957 | | | | 1.7 | % | |
| Capital Markets | | | 334,477 | | | | 1.7 | % | |
| Beverages | | | 318,817 | | | | 1.6 | % | |
| Real Estate Investment Trusts | | | 269,521 | | | | 1.4 | % | |
| Exchange Traded Funds | | | 269,081 | | | | 1.3 | % | |
| Diversified Telecommunication Services | | | 237,846 | | | | 1.2 | % | |
| Diversified Financial Services | | | 233,085 | | | | 1.2 | % | |
| Automobiles | | | 214,802 | | | | 1.1 | % | |
| Life Sciences Tools & Services | | | 203,666 | | | | 1.0 | % | |
| Communications Equipment | | | 187,833 | | | | 0.9 | % | |
| Biotechnology | | | 170,783 | | | | 0.9 | % | |
| Thrifts & Mortgage Finance | | | 165,090 | | | | 0.8 | % | |
| Household Products | | | 148,356 | | | | 0.8 | % | |
| Industrial Conglomerates | | | 145,670 | | | | 0.7 | % | |
| Real Estate Management & Development | | | 92,117 | | | | 0.5 | % | |
| Short-Term Investments and Other Assets—Net | | | 44,418 | | | | 0.3 | % | |
| | | $ | 19,659,217 | | | | 100.0 | % | |
See Notes to Schedule of Investments
8
Notes to Schedule of Investments International Portfolio
† In accordance with Accounting Standards Codification ("ASC") 820 "Fair Value Measurements and Disclosures" ("ASC 820"), all investments held by Neuberger Berman Advisers Management Trust International Portfolio (the "Fund") are carried at the value that Neuberger Berman Management LLC ("Management") believes the Fund would receive upon selling an investment in an orderly transaction to an independent buyer in the principal or most advantageous market for the investment under current market conditions. Various inputs, including the volume and level of activity for the asset or liability in the market, are considered in valuing the Fund's investments, some of which are discussed below. Significant management judgment may be necessary to value investments in accordance with ASC 820.
ASC 820 established a three-tier hierarchy of inputs to create a classification of value measurements for disclosure purposes. The three-tier hierarchy of inputs is summarized in the three broad Levels listed below.
• Level 1 – quoted prices in active markets for identical investments
• Level 2 – other significant observable inputs (including quoted prices for similar investments, interest rates, prepayment speeds, credit risk, amortized cost, etc.)
• Level 3 – significant unobservable inputs (including the Fund's own assumptions in determining the fair value of investments)
The inputs or methodology used for valuing an investment are not necessarily an indication of the risk associated with investing in those securities.
The value of the Fund's investments in equity securities and exchange traded funds, for which market quotations are readily available, is generally determined by Management by obtaining valuations from an independent pricing service based on the latest sale price quoted on a principal exchange or market for that security (Level 1 inputs). Securities traded primarily on the NASDAQ Stock Market are normally valued by the Fund at the NASDAQ Official Closing Price ("NOCP") provided by NASDAQ each business day. The NOCP is the most recently reported price as of 4:00:02 p.m., Eastern time, unless that price is outside the range of the "inside" bid and asked prices (i.e., the bid and asked prices that dealers quote to each other when trading for their own accounts); in that case, NASDAQ will adjust the price to equal the inside bid or asked price, whichever is closer. Because of delays in reporting trades, the NOCP may not be based on the price of the last trade to occur before the market closes. If there is no reported sale of a security on a particular day, the independent pricing service may value the security based on reported market quotations.
Management has developed a process to periodically review information provided by independent pricing services for all types of securities.
Investments in State Street Institutional Treasury Money Market Fund Institutional Class are valued using the fund's daily calculated net asset value per share (Level 2 inputs).
If a valuation is not available from an independent pricing service, or if Management has reason to believe that the valuation received does not represent the amount the Fund might reasonably expect to receive on a current sale in an orderly transaction, the Fund seeks to obtain quotations from principal market makers (generally considered Level 3 inputs). If such quotations are not readily available, the security is valued using methods the Neuberger Berman Advisers Management Trust's Board of Trustees (the "Board") has approved on the belief that they reflect fair value. Numerous factors may be considered when determining the fair value of a security based on Level 2 or 3 inputs, including available analyst, media or other reports, trading in futures or ADRs and whether the issuer of the security being fair valued has other securities outstanding.
The value of the Fund's investments in foreign securities is generally determined using the same valuation methods and inputs as other Fund investments, as discussed above. Foreign security prices expressed in local currency values are translated from the local currency into U.S. dollars using the exchange rates as of 4:00 p.m., Eastern time. The Board has approved the use of Interactive Data Pricing and Reference Data, Inc. ("Interactive") to assist in determining the fair value of foreign equity securities when changes in the value of a certain index suggest that the closing prices on the foreign exchanges may no longer represent the amount that the Fund could expect to receive for those securities or on days when foreign markets are closed and U.S. markets are open. In each of these events,
See Notes to Financial Statements
9
Notes to Schedule of Investments International Portfolio (cont'd)
Interactive will provide adjusted prices for certain foreign equity securities using a statistical analysis of historical correlations of multiple factors (Level 2 inputs). In the absence of precise information about the market values of these foreign securities as of the close of the New York Stock Exchange, the Board has determined on the basis of available data that prices adjusted in this way are likely to be closer to the prices the Fund could realize on a current sale than are the prices of those securities established at the close of the foreign markets in which the securities primarily trade.
Fair value prices are necessarily estimates, and there is no assurance that such a price will be at or close to the price at which the security is next quoted or next trades.
The following is a summary, categorized by Level, of inputs used to value the Fund's investments as of December 31, 2012:
| Asset Valuation Inputs | | Level 1 | | Level 2 | | Level 3 | | Total | |
| Investments: | |
| Common Stocks^ | |
| Australia | | $ | — | | | $ | 376,048 | | | $ | — | | | $ | 376,048 | | |
| Belgium | | | — | | | | 371,225 | | | | — | | | | 371,225 | | |
| Canada | | | 1,413,155 | | | | — | | | | — | | | | 1,413,155 | | |
| Chile | | | 197,705 | | | | — | | | | — | | | | 197,705 | | |
| China | | | 190,840 | | | | 356,158 | | | | — | | | | 546,998 | | |
| Czech Republic | | | — | | | | 30,653 | | | | — | | | | 30,653 | | |
| Denmark | | | — | | | | 527,737 | | | | — | | | | 527,737 | | |
| France | | | — | | | | 1,170,186 | | | | — | | | | 1,170,186 | | |
| Germany | | | — | | | | 1,533,905 | | | | — | | | | 1,533,905 | | |
| Indonesia | | | — | | | | 148,163 | | | | — | | | | 148,163 | | |
| Ireland | | | 145,670 | | | | — | | | | — | | | | 145,670 | | |
| Israel | | | 220,097 | | | | 96,527 | | | | — | | | | 316,624 | | |
| Japan | | | — | | | | 2,799,639 | | | | — | | | | 2,799,639 | | |
| Korea | | | 163,415 | | | | 536,028 | | | | — | | | | 699,443 | | |
| Netherlands | | | — | | | | 1,028,057 | | | | — | | | | 1,028,057 | | |
| Norway | | | — | | | | 519,170 | | | | — | | | | 519,170 | | |
| Russia | | | — | | | | 311,868 | | | | — | | | | 311,868 | | |
| Singapore | | | — | | | | 196,848 | | | | — | | | | 196,848 | | |
| Sweden | | | 370,857 | | | | 277,529 | | | | — | | | | 648,386 | | |
| Switzerland | | | — | | | | 2,455,714 | | | | — | | | | 2,455,714 | | |
| Turkey | | | — | | | | 98,704 | | | | — | | | | 98,704 | | |
| United Kingdom | | | 456,664 | | | | 3,353,008 | | | | — | | | | 3,809,672 | | |
| Total Common Stocks | | | 3,158,403 | | | | 16,187,167 | | | | — | | | | 19,345,570 | | |
| Exchange Traded Funds | | | 269,081 | | | | — | | | | — | | | | 269,081 | | |
| Rights^ | | | 148 | | | | — | | | | — | | | | 148 | | |
| Short-Term Investments | | | — | | | | 10,589 | | | | — | | | | 10,589 | | |
| Total Investments | | $ | 3,427,632 | | | $ | 16,197,756 | | | $ | — | | | $ | 19,625,388 | | |
See Notes to Financial Statements
10
Notes to Schedule of Investments International Portfolio (cont'd)
^ The Schedule of Investments and Summary Schedule of Investments by Industry provides information on the country and industry categorization for the portfolio.
As of the year ended December 31, 2012, certain foreign equity securities were transferred from Level 1 to Level 2 as a result of the Fund's procedures for valuing securities, as stated in the description of the valuation methods of foreign equity securities above. Based on beginning of period market values as of December 31, 2011, $12,671,538 was transferred from Level 1 to Level 2.
## At December 31, 2012, the cost of investments for U.S. federal income tax purposes was $17,223,654. Gross unrealized appreciation of investments was $2,903,214 and gross unrealized depreciation of investments was $501,480, resulting in net unrealized appreciation of $2,401,734 based on cost for U.S. federal income tax purposes.
* Security did not produce income during the last twelve months.
ñ Securities were purchased under Rule 144A of the Securities Act of 1933, as amended (the "1933 Act"), or are private placements and, unless registered under the 1933 Act or exempted from registration, may only be sold to qualified institutional investors. These securities have been deemed by the investment manager to be liquid. At December 31, 2012, these securities amounted to $161,046 or 0.8% of net assets for the Fund.
See Notes to Financial Statements
11
Statement of Assets and Liabilities
Neuberger Berman Advisers Management Trust
| | | INTERNATIONAL PORTFOLIO | |
| | | December 31, 2012 | |
| Assets | |
| Investments in securities, at value* (Note A)—see Schedule of Investments: | |
| Unaffiliated issuers | | $ | 19,625,388 | | |
| Foreign currency | | | 7,781 | | |
| Dividends receivable | | | 44,533 | | |
| Receivable for securities sold | | | 64,622 | | |
| Receivable for Fund shares sold | | | 43 | | |
| Receivable from Management—net (Note B) | | | 12,624 | | |
| Prepaid expenses and other assets | | | 357 | | |
| Total Assets | | | 19,755,348 | | |
| Liabilities | |
| Payable for securities purchased | | | 6,190 | | |
| Payable for Fund shares redeemed | | | 11,176 | | |
| Payable to investment manager (Note B) | | | 14,063 | | |
| Accrued expenses and other payables | | | 64,702 | | |
| Total Liabilities | | | 96,131 | | |
| Net Assets | | $ | 19,659,217 | | |
| Net Assets consist of: | |
| Paid-in capital | | $ | 150,165,635 | | |
| Undistributed net investment income (loss) | | | 214,097 | | |
| Accumulated net realized gains (losses) on investments | | | (133,378,312 | ) | |
| Net unrealized appreciation (depreciation) in value of investments | | | 2,657,797 | | |
| Net Assets | | $ | 19,659,217 | | |
| Shares Outstanding ($.001 par value; unlimited shares authorized) | | | 1,980,699 | | |
| Net Asset Value, offering and redemption price per share | | $ | 9.93 | | |
| *Cost of investments | | | $16,967,265 | | |
| Total cost of foreign currency | | $ | 7,767 | | |
See Notes to Financial Statements
12
Statement of Operations
Neuberger Berman Advisers Management Trust
| | | INTERNATIONAL PORTFOLIO | |
| | | For the Year Ended December 31, 2012 | |
| Investment Income: | |
| Income (Note A): | |
| Dividend income—unaffiliated issuers | | $ | 568,301 | | |
| Foreign taxes withheld | | | (47,330 | ) | |
| Total income | | $ | 520,971 | | |
| Expenses: | |
| Investment management fees (Note B) | | | 169,507 | | |
| Administration fees (Note B) | | | 59,826 | | |
| Distribution fees (Note B) | | | 49,855 | | |
| Audit fees | | | 43,535 | | |
| Custodian fees | | | 79,979 | | |
| Insurance expense | | | 327 | | |
| Legal fees | | | 10,032 | | |
| Shareholder reports | | | 27,395 | | |
| Trustees' fees and expenses | | | 50,765 | | |
| Miscellaneous | | | 17,397 | | |
| Total expenses | | | 508,618 | | |
| Expenses reimbursed by Management (Note B) | | | (208,062 | ) | |
| Expenses reduced by custodian fee expense offset arrangement (Note A) | | | (2 | ) | |
| Total net expenses | | | 300,554 | | |
| Net investment income (loss) | | $ | 220,417 | | |
| Realized and Unrealized Gain (Loss) on Investments (Note A): | |
| Net realized gain (loss) on: | |
| Sales of investment securities of unaffiliated issuers | | | 207,418 | | |
| Foreign currency | | | (4,559 | ) | |
| Change in net unrealized appreciation (depreciation) in value of: | |
| Unaffiliated investment securities | | | 2,962,916 | | |
| Foreign currency | | | (6,874 | ) | |
| Net gain (loss) on investments | | | 3,158,901 | | |
| Net increase (decrease) in net assets resulting from operations | | $ | 3,379,318 | | |
See Notes to Financial Statements
13
Statements of Changes in Net Assets
Neuberger Berman Advisers Management Trust
| | | INTERNATIONAL PORTFOLIO | |
| | | Year Ended December 31, 2012 | | Year Ended December 31, 2011 | |
| Increase (Decrease) in Net Assets: | |
| From Operations (Note A): | |
| Net investment income (loss) | | $ | 220,417 | | | $ | 259,427 | | |
| Net realized gain (loss) on investments | | | 202,859 | | | | 876,370 | | |
| Change in net unrealized appreciation (depreciation) of investments | | | 2,956,042 | | | | (4,111,760 | ) | |
| Net increase (decrease) in net assets resulting from operations | | | 3,379,318 | | | | (2,975,963 | ) | |
| Distributions to Shareholders From (Note A): | |
| Net investment income | | | (160,166 | ) | | | (1,454,260 | ) | |
| From Fund Share Transactions (Note D): | |
| Proceeds from shares sold | | | 1,222,280 | | | | 2,732,858 | | |
| Proceeds from reinvestment of dividends and distributions | | | 160,166 | | | | 1,454,260 | | |
| Payments for shares redeemed | | | (4,844,614 | ) | | | (4,681,550 | ) | |
| Redemption fees retained | | | — | | | | 162 | | |
| Net increase (decrease) from Fund share transactions | | | (3,462,168 | ) | | | (494,270 | ) | |
| Net Increase (Decrease) in Net Assets | | | (243,016 | ) | | | (4,924,493 | ) | |
| Net Assets: | |
| Beginning of year | | | 19,902,233 | | | | 24,826,726 | | |
| End of year | | $ | 19,659,217 | | | $ | 19,902,233 | | |
| Undistributed net investment income (loss) at end of year | | $ | 214,097 | | | $ | 150,471 | | |
See Notes to Financial Statements
14
Notes to Financial Statements International Portfolio
Note A—Summary of Significant Accounting Policies:
1 General: Neuberger Berman Advisers Management Trust (the "Trust") is a Delaware statutory trust organized pursuant to a Trust Instrument dated May 23, 1994. The Trust is currently comprised of ten separate operating series (each individually a "Series," and collectively the "Funds") each of which is diversified. The Trust is registered as an open-end management investment company under the Investment Company Act of 1940, as amended (the "1940 Act"), and its shares are registered under the Securities Act of 1933, as amended. The Fund currently offers only Class S shares. The Board may establish additional series or classes of shares without the approval of shareholders.
The assets of each Series belong only to that Series, and the liabilities of each Series are borne solely by that Series and no other.
The preparation of financial statements in accordance with U.S. generally accepted accounting principles ("GAAP") requires Management to make estimates and assumptions at the date of the financial statements. Actual results could differ from those estimates.
2 Portfolio valuation: Investment securities are valued as indicated in the notes following the Schedule of Investments.
3 Foreign currency translation: The accounting records of the Fund are maintained in U.S. dollars. Foreign currency amounts are translated into U.S. dollars using the exchange rate as of 4:00 p.m., Eastern time, to determine the value of investments, other assets and liabilities. Purchase and sale prices of securities, and income and expenses, are translated into U.S. dollars at the prevailing rate of exchange on the respective dates of such transactions. Net unrealized foreign currency gain (loss), if any, arises from changes in the value of assets and liabilities, other than investments in securities, as a result of changes in exchange rates and is stated separately in the Statement of Operations.
4 Securities transactions and investment income: Securities transactions are recorded on trade date for financial reporting purposes. Dividend income is recorded on the ex-dividend date or, for certain foreign dividends, as soon as the Fund becomes aware of the dividends. Non-cash dividends included in dividend income, if any, are recorded at the fair market value of the securities received. Interest income, including accretion of original issue discount, where applicable, and accretion of discount on short-term investments, if any, is recorded on the accrual basis. Realized gains and losses from securities transactions and foreign currency transactions, if any, are recorded on the basis of identified cost and stated separately in the Statement of Operations.
5 Income tax information: The Funds are treated as separate entities for U.S. federal income tax purposes. It is the policy of the Fund to continue to qualify for treatment as a regulated investment company by complying with the requirements of the U.S. Internal Revenue Code applicable to regulated investment companies and to distribute substantially all of its net investment income and net realized capital gains to its shareholders. To the extent the Fund distributes substantially all of its net investment income and net realized capital gains to shareholders, no federal income or excise tax provision is required.
The Fund has adopted the provisions of ASC 740 "Income Taxes" ("ASC 740"). ASC 740 sets forth a minimum threshold for financial statement recognition of a tax position taken, or expected to be taken, in a tax return. The Fund recognizes interest and penalties, if any, related to unrecognized tax positions as an income tax expense in the Statement of Operations. The Fund is subject to examination by U.S. federal and state tax authorities for returns filed for the prior three fiscal years 2009 - 2011. As of December 31, 2012, the Fund did not have any unrecognized tax positions.
Income distributions and capital gain distributions are determined in accordance with income tax regulations, which may differ from GAAP. These differences are primarily due to differing treatments of income and gains on
15
various investment securities held by the Fund, timing differences and differing characterization of distributions made by the Fund. The Fund may also utilize earnings and profits distributed to shareholders on redemption of shares as a part of the dividends-paid deduction for income tax purposes.
As determined on December 31, 2012, permanent differences resulting primarily from different book and tax accounting were reclassified at year end. Such differences may be attributed to one or more of the following: foreign currency gains and losses and passive foreign investment company gains and losses. These reclassifications had no effect on net income, net asset value ("NAV") or NAV per share of the Fund. For the year ended December 31, 2012, the Fund recorded the following permanent reclassifications:
| Paid-in Capital | | Undistributed Net Investment Income (Loss) | | Accumulated Net Realized Gains (Losses) on Investments | |
| $ | — | | | $ | 3,375 | | | $ | (3,375 | ) | |
For tax purposes, distributions of short-term gains are taxable to shareholders as ordinary income.
The tax character of distributions paid during the years ended December 31, 2012 and December 31, 2011 was as follows:
| Distributions Paid From: | | | |
| Ordinary Income | | Total | | | |
| 2012 | | 2011 | | 2012 | | 2011 | | | |
| $ | 160,166 | | | $ | 1,454,260 | | | $ | 160,166 | | | $ | 1,454,260 | | | | |
As of December 31, 2012, the components of distributable earnings (accumulated losses) on a U.S. federal income tax basis were as follows:
Undistributed Ordinary Income | | Unrealized Appreciation (Depreciation) | | Loss Carryforwards and Deferrals | | Other Temporary Differences | | Total | |
| $ | 282,639 | | | $ | 2,401,383 | | | $ | (133,190,440 | ) | | $ | — | | | $ | (130,506,418 | ) | |
The difference between book basis and tax basis distributable earnings are primarily due to: timing differences of wash sales, forward contracts mark to market, passive foreign investment companies and capital loss carryforwards.
To the extent the Fund's net realized capital gains, if any, can be offset by capital loss carryforwards, it is the policy of the Fund not to distribute such gains. The Regulated Investment Company ("RIC") Modernization Act of 2010 (the "Act") became effective for the Fund on January 1, 2011. The Act modernizes several of the federal income and excise tax provisions related to RICs. Among the changes made are changes to the capital loss carryforward rules allowing for RICs to carry forward capital losses indefinitely and to retain the character of capital loss carryforwards as short-term or long-term ("Post-Enactment"). Rules in effect previously limited the carryforward period to eight years and all carryforwards were considered short-term in character ("Pre-Enactment"). As determined at December 31, 2012, the Fund had unused capital loss carryforwards available for federal income tax purposes to offset net realized capital gains, if any, as follows:
| | | Pre-Enactment | |
| | | Expiring in: | |
| | | 2016 | | 2017 | |
| | | | | $ | 69,603,692 | | | $ | 63,586,748 | | |
16
Post-Enactment capital loss carryforwards must be fully used before Pre-Enactment capital loss carryforwards; therefore, under certain circumstances, Pre-Enactment capital loss carryforwards available as of the report date may expire unused. As of December 31, 2012, the Fund had no Post-Enactment capital loss carryforwards.
During the year ended December 31, 2012, the Fund utilized capital loss carryforwards of $87,566.
6 Distributions to shareholders: The Fund may earn income, net of expenses, daily on its investments. Distributions from net investment income and net realized capital gains, if any, generally are distributed once a year (usually in October). Income distributions and capital gain distributions to shareholders are recorded on the ex-date.
7 Foreign taxes: Foreign taxes withheld represent amounts withheld by foreign tax authorities, net of refunds recoverable.
8 Expense allocation: Certain expenses are applicable to multiple funds. Expenses directly attributable to a Series are charged to that Series. Expenses of the Trust that are not directly attributable to a particular series of the Trust (e.g., the Fund) are allocated among the series of the Trust, on the basis of relative net assets, except where a more appropriate allocation of expenses to each of the series can otherwise be made fairly. Expenses borne by the complex of related investment companies, which includes open-end and closed-end investment companies for which Management serves as investment manager, that are not directly attributable to a particular investment company in the complex (e.g., the Trust) or series thereof are allocated among the investment companies in the complex or series thereof, on the basis of relative net assets, except where a more appropriate allocation of expenses to each of the investment companies in the complex or series thereof can otherwise be made fairly.
9 Redemption of fund shares: Prior to May 1, 2011, the Fund charged a redemption fee of 2% on shares redeemed or exchanged for shares of another fund within 60 days or less of the purchase date. As of May 1, 2011, the Fund no longer charges a redemption fee.
10 Investments in foreign securities: Investing in foreign securities may involve certain sovereign and other risks, in addition to the credit and market risks normally associated with domestic securities. These additional risks include the possibility of adverse political and economic developments (including political instability, nationalization, expropriation, or confiscatory taxation) and the potentially adverse effects of unavailability of public information regarding issuers, less governmental supervision and regulation of financial markets, reduced liquidity of certain financial markets, and the lack of uniform accounting, auditing, and financial reporting standards or the application of standards that are different or less stringent than those applied in the United States. Foreign securities also may experience greater price volatility, higher rates of inflation, and delays in settlement.
11 Indemnifications: Like many other companies, the Trust's organizational documents provide that its officers and trustees are indemnified against certain liabilities arising out of the performance of their duties to the Trust. In addition, both in some of its principal service contracts and in the normal course of its business, the Trust enters into contracts that provide indemnifications to other parties for certain types of losses or liabilities. The Trust's maximum exposure under these arrangements is unknown as this could involve future claims against the Trust.
12 Expense offset arrangement: The Fund has an expense offset arrangement in connection with its custodian contract. For the year ended December 31, 2012, the impact of this arrangement was a reduction of expenses of $2.
Note B—Management Fees, Administration Fees, Distribution Arrangements, and Other Transactions with Affiliates:
Fund shares are issued and redeemed in connection with investments in and payments under certain variable annuity contracts and variable life insurance policies issued through separate accounts of life insurance companies and are also offered directly to certain qualified pension and retirement plans.
The Fund retains Management as its investment manager under a Management Agreement. For such investment management services, the Fund pays Management a fee at the annual rate of 0.85% of the first $250 million of the
17
Fund's average daily net assets, 0.825% of the next $250 million, 0.80% of the next $250 million, 0.775% of the next $250 million, 0.75% of the next $500 million, 0.725% of the next $1 billion, and 0.70% of average daily net assets in excess of $2.5 billion. Accordingly, for the year ended December 31, 2012, the management fee pursuant to the Management Agreement was equivalent to an annual effective rate of 0.85% of the Fund's average daily net assets.
The Fund retains Management as its administrator under an Administration Agreement. The Fund pays Management an administration fee at the annual rate of 0.30% of its average daily net assets under this agreement. Additionally, Management retains State Street Bank and Trust Company ("State Street") as its sub-administrator under a Sub-Administration Agreement. Management pays State Street a fee for all services received under this agreement.
Management acts as agent in arranging for the sale of Fund shares without commission and bears advertising and promotion expenses. The Board has adopted a distribution plan (the "Plan") with respect to the Fund, pursuant to Rule 12b-1 under the 1940 Act. The Plan provides that, as compensation for administrative and other services provided to the Fund, Management's activities and expenses related to the sale and distribution of the Fund's shares, and ongoing services provided to investors in the Fund, Management receives from the Fund a fee at the annual rate of 0.25% of the Fund's average daily net assets. Management receives this amount to provide distribution and shareholder servicing for the Fund and pays a portion of it to institutions that provide such services. Those institutions may use the payments for, among other purposes, compensating employees engaged in sales and/or shareholder servicing. The amount of fees paid by the Fund during any year may be more or less than the cost of distribution and other services provided to the Fund. FINRA rules limit the amount of annual distribution fees that may be paid by a mutual fund and impose a ceiling on the cumulative distribution fees paid. The Trust's Plan complies with those rules.
Management has contractually undertaken through December 31, 2015 to waive current payment of fees and/or reimburse the Fund for its operating expenses (including fees payable to Management but excluding interest, taxes, brokerage commissions, extraordinary expenses, transaction costs and dividend expense on short sales, if any) ("Operating Expenses") which exceed, in the aggregate, 1.50% per annum of the Fund's average daily net assets (the "Expense Limitation"). For the year ended December 31, 2012, such excess expenses amounted to $208,062. The Fund has agreed to repay Management through December 31, 2018 for fees and expenses waived and/or its excess Operating Expenses previously reimbursed by Management, so long as its annual Operating Expenses during that period do not exceed its Expense Limitation in place at the time the fees and expenses were waived or reimbursed, and the repayment is made within three years after the year in which Management issued the reimbursement or waived fees. During the year ended December 31, 2012, there was no repayment to Management under its contractual expense limitation. At December 31, 2012, contingent liabilities to Management under its contractual expense limitation were as follows:
| | | Expiring in: | |
| | | 2013 | | 2014 | | 2015 | | Total | |
| | | | | $ | 217,800 | | | $ | 330,578 | | | $ | 208,062 | | | $ | 756,440 | | |
Neuberger Berman LLC ("Neuberger") is retained by Management to furnish it with investment recommendations and research information without added cost to the Fund. Several individuals who are officers and/or trustees of the Trust are also employees of Neuberger and/or Management.
Management and Neuberger are indirect subsidiaries of Neuberger Berman Group LLC (("NBG") and together with its consolidated subsidiaries ("NB Group")). NBSH Acquisition, LLC ("NBSH"), which is owned by portfolio managers, members of the NB Group management team and certain of NB Group's key employees and senior professionals, owns, as of September 30, 2012, approximately 57% of NBG's common units, and Lehman Brothers Holdings Inc. ("LBHI") and certain of its subsidiaries (collectively the "LBHI Parties") own the remaining 43% of such common units. Pursuant to agreements among NBG, NBSH and the LBHI Parties, NBG is entitled to acquire the remaining Class A common units through a process that is expected to end in 2017. In April 2012, NBG exercised its option (the "Redemption Agreement Option") to redeem during 2012 certain of its Class A common units held by the
18
LBHI Parties equal to 10% of NBG's aggregate common units issued and outstanding as of March 16, 2012. The final payment for such Class A common units is due within thirty (30) days of December 31, 2012.
Note C—Securities Transactions:
During the year ended December 31, 2012, there were purchase and sale transactions (excluding short-term securities) of $6,433,079 and $9,565,998, respectively.
During the year ended December 31, 2012, no brokerage commissions on securities transactions were paid to affiliated brokers.
Note D—Fund Share Transactions:
Share activity for the years ended December 31, 2012 and December 31, 2011 was as follows:
| | | For the Year Ended December 31, | |
| | | 2012 | | 2011 | |
| Shares Sold | | | 134,733 | | | | 267,940 | | |
| Shares Issued on Reinvestment of Dividends and Distributions | | | 16,931 | | | | 164,695 | | |
| Shares Redeemed | | | (526,971 | ) | | | (477,844 | ) | |
| Total | | | (375,307 | ) | | | (45,209 | ) | |
Note E—Lines of Credit:
At December 31, 2012, the Fund was a participant in a single committed, unsecured $200,000,000 line of credit with State Street, to be used only for temporary or emergency purposes. Other investment companies managed by Management also participate in this line of credit on the same terms. Interest is charged on borrowings under this line of credit at the higher of (a) the Federal Funds Rate plus 1.25% per annum or (b) the Overnight LIBOR Rate plus 1.25% per annum. A commitment fee of 0.10% per annum of the available line of credit is charged, of which each participating Fund has agreed to pay its pro rata share, based on the ratio of its individual net assets to the net assets of all participants at the time the fee is due and payable. The fee is paid quarterly in arrears. Because several mutual funds participate, there is no assurance that an individual Fund will have access to all or any part of the $200,000,000 at any particular time.
At December 31, 2012, the Fund was a participant in a single uncommitted, secured $100,000,000 line of credit with State Street to be used only for temporary or emergency purposes or for leverage. Other investment companies managed by Management also participate in this line of credit on the same terms. Interest is charged at LIBOR, or the overnight Federal Funds Rate, plus a spread to be determined at the time of borrowing. Because several mutual funds participate, there is no assurance that the Fund will have access to all or any part of the $100,000,000 at any particular time.
The Fund had no loans outstanding pursuant to these lines of credit at December 31, 2012. During the year ended December 31, 2012, the Fund did not utilize these lines of credit.
Note F—Recent Accounting Pronouncement:
In December 2011, the Financial Accounting Standards Board issued Accounting Standards Update 2011-11 Disclosures about Offsetting Assets and Liabilities ("ASU 2011-11"). Effective for annual reporting periods beginning on or after January 1, 2013 and interim periods within those annual periods, ASU 2011-11 is intended to enhance disclosure requirements on the offsetting of financial assets and liabilities. At this time, Management is evaluating the implications of ASU 2011-11 and its impact on the financial statements.
19
Financial Highlights
International Portfolio
The following table includes selected data for a share outstanding throughout each year and other performance information derived from the Financial Statements. Per share amounts that round to less than $.01 or $(.01) per share are presented as $.00 or $(.00), respectively.
| | | Year Ended December 31, | |
| | | 2012 | | 2011 | | 2010 | | 2009 | | 2008 | |
| Net Asset Value, Beginning of Year | | $ | 8.45 | | | $ | 10.34 | | | $ | 9.51 | | | $ | 7.29 | | | $ | 13.61 | | |
| Income From Investment Operations: | |
Net Investment Income (Loss)‡ | | | .10 | | | | .11 | | | | .13 | | | | .09 | | | | .32 | | |
Net Gains or Losses on Securities (both realized and unrealized) | | | 1.46 | | | | (1.36 | ) | | | 1.90 | | | | 2.43 | | | | (6.64 | ) | |
| Total From Investment Operations | | | 1.56 | | | | (1.25 | ) | | | 2.03 | | | | 2.52 | | | | (6.32 | ) | |
| Less Distributions From: | |
| Net Investment Income | | | (.08 | ) | | | (.64 | ) | | | (1.20 | ) | | | (.30 | ) | | | — | | |
Redemption FeesØØ | | | — | | | | .00 | | | | .00 | | | | .00 | | | | .00 | | |
| Net Asset Value, End of Year | | $ | 9.93 | | | $ | 8.45 | | | $ | 10.34 | | | $ | 9.51 | | | $ | 7.29 | | |
Total Return†† | | | 18.48 | % | | | (12.33 | )% | | | 22.01 | % | | | 34.51 | % | | | (46.44 | )% | |
| Ratios/Supplemental Data | |
| Net Assets, End of Year (in millions) | | $ | 19.7 | | | $ | 19.9 | | | $ | 24.8 | | | $ | 330.1 | | | $ | 246.9 | | |
Ratio of Gross Expenses to Average Net Assets# | | | 2.55 | % | | | 2.89 | % | | | 1.65 | % | | | 1.66 | % | | | 1.59 | % | |
Ratio of Net Expenses to Average Net Assets§ | | | 1.51 | % | | | 1.50 | % | | | 1.50 | % | | | 1.50 | % | | | 1.53 | % | |
Ratio of Net Investment Income (Loss) to Average Net Assets | | | 1.11 | % | | | 1.09 | % | | | 1.42 | % | | | 1.13 | % | | | 2.78 | % | |
| Portfolio Turnover Rate | | | 33 | % | | | 45 | % | | | 61 | % | | | 80 | % | | | 149 | % | |
See Notes to Financial Highlights
20
Notes to Financial Highlights International Portfolio
†† Total return based on per share NAV reflects the effects of changes in NAV on the performance of the Fund during each fiscal period and assumes income dividends and other distributions, if any, were reinvested. Results represent past performance and do not indicate future results. Current returns may be lower or higher than the performance data quoted. Investment returns and principal may fluctuate and shares when redeemed may be worth more or less than original cost. Total return would have been lower if Management had not reimbursed and/or waived certain expenses. The total return information shown does not reflect charges and other expenses that apply to the separate account or the related insurance policies, and the inclusion of these charges and other expenses would reduce the total return for all fiscal periods shown. For the year ended December 31, 2009, Management reimbursed the Fund for losses incurred in connection with the disposition of foreign currency contracts, which had a .01% impact on total return.
# Represents the annualized ratios of net expenses to average daily net assets if Management had not reimbursed certain expenses and/or waived a portion of the investment management fee.
‡ Calculated based on the average number of shares outstanding during each fiscal period.
ØØ Prior to May 1, 2011, redemption fees were charged on the Fund. Calculated based on the average number of shares outstanding during each fiscal period.
§ After reimbursement of expenses and/or waiver of a portion of the investment management fee by Management. The Fund is required to calculate an expense ratio without taking into consideration any expense reductions related to expense offset arrangements. Had the Fund not received expense reductions related to expense offset arrangements, the annualized ratios of net expenses to average daily net assets would have been:
| | | Year Ended December 31, | |
| | | 2012 | | 2011 | | 2010 | | 2009 | | 2008 | |
| | | | | | 1.51 | % | | | 1.50 | % | | | 1.50 | % | | | 1.50 | % | | | 1.53 | % | |
21
Report of Independent Registered Public Accounting Firm
To the Board of Trustees of
Neuberger Berman Advisers Management Trust and
Shareholders of International Portfolio
We have audited the accompanying statement of assets and liabilities of International Portfolio, one of the series constituting Neuberger Berman Advisers Management Trust (the "Trust"), including the schedule of investments, as of December 31, 2012, and the related statement of operations for the year then ended, the statements of changes in net assets for each of the two years in the period then ended, and the financial highlights for each of the five years in the period then ended. These financial statements and financial highlights are the responsibility of the Trust's management. Our responsibility is to express an opinion on these financial statements and financial highlights based on our audits.
We conducted our audits in accordance with the standards of the Public Company Accounting Oversight Board (United States). Those standards require that we plan and perform the audit to obtain reasonable assurance about whether the financial statements and financial highlights are free of material misstatement. We were not engaged to perform an audit of the Trust's internal control over financial reporting. Our audits included consideration of internal control over financial reporting as a basis for designing audit procedures that are appropriate in the circumstances, but not for the purpose of expressing an opinion on the effectiveness of the Trust's internal control over financial reporting. Accordingly, we express no such opinion. An audit also includes examining, on a test basis, evidence supporting the amounts and disclosures in the financial statements and financial highlights, assessing the accounting principles used and significant estimates made by management, and evaluating the overall financial statement presentation. Our procedures included confirmation of securities owned as of December 31, 2012 by correspondence with the custodian and others or by other appropriate auditing procedures where replies from others were not received. We believe that our audits provide a reasonable basis for our opinion.
In our opinion, the financial statements and financial highlights referred to above present fairly, in all material respects, the financial position of International Portfolio, a series of Neuberger Berman Advisers Management Trust, at December 31, 2012, the results of its operations for the year then ended, the changes in its net assets for each of the two years in the period then ended, and the financial highlights for each of the five years in the period then ended, in conformity with U.S. generally accepted accounting principles.
Boston, Massachusetts
February 7, 2013
22
Trustee and Officer Information
The following tables set forth information concerning the trustees ("Trustees") and officers ("Officers") of the Trust. All persons named as Trustees and Officers also serve in similar capacities for other funds administered or managed by Management, Neuberger and Neuberger Berman Fixed Income LLC ("NBFI"). The Statement of Additional Information includes additional information about Trustees and is available upon request, without charge, by calling (800) 877-9700.
Information about the Board of Trustees
Name, (Year of Birth), and Address(1) | | Position(s) and Length of Time Served(2) | | Principal Occupation(s)(3) | | Number of Funds in Fund Complex Overseen by Fund Trustee | | Other Directorships Held Outside Fund Complex by Fund Trustee(3) | |
| Independent Fund Trustees | |
| Faith Colish (1935) | | Trustee since 1982 | | Counsel, Carter Ledyard & Milburn LLP (law firm) since October 2002; formerly, Attorney-at-Law and President, Faith Colish, A Professional Corporation, 1980 to 2002. | | | 50 | | | Formerly, Director, 1997 to 2003, and Advisory Director, 2003 to 2006, ABA Retirement Funds (formerly, American Bar Retirement Association) (not-for-profit membership corporation). | |
| Martha C. Goss (1949) | | Trustee since 2007 | | President, Woodhill Enterprises Inc./Chase Hollow Associates LLC (personal investment vehicle), since 2006; Chief Operating and Financial Officer, Hopewell Holdings LLC/Amwell Holdings, LLC (a holding company for investments in the healthcare sector), since 2003; formerly, Consultant, Resources Connection (temporary staffing), 2002 to 2006. | | | 50 | | | Director, American Water (water utility), since 2003; Director, Channel Reinsurance (financial guaranty reinsurance), 2006 to 2010; Director, Allianz Life of New York (insurance), since 2005; Director, Financial Women's Association of New York (not-for-profit association), since 2003; Trustee Emerita, Brown University, since 1998; formerly, Director, Ocwen Financial Corporation (mortgage servicing), 2005 to 2010; formerly, Advisory Board Member, Attensity (software developer), 2005 to 2007; formerly, Director, Bank Leumi (commercial bank), 2005 to 2007; formerly, Director, Claire's Stores, Inc. (retailer), 2005 to 2007. | |
23
Name, (Year of Birth), and Address(1) | | Position(s) and Length of Time Served(2) | | Principal Occupation(s)(3) | | Number of Funds in Fund Complex Overseen by Fund Trustee | | Other Directorships Held Outside Fund Complex by Fund Trustee(3) | |
| Michael M. Knetter (1960) | | Trustee since 2007 | | President and Chief Executive Officer, University of Wisconsin Foundation, since October 2010; formerly, Dean, School of Business, University of Wisconsin - Madison; formerly, Professor of International Economics and Associate Dean, Amos Tuck School of Business - Dartmouth College, 1998 to 2002. | | | 50 | | | Director, American Family Insurance (a mutual company, not publicly traded), since March 2009; formerly, Trustee, Northwestern Mutual Series Fund, Inc., 2007 to 2010; formerly, Director, Wausau Paper, 2005 to 2011; formerly, Director, Great Wolf Resorts, 2004 to 2009. | |
| Howard A. Mileaf (1937) | | Trustee since 1999 | | Retired; formerly, Vice President and General Counsel, WHX Corporation (holding company), 1993 to 2001. | | | 50 | | | Formerly, Director, Webfinancial Corporation (holding company), 2002 to 2008; formerly, Director, WHX Corporation (holding company), 2002 to 2005; formerly, Director, State Theatre of New Jersey (not-for-profit theatre), 2000 to 2005. | |
| George W. Morriss (1947) | | Trustee since 2007 | | Adjunct Faculty Member, Columbia University School of International Policy and Administration, since October 2012; formerly, Executive Vice President and Chief Financial Officer, People's Bank, Connecticut (a financial services company), 1991 to 2001. | | | 50 | | | Formerly, Manager, Larch Lane Multi-Strategy Fund complex (which consisted of three funds), 2006 to 2011; formerly, Member, NASDAQ Issuers' Affairs Committee, 1995 to 2003. | |
24
Name, (Year of Birth), and Address(1) | | Position(s) and Length of Time Served(2) | | Principal Occupation(s)(3) | | Number of Funds in Fund Complex Overseen by Fund Trustee | | Other Directorships Held Outside Fund Complex by Fund Trustee(3) | |
| Jack L. Rivkin (1940) | | Trustee since 2002; President 2002 to 2008 | | Formerly, Executive Vice President and Chief Investment Officer, Neuberger Berman Holdings LLC (holding company), 2002 to August 2008 and 2003 to August 2008, respectively; formerly, Managing Director and Chief Investment Officer, Neuberger, December 2005 to August 2008 and 2003 to August 2008, respectively; formerly, Executive Vice President, Neuberger, December 2002 to 2005; formerly, Director and Chairman, Management, December 2002 to August 2008; formerly, Executive Vice President, Citigroup Investments, Inc., September 1995 to February 2002; formerly, Executive Vice President, Citigroup Inc., September 1995 to February 2002. | | | 50 | | | Director, Idealab (private company), since 2009; Director, Distributed World Power (private company), since 2009; Director, Dale Carnegie and Associates, Inc. (private company), since 1999; Director, Solbright, Inc. (private company), since 1998; Director, SA Agricultural Fund, since 2009; Chairman and Director, Essential Brands (consumer products) since 2008; formerly, Director, New York Society of Security Analysts, 2006 to 2008. | |
| Tom D. Seip (1950) | | Trustee since 2000; Chairman of the Board since 2008; Lead Independent Trustee 2006 to 2008 | | General Partner, Ridgefield Farm LLC (a private investment vehicle); formerly, President and CEO, Westaff, Inc. (temporary staffing), May 2001 to January 2002; formerly, Senior Executive, The Charles Schwab Corporation, 1983 to 1998, including Chief Executive Officer, Charles Schwab Investment Management, Inc.; Trustee, Schwab Family of Funds and Schwab Investments, 1997 to 1998; and Executive Vice President—Retail Brokerage, Charles Schwab & Co., Inc., 1994 to 1997. | | | 50 | | | Director, H&R Block, Inc. (financial services company), since May 2001; Chairman, Governance and Nominating Committee, H&R Block, Inc., since 2011; formerly, Chairman, Compensation Committee, H&R Block, Inc., 2006 to 2010; formerly, Director, Forward Management, Inc. (asset management company), 1999 to 2006. | |
25
Name, (Year of Birth), and Address(1) | | Position(s) and Length of Time Served(2) | | Principal Occupation(s)(3) | | Number of Funds in Fund Complex Overseen by Fund Trustee | | Other Directorships Held Outside Fund Complex by Fund Trustee(3) | |
| Candace L. Straight (1947) | | Trustee since 1999 | | Private investor and consultant specializing in the insurance industry; formerly, Advisory Director, Securitas Capital LLC (a global private equity investment firm dedicated to making investments in the insurance sector), 1998 to December 2003. | | | 50 | | | Public Member, Board of Governors and Board of Trustees, Rutgers University, since 2011; Director, Montpelier Re Holdings Ltd. (reinsurance company), since 2006; formerly, Director, National Atlantic Holdings Corporation (property and casualty insurance company), 2004 to 2008; formerly, Director, The Proformance Insurance Company (property and casualty insurance company), 2004 to 2008; formerly, Director, Providence Washington Insurance Company (property and casualty insurance company), 1998 to 2006; formerly, Director, Summit Global Partners (insurance brokerage firm), 2000 to 2005. | |
| Peter P. Trapp (1944) | | Trustee since 1984 | | Retired; formerly, Regional Manager for Mid-Southern Region, Ford Motor Credit Company, September 1997 to 2007; formerly, President, Ford Life Insurance Company, April 1995 to August 1997. | | | 50 | | | None. | |
26
Name, (Year of Birth), and Address(1) | | Position(s) and Length of Time Served(2) | | Principal Occupation(s)(3) | | Number of Funds in Fund Complex Overseen by Fund Trustee | | Other Directorships Held Outside Fund Complex by Fund Trustee(3) | |
| Fund Trustees who are "Interested Persons" | |
| Joseph V. Amato* (1962) | | Trustee since 2009 | | President and Director, Neuberger Berman Group LLC, since 2009; President and Chief Executive Officer, Neuberger and Neuberger Berman Holdings LLC (including its predecessor, Neuberger Berman Inc.), since 2007; Chief Investment Officer, Neuberger, since 2009; Chief Investment Officer (Equities) and Managing Director, Management, since 2009; Managing Director, NBFI, since 2007; Board member of NBFI since 2006; formerly, Global Head of Asset Management of Lehman Brothers Holdings Inc.'s ("LBHI") Investment Management Division, 2006 to 2009; formerly, member of LBHI's Investment Management Division's Executive Management Committee, 2006 to 2009; formerly, Managing Director, Lehman Brothers Inc. ("LBI"), 2006 to 2008; formerly, Chief Recruiting and Development Officer, LBI, 2005 to 2006; formerly, Global Head of LBI's Equity Sales and a Member of its Equities Division Executive Committee, 2003 to 2005. | | | 50 | | | Member of Board of Advisors, McDonough School of Business, Georgetown University, since 2001; Member of New York City Board of Advisors, Teach for America, since 2005; Trustee, Montclair Kimberley Academy (private school), since 2007. | |
27
Name, (Year of Birth), and Address(1) | | Position(s) and Length of Time Served(2) | | Principal Occupation(s)(3) | | Number of Funds in Fund Complex Overseen by Fund Trustee | | Other Directorships Held Outside Fund Complex by Fund Trustee(3) | |
| Robert Conti* (1956) | | Chief Executive Officer, President and Trustee since 2008; prior thereto, Executive Vice President in 2008 and Vice President 2000 to 2008 | | Managing Director, Neuberger, since 2007; formerly, Senior Vice President, Neuberger, 2003 to 2006; formerly, Vice President, Neuberger, 1999 to 2003; President and Chief Executive Officer, Management, since 2008; formerly, Senior Vice President, Management, 2000 to 2008; Managing Director, NBFI, since 2009. | | | 50 | | | Director, Staten Island Mental Health Society, since 1994; formerly, Chairman of the Board, Staten Island Mental Health Society, 2008 to 2011. | |
(1) The business address of each listed person is 605 Third Avenue, New York, New York 10158.
(2) Pursuant to the Trust's Trust Instrument, each of these Fund Trustees shall hold office for life or until his or her successor is elected or the Trust terminates; except that (a) any Fund Trustee may resign by delivering a written resignation; (b) any Fund Trustee may be removed with or without cause at any time by a written instrument signed by at least two-thirds of the other Fund Trustees; (c) any Fund Trustee who requests to be retired, or who has become unable to serve, may be retired by a written instrument signed by a majority of the other Fund Trustees; and (d) any Fund Trustee may be removed at any shareholder meeting by a vote of at least two-thirds of the outstanding shares.
(3) Except as otherwise indicated, each individual has held the positions shown for at least the last five years.
* Indicates a Fund Trustee who is an "interested person" within the meaning of the 1940 Act. Mr. Amato and Mr. Conti are interested persons of the Trust by virtue of the fact that each is an officer of Management, Neuberger and/or their affiliates.
28
Information about the Officers of the Trust
Name, (Year of Birth), and Address(1) | | Position(s) and Length of Time Served(2) | | Principal Occupation(s)(3) | |
| Andrew B. Allard (1961) | | Chief Legal Officer since 2013 (only for purposes of sections 307 and 406 of the Sarbanes-Oxley Act of 2002) and Anti-Money Laundering Compliance Officer since 2002 | | Senior Vice President, Neuberger, since 2006 and Employee since 1999; Deputy General Counsel, Neuberger, since 2004; formerly, Vice President, Neuberger, 2000 to 2005; formerly, Employee, Management, 1994 to 1999; Chief Legal Officer since 2013 (only for purposes of sections 307 and 406 of the Sarbanes-Oxley Act of 2002) and Anti-Money Laundering Compliance Officer since 2002, nine registered investment companies for which Management acts as investment manager and administrator (six since 2002, one since 2003, one since 2005 and one since 2006). | |
| Claudia A. Brandon (1956) | | Executive Vice President since 2008 and Secretary since 1985 | | Senior Vice President, Neuberger, since 2007 and Employee since 1999; Senior Vice President, Management, since 2008 and Assistant Secretary since 2004; formerly, Vice President, Neuberger, 2002 to 2006; formerly, Vice President—Mutual Fund Board Relations, Management, 2000 to 2008; formerly, Vice President, Management, 1986 to 1999 and Employee 1984 to 1999; Executive Vice President, nine registered investment companies for which Management acts as investment manager and administrator (nine since 2008); Secretary, nine registered investment companies for which Management acts as investment manager and administrator (three since 1985, three since 2002, one since 2003, one since 2005 and one since 2006). | |
| Anthony DiBernardo (1979) | | Assistant Treasurer since 2011 | | Vice President, Neuberger, since 2009; Employee, Management, since 2003; Assistant Treasurer, nine registered investment companies for which Management acts as investment manager and administrator (nine since 2011). | |
| Sheila R. James (1965) | | Assistant Secretary since 2002 | | Vice President, Neuberger, since 2008 and Employee since 1999; formerly, Assistant Vice President, Neuberger, 2007; formerly, Employee, Management, 1991 to 1999; Assistant Secretary, nine registered investment companies for which Management acts as investment manager and administrator (six since 2002, one since 2003, one since 2005 and one since 2006). | |
| Brian Kerrane (1969) | | Vice President since 2008 | | Senior Vice President, Neuberger, since 2006; formerly, Vice President, Neuberger, 2002 to 2006; Vice President, Management, since 2008 and Employee since 1991; Vice President, nine registered investment companies for which Management acts as investment manager and administrator (nine since 2008). | |
29
Name, (Year of Birth), and Address(1) | | Position(s) and Length of Time Served(2) | | Principal Occupation(s)(3) | |
| Kevin Lyons (1955) | | Assistant Secretary since 2003 | | Assistant Vice President, Neuberger, since 2008 and Employee since 1999; formerly, Employee, Management, 1993 to 1999; Assistant Secretary, nine registered investment companies for which Management acts as investment manager and administrator (seven since 2003, one since 2005 and one since 2006). | |
| Owen F. McEntee, Jr. (1961) | | Vice President since 2008 | | Vice President, Neuberger, since 2006; Employee, Management, since 1992; Vice President, nine registered investment companies for which Management acts as investment manager and administrator (nine since 2008). | |
| John M. McGovern (1970) | | Treasurer and Principal Financial and Accounting Officer since 2005 | | Senior Vice President, Neuberger, since 2007; formerly, Vice President, Neuberger, 2004 to 2006; Employee, Management, since 1993; Treasurer and Principal Financial and Accounting Officer, nine registered investment companies for which Management acts as investment manager and administrator (eight since 2005 and one since 2006); formerly, Assistant Treasurer, eight registered investment companies for which Management acts as investment manager and administrator, 2002 to 2005. | |
| Frank Rosato (1971) | | Assistant Treasurer since 2005 | | Vice President, Neuberger, since 2006; Employee, Management, since 1995; Assistant Treasurer, nine registered investment companies for which Management acts as investment manager and administrator (eight since 2005 and one since 2006). | |
| Neil S. Siegel (1967) | | Vice President since 2008 | | Managing Director, Management, since 2008; Managing Director, Neuberger, since 2006; formerly, Senior Vice President, Neuberger, 2004 to 2006; Vice President, nine registered investment companies for which Management acts as investment manager and administrator (nine since 2008). | |
| Chamaine Williams (1971) | | Chief Compliance Officer since 2005 | | Senior Vice President, Neuberger, since 2007; Chief Compliance Officer, Management, since 2006; Chief Compliance Officer, nine registered investment companies for which Management acts as investment manager and administrator (eight since 2005 and one since 2006); formerly, Senior Vice President, LBI, 2007 to 2008; formerly, Vice President, LBI, 2003 to 2006; formerly, Chief Compliance Officer, Lehman Brothers Asset Management Inc., 2003 to 2007; formerly, Chief Compliance Officer, Lehman Brothers Alternative Investment Management LLC, 2003 to 2007. | |
(1) The business address of each listed person is 605 Third Avenue, New York, New York 10158.
(2) Pursuant to the By-Laws of the Trust, each officer elected by the Fund Trustees shall hold office until his or her successor shall have been elected and qualified or until his or her earlier death, inability to serve, or resignation. Officers serve at the pleasure of the Fund Trustees and may be removed at any time with or without cause.
(3) Except as otherwise indicated, each individual has held the positions shown for at least the last five years.
30
Proxy Voting Policies and Procedures
A description of the policies and procedures that the Trust uses to determine how to vote proxies relating to portfolio securities is available, without charge, by calling 1-800-877-9700 (toll-free) and on the website of the Securities and Exchange Commission, at www.sec.gov. Information regarding how the Trust voted proxies relating to portfolio securities during the most recent 12-month period ended June 30 is also available, without charge, by calling 1-800-877-9700 (toll-free), on the website of the Securities and Exchange Commission at www.sec.gov, and on Management's website at www.nb.com.
Quarterly Portfolio Schedule
The Trust files a complete schedule of portfolio holdings for the Fund with the Securities and Exchange Commission for the first and third quarters of each fiscal year on Form N-Q. The Trust's Forms N-Q are available on the Securities and Exchange Commission's website at www.sec.gov and may be reviewed and copied at the Securities and Exchange Commission's Public Reference Room in Washington, DC. Information on the operation of the Public Reference Room may be obtained by calling 1-800-SEC-0330. The information on Form N-Q is available upon request, without charge, by calling 1-800-877-9700 (toll free).
Notice to Shareholders
0.33% of the dividends earned during the fiscal year ended December 31, 2012 qualifies for the dividends received deduction for corporate shareholders.
The Fund has elected to pass through to its shareholders the credits for taxes paid to foreign countries. For the fiscal year ended December 31, 2012, the Fund designates $44,396, or $0.02 per share outstanding, foreign taxes paid and $567,218, or $0.29 per share outstanding, foreign source income earned for Federal income tax purposes.
Board Consideration of the Management and Sub-Advisory Agreements
At a meeting held on October 25, 2012, the Board of Trustees of Neuberger Berman Advisers Management Trust ("Board"), including the Trustees who are not "interested persons" of Management (including its affiliates) or Neuberger Berman Advisers Management Trust ("Independent Fund Trustees"), approved the continuance of the Management and Sub-Advisory Agreements ("Agreements") for International Portfolio ("Fund").
In evaluating the Agreements, the Board, including the Independent Fund Trustees, reviewed materials furnished by Management in response to questions submitted by counsel for the Independent Fund Trustees, and met with senior representatives of Management regarding their personnel, operations and financial conditions as they relate to the Fund. The Independent Fund Trustees were advised by counsel that is experienced in Investment Company Act of 1940 matters and that is independent of Management. The Independent Fund Trustees received a memorandum from independent counsel discussing the legal standards for their consideration of the proposed continuance of the Agreements. They met with such counsel separately from representatives of Management to discuss the annual contract review. The annual contract review extends over three regular meetings of the Board, including one meeting devoted primarily to reviewing and discussing Fund performance, to ensure that Management has time to respond to any questions the Independent Fund Trustees may have on their initial review of the report and that the Independent Fund Trustees have time to consider those responses.
The Board considered the following factors, among others, in connection with its approval of the continuance of the Agreements: (1) the nature, extent, and quality of the services provided by Management and Neuberger; (2) the performance of the Fund compared to a relevant market index and a peer group of investment companies; (3) the costs of the services provided and profits or losses realized by Management and its affiliates from their relationship with the Fund; (4) the extent to which economies of scale might be realized as the Fund grows; and (5) whether fee levels reflect any such
31
potential economies of scale for the benefit of investors in the Fund. In their deliberations, the Board members did not identify any particular information that was all-important or controlling, and each Trustee may have attributed different weights to the various factors.
The Board evaluated the terms of the Agreements, the overall fairness of the Agreements to the Fund and whether the Agreements were in the best interests of the Fund and its shareholders.
With respect to the nature, extent and quality of the services provided, the Board considered the performance of the Fund and the experience and staffing of the portfolio management personnel of Management and Neuberger who perform services for the Fund. The Board noted that Management also provides certain administrative services, including fund accounting and compliance oversight. The Board also considered Management's and Neuberger's policies and practices regarding brokerage and allocation of portfolio transactions by Management. The Board's Portfolio Transactions and Pricing Committee from time to time reviewed the quality of the execution services that Management and Neuberger had provided, and periodically reviewed studies by an independent firm engaged to review and evaluate the quality of brokerage execution received by the Fund. The Board also reviewed whether Management and Neuberger used brokers to execute Fund transactions that provide research and other services to Management and Neuberger, and the types of benefits potentially derived from such services by Management, Neuberger, the Fund and other clients of Management and Neuberger. In addition, the Board noted the positive compliance history of Management and Neuberger, as each firm has been free of significant reported compliance problems. As in past years, the Board also considered the manner in which Management addressed various non-routine matters that arose during the year, some of them a result of developments in the broader fund industry or the regulations governing it.
The Board considered the performance of the Fund relative to its benchmark and the average performance of composite peer groups of investment companies pursuing broadly similar strategies. The Board also reviewed performance during the period in relation to certain measures of the degree of investment risk undertaken by the portfolio manager. The Board also considered Management's resources and responsiveness with respect to the Fund.
With respect to the overall fairness of the Agreements, the Board considered the fee structure for the Fund under the Agreements and any fall-out benefits likely to accrue to Management or Neuberger or their affiliates from their relationship with the Fund. The Board also considered the contractual limit on Fund expenses undertaken by Management. With regard to the sub-advisory fee paid to Neuberger, the Board noted that this fee is "at cost." In addition, the Board considered the profitability of Management and its affiliates from their association with the Fund and noted that Management incurred a loss on the Fund.
The Board considered whether there were other funds that were advised or sub-advised by Management or its affiliates or separate accounts managed by Management or its affiliates with investment objectives, policies and strategies that were similar to the Fund. If so, the Board compared the fees charged to the Fund to the fees charged to any such other funds and/or separate accounts. The Board considered the appropriateness and reasonableness of any differences between the fees charged to the Fund and any such other funds and/or separate accounts and determined that the differences in fees were consistent with the management and other services provided.
The Board also evaluated any apparent or anticipated economies of scale in relation to the services Management provides to the Fund. The Board considered whether the Fund's fee structure provides for a reduction of payments resulting from the use of breakpoints and whether those breakpoints are set at appropriate asset levels. In concluding that the benefits accruing to Management and its affiliates by virtue of their relationship to the Fund were reasonable in comparison with the costs of providing the investment advisory and other services and the benefits accruing to the Fund, the Board reviewed specific data as to Management's loss on the Fund for a recent period. The Board also carefully examined Management's cost allocation methodology.
32
Conclusions
In approving the Agreements, the Board concluded that the terms of each Agreement are fair and reasonable and that approval of the Agreements is in the best interests of the Fund and its shareholders. In reaching this determination, the Board considered that Management and Neuberger could be expected to provide a high level of service to the Fund; that the performance of the Fund was satisfactory over time; that the Fund's fee structure appeared to the Board to be reasonable given the nature and quality of services provided; and that the benefits accruing to Management and its affiliates by virtue of their relationship to the Fund were reasonable in comparison with the benefits accruing to the Fund.
33
Neuberger Berman
Advisers Management Trust
Large Cap Value Portfolio
(Formerly Partners Portfolio)
I Class Shares
Annual Report
December 31, 2012
B1010 02/13
Large Cap Value Portfolio Commentary (Unaudited)
The Neuberger Berman Advisers Management Trust (AMT) Large Cap Value Portfolio Class I generated a 16.60% total return for the fiscal year ended December 31, 2012, underperforming its benchmark, the Russell 1000® Value Index, which returned 17.51% for the same period.
Uncertainty regarding economic, regulatory and geopolitical matters was a recurring macro theme in 2012 that stood in contrast to a solid rise in equities over the year. During the first quarter of 2012, the credit crisis in Europe was a focal concern, yet the market soared on growing confidence that signs of economic improvement in the U.S. as well as strong corporate earnings and the encouraging Federal Reserve "Stress Test" results meant that U.S. businesses could withstand a downturn abroad. The market gave back some of these gains in the spring when the situation in Europe intensified, but the decline was short-lived and equities resumed their ascent during the summer months despite the lack of any meaningful macro improvement.
In the fourth quarter, the market dipped as uncertainty regarding the presidential election and approaching fiscal cliff dominated headlines. However, stocks again recovered much of these losses by the end of the period on positive developments both at home and abroad, which included signs of growth in China and additional progress in Europe to bolster its banking systems. The domestic economy also seemed to be heading towards steadier ground, with rising income and spending data, an improving employment picture and a brightening housing market. In addition, the whirlwind of activity in Congress surrounding the fiscal cliff seemed to suggest that the issue may get warded off for some time. Though equities on the whole produced a flat to negative return in the fourth quarter, market movements culminated in strong returns for the year.
Consumer Discretionary stocks led performance in the large cap value arena in 2012 as increased wages and a slowly improving housing market resulted in healthier spending on consumer goods and services. Financials also outperformed during the year driven in part by stepped-up efforts in Europe to support the banking industry. Meanwhile, depressed natural gas prices hurt the Utilities and Energy sectors, and the Information Technology (IT) sector lagged as the proliferation of smartphones and tablets squeezed profits for computer hardware producers.
Regarding the Portfolio, our holdings in the Financials sector produced the bulk of absolute returns for the year. Financials was also the greatest contributor to performance relative to the Russell 1000 Value Index, owing to our heavier exposure to this outperforming area as well as strong stock selection. An underweight allocation to Utilities further benefitted relative results.
Within Financials, the top drivers of Portfolio returns were Goldman Sachs, Citigroup and Bank of America. These holdings rose significantly from January to March alongside other large banks and brokers due largely to an improving economic environment as well as the release of the Fed "Stress Test" results which revealed the solid capital positions of many of these institutions, particularly Bank of America. These names also benefitted from greater confidence that the more solid banks and brokers in the U.S. could withstand or even profit from a deteriorating financial system in Europe. These stocks retreated along with their industry peers in April and May on weak domestic economic data, but then recovered nicely due to a continuation of the "risk-on" trade that ensued as the domestic economy improved in areas such as employment and housing and as concerns about Europe abated after the European Central Bank (ECB) asserted that it will do "whatever it takes" to support the region's financial system. In addition, within the sector itself, these names became more attractive relative to regional banks whose valuations appeared fuller and whose earnings were more vulnerable to persistently low interest rates. With regard to Utilities, we began 2012 underweighted in the sector and trimmed our position even further over the course of the year. Utility stocks greatly underperformed the general market during the period due in part to persistently low natural gas prices (which dragged down power prices charged by utility companies) as well as general sector rotation out of defensive investments and into more economically sensitive areas of the market.
On the downside, weaker stock returns relative to the Russell 1000 Value Index in IT, Energy and Industrials weighed on Portfolio performance for the period. One of our worst performing holdings in IT was Hewlett-Packard. The stock
1
tumbled over 40% during the year due mainly to ongoing revenue softness as a result of the challenging macro environment as well as company-specific execution issues. The company is in transition and although we viewed the stock as attractively valued, we sold our position during the year as we realized that signs of revival may be farther off than we anticipated, making other investment opportunities appear more attractive at this time. Within Energy, the greatest detractor from relative performance was Range Resources, an independent oil and gas company with the largest acreage position of all the drillers in the Marcellus basin—an area that boasts the best economics in the country for natural gas production. The stock underperformed during the year as it has been pressured by persistently low natural gas prices, and although the price of natural gas recovered somewhat over the past few months, it is still depressed relative to history. At present, we still believe the stock has a great deal of value, however, which we anticipate could be uncovered if Wall Street begins to more fully appreciate the company's strategic assets that enable it to produce natural gas economically in a low gas price environment. Within Industrials, the greatest loss came from CSX Corp, which declined along with other rail freight and transportation stocks due to weak coal demand and overall soft volumes as a result of the lackluster economy. Though economic growth may remain muted in the near term, we continue to see value in CSX owing in part to the company's potential to generate a great deal of cash in the future, which we believe may be returned to shareholders in the form of dividends and buybacks.
Going forward, we see a myriad of unknowns that could test the market yet we continue to draw a line between our view on the global macro environment and prudent stock picking. Among the challenges facing investors is the ongoing credit debacle in Europe; the debt ceiling debate and subsequent spending cuts in the U.S.; the sustainability of recent economic growth in China; a new regime in Japan dedicated to lowering the yen and making their exports more competitive; and ongoing unrest in the Middle East, which could flare up at any time and cause oil prices to spike. Furthermore, corporate revenue growth in the U.S. has begun to slow and it remains to be seen whether companies can continue to grow earnings in 2013 as they have done over the past few years. While we are keenly aware of the external matters at hand, we do not try to predict how or when these events will impact the stock market. Equity multiples on the whole are still low relative to history and we believe we can find value opportunities by seeking stocks that trade at what we consider to be discounted valuations relative to their normalized earnings power, but with a foreseeable catalyst that can reveal their true value over time. We adhere to this strategy regardless of the macro backdrop in an attempt to create a Portfolio that generates superior risk-adjusted returns over the long term. As always, we pay close attention to the correlation between holdings in an effort to reduce risk while maximizing potential returns.
Sincerely,
ELI M. SALZMANN
PORTFOLIO MANAGER
Information about the principal risks of investing in the Portfolio is set forth in the prospectus and statement of additional information.
The portfolio composition, industries and holdings of the Portfolio are subject to change.
Opinions expressed are as of the date herein and are subject to change without notice. This material is not intended to be a formal research report and should not be construed as an offer to sell or the solicitation of an offer to buy any security.
2
Large Cap Value Portfolio (Unaudited)
SECTOR ALLOCATION
| (as a % of Total Investments) | |
| Consumer Discretionary | | | 5.7 | % | |
| Consumer Staples | | | 0.6 | | |
| Energy | | | 18.9 | | |
| Financials | | | 31.2 | | |
| Health Care | | | 6.4 | | |
| Industrials | | | 14.4 | | |
| Information Technology | | | 6.7 | | |
| Materials | | | 10.8 | | |
| Utilities | | | 0.8 | | |
| Short-Term Investments | | | 4.5 | | |
| Total | | | 100.0 | % | |
PERFORMANCE HIGHLIGHTS
| | | | | Average Annual Total Return Ended 12/31/2012 | |
| | | Inception Date | | 1 Year | | 5 Years | | 10 Years | | Life of Fund | |
| Large Cap Value | | | | | | | | | | | | | | | | | | | | | |
| Portolio Class I | | 03/22/1994 | | | 16.60 | % | | | –2.34 | % | | | 7.54 | % | | | 7.50 | % | |
Russell 1000® Value Index1,2 | | | | | | | 17.51 | % | | | 0.59 | % | | | 7.38 | % | | | 8.65 | % | |
The performance data quoted represent past performance and do not indicate future results. Current performance may be lower or higher than the performance data quoted. For more current performance data, please visit www.nb.com.
The results shown in the table reflect the reinvestment of income dividends and other distributions, if any. The results do not reflect the effect of taxes a shareholder would pay on Portfolio distributions or on the redemption of Portfolio shares. The results do not reflect fees and expenses of the variable annuity and variable life insurance policies or the qualified pension and retirement plans whose proceeds are invested in the Portfolio.
The investment return and principal value of an investment will fluctuate and shares, when redeemed, may be worth more or less than their original cost.
Returns would have been lower if Neuberger Berman Management LLC ("Management") had not reimbursed certain expenses and/or waived a portion of the investment management fees during certain of the periods shown. Repayment by a class (of expenses previously reimbursed and/or fees previously waived by Management) will decrease the class's returns. Please see Note B in the Notes to Financial Statements for specific information regarding expense reimbursement and/or fee waiver arrangements.
COMPARISON OF A $10,000 INVESTMENT
This graph shows the change in value of a hypothetical $10,000 investment in the Portfolio over the past 10 fiscal years, or since the Portfolio's inception, if it has not operated for 10 years. The result is compared with benchmarks, which include a broad-based market index and may include a more narrowly based index. Market indices have not been reduced to reflect any of the fees and costs of investing. The results shown in the graph reflect the reinvestment of income dividends and other distributions, if any. The results do not reflect the effect of taxes a shareholder would pay on Portfolio distributions or on the redemption of Portfolio shares. Results represent past performance and do not indicate future results.
Please see Endnotes for additional information.
3
Endnotes (Unaudited)
1 The date used to calculate Life of Fund performance for the index is the inception date of the oldest share class.
2 The Russell 1000® Value Index measures the performance of those Russell 1000® Index companies with lower price-to book ratios and lower forecasted growth values. The Russell 1000 Index measures the performance of the 1,000 largest companies in the Russell 3000® Index (which measures the performance of the 3,000 largest U.S. companies based on total market capitalization). The Russell 1000 Index represents approximately 92% of the total market capitalization of the Russell 3000 Index. Please note that indices do not take into account any fees, expenses or tax consequences of investing in the individual securities that they track, and that individuals cannot invest directly in any index. Data about the performance of an index is prepared or obtained by Neuberger Berman Management LLC ("Management") and reflects the reinvestment of income dividends and other distributions, if any. The Portfolio may invest in securities not included in a described index and/or may not invest in all securities included in a described index.
Any ratios or other measurements using a factor of forecasted earnings of a company discussed herein are based on consensus estimates, not Management's own projections, and they may or may not be realized. In addition, any revision to a forecast could affect the market price of a security. By quoting them herein, Management does not offer an opinion as to the accuracy of and does not guarantee these forecasted numbers.
The investments for the Portfolio are managed by the same portfolio manager(s) who manage(s) one or more other registered funds that have names, investment objectives and investment styles that are similar to those of the Portfolio. You should be aware that the Portfolio is likely to differ from the other mutual fund(s) in size, cash flow pattern and tax matters. Accordingly, the holdings and performance of the Portfolio can be expected to vary from those of the other mutual fund(s).
Shares of the separate AMT Portfolios are not available to the general public. Shares of this Portfolio may be purchased only by life insurance companies to be used with their separate accounts that fund variable annuity and variable life insurance policies and by qualified pension and retirement plans.
Statistics and projections in this report are derived from sources deemed to be reliable but cannot be regarded as a representation of future results of the AMT Portfolios. This report is prepared for the general information of shareholders and is not an offer of shares of the AMT Portfolios. Shares of the AMT Portfolios are sold only through the currently effective prospectuses, which must precede or accompany this report.
The "Neuberger Berman" name and logo are registered service marks of Neuberger Berman Group LLC. "Neuberger Berman Management LLC" and the individual Fund name in this piece are either service marks or registered service marks of Neuberger Berman Management LLC.
© 2013 Neuberger Berman Management LLC distributor. All rights reserved.
4
Information About Your Fund's Expenses (Unaudited)
As a Fund shareholder, you incur two types of costs: (1) transaction costs such as fees and expenses that are, or may be, imposed under your variable contract or qualified pension plan; and (2) ongoing costs, including management fees; distribution and/or service (12b-1) fees (if applicable); and other Fund expenses. This example is intended to help you understand your ongoing costs (in dollars) of investing in the Fund and compare these costs with the ongoing costs of investing in other mutual funds.
This table is designed to provide information regarding costs related to your investments. The following examples are based on an investment of $1,000 made at the beginning of the six month period ended December 31, 2012 and held for the entire period. The table illustrates the Fund's costs in two ways:
| Actual Expenses and Performance: | | The first section of the table provides information about actual account values and actual expenses in dollars, based on the Fund's actual performance during the period. You may use the information in this line, together with the amount you invested, to estimate the expenses you paid over the period. Simply divide your account value by $1,000 (for example, an $8,600 account value divided by $1,000 = 8.6), then multiply the result by the number in the first section of the table under the heading entitled "Expenses Paid During the Period" to estimate the expenses you paid over the period. | |
Hypothetical Example for Comparison Purposes: | | The second section of the table provides information about hypothetical account values and hypothetical expenses based on the Fund's actual expense ratio and an assumed rate of return at 5% per year before expenses. This return is not the Fund's actual return. The hypothetical account values and expenses may not be used to estimate the actual ending account balance or expenses you paid for the period. You may use this information to compare the ongoing costs of investing in this Fund versus other funds. To do so, compare the expenses shown in this 5% hypothetical example with the 5% hypothetical examples that appear in the shareholder reports of other funds. | |
Please note that the expenses in the table are meant to highlight your ongoing costs only and do not include any transaction costs, such as fees and expenses that are, or may be imposed under your variable contract or qualified pension plan. Therefore, the information under the heading "Hypothetical (5% annual return before expenses)" is useful in comparing ongoing costs only, and will not help you determine the relative total costs of owning different funds. In addition, if these transaction costs were included, your costs would have been higher.
Expense Information as of 12/31/12
NEUBERGER BERMAN ADVISERS MANAGEMENT TRUST LARGE CAP VALUE PORTFOLIO
| Actual | | Beginning Account Value 7/1/12 | | Ending Account Value 12/31/12 | | Expenses Paid During the Period* 7/1/12 – 12/31/12 | |
| Class I | | $ | 1,000.00 | | | $ | 1,111.50 | | | $ | 6.21 | | |
| Hypothetical (5% annual return before expenses)** | |
| Class I | | $ | 1,000.00 | | | $ | 1,019.25 | | | $ | 5.94 | | |
* Expenses are equal to the annualized expense ratio of 1.17%, multiplied by the average account value over the period, multiplied by 184/366 (to reflect the one-half year period shown).
** Hypothetical 5% annual return before expenses is calculated by multiplying the number of days in the most recent half year divided by 366.
5
Schedule of Investments Large Cap Value Portfolio
| NUMBER OF SHARES | | | | VALUE† | |
| Common Stocks (95.6%) | | | |
| Automobiles (1.7%) | | | |
| | 80,632 | | | Ford Motor Co. | | $ | 1,044,184 | | |
| Beverages (0.6%) | | | |
| | 10,596 | | | Constellation Brands, Inc. Class A | | | 374,992 | * | |
| Capital Markets (9.0%) | | | |
| | 49,017 | | | Bank of New York Mellon Corp. | | | 1,259,737 | | |
| | 46,809 | | | Charles Schwab Corp. | | | 672,177 | | |
| | 14,802 | | | Goldman Sachs Group, Inc. | | | 1,888,143 | | |
| | 41,850 | | | Invesco Ltd. | | | 1,091,867 | | |
| | 32,791 | | | Morgan Stanley | | | 626,964 | | |
| | | | 5,538,888 | | |
| Chemicals (4.1%) | | | |
| | 11,714 | | | Dow Chemical Co. | | | 378,596 | | |
| | 17,261 | | | LyondellBasell Industries NV Class A | | | 985,431 | | |
| | 12,268 | | | Monsanto Co. | | | 1,161,166 | | |
| | | | 2,525,193 | | |
| Commercial Banks (5.4%) | | | |
| | 67,682 | | | Regions Financial Corp. | | | 481,896 | | |
| | 17,413 | | | SunTrust Banks, Inc. | | | 493,658 | | |
| | 58,908 | | | Wells Fargo & Co. | | | 2,013,475 | | |
| | 16,629 | | | Zions Bancorporation | | | 355,861 | | |
| | | | 3,344,890 | | |
| Communications Equipment (1.3%) | | | |
| | 41,159 | | | Cisco Systems, Inc. | | | 808,774 | | |
| Computers & Peripherals (0.6%) | | | |
| | 8,032 | | | SanDisk Corp. | | | 349,874 | * | |
| Consumer Finance (0.4%) | | | |
| | 6,464 | | | Discover Financial Services | | | 249,187 | | |
| Containers & Packaging (0.8%) | | | |
| | 7,275 | | | Owens-Illinois, Inc. | | | 154,739 | * | |
| | 18,098 | | | Sealed Air Corp. | | | 316,896 | | |
| | | | 471,635 | | |
| NUMBER OF SHARES | | | | VALUE† | |
| Diversified Financial Services (12.8%) | | | |
| | 131,361 | | | Bank of America Corp. | | $ | 1,523,788 | | |
| | 68,101 | | | Citigroup, Inc. | | | 2,694,075 | | |
| | 74,610 | | | J.P. Morgan Chase & Co. | | | 3,280,602 | | |
| | 8,322 | | | Moody's Corp. | | | 418,763 | | |
| | | | 7,917,228 | | |
| Electric Utilities (0.8%) | | | |
| | 16,336 | | | PPL Corp. | | | 467,700 | | |
| Electrical Equipment (0.8%) | | | |
| | 9,381 | | | Emerson Electric Co. | | | 496,818 | | |
Electronic Equipment, Instruments & Components (0.4%) | | | |
| | 18,793 | | | Corning, Inc. | | | 237,168 | | |
| Energy Equipment & Services (6.1%) | | | |
| | 15,046 | | | Diamond Offshore Drilling, Inc. | | | 1,022,526 | | |
| | 19,144 | | | Halliburton Co. | | | 664,106 | | |
| | 62,007 | | | McDermott International, Inc. | | | 683,317 | * | |
| | 20,324 | | | Schlumberger Ltd. | | | 1,408,250 | | |
| | | | 3,778,199 | | |
| Health Care Equipment & Supplies (1.4%) | | | |
| | 93,081 | | | Boston Scientific Corp. | | | 533,354 | * | |
| | 5,224 | | | Zimmer Holdings, Inc. | | | 348,232 | | |
| | | | 881,586 | | |
| Health Care Providers & Services (1.6%) | | | |
| | 12,598 | | | Aetna, Inc. | | | 583,288 | | |
| | 8,055 | | | Cigna Corp. | | | 430,620 | | |
| | | | 1,013,908 | | |
| Hotels, Restaurants & Leisure (0.9%) | | | |
| | 15,698 | | | Carnival Corp. | | | 577,215 | | |
| Industrial Conglomerates (3.5%) | | | |
| | 104,534 | | | General Electric Co. | | | 2,194,169 | | |
| Insurance (3.7%) | | | |
| | 28,687 | | | American International Group, Inc. | | | 1,012,651 | * | |
| | 31,197 | | | Lincoln National Corp. | | | 808,002 | | |
| | 8,992 | | | Reinsurance Group of America, Inc. | | | 481,252 | | |
| | | | 2,301,905 | | |
| Internet Software & Services (0.8%) | | | |
| | 24,264 | | | Yahoo! Inc. | | | 482,854 | * | |
See Notes to Schedule of Investments
6
| NUMBER OF SHARES | | | | VALUE† | |
| IT Services (0.5%) | | | |
| | 7,189 | | | Global Payments, Inc. | | $ | 325,662 | | |
| Machinery (9.2%) | | | |
| | 12,661 | | | Caterpillar, Inc. | | | 1,134,172 | | |
| | 8,361 | | | Cummins, Inc. | | | 905,914 | | |
| | 12,836 | | | Deere & Co. | | | 1,109,287 | | |
| | 12,119 | | | Dover Corp. | | | 796,340 | | |
| | 20,758 | | | Joy Global, Inc. | | | 1,323,945 | | |
| | 9,707 | | | PACCAR, Inc. | | | 438,854 | | |
| | | | 5,708,512 | | |
| Media (1.0%) | | | |
| | 15,791 | | | Comcast Corp. Class A | | | 590,268 | | |
| Metals & Mining (5.9%) | | | |
| | 13,995 | | | BHP Billiton Ltd. ADR | | | 1,097,768 | | |
| | 17,065 | | | Freeport-McMoRan Copper & Gold, Inc. | | | 583,623 | | |
| | 25,659 | | | Newmont Mining Corp. | | | 1,191,604 | | |
| | 18,535 | | | Nucor Corp. | | | 800,341 | | |
| | | | 3,673,336 | | |
| Multiline Retail (0.7%) | | | |
| | 6,931 | | | Target Corp. | | | 410,107 | | |
| Oil, Gas & Consumable Fuels (12.8%) | | | |
| | 6,417 | | | Anadarko Petroleum Corp. | | | 476,847 | | |
| | 7,042 | | | Cabot Oil & Gas Corp. | | | 350,269 | | |
| | 14,422 | | | Chevron Corp. | | | 1,559,595 | | |
| | 42,710 | | | Exxon Mobil Corp. | | | 3,696,551 | | |
| | 5,752 | | | Pioneer Natural Resources Co. | | | 613,106 | | |
| | 19,647 | | | Range Resources Corp. | | | 1,234,421 | | |
| | | | 7,930,789 | | |
| Pharmaceuticals (3.4%) | | | |
| | 21,969 | | | Johnson & Johnson | | | 1,540,027 | | |
| | 13,684 | | | Merck & Co., Inc. | | | 560,223 | | |
| | | | 2,100,250 | | |
| Road & Rail (0.9%) | | | |
| | 27,532 | | | CSX Corp. | | | 543,206 | | |
Semiconductors & Semiconductor Equipment (1.7%) | | | |
| | 28,135 | | | Intel Corp. | | | 580,425 | | |
| | 15,459 | | | Texas Instruments, Inc. | | | 478,301 | | |
| | | | 1,058,726 | | |
| Software (1.4%) | | | |
| | 20,398 | | | Microsoft Corp. | | | 545,238 | | |
| | 10,018 | | | Oracle Corp. | | | 333,800 | | |
| | | | 879,038 | | |
| NUMBER OF SHARES | | | | VALUE† | |
| Specialty Retail (1.4%) | | | |
| | 22,720 | | | Urban Outfitters, Inc. | | $ | 894,259 | * | |
| | | | | Total Common Stocks (Cost $52,266,482) | | | 59,170,520 | | |
| Short-Term Investments (4.5%) | | | |
| | 2,757,410 | | | State Street Insitutional Liquid Reserves Fund Institutional Class (Cost $2,757,410) | | | 2,757,410 | | |
| | | | | Total Investments (100.1%) (Cost $55,023,892) | | | 61,927,930 | ## | |
| | | | | Liabilities, less cash, receivables and other assets [(0.1%)] | | | (73,287 | ) | |
| | | | | Total Net Assets (100.0%) | | $ | 61,854,643 | | |
See Notes to Schedule of Investments
7
Notes to Schedule of Investments Large Cap Value Portfolio
† In accordance with Accounting Standards Codification ("ASC") 820 "Fair Value Measurements and Disclosures" ("ASC 820"), all investments held by Neuberger Berman Advisers Management Trust Large Cap Value Portfolio (the "Fund") are carried at the value that Neuberger Berman Management LLC ("Management") believes the Fund would receive upon selling an investment in an orderly transaction to an independent buyer in the principal or most advantageous market for the investment under current market conditions. Various inputs, including the volume and level of activity for the asset or liability in the market, are considered in valuing the Fund's investments, some of which are discussed below. Significant management judgment may be necessary to value investments in accordance with ASC 820.
ASC 820 established a three-tier hierarchy of inputs to create a classification of value measurements for disclosure purposes. The three-tier hierarchy of inputs is summarized in the three broad Levels listed below.
• Level 1 – quoted prices in active markets for identical investments
• Level 2 – other significant observable inputs (including quoted prices for similar investments, interest rates, prepayment speeds, credit risk, amortized cost, etc.)
• Level 3 – significant unobservable inputs (including the Fund's own assumptions in determining the fair value of investments)
The inputs or methodology used for valuing an investment are not necessarily an indication of the risk associated with investing in those securities.
The value of the Fund's investments in equity securities and exchange traded funds, for which market quotations are readily available, is generally determined by Management by obtaining valuations from an independent pricing service based on the latest sale price quoted on a principal exchange or market for that security (Level 1 inputs). Securities traded primarily on the NASDAQ Stock Market are normally valued by the Fund at the NASDAQ Official Closing Price ("NOCP") provided by NASDAQ each business day. The NOCP is the most recently reported price as of 4:00:02 p.m., Eastern time, unless that price is outside the range of the "inside" bid and asked prices (i.e., the bid and asked prices that dealers quote to each other when trading for their own accounts); in that case, NASDAQ will adjust the price to equal the inside bid or asked price, whichever is closer. Because of delays in reporting trades, the NOCP may not be based on the price of the last trade to occur before the market closes. If there is no reported sale of a security on a particular day, the independent pricing service may value the security based on reported market quotations.
Management has developed a process to periodically review information provided by independent pricing services for all types of securities.
Investments in State Street Institutional Liquid Reserves Fund Institutional Class are valued using the fund's daily calculated net asset value per share (Level 2 inputs).
If a valuation is not available from an independent pricing service, or if Management has reason to believe that the valuation received does not represent the amount the Fund might reasonably expect to receive on a current sale in an orderly transaction, the Fund seeks to obtain quotations from principal market makers (generally considered Level 3 inputs). If such quotations are not readily available, the security is valued using methods the Neuberger Berman Advisers Management Trust's Board of Trustees (the "Board") has approved on the belief that they reflect fair value. Numerous factors may be considered when determining the fair value of a security based on Level 2 or 3 inputs, including available analyst, media or other reports, trading in futures or ADRs and whether the issuer of the security being fair valued has other securities outstanding.
The value of the Fund's investments in foreign securities is generally determined using the same valuation methods and inputs as other Fund investments, as discussed above. Foreign security prices expressed in local currency values are translated from the local currency into U.S. dollars using the exchange rates as of 4:00 p.m., Eastern time. The Board has approved the use of Interactive Data Pricing and Reference Data, Inc. ("Interactive")
See Notes to Financial Statements
8
Notes to Schedule of Investments Large Cap Value Portfolio (cont'd)
to assist in determining the fair value of foreign equity securities when changes in the value of a certain index suggest that the closing prices on the foreign exchanges may no longer represent the amount that the Fund could expect to receive for those securities or on days when foreign markets are closed and U.S. markets are open. In each of these events, Interactive will provide adjusted prices for certain foreign equity securities using a statistical analysis of historical correlations of multiple factors (Level 2 inputs). In the absence of precise information about the market values of these foreign securities as of the close of the New York Stock Exchange, the Board has determined on the basis of available data that prices adjusted in this way are likely to be closer to the prices the Fund could realize on a current sale than are the prices of those securities established at the close of the foreign markets in which the securities primarily trade.
Fair value prices are necessarily estimates, and there is no assurance that such a price will be at or close to the price at which the security is next quoted or next trades.
The following is a summary, categorized by Level, of inputs used to value the Fund's investments as of December 31, 2012:
| Asset Valuation Inputs | | Level 1 | | Level 2 | | Level 3 | | Total | |
| Investments: | |
| Common Stocks^ | | $ | 59,170,520 | | | $ | — | | | $ | — | | | $ | 59,170,520 | | |
| Short-Term Investments | | | — | | | | 2,757,410 | | | | — | | | | 2,757,410 | | |
| Total Investments | | $ | 59,170,520 | | | $ | 2,757,410 | | | $ | — | | | $ | 61,927,930 | | |
^ The Schedule of Investments provides information on the industry categorization for the portfolio.
The Fund had no transfers between Levels 1 and 2 during the year ended December 31, 2012.
## At December 31, 2012, the cost of investments for U.S. federal income tax purposes was $55,816,583. Gross unrealized appreciation of investments was $6,554,036 and gross unrealized depreciation of investments was $442,689, resulting in net unrealized appreciation of $6,111,347, based on cost for U.S. federal income tax purposes.
* Security did not produce income during the last twelve months.
See Notes to Financial Statements
9
Statement of Assets and Liabilities
Neuberger Berman Advisers Management Trust
| | | LARGE CAP VALUE PORTFOLIO | |
| | | December 31, 2012 | |
| Assets | |
| Investments in securities, at value* (Note A)—see Schedule of Investments: | |
| Unaffiliated issuers | | $ | 61,927,930 | | |
| Foreign currency | | | 36,680 | | |
| Dividends and interest receivable | | | 57,977 | | |
| Receivable for securities sold | | | 1,134,017 | | |
| Receivable for Fund shares sold | | | 52,326 | | |
| Prepaid expenses and other assets | | | 14,497 | | |
| Total Assets | | | 63,223,427 | | |
| Liabilities | |
| Payable for securities purchased | | | 974,473 | | |
| Payable for Fund shares redeemed | | | 288,344 | | |
| Payable to investment manager (Note B) | | | 28,641 | | |
| Payable to administrator (Note B) | | | 15,622 | | |
| Accrued expenses and other payables | | | 61,704 | | |
| Total Liabilities | | | 1,368,784 | | |
| Net Assets | | $ | 61,854,643 | | |
| Net Assets consist of: | |
| Paid-in capital | | $ | 70,675,717 | | |
| Undistributed net investment income (loss) | | | 760,815 | | |
| Accumulated net realized gains (losses) on investments | | | (16,492,393 | ) | |
| Net unrealized appreciation (depreciation) in value of investments | | | 6,910,504 | | |
| Net Assets | | $ | 61,854,643 | | |
| Shares Outstanding ($.001 par value; unlimited shares authorized) | | | 5,331,703 | | |
| Net Asset Value, offering and redemption price per share | | $ | 11.60 | | |
| *Cost of Investments | | $ | 55,023,892 | | |
| Total cost of foreign currency | | $ | 30,215 | | |
See Notes to Financial Statements
10
Statement of Operations
Neuberger Berman Advisers Management Trust
| | | LARGE CAP VALUE PORTFOLIO | |
| | | For the Year Ended December 31, 2012 | |
| Investment Income: | |
| Income (Note A): | |
| Dividend income—unaffiliated issuers | | $ | 1,526,947 | | |
| Interest income—unaffiliated issuers | | | 5,364 | | |
| Foreign taxes withheld | | | (10,810 | ) | |
| Total income | | $ | 1,521,501 | | |
| Expenses: | |
| Investment management fees (Note B) | | | 364,552 | | |
| Administration fees (Note B) | | | 198,846 | | |
| Audit fees | | | 43,535 | | |
| Custodian fees | | | 34,005 | | |
| Insurance expense | | | 4,507 | | |
| Legal fees | | | 32,854 | | |
| Shareholder reports | | | 26,450 | | |
| Trustees' fees and expenses | | | 50,824 | | |
| Miscellaneous | | | 4,908 | | |
| Total expenses | | | 760,481 | | |
| Expenses reduced by custodian fee expense offset arrangement (Note A) | | | (10 | ) | |
| Total net expenses | | | 760,471 | | |
| Net investment income (loss) | | $ | 761,030 | | |
| Realized and Unrealized Gain (Loss) on Investments (Note A): | |
| Net realized gain (loss) on: | |
| Sales of investment securities of unaffiliated issuers | | | 6,973,049 | | |
| Foreign currency | | | 90 | | |
| Change in net unrealized appreciation (depreciation) in value of: | |
| Unaffiliated investment securities | | | 2,893,265 | | |
| Foreign currency | | | 796 | | |
| Net gain (loss) on investments | | | 9,867,200 | | |
| Net increase (decrease) in net assets resulting from operations | | $ | 10,628,230 | | |
See Notes to Financial Statements
11
Statements of Changes in Net Assets
Neuberger Berman Advisers Management Trust
| | | LARGE CAP VALUE PORTFOLIO | |
| | | Year Ended December 31, 2012 | | Year Ended December 31, 2011 | |
| Increase (Decrease) in Net Assets: | |
| From Operations (Note A): | |
| Net investment income (loss) | | $ | 761,030 | | | $ | 262,123 | | |
| Net realized gain (loss) on investments | | | 6,973,139 | | | | 16,246,799 | | |
| Change in net unrealized appreciation (depreciation) of investments | | | 2,894,061 | | | | (26,555,817 | ) | |
| Net increase (decrease) in net assets resulting from operations | | | 10,628,230 | | | | (10,046,895 | ) | |
| Distributions to Shareholders From (Note A): | |
| Net investment income | | | (254,987 | ) | | | — | | |
| From Fund Share Transactions (Note D): | |
| Proceeds from shares sold | | | 5,848,833 | | | | 14,160,515 | | |
| Proceeds from reinvestment of dividends and distributions | | | 254,987 | | | | — | | |
| Payments for shares redeemed | | | (29,906,577 | ) | | | (25,985,207 | ) | |
| Net increase (decrease) from Fund share transactions | | | (23,802,757 | ) | | | (11,824,692 | ) | |
| Net Increase (Decrease) in Net Assets | | | (13,429,514 | ) | | | (21,871,587 | ) | |
| Net Assets: | |
| Beginning of year | | | 75,284,157 | | | | 97,155,744 | | |
| End of year | | $ | 61,854,643 | | | $ | 75,284,157 | | |
| Undistributed net investment income (loss) at end of year | | $ | 760,815 | | | $ | 254,682 | | |
See Notes to Financial Statements
12
Notes to Financial Statements Large Cap Value Portfolio
Note A—Summary of Significant Accounting Policies:
1 General: Neuberger Berman Advisers Management Trust (the "Trust") is a Delaware statutory trust organized pursuant to a Trust Instrument dated May 23, 1994. The Trust is currently comprised of ten separate operating series (each individually a "Series," and collectively the "Funds") each of which is diversified. The Trust is registered as an open-end management investment company under the Investment Company Act of 1940, as amended (the "1940 Act"), and its shares are registered under the Securities Act of 1933, as amended. The Fund currently offers only Class I shares. The Board may establish additional series or classes of shares without the approval of shareholders.
The assets of each Series belong only to that Series, and the liabilities of each Series are borne solely by that Series and no other.
The preparation of financial statements in accordance with U.S. generally accepted accounting principles ("GAAP") requires Management to make estimates and assumptions at the date of the financial statements. Actual results could differ from those estimates.
2 Portfolio valuation: Investment securities are valued as indicated in the notes following the Schedule of Investments.
3 Foreign currency translation: The accounting records of the Fund are maintained in U.S. dollars. Foreign currency amounts are translated into U.S. dollars using the exchange rate as of 4:00 p.m., Eastern time, to determine the value of investments, other assets and liabilities. Purchase and sale prices of securities, and income and expenses, are translated into U.S. dollars at the prevailing rate of exchange on the respective dates of such transactions. Net unrealized foreign currency gain (loss), if any, arises from changes in the value of assets and liabilities, other than investments in securities, as a result of changes in exchange rates and is stated separately in the Statement of Operations.
4 Securities transactions and investment income: Securities transactions are recorded on trade date for financial reporting purposes. Dividend income is recorded on the ex-dividend date or, for certain foreign dividends, as soon as the Fund becomes aware of the dividends. Non-cash dividends included in dividend income, if any, are recorded at the fair market value of the securities received. Interest income, including accretion of original issue discount, where applicable, and accretion of discount on short-term investments, if any, is recorded on the accrual basis. Realized gains and losses from securities transactions and foreign currency transactions, if any, are recorded on the basis of identified cost and stated separately in the Statement of Operations. Included in net realized gain (loss) on investments are proceeds from the settlements of class action litigation in which the Fund participated as a class member. The amount of such proceeds for the year ended December 31, 2012 was $3,774.
5 Income tax information: The Funds are treated as separate entities for U.S. federal income tax purposes. It is the policy of the Fund to continue to qualify for treatment as a regulated investment company by complying with the requirements of the U.S. Internal Revenue Code applicable to regulated investment companies and to distribute substantially all of its net investment income and net realized capital gains to its shareholders. To the extent the Fund distributes substantially all of its net investment income and net realized capital gains to shareholders, no federal income or excise tax provision is required.
The Fund has adopted the provisions of ASC 740 "Income Taxes" ("ASC 740"). ASC 740 sets forth a minimum threshold for financial statement recognition of a tax position taken, or expected to be taken, in a tax return. The Fund recognizes interest and penalties, if any, related to unrecognized tax positions as an income tax expense in the Statement of Operations. The Fund is subject to examination by U.S. federal and state tax authorities for returns filed for the prior three fiscal years 2009 - 2011. As of December 31, 2012, the Fund did not have any unrecognized tax positions.
13
Income distributions and capital gain distributions are determined in accordance with income tax regulations, which may differ from GAAP. These differences are primarily due to differing treatments of income and gains on various investment securities held by the Fund, timing differences and differing characterization of distributions made by the Fund. The Fund may also utilize earnings and profits distributed to shareholders on redemption of shares as a part of the dividends-paid deduction for income tax purposes.
As determined on December 31, 2012, permanent differences resulting primarily from different book and tax accounting were reclassified at year end. Such differences are attributed to foreign currency gains and losses. These reclassifications had no effect on net income, net asset value ("NAV") or NAV per share of the Fund. For the year ended December 31, 2012, the Fund recorded the following permanent reclassifications:
| | | Paid-in Capital | | Undistributed Net Investment Income (Loss) | | Accumulated Net Realized Gains (Losses) on Investments | |
| | | | | $ | — | | | $ | 90 | | | $ | (90 | ) | |
For tax purposes, distributions of short-term gains are taxable to shareholders as ordinary income.
The tax character of distributions paid during the years ended December 31, 2012 and December 31, 2011 was as follows:
| | | Distributions Paid From: | |
| | | Ordinary Income | | Long- Term Capital Gain | | Total | |
| | | 2012 | | 2011 | | 2012 | | 2011 | | 2012 | | 2011 | |
| | | | | $ | 254,987 | | | $ | — | | | $ | — | | | $ | — | | | $ | 254,987 | | | $ | — | | |
As of December 31, 2012, the components of distributable earnings (accumulated losses) on a U.S. federal income tax basis were as follows:
| | | Undistributed Ordinary Income | | Undistributed Long-Term Gain | | Unrealized Appreciation (Depreciation) | | Loss Carryforwards and Deferrals | | Other Temporary Differences | | Total | |
| | | | | $ | 760,815 | | | $ | — | | | $ | 6,117,813 | | | $ | (15,699,702 | ) | | $ | — | | | $ | (8,821,074 | ) | |
The difference between book basis and tax basis distributable earnings are primarily due to: timing differences of wash sales and capital loss carryforwards.
To the extent the Fund's net realized capital gains, if any, can be offset by capital loss carryforwards, it is the policy of the Fund not to distribute such gains. The Regulated Investment Company ("RIC") Modernization Act of 2010 (the "Act") became effective for the Fund on January 1, 2011. The Act modernizes several of the federal income and excise tax provisions related to RICs. Among the changes made are changes to the capital loss carryforward rules allowing for RICs to carry forward capital losses indefinitely and to retain the character of capital loss carryforwards as short-term or long-term ("Post-Enactment"). Rules in effect previously limited the carryforward period to eight years and all carryforwards were considered short-term in character ("Pre-Enactment"). As determined at December 31, 2012, the Fund had unused capital loss carryforwards available for federal income tax purposes to offset net realized capital gains, if any, as follows:
| | | Pre-Enactment | |
| | | Expiring in: | |
| | | 2017 | |
| | | | | $ | 15,699,702 | | |
14
Post-Enactment capital loss carryforwards must be fully used before Pre-Enactment capital loss carryforwards; therefore, under certain circumstances, Pre-Enactment capital loss carryforwards available as of the report date may expire unused. As of December 31, 2012, the Fund had no Post-Enactment capital loss carryforwards.
During the year ended December 31, 2012, the Fund utilized capital loss carryforwards of $7,240,121.
6 Distributions to shareholders: The Fund may earn income, net of expenses, daily on its investments. Distributions from net investment income and net realized capital gains, if any, generally are distributed once a year (usually in October). Income distributions and capital gain distributions to shareholders are recorded on the ex-date.
7 Foreign taxes: Foreign taxes withheld represent amounts withheld by foreign tax authorities, net of refunds recoverable.
8 Expense allocation: Certain expenses are applicable to multiple funds. Expenses directly attributable to a Series are charged to that Series. Expenses of the Trust that are not directly attributable to a particular series of the Trust (e.g., the Fund) are allocated among the series of the Trust, on the basis of relative net assets, except where a more appropriate allocation of expenses to each of the series can otherwise be made fairly. Expenses borne by the complex of related investment companies, which includes open-end and closed-end investment companies for which Management serves as investment manager, that are not directly attributable to a particular investment company in the complex (e.g., the Trust) or series thereof are allocated among the investment companies in the complex or series thereof, on the basis of relative net assets, except where a more appropriate allocation of expenses to each of the investment companies in the complex or series thereof can otherwise be made fairly.
9 Investments in foreign securities: Investing in foreign securities may involve certain sovereign and other risks, in addition to the credit and market risks normally associated with domestic securities. These additional risks include the possibility of adverse political and economic developments (including political instability, nationalization, expropriation, or confiscatory taxation) and the potentially adverse effects of unavailability of public information regarding issuers, less governmental supervision and regulation of financial markets, reduced liquidity of certain financial markets, and the lack of uniform accounting, auditing, and financial reporting standards or the application of standards that are different or less stringent than those applied in the United States. Foreign securities also may experience greater price volatility, higher rates of inflation, and delays in settlement.
10 Indemnifications: Like many other companies, the Trust's organizational documents provide that its officers and trustees are indemnified against certain liabilities arising out of the performance of their duties to the Trust. In addition, both in some of its principal service contracts and in the normal course of its business, the Trust enters into contracts that provide indemnifications to other parties for certain types of losses or liabilities. The Trust's maximum exposure under these arrangements is unknown as this could involve future claims against the Trust.
11 Expense offset arrangement: The Fund has an expense offset arrangement in connection with its custodian contract. For the year ended December 31, 2012, the impact of this arrangement was a reduction of expenses of $10.
Note B—Management Fees, Administration Fees, Distribution Arrangements, and Other Transactions with Affiliates:
Fund shares are issued and redeemed in connection with investments in and payments under certain variable annuity contracts and variable life insurance policies issued through separate accounts of life insurance companies and are also offered directly to certain qualified pension and retirement plans.
The Fund retains Management as its investment manager under a Management Agreement. For such investment management services, the Fund pays Management a fee at the annual rate of 0.55% of the first $250 million of the Fund's average daily net assets, 0.525% of the next $250 million, 0.50% of the next $250 million, 0.475% of the next $250 million, 0.45% of the next $500 million, 0.425% of the next $2.5 billion, and 0.40% of average daily net assets
15
in excess of $4 billion. Accordingly, for the year ended December 31, 2012, the management fee pursuant to the Management Agreement was equivalent to an annual effective rate of 0.55% of the Fund's average daily net assets.
The Fund retains Management as its administrator under an Administration Agreement. The Fund pays Management an administration fee at the annual rate of 0.30% of its average daily net assets under this agreement. Additionally, Management retains State Street Bank and Trust Company ("State Street") as its sub-administrator under a Sub-Administration Agreement. Management pays State Street a fee for all services received under this agreement.
The Board adopted a non-fee distribution plan for the Fund.
Management has contractually undertaken through December 31, 2015 to waive current payment of fees and/or reimburse the Fund for its operating expenses (excluding fees payable to Management, interest, taxes, brokerage commissions, extraordinary expenses, transaction costs and dividend expense on short sales, if any) ("Operating Expenses") which exceed, in the aggregate, 1.00% per annum of the Fund's average daily net assets (the "Expense Limitation"). For the year ended December 31, 2012, no reimbursement to the Fund was required. The Fund has agreed to repay Management through December 31, 2018 for fees and expenses waived and/or its excess Operating Expenses previously reimbursed by Management, so long as its annual Operating Expenses during that period do not exceed its Expense Limitation in place at the time the fees and expenses were waived or reimbursed, and the repayment is made within three years after the year in which Management issued the reimbursement or waived fees. During the year ended December 31, 2012, there was no repayment to Management under its contractual expense limitation. At December 31, 2012, the Fund had no contingent liability to Management under its contractual expense limitation.
Neuberger Berman LLC ("Neuberger") is retained by Management to furnish it with investment recommendations and research information without added cost to the Fund. Several individuals who are officers and/or trustees of the Trust are also employees of Neuberger and/or Management.
Management and Neuberger are indirect subsidiaries of Neuberger Berman Group LLC (("NBG") and together with its consolidated subsidiaries ("NB Group")). NBSH Acquisition, LLC ("NBSH"), which is owned by portfolio managers, members of the NB Group management team and certain of NB Group's key employees and senior professionals, owns, as of September 30, 2012, approximately 57% of NBG's common units, and Lehman Brothers Holdings Inc. ("LBHI") and certain of its subsidiaries (collectively the "LBHI Parties") own the remaining 43% of such common units. Pursuant to agreements among NBG, NBSH and the LBHI Parties, NBG is entitled to acquire the remaining Class A common units through a process that is expected to end in 2017. In April 2012, NBG exercised its option (the "Redemption Agreement Option") to redeem during 2012 certain of its Class A common units held by the LBHI Parties equal to 10% of NBG's aggregate common units issued and outstanding as of March 16, 2012. The final payment for such Class A common units is due within thirty (30) days of December 31, 2012.
Note C—Securities Transactions:
During the year ended December 31, 2012, there were purchase and sale transactions (excluding short-term securities) of $78,444,670 and $100,770,041, respectively.
During the year ended December 31, 2012, no brokerage commissions on securities transactions were paid to affiliated brokers.
16
Note D—Fund Share Transactions:
Share activity for the years ended December 31, 2012 and December 31, 2011 was as follows:
| | | For the Year Ended December 31, | |
| | | 2012 | | 2011 | |
| Shares Sold | | | 537,429 | | | | 1,276,805 | | |
| Shares Issued on Reinvestment of Dividends and Distributions | | | 22,706 | | | | — | | |
| Shares Redeemed | | | (2,766,023 | ) | | | (2,359,718 | ) | |
| Total | | | (2,205,888 | ) | | | (1,082,913 | ) | |
Note E—Line of Credit:
At December 31, 2012, the Fund was a participant in a single committed, unsecured $200,000,000 line of credit with State Street, to be used only for temporary or emergency purposes. Other investment companies managed by Management also participate in this line of credit on the same terms. Interest is charged on borrowings under this line of credit at the higher of (a) the Federal Funds Rate plus 1.25% per annum or (b) the Overnight LIBOR Rate plus 1.25% per annum. A commitment fee of 0.10% per annum of the available line of credit is charged, of which each participating Fund has agreed to pay its pro rata share, based on the ratio of its individual net assets to the net assets of all participants at the time the fee is due and payable. The fee is paid quarterly in arrears. Because several mutual funds participate, there is no assurance that an individual Fund will have access to all or any part of the $200,000,000 at any particular time. There were no loans outstanding pursuant to this line of credit at December 31, 2012. During the year ended December 31, 2012, the Fund did not utilize this line of credit.
Note F—Recent Accounting Pronouncement:
In December 2011, the Financial Accounting Standards Board issued Accounting Standards Update 2011-11 Disclosures about Offsetting Assets and Liabilities ("ASU 2011-11"). Effective for annual reporting periods beginning on or after January 1, 2013 and interim periods within those annual periods, ASU 2011-11 is intended to enhance disclosure requirements on the offsetting of financial assets and liabilities. At this time, Management is evaluating the implications of ASU 2011-11 and its impact on the financial statements.
17
Financial Highlights
Large Cap Value Portfolio
The following table includes selected data for a share outstanding throughout each year and other performance information derived from the Financial Statements. Per share amounts that round to less than $.01 or $(.01) per share are presented as $.00 or $(.00), respectively.
| | | Year Ended December 31, | |
| | | 2012 | | 2011 | | 2010 | | 2009 | | 2008 | |
| Net Asset Value, Beginning of Year | | $ | 9.99 | | | $ | 11.27 | | | $ | 9.82 | | | $ | 7.11 | | | $ | 20.76 | | |
| Income From Investment Operations: | |
Net Investment Income (Loss)‡ | | | .12 | | | | .03 | | | | (.00 | ) | | | .03 | | | | .08 | | |
Net Gains or Losses on Securities (both realized and unrealized) | | | 1.54 | | | | (1.31 | ) | | | 1.52 | | | | 3.98 | | | | (10.78 | ) | |
| Total From Investment Operations | | | 1.66 | | | | (1.28 | ) | | | 1.52 | | | | 4.01 | | | | (10.70 | ) | |
| Less Distributions From: | |
| Net Investment Income | | | (.05 | ) | | | — | | | | (.07 | ) | | | (.24 | ) | | | (.09 | ) | |
| Net Capital Gains | | | — | | | | — | | | | — | | | | (1.06 | ) | | | (2.86 | ) | |
| Total Distributions | | | (.05 | ) | | | — | | | | (.07 | ) | | | (1.30 | ) | | | (2.95 | ) | |
| Net Asset Value, End of Year | | $ | 11.60 | | | $ | 9.99 | | | $ | 11.27 | | | $ | 9.82 | | | $ | 7.11 | | |
Total Return†† | | | 16.60 | % | | | (11.36 | )% | | | 15.55 | % | | | 56.23 | % | | | (52.37 | )% | |
| Ratios/Supplemental Data | |
| Net Assets, End of Year (in millions) | | $ | 61.9 | | | $ | 75.3 | | | $ | 97.2 | | | $ | 96.7 | | | $ | 217.9 | | |
Ratio of Gross Expenses to Average Net Assets# | | | 1.15 | % | | | 1.13 | % | | | 1.11 | % | | | 1.06 | % | | | .94 | % | |
Ratio of Net Expenses to Average Net Assets§ | | | 1.15 | % | | | 1.13 | % | | | 1.11 | % | | | 1.05 | % | | | .94 | % | |
Ratio of Net Investment Income (Loss) to Average Net Assets | | | 1.15 | % | | | .29 | % | | | (.02 | )% | | | .34 | % | | | .53 | % | |
| Portfolio Turnover Rate | | | 124 | % | | | 102 | % | | | 43 | % | | | 41 | % | | | 38 | % | |
See Notes to Financial Highlights
18
Notes to Financial Highlights Large Cap Value Portfolio
†† Total return based on per share NAV reflects the effects of changes in NAV on the performance of the Fund during each fiscal period and assumes income dividends and other distributions, if any, were reinvested. Results represent past performance and do not indicate future results. Current returns may be lower or higher than the performance data quoted. Investment returns and principal may fluctuate and shares when redeemed may be worth more or less than original cost. Total return would have been lower if Management had not waived certain expenses. The total return information shown does not reflect charges and other expenses that apply to the separate account or the related insurance policies, and the inclusion of these charges and other expenses would reduce the total return for all fiscal periods shown. The class actions proceeds listed in Note A-4 had no impact on total return.
# Represents the annualized ratios of net expenses to average daily net assets if Management had not waived a portion of the investment management fee.
‡ Calculated based on the average number of shares outstanding during each fiscal period.
§ After waiver of a portion of the investment management fee by Management. The Fund is required to calculate an expense ratio without taking into consideration any expense reductions related to expense offset arrangements. Had the Fund not received expense reductions related to expense offset arrangements, the annualized ratios of net expenses to average daily net assets would have been:
| | | Year Ended December 31, | |
| | | 2012 | | 2011 | | 2010 | | 2009 | | 2008 | |
| | | | | | 1.15 | % | | | 1.13 | % | | | 1.11 | % | | | 1.05 | % | | | .95 | % | |
19
Report of Independent Registered Public Accounting Firm
To the Board of Trustees of
Neuberger Berman Advisers Management Trust and
Shareholders of Large Cap Value Portfolio
We have audited the accompanying statement of assets and liabilities of Large Cap Value Portfolio (formerly, Partners Portfolio), one of the series constituting Neuberger Berman Advisers Management Trust (the "Trust"), including the schedule of investments, as of December 31, 2012, and the related statement of operations for the year then ended, the statements of changes in net assets for each of the two years in the period then ended, and the financial highlights for each of the five years in the period then ended. These financial statements and financial highlights are the responsibility of the Trust's management. Our responsibility is to express an opinion on these financial statements and financial highlights based on our audits.
We conducted our audits in accordance with the standards of the Public Company Accounting Oversight Board (United States). Those standards require that we plan and perform the audit to obtain reasonable assurance about whether the financial statements and financial highlights are free of material misstatement. We were not engaged to perform an audit of the Trust's internal control over financial reporting. Our audits included consideration of internal control over financial reporting as a basis for designing audit procedures that are appropriate in the circumstances, but not for the purpose of expressing an opinion on the effectiveness of the Trust's internal control over financial reporting. Accordingly, we express no such opinion. An audit also includes examining, on a test basis, evidence supporting the amounts and disclosures in the financial statements and financial highlights, assessing the accounting principles used and significant estimates made by management, and evaluating the overall financial statement presentation. Our procedures included confirmation of securities owned as of December 31, 2012 by correspondence with the custodian and others or by other appropriate auditing procedures where replies from others were not received. We believe that our audits provide a reasonable basis for our opinion.
In our opinion, the financial statements and financial highlights referred to above present fairly, in all material respects, the financial position of Large Cap Value Portfolio, a series of Neuberger Berman Advisers Management Trust, at December 31, 2012, the results of its operations for the year then ended, the changes in its net assets for each of the two years in the period then ended, and the financial highlights for each of the five years in the period then ended, in conformity with U.S. generally accepted accounting principles.
Boston, Massachusetts
February 7, 2013
20
Trustee and Officer Information
The following tables set forth information concerning the trustees ("Trustees") and officers ("Officers") of the Trust. All persons named as Trustees and Officers also serve in similar capacities for other funds administered or managed by Management, Neuberger and Neuberger Berman Fixed Income LLC ("NBFI"). The Statement of Additional Information includes additional information about Trustees and is available upon request, without charge, by calling (800) 877-9700.
Information about the Board of Trustees
Name, (Year of Birth), and Address(1) | | Position(s) and Length of Time Served(2) | | Principal Occupation(s)(3) | | Number of Funds in Fund Complex Overseen by Fund Trustee | | Other Directorships Held Outside Fund Complex by Fund Trustee(3) | |
| Independent Fund Trustees | |
| Faith Colish (1935) | | Trustee since 1982 | | Counsel, Carter Ledyard & Milburn LLP (law firm) since October 2002; formerly, Attorney-at-Law and President, Faith Colish, A Professional Corporation, 1980 to 2002. | | | 50 | | | Formerly, Director, 1997 to 2003, and Advisory Director, 2003 to 2006, ABA Retirement Funds (formerly, American Bar Retirement Association) (not-for-profit membership corporation). | |
| Martha C. Goss (1949) | | Trustee since 2007 | | President, Woodhill Enterprises Inc./Chase Hollow Associates LLC (personal investment vehicle), since 2006; Chief Operating and Financial Officer, Hopewell Holdings LLC/Amwell Holdings, LLC (a holding company for investments in the healthcare sector), since 2003; formerly, Consultant, Resources Connection (temporary staffing), 2002 to 2006. | | | 50 | | | Director, American Water (water utility), since 2003; Director, Channel Reinsurance (financial guaranty reinsurance), 2006 to 2010; Director, Allianz Life of New York (insurance), since 2005; Director, Financial Women's Association of New York (not-for-profit association), since 2003; Trustee Emerita, Brown University, since 1998; formerly, Director, Ocwen Financial Corporation (mortgage servicing), 2005 to 2010; formerly, Advisory Board Member, Attensity (software developer), 2005 to 2007; formerly, Director, Bank Leumi (commercial bank), 2005 to 2007; formerly, Director, Claire's Stores, Inc. (retailer), 2005 to 2007. | |
21
Name, (Year of Birth), and Address(1) | | Position(s) and Length of Time Served(2) | | Principal Occupation(s)(3) | | Number of Funds in Fund Complex Overseen by Fund Trustee | | Other Directorships Held Outside Fund Complex by Fund Trustee(3) | |
| Michael M. Knetter (1960) | | Trustee since 2007 | | President and Chief Executive Officer, University of Wisconsin Foundation, since October 2010; formerly, Dean, School of Business, University of Wisconsin - Madison; formerly, Professor of International Economics and Associate Dean, Amos Tuck School of Business - Dartmouth College, 1998 to 2002. | | | 50 | | | Director, American Family Insurance (a mutual company, not publicly traded), since March 2009; formerly, Trustee, Northwestern Mutual Series Fund, Inc., 2007 to 2010; formerly, Director, Wausau Paper, 2005 to 2011; formerly, Director, Great Wolf Resorts, 2004 to 2009. | |
| Howard A. Mileaf (1937) | | Trustee since 1999 | | Retired; formerly, Vice President and General Counsel, WHX Corporation (holding company), 1993 to 2001. | | | 50 | | | Formerly, Director, Webfinancial Corporation (holding company), 2002 to 2008; formerly, Director, WHX Corporation (holding company), 2002 to 2005; formerly, Director, State Theatre of New Jersey (not-for-profit theatre), 2000 to 2005. | |
| George W. Morriss (1947) | | Trustee since 2007 | | Adjunct Faculty Member, Columbia University School of International Policy and Administration, since October 2012; formerly, Executive Vice President and Chief Financial Officer, People's Bank, Connecticut (a financial services company), 1991 to 2001. | | | 50 | | | Formerly, Manager, Larch Lane Multi-Strategy Fund complex (which consisted of three funds), 2006 to 2011; formerly, Member, NASDAQ Issuers' Affairs Committee, 1995 to 2003. | |
22
Name, (Year of Birth), and Address(1) | | Position(s) and Length of Time Served(2) | | Principal Occupation(s)(3) | | Number of Funds in Fund Complex Overseen by Fund Trustee | | Other Directorships Held Outside Fund Complex by Fund Trustee(3) | |
| Jack L. Rivkin (1940) | | Trustee since 2002; President 2002 to 2008 | | Formerly, Executive Vice President and Chief Investment Officer, Neuberger Berman Holdings LLC (holding company), 2002 to August 2008 and 2003 to August 2008, respectively; formerly, Managing Director and Chief Investment Officer, Neuberger, December 2005 to August 2008 and 2003 to August 2008, respectively; formerly, Executive Vice President, Neuberger, December 2002 to 2005; formerly, Director and Chairman, Management, December 2002 to August 2008; formerly, Executive Vice President, Citigroup Investments, Inc., September 1995 to February 2002; formerly, Executive Vice President, Citigroup Inc., September 1995 to February 2002. | | | 50 | | | Director, Idealab (private company), since 2009; Director, Distributed World Power (private company), since 2009; Director, Dale Carnegie and Associates, Inc. (private company), since 1999; Director, Solbright, Inc. (private company), since 1998; Director, SA Agricultural Fund, since 2009; Chairman and Director, Essential Brands (consumer products) since 2008; formerly, Director, New York Society of Security Analysts, 2006 to 2008. | |
| Tom D. Seip (1950) | | Trustee since 2000; Chairman of the Board since 2008; Lead Independent Trustee 2006 to 2008 | | General Partner, Ridgefield Farm LLC (a private investment vehicle); formerly, President and CEO, Westaff, Inc. (temporary staffing), May 2001 to January 2002; formerly, Senior Executive, The Charles Schwab Corporation, 1983 to 1998, including Chief Executive Officer, Charles Schwab Investment Management, Inc.; Trustee, Schwab Family of Funds and Schwab Investments, 1997 to 1998; and Executive Vice President-Retail Brokerage, Charles Schwab & Co., Inc., 1994 to 1997. | | | 50 | | | Director, H&R Block, Inc. (financial services company), since May 2001; Chairman, Governance and Nominating Committee, H&R Block, Inc., since 2011; formerly, Chairman, Compensation Committee, H&R Block, Inc., 2006 to 2010; formerly, Director, Forward Management, Inc. (asset management company), 1999 to 2006. | |
23
Name, (Year of Birth), and Address(1) | | Position(s) and Length of Time Served(2) | | Principal Occupation(s)(3) | | Number of Funds in Fund Complex Overseen by Fund Trustee | | Other Directorships Held Outside Fund Complex by Fund Trustee(3) | |
| Candace L. Straight (1947) | | Trustee since 1999 | | Private investor and consultant specializing in the insurance industry; formerly, Advisory Director, Securitas Capital LLC (a global private equity investment firm dedicated to making investments in the insurance sector), 1998 to December 2003. | | | 50 | | | Public Member, Board of Governors and Board of Trustees, Rutgers University, since 2011; Director, Montpelier Re Holdings Ltd. (reinsurance company), since 2006; formerly, Director, National Atlantic Holdings Corporation (property and casualty insurance company), 2004 to 2008; formerly, Director, The Proformance Insurance Company (property and casualty insurance company), 2004 to 2008; formerly, Director, Providence Washington Insurance Company (property and casualty insurance company), 1998 to 2006; formerly, Director, Summit Global Partners (insurance brokerage firm), 2000 to 2005. | |
| Peter P. Trapp (1944) | | Trustee since 1984 | | Retired; formerly, Regional Manager for Mid-Southern Region, Ford Motor Credit Company, September 1997 to 2007; formerly, President, Ford Life Insurance Company, April 1995 to August 1997. | | | 50 | | | | None. | | |
24
Name, (Year of Birth), and Address(1) | | Position(s) and Length of Time Served(2) | | Principal Occupation(s)(3) | | Number of Funds in Fund Complex Overseen by Fund Trustee | | Other Directorships Held Outside Fund Complex by Fund Trustee(3) | |
| Fund Trustees who are "Interested Persons" | |
| Joseph V. Amato* (1962) | | Trustee since 2009 | | President and Director, Neuberger Berman Group LLC, since 2009; President and Chief Executive Officer, Neuberger and Neuberger Berman Holdings LLC (including its predecessor, Neuberger Berman Inc.), since 2007; Chief Investment Officer, Neuberger, since 2009; Chief Investment Officer (Equities) and Managing Director, Management, since 2009; Managing Director, NBFI, since 2007; Board member of NBFI since 2006; formerly, Global Head of Asset Management of Lehman Brothers Holdings Inc.'s ("LBHI") Investment Management Division, 2006 to 2009; formerly, member of LBHI's Investment Management Division's Executive Management Committee, 2006 to 2009; formerly, Managing Director, Lehman Brothers Inc. ("LBI"), 2006 to 2008; formerly, Chief Recruiting and Development Officer, LBI, 2005 to 2006; formerly, Global Head of LBI's Equity Sales and a Member of its Equities Division Executive Committee, 2003 to 2005. | | | 50 | | | Member of Board of Advisors, McDonough School of Business, Georgetown University, since 2001; Member of New York City Board of Advisors, Teach for America, since 2005; Trustee, Montclair Kimberley Academy (private school), since 2007. | |
25
Name, (Year of Birth), and Address(1) | | Position(s) and Length of Time Served(2) | | Principal Occupation(s)(3) | | Number of Funds in Fund Complex Overseen by Fund Trustee | | Other Directorships Held Outside Fund Complex by Fund Trustee(3) | |
| Robert Conti* (1956) | | Chief Executive Officer, President and Trustee since 2008; prior thereto, Executive Vice President in 2008 and Vice President 2000 to 2008 | | Managing Director, Neuberger, since 2007; formerly, Senior Vice President, Neuberger, 2003 to 2006; formerly, Vice President, Neuberger, 1999 to 2003; President and Chief Executive Officer, Management, since 2008; formerly, Senior Vice President, Management, 2000 to 2008; Managing Director, NBFI, since 2009. | | | 50 | | | Director, Staten Island Mental Health Society, since 1994; formerly, Chairman of the Board, Staten Island Mental Health Society, 2008 to 2011. | |
(1) The business address of each listed person is 605 Third Avenue, New York, New York 10158.
(2) Pursuant to the Trust's Trust Instrument, each of these Fund Trustees shall hold office for life or until his or her successor is elected or the Trust terminates; except that (a) any Fund Trustee may resign by delivering a written resignation; (b) any Fund Trustee may be removed with or without cause at any time by a written instrument signed by at least two-thirds of the other Fund Trustees; (c) any Fund Trustee who requests to be retired, or who has become unable to serve, may be retired by a written instrument signed by a majority of the other Fund Trustees; and (d) any Fund Trustee may be removed at any shareholder meeting by a vote of at least two-thirds of the outstanding shares.
(3) Except as otherwise indicated, each individual has held the positions shown for at least the last five years.
* Indicates a Fund Trustee who is an "interested person" within the meaning of the 1940 Act. Mr. Amato and Mr. Conti are interested persons of the Trust by virtue of the fact that each is an officer of Management, Neuberger and/or their affiliates.
26
Information about the Officers of the Trust
Name, (Year of Birth), and Address(1) | | Position(s) and Length of Time Served(2) | | Principal Occupation(s)(3) | |
| Andrew B. Allard (1961) | | Chief Legal Officer since 2013 (only for purposes of sections 307 and 406 of the Sarbanes-Oxley Act of 2002) and Anti-Money Laundering Compliance Officer since 2002 | | Senior Vice President, Neuberger, since 2006 and Employee since 1999; Deputy General Counsel, Neuberger, since 2004; formerly, Vice President, Neuberger, 2000 to 2005; formerly, Employee, Management, 1994 to 1999; Chief Legal Officer since 2013 (only for purposes of sections 307 and 406 of the Sarbanes-Oxley Act of 2002) and Anti-Money Laundering Compliance Officer since 2002, nine registered investment companies for which Management acts as investment manager and administrator (six since 2002, one since 2003, one since 2005 and one since 2006). | |
| Claudia A. Brandon (1956) | | Executive Vice President since 2008 and Secretary since 1985 | | Senior Vice President, Neuberger, since 2007 and Employee since 1999; Senior Vice President, Management, since 2008 and Assistant Secretary since 2004; formerly, Vice President, Neuberger, 2002 to 2006; formerly, Vice President-Mutual Fund Board Relations, Management, 2000 to 2008; formerly, Vice President, Management, 1986 to 1999 and Employee 1984 to 1999; Executive Vice President, nine registered investment companies for which Management acts as investment manager and administrator (nine since 2008); Secretary, nine registered investment companies for which Management acts as investment manager and administrator (three since 1985, three since 2002, one since 2003, one since 2005 and one since 2006). | |
| Anthony DiBernardo (1979) | | Assistant Treasurer since 2011 | | Vice President, Neuberger, since 2009; Employee, Management, since 2003; Assistant Treasurer, nine registered investment companies for which Management acts as investment manager and administrator (nine since 2011). | |
| Sheila R. James (1965) | | Assistant Secretary since 2002 | | Vice President, Neuberger, since 2008 and Employee since 1999; formerly, Assistant Vice President, Neuberger, 2007; formerly, Employee, Management, 1991 to 1999; Assistant Secretary, nine registered investment companies for which Management acts as investment manager and administrator (six since 2002, one since 2003, one since 2005 and one since 2006). | |
| Brian Kerrane (1969) | | Vice President since 2008 | | Senior Vice President, Neuberger, since 2006; formerly, Vice President, Neuberger, 2002 to 2006; Vice President, Management, since 2008 and Employee since 1991; Vice President, nine registered investment companies for which Management acts as investment manager and administrator (nine since 2008). | |
27
Name, (Year of Birth), and Address(1) | | Position(s) and Length of Time Served(2) | | Principal Occupation(s)(3) | |
| Kevin Lyons (1955) | | Assistant Secretary since 2003 | | Assistant Vice President, Neuberger, since 2008 and Employee since 1999; formerly, Employee, Management, 1993 to 1999; Assistant Secretary, nine registered investment companies for which Management acts as investment manager and administrator (seven since 2003, one since 2005 and one since 2006). | |
| Owen F. McEntee, Jr. (1961) | | Vice President since 2008 | | Vice President, Neuberger, since 2006; Employee, Management, since 1992; Vice President, nine registered investment companies for which Management acts as investment manager and administrator (nine since 2008). | |
| John M. McGovern (1970) | | Treasurer and Principal Financial and Accounting Officer since 2005 | | Senior Vice President, Neuberger, since 2007; formerly, Vice President, Neuberger, 2004 to 2006; Employee, Management, since 1993; Treasurer and Principal Financial and Accounting Officer, nine registered investment companies for which Management acts as investment manager and administrator (eight since 2005 and one since 2006); formerly, Assistant Treasurer, eight registered investment companies for which Management acts as investment manager and administrator, 2002 to 2005. | |
| Frank Rosato (1971) | | Assistant Treasurer since 2005 | | Vice President, Neuberger, since 2006; Employee, Management, since 1995; Assistant Treasurer, nine registered investment companies for which Management acts as investment manager and administrator (eight since 2005 and one since 2006). | |
| Neil S. Siegel (1967) | | Vice President since 2008 | | Managing Director, Management, since 2008; Managing Director, Neuberger, since 2006; formerly, Senior Vice President, Neuberger, 2004 to 2006; Vice President, nine registered investment companies for which Management acts as investment manager and administrator (nine since 2008). | |
| Chamaine Williams (1971) | | Chief Compliance Officer since 2005 | | Senior Vice President, Neuberger, since 2007; Chief Compliance Officer, Management, since 2006; Chief Compliance Officer, nine registered investment companies for which Management acts as investment manager and administrator (eight since 2005 and one since 2006); formerly, Senior Vice President, LBI, 2007 to 2008; formerly, Vice President, LBI, 2003 to 2006; formerly, Chief Compliance Officer, Lehman Brothers Asset Management Inc., 2003 to 2007; formerly, Chief Compliance Officer, Lehman Brothers Alternative Investment Management LLC, 2003 to 2007. | |
(1) The business address of each listed person is 605 Third Avenue, New York, New York 10158.
(2) Pursuant to the By-Laws of the Trust, each officer elected by the Fund Trustees shall hold office until his or her successor shall have been elected and qualified or until his or her earlier death, inability to serve, or resignation. Officers serve at the pleasure of the Fund Trustees and may be removed at any time with or without cause.
(3) Except as otherwise indicated, each individual has held the positions shown for at least the last five years.
28
Proxy Voting Policies and Procedures
A description of the policies and procedures that the Trust uses to determine how to vote proxies relating to portfolio securities is available, without charge, by calling 1-800-877-9700 (toll-free) and on the website of the Securities and Exchange Commission, at www.sec.gov. Information regarding how the Trust voted proxies relating to portfolio securities during the most recent 12-month period ended June 30 is also available, without charge, by calling 1-800-877-9700 (toll-free), on the website of the Securities and Exchange Commission at www.sec.gov, and on Management's website at www.nb.com.
Quarterly Portfolio Schedule
The Trust files a complete schedule of portfolio holdings for the Fund with the Securities and Exchange Commission for the first and third quarters of each fiscal year on Form N-Q. The Trust's Forms N-Q are available on the Securities and Exchange Commission's website at www.sec.gov and may be reviewed and copied at the Securities and Exchange Commission's Public Reference Room in Washington, DC. Information on the operation of the Public Reference Room may be obtained by calling 1-800-SEC-0330. The information on Form N-Q is available upon request, without charge, by calling 1-800-877-9700 (toll free).
Notice to Shareholders
100.00% of the dividends earned during the fiscal year ended December 31, 2012 qualifies for the dividends received deduction for corporate shareholders.
Board Consideration of the Management and Sub-Advisory Agreements
At a meeting held on October 25, 2012, the Board of Trustees of Neuberger Berman Advisers Management Trust ("Board"), including the Trustees who are not "interested persons" of Neuberger Berman Management LLC ("Management") (including its affiliates) or Neuberger Berman Advisers Management Trust ("Independent Fund Trustees"), approved the continuance of the Management and Sub-Advisory Agreements ("Agreements") for Large Cap Value Portfolio ("Fund").
In evaluating the Agreements, the Board, including the Independent Fund Trustees, reviewed materials furnished by Management in response to questions submitted by counsel for the Independent Fund Trustees, and met with senior representatives of Management regarding their personnel, operations and financial conditions as they relate to the Fund. The Independent Fund Trustees were advised by counsel that is experienced in Investment Company Act of 1940 matters and that is independent of Management. The Independent Fund Trustees received a memorandum from independent counsel discussing the legal standards for their consideration of the proposed continuance of the Agreements. They met with such counsel separately from representatives of Management to discuss the annual contract review. The annual contract review extends over three regular meetings of the Board, including one meeting devoted primarily to reviewing and discussing Fund performance, to ensure that Management has time to respond to any questions the Independent Fund Trustees may have on their initial review of the report and that the Independent Fund Trustees have time to consider those responses.
The Board considered the following factors, among others, in connection with its approval of the continuance of the Agreements: (1) the nature, extent, and quality of the services provided by Management and Neuberger Berman LLC ("Neuberger"); (2) the performance of the Fund compared to a relevant market index and a peer group of investment companies; (3) the costs of the services provided and profits or losses realized by Management and its affiliates from their relationship with the Fund; (4) the extent to which economies of scale might be realized as the Fund grows; and (5) whether fee levels reflect any such potential economies of scale for the benefit of investors in the Fund. In their deliberations, the Board members did not identify any particular information that was all-important or controlling, and each Trustee may have attributed different weights to the various factors.
29
The Board evaluated the terms of the Agreements, the overall fairness of the Agreements to the Fund and whether the Agreements were in the best interests of the Fund and its shareholders.
With respect to the nature, extent and quality of the services provided, the Board considered the performance of the Fund and the experience and staffing of the portfolio management personnel of Management and Neuberger who perform services for the Fund. The Board noted that Management also provides certain administrative services, including fund accounting and compliance oversight. The Board also considered Management's and Neuberger's policies and practices regarding brokerage and allocation of portfolio transactions by Management. The Board's Portfolio Transactions and Pricing Committee from time to time reviewed the quality of the execution services that Management and Neuberger had provided, and periodically reviewed studies by an independent firm engaged to review and evaluate the quality of brokerage execution received by the Fund. The Board also reviewed whether Management and Neuberger used brokers to execute Fund transactions that provide research and other services to Management and Neuberger, and the types of benefits potentially derived from such services by Management, Neuberger, the Fund and other clients of Management and Neuberger. In addition, the Board noted the positive compliance history of Management and Neuberger, as each firm has been free of significant reported compliance problems. As in past years, the Board also considered the manner in which Management addressed various non-routine matters that arose during the year, some of them a result of developments in the broader fund industry or the regulations governing it.
The Board considered the performance of the Fund relative to its benchmark and the average performance of composite peer groups of investment companies dedicated to insurance products pursuing broadly similar strategies. The Board also reviewed performance during the period in relation to certain measures of the degree of investment risk undertaken by the portfolio manager. The Board discussed with Management the Fund's performance and steps that Management had under consideration to improve performance. The Board also considered Management's resources and responsiveness with respect to the Fund.
With respect to the overall fairness of the Agreements, the Board considered the fee structure for the Fund under the Agreements as compared to a peer group of comparable funds and any fall-out benefits likely to accrue to Management or Neuberger or their affiliates from their relationship with the Fund. The Board also considered the profitability of Management and its affiliates from their association with the Fund.
The Board reviewed a comparison of the Fund's management fee and overall expense ratio to a peer group of broadly comparable non-proprietary funds dedicated to insurance products. The Board considered the mean and median of the management fees and expense ratios of the peer group. The Board noted that the Fund's management fee was higher than the peer group mean and median. The Board considered whether specific portfolio management or administration needs contributed to the management fee. The Board also considered the contractual limit on Fund expenses undertaken by Management. With regard to the sub-advisory fee paid to Neuberger, the Board noted that this fee is "at cost."
The Board considered whether there were other funds that were advised or sub-advised by Management or its affiliates or separate accounts managed by Management or its affiliates with investment objectives, policies and strategies that were similar to the Fund. If so, the Board compared the fees charged to the Fund to the fees charged to any such other funds and/or separate accounts. The Board considered the appropriateness and reasonableness of any differences between the fees charged to the Fund and any such other funds and/or separate accounts and determined that the differences in fees were consistent with the management and other services provided.
The Board also evaluated any apparent or anticipated economies of scale in relation to the services Management provides to the Fund. The Board considered whether the Fund's fee structure provides for a reduction of payments resulting from the use of breakpoints and whether those breakpoints are set at appropriate asset levels. In concluding that the benefits accruing to Management and its affiliates by virtue of their relationship to the Fund were reasonable in comparison with the costs of providing the investment advisory and other services and the benefits accruing to the Fund, the Board reviewed specific data as to Management's profit on the Fund for a recent period. The Board also carefully examined Management's cost allocation methodology. The Board recognized that Management should be entitled to earn a reasonable level of profits for services it provides to the Fund and, based on its review, concluded that Management's level of profitability was not excessive.
30
Conclusions
In approving the Agreements, the Board concluded that the terms of each Agreement are fair and reasonable and that approval of the Agreements is in the best interests of the Fund and its shareholders. In reaching this determination, the Board considered that Management and Neuberger could be expected to provide a high level of service to the Fund; that it retained confidence in Management's and Neuberger's capabilities to manage the Fund; that the Fund's fee structure appeared to the Board to be reasonable given the nature and quality of services provided; and that the benefits accruing to Management and its affiliates by virtue of their relationship to the Fund were reasonable in comparison with the benefits accruing to the Fund.
31
Neuberger Berman
Advisers Management Trust
Mid Cap Growth Portfolio
I Class Shares
S Class Shares
Annual Report
December 31, 2012
B1013 02/13
Mid Cap Growth Portfolio Commentary (Unaudited)
The Neuberger Berman Advisers Management Trust (AMT) Mid Cap Growth Portfolio Class I generated a 12.41% total return for the fiscal year ended December 31, 2012, but underperformed its benchmark, the Russell Midcap® Growth Index, which returned 15.81% for the same period. Returns for the Portfolio's Class I and Class S shares are provided on page three.
The down-to-the-wire fiscal cliff negotiations and resulting deal were a fitting end to a year plagued by political acrimony and economic uncertainty. While the hard fought, but ultimately underwhelming, compromise does address several pertinent tax and entitlement issues, we believe this "not so grand bargain" falls far short of addressing the broader issues around our country's debt ceiling, budget imbalance and credit rating. From our perspective, the risk was never really about going over the cliff, but rather the failure to reach a comprehensive and forward-thinking solution in a reasonable period of time. Unfortunately, that risk still remains.
While confidence may have ebbed a bit during the year, consumer resiliency and sustainable gains in housing remained bright spots. With fiscal austerity looming, in our assessment the clear prescription for a healthier economy remains a rebound in corporate spending. However, ongoing concerns around the health of Europe's economies, China's growth engine and our government's fiscal game of chicken continue to foster a sub-optimal level of capital reinvestment that could risk competitiveness.
Setting aside the dysfunctional nature of Congress and the seemingly perpetual "walls of worry," it is important to remember that 2012 actually hosted a positive environment for equities. Highlighted by attractive valuations, solid earnings and efficient bottom-lines, the market rewarded the patience of domestic equity investors with attractive returns overall.
For the year as a whole, stock selection was the main driver of Portfolio underperformance versus the benchmark. With a "shoot first, ask questions later" mentality, we feel the market adopted an over reactionary stance to any fundamental softening.
The leading contributor to performance was SBA Communications, an owner and operator of wireless communications towers. SBA benefited from strong top-line growth and better than expected guidance. A few health care names were also top contributors, including Catalyst Health Solutions, a provider of pharmacy benefit management services, which stood out as it agreed to be acquired by another portfolio holding, SXC Health Solutions (which was later renamed Catamaran Corp. after the merger was completed), and Alexion Pharmaceuticals, a biotech company focused on rare, life-threatening disease states that was rewarded for its successful international rollout and positive early stage testing for new drug indications.
Within Information Technology, strong contributions came from Trimble Navigation, a provider of advanced positioning and resource management solutions that delivered efficiency gains and encouraging guidance during the fourth quarter, as well as Rackspace Hosting, a provider of cloud hosting services that successfully launched a new product that the market expects will provide momentum going into 2013.
Information Technology was also the source of three leading detractors from performance. Finisar Corporation, a provider of data network optical subsystems and components, lagged as an anticipated rebound in telecommunication spending failed to materialize. QLIK Technologies and Informatica Corporation, both business intelligence/information data companies, were negatively impacted by poor execution and concerns over Europe's economic crisis.
Our Energy holdings struggled as downward pressure on prices and demand hurt both SM Energy, focused on-shore exploration and production, and CARBO Ceramics, a producer of hydraulic fracturing ceramic proppant.
Within Consumer Discretionary, PVH Corp., an apparel company with various owned and licensed brands, delivered solid international results and a well-received acquisition of another portfolio holding, Warnaco Group. Unfortunately, this positive couldn't offset underperformance from other Consumer Discretionary names such as Vera Bradley, a designer and retailer of handbags and accessories that was plagued by poor execution, and Chipotle Mexican Grill, an
1
operator of over 1,200 restaurants, which tempered future guidance and proposed an unexpected change in organizational structure. Additionally, Gentex Corporation, a supplier of camera-based features and specialty rear-view mirrors, was the Portfolio's leading detractor from performance as it was negatively impacted by delays in the implementation of a mandate requiring cars to have back-up cameras.
With the exception of Informatica, we sold all the aforementioned detractors during the year.
Based on our expectations for 2013, our current view is that we are likely to remain overweighted in Industrials, Information Technology and Telecommunication Services and underweighted in Consumer Discretionary, Consumer Staples and Materials.
As we look ahead into the New Year, we just can't quite shake that feeling of déjà vu. We are once again faced with dire deadlines complicated by substantial ideological differences, an acrimonious political environment and an appalling disregard for effective political compromise. While the confidence and market gains from the fiscal cliff deal may prove fleeting, we feel it is important to remember a lesson of 2012—don't underestimate the resiliency of both our economy and the financial markets. We believe valuations are reasonable at this time and that higher-quality companies offering competitive attributes, along with compelling top-line growth that efficiently translates through to the bottom line, may well be rewarded by a market seeking positive differentiation. To that end, and in spite of the uncertainty that lies ahead, we remain cautiously optimistic that 2013 can be another positive year for mid-cap equities.
Sincerely,
KENNETH J. TUREK
PORTFOLIO MANAGER
Information about the principal risks of investing in the Portfolio is set forth in the prospectus and statement of additional information.
The portfolio composition, industries and holdings of the Portfolio are subject to change.
Opinions expressed are as of the date herein and are subject to change without notice. This material is not intended to be a formal research report and should not be construed as an offer to sell or the solicitation of an offer to buy any security.
2
Mid Cap Growth Portfolio (Unaudited)
SECTOR ALLOCATION
| (as a % of Total Investments) | |
| Consumer Discretionary | | | 16.9 | % | |
| Consumer Staples | | | 4.0 | | |
| Energy | | | 6.2 | | |
| Financials | | | 5.7 | | |
| Health Care | | | 14.2 | | |
| Industrials | | | 23.2 | | |
| Information Technology | | | 21.1 | | |
| Materials | | | 3.6 | | |
| Telecommunication Services | | | 4.3 | | |
| Short-Term Investments | | | 0.8 | | |
| Total | | | 100.0 | % | |
PERFORMANCE HIGHLIGHTS
| | | Inception | | Average Annual Total Return Ended 12/31/2012 | |
| | | Date | | 1 Year | | 5 Years | | 10 Years | | Life of Fund | |
Mid Cap Growth Portfolio Class I | | | 11/03/1997 | | | | 12.41 | % | | | 1.68 | % | | | 9.97 | % | | | 7.97 | % | |
Mid Cap Growth Portfolio Class S2 | | | 02/18/2003 | | | | 12.14 | % | | | 1.44 | % | | | 9.70 | % | | | 7.80 | % | |
Russell Midcap® Growth Index1,3 | | | | | | | 15.81 | % | | | 3.23 | % | | | 10.32 | % | | | 6.21 | % | |
Russell Midcap® Index1,3 | | | | | | | 17.28 | % | | | 3.57 | % | | | 10.65 | % | | | 8.02 | % | |
The performance data quoted represent past performance and do not indicate future results. Current performance may be lower or higher than the performance data quoted. For more current performance data, please visit www.nb.com.
The results shown in the table reflect the reinvestment of income dividends and other distributions, if any. The results do not reflect the effect of taxes a shareholder would pay on Portfolio distributions or on the redemption of Portfolio shares. The results do not reflect fees and expenses of the variable annuity and variable life insurance policies or the qualified pension and retirement plans whose proceeds are invested in the Portfolio.
The investment return and principal value of an investment will fluctuate and shares, when redeemed, may be worth more or less than their original cost.
Returns would have been lower if Neuberger Berman Management LLC ("Management") had not reimbursed certain expenses and/or waived a portion of the investment management fees during certain of the periods shown. Repayment by a class (of expenses previously reimbursed and/or fees previously waived by Management) will decrease the class's returns. Please see Note B in the Notes to Financial Statements for specific information regarding expense reimbursement and/or fee waiver arrangements.
COMPARISON OF A $10,000 INVESTMENT
This graph shows the change in value of a hypothetical $10,000 investment in the Portfolio over the past 10 fiscal years, or since the Portfolio's inception if it has not operated for 10 years. The graph is based on Class I shares only; the performance of the Portfolio's share classes will differ primarily due to different class expenses (see Performance Highlights chart above).The result is compared with benchmarks, which include a broad-based market index and may include a more narrowly based index. Market indices have not been reduced to reflect any of the fees and costs of investing. The results shown in the graph reflect the reinvestment of income dividends and other distributions, if any. The results do not reflect the effect of taxes a shareholder would pay on Portfolio distributions or on the redemption of Portfolio shares. Results represent past performance and do not indicate future results.
Please see Endnotes for additional information.
3
Endnotes (Unaudited)
1 The date used to calculate Life of Fund performance for the index is the inception date of the oldest share class.
2 Performance shown prior to February 18, 2003 for Class S shares is that of Class I shares, which have lower expenses and correspondingly higher returns than Class S shares.
3 The Russell Midcap® Growth Index measures the performance of those Russell Midcap® Index companies with higher price-to-book ratios and higher forecasted growth values. The Russell Midcap Index measures the performance of the 800 smallest companies in the Russell 1000® Index, which represents approximately 31% of the total market capitalization of the Russell 1000 Index (which, in turn, consists of the 1,000 largest U.S. companies, based on market capitalization). Please note that indices do not take into account any fees, expenses or tax consequences of investing in the individual securities that they track, and that individuals cannot invest directly in any index. Data about the performance of an index is prepared or obtained by Neuberger Berman Management LLC ("Management") and reflects the reinvestment of income dividends and other distributions, if any. The Portfolio may invest in securities not included in a described index and/or may not invest in all securities included in a described index.
Any ratios or other measurements using a factor of forecasted earnings of a company discussed herein are based on consensus estimates, not Management's own projections, and they may or may not be realized. In addition, any revision to a forecast could affect the market price of a security. By quoting them herein, Management does not offer an opinion as to the accuracy of, and does not guarantee, these forecasted numbers.
The investments for the Portfolio are managed by the same portfolio manager(s) who manage(s) one or more other registered funds that have names, investment objectives and investment styles that are similar to those of the Portfolio. You should be aware that the Portfolio is likely to differ from the other mutual fund(s) in size, cash flow pattern and tax matters. Accordingly, the holdings and performance of the Portfolio can be expected to vary from those of the other mutual fund(s).
Shares of the separate AMT Portfolios are not available to the general public. Shares of this Portfolio may be purchased only by life insurance companies to be used with their separate accounts that fund variable annuity and variable life insurance policies and by qualified pension and retirement plans.
Statistics and projections in this report are derived from sources deemed to be reliable but cannot be regarded as a representation of future results of the AMT Portfolios. This report is prepared for the general information of shareholders and is not an offer of shares of the AMT Portfolios. Shares of the AMT Portfolios are sold only through the currently effective prospectuses, which must precede or accompany this report.
The "Neuberger Berman" name and logo are registered service marks of Neuberger Berman Group LLC. "Neuberger Berman Management LLC" and the individual Fund name in this piece are either service marks or registered service marks of Neuberger Berman Management LLC.
© 2013 Neuberger Berman Management LLC distributor. All rights reserved.
4
Information About Your Fund's Expenses (Unaudited)
As a Fund shareholder, you incur two types of costs: (1) transaction costs such as fees and expenses that are, or may be, imposed under your variable contract or qualified pension plan; and (2) ongoing costs, including management fees; distribution and/or service (12b-1) fees (if applicable); and other Fund expenses. This example is intended to help you understand your ongoing costs (in dollars) of investing in the Fund and compare these costs with the ongoing costs of investing in other mutual funds.
This table is designed to provide information regarding costs related to your investments. The following examples are based on an investment of $1,000 made at the beginning of the six month period ended December 31, 2012 and held for the entire period. The table illustrates the Fund's costs in two ways:
| Actual Expenses and Performance: | | The first section of the table provides information about actual account values and actual expenses in dollars, based on the Fund's actual performance during the period. You may use the information in this line, together with the amount you invested, to estimate the expenses you paid over the period. Simply divide your account value by $1,000 (for example, an $8,600 account value divided by $1,000 = 8.6), then multiply the result by the number in the first section of the table under the heading entitled "Expenses Paid During the Period" to estimate the expenses you paid over the period. | |
Hypothetical Example for Comparison Purposes: | | The second section of the table provides information about hypothetical account values and hypothetical expenses based on the Fund's actual expense ratio and an assumed rate of return at 5% per year before expenses. This return is not the Fund's actual return. The hypothetical account values and expenses may not be used to estimate the actual ending account balance or expenses you paid for the period. You may use this information to compare the ongoing costs of investing in this Fund versus other funds. To do so, compare the expenses shown in this 5% hypothetical example with the 5% hypothetical examples that appear in the shareholder reports of other funds. | |
Please note that the expenses in the table are meant to highlight your ongoing costs only and do not include any transaction costs, such as fees and expenses that are, or may be imposed under your variable contract or qualified pension plan. Therefore, the information under the heading "Hypothetical (5% annual return before expenses)" is useful in comparing ongoing costs only, and will not help you determine the relative total costs of owning different funds. In addition, if these transaction costs were included, your costs would have been higher.
Expense Information as of 12/31/12
NEUBERGER BERMAN ADVISERS MANAGEMENT TRUST MID CAP GROWTH PORTFOLIO
| Actual | | Beginning Account Value 7/1/12 | | Ending Account Value 12/31/12 | | Expenses Paid During the Period* 7/1/12 – 12/31/12 | | Expense Ratio | |
| Class I | | $ | 1,000.00 | | | $ | 1,031.30 | | | $ | 5.11 | | | | 1.00 | % | |
| Class S | | $ | 1,000.00 | | | $ | 1,030.00 | | | $ | 6.38 | | | | 1.25 | % | |
| Hypothetical (5% annual return before expenses)** | |
| Class I | | $ | 1,000.00 | | | $ | 1,020.11 | | | $ | 5.08 | | | | 1.00 | % | |
| Class S | | $ | 1,000.00 | | | $ | 1,018.85 | | | $ | 6.34 | | | | 1.25 | % | |
* For each class, expenses are equal to the annualized expense ratio for the class, multiplied by the average account value over the period, multiplied by 184/366 (to reflect the one-half year period shown).
** Hypothetical 5% annual return before expenses is calculated by multiplying the number of days in the most recent half year divided by 366.
5
Schedule of Investments Mid Cap Growth Portfolio
| NUMBER OF SHARES | | | | VALUE† | |
| Common Stocks (98.8%) | | | |
| Aerospace & Defense (3.5%) | | | |
| | 75,000 | | | BE Aerospace, Inc. | | $ | 3,705,000 | * | |
| | 81,250 | | | HEICO Corp. | | | 3,636,750 | | |
| | 20,000 | | | Precision Castparts Corp. | | | 3,788,400 | | |
| | | | 11,130,150 | | |
| Beverages (0.8%) | | | |
| | 40,000 | | | Beam, Inc. | | | 2,443,600 | | |
| Biotechnology (4.6%) | | | |
| | 57,500 | | | Alexion Pharmaceuticals, Inc. | | | 5,394,075 | * | |
| | 52,500 | | | ARIAD Pharmaceuticals, Inc. | | | 1,006,950 | * | |
| | 20,000 | | | BioMarin Pharmaceutical, Inc. | | | 985,000 | * | |
| | 60,000 | | | Cepheid, Inc. | | | 2,028,600 | * | |
| | 55,000 | | | Cubist Pharmaceuticals, Inc. | | | 2,313,300 | * | |
| | 31,000 | | | Medivation, Inc. | | | 1,585,960 | * | |
| | 17,500 | | | Onyx Pharmaceuticals, Inc. | | | 1,321,775 | * | |
| | | | 14,635,660 | | |
| Building Products (0.9%) | | | |
| | 100,000 | | | Fortune Brands Home & Security, Inc. | | | 2,922,000 | * | |
| Capital Markets (2.4%) | | | |
| | 37,900 | | | Affiliated Managers Group, Inc. | | | 4,932,685 | * | |
| | 70,000 | | | Raymond James Financial, Inc. | | | 2,697,100 | | |
| | | | 7,629,785 | | |
| Chemicals (2.8%) | | | |
| | 60,000 | | | Airgas, Inc. | | | 5,477,400 | | |
| | 43,000 | | | Ashland, Inc. | | | 3,457,630 | | |
| | | | 8,935,030 | | |
| Commercial Services & Supplies (2.5%) | | | |
| | 32,500 | | | Clean Harbors, Inc. | | | 1,787,825 | * | |
| | 65,000 | | | Stericycle, Inc. | | | 6,062,550 | * | |
| | | | 7,850,375 | | |
| Communications Equipment (1.2%) | | | |
| | 55,000 | | | Aruba Networks, Inc. | | | 1,141,250 | * | |
| | 26,500 | | | F5 Networks, Inc. | | | 2,574,475 | * | |
| | | | 3,715,725 | | |
| Containers & Packaging (0.5%) | | | |
| | 40,000 | | | Packaging Corp. of America | | | 1,538,800 | | |
| Distributors (0.3%) | | | |
| | 50,000 | | | LKQ Corp. | | | 1,055,000 | * | |
| NUMBER OF SHARES | | | | VALUE† | |
| Diversified Financial Services (1.1%) | | | |
| | 29,400 | | | IntercontinentalExchange, Inc. | | $ | 3,640,014 | * | |
Diversified Telecommunication Services (0.6%) | | | |
| | 75,000 | | | tw telecom, Inc. | | | 1,910,250 | * | |
| Electrical Equipment (4.8%) | | | |
| | 151,350 | | | AMETEK, Inc. | | | 5,686,219 | | |
| | 50,000 | | | Generac Holdings, Inc. | | | 1,715,500 | | |
| | 51,500 | | | Roper Industries, Inc. | | | 5,741,220 | | |
| | 60,000 | | | Sensata Technologies Holding NV | | | 1,948,800 | * | |
| | | | 15,091,739 | | |
Electronic Equipment, Instruments & Components (2.1%) | | | |
| | 110,500 | | | Trimble Navigation Ltd. | | | 6,605,690 | * | |
| Energy Equipment & Services (3.2%) | | | |
| | 45,000 | | | Cameron International Corp. | | | 2,540,700 | * | |
| | 15,000 | | | Core Laboratories NV | | | 1,639,650 | | |
| | 37,500 | | | Oceaneering International, Inc. | | | 2,017,125 | | |
| | 55,000 | | | Oil States International, Inc. | | | 3,934,700 | * | |
| | | | 10,132,175 | | |
| Food & Staples Retailing (2.0%) | | | |
| | 40,000 | | | PriceSmart, Inc. | | | 3,082,000 | | |
| | 36,800 | | | Whole Foods Market, Inc. | | | 3,360,944 | | |
| | | | 6,442,944 | | |
| Health Care Equipment & Supplies (2.7%) | | | |
| | 24,500 | | | Cooper Cos., Inc. | | | 2,265,760 | | |
| | 18,000 | | | Edwards Lifesciences Corp. | | | 1,623,060 | * | |
| | 6,000 | | | Intuitive Surgical, Inc. | | | 2,942,220 | * | |
| | 67,500 | | | Volcano Corp. | | | 1,593,675 | * | |
| | | | 8,424,715 | | |
| Health Care Providers & Services (2.8%) | | | |
| | 116,000 | | | Catamaran Corp. | | | 5,464,760 | * | |
| | 30,000 | | | DaVita HealthCare Partners, Inc. | | | 3,315,900 | * | |
| | | | 8,780,660 | | |
| Health Care Technology (1.8%) | | | |
| | 75,000 | | | Cerner Corp. | | | 5,823,000 | * | |
| Hotels, Restaurants & Leisure (1.4%) | | | |
| | 28,000 | | | Buffalo Wild Wings, Inc. | | | 2,038,960 | * | |
| | 40,000 | | | Starwood Hotels & Resorts Worldwide, Inc. | | | 2,294,400 | | |
| | | | 4,333,360 | | |
See Notes to Schedule of Investments
6
| NUMBER OF SHARES | | | | VALUE† | |
| Household Products (1.2%) | | | |
| | 70,000 | | | Church & Dwight Co., Inc. | | $ | 3,749,900 | | |
| Internet & Catalog Retail (0.7%) | | | |
| | 35,000 | | | Expedia, Inc. | | | 2,150,750 | | |
| Internet Software & Services (2.9%) | | | |
| | 77,000 | | | Liquidity Services, Inc. | | | 3,146,220 | * | |
| | 80,000 | | | Rackspace Hosting, Inc. | | | 5,941,600 | * | |
| | | | 9,087,820 | | |
| IT Services (3.0%) | | | |
| | 27,500 | | | Alliance Data Systems Corp. | | | 3,980,900 | * | |
| | 52,500 | | | Cognizant Technology Solutions Corp. Class A | | | 3,887,625 | * | |
| | 27,500 | | | Teradata Corp. | | | 1,701,975 | * | |
| | | | 9,570,500 | | |
| Life Sciences Tools & Services (1.3%) | | | |
| | 72,500 | | | Illumina, Inc. | | | 4,030,275 | * | |
| Machinery (2.8%) | | | |
| | 16,000 | | | Cummins, Inc. | | | 1,733,600 | | |
| | 105,000 | | | Donaldson Co., Inc. | | | 3,448,200 | | |
| | 60,000 | | | Pall Corp. | | | 3,615,600 | | |
| | | | 8,797,400 | | |
| Media (2.0%) | | | |
| | 77,500 | | | AMC Networks, Inc. Class A | | | 3,836,250 | * | |
| | 40,000 | | | Discovery Communications, Inc. Class A | | | 2,539,200 | * | |
| | | | 6,375,450 | | |
| Metals & Mining (0.3%) | | | |
| | 16,500 | | | Carpenter Technology Corp. | | | 851,895 | | |
| Multiline Retail (1.0%) | | | |
| | 80,000 | | | Dollar Tree, Inc. | | | 3,244,800 | * | |
| Oil, Gas & Consumable Fuels (2.9%) | | | |
| | 82,500 | | | Cabot Oil & Gas Corp. | | | 4,103,550 | | |
| | 20,500 | | | Concho Resources, Inc. | | | 1,651,480 | * | |
| | 150,000 | | | Denbury Resources, Inc. | | | 2,430,000 | * | |
| | 35,000 | | | Oasis Petroleum, Inc. | | | 1,113,000 | * | |
| | | | 9,298,030 | | |
| Pharmaceuticals (1.0%) | | | |
| | 31,500 | | | Perrigo Co. | | | 3,276,945 | | |
| NUMBER OF SHARES | | | | VALUE† | |
| Professional Services (2.5%) | | | |
| | 50,000 | | | Advisory Board Co. | | $ | 2,339,500 | * | |
| | 14,500 | | | Towers Watson & Co. Class A | | | 815,045 | | |
| | 96,100 | | | Verisk Analytics, Inc. Class A | | | 4,901,100 | * | |
| | | | 8,055,645 | | |
Real Estate Management & Development (1.3%) | | | |
| | 47,500 | | | Jones Lang LaSalle, Inc. | | | 3,987,150 | | |
| Road & Rail (3.2%) | | | |
| | 26,500 | | | Canadian Pacific Railway Ltd. | | | 2,692,930 | | |
| | 75,000 | | | J.B. Hunt Transport Services, Inc. | | | 4,478,250 | | |
| | 34,500 | | | Kansas City Southern | | | 2,880,060 | | |
| | | | 10,051,240 | | |
Semiconductors & Semiconductor Equipment (3.1%) | | | |
| | 80,000 | | | Altera Corp. | | | 2,755,200 | | |
| | 130,000 | | | Avago Technologies Ltd. | | | 4,115,800 | | |
| | 100,000 | | | Cavium, Inc. | | | 3,121,000 | * | |
| | | | 9,992,000 | | |
| Software (8.7%) | | | |
| | 65,000 | | | ANSYS, Inc. | | | 4,377,100 | * | |
| | 70,000 | | | Aspen Technology, Inc. | | | 1,934,800 | * | |
| | 52,800 | | | Citrix Systems, Inc. | | | 3,471,600 | * | |
| | 24,500 | | | Concur Technologies, Inc. | | | 1,654,240 | * | |
| | 65,000 | | | Informatica Corp. | | | 1,970,800 | * | |
| | 65,000 | | | MICROS Systems, Inc. | | | 2,758,600 | * | |
| | 60,000 | | | Red Hat, Inc. | | | 3,177,600 | * | |
| | 20,000 | | | Salesforce.com, Inc. | | | 3,362,000 | * | |
| | 50,000 | | | Splunk, Inc. | | | 1,451,000 | * | |
| | 76,800 | | | TIBCO Software, Inc. | | | 1,690,368 | * | |
| | 19,000 | | | Ultimate Software Group, Inc. | | | 1,793,790 | * | |
| | | | 27,641,898 | | |
| Specialty Retail (8.7%) | | | |
| | 50,000 | | | Cabela's, Inc. | | | 2,087,500 | * | |
| | 86,700 | | | Dick's Sporting Goods, Inc. | | | 3,943,983 | | |
| | 42,500 | | | DSW, Inc. Class A | | | 2,791,825 | | |
| | 39,000 | | | O'Reilly Automotive, Inc. | | | 3,487,380 | * | |
| | 32,500 | | | PetSmart, Inc. | | | 2,221,050 | | |
| | 55,000 | | | Ross Stores, Inc. | | | 2,978,250 | | |
| | 40,000 | | | Tractor Supply Co. | | | 3,534,400 | | |
| | 95,000 | | | Urban Outfitters, Inc. | | | 3,739,200 | * | |
| | 65,000 | | | Williams-Sonoma, Inc. | | | 2,845,050 | | |
| | | | 27,628,638 | | |
| Textiles, Apparel & Luxury Goods (2.7%) | | | |
| | 25,000 | | | Lululemon Athetica, Inc. | | | 1,905,750 | * | |
| | 42,500 | | | PVH Corp. | | | 4,717,925 | | |
| | 42,500 | | | Under Armour, Inc. Class A | | | 2,062,525 | * | |
| | | | 8,686,200 | | |
See Notes to Schedule of Investments
7
| NUMBER OF SHARES | | | | VALUE† | |
| Thrifts & Mortgage Finance (0.9%) | | | |
| | 80,000 | | | Ocwen Financial Corp. | | $ | 2,767,200 | * | |
| Trading Companies & Distributors (2.9%) | | | |
| | 95,000 | | | Fastenal Co. | | | 4,435,550 | | |
| | 39,200 | | | MSC Industrial Direct Co., Inc. Class A | | | 2,954,896 | | |
| | 40,500 | | | United Rentals, Inc. | | | 1,843,560 | * | |
| | | | 9,234,006 | | |
| Wireless Telecommunication Services (3.7%) | | | |
| | 65,000 | | | Crown Castle International Corp. | | | 4,690,400 | * | |
| | 100,000 | | | SBA Communications Corp. Class A | | | 7,102,000 | * | |
| | | | 11,792,400 | | |
| | | | | Total Common Stocks (Cost $216,910,360) | | | 313,310,814 | | |
| Short-Term Investments (0.8%) | | | |
| | 2,420,634 | | | State Street Institutional Liquid Reserves Fund Institutional Class (Cost $2,420,634) | | | 2,420,634 | | |
| | | | | Total Investments (99.6%) (Cost $219,330,994) | | | 315,731,448 | ## | |
| | | | | Cash, receivables and other assets, less liabilities (0.4%) | | | 1,425,046 | | |
| | | | | Total Net Assets (100.0%) | | $ | 317,156,494 | | |
See Notes to Schedule of Investments
8
Notes to Schedule of Investments Mid Cap Growth Portfolio
† In accordance with Accounting Standards Codification ("ASC") 820 "Fair Value Measurements and Disclosures" ("ASC 820"), all investments held by Neuberger Berman Advisers Management Trust Mid Cap Growth Portfolio (the "Fund") are carried at the value that Neuberger Berman Management LLC ("Management") believes the Fund would receive upon selling an investment in an orderly transaction to an independent buyer in the principal or most advantageous market for the investment under current market conditions. Various inputs, including the volume and level of activity for the asset or liability in the market, are considered in valuing the Fund's investments, some of which are discussed below. Significant management judgment may be necessary to value investments in accordance with ASC 820.
ASC 820 established a three-tier hierarchy of inputs to create a classification of value measurements for disclosure purposes. The three-tier hierarchy of inputs is summarized in the three broad Levels listed below.
• Level 1 – quoted prices in active markets for identical investments
• Level 2 – other significant observable inputs (including quoted prices for similar investments, interest rates, prepayment speeds, credit risk, amortized cost, etc.)
• Level 3 – significant unobservable inputs (including the Fund's own assumptions in determining the fair value of investments)
The inputs or methodology used for valuing an investment are not necessarily an indication of the risk associated with investing in those securities.
The value of the Fund's investments in equity securities and exchange traded funds, for which market quotations are readily available, is generally determined by Management by obtaining valuations from an independent pricing service based on the latest sale price quoted on a principal exchange or market for that security (Level 1 inputs). Securities traded primarily on the NASDAQ Stock Market are normally valued by the Fund at the NASDAQ Official Closing Price ("NOCP") provided by NASDAQ each business day. The NOCP is the most recently reported price as of 4:00:02 p.m., Eastern time, unless that price is outside the range of the "inside" bid and asked prices (i.e., the bid and asked prices that dealers quote to each other when trading for their own accounts); in that case, NASDAQ will adjust the price to equal the inside bid or asked price, whichever is closer. Because of delays in reporting trades, the NOCP may not be based on the price of the last trade to occur before the market closes. If there is no reported sale of a security on a particular day, the independent pricing service may value the security based on reported market quotations.
Management has developed a process to periodically review information provided by independent pricing services for all types of securities.
Investments in State Street Institutional Liquid Reserves Fund Institutional Class are valued using the fund's daily calculated net asset value per share (Level 2 inputs).
If a valuation is not available from an independent pricing service, or if Management has reason to believe that the valuation received does not represent the amount the Fund might reasonably expect to receive on a current sale in an orderly transaction, the Fund seeks to obtain quotations from principal market makers (generally considered Level 3 inputs). If such quotations are not readily available, the security is valued using methods the Neuberger Berman Advisers Management Trust's Board of Trustees (the "Board") has approved on the belief that they reflect fair value. Numerous factors may be considered when determining the fair value of a security based on Level 2 or 3 inputs, including available analyst, media or other reports, trading in futures or ADRs and whether the issuer of the security being fair valued has other securities outstanding.
The value of the Fund's investments in foreign securities is generally determined using the same valuation methods and inputs as other Fund investments, as discussed above. Foreign security prices expressed in local currency
See Notes to Financial Statements
9
Notes to Schedule of Investments Mid Cap Growth Portfolio (cont'd)
values are translated from the local currency into U.S. dollars using the exchange rates as of 4:00 p.m., Eastern time. The Board has approved the use of Interactive Data Pricing and Reference Data, Inc. ("Interactive") to assist in determining the fair value of foreign equity securities when changes in the value of a certain index suggest that the closing prices on the foreign exchanges may no longer represent the amount that the Fund could expect to receive for those securities or on days when foreign markets are closed and U.S. markets are open. In each of these events, Interactive will provide adjusted prices for certain foreign equity securities using a statistical analysis of historical correlations of multiple factors (Level 2 inputs). In the absence of precise information about the market values of these foreign securities as of the close of the New York Stock Exchange, the Board has determined on the basis of available data that prices adjusted in this way are likely to be closer to the prices the Fund could realize on a current sale than are the prices of those securities established at the close of the foreign markets in which the securities primarily trade.
Fair value prices are necessarily estimates, and there is no assurance that such a price will be at or close to the price at which the security is next quoted or next trades.
The following is a summary, categorized by Level, of inputs used to value the Fund's investments as of December 31, 2012:
| Asset Valuation Inputs | | Level 1 | | Level 2 | | Level 3 | | Total | |
| Investments: | |
| Common Stocks^ | | $ | 313,310,814 | | | $ | — | | | $ | — | | | $ | 313,310,814 | | |
| Short-Term Investments | | | — | | | | 2,420,634 | | | | — | | | | 2,420,634 | | |
| Total Investments | | $ | 313,310,814 | | | $ | 2,420,634 | | | $ | — | | | $ | 315,731,448 | | |
^ The Schedule of Investments provides information on the industry categorization for the portfolio.
The Fund had no transfers between Levels 1 and 2 during the year ended December 31, 2012.
## At December 31, 2012, the cost of investments for U.S. federal income tax purposes was $219,697,835. Gross unrealized appreciation of investments was $99,863,775 and gross unrealized depreciation of investments was $3,830,162, resulting in net unrealized appreciation of $96,033,613, based on cost for U.S. federal income tax purposes.
* Security did not produce income during the last twelve months.
See Notes to Financial Statements
10
Statement of Assets and Liabilities
Neuberger Berman Advisers Management Trust
| | | MID CAP GROWTH PORTFOLIO | |
| | | December 31, 2012 | |
| Assets | |
| Investments in securities, at value* (Note A)—see Schedule of Investments: | |
| Unaffiliated issuers | | $ | 315,731,448 | | |
| Dividends and interest receivable | | | 18,174 | | |
| Receivable for securities sold | | | 960,484 | | |
| Receivable for Fund shares sold | | | 2,683,043 | | |
| Prepaid expenses and other assets | | | 4,143 | | |
| Total Assets | | | 319,397,292 | | |
| Liabilities | |
| Payable for securities purchased | | | 1,070,617 | | |
| Payable for Fund shares redeemed | | | 820,617 | | |
| Payable to investment manager (Note B) | | | 145,264 | | |
| Payable to administrator—net (Note B) | | | 101,107 | | |
| Accrued expenses and other payables | | | 103,193 | | |
| Total Liabilities | | | 2,240,798 | | |
| Net Assets | | $ | 317,156,494 | | |
| Net Assets consist of: | |
| Paid-in capital | | $ | 232,526,570 | | |
| Accumulated net realized gains (losses) on investments | | | (11,770,501 | ) | |
| Net unrealized appreciation (depreciation) in value of investments | | | 96,400,425 | | |
| Net Assets | | $ | 317,156,494 | | |
| Net Assets | |
| Class I | | $ | 228,954,552 | | |
| Class S | | | 88,201,942 | | |
| Shares Outstanding ($.001 par value; unlimited shares authorized) | |
| Class I | | | 7,392,704 | | |
| Class S | | | 2,920,062 | | |
| Net Asset Value, offering and redemption price per share | |
| Class I | | $ | 30.97 | | |
| Class S | | | 30.21 | | |
| * Cost of Investments | | $ | 219,330,994 | | |
See Notes to Financial Statements
11
Statement of Operations
Neuberger Berman Advisers Management Trust
| | | MID CAP GROWTH PORTFOLIO | |
| | | For the Year Ended December 31, 2012 | |
| Investment Income: | |
| Income (Note A): | |
| Dividend income—unaffiliated issuers | | $ | 2,129,342 | | |
| Interest income—unaffiliated issuers | | | 11,886 | | |
| Foreign taxes withheld | | | (8,505 | ) | |
| Total income | | $ | 2,132,723 | | |
| Expenses: | |
| Investment management fees (Note B) | | | 1,766,658 | | |
| Administration fees (Note B): | |
| Class I | | | 724,505 | | |
| Class S | | | 249,300 | | |
| Distribution fees (Note B): | |
| Class S | | | 207,750 | | |
| Audit fees | | | 43,535 | | |
| Custodian fees | | | 105,417 | | |
| Insurance expense | | | 19,002 | | |
| Legal fees | | | 166,013 | | |
| Reimbursement of expenses previously assumed by Management (Note B) | | | 8,207 | | |
| Shareholder reports | | | 70,307 | | |
| Trustees' fees and expenses | | | 51,069 | | |
| Miscellaneous | | | 14,698 | | |
| Total expenses | | | 3,426,461 | | |
| Expenses reduced by custodian fee expense offset arrangement (Note A) | | | (49 | ) | |
| Total net expenses | | | 3,426,412 | | |
| Net investment income (loss) | | $ | (1,293,689 | ) | |
| Realized and Unrealized Gain (Loss) on Investments (Note A): | |
| Net realized gain (loss) on: | |
| Sales of investment securities of unaffiliated issuers | | | 30,504,948 | | |
| Foreign currency | | | (64 | ) | |
| Change in net unrealized appreciation (depreciation) in value of: | |
| Unaffiliated investment securities | | | 7,520,456 | | |
| Foreign currency | | | (29 | ) | |
| Net gain (loss) on investments | | | 38,025,311 | | |
| Net increase (decrease) in net assets resulting from operations | | $ | 36,731,622 | | |
See Notes to Financial Statements
12
Statements of Changes in Net Assets
Neuberger Berman Advisers Management Trust
| | | MID CAP GROWTH PORTFOLIO | |
| | | Year Ended December 31, 2012 | | Year Ended December 31, 2011 | |
| Increase (Decrease) in Net Assets: | |
| From Operations (Note A): | |
| Net investment income (loss) | | $ | (1,293,689 | ) | | $ | (1,857,518 | ) | |
| Net realized gain (loss) on investments | | | 30,504,884 | | | | 40,544,868 | | |
| Change in net unrealized appreciation (depreciation) of investments | | | 7,520,427 | | | | (37,234,254 | ) | |
| Net increase (decrease) in net assets resulting from operations | | | 36,731,622 | | | | 1,453,096 | | |
| From Fund Share Transactions (Note D): | |
| Proceeds from shares sold: | |
| Class I | | | 16,627,978 | | | | 13,672,447 | | |
| Class S | | | 25,694,233 | | | | 16,391,288 | | |
| Payments for shares redeemed: | |
| Class I | | | (49,343,797 | ) | | | (48,218,175 | ) | |
| Class S | | | (9,994,051 | ) | | | (11,075,136 | ) | |
| Net increase (decrease) from Fund share transactions | | | (17,015,637 | ) | | | (29,229,576 | ) | |
| Net Increase (Decrease) in Net Assets | | | 19,715,985 | | | | (27,776,480 | ) | |
| Net Assets: | |
| Beginning of year | | | 297,440,509 | | | | 325,216,989 | | |
| End of year | | $ | 317,156,494 | | | $ | 297,440,509 | | |
| Undistributed net investment income (loss) at end of year | | $ | — | | | $ | — | | |
See Notes to Financial Statements
13
Notes to Financial Statements Mid Cap Growth Portfolio
Note A—Summary of Significant Accounting Policies:
1 General: Neuberger Berman Advisers Management Trust (the "Trust") is a Delaware statutory trust organized pursuant to a Trust Instrument dated May 23, 1994. The Trust is currently comprised of ten separate operating series (each individually a "Series," and collectively the "Funds") each of which is diversified. The Trust is registered as an open-end management investment company under the Investment Company Act of 1940, as amended (the "1940 Act"), and its shares are registered under the Securities Act of 1933, as amended. The Fund currently offers Class I and Class S shares. The Board may establish additional series or classes of shares without the approval of shareholders.
The assets of each Series belong only to that Series, and the liabilities of each Series are borne solely by that Series and no other.
The preparation of financial statements in accordance with U.S. generally accepted accounting principles ("GAAP") requires Management to make estimates and assumptions at the date of the financial statements. Actual results could differ from those estimates.
2 Portfolio valuation: Investment securities are valued as indicated in the notes following the Schedule of Investments.
3 Foreign currency translation: The accounting records of the Fund are maintained in U.S. dollars. Foreign currency amounts are translated into U.S. dollars using the exchange rate as of 4:00 p.m., Eastern time, to determine the value of investments, other assets and liabilities. Purchase and sale prices of securities, and income and expenses, are translated into U.S. dollars at the prevailing rate of exchange on the respective dates of such transactions. Net unrealized foreign currency gain (loss), if any, arises from changes in the value of assets and liabilities, other than investments in securities, as a result of changes in exchange rates and is stated separately in the Statement of Operations.
4 Securities transactions and investment income: Securities transactions are recorded on trade date for financial reporting purposes. Dividend income is recorded on the ex-dividend date or, for certain foreign dividends, as soon as the Fund becomes aware of the dividends. Non-cash dividends included in dividend income, if any, are recorded at the fair market value of the securities received. Interest income, including accretion of original issue discount, where applicable, and accretion of discount on short-term investments, if any, is recorded on the accrual basis. Realized gains and losses from securities transactions and foreign currency transactions, if any, are recorded on the basis of identified cost and stated separately in the Statement of Operations. Included in net realized gain (loss) on investments are proceeds from the settlements of class action litigation in which the Fund participated as a class member. The amount of such proceeds for the year ended December 31, 2012 was $253,347.
5 Income tax information: The Funds are treated as separate entities for U.S. federal income tax purposes. It is the policy of the Fund to continue to qualify for treatment as a regulated investment company by complying with the requirements of the U.S. Internal Revenue Code applicable to regulated investment companies and to distribute substantially all of its net investment income and net realized capital gains to its shareholders. To the extent the Fund distributes substantially all of its net investment income and net realized capital gains to shareholders, no federal income or excise tax provision is required.
The Fund has adopted the provisions of ASC 740 "Income Taxes" ("ASC 740"). ASC 740 sets forth a minimum threshold for financial statement recognition of a tax position taken, or expected to be taken, in a tax return. The Fund recognizes interest and penalties, if any, related to unrecognized tax positions as an income tax expense in the Statement of Operations. The Fund is subject to examination by U.S. federal and state tax authorities for returns filed for the prior three fiscal years 2009 - 2011. As of December 31, 2012, the Fund did not have any unrecognized tax positions.
14
Income distributions and capital gain distributions are determined in accordance with income tax regulations, which may differ from GAAP. These differences are primarily due to differing treatments of income and gains on various investment securities held by the Fund, timing differences and differing characterization of distributions made by the Fund. The Fund may also utilize earnings and profits distributed to shareholders on redemption of shares as a part of the dividends-paid deduction for income tax purposes.
As determined on December 31, 2012, permanent differences resulting primarily from different book and tax accounting were reclassified at year end. Such differences may be attributed to one or more of the following: net operating losses, non-taxable dividend adjustments to income and foreign currency gains and losses. These reclassifications had no effect on net income, net asset value ("NAV") or NAV per share of the Fund. For the year ended December 31, 2012, the Fund recorded the following permanent reclassifications:
| Paid-in Capital | | Undistributed Net Investment Income (Loss) | | Accumulated Net Realized Gains (Losses) on Investments | |
| $ | (1,346,253 | ) | | $ | 1,293,689 | | | $ | 52,564 | | |
As of December 31, 2012, the components of distributable earnings (accumulated losses) on a U.S. federal income tax basis were as follows:
Unrealized Appreciation (Depreciation) | | Loss Carryforwards and Deferrals | | Other Temporary Differences | | Total | |
| $ | 96,033,584 | | | $ | (11,403,660 | ) | | $ | — | | | $ | 84,629,924 | | |
The difference between book basis and tax basis distributable earnings are primarily due to: timing differences of wash sales and capital loss carryforwards.
To the extent the Fund's net realized capital gains, if any, can be offset by capital loss carryforwards, it is the policy of the Fund not to distribute such gains. The Regulated Investment Company ("RIC") Modernization Act of 2010 (the "Act") became effective for the Fund on January 1, 2011. The Act modernizes several of the federal income and excise tax provisions related to RICs. Among the changes made are changes to the capital loss carryforward rules allowing for RICs to carry forward capital losses indefinitely and to retain the character of capital loss carryforwards as short-term or long-term ("Post-Enactment"). Rules in effect previously limited the carryforward period to eight years and all carryforwards were considered short-term in character ("Pre-Enactment"). As determined at December 31, 2012, the Fund had unused capital loss carryforwards available for federal income tax purposes to offset net realized capital gains, if any, as follows:
| | | Pre-Enactment | |
| | | Expiring in: 2017 | |
| | | | | $ | 11,403,660 | | |
Post-Enactment capital loss carryforwards must be fully used before Pre-Enactment capital loss carryforwards; therefore, under certain circumstances, Pre-Enactment capital loss carryforwards available as of the report date may expire unused. As of December 31, 2012, the Fund had no Post-Enactment capital loss carryforwards.
During the year ended December 31, 2012, the Fund utilized capital loss carryforwards of $30,312,860.
6 Distributions to shareholders: The Fund may earn income, net of expenses, daily on its investments. Distributions from net investment income and net realized capital gains, if any, generally are distributed once a year (usually in October). Income distributions and capital gain distributions to shareholders are recorded on the ex-date.
7 Foreign taxes: Foreign taxes withheld represent amounts withheld by foreign tax authorities, net of refunds recoverable.
15
8 Expense allocation: Certain expenses are applicable to multiple funds. Expenses directly attributable to a Series are charged to that Series. Expenses of the Trust that are not directly attributable to a particular series of the Trust (e.g., the Fund) are allocated among the series of the Trust, on the basis of relative net assets, except where a more appropriate allocation of expenses to each of the series can otherwise be made fairly. Expenses borne by the complex of related investment companies, which includes open-end and closed-end investment companies for which Management serves as investment manager, that are not directly attributable to a particular investment company in the complex (e.g., the Trust) or series thereof are allocated among the investment companies in the complex or series thereof, on the basis of relative net assets, except where a more appropriate allocation of expenses to each of the investment companies in the complex or series thereof can otherwise be made fairly. The Fund's expenses (other than those specific to each class) are allocated proportionally each day between the classes based upon the relative net assets of each class.
9 Investments in foreign securities: Investing in foreign securities may involve certain sovereign and other risks, in addition to the credit and market risks normally associated with domestic securities. These additional risks include the possibility of adverse political and economic developments (including political instability, nationalization, expropriation, or confiscatory taxation) and the potentially adverse effects of unavailability of public information regarding issuers, less governmental supervision and regulation of financial markets, reduced liquidity of certain financial markets, and the lack of uniform accounting, auditing, and financial reporting standards or the application of standards that are different or less stringent than those applied in the United States. Foreign securities also may experience greater price volatility, higher rates of inflation, and delays in settlement.
10 Indemnifications: Like many other companies, the Trust's organizational documents provide that its officers and trustees are indemnified against certain liabilities arising out of the performance of their duties to the Trust. In addition, both in some of its principal service contracts and in the normal course of its business, the Trust enters into contracts that provide indemnifications to other parties for certain types of losses or liabilities. The Trust's maximum exposure under these arrangements is unknown as this could involve future claims against the Trust.
11 Expense offset arrangement: The Fund has an expense offset arrangement in connection with its custodian contract. For the year ended December 31, 2012, the impact of this arrangement was a reduction of expenses of $49.
12 Other: All net investment income and realized and unrealized capital gains and losses of the Fund are allocated, on the basis of relative net assets, pro rata among its respective classes.
Note B—Management Fees, Administration Fees, Distribution Arrangements, and Other Transactions with Affiliates:
Fund shares are issued and redeemed in connection with investments in and payments under certain variable annuity contracts and variable life insurance policies issued through separate accounts of life insurance companies and are also offered directly to certain qualified pension and retirement plans.
The Fund retains Management as its investment manager under a Management Agreement. For such investment management services, the Fund pays Management a fee at the annual rate of 0.55% of the first $250 million of the Fund's average daily net assets, 0.525% of the next $250 million, 0.50% of the next $250 million, 0.475% of the next $250 million, 0.45% of the next $500 million, 0.425% of the next $2.5 billion, and 0.40% of average daily net assets in excess of $4 billion. Accordingly, for the year ended December 31, 2012, the management fee pursuant to the Management Agreement was equivalent to an annual effective rate of 0.54% of the Fund's average daily net assets.
The Fund retains Management as its administrator under an Administration Agreement. Each class pays Management an administration fee at the annual rate of 0.30% of its average daily net assets under this agreement. Additionally, Management retains State Street Bank and Trust Company ("State Street") as its sub-administrator under a Sub-Administration Agreement. Management pays State Street a fee for all services received under this agreement.
16
The Board adopted a non-fee distribution plan for the Fund's Class I.
For the Fund's Class S, Management acts as agent in arranging for the sale of class shares without commission and bears advertising and promotion expenses. The Board has adopted a distribution plan (the "Plan") with respect to this class, pursuant to Rule 12b-1 under the 1940 Act. The Plan provides that, as compensation for administrative and other services provided to this class, Management's activities and expenses related to the sale and distribution of this class of shares, and ongoing services provided to investors in this class, Management receives from this class a fee at the annual rate of 0.25% of Class S's average daily net assets. Management receives this amount to provide distribution and shareholder servicing for this class and pays a portion of it to institutions that provide such services. Those institutions may use the payments for, among other purposes, compensating employees engaged in sales and/or shareholder servicing. The amount of fees paid by this class during any year may be more or less than the cost of distribution and other services provided to this class. FINRA rules limit the amount of annual distribution fees that may be paid by a mutual fund and impose a ceiling on the cumulative distribution fees paid. The Trust's Plan complies with those rules.
Management has contractually undertaken to waive current payment of fees and/or reimburse the Fund's Class I and Class S shares for their operating expenses (excluding fees payable to Management (including fees payable to Management with respect to the Fund's Class S shares), interest, taxes, brokerage commissions, extraordinary expenses, transaction costs and dividend expense on short sales, if any) ("Operating Expenses") which exceed the expense limitation as detailed in the following table:
| | | Expense Limitation(1) | | Expiration | | Reimbursement from Management for the Year Ended December 31, 2012 | |
| Class I | | | 1.00 | % | | 12/31/15 | | $ | — | | |
| Class S | | | 1.25 | % | | 12/31/15 | | | — | | |
(1) Expense limitation per annum of the respective class' average daily net assets.
Each respective class has agreed to repay Management through December 31, 2018 for fees and expenses waived and/or its excess Operating Expenses previously reimbursed by Management, so long as its annual Operating Expenses during that period do not exceed its expense limitation in place at the time the fees and expenses were waived or reimbursed, and the repayment is made within three years after the year in which Management issued the reimbursement or waived fees. During the year ended December 31, 2012, the Fund's Class S shares reimbursed Management $8,207, under its contractual expense limitation. At December 31, 2012, the Fund's Class I shares had no contingent liability to Management under its contractual expense limitation. At December 31, 2012, the Fund's Class S shares contingent liabilities to Management under its contractual expense limitation were as follows:
| | | Expiring in: | |
| | | 2013 | | 2014 | | Total | |
| Class S | | $ | 5,522 | | | $ | 4,506 | | | $ | 10,028 | | |
Neuberger Berman LLC ("Neuberger") is retained by Management to furnish it with investment recommendations and research information without added cost to the Fund. Several individuals who are officers and/or trustees of the Trust are also employees of Neuberger and/or Management.
Management and Neuberger are indirect subsidiaries of Neuberger Berman Group LLC (("NBG") and together with its consolidated subsidiaries ("NB Group")). NBSH Acquisition, LLC ("NBSH"), which is owned by portfolio managers, members of the NB Group management team and certain of NB Group's key employees and senior professionals, owns, as of September 30, 2012, approximately 57% of NBG's common units, and Lehman Brothers Holdings Inc. ("LBHI") and certain of its subsidiaries (collectively the "LBHI Parties") own the remaining 43% of such common units. Pursuant to agreements among NBG, NBSH and the LBHI Parties, NBG is entitled to acquire the remaining Class A common units through a process that is expected to end in 2017. In April 2012, NBG
17
exercised its option (the "Redemption Agreement Option") to redeem during 2012 certain of its Class A common units held by the LBHI Parties equal to 10% of NBG's aggregate common units issued and outstanding as of March 16, 2012. The final payment for such Class A common units is due within thirty (30) days of December 31, 2012.
Note C—Securities Transactions:
During the year ended December 31, 2012, there were purchase and sale transactions (excluding short-term securities) of $120,170,779 and $136,414,705, respectively.
During the year ended December 31, 2012, no brokerage commissions on securities transactions were paid to affiliated brokers.
Note D—Fund Share Transactions:
Share activity for the years ended December 31, 2012 and December 31, 2011 was as follows:
For the Year Ended December 31, 2012
| | | Shares Sold | | Shares Redeemed | | Total | |
| Class I | | | 553,983 | | | | (1,626,755 | ) | | | (1,072,772 | ) | |
| Class S | | | 873,826 | | | | (336,962 | ) | | | 536,864 | | |
For the Year Ended December 31, 2011
| | | Shares Sold | | Shares Redeemed | | Total | |
| Class I | | | 478,220 | | | | (1,714,503 | ) | | | (1,236,283 | ) | |
| Class S | | | 587,530 | | | | (408,330 | ) | | | 179,200 | | |
Note E—Line of Credit:
At December 31, 2012, the Fund was a participant in a single committed, unsecured $200,000,000 line of credit with State Street, to be used only for temporary or emergency purposes. Other investment companies managed by Management also participate in this line of credit on the same terms. Interest is charged on borrowings under this line of credit at the higher of (a) the Federal Funds Rate plus 1.25% per annum or (b) the Overnight LIBOR Rate plus 1.25% per annum. A commitment fee of 0.10% per annum of the available line of credit is charged, of which each participating Fund has agreed to pay its pro rata share, based on the ratio of its individual net assets to the net assets of all participants at the time the fee is due and payable. The fee is paid quarterly in arrears. Because several mutual funds participate, there is no assurance that an individual Fund will have access to all or any part of the $200,000,000 at any particular time. There were no loans outstanding pursuant to this line of credit at December 31, 2012. During the year ended December 31, 2012, the Fund did not utilize this line of credit.
Note F—Recent Accounting Pronouncement:
In December 2011, the Financial Accounting Standards Board issued Accounting Standards Update 2011-11 Disclosures about Offsetting Assets and Liabilities ("ASU 2011-11"). Effective for annual reporting periods beginning on or after January 1, 2013 and interim periods within those annual periods, ASU 2011-11 is intended to enhance disclosure requirements on the offsetting of financial assets and liabilities. At this time, Management is evaluating the implications of ASU 2011-11 and its impact on the financial statements.
18
Financial Highlights
Mid Cap Growth Portfolio
The following tables include selected data for a share outstanding throughout each year and other performance information derived from the Financial Statements. Per share amounts that round to less than $.01 or $(.01) per share are presented as $.00 or $(.00), respectively.
| Class I | |
| | | Year Ended December 31, | |
| | | 2012 | | 2011 | | 2010 | | 2009 | | 2008 | |
| Net Asset Value, Beginning of Year | | $ | 27.55 | | | $ | 27.42 | | | $ | 21.25 | | | $ | 16.14 | | | $ | 28.50 | | |
| Income From Investment Operations: | |
Net Investment Income (Loss)‡ | | | (.10 | ) | | | (.15 | ) | | | (.11 | ) | | | (.03 | ) | | | (.12 | ) | |
Net Gains or Losses on Securities (both realized and unrealized) | | | 3.52 | | | | .28 | | | | 6.28 | | | | 5.14 | | | | (12.24 | ) | |
| Total From Investment Operations | | | 3.42 | | | | .13 | | | | 6.17 | | | | 5.11 | | | | (12.36 | ) | |
| Net Asset Value, End of Year | | $ | 30.97 | | | $ | 27.55 | | | $ | 27.42 | | | $ | 21.25 | | | $ | 16.14 | | |
Total Return†† | | | 12.41 | % | | | .47 | % | | | 29.04 | % | | | 31.66 | % | | | (43.37 | )% | |
| Ratios/Supplemental Data | |
| Net Assets, End of Year (in millions) | | $ | 229.0 | | | $ | 233.2 | | | $ | 266.0 | | | $ | 234.1 | | | $ | 345.1 | | |
Ratio of Gross Expenses to Average Net Assets# | | | .99 | % | | | 1.01 | % | | | 1.02 | % | | | 1.01 | % | | | .92 | % | |
Ratio of Net Expenses to Average Net Assets§ | | | .99 | % | | | 1.01 | % | | | 1.02 | % | | | 1.01 | % | | | .92 | % | |
Ratio of Net Investment Income (Loss) to Average Net Assets | | | (.34 | )% | | | (.54 | )% | | | (.49 | )% | | | (.16 | )% | | | (.51 | )% | |
| Portfolio Turnover Rate | | | 38 | % | | | 35 | % | | | 46 | % | | | 67 | % | | | 62 | % | |
See Notes to Financial Highlights
19
Financial Highlights (cont'd)
| Class S | |
| | | Year Ended December 31, | |
| | | 2012 | | 2011 | | 2010 | | 2009 | | 2008 | |
| Net Asset Value, Beginning of Year | | $ | 26.94 | | | $ | 26.87 | | | $ | 20.87 | | | $ | 15.89 | | | $ | 28.13 | | |
| Income From Investment Operations: | |
Net Investment Income (Loss)‡ | | | (.17 | ) | | | (.21 | ) | | | (.16 | ) | | | (.08 | ) | | | (.17 | ) | |
Net Gains or Losses on Securities (both realized and unrealized) | | | 3.44 | | | | .28 | | | | 6.16 | | | | 5.06 | | | | (12.07 | ) | |
| Total From Investment Operations | | | 3.27 | | | | .07 | | | | 6.00 | | | | 4.98 | | | | (12.24 | ) | |
| Net Asset Value, End of Year | | $ | 30.21 | | | $ | 26.94 | | | $ | 26.87 | | | $ | 20.87 | | | $ | 15.89 | | |
Total Return†† | | | 12.14 | % | | | .26 | % | | | 28.75 | % | | | 31.34 | % | | | (43.51 | )% | |
| Ratios/Supplemental Data | |
| Net Assets, End of Year (in millions) | | $ | 88.2 | | | $ | 64.2 | | | $ | 59.2 | | | $ | 43.2 | | | $ | 38.7 | | |
Ratio of Gross Expenses to Average Net Assets# | | | 1.25 | % | | | 1.26 | % | | | 1.27 | % | | | 1.27 | % | | | 1.17 | % | |
Ratio of Net Expenses to Average Net Assets§ | | | 1.25 | % | | | 1.25 | % | | | 1.25 | % | | | 1.25 | % | | | 1.17 | % | |
Ratio of Net Investment Income (Loss) to Average Net Assets | | | (.57 | )% | | | (.78 | )% | | | (.73 | )% | | | (.44 | )% | | | (.77 | )% | |
| Portfolio Turnover Rate | | | 38 | % | | | 35 | % | | | 46 | % | | | 67 | % | | | 62 | % | |
See Notes to Financial Highlights
20
Notes to Financial Highlights Mid Cap Growth Portfolio
†† Total return based on per share NAV reflects the effects of changes in NAV on the performance of the Fund during each fiscal period and assumes income dividends and other distributions, if any, were reinvested. Results represent past performance and do not indicate future results. Current returns may be lower or higher than the performance data quoted. Investment returns and principal may fluctuate and shares when redeemed may be worth more or less than original cost. Total return would have been lower if Management had not reimbursed and/or waived certain expenses. Total return would have been higher if Management had not recouped previously reimbursed expenses. The total return information shown does not reflect charges and other expenses that apply to the separate account or the related insurance policies, and the inclusion of these charges and other expenses would reduce the total return for all fiscal periods shown. Had the Fund not received the class actions proceeds as listed in Note A-4, total return based on per share NAV for the year ended December 31, 2012 would have been 12.34% and 12.06% for Class I and Class S, respectively.
# Represents the annualized ratios of net expenses to average daily net assets if Management had not reimbursed certain expenses and/or waived a portion of the investment management fee.
‡ Calculated based on the average number of shares outstanding during each fiscal period.
§ After reimbursement of expenses and/or waiver of a portion of the investment management fee by Management. The Fund is required to calculate an expense ratio without taking into consideration any expense reductions related to expense offset arrangements. Had the Fund not received expense reductions related to expense offset arrangements, the annualized ratios of net expenses to average daily net assets would have been:
| | | Year Ended December 31, | |
| | | 2012 | | 2011 | | 2010 | | 2009 | | 2008 | |
| Mid Cap Growth Portfolio Class I | | | .99 | % | | | 1.01 | % | | | 1.02 | % | | | 1.01 | % | | | .92 | % | |
| Mid Cap Growth Portfolio Class S | | | 1.25 | % | | | 1.25 | % | | | 1.25 | % | | | 1.25 | % | | | 1.18 | % | |
After reimbursement of expenses previously paid by Management. Had the Fund not made such reimbursements, the annualized ratio of net expenses to average daily net assets would have been:
| | | Year Ended December 31, 2012 | |
| Mid Cap Growth Portfolio Class S | | | 1.24 | % | |
21
Report of Independent Registered Public Accounting Firm
To the Board of Trustees of
Neuberger Berman Advisers Management Trust and
Shareholders of Mid Cap Growth Portfolio
We have audited the accompanying statement of assets and liabilities of Mid Cap Growth Portfolio, one of the series constituting Neuberger Berman Advisers Management Trust (the "Trust"), including the schedule of investments, as of December 31, 2012, and the related statement of operations for the year then ended, the statements of changes in net assets for each of the two years in the period then ended, and the financial highlights for each of the five years in the period then ended. These financial statements and financial highlights are the responsibility of the Trust's management. Our responsibility is to express an opinion on these financial statements and financial highlights based on our audits.
We conducted our audits in accordance with the standards of the Public Company Accounting Oversight Board (United States). Those standards require that we plan and perform the audit to obtain reasonable assurance about whether the financial statements and financial highlights are free of material misstatement. We were not engaged to perform an audit of the Trust's internal control over financial reporting. Our audits included consideration of internal control over financial reporting as a basis for designing audit procedures that are appropriate in the circumstances, but not for the purpose of expressing an opinion on the effectiveness of the Trust's internal control over financial reporting. Accordingly, we express no such opinion. An audit also includes examining, on a test basis, evidence supporting the amounts and disclosures in the financial statements and financial highlights, assessing the accounting principles used and significant estimates made by management, and evaluating the overall financial statement presentation. Our procedures included confirmation of securities owned as of December 31, 2012 by correspondence with the custodian and others or by other appropriate auditing procedures where replies from others were not received. We believe that our audits provide a reasonable basis for our opinion.
In our opinion, the financial statements and financial highlights referred to above present fairly, in all material respects, the financial position of Mid Cap Growth Portfolio, a series of Neuberger Berman Advisers Management Trust, at December 31, 2012, the results of its operations for the year then ended, the changes in its net assets for each of the two years in the period then ended, and the financial highlights for each of the five years in the period then ended, in conformity with U.S. generally accepted accounting principles.
Boston, Massachusetts
February 7, 2013
22
Trustee and Officer Information
The following tables set forth information concerning the trustees ("Trustees") and officers ("Officers") of the Trust. All persons named as Trustees and Officers also serve in similar capacities for other funds administered or managed by Management, Neuberger and Neuberger Berman Fixed Income LLC ("NBFI"). The Statement of Additional Information includes additional information about Trustees and is available upon request, without charge, by calling (800) 877-9700.
Information about the Board of Trustees
Name, (Year of Birth), and Address(1) | | Position(s) and Length of Time Served(2) | | Principal Occupation(s)(3) | | Number of Funds in Fund Complex Overseen by Fund Trustee | | Other Directorships Held Outside Fund Complex by Fund Trustee(3) | |
| Independent Fund Trustees | |
| Faith Colish (1935) | | Trustee since 1982 | | Counsel, Carter Ledyard & Milburn LLP (law firm) since October 2002; formerly, Attorney-at-Law and President, Faith Colish, A Professional Corporation, 1980 to 2002. | | | 50 | | | Formerly, Director, 1997 to 2003, and Advisory Director, 2003 to 2006, ABA Retirement Funds (formerly, American Bar Retirement Association) (not-for-profit membership corporation). | |
| Martha C. Goss (1949) | | Trustee since 2007 | | President, Woodhill Enterprises Inc./Chase Hollow Associates LLC (personal investment vehicle), since 2006; Chief Operating and Financial Officer, Hopewell Holdings LLC/Amwell Holdings, LLC (a holding company for investments in the healthcare sector), since 2003; formerly, Consultant, Resources Connection (temporary staffing), 2002 to 2006. | | | 50 | | | Director, American Water (water utility), since 2003; Director, Channel Reinsurance (financial guaranty reinsurance), 2006 to 2010; Director, Allianz Life of New York (insurance), since 2005; Director, Financial Women's Association of New York (not-for-profit association), since 2003; Trustee Emerita, Brown University, since 1998; formerly, Director, Ocwen Financial Corporation (mortgage servicing), 2005 to 2010; formerly, Advisory Board Member, Attensity (software developer), 2005 to 2007; formerly, Director, Bank Leumi (commercial bank), 2005 to 2007; formerly, Director, Claire's Stores, Inc. (retailer), 2005 to 2007. | |
23
Name, (Year of Birth), and Address(1) | | Position(s) and Length of Time Served(2) | | Principal Occupation(s)(3) | | Number of Funds in Fund Complex Overseen by Fund Trustee | | Other Directorships Held Outside Fund Complex by Fund Trustee(3) | |
| Michael M. Knetter (1960) | | Trustee since 2007 | | President and Chief Executive Officer, University of Wisconsin Foundation, since October 2010; formerly, Dean, School of Business, University of Wisconsin - Madison; formerly, Professor of International Economics and Associate Dean, Amos Tuck School of Business - Dartmouth College, 1998 to 2002. | | | 50 | | | Director, American Family Insurance (a mutual company, not publicly traded), since March 2009; formerly, Trustee, Northwestern Mutual Series Fund, Inc., 2007 to 2010; formerly, Director, Wausau Paper, 2005 to 2011; formerly, Director, Great Wolf Resorts, 2004 to 2009. | |
| Howard A. Mileaf (1937) | | Trustee since 1999 | | Retired; formerly, Vice President and General Counsel, WHX Corporation (holding company), 1993 to 2001. | | | 50 | | | Formerly, Director, Webfinancial Corporation (holding company), 2002 to 2008; formerly, Director, WHX Corporation (holding company), 2002 to 2005; formerly, Director, State Theatre of New Jersey (not-for-profit theatre), 2000 to 2005. | |
| George W. Morriss (1947) | | Trustee since 2007 | | Adjunct Faculty Member, Columbia University School of International Policy and Administration, since October 2012; formerly, Executive Vice President and Chief Financial Officer, People's Bank, Connecticut (a financial services company), 1991 to 2001. | | | 50 | | | Formerly, Manager, Larch Lane Multi-Strategy Fund complex (which consisted of three funds), 2006 to 2011; formerly, Member, NASDAQ Issuers' Affairs Committee, 1995 to 2003. | |
24
Name, (Year of Birth), and Address(1) | | Position(s) and Length of Time Served(2) | | Principal Occupation(s)(3) | | Number of Funds in Fund Complex Overseen by Fund Trustee | | Other Directorships Held Outside Fund Complex by Fund Trustee(3) | |
| Jack L. Rivkin (1940) | | Trustee since 2002; President 2002 to 2008 | | Formerly, Executive Vice President and Chief Investment Officer, Neuberger Berman Holdings LLC (holding company), 2002 to August 2008 and 2003 to August 2008, respectively; formerly, Managing Director and Chief Investment Officer, Neuberger, December 2005 to August 2008 and 2003 to August 2008, respectively; formerly, Executive Vice President, Neuberger, December 2002 to 2005; formerly, Director and Chairman, Management, December 2002 to August 2008; formerly, Executive Vice President, Citigroup Investments, Inc., September 1995 to February 2002; formerly, Executive Vice President, Citigroup Inc., September 1995 to February 2002. | | | 50 | | | Director, Idealab (private company), since 2009; Director, Distributed World Power (private company), since 2009; Director, Dale Carnegie and Associates, Inc. (private company), since 1999; Director, Solbright, Inc. (private company), since 1998; Director, SA Agricultural Fund, since 2009; Chairman and Director, Essential Brands (consumer products) since 2008; formerly, Director, New York Society of Security Analysts, 2006 to 2008. | |
| Tom D. Seip (1950) | | Trustee since 2000; Chairman of the Board since 2008; Lead Independent Trustee 2006 to 2008 | | General Partner, Ridgefield Farm LLC (a private investment vehicle); formerly, President and CEO, Westaff, Inc. (temporary staffing), May 2001 to January 2002; formerly, Senior Executive, The Charles Schwab Corporation, 1983 to 1998, including Chief Executive Officer, Charles Schwab Investment Management, Inc.; Trustee, Schwab Family of Funds and Schwab Investments, 1997 to 1998; and Executive Vice President-Retail Brokerage, Charles Schwab & Co., Inc., 1994 to 1997. | | | 50 | | | Director, H&R Block, Inc. (financial services company), since May 2001; Chairman, Governance and Nominating Committee, H&R Block, Inc., since 2011; formerly, Chairman, Compensation Committee, H&R Block, Inc., 2006 to 2010; formerly, Director, Forward Management, Inc. (asset management company), 1999 to 2006. | |
25
Name, (Year of Birth), and Address(1) | | Position(s) and Length of Time Served(2) | | Principal Occupation(s)(3) | | Number of Funds in Fund Complex Overseen by Fund Trustee | | Other Directorships Held Outside Fund Complex by Fund Trustee(3) | |
| Candace L. Straight (1947) | | Trustee since 1999 | | Private investor and consultant specializing in the insurance industry; formerly, Advisory Director, Securitas Capital LLC (a global private equity investment firm dedicated to making investments in the insurance sector), 1998 to December 2003. | | | 50 | | | Public Member, Board of Governors and Board of Trustees, Rutgers University, since 2011; Director, Montpelier Re Holdings Ltd. (reinsurance company), since 2006; formerly, Director, National Atlantic Holdings Corporation (property and casualty insurance company), 2004 to 2008; formerly, Director, The Proformance Insurance Company (property and casualty insurance company), 2004 to 2008; formerly, Director, Providence Washington Insurance Company (property and casualty insurance company), 1998 to 2006; formerly, Director, Summit Global Partners (insurance brokerage firm), 2000 to 2005. | |
| Peter P. Trapp (1944) | | Trustee since 1984 | | Retired; formerly, Regional Manager for Mid-Southern Region, Ford Motor Credit Company, September 1997 to 2007; formerly, President, Ford Life Insurance Company, April 1995 to August 1997. | | | 50 | | | | None. | | |
26
Name, (Year of Birth), and Address(1) | | Position(s) and Length of Time Served(2) | | Principal Occupation(s)(3) | | Number of Funds in Fund Complex Overseen by Fund Trustee | | Other Directorships Held Outside Fund Complex by Fund Trustee(3) | |
| Fund Trustees who are "Interested Persons" | |
| Joseph V. Amato* (1962) | | Trustee since 2009 | | President and Director, Neuberger Berman Group LLC, since 2009; President and Chief Executive Officer, Neuberger and Neuberger Berman Holdings LLC (including its predecessor, Neuberger Berman Inc.), since 2007; Chief Investment Officer, Neuberger, since 2009; Chief Investment Officer (Equities) and Managing Director, Management, since 2009; Managing Director, NBFI, since 2007; Board member of NBFI since 2006; formerly, Global Head of Asset Management of Lehman Brothers Holdings Inc.'s ("LBHI") Investment Management Division, 2006 to 2009; formerly, member of LBHI's Investment Management Division's Executive Management Committee, 2006 to 2009; formerly, Managing Director, Lehman Brothers Inc. ("LBI"), 2006 to 2008; formerly, Chief Recruiting and Development Officer, LBI, 2005 to 2006; formerly, Global Head of LBI's Equity Sales and a Member of its Equities Division Executive Committee, 2003 to 2005. | | | 50 | | | Member of Board of Advisors, McDonough School of Business, Georgetown University, since 2001; Member of New York City Board of Advisors, Teach for America, since 2005; Trustee, Montclair Kimberley Academy (private school), since 2007. | |
27
Name, (Year of Birth), and Address(1) | | Position(s) and Length of Time Served(2) | | Principal Occupation(s)(3) | | Number of Funds in Fund Complex Overseen by Fund Trustee | | Other Directorships Held Outside Fund Complex by Fund Trustee(3) | |
| Robert Conti* (1956) | | Chief Executive Officer, President and Trustee since 2008; prior thereto, Executive Vice President in 2008 and Vice President 2000 to 2008 | | Managing Director, Neuberger, since 2007; formerly, Senior Vice President, Neuberger, 2003 to 2006; formerly, Vice President, Neuberger, 1999 to 2003; President and Chief Executive Officer, Management, since 2008; formerly, Senior Vice President, Management, 2000 to 2008; Managing Director, NBFI, since 2009. | | | 50 | | | Director, Staten Island Mental Health Society, since 1994; formerly, Chairman of the Board, Staten Island Mental Health Society, 2008 to 2011. | |
(1) The business address of each listed person is 605 Third Avenue, New York, New York 10158.
(2) Pursuant to the Trust's Trust Instrument, each of these Fund Trustees shall hold office for life or until his or her successor is elected or the Trust terminates; except that (a) any Fund Trustee may resign by delivering a written resignation; (b) any Fund Trustee may be removed with or without cause at any time by a written instrument signed by at least two-thirds of the other Fund Trustees; (c) any Fund Trustee who requests to be retired, or who has become unable to serve, may be retired by a written instrument signed by a majority of the other Fund Trustees; and (d) any Fund Trustee may be removed at any shareholder meeting by a vote of at least two-thirds of the outstanding shares.
(3) Except as otherwise indicated, each individual has held the positions shown for at least the last five years.
* Indicates a Fund Trustee who is an "interested person" within the meaning of the 1940 Act. Mr. Amato and Mr. Conti are interested persons of the Trust by virtue of the fact that each is an officer of Management, Neuberger and/or their affiliates.
28
Information about the Officers of the Trust
Name, (Year of Birth), and Address(1) | | Position(s) and Length of Time Served(2) | | Principal Occupation(s)(3) | |
| Andrew B. Allard (1961) | | Chief Legal Officer since 2013 (only for purposes of sections 307 and 406 of the Sarbanes-Oxley Act of 2002) and Anti-Money Laundering Compliance Officer since 2002 | | Senior Vice President, Neuberger, since 2006 and Employee since 1999; Deputy General Counsel, Neuberger, since 2004; formerly, Vice President, Neuberger, 2000 to 2005; formerly, Employee, Management, 1994 to 1999; Chief Legal Officer since 2013 (only for purposes of sections 307 and 406 of the Sarbanes-Oxley Act of 2002) and Anti-Money Laundering Compliance Officer since 2002, nine registered investment companies for which Management acts as investment manager and administrator (six since 2002, one since 2003, one since 2005 and one since 2006). | |
| Claudia A. Brandon (1956) | | Executive Vice President since 2008 and Secretary since 1985 | | Senior Vice President, Neuberger, since 2007 and Employee since 1999; Senior Vice President, Management, since 2008 and Assistant Secretary since 2004; formerly, Vice President, Neuberger, 2002 to 2006; formerly, Vice President-Mutual Fund Board Relations, Management, 2000 to 2008; formerly, Vice President, Management, 1986 to 1999 and Employee 1984 to 1999; Executive Vice President, nine registered investment companies for which Management acts as investment manager and administrator (nine since 2008); Secretary, nine registered investment companies for which Management acts as investment manager and administrator (three since 1985, three since 2002, one since 2003, one since 2005 and one since 2006). | |
| Anthony DiBernardo (1979) | | Assistant Treasurer since 2011 | | Vice President, Neuberger, since 2009; Employee, Management, since 2003; Assistant Treasurer, nine registered investment companies for which Management acts as investment manager and administrator (nine since 2011). | |
| Sheila R. James (1965) | | Assistant Secretary since 2002 | | Vice President, Neuberger, since 2008 and Employee since 1999; formerly, Assistant Vice President, Neuberger, 2007; formerly, Employee, Management, 1991 to 1999; Assistant Secretary, nine registered investment companies for which Management acts as investment manager and administrator (six since 2002, one since 2003, one since 2005 and one since 2006). | |
| Brian Kerrane (1969) | | Vice President since 2008 | | Senior Vice President, Neuberger, since 2006; formerly, Vice President, Neuberger, 2002 to 2006; Vice President, Management, since 2008 and Employee since 1991; Vice President, nine registered investment companies for which Management acts as investment manager and administrator (nine since 2008). | |
29
Name, (Year of Birth), and Address(1) | | Position(s) and Length of Time Served(2) | | Principal Occupation(s)(3) | |
| Kevin Lyons (1955) | | Assistant Secretary since 2003 | | Assistant Vice President, Neuberger, since 2008 and Employee since 1999; formerly, Employee, Management, 1993 to 1999; Assistant Secretary, nine registered investment companies for which Management acts as investment manager and administrator (seven since 2003, one since 2005 and one since 2006). | |
| Owen F. McEntee, Jr. (1961) | | Vice President since 2008 | | Vice President, Neuberger, since 2006; Employee, Management, since 1992; Vice President, nine registered investment companies for which Management acts as investment manager and administrator (nine since 2008). | |
| John M. McGovern (1970) | | Treasurer and Principal Financial and Accounting Officer since 2005 | | Senior Vice President, Neuberger, since 2007; formerly, Vice President, Neuberger, 2004 to 2006; Employee, Management, since 1993; Treasurer and Principal Financial and Accounting Officer, nine registered investment companies for which Management acts as investment manager and administrator (eight since 2005 and one since 2006); formerly, Assistant Treasurer, eight registered investment companies for which Management acts as investment manager and administrator, 2002 to 2005. | |
| Frank Rosato (1971) | | Assistant Treasurer since 2005 | | Vice President, Neuberger, since 2006; Employee, Management, since 1995; Assistant Treasurer, nine registered investment companies for which Management acts as investment manager and administrator (eight since 2005 and one since 2006). | |
| Neil S. Siegel (1967) | | Vice President since 2008 | | Managing Director, Management, since 2008; Managing Director, Neuberger, since 2006; formerly, Senior Vice President, Neuberger, 2004 to 2006; Vice President, nine registered investment companies for which Management acts as investment manager and administrator (nine since 2008). | |
| Chamaine Williams (1971) | | Chief Compliance Officer since 2005 | | Senior Vice President, Neuberger, since 2007; Chief Compliance Officer, Management, since 2006; Chief Compliance Officer, nine registered investment companies for which Management acts as investment manager and administrator (eight since 2005 and one since 2006); formerly, Senior Vice President, LBI, 2007 to 2008; formerly, Vice President, LBI, 2003 to 2006; formerly, Chief Compliance Officer, Lehman Brothers Asset Management Inc., 2003 to 2007; formerly, Chief Compliance Officer, Lehman Brothers Alternative Investment Management LLC, 2003 to 2007. | |
(1) The business address of each listed person is 605 Third Avenue, New York, New York 10158.
(2) Pursuant to the By-Laws of the Trust, each officer elected by the Fund Trustees shall hold office until his or her successor shall have been elected and qualified or until his or her earlier death, inability to serve, or resignation. Officers serve at the pleasure of the Fund Trustees and may be removed at any time with or without cause.
(3) Except as otherwise indicated, each individual has held the positions shown for at least the last five years.
30
Proxy Voting Policies and Procedures
A description of the policies and procedures that the Trust uses to determine how to vote proxies relating to portfolio securities is available, without charge, by calling 1-800-877-9700 (toll-free) and on the website of the Securities and Exchange Commission, at www.sec.gov. Information regarding how the Trust voted proxies relating to portfolio securities during the most recent 12-month period ended June 30 is also available, without charge, by calling 1-800-877-9700 (toll-free), on the website of the Securities and Exchange Commission at www.sec.gov, and on Management's website at www.nb.com.
Quarterly Portfolio Schedule
The Trust files a complete schedule of portfolio holdings for the Fund with the Securities and Exchange Commission for the first and third quarters of each fiscal year on Form N-Q. The Trust's Forms N-Q are available on the Securities and Exchange Commission's website at www.sec.gov and may be reviewed and copied at the Securities and Exchange Commission's Public Reference Room in Washington, DC. Information on the operation of the Public Reference Room may be obtained by calling 1-800-SEC-0330. The information on Form N-Q is available upon request, without charge, by calling 1-800-877-9700 (toll free).
Board Consideration of the Management and Sub-Advisory Agreements
At a meeting held on October 25, 2012, the Board of Trustees of Neuberger Berman Advisers Management Trust ("Board"), including the Trustees who are not "interested persons" of Neuberger Berman Management LLC ("Management") (including its affiliates) or Neuberger Berman Advisers Management Trust ("Independent Fund Trustees"), approved the continuance of the Management and Sub-Advisory Agreements ("Agreements") for Mid-Cap Growth Portfolio ("Fund").
In evaluating the Agreements, the Board, including the Independent Fund Trustees, reviewed materials furnished by Management in response to questions submitted by counsel for the Independent Fund Trustees, and met with senior representatives of Management regarding Neuberger Berman's personnel, operations and financial conditions as they relate to the Fund. The Independent Fund Trustees were advised by counsel that is experienced in Investment Company Act of 1940 matters and that is independent of Management. The Independent Fund Trustees received a memorandum from independent counsel discussing the legal standards for their consideration of the proposed continuance of the Agreements. They met with such counsel separately from representatives of Management to discuss the annual contract review. The annual contract review extends over three regular meetings of the Board, including one meeting devoted primarily to reviewing and discussing Fund performance, to ensure that Management has time to respond to any questions the Independent Fund Trustees may have on their initial review of the report and that the Independent Fund Trustees have time to consider those responses.
The Board considered the following factors, among others, in connection with its approval of the continuance of the Agreements: (1) the nature, extent, and quality of the services provided by Management and Neuberger Berman LLC ("Neuberger"); (2) the performance of the Fund compared to a relevant market index and a peer group of investment companies; (3) the costs of the services provided and profits or losses realized by Management and its affiliates from their relationship with the Fund; (4) the extent to which economies of scale might be realized as the Fund grows; and (5) whether fee levels reflect any such potential economies of scale for the benefit of investors in the Fund. In their deliberations, the Board members did not identify any particular information that was all-important or controlling, and each Trustee may have attributed different weights to the various factors.
The Board evaluated the terms of the Agreements, the overall fairness of the Agreements to the Fund and whether the Agreements were in the best interests of the Fund and its shareholders.
With respect to the nature, extent and quality of the services provided, the Board considered the performance of the Fund and the experience and staffing of the portfolio management personnel of Management and Neuberger who perform services for the Fund. The Board noted that Management also provides certain administrative services, including fund
31
accounting and compliance oversight. The Board also considered Management's and Neuberger's policies and practices regarding brokerage and allocation of portfolio transactions by Management. The Board's Portfolio Transactions and Pricing Committee from time to time reviewed the quality of the execution services that Management and Neuberger had provided, and periodically reviewed studies by an independent firm engaged to review and evaluate the quality of brokerage execution received by the Fund. The Board also reviewed whether Management and Neuberger used brokers to execute Fund transactions that provide research and other services to Management and Neuberger, and the types of benefits potentially derived from such services by Management, Neuberger, the Fund and other clients of Management and Neuberger. In addition, the Board noted the positive compliance history of Management and Neuberger, as each firm has been free of significant reported compliance problems. As in past years, the Board also considered the manner in which Management addressed various non-routine matters that arose during the year, some of them a result of developments in the broader fund industry or the regulations governing it.
The Board considered the performance of the Fund relative to its benchmark and the average performance of composite peer groups of investment companies dedicated to insurance products pursuing broadly similar strategies. The Board also reviewed performance during the period in relation to certain measures of the degree of investment risk undertaken by the portfolio manager. The Board discussed with Management the Fund's performance and steps that Management had under consideration to improve performance. The Board also considered Management's resources and responsiveness with respect to the Fund.
With respect to the overall fairness of the Agreements, the Board considered the fee structure for the Fund under the Agreements as compared to a peer group of comparable funds and any fall-out benefits likely to accrue to Management or Neuberger or their affiliates from their relationship with the Fund. In addition, the Board considered the profitability of Management and its affiliates from their association with the Fund.
The Board reviewed a comparison of the Fund's management fee and overall expense ratio to a peer group of broadly comparable non-proprietary funds dedicated to insurance products. The Board considered the mean and median of the management fees and expense ratios of the peer group. The Board noted that the Fund's management fee was higher than the peer group mean and median. The Board considered whether specific portfolio management or administration needs contributed to the management fee. The Board also considered the contractual limit on Fund expenses undertaken by Management. With regard to the sub-advisory fee paid to Neuberger, the Board noted that this fee is "at cost."
The Board considered whether there were other funds that were advised or sub-advised by Management or its affiliates or separate accounts managed by Management or its affiliates with investment objectives, policies and strategies that were similar to the Fund. If so, the Board compared the fees charged to the Fund to the fees charged to any such other funds and/or separate accounts. The Board considered the appropriateness and reasonableness of any differences between the fees charged to the Fund and any such other funds and/or separate accounts and determined that the differences in fees were consistent with the management and other services provided.
The Board also evaluated any apparent or anticipated economies of scale in relation to the services Management provides to the Fund. The Board considered whether the Fund's fee structure provides for a reduction of payments resulting from the use of breakpoints and whether those breakpoints are set at appropriate asset levels. In concluding that the benefits accruing to Management and its affiliates by virtue of their relationship to the Fund were reasonable in comparison with the costs of providing the investment advisory and other services and the benefits accruing to the Fund, the Board reviewed specific data as to Management's profit on the Fund for a recent period. The Board also carefully examined Management's cost allocation methodology. The Board recognized that Management should be entitled to earn a reasonable level of profits for services it provides to the Fund and, based on its review, concluded that Management's level of profitability was not excessive.
Conclusions
In approving the Agreements, the Board concluded that the terms of each Agreement are fair and reasonable and that approval of the Agreements is in the best interests of the Fund and its shareholders. In reaching this determination, the Board considered that Management and Neuberger could be expected to provide a high level of service to the Fund; that
32
it retained confidence in Management's and Neuberger's capabilities to manage the Fund; that the Fund's fee structure appeared to the Board to be reasonable given the nature and quality of services provided; and that the benefits accruing to Management and its affiliates by virtue of their relationship to the Fund were reasonable in comparison with the benefits accruing to the Fund.
33
Neuberger Berman
Advisers Management Trust
Mid Cap Intrinsic Value Portfolio
(Formerly Regency Portfolio)
I Class Shares
S Class Shares
Annual Report
December 31, 2012
B1012 02/13
Mid Cap Intrinsic Value Portfolio Commentary (Unaudited)The Neuberger Berman Advisers Management Trust (AMT) Mid Cap Intrinsic Value Portfolio Class I generated a 15.53% total return for the fiscal year ended December 31, 2012, but underperformed its benchmark, the Russell Midcap® Value Index, which returned 18.51% for the same period. Returns for the Portfolio's Class I and Class S shares are provided on page three.
The robust stock market that prevailed during 2012 was primarily driven by a combination of attractive equity valuations and the continuation of enormous liquidity provided by global monetary authorities, in our view. During the fourth quarter, in an unprecedented move, the Federal Reserve announced its intention to keep the federal funds rate near 0% as long as the unemployment rate remained above 6.5% and inflation remained below 2.5%. The Fed replaced "Operation Twist" with outright bond buying and agreed to pump approximately $1 trillion per year in liquidity into the domestic economy. The European Central Bank (ECB) has also committed to its bond buying program (Outright Monetary Transactions) and is expected to lower interest rates in the coming months. As a result of this easy monetary policy, bond yields are currently at extremely low levels and stocks have become very attractive. Stock valuations are currently appealing, selling at around 12-13 times forward earnings at the end of 2012. Additionally, corporate balance sheets are in excellent shape and we see corporations returning cash to shareholders through dividends and share repurchases.
Despite valuations that we found to be attractive, we remained conservatively positioned during the year due to the very difficult macroeconomic backdrop. Our conservative positioning and our contrarian focus, coupled with our underweight in the Financial Services sector and our overweight in the Consumer Discretionary sector, contributed to our underperformance versus the benchmark. Our contrarian value style hurt returns as stocks that were out of favor and that we own (e.g., Best Buy, Staples, Safeway) continued to decline despite what appeared to be significant discounts to our estimates of intrinsic value.1 Our underweight in the Utilities sector and our overweight in Producer Durables helped relative returns. The Portfolio also benefited from a number of strategic events that created value: Tyco split into three separate companies; Sunoco agreed to be acquired by Energy Transfer Partners; Corrections Corp. of America announced its intention to convert to a REIT; Constellation Brands agreed to buy the 50% of Crown Imports that it didn't own; BMC Software agreed to put representatives of activist investor Elliot Associates on the Board; and Symantec's board of directors announced the hiring of a new CEO who intends to focus on creating shareholder value. Despite underperforming the index, we are pleased with the solid absolute returns achieved during 2012.
Notwithstanding the enormous amount of liquidity being pumped into the economy, and very attractive valuations, we believe worldwide economies remain fragile and we continue to be in a deleveraging cycle. Domestic economic growth has slowed, Europe appears to be in a prolonged recession, and emerging markets' growth rates have come down. These circumstances could put pressure on corporate earnings, which may limit the upside in stocks. While the budget deal reached by Congress on New Year's Day addresses some of the revenue issues by raising taxes, the new deal does not address the debt ceiling, government spending and entitlement programs. It is imperative that Congress address these open items over the next few months, but it is hard to imagine a big budget deal being worked out in Washington. This could create concern with investors, businesses and consumers alike. It is our current view that, over time, a comprehensive budget deal would have to include raising taxes further (or instituting comprehensive tax reform) and reducing spending (especially in entitlement programs), which could create a headwind for growth—a negative for equities. Finally, while we think the ECB to date has done an excellent job in containing the European crisis, huge structural issues have yet to be resolved and stock markets will continue to be subjected to negative headline risk.
As we look toward 2013, we anticipate three major factors will drive returns. First, we believe that the liquidity being pumped into worldwide economies is very powerful and, given the relative attraction of equities as compared to fixed income, stocks could have an upward bias. Secondly, we believe the M&A market is now heating up. Given the current low growth environment, companies that are very strong financially could turn to acquisitions during the year to bolster their growth rates. Our cash-generating franchise companies that are selling at significant discounts to our estimate of intrinsic value are usually attractive candidates for this anticipated M&A activity. Third, we anticipate a continued recovery in the housing and auto sectors, which could contribute to a prolonged improvement in the domestic economy.
1
On the negative side, the deleveraging cycle may continue to play out and an anticipated slowdown in the federal government could create a headwind. Additionally, given sluggish worldwide growth rates, corporate earnings growth may be limited, which would, in our opinion, constrain the market's upside. With equity valuations in our Portfolio historically cheap, we currently believe the Portfolio has the potential to achieve favorable returns moving forward.
Sincerely,
MICHAEL C. GREENE
PORTFOLIO MANAGER
1 Intrinsic value reflects the team's analysis and estimates of a company's value. There is no guarantee that any intrinsic values will be realized; security prices may decrease regardless of intrinsic values.
Information about the principal risks of investing in the Portfolio is set forth in the prospectus and statement of additional information.
The portfolio composition, industries and holdings of the Portfolio are subject to change.
Opinions expressed are as of the date herein and are subject to change without notice. This material is not intended to be a formal research report and should not be construed as an offer to sell or the solicitation of an offer to buy any security.
2
Mid Cap Intrinsic Value Portfolio (Unaudited)
SECTOR ALLOCATION
| (as a % of Total Investments) | |
| Consumer Discretionary | | | 12.1 | % | |
| Consumer Staples | | | 6.8 | | |
| Energy | | | 3.3 | | |
| Financial Services | | | 15.0 | | |
| Health Care | | | 12.0 | | |
| Producer Durables | | | 25.3 | | |
| Technology | | | 13.2 | | |
| Utilities | | | 7.5 | | |
| Short-Term Investments | | | 4.8 | | |
| Total | | | 100.0 | % | |
PERFORMANCE HIGHLIGHTS
| | | Inception | | Average Annual Total Return Ended 12/31/2012 | |
| | | Date | | 1 Year | | 5 Years | | 10 Years | | Life of Fund | |
Mid Cap Intrinsic Value Portfolio Class I | | 08/22/2001 | | | 15.53 | % | | | 1.60 | % | | | 8.75 | % | | | 6.58 | % | |
Mid Cap Intrinsic Value Portfolio Class S2 | | 04/29/2005 | | | 15.37 | % | | | 1.39 | % | | | 8.59 | % | | | 6.44 | % | |
Russell Midcap® Value Index1,3 | | | | | | | 18.51 | % | | | 3.79 | % | | | 10.63 | % | | | 8.35 | % | |
Russell Midcap® Index1,3 | | | | | | | 17.28 | % | | | 3.57 | % | | | 10.65 | % | | | 7.87 | % | |
The performance data quoted represent past performance and do not indicate future results. Current performance may be lower or higher than the performance data quoted. For more current performance data, please visit www.nb.com.
The results shown in the table reflect the reinvestment of income dividends and other distributions, if any. The results do not reflect the effect of taxes a shareholder would pay on Portfolio distributions or on the redemption of Portfolio shares. The results do not reflect fees and expenses of the variable annuity and variable life insurance policies or the qualified pension and retirement plans whose proceeds are invested in the Portfolio.
The investment return and principal value of an investment will fluctuate and shares, when redeemed, may be worth more or less than their original cost.
Returns would have been lower if Neuberger Berman Management LLC ("Management") had not reimbursed certain expenses and/or waived a portion of the investment management fees during certain of the periods shown. Repayment by a class (of expenses previously reimbursed and/or fees previously waived by Management) will decrease the class's returns. Please see Note B in the Notes to Financial Statements for specific information regarding expense reimbursement and/or fee waiver arrangements.
COMPARISON OF A $10,000 INVESTMENT
This graph shows the change in value of a hypothetical $10,000 investment in the Portfolio over the past 10 fiscal years, or since the Portfolio's inception, if it has not operated for 10 years. The graph is based on Class I shares only; the performance of the Portfolio's share classes will differ primarily due to different class expenses (see Performance Highlights chart above). The result is compared with benchmarks, which include a broad-based market index and may include a more narrowly based index. Market indices have not been reduced to reflect any of the fees and costs of investing. The results shown in the graph reflect the reinvestment of income dividends and other distributions, if any. The results do not reflect the effect of taxes a shareholder would pay on Portfolio distributions or on the redemption of Portfolio shares. Results represent past performance and do not indicate future results.
Please see Endnotes for additional information.
3
Endnotes (Unaudited)
1 The date used to calculate Life of Fund performance for the index is the inception date of the oldest share class.
2 Performance shown prior to April 29, 2005 for Class S shares is that of Class I shares, which have lower expenses and correspondingly higher returns than Class S shares.
3 The Russell Midcap® Value Index measures the performance of those Russell Midcap® Index companies with lower price-to-book ratios and lower forecasted growth values. The Russell Midcap Index measures the performance of the 800 smallest companies in the Russell 1000® Index, which represents approximately 31% of the total market capitalization of the Russell 1000 Index (which, in turn, consists of the 1,000 largest U.S. companies, based on market capitalization). Please note that indices do not take into account any fees, expenses or tax consequences of investing in the individual securities that they track, and that individuals cannot invest directly in any index. Data about the performance of an index is prepared or obtained by Neuberger Berman Management LLC ("Management") and reflects the reinvestment of income dividends and other distributions, if any. The Portfolio may invest in securities not included in a described index and/or may not invest in all securities included in a described index.
Any ratios or other measurements using a factor of forecasted earnings of a company discussed herein are based on consensus estimates, not Management's own projections, and they may or may not be realized. In addition, any revision to a forecast could affect the market price of a security. By quoting them herein, Management does not offer an opinion as to the accuracy of and does not guarantee these forecasted numbers.
The investments for the Portfolio are managed by the same portfolio manager(s) who manage(s) one or more other registered funds that have names, investment objectives and investment styles that are similar to those of the Portfolio. You should be aware that the Portfolio is likely to differ from the other mutual fund(s) in size, cash flow pattern and tax matters. Accordingly, the holdings and performance of the Portfolio can be expected to vary from those of the other mutual fund(s).
Shares of the separate AMT Portfolios are not available to the general public. Shares of this Portfolio may be purchased only by life insurance companies to be used with their separate accounts that fund variable annuity and variable life insurance policies and by qualified pension and retirement plans.
Statistics and projections in this report are derived from sources deemed to be reliable but cannot be regarded as a representation of future results of the AMT Portfolios. This report is prepared for the general information of shareholders and is not an offer of shares of the AMT Portfolios. Shares of the AMT Portfolios are sold only through the currently effective prospectuses, which must precede or accompany this report.
The "Neuberger Berman" name and logo are registered service marks of Neuberger Berman Group LLC. "Neuberger Berman Management LLC" and the individual Fund name in this piece are either service marks or registered service marks of Neuberger Berman Management LLC.
© 2013 Neuberger Berman Management LLC distributor. All rights reserved.
4
Information About Your Fund's Expenses (Unaudited)
As a Fund shareholder, you incur two types of costs: (1) transaction costs such as fees and expenses that are, or may be, imposed under your variable contract or qualified pension plan; and (2) ongoing costs, including management fees; distribution and/or service (12b-1) fees (if applicable); and other Fund expenses. This example is intended to help you understand your ongoing costs (in dollars) of investing in the Fund and compare these costs with the ongoing costs of investing in other mutual funds.
This table is designed to provide information regarding costs related to your investments. The following examples are based on an investment of $1,000 made at the beginning of the six month period ended December 31, 2012 and held for the entire period. The table illustrates the Fund's costs in two ways:
| Actual Expenses and Performance: | | The first section of the table provides information about actual account values and actual expenses in dollars, based on the Fund's actual performance during the period. You may use the information in this line, together with the amount you invested, to estimate the expenses you paid over the period. Simply divide your account value by $1,000 (for example, an $8,600 account value divided by $1,000 = 8.6), then multiply the result by the number in the first section of the table under the heading entitled "Expenses Paid During the Period" to estimate the expenses you paid over the period. | |
Hypothetical Example for Comparison Purposes: | | The second section of the table provides information about hypothetical account values and hypothetical expenses based on the Fund's actual expense ratio and an assumed rate of return at 5% per year before expenses. This return is not the Fund's actual return. The hypothetical account values and expenses may not be used to estimate the actual ending account balance or expenses you paid for the period. You may use this information to compare the ongoing costs of investing in this Fund versus other funds. To do so, compare the expenses shown in this 5% hypothetical example with the 5% hypothetical examples that appear in the shareholder reports of other funds. | |
Please note that the expenses in the table are meant to highlight your ongoing costs only and do not include any transaction costs, such as fees and expenses that are, or may be imposed under your variable contract or qualified pension plan. Therefore, the information under the heading "Hypothetical (5% annual return before expenses)" is useful in comparing ongoing costs only, and will not help you determine the relative total costs of owning different funds. In addition, if these transaction costs were included, your costs would have been higher.
Expense Information as of 12/31/12
NEUBERGER BERMAN ADVISERS MANAGEMENT TRUST MID CAP INTRINSIC VALUE PORTFOLIO
| Actual | | Beginning Account Value 7/1/12 | | Ending Account Value 12/31/12 | | Expenses Paid During the Period* 7/1/12 – 12/31/12 | | Expense Ratio | |
| Class I | | $ | 1,000.00 | | | $ | 1,079.60 | | | $ | 5.59 | | | | 1.07 | % | |
| Class S | | $ | 1,000.00 | | | $ | 1,078.80 | | | $ | 6.53 | | | | 1.25 | % | |
| Hypothetical (5% annual return before expenses)** | |
| Class I | | $ | 1,000.00 | | | $ | 1,019.76 | | | $ | 5.43 | | | | 1.07 | % | |
| Class S | | $ | 1,000.00 | | | $ | 1,018.85 | | | $ | 6.34 | | | | 1.25 | % | |
* For each class, expenses are equal to the annualized expense ratio for the class, multiplied by the average account value over the period, multiplied by 184/366 (to reflect the one-half year period shown).
** Hypothetical 5% annual return before expenses is calculated by multiplying the number of days in the most recent half year divided by 366.
5
Schedule of Investments Mid Cap Intrinsic Value Portfolio
| NUMBER OF SHARES | | | | VALUE† | |
| Common Stocks (95.1%) | | | |
| Aerospace & Defense (5.1%) | | | |
| | 27,200 | | | General Dynamics Corp. | | $ | 1,884,144 | | |
| | 51,400 | | | Rockwell Collins, Inc. | | | 2,989,938 | | |
| | 75,000 | | | Spirit Aerosystems Holdings, Inc. Class A | | | 1,272,750 | * | |
| | | | 6,146,832 | | |
| Auto Components (1.2%) | | | |
| | 30,300 | | | Lear Corp. | | | 1,419,252 | | |
| Beverages (1.0%) | | | |
| | 33,600 | | | Constellation Brands, Inc. Class A | | | 1,189,104 | * | |
| Capital Markets (2.3%) | | | |
| | 60,200 | | | State Street Corp. | | | 2,830,002 | | |
| Commercial Banks (5.5%) | | | |
| | 57,900 | | | BankUnited, Inc. | | | 1,415,076 | | |
| | 52,800 | | | BB&T Corp. | | | 1,537,008 | | |
| | 53,400 | | | Comerica, Inc. | | | 1,620,156 | | |
| | 335,200 | | | Huntington Bancshares, Inc. | | | 2,141,928 | | |
| | | | 6,714,168 | | |
| Commercial Services & Supplies (14.7%) | | | |
| | 29,400 | | | ADT Corp. | | | 1,366,806 | | |
| | 98,900 | | | Avery Dennison Corp. | | | 3,453,588 | | |
| | 99,200 | | | Brink's Co. | | | 2,830,176 | | |
| | 89,700 | | | Corrections Corporation of America | | | 3,181,659 | | |
| | 139,500 | | | Covanta Holding Corp. | | | 2,569,590 | | |
| | 93,100 | | | Republic Services, Inc. | | | 2,730,623 | | |
| | 58,800 | | | Tyco International Ltd. | | | 1,719,900 | | |
| | | | 17,852,342 | | |
| Communications Equipment (2.5%) | | | |
| | 55,000 | | | Motorola Solutions, Inc. | | | 3,062,400 | | |
| Construction & Engineering (2.3%) | | | |
| | 94,400 | | | KBR, Inc. | | | 2,824,448 | | |
| Electric Utilities (3.5%) | | | |
| | 134,100 | | | NV Energy, Inc. | | | 2,432,574 | | |
| | 35,800 | | | Pinnacle West Capital Corp. | | | 1,825,084 | | |
| | | | 4,257,658 | | |
| NUMBER OF SHARES | | | | VALUE† | |
Electronic Equipment, Instruments & Components (3.3%) | | | |
| | 73,700 | | | Dolby Laboratories, Inc. Class A | | $ | 2,161,621 | | |
| | 294,300 | | | Flextronics International Ltd. | | | 1,827,603 | * | |
| | | | 3,989,224 | | |
| Energy Equipment & Services (1.8%) | | | |
| | 38,300 | | | Cameron International Corp. | | | 2,162,418 | * | |
| Food & Staples Retailing (5.8%) | | | |
| | 60,900 | | | CVS Caremark Corp. | | | 2,944,515 | | |
| | 230,200 | | | Safeway, Inc. | | | 4,164,318 | | |
| | | | 7,108,833 | | |
| Health Care Equipment & Supplies (4.4%) | | | |
| | 49,800 | | | Covidien PLC | | | 2,875,452 | | |
| | 37,500 | | | Zimmer Holdings, Inc. | | | 2,499,750 | | |
| | | | 5,375,202 | | |
| Health Care Providers & Services (5.4%) | | | |
| | 61,300 | | | Cardinal Health, Inc. | | | 2,524,334 | | |
| | 26,800 | | | Humana, Inc. | | | 1,839,284 | | |
| | 60,100 | | | Omnicare, Inc. | | | 2,169,610 | | |
| | | | 6,533,228 | | |
| Health Care Technology (0.1%) | | | |
| | 6,700 | | | Allscripts Healthcare Solutions, Inc. | | | 63,114 | * | |
| Hotels, Restaurants & Leisure (1.0%) | | | |
| | 23,500 | | | Wyndham Worldwide Corp. | | | 1,250,435 | | |
| IT Services (6.1%) | | | |
| | 80,300 | | | Amdocs Ltd. | | | 2,729,397 | | |
| | 72,600 | | | Fidelity National Information Services, Inc. | | | 2,527,206 | | |
| | 160,300 | | | Western Union Co. | | | 2,181,683 | | |
| | | | 7,438,286 | | |
| Machinery (3.2%) | | | |
| | 108,300 | | | ITT Corp. | | | 2,540,718 | | |
| | 61,500 | | | Navistar International Corp. | | | 1,338,855 | * | |
| | | | 3,879,573 | | |
| Media (3.4%) | | | |
| | 182,900 | | | Cablevision Systems Corp. Class A | | | 2,732,526 | | |
| | 38,300 | | | Virgin Media, Inc. | | | 1,407,525 | | |
| | | | 4,140,051 | | |
See Notes to Schedule of Investments
6
| NUMBER OF SHARES | | | | VALUE† | |
| Multi-Utilities (4.0%) | | | |
| | 114,000 | | | CenterPoint Energy, Inc. | | $ | 2,194,500 | | |
| | 37,000 | | | Sempra Energy | | | 2,624,780 | | |
| | | | 4,819,280 | | |
| Multiline Retail (1.7%) | | | |
| | 48,900 | | | Kohl's Corp. | | | 2,101,722 | | |
| Oil, Gas & Consumable Fuels (1.5%) | | | |
| | 16,638 | | | Energy Transfer Partners L.P. | | | 714,269 | | |
| | 33,400 | | | Southwestern Energy Co. | | | 1,115,894 | * | |
| | | | 1,830,163 | | |
| Pharmaceuticals (2.1%) | | | |
| | 81,600 | | | Hospira, Inc. | | | 2,549,184 | * | |
| Real Estate Investment Trusts (1.3%) | | | |
| | 67,500 | | | Starwood Property Trust, Inc. | | | 1,549,800 | | |
| Software (5.2%) | | | |
| | 48,000 | | | BMC Software, Inc. | | | 1,903,680 | * | |
| | 58,600 | | | Nuance Communications, Inc. | | | 1,307,952 | * | |
| | 163,200 | | | Symantec Corp. | | | 3,069,792 | * | |
| | | | 6,281,424 | | |
| Specialty Retail (4.8%) | | | |
| | 152,800 | | | Best Buy Co., Inc. | | | 1,810,680 | | |
| | 105,300 | | | Express, Inc. | | | 1,588,977 | * | |
| | 213,400 | | | Staples, Inc. | | | 2,432,760 | | |
| | | | 5,832,417 | | |
| Thrifts & Mortgage Finance (1.9%) | | | |
| | 195,900 | | | People's United Financial, Inc. | | | 2,368,431 | | |
| | | | | Total Common Stocks (Cost $105,549,559) | | | 115,568,991 | | |
| Short-Term Investments (4.8%) | | | |
| | 5,813,684 | | | State Street Institutional Liquid Reserves Fund Institutional Class (Cost $5,813,684) | | | 5,813,684 | | |
| | | | | Total Investments (99.9%) (Cost $111,363,243) | | | 121,382,675 | ## | |
| | | | | Cash, receivables and other assets, less liabilities (0.1%) | | | 103,315 | | |
| | | | | Total Net Assets (100.0%) | | $ | 121,485,990 | | |
See Notes to Schedule of Investments
7
Notes to Schedule of Investments Mid Cap Intrinsic
Value Portfolio
† In accordance with Accounting Standards Codification ("ASC") 820 "Fair Value Measurements and Disclosures" ("ASC 820"), all investments held by Neuberger Berman Advisers Management Trust Mid Cap Intrinsic Value Portfolio (the "Fund") are carried at the value that Neuberger Berman Management LLC ("Management") believes the Fund would receive upon selling an investment in an orderly transaction to an independent buyer in the principal or most advantageous market for the investment under current market conditions. Various inputs, including the volume and level of activity for the asset or liability in the market, are considered in valuing the Fund's investments, some of which are discussed below. Significant management judgment may be necessary to value investments in accordance with ASC 820.
ASC 820 established a three-tier hierarchy of inputs to create a classification of value measurements for disclosure purposes. The three-tier hierarchy of inputs is summarized in the three broad Levels listed below.
• Level 1 – quoted prices in active markets for identical investments
• Level 2 – other significant observable inputs (including quoted prices for similar investments, interest rates, prepayment speeds, credit risk, amortized cost, etc.)
• Level 3 – significant unobservable inputs (including the Fund's own assumptions in determining the fair value of investments)
The inputs or methodology used for valuing an investment are not necessarily an indication of the risk associated with investing in those securities.
The value of the Fund's investments in equity securities and exchange traded funds, for which market quotations are readily available, is generally determined by Management by obtaining valuations from an independent pricing service based on the latest sale price quoted on a principal exchange or market for that security (Level 1 inputs). Securities traded primarily on the NASDAQ Stock Market are normally valued by the Fund at the NASDAQ Official Closing Price ("NOCP") provided by NASDAQ each business day. The NOCP is the most recently reported price as of 4:00:02 p.m., Eastern time, unless that price is outside the range of the "inside" bid and asked prices (i.e., the bid and asked prices that dealers quote to each other when trading for their own accounts); in that case, NASDAQ will adjust the price to equal the inside bid or asked price, whichever is closer. Because of delays in reporting trades, the NOCP may not be based on the price of the last trade to occur before the market closes. If there is no reported sale of a security on a particular day, the independent pricing service may value the security based on reported market quotations.
Management has developed a process to periodically review information provided by independent pricing services for all types of securities.
Investments in State Street Institutional Liquid Reserves Fund Institutional Class are valued using the fund's daily calculated net asset value per share (Level 2 inputs).
If a valuation is not available from an independent pricing service, or if Management has reason to believe that the valuation received does not represent the amount the Fund might reasonably expect to receive on a current sale in an orderly transaction, the Fund seeks to obtain quotations from principal market makers (generally considered Level 3 inputs). If such quotations are not readily available, the security is valued using methods the Neuberger Berman Advisers Management Trust's Board of Trustees (the "Board") has approved on the belief that they reflect fair value. Numerous factors may be considered when determining the fair value of a security based on Level 2 or 3 inputs, including available analyst, media or other reports, trading in futures or ADRs and whether the issuer of the security being fair valued has other securities outstanding.
The value of the Fund's investments in foreign securities is generally determined using the same valuation methods and inputs as other Fund investments, as discussed above. Foreign security prices expressed in local currency values are translated from the local currency into U.S. dollars using the exchange rates as of 4:00 p.m.,
See Notes to Financial Statements
8
Notes to Schedule of Investments Mid Cap Intrinsic
Value Portfolio (cont'd)
Eastern time. The Board has approved the use of Interactive Data Pricing and Reference Data, Inc. ("Interactive") to assist in determining the fair value of foreign equity securities when changes in the value of a certain index suggest that the closing prices on the foreign exchanges may no longer represent the amount that the Fund could expect to receive for those securities or on days when foreign markets are closed and U.S. markets are open. In each of these events, Interactive will provide adjusted prices for certain foreign equity securities using a statistical analysis of historical correlations of multiple factors (Level 2 inputs). In the absence of precise information about the market values of these foreign securities as of the close of the New York Stock Exchange, the Board has determined on the basis of available data that prices adjusted in this way are likely to be closer to the prices the Fund could realize on a current sale than are the prices of those securities established at the close of the foreign markets in which the securities primarily trade.
Fair value prices are necessarily estimates, and there is no assurance that such a price will be at or close to the price at which the security is next quoted or next trades.
The following is a summary, categorized by Level, of inputs used to value the Fund's investments as of December 31, 2012:
| Asset Valuation Inputs | | Level 1 | | Level 2 | | Level 3 | | Total | |
| Investments: | |
| Common Stocks^ | | $ | 115,568,991 | | | $ | — | | | $ | — | | | $ | 115,568,991 | | |
| Short-Term Investments | | | — | | | | 5,813,684 | | | | — | | | | 5,813,684 | | |
| Total Investments | | $ | 115,568,991 | | | $ | 5,813,684 | | | $ | — | | | $ | 121,382,675 | | |
^ The Schedule of Investments provides information on the industry categorization for the portfolio.
The Fund had no transfers between Levels 1 and 2 during the year ended December 31, 2012.
## At December 31, 2012, the cost of investments for U.S. federal income tax purposes was $111,389,350. Gross unrealized appreciation of investments was $15,972,447 and gross unrealized depreciation of investments was $5,979,122, resulting in net unrealized appreciation of $9,993,325, based on cost for U.S. federal income tax purposes.
* Security did not produce income during the last twelve months.
See Notes to Financial Statements
9
Statement of Assets and Liabilities
Neuberger Berman Advisers Management Trust
| | | MID CAP INTRINSIC VALUE PORTFOLIO | |
| | | December 31, 2012 | |
| Assets | |
| Investments in securities, at value* (Note A)—see Schedule of Investments: | |
| Unaffiliated issuers | | $ | 121,382,675 | | |
| Dividends and interest receivable | | | 172,570 | | |
| Receivable for Fund shares sold | | | 331,205 | | |
| Prepaid expenses and other assets | | | 827 | | |
| Total Assets | | | 121,887,277 | | |
| Liabilities | |
| Payable for Fund shares redeemed | | | 231,472 | | |
| Payable to investment manager (Note B) | | | 56,127 | | |
| Payable to administrator—net (Note B) | | | 41,457 | | |
| Accrued expenses and other payables | | | 72,231 | | |
| Total Liabilities | | | 401,287 | | |
| Net Assets | | $ | 121,485,990 | | |
| Net Assets consist of: | |
| Paid-in capital | | $ | 145,918,221 | | |
| Undistributed net investment income (loss) | | | 1,448,230 | | |
| Accumulated net realized gains (losses) on investments | | | (35,899,893 | ) | |
| Net unrealized appreciation (depreciation) in value of investments | | | 10,019,432 | | |
| Net Assets | | $ | 121,485,990 | | |
| Net Assets | |
| Class I | | $ | 67,965,341 | | |
| Class S | | | 53,520,649 | | |
| Shares Outstanding ($.001 par value; unlimited shares authorized) | |
| Class I | | | 5,620,820 | | |
| Class S | | | 3,985,482 | | |
| Net Asset Value, offering and redemption price per share | |
| Class I | | $ | 12.09 | | |
| Class S | | | 13.43 | | |
| *Cost of Investments | | $ | 111,363,243 | | |
See Notes to Financial Statements
10
Statement of Operations
Neuberger Berman Advisers Management Trust
| | | MID CAP INTRINSIC VALUE PORTFOLIO | |
| | | For the Year Ended December 31, 2012 | |
| Investment Income: | |
| Income (Note A): | |
| Dividend income—unaffiliated issuers | | $ | 2,890,917 | | |
| Interest income—unaffiliated issuers | | | 4,292 | | |
| Foreign taxes withheld | | | (13,724 | ) | |
| Total income | | $ | 2,881,485 | | |
| Expenses: | |
| Investment management fees (Note B) | | | 677,685 | | |
| Administration fees (Note B): | |
| Class I | | | 208,232 | | |
| Class S | | | 161,414 | | |
| Distribution fees (Note B): | |
| Class S | | | 134,512 | | |
| Audit fees | | | 43,535 | | |
| Custodian fees | | | 54,470 | | |
| Insurance expense | | | 9,458 | | |
| Legal fees | | | 62,292 | | |
| Shareholder reports | | | 41,324 | | |
| Trustees' fees and expenses | | | 50,877 | | |
| Miscellaneous | | | 6,335 | | |
| Total expenses | | | 1,450,134 | | |
| Expenses reimbursed by Management (Note B) | | | (36,201 | ) | |
| Expenses reduced by custodian fee expense offset arrangement (Note A) | | | (19 | ) | |
| Total net expenses | | | 1,413,914 | | |
| Net investment income (loss) | | $ | 1,467,571 | | |
| Realized and Unrealized Gain (Loss) on Investments (Note A): | |
| Net realized gain (loss) on: | |
| Sales of investment securities of unaffiliated issuers | | | 8,362,432 | | |
| Change in net unrealized appreciation (depreciation) in value of: | |
| Unaffiliated investment securities | | | 8,026,866 | | |
| Net gain (loss) on investments | | | 16,389,298 | | |
| Net increase (decrease) in net assets resulting from operations | | $ | 17,856,869 | | |
See Notes to Financial Statements
11
Statements of Changes in Net Assets
Neuberger Berman Advisers Management Trust
| | | MID CAP INTRINSIC VALUE PORTFOLIO | |
| | | Year Ended December 31, 2012 | | Year Ended December 31, 2011 | |
| Increase (Decrease) in Net Assets: | |
| From Operations (Note A): | |
| Net investment income (loss) | | $ | 1,467,571 | | | $ | 620,133 | | |
| Net realized gain (loss) on investments | | | 8,362,432 | | | | 50,071,971 | | |
| Change in net unrealized appreciation (depreciation) of investments | | | 8,026,866 | | | | (56,616,746 | ) | |
| Net increase (decrease) in net assets resulting from operations | | | 17,856,869 | | | | (5,924,642 | ) | |
| Distributions to Shareholders From (Note A): | |
| Net investment income: | |
| Class I | | | (410,743 | ) | | | (495,806 | ) | |
| Class S | | | (193,942 | ) | | | (233,831 | ) | |
| Net realized gain on investments: | |
| Class I | | | (17,680,175 | ) | | | — | | |
| Class S | | | (12,932,617 | ) | | | — | | |
| Total distributions to shareholders | | | (31,217,477 | ) | | | (729,637 | ) | |
| From Fund Share Transactions (Note D): | |
| Proceeds from shares sold: | |
| Class I | | | 5,251,795 | | | | 9,740,700 | | |
| Class S | | | 4,534,614 | | | | 11,448,964 | | |
| Proceeds from reinvestment of dividends and distributions: | |
| Class I | | | 18,090,918 | | | | 495,806 | | |
| Class S | | | 13,126,559 | | | | 233,831 | | |
| Payments for shares redeemed: | |
| Class I | | | (17,388,041 | ) | | | (71,547,917 | ) | |
| Class S | | | (13,971,174 | ) | | | (15,624,875 | ) | |
| Net increase (decrease) from Fund share transactions | | | 9,644,671 | | | | (65,253,491 | ) | |
| Net Increase (Decrease) in Net Assets | | | (3,715,937 | ) | | | (71,907,770 | ) | |
| Net Assets: | |
| Beginning of year | | | 125,201,927 | | | | 197,109,697 | | |
| End of year | | $ | 121,485,990 | | | $ | 125,201,927 | | |
| Undistributed net investment income (loss) at end of year | | $ | 1,448,230 | | | $ | 604,304 | | |
See Notes to Financial Statements
12
Notes to Financial Statements Mid Cap Intrinsic Value Portfolio
Note A—Summary of Significant Accounting Policies:
1 General: Neuberger Berman Advisers Management Trust (the "Trust") is a Delaware statutory trust organized pursuant to a Trust Instrument dated May 23, 1994. The Trust is currently comprised of ten separate operating series (each individually a "Series," and collectively the "Funds") each of which is diversified. The Trust is registered as an open-end management investment company under the Investment Company Act of 1940, as amended (the "1940 Act"), and its shares are registered under the Securities Act of 1933, as amended. The Fund currently offers Class I and Class S shares. The Board may establish additional series or classes of shares without the approval of shareholders.
The assets of each Series belong only to that Series, and the liabilities of each Series are borne solely by that Series and no other.
The preparation of financial statements in accordance with U.S. generally accepted accounting principles ("GAAP") requires Management to make estimates and assumptions at the date of the financial statements. Actual results could differ from those estimates.
2 Portfolio valuation: Investment securities are valued as indicated in the notes following the Schedule of Investments.
3 Foreign currency translation: The accounting records of the Fund are maintained in U.S. dollars. Foreign currency amounts are translated into U.S. dollars using the exchange rate as of 4:00 p.m., Eastern time, to determine the value of investments, other assets and liabilities. Purchase and sale prices of securities, and income and expenses, are translated into U.S. dollars at the prevailing rate of exchange on the respective dates of such transactions. Net unrealized foreign currency gain (loss), if any, arises from changes in the value of assets and liabilities, other than investments in securities, as a result of changes in exchange rates and is stated separately in the Statement of Operations.
4 Securities transactions and investment income: Securities transactions are recorded on trade date for financial reporting purposes. Dividend income is recorded on the ex-dividend date or, for certain foreign dividends, as soon as the Fund becomes aware of the dividends. Non-cash dividends included in dividend income, if any, are recorded at the fair market value of the securities received. Interest income, including accretion of original issue discount, where applicable, and accretion of discount on short-term investments, if any, is recorded on the accrual basis. Realized gains and losses from securities transactions and foreign currency transactions, if any, are recorded on the basis of identified cost and stated separately in the Statement of Operations. Included in net realized gain (loss) on investments are proceeds from the settlements of class action litigation in which the Fund participated as a class member. The amount of such proceeds for the year ended December 31, 2012 was $5,564.
5 Income tax information: The Funds are treated as separate entities for U.S. federal income tax purposes. It is the policy of the Fund to continue to qualify for treatment as a regulated investment company by complying with the requirements of the U.S. Internal Revenue Code applicable to regulated investment companies and to distribute substantially all of its net investment income and net realized capital gains to its shareholders. To the extent the Fund distributes substantially all of its net investment income and net realized capital gains to shareholders, no federal income or excise tax provision is required.
The Fund has adopted the provisions of ASC 740 "Income Taxes" ("ASC 740"). ASC 740 sets forth a minimum threshold for financial statement recognition of a tax position taken, or expected to be taken, in a tax return. The Fund recognizes interest and penalties, if any, related to unrecognized tax positions as an income tax expense in the Statement of Operations. The Fund is subject to examination by U.S. federal and state tax authorities for returns filed for the prior three fiscal years 2009 - 2011. As of December 31, 2012, the Fund did not have any unrecognized tax positions.
13
Income distributions and capital gain distributions are determined in accordance with income tax regulations, which may differ from GAAP. These differences are primarily due to differing treatments of income and gains on various investment securities held by the Fund, timing differences and differing characterization of distributions made by the Fund. The Fund may also utilize earnings and profits distributed to shareholders on redemption of shares as a part of the dividends-paid deduction for income tax purposes.
As determined on December 31, 2012, permanent differences resulting primarily from different book and tax accounting were reclassified at year end. Such differences are attributed to non-taxable dividend adjustments to income. These reclassifications had no effect on net income, net asset value ("NAV") or NAV per share of the Fund. For the year ended December 31, 2012, the Fund recorded the following permanent reclassifications:
| Paid-in Capital | | Undistributed Net Investment Income (Loss) | | Accumulated Net Realized Gains (Losses) on Investments | |
| $ | — | | | $ | (18,960 | ) | | $ | 18,960 | | |
For tax purposes, distributions of short-term gains are taxable to shareholders as ordinary income.
The tax character of distributions paid during the years ended December 31, 2012 and December 31, 2011 was as follows:
| | | Distributions Paid From: | | | |
| Ordinary Income | | Long-Term Capital Gain | | Total | |
| 2012 | | 2011 | | 2012 | | 2011 | | 2012 | | 2011 | |
| $ | 604,685 | | | $ | 729,637 | | | $ | 30,612,792 | | | $ | — | | | $ | 31,217,477 | | | $ | 729,637 | | |
As of December 31, 2012, components of distributable earnings (accumulated losses) on a U.S. federal income tax basis were as follows:
Undistributed Ordinary Income | | Undistributed Long-Term Gain | | Unrealized Appreciation (Depreciation) | | Loss Carryforwards and Deferrals | | Other Temporary Differences | | Total | |
| $ | 1,448,230 | | | $ | — | | | $ | 9,993,325 | | | $ | (35,873,786 | ) | | $ | — | | | $ | (24,432,231 | ) | |
The difference between book basis and tax basis distributable earnings are primarily due to: timing differences of wash sales and capital loss carryforwards.
To the extent the Fund's net realized capital gains, if any, can be offset by capital loss carryforwards, it is the policy of the Fund not to distribute such gains. The Regulated Investment Company ("RIC") Modernization Act of 2010 (the "Act") became effective for the Fund on January 1, 2011. The Act modernizes several of the federal income and excise tax provisions related to RICs. Among the changes made are changes to the capital loss carryforward rules allowing for RICs to carry forward capital losses indefinitely and to retain the character of capital loss carryforwards as short-term or long-term ("Post-Enactment"). Rules in effect previously limited the carryforward period to eight years and all carryforwards were considered short-term in character ("Pre-Enactment"). As determined at December 31, 2012, the Fund had unused capital loss carryforwards available for federal income tax purposes to offset net realized capital gains, if any, as follows:
| | | Pre-Enactment | |
| | | Expiring in: 2017 | |
| | | | | $ | 35,873,786 | | |
14
Post-Enactment capital loss carryforwards must be fully used before Pre-Enactment capital loss carryforwards; therefore, under certain circumstances, Pre-Enactment capital loss carryforwards available as of the report date may expire unused. As of December 31, 2012, the Fund had no Post-Enactment capital loss carryforwards.
Under current tax law, the use of these losses to offset future gains may be limited.
During the year ended December 31, 2012, the Fund utilized capital loss carryforwards of $8,385,896.
6 Distributions to shareholders: The Fund may earn income, net of expenses, daily on its investments. Distributions from net investment income and net realized capital gains, if any, generally are distributed once a year (usually in October). Income distributions and capital gain distributions to shareholders are recorded on the ex-date.
It is the policy of the Fund to pass through to its shareholders substantially all REIT distributions and other income it receives, less operating expenses. The distributions the Fund receives from REITs are generally composed of income, capital gains, and/or return of REIT capital, but the REITs do not report this information to the Fund until the following calendar year. At December 31, 2012, the Fund estimated these amounts within the financial statements since the information is not available from the REITs until after the Fund's fiscal year-end. For the year ended December 31, 2012, the character of distributions paid to shareholders disclosed within the Statements of Changes in Net Assets is based on estimates made at that time. All estimates are based upon REIT information sources available to the Fund together with actual IRS Forms 1099DIV received to date. Based on past experience it is possible that a portion of the Fund's distributions during the current fiscal year will be considered tax return of capital, but the actual amount of the tax return of capital, if any, is not determinable until after the Fund's fiscal year-end. After calendar year-end, when the Fund learns the nature of the distributions paid by REITs during that year, distributions previously identified as income are often re-characterized as return of capital and/or capital gain. After all applicable REITs have informed the Fund of the actual breakdown of distributions paid to the Fund during its fiscal year, estimates previously recorded are adjusted on the books of the Fund to reflect actual results. As a result, the composition of the Fund's distributions as reported herein may differ from the final composition determined after calendar year-end and reported to Fund shareholders on IRS Form 1099DIV.
7 Foreign taxes: Foreign taxes withheld represent amounts withheld by foreign tax authorities, net of refunds recoverable.
8 Expense allocation: Certain expenses are applicable to multiple funds. Expenses directly attributable to a Series are charged to that Series. Expenses of the Trust that are not directly attributable to a particular series of the Trust (e.g., the Fund) are allocated among the series of the Trust, on the basis of relative net assets, except where a more appropriate allocation of expenses to each of the series can otherwise be made fairly. Expenses borne by the complex of related investment companies, which includes open-end and closed-end investment companies for which Management serves as investment manager, that are not directly attributable to a particular investment company in the complex (e.g., the Trust) or series thereof are allocated among the investment companies in the complex or series thereof, on the basis of relative net assets, except where a more appropriate allocation of expenses to each of the investment companies in the complex or series thereof can otherwise be made fairly. The Fund's expenses (other than those specific to each class) are allocated proportionally each day between the classes based upon the relative net assets of each class.
9 Investments in foreign securities: Investing in foreign securities may involve certain sovereign and other risks, in addition to the credit and market risks normally associated with domestic securities. These additional risks include the possibility of adverse political and economic developments (including political instability, nationalization, expropriation, or confiscatory taxation) and the potentially adverse effects of unavailability of public information regarding issuers, less governmental supervision and regulation of financial markets, reduced liquidity of certain financial markets, and the lack of uniform accounting, auditing, and financial reporting standards or the application of standards that are different or less stringent than those applied in the United States. Foreign securities also may experience greater price volatility, higher rates of inflation, and delays in settlement.
15
10 Indemnifications: Like many other companies, the Trust's organizational documents provide that its officers and trustees are indemnified against certain liabilities arising out of the performance of their duties to the Trust. In addition, both in some of its principal service contracts and in the normal course of its business, the Trust enters into contracts that provide indemnifications to other parties for certain types of losses or liabilities. The Trust's maximum exposure under these arrangements is unknown as this could involve future claims against the Trust.
11 Expense offset arrangement: The Fund has an expense offset arrangement in connection with its custodian contract. For the year ended December 31, 2012, the impact of this arrangement was a reduction of expenses of $19.
12 Other: All net investment income and realized and unrealized capital gains and losses of the Fund are allocated, on the basis of relative net assets, pro rata among its respective classes.
Note B—Management Fees, Administration Fees, Distribution Arrangements, and Other Transactions with Affiliates:
Fund shares are issued and redeemed in connection with investments in and payments under certain variable annuity contracts and variable life insurance policies issued through separate accounts of life insurance companies and are also offered directly to certain qualified pension and retirement plans.
The Fund retains Management as its investment manager under a Management Agreement. For such investment management services, the Fund pays Management a fee at the annual rate of 0.55% of the first $250 million of the Fund's average daily net assets, 0.525% of the next $250 million, 0.50% of the next $250 million, 0.475% of the next $250 million, 0.45% of the next $500 million, 0.425% of the next $2.5 billion, and 0.40% of average daily net assets in excess of $4 billion. Accordingly, for the year ended December 31, 2012, the management fee pursuant to the Management Agreement was equivalent to an annual effective rate of 0.55% of the Fund's average daily net assets.
The Fund retains Management as its administrator under an Administration Agreement. Each class pays Management an administration fee at the annual rate of 0.30% of its average daily net assets under this agreement. Additionally, Management retains State Street Bank and Trust Company ("State Street") as its sub-administrator under a Sub-Administration Agreement. Management pays State Street a fee for all services received under this agreement.
The Board adopted a non-fee distribution plan for the Fund's Class I.
For the Fund's Class S, Management acts as agent in arranging for the sale of class shares without commission and bears advertising and promotion expenses. The Board has adopted a distribution plan (the "Plan") with respect to this class, pursuant to Rule 12b-1 under the 1940 Act. The Plan provides that, as compensation for administrative and other services provided to this class, Management's activities and expenses related to the sale and distribution of this class of shares, and ongoing services provided to investors in this class, Management receives from this class a fee at the annual rate of 0.25% of Class S's average daily net assets. Management receives this amount to provide distribution and shareholder servicing for this class and pays a portion of it to institutions that provide such services. Those institutions may use the payments for, among other purposes, compensating employees engaged in sales and/or shareholder servicing. The amount of fees paid by this class during any year may be more or less than the cost of distribution and other services provided to this class. FINRA rules limit the amount of annual distribution fees that may be paid by a mutual fund and impose a ceiling on the cumulative distribution fees paid. The Trust's Plan complies with those rules.
Management has contractually undertaken to waive current payment of fees and/or reimburse the Fund's Class I and Class S shares for their operating expenses (including fees payable to Management but excluding interest,
16
taxes, brokerage commissions, extraordinary expenses, transaction costs and dividend expense on short sales, if any) ("Operating Expenses") which exceed the expense limitation as detailed in the following table:
| | | Expense Limitation(1) | | Expiration | | Reimbursement from Management for the Year Ended December 31, 2012 | |
| Class I | | | 1.50 | % | | 12/31/15 | | $ | — | | |
| Class S | | | 1.25 | % | | 12/31/20 | | | 36,201 | | |
(1) Expense limitation per annum of the respective class' average daily net assets.
Each respective class has agreed to repay Management for fees and expenses waived and/or its excess Operating Expenses previously reimbursed by Management, so long as its annual Operating Expenses during that period do not exceed its expense limitation in place at the time the fees and expenses were waived or reimbursed, and the repayment is made within three years after the year in which Management issued the reimbursement or waived fees. During the year ended December 31, 2012, there was no repayment to Management under its contractual expense limitation. At December 31, 2012, the Fund's Class I shares had no contingent liability to Management under its contractual expense limitation. At December 31, 2012, the Fund's Class S shares contingent liabilities to Management under its contractual expense limitation were as follows:
| | | Expiring in: | | | |
| | | 2013 | | 2014 | | 2015 | | Total | |
| Class S | | $ | 31,454 | | | $ | 41,438 | | | $ | 36,201 | | | $ | 109,093 | | |
Neuberger Berman LLC ("Neuberger") is retained by Management to furnish it with investment recommendations and research information without added cost to the Fund. Several individuals who are officers and/or trustees of the Trust are also employees of Neuberger and/or Management.
Management and Neuberger are indirect subsidiaries of Neuberger Berman Group LLC (("NBG") and together with its consolidated subsidiaries ("NB Group")). NBSH Acquisition, LLC ("NBSH"), which is owned by portfolio managers, members of the NB Group management team and certain of NB Group's key employees and senior professionals, owns, as of September 30, 2012, approximately 57% of NBG's common units, and Lehman Brothers Holdings Inc. ("LBHI") and certain of its subsidiaries (collectively the "LBHI Parties") own the remaining 43% of such common units. Pursuant to agreements among NBG, NBSH and the LBHI Parties, NBG is entitled to acquire the remaining Class A common units through a process that is expected to end in 2017. In April 2012, NBG exercised its option (the "Redemption Agreement Option") to redeem during 2012 certain of its Class A common units held by the LBHI Parties equal to 10% of NBG's aggregate common units issued and outstanding as of March 16, 2012. The final payment for such Class A common units is due within thirty (30) days of December 31, 2012.
Note C—Securities Transactions:
During the year ended December 31, 2012, there were purchase and sale transactions (excluding short-term securities) of $35,465,537 and $52,933,254, respectively.
During the year ended December 31, 2012, no brokerage commissions on securities transactions were paid to affiliated brokers.
17
Note D—Fund Share Transactions:
Share activity for the years ended December 31, 2012 and December 31, 2011 was as follows:
For the Year Ended December 31, 2012
| | | Shares Sold | | Shares Issued on Reinvestment of Dividends and Distributions | | Shares Redeemed | | Total | |
| Class I | | | 374,927 | | | | 1,530,534 | | | | (1,196,050 | ) | | | 709,411 | | |
| Class S | | | 289,590 | | | | 999,738 | | | | (884,415 | ) | | | 404,913 | | |
For the Year Ended December 31, 2011
| | | Shares Sold | | Shares Issued on Reinvestment of Dividends and Distributions | | Shares Redeemed | | Total | |
| Class I | | | 632,083 | | | | 36,296 | | | | (4,520,876 | ) | | | (3,852,497 | ) | |
| Class S | | | 736,152 | | | | 15,821 | | | | (941,055 | ) | | | (189,082 | ) | |
Note E—Line of Credit:
At December 31, 2012, the Fund was a participant in a single committed, unsecured $200,000,000 line of credit with State Street, to be used only for temporary or emergency purposes. Other investment companies managed by Management also participate in this line of credit on the same terms. Interest is charged on borrowings under this line of credit at the higher of (a) the Federal Funds Rate plus 1.25% per annum or (b) the Overnight LIBOR Rate plus 1.25% per annum. A commitment fee of 0.10% per annum of the available line of credit is charged, of which each participating Fund has agreed to pay its pro rata share, based on the ratio of its individual net assets to the net assets of all participants at the time the fee is due and payable. The fee is paid quarterly in arrears. Because several mutual funds participate, there is no assurance that an individual Fund will have access to all or any part of the $200,000,000 at any particular time. There were no loans outstanding pursuant to this line of credit at December 31, 2012. During the year ended December 31, 2012, the Fund did not utilize this line of credit.
Note F—Recent Accounting Pronouncement:
In December 2011, the Financial Accounting Standards Board issued Accounting Standards Update 2011-11 Disclosures about Offsetting Assets and Liabilities ("ASU 2011-11"). Effective for annual reporting periods beginning on or after January 1, 2013 and interim periods within those annual periods, ASU 2011-11 is intended to enhance disclosure requirements on the offsetting of financial assets and liabilities. At this time, Management is evaluating the implications of ASU 2011-11 and its impact on the financial statements.
18
Financial Highlights
Mid Cap Intrinsic Value Portfolio
The following tables include selected data for a share outstanding throughout each year and other performance information derived from the Financial Statements. Per share amounts that round to less than $.01 or $(.01) per share are presented as $.00 or $(.00), respectively.
| Class I | |
| | | Year Ended December 31, | |
| | | 2012 | | 2011 | | 2010 | | 2009 | | 2008 | |
| Net Asset Value, Beginning of Year | | $ | 14.26 | | | $ | 15.36 | | | $ | 12.26 | | | $ | 8.60 | | | $ | 16.23 | | |
| Income From Investment Operations: | |
Net Investment Income (Loss)‡ | | | .18 | | | | .06 | | | | .07 | | | | .07 | | | | .10 | | |
Net Gains or Losses on Securities (both realized and unrealized) | | | 1.94 | | | | (1.06 | ) | | | 3.13 | | | | 3.93 | | | | (7.53 | ) | |
| Total From Investment Operations | | | 2.12 | | | | (1.00 | ) | | | 3.20 | | | | 4.00 | | | | (7.43 | ) | |
| Less Distributions From: | |
| Net Investment Income | | | (.10 | ) | | | (.10 | ) | | | (.10 | ) | | | (.18 | ) | | | (.17 | ) | |
| Net Capital Gains | | | (4.19 | ) | | | — | | | | — | | | | (.16 | ) | | | (.03 | ) | |
| Total Distributions | | | (4.29 | ) | | | (.10 | ) | | | (.10 | ) | | | (.34 | ) | | | (.20 | ) | |
| Net Asset Value, End of Year | | $ | 12.09 | | | $ | 14.26 | | | $ | 15.36 | | | $ | 12.26 | | | $ | 8.60 | | |
Total Return†† | | | 15.53 | % | | | (6.50 | )% | | | 26.18 | % | | | 46.56 | % | | | (45.82 | )% | |
| Ratios/Supplemental Data | |
| Net Assets, End of Year (in millions) | | $ | 68.0 | | | $ | 70.0 | | | $ | 134.6 | | | $ | 86.1 | | | $ | 74.8 | | |
Ratio of Gross Expenses to Average Net Assets# | | | 1.07 | % | | | 1.07 | % | | | 1.06 | % | | | 1.06 | % | | | .96 | % | |
Ratio of Net Expenses to Average Net Assets§ | | | 1.07 | % | | | 1.07 | % | | | 1.06 | % | | | 1.06 | % | | | .96 | % | |
Ratio of Net Investment Income (Loss) to Average Net Assets | | | 1.27 | % | | | .42 | % | | | .54 | % | | | .67 | % | | | .76 | % | |
| Portfolio Turnover Rate | | | 29 | % | | | 95 | % | | | 39 | % | | | 51 | % | | | 66 | % | |
See Notes to Financial Highlights
19
Financial Highlights (cont'd)
| Class S | |
| | | Year Ended December 31, | |
| | | 2012 | | 2011 | | 2010 | | 2009 | | 2008 | |
| Net Asset Value, Beginning of Year | | $ | 15.41 | | | $ | 16.59 | | | $ | 13.21 | | | $ | 9.22 | | | $ | 17.37 | | |
| Income From Investment Operations: | |
Net Investment Income (Loss)‡ | | | .17 | | | | .05 | | | | .04 | | | | .06 | | | | .08 | | |
Net Gains or Losses on Securities (both realized and unrealized) | | | 2.10 | | | | (1.16 | ) | | | 3.39 | | | | 4.20 | | | | (8.06 | ) | |
| Total From Investment Operations | | | 2.27 | | | | (1.11 | ) | | | 3.43 | | | | 4.26 | | | | (7.98 | ) | |
| Less Distributions From: | |
| Net Investment Income | | | (.06 | ) | | | (.07 | ) | | | (.05 | ) | | | (.11 | ) | | | (.14 | ) | |
| Net Capital Gains | | | (4.19 | ) | | | — | | | | — | | | | (.16 | ) | | | (.03 | ) | |
| Total Distributions | | | (4.25 | ) | | | (.07 | ) | | | (.05 | ) | | | (.27 | ) | | | (.17 | ) | |
| Net Asset Value, End of Year | | $ | 13.43 | | | $ | 15.41 | | | $ | 16.59 | | | $ | 13.21 | | | $ | 9.22 | | |
Total Return†† | | | 15.37 | % | | | (6.70 | )% | | | 25.99 | % | | | 46.16 | % | | | (45.95 | )% | |
| Ratios/Supplemental Data | |
| Net Assets, End of Year (in millions) | | $ | 53.5 | | | $ | 55.2 | | | $ | 62.5 | | | $ | 57.8 | | | $ | 119.7 | | |
Ratio of Gross Expenses to Average Net Assets# | | | 1.32 | % | | | 1.32 | % | | | 1.30 | % | | | 1.29 | % | | | 1.22 | % | |
Ratio of Net Expenses to Average Net Assets§ | | | 1.25 | % | | | 1.25 | % | | | 1.25 | % | | | 1.25 | % | | | 1.22 | % | |
Ratio of Net Investment Income (Loss) to Average Net Assets | | | 1.09 | % | | | .32 | % | | | .30 | % | | | .61 | % | | | .58 | % | |
| Portfolio Turnover Rate | | | 29 | % | | | 95 | % | | | 39 | % | | | 51 | % | | | 66 | % | |
See Notes to Financial Highlights
20
Notes to Financial Highlights Mid Cap Intrinsic Value Portfolio
†† Total return based on per share NAV reflects the effects of changes in NAV on the performance of the Fund during each fiscal period and assumes income dividends and other distributions, if any, were reinvested. Results represent past performance and do not indicate future results. Current returns may be lower or higher than the performance data quoted. Investment returns and principal may fluctuate and shares when redeemed may be worth more or less than original cost. Total return would have been lower if Management had not reimbursed and/or waived certain expenses. The total return information shown does not reflect charges and other expenses that apply to the separate account or the related insurance policies, and the inclusion of these charges and other expenses would reduce the total return for all fiscal periods shown. The class actions proceeds listed in Note A-4 had no impact on total return.
# Represents the annualized ratios of net expenses to average daily net assets if Management had not reimbursed certain expenses and/or waived a portion of the investment management fee.
‡ Calculated based on the average number of shares outstanding during each fiscal period.
§ After reimbursement of expenses and/or waiver of a portion of the investment management fee by Management. The Fund is required to calculate an expense ratio without taking into consideration any expense reductions related to expense offset arrangements. Had the Fund not received expense reductions related to expense offset arrangements, the annualized ratios of net expenses to average daily net assets would have been:
| | | Year Ended December 31, | |
| | | 2012 | | 2011 | | 2010 | | 2009 | | 2008 | |
| Mid Cap Intrinsic Value Portfolio Class I | | | 1.07 | % | | | 1.07 | % | | | 1.06 | % | | | 1.06 | % | | | .97 | % | |
| Mid Cap Intrinsic Value Portfolio Class S | | | 1.25 | % | | | 1.25 | % | | | 1.25 | % | | | 1.25 | % | | | 1.23 | % | |
21
Report of Independent Registered Public Accounting Firm
To the Board of Trustees of
Neuberger Berman Advisers Management Trust and
Shareholders of Mid Cap Intrinsic Value Portfolio
We have audited the accompanying statement of assets and liabilities of Mid Cap Intrinsic Value Portfolio (formerly, Regency Portfolio), one of the series constituting Neuberger Berman Advisers Management Trust (the "Trust"), including the schedule of investments, as of December 31, 2012, and the related statement of operations for the year then ended, the statements of changes in net assets for each of the two years in the period then ended, and the financial highlights for each of the five years in the period then ended. These financial statements and financial highlights are the responsibility of the Trust's management. Our responsibility is to express an opinion on these financial statements and financial highlights based on our audits.
We conducted our audits in accordance with the standards of the Public Company Accounting Oversight Board (United States). Those standards require that we plan and perform the audit to obtain reasonable assurance about whether the financial statements and financial highlights are free of material misstatement. We were not engaged to perform an audit of the Trust's internal control over financial reporting. Our audits included consideration of internal control over financial reporting as a basis for designing audit procedures that are appropriate in the circumstances, but not for the purpose of expressing an opinion on the effectiveness of the Trust's internal control over financial reporting. Accordingly, we express no such opinion. An audit also includes examining, on a test basis, evidence supporting the amounts and disclosures in the financial statements and financial highlights, assessing the accounting principles used and significant estimates made by management, and evaluating the overall financial statement presentation. Our procedures included confirmation of securities owned as of December 31, 2012 by correspondence with the custodian. We believe that our audits provide a reasonable basis for our opinion.
In our opinion, the financial statements and financial highlights referred to above present fairly, in all material respects, the financial position of Mid Cap Intrinsic Value Portfolio, a series of Neuberger Berman Advisers Management Trust, at December 31, 2012, the results of its operations for the year then ended, the changes in its net assets for each of the two years in the period then ended, and the financial highlights for each of the five years in the period then ended, in conformity with U.S. generally accepted accounting principles.
Boston, Massachusetts
February 7, 2013
22
Trustee and Officer Information
The following tables set forth information concerning the trustees ("Trustees") and officers ("Officers") of the Trust. All persons named as Trustees and Officers also serve in similar capacities for other funds administered or managed by Management, Neuberger and Neuberger Berman Fixed Income LLC ("NBFI"). The Statement of Additional Information includes additional information about Trustees and is available upon request, without charge, by calling (800) 877-9700.
Information about the Board of Trustees
Name, (Year of Birth), and Address(1) | | Position(s) and Length of Time Served(2) | | Principal Occupation(s)(3) | | Number of Funds in Fund Complex Overseen by Fund Trustee | | Other Directorships Held Outside Fund Complex by Fund Trustee(3) | |
| Independent Fund Trustees | |
| Faith Colish (1935) | | Trustee since 1982 | | Counsel, Carter Ledyard & Milburn LLP (law firm) since October 2002; formerly, Attorney-at-Law and President, Faith Colish, A Professional Corporation, 1980 to 2002. | | | 50 | | | Formerly, Director, 1997 to 2003, and Advisory Director, 2003 to 2006, ABA Retirement Funds (formerly, American Bar Retirement Association) (not-for-profit membership corporation). | |
| Martha C. Goss (1949) | | Trustee since 2007 | | President, Woodhill Enterprises Inc./Chase Hollow Associates LLC (personal investment vehicle), since 2006; Chief Operating and Financial Officer, Hopewell Holdings LLC/ Amwell Holdings, LLC (a holding company for investments in the healthcare sector), since 2003; formerly, Consultant, Resources Connection (temporary staffing), 2002 to 2006. | | | 50 | | | Director, American Water (water utility), since 2003; Director, Channel Reinsurance (financial guaranty reinsurance), 2006 to 2010; Director, Allianz Life of New York (insurance), since 2005; Director, Financial Women's Association of New York (not-for-profit association), since 2003; Trustee Emerita, Brown University, since 1998; formerly, Director, Ocwen Financial Corporation (mortgage servicing), 2005 to 2010; formerly, Advisory Board Member, Attensity (software developer), 2005 to 2007; formerly, Director, Bank Leumi (commercial bank), 2005 to 2007; formerly, Director, Claire's Stores, Inc. (retailer), 2005 to 2007. | |
23
Name, (Year of Birth), and Address(1) | | Position(s) and Length of Time Served(2) | | Principal Occupation(s)(3) | | Number of Funds in Fund Complex Overseen by Fund Trustee | | Other Directorships Held Outside Fund Complex by Fund Trustee(3) | |
| Michael M. Knetter (1960) | | Trustee since 2007 | | President and Chief Executive Officer, University of Wisconsin Foundation, since October 2010; formerly, Dean, School of Business, University of Wisconsin - Madison; formerly, Professor of International Economics and Associate Dean, Amos Tuck School of Business - Dartmouth College, 1998 to 2002. | | | 50 | | | Director, American Family Insurance (a mutual company, not publicly traded), since March 2009; formerly, Trustee, Northwestern Mutual Series Fund, Inc., 2007 to 2010; formerly, Director, Wausau Paper, 2005 to 2011; formerly, Director, Great Wolf Resorts, 2004 to 2009. | |
| Howard A. Mileaf (1937) | | Trustee since 1999 | | Retired; formerly, Vice President and General Counsel, WHX Corporation (holding company), 1993 to 2001. | | | 50 | | | Formerly, Director, Webfinancial Corporation (holding company), 2002 to 2008; formerly, Director, WHX Corporation (holding company), 2002 to 2005; formerly, Director, State Theatre of New Jersey (not-for-profit theatre), 2000 to 2005. | |
| George W. Morriss (1947) | | Trustee since 2007 | | Adjunct Faculty Member, Columbia University School of International Policy and Administration, since October 2012; formerly, Executive Vice President and Chief Financial Officer, People's Bank, Connecticut (a financial services company), 1991 to 2001. | | | 50 | | | Formerly, Manager, Larch Lane Multi-Strategy Fund complex (which consisted of three funds), 2006 to 2011; formerly, Member, NASDAQ Issuers' Affairs Committee, 1995 to 2003. | |
24
Name, (Year of Birth), and Address(1) | | Position(s) and Length of Time Served(2) | | Principal Occupation(s)(3) | | Number of Funds in Fund Complex Overseen by Fund Trustee | | Other Directorships Held Outside Fund Complex by Fund Trustee(3) | |
| Jack L. Rivkin (1940) | | Trustee since 2002; President 2002 to 2008 | | Formerly, Executive Vice President and Chief Investment Officer, Neuberger Berman Holdings LLC (holding company), 2002 to August 2008 and 2003 to August 2008, respectively; formerly, Managing Director and Chief Investment Officer, Neuberger, December 2005 to August 2008 and 2003 to August 2008, respectively; formerly, Executive Vice President, Neuberger, December 2002 to 2005; formerly, Director and Chairman, Management, December 2002 to August 2008; formerly, Executive Vice President, Citigroup Investments, Inc., September 1995 to February 2002; formerly, Executive Vice President, Citigroup Inc., September 1995 to February 2002. | | | 50 | | | Director, Idealab (private company), since 2009; Director, Distributed World Power (private company), since 2009; Director, Dale Carnegie and Associates, Inc. (private company), since 1999; Director, Solbright, Inc. (private company), since 1998; Director, SA Agricultural Fund, since 2009; Chairman and Director, Essential Brands (consumer products) since 2008; formerly, Director, New York Society of Security Analysts, 2006 to 2008. | |
| Tom D. Seip (1950) | | Trustee since 2000; Chairman of the Board since 2008; Lead Independent Trustee 2006 to 2008 | | General Partner, Ridgefield Farm LLC (a private investment vehicle); formerly, President and CEO, Westaff, Inc. (temporary staffing), May 2001 to January 2002; formerly, Senior Executive, The Charles Schwab Corporation, 1983 to 1998, including Chief Executive Officer, Charles Schwab Investment Management, Inc.; Trustee, Schwab Family of Funds and Schwab Investments, 1997 to 1998; and Executive Vice President-Retail Brokerage, Charles Schwab & Co., Inc., 1994 to 1997. | | | 50 | | | Director, H&R Block, Inc. (financial services company), since May 2001; Chairman, Governance and Nominating Committee, H&R Block, Inc., since 2011; formerly, Chairman, Compensation Committee, H&R Block, Inc., 2006 to 2010; formerly, Director, Forward Management, Inc. (asset management company), 1999 to 2006. | |
25
Name, (Year of Birth), and Address(1) | | Position(s) and Length of Time Served(2) | | Principal Occupation(s)(3) | | Number of Funds in Fund Complex Overseen by Fund Trustee | | Other Directorships Held Outside Fund Complex by Fund Trustee(3) | |
| Candace L. Straight (1947) | | Trustee since 1999 | | Private investor and consultant specializing in the insurance industry; formerly, Advisory Director, Securitas Capital LLC (a global private equity investment firm dedicated to making investments in the insurance sector), 1998 to December 2003. | | | 50 | | | Public Member, Board of Governors and Board of Trustees, Rutgers University, since 2011; Director, Montpelier Re Holdings Ltd. (reinsurance company), since 2006; formerly, Director, National Atlantic Holdings Corporation (property and casualty insurance company), 2004 to 2008; formerly, Director, The Proformance Insurance Company (property and casualty insurance company), 2004 to 2008; formerly, Director, Providence Washington Insurance Company (property and casualty insurance company), 1998 to 2006; formerly, Director, Summit Global Partners (insurance brokerage firm), 2000 to 2005. | |
| Peter P. Trapp (1944) | | Trustee since 1984 | | Retired; formerly, Regional Manager for Mid-Southern Region, Ford Motor Credit Company, September 1997 to 2007; formerly, President, Ford Life Insurance Company, April 1995 to August 1997. | | | 50 | | | None. | |
26
Name, (Year of Birth), and Address(1) | | Position(s) and Length of Time Served(2) | | Principal Occupation(s)(3) | | Number of Funds in Fund Complex Overseen by Fund Trustee | | Other Directorships Held Outside Fund Complex by Fund Trustee(3) | |
| Fund Trustees who are "Interested Persons" | |
| Joseph V. Amato* (1962) | | Trustee since 2009 | | President and Director, Neuberger Berman Group LLC, since 2009; President and Chief Executive Officer, Neuberger and Neuberger Berman Holdings LLC (including its predecessor, Neuberger Berman Inc.), since 2007; Chief Investment Officer, Neuberger, since 2009; Chief Investment Officer (Equities) and Managing Director, Management, since 2009; Managing Director, NBFI, since 2007; Board member of NBFI since 2006; formerly, Global Head of Asset Management of Lehman Brothers Holdings Inc.'s ("LBHI") Investment Management Division, 2006 to 2009; formerly, member of LBHI's Investment Management Division's Executive Management Committee, 2006 to 2009; formerly, Managing Director, Lehman Brothers Inc. ("LBI"), 2006 to 2008; formerly, Chief Recruiting and Development Officer, LBI, 2005 to 2006; formerly, Global Head of LBI's Equity Sales and a Member of its Equities Division Executive Committee, 2003 to 2005. | | | 50 | | | Member of Board of Advisors, McDonough School of Business, Georgetown University, since 2001; Member of New York City Board of Advisors, Teach for America, since 2005; Trustee, Montclair Kimberley Academy (private school), since 2007. | |
27
Name, (Year of Birth), and Address(1) | | Position(s) and Length of Time Served(2) | | Principal Occupation(s)(3) | | Number of Funds in Fund Complex Overseen by Fund Trustee | | Other Directorships Held Outside Fund Complex by Fund Trustee(3) | |
| Robert Conti* (1956) | | Chief Executive Officer, President and Trustee since 2008; prior thereto, Executive Vice President in 2008 and Vice President 2000 to 2008 | | Managing Director, Neuberger, since 2007; formerly, Senior Vice President, Neuberger, 2003 to 2006; formerly, Vice President, Neuberger, 1999 to 2003; President and Chief Executive Officer, Management, since 2008; formerly, Senior Vice President, Management, 2000 to 2008; Managing Director, NBFI, since 2009. | | | 50 | | | Director, Staten Island Mental Health Society, since 1994; formerly, Chairman of the Board, Staten Island Mental Health Society, 2008 to 2011. | |
(1) The business address of each listed person is 605 Third Avenue, New York, New York 10158.
(2) Pursuant to the Trust's Trust Instrument, each of these Fund Trustees shall hold office for life or until his or her successor is elected or the Trust terminates; except that (a) any Fund Trustee may resign by delivering a written resignation; (b) any Fund Trustee may be removed with or without cause at any time by a written instrument signed by at least two-thirds of the other Fund Trustees; (c) any Fund Trustee who requests to be retired, or who has become unable to serve, may be retired by a written instrument signed by a majority of the other Fund Trustees; and (d) any Fund Trustee may be removed at any shareholder meeting by a vote of at least two-thirds of the outstanding shares.
(3) Except as otherwise indicated, each individual has held the positions shown for at least the last five years.
* Indicates a Fund Trustee who is an "interested person" within the meaning of the 1940 Act. Mr. Amato and Mr. Conti are interested persons of the Trust by virtue of the fact that each is an officer of Management, Neuberger and/or their affiliates.
28
Information about the Officers of the Trust
Name, (Year of Birth), and Address(1) | | Position(s) and Length of Time Served(2) | | Principal Occupation(s)(3) | |
| Andrew B. Allard (1961) | | Chief Legal Officer since 2013 (only for purposes of sections 307 and 406 of the Sarbanes-Oxley Act of 2002) and Anti-Money Laundering Compliance Officer since 2002 | | Senior Vice President, Neuberger, since 2006 and Employee since 1999; Deputy General Counsel, Neuberger, since 2004; formerly, Vice President, Neuberger, 2000 to 2005; formerly, Employee, Management, 1994 to 1999; Chief Legal Officer since 2013 (only for purposes of sections 307 and 406 of the Sarbanes-Oxley Act of 2002) and Anti-Money Laundering Compliance Officer since 2002, nine registered investment companies for which Management acts as investment manager and administrator (six since 2002, one since 2003, one since 2005 and one since 2006). | |
| Claudia A. Brandon (1956) | | Executive Vice President since 2008 and Secretary since 1985 | | Senior Vice President, Neuberger, since 2007 and Employee since 1999; Senior Vice President, Management, since 2008 and Assistant Secretary since 2004; formerly, Vice President, Neuberger, 2002 to 2006; formerly, Vice President-Mutual Fund Board Relations, Management, 2000 to 2008; formerly, Vice President, Management, 1986 to 1999 and Employee 1984 to 1999; Executive Vice President, nine registered investment companies for which Management acts as investment manager and administrator (nine since 2008); Secretary, nine registered investment companies for which Management acts as investment manager and administrator (three since 1985, three since 2002, one since 2003, one since 2005 and one since 2006). | |
| Anthony DiBernardo (1979) | | Assistant Treasurer since 2011 | | Vice President, Neuberger, since 2009; Employee, Management, since 2003; Assistant Treasurer, nine registered investment companies for which Management acts as investment manager and administrator (nine since 2011). | |
| Sheila R. James (1965) | | Assistant Secretary since 2002 | | Vice President, Neuberger, since 2008 and Employee since 1999; formerly, Assistant Vice President, Neuberger, 2007; formerly, Employee, Management, 1991 to 1999; Assistant Secretary, nine registered investment companies for which Management acts as investment manager and administrator (six since 2002, one since 2003, one since 2005 and one since 2006). | |
| Brian Kerrane (1969) | | Vice President since 2008 | | Senior Vice President, Neuberger, since 2006; formerly, Vice President, Neuberger, 2002 to 2006; Vice President, Management, since 2008 and Employee since 1991; Vice President, nine registered investment companies for which Management acts as investment manager and administrator (nine since 2008). | |
29
Name, (Year of Birth), and Address(1) | | Position(s) and Length of Time Served(2) | | Principal Occupation(s)(3) | |
| Kevin Lyons (1955) | | Assistant Secretary since 2003 | | Assistant Vice President, Neuberger, since 2008 and Employee since 1999; formerly, Employee, Management, 1993 to 1999; Assistant Secretary, nine registered investment companies for which Management acts as investment manager and administrator (seven since 2003, one since 2005 and one since 2006). | |
| Owen F. McEntee, Jr. (1961) | | Vice President since 2008 | | Vice President, Neuberger, since 2006; Employee, Management, since 1992; Vice President, nine registered investment companies for which Management acts as investment manager and administrator (nine since 2008). | |
| John M. McGovern (1970) | | Treasurer and Principal Financial and Accounting Officer since 2005 | | Senior Vice President, Neuberger, since 2007; formerly, Vice President, Neuberger, 2004 to 2006; Employee, Management, since 1993; Treasurer and Principal Financial and Accounting Officer, nine registered investment companies for which Management acts as investment manager and administrator (eight since 2005 and one since 2006); formerly, Assistant Treasurer, eight registered investment companies for which Management acts as investment manager and administrator, 2002 to 2005. | |
| Frank Rosato (1971) | | Assistant Treasurer since 2005 | | Vice President, Neuberger, since 2006; Employee, Management, since 1995; Assistant Treasurer, nine registered investment companies for which Management acts as investment manager and administrator (eight since 2005 and one since 2006). | |
| Neil S. Siegel (1967) | | Vice President since 2008 | | Managing Director, Management, since 2008; Managing Director, Neuberger, since 2006; formerly, Senior Vice President, Neuberger, 2004 to 2006; Vice President, nine registered investment companies for which Management acts as investment manager and administrator (nine since 2008). | |
| Chamaine Williams (1971) | | Chief Compliance Officer since 2005 | | Senior Vice President, Neuberger, since 2007; Chief Compliance Officer, Management, since 2006; Chief Compliance Officer, nine registered investment companies for which Management acts as investment manager and administrator (eight since 2005 and one since 2006); formerly, Senior Vice President, LBI, 2007 to 2008; formerly, Vice President, LBI, 2003 to 2006; formerly, Chief Compliance Officer, Lehman Brothers Asset Management Inc., 2003 to 2007; formerly, Chief Compliance Officer, Lehman Brothers Alternative Investment Management LLC, 2003 to 2007. | |
(1) The business address of each listed person is 605 Third Avenue, New York, New York 10158.
(2) Pursuant to the By-Laws of the Trust, each officer elected by the Fund Trustees shall hold office until his or her successor shall have been elected and qualified or until his or her earlier death, inability to serve, or resignation. Officers serve at the pleasure of the Fund Trustees and may be removed at any time with or without cause.
(3) Except as otherwise indicated, each individual has held the positions shown for at least the last five years.
30
Proxy Voting Policies and Procedures
A description of the policies and procedures that the Trust uses to determine how to vote proxies relating to portfolio securities is available, without charge, by calling 1-800-877-9700 (toll-free) and on the website of the Securities and Exchange Commission, at www.sec.gov. Information regarding how the Trust voted proxies relating to portfolio securities during the most recent 12-month period ended June 30 is also available, without charge, by calling 1-800-877-9700 (toll-free), on the website of the Securities and Exchange Commission at www.sec.gov, and on Management's website at www.nb.com.
Quarterly Portfolio Schedule
The Trust files a complete schedule of portfolio holdings for the Fund with the Securities and Exchange Commission for the first and third quarters of each fiscal year on Form N-Q. The Trust's Forms N-Q are available on the Securities and Exchange Commission's website at www.sec.gov and may be reviewed and copied at the Securities and Exchange Commission's Public Reference Room in Washington, DC. Information on the operation of the Public Reference Room may be obtained by calling 1-800-SEC-0330. The information on Form N-Q is available upon request, without charge, by calling 1-800-877-9700 (toll free).
Notice to Shareholders
100.00% of the dividends earned during the fiscal year ended December 31, 2012 qualifies for the dividends received deduction for corporate shareholders.
The Fund hereby designates $30,612,792 as a capital gain distribution.
Board Consideration of the Management and Sub-Advisory Agreements
At a meeting held on October 25, 2012, the Board of Trustees of Neuberger Berman Advisers Management Trust ("Board"), including the Trustees who are not "interested persons" of Management (including its affiliates) or Neuberger Berman Advisers Management Trust ("Independent Fund Trustees"), approved the continuance of the Management and Sub-Advisory Agreements ("Agreements") for Mid Cap Intrinsic Value Portfolio ("Fund").
In evaluating the Agreements, the Board, including the Independent Fund Trustees, reviewed materials furnished by Management in response to questions submitted by counsel for the Independent Fund Trustees, and met with senior representatives of Management regarding their personnel, operations and financial conditions as they relate to the Fund. The Independent Fund Trustees were advised by counsel that is experienced in Investment Company Act of 1940 matters and that is independent of Management. The Independent Fund Trustees received a memorandum from independent counsel discussing the legal standards for their consideration of the proposed continuance of the Agreements. They met with such counsel separately from representatives of Management to discuss the annual contract review. The annual contract review extends over three regular meetings of the Board, including one meeting devoted primarily to reviewing and discussing Fund performance, to ensure that Management has time to respond to any questions the Independent Fund Trustees may have on their initial review of the report and that the Independent Fund Trustees have time to consider those responses.
The Board considered the following factors, among others, in connection with its approval of the continuance of the Agreements: (1) the nature, extent, and quality of the services provided by Management and Neuberger; (2) the performance of the Fund compared to a relevant market index and a peer group of investment companies; (3) the costs of the services provided and profits or losses realized by Management and its affiliates from their relationship with the Fund; (4) the extent to which economies of scale might be realized as the Fund grows; and (5) whether fee levels reflect any such potential economies of scale for the benefit of investors in the Fund. In their deliberations, the Board members did not identify any particular information that was all-important or controlling, and each Trustee may have attributed different weights to the various factors.
31
The Board evaluated the terms of the Agreements, the overall fairness of the Agreements to the Fund and whether the Agreements were in the best interests of the Fund and its shareholders.
With respect to the nature, extent and quality of the services provided, the Board considered the performance of the Fund and the experience and staffing of the portfolio management personnel of Management and Neuberger who perform services for the Fund. The Board noted that Management also provides certain administrative services, including fund accounting and compliance oversight. The Board also considered Management's and Neuberger's policies and practices regarding brokerage and allocation of portfolio transactions by Management. The Board's Portfolio Transactions and Pricing Committee from time to time reviewed the quality of the execution services that Management and Neuberger had provided, and periodically reviewed studies by an independent firm engaged to review and evaluate the quality of brokerage execution received by the Fund. The Board also reviewed whether Management and Neuberger used brokers to execute Fund transactions that provide research and other services to Management and Neuberger, and the types of benefits potentially derived from such services by Management, Neuberger, the Fund and other clients of Management and Neuberger. In addition, the Board noted the positive compliance history of Management and Neuberger, as each firm has been free of significant reported compliance problems. As in past years, the Board also considered the manner in which Management addressed various non-routine matters that arose during the year, some of them a result of developments in the broader fund industry or the regulations governing it.
The Board considered the performance of the Fund relative to its benchmark and the average performance of composite peer groups of investment companies dedicated to insurance products pursuing broadly similar strategies. The Board also reviewed performance during the period in relation to certain measures of the degree of investment risk undertaken by the portfolio manager. The Board discussed with Management the Fund's performance and steps that Management had under consideration to improve performance. The Board also considered Management's resources and responsiveness with respect to the Fund.
With respect to the overall fairness of the Agreements, the Board considered the fee structure for the Fund under the Agreements as compared to a peer group of comparable funds and any fall-out benefits likely to accrue to Management or Neuberger or their affiliates from their relationship with the Fund. The Board also considered the profitability of Management and its affiliates from their association with the Fund.
The Board reviewed a comparison of the Fund's management fee and overall expense ratio to a peer group of broadly comparable non-proprietary funds dedicated to insurance products. The Board considered the mean and median of the management fees and expense ratios of the peer group. The Board noted that the Fund's management fee was higher than the peer group mean and median. The Board considered whether specific portfolio management or administration needs contributed to the management fee. The Board also considered the contractual limit on Fund expenses undertaken by Management. With regard to the sub-advisory fee paid to Neuberger, the Board noted that this fee is "at cost."
The Board considered whether there were other funds that were advised or sub-advised by Management or its affiliates or separate accounts managed by Management or its affiliates with investment objectives, policies and strategies that were similar to the Fund. If so, the Board compared the fees charged to the Fund to the fees charged to any such other funds and/or separate accounts. The Board considered the appropriateness and reasonableness of any differences between the fees charged to the Fund and any such other funds and/or separate accounts and determined that the differences in fees were consistent with the management and other services provided.
The Board also evaluated any apparent or anticipated economies of scale in relation to the services Management provides to the Fund. The Board considered whether the Fund's fee structure provides for a reduction of payments resulting from the use of breakpoints and whether those breakpoints are set at appropriate asset levels. In concluding that the benefits accruing to Management and its affiliates by virtue of their relationship to the Fund were reasonable in comparison with the costs of providing the investment advisory and other services and the benefits accruing to the Fund, the Board reviewed specific data as to Management's profit on the Fund for a recent period. The Board also carefully examined Management's cost allocation methodology. The Board recognized that Management should be entitled to earn a reasonable level of profits for services it provides to the Fund and, based on its review, concluded that Management's level of profitability was not excessive.
32
Conclusions
In approving the Agreements, the Board concluded that the terms of each Agreement are fair and reasonable and that approval of the Agreements is in the best interests of the Fund and its shareholders. In reaching this determination, the Board considered that Management and Neuberger could be expected to provide a high level of service to the Fund; that it retained confidence in Management's and Neuberger's capabilities to manage the Fund; that the Fund's fee structure appeared to the Board to be reasonable given the nature and quality of services provided; and that the benefits accruing to Management and its affiliates by virtue of their relationship to the Fund were reasonable in comparison with the benefits accruing to the Fund.
33
Neuberger Berman
Advisers Management Trust
Short Duration Bond Portfolio
I Class Shares
Annual Report
December 31, 2012
B1011 02/13
Short Duration Bond Portfolio Commentary (Unaudited)
The Neuberger Berman Advisers Management Trust (AMT) Short Duration Bond Portfolio posted a 4.61% total return for the fiscal year ended December 31, 2012 and outperformed its benchmark, the Barclays 1-3 Year U.S. Government/Credit Index, which returned 1.26% for the same period.
Shifting investor sentiment due to mixed economic data, the European sovereign debt crisis and uncertainties regarding future central bank policy resulted in periods of market volatility during the year. However, investors who took on greater risk were generally rewarded. While there were several setbacks in the non-Treasury market, these proved to be only temporary in nature, as demand was typically strong from investors looking to generate incremental yield. Also supporting non-Treasuries were actions taken by the Federal Reserve (Fed) to stimulate the economy. In September 2012, the Fed introduced a third round of quantitative easing (QE3). At its final meeting of the year in December, the Fed announced that it would continue purchasing $40 billion per month of agency mortgage-backed securities (MBS) as well as $45 billion per month of longer-term Treasuries. The Fed also announced that it would keep the federal funds rate on hold as long as the unemployment rate remained above 6.5% and that inflation remained "no more than a half percentage point above the Committee's 2.0% longer-run goal."
The Portfolio's overweight to non-Treasuries versus the benchmark was the largest driver of its outperformance during the reporting period. The largest contributor to results was the Portfolio's exposure to non-agency MBS, followed by allocations to commercial mortgage-backed securities (CMBS) and investment grade corporate bonds. Within the investment grade corporate bond market, our holdings in the financials subsector was the most beneficial. Elsewhere, the Portfolio's defensive yield curve positioning was rewarded. Detracting slightly from results was the Portfolio's zero allocation to agency debt securities, as they outperformed equal-duration Treasuries.
There were several adjustments made to the Portfolio from a sector perspective during the reporting period. We reduced our exposure to non-agency MBS to capture profits and pare the Portfolio's overall risk exposure. Our allocation to agency MBS was also reduced. In contrast, we increased the allocation to corporate bonds, primarily by taking advantage of opportunities in the new issue market. Treasury futures were used during a portion of the period to assist in managing our duration positioning. We closed this position in February 2012.
The ultimate resolution of the fiscal cliff-related government spending cuts and the raising of the debt ceiling remain wild cards for the U.S. economy in 2013. It's now clear that the grand bargain scenario for the fiscal cliff was wishful thinking and angst regarding the debt ceiling appears likely. As such, it may be some time before we have total clarity on these issues. Regardless of how they play out, certain taxes are increasing and government spending cuts will occur. Both of these factors will weigh on the economy in 2013. Nonetheless, while it is difficult to project with complete confidence, it is our belief that the U.S. economy will continue to modestly expand in 2013.
As we saw during much of 2012, a relatively weak economic backdrop doesn't necessarily mean the fixed income markets will perform poorly in 2013. In fact, at present we believe the spread sectors will generally post positive results in 2013. Given our view that we will have a prolonged period of low interest rates, we currently believe that spread sector demand will remain solid, albeit punctuated by periods of risk aversion. Given the magnitude of spread tightening since the credit crisis, we currently believe that spread sector returns in 2013 will probably not be as robust as in recent years. However, we anticipate maintaining our long-held strategy of overweighting the spread sectors, as we feel it is a prudent approach for long-term investors.
Sincerely,
THOMAS SONTAG, MICHAEL FOSTER AND RICHARD GRAU
PORTFOLIO CO-MANAGERS
Information about the principal risks of investing in the Portfolio is set forth in the prospectus and statement of additional information.
The portfolio composition, industries and holdings of the Portfolio are subject to change.
Opinions expressed are as of the date herein and are subject to change without notice. This material is not intended to be a formal research report and should not be construed as an offer to sell or the solicitation of an offer to buy any security.
1
Short Duration Bond Portfolio (Unaudited)
PORTFOLIO BY TYPE OF SECURITY
| (as a % of Total Net Assets) | |
| Asset-Backed Securities | | | 19.9 | % | |
| Corporate Debt Securities | | | 39.9 | | |
| Mortgage-Backed Securities | | | 26.9 | | |
| U.S. Treasury Securities | | | 12.9 | | |
| Short-Term Investments | | | 0.6 | | |
Liabilities, less cash, receivables and other assets | | | (0.2 | ) | |
| Total | | | 100.0 | % | |
PERFORMANCE HIGHLIGHTS
| | | | | Average Annual Total Return Ended 12/31/2012 | |
| | | Inception Date | | 1 Year | | 5 Years | | 10 Years | | Life of Fund | |
Short Duration Bond Portfolio Class I | | 09/10/1984 | | | 4.61 | % | | | 1.62 | % | | | 2.16 | % | | | 5.51 | % | |
Barclays 1-3 Year U.S. Government/ Credit Index1,2 | | | | | | | 1.26 | % | | | 2.88 | % | | | 3.13 | % | | | 6.17 | % | |
The performance data quoted represent past performance and do not indicate future results. Current performance may be lower or higher than the performance data quoted. For more current performance data, please visit www.nb.com.
The results shown in the table reflect the reinvestment of income dividends and other distributions, if any. The results do not reflect the effect of taxes a shareholder would pay on Portfolio distributions or on the redemption of Portfolio shares. The results do not reflect fees and expenses of the variable annuity and variable life insurance policies or the qualified pension and retirement plans whose proceeds are invested in the Portfolio.
The investment return and principal value of an investment will fluctuate and shares, when redeemed, may be worth more or less than their original cost.
Returns would have been lower if Neuberger Berman Management LLC ("Management") had not reimbursed certain expenses and/or waived a portion of the investment management fees during certain of the periods shown. Repayment by a class (of expenses previously reimbursed and/or fees previously waived by Management) will decrease the class's returns. Please see Note B in the Notes to Financial Statements for specific information regarding expense reimbursement and/or fee waiver arrangements.
COMPARISON OF A $10,000 INVESTMENT
This graph shows the change in value of a hypothetical $10,000 investment in the Portfolio over the past 10 fiscal years, or since the Portfolio's inception, if it has not operated for 10 years. The result is compared with benchmarks, which include a broad-based market index and may include a more narrowly based index. Market indices have not been reduced to reflect any of the fees and costs of investing. The results shown in the graph reflect the reinvestment of income dividends and other distributions, if any. The results do not reflect the effect of taxes a shareholder would pay on Portfolio distributions or on the redemption of Portfolio shares. Results represent past performance and do not indicate future results.
Please see Endnotes for additional information.
2
Endnotes (Unaudited)
1 The date used to calculate Life of Fund performance for the index is the inception date of the oldest share class.
2 The Barclays 1-3 Year U.S. Government/Credit Index is an unmanaged index that includes all bonds in the U.S. Government/Credit Index with at least one to three years to maturity. The U.S. Government/Credit Index includes all securities in the Government and Credit Indices. The Government Index includes Treasuries (i.e., public obligations of the U.S. Treasury that have remaining maturities of more than one year) and agencies (i.e., publicly issued debt of U.S. Government agencies, quasi-federal corporations, and corporate or foreign debt guaranteed by the U.S. Government). The Credit Index includes publicly issued U.S. corporate and foreign debentures and secured notes that meet specified maturity, liquidity, and quality requirements. All bonds in the Credit Index must meet the following additional criteria: must have at least one year to final maturity regardless of call features; must have at least $250 million par amount outstanding; must be rated investment-grade (Baa3/BBB- or higher) by at least two of the following ratings agencies: Standard & Poor's, Moody's Investors Services, Inc., and Fitch, Inc.; must be fixed rate; must be dollar-denominated and non-convertible; and must be publicly issued. Please note that indices do not take into account any fees, expenses or tax consequences of investing in the individual securities that they track, and individuals cannot invest directly in any index. Data about the performance of an index is prepared or obtained by Neuberger Berman Management LLC ("Management") and reflects the reinvestment of income dividends and other distributions, if any. The Portfolio may invest in securities not included in a described index and/or may not invest in all securities included in a described index.
Any ratios or other measurements using a factor of forecasted earnings of a company discussed herein are based on consensus estimates, not Management's own projections, and they may or may not be realized. In addition, any revision to a forecast could affect the market price of a security. By quoting them herein, Management does not offer an opinion as to the accuracy of, and does not guarantee, these forecasted numbers.
The investments for the Portfolio are managed by the same portfolio manager(s) who manage(s) one or more other registered funds that have names, investment objectives and investment styles that are similar to those of the Portfolio. You should be aware that the Portfolio is likely to differ from the other mutual fund(s) in size, cash flow pattern and tax matters. Accordingly, the holdings and performance of the Portfolio can be expected to vary from those of the other mutual fund(s).
Shares of the separate AMT Portfolios are not available to the general public. Shares of this Portfolio may be purchased only by life insurance companies to be used in their separate accounts that fund variable annuity and variable life insurance policies and by qualified pension and retirement plans.
Statistics and projections in this report are derived from sources deemed to be reliable but cannot be regarded as a representation of future results of the AMT Portfolios. This report is prepared for the general information of shareholders and is not an offer of shares of the AMT Portfolios. Shares of the AMT Portfolios are sold only through the currently effective prospectuses, which must precede or accompany this report.
The "Neuberger Berman" name and logo are registered service marks of Neuberger Berman Group LLC. "Neuberger Berman Management LLC" and the individual Fund names in this piece are either service marks or registered service marks of Neuberger Berman Management LLC.
© 2013 Neuberger Berman Management LLC distributor. All rights reserved.
3
Information About Your Fund's Expenses (Unaudited)
As a Fund shareholder, you incur two types of costs: (1) transaction costs such as fees and expenses that are, or may be, imposed under your variable contract or qualified pension plan; and (2) ongoing costs, including management fees; distribution and/or service (12b-1) fees (if applicable); and other Fund expenses. This example is intended to help you understand your ongoing costs (in dollars) of investing in the Fund and compare these costs with the ongoing costs of investing in other mutual funds.
This table is designed to provide information regarding costs related to your investments. The following examples are based on an investment of $1,000 made at the beginning of the six month period ended December 31, 2012 and held for the entire period. The table illustrates the Fund's costs in two ways:
| Actual Expenses and Performance: | | The first section of the table provides information about actual account values and actual expenses in dollars, based on the Fund's actual performance during the period. You may use the information in this line, together with the amount you invested, to estimate the expenses you paid over the period. Simply divide your account value by $1,000 (for example, an $8,600 account value divided by $1,000 = 8.6), then multiply the result by the number in the first section of the table under the heading entitled "Expenses Paid During the Period" to estimate the expenses you paid over the period. | |
| Hypothetical Example for Comparison Purposes: | | The second section of the table provides information about hypothetical account values and hypothetical expenses based on the Fund's actual expense ratio and an assumed rate of return at 5% per year before expenses. This return is not the Fund's actual return. The hypothetical account values and expenses may not be used to estimate the actual ending account balance or expenses you paid for the period. You may use this information to compare the ongoing costs of investing in this Fund versus other funds. To do so, compare the expenses shown in this 5% hypothetical example with the 5% hypothetical examples that appear in the shareholder reports of other funds. | |
Please note that the expenses in the table are meant to highlight your ongoing costs only and do not include any transaction costs, such as fees and expenses that are, or may be imposed under your variable contract or qualified pension plan. Therefore, the information under the heading "Hypothetical (5% annual return before expenses)" is useful in comparing ongoing costs only, and will not help you determine the relative total costs of owning different funds. In addition, if these transaction costs were included, your costs would have been higher.
Expense Information as of 12/31/12
NEUBERGER BERMAN ADVISERS MANAGEMENT TRUST SHORT DURATION BOND PORTFOLIO
| Actual | | Beginning Account Value 7/1/12 | | Ending Account Value 12/31/12 | | Expenses Paid During the Period* 7/1/12 – 12/31/12 | |
| Class I | | $ | 1,000.00 | | | $ | 1,018.70 | | | $ | 4.26 | | |
| Hypothetical (5% annual return before expenses)** | |
| Class I | | $ | 1,000.00 | | | $ | 1,020.91 | | | $ | 4.27 | | |
* Expenses are equal to the annualized expense ratio of .84%, multiplied by the average account value over the period, multiplied by 184/366 (to reflect the one-half year period shown).
** Hypothetical 5% annual return before expenses is calculated by multiplying the number of days in the most recent half year divided by 366.
4
Schedule of Investments Short Duration Bond Portfolio
| PRINCIPAL AMOUNT | | | | VALUE† | |
| U.S. Treasury Securities-Backed by the Full Faith and Credit of the U.S. Government (12.9%) | |
| $ | 11,600,000 | | | U.S. Treasury Notes, 0.38%, due 7/31/13 & 11/15/15 | | $ | 11,612,344 | | |
| | 12,220,000 | | | U.S. Treasury Notes, 2.13%, due 11/30/14 | | | 12,653,431 | | |
| | 5,020,000 | | | U.S. Treasury Notes, 0.25%, due 9/15/15 & 12/15/15 | | | 5,006,282 | | |
| | | | | Total U.S. Treasury Securities-Backed by the Full Faith and Credit of the U.S. Government (Cost $29,427,253) | | | 29,272,057 | | |
| Mortgage-Backed Securities (26.9%) | |
| Adjustable Jumbo Balance (1.0%) | |
| | 2,270,822 | | | Merrill Lynch Mortgage Investors Trust, Ser. 2005-A1, Class 2A1, 2.69%, due 12/25/34 | | | 2,270,018 | µ | |
| Adjustable Mixed Balance (2.7%) | |
| | 2,768,389 | | | Countrywide Home Loan Mortgage Pass-Through Trust, Ser. 2006-HYB5, Class 2A1, 2.86%, due 9/20/36 | | | 1,675,398 | µ | |
| | 1,895,575 | | | Credit Suisse First Boston Mortgage Securities Corp., Ser. 2004-AR4, Class 2A1, 2.96%, due 5/25/34 | | | 1,829,416 | µ | |
| | 2,424,351 | | | First Horizon Mortgage Pass-Through Trust, Ser. 2005-AR5, Class 2A1, 2.71%, due 11/25/35 | | | 2,111,952 | µ | |
| | 458,682 | | | Harborview Mortgage Loan Trust, Ser. 2004-4, Class 3A, 1.34%, due 6/19/34 | | | 434,541 | µ | |
| | | | 6,051,307 | | |
| Commercial Mortgage-Backed (16.5%) | |
| | 2,760,146 | | | Bear Stearns Commercial Mortgage Securities, Inc., Ser. 2005-PWR8, Class AAB, 4.58%, due 6/11/41 | | | 2,766,881 | | |
| | 596,745 | | | Citigroup Commercial Mortgage Trust, Ser. 2006-C4, Class A2, 5.74%, due 3/15/49 | | | 630,796 | µ | |
| | 509,031 | | | Citigroup/Deutsche Bank Commercial Mortgage Trust, Ser. 2006-CD2, Class AAB, 5.33%, due 1/15/46 | | | 522,608 | µ | |
| | 4,650,000 | | | Commercial Mortgage Pass-Through Certificates, Ser. 2003-LB1A, Class C, 4.23%, due 6/10/38 | | | 4,709,027 | | |
| | 2,156,901 | | | GMAC Commercial Mortgage Securities, Inc., Ser. 2004-C3, Class AAB, 4.70%, due 12/10/41 | | | 2,220,213 | | |
| | 3,968,266 | | | JP Morgan Chase Commercial Mortgage Securities Corp., Ser. 2011-C3, Class A1, 1.87%, due 2/15/46 | | | 4,034,317 | ñ | |
| | 4,225,000 | | | LB-UBS Commercial Mortgage Trust, Ser. 2003-C7, Class C, 5.07%, due 7/15/37 | | | 4,338,555 | µ | |
| | 2,327,387 | | | Morgan Stanley Capital I, Ser. 2011-C1, Class A1, 2.60%, due 9/15/47 | | | 2,396,830 | ñ | |
| | 4,348,177 | | | Morgan Stanley Capital I, Ser. 2011-C3, Class A1, 2.18%, due 7/15/49 | | | 4,467,504 | | |
| | 856,781 | | | Prudential Commercial Mortgage Trust, Ser. 2003-PWR1, Class A2, 4.49%, due 2/11/36 | | | 856,602 | | |
| | 7,250,000 | | | Wachovia Bank Commercial Mortgage Trust, Ser. 2003-C6, Class D, 5.13%, due 8/15/35 | | | 7,381,269 | | |
| | 109,539 | | | Wachovia Bank Commercial Mortgage Trust, Ser. 2003-C7, Class A1, 4.24%, due 10/15/35 | | | 109,898 | ñ | |
| | 282,107 | | | Wachovia Bank Commercial Mortgage Trust, Ser. 2005-C22, Class A3, 5.31%, due 12/15/44 | | | 282,014 | µ | |
| | 2,584,162 | | | WF-RBS Commercial Mortgage Trust, Ser. 2011-C2, Class A1, 2.50%, due 2/15/44 | | | 2,648,665 | ñ | |
| | | | 37,365,179 | | |
| Mortgage-Backed Non-Agency (1.9%) | |
| | 998,359 | | | Countrywide Home Loans, Ser. 2005-R2, Class 2A4, 8.50%, due 6/25/35 | | | 1,032,036 | ñ | |
| | 2,675,741 | | | GSMPS Mortgage Loan Trust, Ser. 2005-RP2, Class 1A4, 8.50%, due 3/25/35 | | | 2,780,365 | ñ | |
| | 532,620 | | | GSMPS Mortgage Loan Trust, Ser. 2005-RP3, Class 1A4, 8.50%, due 9/25/35 | | | 570,467 | ñ | |
| | | | 4,382,868 | | |
| Fannie Mae (2.7%) | |
| | 713,205 | | | Fannie Mae Grantor Trust, Ser. 2003-T4, Class 1A, 0.43%, due 9/26/33 | | | 703,542 | µ | |
| | 5,138,633 | | | Pass-Through Certificates, 4.50%, due 5/1/41 | | | 5,568,683 | | |
| | | | 6,272,225 | | |
See Notes to Schedule of Investments
5
| PRINCIPAL AMOUNT | | | | VALUE† | |
| Freddie Mac (2.1%) | |
| $ | 8,704 | | | Pass-Through Certificates, 10.00%, due 4/1/20 | | $ | 8,732 | | |
| | 4,405,611 | | | Pass-Through Certificates, 4.50%, due 11/1/39 | | | 4,727,626 | | |
| | | | 4,736,358 | | |
| | | | | Total Mortgage-Backed Securities (Cost $62,546,539) | | | 61,077,955 | | |
| Corporate Debt Securities (39.9%) | |
| Aerospace & Defense (0.2%) | |
| | 445,000 | | | United Technologies Corp., Senior Unsecured Notes, 1.20%, due 6/1/15 | | | 451,371 | | |
| Auto Manufacturers (1.0%) | |
| | 2,215,000 | | | Daimler Finance N.A. LLC, Guaranteed Notes, 1.65%, due 4/10/15 | | | 2,242,169 | ñ | |
| Banks (11.6%) | |
| | 980,000 | | | American Express Centurion Bank, Guaranteed Notes, 0.88%, due 11/13/15 | | | 979,280 | | |
| | 3,130,000 | | | Citigroup, Inc., Senior Unsecured Notes, 2.65%, due 3/2/15 | | | 3,223,168 | | |
| | 1,540,000 | | | Goldman Sachs Group, Inc., Senior Unsecured Notes, 5.25%, due 10/15/13 | | | 1,593,918 | | |
| | 1,280,000 | | | Goldman Sachs Group, Inc., Senior Unsecured Medium-Term Notes, 1.60%, due 11/23/15 | | | 1,288,994 | | |
| | 6,300,000 | | | JPMorgan Chase & Co., Senior Unsecured Medium-Term Notes, 1.88%, due 3/20/15 | | | 6,413,268 | | |
| | 2,975,000 | | | Morgan Stanley, Senior Unsecured Global Medium-Term Notes, 6.00%, due 5/13/14 | | | 3,150,436 | | |
| | 4,875,000 | | | Wells Fargo & Co., Senior Unsecured Notes, 1.50%, due 7/1/15 | | | 4,958,991 | | |
| | 1,905,000 | | | Westpac Banking Corp., Senior Unsecured Notes, 1.85%, due 12/9/13 | | | 1,932,840 | | |
| | 2,780,000 | | | Westpac Banking Corp., Senior Unsecured Notes, 1.13%, due 9/25/15 | | | 2,805,754 | | |
| | | | 26,346,649 | | |
| Beverages (2.0%) | |
| | 3,350,000 | | | Anheuser-Busch Cos., LLC, Guaranteed Unsecured Notes, 4.95%, due 1/15/14 | | | 3,499,879 | | |
| | 475,000 | | | Anheuser-Busch InBev Worldwide, Inc., Guaranteed Notes, 1.50%, due 7/14/14 | | | 481,861 | | |
| | 250,000 | | | Anheuser-Busch InBev Worldwide, Inc., Guaranteed Notes, 0.80%, due 7/15/15 | | | 250,654 | | |
| | 280,000 | | | Heineken NV, Senior Notes, 0.80%, due 10/1/15 | | | 280,523 | ñ | |
| | | | 4,512,917 | | |
| Commercial Services (0.9%) | |
| | 1,760,000 | | | ERAC USA Finance LLC, Guaranteed Notes, 2.25%, due 1/10/14 | | | 1,777,933 | ñ | |
| | 305,000 | | | ERAC USA Finance LLC, Guaranteed Notes, 1.40%, due 4/15/16 | | | 307,045 | ñ | |
| | | | 2,084,978 | | |
| Computers (2.2%) | |
| | 5,050,000 | | | IBM Corp., Senior Unsecured Notes, 0.88%, due 10/31/14 | | | 5,092,556 | | |
| Diversified Financial Services (8.7%) | |
| | 2,400,000 | | | American Express Credit Corp., Senior Unsecured Medium-Term Notes, Ser. C, 5.88%, due 5/2/13 | | | 2,443,334 | | |
| | 1,900,000 | | | American Honda Finance Corp., Unsecured Notes, 1.00%, due 8/11/15 | | | 1,910,710 | ñ | |
| | 2,165,000 | | | Caterpillar Financial Services Corp., Senior Unsecured Notes, 1.65%, due 4/1/14 | | | 2,196,358 | | |
| | 875,000 | | | Caterpillar Financial Services Corp., Senior Unsecured Medium-Term Notes, 1.13%, due 12/15/14 | | | 884,386 | | |
| | 6,500,000 | | | General Electric Capital Corp., Senior Unsecured Notes, 5.90%, due 5/13/14 | | | 6,966,148 | | |
| | 1,405,000 | | | Harley-Davidson Financial Services, Inc., Guaranteed Notes, 1.15%, due 9/15/15 | | | 1,408,688 | ñ | |
| | 1,900,000 | | | John Deere Capital Corp., Senior Unsecured Notes, 0.88%, due 4/17/15 | | | 1,908,354 | | |
| | 1,980,000 | | | Toyota Motor Credit Corp., Senior Unsecured Medium-Term Notes, 1.00%, due 2/17/15 | | | 1,993,282 | | |
| | | | 19,711,260 | | |
| Food (0.3%) | |
| | 660,000 | | | Kraft Foods Group, Inc., Senior Unsecured Notes, 1.63%, due 6/4/15 | | | 671,728 | ñ | |
See Notes to Schedule of Investments
6
| PRINCIPAL AMOUNT | | | | VALUE† | |
| Insurance (0.6%) | |
| $ | 1,310,000 | | | Berkshire Hathaway Finance Corp., Guaranteed Notes, 1.50%, due 1/10/14 | | $ | 1,324,748 | | |
| Internet (0.6%) | |
| | 1,310,000 | | | Amazon.com, Inc., Senior Unsecured Notes, 0.65%, due 11/27/15 | | | 1,309,210 | | |
| Media (4.4%) | |
| | 3,250,000 | | | DIRECTV Holdings LLC, Guaranteed Notes, 4.75%, due 10/1/14 | | | 3,470,090 | | |
| | 3,430,000 | | | NBC Universal Media LLC, Senior Unsecured Notes, 2.10%, due 4/1/14 | | | 3,492,776 | | |
| | 2,810,000 | | | Time Warner Cable, Inc., Guaranteed Notes, 3.50%, due 2/1/15 | | | 2,967,750 | | |
| | | | 9,930,616 | | |
| Mining (0.6%) | |
| | 1,280,000 | | | BHP Billiton Finance USA Ltd., Guaranteed Notes, 1.13%, due 11/21/14 | | | 1,295,434 | | |
| Oil & Gas (0.3%) | |
| | 615,000 | | | Marathon Oil Corp., Senior Unsecured Notes, 0.90%, due 11/1/15 | | | 615,496 | | |
| Pharmaceuticals (2.4%) | |
| | 3,420,000 | | | AbbVie, Inc., Guaranteed Notes, 1.20%, due 11/6/15 | | | 3,442,849 | ñ | |
| | 1,555,000 | | | Express Scripts Holding Co., Guaranteed Notes, 2.10%, due 2/12/15 | | | 1,584,009 | ñ | |
| | 500,000 | | | McKesson Corp., Senior Unsecured Notes, 0.95%, due 12/4/15 | | | 500,703 | | |
| | | | 5,527,561 | | |
| Pipelines (0.7%) | |
| | 815,000 | | | Enterprise Products Operating LLC, Guaranteed Notes, 1.25%, due 8/13/15 | | | 820,005 | | |
| | 875,000 | | | TransCanada PipeLines Ltd., Senior Unsecured Notes, 0.88%, due 3/2/15 | | | 879,957 | | |
| | | | 1,699,962 | | |
| Retail (1.4%) | |
| | 3,100,000 | | | Home Depot, Inc., Senior Unsecured Notes, 5.25%, due 12/16/13 | | | 3,243,409 | | |
| Telecommunications (2.0%) | |
| | 2,135,000 | | | AT&T, Inc., Senior Unsecured Notes, 0.88%, due 2/13/15 | | | 2,145,009 | | |
| | 2,275,000 | | | Verizon Communications, Inc., Senior Unsecured Notes, 0.70%, due 11/2/15 | | | 2,275,571 | | |
| | | | 4,420,580 | | |
| | | | | Total Corporate Debt Securities (Cost $89,031,000) | | | 90,480,644 | | |
| Asset-Backed Securities (19.9%) | |
| | 1,331,135 | | | Ally Auto Receivables Trust, Ser. 2010-4, Class A3, 0.91%, due 11/17/14 | | | 1,333,772 | | |
| | 2,005,661 | | | Ally Auto Receivables Trust, Ser. 2011-1, Class A3, 1.38%, due 1/15/15 | | | 2,012,883 | | |
| | 6,825,000 | | | American Express Credit Account Master Trust, Ser. 2012-4, Class A, 0.45%, due 5/15/20 | | | 6,838,138 | µ | |
| | 4,000,000 | | | Carrington Mortgage Loan Trust, Ser. 2007-FRE1, Class A3, 0.47%, due 2/25/37 | | | 1,967,164 | µ | |
| | 4,382,734 | | | Ford Credit Auto Owner Trust, Ser. 2011-A, Class A3, 0.97%, due 1/15/15 | | | 4,392,648 | | |
| | 4,581,198 | | | Hyundai Auto Receivables Trust, Ser. 2011-A, Class A3, 1.16%, due 4/15/15 | | | 4,598,932 | | |
| | 3,875,000 | | | Mercedes-Benz Auto Receivables Trust, Ser. 2012-1, Class A2, 0.37%, due 3/16/15 | | | 3,876,480 | | |
| | 1,894,381 | | | Mercedes-Benz Auto Receivables Trust, Ser. 2011-1, Class A3, 0.85%, due 3/16/15 | | | 1,898,835 | | |
| | 5,375,000 | | | Nissan Auto Receivables Owner Trust, Ser. 2012-B, Class A2, 0.39%, due 4/15/15 | | | 5,377,037 | | |
| | 3,712,074 | | | SLM Student Loan Trust, Ser. 2004-5, Class A4, 0.47%, due 1/25/21 | | | 3,709,561 | µ | |
| | 5,692,325 | | | SLM Student Loan Trust, Ser. 2006-5, Class A4, 0.40%, due 4/25/23 | | | 5,685,226 | µ | |
| | 4,057,384 | | | Soundview Home Equity Loan Trust, Ser. 2006-OPT3, Class 2A3, 0.38%, due 6/25/36 | | | 3,310,939 | µ | |
| | | | | Total Asset-Backed Securities (Cost $47,573,009) | | | 45,001,615 | | |
See Notes to Schedule of Investments
7
| NUMBER OF SHARES | | | | VALUE† | |
| Short-Term Investments (0.6%) | |
| | 1,247,138 | | | State Street Institutional Liquid Reserves Fund Institutional Class (Cost $1,247,138) | | $ | 1,247,138 | | |
| | | Total Investments (100.2%) (Cost $229,824,939) | | | 227,079,409 | ## | |
| | | Liabilities, less cash, receivables and other assets [(0.2%)] | | | (486,706 | ) | |
| | | Total Net Assets (100.0%) | | $ | 226,592,703 | | |
See Notes to Schedule of Investments
8
Notes to Schedule of Investments Short Duration Bond Portfolio
† In accordance with Accounting Standards Codification ("ASC") 820 "Fair Value Measurements and Disclosures" ("ASC 820"), all investments held by Neuberger Berman Advisers Management Trust Short Duration Bond Portfolio (the "Fund") are carried at the value that Neuberger Berman Management LLC ("Management") believes the Fund would receive upon selling an investment in an orderly transaction to an independent buyer in the principal or most advantageous market for the investment under current market conditions. Various inputs, including the volume and level of activity for the asset or liability in the market, are considered in valuing the Fund's investments, some of which are discussed below. Significant management judgment may be necessary to value investments in accordance with ASC 820.
ASC 820 established a three-tier hierarchy of inputs to create a classification of value measurements for disclosure purposes. The three-tier hierarchy of inputs is summarized in the three broad Levels listed below.
• Level 1 – quoted prices in active markets for identical investments
• Level 2 – other significant observable inputs (including quoted prices for similar investments, interest rates, prepayment speeds, credit risk, amortized cost, etc.)
• Level 3 – significant unobservable inputs (including the Fund's own assumptions in determining the fair value of investments)
The inputs or methodology used for valuing an investment are not necessarily an indication of the risk associated with investing in those securities.
The value of the Fund's investments in debt securities is determined by Management primarily by obtaining valuations from independent pricing services based on readily available bid quotations, or if quotations are not available, by methods which include various considerations based on security type (generally Level 2 inputs). In addition to the consideration of yields or prices of securities of comparable quality, coupon, maturity and type; indications as to values from dealers; and general market conditions, the following is a description of other Level 2 inputs and related valuation techniques used by an independent pricing service to value certain types of debt securities of the Fund:
Corporate Debt Securities. Inputs used to value corporate debt securities generally include relative credit information, observed market movements, sector news, spread to the U.S. Treasury market, and other market information which may include benchmark yields, reported trades, broker-dealer quotes, issuer spreads, benchmark securities, bids, offers, and reference data, such as market research publications, when available ("Other Market Information").
U.S. Treasury Securities. Inputs used to value U.S. Treasury securities generally include quotes from several inter-dealer brokers and Other Market Information.
Asset-Backed Securities and Mortgage-Backed Securities. Inputs used to value asset-backed securities and mortgage-backed securities generally include models that consider a number of factors, which may include the following: prepayment speeds, cash flows, spread adjustments and Other Market Information.
The value of financial futures contracts is determined by obtaining valuations from independent pricing services at the settlement price at the market close (Level 1 inputs).
Management has developed a process to periodically review information provided by independent pricing services for all types of securities.
Investments in State Street Institutional Liquid Reserves Fund Institutional Class are valued using the fund's daily calculated net asset value per share (Level 2 inputs).
See Notes to Financial Statements
9
Notes to Schedule of Investments Short Duration Bond Portfolio (cont'd)
If a valuation is not available from an independent pricing service, or if Management has reason to believe that the valuation received does not represent the amount the Fund might reasonably expect to receive on a current sale in an orderly transaction, the Fund seeks to obtain quotations from principal market makers (generally considered Level 3 inputs). If such quotations are not readily available, the security is valued using methods the Neuberger Berman Advisers Management Trust's Board of Trustees (the "Board") has approved on the belief that they reflect fair value. Numerous factors may be considered when determining the fair value of a security based on Level 2 or 3 inputs, including available analyst, media or other reports, trading in futures or ADRs and whether the issuer of the security being fair valued has other securities outstanding.
Fair value prices are necessarily estimates, and there is no assurance that such a price will be at or close to the price at which the security is next quoted or next trades.
The following is a summary, categorized by Level, of inputs used to value the Fund's investments as of December 31, 2012:
| Asset Valuation Inputs | | Level 1 | | Level 2 | | Level 3 | | Total | |
| Investments: | |
U.S. Treasury Securities-Backed by the Full Faith and Credit of the U.S. Government | | $ | — | | | $ | 29,272,057 | | | $ | — | | | $ | 29,272,057 | | |
| Mortgage-Backed Securities^ | | | — | | | | 61,077,955 | | | | — | | | | 61,077,955 | | |
| Corporate Debt Securities^ | | | — | | | | 90,480,644 | | | | — | | | | 90,480,644 | | |
| Asset-Backed Securities | | | — | | | | 45,001,615 | | | | — | | | | 45,001,615 | | |
| Short-Term Investments | | | — | | | | 1,247,138 | | | | — | | | | 1,247,138 | | |
| Total Investments | | $ | — | | | $ | 227,079,409 | | | $ | — | | | $ | 227,079,409 | | |
^ The Schedule of Investments provides information on the industry categorization for the portfolio.
The Fund had no transfers between Levels 1 and 2 during the year ended December 31, 2012.
## At December 31, 2012, the cost of investments for U.S. federal income tax purposes was $231,509,626. Gross unrealized appreciation of investments was $1,392,115 and gross unrealized depreciation of investments was $5,822,332, resulting in net unrealized depreciation of $4,430,217, based on cost for U.S. federal income tax purposes.
µ Floating rate securities are securities whose yields vary with a designated market index or market rate. These securities are shown at their current rates as of December 31, 2012 and their final maturity dates.
ñ Securities were purchased under Rule 144A of the Securities Act of 1933, as amended (the "1933 Act"), or are private placements and, unless registered under the 1933 Act or exempted from registration, may only be sold to qualified institutional investors. These securities have been deemed by the investment manager to be liquid. At December 31, 2012, these securities amounted to $27,198,232 or 12.0% of net assets for the Fund.
See Notes to Financial Statements
10
Statement of Assets and Liabilities
Neuberger Berman Advisers Management Trust
| | | SHORT DURATION BOND PORTFOLIO | |
| | | December 31, 2012 | |
| Assets | |
| Investments in securities, at value* (Note A)—see Schedule of Investments: | |
| Unaffiliated issuers | | $ | 227,079,409 | | |
| Interest receivable | | | 1,349,801 | | |
| Receivable for securities sold | | | 3,123,413 | | |
| Receivable for Fund shares sold | | | 149,806 | | |
| Prepaid expenses and other assets | | | 4,681 | | |
| Total Assets | | | 231,707,110 | | |
| Liabilities | |
| Payable for securities purchased | | | 3,489,917 | | |
| Payable for Fund shares redeemed | | | 1,392,604 | | |
| Payable to investment manager (Note B) | | | 48,755 | | |
| Payable to administrator (Note B) | | | 78,008 | | |
| Accrued expenses and other payables | | | 105,123 | | |
| Total Liabilities | | | 5,114,407 | | |
| Net Assets | | $ | 226,592,703 | | |
| Net Assets consist of: | |
| Paid-in capital | | $ | 305,531,117 | | |
| Undistributed net investment income (loss) | | | 4,925,310 | | |
| Accumulated net realized gains (losses) on investments | | | (81,118,194 | ) | |
| Net unrealized appreciation (depreciation) in value of investments | | | (2,745,530 | ) | |
| Net Assets | | $ | 226,592,703 | | |
| Shares Outstanding ($.001 par value; unlimited shares authorized) | | | 20,686,875 | | |
| Net Asset Value, offering and redemption price per share | | $ | 10.95 | | |
| *Cost of Investments | | $ | 229,824,939 | | |
See Notes to Financial Statements
11
Statement of Operations
Neuberger Berman Advisers Management Trust
| | | SHORT DURATION BOND PORTFOLIO | |
| | | For the Year Ended December 31, 2012 | |
| Investment Income: | |
| Income (Note A): | |
| Interest income—unaffiliated issuers | | $ | 4,905,909 | | |
| Foreign taxes withheld | | | (674 | ) | |
| Total income | | $ | 4,905,235 | | |
| Expenses: | |
| Investment management fees (Note B) | | | 609,032 | | |
| Administration fees (Note B) | | | 974,452 | | |
| Audit fees | | | 53,585 | | |
| Custodian fees | | | 89,242 | | |
| Insurance expense | | | 13,994 | | |
| Legal fees | | | 124,504 | | |
| Shareholder reports | | | 58,466 | | |
| Trustees' fees and expenses | | | 51,014 | | |
| Miscellaneous | | | 16,629 | | |
| Total expenses | | | 1,990,918 | | |
| Expenses reduced by custodian fee expense offset arrangement (Note A) | | | (108 | ) | |
| Total net expenses | | | 1,990,810 | | |
| Net investment income (loss) | | $ | 2,914,425 | | |
| Realized and Unrealized Gain (Loss) on Investments (Note A): | |
| Net realized gain (loss) on: | |
| Sales of investment securities of unaffiliated issuers | | | (6,919,121 | ) | |
| Financial futures contracts | | | (4,306 | ) | |
| Change in net unrealized appreciation (depreciation) in value of: | |
| Unaffiliated investment securities | | | 15,038,873 | | |
| Financial futures contracts | | | (2,109 | ) | |
| Net gain (loss) on investments | | | 8,113,337 | | |
| Net increase (decrease) in net assets resulting from operations | | $ | 11,027,762 | | |
See Notes to Financial Statements
12
Statements of Changes in Net Assets
Neuberger Berman Advisers Management Trust
| | | SHORT DURATION BOND PORTFOLIO | |
| | | Year Ended December 31, 2012 | | Year Ended December 31, 2011 | |
| Increase (Decrease) in Net Assets: | |
| From Operations (Note A): | |
| Net investment income (loss) | | $ | 2,914,425 | | | $ | 4,712,102 | | |
| Net realized gain (loss) on investments | | | (6,923,427 | ) | | | (3,412,879 | ) | |
| Change in net unrealized appreciation (depreciation) of investments | | | 15,036,764 | | | | (350,022 | ) | |
| Net increase (decrease) in net assets resulting from operations | | | 11,027,762 | | | | 949,201 | | |
| Distributions to Shareholders From (Note A): | |
| Net investment income | | | (7,045,678 | ) | | | (9,927,354 | ) | |
| From Fund Share Transactions (Note D): | |
| Proceeds from shares sold | | | 29,582,967 | | | | 23,227,502 | | |
| Proceeds from reinvestment of dividends and distributions | | | 7,045,678 | | | | 9,927,354 | | |
| Payments for shares redeemed | | | (59,582,782 | ) | | | (65,920,504 | ) | |
| Net increase (decrease) from Fund share transactions | | | (22,954,137 | ) | | | (32,765,648 | ) | |
| Net Increase (Decrease) in Net Assets | | | (18,972,053 | ) | | | (41,743,801 | ) | |
| Net Assets: | |
| Beginning of year | | | 245,564,756 | | | | 287,308,557 | | |
| End of year | | $ | 226,592,703 | | | $ | 245,564,756 | | |
| Undistributed net investment income (loss) at end of year | | $ | 4,925,310 | | | $ | 7,045,031 | | |
See Notes to Financial Statements
13
Notes to Financial Statements Short Duration Bond Portfolio
Note A—Summary of Significant Accounting Policies:
1 General: Neuberger Berman Advisers Management Trust (the "Trust") is a Delaware statutory trust organized pursuant to a Trust Instrument dated May 23, 1994. The Trust is currently comprised of ten separate operating series (each individually a "Series," and collectively the "Funds") each of which is diversified. The Trust is registered as an open-end management investment company under the Investment Company Act of 1940, as amended (the "1940 Act"), and its shares are registered under the 1933 Act. The Fund currently offers only Class I shares. The Board may establish additional series or classes of shares without the approval of shareholders.
The assets of each Series belong only to that Series, and the liabilities of each Series are borne solely by that Series and no other.
The preparation of financial statements in accordance with U.S. generally accepted accounting principles ("GAAP") requires Management to make estimates and assumptions at the date of the financial statements. Actual results could differ from those estimates.
2 Portfolio valuation: Investment securities are valued as indicated in the notes following the Schedule of Investments.
3 Foreign currency translation: The accounting records of the Fund are maintained in U.S. dollars. Foreign currency amounts are translated into U.S. dollars using the exchange rate as of 4:00 p.m., Eastern time, to determine the value of investments, other assets and liabilities. Purchase and sale prices of securities, and income and expenses, are translated into U.S. dollars at the prevailing rate of exchange on the respective dates of such transactions. Net unrealized foreign currency gain (loss), if any, arises from changes in the value of assets and liabilities, other than investments in securities, as a result of changes in exchange rates and is stated separately in the Statement of Operations.
4 Securities transactions and investment income: Securities transactions are recorded on trade date for financial reporting purposes. Interest income, including accretion of discount (adjusted for original issue discount, where applicable) is recorded on the accrual basis. Realized gains and losses from securities transactions and foreign currency transactions, if any, are recorded on the basis of identified cost and stated separately in the Statement of Operations.
5 Income tax information: The Funds are treated as separate entities for U.S. federal income tax purposes. It is the policy of the Fund to continue to qualify for treatment as a regulated investment company by complying with the requirements of the U.S. Internal Revenue Code applicable to regulated investment companies and to distribute substantially all of its net investment income and net realized capital gains to its shareholders. To the extent the Fund distributes substantially all of its net investment income and net realized capital gains to shareholders, no federal income or excise tax provision is required.
The Fund has adopted the provisions of ASC 740 "Income Taxes" ("ASC 740"). ASC 740 sets forth a minimum threshold for financial statement recognition of a tax position taken, or expected to be taken, in a tax return. The Fund recognizes interest and penalties, if any, related to unrecognized tax positions as an income tax expense in the Statement of Operations. The Fund is subject to examination by U.S. federal and state tax authorities for returns filed for the prior three fiscal years 2009 - 2011. As of December 31, 2012, the Fund did not have any unrecognized tax positions.
Income distributions and capital gain distributions are determined in accordance with income tax regulations, which may differ from GAAP. These differences are primarily due to differing treatments of income and gains on various investment securities held by the Fund, timing differences and differing characterization of distributions made by the Fund. The Fund may also utilize earnings and profits distributed to shareholders on redemption of shares as a part of the dividends-paid deduction for income tax purposes.
14
As determined on December 31, 2012, permanent differences resulting primarily from different book and tax accounting were reclassified at year end. Such differences may be attributed to one or more of the following: paydown gains and losses, amortization of bond premium and capital loss carryforwards expiring. These reclassifications had no effect on net income, net asset value ("NAV") or NAV per share of the Fund. For the year ended December 31, 2012, the Fund recorded the following permanent reclassifications:
| Paid-in Capital | | Undistributed Net Investment Income (Loss) | | Accumulated Net Realized Gains (Losses) on Investments | |
| $ | (2,710,071 | ) | | $ | 2,011,532 | | | $ | 698,539 | | |
For tax purposes, distributions of short-term gains are taxable to shareholders as ordinary income.
The tax character of distributions paid during the years ended December 31, 2012 and December 31, 2011 was as follows:
| Distributions Paid From: | |
| Ordinary Income | | Total | |
| 2012 | | 2011 | | 2012 | | 2011 | |
| $ | 7,045,678 | | | $ | 9,927,354 | | | $ | 7,045,678 | | | $ | 9,927,354 | | |
As of December 31, 2012, the components of distributable earnings (accumulated losses) on a U.S. federal income tax basis were as follows:
Undistributed Ordinary Income | | Unrealized Appreciation (Depreciation) | | Loss Carryforwards and Deferrals | | Other Temporary Differences | | Total | |
| $ | 4,925,310 | | | $ | (4,430,217 | ) | | $ | (79,433,507 | ) | | $ | — | | | $ | (78,938,414 | ) | |
The difference between book basis and tax basis distributable earnings are primarily due to: timing differences of amortization of bond premium, wash sales and capital loss carryforwards.
To the extent the Fund's net realized capital gains, if any, can be offset by capital loss carryforwards, it is the policy of the Fund not to distribute such gains. The Regulated Investment Company ("RIC") Modernization Act of 2010 (the "Act") became effective for the Fund on January 1, 2011. The Act modernizes several of the federal income and excise tax provisions related to RICs. Among the changes made are changes to the capital loss carryforward rules allowing for RICs to carry forward capital losses indefinitely and to retain the character of capital loss carryforwards as short-term or long-term ("Post-Enactment"). Rules in effect previously limited the carryforward period to eight years and all carryforwards were considered short-term in character ("Pre-Enactment"). As determined at December 31, 2012, the Fund had unused capital loss carryforwards available for federal income tax purposes to offset net realized capital gains, if any, as follows:
| Pre-Enactment | |
| Expiring in: | |
| 2013 | | 2014 | | 2015 | | 2016 | | 2017 | | 2018 | |
| $ | 4,632,986 | | | $ | 3,820,726 | | | $ | 514,506 | | | $ | — | | | $ | 45,541,698 | | | $ | 7,896,656 | | |
| Post-Enactment (No Expiration Date) | |
| Long-Term | | Short-Term | |
| $ | 16,065,672 | | | $ | 961,263 | | |
15
Post-Enactment capital loss carryforwards must be fully used before Pre-Enactment capital loss carryforwards; therefore, under certain circumstances, Pre-Enactment capital loss carryforwards available as of the report date may expire unused.
The Fund had $2,710,070 of capital loss carryforwards that expired during the year ended December 31, 2012.
6 Distributions to shareholders: The Fund may earn income, net of expenses, daily on its investments. Distributions from net investment income and net realized capital gains, if any, generally are distributed once a year (usually in October). Income distributions and capital gain distributions to shareholders are recorded on the ex-date.
7 Foreign taxes: Foreign taxes withheld represent amounts withheld by foreign tax authorities, net of refunds recoverable.
8 Expense allocation: Certain expenses are applicable to multiple funds. Expenses directly attributable to a Series are charged to that Series. Expenses of the Trust that are not directly attributable to a particular series of the Trust (e.g., the Fund) are allocated among the series of the Trust, on the basis of relative net assets, except where a more appropriate allocation of expenses to each of the series can otherwise be made fairly. Expenses borne by the complex of related investment companies, which includes open-end and closed-end investment companies for which Management serves as investment manager, that are not directly attributable to a particular investment company in the complex (e.g., the Trust) or series thereof are allocated among the investment companies in the complex or series thereof, on the basis of relative net assets, except where a more appropriate allocation of expenses to each of the investment companies in the complex or series thereof can otherwise be made fairly.
9 Dollar rolls: The Fund may enter into dollar roll transactions with respect to mortgage-backed securities. In a dollar roll transaction, the Fund sells securities for delivery in the current month and simultaneously agrees to repurchase substantially similar (i.e., same type and coupon) securities on a specified future date from the same party. During the period before the repurchase, the Fund foregoes principal and interest payments on the securities. The Fund is compensated by the difference between the current sales price and the forward price for the future purchase (often referred to as the "drop"), as well as by the interest earned on the cash proceeds of the initial sale. Dollar rolls may increase fluctuations in the Fund's NAV and may be viewed as a form of leverage. There is a risk that the counterparty will be unable or unwilling to complete the transaction as scheduled, which may result in losses to the Fund.
10 Investments in foreign securities: Investing in foreign securities may involve certain sovereign and other risks, in addition to the credit and market risks normally associated with domestic securities. These additional risks include the possibility of adverse political and economic developments (including political instability, nationalization, expropriation, or confiscatory taxation) and the potentially adverse effects of unavailability of public information regarding issuers, less governmental supervision and regulation of financial markets, reduced liquidity of certain financial markets, and the lack of uniform accounting, auditing, and financial reporting standards or the application of standards that are different or less stringent than those applied in the United States. Foreign securities also may experience greater price volatility, higher rates of inflation, and delays in settlement.
11 Derivative instruments: During the year ended December 31, 2012, the Fund's use of derivatives was limited to financial futures contracts. The Fund has adopted the provisions of ASC 815 "Derivatives and Hedging" ("ASC 815"). The disclosure requirements of ASC 815 distinguish between derivatives that qualify for hedge accounting and those that do not. Because investment companies value their derivatives at fair value and recognize changes in fair value through the Statement of Operations, they do not qualify for hedge accounting. Accordingly, even though the Fund's investments in derivatives may represent economic hedges, they are considered non-hedge transactions for purposes of this disclosure.
Financial futures contracts: During the year ended December 31, 2012, the Fund entered into financial futures contracts for economic hedging purposes, including as a maturity or duration management device. There were no financial futures contracts outstanding at December 31, 2012.
16
At the time the Fund enters into a financial futures contract, it is required to deposit with the futures commission merchant a specified amount of cash or liquid securities, known as "initial margin," which is a percentage of the value of the financial futures contract being traded that is set by the exchange upon which the futures contract is traded. Each day, the futures contract is valued at the official settlement price of the board of trade or U.S. commodity exchange on which such futures contract is traded. Subsequent payments, known as "variation margin," to and from the broker are made on a daily basis, or as needed, as the market price of the financial futures contract fluctuates. Daily variation margin adjustments, arising from this "mark to market," are recorded by the Fund as unrealized gains or losses.
Although some financial futures contracts by their terms call for actual delivery or acquisition of the underlying securities or currency, in most cases the contracts are closed out prior to delivery by offsetting purchases or sales of matching financial futures contracts. When the contracts are closed, the Fund recognizes a gain or loss. Risks of entering into futures contracts include the possibility there may be an illiquid market, possibly at a time of rapidly declining prices, and/or a change in the value of the contract may not correlate with changes in the value of the underlying securities. Futures executed on regulated futures exchanges have minimal counterparty risk to a fund because the exchange's clearinghouse assumes the position of the counterparty in each transaction. Thus, the Fund is exposed to risk only in connection with the clearinghouse and not in connection with the original counterparty to the transaction.
For U.S. federal income tax purposes, the futures transactions undertaken by the Fund may cause the Fund to recognize gains or losses from marking contracts to market even though its positions have not been sold or terminated, may affect the character of the gains or losses recognized as long-term or short-term, and may affect the timing of some capital gains and losses realized by the Fund. Also, the Fund's losses on transactions involving futures contracts may be deferred rather than being taken into account currently in calculating the Fund's taxable income.
During the year ended December 31, 2012, the average notional value of financial futures contracts for long positions was $1,525,673.
The impact of the use of these derivative instruments on the Statement of Operations during the year ended December 31, 2012, was as follows:
Realized Gain (Loss)
| | | Interest Rate Risk | | Statement of Operations Location | |
| Futures Contracts | | $ | (4,306 | ) | | Net realized | |
| Total Realized Gain (Loss) | | $ | (4,306 | ) | | gain (loss) on: financial futures contracts | |
Change in Appreciation (Depreciation)
| | | Interest Rate Risk | | | |
| Futures Contracts | | $ | (2,109 | ) | | Change in net unrealized | |
Total Change in Appreciation (Depreciation) | | $ | (2,109 | ) | | appreciation (depreciation) in value of: financial futures contracts | |
12 Indemnifications: Like many other companies, the Trust's organizational documents provide that its officers and trustees are indemnified against certain liabilities arising out of the performance of their duties to the Trust. In addition, both in some of its principal service contracts and in the normal course of its business, the Trust enters into contracts that provide indemnifications to other parties for certain types of losses or liabilities. The Trust's maximum exposure under these arrangements is unknown as this could involve future claims against the Trust.
17
13 Expense offset arrangement: The Fund has an expense offset arrangement in connection with its custodian contract. For the year ended December 31, 2012, the impact of this arrangement was a reduction of expenses of $108.
Note B—Management Fees, Administration Fees, Distribution Arrangements, and Other Transactions with Affiliates:
Fund shares are issued and redeemed in connection with investments in and payments under certain variable annuity contracts and variable life insurance policies issued through separate accounts of life insurance companies and are also offered directly to certain qualified pension and retirement plans.
The Fund retains Management as its investment manager under a Management Agreement. For such investment management services, the Fund pays Management a fee at the annual rate of 0.25% of the first $500 million of the Fund's average daily net assets, 0.225% of the next $500 million, 0.20% of the next $500 million, 0.175% of the next $500 million, and 0.15% of average daily net assets in excess of $2 billion. Accordingly, for the year ended December 31, 2012, the management fee pursuant to the Management Agreement was equivalent to an annual effective rate of 0.25% of the Fund's average daily net assets. As sub-adviser Neuberger Berman Fixed Income LLC ("NBFI") receives a monthly fee paid by Management. The Fund does not pay a fee directly to NBFI for such services.
The Fund retains Management as its administrator under an Administration Agreement. The Fund pays Management an administration fee at the annual rate of 0.40% of its average daily net assets under this agreement. Additionally, Management retains State Street Bank and Trust Company ("State Street") as its sub-administrator under a Sub-Administration Agreement. Management pays State Street a fee for all services received under this agreement.
The Board adopted a non-fee distribution plan for the Fund.
Management has contractually undertaken through December 31, 2015 to waive current payment of fees and/or reimburse the Fund for its operating expenses (excluding fees payable to Management, interest, taxes, brokerage commissions, extraordinary expenses, transaction costs and dividend expense on short sales, if any) ("Operating Expenses") which exceed, in the aggregate, 1.00% per annum of the Fund's average daily net assets (the "Expense Limitation"). For the year ended December 31, 2012, no reimbursement to the Fund was required. The Fund has agreed to repay Management through December 31, 2018 for fees and expenses waived and/or its excess Operating Expenses previously reimbursed by Management, so long as its annual Operating Expenses during that period do not exceed its Expense Limitation in place at the time the fees and expenses were waived or reimbursed, and the repayment is made within three years after the year in which Management issued the reimbursement or waived fees. During the year ended December 31, 2012, there was no repayment to Management under its contractual expense limitation. At December 31, 2012, the Fund had no contingent liability to Management under its contractual expense limitation.
NBFI, as the sub-adviser to the Fund, is retained by Management to furnish it with investment recommendations and research information without added cost to the Fund. Several individuals who are officers and/or trustees of the Trust are also employees of NBFI and/or Management.
Management and NBFI are indirect subsidiaries of Neuberger Berman Group LLC (("NBG") and together with its consolidated subsidiaries ("NB Group")). NBSH Acquisition, LLC ("NBSH"), which is owned by portfolio managers, members of the NB Group management team and certain of NB Group's key employees and senior professionals, owns, as of September 30, 2012, approximately 57% of NBG's common units, and Lehman Brothers Holdings Inc. ("LBHI") and certain of its subsidiaries (collectively the "LBHI Parties") own the remaining 43% of such common units. Pursuant to agreements among NBG, NBSH and the LBHI Parties, NBG is entitled to acquire the remaining Class A common units through a process that is expected to end in 2017. In April 2012, NBG exercised its option (the "Redemption Agreement Option") to redeem during 2012 certain of its Class A common units held by the LBHI Parties equal to 10% of NBG's aggregate common units issued and outstanding as of March 16, 2012. The final payment for such Class A common units is due within thirty (30) days of December 31, 2012.
18
Note C—Securities Transactions:
Cost of purchases and proceeds of sales and maturities of long-term securities (excluding financial futures contracts) for the year ended December 31, 2012 were as follows:
Purchases of U.S. Government and Agency Obligations | | Purchases excluding U.S. Government and Agency Obligations | | Sales and Maturities of U.S. Government and Agency Obligations | | Sales and Maturities excluding U.S. Government and Agency Obligations | |
| $ | 73,737,472 | | | $ | 79,619,669 | | | $ | 57,202,965 | | | $ | 119,947,714 | | |
Note D—Fund Share Transactions:
Share activity for the years ended December 31, 2012 and December 31, 2011 was as follows:
| | | For the Year Ended December 31, | |
| | | 2012 | | 2011 | |
| Shares Sold | | | 2,696,181 | | | | 2,071,645 | | |
| Shares Issued on Reinvestment of Dividends and Distributions | | | 645,209 | | | | 924,335 | | |
| Shares Redeemed | | | (5,402,599 | ) | | | (5,895,200 | ) | |
| Total | | | (2,061,209 | ) | | | (2,899,220 | ) | |
Note E—Line of Credit:
At December 31, 2012, the Fund was a participant in a single committed, unsecured $200,000,000 line of credit with State Street, to be used only for temporary or emergency purposes. Other investment companies managed by Management also participate in this line of credit on the same terms. Interest is charged on borrowings under this line of credit at the higher of (a) the Federal Funds Rate plus 1.25% per annum or (b) the Overnight LIBOR Rate plus 1.25% per annum. A commitment fee of 0.10% per annum of the available line of credit is charged, of which each participating Fund has agreed to pay its pro rata share, based on the ratio of its individual net assets to the net assets of all participants at the time the fee is due and payable. The fee is paid quarterly in arrears. Because several mutual funds participate, there is no assurance that an individual Fund will have access to all or any part of the $200,000,000 at any particular time. There were no loans outstanding pursuant to this line of credit at December 31, 2012. During the year ended December 31, 2012, the Fund did not utilize this line of credit.
Note F—Recent Accounting Pronouncement:
In December 2011, the Financial Accounting Standards Board issued Accounting Standards Update 2011-11 Disclosures about Offsetting Assets and Liabilities ("ASU 2011-11"). Effective for annual reporting periods beginning on or after January 1, 2013 and interim periods within those annual periods, ASU 2011-11 is intended to enhance disclosure requirements on the offsetting of financial assets and liabilities. At this time, Management is evaluating the implications of ASU 2011-11 and its impact on the financial statements.
19
Financial Highlights
Short Duration Bond Portfolio
The following table includes selected data for a share outstanding throughout each year and other performance information derived from the Financial Statements. Per share amounts that round to less than $.01 or $(.01) per share are presented as $.00 or $(.00), respectively.
| | | Year Ended December 31, | |
| | | 2012 | | 2011 | | 2010 | | 2009 | | 2008 | |
| Net Asset Value, Beginning of Year | | $ | 10.79 | | | $ | 11.20 | | | $ | 11.22 | | | $ | 10.71 | | | $ | 13.00 | | |
| Income From Investment Operations: | |
Net Investment Income (Loss)‡ | | | .13 | | | | .19 | | | | .24 | | | | .43 | | | | .53 | | |
Net Gains or Losses on Securities (both realized and unrealized) | | | .37 | | | | (.16 | ) | | | .36 | | | | .98 | | | | (2.23 | ) | |
| Total From Investment Operations | | | .50 | | | | .03 | | | | .60 | | | | 1.41 | | | | (1.70 | ) | |
| Less Distributions From: | |
| Net Investment Income | | | (.34 | ) | | | (.44 | ) | | | (.62 | ) | | | (.90 | ) | | | (.59 | ) | |
| Net Asset Value, End of Year | | $ | 10.95 | | | $ | 10.79 | | | $ | 11.20 | | | $ | 11.22 | | | $ | 10.71 | | |
Total Return†† | | | 4.61 | % | | | .29 | % | | | 5.28 | % | | | 13.33 | % | | | (13.43 | )% | |
| Ratios/Supplemental Data | |
| Net Assets, End of Year (in millions) | | $ | 226.6 | | | $ | 245.6 | | | $ | 287.3 | | | $ | 350.0 | | | $ | 445.5 | | |
Ratio of Gross Expenses to Average Net Assets# | | | .82 | % | | | .81 | % | | | .81 | % | | | .79 | % | | | .74 | % | |
Ratio of Net Expenses to Average Net Assets§ | | | .82 | % | | | .81 | % | | | .81 | % | | | .79 | % | | | .74 | % | |
Ratio of Net Investment Income (Loss) to Average Net Assets | | | 1.20 | % | | | 1.73 | % | | | 2.07 | % | | | 3.87 | % | | | 4.35 | % | |
| Portfolio Turnover Rate | | | 67 | % | | | 74 | % | | | 70 | % | | | 47 | % | | | 46 | % | |
See Notes to Financial Highlights
20
Notes to Financial Highlights Short Duration Bond Portfolio
†† Total return based on per share NAV reflects the effects of changes in NAV on the performance of the Fund during each fiscal period and assumes income dividends and other distributions, if any, were reinvested. Results represent past performance and do not indicate future results. Current returns may be lower or higher than the performance data quoted. Investment returns and principal may fluctuate and shares when redeemed may be worth more or less than original cost. Total return would have been lower if Management had not waived certain expenses. The total return information shown does not reflect charges and other expenses that apply to the separate account or the related insurance policies, and the inclusion of these charges and other expenses would reduce the total return for all fiscal periods shown.
# Represents the annualized ratios of net expenses to average daily net assets if Management had not waived a portion of the investment management fee.
‡ Calculated based on the average number of shares outstanding during each fiscal period.
§ After waiver of a portion of the investment management fee by Management. The Fund is required to calculate an expense ratio without taking into consideration any expense reductions related to expense offset arrangements. Had the Fund not received expense reductions related to expense offset arrangements, the annualized ratios of net expenses to average daily net assets would have been:
| | | Year Ended December 31, | |
| 2012 | | 2011 | | 2010 | | 2009 | | 2008 | | | |
| | .82 | % | | | .81 | % | | | .81 | % | | | .79 | % | | | .74 | % | | | |
21
Report of Independent Registered Public Accounting Firm
To the Board of Trustees of
Neuberger Berman Advisers Management Trust and
Shareholders of Short Duration Bond Portfolio
We have audited the accompanying statement of assets and liabilities of Short Duration Bond Portfolio, one of the series constituting Neuberger Berman Advisers Management Trust (the "Trust"), including the schedule of investments, as of December 31, 2012, and the related statement of operations for the year then ended, the statements of changes in net assets for each of the two years in the period then ended, and the financial highlights for each of the five years in the period then ended. These financial statements and financial highlights are the responsibility of the Trust's management. Our responsibility is to express an opinion on these financial statements and financial highlights based on our audits.
We conducted our audits in accordance with the standards of the Public Company Accounting Oversight Board (United States). Those standards require that we plan and perform the audit to obtain reasonable assurance about whether the financial statements and financial highlights are free of material misstatement. We were not engaged to perform an audit of the Trust's internal control over financial reporting. Our audits included consideration of internal control over financial reporting as a basis for designing audit procedures that are appropriate in the circumstances, but not for the purpose of expressing an opinion on the effectiveness of the Trust's internal control over financial reporting. Accordingly, we express no such opinion. An audit also includes examining, on a test basis, evidence supporting the amounts and disclosures in the financial statements and financial highlights, assessing the accounting principles used and significant estimates made by management, and evaluating the overall financial statement presentation. Our procedures included confirmation of securities owned as of December 31, 2012 by correspondence with the custodian and others or by other appropriate auditing procedures where replies from others were not received. We believe that our audits provide a reasonable basis for our opinion.
In our opinion, the financial statements and financial highlights referred to above present fairly, in all material respects, the financial position of Short Duration Bond Portfolio, a series of Neuberger Berman Advisers Management Trust, at December 31, 2012, the results of its operations for the year then ended, the changes in its net assets for each of the two years in the period then ended, and the financial highlights for each of the five years in the period then ended, in conformity with U.S. generally accepted accounting principles.
Boston, Massachusetts
February 7, 2013
22
Trustee and Officer Information
The following tables set forth information concerning the trustees ("Trustees") and officers ("Officers") of the Trust. All persons named as Trustees and Officers also serve in similar capacities for other funds administered or managed by Management, Neuberger and NBFI. The Statement of Additional Information includes additional information about Trustees and is available upon request, without charge, by calling (800) 877-9700.
Information about the Board of Trustees
Name, (Year of Birth), and Address(1) | | Position(s) and Length of Time Served(2) | | Principal Occupation(s)(3) | | Number of Funds in Fund Complex Overseen by Fund Trustee | | Other Directorships Held Outside Fund Complex by Fund Trustee(3) | |
| Independent Fund Trustees | |
| Faith Colish (1935) | | Trustee since 1982 | | Counsel, Carter Ledyard & Milburn LLP (law firm) since October 2002; formerly, Attorney-at-Law and President, Faith Colish, A Professional Corporation, 1980 to 2002. | | | 50 | | | Formerly, Director, 1997 to 2003, and Advisory Director, 2003 to 2006, ABA Retirement Funds (formerly, American Bar Retirement Association) (not-for-profit membership corporation). | |
| Martha C. Goss (1949) | | Trustee since 2007 | | President, Woodhill Enterprises Inc./Chase Hollow Associates LLC (personal investment vehicle), since 2006; Chief Operating and Financial Officer, Hopewell Holdings LLC/Amwell Holdings, LLC (a holding company for investments in the healthcare sector), since 2003; formerly, Consultant, Resources Connection (temporary staffing), 2002 to 2006. | | | 50 | | | Director, American Water (water utility), since 2003; Director, Channel Reinsurance (financial guaranty reinsurance), 2006 to 2010; Director, Allianz Life of New York (insurance), since 2005; Director, Financial Women's Association of New York (not-for-profit association), since 2003; Trustee Emerita, Brown University, since 1998; formerly, Director, Ocwen Financial Corporation (mortgage servicing), 2005 to 2010; formerly, Advisory Board Member, Attensity (software developer), 2005 to 2007; formerly, Director, Bank Leumi (commercial bank), 2005 to 2007; formerly, Director, Claire's Stores, Inc. (retailer), 2005 to 2007. | |
23
Name, (Year of Birth), and Address(1) | | Position(s) and Length of Time Served(2) | | Principal Occupation(s)(3) | | Number of Funds in Fund Complex Overseen by Fund Trustee | | Other Directorships Held Outside Fund Complex by Fund Trustee(3) | |
| Michael M. Knetter (1960) | | Trustee since 2007 | | President and Chief Executive Officer, University of Wisconsin Foundation, since October 2010; formerly, Dean, School of Business, University of Wisconsin - Madison; formerly, Professor of International Economics and Associate Dean, Amos Tuck School of Business - Dartmouth College, 1998 to 2002. | | | 50 | | | Director, American Family Insurance (a mutual company, not publicly traded), since March 2009; formerly, Trustee, Northwestern Mutual Series Fund, Inc., 2007 to 2010; formerly, Director, Wausau Paper, 2005 to 2011; formerly, Director, Great Wolf Resorts, 2004 to 2009. | |
| Howard A. Mileaf (1937) | | Trustee since 1999 | | Retired; formerly, Vice President and General Counsel, WHX Corporation (holding company), 1993 to 2001. | | | 50 | | | Formerly, Director, Webfinancial Corporation (holding company), 2002 to 2008; formerly, Director, WHX Corporation (holding company), 2002 to 2005; formerly, Director, State Theatre of New Jersey (not-for-profit theatre), 2000 to 2005. | |
| George W. Morriss (1947) | | Trustee since 2007 | | Adjunct Faculty Member, Columbia University School of International Policy and Administration, since October 2012; formerly, Executive Vice President and Chief Financial Officer, People's Bank, Connecticut (a financial services company), 1991 to 2001. | | | 50 | | | Formerly, Manager, Larch Lane Multi-Strategy Fund complex (which consisted of three funds), 2006 to 2011; formerly, Member, NASDAQ Issuers' Affairs Committee, 1995 to 2003. | |
24
Name, (Year of Birth), and Address(1) | | Position(s) and Length of Time Served(2) | | Principal Occupation(s)(3) | | Number of Funds in Fund Complex Overseen by Fund Trustee | | Other Directorships Held Outside Fund Complex by Fund Trustee(3) | |
| Jack L. Rivkin (1940) | | Trustee since 2002; President 2002 to 2008 | | Formerly, Executive Vice President and Chief Investment Officer, Neuberger Berman Holdings LLC (holding company), 2002 to August 2008 and 2003 to August 2008, respectively; formerly, Managing Director and Chief Investment Officer, Neuberger, December 2005 to August 2008 and 2003 to August 2008, respectively; formerly, Executive Vice President, Neuberger, December 2002 to 2005; formerly, Director and Chairman, Management, December 2002 to August 2008; formerly, Executive Vice President, Citigroup Investments, Inc., September 1995 to February 2002; formerly, Executive Vice President, Citigroup Inc., September 1995 to February 2002. | | | 50 | | | Director, Idealab (private company), since 2009; Director, Distributed World Power (private company), since 2009; Director, Dale Carnegie and Associates, Inc. (private company), since 1999; Director, Solbright, Inc. (private company), since 1998; Director, SA Agricultural Fund, since 2009; Chairman and Director, Essential Brands (consumer products) since 2008; formerly, Director, New York Society of Security Analysts, 2006 to 2008. | |
| Tom D. Seip (1950) | | Trustee since 2000; Chairman of the Board since 2008; Lead Independent Trustee 2006 to 2008 | | General Partner, Ridgefield Farm LLC (a private investment vehicle); formerly, President and CEO, Westaff, Inc. (temporary staffing), May 2001 to January 2002; formerly, Senior Executive, The Charles Schwab Corporation, 1983 to 1998, including Chief Executive Officer, Charles Schwab Investment Management, Inc.; Trustee, Schwab Family of Funds and Schwab Investments, 1997 to 1998; and Executive Vice President-Retail Brokerage, Charles Schwab & Co., Inc., 1994 to 1997. | | | 50 | | | Director, H&R Block, Inc. (financial services company), since May 2001; Chairman, Governance and Nominating Committee, H&R Block, Inc., since 2011; formerly, Chairman, Compensation Committee, H&R Block, Inc., 2006 to 2010; formerly, Director, Forward Management, Inc. (asset management company), 1999 to 2006. | |
25
Name, (Year of Birth), and Address(1) | | Position(s) and Length of Time Served(2) | | Principal Occupation(s)(3) | | Number of Funds in Fund Complex Overseen by Fund Trustee | | Other Directorships Held Outside Fund Complex by Fund Trustee(3) | |
| Candace L. Straight (1947) | | Trustee since 1999 | | Private investor and consultant specializing in the insurance industry; formerly, Advisory Director, Securitas Capital LLC (a global private equity investment firm dedicated to making investments in the insurance sector), 1998 to December 2003. | | | 50 | | | Public Member, Board of Governors and Board of Trustees, Rutgers University, since 2011; Director, Montpelier Re Holdings Ltd. (reinsurance company), since 2006; formerly, Director, National Atlantic Holdings Corporation (property and casualty insurance company), 2004 to 2008; formerly, Director, The Proformance Insurance Company (property and casualty insurance company), 2004 to 2008; formerly, Director, Providence Washington Insurance Company (property and casualty insurance company), 1998 to 2006; formerly, Director, Summit Global Partners (insurance brokerage firm), 2000 to 2005. | |
| Peter P. Trapp (1944) | | Trustee since 1984 | | Retired; formerly, Regional Manager for Mid-Southern Region, Ford Motor Credit Company, September 1997 to 2007; formerly, President, Ford Life Insurance Company, April 1995 to August 1997. | | | 50 | | | None. | |
26
Name, (Year of Birth), and Address(1) | | Position(s) and Length of Time Served(2) | | Principal Occupation(s)(3) | | Number of Funds in Fund Complex Overseen by Fund Trustee | | Other Directorships Held Outside Fund Complex by Fund Trustee(3) | |
| Fund Trustees who are "Interested Persons" | |
| Joseph V. Amato* (1962) | | Trustee since 2009 | | President and Director, Neuberger Berman Group LLC, since 2009; President and Chief Executive Officer, Neuberger and Neuberger Berman Holdings LLC (including its predecessor, Neuberger Berman Inc.), since 2007; Chief Investment Officer, Neuberger, since 2009; Chief Investment Officer (Equities) and Managing Director, Management, since 2009; Managing Director, NBFI, since 2007; Board member of NBFI since 2006; formerly, Global Head of Asset Management of Lehman Brothers Holdings Inc.'s ("LBHI") Investment Management Division, 2006 to 2009; formerly, member of LBHI's Investment Management Division's Executive Management Committee, 2006 to 2009; formerly, Managing Director, Lehman Brothers Inc. ("LBI"), 2006 to 2008; formerly, Chief Recruiting and Development Officer, LBI, 2005 to 2006; formerly, Global Head of LBI's Equity Sales and a Member of its Equities Division Executive Committee, 2003 to 2005. | | | 50 | | | Member of Board of Advisors, McDonough School of Business, Georgetown University, since 2001; Member of New York City Board of Advisors, Teach for America, since 2005; Trustee, Montclair Kimberley Academy (private school), since 2007. | |
27
Name, (Year of Birth), and Address(1) | | Position(s) and Length of Time Served(2) | | Principal Occupation(s)(3) | | Number of Funds in Fund Complex Overseen by Fund Trustee | | Other Directorships Held Outside Fund Complex by Fund Trustee(3) | |
| Robert Conti* (1956) | | Chief Executive Officer, President and Trustee since 2008; prior thereto, Executive Vice President in 2008 and Vice President 2000 to 2008 | | Managing Director, Neuberger, since 2007; formerly, Senior Vice President, Neuberger, 2003 to 2006; formerly, Vice President, Neuberger, 1999 to 2003; President and Chief Executive Officer, Management, since 2008; formerly, Senior Vice President, Management, 2000 to 2008; Managing Director, NBFI, since 2009. | | | 50 | | | Director, Staten Island Mental Health Society, since 1994; formerly, Chairman of the Board, Staten Island Mental Health Society, 2008 to 2011. | |
(1) The business address of each listed person is 605 Third Avenue, New York, New York 10158.
(2) Pursuant to the Trust's Trust Instrument, each of these Fund Trustees shall hold office for life or until his or her successor is elected or the Trust terminates; except that (a) any Fund Trustee may resign by delivering a written resignation; (b) any Fund Trustee may be removed with or without cause at any time by a written instrument signed by at least two-thirds of the other Fund Trustees; (c) any Fund Trustee who requests to be retired, or who has become unable to serve, may be retired by a written instrument signed by a majority of the other Fund Trustees; and (d) any Fund Trustee may be removed at any shareholder meeting by a vote of at least two-thirds of the outstanding shares.
(3) Except as otherwise indicated, each individual has held the positions shown for at least the last five years.
* Indicates a Fund Trustee who is an "interested person" within the meaning of the 1940 Act. Mr. Amato and Mr. Conti are interested persons of the Trust by virtue of the fact that each is an officer of Management, Neuberger and/or their affiliates.
28
Information about the Officers of the Trust
Name, (Year of Birth), and Address(1) | | Position(s) and Length of Time Served(2) | | Principal Occupation(s)(3) | |
| Andrew B. Allard (1961) | | Chief Legal Officer since 2013 (only for purposes of sections 307 and 406 of the Sarbanes-Oxley Act of 2002) and Anti-Money Laundering Compliance Officer since 2002 | | Senior Vice President, Neuberger, since 2006 and Employee since 1999; Deputy General Counsel, Neuberger, since 2004; formerly, Vice President, Neuberger, 2000 to 2005; formerly, Employee, Management, 1994 to 1999; Chief Legal Officer since 2013 (only for purposes of sections 307 and 406 of the Sarbanes-Oxley Act of 2002) and Anti-Money Laundering Compliance Officer since 2002, nine registered investment companies for which Management acts as investment manager and administrator (six since 2002, one since 2003, one since 2005 and one since 2006). | |
| Claudia A. Brandon (1956) | | Executive Vice President since 2008 and Secretary since 1985 | | Senior Vice President, Neuberger, since 2007 and Employee since 1999; Senior Vice President, Management, since 2008 and Assistant Secretary since 2004; formerly, Vice President, Neuberger, 2002 to 2006; formerly, Vice President-Mutual Fund Board Relations, Management, 2000 to 2008; formerly, Vice President, Management, 1986 to 1999 and Employee 1984 to 1999; Executive Vice President, nine registered investment companies for which Management acts as investment manager and administrator (nine since 2008); Secretary, nine registered investment companies for which Management acts as investment manager and administrator (three since 1985, three since 2002, one since 2003, one since 2005 and one since 2006). | |
| Anthony DiBernardo (1979) | | Assistant Treasurer since 2011 | | Vice President, Neuberger, since 2009; Employee, Management, since 2003; Assistant Treasurer, nine registered investment companies for which Management acts as investment manager and administrator (nine since 2011). | |
| Sheila R. James (1965) | | Assistant Secretary since 2002 | | Vice President, Neuberger, since 2008 and Employee since 1999; formerly, Assistant Vice President, Neuberger, 2007; formerly, Employee, Management, 1991 to 1999; Assistant Secretary, nine registered investment companies for which Management acts as investment manager and administrator (six since 2002, one since 2003, one since 2005 and one since 2006). | |
| Brian Kerrane (1969) | | Vice President since 2008 | | Senior Vice President, Neuberger, since 2006; formerly, Vice President, Neuberger, 2002 to 2006; Vice President, Management, since 2008 and Employee since 1991; Vice President, nine registered investment companies for which Management acts as investment manager and administrator (nine since 2008). | |
29
Name, (Year of Birth), and Address(1) | | Position(s) and Length of Time Served(2) | | Principal Occupation(s)(3) | |
| Kevin Lyons (1955) | | Assistant Secretary since 2003 | | Assistant Vice President, Neuberger, since 2008 and Employee since 1999; formerly, Employee, Management, 1993 to 1999; Assistant Secretary, nine registered investment companies for which Management acts as investment manager and administrator (seven since 2003, one since 2005 and one since 2006). | |
| Owen F. McEntee, Jr. (1961) | | Vice President since 2008 | | Vice President, Neuberger, since 2006; Employee, Management, since 1992; Vice President, nine registered investment companies for which Management acts as investment manager and administrator (nine since 2008). | |
| John M. McGovern (1970) | | Treasurer and Principal Financial and Accounting Officer since 2005 | | Senior Vice President, Neuberger, since 2007; formerly, Vice President, Neuberger, 2004 to 2006; Employee, Management, since 1993; Treasurer and Principal Financial and Accounting Officer, nine registered investment companies for which Management acts as investment manager and administrator (eight since 2005 and one since 2006); formerly, Assistant Treasurer, eight registered investment companies for which Management acts as investment manager and administrator, 2002 to 2005. | |
| Frank Rosato (1971) | | Assistant Treasurer since 2005 | | Vice President, Neuberger, since 2006; Employee, Management, since 1995; Assistant Treasurer, nine registered investment companies for which Management acts as investment manager and administrator (eight since 2005 and one since 2006). | |
| Neil S. Siegel (1967) | | Vice President since 2008 | | Managing Director, Management, since 2008; Managing Director, Neuberger, since 2006; formerly, Senior Vice President, Neuberger, 2004 to 2006; Vice President, nine registered investment companies for which Management acts as investment manager and administrator (nine since 2008). | |
| Chamaine Williams (1971) | | Chief Compliance Officer since 2005 | | Senior Vice President, Neuberger, since 2007; Chief Compliance Officer, Management, since 2006; Chief Compliance Officer, nine registered investment companies for which Management acts as investment manager and administrator (eight since 2005 and one since 2006); formerly, Senior Vice President, LBI, 2007 to 2008; formerly, Vice President, LBI, 2003 to 2006; formerly, Chief Compliance Officer, Lehman Brothers Asset Management Inc., 2003 to 2007; formerly, Chief Compliance Officer, Lehman Brothers Alternative Investment Management LLC, 2003 to 2007. | |
(1) The business address of each listed person is 605 Third Avenue, New York, New York 10158.
(2) Pursuant to the By-Laws of the Trust, each officer elected by the Fund Trustees shall hold office until his or her successor shall have been elected and qualified or until his or her earlier death, inability to serve, or resignation. Officers serve at the pleasure of the Fund Trustees and may be removed at any time with or without cause.
(3) Except as otherwise indicated, each individual has held the positions shown for at least the last five years.
30
Proxy Voting Policies and Procedures
A description of the policies and procedures that the Trust uses to determine how to vote proxies relating to portfolio securities is available, without charge, by calling 1-800-877-9700 (toll-free) and on the website of the Securities and Exchange Commission, at www.sec.gov. Information regarding how the Trust voted proxies relating to portfolio securities during the most recent 12-month period ended June 30 is also available, without charge, by calling 1-800-877-9700 (toll-free), on the website of the Securities and Exchange Commission at www.sec.gov, and on Management's website at www.nb.com.
Quarterly Portfolio Schedule
The Trust files a complete schedule of portfolio holdings for the Fund with the Securities and Exchange Commission for the first and third quarters of each fiscal year on Form N-Q. The Trust's Forms N-Q are available on the Securities and Exchange Commission's website at www.sec.gov and may be reviewed and copied at the Securities and Exchange Commission's Public Reference Room in Washington, DC. Information on the operation of the Public Reference Room may be obtained by calling 1-800-SEC-0330. The information on Form N-Q is available upon request, without charge, by calling 1-800-877-9700 (toll free).
Board Consideration of the Management and Sub-Advisory Agreements
At a meeting held on October 25, 2012, the Board of Trustees of Neuberger Berman Advisers Management Trust ("Board"), including the Trustees who are not "interested persons" of Management (including its affiliates) or Neuberger Berman Advisers Management Trust ("Independent Fund Trustees"), approved the continuance of the Management and Sub-Advisory Agreements ("Agreements") for Short Duration Bond Portfolio ("Fund").
In evaluating the Agreements, the Board, including the Independent Fund Trustees, reviewed materials furnished by Management in response to questions submitted by counsel for the Independent Fund Trustees, and met with senior representatives of Management regarding their personnel, operations and financial conditions as they relate to the Fund. The Independent Fund Trustees were advised by counsel that is experienced in Investment Company Act of 1940 matters and that is independent of Management. The Independent Fund Trustees received a memorandum from independent counsel discussing the legal standards for their consideration of the proposed continuance of the Agreements. They met with such counsel separately from representatives of Management to discuss the annual contract review. The annual contract review extends over three regular meetings of the Board, including one meeting devoted primarily to reviewing and discussing Fund performance, to ensure that Management has time to respond to any questions the Independent Fund Trustees may have on their initial review of the report and that the Independent Fund Trustees have time to consider those responses.
The Board considered the following factors, among others, in connection with its approval of the continuance of the Agreements: (1) the nature, extent, and quality of the services provided by Management and NBFI; (2) the performance of the Fund compared to a relevant market index and a peer group of investment companies; (3) the costs of the services provided and profits or losses realized by Management and its affiliates from their relationship with the Fund; (4) the extent to which economies of scale might be realized as the Fund grows; and (5) whether fee levels reflect any such potential economies of scale for the benefit of investors in the Fund. In their deliberations, the Board members did not identify any particular information that was all-important or controlling, and each Trustee may have attributed different weights to the various factors.
The Board evaluated the terms of the Agreements, the overall fairness of the Agreements to the Fund and whether the Agreements were in the best interests of the Fund and its shareholders.
With respect to the nature, extent and quality of the services provided, the Board considered the performance of the Fund and the experience and staffing of the portfolio management personnel of Management and NBFI who perform services for the Fund. The Board noted that Management also provides certain administrative services, including fund accounting
31
and compliance oversight. The Board also considered Management's and NBFI's policies and practices regarding brokerage and allocation of portfolio transactions by Management. The Board's Portfolio Transactions and Pricing Committee from time to time reviewed the quality of the execution services that Management had provided. In addition, the Board noted the positive compliance history of Management and NBFI, as each firm has been free of significant reported compliance problems. As in past years, the Board also considered the manner in which Management addressed various non-routine matters that arose during the year, some of them a result of developments in the broader fund industry or the regulations governing it.
The Board considered the performance of the Fund relative to its benchmark and the average performance of composite peer groups of investment companies dedicated to insurance products pursuing broadly similar strategies. The Board also reviewed performance during the period in relation to certain measures of the degree of investment risk undertaken by the portfolio managers. The Board discussed with Management the Fund's performance and steps that Management had under consideration to improve performance. The Board also considered Management's resources and responsiveness with respect to the Fund.
With respect to the overall fairness of the Agreements, the Board considered the fee structure for the Fund under the Agreements as compared to a peer group of comparable funds and any fall-out benefits likely to accrue to Management or NBFI or their affiliates from their relationship with the Fund. The Board also considered the profitability of Management and its affiliates from their association with the Fund.
The Board reviewed a comparison of the Fund's management fee and overall expense ratio to a peer group of broadly comparable non-proprietary funds dedicated to insurance products. The Board considered the mean and median of the management fees and expense ratios of the peer group. The Board noted that the Fund's management fee was higher than the peer group mean and median. The Board considered whether specific portfolio management or administration needs contributed to the management fee. The Board also considered the contractual limit on Fund expenses undertaken by Management. With regard to the sub-advisory fee paid to NBFI, the Board noted that this fee is "at cost."
The Board considered whether there were other funds that were advised or sub-advised by Management or its affiliates or separate accounts managed by Management or its affiliates with investment objectives, policies and strategies that were similar to the Fund. If so, the Board compared the fees charged to the Fund to the fees charged to any such other funds and/or separate accounts. The Board considered the appropriateness and reasonableness of any differences between the fees charged to the Fund and any such other funds and/or separate accounts and determined that the differences in fees were consistent with the management and other services provided.
The Board also evaluated any apparent or anticipated economies of scale in relation to the services Management provides to the Fund. The Board considered whether the Fund's fee structure provides for a reduction of payments resulting from the use of breakpoints and whether those breakpoints are set at appropriate asset levels. In concluding that the benefits accruing to Management and its affiliates by virtue of their relationship to the Fund were reasonable in comparison with the costs of providing the investment advisory and other services and the benefits accruing to the Fund, the Board reviewed specific data as to Management's profit on the Fund for a recent period. The Board also carefully examined Management's cost allocation methodology. The Board recognized that Management should be entitled to earn a reasonable level of profits for services it provides to the Fund and, based on its review, concluded that Management's level of profitability was not excessive.
Conclusions
In approving the Agreements, the Board concluded that the terms of each Agreement are fair and reasonable and that approval of the Agreements is in the best interests of the Fund and its shareholders. In reaching this determination, the Board considered that Management and NBFI could be expected to provide a high level of service to the Fund; that it retained confidence in Management's and NBFI's capabilities to manage the Fund; that the Fund's fee structure appeared to the Board to be reasonable given the nature and quality of services provided; and that the benefits accruing to Management and its affiliates by virtue of their relationship to the Fund were reasonable in comparison with the benefits accruing to the Fund.
32
Neuberger Berman
Advisers Management Trust
Small Cap Growth Portfolio
S Class Shares
Annual Report
December 31, 2012
D0081 02/13
Small Cap Growth Portfolio Commentary (Unaudited)
The Neuberger Berman Advisers Management Trust (AMT) Small Cap Growth Portfolio generated an 8.82% total return for the fiscal year ended December 31, 2012, but underperformed its benchmark, the Russell 2000® Growth Index, which returned 14.59% for the same period.
The down-to-the-wire fiscal cliff negotiations and resulting deal were a fitting end to a year plagued by political acrimony and economic uncertainty. While the hard fought, but ultimately underwhelming, compromise does address several pertinent tax and entitlement issues, we believe this "not so grand bargain" falls far short of addressing the broader issues around our country's debt ceiling, budget imbalance and credit rating. From our perspective, the risk was never really about going over the cliff, but rather the failure to reach a comprehensive and forward-thinking solution in a reasonable period of time. Unfortunately, that risk still remains.
Setting aside the dysfunctional nature of Washington and the seemingly perpetual "walls of worry," it's important to remember that 2012 actually hosted a positive environment for equities. Highlighted by attractive valuations, solid earnings and efficient bottom-lines, the market rewarded the patience of domestic equity investors with attractive returns overall.
Stylistically, the first three quarters of 2012 were generally receptive to our typical portfolio holdings, which are generally characterized by higher sales and earnings growth, strong bottom-line fundamentals and elevated expectations and, as a result, higher valuations. However, the fourth quarter ushered in a "risk-off" environment, fueled by political and fiscal uncertainty in our opinion, in which the market indiscriminately rotated away from our typical types of holdings. The end result was that our higher P/E and higher growth companies broadly underperformed, resulting in a negative portfolio return for the fourth quarter.
For the year, stock selection was the main driver of performance for the Portfolio. The leading contributor to performance was Ultimate Software Group, a provider of human capital management and employment life cycle software-as-a-service (SaaS) solutions that benefitted from the market's increased interest in SaaS offerings. Other positive contributors to performance included Ulta Salon, an operator of specialty retail stores focused on cosmetic, hair and skin care products, which continued to benefit as consumers traded down from higher-end retail options, and Smart Balance (now Boulder Brands), a manufacturer of health-focused food products, which benefited from surging interest in gluten-free food.
The market reacted positively to CoreLogic, a provider of property, financial and consumer analytics services, which benefited from restructuring efficiencies and the housing market's upturn. Additionally, the Portfolio benefited from merger activity as Ariba, a provider of collaborative business solutions, and Zoll Medical, a developer of cardiopulmonary resuscitation devices, were acquired at a premium. SXC Health Solutions (now Catamaran) also excelled as it acquired and merged with a key competitor. (Ariba, Zoll and SXC were sold during the fiscal year.)
Stock selection within Health Care was generally weak as HMS Holdings, a provider of health care cost containment and audit services, MAKO Surgical, a marketer of robotic and minimally invasive orthopedic implant procedures, and NuVasive, a developer of minimally disruptive surgical products and procedures for the spine, all detracted from performance. The uncertainty surrounding the health care spending mandate negatively impacted HMS, while MAKO saw new equipment placement fall short of expectations and NuVasive missed earnings and significantly lowered guidance.
Our Energy holdings also struggled as downward pressure on prices and demand hurt Rosetta Resources and Energy XXI (Bermuda) Ltd., both focused on onshore exploration and production.
Finally, Liquidity Services, an automated online auction marketplace for bulk, government and salvage assets, disappointed with disclosure of a strategic capital reinvestment related to a recent acquisition, while ACCO Brands Corporation, a producer of office products, faltered with a sustained slowdown in the office merchandise resale industry. For the year, ACCO Brands was the leading detractor to performance. With the exception of Rosetta Resources, we sold all of the aforementioned detractors during the fiscal year.
1
Based on our expectations for the beginning of 2013, our current view is that we are likely to remain overweighted in Consumer Discretionary, Information Technology and Industrials and underweighted in Health Care, Financials and Materials.
As we look ahead into the New Year, we just can't quite shake that feeling of déjà vu. We are once again faced with dire deadlines complicated by substantial ideological differences, an acrimonious political environment and an appalling disregard for effective political compromise. While the confidence and market gains from the year-end cliff deal may prove fleeting, we feel it is important to revisit a lesson of 2012—don't underestimate the resiliency of both our economy and the financial markets. We currently believe valuations are reasonable and that higher-quality companies offering competitive attributes, along with compelling top-line growth that efficiently translates through to the bottom line, will be rewarded by a market that is seeking positive differentiation. To that end, and in spite of the uncertainty that lies ahead, we remain cautiously optimistic that 2013 can be another positive year for small cap equities.
Sincerely,
DAVID H. BURSHTAN
PORTFOLIO MANAGER
Information about the principal risks of investing in the Portfolio in set forth in the prospectus and statement of additional information.
The portfolio composition, industries and holdings of the Portfolio are subject to change.
Opinions expressed are as of the date herein and are subject to change without notice. This material is not intended to be a formal research report and should not be construed as an offer to sell or the solicitation of an offer to buy any security.
2
Small Cap Growth Portfolio (Unaudited)
SECTOR ALLOCATION
| (as a % of Total Investments) | |
| Consumer Discretionary | | | 18.7 | % | |
| Consumer Staples | | | 4.3 | | |
| Energy | | | 5.2 | | |
| Financials | | | 7.1 | | |
| Health Care | | | 19.4 | | |
| Industrials | | | 16.1 | | |
| Information Technology | | | 26.0 | | |
| Materials | | | 3.2 | | |
| Short-Term Investments | | | 0.0 | | |
| Total | | | 100.0 | % | |
PERFORMANCE HIGHLIGHTS
| | | Inception | | Average Annual Total Return Ended 12/31/2012 | |
| | | Date | | 1 Year | | 5 Years | | 10 Years | | Life of Fund | |
Small Cap Growth Portfolio Class S | | | 07/12/2002 | | | | 8.82 | % | | | –0.88 | % | | | 3.84 | % | | | 3.58 | % | |
Russell 2000® Growth Index1,2 | | | | | | | 14.59 | % | | | 3.49 | % | | | 9.80 | % | | | 8.75 | % | |
Russell 2000® Index1,2 | | | | | | | 16.35 | % | | | 3.56 | % | | | 9.72 | % | | | 8.45 | % | |
The performance data quoted represent past performance and do not indicate future results. Current performance may be lower or higher than the performance data quoted. For more current performance data, please visit www.nb.com.
The results shown in the table reflect the reinvestment of income dividends and other distributions, if any. The results do not reflect the effect of taxes a shareholder would pay on Portfolio distributions or on the redemption of Portfolio shares. The results do not reflect fees and expenses of the variable annuity and variable life insurance policies or the qualified pension and retirement plans whose proceeds are invested in the Portfolio.
The investment return and principal value of an investment will fluctuate and shares, when redeemed, may be worth more or less than their original cost.
Returns would have been lower if Neuberger Berman Management LLC ("Management") had not reimbursed certain expenses and/or waived a portion of the investment management fees during certain of the periods shown. Repayment by a class (of expenses previously reimbursed and/or fees previously waived by Management) will decrease the class's returns. Please see Note B in the Notes to Financial Statements for specific information regarding expense reimbursement and/or fee waiver arrangements.
COMPARISON OF A $10,000 INVESTMENT
This graph shows the change in value of a hypothetical $10,000 investment in the Portfolio over the past 10 fiscal years, or since the Portfolio's inception, if it has not operated for 10 years. The result is compared with benchmarks, which include a broad-based market index and may include a more narrowly based index. Market indices have not been reduced to reflect any of the fees and costs of investing. The results shown in the graph reflect the reinvestment of income dividends and other distributions, if any. The results do not reflect the effect of taxes a shareholder would pay on Portfolio distributions or on the redemption of Portfolio shares. Results represent past performance and do not indicate future results.
Please see Endnotes for additional information.
3
Endnotes (Unaudited)
1 The date used to calculate Life of Fund performance for the index is the inception date of the oldest share class.
2 The Russell 2000® Growth Index measures the performance of those Russell 2000® Index companies with higher price-to-book ratios and higher forecasted growth values. The Russell 2000 Index is an unmanaged index consisting of the securities of the 2000 issuers having the smallest capitalization in the Russell 3000® Index, representing approximately 10% of the Russell 3000 total market capitalization. As of the latest reconstitution, the market capitalization of the smallest company included in the Russell 2000 Index was roughly $101 million. Please note that indices do not take into account any fees, expenses or tax consequences of investing in the individual securities that they track, and that individuals cannot invest directly in any index. Data about the performance of an index is prepared or obtained by Neuberger Berman Management LLC ("Management") and reflects the reinvestment of income dividends and other distributions, if any. The Portfolio may invest in securities not included in a described index and/or may not invest in all securities included in a described index.
Any ratios or other measurements using a factor of forecasted earnings of a company discussed herein are based on consensus estimates, not Management's own projections, and they may or may not be realized. In addition, any revision to a forecast could affect the market price of a security. By quoting them herein, Management does not offer an opinion as to the accuracy of, and does not guarantee, these forecasted numbers.
The investments for the Portfolio are managed by the same portfolio manager(s) who manage(s) one or more other registered funds that have names, investment objectives and investment styles that are similar to those of the Portfolio. You should be aware that the Portfolio is likely to differ from the other mutual fund(s) in size, cash flow pattern and tax matters. Accordingly, the holdings and performance of the Portfolio can be expected to vary from those of the other mutual fund(s).
Shares of the separate AMT Portfolios are not available to the general public. Shares of this Portfolio may be purchased only by life insurance companies to be used with their separate accounts that fund variable annuity and variable life insurance policies and by qualified pension and retirement plans.
Statistics and projections in this report are derived from sources deemed to be reliable but cannot be regarded as a representation of future results of the AMT Portfolios. This report is prepared for the general information of shareholders and is not an offer of shares of the AMT Portfolios. Shares of the AMT Portfolios are sold only through the currently effective prospectuses, which must precede or accompany this report.
The "Neuberger Berman" name and logo are registered service marks of Neuberger Berman Group LLC. "Neuberger Berman Management LLC" and the individual Fund name in this piece are either service marks or registered service marks of Neuberger Berman Management LLC.
© 2013 Neuberger Berman Management LLC distributor. All rights reserved.
4
Information About Your Fund's Expenses (Unaudited)
As a Fund shareholder, you incur two types of costs: (1) transaction costs such as fees and expenses that are, or may be, imposed under your variable contract or qualified pension plan; and (2) ongoing costs, including management fees; distribution and/or service (12b-1) fees (if applicable); and other Fund expenses. This example is intended to help you understand your ongoing costs (in dollars) of investing in the Fund and compare these costs with the ongoing costs of investing in other mutual funds.
This table is designed to provide information regarding costs related to your investments. The following examples are based on an investment of $1,000 made at the beginning of the six month period ended December 31, 2012 and held for the entire period. The table illustrates the Fund's costs in two ways:
| Actual Expenses and Performance: | | The first section of the table provides information about actual account values and actual expenses in dollars, based on the Fund's actual performance during the period. You may use the information in this line, together with the amount you invested, to estimate the expenses you paid over the period. Simply divide your account value by $1,000 (for example, an $8,600 account value divided by $1,000 = 8.6), then multiply the result by the number in the first section of the table under the heading entitled "Expenses Paid During the Period" to estimate the expenses you paid over the period. | |
Hypothetical Example for Comparison Purposes: | | The second section of the table provides information about hypothetical account values and hypothetical expenses based on the Fund's actual expense ratio and an assumed rate of return at 5% per year before expenses. This return is not the Fund's actual return. The hypothetical account values and expenses may not be used to estimate the actual ending account balance or expenses you paid for the period. You may use this information to compare the ongoing costs of investing in this Fund versus other funds. To do so, compare the expenses shown in this 5% hypothetical example with the 5% hypothetical examples that appear in the shareholder reports of other funds. | |
Please note that the expenses in the table are meant to highlight your ongoing costs only and do not include any transaction costs, such as fees and expenses that are, or may be imposed under your variable contract or qualified pension plan. Therefore, the information under the heading "Hypothetical (5% annual return before expenses)" is useful in comparing ongoing costs only, and will not help you determine the relative total costs of owning different funds. In addition, if these transaction costs were included, your costs would have been higher.
Expense Information as of 12/31/12
NEUBERGER BERMAN ADVISERS MANAGEMENT TRUST SMALL CAP GROWTH PORTFOLIO
| Actual | | Beginning Account Value 7/1/12 | | Ending Account Value 12/31/12 | | Expenses Paid During the Period* 7/1/12 – 12/31/12 | |
| Class S | | $ | 1,000.00 | | | $ | 1,003.00 | | | $ | 7.05 | | |
| Hypothetical (5% annual return before expenses)** | |
| Class S | | $ | 1,000.00 | | | $ | 1,018.10 | | | $ | 7.10 | | |
* Expenses are equal to the annualized expense ratio of 1.40%, multiplied by the average account value over the period, multiplied by 184/366 (to reflect the one-half year period shown).
** Hypothetical 5% annual return before expenses is calculated by multiplying the number of days in the most recent half year divided by 366.
5
Schedule of Investments Small Cap Growth Portfolio
| NUMBER OF SHARES | | | | VALUE† | |
| Common Stocks (98.8%) | | | |
| Aerospace & Defense (3.9%) | | | |
| | 7,600 | | | DigitalGlobe, Inc. | | $ | 185,744 | * | |
| | 4,200 | | | HEICO Corp. | | | 187,992 | | |
| | 6,500 | | | Hexcel Corp. | | | 175,240 | * | |
| | | | 548,976 | | |
| Air Freight & Logistics (1.0%) | | | |
| | 8,100 | | | Echo Global Logistics, Inc. | | | 145,557 | * | |
| Biotechnology (1.9%) | | | |
| | 7,700 | | | Alkermes PLC | | | 142,604 | * | |
| | 3,100 | | | Cubist Pharmaceuticals, Inc. | | | 130,386 | * | |
| | | | 272,990 | | |
| Chemicals (3.1%) | | | |
| | 5,900 | | | American Vanguard Corp. | | | 183,313 | | |
| | 3,100 | | | Chemtura Corp. | | | 65,906 | * | |
| | 4,900 | | | Minerals Technologies, Inc. | | | 195,608 | | |
| | | | 444,827 | | |
| Commercial Banks (4.2%) | | | |
| | 4,700 | | | SCBT Financial Corp. | | | 188,846 | | |
| | 2,900 | | | Signature Bank | | | 206,886 | * | |
| | 4,600 | | | Texas Capital Bancshares, Inc. | | | 206,172 | * | |
| | | | 601,904 | | |
| Commercial Services & Supplies (3.9%) | | | |
| | 9,300 | | | Healthcare Services Group, Inc. | | | 216,039 | | |
| | 13,200 | | | InnerWorkings, Inc. | | | 181,896 | * | |
| | 5,900 | | | Tetra Tech, Inc. | | | 156,055 | * | |
| | | | 553,990 | | |
| Communications Equipment (2.3%) | | | |
| | 8,600 | | | Aruba Networks, Inc. | | | 178,450 | * | |
| | 9,100 | | | Ixia | | | 154,518 | * | |
| | | | 332,968 | | |
| Computers & Peripherals (1.6%) | | | |
| | 2,900 | | | Stratasys Ltd. | | | 232,435 | * | |
| Diversified Consumer Services (1.0%) | | | |
| | 3,100 | | | Steiner Leisure Ltd. | | | 149,389 | * | |
| Diversified Financial Services (1.5%) | | | |
| | 10,800 | | | Marlin Business Services Corp. | | | 216,648 | | |
| NUMBER OF SHARES | | | | VALUE† | |
| Electrical Equipment (2.9%) | | | |
| | 6,400 | | | Generac Holdings, Inc. | | $ | 219,584 | | |
| | 4,100 | | | Polypore International, Inc. | | | 190,650 | * | |
| | | | 410,234 | | |
| Food & Staples Retailing (2.9%) | | | |
| | 3,000 | | | PriceSmart, Inc. | | | 231,150 | | |
| | 3,300 | | | United Natural Foods, Inc. | | | 176,847 | * | |
| | | | 407,997 | | |
| Food Products (1.4%) | | | |
| | 14,900 | | | Boulder Brands, Inc. | | | 192,210 | * | |
| Health Care Equipment & Supplies (7.8%) | | | |
| | 4,100 | | | Cyberonics, Inc. | | | 215,373 | * | |
| | 13,800 | | | DexCom, Inc. | | | 187,818 | * | |
| | 11,400 | | | Endologix, Inc. | | | 162,336 | * | |
| | 3,700 | | | ICU Medical, Inc. | | | 225,441 | * | |
| | 9,300 | | | Quidel Corp. | | | 173,631 | * | |
| | 6,400 | | | Volcano Corp. | | | 151,104 | * | |
| | | | 1,115,703 | | |
| Health Care Providers & Services (7.0%) | | | |
| | 8,300 | | | Acadia Healthcare Co., Inc. | | | 193,639 | * | |
| | 5,400 | | | Air Methods Corp. | | | 199,206 | | |
| | 6,100 | | | Hanger, Inc. | | | 166,896 | * | |
| | 2,100 | | | MWI Veterinary Supply, Inc. | | | 231,000 | * | |
| | 7,400 | | | U.S. Physical Therapy, Inc. | | | 203,796 | | |
| | | | 994,537 | | |
| Hotels, Restaurants & Leisure (2.1%) | | | |
| | 8,800 | | | Bloomin' Brands, Inc. | | | 137,632 | * | |
| | 13,300 | | | Orient-Express Hotels Ltd. Class A | | | 155,477 | * | |
| | | | 293,109 | | |
| Internet & Catalog Retail (1.1%) | | | |
| | 2,800 | | | HSN, Inc. | | | 154,224 | | |
| Internet Software & Services (2.6%) | | | |
| | 5,400 | | | Cornerstone OnDemand, Inc. | | | 159,462 | * | |
| | 2,300 | | | CoStar Group, Inc. | | | 205,551 | * | |
| | | | 365,013 | | |
| IT Services (5.8%) | | | |
| | 5,600 | | | CoreLogic, Inc. | | | 150,752 | * | |
| | 7,500 | | | EPAM Systems, Inc. | | | 135,750 | * | |
| | 8,900 | | | InterXion Holding NV | | | 211,464 | * | |
| | 2,700 | | | MAXIMUS, Inc. | | | 170,694 | | |
| | 9,900 | | | Virtusa Corp. | | | 162,657 | * | |
| | | | 831,317 | | |
See Notes to Schedule of Investments
6
| NUMBER OF SHARES | | | | VALUE† | |
| Leisure Equipment & Products (1.1%) | | | |
| | 5,500 | | | Brunswick Corp. | | $ | 159,995 | | |
| Life Sciences Tools & Services (1.0%) | | | |
| | 5,200 | | | ICON PLC | | | 144,352 | * | |
| Machinery (1.5%) | | | |
| | 7,500 | | | TriMas Corp. | | | 209,700 | * | |
| Media (1.4%) | | | |
| | 12,000 | | | Lions Gate Entertainment Corp. | | | 196,800 | * | |
| Oil, Gas & Consumable Fuels (5.2%) | | | |
| | 7,100 | | | Bonanza Creek Energy, Inc. | | | 197,309 | * | |
| | 16,000 | | | Kodiak Oil & Gas Corp. | | | 141,600 | * | |
| | 6,400 | | | Oasis Petroleum, Inc. | | | 203,520 | * | |
| | 4,200 | | | Rosetta Resources, Inc. | | | 190,512 | * | |
| | | | 732,941 | | |
| Pharmaceuticals (1.5%) | | | |
| | 15,800 | | | Akorn, Inc. | | | 211,088 | * | |
Real Estate Management & Development (1.2%) | | | |
| | 2,100 | | | Jones Lang LaSalle, Inc. | | | 176,274 | | |
| Road & Rail (1.4%) | | | |
| | 5,850 | | | Old Dominion Freight Line, Inc. | | | 200,538 | * | |
Semiconductors & Semiconductor Equipment (2.2%) | | | |
| | 4,400 | | | Cavium, Inc. | | | 137,324 | * | |
| | 4,300 | | | Silicon Laboratories, Inc. | | | 179,783 | * | |
| | | | 317,107 | | |
| Software (11.1%) | | | |
| | 15,000 | | | Accelrys, Inc. | | | 135,750 | * | |
| | 5,500 | | | Aspen Technology, Inc. | | | 152,020 | * | |
| | 8,000 | | | Bottomline Technologies, Inc. | | | 211,120 | * | |
| | 2,500 | | | CommVault Systems, Inc. | | | 174,275 | * | |
| | 14,900 | | | Guidance Software, Inc. | | | 176,863 | * | |
| | 3,000 | | | NetSuite, Inc. | | | 201,900 | * | |
| | 5,100 | | | Tyler Technologies, Inc. | | | 247,044 | * | |
| | 2,900 | | | Ultimate Software Group, Inc. | | | 273,789 | * | |
| | | | 1,572,761 | | |
| NUMBER OF SHARES | | | | VALUE† | |
| Specialty Retail (11.8%) | | | |
| | 4,000 | | | ANN, Inc. | | $ | 135,360 | * | |
| | 3,400 | | | Cabela's, Inc. | | | 141,950 | * | |
| | 8,400 | | | Chico's FAS, Inc. | | | 155,064 | | |
| | 3,400 | | | Hibbett Sports, Inc. | | | 179,180 | * | |
| | 4,600 | | | Lithia Motors, Inc. Class A | | | 172,132 | | |
| | 10,400 | | | Tile Shop Holdings, Inc. | | | 175,032 | * | |
| | 11,300 | | | Tilly's, Inc. Class A | | | 152,437 | * | |
| | 2,100 | | | Tractor Supply Co. | | | 185,556 | | |
| | 2,200 | | | Ulta Salon Cosmetics & Fragrance, Inc. | | | 216,172 | | |
| | 2,900 | | | Vitamin Shoppe, Inc. | | | 166,344 | * | |
| | | | 1,679,227 | | |
| Trading Companies & Distributors (1.4%) | | | |
| | 14,200 | | | AerCap Holdings NV | | | 194,824 | * | |
| | | | | Total Common Stocks (Cost $13,220,794) | | | 14,059,635 | | |
| Short-Term Investments (0.0%) | | | |
| | 1 | | | State Street Institutional Liquid Reserves Fund Institutional Class (Cost $1) | | | 1 | | |
| | | | | Total Investments (98.8%) (Cost $13,220,795) | | | 14,059,636 | ## | |
| | | | | Cash, receivables and other assets, less liabilities (1.2%) | | | 164,991 | | |
| | | | | Total Net Assets (100.0%) | | $ | 14,224,627 | | |
See Notes to Schedule of Investments
7
Notes to Schedule of Investments Small Cap Growth Portfolio
† In accordance with Accounting Standards Codification ("ASC") 820 "Fair Value Measurements and Disclosures" ("ASC 820"), all investments held by Neuberger Berman Advisers Management Trust Small Cap Growth Portfolio (the "Fund") are carried at the value that Neuberger Berman Management LLC ("Management") believes the Fund would receive upon selling an investment in an orderly transaction to an independent buyer in the principal or most advantageous market for the investment under current market conditions. Various inputs, including the volume and level of activity for the asset or liability in the market, are considered in valuing the Fund's investments, some of which are discussed below. Significant management judgment may be necessary to value investments in accordance with ASC 820.
ASC 820 established a three-tier hierarchy of inputs to create a classification of value measurements for disclosure purposes. The three-tier hierarchy of inputs is summarized in the three broad Levels listed below.
• Level 1 – quoted prices in active markets for identical investments
• Level 2 – other significant observable inputs (including quoted prices for similar investments, interest rates, prepayment speeds, credit risk, amortized cost, etc.)
• Level 3 – significant unobservable inputs (including the Fund's own assumptions in determining the fair value of investments)
The inputs or methodology used for valuing an investment are not necessarily an indication of the risk associated with investing in those securities.
The value of the Fund's investments in equity securities and exchange traded funds, for which market quotations are readily available, is generally determined by Management by obtaining valuations from an independent pricing service based on the latest sale price quoted on a principal exchange or market for that security (Level 1 inputs). Securities traded primarily on the NASDAQ Stock Market are normally valued by the Fund at the NASDAQ Official Closing Price ("NOCP") provided by NASDAQ each business day. The NOCP is the most recently reported price as of 4:00:02 p.m., Eastern time, unless that price is outside the range of the "inside" bid and asked prices (i.e., the bid and asked prices that dealers quote to each other when trading for their own accounts); in that case, NASDAQ will adjust the price to equal the inside bid or asked price, whichever is closer. Because of delays in reporting trades, the NOCP may not be based on the price of the last trade to occur before the market closes. If there is no reported sale of a security on a particular day, the independent pricing service may value the security based on reported market quotations.
Management has developed a process to periodically review information provided by independent pricing services for all types of securities.
Investments in State Street Institutional Liquid Reserves Fund Institutional Class are valued using the fund's daily calculated net asset value per share (Level 2 inputs).
If a valuation is not available from an independent pricing service, or if Management has reason to believe that the valuation received does not represent the amount the Fund might reasonably expect to receive on a current sale in an orderly transaction, the Fund seeks to obtain quotations from principal market makers (generally considered Level 3 inputs). If such quotations are not readily available, the security is valued using methods the Neuberger Berman Advisers Management Trust's Board of Trustees (the "Board") has approved on the belief that they reflect fair value. Numerous factors may be considered when determining the fair value of a security based on Level 2 or 3 inputs, including available analyst, media or other reports, trading in futures or ADRs and whether the issuer of the security being fair valued has other securities outstanding.
The value of the Fund's investments in foreign securities is generally determined using the same valuation methods and inputs as other Fund investments, as discussed above. Foreign security prices expressed in local
See Notes to Financial Statements
8
Notes to Schedule of Investments Small Cap Growth Portfolio (cont'd)
currency values are translated from the local currency into U.S. dollars using the exchange rates as of 4:00 p.m., Eastern time. The Board has approved the use of Interactive Data Pricing and Reference Data, Inc. ("Interactive") to assist in determining the fair value of foreign equity securities when changes in the value of a certain index suggest that the closing prices on the foreign exchanges may no longer represent the amount that the Fund could expect to receive for those securities or on days when foreign markets are closed and U.S. markets are open. In each of these events, Interactive will provide adjusted prices for certain foreign equity securities using a statistical analysis of historical correlations of multiple factors (Level 2 inputs). In the absence of precise information about the market values of these foreign securities as of the close of the New York Stock Exchange, the Board has determined on the basis of available data that prices adjusted in this way are likely to be closer to the prices the Fund could realize on a current sale than are the prices of those securities established at the close of the foreign markets in which the securities primarily trade.
Fair value prices are necessarily estimates, and there is no assurance that such a price will be at or close to the price at which the security is next quoted or next trades.
The following is a summary, categorized by Level, of inputs used to value the Fund's investments as of December 31, 2012:
| Asset Valuation Inputs | | Level 1 | | Level 2 | | Level 3 | | Total | |
| Investments: | |
| Common Stocks^ | | $ | 14,059,635 | | | $ | — | | | $ | — | | | $ | 14,059,635 | | |
| Short-Term Investments | | | — | | | | 1 | | | | — | | | | 1 | | |
| Total Investments | | $ | 14,059,635 | | | $ | 1 | | | $ | — | | | $ | 14,059,636 | | |
^ The Schedule of Investments provides information on the industry categorization for the portfolio.
The Fund had no transfers between Levels 1 and 2 during the year ended December 31, 2012.
## At December 31, 2012, the cost of investments for U.S. federal income tax purposes was $13,287,777. Gross unrealized appreciation of investments was $929,623 and gross unrealized depreciation of investments was $157,764, resulting in net unrealized appreciation of $771,859, based on cost for U.S. federal income tax purposes.
* Security did not produce income during the last twelve months.
See Notes to Financial Statements
9
Statement of Assets and Liabilities
Neuberger Berman Advisers Management Trust
| | | SMALL CAP GROWTH PORTFOLIO | |
| | | December 31, 2012 | |
| Assets | |
| Investments in securities, at value* (Note A)—see Schedule of Investments: | |
| Unaffiliated issuers | | $ | 14,059,636 | | |
| Interest receivable | | | 24 | | |
| Receivable for securities sold | | | 254,563 | | |
| Receivable for Fund shares sold | | | 55,083 | | |
| Receivable from Management—net (Note B) | | | 2,243 | | |
| Prepaid expenses and other assets | | | 128 | | |
| Total Assets | | | 14,371,677 | | |
| Liabilities | |
| Due to custodian | | | 1,288 | | |
| Payable for securities purchased | | | 80,429 | | |
| Payable for Fund shares redeemed | | | 997 | | |
| Payable to investment manager (Note B) | | | 10,262 | | |
| Accrued expenses and other payables | | | 54,074 | | |
| Total Liabilities | | | 147,050 | | |
| Net Assets | | $ | 14,224,627 | | |
| Net Assets consist of: | |
| Paid-in capital | | $ | 16,165,660 | | |
| Accumulated net realized gains (losses) on investments | | | (2,779,874 | ) | |
| Net unrealized appreciation (depreciation) in value of investments | | | 838,841 | | |
| Net Assets | | $ | 14,224,627 | | |
| Shares Outstanding ($.001 par value; unlimited shares authorized) | | | 1,077,369 | | |
| Net Asset Value, offering and redemption price per share | | $ | 13.20 | | |
| *Cost of Investments | | $ | 13,220,795 | | |
See Notes to Financial Statements
10
Statement of Operations
Neuberger Berman Advisers Management Trust
| | | SMALL CAP GROWTH PORTFOLIO | |
| | | For the Year Ended December 31, 2012 | |
| Investment Income: | |
| Income (Note A): | |
| Dividend income—unaffiliated issuers | | $ | 81,859 | | |
| Interest income—unaffiliated issuers | | | 489 | | |
| Foreign taxes withheld | | | (128 | ) | |
| Total income | | $ | 82,220 | | |
| Expenses: | |
| Investment management fees (Note B) | | | 135,084 | | |
| Administration fees (Note B) | | | 47,677 | | |
| Distribution fees (Note B) | | | 39,731 | | |
| Audit fees | | | 43,535 | | |
| Custodian fees | | | 16,900 | | |
| Insurance expense | | | 1,176 | | |
| Legal fees | | | 8,070 | | |
| Shareholder reports | | | 11,966 | | |
| Trustees' fees and expenses | | | 50,762 | | |
| Miscellaneous | | | 1,037 | | |
| Total expenses | | | 355,938 | | |
| Expenses reimbursed by Management (Note B) | | | (133,197 | ) | |
| Expenses reduced by custodian fee expense offset arrangement (Note A) | | | (1 | ) | |
| Total net expenses | | | 222,740 | | |
| Net investment income (loss) | | $ | (140,520 | ) | |
| Realized and Unrealized Gain (Loss) on Investments (Note A): | |
| Net realized gain (loss) on: | |
| Sales of investment securities of unaffiliated issuers | | | 1,434,113 | | |
| Change in net unrealized appreciation (depreciation) in value of: | |
| Unaffiliated investment securities | | | 163,581 | | |
| Net gain (loss) on investments | | | 1,597,694 | | |
| Net increase (decrease) in net assets resulting from operations | | $ | 1,457,174 | | |
See Notes to Financial Statements
11
Statements of Changes in Net Assets
Neuberger Berman Advisers Management Trust
| | | SMALL CAP GROWTH PORTFOLIO | |
| | | Year Ended December 31, 2012 | | Year Ended December 31, 2011 | |
| Increase (Decrease) in Net Assets: | |
| From Operations (Note A): | |
| Net investment income (loss) | | $ | (140,520 | ) | | $ | (217,898 | ) | |
| Net realized gain (loss) on investments | | | 1,434,113 | | | | 2,755,275 | | |
| Change in net unrealized appreciation (depreciation) of investments | | | 163,581 | | | | (3,317,347 | ) | |
| Net increase (decrease) in net assets resulting from operations | | | 1,457,174 | | | | (779,970 | ) | |
| From Fund Share Transactions (Note D): | |
| Proceeds from shares sold | | | 2,765,400 | | | | 16,549,002 | | |
| Payments for shares redeemed | | | (6,426,319 | ) | | | (20,324,016 | ) | |
| Net increase (decrease) from Fund share transactions | | | (3,660,919 | ) | | | (3,775,014 | ) | |
| Net Increase (Decrease) in Net Assets | | | (2,203,745 | ) | | | (4,554,984 | ) | |
| Net Assets: | |
| Beginning of year | | | 16,428,372 | | | | 20,983,356 | | |
| End of year | | $ | 14,224,627 | | | $ | 16,428,372 | | |
| Undistributed net investment income (loss) at end of year | | $ | — | | | $ | — | | |
See Notes to Financial Statements
12
Notes to Financial Statements Small Cap Growth Portfolio
Note A—Summary of Significant Accounting Policies:
1 General: Neuberger Berman Advisers Management Trust (the "Trust") is a Delaware statutory trust organized pursuant to a Trust Instrument dated May 23, 1994. The Trust is currently comprised of ten separate operating series (each individually a "Series," and collectively the "Funds") each of which is diversified. The Trust is registered as an open-end management investment company under the Investment Company Act of 1940, as amended (the "1940 Act"), and its shares are registered under the Securities Act of 1933, as amended. The Fund currently offers only Class S shares. The Board may establish additional series or classes of shares without the approval of shareholders.
The assets of each Series belong only to that Series, and the liabilities of each Series are borne solely by that Series and no other.
The preparation of financial statements in accordance with U.S. generally accepted accounting principles ("GAAP") requires Management to make estimates and assumptions at the date of the financial statements. Actual results could differ from those estimates.
2 Portfolio valuation: Investment securities are valued as indicated in the notes following the Schedule of Investments.
3 Foreign currency translation: The accounting records of the Fund are maintained in U.S. dollars. Foreign currency amounts are translated into U.S. dollars using the exchange rate as of 4:00 p.m., Eastern time, to determine the value of investments, other assets and liabilities. Purchase and sale prices of securities, and income and expenses, are translated into U.S. dollars at the prevailing rate of exchange on the respective dates of such transactions. Net unrealized foreign currency gain (loss), if any, arises from changes in the value of assets and liabilities, other than investments in securities, as a result of changes in exchange rates and is stated separately in the Statement of Operations.
4 Securities transactions and investment income: Securities transactions are recorded on trade date for financial reporting purposes. Dividend income is recorded on the ex-dividend date or, for certain foreign dividends, as soon as the Fund becomes aware of the dividends. Non-cash dividends included in dividend income, if any, are recorded at the fair market value of the securities received. Interest income, including accretion of original issue discount, where applicable, and accretion of discount on short-term investments, if any, is recorded on the accrual basis. Realized gains and losses from securities transactions and foreign currency transactions, if any, are recorded on the basis of identified cost and stated separately in the Statement of Operations.
5 Income tax information: The Funds are treated as separate entities for U.S. federal income tax purposes. It is the policy of the Fund to continue to qualify for treatment as a regulated investment company by complying with the requirements of the U.S. Internal Revenue Code applicable to regulated investment companies and to distribute substantially all of its net investment income and net realized capital gains to its shareholders. To the extent the Fund distributes substantially all of its net investment income and net realized capital gains to shareholders, no federal income or excise tax provision is required.
The Fund has adopted the provisions of ASC 740 "Income Taxes" ("ASC 740"). ASC 740 sets forth a minimum threshold for financial statement recognition of a tax position taken, or expected to be taken, in a tax return. The Fund recognizes interest and penalties, if any, related to unrecognized tax positions as an income tax expense in the Statement of Operations. The Fund is subject to examination by U.S. federal and state tax authorities for returns filed for the prior three fiscal years 2009 - 2011. As of December 31, 2012, the Fund did not have any unrecognized tax positions.
Income distributions and capital gain distributions are determined in accordance with income tax regulations, which may differ from GAAP. These differences are primarily due to differing treatments of income and gains on
13
various investment securities held by the Fund, timing differences and differing characterization of distributions made by the Fund. The Fund may also utilize earnings and profits distributed to shareholders on redemption of shares as a part of the dividends-paid deduction for income tax purposes.
As determined on December 31, 2012, permanent differences resulting primarily from different book and tax accounting were reclassified at year end. Such differences are attributed to net operating losses. These reclassifications had no effect on net income, net asset value ("NAV") or NAV per share of the Fund. For the year ended December 31, 2012, the Fund recorded the following permanent reclassifications:
| Paid-in Capital | | Undistributed Net Investment Income (Loss) | | Accumulated Net Realized Gains (Losses) on Investments | |
| $ | (140,520 | ) | | $ | 140,520 | | | $ | — | | |
For tax purposes, distributions of short-term gains are taxable to shareholders as ordinary income.
As of December 31, 2012, the components of distributable earnings (accumulated losses) on a U.S. federal income tax basis were as follows:
Undistributed Long-Term Gain | | Unrealized Appreciation (Depreciation) | | Loss Carryforwards and Deferrals | | Other Temporary Differences | | Total | |
| $ | — | | | $ | 771,859 | | | $ | (2,712,892 | ) | | $ | — | | | $ | (1,941,033 | ) | |
The difference between book basis and tax basis distributable earnings are primarily due to: timing differences of wash sales and capital loss carryforwards.
To the extent the Fund's net realized capital gains, if any, can be offset by capital loss carryforwards, it is the policy of the Fund not to distribute such gains. The Regulated Investment Company ("RIC") Modernization Act of 2010 (the "Act") became effective for the Fund on January 1, 2011. The Act modernizes several of the federal income and excise tax provisions related to RICs. Among the changes made are changes to the capital loss carryforward rules allowing for RICs to carry forward capital losses indefinitely and to retain the character of capital loss carryforwards as short-term or long-term ("Post-Enactment"). Rules in effect previously limited the carryforward period to eight years and all carryforwards were considered short-term in character ("Pre-Enactment"). As determined at December 31, 2012, the Fund had unused capital loss carryforwards available for federal income tax purposes to offset net realized capital gains, if any, as follows:
| | | Pre-Enactment | |
| | | Expiring in: 2017 | |
| | | | | $ | 2,712,892 | | |
Post-Enactment capital loss carryforwards must be fully used before Pre-Enactment capital loss carryforwards; therefore, under certain circumstances, Pre-Enactment capital loss carryforwards available as of the report date may expire unused. As of December 31, 2012, the Fund had no Post-Enactment capital loss carryforwards.
During the year ended December 31, 2012, the Fund utilized capital loss carryforwards of $1,376,857.
6 Distributions to shareholders: The Fund may earn income, net of expenses, daily on its investments. Distributions from net investment income and net realized capital gains, if any, generally are distributed once a year (usually in October). Income distributions and capital gain distributions to shareholders are recorded on the ex-date.
7 Foreign taxes: Foreign taxes withheld represent amounts withheld by foreign tax authorities, net of refunds recoverable.
14
8 Expense allocation: Certain expenses are applicable to multiple funds. Expenses directly attributable to a Series are charged to that Series. Expenses of the Trust that are not directly attributable to a particular series of the Trust (e.g., the Fund) are allocated among the series of the Trust, on the basis of relative net assets, except where a more appropriate allocation of expenses to each of the series can otherwise be made fairly. Expenses borne by the complex of related investment companies, which includes open-end and closed-end investment companies for which Management serves as investment manager, that are not directly attributable to a particular investment company in the complex (e.g., the Trust) or series thereof are allocated among the investment companies in the complex or series thereof, on the basis of relative net assets, except where a more appropriate allocation of expenses to each of the investment companies in the complex or series thereof can otherwise be made fairly.
9 Investments in foreign securities: Investing in foreign securities may involve certain sovereign and other risks, in addition to the credit and market risks normally associated with domestic securities. These additional risks include the possibility of adverse political and economic developments (including political instability, nationalization, expropriation, or confiscatory taxation) and the potentially adverse effects of unavailability of public information regarding issuers, less governmental supervision and regulation of financial markets, reduced liquidity of certain financial markets, and the lack of uniform accounting, auditing, and financial reporting standards or the application of standards that are different or less stringent than those applied in the United States. Foreign securities also may experience greater price volatility, higher rates of inflation, and delays in settlement.
10 Indemnifications: Like many other companies, the Trust's organizational documents provide that its officers and trustees are indemnified against certain liabilities arising out of the performance of their duties to the Trust. In addition, both in some of its principal service contracts and in the normal course of its business, the Trust enters into contracts that provide indemnifications to other parties for certain types of losses or liabilities. The Trust's maximum exposure under these arrangements is unknown as this could involve future claims against the Trust.
11 Expense offset arrangement: The Fund has an expense offset arrangement in connection with its custodian contract. For the year ended December 31, 2012, the impact of this arrangement was a reduction of expenses of $1.
Note B—Management Fees, Administration Fees, Distribution Arrangements, and Other Transactions with Affiliates:
Fund shares are issued and redeemed in connection with investments in and payments under certain variable annuity contracts and variable life insurance policies issued through separate accounts of life insurance companies and are also offered directly to certain qualified pension and retirement plans.
The Fund retains Management as its investment manager under a Management Agreement. For such investment management services, the Fund pays Management a fee at the annual rate of 0.85% of the first $500 million of the Fund's average daily net assets, 0.825% of the next $500 million, 0.80% of the next $500 million, 0.775% of the next $500 million, 0.75% of the next $500 million, and 0.725% of average daily net assets in excess of $2.5 billion. Accordingly, for the year ended December 31, 2012, the management fee pursuant to the Management Agreement was equivalent to an annual effective rate of 0.85% of the Fund's average daily net assets.
The Fund retains Management as its administrator under an Administration Agreement. The Fund pays Management an administration fee at the annual rate of 0.30% of its average daily net assets under this agreement. Additionally, Management retains State Street Bank and Trust Company ("State Street") as its sub-administrator under a Sub-Administration Agreement. Management pays State Street a fee for all services received under this agreement.
Management acts as agent in arranging for the sale of Fund shares without commission and bears advertising and promotion expenses. The Board has adopted a distribution plan (the "Plan") with respect to the Fund, pursuant to Rule 12b-1 under the 1940 Act. The Plan provides that, as compensation for administrative and other services provided to the Fund, Management's activities and expenses related to the sale and distribution of the Fund's shares, and ongoing services provided to investors in the Fund, Management receives from the Fund a fee at the
15
annual rate of 0.25% of the Fund's average daily net assets. Management receives this amount to provide distribution and shareholder servicing for the Fund and pays a portion of it to institutions that provide such services. Those institutions may use the payments for, among other purposes, compensating employees engaged in sales and/or shareholder servicing. The amount of fees paid by the Fund during any year may be more or less than the cost of distribution and other services provided to the Fund. FINRA rules limit the amount of annual distribution fees that may be paid by a mutual fund and impose a ceiling on the cumulative distribution fees paid. The Trust's Plan complies with those rules.
Management has contractually undertaken through December 31, 2015 to waive current payment of fees and/or reimburse the Fund for its operating expenses (including fees payable to Management but excluding interest, taxes, brokerage commissions, extraordinary expenses, transaction costs and dividend expense on short sales, if any) ("Operating Expenses") which exceed, in the aggregate, 1.40% per annum of the Fund's average daily net assets (the "Expense Limitation"). For the year ended December 31, 2012, such excess expenses amounted to $133,197. The Fund has agreed to repay Management through December 31, 2018 for fees and expenses waived and/or its excess Operating Expenses previously reimbursed by Management, so long as its annual Operating Expenses during that period do not exceed its Expense Limitation in place at the time the fees and expenses were waived or reimbursed, and the repayment is made within three years after the year in which Management issued the reimbursement or waived fees. During the year ended December 31, 2012, there was no repayment to Management under its contractual expense limitation. At December 31, 2012, contingent liabilities to Management under its contractual expense limitation were as follows:
| | | Expiring in: | |
| | | 2013 | | 2014 | | 2015 | | Total | |
| | | | | $ | 137,598 | | | $ | 153,311 | | | $ | 133,197 | | | $ | 424,106 | | |
Neuberger Berman LLC ("Neuberger") is retained by Management to furnish it with investment recommendations and research information without added cost to the Fund. Several individuals who are officers and/or trustees of the Trust are also employees of Neuberger and/or Management.
Management and Neuberger are indirect subsidiaries of Neuberger Berman Group LLC (("NBG") and together with its consolidated subsidiaries ("NB Group")). NBSH Acquisition, LLC ("NBSH"), which is owned by portfolio managers, members of the NB Group management team and certain of NB Group's key employees and senior professionals, owns, as of September 30, 2012, approximately 57% of NBG's common units, and Lehman Brothers Holdings Inc. ("LBHI") and certain of its subsidiaries (collectively the "LBHI Parties") own the remaining 43% of such common units. Pursuant to agreements among NBG, NBSH and the LBHI Parties, NBG is entitled to acquire the remaining Class A common units through a process that is expected to end in 2017. In April 2012, NBG exercised its option (the "Redemption Agreement Option") to redeem during 2012 certain of its Class A common units held by the LBHI Parties equal to 10% of NBG's aggregate common units issued and outstanding as of March 16, 2012. The final payment for such Class A common units is due within thirty (30) days of December 31, 2012.
Note C—Securities Transactions:
For the year ended December 31, 2012, there were purchase and sale transactions (excluding short-term securities) of $44,151,388 and $48,091,609, respectively.
For the year ended December 31, 2012, no brokerage commissions on securities transactions were paid to affiliated brokers.
16
Note D—Fund Share Transactions:
Share activity for the years ended December 31, 2012 and December 31, 2011 was as follows:
| | | For the Year Ended December 31, | |
| | | 2012 | | 2011 | |
| Shares Sold | | | 211,645 | | | | 1,265,572 | | |
| Shares Redeemed | | | (488,996 | ) | | | (1,621,981 | ) | |
| Total | | | (277,351 | ) | | | (356,409 | ) | |
Note E—Line of Credit:
At December 31, 2012, the Fund was a participant in a single committed, unsecured $200,000,000 line of credit with State Street, to be used only for temporary or emergency purposes. Other investment companies managed by Management also participate in this line of credit on the same terms. Interest is charged on borrowings under this line of credit at the higher of (a) the Federal Funds Rate plus 1.25% per annum or (b) the Overnight LIBOR Rate plus 1.25% per annum. A commitment fee of 0.10% per annum of the available line of credit is charged, of which each participating Fund has agreed to pay its pro rata share, based on the ratio of its individual net assets to the net assets of all participants at the time the fee is due and payable. The fee is paid quarterly in arrears. Because several mutual funds participate, there is no assurance that an individual Fund will have access to all or any part of the $200,000,000 at any particular time. There were no loans outstanding pursuant to this line of credit at December 31, 2012. During the year ended December 31, 2012, the Fund did not utilize this line of credit.
Note F—Recent Accounting Pronouncement:
In December 2011, the Financial Accounting Standards Board issued Accounting Standards Update 2011-11 Disclosures about Offsetting Assets and Liabilities ("ASU 2011-11"). Effective for annual reporting periods beginning on or after January 1, 2013 and interim periods within those annual periods, ASU 2011-11 is intended to enhance disclosure requirements on the offsetting of financial assets and liabilities. At this time, Management is evaluating the implications of ASU 2011-11 and its impact on the financial statements.
17
Financial Highlights
Small Cap Growth Portfolio
The following table includes selected data for a share outstanding throughout each year and other performance information derived from the Financial Statements. Per share amounts that round to less than $.01 or $(.01) per share are presented as $.00 or $(.00), respectively.
| | | Year Ended December 31, | |
| | | 2012 | | 2011 | | 2010 | | 2009 | | 2008 | |
| Net Asset Value, Beginning of Year | | $ | 12.13 | | | $ | 12.26 | | | $ | 10.25 | | | $ | 8.35 | | | $ | 14.50 | | |
| Income From Investment Operations: | |
Net Investment Income (Loss)‡ | | | (.12 | ) | | | (.14 | ) | | | (.12 | ) | | | (.09 | ) | | | (.11 | ) | |
Net Gains or Losses on Securities (both realized and unrealized) | | | 1.19 | | | | .01 | | | | 2.13 | | | | 1.99 | | | | (5.60 | )§§ | |
| Total From Investment Operations | | | 1.07 | | | | (.13 | ) | | | 2.01 | | | | 1.90 | | | | (5.71 | ) | |
| Less Distributions From: | |
| Net Capital Gains | | | — | | | | — | | | | — | | | | — | | | | (.44 | ) | |
| Tax Return of Capital | | | — | | | | — | | | | — | | | | — | | | | (.00 | ) | |
| Total Distributions | | | — | | | | — | | | | — | | | | — | | | | (.44 | ) | |
| Net Asset Value, End of Year | | $ | 13.20 | | | $ | 12.13 | | | $ | 12.26 | | | $ | 10.25 | | | $ | 8.35 | | |
Total Return†† | | | 8.82 | % | | | (1.06 | )% | | | 19.61 | % | | | 22.75 | % | | | (39.47 | )% | |
| Ratios/Supplemental Data | |
| Net Assets, End of Year (in millions) | | $ | 14.2 | | | $ | 16.4 | | | $ | 21.0 | | | $ | 16.0 | | | $ | 12.6 | | |
Ratio of Gross Expenses to Average Net Assets# | | | 2.24 | % | | | 2.20 | % | | | 2.27 | % | | | 2.46 | % | | | 1.97 | % | |
Ratio of Net Expenses to Average Net Assets§ | | | 1.40 | % | | | 1.41 | % | | | 1.40 | % | | | 1.42 | % | | | 1.42 | % | |
Ratio of Net Investment Income (Loss) to Average Net Assets | | | (.88 | )% | | | (1.11 | )% | | | (1.15 | )% | | | (1.08 | )% | | | (.92 | )% | |
| Portfolio Turnover Rate | | | 282 | % | | | 279 | % | | | 243 | % | | | 300 | % | | | 323 | % | |
See Notes to Financial Highlights
18
Notes to Financial Highlights Small Cap Growth Portfolio
†† Total return based on per share NAV reflects the effects of changes in NAV on the performance of the Fund during each fiscal period and assumes income dividends and other distributions, if any, were reinvested. Results represent past performance and do not indicate future results. Current returns may be lower or higher than the performance data quoted. Investment returns and principal may fluctuate and shares when redeemed may be worth more or less than original cost. Total return would have been lower if Management had not reimbursed and/or waived certain expenses. The total return information shown does not reflect charges and other expenses that apply to the separate account or the related insurance policies, and the inclusion of these charges and other expenses would reduce the total return for all fiscal periods shown.
# Represents the annualized ratios of net expenses to average daily net assets if Management had not reimbursed certain expenses and/or waived a portion of the investment management fee.
‡ Calculated based on the average number of shares outstanding during each fiscal period.
§ After reimbursement of expenses and/or waiver of a portion of the investment management fee by Management. The Fund is required to calculate an expense ratio without taking into consideration any expense reductions related to expense offset arrangements. Had the Fund not received expense reductions related to expense offset arrangements, the annualized ratios of net expenses to average daily net assets would have been:
| | | Year Ended December 31, | |
| 2012 | | 2011 | | 2010 | | 2009 | | 2008 | | | |
| | 1.40 | % | | | 1.41 | % | | | 1.40 | % | | | 1.42 | % | | | 1.43 | % | | | |
§§ Included in this net loss is a voluntary reimbursement from Management for brokerage commissions from March 25, 2008 to April 15, 2008, to facilitate a restructuring of the portfolio following a change in the Fund's portfolio manager.
19
Report of Independent Registered Public Accounting Firm
To the Board of Trustees of
Neuberger Berman Advisers Management Trust and
Shareholders of Small Cap Growth Portfolio
We have audited the accompanying statement of assets and liabilities of Small Cap Growth Portfolio, one of the series constituting Neuberger Berman Advisers Management Trust (the "Trust"), including the schedule of investments, as of December 31, 2012, and the related statement of operations for the year then ended, the statements of changes in net assets for each of the two years in the period then ended, and the financial highlights for each of the five years in the period then ended. These financial statements and financial highlights are the responsibility of the Trust's management. Our responsibility is to express an opinion on these financial statements and financial highlights based on our audits.
We conducted our audits in accordance with the standards of the Public Company Accounting Oversight Board (United States). Those standards require that we plan and perform the audit to obtain reasonable assurance about whether the financial statements and financial highlights are free of material misstatement. We were not engaged to perform an audit of the Trust's internal control over financial reporting. Our audits included consideration of internal control over financial reporting as a basis for designing audit procedures that are appropriate in the circumstances, but not for the purpose of expressing an opinion on the effectiveness of the Trust's internal control over financial reporting. Accordingly, we express no such opinion. An audit also includes examining, on a test basis, evidence supporting the amounts and disclosures in the financial statements and financial highlights, assessing the accounting principles used and significant estimates made by management, and evaluating the overall financial statement presentation. Our procedures included confirmation of securities owned as of December 31, 2012 by correspondence with the custodian and others or by other appropriate auditing procedures where replies from others were not received. We believe that our audits provide a reasonable basis for our opinion.
In our opinion, the financial statements and financial highlights referred to above present fairly, in all material respects, the financial position of Small Cap Growth Portfolio, a series of Neuberger Berman Advisers Management Trust, at December 31, 2012, the results of its operations for the year then ended, the changes in its net assets for each of the two years in the period then ended, and the financial highlights for each of the five years in the period then ended, in conformity with U.S. generally accepted accounting principles.
Boston, Massachusetts
February 7, 2013
20
Trustee and Officer Information
The following tables set forth information concerning the trustees ("Trustees") and officers ("Officers") of the Trust. All persons named as Trustees and Officers also serve in similar capacities for other funds administered or managed by Management, Neuberger and Neuberger Berman Fixed Income LLC ("NBFI"). The Statement of Additional Information includes additional information about Trustees and is available upon request, without charge, by calling (800) 877-9700.
Information about the Board of Trustees
Name, (Year of Birth), and Address(1) | | Position(s) and Length of Time Served(2) | | Principal Occupation(s)(3) | | Number of Funds in Fund Complex Overseen by Fund Trustee | | Other Directorships Held Outside Fund Complex by Fund Trustee(3) | |
| Independent Fund Trustees | |
| Faith Colish (1935) | | Trustee since 1982 | | Counsel, Carter Ledyard & Milburn LLP (law firm) since October 2002; formerly, Attorney-at-Law and President, Faith Colish, A Professional Corporation, 1980 to 2002. | | | 50 | | | Formerly, Director, 1997 to 2003, and Advisory Director, 2003 to 2006, ABA Retirement Funds (formerly, American Bar Retirement Association) (not-for-profit membership corporation). | |
| Martha C. Goss (1949) | | Trustee since 2007 | | President, Woodhill Enterprises Inc./Chase Hollow Associates LLC (personal investment vehicle), since 2006; Chief Operating and Financial Officer, Hopewell Holdings LLC/Amwell Holdings, LLC (a holding company for investments in the healthcare sector), since 2003; formerly, Consultant, Resources Connection (temporary staffing), 2002 to 2006. | | | 50 | | | Director, American Water (water utility), since 2003; Director, Channel Reinsurance (financial guaranty reinsurance), 2006 to 2010; Director, Allianz Life of New York (insurance), since 2005; Director, Financial Women's Association of New York (not-for-profit association), since 2003; Trustee Emerita, Brown University, since 1998; formerly, Director, Ocwen Financial Corporation (mortgage servicing), 2005 to 2010; formerly, Advisory Board Member, Attensity (software developer), 2005 to 2007; formerly, Director, Bank Leumi (commercial bank), 2005 to 2007; formerly, Director, Claire's Stores, Inc. (retailer), 2005 to 2007. | |
21
Name, (Year of Birth), and Address(1) | | Position(s) and Length of Time Served(2) | | Principal Occupation(s)(3) | | Number of Funds in Fund Complex Overseen by Fund Trustee | | Other Directorships Held Outside Fund Complex by Fund Trustee(3) | |
| Michael M. Knetter (1960) | | Trustee since 2007 | | President and Chief Executive Officer, University of Wisconsin Foundation, since October 2010; formerly, Dean, School of Business, University of Wisconsin - Madison; formerly, Professor of International Economics and Associate Dean, Amos Tuck School of Business - Dartmouth College, 1998 to 2002. | | | 50 | | | Director, American Family Insurance (a mutual company, not publicly traded), since March 2009; formerly, Trustee, Northwestern Mutual Series Fund, Inc., 2007 to 2010; formerly, Director, Wausau Paper, 2005 to 2011; formerly, Director, Great Wolf Resorts, 2004 to 2009. | |
| Howard A. Mileaf (1937) | | Trustee since 1999 | | Retired; formerly, Vice President and General Counsel, WHX Corporation (holding company), 1993 to 2001. | | | 50 | | | Formerly, Director, Webfinancial Corporation (holding company), 2002 to 2008; formerly, Director, WHX Corporation (holding company), 2002 to 2005; formerly, Director, State Theatre of New Jersey (not-for-profit theatre), 2000 to 2005. | |
| George W. Morriss (1947) | | Trustee since 2007 | | Adjunct Faculty Member, Columbia University School of International Policy and Administration, since October 2012; formerly, Executive Vice President and Chief Financial Officer, People's Bank, Connecticut (a financial services company), 1991 to 2001. | | | 50 | | | Formerly, Manager, Larch Lane Multi-Strategy Fund complex (which consisted of three funds), 2006 to 2011; formerly, Member, NASDAQ Issuers' Affairs Committee, 1995 to 2003. | |
22
Name, (Year of Birth), and Address(1) | | Position(s) and Length of Time Served(2) | | Principal Occupation(s)(3) | | Number of Funds in Fund Complex Overseen by Fund Trustee | | Other Directorships Held Outside Fund Complex by Fund Trustee(3) | |
| Jack L. Rivkin (1940) | | Trustee since 2002; President 2002 to 2008 | | Formerly, Executive Vice President and Chief Investment Officer, Neuberger Berman Holdings LLC (holding company), 2002 to August 2008 and 2003 to August 2008, respectively; formerly, Managing Director and Chief Investment Officer, Neuberger, December 2005 to August 2008 and 2003 to August 2008, respectively; formerly, Executive Vice President, Neuberger, December 2002 to 2005; formerly, Director and Chairman, Management, December 2002 to August 2008; formerly, Executive Vice President, Citigroup Investments, Inc., September 1995 to February 2002; formerly, Executive Vice President, Citigroup Inc., September 1995 to February 2002. | | | 50 | | | Director, Idealab (private company), since 2009; Director, Distributed World Power (private company), since 2009; Director, Dale Carnegie and Associates, Inc. (private company), since 1999; Director, Solbright, Inc. (private company), since 1998; Director, SA Agricultural Fund, since 2009; Chairman and Director, Essential Brands (consumer products) since 2008; formerly, Director, New York Society of Security Analysts, 2006 to 2008. | |
| Tom D. Seip (1950) | | Trustee since 2000; Chairman of the Board since 2008; Lead Independent Trustee 2006 to 2008 | | General Partner, Ridgefield Farm LLC (a private investment vehicle); formerly, President and CEO, Westaff, Inc. (temporary staffing), May 2001 to January 2002; formerly, Senior Executive, The Charles Schwab Corporation, 1983 to 1998, including Chief Executive Officer, Charles Schwab Investment Management, Inc.; Trustee, Schwab Family of Funds and Schwab Investments, 1997 to 1998; and Executive Vice President—Retail Brokerage, Charles Schwab & Co., Inc., 1994 to 1997. | | | 50 | | | Director, H&R Block, Inc. (financial services company), since May 2001; Chairman, Governance and Nominating Committee, H&R Block, Inc., since 2011; formerly, Chairman, Compensation Committee, H&R Block, Inc., 2006 to 2010; formerly, Director, Forward Management, Inc. (asset management company), 1999 to 2006. | |
23
Name, (Year of Birth), and Address(1) | | Position(s) and Length of Time Served(2) | | Principal Occupation(s)(3) | | Number of Funds in Fund Complex Overseen by Fund Trustee | | Other Directorships Held Outside Fund Complex by Fund Trustee(3) | |
| Candace L. Straight (1947) | | Trustee since 1999 | | Private investor and consultant specializing in the insurance industry; formerly, Advisory Director, Securitas Capital LLC (a global private equity investment firm dedicated to making investments in the insurance sector), 1998 to December 2003. | | | 50 | | | Public Member, Board of Governors and Board of Trustees, Rutgers University, since 2011; Director, Montpelier Re Holdings Ltd. (reinsurance company), since 2006; formerly, Director, National Atlantic Holdings Corporation (property and casualty insurance company), 2004 to 2008; formerly, Director, The Proformance Insurance Company (property and casualty insurance company), 2004 to 2008; formerly, Director, Providence Washington Insurance Company (property and casualty insurance company), 1998 to 2006; formerly, Director, Summit Global Partners (insurance brokerage firm), 2000 to 2005. | |
| Peter P. Trapp (1944) | | Trustee since 1984 | | Retired; formerly, Regional Manager for Mid-Southern Region, Ford Motor Credit Company, September 1997 to 2007; formerly, President, Ford Life Insurance Company, April 1995 to August 1997. | | | 50 | | | None. | |
24
Name, (Year of Birth), and Address(1) | | Position(s) and Length of Time Served(2) | | Principal Occupation(s)(3) | | Number of Funds in Fund Complex Overseen by Fund Trustee | | Other Directorships Held Outside Fund Complex by Fund Trustee(3) | |
| Fund Trustees who are "Interested Persons" | |
| Joseph V. Amato* (1962) | | Trustee since 2009 | | President and Director, Neuberger Berman Group LLC, since 2009; President and Chief Executive Officer, Neuberger and Neuberger Berman Holdings LLC (including its predecessor, Neuberger Berman Inc.), since 2007; Chief Investment Officer, Neuberger, since 2009; Chief Investment Officer (Equities) and Managing Director, Management, since 2009; Managing Director, NBFI, since 2007; Board member of NBFI since 2006; formerly, Global Head of Asset Management of Lehman Brothers Holdings Inc.'s ("LBHI") Investment Management Division, 2006 to 2009; formerly, member of LBHI's Investment Management Division's Executive Management Committee, 2006 to 2009; formerly, Managing Director, Lehman Brothers Inc. ("LBI"), 2006 to 2008; formerly, Chief Recruiting and Development Officer, LBI, 2005 to 2006; formerly, Global Head of LBI's Equity Sales and a Member of its Equities Division Executive Committee, 2003 to 2005. | | | 50 | | | Member of Board of Advisors, McDonough School of Business, Georgetown University, since 2001; Member of New York City Board of Advisors, Teach for America, since 2005; Trustee, Montclair Kimberley Academy (private school), since 2007. | |
25
Name, (Year of Birth), and Address(1) | | Position(s) and Length of Time Served(2) | | Principal Occupation(s)(3) | | Number of Funds in Fund Complex Overseen by Fund Trustee | | Other Directorships Held Outside Fund Complex by Fund Trustee(3) | |
| Robert Conti* (1956) | | Chief Executive Officer, President and Trustee since 2008; prior thereto, Executive Vice President in 2008 and Vice President 2000 to 2008 | | Managing Director, Neuberger, since 2007; formerly, Senior Vice President, Neuberger, 2003 to 2006; formerly, Vice President, Neuberger, 1999 to 2003; President and Chief Executive Officer, Management, since 2008; formerly, Senior Vice President, Management, 2000 to 2008; Managing Director, NBFI, since 2009. | | | 50 | | | Director, Staten Island Mental Health Society, since 1994; formerly, Chairman of the Board, Staten Island Mental Health Society, 2008 to 2011. | |
(1) The business address of each listed person is 605 Third Avenue, New York, New York 10158.
(2) Pursuant to the Trust's Trust Instrument, each of these Fund Trustees shall hold office for life or until his or her successor is elected or the Trust terminates; except that (a) any Fund Trustee may resign by delivering a written resignation; (b) any Fund Trustee may be removed with or without cause at any time by a written instrument signed by at least two-thirds of the other Fund Trustees; (c) any Fund Trustee who requests to be retired, or who has become unable to serve, may be retired by a written instrument signed by a majority of the other Fund Trustees; and (d) any Fund Trustee may be removed at any shareholder meeting by a vote of at least two-thirds of the outstanding shares.
(3) Except as otherwise indicated, each individual has held the positions shown for at least the last five years.
* Indicates a Fund Trustee who is an "interested person" within the meaning of the 1940 Act. Mr. Amato and Mr. Conti are interested persons of the Trust by virtue of the fact that each is an officer of Management, Neuberger and/or their affiliates.
26
Information about the Officers of the Trust
Name, (Year of Birth), and Address(1) | | Position(s) and Length of Time Served(2) | | Principal Occupation(s)(3) | |
| Andrew B. Allard (1961) | | Chief Legal Officer since 2013 (only for purposes of sections 307 and 406 of the Sarbanes-Oxley Act of 2002) and Anti-Money Laundering Compliance Officer since 2002 | | Senior Vice President, Neuberger, since 2006 and Employee since 1999; Deputy General Counsel, Neuberger, since 2004; formerly, Vice President, Neuberger, 2000 to 2005; formerly, Employee, Management, 1994 to 1999; Chief Legal Officer since 2013 (only for purposes of sections 307 and 406 of the Sarbanes-Oxley Act of 2002) and Anti-Money Laundering Compliance Officer since 2002, nine registered investment companies for which Management acts as investment manager and administrator (six since 2002, one since 2003, one since 2005 and one since 2006). | |
| Claudia A. Brandon (1956) | | Executive Vice President since 2008 and Secretary since 1985 | | Senior Vice President, Neuberger, since 2007 and Employee since 1999; Senior Vice President, Management, since 2008 and Assistant Secretary since 2004; formerly, Vice President, Neuberger, 2002 to 2006; formerly, Vice President—Mutual Fund Board Relations, Management, 2000 to 2008; formerly, Vice President, Management, 1986 to 1999 and Employee 1984 to 1999; Executive Vice President, nine registered investment companies for which Management acts as investment manager and administrator (nine since 2008); Secretary, nine registered investment companies for which Management acts as investment manager and administrator (three since 1985, three since 2002, one since 2003, one since 2005 and one since 2006). | |
| Anthony DiBernardo (1979) | | Assistant Treasurer since 2011 | | Vice President, Neuberger, since 2009; Employee, Management, since 2003; Assistant Treasurer, nine registered investment companies for which Management acts as investment manager and administrator (nine since 2011). | |
| Sheila R. James (1965) | | Assistant Secretary since 2002 | | Vice President, Neuberger, since 2008 and Employee since 1999; formerly, Assistant Vice President, Neuberger, 2007; formerly, Employee, Management, 1991 to 1999; Assistant Secretary, nine registered investment companies for which Management acts as investment manager and administrator (six since 2002, one since 2003, one since 2005 and one since 2006). | |
| Brian Kerrane (1969) | | Vice President since 2008 | | Senior Vice President, Neuberger, since 2006; formerly, Vice President, Neuberger, 2002 to 2006; Vice President, Management, since 2008 and Employee since 1991; Vice President, nine registered investment companies for which Management acts as investment manager and administrator (nine since 2008). | |
27
Name, (Year of Birth), and Address(1) | | Position(s) and Length of Time Served(2) | | Principal Occupation(s)(3) | |
| Kevin Lyons (1955) | | Assistant Secretary since 2003 | | Assistant Vice President, Neuberger, since 2008 and Employee since 1999; formerly, Employee, Management, 1993 to 1999; Assistant Secretary, nine registered investment companies for which Management acts as investment manager and administrator (seven since 2003, one since 2005 and one since 2006). | |
| Owen F. McEntee, Jr. (1961) | | Vice President since 2008 | | Vice President, Neuberger, since 2006; Employee, Management, since 1992; Vice President, nine registered investment companies for which Management acts as investment manager and administrator (nine since 2008). | |
| John M. McGovern (1970) | | Treasurer and Principal Financial and Accounting Officer since 2005 | | Senior Vice President, Neuberger, since 2007; formerly, Vice President, Neuberger, 2004 to 2006; Employee, Management, since 1993; Treasurer and Principal Financial and Accounting Officer, nine registered investment companies for which Management acts as investment manager and administrator (eight since 2005 and one since 2006); formerly, Assistant Treasurer, eight registered investment companies for which Management acts as investment manager and administrator, 2002 to 2005. | |
| Frank Rosato (1971) | | Assistant Treasurer since 2005 | | Vice President, Neuberger, since 2006; Employee, Management, since 1995; Assistant Treasurer, nine registered investment companies for which Management acts as investment manager and administrator (eight since 2005 and one since 2006). | |
| Neil S. Siegel (1967) | | Vice President since 2008 | | Managing Director, Management, since 2008; Managing Director, Neuberger, since 2006; formerly, Senior Vice President, Neuberger, 2004 to 2006; Vice President, nine registered investment companies for which Management acts as investment manager and administrator (nine since 2008). | |
| Chamaine Williams (1971) | | Chief Compliance Officer since 2005 | | Senior Vice President, Neuberger, since 2007; Chief Compliance Officer, Management, since 2006; Chief Compliance Officer, nine registered investment companies for which Management acts as investment manager and administrator (eight since 2005 and one since 2006); formerly, Senior Vice President, LBI, 2007 to 2008; formerly, Vice President, LBI, 2003 to 2006; formerly, Chief Compliance Officer, Lehman Brothers Asset Management Inc., 2003 to 2007; formerly, Chief Compliance Officer, Lehman Brothers Alternative Investment Management LLC, 2003 to 2007. | |
(1) The business address of each listed person is 605 Third Avenue, New York, New York 10158.
(2) Pursuant to the By-Laws of the Trust, each officer elected by the Fund Trustees shall hold office until his or her successor shall have been elected and qualified or until his or her earlier death, inability to serve, or resignation. Officers serve at the pleasure of the Fund Trustees and may be removed at any time with or without cause.
(3) Except as otherwise indicated, each individual has held the positions shown for at least the last five years.
28
Proxy Voting Policies and Procedures
A description of the policies and procedures that the Trust uses to determine how to vote proxies relating to portfolio securities is available, without charge, by calling 1-800-877-9700 (toll-free) and on the website of the Securities and Exchange Commission, at www.sec.gov. Information regarding how the Trust voted proxies relating to portfolio securities during the most recent 12-month period ended June 30 is also available, without charge, by calling 1-800-877-9700 (toll-free), on the website of the Securities and Exchange Commission at www.sec.gov, and on Management's website at www.nb.com.
Quarterly Portfolio Schedule
The Trust files a complete schedule of portfolio holdings for the Fund with the Securities and Exchange Commission for the first and third quarters of each fiscal year on Form N-Q. The Trust's Forms N-Q are available on the Securities and Exchange Commission's website at www.sec.gov and may be reviewed and copied at the Securities and Exchange Commission's Public Reference Room in Washington, DC. Information on the operation of the Public Reference Room may be obtained by calling 1-800-SEC-0330. The information on Form N-Q is available upon request, without charge, by calling 1-800-877-9700 (toll free).
Board Consideration of the Management and Sub-Advisory Agreements
At a meeting held on October 25, 2012, the Board of Trustees of Neuberger Berman Advisers Management Trust ("Board"), including the Trustees who are not "interested persons" of Management (including its affiliates) or Neuberger Berman Advisers Management Trust ("Independent Fund Trustees"), approved the continuance of the Management and Sub-Advisory Agreements ("Agreements") for Small Cap Growth Portfolio ("Fund").
In evaluating the Agreements, the Board, including the Independent Fund Trustees, reviewed materials furnished by Management in response to questions submitted by counsel for the Independent Fund Trustees, and met with senior representatives of Management regarding their personnel, operations and financial conditions as they relate to the Fund. The Independent Fund Trustees were advised by counsel that is experienced in Investment Company Act of 1940 matters and that is independent of Management. The Independent Fund Trustees received a memorandum from independent counsel discussing the legal standards for their consideration of the proposed continuance of the Agreements. They met with such counsel separately from representatives of Management to discuss the annual contract review. The annual contract review extends over three regular meetings of the Board, including one meeting devoted primarily to reviewing and discussing Fund performance, to ensure that Management has time to respond to any questions the Independent Fund Trustees may have on their initial review of the report and that the Independent Fund Trustees have time to consider those responses.
The Board considered the following factors, among others, in connection with its approval of the continuance of the Agreements: (1) the nature, extent, and quality of the services provided by Management and Neuberger; (2) the performance of the Fund compared to a relevant market index and a peer group of investment companies; (3) the costs of the services provided and profits or losses realized by Management and its affiliates from their relationship with the Fund; (4) the extent to which economies of scale might be realized as the Fund grows; and (5) whether fee levels reflect any such potential economies of scale for the benefit of investors in the Fund. In their deliberations, the Board members did not identify any particular information that was all-important or controlling, and each Trustee may have attributed different weights to the various factors.
The Board evaluated the terms of the Agreements, the overall fairness of the Agreements to the Fund and whether the Agreements were in the best interests of the Fund and its shareholders.
With respect to the nature, extent and quality of the services provided, the Board considered the performance of the Fund and the experience and staffing of the portfolio management personnel of Management and Neuberger who perform services for the Fund. The Board noted that Management also provides certain administrative services, including fund accounting and compliance oversight. The Board also considered Management's and Neuberger's policies
29
and practices regarding brokerage and allocation of portfolio transactions by Management. The Board's Portfolio Transactions and Pricing Committee from time to time reviewed the quality of the execution services that Management and Neuberger had provided, and periodically reviewed studies by an independent firm engaged to review and evaluate the quality of brokerage execution received by the Fund. The Board also reviewed whether Management and Neuberger used brokers to execute Fund transactions that provide research and other services to Management and Neuberger, and the types of benefits potentially derived from such services by Management, Neuberger, the Fund and other clients of Management and Neuberger. In addition, the Board noted the positive compliance history of Management and Neuberger, as each firm has been free of significant reported compliance problems. As in past years, the Board also considered the manner in which Management addressed various non-routine matters that arose during the year, some of them a result of developments in the broader fund industry or the regulations governing it.
The Board considered the performance of the Fund relative to its benchmark and the average performance of composite peer groups of investment companies pursuing broadly similar strategies. The Board also reviewed performance during the period in relation to certain measures of the degree of investment risk undertaken by the portfolio manager. The Board discussed with Management the Fund's performance and steps that Management had under consideration to improve performance. The Board also considered Management's resources and responsiveness with respect to the Fund.
With respect to the overall fairness of the Agreements, the Board considered the fee structure for the Fund under the Agreements and any fall-out benefits likely to accrue to Management or Neuberger or their affiliates from their relationship with the Fund. The Board also considered the contractual limit on Fund expenses undertaken by Management. With regard to the sub-advisory fee paid to Neuberger, the Board noted that this fee is "at cost." In addition, the Board considered the profitability of Management and its affiliates from their association with the Fund and noted that Management incurred a loss on the Fund.
The Board considered whether there were other funds that were advised or sub-advised by Management or its affiliates or separate accounts managed by Management or its affiliates with investment objectives, policies and strategies that were similar to the Fund. If so, the Board compared the fees charged to the Fund to the fees charged to any such other funds and/or separate accounts. The Board considered the appropriateness and reasonableness of any differences between the fees charged to the Fund and any such other funds and/or separate accounts and determined that the differences in fees were consistent with the management and other services provided.
The Board also evaluated any apparent or anticipated economies of scale in relation to the services Management provides to the Fund. The Board considered whether the Fund's fee structure provides for a reduction of payments resulting from the use of breakpoints and whether those breakpoints are set at appropriate asset levels. In concluding that the benefits accruing to Management and its affiliates by virtue of their relationship to the Fund were reasonable in comparison with the costs of providing the investment advisory and other services and the benefits accruing to the Fund, the Board reviewed specific data as to Management's loss on the Fund for a recent period. The Board also carefully examined Management's cost allocation methodology.
Conclusions
In approving the Agreements, the Board concluded that the terms of each Agreement are fair and reasonable and that approval of the Agreements is in the best interests of the Fund and its shareholders. In reaching this determination, the Board considered that Management and Neuberger could be expected to provide a high level of service to the Fund; that it retained confidence in Management's and Neuberger's capabilities to manage the Fund; that the Fund's fee structure appeared to the Board to be reasonable given the nature and quality of services provided; and that the benefits accruing to Management and its affiliates by virtue of their relationship to the Fund were reasonable in comparison with the benefits accruing to the Fund.
30
Neuberger Berman
Advisers Management Trust
Socially Responsive Portfolio
I Class Shares
S Class Shares
Annual Report
December 31, 2012
B1017 02/13
Socially Responsive Portfolio Commentary (Unaudited)
The Neuberger Berman Advisers Management Trust (AMT) Socially Responsive Portfolio Class I generated a total return of 10.98% for the fiscal year ended December 31, 2012, but underperformed its benchmark, the S&P 500 Index, which returned 16.00% for the same period. Returns for the Portfolio's Class I and Class S shares are provided on page three.
During 2012, the market responded more to macroeconomic events and perceptions than company fundamentals. Instead of rewarding companies performing well as businesses, with fundamentals like balance sheet strength, steady earnings, and high free cash flows that allow them to perform well in a slow growth economy, the market rotated quickly between "risk on" and "risk off" sentiment.
For instance, equity investors sought the visibility of return offered by dividend paying stocks when confronted with the uncertainty created by a potential U.S. debt default or of Greece exiting the eurozone. Conversely, the market favored more cyclical areas as central bank activity and slight improvements in consumer confidence and the housing sector encouraged investors during the fall.
As 2012 ended, our Portfolio began to benefit on a relative basis, potentially an early sign that investor sentiment is now shifting towards businesses that can deliver steady growth in a slow growth environment—a key characteristic of our portfolio companies since this cycle began in 2008.
Throughout the year, we continued to manage a portfolio of very high-quality businesses that, with few exceptions, delivered in line with or exceeded expectations. In light of current global debt issues, we also managed with an eye on "fat tail risk"—the potential for debt-driven deflation and recession on one hand, and for inflation triggered by the policy response to the debt crisis on the other.
We further tightened already high standards for free cash flow and balance sheet strength, focusing on well-funded businesses that we believe could survive without access to new capital, and that potentially could exit a downturn in stronger shape by outperforming weaker competitors. Many of our portfolio companies are also positioned for an inflationary possibility, with business models that we believe allow them to pass through cost increases should price inflation become an issue.
While almost all of our portfolio companies performed well as businesses throughout 2012, the Portfolio benefited most from stock selection within the Consumer Discretionary sector—where holdings such as Scripps Networks and Comcast delivered excellent results. Consumer Staples holdings also outperformed, with both McCormick and Unilever being notable performers, as did holdings in Health Care, including Covidien and Roche. Having avoided the very weak Utilities sector was another relative benefit.
Allocations within the Energy, Financials and Information Technology (IT) sectors were relative headwinds to performance. In Energy, two holdings disappointed on reduced production guidelines for 2013. In Financials, where credit-sensitive financial firms and money center banks outperformed with a late year rally, our conscious lack of exposure in the sector impeded relative performance—an exposure conviction that currently continues due to concerns over regulatory risk, business model risk and transparency. We believe our underperformance was a timing issue and that our mix of Financials holdings—which includes asset managers, insurers and exchanges—could outperform over time. Within IT, not owning Apple was a relative headwind for much of the year.
We managed the Portfolio fairly actively this year, especially in recent months. We sold Newfield Exploration, one of our Energy detractors, as well as strong contributors Charles Schwab and Comcast. In Schwab's case, we saw pressure on earnings potential from an extended low interest rate environment. We sold Comcast as its stock, in our estimation, became more fully valued.
1
New purchases included BorgWarner and Newell Rubbermaid. BorgWarner supplies emissions and fuel efficiency components to the automotive sector. With a strong balance sheet and growing global demand for clean combustion and improved fuel efficiency, we presently see the potential for outperformance over time.
Newell Rubbermaid—owner of global brands including Rubbermaid, Irwin, Lenox, Parker, Paper-Mate, Sharpie, Graco and more—could become a turnaround story. We currently believe its experienced new management team can successfully restructure the business through moves such as increasing international exposure, reducing redundant overhead and centralizing decision making. Newell intends to reduce its operational environmental footprint while focusing efforts on providing innovative products with environmental, health and hygiene benefits for the rising middle class in emerging markets.
While we trailed the index for the year, we remain pleased with our portfolio holdings and positioning. By and large, the businesses we own have outperformed in a slow growth world, executing on their strategies and providing steady or growing earnings since the 2008 recession.
As debt issues abroad and in the U.S. are likely to remain with us for the indefinite future, we anticipate ongoing uncertainty will influence near term trends in the financial markets. So while the types of stocks favored by the market may continue to rotate quickly, we will stay focused on quality companies delivering advantaged growth, and which we believe are positioned to outperform as businesses through the environment that unfolds. Within a longer-term strategy, we believe the relatively positive earnings development of our portfolio companies in 2012 could serve as fuel for relative outperformance in the periods ahead, especially in a subdued growth environment.
Sincerely,
ARTHUR MORETTI AND INGRID DYOTT
PORTFOLIO CO-MANAGERS
Information about the principal risks of investing in the Portfolio is set forth in the prospectus and statement of additional information.
The portfolio composition, industries and holdings of the Portfolio are subject to change.
Opinions expressed are as of the date herein and are subject to change without notice. This material is not intended to be a formal research report and should not be construed as an offer to sell or the solicitation of an offer to buy any security.
2
Socially Responsive Portfolio (Unaudited)
SECTOR ALLOCATION
| (as a % of Total Investments) | |
| Consumer Discretionary | | | 11.7 | % | |
| Consumer Staples | | | 11.6 | | |
| Energy | | | 11.2 | | |
| Financials | | | 15.8 | | |
| Health Care | | | 9.3 | | |
| Industrials | | | 15.7 | | |
| Information Technology | | | 17.4 | | |
| Materials | | | 4.3 | | |
| Short-Term Investments | | | 3.0 | | |
| Total | | | 100.0 | % | |
PERFORMANCE HIGHLIGHTS
| | | | | Average Annual Total Return Ended 12/31/2012 | |
| | | Inception Date | | 1 Year | | 5 Years | | 10 Years | | Life of Fund | |
Socially Responsive Portfolio Class I | | 02/18/1999 | | | 10.98 | % | | | 1.01 | % | | | 7.67 | % | | | 4.94 | % | |
Socially Responsive Portfolio Class S2 | | 05/01/2006 | | | 10.74 | % | | | 0.93 | % | | | 7.58 | % | | | 4.89 | % | |
S&P 500 Index1,3 | | | | | 16.00 | % | | | 1.66 | % | | | 7.10 | % | | | 2.98 | % | |
The performance data quoted represent past performance and do not indicate future results. Current performance may be lower or higher than the performance data quoted. For more current performance data, please visit www.nb.com.
The results shown in the table reflect the reinvestment of income dividends and other distributions, if any. The results do not reflect the effect of taxes a shareholder would pay on Portfolio distributions or on the redemption of Portfolio shares. The results do not reflect fees and expenses of the variable annuity and variable life insurance policies or the qualified pension and retirement plans whose proceeds are invested in the Portfolio.
The investment return and principal value of an investment will fluctuate and shares, when redeemed, may be worth more or less than their original cost.
Returns would have been lower if Neuberger Berman Management LLC ("Management") had not reimbursed certain expenses and/or waived a portion of the investment management fees during certain of the periods shown. Repayment by a class (of expenses previously reimbursed and/or fees previously waived by Management) will decrease the class's returns. Please see Note B in the Notes to Financial Statements for specific information regarding expense reimbursement and/or fee waiver arrangements.
COMPARISON OF A $10,000 INVESTMENT
This graph shows the change in value of a hypothetical $10,000 investment in the Portfolio over the past 10 fiscal years, or since the Portfolio's inception, if it has not operated for 10 years. The graph is based on Class I shares only; the performance of the Portfolio's share classes will differ primarily due to different class expenses (see Performance Highlights chart above). The result is compared with benchmarks, which include a broad-based market index and may include a more narrowly based index. Market indices have not been reduced to reflect any of the fees and costs of investing. The results shown in the graph reflect the reinvestment of income dividends and other distributions, if any. The results do not reflect the effect of taxes a shareholder would pay on Portfolio distributions or on the redemption of Portfolio shares. Results represent past performance and do not indicate future results.
Please see Endnotes for additional information.
3
Endnotes (Unaudited)
1 The date used to calculate Life of Fund performance for the index is the inception date of the oldest share class.
2 Performance shown prior to May 1, 2006 for Class S shares is that of Class I shares, which have lower expenses and correspondingly higher returns than Class S shares.
3 The S&P 500 Index is widely regarded as the standard for measuring large-cap U.S. stock market performance and includes a representative sample of leading companies in leading industries. Please note that indices do not take into account any fees, expenses or tax consequences of investing in the individual securities that they track, and individuals cannot invest directly in any index. Data about the performance of an index is prepared or obtained by Neuberger Berman Management LLC ("Management") and reflects the reinvestment of income dividends and other distributions, if any. The Portfolio may invest in securities not included in a described index or may not invest in all securities included in a described index.
Any ratios or other measurements using a factor of forecasted earnings of a company discussed herein are based on consensus estimates, not Management's own projections, and they may or may not be realized. In addition, any revision to a forecast could affect the market price of a security. By quoting them herein, Management does not offer an opinion as to the accuracy of, and does not guarantee, these forecasted numbers.
The investments for the Portfolio are managed by the same portfolio manager(s) who manage(s) one or more other registered funds that have names, investment objectives and investment styles that are similar to those of the Portfolio. You should be aware that the Portfolio is likely to differ from the other mutual fund(s) in size, cash flow pattern and tax matters. Accordingly, the holdings and performance of the Portfolio can be expected to vary from those of the other mutual fund(s).
Shares of the separate AMT Portfolios are not available to the general public. Shares of this Portfolio may be purchased only by life insurance companies to be used with their separate accounts that fund variable annuity and variable life insurance policies and by qualified pension and retirement plans.
Statistics and projections in this report are derived from sources deemed to be reliable but cannot be regarded as a representation of future results of the AMT Portfolios. This report is prepared for the general information of shareholders and is not an offer of shares of the AMT Portfolios. Shares of the AMT Portfolios are sold only through the currently effective prospectuses, which must precede or accompany this report.
The "Neuberger Berman" name and logo are registered service marks of Neuberger Berman Group LLC. "Neuberger Berman Management LLC" and the individual Fund names in this piece are either service marks or registered service marks of Neuberger Berman Management LLC.
© 2013 Neuberger Berman Management LLC distributor. All rights reserved.
4
Information About Your Fund's Expenses (Unaudited)
As a Fund shareholder, you incur two types of costs: (1) transaction costs such as fees and expenses that are, or may be, imposed under your variable contract or qualified pension plan; and (2) ongoing costs, including management fees; distribution and/or service (12b-1) fees (if applicable); and other Fund expenses. This example is intended to help you understand your ongoing costs (in dollars) of investing in the Fund and compare these costs with the ongoing costs of investing in other mutual funds.
This table is designed to provide information regarding costs related to your investments. The following examples are based on an investment of $1,000 made at the beginning of the six month period ended December 31, 2012 and held for the entire period. The table illustrates the Fund's costs in two ways:
| Actual Expenses and Performance: | | The first section of the table provides information about actual account values and actual expenses in dollars, based on the Fund's actual performance during the period. You may use the information in this line, together with the amount you invested, to estimate the expenses you paid over the period. Simply divide your account value by $1,000 (for example, an $8,600 account value divided by $1,000 = 8.6), then multiply the result by the number in the first section of the table under the heading entitled "Expenses Paid During the Period" to estimate the expenses you paid over the period. | |
Hypothetical Example for Comparison Purposes: | | The second section of the table provides information about hypothetical account values and hypothetical expenses based on the Fund's actual expense ratio and an assumed rate of return at 5% per year before expenses. This return is not the Fund's actual return. The hypothetical account values and expenses may not be used to estimate the actual ending account balance or expenses you paid for the period. You may use this information to compare the ongoing costs of investing in this Fund versus other funds. To do so, compare the expenses shown in this 5% hypothetical example with the 5% hypothetical examples that appear in the shareholder reports of other funds. | |
Please note that the expenses in the table are meant to highlight your ongoing costs only and do not include any transaction costs, such as fees and expenses that are, or may be imposed under your variable contract or qualified pension plan. Therefore, the information under the heading "Hypothetical (5% annual return before expenses)" is useful in comparing ongoing costs only, and will not help you determine the relative total costs of owning different funds. In addition, if these transaction costs were included, your costs would have been higher.
Expense Information as of 12/31/12
NEUBERGER BERMAN ADVISERS MANAGEMENT TRUST SOCIALLY RESPONSIVE PORTFOLIO
| Actual | | Beginning Account Value 7/1/12 | | Ending Account Value 12/31/12 | | Expenses Paid During the Period* 7/1/12 – 12/31/12 | | Expense Ratio | |
| Class I | | $ | 1,000.00 | | | $ | 1,071.00 | | | $ | 5.36 | | | | 1.03 | % | |
| Class S | | $ | 1,000.00 | | | $ | 1,070.30 | | | $ | 6.09 | | | | 1.17 | % | |
| Hypothetical (5% annual return before expenses)** | |
| Class I | | $ | 1,000.00 | | | $ | 1,019.96 | | | $ | 5.23 | | | | 1.03 | % | |
| Class S | | $ | 1,000.00 | | | $ | 1,019.25 | | | $ | 5.94 | | | | 1.17 | % | |
* For each class, expenses are equal to the annualized expense ratio for the class, multiplied by the average account value over the period, multiplied by 184/366 (to reflect the one-half year period shown).
** Hypothetical 5% annual return before expenses is calculated by multiplying the number of days in the most recent half year divided by 366.
5
Schedule of Investments Socially Responsive Portfolio
| NUMBER OF SHARES | | | | VALUE† | |
| Common Stocks (96.9%) | | | |
| Auto Components (2.2%) | | | |
| | 65,055 | | | BorgWarner, Inc. | | $ | 4,659,239 | * | |
| Capital Markets (4.1%) | | | |
| | 20,550 | | | BlackRock, Inc. | | | 4,247,890 | | |
| | 154,740 | | | Lazard Ltd. Class A | | | 4,617,442 | | |
| | | | 8,865,332 | | |
| Chemicals (1.9%) | | | |
| | 57,810 | | | Ecolab, Inc. | | | 4,156,539 | | |
| Commercial Services & Supplies (1.6%) | | | |
| | 159,910 | | | Herman Miller, Inc. | | | 3,425,272 | | |
| Consumer Finance (3.0%) | | | |
| | 112,915 | | | American Express Co. | | | 6,490,354 | | |
| Diversified Financial Services (4.7%) | | | |
| | 75,142 | | | CME Group, Inc. | | | 3,810,451 | | |
| | 51,747 | | | IntercontinentalExchange, Inc. | | | 6,406,796 | * | |
| | | | 10,217,247 | | |
Electronic Equipment, Instruments & Components (2.6%) | | | |
| | 216,840 | | | National Instruments Corp. | | | 5,596,640 | | |
| Energy Equipment & Services (2.8%) | | | |
| | 105,950 | | | Cameron International Corp. | | | 5,981,937 | * | |
| Food Products (8.2%) | | | |
| | 64,595 | | | J.M. Smucker Co. | | | 5,570,673 | | |
| | 64,005 | | | McCormick & Co., Inc. | | | 4,066,238 | | |
| | 210,665 | | | Unilever NV | | | 8,068,469 | | |
| | | | 17,705,380 | | |
| Health Care Equipment & Supplies (6.0%) | | | |
| | 79,380 | | | Becton, Dickinson & Co. | | | 6,206,722 | | |
| | 115,730 | | | Covidien PLC | | | 6,682,250 | | |
| | | | 12,888,972 | | |
| Household Durables (2.0%) | | | |
| | 195,950 | | | Newell Rubbermaid, Inc. | | | 4,363,807 | | |
| Household Products (3.4%) | | | |
| | 107,410 | | | Procter & Gamble Co. | | | 7,292,065 | | |
| NUMBER OF SHARES | | | | VALUE† | |
| Industrial Conglomerates (8.0%) | | | |
| | 70,650 | | | 3M Co. | | $ | 6,559,852 | | |
| | 190,590 | | | Danaher Corp. | | | 10,653,981 | | |
| | | | 17,213,833 | | |
| Industrial Gases (1.8%) | | | |
| | 34,505 | | | Praxair, Inc. | | | 3,776,572 | | |
| Insurance (3.9%) | | | |
| | 399,805 | | | Progressive Corp. | | | 8,435,886 | | |
| Internet Software & Services (3.3%) | | | |
| | 9,951 | | | Google, Inc. Class A | | | 7,058,941 | * | |
| IT Services (1.5%) | | | |
| | 6,621 | | | MasterCard, Inc. Class A | | | 3,252,765 | | |
| Machinery (2.4%) | | | |
| | 86,265 | | | Pall Corp. | | | 5,198,329 | | |
| Media (2.8%) | | | |
| | 103,170 | | | Scripps Networks Interactive, Inc. Class A | | | 5,975,606 | | |
| Multiline Retail (1.9%) | | | |
| | 69,900 | | | Target Corp. | | | 4,135,983 | | |
| Oil, Gas & Consumable Fuels (8.5%) | | | |
| | 403,222 | | | BG Group PLC | | | 6,725,660 | | |
| | 94,775 | | | Cimarex Energy Co. | | | 5,471,361 | | |
| | 59,550 | | | Noble Energy, Inc. | | | 6,058,617 | | |
| | | | 18,255,638 | | |
| Pharmaceuticals (3.3%) | | | |
| | 35,206 | | | Roche Holding AG | | | 7,117,989 | | |
| Road & Rail (1.8%) | | | |
| | 63,225 | | | J.B. Hunt Transport Services, Inc. | | | 3,775,165 | | |
Semiconductors & Semiconductor Equipment (10.0%) | | | |
| | 313,435 | | | Altera Corp. | | | 10,794,701 | | |
| | 346,340 | | | Texas Instruments, Inc. | | | 10,715,760 | | |
| | | | 21,510,461 | | |
| Specialty Chemicals (0.6%) | | | |
| | 49,425 | | | Novozymes A/S B Shares | | | 1,403,009 | | |
| Specialty Retail (2.7%) | | | |
| | 66,081 | | | O'Reilly Automotive, Inc. | | | 5,908,963 | * | |
See Notes to Schedule of Investments
6
| NUMBER OF SHARES | | | | VALUE† | |
| Trading Companies & Distributors (1.9%) | | | |
| | 20,740 | | | W.W. Grainger, Inc. | | $ | 4,197,154 | | |
| | | | | Total Common Stocks (Cost $175,618,418) | | | 208,859,078 | | |
| Short-Term Investments (2.9%) | | | |
| | 6,172,605 | | | State Street Institutional Treasury Money Market Fund Institutional Class (Cost $6,172,605) | | | 6,172,605 | | |
| PRINCIPAL AMOUNT | | | |
| Certificates of Deposit (0.1%) | | | |
| $ | 100,000 | | | Self Help Credit Union, 0.50%, due 1/24/13 | | | 100,000 | | |
| | 100,000 | | | Self Help Credit Union, 0.50%, due 1/29/13 | | | 100,000 | | |
| | | | | Total Certificates of Deposit (Cost $200,000) | | | 200,000 | # | |
| | | | | Total Investments (99.9%) (Cost $181,991,023) | | | 215,231,683 | ## | |
| | | | | Cash, receivables and other assets, less liabilities (0.1%) | | | 174,951 | | |
| | | | | Total Net Assets (100.0%) | | $ | 215,406,634 | | |
See Notes to Schedule of Investments
7
Notes to Schedule of Investments Socially Responsive Portfolio
† In accordance with Accounting Standards Codification ("ASC") 820 "Fair Value Measurements and Disclosures" ("ASC 820"), all investments held by Neuberger Berman Advisers Management Trust Socially Responsive Portfolio (the "Fund") are carried at the value that Neuberger Berman Management LLC ("Management") believes the Fund would receive upon selling an investment in an orderly transaction to an independent buyer in the principal or most advantageous market for the investment under current market conditions. Various inputs, including the volume and level of activity for the asset or liability in the market, are considered in valuing the Fund's investments, some of which are discussed below. Significant management judgment may be necessary to value investments in accordance with ASC 820.
ASC 820 established a three-tier hierarchy of inputs to create a classification of value measurements for disclosure purposes. The three-tier hierarchy of inputs is summarized in the three broad Levels listed below.
• Level 1 – quoted prices in active markets for identical investments
• Level 2 – other significant observable inputs (including quoted prices for similar investments, interest rates, prepayment speeds, credit risk, amortized cost, etc.)
• Level 3 – significant unobservable inputs (including the Fund's own assumptions in determining the fair value of investments)
The inputs or methodology used for valuing an investment are not necessarily an indication of the risk associated with investing in those securities.
The value of the Fund's investments in equity securities and exchange traded funds, for which market quotations are readily available, is generally determined by Management by obtaining valuations from an independent pricing service based on the latest sale price quoted on a principal exchange or market for that security (Level 1 inputs). Securities traded primarily on the NASDAQ Stock Market are normally valued by the Fund at the NASDAQ Official Closing Price ("NOCP") provided by NASDAQ each business day. The NOCP is the most recently reported price as of 4:00:02 p.m., Eastern time, unless that price is outside the range of the "inside" bid and asked prices (i.e., the bid and asked prices that dealers quote to each other when trading for their own accounts); in that case, NASDAQ will adjust the price to equal the inside bid or asked price, whichever is closer. Because of delays in reporting trades, the NOCP may not be based on the price of the last trade to occur before the market closes. If there is no reported sale of a security on a particular day, the independent pricing service may value the security based on reported market quotations.
Management has developed a process to periodically review information provided by independent pricing services for all types of securities.
Certificates of Deposit are valued at amortized cost. Investments in State Street Institutional Treasury Money Market Fund Institutional Class are valued using the fund's daily calculated net asset value per share (Level 2 inputs).
If a valuation is not available from an independent pricing service, or if Management has reason to believe that the valuation received does not represent the amount the Fund might reasonably expect to receive on a current sale in an orderly transaction, the Fund seeks to obtain quotations from principal market makers (generally considered Level 3 inputs). If such quotations are not readily available, the security is valued using methods the Neuberger Berman Advisers Management Trust's Board of Trustees (the "Board") has approved on the belief that they reflect fair value. Numerous factors may be considered when determining the fair value of a security based on Level 2 or 3 inputs, including available analyst, media or other reports, trading in futures or ADRs and whether the issuer of the security being fair valued has other securities outstanding.
The value of the Fund's investments in foreign securities is generally determined using the same valuation methods and inputs as other Fund investments, as discussed above. Foreign security prices expressed in local currency values are translated from the local currency into U.S. dollars using the exchange rate as of 4:00 p.m., Eastern time. The Board has approved the use of Interactive Data Pricing and Reference Data, Inc. ("Interactive") to assist in determining the fair value of foreign equity securities when changes in the value of a certain index suggest that the closing prices on the foreign exchanges may no longer represent the amount that the Fund could expect to receive for those securities or on days when foreign markets are closed and U.S. markets are open. In each of these events, Interactive will provide
See Notes to Financial Statements
8
Notes to Schedule of Investments Socially Responsive Portfolio (cont'd)
adjusted prices for certain foreign equity securities using a statistical analysis of historical correlations of multiple factors (Level 2 inputs). In the absence of precise information about the market values of these foreign securities as of the close of the New York Stock Exchange, the Board has determined on the basis of available data that prices adjusted in this way are likely to be closer to the prices the Fund could realize on a current sale than are the prices of those securities established at the close of the foreign markets in which the securities primarily trade.
Fair value prices are necessarily estimates, and there is no assurance that such a price will be at or close to the price at which the security is next quoted or next trades.
The following is a summary, categorized by Level, of inputs used to value the Fund's investments as of December 31, 2012:
| Asset Valuation Inputs | | Level 1 | | Level 2 | | Level 3 | | Total | |
| Investments: | |
| Common Stocks | |
| Auto Components | | $ | 4,659,239 | | | $ | — | | | $ | — | | | $ | 4,659,239 | | |
| Capital Markets | | | 8,865,332 | | | | — | | | | — | | | | 8,865,332 | | |
| Chemicals | | | 4,156,539 | | | | — | | | | — | | | | 4,156,539 | | |
| Commercial Services & Supplies | | | 3,425,272 | | | | — | | | | — | | | | 3,425,272 | | |
| Consumer Finance | | | 6,490,354 | | | | — | | | | — | | | | 6,490,354 | | |
| Diversified Financial Services | | | 10,217,247 | | | | — | | | | — | | | | 10,217,247 | | |
| Electronic Equipment, Instruments & Components | | | 5,596,640 | | | | — | | | | — | | | | 5,596,640 | | |
| Energy Equipment & Services | | | 5,981,937 | | | | — | | | | — | | | | 5,981,937 | | |
| Food Products | | | 17,705,380 | | | | — | | | | — | | | | 17,705,380 | | |
| Health Care Equipment & Supplies | | | 12,888,972 | | | | — | | | | — | | | | 12,888,972 | | |
| Household Durables | | | 4,363,807 | | | | — | | | | — | | | | 4,363,807 | | |
| Household Products | | | 7,292,065 | | | | — | | | | — | | | | 7,292,065 | | |
| Industrial Conglomerates | | | 17,213,833 | | | | — | | | | — | | | | 17,213,833 | | |
| Industrial Gases | | | 3,776,572 | | | | — | | | | — | | | | 3,776,572 | | |
| Insurance | | | 8,435,886 | | | | — | | | | — | | | | 8,435,886 | | |
| Internet Software & Services | | | 7,058,941 | | | | — | | | | — | | | | 7,058,941 | | |
| IT Services | | | 3,252,765 | | | | — | | | | — | | | | 3,252,765 | | |
| Machinery | | | 5,198,329 | | | | — | | | | — | | | | 5,198,329 | | |
| Media | | | 5,975,606 | | | | — | | | | — | | | | 5,975,606 | | |
| Multiline Retail | | | 4,135,983 | | | | — | | | | — | | | | 4,135,983 | | |
| Oil, Gas & Consumable Fuels | | | 11,529,978 | | | | 6,725,660 | | | | — | | | | 18,255,638 | | |
| Pharmaceuticals | | | — | | | | 7,117,989 | | | | — | | | | 7,117,989 | | |
| Road & Rail | | | 3,775,165 | | | | — | | | | — | | | | 3,775,165 | | |
| Semiconductors & Semiconductor Equipment | | | 21,510,461 | | | | — | | | | — | | | | 21,510,461 | | |
| Specialty Chemicals | | | — | | | | 1,403,009 | | | | — | | | | 1,403,009 | | |
| Specialty Retail | | | 5,908,963 | | | | — | | | | — | | | | 5,908,963 | | |
| Trading Companies & Distributors | | | 4,197,154 | | | | — | | | | — | | | | 4,197,154 | | |
| Total Common Stocks | | | 193,612,420 | | | | 15,246,658 | | | | — | | | | 208,859,078 | | |
| Short-Term Investments | | | — | | | | 6,172,605 | | | | — | | | | 6,172,605 | | |
| Certificates of Deposit | | | — | | | | 200,000 | | | | — | | | | 200,000 | | |
| Total Investments | | $ | 193,612,420 | | | $ | 21,619,263 | | | $ | — | | | $ | 215,231,683 | | |
See Notes to Financial Statements
9
Notes to Schedule of Investments Socially Responsive Portfolio (cont'd)
As of the year ending December 31, 2012, certain foreign equity securities were transferred from Level 1 to Level 2 as a result of the Fund's procedures for valuing securities, as stated in the description of the valuation methods of foreign equity securities above. Based on beginning of period market values as of December 31, 2011, $13,987,518 was transferred from Level 1 to Level 2.
# At cost, which approximates market value.
## At December 31, 2012, the cost of investments for U.S. federal income tax purposes was $182,380,760. Gross unrealized appreciation of investments was $34,232,233 and gross unrealized depreciation of investments was $1,381,310, resulting in net unrealized appreciation of $32,850,923, based on cost for U.S. federal income tax purposes.
* Security did not produce income during the last twelve months.
See Notes to Financial Statements
10
Statement of Assets and Liabilities
Neuberger Berman Advisers Management Trust
| | | SOCIALLY RESPONSIVE PORTFOLIO | |
| | | December 31, 2012 | |
| Assets | |
| Investments in securities, at value* (Note A)—see Schedule of Investments: | |
| Unaffiliated issuers | | $ | 215,231,683 | | |
| Dividends and interest receivable | | | 117,420 | | |
| Receivable for Fund shares sold | | | 423,305 | | |
| Prepaid expenses and other assets | | | 2,515 | | |
| Total Assets | | | 215,774,923 | | |
| Liabilities | |
| Payable for Fund shares redeemed | | | 121,276 | | |
| Payable to investment manager (Note B) | | | 99,623 | | |
| Payable to administrator—net (Note B) | | | 62,919 | | |
| Accrued expenses and other payables | | | 84,471 | | |
| Total Liabilities | | | 368,289 | | |
| Net Assets | | $ | 215,406,634 | | |
| Net Assets consist of: | |
| Paid-in capital | | $ | 200,623,628 | | |
| Undistributed net investment income (loss) | | | 1,845,780 | | |
| Accumulated net realized gains (losses) on investments | | | (20,304,018 | ) | |
| Net unrealized appreciation (depreciation) in value of investments | | | 33,241,244 | | |
| Net Assets | | $ | 215,406,634 | | |
| Net Assets | |
| Class I | | $ | 148,658,213 | | |
| Class S | | | 66,748,421 | | |
| Shares Outstanding ($.001 par value; unlimited shares authorized) | |
| Class I | | | 9,357,992 | | |
| Class S | | | 4,193,035 | | |
| Net Asset Value, offering and redemption price per share | |
| Class I | | $ | 15.89 | | |
| Class S | | | 15.92 | | |
| *Cost of Investments | | $ | 181,991,023 | | |
See Notes to Financial Statements
11
Statement of Operations
Neuberger Berman Advisers Management Trust
| | | SOCIALLY RESPONSIVE PORTFOLIO | |
| | | For the Year Ended December 31, 2012 | |
| Investment Income: | |
| Income (Note A): | |
| Dividend income—unaffiliated issuers | | $ | 4,125,543 | | |
| Interest income—unaffiliated issuers | | | 1,598 | | |
| Foreign taxes withheld | | | (87,661 | ) | |
| Total income | | $ | 4,039,480 | | |
| Expenses: | |
| Investment management fees (Note B) | | | 1,109,549 | | |
| Administration fees (Note B): | |
| Class I | | | 389,545 | | |
| Class S | | | 215,664 | | |
| Distribution fees (Note B): | |
| Class S | | | 179,720 | | |
| Audit fees | | | 43,535 | | |
| Custodian fees | | | 85,474 | | |
| Insurance expense | | | 10,867 | | |
| Legal fees | | | 102,739 | | |
| Shareholder reports | | | 67,740 | | |
| Trustees' fees and expenses | | | 50,935 | | |
| Miscellaneous | | | 8,603 | | |
| Total expenses | | | 2,264,371 | | |
| Expenses reimbursed by Management (Note B) | | | (80,791 | ) | |
| Expenses reduced by custodian fee expense offset arrangement (Note A) | | | (35 | ) | |
| Total net expenses | | | 2,183,545 | | |
| Net investment income (loss) | | $ | 1,855,935 | | |
| Realized and Unrealized Gain (Loss) on Investments (Note A): | |
| Net realized gain (loss) on: | |
| Sales of investment securities of unaffiliated issuers | | | 2,838,035 | | |
| Foreign currency | | | (9,319 | ) | |
| Change in net unrealized appreciation (depreciation) in value of: | |
| Unaffiliated investment securities | | | 15,661,861 | | |
| Foreign currency | | | 1,021 | | |
| Net gain (loss) on investments | | | 18,491,598 | | |
| Net increase (decrease) in net assets resulting from operations | | $ | 20,347,533 | | |
See Notes to Financial Statements
12
Statements of Changes in Net Assets
Neuberger Berman Advisers Management Trust
| | | SOCIALLY RESPONSIVE PORTFOLIO | |
| | | Year Ended December 31, 2012 | | Year Ended December 31, 2011 | |
| Increase (Decrease) in Net Assets: | |
| From Operations (Note A): | |
| Net investment income (loss) | | $ | 1,855,935 | | | $ | 434,659 | | |
| Net realized gain (loss) on investments | | | 2,828,716 | | | | 2,435,202 | | |
| Change in net unrealized appreciation (depreciation) of investments | | | 15,662,882 | | | | (9,287,434 | ) | |
| Net increase (decrease) in net assets resulting from operations | | | 20,347,533 | | | | (6,417,573 | ) | |
| Distributions to Shareholders From (Note A): | |
| Net investment income: | |
| Class I | | | (316,032 | ) | | | (361,073 | ) | |
| Class S | | | (69,241 | ) | | | (194,031 | ) | |
| Total distributions to shareholders | | | (385,273 | ) | | | (555,104 | ) | |
| From Fund Share Transactions (Note D): | |
| Proceeds from shares sold: | |
| Class I | | | 44,470,837 | | | | 47,741,592 | | |
| Class S | | | 8,088,806 | | | | 15,494,093 | | |
| Proceeds from reinvestment of dividends and distributions: | |
| Class I | | | 316,032 | | | | 361,073 | | |
| Class S | | | 69,241 | | | | 194,031 | | |
| Payments for shares redeemed: | |
| Class I | | | (17,255,217 | ) | | | (18,963,501 | ) | |
| Class S | | | (19,278,046 | ) | | | (14,940,554 | ) | |
| Net increase (decrease) from Fund share transactions | | | 16,411,653 | | | | 29,886,734 | | |
| Net Increase (Decrease) in Net Assets | | | 36,373,913 | | | | 22,914,057 | | |
| Net Assets: | |
| Beginning of year | | | 179,032,721 | | | | 156,118,664 | | |
| End of year | | $ | 215,406,634 | | | $ | 179,032,721 | | |
| Undistributed net investment income (loss) at end of year | | $ | 1,845,780 | | | $ | 384,437 | | |
See Notes to Financial Statements
13
Notes to Financial Statements Socially Responsive Portfolio
Note A—Summary of Significant Accounting Policies:
1 General: Neuberger Berman Advisers Management Trust (the "Trust") is a Delaware statutory trust organized pursuant to a Trust Instrument dated May 23, 1994. The Trust is currently comprised of ten separate operating series (each individually a "Series," and collectively the "Funds") each of which is diversified. The Trust is registered as an open-end management investment company under the Investment Company Act of 1940, as amended (the "1940 Act"), and its shares are registered under the Securities Act of 1933, as amended. The Fund currently offers Class I and Class S shares. The Board may establish additional series or classes of shares without the approval of shareholders.
The assets of each Series belong only to that Series, and the liabilities of each Series are borne solely by that Series and no other.
The preparation of financial statements in accordance with U.S. generally accepted accounting principles ("GAAP") requires Management to make estimates and assumptions at the date of the financial statements. Actual results could differ from those estimates.
2 Portfolio valuation: Investment securities are valued as indicated in the notes following the Schedule of Investments.
3 Foreign currency translation: The accounting records of the Fund are maintained in U.S. dollars. Foreign currency amounts are translated into U.S. dollars using the exchange rate as of 4:00 p.m., Eastern time, to determine the value of investments, other assets and liabilities. Purchase and sale prices of securities, and income and expenses, are translated into U.S. dollars at the prevailing rate of exchange on the respective dates of such transactions. Net unrealized foreign currency gain (loss), if any, arises from changes in the value of assets and liabilities, other than investments in securities, as a result of changes in exchange rates and is stated separately in the Statement of Operations.
4 Securities transactions and investment income: Securities transactions are recorded on trade date for financial reporting purposes. Dividend income is recorded on the ex-dividend date or, for certain foreign dividends, as soon as the Fund becomes aware of the dividends. Non-cash dividends included in dividend income, if any, are recorded at the fair market value of the securities received. Interest income, including accretion of original issue discount, where applicable, and accretion of discount on short-term investments, if any, is recorded on the accrual basis. Realized gains and losses from securities transactions and foreign currency transactions, if any, are recorded on the basis of identified cost and stated separately in the Statement of Operations. Included in net realized gain (loss) on investments are proceeds from the settlements of class action litigation in which the Fund participated as a class member. The amount of such proceeds for the year ended December 31, 2012 was $61,994.
5 Income tax information: The Funds are treated as separate entities for U.S. federal income tax purposes. It is the policy of the Fund to continue to qualify for treatment as a regulated investment company by complying with the requirements of the U.S. Internal Revenue Code applicable to regulated investment companies and to distribute substantially all of its net investment income and net realized capital gains to its shareholders. To the extent the Fund distributes substantially all of its net investment income and net realized capital gains to shareholders, no federal income or excise tax provision is required.
The Fund has adopted the provisions of ASC 740 "Income Taxes" ("ASC 740"). ASC 740 sets forth a minimum threshold for financial statement recognition of a tax position taken, or expected to be taken, in a tax return. The Fund recognizes interest and penalties, if any, related to unrecognized tax positions as an income tax expense in the Statement of Operations. The Fund is subject to examination by U.S. federal and state tax authorities for returns filed for the prior three fiscal years 2009-2011. As of December 31, 2012, the Fund did not have any unrecognized tax positions.
14
Income distributions and capital gain distributions are determined in accordance with income tax regulations, which may differ from GAAP. These differences are primarily due to differing treatments of income and gains on various investment securities held by the Fund, timing differences and differing characterization of distributions made by the Fund. The Fund may also utilize earnings and profits distributed to shareholders on redemption of shares as a part of the dividends-paid deduction for income tax purposes.
As determined on December 31, 2012, permanent differences resulting primarily from different book and tax accounting were reclassified at year end. Such differences are attributed to foreign currency gains and losses. These reclassifications had no effect on net income, net asset value ("NAV") or NAV per share of the Fund. For the year ended December 31, 2012, the Fund recorded the following permanent reclassifications:
| | | Paid-in Capital | | Undistributed Net Investment Income (Loss) | | Accumulated Net Realized Gains (Losses) on Investments | |
| | | | | $ | — | | | $ | (9,319 | ) | | $ | 9,319 | | |
For tax purposes, distributions of short-term gains are taxable to shareholders as ordinary income.
The tax character of distributions paid during the years ended December 31, 2012 and December 31, 2011 was as follows:
| | | Distributions Paid From: | |
| | | Ordinary Income | | Long-Term Capital Gain | | Total | |
| | | 2012 | | 2011 | | 2012 | | 2011 | | 2012 | | 2011 | |
| | | | | $ | 385,273 | | | $ | 555,104 | | | $ | — | | | $ | — | | | $ | 385,273 | | | $ | 555,104 | | |
As of December 31, 2012, the components of distributable earnings (accumulated losses) on a U.S. federal income tax basis were as follows:
| | | Undistributed Ordinary Income | | Unrealized Appreciation (Depreciation) | | Loss Carryforwards and Deferrals | | Other Temporary Differences | | Total | |
| | | | | $ | 1,845,780 | | | $ | 32,851,507 | | | $ | (19,914,281 | ) | | $ | — | | | $ | 14,783,006 | | |
The difference between book basis and tax basis distributable earnings are primarily due to: timing differences of wash sales and capital loss carryforwards.
To the extent the Fund's net realized capital gains, if any, can be offset by capital loss carryforwards, it is the policy of the Fund not to distribute such gains. The Regulated Investment Company ("RIC") Modernization Act of 2010 (the "Act") became effective for the Fund on January 1, 2011. The Act modernizes several of the federal income and excise tax provisions related to RICs. Among the changes made are changes to the capital loss carryforward rules allowing for RICs to carry forward capital losses indefinitely and to retain the character of capital loss carryforwards as short-term or long-term ("Post-Enactment"). Rules in effect previously limited the carryforward period to eight years and all carryforwards were considered short-term in character ("Pre-Enactment"). As determined at December 31, 2012, the Fund had unused capital loss carryforwards available for federal income tax purposes to offset net realized capital gains, if any, as follows:
| | | Pre-Enactment | |
| | | Expiring in: | |
| | | 2016 | | 2017 | |
| | | | | $ | 937,150 | | | $ | 18,977,131 | | |
15
Post-Enactment capital loss carryforwards must be fully used before Pre-Enactment capital loss carryforwards; therefore, under certain circumstances, Pre-Enactment capital loss carryforwards available as of the report date may expire unused. As of December 31, 2012, the Fund had no Post-Enactment capital loss carryforwards.
Under current tax law, the use of these losses to offset future gains may be limited.
During the year ended December 31, 2012, the Fund utilized capital loss carryforwards of $2,769,051.
6 Distributions to shareholders: The Fund may earn income, net of expenses, daily on its investments. Distributions from net investment income and net realized capital gains, if any, generally are distributed once a year (usually in October). Income distributions and capital gain distributions to shareholders are recorded on the ex-date.
7 Foreign taxes: Foreign taxes withheld represent amounts withheld by foreign tax authorities, net of refunds recoverable.
8 Expense allocation: Certain expenses are applicable to multiple funds. Expenses directly attributable to a Series are charged to that Series. Expenses of the Trust that are not directly attributable to a particular series of the Trust (e.g., the Fund) are allocated among the series of the Trust, on the basis of relative net assets, except where a more appropriate allocation of expenses to each of the series can otherwise be made fairly. Expenses borne by the complex of related investment companies, which includes open-end and closed-end investment companies for which Management serves as investment manager, that are not directly attributable to a particular investment company in the complex (e.g., the Trust) or series thereof are allocated among the investment companies in the complex or series thereof, on the basis of relative net assets, except where a more appropriate allocation of expenses to each of the investment companies in the complex or series thereof can otherwise be made fairly. The Fund's expenses (other than those specific to each class) are allocated proportionally each day between the classes based upon the relative net assets of each class.
9 Investments in foreign securities: Investing in foreign securities may involve certain sovereign and other risks, in addition to the credit and market risks normally associated with domestic securities. These additional risks include the possibility of adverse political and economic developments (including political instability, nationalization, expropriation, or confiscatory taxation) and the potentially adverse effects of unavailability of public information regarding issuers, less governmental supervision and regulation of financial markets, reduced liquidity of certain financial markets, and the lack of uniform accounting, auditing, and financial reporting standards or the application of standards that are different or less stringent than those applied in the United States. Foreign securities also may experience greater price volatility, higher rates of inflation, and delays in settlement.
10 Indemnifications: Like many other companies, the Trust's organizational documents provide that its officers and trustees are indemnified against certain liabilities arising out of the performance of their duties to the Trust. In addition, both in some of its principal service contracts and in the normal course of its business, the Trust enters into contracts that provide indemnifications to other parties for certain types of losses or liabilities. The Trust's maximum exposure under these arrangements is unknown as this could involve future claims against the Trust.
11 Expense offset arrangement: The Fund has an expense offset arrangement in connection with its custodian contract. For the year ended December 31, 2012, the impact of this arrangement was a reduction of expenses of $35.
12 Other: All net investment income and realized and unrealized capital gains and losses of the Fund are allocated, on the basis of relative net assets, pro rata among its respective classes.
Note B—Management Fees, Administration Fees, Distribution Arrangements, and Other Transactions with Affiliates:
Fund shares are issued and redeemed in connection with investments in and payments under certain variable annuity contracts and variable life insurance policies issued through separate accounts of life insurance companies and are also offered directly to certain qualified pension and retirement plans.
16
The Fund retains Management as its investment manager under a Management Agreement. For such investment management services, the Fund pays Management a fee at the annual rate of 0.55% of the first $250 million of the Fund's average daily net assets, 0.525% of the next $250 million, 0.50% of the next $250 million, 0.475% of the next $250 million, 0.45% of the next $500 million, 0.425% of the next $2.5 billion, and 0.40% of average daily net assets in excess of $4 billion. Accordingly, for the year ended December 31, 2012, the management fee pursuant to the Management Agreement was equivalent to an annual effective rate of 0.55% of the Fund's average daily net assets.
The Fund retains Management as its administrator under an Administration Agreement. Each class pays Management an administration fee at the annual rate of 0.30% of its average daily net assets under this agreement. Additionally, Management retains State Street Bank and Trust Company ("State Street") as its sub-administrator under a Sub-Administration Agreement. Management pays State Street a fee for all services received under this agreement.
The Board adopted a non-fee distribution plan for the Fund's Class I.
For the Fund's Class S, Management acts as agent in arranging for the sale of class shares without commission and bears advertising and promotion expenses. The Board has adopted a distribution plan (the "Plan") with respect to this class, pursuant to Rule 12b-1 under the 1940 Act. The Plan provides that, as compensation for administrative and other services provided to this class, Management's activities and expenses related to the sale and distribution of this class of shares, and ongoing services provided to investors in this class, Management receives from this class a fee at the annual rate of 0.25% of Class S's average daily net assets. Management receives this amount to provide distribution and shareholder servicing for this class and pays a portion of it to institutions that provide such services. Those institutions may use the payments for, among other purposes, compensating employees engaged in sales and/or shareholder servicing. The amount of fees paid by this class during any year may be more or less than the cost of distribution and other services provided to this class. FINRA rules limit the amount of annual distribution fees that may be paid by a mutual fund and impose a ceiling on the cumulative distribution fees paid. The Trust's Plan complies with those rules.
Management has contractually undertaken to waive current payment of fees and/or reimburse the Fund's Class I and Class S shares for their operating expenses (exclusive of interest, taxes, brokerage commissions, extraordinary expenses, transaction costs and dividend expense on short sales, if any) ("Operating Expenses") which exceed the expense limitation as detailed in the following table:
| | | Expense Limitation(1) | | Expiration | | Reimbursement from Management for the Year Ended December 31, 2012 | |
| Class I | | | 1.30 | % | | 12/31/15 | | $ | — | | |
| Class S | | | 1.17 | % | | 12/31/15 | | | 80,791 | | |
(1) Expense limitation per annum of the respective class' average daily net assets.
Each respective class has agreed to repay Management through December 31, 2018 for fees and expenses waived and/or its excess Operating Expenses previously reimbursed by Management, so long as its annual Operating Expenses during that period do not exceed its expense limitation in place at the time the fees and expenses were waived or reimbursed, and the repayment is made within three years after the year in which Management issued the reimbursement or waived fees. During the year ended December 31, 2012, there was no repayment to Management under its contractual expense limitation. At December 31, 2012, the Fund's Class I shares had no contingent liability to Management under its contractual expense limitation. At December 31, 2012, the Fund's Class S shares contingent liabilities to Management under its contractual expense limitation were as follows:
| | | Expiring in: | | | |
| | | 2013 | | 2014 | | 2015 | | Total | |
| Class S | | $ | 99,087 | | | $ | 99,870 | | | $ | 80,791 | | | $ | 279,748 | | |
17
Neuberger Berman LLC ("Neuberger") is retained by Management to furnish it with investment recommendations and research information without added cost to the Fund. Several individuals who are officers and/or trustees of the Trust are also employees of Neuberger and/or Management.
Management and Neuberger are indirect subsidiaries of Neuberger Berman Group LLC (("NBG") and together with its consolidated subsidiaries ("NB Group")). NBSH Acquisition, LLC ("NBSH"), which is owned by portfolio managers, members of the NB Group management team and certain of NB Group's key employees and senior professionals, owns, as of September 30, 2012, approximately 57% of NBG's common units, and Lehman Brothers Holdings Inc. ("LBHI") and certain of its subsidiaries (collectively the "LBHI Parties") own the remaining 43% of such common units. Pursuant to agreements among NBG, NBSH and the LBHI Parties, NBG is entitled to acquire the remaining Class A common units through a process that is expected to end in 2017. In April 2012, NBG exercised its option (the "Redemption Agreement Option") to redeem during 2012 certain of its Class A common units held by the LBHI Parties equal to 10% of NBG's aggregate common units issued and outstanding as of March 16, 2012. The final payment for such Class A common units is due within thirty (30) days of December 31, 2012.
Note C—Securities Transactions:
During the year ended December 31, 2012, there were purchase and sale transactions (excluding short-term securities) of $75,079,824 and $57,387,253, respectively.
During the year ended December 31, 2012, no brokerage commissions on securities transactions were paid to affiliated brokers.
Note D—Fund Share Transactions:
Share activity for the years ended December 31, 2012 and December 31, 2011 was as follows:
For the Year Ended December 31, 2012
| | | Shares Sold | | Shares Issued on Reinvestment of Dividends and Distributions | | Shares Redeemed | | Total | |
| Class I | | | 2,911,190 | | | | 20,104 | | | | (1,123,918 | ) | | | 1,807,376 | | |
| Class S | | | 524,847 | | | | 4,397 | | | | (1,246,753 | ) | | | (717,509 | ) | |
For the Year Ended December 31, 2011
| | | Shares Sold | | Shares Issued on Reinvestment of Dividends and Distributions | | Shares Redeemed | | Total | |
| Class I | | | 3,225,244 | | | | 25,791 | | | | (1,301,064 | ) | | | 1,949,971 | | |
| Class S | | | 1,021,698 | | | | 13,820 | | | | (1,019,325 | ) | | | 16,193 | | |
Note E—Line of Credit:
At December 31, 2012, the Fund was a participant in a single committed, unsecured $200,000,000 line of credit with State Street, to be used only for temporary or emergency purposes. Other investment companies managed by Management also participate in this line of credit on the same terms. Interest is charged on borrowings under this line of credit at the higher of (a) the Federal Funds Rate plus 1.25% per annum or (b) the Overnight LIBOR Rate plus 1.25% per annum. A commitment fee of 0.10% per annum of the available line of credit is charged, of which
18
each participating Fund has agreed to pay its pro rata share, based on the ratio of its individual net assets to the net assets of all participants at the time the fee is due and payable. The fee is paid quarterly in arrears. Because several mutual funds participate, there is no assurance that an individual Fund will have access to all or any part of the $200,000,000 at any particular time. There were no loans outstanding pursuant to this line of credit at December 31, 2012. During the year ended December 31, 2012, the Fund did not utilize this line of credit.
Note F—Recent Accounting Pronouncement:
In December 2011, the Financial Accounting Standards Board issued Accounting Standards Update 2011-11 Disclosures about Offsetting Assets and Liabilities ("ASU 2011-11"). Effective for annual reporting periods beginning on or after January 1, 2013 and interim periods within those annual periods, ASU 2011-11 is intended to enhance disclosure requirements on the offsetting of financial assets and liabilities. At this time, Management is evaluating the implications of ASU 2011-11 and its impact on the financial statements.
19
Financial Highlights
Socially Responsive Portfolio
The following tables include selected data for a share outstanding throughout each year and other performance information derived from the Financial Statements. Per share amounts that round to less than $.01 or $(.01) per share are presented as $.00 or $(.00), respectively.
| Class I | |
| | | Year Ended December 31, | |
| | | 2012 | | 2011 | | 2010 | | 2009 | | 2008 | |
| Net Asset Value, Beginning of Year | | $ | 14.35 | | | $ | 14.86 | | | $ | 12.10 | | | $ | 9.39 | | | $ | 17.91 | | |
| Income From Investment Operations: | |
Net Investment Income (Loss)‡ | | | .15 | | | | .04 | | | | .06 | | | | .01 | | | | .11 | | |
Net Gains or Losses on Securities (both realized and unrealized) | | | 1.43 | | | | (.50 | ) | | | 2.70 | | | | 2.93 | | | | (7.13 | ) | |
| Total From Investment Operations | | | 1.58 | | | | (.46 | ) | | | 2.76 | | | | 2.94 | | | | (7.02 | ) | |
| Less Distributions From: | |
| Net Investment Income | | | (.04 | ) | | | (.05 | ) | | | (.00 | ) | | | (.23 | ) | | | (.34 | ) | |
| Net Capital Gains | | | — | | | | — | | | | — | | | | — | | | | (1.16 | ) | |
| Total Distributions | | | (.04 | ) | | | (.05 | ) | | | (.00 | ) | | | (.23 | ) | | | (1.50 | ) | |
| Net Asset Value, End of Year | | $ | 15.89 | | | $ | 14.35 | | | $ | 14.86 | | | $ | 12.10 | | | $ | 9.39 | | |
Total Return†† | | | 10.98 | % | | | (3.08 | )% | | | 22.85 | % | | | 31.43 | % | | | (39.44 | )% | |
| Ratios/Supplemental Data | |
| Net Assets, End of Year (in millions) | | $ | 148.7 | | | $ | 108.4 | | | $ | 83.2 | | | $ | 64.5 | | | $ | 51.6 | | |
Ratio of Gross Expenses to Average Net Assets# | | | 1.03 | % | | | 1.06 | % | | | 1.08 | % | | | 1.15 | % | | | .92 | % | |
Ratio of Net Expenses to Average Net Assets§ | | | 1.03 | % | | | 1.06 | % | | | 1.08 | % | | | 1.15 | % | | | .92 | % | |
Ratio of Net Investment Income (Loss) to Average Net Assets | | | .98 | % | | | .29 | % | | | .48 | % | | | .06 | % | | | .70 | % | |
| Portfolio Turnover Rate | | | 30 | % | | | 20 | % | | | 41 | % | | | 34 | % | | | 41 | % | |
See Notes to Financial Highlights
20
Financial Highlights (cont'd)
| Class S | |
| | | Year Ended December 31, | |
| | | 2012 | | 2011 | | 2010 | | 2009 | | 2008 | |
| Net Asset Value, Beginning of Year | | $ | 14.39 | | | $ | 14.90 | | | $ | 12.14 | | | $ | 9.41 | | | $ | 17.86 | | |
| Income From Investment Operations: | |
Net Investment Income (Loss)‡ | | | .13 | | | | .03 | | | | .05 | | | | .00 | | | | .06 | | |
Net Gains or Losses on Securities (both realized and unrealized) | | | 1.42 | | | | (.50 | ) | | | 2.71 | | | | 2.94 | | | | (7.06 | ) | |
| Total From Investment Operations | | | 1.55 | | | | (.47 | ) | | | 2.76 | | | | 2.94 | | | | (7.00 | ) | |
| Less Distributions From: | |
| Net Investment Income | | | (.02 | ) | | | (.04 | ) | | | (.00 | ) | | | (.21 | ) | | | (.29 | ) | |
| Net Capital Gains | | | — | | | | — | | | | — | | | | — | | | | (1.16 | ) | |
| Total Distributions | | | (.02 | ) | | | (.04 | ) | | | (.00 | ) | | | (.21 | ) | | | (1.45 | ) | |
| Net Asset Value, End of Year | | $ | 15.92 | | | $ | 14.39 | | | $ | 14.90 | | | $ | 12.14 | | | $ | 9.41 | | |
Total Return†† | | | 10.74 | % | | | (3.15 | )% | | | 22.76 | % | | | 31.31 | % | | | (39.43 | )% | |
| Ratios/Supplemental Data | |
| Net Assets, End of Year (in millions) | | $ | 66.7 | | | $ | 70.6 | | | $ | 72.9 | | | $ | 58.2 | | | $ | 50.1 | | |
Ratio of Gross Expenses to Average Net Assets# | | | 1.28 | % | | | 1.31 | % | | | 1.33 | % | | | 1.40 | % | | | 1.26 | % | |
Ratio of Net Expenses to Average Net Assets§ | | | 1.17 | % | | | 1.17 | % | | | 1.17 | % | | | 1.18 | % | | | 1.17 | % | |
Ratio of Net Investment Income (Loss) to Average Net Assets | | | .82 | % | | | .20 | % | | | .39 | % | | | .05 | % | | | .40 | % | |
| Portfolio Turnover Rate | | | 30 | % | | | 20 | % | | | 41 | % | | | 34 | % | | | 41 | % | |
See Notes to Financial Highlights
21
Notes to Financial Highlights Socially Responsive Portfolio
†† Total return based on per share NAV reflects the effects of changes in NAV on the performance of the Fund during each fiscal period and assumes income dividends and other distributions, if any, were reinvested. Results represent past performance and do not indicate future results. Current returns may be lower or higher than the performance data quoted. Investment returns and principal may fluctuate and shares when redeemed may be worth more or less than original cost. Total return would have been lower if Management had not reimbursed certain expenses. The total return information shown does not reflect charges and other expenses that apply to the separate account or the related insurance policies, and the inclusion of these charges and other expenses would reduce the total return for all fiscal periods shown. The class actions proceeds listed in Note A-4 had no impact on total return.
# Represents the annualized ratios of net expenses to average daily net assets if Management had not reimbursed certain expenses.
‡ Calculated based on the average number of shares outstanding during each fiscal period.
§ After reimbursement of expenses by Management. The Fund is required to calculate an expense ratio without taking into consideration any expense reductions related to expense offset arrangements. Had the Fund not received expense reductions related to expense offset arrangements, the annualized ratios of net expenses to average daily net assets would have been:
| | | Year Ended December 31, | |
| | | 2012 | | 2011 | | 2010 | | 2009 | | 2008 | |
| Socially Responsive Portfolio Class I | | | 1.03 | % | | | 1.06 | % | | | 1.08 | % | | | 1.15 | % | | | .92 | % | |
| Socially Responsive Portfolio Class S | | | 1.17 | % | | | 1.17 | % | | | 1.17 | % | | | 1.18 | % | | | 1.17 | % | |
22
Report of Independent Registered Public Accounting Firm
To the Board of Trustees of
Neuberger Berman Advisers Management Trust and
Shareholders of Socially Responsive Portfolio
We have audited the accompanying statement of assets and liabilities of Socially Responsive Portfolio, one of the series constituting Neuberger Berman Advisers Management Trust (the "Trust"), including the schedule of investments, as of December 31, 2012, and the related statement of operations for the year then ended, the statements of changes in net assets for each of the two years in the period then ended, and the financial highlights for each of the five years in the period then ended. These financial statements and financial highlights are the responsibility of the Trust's management. Our responsibility is to express an opinion on these financial statements and financial highlights based on our audits.
We conducted our audits in accordance with the standards of the Public Company Accounting Oversight Board (United States). Those standards require that we plan and perform the audit to obtain reasonable assurance about whether the financial statements and financial highlights are free of material misstatement. We were not engaged to perform an audit of the Trust's internal control over financial reporting. Our audits included consideration of internal control over financial reporting as a basis for designing audit procedures that are appropriate in the circumstances, but not for the purpose of expressing an opinion on the effectiveness of the Trust's internal control over financial reporting. Accordingly, we express no such opinion. An audit also includes examining, on a test basis, evidence supporting the amounts and disclosures in the financial statements and financial highlights, assessing the accounting principles used and significant estimates made by management, and evaluating the overall financial statement presentation. Our procedures included confirmation of securities owned as of December 31, 2012 by correspondence with the custodian. We believe that our audits provide a reasonable basis for our opinion.
In our opinion, the financial statements and financial highlights referred to above present fairly, in all material respects, the financial position of Socially Responsive Portfolio, a series of Neuberger Berman Advisers Management Trust, at December 31, 2012, the results of its operations for the year then ended, the changes in its net assets for each of the two years in the period then ended, and the financial highlights for each of the five years in the period then ended, in conformity with U.S. generally accepted accounting principles.
Boston, Massachusetts
February 7, 2013
23
Trustee and Officer Information
The following tables set forth information concerning the trustees ("Trustees") and officers ("Officers") of the Trust. All persons named as Trustees and Officers also serve in similar capacities for other funds administered or managed by Management, Neuberger and Neuberger Berman Fixed Income LLC ("NBFI"). The Statement of Additional Information includes additional information about Trustees and is available upon request, without charge, by calling (800) 877-9700.
Information about the Board of Trustees
Name, (Year of Birth), and Address(1) | | Position(s) and Length of Time Served(2) | | Principal Occupation(s)(3) | | Number of Funds in Fund Complex Overseen by Fund Trustee | | Other Directorships Held Outside Fund Complex by Fund Trustee(3) | |
| Independent Fund Trustees | |
| Faith Colish (1935) | | Trustee since 1982 | | Counsel, Carter Ledyard & Milburn LLP (law firm) since October 2002; formerly, Attorney-at-Law and President, Faith Colish, A Professional Corporation, 1980 to 2002. | | | 50 | | | Formerly, Director, 1997 to 2003, and Advisory Director, 2003 to 2006, ABA Retirement Funds (formerly, American Bar Retirement Association) (not-for-profit membership corporation). | |
| Martha C. Goss (1949) | | Trustee since 2007 | | President, Woodhill Enterprises Inc./Chase Hollow Associates LLC (personal investment vehicle), since 2006; Chief Operating and Financial Officer, Hopewell Holdings LLC/ Amwell Holdings, LLC (a holding company for investments in the healthcare sector), since 2003; formerly, Consultant, Resources Connection (temporary staffing), 2002 to 2006. | | | 50 | | | Director, American Water (water utility), since 2003; Director, Channel Reinsurance (financial guaranty reinsurance), 2006 to 2010; Director, Allianz Life of New York (insurance), since 2005; Director, Financial Women's Association of New York (not-for-profit association), since 2003; Trustee Emerita, Brown University, since 1998; formerly, Director, Ocwen Financial Corporation (mortgage servicing), 2005 to 2010; formerly, Advisory Board Member, Attensity (software developer), 2005 to 2007; formerly, Director, Bank Leumi (commercial bank), 2005 to 2007; formerly, Director, Claire's Stores, Inc. (retailer), 2005 to 2007. | |
24
Name, (Year of Birth), and Address(1) | | Position(s) and Length of Time Served(2) | | Principal Occupation(s)(3) | | Number of Funds in Fund Complex Overseen by Fund Trustee | | Other Directorships Held Outside Fund Complex by Fund Trustee(3) | |
| Michael M. Knetter (1960) | | Trustee since 2007 | | President and Chief Executive Officer, University of Wisconsin Foundation, since October 2010; formerly, Dean, School of Business, University of Wisconsin - Madison; formerly, Professor of International Economics and Associate Dean, Amos Tuck School of Business - Dartmouth College, 1998 to 2002. | | | 50 | | | Director, American Family Insurance (a mutual company, not publicly traded), since March 2009; formerly, Trustee, Northwestern Mutual Series Fund, Inc., 2007 to 2010; formerly, Director, Wausau Paper, 2005 to 2011; formerly, Director, Great Wolf Resorts, 2004 to 2009. | |
| Howard A. Mileaf (1937) | | Trustee since 1999 | | Retired; formerly, Vice President and General Counsel, WHX Corporation (holding company), 1993 to 2001. | | | 50 | | | Formerly, Director, Webfinancial Corporation (holding company), 2002 to 2008; formerly, Director, WHX Corporation (holding company), 2002 to 2005; formerly, Director, State Theatre of New Jersey (not-for-profit theatre), 2000 to 2005. | |
| George W. Morriss (1947) | | Trustee since 2007 | | Adjunct Faculty Member, Columbia University School of International Policy and Administration, since October 2012; formerly, Executive Vice President and Chief Financial Officer, People's Bank, Connecticut (a financial services company), 1991 to 2001. | | | 50 | | | Formerly, Manager, Larch Lane Multi-Strategy Fund complex (which consisted of three funds), 2006 to 2011; formerly, Member, NASDAQ Issuers' Affairs Committee, 1995 to 2003. | |
25
Name, (Year of Birth), and Address(1) | | Position(s) and Length of Time Served(2) | | Principal Occupation(s)(3) | | Number of Funds in Fund Complex Overseen by Fund Trustee | | Other Directorships Held Outside Fund Complex by Fund Trustee(3) | |
| Jack L. Rivkin (1940) | | Trustee since 2002; President 2002 to 2008 | | Formerly, Executive Vice President and Chief Investment Officer, Neuberger Berman Holdings LLC (holding company), 2002 to August 2008 and 2003 to August 2008, respectively; formerly, Managing Director and Chief Investment Officer, Neuberger, December 2005 to August 2008 and 2003 to August 2008, respectively; formerly, Executive Vice President, Neuberger, December 2002 to 2005; formerly, Director and Chairman, Management, December 2002 to August 2008; formerly, Executive Vice President, Citigroup Investments, Inc., September 1995 to February 2002; formerly, Executive Vice President, Citigroup Inc., September 1995 to February 2002. | | | 50 | | | Director, Idealab (private company), since 2009; Director, Distributed World Power (private company), since 2009; Director, Dale Carnegie and Associates, Inc. (private company), since 1999; Director, Solbright, Inc. (private company), since 1998; Director, SA Agricultural Fund, since 2009; Chairman and Director, Essential Brands (consumer products) since 2008; formerly, Director, New York Society of Security Analysts, 2006 to 2008. | |
| Tom D. Seip (1950) | | Trustee since 2000; Chairman of the Board since 2008; Lead Independent Trustee 2006 to 2008 | | General Partner, Ridgefield Farm LLC (a private investment vehicle); formerly, President and CEO, Westaff, Inc. (temporary staffing), May 2001 to January 2002; formerly, Senior Executive, The Charles Schwab Corporation, 1983 to 1998, including Chief Executive Officer, Charles Schwab Investment Management, Inc.; Trustee, Schwab Family of Funds and Schwab Investments, 1997 to 1998; and Executive Vice President - Retail Brokerage, Charles Schwab & Co., Inc., 1994 to 1997. | | | 50 | | | Director, H&R Block, Inc. (financial services company), since May 2001; Chairman, Governance and Nominating Committee, H&R Block, Inc., since 2011; formerly, Chairman, Compensation Committee, H&R Block, Inc., 2006 to 2010; formerly, Director, Forward Management, Inc. (asset management company), 1999 to 2006. | |
26
Name, (Year of Birth), and Address(1) | | Position(s) and Length of Time Served(2) | | Principal Occupation(s)(3) | | Number of Funds in Fund Complex Overseen by Fund Trustee | | Other Directorships Held Outside Fund Complex by Fund Trustee(3) | |
| Candace L. Straight (1947) | | Trustee since 1999 | | Private investor and consultant specializing in the insurance industry; formerly, Advisory Director, Securitas Capital LLC (a global private equity investment firm dedicated to making investments in the insurance sector), 1998 to December 2003. | | | 50 | | | Public Member, Board of Governors and Board of Trustees, Rutgers University, since 2011; Director, Montpelier Re Holdings Ltd. (reinsurance company), since 2006; formerly, Director, National Atlantic Holdings Corporation (property and casualty insurance company), 2004 to 2008; formerly, Director, The Proformance Insurance Company (property and casualty insurance company), 2004 to 2008; formerly, Director, Providence Washington Insurance Company (property and casualty insurance company), 1998 to 2006; formerly, Director, Summit Global Partners (insurance brokerage firm), 2000 to 2005. | |
| Peter P. Trapp (1944) | | Trustee since 1984 | | Retired; formerly, Regional Manager for Mid-Southern Region, Ford Motor Credit Company, September 1997 to 2007; formerly, President, Ford Life Insurance Company, April 1995 to August 1997. | | | 50 | | | None. | |
27
Name, (Year of Birth), and Address(1) | | Position(s) and Length of Time Served(2) | | Principal Occupation(s)(3) | | Number of Funds in Fund Complex Overseen by Fund Trustee | | Other Directorships Held Outside Fund Complex by Fund Trustee(3) | |
| Fund Trustees who are "Interested Persons" | |
| Joseph V. Amato* (1962) | | Trustee since 2009 | | President and Director, Neuberger Berman Group LLC, since 2009; President and Chief Executive Officer, Neuberger and Neuberger Berman Holdings LLC (including its predecessor, Neuberger Berman Inc.), since 2007; Chief Investment Officer, Neuberger, since 2009; Chief Investment Officer (Equities) and Managing Director, Management, since 2009; Managing Director, NBFI, since 2007; Board member of NBFI since 2006; formerly, Global Head of Asset Management of Lehman Brothers Holdings Inc.'s ("LBHI") Investment Management Division, 2006 to 2009; formerly, member of LBHI's Investment Management Division's Executive Management Committee, 2006 to 2009; formerly, Managing Director, Lehman Brothers Inc. ("LBI"), 2006 to 2008; formerly, Chief Recruiting and Development Officer, LBI, 2005 to 2006; formerly, Global Head of LBI's Equity Sales and a Member of its Equities Division Executive Committee, 2003 to 2005. | | | 50 | | | Member of Board of Advisors, McDonough School of Business, Georgetown University, since 2001; Member of New York City Board of Advisors, Teach for America, since 2005; Trustee, Montclair Kimberley Academy (private school), since 2007. | |
28
Name, (Year of Birth), and Address(1) | | Position(s) and Length of Time Served(2) | | Principal Occupation(s)(3) | | Number of Funds in Fund Complex Overseen by Fund Trustee | | Other Directorships Held Outside Fund Complex by Fund Trustee(3) | |
| Robert Conti* (1956) | | Chief Executive Officer, President and Trustee since 2008; prior thereto, Executive Vice President in 2008 and Vice President 2000 to 2008 | | Managing Director, Neuberger, since 2007; formerly, Senior Vice President, Neuberger, 2003 to 2006; formerly, Vice President, Neuberger, 1999 to 2003; President and Chief Executive Officer, Management, since 2008; formerly, Senior Vice President, Management, 2000 to 2008; Managing Director, NBFI, since 2009. | | | 50 | | | Director, Staten Island Mental Health Society, since 1994; formerly, Chairman of the Board, Staten Island Mental Health Society, 2008 to 2011. | |
(1) The business address of each listed person is 605 Third Avenue, New York, New York 10158.
(2) Pursuant to the Trust's Trust Instrument, each of these Fund Trustees shall hold office for life or until his or her successor is elected or the Trust terminates; except that (a) any Fund Trustee may resign by delivering a written resignation; (b) any Fund Trustee may be removed with or without cause at any time by a written instrument signed by at least two-thirds of the other Fund Trustees; (c) any Fund Trustee who requests to be retired, or who has become unable to serve, may be retired by a written instrument signed by a majority of the other Fund Trustees; and (d) any Fund Trustee may be removed at any shareholder meeting by a vote of at least two-thirds of the outstanding shares.
(3) Except as otherwise indicated, each individual has held the positions shown for at least the last five years.
* Indicates a Fund Trustee who is an "interested person" within the meaning of the 1940 Act. Mr. Amato and Mr. Conti are interested persons of the Trust by virtue of the fact that each is an officer of Management, Neuberger and/or their affiliates.
29
Information about the Officers of the Trust
Name, (Year of Birth), and Address(1) | | Position(s) and Length of Time Served(2) | | Principal Occupation(s)(3) | |
| Andrew B. Allard (1961) | | Chief Legal Officer since 2013 (only for purposes of sections 307 and 406 of the Sarbanes-Oxley Act of 2002) and Anti-Money Laundering Compliance Officer since 2002 | | Senior Vice President, Neuberger, since 2006 and Employee since 1999; Deputy General Counsel, Neuberger, since 2004; formerly, Vice President, Neuberger, 2000 to 2005; formerly, Employee, Management, 1994 to 1999; Chief Legal Officer since 2013 (only for purposes of sections 307 and 406 of the Sarbanes-Oxley Act of 2002) and Anti-Money Laundering Compliance Officer since 2002, nine registered investment companies for which Management acts as investment manager and administrator (six since 2002, one since 2003, one since 2005 and one since 2006). | |
| Claudia A. Brandon (1956) | | Executive Vice President since 2008 and Secretary since 1985 | | Senior Vice President, Neuberger, since 2007 and Employee since 1999; Senior Vice President, Management, since 2008 and Assistant Secretary since 2004; formerly, Vice President, Neuberger, 2002 to 2006; formerly, Vice President-Mutual Fund Board Relations, Management, 2000 to 2008; formerly, Vice President, Management, 1986 to 1999 and Employee 1984 to 1999; Executive Vice President, nine registered investment companies for which Management acts as investment manager and administrator (nine since 2008); Secretary, nine registered investment companies for which Management acts as investment manager and administrator (three since 1985, three since 2002, one since 2003, one since 2005 and one since 2006). | |
| Anthony DiBernardo (1979) | | Assistant Treasurer since 2011 | | Vice President, Neuberger, since 2009; Employee, Management, since 2003; Assistant Treasurer, nine registered investment companies for which Management acts as investment manager and administrator (nine since 2011). | |
| Sheila R. James (1965) | | Assistant Secretary since 2002 | | Vice President, Neuberger, since 2008 and Employee since 1999; formerly, Assistant Vice President, Neuberger, 2007; formerly, Employee, Management, 1991 to 1999; Assistant Secretary, nine registered investment companies for which Management acts as investment manager and administrator (six since 2002, one since 2003, one since 2005 and one since 2006). | |
| Brian Kerrane (1969) | | Vice President since 2008 | | Senior Vice President, Neuberger, since 2006; formerly, Vice President, Neuberger, 2002 to 2006; Vice President, Management, since 2008 and Employee since 1991; Vice President, nine registered investment companies for which Management acts as investment manager and administrator (nine since 2008). | |
30
Name, (Year of Birth), and Address(1) | | Position(s) and Length of Time Served(2) | | Principal Occupation(s)(3) | |
| Kevin Lyons (1955) | | Assistant Secretary since 2003 | | Assistant Vice President, Neuberger, since 2008 and Employee since 1999; formerly, Employee, Management, 1993 to 1999; Assistant Secretary, nine registered investment companies for which Management acts as investment manager and administrator (seven since 2003, one since 2005 and one since 2006). | |
| Owen F. McEntee, Jr. (1961) | | Vice President since 2008 | | Vice President, Neuberger, since 2006; Employee, Management, since 1992; Vice President, nine registered investment companies for which Management acts as investment manager and administrator (nine since 2008). | |
| John M. McGovern (1970) | | Treasurer and Principal Financial and Accounting Officer since 2005 | | Senior Vice President, Neuberger, since 2007; formerly, Vice President, Neuberger, 2004 to 2006; Employee, Management, since 1993; Treasurer and Principal Financial and Accounting Officer, nine registered investment companies for which Management acts as investment manager and administrator (eight since 2005 and one since 2006); formerly, Assistant Treasurer, eight registered investment companies for which Management acts as investment manager and administrator, 2002 to 2005. | |
| Frank Rosato (1971) | | Assistant Treasurer since 2005 | | Vice President, Neuberger, since 2006; Employee, Management, since 1995; Assistant Treasurer, nine registered investment companies for which Management acts as investment manager and administrator (eight since 2005 and one since 2006). | |
| Neil S. Siegel (1967) | | Vice President since 2008 | | Managing Director, Management, since 2008; Managing Director, Neuberger, since 2006; formerly, Senior Vice President, Neuberger, 2004 to 2006; Vice President, nine registered investment companies for which Management acts as investment manager and administrator (nine since 2008). | |
| Chamaine Williams (1971) | | Chief Compliance Officer since 2005 | | Senior Vice President, Neuberger, since 2007; Chief Compliance Officer, Management, since 2006; Chief Compliance Officer, nine registered investment companies for which Management acts as investment manager and administrator (eight since 2005 and one since 2006); formerly, Senior Vice President, LBI, 2007 to 2008; formerly, Vice President, LBI, 2003 to 2006; formerly, Chief Compliance Officer, Lehman Brothers Asset Management Inc., 2003 to 2007; formerly, Chief Compliance Officer, Lehman Brothers Alternative Investment Management LLC, 2003 to 2007. | |
(1) The business address of each listed person is 605 Third Avenue, New York, New York 10158.
(2) Pursuant to the By-Laws of the Trust, each officer elected by the Fund Trustees shall hold office until his or her successor shall have been elected and qualified or until his or her earlier death, inability to serve, or resignation. Officers serve at the pleasure of the Fund Trustees and may be removed at any time with or without cause.
(3) Except as otherwise indicated, each individual has held the positions shown for at least the last five years.
31
Proxy Voting Policies and Procedures
A description of the policies and procedures that the Trust uses to determine how to vote proxies relating to portfolio securities is available, without charge, by calling 1-800-877-9700 (toll-free) and on the website of the Securities and Exchange Commission, at www.sec.gov. Information regarding how the Trust voted proxies relating to portfolio securities during the most recent 12-month period ended June 30 is also available, without charge, by calling 1-800-877-9700 (toll-free), on the website of the Securities and Exchange Commission at www.sec.gov, and on Management's website at www.nb.com.
Quarterly Portfolio Schedule
The Trust files a complete schedule of portfolio holdings for the Fund with the Securities and Exchange Commission for the first and third quarters of each fiscal year on Form N-Q. The Trust's Forms N-Q are available on the Securities and Exchange Commission's website at www.sec.gov and may be reviewed and copied at the Securities and Exchange Commission's Public Reference Room in Washington, DC. Information on the operation of the Public Reference Room may be obtained by calling 1-800-SEC-0330. The information on Form N-Q is available upon request, without charge, by calling 1-800-877-9700 (toll free).
Notice to Shareholders
100.00% of the dividends earned during the fiscal year ended December 31, 2012 qualifies for the dividends received deduction for corporate shareholders.
Board Consideration of the Management and Sub-Advisory Agreements
At a meeting held on October 25, 2012, the Board of Trustees of Neuberger Berman Advisers Management Trust ("Board"), including the Trustees who are not "interested persons" of Neuberger Berman Management LLC ("Management") (including its affiliates) or Neuberger Berman Advisers Management Trust ("Independent Fund Trustees"), approved the continuance of the Management and Sub-Advisory Agreements ("Agreements") for Socially Responsive Portfolio ("Fund").
In evaluating the Agreements, the Board, including the Independent Fund Trustees, reviewed materials furnished by Management in response to questions submitted by counsel for the Independent Fund Trustees, and met with senior representatives of Management regarding Neuberger Berman's personnel, operations and financial conditions as they relate to the Fund. The Independent Fund Trustees were advised by counsel that is experienced in Investment Company Act of 1940 matters and that is independent of Management. The Independent Fund Trustees received a memorandum from independent counsel discussing the legal standards for their consideration of the proposed continuance of the Agreements. They met with such counsel separately from representatives of Management to discuss the annual contract review. The annual contract review extends over three regular meetings of the Board, including one meeting devoted primarily to reviewing and discussing Fund performance, to ensure that Management has time to respond to any questions the Independent Fund Trustees may have on their initial review of the report and that the Independent Fund Trustees have time to consider those responses.
The Board considered the following factors, among others, in connection with its approval of the continuance of the Agreements: (1) the nature, extent, and quality of the services provided by Management and Neuberger Berman LLC ("Neuberger"); (2) the performance of the Fund compared to a relevant market index and a peer group of investment companies; (3) the costs of the services provided and profits or losses realized by Management and its affiliates from their relationship with the Fund; (4) the extent to which economies of scale might be realized as the Fund grows; and (5) whether fee levels reflect any such potential economies of scale for the benefit of investors in the Fund. In their deliberations, the Board members did not identify any particular information that was all-important or controlling, and each Trustee may have attributed different weights to the various factors.
32
The Board evaluated the terms of the Agreements, the overall fairness of the Agreements to the Fund and whether the Agreements were in the best interests of the Fund and its shareholders.
With respect to the nature, extent and quality of the services provided, the Board considered the performance of the Fund and the experience and staffing of the portfolio management personnel of Management and Neuberger who perform services for the Fund. The Board noted that Management also provides certain administrative services, including fund accounting and compliance oversight. The Board also considered Management's and Neuberger's policies and practices regarding brokerage and allocation of portfolio transactions by Management. The Board's Portfolio Transactions and Pricing Committee from time to time reviewed the quality of the execution services that Management and Neuberger had provided, and periodically reviewed studies by an independent firm engaged to review and evaluate the quality of brokerage execution received by the Fund. The Board also reviewed whether Management and Neuberger used brokers to execute Fund transactions that provide research and other services to Management and Neuberger, and the types of benefits potentially derived from such services by Management, Neuberger, the Fund and other clients of Management and Neuberger. In addition, the Board noted the positive compliance history of Management and Neuberger, as each firm has been free of significant reported compliance problems. As in past years, the Board also considered the manner in which Management addressed various non-routine matters that arose during the year, some of them a result of developments in the broader fund industry or the regulations governing it.
The Board considered the performance of the Fund relative to its benchmark and the average performance of composite peer groups of investment companies dedicated to insurance products pursuing broadly similar strategies. The Board also reviewed performance during the period in relation to certain measures of the degree of investment risk undertaken by the portfolio managers. The Board discussed with Management the Fund's performance and steps that Management had under consideration to improve performance. The Board also considered Management's resources and responsiveness with respect to the Fund.
With respect to the overall fairness of the Agreements, the Board considered the fee structure for the Fund under the Agreements as compared to a peer group of comparable funds and any fall-out benefits likely to accrue to Management or Neuberger or their affiliates from their relationship with the Fund. The Board also considered the profitability of Management and its affiliates from their association with the Fund.
The Board reviewed a comparison of the Fund's management fee and overall expense ratio to a peer group of broadly comparable non-proprietary funds dedicated to insurance products. The Board considered the mean and median of the management fees and expense ratios of the peer group. The Board noted that the Fund's management fee was higher than the peer group mean and median. The Board considered whether specific portfolio management or administration needs contributed to the management fee. The Board also considered the contractual limit on Fund expenses undertaken by Management. With regard to the sub-advisory fee paid to Neuberger, the Board noted that this fee is "at cost."
The Board considered whether there were other funds that were advised or sub-advised by Management or its affiliates or separate accounts managed by Management or its affiliates with investment objectives, policies and strategies that were similar to the Fund. If so, the Board compared the fees charged to the Fund to the fees charged to any such other funds and/or separate accounts. The Board considered the appropriateness and reasonableness of any differences between the fees charged to the Fund and any such other funds and/or separate accounts and determined that the differences in fees were consistent with the management and other services provided.
The Board also evaluated any apparent or anticipated economies of scale in relation to the services Management provides to the Fund. The Board considered whether the Fund's fee structure provides for a reduction of payments resulting from the use of breakpoints and whether those breakpoints are set at appropriate asset levels. In concluding that the benefits accruing to Management and its affiliates by virtue of their relationship to the Fund were reasonable in comparison with the costs of providing the investment advisory and other services and the benefits accruing to the Fund, the Board reviewed specific data as to Management's profit on the Fund for a recent period. The Board also carefully examined Management's cost allocation methodology. The Board recognized that Management should be entitled to earn a reasonable level of profits for services it provides to the Fund and, based on its review, concluded that Management's level of profitability was not excessive.
33
Conclusions
In approving the Agreements, the Board concluded that the terms of each Agreement are fair and reasonable and that approval of the Agreements is in the best interests of the Fund and its shareholders. In reaching this determination, the Board considered that Management and Neuberger could be expected to provide a high level of service to the Fund; that it retained confidence in Management's and Neuberger's capabilities to manage the Fund; that the Fund's fee structure appeared to the Board to be reasonable given the nature and quality of services provided; and that the benefits accruing to Management and its affiliates by virtue of their relationship to the Fund were reasonable in comparison with the benefits accruing to the Fund.
34
ITEM 2. CODE OF ETHICS
The Registrant’s Board of Trustees (“Board”) adopted a code of ethics that applies to the Registrant's principal executive officer, principal financial officer, principal accounting officer or controller, or persons performing similar functions (“Code of Ethics”). For the period covered by this Form N-CSR, there were no amendments to the Code of Ethics and there were no waivers from the Code of Ethics granted to the Registrant's principal executive officer, principal financial officer, principal accounting officer or controller, or persons performing similar functions.
A copy of the Code of Ethics was included as an exhibit to Registrant's Form N-CSR filed on February 28, 2007. The Code of Ethics is also available, without charge, by calling 1-800-877-9700 (toll-free).
ITEM 3. AUDIT COMMITTEE FINANCIAL EXPERT
The Board has determined that the Registrant has two audit committee financial experts serving on its audit committee. The Registrant's audit committee financial experts are Martha C. Goss and George W. Morriss. Ms. Goss and Mr. Morriss are independent trustees as defined by Form N-CSR.
ITEM 4. PRINCIPAL ACCOUNTANT FEES AND SERVICES
The financial information provided below is that of the Registrant. This Form N-CSR relates only to the Balanced, Small Cap Growth, Growth, Guardian, International, Short Duration Bond, Mid Cap Growth, Large Cap Value, Mid Cap Intrinsic Value and Socially Responsive Portfolios (collectively, the “Funds”). Ernst & Young, LLP (“E&Y”) serves as the principal accountant for the Funds.
| (a)-(d) | Aggregate fees billed to the Registrant for the last two fiscal years for professional services rendered by E&Y for the Funds are listed below. |
| | 2012 | 2011 |
| Audit Fees | $373,600 | $347,600 |
| Audit-Related Fees | 0 | 0 |
| Tax Fees | 81,850 | 75,850 |
| All Other Fees | 0 | 0 |
Audit Fees include amounts related to the audit of the Registrant's annual financial statements and services normally provided by the principal accountant in connection with statutory and regulatory filings. Audit-Related Fees include amounts for attest services not required by statute or regulation. Tax Fees include amounts related to tax compliance, tax planning, and tax advice. All Other Fees include amounts for products and services not reported in Audit Fees, Audit-Related Fees and Tax Fees.
| (e) | (1) | The Audit Committee’s pre-approval policies and procedures for the Registrant to engage an accountant to render audit and non-audit services delegate to each member of the Audit Committee the power to pre-approve services between meetings of the Audit Committee. |
| | | |
| | (2) | No services included in (b) - (d) above were approved pursuant to paragraph (c)(7)(i)(C) of Rule 2-01 of Regulation S-X. |
| | | |
| (f) | | Not applicable. |
| | | |
| (g) | | The aggregate fees billed for the most recent fiscal year and the preceding fiscal year by E&Y for non-audit services rendered to the Registrant, its investment adviser, and any affiliates of its investment adviser that provide ongoing services to the Registrant were $81,850 and $75,850, respectively. |
| | | |
| (h) | | All non-audit services rendered in (g) above were pre-approved by the Registrant's audit committee pursuant to paragraph (c)(7)(ii) of Rule 2-01 of Regulation S-X. Accordingly, these services were considered by the Registrant’s Audit Committee and found to be compatible with maintaining the principal accountant's independence. |
ITEM 5. AUDIT COMMITTEE OF LISTED REGISTRANTS
Not applicable to the Registrant.
ITEM 6. SCHEDULE OF INVESTMENTS.
The complete schedule of investments for each series is disclosed in the Registrant's annual reports to shareholders, which are included as Item 1 of this Form N-CSR.
| ITEM 7. | DISCLOSURE OF PROXY VOTING POLICIES AND PROCEDURES FOR CLOSED-END MANAGEMENT INVESTMENT COMPANIES. |
Not applicable to the Registrant.
ITEM 8. | PORTFOLIO MANAGERS OF CLOSED-END MANAGEMENT INVESTMENT COMPANIES. |
Not applicable to the Registrant.
ITEM 9. | PURCHASES OF EQUITY SECURITIES BY CLOSED-END MANAGEMENT INVESTMENT COMPANY AND AFFILIATED PURCHASERS. |
Not applicable to Registrant.
ITEM 10. SUBMISSION OF MATTERS TO A VOTE OF SECURITY HOLDERS.
There were no material changes to the procedures by which shareholders may recommend nominees to the Board.
ITEM 11. CONTROLS AND PROCEDURES
| (a) | Based on an evaluation of the disclosure controls and procedures (as defined in Rule 30a-2(c) under the Act) as of a date within 90 days of the filing date of this report, the Chief Executive Officer and Treasurer of the Registrant have concluded that such disclosure controls and procedures are effectively designed to ensure that information required to be disclosed by the Registrant is accumulated and communicated to the Registrant’s management to allow timely decisions regarding required disclosure. |
| | |
| (b) | There were no significant changes in the Registrant’s internal controls over financial reporting (as defined in Rule 30a-3(d) under the Act) that occurred during the Registrant’s second fiscal quarter of the period covered by this report that have materially affected, or are reasonably likely to materially affect, the Registrant’s internal control over financial reporting. |
| | |
ITEM 12. EXHIBITS
| (a) | (1) | A copy of the Code of Ethics was included as an exhibit to Registrant's Form N-CSR filed on February 28, 2007 (Investment Company Act file number 811-4255) and is incorporated herein by reference. |
| | | |
| | (2) | The certifications required by Rule 30a-2(a) under the Act, are attached hereto. |
| | | |
| | (3) | Not applicable to the Registrant. |
| | | |
| (b) | | The certification required by Rule 30a-2(b) under the Act, Rule 13a-14(b) or Rule 15d-14(b) under the Securities Exchange Act of 1934 (“Exchange Act”), and Section 1350 of Chapter 63 of Title 18 of the United States Code are attached hereto. |
| | | |
SIGNATURES
Pursuant to the requirements of the Securities Exchange Act of 1934 and the Investment Company Act of 1940, the Registrant has duly caused this report to be signed on its behalf by the undersigned, thereunto duly authorized.
| | NEUBERGER BERMAN ADVISERS MANAGEMENT TRUST |
| | | |
| | By: | /s/ Robert Conti |
| | | Robert Conti |
| | | Chief Executive Officer |
| | | |
| | Date: | February 19, 2013 |
Pursuant to the requirements of the Securities Exchange Act of 1934 and the Investment Company Act of 1940, this report has been signed below by the following persons on behalf of the Registrant and in the capacities and on the dates indicated.
| By: | /s/ Robert Conti |
| | Robert Conti |
| | Chief Executive Officer |
| | |
| Date: | February 19, 2013 |
| By: | /s/ John M. McGovern |
| | John M. McGovern |
| | Treasurer and Principal Financial |
| | and Accounting Officer |
| | |
| Date: | February 19, 2013 |