As filed with the Securities and Exchange Commission on March 5, 2010
UNITED STATES
SECURITIES AND EXCHANGE COMMISSION
Washington, D.C. 20549
FORM N-CSR
CERTIFIED SHAREHOLDER REPORT OF
REGISTERED MANAGEMENT INVESTMENT COMPANIES
Investment Company Act File Number: 811-4255
NEUBERGER BERMAN ADVISERS MANAGEMENT TRUST
(Exact Name of the Registrant as Specified in Charter)
605 Third Avenue, 2nd Floor
New York, New York 10158-0180
(Address of Principal Executive Offices - Zip Code)
Robert Conti, Chief Executive Officer
Neuberger Berman Advisers Management Trust
605 Third Avenue, 2nd Floor
New York, New York 10158-0180
Jeffrey S. Puretz, Esq.
Dechert LLP
1775 I Street, N.W.
Washington, D.C. 20006
(Names and Addresses of agents for service)
Registrant's Telephone Number, including area code: (212) 476-8800
Date of fiscal year end: December 31
Date of reporting period: December 31, 2009
Form N-CSR is to be used by management investment companies to file reports with the Commission not later than 10 days after the transmission to stockholders of any report that is required to be transmitted to stockholders under Rule 30e-1 under the Investment Company Act of 1940 (the "Act") (17 CFR 270.30e-1). The Commission may use the information provided on Form N-CSR in its regulatory, disclosure review, inspection, and policymaking roles.
A registrant is required to disclose the information specified by Form N-CSR, and the Commission will make this information public. A registrant is not required to respond to the collection of information contained in Form N-CSR unless the Form displays a currently valid Office of Management and Budget ("OMB") control number. Please direct comments concerning the accuracy of the information collection burden estimate and any suggestions for reducing the burden to Secretary, Securities and Exchange Commission, 100 F Street, NE, Washington, DC 20549. The OMB has reviewed this collection of information under the clearance requirements of 44 U.S.C. Section 3507.
ITEM 1. REPORTS TO SHAREHOLDERS
The following are copies of the annual reports transmitted to shareholders pursuant to Rule 30e-1 under the Act.

Neuberger Berman
Advisers Management Trust
Balanced Portfolio
I Class Shares
Annual Report
December 31, 2009
Balanced Portfolio Managers' Commentary
For the year ended December 31, 2009, the Neuberger Berman Advisers Management Trust (AMT) Balanced Portfolio posted a strongly positive return. Although its equity component trailed the Russell Midcap(R) Growth Index, its fixed income component outpaced the Merrill Lynch 1-3 Year Treasury Index.
Equities
While the stock market ended 2009 decidedly up, the period contained two very different phases - -- dramatic weakness carrying over from 2008 colored the early part of the year, and then markets rallied from March through year-end. Mid-cap stocks led other market capitalization groups, and growth stocks outperformed value stocks for the year.
Generally speaking, this year's rally was led by what we consider the lower quality area of the market, including stocks with low price/earnings, low returns on equity, low prices (under $5) and little or no earnings. This was not surprising to us, as low quality stocks have historically led early in market rallies. We typically avoid these areas given our stock selection process and fundamental criteria. We also do not believe they can outperform over the longer term. In fact, we believe there are signs that the low-quality rally may already be fading, and that the markets will once again focus on fundamentals and higher quality names with superior growth potential.
Within the Portfolio's equity component, our Telecommunications holdings were beneficial to relative performance, as was a zero allocation to Utilities. Given that our higher-quality discipline was out of favor for most of the year, stock selection was a negative versus the market. We saw particular weakness within Health Care and Information Technology stocks.
In Health Care, both uncertainty surrounding health care reform and weak earnings impacted our holdings. Additionally, medical supplies and services companies underperformed on concerns about lower hospital spending. In addition, our medical diagnostics theme was impacted by the slowdown more than we had expected. Within the sector, we are focusing on companies that we believe may be beneficiaries of or are relatively insulated from health care reforms.
In IT, our holdings, primarily software and services names, did not keep pace with the rally, although our semiconductor equipment stocks performed better than other IT holdings. We have not significantly changed our positioning, expecting that holdings could benefit as long-delayed business spending increases.
Within Industrials, while high-quality holdings exceeded expectations, they were out of favor with the preference for low quality stocks over the past year. We believe the companies could benefit now from improved corporate spending. We continue to hold aerospace and defense themed names and have added to positions in stocks that we believed could benefit from economic improvement.
In Consumer Discretionary, our secondary education theme underperformed this period, but our "retail survivors" theme was beneficial. We are taking a bifurcated approach, holding select names at the low and high ends of the sector.
Looking ahead, we believe a continued recovery will occur with muted growth, expecting GDP--likely in our view to be stronger in the first half of 2010 than the second--in the range of 3%. Consumer weakness and jobless claims continue to be our main concerns. Since the consumer is unlikely to help move the economy forward, we believe it is critical that select international economies, such as the BRIC (Brazil, Russia, India and China) markets, show robust growth. Considering this outlook, we are seeking "international exposure" through companies with exposure to international revenue streams.
In addition, unlike last year, we are looking for top-line growth as opposed to bottom line improvements. We believe there is a great deal of potential for a renewed corporate spending. This should benefit some Industrials and IT companies. We have continued to become less defensive within the equity portfolio segment overall, and believe that with a sustained slower growth recovery backdrop, the market will reward companies with strong management, quality growth characteristics and strong balance sheets.
1
Fixed Income
As the year began, the U.S. fixed income markets were still being negatively impacted by fallout from the turmoil in the financial markets, frozen credit conditions and illiquidity. Collectively, this caused risk aversion to remain elevated, as investors favored the safety of short-term U.S. Treasury securities and avoided securities that were perceived to be risky.
Conditions in the fixed income markets then gradually started to improve as the government's aggressive initiatives to stabilize financial markets began to bear fruit. In addition, as the reporting period progressed, optimism grew regarding the outlook for the U.S. economy. These factors caused investor sentiment to reverse course and risk aversion was replaced with increased risk appetite. Against this backdrop, non-Treasury (spread) sectors rallied sharply. Aside from several brief periods of weakness, these sectors generally outperformed Treasuries in 2009.
During the year, the Portfolio's fixed income segment's strong performance was, in large part, the result of its exposure to structured products. Despite their poor performance in 2008, we maintained these positions, as we felt these securities had become extremely undervalued based on their underlying fundamentals and future cash flows. Adhering to our investment discipline proved to be highly beneficial, as our structured products generated strong relative performance versus Treasuries during the reporting period. In particular, our commercial mortgage-backed securities, non-agency mortgage-backed securities and asset-backed securities generated strong returns.
Another element that enhanced our results was exposure to investment grade financial and industrial bonds. When the year began, their yields relative to Treasuries (or spreads) were pricing in worst-case scenarios, with assumed default rates at levels several times higher than had ever occurred, even during the Great Depression. Again, we relied on our fundamental analysis, which indicated that these spreads were unsustainably wide and, barring a complete global financial meltdown, that they would narrow in 2009. This proved to be the case as, in many cases, investment grade bond spreads narrowed to pre-crisis levels during 2009.
As noted, we anticipate below-average economic growth. On the monetary side, we will be closely watching the timing and methods used by the Federal Reserve to remove its quantitative programs.
We believe the fixed income portfolio segment is well positioned in this environment. As was the case throughout 2009, we expect to maintain a defensive posture in duration (or sensitivity to interest rate movements), which is shorter than that of the benchmark. We have reduced our risk exposure by capturing profits on some of our strong performers and further diversifying by increasing our Treasury position. That said, we continue to identify compelling securities in certain non-Treasury sectors--most notably corporate bonds--and plan to continue pursuing these opportunities when we believe it is appropriate to do so from a risk/reward perspective.
Sincerely,
Kenneth J. Turek, Thomas Sontag
Michael Foster and Richard Grau
Portfolio Co-Managers
2
Balanced Portfolio
ASSET DIVERSIFICATION
| (% of Market Value) | |
| Asset Backed | | | 2.4 | % | |
| Corporate Debt | | | 8.6 | | |
| Common Stock | | | 54.1 | | |
| Mortgage-Backed Securities | | | 12.7 | | |
| U.S. Treasury Securities | | | 18.8 | | |
| Short-Term Investments | | | 3.4 | | |
| Total | | | 100.0 | % | |
AVERAGE ANNUAL TOTAL RETURN1
| | | Inception
Date | | 1 Year | | 5 Years | | 10 Years | | Life of
Fund* | |
Balanced Portfolio
Class I | | 02/28/1989 | | | 22.47 | % | | | 0.81 | % | | | -0.98 | % | | | 6.15 | % | |
Merrill Lynch 1-3 Year
Treasury Index2 | | | | | 0.78 | % | | | 4.04 | % | | | 4.48 | % | | | 5.78 | % | |
Russell Midcap(R)
Growth Index2 | | | | | 46.29% | | | | 2.40% | | | | -0.52% | | | | 9.58% | | |
| Russell Midcap(R) Index2 | | | | | 40.48 | % | | | 2.43 | % | | | 4.98 | % | | | 10.81 | % | |
Performance data quoted represent past performance, which is no guarantee of future results. The investment return and principal value of an investment will fluctuate so that an investor's shares, when redeemed may be worth more or less than their original cost. Results are shown on a "total return" basis and include reinvestment of all income dividends and distributions.
Current performance may be lower or higher than the performance data quoted. For performance data current to the most recent month end, please visit https://www.nb.com.
* Index returns are as of the inception date 02/28/1989.
As stated in the Portfolio's most recent prospectus, the total annual fund operating expense ratio for fiscal year 2008 was 1.29% for Class I shares (prior to any fee waivers or expense reimbursements). Neuberger Berman Management LLC has contractually agreed to limit certain expenses of the Portfolio through 12/31/2012.
COMPARISON OF A $10,000 INVESTMENT
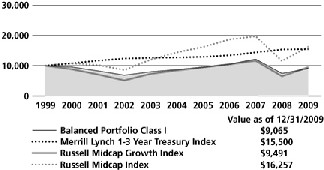
The chart shows the value of a hypothetical $10,000 investment in the Portfolio over the past 10 fiscal years, or since the Portfolio's inception, if it has not operated for 10 years. The result is compared with benchmarks, which may include a broad-based market index and/or a narrower index. Please note that market indexes do not include expenses. All results include the reinvestment of income dividends and distributions. Results represent past performance and do not indicate future results. The chart and table do not reflect the deduction of taxes that a shareholder would pay on Portfolio distributions or the redemption of Portfolio shares.
Please see Endnotes for additional information.
3
Endnotes
1 "Total Return" includes reinvestment of all income dividends and distributions. Results represent past performance and do not indicate future results. The value of an investment in the Portfolio and the return on the investment both will fluctuate, and redemption proceeds may be higher or lower than an investor's original cost. The performance information does not reflect fees and expenses of the variable annuity and variable life insurance policies or the qualified pension and retirement plans whose proceeds are invested in the Portfolio. Neuberger Berman Management LLC ("NBM LLC") has agreed to absorb certain expenses of the AMT Portfolios, including the Portfolio. Without this arrangement, which is subject to change, the total returns of the Portfolio may have been less.
2 The Russell Midcap(R) Growth Index measures the performance of those Russell Midcap(R) Index companies with higher price-to-book ratios and higher forecasted growth values. The Russell Midcap Index measures the performance of the 800 smallest companies in the Russell 1000(R) Index, which represents approximately 31% of the total market capitalization of the Russell 1000 Index (which, in turn, consists of the 1,000 largest U.S. companies, based on the market capitalization). The Merrill Lynch 1-3 Year Treasury Index is an unmanaged total return market value index consisting of all coupon-bearing U.S. Treasury publicly placed debt securities with maturities between 1 to 3 years. Please note that indices do not take into account any fees and expenses of investing in the individual securities that they track and that individuals cannot invest directly in any index. Data about the performance of these indices are prepared or obtained by NBM LLC and include reinvestment of all income dividends and distributions. The Portfolio may invest in many securities not included in the above described indices.
Any ratios or other measurements using a factor of forecasted earnings of a company discussed herein are based on consensus estimates, not NBM LLC's own projections, and they may or may not be realized. In addition, any revision to a forecast could affect the market price of a security. By quoting them herein, NBM LLC does not offer an opinion as to the accuracy of and does not guarantee these forecasted numbers.
The investments for the Portfolio are managed by the same portfolio manager(s) who manage one or more other mutual funds that have similar names, investment objectives and investment styles as the Portfolio. You should be aware that the Portfolio is likely to differ from the other mutual funds in size, cash flow pattern and tax matters. Accordingly, the holdings and performance can be expected to vary from those of the other mutual funds.
The composition, industries and holdings of the Portfolio are subject to change.
Shares of the separate AMT Portfolios are not available to the general public. Shares of this Portfolio may be purchased only by life insurance companies to be used with their separate accounts that fund variable annuity and variable life insurance policies and by qualified pension and retirement plans.
Statistics and projections in this report are derived from sources deemed to be reliable but cannot be regarded as a representation of future results of the AMT Portfolios. This report is prepared for the general information of shareholders and is not an offer of shares of the AMT Portfolios. Shares of the AMT Portfolios are sold only through the currently effective prospectuses, which must precede or accompany this report.
(c) 2010 Neuberger Berman Management LLC distributor. All rights reserved.
4
Information About Your Fund's Expenses
This table is designed to provide information regarding costs related to your investments. All mutual funds incur operating expenses, which include management fees, fees for administrative services and costs of shareholder reports, among others. The following examples are based on an investment of $1,000 made at the beginning of the six month period ended December 31, 2009 and held for the entire period. The table illustrates the fund's costs in two ways:
| Actual Expenses and Performance: | | The first section of the table provides information about actual account values and actual expenses in dollars, based on the fund's actual performance during the period. You may use the information in this line, together with the amount you invested, to estimate the expenses you paid over the period. Simply divide your account value by $1,000 (for example, an $8,600 account value divided by $1,000 = 8.6), then multiply the result by the number in the first section of the table under the heading entitled "Expenses Paid During the Period" to estimate the expenses you paid over the period. | |
|
Hypothetical Example for
Comparison Purposes: | | The second section of the table provides information about hypothetical account values and hypothetical expenses based on the fund's actual expense ratio and an assumed rate of return at 5% per year before expenses. This return is not the fund's actual return. The hypothetical account values and expenses may not be used to estimate the actual ending account balance or expenses you paid for the period. You may use this information to compare the ongoing costs of investing in this fund versus other funds. To do so, compare the expenses shown in this 5% hypothetical example with the 5% hypothetical examples that appear in the shareholder reports of other funds. | |
|
Please note that the expenses in the table are meant to highlight your ongoing costs only. The table and expense example do not include any transactional costs, such as fees and expenses that are, or may be, imposed under your variable contract or qualified pension plan. Therefore, the information under the heading "Hypothetical (5% annual return before expenses)" is useful in comparing ongoing costs only, and will not help you determine the relative total costs of owning different funds. In addition, if these transactional costs were included, your costs would have been higher.
Expense Information as of 12/31/09 (Unaudited)
NEUBERGER BERMAN ADVISERS MANAGEMENT TRUST BALANCED PORTFOLIO
| Actual | | Beginning Account
Value
7/1/09 | | Ending Account
Value
12/31/09 | | Expenses Paid During
the Period*
7/1/09 - 12/31/09 | |
| Class I | | $ | 1,000.00 | | | $ | 1,151.70 | | | $ | 10.03 | | |
| Hypothetical (5% annual return before expenses)** | |
| Class I | | $ | 1,000.00 | | | $ | 1,015.88 | | | $ | 9.40 | | |
* Expenses are equal to the annualized expense ratio of 1.85%, multiplied by the average account value over the period, multiplied by 184/365 (to reflect the one-half year period shown).
** Hypothetical 5% annual return before expenses is calculated by multiplying the number of days in the most recent half year divided by 365.
5
Schedule of Investments Balanced Portfolio
| NUMBER OF SHARES | | | | VALUEt | |
| Common Stocks (54.6%) | | | |
| Aerospace & Defense (1.2%) | | | |
| | 1,150 | | | Precision Castparts | | $ | 126,902 | | |
| | 1,250 | | | Rockwell Collins | | | 69,200 | | |
| | | | 196,102 | | |
| Air Freight & Logistics (1.3%) | | | |
| | 2,500 | | | C.H. Robinson Worldwide | | | 146,825 | | |
| | 2,000 | | | Expeditors International | | | 69,460 | | |
| | | | 216,285 | | |
| Biotechnology (2.3%) | | | |
| | 1,900 | | | Alexion Pharmaceuticals | | | 92,758 | * | |
| | 2,000 | | | BioMarin Pharmaceutical | | | 37,620 | * | |
| | 1,100 | | | Dendreon Corp. | | | 28,908 | ** | |
| | 2,250 | | | Human Genome Sciences | | | 68,850 | * | |
| | 3,500 | | | Talecris Biotherapeutics | | | 77,945 | * | |
| | 1,750 | | | Vertex Pharmaceuticals | | | 74,987 | * | |
| | | | 381,068 | | |
| Capital Markets (1.3%) | | | |
| | 1,300 | | | Affiliated Managers Group | | | 87,555 | * | |
| | 1,500 | | | Artio Global Investors | | | 38,235 | * | |
| | 4,000 | | | Invesco Ltd. | | | 93,960 | | |
| | | | 219,750 | | |
| Chemicals (2.0%) | | | |
| | 3,100 | | | Airgas, Inc. | | | 147,560 | oo | |
| | 2,800 | | | Ecolab Inc. | | | 124,824 | oo | |
| | 2,000 | | | Nalco Holding | | | 51,020 | | |
| | | | 323,404 | | |
| Commercial Services & Supplies (1.0%) | | | |
| | 3,000 | | | Stericycle, Inc. | | | 165,510 | *oo | |
| Communications Equipment (0.6%) | | | |
| | 3,700 | | | Juniper Networks | | | 98,679 | * | |
| Computers & Peripherals (0.9%) | | | |
| | 2,500 | | | NetApp, Inc. | | | 85,975 | * | |
| | 1,550 | | | Western Digital | | | 68,433 | * | |
| | | | 154,408 | | |
| Diversified Consumer Services (1.2%) | | | |
| | 1,650 | | | DeVry, Inc. | | | 93,604 | | |
| | 500 | | | Strayer Education | | | 106,245 | | |
| | | | 199,849 | | |
| Diversified Financial Services (1.3%) | | | |
| | 1,000 | | | IntercontinentalExchange Inc. | | | 112,300 | * | |
| | 3,250 | | | MSCI Inc. | | | 103,350 | * | |
| | | | 215,650 | | |
| NUMBER OF SHARES | | | | VALUEt | |
| Electrical Equipment (1.2%) | | | |
| | 3,000 | | | AMETEK, Inc. | | $ | 114,720 | | |
| | 1,500 | | | Roper Industries | | | 78,555 | | |
| | | | 193,275 | | |
Electronic Equipment, Instruments &
Components (2.4%) | | | |
| | 2,000 | | | Amphenol Corp. | | | 92,360 | | |
| | 2,500 | | | Dolby Laboratories | | | 119,325 | * | |
| | 3,000 | | | National Instruments | | | 88,350 | | |
| | 3,500 | | | Trimble Navigation | | | 88,200 | * | |
| | | | 388,235 | | |
| Energy Equipment & Services (1.7%) | | | |
| | 1,800 | | | CARBO Ceramics | | | 122,706 | | |
| | 850 | | | Core Laboratories N.V. | | | 100,402 | | |
| | 900 | | | Oceaneering International | | | 52,668 | * | |
| | | | 275,776 | | |
| Food Products (0.3%) | | | |
| | 850 | | | J.M. Smucker | | | 52,488 | | |
| Health Care Equipment & Supplies (2.4%) | | | |
| | 1,000 | | | Edwards Lifesciences | | | 86,850 | * | |
| | 225 | | | Intuitive Surgical | | | 68,247 | * | |
| | 1,250 | | | Masimo Corp. | | | 38,025 | * | |
| | 1,950 | | | NuVasive, Inc. | | | 62,361 | * | |
| | 900 | | | ResMed Inc. | | | 47,043 | * | |
| | 1,500 | | | Sirona Dental Systems | | | 47,610 | * | |
| | 2,500 | | | Volcano Corp. | | | 43,450 | * | |
| | | | 393,586 | | |
| Health Care Providers & Services (1.5%) | | | |
| | 1,400 | | | Express Scripts | | | 121,030 | * | |
| | 1,600 | | | HMS Holdings | | | 77,904 | * | |
| | 2,000 | | | PSS World Medical | | | 45,140 | * | |
| | | | 244,074 | | |
| Health Care Technology (0.7%) | | | |
| | 3,500 | | | Allscripts Healthcare Solutions | | | 70,805 | * | |
| | 2,000 | | | MedAssets Inc. | | | 42,420 | * | |
| | | | 113,225 | | |
| Hotels, Restaurants & Leisure (1.8%) | | | |
| | 1,000 | | | Bally Technologies | | | 41,290 | * | |
| | 3,500 | | | Penn National Gaming | | | 95,130 | * | |
| | 4,000 | | | WMS Industries | | | 160,000 | *oo | |
| | | | 296,420 | | |
| Household Products (0.5%) | | | |
| | 1,400 | | | Church & Dwight | | | 84,630 | | |
See Notes to Schedule of Investments 6
| NUMBER OF SHARES | | | | VALUEt | |
| Internet & Catalog Retail (0.5%) | | | |
| | 400 | | | Priceline.com Inc. | | $ | 87,400 | * | |
| Internet Software & Services (1.8%) | | | |
| | 1,100 | | | Equinix, Inc. | | | 116,765 | * | |
| | 1,500 | | | GSI Commerce | | | 38,085 | * | |
| | 2,500 | | | VistaPrint NV | | | 141,650 | * | |
| | | | 296,500 | | |
| IT Services (1.0%) | | | |
| | 700 | | | Alliance Data Systems | | | 45,213 | ** | |
| | 2,500 | | | Cognizant Technology Solutions | | | 113,250 | * | |
| | | | 158,463 | | |
| Machinery (1.1%) | | | |
| | 1,400 | | | Danaher Corp. | | | 105,280 | oo | |
| | 750 | | | Flowserve Corp. | | | 70,897 | | |
| | | | 176,177 | | |
| Media (1.0%) | | | |
| | 1,500 | | | Discovery Communications
Class A | | | 46,005 | * | |
| | 1,750 | | | DreamWorks Animation SKG | | | 69,913 | * | |
| | 1,000 | | | Scripps Networks Interactive | | | 41,500 | | |
| | | | 157,418 | | |
| Metals & Mining (0.4%) | | | |
| | 1,500 | | | Cliffs Natural Resources | | | 69,135 | | |
| Multiline Retail (1.1%) | | | |
| | 1,750 | | | Dollar Tree | | | 84,525 | * | |
| | 2,600 | | | Nordstrom, Inc. | | | 97,708 | | |
| | | | 182,233 | | |
| Oil, Gas & Consumable Fuels (3.5%) | | | |
| | 800 | | | Alpha Natural Resources | | | 34,704 | * | |
| | 1,500 | | | Cabot Oil & Gas | | | 65,385 | | |
| | 3,900 | | | Concho Resources | | | 175,110 | * | |
| | 2,400 | | | Range Resources | | | 119,640 | | |
| | 3,700 | | | Southwestern Energy | | | 178,340 | *oo | |
| | | | 573,179 | | |
| Personal Products (0.8%) | | | |
| | 1,750 | | | Avon Products | | | 55,125 | | |
| | 1,700 | | | Mead Johnson Nutrition | | | 74,290 | | |
| | | | 129,415 | | |
| Pharmaceuticals (0.4%) | | | |
| | 3,750 | | | Mylan Laboratories | | | 69,113 | * | |
| Professional Services (1.3%) | | | |
| | 2,100 | | | IHS Inc. | | | 115,101 | * | |
| | 3,200 | | | Verisk Analytics | | | 96,896 | * | |
| | | | 211,997 | | |
| NUMBER OF SHARES | | | | VALUEt | |
| Road & Rail (0.6%) | | | |
| | 3,000 | | | J.B. Hunt Transport Services | | $ | 96,810 | | |
Semiconductors & Semiconductor
Equipment (3.6%) | | | |
| | 2,700 | | | Analog Devices | | | 85,266 | | |
| | 3,500 | | | Avago Technologies | | | 64,015 | * | |
| | 4,900 | | | Marvell Technology Group | | | 101,675 | * | |
| | 4,000 | | | Microchip Technology | | | 116,240 | | |
| | 2,000 | | | Novellus Systems | | | 46,680 | * | |
| | 2,200 | | | Silicon Laboratories | | | 106,348 | * | |
| | 1,800 | | | Varian Semiconductor Equipment | | | 64,584 | * | |
| | | | 584,808 | | |
| Software (3.6%) | | | |
| | 7,500 | | | Activision Blizzard | | | 83,325 | * | |
| | 3,000 | | | ANSYS, Inc. | | | 130,380 | * | |
| | 1,200 | | | Citrix Systems | | | 49,932 | * | |
| | 1,150 | | | McAfee Inc. | | | 46,655 | * | |
| | 1,350 | | | MICROS Systems | | | 41,890 | * | |
| | 2,500 | | | Rovi Corp. | | | 79,675 | * | |
| | 700 | | | Salesforce.com, Inc. | | | 51,639 | * | |
| | 750 | | | Solera Holdings | | | 27,008 | | |
| | 1,750 | | | Sybase, Inc. | | | 75,950 | * | |
| | | | 586,454 | | |
| Specialty Retail (4.4%) | | | |
| | 2,600 | | | Bed Bath & Beyond | | | 100,438 | * | |
| | 2,700 | | | CarMax, Inc. | | | 65,475 | * | |
| | 1,750 | | | J Crew Group | | | 78,295 | * | |
| | 3,000 | | | Ross Stores | | | 128,130 | | |
| | 700 | | | Tiffany & Co. | | | 30,100 | | |
| | 2,300 | | | TJX Cos. | | | 84,065 | | |
| | 5,000 | | | Urban Outfitters | | | 174,950 | * | |
| | 2,600 | | | Williams-Sonoma | | | 54,028 | | |
| | | | 715,481 | | |
| Textiles, Apparel & Luxury Goods (0.4%) | | | |
| | 950 | | | Coach, Inc. | | | 34,704 | | |
| | 300 | | | Polo Ralph Lauren | | | 24,294 | | |
| | | | 58,998 | | |
| Trading Companies & Distributors (1.0%) | | | |
| | 2,500 | | | Fastenal Co. | | | 104,100 | * | |
| | 700 | | | W.W. Grainger | | | 67,781 | | |
| | | | 171,881 | | |
| Wireless Telecommunication Services (2.5%) | | | |
| | 2,500 | | | American Tower | | | 108,025 | * | |
| | 1,300 | | | Crown Castle International | | | 50,752 | * | |
| | 1,750 | | | NII Holdings | | | 58,765 | * | |
| | 5,900 | | | SBA Communications | | | 201,544 | * | |
| | | | 419,086 | | |
| | | | | Total Common Stocks
(Cost $6,696,258) | | | 8,956,962 | | |
See Notes to Schedule of Investments 7
| PRINCIPAL AMOUNT | | | | VALUEt | |
| U.S. Treasury Securities-Backed by the Full Faith and Credit of the U.S. Government (18.9%) | | | |
| $ | 2,775,000 | | | U.S. Treasury Notes, 4.75%, due 3/31/11 | | $ | 2,911,147 | | |
| | 125,000 | | | U.S. Treasury Notes, 1.38%, due 4/15/12 | | | 125,117 | | |
| | 70,000 | | | U.S. Treasury Notes, 3.88%, due 10/31/12 | | | 74,485 | | |
| | | | | Total U.S. Treasury Securities-Backed by the Full Faith and Credit of the U.S. Government
(Cost $3,109,761) | | | 3,110,749 | | |
| Mortgage-Backed Securities (12.8%) | | | |
| Adjustable Alt-B Mixed Balance (0.5%) | | | |
| | 110,650 | | | Lehman XS Trust, Floating Rate, Ser. 2005-1, Class 2A1, 1.73%, due 1/4/10 | | | 76,691 | u | |
| Adjustable Conforming Balance (0.9%) | | | |
| | 248,021 | | | Adjustable Rate Mortgage Trust, Ser. 2005-10, Class 4A1, 5.38%, due 1/4/10 | | | 151,406 | u | |
| Adjustable Jumbo Balance (1.1%) | | | |
| | 104,467 | | | Banc of America Funding Corp., Ser. 2005-F, Class 4A1, 5.29%, due 1/4/10 | | | 72,454 | u | |
| | 182,720 | | | Banc of America Funding Corp., Ser. 2006-A, Class 3A2, 5.79%, due 1/4/10 | | | 104,016 | u | |
| | | | 176,470 | | |
| Adjustable Mixed Balance (6.6%) | | | |
| | 384,963 | | | Countrywide Home Loan Mortgage Pass-Through Trust, Ser. 2006-HYB3, Class 1A1A,
4.14%, due 1/4/10 | | | 231,247 | u | |
| | 254,693 | | | Credit Suisse First Boston Mortgage Securities Corp., Ser. 2004-AR4, Class 2A1, 3.39%, due 1/4/10 | | | 218,311 | u | |
| | 252,262 | | | First Horizon Mortgage Pass-Through Trust, Ser. 2005-AR5, Class 2A1, 5.45%, due 1/4/10 | | | 216,458 | u | |
| | 241,072 | | | GMAC Mortgage Corp. Loan Trust, Ser. 2006-AR1, Class 1A1, 5.49%, due 1/4/10 | | | 176,910 | u | |
| | 15,092 | | | Harborview Mortgage Loan Trust, Ser. 2004-4, Class 3A, 1.36%, due 1/4/10 | | | 9,651 | u | |
| | 466,419 | | | IndyMac INDX Mortgage Loan Trust, Ser. 2006-AR3, Class 2A1A, 5.98%, due 1/4/10 | | | 241,388 | uoo | |
| | | | 1,093,965 | | |
| Mortgage-Backed Non-Agency (1.0%) | | | |
| | 115,509 | | | Countrywide Home Loans, Ser. 2005-R2, Class 2A4, 8.50%, due 6/25/35 | | | 110,889 | noo�� | |
| | 51,949 | | | GSMPS Mortgage Loan Trust, Ser. 2005-RP3, Class 1A4, 8.50%, due 9/25/35 | | | 47,273 | n | |
| | | | 158,162 | | |
| Fannie Mae (0.8%) | | | |
| | 119,792 | | | Whole Loan, Ser. 2004-W8, Class PT, 10.61%, due 1/4/10 | | | 130,703 | uoo | |
| Freddie Mac (1.9%) | | | |
| | 163,936 | | | Pass-Through Certificates, 8.00%, due 11/1/26 | | | 188,024 | oo | |
| | 113,280 | | | Pass-Through Certificates, 8.50%, due 10/1/30 | | | 130,738 | oo | |
| | | | 318,762 | | |
| | | | | Total Mortgage-Backed Securities (Cost $2,877,107) | | | 2,106,159 | | |
| Corporate Debt Securities (8.7%) | | | |
| Banks (4.4%) | | | |
| | 150,000 | | | Bank of America Corp., Senior Unsecured Notes, 6.25%, due 4/15/12 | | | 160,698 | | |
| | 100,000 | | | Bear Stearns Cos. LLC, Senior Unsecured Notes, 5.35%, due 2/1/12 | | | 106,257 | | |
| | 30,000 | | | Bear Stearns Cos. LLC, Senior Unsecured Medium-Term Notes, Ser. B, 6.95%, due 8/10/12 | | | 33,518 | | |
| | 145,000 | | | Citigroup, Inc., Senior Unsecured Notes, 5.13%, due 2/14/11 | | | 149,609 | | |
| | 125,000 | | | Goldman Sachs Group, Inc., Senior Unsecured Notes, 6.60%, due 1/15/12 | | | 135,892 | | |
| | 125,000 | | | Morgan Stanley, Senior Unsecured Notes, 6.75%, due 4/15/11 | | | 132,435 | | |
| | | | 718,409 | | |
See Notes to Schedule of Investments 8
| PRINCIPAL AMOUNT | | | | VALUEt | |
| Beverages (0.5%) | | | |
| $ | 75,000 | | | Anheuser-Busch Cos., Inc., Senior Unsecured Notes, 4.95%, due 1/15/14 | | $ | 77,370 | | |
| Diversified Financial Services (1.5%) | | | |
| | 85,000 | | | American Express Credit Corp., Senior Unsecured Medium-Term Notes, Ser. C, 5.88%, due 5/2/13 | | | 91,219 | | |
| | 145,000 | | | General Electric Capital Corp., Senior Unsecured Medium-Term Notes, 5.00%, due 4/10/12 | | | 152,733 | | |
| | | | 243,952 | | |
| Media (0.9%) | | | |
| | 70,000 | | | Comcast Cable Communications LLC, Guaranteed Senior Unsecured Notes, 6.75%, due 1/30/11 | | | 73,876 | | |
| | 70,000 | | | Time Warner Cable, Inc., Guaranteed Notes, 5.40%, due 7/2/12 | | | 74,790 | | |
| | | | 148,666 | | |
| Office/Business Equipment (0.3%) | | | |
| | 50,000 | | | Xerox Corp., Senior Unsecured Notes, 5.50%, due 5/15/12 | | | 52,841 | | |
| Oil & Gas (0.3%) | | | |
| | 50,000 | | | XTO Energy, Inc., Senior Unsecured Notes, 5.90%, due 8/1/12 | | | 54,784 | | |
| Pharmaceuticals (0.6%) | | | |
| | 90,000 | | | Pfizer, Inc., Senior Unsecured Notes, 4.45%, due 3/15/12 | | | 95,188 | | |
| Telecommunications (0.2%) | | | |
| | 35,000 | | | Telecom Italia Capital SA, Guaranteed Notes, 5.25%, due 11/15/13 | | | 36,813 | | |
| | | | | Total Corporate Debt Securities (Cost $1,425,061) | | | 1,428,023 | | |
| Asset-Backed Securities (2.4%) | | | |
| | 228,573 | | | ACE Securities Corp. Home Equity Loan Trust, Ser. 2006-ASP5, Class A2B, 0.36%, due 1/25/10 | | | 115,986 | uoo | |
| | 100,000 | | | ACE Securities Corp. Home Equity Loan Trust, Ser. 2006-OP1, Class A2C, 0.38%, due 1/25/10 | | | 59,207 | uoo | |
| | 200,000 | | | Carrington Mortgage Loan Trust, Ser. 2007-FRE1, Class A3, 0.49%, due 1/25/10 | | | 71,345 | uoo | |
| | 60,737 | | | Impac Secured Assets Corp., Ser. 2006-3, Class A4, 0.32%, due 1/25/10 | | | 23,991 | u | |
| | 135,724 | | | Residential Asset Mortgage Products, Inc., Ser. 2006-RS1, Class AI2, 0.46%, due 1/25/10 | | | 91,011 | uoo | |
| | 73,247 | | | Securitized Asset Backed Receivables LLC Trust, Ser. 2006-WM4, Class A2C, 0.39%, due 1/25/10 | | | 26,455 | u | |
| | | | | Total Asset-Backed Securities (Cost $784,083) | | | 387,995 | | |
| NUMBER OF SHARES | |
| Short-Term Investments (3.4%) | | | |
| | 161,031 | | | Neuberger Berman Securities Lending Quality Fund, LLC | | | 164,252 | tt | |
| | 394,793 | | | State Street Institutional Liquid Reserves Fund Institutional Class | | | 394,793 | | |
| | | | | Total Short-Term Investments (Cost $559,045) | | | 559,045 | | |
| | | | | Total Investments (100.8%) (Cost $15,451,315) | | | 16,548,933 | ## | |
| | | | | Liabilities, less cash, receivables and other assets [(0.8%)] | | | (134,549 | ) | |
| | | | | Total Net Assets (100.0%) | | $ | 16,414,384 | | |
See Notes to Schedule of Investments 9
Notes to Schedule of Investments Balanced Portfolio
t The value of investments in equity securities and financial futures contracts by Neuberger Berman Advisers Management Trust Balanced Portfolio (the "Fund") is determined by Neuberger Berman Management LLC ("Management") primarily by obtaining valuations from an independent pricing service based on the latest sale price when that price is readily available. Securities traded primarily on the NASDAQ Stock Market are normally valued by the Fund at the NASDAQ Official Closing Price ("NOCP") provided by NASDAQ each business day. The NOCP is the most recently reported price as of 4:00:02 p.m., Eastern time, unless that price is outside the range of the "inside" bid and asked prices (i.e., the bid and asked prices that dealers quote to each other when trading for their own accounts); in that case, NASDAQ will adjust the price to equal the inside bid or asked price, whichever is closer. Because of delays in reporting trades, the NOCP may not be based on the price of the last trade to occur before the market closes. If there is no reported sale of a security on a particular day, the independent pricing service may value the security based on reported market quotations. If a valuation is not available from an independent pricing service, the Fund seeks to obtain quotations from principal market makers. The value of investments in debt securities are determined by Management primarily by obtaining valuations from independent pricing services based on readily available bid quotations, or if quotations are not available, by methods which include considerations such as: yields or prices of securities of comparable quality, coupon, maturity and type; indications as to values from dealers; and general market conditions. Management has developed a process to periodically review information provided by independent pricing services. For both debt and equity securities, if such quotations are not readily available, securities are valued using methods the Board of Trustees of Neuberger Berman Advisers Management Trust (the "Board") has approved on the belief that they reflect fair value. Numerous factors may be considered when determining the fair value of a security, including available analyst, media or other reports, trading in futures or ADRs and whether the issuer of the security being fair valued has other securities outstanding. Foreign security prices are furnished by independent quotation services and expressed in local currency values. Foreign security prices are currently translated from the local currency into U.S. dollars using the exchange rate as of 4:00 p.m., Eastern time. The Board has approved the use of Interactive Data Pricing and Reference Data, Inc. ("Interactive") to assist in determining the fair value of foreign equity securities when changes in the value of a certain index suggest that the closing prices on the foreign exchanges may no longer represent the amount that the Fund could expect to receive for those securities. In this event, Interactive will provide adjusted prices for certain foreign equity securities using a statistical analysis of historical correlations of multiple factors. In the absence of precise information about the market values of these foreign securities as of the close of the New York Stock Exchange, the Board has determined on the basis of available data that prices adjusted in this way are likely to be closer to the prices the Fund could realize on a current sale than are the prices of those securities established at the close of the foreign markets in which the securities primarily trade. Fair value prices are necessarily estimates, and there is no assurance that such a price will be at or close to the price at which the security is next quoted or next trades. Short-term debt securities with less than 60 days until maturity may be valued at cost, which, when combined with interest earned, is expected to approximate market value.
In accordance with Accounting Standards Codification ("ASC") 820 "Fair Value Measurements and Disclosures" ("ASC 820"), formerly known as Financial Accounting Standards Board ("FASB") Statement of Financial Accounting Standards No. 157, "Fair Value Measurements," investments held by the Fund are carried at "fair value" as defined by ASC 820. Fair value is defined as the price that a fund would receive upon selling an investment in an orderly transaction to an independent buyer in the principal or most advantageous market for the investment under current market conditions. Various inputs, including the volume and level of activity for the asset or liability in the market are considered in determining the value of the Fund's investments, some of which are discussed above. Significant management judgment may be necessary to estimate fair value in accordance with ASC 820.
In addition to defining fair value, ASC 820 established a three-tier hierarchy of inputs to establish a classification of fair value measurements for disclosure purposes. The three-tier hierarchy of inputs is summarized in the three broad Levels listed below.
. Level 1 - quoted prices in active markets for identical investments
See Notes to Financial Statements 10
Notes to Schedule of Investments Balanced Portfolio (cont'd)
. Level 2 - other significant observable inputs (including quoted prices for similar investments, interest rates, prepayment speeds, credit risk, amortized cost, etc.)
. Level 3 - significant unobservable inputs (including the Fund's own assumptions in determining the fair value of investments)
The inputs or methodology used for valuing an investment are not necessarily an indication of the risk associated with investing in those securities.
The following is a summary, by category of Level, of inputs used to value the Fund's investments as of December 31, 2009:
| Asset Valuation Inputs | | Level 1 | | Level 2 | | Level 3 | | Total | |
| Investments: | |
| Common Stocks^ | | $ | 8,956,962 | | | $ | -- | | | $ | -- | | | $ | 8,956,962 | | |
| U.S. Treasury Securities-Backed by the Full Faith and Credit of the U.S. Government | | | -- | | | | 3,110,749 | | | | -- | | | | 3,110,749 | | |
| Mortgage-Backed Securities^ | | | -- | | | | 2,106,159 | | | | -- | | | | 2,106,159 | | |
| Corporate Debt Securities^ | | | -- | | | | 1,428,023 | | | | -- | | | | 1,428,023 | | |
| Asset-Backed Securities | | | -- | | | | 387,995 | | | | -- | | | | 387,995 | | |
| Short-Term Investments | | | -- | | | | 559,045 | | | | -- | | | | 559,045 | | |
| Total Investments | | $ | 8,956,962 | | | $ | 7,591,971 | | | $ | -- | | | $ | 16,548,933 | | |
^ The Schedule of Investments provides information on the industry categorization for the portfolio.
Liability Valuation Inputs
The following is a summary, by category of Level, of inputs used to value the Fund's derivatives as of December 31, 2009:
| | | Level 1 | | Level 2 | | Level 3 | | Total | |
| Financial Futures Contracts | | $ | (1,172 | ) | | $ | -- | | | $ | -- | | | $ | (1,172 | ) | |
## At December 31, 2009, the cost of investments for U.S. federal income tax purposes was $15,536,011. Gross unrealized appreciation of investments was $2,298,410, and gross unrealized depreciation of investments was $1,285,488, resulting in net unrealized appreciation of $1,012,922, based on cost for U.S. federal income tax purposes.
* Security did not produce income during the last twelve months.
n Restricted security subject to restrictions on resale under federal securities laws. These securities may be resold in transactions exempt from registration, normally to qualified institutional buyers under Rule 144A under the Securities Act of 1933, as amended, and have been deemed by the investment manager to be liquid. At December 31, 2009, these securities amounted to $158,162 or 1.0% of net assets.
oo All or a portion of this security is segregated as collateral for financial futures contracts.
u Floating rate securities are securities whose yields vary with a designated market index or market rate. These securities are shown at their current rates as of December 31, 2009.
tt Managed by an affiliate of Management and could be deemed an affiliate of the Fund (see Notes A & F of Notes to Financial Statements).
* All or a portion of this security is on loan (see Note A of Notes to Financial Statements).
See Notes to Financial Statements 11
Statement of Assets and Liabilities
Neuberger Berman Advisers Management Trust
| | | BALANCED
PORTFOLIO | |
| | | December 31, 2009 | |
| Assets | |
| Investments in securities, at value*t (Notes A & F)--see Schedule of Investments: | |
| Unaffiliated issuers | | $ | 16,384,681 | | |
| Affiliated issuers | | | 164,252 | | |
| | | | 16,548,933 | | |
| Cash | | | 1 | | |
| Foreign currency | | | 9,980 | | |
| Dividends and interest receivable | | | 75,605 | | |
| Receivable for Fund shares sold | | | 1,195 | | |
| Receivable for securities lending income--net (Note A) | | | 635 | | |
| Prepaid expenses and other assets | | | 1,418 | | |
| Total Assets | | | 16,637,767 | | |
| Liabilities | |
| Payable for collateral on securities loaned (Note A) | | | 162,830 | | |
| Payable for Fund shares redeemed | | | 421 | | |
| Payable to investment manager (Notes A & B) | | | 7,648 | | |
| Payable to administrator--net (Note B) | | | 216 | | |
| Payable for variation margin on open futures contracts (Note A) | | | 375 | | |
| Accrued expenses and other payables | | | 51,893 | | |
| Total Liabilities | | | 223,383 | | |
| Net Assets at value | | $ | 16,414,384 | | |
| Net Assets consist of: | |
| Paid-in capital | | $ | 31,695,146 | | |
| Undistributed net investment income (loss) | | | 162,225 | | |
| Accumulated net realized gains (losses) on investments | | | (16,539,726 | ) | |
| Net unrealized appreciation (depreciation) in value of investments | | | 1,096,739 | | |
| Net Assets at value | | $ | 16,414,384 | | |
| Shares Outstanding ($.001 par value; unlimited shares authorized) | | | 1,824,686 | | |
| Net Asset Value, offering and redemption price per share | | $ | 9.00 | | |
| tSecurities on loan, at value: | |
| Unaffiliated issuers | | $ | 159,376 | | |
| *Cost of Investments: | |
| Unaffiliated issuers | | $ | 15,287,063 | | |
| Affiliated issuers | | | 164,252 | | |
| Total cost of investments | | $ | 15,451,315 | | |
| Total cost of foreign currency | | $ | 9,687 | | |
See Notes to Financial Statements 12
Statement of Operations
Neuberger Berman Advisers Management Trust
| | | BALANCED
PORTFOLIO | |
| | | For the
Year Ended
December 31, 2009 | |
| Investment Income: | |
| Income (Note A): | |
| Dividend income--unaffiliated issuers | | $ | 55,824 | | |
| Interest income--unaffiliated issuers | | | 327,830 | | |
| Income from securities loaned--net (Note F) | | | 3,205 | | |
| Income from investments in affiliated issuers (Note F) | | | 693 | | |
| Foreign taxes withheld | | | (526 | ) | |
| Total income | | $ | 387,026 | | |
| Expenses: | |
| Investment management fees (Notes A & B) | | | 84,703 | | |
| Administration fees (Note B) | | | 46,201 | | |
| Audit fees | | | 43,306 | | |
| Custodian fees (Note B) | | | 51,046 | | |
| Insurance expense | | | 1,168 | | |
| Legal fees | | | 1,640 | | |
| Registration and filing fees | | | 14,856 | | |
| Shareholder reports | | | 18,437 | | |
| Trustees' fees and expenses | | | 50,094 | | |
| Miscellaneous | | | 2,067 | | |
| Total expenses | | | 313,518 | | |
| Expenses reimbursed by administrator (Note B) | | | (27,368 | ) | |
| Investment management fees waived (Note A) | | | (335 | ) | |
| Expenses reduced by custodian fee expense offset arrangement (Note B) | | | (26 | ) | |
| Total net expenses | | | 285,789 | | |
| Net investment income (loss) | | $ | 101,237 | | |
| Realized and Unrealized Gain (Loss) on Investments (Note A) | |
| Net realized gain (loss) on: | |
| Sales of investment securities of unaffiliated issuers | | | (2,282,804 | ) | |
| Sales of investment securities of affiliated issuers | | | 1,423 | | |
| Financial futures contracts | | | 35,540 | | |
| Foreign currency | | | (591 | ) | |
| Change in net unrealized appreciation (depreciation) in value of: | |
| Unaffiliated investment securities | | | 5,293,892 | | |
| Financial futures contracts | | | (21,843 | ) | |
| Foreign currency | | | 18,932 | | |
| Net gain (loss) on investments | | | 3,044,549 | | |
| Net increase (decrease) in net assets resulting from operations | | $ | 3,145,786 | | |
See Notes to Financial Statements 13
Statements of Changes in Net Assets
Neuberger Berman Advisers Management Trust
| | | BALANCED PORTFOLIO | |
| | | Year Ended
December 31,
2009 | | Year Ended
December 31,
2008 | |
| Increase (Decrease) in Net Assets: | |
| From Operations (Note A): | |
| Net investment income (loss) | | $ | 101,237 | | | $ | 425,214 | | |
| Net realized gain (loss) on investments | | | (2,246,432 | ) | | | 3,319,630 | | |
| Change in net unrealized appreciation (depreciation) of investments | | | 5,290,981 | | | | (20,260,861 | ) | |
| Net increase (decrease) in net assets resulting from operations | | | 3,145,786 | | | | (16,516,017 | ) | |
| Distributions to Shareholders From (Note A): | |
| Net investment income | | | (502,617 | ) | | | (836,556 | ) | |
| From Fund Share Transactions (Note D): | |
| Proceeds from shares sold | | | 351,956 | | | | 5,241,056 | | |
| Proceeds from reinvestment of dividends and distributions | | | 502,617 | | | | 836,556 | | |
| Payments for shares redeemed | | | (2,588,215 | ) | | | (51,583,340 | ) | |
| Net increase (decrease) from Fund share transactions | | | (1,733,642 | ) | | | (45,505,728 | ) | |
| Net Increase (Decrease) in Net Assets | | | 909,527 | | | | (62,858,301 | ) | |
| Net Assets: | |
| Beginning of year | | | 15,504,857 | | | | 78,363,158 | | |
| End of year | | $ | 16,414,384 | | | $ | 15,504,857 | | |
| Undistributed net investment income (loss) at end of year | | $ | 162,225 | | | $ | 498,378 | | |
See Notes to Financial Statements 14
Notes to Financial Statements Balanced Portfolio
Note A--Summary of Significant Accounting Policies:
1 General: The Fund is a separate operating series of Neuberger Berman Advisers Management Trust (the "Trust"), a Delaware statutory trust organized pursuant to a Trust Instrument dated May 23, 1994. The Trust is currently comprised of ten separate operating series (each a "Series," collectively, the "Funds") each of which is diversified. The Trust is registered as an open-end management investment company under the Investment Company Act of 1940, as amended (the "1940 Act"), and its shares are registered under the Securities Act of 1933, as amended. The Fund currently offers only Class I shares. The Board may establish additional series or classes of shares without the approval of shareholders.
The assets of each Series belong only to that Series, and the liabilities of each Series are borne solely by that Series and no other.
The preparation of financial statements in accordance with U.S. generally accepted accounting principles requires Management to make estimates and assumptions at the date of the financial statements. Actual results could differ from those estimates.
2 Portfolio valuation: Investment securities are valued as indicated in the notes following the Schedule of Investments.
3 Foreign currency translation: The accounting records of the Fund are maintained in U.S. dollars. Foreign currency amounts are currently translated into U.S. dollars using the exchange rates as of 4:00 p.m., Eastern time, to determine the value of investments, other assets and liabilities. Purchase and sale prices of securities, and income and expenses, are translated into U.S. dollars at the prevailing rate of exchange on the respective dates of such transactions. Net unrealized foreign currency gain (loss), if any, arises from changes in the value of assets and liabilities, other than investments in securities, as a result of changes in exchange rates and is stated separately in the Statement of Operations.
4 Securities transactions and investment income: Securities transactions are recorded on trade date for financial reporting purposes. Dividend income is recorded on the ex-dividend date or, for certain foreign dividends, as soon as the Fund becomes aware of the dividends. Non-cash dividends included in dividend income, if any, are recorded at the fair market value of the securities received. Interest income, including accretion of discount (adjusted for original issue discount, where applicable) and accretion of market discount on long-term bonds and short-term investments, is recorded on the accrual basis. Realized gains and losses from securities transactions and foreign currency transactions, if any, are recorded on the basis of identified cost and stated separately in the Statement of Operations. Included in net realized gain (loss) on investments are proceeds from the settlements of class action litigation in which the Fund participated as a class member. The amount of such proceeds for the year ended December 31, 2009 was $11,610.
5 Income tax information: The Funds are treated as separate entities for U.S. federal income tax purposes. It is the policy of the Fund to continue to qualify as a regulated investment company by complying with the requirements of Subchapter M of the Internal Revenue Code applicable to regulated investment companies and to distribute substantially all of its earnings to its shareholders. Therefore, no federal income or excise tax provision is required.
The Fund has adopted the provisions of ASC 740 "Income Taxes" ("ASC 740"), formerly known as FASB Interpretation No. 48 "Accounting for Uncertainty in Income Taxes -- an interpretation of FASB Statement No. 109." ASC 740 sets forth a minimum threshold for financial statement recognition of the benefit of a tax position taken, or expected to be taken, in a tax return. The Fund recognizes interest and penalties, if any, related to unrecognized tax benefits as an income tax expense in the Statement of Operations. The Fund is subject to examination by U.S. federal and state tax authorities for returns filed for the prior three fiscal years 2006 - 2008. As of December 31, 2009, the Fund did not have any unrecognized tax benefits.
15
Income distributions and capital gain distributions are determined in accordance with income tax regulations, which may differ from U.S. generally accepted accounting principles. These differences are primarily due to differing treatments of income and gains on various investment securities held by the Fund, timing differences and differing characterization of distributions made by the Fund as a whole. The Fund may also utilize earnings and profits distributed to shareholders on redemption of shares as a part of the dividends paid deduction for income tax purposes.
As determined on December 31, 2009, permanent differences resulting primarily from different book and tax accounting for paydown gains and losses, amortization of bond premium, partnership basis adjustments and expiration of capital loss carryforwards, were reclassified at fiscal year-end. These reclassifications had no effect on net income, net asset value or net asset value per share of the Fund.
The tax character of distributions paid during the years ended December 31, 2009 and December 31, 2008 was as follows:
| | | Distributions Paid From: | |
| | | Ordinary Income | | Total | |
| | | 2009 | | 2008 | | 2009 | | 2008 | |
| | | $ | 502,617 | | | $ | 836,556 | | | $ | 502,617 | | | $ | 836,556 | | |
As of December 31, 2009, the components of distributable earnings (accumulated losses) on a U.S. federal income tax basis were as follows:
Undistributed
Ordinary
Income | | Unrealized
Appreciation
(Depreciation) | | Loss
Carryforwards
and Deferrals | | Total | |
| $ | 162,225 | | | $ | 1,013,215 | | | $ | (16,456,202 | ) | | $ | (15,280,762 | ) | |
The difference between book basis and tax basis distributable earnings is attributable primarily to timing differences of wash sales, mark to market on certain futures contracts, amortization of bond premium, partnership basis adjustments and capital loss carryforwards.
To the extent the Fund's net realized capital gains, if any, can be offset by capital loss carryforwards, it is the policy of the Fund not to distribute such gains. As determined at December 31, 2009, the Fund had unused capital loss carryforwards available for federal income tax purposes to offset net realized capital gains, if any, as follows:
| | | Expiring in: | |
| | | 2010 | | 2017 | |
| | | $ | 13,734,011 | | | $ | 2,722,191 | | |
Under current tax law, the use of these losses to offset future gains may be limited.
The Fund had $2,806,578 of capital loss carryforwards that expired during the year ended December 31, 2009.
6 Distributions to shareholders: The Fund may earn income, net of expenses, daily on its investments. Distributions from net investment income and net realized capital gains, if any, generally are distributed in October. Income distributions and capital gain distributions to shareholders are recorded on the ex-date.
7 Foreign taxes: Foreign taxes withheld represent amounts withheld by foreign tax authorities, net of refunds recoverable.
8 Expense allocation: Certain expenses are applicable to multiple funds. Expenses directly attributable to a Series are charged to that Series. Expenses of the Trust that are not directly attributed to a Series are allocated among the Funds, on the basis of relative net assets, except where a more appropriate allocation of expenses to each of the Funds can otherwise be made fairly. Expenses borne by the complex of related investment companies, which includes open-end and closed-end investment companies for which Management serves as investment manager, that are not directly attributed to a Series or the Trust are allocated among the Fund and the other investment
16
companies in the complex or series thereof on the basis of relative net assets, except where a more appropriate allocation of expenses to each investment company in the complex or series thereof can otherwise be made fairly.
9 Security lending: A third party, eSecLending, serves as exclusive lending agent for the Fund. eSecLending, as agent, has assisted the Fund in conducting bidding processes to try to identify a principal that would pay a guaranteed amount to the Fund in consideration of the Fund entering into an exclusive securities lending arrangement. During the fiscal year, no principal had an exclusive securities lending arrangement with the Fund; as such, the Fund was not guaranteed any particular level of income.
Under the securities lending arrangement, the Fund receives cash collateral at the beginning of each transaction equal to at least 102% of the prior day's market value of the loaned securities (105% in the case of international securities). The Fund may invest all the cash collateral in Neuberger Berman Securities Lending Quality Fund, LLC ("Quality Fund"), a fund managed by Neuberger Berman Fixed Income LLC (formerly known as Lehman Brothers Asset Management LLC) ("NBFI") an affiliate of Management. Effective July 1, 2009, Dwight Asset Management Company LLC became the Sub-Adviser to the Quality Fund. The Quality Fund is not a money market fund that is registered under the 1940 Act and does not operate in accordance with all requirements of Rule 2a-7 under the 1940 Act. There is no assurance that the Quality Fund will maintain a $1.00 share price.
The market value of the Fund's investments in the Quality Fund as of the fiscal year ended December 31, 2009, if any, is reflected in the Fund's Schedule of Investments. If it were necessary to liquidate assets in the Quality Fund to meet returns on outstanding securities loans at a time when the Quality Fund's price per share was less than $1.00, the Fund may not receive an amount from the Quality Fund that is equal in amount to the collateral the Fund would be required to return to the borrower of the securities and the Fund would be required to make up for this shortfall. In addition, as a result of recent reduced liquidity in the credit and fixed income markets, it may be difficult to dispose quickly of some securities in the Quality Fund at the price at which the Quality Fund is carrying them.
Net income from the lending program represents any amounts received from a principal plus income earned on the cash collateral invested in Quality Fund or in other investments, if applicable, less cash collateral fees and other expenses associated with the loans. For the fiscal year ended December 31, 2009, the Fund received net income under the securities lending arrangement of approximately $3,205, which is reflected in the Statement of Operations under the caption "Income from securities loaned -- net." For the fiscal year ended December 31, 2009, "Income from securities loaned -- net" consisted of approximately $4,239 in income earned on cash collateral and amounts received from a principal (including approximately $1,463 of interest income earned from the Quality Fund), less fees and expenses paid of approximately $1,034.
10 Repurchase agreements: The Fund may enter into repurchase agreements with institutions that Management has determined are creditworthy. Each repurchase agreement is recorded at cost. The Fund requires that the securities purchased in a repurchase agreement be transferred to the custodian in a manner sufficient to enable the Fund to assert a perfected security interest in those securities in the event of a default under the repurchase agreement. The Fund monitors, on a daily basis, the value of the securities transferred to ensure that their value, including accrued interest, is greater than amounts owed to the Fund under each such repurchase agreement.
11 Transactions with other funds managed by Neuberger Berman Management LLC: Pursuant to an Exemptive Order issued by the Securities and Exchange Commission, the Fund may invest in a money market fund managed by Management or an affiliate. Through August 10, 2009, the Fund invested in Neuberger Berman Prime Money Fund ("Prime Money"), as approved by the Board. Prime Money sought to provide the highest available current income consistent with safety and liquidity. For any cash that the Fund invested in Prime Money, Management waived a portion of its management fee equal to the management fee it received from Prime Money on those assets (the "Arrangement"). For the year ended December 31, 2009, management fees waived under this Arrangement amounted to $335 and are reflected in the Statement of Operations under the caption "Investment management fees waived." For the year ended December 31, 2009, income earned under this Arrangement amounted to $693 and is reflected in the Statement of Operations under the caption "Income from investments in affiliated issuers."
17
On August 10, 2009, the Fund ceased investing in Prime Money. On this date, the Fund's shares of Prime Money were redeemed in exchange for portfolio holdings of Prime Money, which were used to purchase Institutional Class shares of State Street Institutional Liquid Reserves Fund.
12 Dollar rolls: The Fund may enter into dollar roll transactions with respect to mortgage-backed securities. In a dollar roll transaction, the Fund sells securities for delivery in the current month and simultaneously agrees to repurchase substantially similar (i.e., same type and coupon) securities on a specified future date from the same party. During the period before the repurchase, the Fund foregoes principal and interest payments on the securities. The Fund is compensated by the difference between the current sales price and the forward price for the future purchase (often referred to as the "drop"), as well as by the interest earned on the cash proceeds of the initial sale. Dollar rolls may increase fluctuations in the Fund's net asset value and may be viewed as a form of leverage. There is a risk that the counter party will be unable or unwilling to complete the transaction as scheduled, which may result in losses to the Fund.
13 Investments in foreign securities: Investing in foreign securities may involve certain sovereign and other risks, in addition to the credit and market risks normally associated with domestic securities. These additional risks include the possibility of adverse political and economic developments (including political instability, nationalization, expropriation, or confiscatory taxation) and the potentially adverse effects of unavailability of public information regarding issuers, less governmental supervision and regulation of financial markets, reduced liquidity of certain financial markets, and the lack of uniform accounting, auditing, and financial reporting standards or the application of standards that are different or less stringent than those applied in the United States. Foreign securities also may experience greater price volatility, higher rates of inflation, and delays in settlement.
14 Derivative instruments: During the fiscal period ended December 31, 2009, the Fund's use of derivatives was limited to financial futures contracts. The Fund adopted ASC 815 "Derivatives and Hedging" ("ASC 815"), formerly known as FASB Statement of Financial Accounting Standards No. 161 "Disclosures about Derivative Instruments and Hedging Activities," effective January 1, 2009.
Financial futures contracts: The Fund may buy and sell financial futures contracts to hedge against changes in securities prices resulting from changes in prevailing interest rates. At the time the Fund enters into a financial futures contract, it is required to deposit with the futures commission merchant a specified amount of cash or liquid securities, known as "initial margin," ranging upward from 1.1% of the value of the financial futures contract being traded. Each day, the futures contract is valued at the official settlement price of the board of trade or U.S. commodity exchange on which such futures contract is traded. Subsequent payments, known as "variation margin," to and from the broker are made on a daily basis as the market price of the financial futures contract fluctuates. Daily variation margin adjustments, arising from this "mark to market," are recorded by the Fund as unrealized gains or losses.
Although some financial futures contracts by their terms call for actual delivery or acceptance of financial instruments, in most cases the contracts are closed out prior to delivery by offsetting purchases or sales of matching financial futures contracts. When the contracts are closed, the Fund recognizes a gain or loss. Risks of entering into futures contracts include the possibility there may be an illiquid market, possibly at a time of rapidly declining prices, and/or a change in the value of the contract may not correlate with changes in the value of the underlying securities. Futures have minimal counterparty risk to the Fund since the exchange's clearinghouse, as counterparty to all exchange traded futures, guarantees the futures against default.
For U.S. federal income tax purposes, the futures transactions undertaken by the Fund may cause the Fund to recognize gains or losses from marking contracts to market even though its positions have not been sold or terminated, may affect the character of the gains or losses recognized as long-term or short-term, and may affect the timing of some capital gains and losses realized by the Fund. Also, the Fund's losses on transactions involving futures contracts may be deferred rather than being taken into account currently in calculating the Fund's taxable income.
18
During the year ended December 31, 2009, the Fund entered into financial futures contracts. At December 31, 2009, open positions in financial futures contracts were:
| Expiration | | Open Contracts | | Position | | Unrealized
Depreciation | |
| March 2010 | | 2 U.S. Treasury Notes, 2 Year | | Long | | $ | (1,172 | ) | |
For the year ended December 31, 2009, the Fund invested in open futures contracts with notional amounts ranging from $200,000 to $1,200,000. At December 31, 2009, the Fund had deposited $55,048 in Fannie Mae Whole Loan, 10.61%, due 1/4/10, to cover margin requirements on open futures contracts.
At December 31, 2009, the Fund had the following derivatives (not designated as hedging instruments under ASC 815), for open contracts grouped by primary risk exposure:
Liability Derivatives
| | | Interest Rate
Risk | |
| Futures Contracts(1) | | $ | (1,172 | ) | |
| Total Value | | $ | (1,172 | ) | |
(1) Statement of Assets and Liabilities location: Cumulative appreciation (depreciation) of futures contracts is shown in "Futures Contracts" above and is included in Net unrealized appreciation (depreciation) in value of investments within the Statement of Assets and Liabilities. Only current day's variation margin, if any, is reported within the Statement of Assets and Liabilities: Payable for variation margin on open futures contracts.
The impact of these derivative instruments on the Statement of Operations during the year ended December 31, 2009, was as follows:
Realized Gain (Loss)(1)
| | | Interest Rate
Risk | |
| Futures Contracts | | $ | 35,540 | | |
| Total Realized Gain (Loss) | | $ | 35,540 | | |
Change in Appreciation (Depreciation)(2)
| | | Interest Rate
Risk | |
| Futures Contracts | | $ | (21,843 | ) | |
| Total Change in Appreciation (Depreciation) | | $ | (21,843 | ) | |
(1) Statement of Operations location: Net realized gain (loss) on financial futures contracts.
(2) Statement of Operations location: Change in net unrealized appreciation (depreciation) in value of financial futures contracts.
15 Indemnifications: Like many other companies, the Trust's organizational documents provide that its officers and trustees are indemnified against certain liabilities arising out of the performance of their duties to the Trust. In addition, both in some of its principal service contracts and in the normal course of its business, the Trust enters into contracts that provide indemnifications to other parties for certain types of losses or liabilities. The Trust's maximum exposure under these arrangements is unknown as this could involve future claims against the Trust.
19
Note B--Management Fees, Administration Fees, Distribution Arrangements, and Other Transactions With Affiliates:
Fund shares are issued and redeemed in connection with investments in and payments under certain variable annuity contracts and variable life insurance policies issued through separate accounts of life insurance companies and are also offered directly to qualified pension and retirement plans.
The Fund retains Management as its investment manager under a Management Agreement. For such investment management services, the Fund pays Management a fee at the annual rate of 0.55% of the first $250 million of the Fund's average daily net assets, 0.525% of the next $250 million, 0.50% of the next $250 million, 0.475% of the next $250 million, 0.45% of the next $500 million, 0.425% of the next $2.5 billion, and 0.40% of average daily net assets in excess of $4 billion.
The Fund retains Management as its administrator under an Administration Agreement. The Fund pays Management an administration fee at the annual rate of 0.30% of its average daily net assets under this agreement. Additionally, Management retains State Street Bank and Trust Company ("State Street") as its sub-administrator under a Sub-Administration Agreement. Management pays State Street a fee for all services received under this agreement.
The Board adopted a non-fee distribution plan for the Fund.
Management has contractually undertaken through December 31, 2012 to forgo current payment of fees and/or reimburse the Fund for its operating expenses (excluding the fees payable to Management, interest, taxes, brokerage commissions, extraordinary expenses, and transaction costs) ("Operating Expenses") which exceed, in the aggregate, 1.00% per annum of the Fund's average daily net assets (the "Expense Limitation"). For the year ended December 31, 2009, such excess expenses amounted to $27,368. The Fund has agreed to repay Management through December 31, 2015 for fees and expenses foregone and/or its excess Operating Expenses previously reimbursed by Management, so long as its annual Operating Expenses during that period do not exceed its Expense Limitation, and the repayment is made within three years after the year in which Management issued the reimbursement or waived fees. During the year ended December 31, 2009, there was no repayment to Management under this agreement. At December 31, 2009, contingent liabilities to Management under this agreement were as follows:
| | | Expiring in: | |
| | | 2012 | |
| | | $ | 27,368 | | |
Neuberger Berman LLC (formerly known as Neuberger Berman, LLC) ("Neuberger") is retained by Management to furnish it with investment recommendations and research information without added cost to the Fund. Several individuals who are officers and/or trustees of the Trust are also employees of Neuberger and/or Management.
During the reporting period, the predecessor of Management, the investment manager of the Fund, and Neuberger, the sub-adviser of the Fund, were wholly owned subsidiaries of Lehman Brothers Holdings Inc. ("Lehman Brothers"), a publicly owned holding company. On September 15, 2008, Lehman Brothers filed a voluntary petition under Chapter 11 of the U.S. Bankruptcy Code. On December 3, 2008, NBSH Acquisition, LLC ("NBSH"), an entity organized by key members of Neuberger Berman's senior management, was selected as the successful bidder in the public auction to acquire a majority interest in Neuberger Berman's business and the fixed income and certain alternative asset management businesses of Lehman Brothers' Investment Management Division (together with Neuberger Berman, the "Acquired Businesses") (the "Acquisition"). On December 22, 2008, the bankruptcy court having jurisdiction over the Lehman Brothers matter approved the sale of the Acquired Businesses to NBSH (or its successor or assign), as the successful bidder.
The Acquisition closed on May 4, 2009. The Acquired Businesses are now indirectly owned by, among others, portfolio managers, Neuberger Berman's management team, and certain key members and senior professionals
20
who are employed in various parts of the Neuberger Berman complex of companies, with a minority interest retained by Lehman Brothers and certain affiliates of Lehman Brothers.
The closing of the Acquisition resulted in an "assignment" of the Fund's Management Agreement and Sub-Advisory Agreement. Such an assignment, by law, automatically terminated those agreements. Accordingly, prior to the closing, the Board, including the Trustees who are not "interested persons" of the Fund's investment manager and its affiliates or the Fund, considered and approved a new Management Agreement and Sub-Advisory Agreement for the Fund. The new agreements, which are virtually identical to those previously in effect, were also approved by a vote of the Fund's shareholders.
These events have not had a material impact on the Fund or its operations. Management and Neuberger continue to operate in the ordinary course of business as the investment manager and sub-adviser of the Fund.
The Fund has an expense offset arrangement in connection with its custodian contract. For the year ended December 31, 2009, the impact of this arrangement was a reduction of expenses of $26.
Note C--Securities Transactions:
Cost of purchases and proceeds of sales and maturities of long-term securities (excluding short-term securities and financial futures contracts) for the year ended December 31, 2009 were as follows:
Purchases of
U.S. Government
and Agency
Obligations | | Purchases excluding
U.S. Government
and Agency
Obligations | | Sales and Maturities
of U.S. Government
and Agency
Obligations | | Sales and Maturities
excluding
U.S. Government
and Agency
Obligations | |
| $ | 3,946,303 | | | $ | 8,322,458 | | | $ | 799,426 | | | $ | 13,059,784 | | |
During the year ended December 31, 2009, no brokerage commissions on securities transactions were paid to affiliated brokers.
Note D--Fund Share Transactions:
Share activity for the years ended December 31, 2009 and December 31, 2008 was as follows:
| | | For the Year Ended December 31, | |
| | | 2009 | | 2008 | |
| Shares Sold | | | 42,797 | | | | 436,916 | | |
| Shares Issued on Reinvestment of Dividends and Distributions | | | 57,377 | | | | 99,828 | | |
| Shares Redeemed | | | (321,180 | ) | | | (4,480,615 | ) | |
| Total | | | (221,006 | ) | | | (3,943,871 | ) | |
Note E--Line of Credit:
At December 31, 2009, the Fund was a participant in a single committed, unsecured $150,000,000 line of credit with State Street, to be used only for temporary or emergency purposes. Other investment companies managed by Management also participate in this line of credit on the same terms. Interest is charged on borrowings under this line of credit at the higher of (a) the Federal Funds Rate plus 1.25% per annum or (b) the Overnight LIBOR Rate plus 1.25% per annum. Prior to September 18, 2009, interest was charged on borrowings under this line of credit at the Federal Funds Rate plus 0.50% per annum. A facility fee of 0.15% (prior to September 18, 2009, 0.09%) per annum of the available line of credit is charged, of which the Fund has agreed to pay its pro rata share, based on the ratio of its individual net assets to the net assets of all participants at the time the fee is due and payable. The fee is paid quarterly in arrears. Because several investment companies participate, there is no assurance that an individual
21
Fund will have access to all or any part of the $150,000,000 at any particular time. There were no loans outstanding pursuant to this line of credit at December 31, 2009. During the year ended December 31, 2009, the Fund did not utilize this line of credit.
Note F--Investments in Affiliates:
| Name of Issuer | | Balance of
Shares
Held
December 31,
2008 | | Gross
Purchases
and
Additions | | Gross
Sales
and
Reductions | | Balance of
Shares
Held
December 31,
2009 | | Value
December 31,
2009 | | Income from
Investments in
Affiliated
Issuers
Included in
Total Income | |
Neuberger Berman Prime
Money Fund Trust Class* | | | 313,321 | | | | 3,322,918 | | | | 3,636,239 | | | | -- | | | $ | -- | | | $ | 693 | | |
Neuberger Berman Securities
Lending Quality Fund, LLC** | | | -- | | | | 671,522 | | | | 510,491 | | | | 161,031 | | | | 164,252 | | | | 1,463 | | |
| Total | | | | | | | | | | $ | 164,252 | | | $ | 2,156 | | |
* Prime Money was also managed by Management and may have been considered an affiliate since it had the same officers, Board members, and investment manager as the Fund and because, at times, the Fund may have owned 5% or more of the outstanding voting securities of Prime Money.
** Quality Fund, a fund managed by NBFI, an affiliate of Management, is used to invest cash the Fund receives as collateral for securities loaned as approved by the Board. Because all shares of Quality Fund are held by funds in the related investment management complex, Quality Fund may be considered an affiliate of the Fund.
Note G--Subsequent Events:
In accordance with the provision set forth in ASC 855 "Subsequent Events" ("ASC 855") formerly known as FAS 165, "Subsequent Events," Management has evaluated the possibility of subsequent events existing in the Fund's financial statements through February 9, 2010. Management has determined that there are no subsequent events that, in accordance with ASC 855, would need to be disclosed in the Fund's financial statements through this date.
22
Financial Highlights
Balanced Portfolio
The following table includes selected data for a share outstanding throughout each year and other performance information derived from the Financial Statements.
| | | Year Ended December 31, | |
| | | 2009 | | 2008 | | 2007 | | 2006 | | 2005 | |
| Net Asset Value, Beginning of Year | | $ | 7.58 | | | $ | 13.08 | | | $ | 11.44 | | | $ | 10.42 | | | $ | 9.64 | | |
| Income From Investment Operations: | |
| Net Investment Income (Loss)tt | | | .05 | | | | .09 | | | | .12 | | | | .11 | | | | .04 | | |
Net Gains or Losses on Securities
(both realized and unrealized) | | | 1.65 | | | | (5.17 | ) | | | 1.67 | | | | 1.00 | | | | .84 | | |
| Total From Investment Operations | | | 1.70 | | | | (5.08 | ) | | | 1.79 | | | | 1.11 | | | | .88 | | |
| Less Distributions From: | |
| Net Investment Income | | | (.28 | ) | | | (.42 | ) | | | (.15 | ) | | | (.09 | ) | | | (.10 | ) | |
| Net Asset Value, End of Year | | $ | 9.00 | | | $ | 7.58 | | | $ | 13.08 | | | $ | 11.44 | | | $ | 10.42 | | |
| Total Returntt | | | 22.47 | % | | | (39.15 | )% | | | 15.60 | % | | | 10.67 | % | | | 9.18 | % | |
| Ratios/Supplemental Data | |
| Net Assets, End of Year (in millions) | | $ | 16.4 | | | $ | 15.5 | | | $ | 78.4 | | | $ | 72.3 | | | $ | 73.7 | | |
| Ratio of Gross Expenses to Average Net Assets# | | | 1.86 | % | | | 1.29 | % | | | 1.16 | % | | | 1.19 | % | | | 1.14 | % | |
| Ratio of Net Expenses to Average Net AssetsS | | | 1.86 | % | | | 1.29 | % | | | 1.16 | % | | | 1.18 | % | | | 1.13 | % | |
Ratio of Net Investment Income (Loss) to Average
Net Assets | | | .66 | % | | | .81 | % | | | 1.00 | % | | | 1.01 | % | | | .41 | % | |
| Portfolio Turnover Rate | | | 85 | % | | | 57 | % | | | 54 | % | | | 62 | % | | | 82 | % | |
See Notes to Financial Highlights 23
Notes to Financial Highlights Balanced Portfolio
tt Total return based on per share net asset value reflects the effects of changes in net asset value on the performance of the Fund during each fiscal period and assumes dividends and other distributions, if any, were reinvested. Results represent past performance and do not guarantee future results. Current returns may be lower or higher than the performance data quoted. Investment returns and principal may fluctuate and shares when redeemed may be worth more or less than original cost. Total return would have been lower if Management had not reimbursed and/or waived certain expenses. The total return information shown does not reflect charges and other expenses that apply to the separate account or the related insurance policies, and the inclusion of these charges and other expenses would reduce the total return for all fiscal periods shown. For the year ended December 31, 2006, Management reimbursed the Fund for losses incurred in connection with the disposition of foreign currency contracts, which had no impact on total return.
# The Fund is required to calculate an expense ratio without taking into consideration any expense reductions related to expense offset arrangements.
tt Calculated based on the average number of shares outstanding during each fiscal period.
S After reimbursement and/or waiver of a portion of the investment management fee by Management. Had Management not undertaken such actions, the annualized ratios of net expenses to average net assets would have been:
| | | Year Ended December 31, | |
| 2009 | | 2008 | | 2007 | | 2006 | | 2005 | |
| | 2.04 | % | | | 1.29 | % | | | 1.16 | % | | | 1.18 | % | | | 1.13 | % | |
24
Report of Independent Registered Public Accounting Firm
To the Board of Trustees of
Neuberger Berman Advisers Management Trust and
Shareholders of Balanced Portfolio
We have audited the accompanying statement of assets and liabilities, including the schedule of investments, of Balanced Portfolio, one of the series constituting Neuberger Berman Advisers Management Trust (the "Trust"), as of December 31, 2009, and the related statement of operations for the year then ended, the statement of changes in net assets for each of the two years in the period then ended, and the financial highlights for each of the five years in the period then ended. These financial statements and financial highlights are the responsibility of the Trust's management. Our responsibility is to express an opinion on these financial statements and financial highlights based on our audits.
We conducted our audits in accordance with the standards of the Public Company Accounting Oversight Board (United States). Those standards require that we plan and perform the audit to obtain reasonable assurance about whether the financial statements and financial highlights are free of material misstatement. We were not engaged to perform an audit of the Trust's internal control over financial reporting. Our audits included consideration of internal control over financial reporting as a basis for designing audit procedures that are appropriate in the circumstances, but not for the purpose of expressing an opinion on the effectiveness of the Trust's internal control over financial reporting. Accordingly, we express no such opinion. An audit also includes examining, on a test basis, evidence supporting the amounts and disclosures in the financial statements and financial highlights, assessing the accounting principles used and significant estimates made by management, and evaluating the overall financial statement presentation. Our procedures included confirmation of securities owned as of December 31, 2009 by correspondence with the custodian and brokers. We believe that our audits provide a reasonable basis for our opinion.
In our opinion, the financial statements and financial highlights referred to above present fairly, in all material respects, the financial position of Balanced Portfolio, a series of Neuberger Berman Advisers Management Trust, at December 31, 2009, the results of its operations for the year then ended, the changes in its net assets for each of the two years in the period then ended, and the financial highlights for each of the five years in the period then ended, in conformity with U.S. generally accepted accounting principles.

Boston, Massachusetts
February 9, 2010
25
Trustee and Officer Information
The following tables set forth information concerning the trustees and officers of the Trust. All persons named as trustees and officers also serve in similar capacities for other funds administered or managed by Management and Neuberger. The Statement of Additional Information includes additional information about fund trustees and is available upon request, without charge, by calling (800) 877-9700.
Information about the Board of Trustees
Name, (Year of Birth),
and Address(1) | | Position and
Length of
Time Served(2) | | Principal Occupation(s)(3) | | Number of
Funds in Fund
Complex
Overseen by
Fund Trustee | | Other Directorships
Held Outside Fund
Complex by Fund
Trustee | |
| Independent Fund Trustees | |
|
| John Cannon (1930) | | Trustee since 2000 | | Consultant; formerly, Chairman, CDC Investment Advisers (registered investment adviser), 1993 to January 1999; formerly, President and Chief Executive Officer, AMA Investment Advisors, an affiliate of the American Medical Association. | | | 46 | | | Formerly, Independent Trustee or Director of three series of Oppenheimer Funds: Oppenheimer Limited Term New York Municipal Fund, Rochester Fund Municipals, and Oppenheimer Convertible Securities Fund (1992 to 2009). | |
|
| Faith Colish (1935) | | Trustee since 1982 | | Counsel, Carter Ledyard & Milburn LLP (law firm) since October 2002; formerly, Attorney-at-Law and President, Faith Colish, A Professional Corporation, 1980 to 2002. | | | 46 | | | Formerly, Director (1997 to 2003) and Advisory Director (2003 to 2006), ABA Retirement Funds (formerly, American Bar Retirement Association) (not-for-profit membership corporation). | |
|
26
Name, (Year of Birth),
and Address(1) | | Position and
Length of
Time Served(2) | | Principal Occupation(s)(3) | | Number of
Funds in Fund
Complex
Overseen by
Fund Trustee | | Other Directorships
Held Outside Fund
Complex by Fund
Trustee | |
| Martha C. Goss (1949) | | Trustee since 2007 | | President, Woodhill Enterprises Inc./Chase Hollow Associates LLC (personal investment vehicle), since 2006; Chief Operating and Financial Officer, Hopewell Holdings LLC/Amwell Holdings, LLC (a holding company for a healthcare reinsurance company start-up), since 2003; formerly, Consultant, Resources Connection (temporary staffing), 2002 to 2006. | | | 46 | | | Director, Ocwen Financial Corporation (mortgage servicing), since 2005; Director, American Water (water utility), since 2003; Director, Channel Reinsurance (financial guaranty reinsurance), since 2006; Advisory Board Member, Attensity (software developer), since 2005; Director, Allianz Life of New York (insurance), since 2005; Director, Financial Women's Association of New York (not for profit association), since 2003; Trustee Emerita, Brown University, since 1998. | |
|
| C. Anne Harvey (1937) | | Trustee since 1998 | | President, C.A. Harvey Associates, since October 2001; formerly, Director, AARP, 1978 to December 2001. | | | 46 | | | Formerly, President, Board of Associates to The National Rehabilitation Hospital's Board of Directors, 2001 to 2002; formerly, Member, Individual Investors Advisory Committee to the New York Stock Exchange Board of Directors, 1998 to June 2002. | |
|
| Robert A. Kavesh (1927) | | Trustee since 2000 | | Retired; Marcus Nadler Professor Emeritus of Finance and Economics, New York University Stern School of Business; formerly, Executive Secretary-Treasurer, American Finance Association, 1961 to 1979. | | | 46 | | | Formerly, Director, The Caring Community (not-for-profit), 1997 to 2006; formerly, Director, DEL Laboratories, Inc. (cosmetics and pharmaceuticals), 1978 to 2004; formerly, Director, Apple Bank for Savings, 1979 to 1990; formerly, Director, Western Pacific Industries, Inc., 1972 to 1986 (public company). | |
|
27
Name, (Year of Birth),
and Address(1) | | Position and
Length of
Time Served(2) | | Principal Occupation(s)(3) | | Number of
Funds in Fund
Complex
Overseen by
Fund Trustee | | Other Directorships
Held Outside Fund
Complex by Fund
Trustee | |
| Michael M. Knetter (1960) | | Trustee since 2007 | | Dean, School of Business, University of Wisconsin - Madison; formerly, Professor of International Economics and Associate Dean, Amos Tuck School of Business - Dartmouth College, 1998 to 2002. | | | 46 | | | Trustee, Northwestern Mutual Series Fund, Inc., since February 2007; Director, Wausau Paper, since 2005; Director, Great Wolf Resorts, since 2004. | |
|
| Howard A. Mileaf (1937) | | Trustee since 1999 | | Retired; formerly, Vice President and General Counsel, WHX Corporation (holding company), 1993 to 2001. | | | 46 | | | Formerly, Director, Webfinancial Corporation (holding company), 2002 to 2008; formerly, Director WHX Corporation (holding company), January 2002 to June 2005; formerly, Director, State Theatre of New Jersey (not-for-profit theater), 2000 to 2005. | |
|
| George W. Morriss (1947) | | Trustee since 2007 | | Retired; formerly, Executive Vice President and Chief Financial Officer, People's Bank, Connecticut (a financial services company), 1991 to 2001. | | | 46 | | | Manager, Old Mutual 2100 fund complex (consisting of six funds) since October 2006 for four funds and since February 2007 for two funds; formerly, Member NASDAQ Issuers' Affairs Committee, 1995 to 2003. | |
|
| Edward I. O'Brien (1928) | | Trustee since 2000 | | Retired; Formerly, Member, Investment Policy Committee, Edward Jones, 1993 to 2001; President, Securities Industry Association ("SIA") (securities industry's representative in government relations and regulatory matters at the federal and state levels), 1974 to 1992; Adviser to SIA, November 1992 to November 1993. | | | 46 | | | Formerly, Director, Legg Mason, Inc. (financial services holding company), 1993 to July 2008; formerly, Director, Boston Financial Group (real estate and tax shelters), 1993 to 1999. | |
|
28
Name, (Year of Birth),
and Address(1) | | Position and
Length of
Time Served(2) | | Principal Occupation(s)(3) | | Number of
Funds in Fund
Complex
Overseen by
Fund Trustee | | Other Directorships
Held Outside Fund
Complex by Fund
Trustee | |
| Cornelius T. Ryan (1931) | | Trustee since 2000 | | Founding General Partner, Oxford Partners and Oxford Bioscience Partners (venture capital investing) and President, Oxford Venture Corporation, since 1981. | | | 46 | | | None. | |
|
| Tom D. Seip (1950) | | Trustee since 2000; Chairman of the Board since 2008; Lead Independent Trustee from 2006 to 2008 | | General Partner, Seip Investments LP (a private investment partnership); formerly, President and CEO, Westaff, Inc. (temporary staffing), May 2001 to January 2002; formerly, Senior Executive at the Charles Schwab Corporation, 1983 to 1998, including Chief Executive Officer, Charles Schwab Investment Management, Inc., and Trustee, Schwab Family of Funds and Schwab Investments, 1997 to 1998, and Executive Vice President-Retail Brokerage, Charles Schwab & Co., Inc., 1994 to 1997. | | | 46 | | | Director, H&R Block, Inc. (financial services company), since May 2001; Chairman, Compensation Committee, H&R Block, Inc., since 2006; formerly, Director, Forward Management, Inc. (asset management company), 1999 to 2006. | |
|
29
Name, (Year of Birth),
and Address(1) | | Position and
Length of
Time Served(2) | | Principal Occupation(s)(3) | | Number of
Funds in Fund
Complex
Overseen by
Fund Trustee | | Other Directorships
Held Outside Fund
Complex by Fund
Trustee | |
| Candace L. Straight (1947) | | Trustee since 1999 | | Private investor and consultant specializing in the insurance industry; formerly, Advisory Director, Securitas Capital LLC (a global private equity investment firm dedicated to making investments in the insurance sector), 1998 to December 2003. | | | 46 | | | Director, Montpelier Re (reinsurance company), since 2006; formerly, Director, National Atlantic Holdings Corporation (property and casualty insurance company), 2004 to 2008; formerly, Director, The Proformance Insurance Company (property and casualty insurance company), 2004 to 2008; formerly, Director, Providence Washington Insurance Company (property and casualty insurance company), December 1998 to March 2006; formerly, Director, Summit Global Partners (insurance brokerage firm), 2000 to 2005. | |
|
| Peter P. Trapp (1944) | | Trustee since 1984 | | Retired; formerly, Regional Manager for Mid-Southern Region, Ford Motor Credit Company, September 1997 to 2007; formerly, President, Ford Life Insurance Company, April 1995 to August 1997. | | | 46 | | | None. | |
|
30
Name, (Year of Birth),
and Address(1) | | Position and
Length of
Time Served(2) | | Principal Occupation(s)(3) | | Number of
Funds in Fund
Complex
Overseen by
Fund Trustee | | Other Directorships
Held Outside Fund
Complex by Fund
Trustee | |
| Fund Trustees who are "Interested Persons" | |
|
| Joseph V. Amato* (1962) | | Trustee since 2009 | | President and Director, Neuberger Berman Group LLC, since 2009; President and Chief Executive Officer, Neuberger and Neuberger Berman Holdings LLC (including its predecessor, Neuberger Berman Inc.), since 2007; Chief Investment Officer, Neuberger, since 2009; Chief Executive Officer (Equities) and Managing Director, Management, since 2009; Managing Director, Neuberger Berman Fixed Income LLC ("NBFI"), since 2007; Board member of NBFI since 2006; formerly, Global Head of Asset Management of Lehman Brothers Holdings Inc.'s ("LBHI") Investment Management division, 2006 to 2009; formerly, member of LBHI's Investment Management Division's Executive Management Committee, 2006 to 2009; formerly, Managing Director, Lehman Brothers Inc. ("LBI"), 2006 to 2008; formerly, Chief Recruiting and Development Officer, LBI, 2005 to 2006; formerly, Global Head of LBI's Equity Sales and a Member of its Equities Division Executive Committee, 2003 to 2005. | | | 46 | | | Member of Board of Advisors, McDonough School of Business, Georgetown University, since 2001; Member of New York City Board of Advisors, Teach for America, since 2005; Trustee, Montclair Kimberley Academy (private school), since 2007. | |
|
31
Name, (Year of Birth),
and Address(1) | | Position and
Length of
Time Served(2) | | Principal Occupation(s)(3) | | Number of
Funds in Fund
Complex
Overseen by
Fund Trustee | | Other Directorships
Held Outside Fund
Complex by Fund
Trustee | |
| Robert Conti* (1956) | | Chief Executive Officer, President and Trustee since 2008; prior thereto, Executive Vice President in 2008 and Vice President 2000 to 2008 | | Managing Director, Neuberger, since 2007; formerly, Senior Vice President, Neuberger, 2003 to 2006; formerly, Vice President, Neuberger, 1999 to 2003; President and Chief Executive Officer, Management, since 2008; formerly, Senior Vice President, Management, 2000 to 2008. | | | 46 | | | Chairman of the Board, Staten Island Mental Health Society since 2008. | |
|
| Jack L. Rivkin* (1940) | | Trustee since 2002; President from 2002 to 2008 | | Formerly, Executive Vice President and Chief Investment Officer, Neuberger Berman Holdings LLC (holding company), 2002 to August 2008 and 2003 to August 2008, respectively; formerly, Managing Director and Chief Investment Officer, Neuberger, December 2005 to August 2008 and 2003 to August 2008, respectively; formerly, Executive Vice President, Neuberger, December 2002 to 2005; formerly, Director and Chairman, Management, December 2002 to August 2008; formerly, Executive Vice President, Citigroup Investments, Inc., September 1995 to February 2002; formerly, Executive Vice President, Citigroup Inc., September 1995 to February 2002. | | | 46 | | | Director, Idealab (private company), since 2009; Director, Distributed World Power (private company), since 2009; Director, Dale Carnegie and Associates, Inc. (private company), since 1998; Director, Solbright, Inc. (private company), since 1997; formerly, Director, New York Society of Security Analysts (2006 to 2008). | |
|
(1) The business address of each listed person is 605 Third Avenue, New York, New York 10158.
(2) Pursuant to the Trust's Trust Instrument, each of these Fund Trustees shall hold office for life or until his or her successor is elected or the Trust terminates; except that (a) any Fund Trustee may resign by delivering a written resignation; (b) any Fund Trustee may be removed with or without cause at any time by a written instrument signed by at least two-thirds of the other Fund Trustees; (c) any Fund Trustee who requests to be retired, or who has become unable to serve, may be retired by a written instrument signed by a majority of the other Fund Trustees; and (d) any Fund Trustee may be removed at any shareholder meeting by a vote of at least two-thirds of the outstanding shares.
32
(3) Except as otherwise indicated, each individual has held the positions shown for at least the last five years.
* Indicates a Fund Trustee who is an "interested person" within the meaning of the 1940 Act. Mr. Amato and Mr. Conti are interested persons of the Trust by virtue of the fact that each is an officer of Management, Neuberger and/or their affiliates. Mr. Rivkin may be deemed an interested person of the Trust by virtue of the fact that, until August 2008, he was a director of Management and an officer of Neuberger.
33
Information about the Officers of the Trust
Name, (Year of Birth),
and Address(1) | | Position and
Length of Time
Served(2) | | Principal Occupation(s)(3) | |
| Andrew B. Allard (1961) | | Anti-Money Laundering Compliance Officer since 2002 | | Senior Vice President, Neuberger, since 2006; Deputy General Counsel, Neuberger, since 2004; formerly, Vice President, Neuberger, 2000 to 2005; formerly, Associate General Counsel, Neuberger, 1999 to 2004; Anti-Money Laundering Compliance Officer, nine registered investment companies for which Management acts as investment manager and administrator (six since 2002, two since 2003 and one since 2006). | |
|
| Claudia A. Brandon (1956) | | Executive Vice President since 2008 and Secretary since 1985 | | Senior Vice President, Neuberger, since 2007 and Employee since 1999; formerly, Vice President, Neuberger, 2002 to 2006; Senior Vice President, Management, since 2008 and Assistant Secretary since 2004; formerly, Vice President-Mutual Fund Board Relations, Management, 2000 to 2008; Executive Vice President, nine registered investment companies for which Management acts as investment manager and administrator (nine since 2008); Secretary, nine registered investment companies for which Management acts as investment manager and administrator (three since 1985, three since 2002, two since 2003 and one since 2006). | |
|
| Maxine L. Gerson (1950) | | Executive Vice President since 2008 and Chief Legal Officer since 2005 (only for purposes of sections 307 and 406 of the Sarbanes-Oxley Act of 2002) | | Senior Vice President, Neuberger, since 2002; Deputy General Counsel and Assistant Secretary, Neuberger, since 2001; Senior Vice President, Management, since 2006; Secretary and General Counsel, Management, since 2004; Executive Vice President, nine registered investment companies for which Management acts as investment manager and administrator (nine since 2008); Chief Legal Officer (only for purposes of sections 307 and 406 of the Sarbanes-Oxley Act of 2002), nine registered investment companies for which Management acts as investment manager and administrator (eight since 2005 and one since 2006). | |
|
| Sheila R. James (1965) | | Assistant Secretary since 2002 | | Vice President, Neuberger, since 2008 and Employee since 1999; formerly, Assistant Vice President, Neuberger, 2007; Assistant Secretary, nine registered investment companies for which Management acts as investment manager and administrator (six since 2002, two since 2003 and one since 2006). | |
|
| Brian Kerrane (1969) | | Vice President since 2008 | | Senior Vice President, Neuberger, since 2006; formerly, Vice President, Neuberger, 2002 to 2006; Vice President, Management, since 2008 and Employee since 1991; Vice President, nine registered investment companies for which Management acts as investment manager and administrator (nine since 2008). | |
|
| Kevin Lyons (1955) | | Assistant Secretary since 2003 | | Assistant Vice President, Neuberger, since 2008 and Employee since 1999; Assistant Secretary, nine registered investment companies for which Management acts as investment manager and administrator (eight since 2003 and one since 2006). | |
|
34
Name, (Year of Birth),
and Address(1) | | Position and
Length of Time
Served(2) | | Principal Occupation(s)(3) | |
| Owen F. McEntee, Jr. (1961) | | Vice President since 2008 | | Vice President, Neuberger, since 2006; Employee, Management, since 1992; Vice President, nine registered investment companies for which Management acts as investment manager and administrator (nine since 2008). | |
|
| John M. McGovern (1970) | | Treasurer and Principal Financial and Accounting Officer since 2005; prior thereto, Assistant Treasurer since 2002 | | Senior Vice President, Neuberger, since 2007; formerly, Vice President, Neuberger, 2004 to 2006; Employee, Management, since 1993; Treasurer and Principal Financial and Accounting Officer, nine registered investment companies for which Management acts as investment manager and administrator (eight since 2005 and one since 2006); formerly, Assistant Treasurer, eight registered investment companies for which Management acts as investment manager and administrator, 2002 to 2005. | |
|
| Andrew Provencher (1965) | | Vice President since 2008 | | Managing Director, Management, since 2008; Managing Director, Neuberger, since 2005; formerly, Senior Vice President, Neuberger, 2003 to 2005; formerly, Vice President, Neuberger, 1999 to 2003; Vice President, nine registered investment companies for which Management acts as investment manager and administrator (nine since 2008). | |
|
| Frank Rosato (1971) | | Assistant Treasurer since 2005 | | Vice President, Neuberger, since 2006; Employee, Management, since 1995; Assistant Treasurer, nine registered investment companies for which Management acts as investment manager and administrator (eight since 2005 and one since 2006). | |
|
| Neil S. Siegel (1967) | | Vice President since 2008 | | Managing Director, Management, since 2008; Managing Director, Neuberger, since 2006; formerly, Senior Vice President, Neuberger, 2004 to 2006; Vice President, nine registered investment companies for which Management acts as investment manager and administrator (nine since 2008); formerly, Head of Institutional Marketing, Morgan Stanley Investment Management, 1993 to 2004. | |
|
| Chamaine Williams (1971) | | Chief Compliance Officer since 2005 | | Senior Vice President, Neuberger, since 2007; Chief Compliance Officer, Management, since 2006; Chief Compliance Officer, nine registered investment companies for which Management acts as investment manager and administrator (eight since 2005 and one since 2006); formerly, Senior Vice President, LBI, 2007 to 2008; formerly, Vice President, LBI, 2003 to 2006; formerly, Chief Compliance Officer, Lehman Brothers Asset Management Inc., 2003 to 2007; formerly, Chief Compliance Officer, Lehman Brothers Alternative Investment Management LLC, 2003 to 2007; formerly, Vice President, UBS Global Asset Management (US) Inc. (formerly, Mitchell Hutchins Asset Management, a wholly-owned subsidiary of PaineWebber Inc.), 1997 to 2003. | |
|
(1) The business address of each listed person is 605 Third Avenue, New York, New York 10158.
(2) Pursuant to the By-Laws of the Trust, each officer elected by the Fund Trustees shall hold office until his or her successor shall have been elected and qualified or until his or her earlier death, inability to serve, or resignation. Officers serve at the pleasure of the Fund Trustees and may be removed at any time with or without cause.
(3) Except as otherwise indicated, each individual has held the positions shown for at least the last five years.
35
Proxy Voting Policies and Procedures
A description of the policies and procedures that the Trust uses to determine how to vote proxies relating to portfolio securities is available, without charge, by calling 1-800-877-9700 (toll-free) and on the website of the Securities and Exchange Commission, at www.sec.gov. Information regarding how the Trust voted proxies relating to portfolio securities during the most recent 12-month period ended June 30 is also available, without charge, by calling 1-800-877-9700 (toll-free), on the website of the Securities and Exchange Commission at www.sec.gov, and on Management's website at www.nb.com.
Quarterly Portfolio Schedule
The Trust files a complete schedule of portfolio holdings for the Fund with the Securities and Exchange Commission for the first and third quarters of each fiscal year on Form N-Q. The Trust's Forms N-Q are available on the Securities and Exchange Commission's website at www.sec.gov and may be reviewed and copied at the Securities and Exchange Commission's Public Reference Room in Washington, DC. Information on the operation of the Public Reference Room may be obtained by calling 1-800-SEC-0330. The information on Form N-Q is available upon request, without charge, by calling 1-800-877-9700 (toll free).
Notice to Shareholders (Unaudited)
30.23% of the dividends distributed during the fiscal year ended December 31, 2009 qualifies for the dividends received deduction for corporate shareholders.
36
Neuberger Berman
Advisers Management Trust
Growth Portfolio
I Class Shares
Annual Report
December 31, 2009
B1015 02/10
Growth Portfolio Manager's Commentary
For the year ended December 31, 2009, the Neuberger Berman Advisers Management Trust (AMT) Growth Portfolio posted strong results but underperformed its benchmark, the Russell Midcap(R) Growth Index.
While the equity markets ended 2009 decidedly up, the period contained two very different phases -- dramatic weakness carrying over from 2008 colored the early part of the year, and then markets rallied from March through year-end. Mid-cap stocks led other market capitalization groups, and growth stocks outperformed value stocks for the year.
Generally speaking, this year's rally was led by what we consider the lower-quality area of the market, including stocks with low price/earnings, low returns on equity, low prices (under $5) and little or no earnings. This was not surprising to us, as low-quality stocks have historically led early in market rallies. We typically avoid these areas given our stock selection process and fundamental criteria. We also do not believe they can outperform over the longer term. In fact, we believe there are signs that the low-quality rally may already be fading, and that the markets will once again focus on fundamentals and higher-quality names with superior growth potential. Information Technology (IT) and Energy were the best performing index sectors in 2009, while Utilities and Telecommunications were the weakest.
Within the Portfolio, our Telecommunications holdings were beneficial to relative performance, as was a zero allocation to Utilities. In Telecommunications, tower companies including our top performer, SBA Communications, and American Tower, were strong this period.
Given that our higher-quality discipline was out of favor for most of the year, stock selection was a negative versus the market. We saw particular weakness within Health Care and IT.
In Health Care, both uncertainty surrounding health care reform and weak earnings impacted our holdings. Additionally, medical supplies and services companies underperformed on concerns about lower hospital spending. In addition, our medical diagnostics theme was impacted by the slowdown more than we had expected. We sold Wright Medical, Psychiatric Solutions, Illumina and Myriad Genetics on earnings disappointments and/or lower guidance. Within the sector, we are focusing on companies that we believe may be beneficiaries of health care reform, such as payment management firms Express Scripts, Allscripts and MedAssets. We also see potential in insulated areas, such as ResMed, a company focused on sleep disorders; Sirona, a dental instrument maker; and Mylan, a manufacturer of generic medications.
In IT, our holdings, primarily software and services names, did not keep pace with the rally, although our semiconductor equipment stocks performed better than our sector holdings overall. Alliance Data Systems was one such niche business service provider that underperformed. Vistaprint, a lower-cost business products and services provider, was among our top performers, and was particularly strong during the second half. Cognizant Technology Solutions, Equinix and Marvell also performed very well. In IT, we have not significantly changed our positioning, expecting that holdings could benefit as long-delayed business spending increases.
Within Industrials, while high-quality holdings including Danaher, Stericycle and Fastenal exceeded earnings expectations, they were out of favor with the preference for low quality stocks over the past year. We currently believe these companies could benefit now from improved corporate spending. We continue to hold aerospace and defense themed names such as Rockwell Collins and Precision Castparts. We sold Corrections Corp., a prison outsourcing company, on concerns about state spending levels, and added to names that we believed could benefit from economic improvement.
In Consumer Discretionary, our secondary education theme underperformed this period, although holdings here also exceeded expectations. We sold American Public Education and Grand Canyon, but continue to hold DeVry and Strayer. Our "retail survivors" theme was beneficial, with Nordstrom among our top performers. We sold Staples and Kohl's as they grew too large in our view for the Portfolio, and we are currently taking a bifurcated approach to the market, considering stresses on consumers. At the lower end of the consumer market, we hold Dollar Tree, top performer Ross Stores and TJX. On the higher end, we hold Coach and Polo Ralph Lauren. These high-end retailers provide the Portfolio with exposure to internationally generated revenues. We also continue to hold gaming and high-end leisure, with companies such as Penn National, Bally Technologies and WMS Industries.
1
Looking ahead, we currently believe a continued recovery will occur with muted growth, expecting GDP -- likely in our view to be stronger in the first half of 2010 than the second -- in the range of 3%. Consumer weakness and jobless claims continue to be our main concerns. Since the consumer is unlikely to help move the economy forward, we believe it is critical that select international economies, such as the BRIC (Brazil, Russia, India and China) markets, show robust growth. Considering this outlook, we are seeking "international exposure" through companies with exposure to international revenue streams. In addition, unlike last year, we are looking for top line growth as opposed to bottom line improvements. We believe there is a great deal of potential for renewed corporate spending. This should benefit some Industrials and IT companies. We have continued to become less defensive within the Portfolio overall, and believe that with a sustained slower growth recovery backdrop, the market will reward companies with strong managements, quality growth characteristics and strong balance sheets.
Sincerely,

Kenneth J. Turek
Portfolio Manager
2
Growth Portfolio
SECTOR ALLOCATION
| (% of Equity Market Value) | |
| Consumer Discretionary | | | 19.2 | % | |
| Consumer Staples | | | 3.1 | | |
| Energy | | | 9.1 | | |
| Financials | | | 4.7 | | |
| Health Care | | | 13.8 | | |
| Industrials | | | 15.9 | | |
| Information Technology | | | 25.3 | | |
| Materials | | | 4.2 | | |
| Telecommunication Services | | | 4.7 | | |
| Total | | | 100.0 | % | |
AVERAGE ANNUAL TOTAL RETURN1
| | | Inception
Date | | 1 Year | | 5 Years | | 10 Years | | Life of
Fund* | |
| Growth Portfolio Class I | | 09/10/1984 | | | 30.63 | % | | | 3.17 | % | | | -2.73 | % | | | 8.29 | % | |
Russell Midcap(R)
Growth Index2 | | | | | 46.29 | % | | | 2.40 | % | | | -0.52 | % | | N/A | |
| Russell Midcap(R) Index2 | | | | | 40.48 | % | | | 2.43 | % | | | 4.98 | % | | | 11.94 | % | |
Performance data quoted represent past performance, which is no guarantee of future results. The investment return and principal value of an investment will fluctuate so that an investor's shares, when redeemed may be worth more or less than their original cost. Results are shown on a "total return" basis and include reinvestment of all income dividends and distributions.
Current performance may be higher or lower than the performance data quoted. For performance data current to the most recent month end, please visit https://www.nb.com.
* Index returns are as of the inception date 09/10/1984.
As stated in the Portfolio's most recent prospectus, the total annual fund operating expense ratio for fiscal year 2008 was 1.04% for Class I shares (prior to any fee waivers or expense reimbursements). Neuberger Berman Management LLC has contractually agreed to limit certain expenses of the Portfolio through 12/31/2012.
COMPARISON OF A $10,000 INVESTMENT
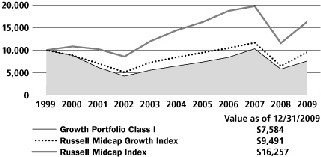
The chart shows the value of a hypothetical $10,000 investment in the Portfolio over the past 10 fiscal years. The result is compared with benchmarks, which may include a broad-based market index and/or a narrower index. Please note that market indexes do not include expenses. All results include the reinvestment of income dividends and distributions. Results represent past performance and do not indicate future results. The chart and table do not reflect the deduction of taxes that a shareholder would pay on Portfolio distributions or the redemption of Portfolio shares.
Please see Endnotes for additional information.
3
Endnotes
1 "Total Return" includes reinvestment of all income dividends and distributions. Results represent past performance and do not indicate future results. The value of an investment in the Portfolio and the return on the investment both will fluctuate, and redemption proceeds may be higher or lower than an investor's original cost. The performance information does not reflect fees and expenses of the variable annuity and variable life insurance policies or the qualified pension and retirement plans whose proceeds are invested in the Portfolio. Neuberger Berman Management LLC ("NBM LLC") has agreed to absorb certain expenses of the AMT Portfolios, including the Portfolio. Without this arrangement, which is subject to change, the total returns of the Portfolio may have been less.
2 The Russell Midcap(R) Growth Index measures the performance of those Russell Midcap(R) Index companies with higher price-to-book ratios and higher forecasted growth values. The Russell Midcap Index measures the performance of the 800 smallest companies in the Russell 1000(R) Index, which represents approximately 31% of the total market capitalization of the Russell 1000 Index (which, in turn, consists of the 1,000 largest U.S. companies, based on market capitalization). Please note that indices do not take into account any fees and expenses of investing in the individual securities that they track and that individuals cannot invest directly in any index. Data about the performance of these indices are prepared or obtained by NBM LLC and include reinvestment of all income dividends and distributions. The Portfolio may invest in many securities not included in the above-described indices.
Any ratios or other measurements using a factor of forecasted earnings of a company discussed herein are based on consensus estimates, not NBM LLC's own projections, and they may or may not be realized. In addition, any revision to a forecast could affect the market price of a security. By quoting them herein, NBM LLC does not offer an opinion as to the accuracy of and does not guarantee these forecasted numbers.
The investments for the Portfolio are managed by the same portfolio manager(s) who manage one or more other mutual funds that have similar names, investment objectives and investment styles as the Portfolio. You should be aware that the Portfolio is likely to differ from the other mutual funds in size, cash flow pattern and tax matters. Accordingly, the holdings and performance can be expected to vary from those of the other mutual funds.
The composition, industries and holdings of the Portfolio are subject to change.
Shares of the separate AMT Portfolios are not available to the general public. Shares of this Portfolio may be purchased only by life insurance companies to be used with their separate accounts that fund variable annuity and variable life insurance policies and by qualified pension and retirement plans.
Statistics and projections in this report are derived from sources deemed to be reliable but cannot be regarded as a representation of future results of the AMT Portfolios. This report is prepared for the general information of shareholders and is not an offer of shares of the AMT Portfolios. Shares of the AMT Portfolios are sold only through the currently effective prospectuses, which must precede or accompany this report.
(c) 2010 Neuberger Berman Management LLC distributor. All rights reserved.
4
Information About Your Fund's Expenses
This table is designed to provide information regarding costs related to your investments. All mutual funds incur operating expenses, which include management fees, fees for administrative services and costs of shareholder reports, among others. The following examples are based on an investment of $1,000 made at the beginning of the six month period ended December 31, 2009 and held for the entire period. The table illustrates the fund's costs in two ways:
| Actual Expenses and Performance: | | The first section of the table provides information about actual account values and actual expenses in dollars, based on the fund's actual performance during the period. You may use the information in this line, together with the amount you invested, to estimate the expenses you paid over the period. Simply divide your account value by $1,000 (for example, an $8,600 account value divided by $1,000 = 8.6), then multiply the result by the number in the first section of the table under the heading entitled "Expenses Paid During the Period" to estimate the expenses you paid over the period. | |
|
| Hypothetical Example for Comparison Purposes: | | The second section of the table provides information about hypothetical account values and hypothetical expenses based on the fund's actual expense ratio and an assumed rate of return at 5% per year before expenses. This return is not the fund's actual return. The hypothetical account values and expenses may not be used to estimate the actual ending account balance or expenses you paid for the period. You may use this information to compare the ongoing costs of investing in this fund versus other funds. To do so, compare the expenses shown in this 5% hypothetical example with the 5% hypothetical examples that appear in the shareholder reports of other funds. | |
|
Please note that the expenses in the table are meant to highlight your ongoing costs only. The table and expense example do not include any transactional costs, such as fees and expenses that are, or may be, imposed under your variable contract or qualified pension plan. Therefore, the information under the heading "Hypothetical (5% annual return before expenses)" is useful in comparing ongoing costs only, and will not help you determine the relative total costs of owning different funds. In addition, if these transactional costs were included, your costs would have been higher.
Expense Information as of 12/31/09 (Unaudited)
NEUBERGER BERMAN ADVISERS MANAGEMENT TRUST GROWTH PORTFOLIO
| Actual | | Beginning Account
Value
7/1/09 | | Ending Account
Value
12/31/09 | | Expenses Paid
During the Period*
7/1/09-12/31/09 | |
| Class I | | $ | 1,000.00 | | | $ | 1,213.70 | | | $ | 8.70 | | |
| Hypothetical (5% annual return before expenses)** | | | | | |
| Class I | | $ | 1,000.00 | | | $ | 1,017.34 | | | $ | 7.93 | | |
* Expenses are equal to the annualized expense ratio of 1.56%, multiplied by the average account value over the period, multiplied by 184/365 (to reflect the one-half year period shown).
** Hypothetical 5% annual return before expenses is calculated by multiplying the number of days in the most recent half year divided by 365.
5
Schedule of Investments Growth Portfolio
| NUMBER OF SHARES | | | | VALUEt | |
| Common Stocks (99.6%) | | | |
| Aerospace & Defense (2.2%) | | | |
| | 1,000 | | | Precision Castparts | | $ | 110,350 | | |
| | 1,000 | | | Rockwell Collins | | | 55,360 | | |
| | | | 165,710 | | |
| Air Freight & Logistics (1.6%) | | | |
| | 2,000 | | | C.H. Robinson Worldwide | | | 117,460 | | |
| Biotechnology (4.4%) | | | |
| | 1,600 | | | Alexion Pharmaceuticals | | | 78,112 | * | |
| | 1,750 | | | BioMarin Pharmaceutical | | | 32,917 | * | |
| | 1,000 | | | Dendreon Corp. | | | 26,280 | * | |
| | 2,000 | | | Human Genome Sciences | | | 61,200 | * | |
| | 3,000 | | | Talecris Biotherapeutics | | | 66,810 | * | |
| | 1,500 | | | Vertex Pharmaceuticals | | | 64,275 | * | |
| | | | 329,594 | | |
| Capital Markets (2.4%) | | | |
| | 1,100 | | | Affiliated Managers Group | | | 74,085 | * | |
| | 1,200 | | | Artio Global Investors | | | 30,588 | * | |
| | 3,000 | | | Invesco Ltd. | | | 70,470 | | |
| | | | 175,143 | | |
| Chemicals (3.4%) | | | |
| | 2,800 | | | Airgas, Inc. | | | 133,280 | | |
| | 1,900 | | | Ecolab Inc. | | | 84,702 | | |
| | 1,500 | | | Nalco Holding | | | 38,265 | | |
| | | | 256,247 | | |
| Commercial Services & Supplies (1.9%) | | | |
| | 2,500 | | | Stericycle, Inc. | | | 137,925 | * | |
| Communications Equipment (1.2%) | | | |
| | 3,200 | | | Juniper Networks | | | 85,344 | * | |
| Computers & Peripherals (1.8%) | | | |
| | 2,000 | | | NetApp, Inc. | | | 68,780 | * | |
| | 1,500 | | | Western Digital | | | 66,225 | * | |
| | | | 135,005 | | |
| Diversified Consumer Services (2.2%) | | | |
| | 1,400 | | | DeVry, Inc. | | | 79,422 | | |
| | 400 | | | Strayer Education | | | 84,996 | | |
| | | | 164,418 | | |
| Diversified Financial Services (2.3%) | | | |
| | 700 | | | IntercontinentalExchange Inc. | | | 78,610 | * | |
| | 3,000 | | | MSCI Inc. | | | 95,400 | * | |
| | | | 174,010 | | |
| NUMBER OF SHARES | | | | VALUEt | |
| Electrical Equipment (2.3%) | | | |
| | 2,500 | | | AMETEK, Inc. | | $ | 95,600 | | |
| | 1,500 | | | Roper Industries | | | 78,555 | | |
| | | | 174,155 | | |
Electronic Equipment, Instruments &
Components (4.3%) | | | |
| | 1,650 | | | Amphenol Corp. | | | 76,197 | | |
| | 2,000 | | | Dolby Laboratories | | | 95,460 | * | |
| | 2,500 | | | National Instruments | | | 73,625 | | |
| | 3,000 | | | Trimble Navigation | | | 75,600 | * | |
| | | | 320,882 | | |
| Energy Equipment & Services (3.1%) | | | |
| | 1,500 | | | CARBO Ceramics | | | 102,255 | | |
| | 750 | | | Core Laboratories N.V. | | | 88,590 | | |
| | 700 | | | Oceaneering International | | | 40,964 | * | |
| | | | 231,809 | | |
| Food Products (0.6%) | | | |
| | 700 | | | J.M. Smucker | | | 43,225 | | |
| Health Care Equipment & Services (0.5%) | | | |
| | 1,750 | | | PSS World Medical | | | 39,498 | * | |
| Health Care Equipment & Supplies (4.2%) | | | |
| | 800 | | | Edwards Lifesciences | | | 69,480 | * | |
| | 150 | | | Intuitive Surgical | | | 45,498 | * | |
| | 1,000 | | | Masimo Corp. | | | 30,420 | * | |
| | 1,650 | | | NuVasive, Inc. | | | 52,767 | * | |
| | 800 | | | ResMed Inc. | | | 41,816 | * | |
| | 1,250 | | | Sirona Dental Systems | | | 39,675 | * | |
| | 2,000 | | | Volcano Corp. | | | 34,760 | * | |
| | | | 314,416 | | |
| Health Care Providers & Services (2.6%) | | | |
| | 1,500 | | | Express Scripts | | | 129,675 | * | |
| | 1,350 | | | HMS Holdings | | | 65,731 | * | |
| | | | 195,406 | | |
| Health Care Technology (1.2%) | | | |
| | 2,750 | | | Allscripts Healthcare Solutions | | | 55,633 | * | |
| | 1,500 | | | MedAssets Inc. | | | 31,815 | * | |
| | | | 87,448 | | |
| Hotels, Restaurants & Leisure (3.5%) | | | |
| | 1,000 | | | Bally Technologies | | | 41,290 | * | |
| | 3,000 | | | Penn National Gaming | | | 81,540 | * | |
| | 3,500 | | | WMS Industries | | | 140,000 | * | |
| | | | 262,830 | | |
See Notes to Schedule of Investments 6
| NUMBER OF SHARES | | | | VALUEt | |
| Household Products (1.0%) | | | |
| | 1,200 | | | Church & Dwight | | $ | 72,540 | | |
| Internet & Catalog Retail (0.9%) | | | |
| | 300 | | | Priceline.com Inc. | | | 65,550 | * | |
| Internet Software & Services (3.2%) | | | |
| | 900 | | | Equinix, Inc. | | | 95,535 | * | |
| | 1,250 | | | GSI Commerce | | | 31,738 | * | |
| | 2,000 | | | VistaPrint NV | | | 113,320 | * | |
| | | | 240,593 | | |
| IT Services (1.8%) | | | |
| | 650 | | | Alliance Data Systems | | | 41,984 | * | |
| | 2,000 | | | Cognizant Technology Solutions | | | 90,600 | * | |
| | | | 132,584 | | |
| Machinery (2.1%) | | | |
| | 1,300 | | | Danaher Corp. | | | 97,760 | | |
| | 600 | | | Flowserve Corp. | | | 56,718 | | |
| | | | 154,478 | | |
| Media (1.8%) | | | |
| | 1,250 | | | Discovery Communications
Class A | | | 38,337 | * | |
| | 1,400 | | | DreamWorks Animation SKG | | | 55,930 | * | |
| | 1,000 | | | Scripps Networks Interactive | | | 41,500 | | |
| | | | 135,767 | | |
| Metals & Mining (0.7%) | | | |
| | 1,200 | | | Cliffs Natural Resources | | | 55,308 | | |
| Multiline Retail (2.1%) | | | |
| | 1,500 | | | Dollar Tree | | | 72,450 | * | |
| | 2,200 | | | Nordstrom, Inc. | | | 82,676 | | |
| | | | 155,126 | | |
| Oil, Gas & Consumable Fuels (6.0%) | | | |
| | 700 | | | Alpha Natural Resources | | | 30,366 | * | |
| | 1,250 | | | Cabot Oil & Gas | | | 54,487 | | |
| | 3,400 | | | Concho Resources | | | 152,660 | * | |
| | 2,000 | | | Range Resources | | | 99,700 | | |
| | 2,200 | | | Southwestern Energy | | | 106,040 | * | |
| | | | 443,253 | | |
| Personal Products (1.5%) | | | |
| | 1,500 | | | Avon Products | | | 47,250 | | |
| | 1,500 | | | Mead Johnson Nutrition | | | 65,550 | | |
| | | | 112,800 | | |
| Pharmaceuticals (0.8%) | | | |
| | 3,250 | | | Mylan Laboratories | | | 59,898 | * | |
| NUMBER OF SHARES | | | | VALUEt | |
| Professional Services (2.6%) | | | |
| | 2,000 | | | IHS Inc. | | $ | 109,620 | * | |
| | 2,700 | | | Verisk Analytics | | | 81,756 | * | |
| | | | 191,376 | | |
| Road & Rail (1.0%) | | | |
| | 2,400 | | | J.B. Hunt Transport Services | | | 77,448 | | |
Semiconductors & Semiconductor
Equipment (6.7%) | | | |
| | 2,500 | | | Analog Devices | | | 78,950 | | |
| | 3,000 | | | Avago Technologies | | | 54,870 | * | |
| | 4,000 | | | Marvell Technology Group | | | 83,000 | * | |
| | 3,500 | | | Microchip Technology | | | 101,710 | | |
| | 1,500 | | | Novellus Systems | | | 35,010 | * | |
| | 1,800 | | | Silicon Laboratories | | | 87,012 | * | |
| | 1,700 | | | Varian Semiconductor Equipment | | | 60,996 | * | |
| | | | 501,548 | | |
| Software (6.2%) | | | |
| | 6,000 | | | Activision Blizzard | | | 66,660 | * | |
| | 2,300 | | | ANSYS, Inc. | | | 99,958 | * | |
| | 1,000 | | | Citrix Systems | | | 41,610 | * | |
| | 900 | | | McAfee Inc. | | | 36,513 | * | |
| | 1,200 | | | MICROS Systems | | | 37,236 | * | |
| | 2,250 | | | Rovi Corp. | | | 71,707 | * | |
| | 550 | | | Salesforce.com, Inc. | | | 40,574 | * | |
| | 1,500 | | | Sybase, Inc. | | | 65,100 | * | |
| | | | 459,358 | | |
| Specialty Retail (7.8%) | | | |
| | 1,800 | | | Bed Bath & Beyond | | | 69,534 | * | |
| | 2,000 | | | CarMax, Inc. | | | 48,500 | * | |
| | 1,500 | | | J Crew Group | | | 67,110 | * | |
| | 2,500 | | | Ross Stores | | | 106,775 | | |
| | 600 | | | Tiffany & Co. | | | 25,800 | | |
| | 1,900 | | | TJX Cos. | | | 69,445 | | |
| | 4,250 | | | Urban Outfitters | | | 148,707 | * | |
| | 2,300 | | | Williams-Sonoma | | | 47,794 | | |
| | | | 583,665 | | |
| Textiles, Apparel & Luxury Goods (0.8%) | | | |
| | 1,050 | | | Coach, Inc. | | | 38,357 | | |
| | 250 | | | Polo Ralph Lauren | | | 20,245 | | |
| | | | 58,602 | | |
| Trading Companies & Distributors (2.2%) | | | |
| | 2,300 | | | Fastenal Co. | | | 95,772 | | |
| | 700 | | | W.W. Grainger | | | 67,781 | | |
| | | | 163,553 | | |
See Notes to Schedule of Investments 7
| NUMBER OF SHARES | | | | VALUEt | |
| Wireless Telecommunication Services (4.7%) | | | |
| | 2,000 | | | American Tower | | $ | 86,420 | * | |
| | 1,100 | | | Crown Castle International | | | 42,944 | * | |
| | 1,500 | | | NII Holdings | | | 50,370 | * | |
| | 5,000 | | | SBA Communications | | | 170,800 | * | |
| | | | 350,534 | | |
| | | | | Total Common Stocks
(Cost $5,211,429) | | | 7,424,506 | | |
| Short-Term Investments (0.6%) | | | |
| | 44,559 | | | State Street Institutional
Liquid Reserves Fund
Institutional Class
(Cost $44,559) | | | 44,559 | | |
| | | | | Total Investments (100.2%)
(Cost $5,255,988) | | | 7,469,065 | ## | |
| | | | | Liabilities, less cash, receivables and
other assets [(0.2%)] | | | (11,962 | ) | |
| | | | | Total Net Assets (100.0%) | | $ | 7,457,103 | | |
See Notes to Schedule of Investments 8
Notes to Schedule of Investments Growth Portfolio
t The value of investments in equity securities by Neuberger Berman Advisers Management Trust Growth Portfolio (the "Fund") is determined by Neuberger Berman Management LLC ("Management") primarily by obtaining valuations from an independent pricing service based on the latest sale price when that price is readily available. Securities traded primarily on the NASDAQ Stock Market are normally valued by the Fund at the NASDAQ Official Closing Price ("NOCP") provided by NASDAQ each business day. The NOCP is the most recently reported price as of 4:00:02 p.m., Eastern time, unless that price is outside the range of the "inside" bid and asked prices (i.e., the bid and asked prices that dealers quote to each other when trading for their own accounts); in that case, NASDAQ will adjust the price to equal the inside bid or asked price, whichever is closer. Because of delays in reporting trades, the NOCP may not be based on the price of the last trade to occur before the market closes. If there is no reported sale of a security on a particular day, the independent pricing service may value the security based on reported market quotations. Management has developed a process to periodically review information provided by independent pricing services. If a valuation is not available from an independent pricing service, the Fund seeks to obtain quotations from principal market makers. If such quotations are not readily available, securities are valued using methods the Board of Trustees of Neuberger Berman Advisers Management Trust (the "Board") has approved on the belief that they reflect fair value. Numerous factors may be considered when determining the fair value of a security, including available analyst, media or other reports, trading in futures or ADRs and whether the issuer of the security being fair valued has other securities outstanding. Foreign security prices are furnished by independent quotation services and expressed in local currency values. Foreign security prices are currently translated from the local currency into U.S. dollars using the exchange rate as of 4:00 p.m., Eastern time. The Board has approved the use of Interactive Data Pricing and Reference Data, Inc. ("Interactive") to assist in determining the fair value of the Fund's foreign equity securities when changes in the value of a certain index suggest that the closing prices on the foreign exchanges may no longer represent the amount that the Fund could expect to receive for those securities. In this event, Interactive will provide adjusted prices for certain foreign equity securities using a statistical analysis of historical correlations of multiple factors. In the absence of precise information about the market values of these foreign securities as of the close of the New York Stock Exchange, the Board has determined on the basis of available data that prices adjusted in this way are likely to be closer to the prices the Fund could realize on a current sale than are the prices of those securities established at the close of the foreign markets in which the securities primarily trade. Fair value prices are necessarily estimates, and there is no assurance that such a price will be at or close to the price at which the security next trades. Short-term debt securities with less than 60 days until maturity may be valued at cost, which, when combined with interest earned, is expected to approximate market value.
In accordance with Accounting Standards Codification ("ASC") 820 "Fair Value Measurements and Disclosures" ("ASC 820"), formerly known as Financial Accounting Standards Board ("FASB") Statement of Financial Accounting Standards No. 157, "Fair Value Measurements," investments held by the Fund are carried at "fair value" as defined by ASC 820. Fair value is defined as the price that a fund would receive upon selling an investment in an orderly transaction to an independent buyer in the principal or most advantageous market for the investment under current market conditions. Various inputs, including the volume and level of activity for the asset or liability in the market are considered in determining the value of the Fund's investments, some of which are discussed above. Significant management judgement may be necessary to estimate fair value in accordance with ASC 820.
In addition to defining fair value, ASC 820 established a three-tier hierarchy of inputs to establish a classification of fair value measurements for disclosure purposes. The three-tier hierarchy of inputs is summarized in the three broad Levels listed below.
. Level 1 - quoted prices in active markets for identical investments
. Level 2 - other significant observable inputs (including quoted prices for similar investments, interest rates, prepayment speeds, credit risk, amortized cost, etc.)
See Notes to Financial Statements 9
Notes to Schedule of Investments Growth Portfolio (cont'd)
. Level 3 - significant unobservable inputs (including the Fund's own assumptions in determining the fair value of investments)
The inputs or methodology used for valuing an investment are not necessarily an indication of the risk associated with investing in those securities.
The following is a summary, by category of Level, of inputs used to value the Fund's investments as of December 31, 2009:
| Asset Valuation Inputs | | Level 1 | | Level 2 | | Level 3 | | Total | |
| Investments: | |
| Common Stocks^ | | $ | 7,424,506 | | | $ | -- | | | $ | -- | | | $ | 7,424,506 | | |
| Short-Term Investments | | | -- | | | | 44,559 | | | | -- | | | | 44,559 | | |
| Total Investments | | $ | 7,424,506 | | | $ | 44,559 | | | $ | -- | | | $ | 7,469,065 | | |
^ The Schedule of Investments provides information on the industry categorization for the portfolio.
## At December 31, 2009, the cost of investments for U.S. federal income tax purposes was $5,282,318. Gross unrealized appreciation of investments was $2,200,281 and gross unrealized depreciation of investments was $13,534, resulting in net unrealized appreciation of $2,186,747, based on cost for U.S. federal income tax purposes.
* Security did not produce income during the last twelve months.
See Notes to Financial Statements 10
Statement of Assets and Liabilities
Neuberger Berman Advisers Management Trust
| | | GROWTH
PORTFOLIO | |
| | | December 31, 2009 | |
| Assets | |
| Investments in securities, at value* (Notes A & F)--see Schedule of Investments: | |
| Unaffiliated issuers | | $ | 7,469,065 | | |
| Cash | | | 19,351 | | |
| Dividends and interest receivable | | | 13,885 | | |
| Receivable for Fund shares sold | | | 9,224 | | |
| Receivable for securities lending income--net (Note A) | | | 554 | | |
| Prepaid expenses and other assets | | | 6,442 | | |
| Total Assets | | | 7,518,521 | | |
| Liabilities | |
| Accrued audit fees | | | 40,900 | | |
| Accrued custodian fees | | | 5,009 | | |
| Accrued shareholder reports | | | 6,586 | | |
| Payable for Fund shares redeemed | | | 3,336 | | |
| Payable to investment manager (Notes A & B) | | | 3,431 | | |
| Payable to administrator (Note B) | | | 1,872 | | |
| Accrued expenses and other payables | | | 284 | | |
| Total Liabilities | | | 61,418 | | |
| Net Assets at value | | $ | 7,457,103 | | |
| Net Assets consist of: | |
| Paid-in capital | | $ | 86,648,611 | | |
| Accumulated net realized gains (losses) on investments | | | (81,404,585 | ) | |
| Net unrealized appreciation (depreciation) in value of investments | | | 2,213,077 | | |
| Net Assets at value | | $ | 7,457,103 | | |
| Shares Outstanding ($.001 par value; unlimited shares authorized) | | | 525,209 | | |
| Net Asset Value, offering and redemption price per share | | $ | 14.20 | | |
| *Cost of Investments: | |
| Unaffiliated issuers | | $ | 5,255,988 | | |
See Notes to Financial Statements11
Statement of Operations
Neuberger Berman Advisers Management Trust
| | | GROWTH
PORTFOLIO | |
| | | For the
Year Ended
December 31, 2009 | |
| Investment Income: | |
| Income (Note A): | |
| Dividend income--unaffiliated issuers | | $ | 314,370 | | |
| Interest income--unaffiliated issuers | | | 108 | | |
| Income from securities loaned--net (Note F) | | | 101,750 | | |
| Income from investments in affiliated issuers (Note F) | | | 447 | | |
| Foreign taxes withheld | | | (10,921 | ) | |
| Total income | | $ | 405,754 | | |
| Expenses: | |
| Investment management fees (Notes A & B) | | | 284,208 | | |
| Administration fees (Note B) | | | 155,022 | | |
| Audit fees | | | 41,307 | | |
| Custodian fees (Note B) | | | 50,674 | | |
| Insurance expense | | | 4,943 | | |
| Legal fees | | | 15,587 | | |
| Shareholder reports | | | 48,002 | | |
| Trustees' fees and expenses | | | 50,097 | | |
| Miscellaneous | | | 8,200 | | |
| Total expenses | | | 658,040 | | |
| Investment management fees waived (Note A) | | | (186 | ) | |
| Total net expenses | | | 657,854 | | |
| Net investment income (loss) | | $ | (252,100 | ) | |
| Realized and Unrealized Gain (Loss) on Investments (Note A) | |
| Net realized gain (loss) on: | |
| Sales of investment securities of unaffiliated issuers | | | (7,811,180 | ) | |
| Sales of investment securities of affiliated issuers | | | 106,493 | | |
| Redemption in-kind | | | 10,645,580 | | |
| Foreign currency | | | (3,949 | ) | |
| Change in net unrealized appreciation (depreciation) in value of: | |
| Unaffiliated investment securities | | | 8,600,025 | | |
| Foreign currency | | | 6,728 | | |
| Net gain (loss) on investments | | | 11,543,697 | | |
| Net increase (decrease) in net assets resulting from operations | | $ | 11,291,597 | | |
See Notes to Financial Statements12
Statements of Changes in Net Assets
Neuberger Berman Advisers Management Trust
| | | GROWTH PORTFOLIO | |
| | | Year Ended
December 31,
2009 | | Year Ended
December 31,
2008 | |
| Increase (Decrease) in Net Assets: | |
| From Operations (Note A): | |
| Net investment income (loss) | | $ | (252,100 | ) | | $ | (808,926 | ) | |
| Net realized gain (loss) on investments | | | 2,936,944 | | | | (3,267,376 | ) | |
| Change in net unrealized appreciation (depreciation) of investments | | | 8,606,753 | | | | (64,855,969 | ) | |
| Net increase (decrease) in net assets resulting from operations | | | 11,291,597 | | | | (68,932,271 | ) | |
| From Fund Share Transactions (Note D): | |
| Proceeds from shares sold | | | 654,776 | | | | 1,232,995 | | |
| Payments for shares redeemed | | | (86,519,376 | ) | | | (22,837,977 | ) | |
| Net increase (decrease) from Fund share transactions | | | (85,864,600 | ) | | | (21,604,982 | ) | |
| Net Increase (Decrease) in Net Assets | | | (74,573,003 | ) | | | (90,537,253 | ) | |
| Net Assets: | |
| Beginning of year | | | 82,030,106 | | | | 172,567,359 | | |
| End of year | | $ | 7,457,103 | | | $ | 82,030,106 | | |
| Undistributed net investment income (loss) at end of year | | $ | -- | | | $ | -- | | |
See Notes to Financial Statements13
Notes to Financial Statements Growth Portfolio
Note A--Summary of Significant Accounting Policies:
1 General: The Fund is a separate operating series of Neuberger Berman Advisers Management Trust (the "Trust"), a Delaware statutory trust organized pursuant to a Trust Instrument dated May 23, 1994. The Trust is currently comprised of ten separate operating series (each a "Series," collectively, the "Funds") each of which is diversified. The Trust is registered as an open-end management investment company under the Investment Company Act of 1940, as amended (the "1940 Act"), and its shares are registered under the Securities Act of 1933, as amended. The Fund currently offers only Class I shares. The Board may establish additional series or classes of shares without the approval of shareholders.
The assets of each Series belong only to that Series, and the liabilities of each Series are borne solely by that Series and no other.
The preparation of financial statements in accordance with U.S. generally accepted accounting principles requires Management to make estimates and assumptions at the date of the financial statements. Actual results could differ from those estimates.
2 Portfolio valuation: Investment securities are valued as indicated in the notes following the Schedule of Investments.
3 Foreign currency translation: The accounting records of the Fund are maintained in U.S. dollars. Foreign currency amounts are currently translated into U.S. dollars using the exchange rates as of 4:00 p.m., Eastern time, to determine the value of investments, other assets and liabilities. Purchase and sale prices of securities, and income and expenses, are translated into U.S. dollars at the prevailing rate of exchange on the respective dates of such transactions. Net unrealized foreign currency gain (loss), if any, arises from changes in the value of assets and liabilities, other than investments in securities, as a result of changes in exchange rates and is stated separately in the Statement of Operations.
4 Securities transactions and investment income: Securities transactions are recorded on trade date for financial reporting purposes. Dividend income is recorded on the ex-dividend date or, for certain foreign dividends, as soon as the Fund becomes aware of the dividends. Non-cash dividends included in dividend income, if any, are recorded at the fair market value of the securities received. Interest income, including accretion of original issue discount, where applicable, and accretion of discount on short-term investments, is recorded on the accrual basis. Realized gains and losses from securities transactions and foreign currency transactions, if any, are recorded on the basis of identified cost and stated separately in the Statement of Operations. Included in net realized gain (loss) on investments are proceeds from the settlements of class action litigation in which the Fund participated as a class member. The amount of such proceeds for the year ended December 31, 2009 was $51,235.
5 Income tax information: The Funds are treated as separate entities for U.S. federal income tax purposes. It is the policy of the Fund to continue to qualify as a regulated investment company by complying with the requirements of Subchapter M of the Internal Revenue Code applicable to regulated investment companies and to distribute substantially all of its earnings to its shareholders. Therefore, no federal income or excise tax provision is required.
The Fund has adopted the provisions of ASC 740 "Income Taxes" ("ASC 740"), formerly known as FASB Interpretation No. 48 "Accounting for Uncertainty in Income Taxes -- an interpretation of FASB Statement No. 109." ASC 740 sets forth a minimum threshold for financial statement recognition of the benefit of a tax position taken, or expected to be taken, in a tax return. The Fund recognizes interest and penalties, if any, related to unrecognized tax benefits as an income tax expense in the Statement of Operations. The Fund is subject to examination by U.S. federal and state tax authorities for returns filed for the prior three fiscal years 2006 - 2008. As of December 31, 2009, the Fund did not have any unrecognized tax benefits.
14
Income distributions and capital gain distributions are determined in accordance with income tax regulations, which may differ from U.S. generally accepted accounting principles. These differences are primarily due to differing treatments of income and gains on various investment securities held by the Fund, timing differences and differing characterization of distributions made by the Fund as a whole. The Fund may also utilize earnings and profits distributed to shareholders on redemption of shares as a part of the dividends paid deduction for income tax purposes.
As determined on December 31, 2009, permanent differences resulting primarily from different book and tax accounting for net operating losses, foreign currency gains and losses, expiration of capital loss carryforwards, redemptions in kind and partnership basis adjustments, were reclassified at fiscal year-end. These reclassifications had no effect on net income, net asset value or net asset value per share of the Fund.
As of December 31, 2009, the components of distributable earnings (accumulated losses) on a U.S. federal income tax basis were as follows:
Undistributed
Ordinary
Income (Loss) | | Unrealized
Appreciation
(Depreciation) | | Loss
Carryforwards
and Deferrals | | Total | |
| $ | -- | | | $ | 2,186,747 | | | $ | (81,378,255 | ) | | $ | (79,191,508 | ) | |
The difference between book basis and tax basis distributable earnings is attributable primarily to timing differences of wash sales, capital loss carryforwards and partnership basis adjustments.
To the extent the Fund's net realized capital gains, if any, can be offset by capital loss carryforwards, it is the policy of the Fund not to distribute such gains. As determined at December 31, 2009, the Fund had unused capital loss carryforwards available for federal income tax purposes to offset net realized capital gains, if any, as follows:
| | | Expiring in: | |
| | | 2010 | | 2017 | |
| | | $ | 70,119,797 | | | $ | 11,258,458 | | |
Under current tax law, the use of these losses to offset future gains may be limited.
The Fund had $122,643,722 of capital loss carryforwards that expired during the year ended December 31, 2009.
6 Distributions to shareholders: The Fund may earn income, net of expenses, daily on its investments. Distributions from net investment income and net realized capital gains, if any, generally are distributed in October. Income distributions and capital gain distributions to shareholders are recorded on the ex-date.
7 Foreign taxes: Foreign taxes withheld represent amounts withheld by foreign tax authorities, net of refunds recoverable.
8 Expense allocation: Certain expenses are applicable to multiple funds. Expenses directly attributable to a Series are charged to that Series. Expenses of the Trust that are not directly attributed to a Series are allocated among the Funds, on the basis of relative net assets, except where a more appropriate allocation of expenses to each of the Funds can otherwise be made fairly. Expenses borne by the complex of related investment companies, which includes open-end and closed-end investment companies for which Management serves as investment manager, that are not directly attributed to a Series or the Trust are allocated among the Fund and the other investment companies in the complex or series thereof on the basis of relative net assets, except where a more appropriate allocation of expenses to each investment company in the complex or series thereof can otherwise be made fairly.
9 Security lending: A third party, eSecLending, currently serves as exclusive lending agent for the Fund. eSecLending, as agent, has assisted the Fund in conducting bidding processes to try to identify a principal that would pay a guaranteed amount to the Fund in consideration of the Fund entering into an exclusive securities lending arrangement. During most of the Fund's fiscal year, the Fund was guaranteed a particular level of income from a principal. As a result of a bidding process on October 1, 2009, no principal currently has an exclusive arrangement with the Fund and the Fund is no longer guaranteed a particular level of income.
15
Under the securities lending arrangement, the Fund receives cash collateral at the beginning of each transaction equal to at least 102% of the prior day's market value of the loaned securities (105% in the case of international securities). The Fund may invest all the cash collateral in Neuberger Berman Securities Lending Quality Fund, LLC ("Quality Fund"), a fund managed by Neuberger Berman Fixed Income LLC (formerly known as Lehman Brothers Asset Management LLC) ("NBFI"), an affiliate of Management. Effective July 1, 2009, Dwight Asset Management Company LLC became the Sub-Adviser to the Quality Fund. The Quality Fund is not a money market fund that is registered under the 1940 Act and does not operate in accordance with all requirements of Rule 2a-7 under the 1940 Act. There is no assurance that the Quality Fund will maintain a $1.00 share price.
The market value of the Fund's investments in the Quality Fund as of the fiscal year ended December 31, 2009, if any, is reflected in the Fund's Schedule of Investments. If it were necessary to liquidate assets in the Quality Fund to meet returns on outstanding securities loans at a time when the Quality Fund's price per share was less than $1.00, the Fund may not receive an amount from the Quality Fund that is equal in amount to the collateral the Fund would be required to return to the borrower of the securities and the Fund would be required to make up for this shortfall. In addition, as a result of recent reduced liquidity in the credit and fixed income markets, it may be difficult to dispose quickly of some securities in the Quality Fund at the price at which the Quality Fund is carrying them.
Net income from the lending program represents any amounts received from a principal plus income earned on the cash collateral invested in Quality Fund or in other investments, if applicable, less cash collateral fees and other expenses associated with the loans. For the fiscal year ended December 31, 2009, the Fund received net income under the securities lending arrangement of approximately $101,750, which is reflected in the Statement of Operations under the caption "Income from securities loaned -- net." For the fiscal year ended December 31, 2009, "Income from securities loaned -- net" consisted of approximately $166,459 in income earned on cash collateral and amounts received from a principal (including approximately $135,519 of interest income earned from the Quality Fund), less fees and expenses paid of approximately $64,709.
10 Repurchase agreements: The Fund may enter into repurchase agreements with institutions that Management has determined are creditworthy. Each repurchase agreement is recorded at cost. The Fund requires that the securities purchased in a repurchase agreement be transferred to the custodian in a manner sufficient to enable the Fund to assert a perfected security interest in those securities in the event of a default under the repurchase agreement. The Fund monitors, on a daily basis, the value of the securities transferred to ensure that their value, including accrued interest, is greater than amounts owed to the Fund under each such repurchase agreement.
11 Transactions with other funds managed by Neuberger Berman Management LLC: Pursuant to an Exemptive Order issued by the Securities and Exchange Commission, the Fund may invest in a money market fund managed by Management or an affiliate. Through August 10, 2009, the Fund invested in Neuberger Berman Prime Money Fund ("Prime Money"), as approved by the Board. Prime Money sought to provide the highest available current income consistent with safety and liquidity. For any cash that the Fund invested in Prime Money, Management waived a portion of its management fee equal to the management fee it received from Prime Money on those assets (the "Arrangement"). For the year ended December 31, 2009, management fees waived under this Arrangement amounted to $186 and are reflected in the Statement of Operations under the caption "Investment management fees waived." For the year ended December 31, 2009, income earned under this Arrangement amounted to $447 and is reflected in the Statement of Operations under the caption "Income from investments in affiliated issuers."
On August 10, 2009, the Fund ceased investing in Prime Money. On this date, the Fund's shares of Prime Money were redeemed in exchange for portfolio holdings of Prime Money, which were used to purchase Institutional Class shares of State Street Institutional Liquid Reserves Fund.
12 Investments in foreign securities: Investing in foreign securities may involve certain sovereign and other risks, in addition to the credit and market risks normally associated with domestic securities. These additional risks include the possibility of adverse political and economic developments (including political instability, nationalization, expropriation, or confiscatory taxation) and the potentially adverse effects of unavailability of public information regarding issuers, less governmental supervision and regulation of financial markets, reduced liquidity of certain
16
financial markets, and the lack of uniform accounting, auditing, and financial reporting standards or the application of standards that are different or less stringent than those applied in the United States. Foreign securities also may experience greater price volatility, higher rates of inflation, and delays in settlement.
13 Derivative instruments: Management has evaluated the requirements of ASC 815 "Disclosures about Derivative Instruments and Hedging Activities ("ASC 815"), formerly known as FASB Statement of Financial Accounting Standards No. 161, "Disclosures about Derivative Instruments and Hedging Activities," which are effective for financial statements issued for fiscal years and interim periods beginning after November 15, 2008. ASC 815 requires enhanced disclosures about a fund's derivative and hedging activities. Management has concluded that, since the Fund did not hold any derivative instruments during the year ended December 31, 2009, no additional disclosures pursuant to ASC 815 are required at this time.
14 Indemnifications: Like many other companies, the Trust's organizational documents provide that its officers and trustees are indemnified against certain liabilities arising out of the performance of their duties to the Trust. In addition, both in some of its principal service contracts and in the normal course of its business, the Trust enters into contracts that provide indemnifications to other parties for certain types of losses or liabilities. The Trust's maximum exposure under these arrangements is unknown as this could involve future claims against the Trust.
Note B--Management Fees, Administration Fees, Distribution Arrangements, and Other Transactions With Affiliates:
Fund shares are issued and redeemed in connection with investments in and payments under certain variable annuity contracts and variable life insurance policies issued through separate accounts of life insurance companies and are also offered directly to qualified pension and retirement plans.
The Fund retains Management as its investment manager under a Management Agreement. For such investment management services, the Fund pays Management a fee at the annual rate of 0.55% of the first $250 million of the Fund's average daily net assets, 0.525% of the next $250 million, 0.50% of the next $250 million, 0.475% of the next $250 million, 0.45% of the next $500 million, 0.425% of the next $2.5 billion, and 0.40% of average daily net assets in excess of $4 billion.
The Fund retains Management as its administrator under an Administration Agreement. The Fund pays Management an administration fee at the annual rate of 0.30% of its average daily net assets under this agreement. Additionally, Management retains State Street Bank and Trust Company ("State Street") as its sub-administrator under a Sub-Administration Agreement. Management pays State Street a fee for all services received under this agreement.
The Board adopted a non-fee distribution plan for the Fund.
Management has contractually undertaken through December 31, 2012 to forgo current payment of fees and/or reimburse the Fund for its operating expenses (excluding fees payable to Management, interest, taxes, brokerage commissions, extraordinary expenses, and transaction costs) ("Operating Expenses") which exceed, in the aggregate, 1.00% per annum of the Fund's average daily net assets (the "Expense Limitation"). For the year ended December 31, 2009, no reimbursement to the Fund was required. The Fund has agreed to repay Management through December 31, 2015 for fees and expenses foregone and/or its excess Operating Expenses previously reimbursed by Management, so long as its annual Operating Expenses during that period do not exceed its Expense Limitation, and the repayment is made within three years after the year in which Management issued the reimbursement or waived fees. During the year ended December 31, 2009, there was no repayment to Management under this agreement. At December 31, 2009, the Fund had no contingent liability to Management under this agreement.
17
Neuberger Berman LLC (formerly known as Neuberger Berman, LLC) ("Neuberger") is retained by Management to furnish it with investment recommendations and research information without added cost to the Fund. Several individuals who are officers and/or trustees of the Trust are also employees of Neuberger and/or Management.
During the reporting period, the predecessor of Management, the investment manager of the Fund, and Neuberger, the sub-adviser of the Fund, were wholly owned subsidiaries of Lehman Brothers Holdings Inc. ("Lehman Brothers"), a publicly owned holding company. On September 15, 2008, Lehman Brothers filed a voluntary petition under Chapter 11 of the U.S. Bankruptcy Code. On December 3, 2008, NBSH Acquisition, LLC ("NBSH"), an entity organized by key members of Neuberger Berman's senior management, was selected as the successful bidder in the public auction to acquire a majority interest in Neuberger Berman's business and the fixed income and certain alternative asset management businesses of Lehman Brothers' Investment Management Division (together with Neuberger Berman, the "Acquired Businesses") (the "Acquisition"). On December 22, 2008, the bankruptcy court having jurisdiction over the Lehman Brothers matter approved the sale of the Acquired Businesses to NBSH (or its successor or assign), as the successful bidder.
The Acquisition closed on May 4, 2009. The Acquired Businesses are now indirectly owned by, among others, portfolio managers, Neuberger Berman's management team, and certain key members and senior professionals who are employed in various parts of the Neuberger Berman complex of companies, with a minority interest retained by Lehman Brothers and certain affiliates of Lehman Brothers.
The closing of the Acquisition resulted in an "assignment" of the Fund's Management Agreement and Sub- Advisory Agreement. Such an assignment, by law, automatically terminated those agreements. Accordingly, prior to the closing, the Board, including the Trustees who are not "interested persons" of the Fund's investment manager and its affiliates or the Fund, considered and approved a new Management Agreement and Sub-Advisory Agreement for the Fund. The new agreements, which are virtually identical to those previously in effect, were also approved by a vote of the Fund's shareholders.
These events have not had a material impact on the Fund or its operations. Management and Neuberger continue to operate in the ordinary course of business as the investment manager and sub-adviser of the Fund.
The Fund has an expense offset arrangement in connection with its custodian contract. For the year ended December 31, 2009, there was no reduction of expenses under this arrangement.
Note C--Securities Transactions:
During the year ended December 31, 2009, there were purchase and sale transactions (excluding short-term securities) of $34,309,200 and $120,034,657, respectively.
During the year ended December 31, 2009, no brokerage commissions on securities transactions were paid to affiliated brokers.
Note D--Fund Share Transactions:
Share activity for the years ended December 31, 2009 and December 31, 2008 was as follows:
| | | For the Year Ended December 31, | |
| | | 2009 | | 2008 | |
| Shares Sold | | | 56,733 | | | | 83,656 | | |
| Shares Redeemed | | | (7,077,691 | ) | | | (1,478,574 | ) | |
| Total | | | (7,020,958 | ) | | | (1,394,918 | ) | |
18
Note E--Line of Credit:
At December 31, 2009, the Fund was a participant in a single committed, unsecured $150,000,000 line of credit with State Street, to be used only for temporary or emergency purposes. Other investment companies managed by Management also participate in this line of credit on the same terms. Interest is charged on borrowings under this line of credit at the higher of (a) the Federal Funds Rate plus 1.25% per annum or (b) the Overnight LIBOR Rate plus 1.25% per annum. Prior to September 18, 2009, interest was charged on borrowings under this line of credit at the Federal Funds Rate plus 0.50% per annum. A facility fee of 0.15% (prior to September 18, 2009, 0.09%) per annum of the available line of credit is charged, of which the Fund has agreed to pay its pro rata share, based on the ratio of its individual net assets to the net assets of all participants at the time the fee is due and payable. The fee is paid quarterly in arrears. Because several investment companies participate, there is no assurance that an individual Fund will have access to all or any part of the $150,000,000 at any particular time. There were no loans outstanding pursuant to this line of credit at December 31, 2009. During the year ended December 31, 2009, the Fund did not utilize this line of credit.
Note F--Investments in Affiliates:
| Name of Issuer | | Balance of
Shares
Held
December 31,
2008 | | Gross
Purchases
and
Additions | | Gross
Sales
and
Reductions | | Balance of
Shares
Held
December 31,
2009 | | Value
December 31,
2009 | | Income from
Investments in
Affiliated
Issuers
Included in
Total Income | |
Neuberger Berman Prime
Money Fund Trust Class* | | | 367,842 | | | | 10,661,268 | | | | 11,029,110 | | | | -- | | | $ | -- | | | $ | 447 | | |
Neuberger Berman Securities
Lending Quality Fund, LLC** | | | 10,488,504 | | | | 50,788,317 | | | | 61,276,821 | | | | -- | | | | -- | | | | 135,519 | | |
| Total | | | | | | | | | | $ | -- | | | $ | 135,966 | | |
* Prime Money was also managed by Management and may have been considered an affiliate since it had the same officers, Board members, and investment manager as the Fund and because, at times, the Fund may have owned 5% or more of the outstanding voting securities of Prime Money.
** Quality Fund, a fund managed by NBFI, an affiliate of Management, is used to invest cash the Fund receives as collateral for securities loaned as approved by the Board. Because all shares of Quality Fund are held by funds in the related investment management complex, Quality Fund may be considered an affiliate of the Fund.
Note G--Subsequent Events:
In accordance with the provision set forth in ASC 855 "Subsequent Events" ("ASC 855") formerly known as FAS 165, "Subsequent Events," Management has evaluated the possibility of subsequent events existing in the Fund's financial statements through February 9, 2010. Management has determined that there are no subsequent events that, in accordance with ASC 855, would need to be disclosed in the Fund's financial statements through this date.
19
Financial Highlights
Growth Portfolio
The following table includes selected data for a share outstanding throughout each year and other performance information derived from the Financial Statements.
| | | Year Ended December 31, | |
| | | 2009 | | 2008 | | 2007 | | 2006 | | 2005 | |
| Net Asset Value, Beginning of Year | | $ | 10.87 | | | $ | 19.30 | | | $ | 15.73 | | | $ | 13.79 | | | $ | 12.15 | | |
| Income From Investment Operations: | |
| Net Investment Income (Loss)tt | | | (.05 | ) | | | (.10 | ) | | | (.11 | ) | | | (.05 | ) | | | (.07 | ) | |
Net Gains or Losses on Securities
(both realized and unrealized) | | | 3.38 | | | | (8.33 | ) | | | 3.68 | | | | 1.99 | | | | 1.71 | | |
| Total From Investment Operations | | | 3.33 | | | | (8.43 | ) | | | 3.57 | | | | 1.94 | | | | 1.64 | | |
| Net Asset Value, End of Year | | $ | 14.20 | | | $ | 10.87 | | | $ | 19.30 | | | $ | 15.73 | | | $ | 13.79 | | |
| Total Returntt | | | 30.63 | % | | | (43.68 | )% | | | 22.70 | % | | | 14.07 | % | | | 13.50 | % | |
| Ratios/Supplemental Data | |
| Net Assets, End of Year (in millions) | | $ | 7.5 | | | $ | 82.0 | | | $ | 172.6 | | | $ | 167.7 | | | $ | 196.5 | | |
| Ratio of Gross Expenses to Average Net Assets# | | | 1.27 | % | | | 1.04 | % | | | 1.00 | % | | | 1.00 | % | | | 1.00 | % | |
| Ratio of Net Expenses to Average Net AssetsS | | | 1.27 | % | | | 1.04 | % | | | .99 | % | | | .99 | % | | | .99 | % | |
Ratio of Net Investment Income (Loss) to Average
Net Assets | | | (.49 | )% | | | (.63 | )% | | | (.61 | )% | | | (.35 | )% | | | (.55 | )% | |
| Portfolio Turnover Rate | | | 68 | % | | | 63 | % | | | 48 | % | | | 40 | % | | | 53 | % | |
See Notes to Financial Highlights 20
Notes to Financial Highlights Growth Portfolio
tt Total return based on per share net asset value reflects the effects of changes in net asset value on the performance of the Fund during each fiscal period and assumes dividends and other distributions, if any, were reinvested. Results represent past performance and do not guarantee future results. Current returns may be lower or higher than the performance data quoted. Investment returns and principal may fluctuate and shares when redeemed may be worth more or less than original cost. Total return would have been lower if Management had not waived certain expenses. The total return information shown does not reflect charges and other expenses that apply to the separate account or the related insurance policies, and the inclusion of these charges and other expenses would reduce the total return for all fiscal periods shown.
# The Fund is required to calculate an expense ratio without taking into consideration any expense reductions related to expense offset arrangements.
tt Calculated based on the average number of shares outstanding during each fiscal period.
S After waiver of a portion of the investment management fee by Management. Had Management not undertaken such action, the annualized ratios of net expenses to average daily net assets would have been:
| | | Year Ended December 31, | |
| 2009 | | 2008 | | 2007 | | 2006 | | 2005 | |
| | 1.27 | % | | | 1.04 | % | | | .99 | % | | | .99 | % | | | .99 | % | |
21
Report of Independent Registered Public Accounting Firm
To the Board of Trustees of
Neuberger Berman Advisers Management Trust and
Shareholders of Growth Portfolio
We have audited the accompanying statement of assets and liabilities, including the schedule of investments, of Growth Portfolio, one of the series constituting Neuberger Berman Advisers Management Trust (the "Trust"), as of December 31, 2009, and the related statement of operations for the year then ended, the statement of changes in net assets for each of the two years in the period then ended, and the financial highlights for each of the five years in the period then ended. These financial statements and financial highlights are the responsibility of the Trust's management. Our responsibility is to express an opinion on these financial statements and financial highlights based on our audits.
We conducted our audits in accordance with the standards of the Public Company Accounting Oversight Board (United States). Those standards require that we plan and perform the audit to obtain reasonable assurance about whether the financial statements and financial highlights are free of material misstatement. We were not engaged to perform an audit of the Trust's internal control over financial reporting. Our audits included consideration of internal control over financial reporting as a basis for designing audit procedures that are appropriate in the circumstances, but not for the purpose of expressing an opinion on the effectiveness of the Trust's internal control over financial reporting. Accordingly, we express no such opinion. An audit also includes examining, on a test basis, evidence supporting the amounts and disclosures in the financial statements and financial highlights, assessing the accounting principles used and significant estimates made by management, and evaluating the overall financial statement presentation. Our procedures included confirmation of securities owned as of December 31, 2009 by correspondence with the custodian and brokers. We believe that our audits provide a reasonable basis for our opinion.
In our opinion, the financial statements and financial highlights referred to above present fairly, in all material respects, the financial position of Growth Portfolio, a series of Neuberger Berman Advisers Management Trust, at December 31, 2009, the results of its operations for the year then ended, the changes in its net assets for each of the two years in the period then ended, and the financial highlights for each of the five years in the period then ended, in conformity with U.S. generally accepted accounting principles.
Boston, Massachusetts
February 9, 2010
22
Trustee and Officer Information
The following tables set forth information concerning the trustees and officers of the Trust. All persons named as trustees and officers also serve in similar capacities for other funds administered or managed by Management and Neuberger. The Statement of Additional Information includes additional information about fund trustees and is available upon request, without charge, by calling (800) 877-9700.
Information about the Board of Trustees
Name, (Year of Birth),
and Address(1) | | Position and
Length of
Time Served(2) | | Principal Occupation(s)(3) | | Number of
Funds in Fund
Complex
Overseen by
Fund Trustee | | Other Directorships
Held Outside Fund
Complex by Fund
Trustee | |
| Independent Fund Trustees | |
|
| John Cannon (1930) | | Trustee since 2000 | | Consultant; formerly, Chairman, CDC Investment Advisers (registered investment adviser), 1993 to January 1999; formerly, President and Chief Executive Officer, AMA Investment Advisors, an affiliate of the American Medical Association. | | | 46 | | | Formerly, Independent Trustee or Director of three series of Oppenheimer Funds: Oppenheimer Limited Term New York Municipal Fund, Rochester Fund Municipals, and Oppenheimer Convertible Securities Fund (1992 to 2009). | |
|
| Faith Colish (1935) | | Trustee since 1982 | | Counsel, Carter Ledyard & Milburn LLP (law firm) since October 2002; formerly, Attorney-at-Law and President, Faith Colish, A Professional Corporation, 1980 to 2002. | | | 46 | | | Formerly, Director (1997 to 2003) and Advisory Director (2003 to 2006), ABA Retirement Funds (formerly, American Bar Retirement Association) (not-for-profit membership corporation). | |
|
23
Name, (Year of Birth),
and Address(1) | | Position and
Length of
Time Served(2) | | Principal Occupation(s)(3) | | Number of
Funds in Fund
Complex
Overseen by
Fund Trustee | | Other Directorships
Held Outside Fund
Complex by Fund
Trustee | |
| Martha C. Goss (1949) | | Trustee since 2007 | | President, Woodhill Enterprises Inc./Chase Hollow Associates LLC (personal investment vehicle), since 2006; Chief Operating and Financial Officer, Hopewell Holdings LLC/Amwell Holdings, LLC (a holding company for a healthcare reinsurance company start-up), since 2003; formerly, Consultant, Resources Connection (temporary staffing), 2002 to 2006. | | | 46 | | | Director, Ocwen Financial Corporation (mortgage servicing), since 2005; Director, American Water (water utility), since 2003; Director, Channel Reinsurance (financial guaranty reinsurance), since 2006; Advisory Board Member, Attensity (software developer), since 2005; Director, Allianz Life of New York (insurance), since 2005; Director, Financial Women's Association of New York (not for profit association), since 2003; Trustee Emerita, Brown University, since 1998. | |
|
| C. Anne Harvey (1937) | | Trustee since 1998 | | President, C.A. Harvey Associates, since October 2001; formerly, Director, AARP, 1978 to December 2001. | | | 46 | | | Formerly, President, Board of Associates to The National Rehabilitation Hospital's Board of Directors, 2001 to 2002; formerly, Member, Individual Investors Advisory Committee to the New York Stock Exchange Board of Directors, 1998 to June 2002. | |
|
| Robert A. Kavesh (1927) | | Trustee since 2000 | | Retired; Marcus Nadler Professor Emeritus of Finance and Economics, New York University Stern School of Business; formerly, Executive Secretary-Treasurer, American Finance Association, 1961 to 1979. | | | 46 | | | Formerly, Director, The Caring Community (not-for-profit), 1997 to 2006; formerly, Director, DEL Laboratories, Inc. (cosmetics and pharmaceuticals), 1978 to 2004; formerly, Director, Apple Bank for Savings, 1979 to 1990; formerly, Director, Western Pacific Industries, Inc., 1972 to 1986 (public company). | |
|
24
Name, (Year of Birth),
and Address(1) | | Position and
Length of
Time Served(2) | | Principal Occupation(s)(3) | | Number of
Funds in Fund
Complex
Overseen by
Fund Trustee | | Other Directorships
Held Outside Fund
Complex by Fund
Trustee | |
| Michael M. Knetter (1960) | | Trustee since 2007 | | Dean, School of Business, University of Wisconsin - Madison; formerly, Professor of International Economics and Associate Dean, Amos Tuck School of Business - Dartmouth College, 1998 to 2002. | | | 46 | | | Trustee, Northwestern Mutual Series Fund, Inc., since February 2007; Director, Wausau Paper, since 2005; Director, Great Wolf Resorts, since 2004. | |
|
| Howard A. Mileaf (1937) | | Trustee since 1999 | | Retired; formerly, Vice President and General Counsel, WHX Corporation (holding company), 1993 to 2001. | | | 46 | | | Formerly, Director, Webfinancial Corporation (holding company), 2002 to 2008; formerly, Director WHX Corporation (holding company), January 2002 to June 2005; formerly, Director, State Theatre of New Jersey (not-for-profit theater), 2000 to 2005. | |
|
| George W. Morriss (1947) | | Trustee since 2007 | | Retired; formerly, Executive Vice President and Chief Financial Officer, People's Bank, Connecticut (a financial services company), 1991 to 2001. | | | 46 | | | Manager, Old Mutual 2100 fund complex (consisting of six funds) since October 2006 for four funds and since February 2007 for two funds; formerly, Member NASDAQ Issuers' Affairs Committee, 1995 to 2003. | |
|
| Edward I. O'Brien (1928) | | Trustee since 2000 | | Retired; Formerly, Member, Investment Policy Committee, Edward Jones, 1993 to 2001; President, Securities Industry Association ("SIA") (securities industry's representative in government relations and regulatory matters at the federal and state levels), 1974 to 1992; Adviser to SIA, November 1992 to November 1993. | | | 46 | | | Formerly, Director, Legg Mason, Inc. (financial services holding company), 1993 to July 2008; formerly, Director, Boston Financial Group (real estate and tax shelters), 1993 to 1999. | |
|
25
Name, (Year of Birth),
and Address(1) | | Position and
Length of
Time Served(2) | | Principal Occupation(s)(3) | | Number of
Funds in Fund
Complex
Overseen by
Fund Trustee | | Other Directorships
Held Outside Fund
Complex by Fund
Trustee | |
| Cornelius T. Ryan (1931) | | Trustee since 2000 | | Founding General Partner, Oxford Partners and Oxford Bioscience Partners (venture capital investing) and President, Oxford Venture Corporation, since 1981. | | | 46 | | | None. | |
|
| Tom D. Seip (1950) | | Trustee since 2000; Chairman of the Board since 2008; Lead Independent Trustee from 2006 to 2008 | | General Partner, Seip Investments LP (a private investment partnership); formerly, President and CEO, Westaff, Inc. (temporary staffing), May 2001 to January 2002; formerly, Senior Executive at the Charles Schwab Corporation, 1983 to 1998, including Chief Executive Officer, Charles Schwab Investment Management, Inc., and Trustee, Schwab Family of Funds and Schwab Investments, 1997 to 1998, and Executive Vice President-Retail Brokerage, Charles Schwab & Co., Inc., 1994 to 1997. | | | 46 | | | Director, H&R Block, Inc. (financial services company), since May 2001; Chairman, Compensation Committee, H&R Block, Inc., since 2006; formerly, Director, Forward Management, Inc. (asset management company), 1999 to 2006. | |
|
26
Name, (Year of Birth),
and Address(1) | | Position and
Length of
Time Served(2) | | Principal Occupation(s)(3) | | Number of
Funds in Fund
Complex
Overseen by
Fund Trustee | | Other Directorships
Held Outside Fund
Complex by Fund
Trustee
| |
| Candace L. Straight (1947) | | Trustee since 1999 | | Private investor and consultant specializing in the insurance industry; formerly, Advisory Director, Securitas Capital LLC (a global private equity investment firm dedicated to making investments in the insurance sector), 1998 to December 2003. | | | 46 | | | Director, Montpelier Re (reinsurance company), since 2006; formerly, Director, National Atlantic Holdings Corporation (property and casualty insurance company), 2004 to 2008; formerly, Director, The Proformance Insurance Company (property and casualty insurance company), 2004 to 2008; formerly, Director, Providence Washington Insurance Company (property and casualty insurance company), December 1998 to March 2006; formerly, Director, Summit Global Partners (insurance brokerage firm), 2000 to 2005. | |
|
| Peter P. Trapp (1944) | | Trustee since 1984 | | Retired; formerly, Regional Manager for Mid-Southern Region, Ford Motor Credit Company, September 1997 to 2007; formerly, President, Ford Life Insurance Company, April 1995 to August 1997. | | | 46 | | | None. | |
|
27
Name, (Year of Birth),
and Address(1) | | Position and
Length of
Time Served(2) | | Principal Occupation(s)(3) | | Number of
Funds in Fund
Complex
Overseen by
Fund Trustee | | Other Directorships
Held Outside Fund
Complex by Fund
Trustee
| |
| Fund Trustees who are "Interested Persons" | |
|
| Joseph V. Amato* (1962) | | Trustee since 2009 | | President and Director, Neuberger Berman Group LLC, since 2009; President and Chief Executive Officer, Neuberger and Neuberger Berman Holdings LLC (including its predecessor, Neuberger Berman Inc.), since 2007; Chief Investment Officer, Neuberger, since 2009; Chief Executive Officer (Equities) and Managing Director, Management, since 2009; Managing Director, Neuberger Berman Fixed Income LLC ("NBFI"), since 2007; Board member of NBFI since 2006; formerly, Global Head of Asset Management of Lehman Brothers Holdings Inc.'s ("LBHI") Investment Management division, 2006 to 2009; formerly, member of LBHI's Investment Management Division's Executive Management Committee, 2006 to 2009; formerly, Managing Director, Lehman Brothers Inc. ("LBI"), 2006 to 2008; formerly, Chief Recruiting and Development Officer, LBI, 2005 to 2006; formerly, Global Head of LBI's Equity Sales and a Member of its Equities Division Executive Committee, 2003 to 2005. | | | 46 | | | Member of Board of Advisors, McDonough School of Business, Georgetown University, since 2001; Member of New York City Board of Advisors, Teach for America, since 2005; Trustee, Montclair Kimberley Academy (private school), since 2007. | |
|
28
Name, (Year of Birth),
and Address(1) | | Position and
Length of
Time Served(2) | | Principal Occupation(s)(3) | | Number of
Funds in Fund
Complex
Overseen by
Fund Trustee | | Other Directorships
Held Outside Fund
Complex by Fund
Trustee
| |
| Robert Conti* (1956) | | Chief Executive Officer, President and Trustee since 2008; prior thereto, Executive Vice President in 2008 and Vice President 2000 to 2008 | | Managing Director, Neuberger, since 2007; formerly, Senior Vice President, Neuberger, 2003 to 2006; formerly, Vice President, Neuberger, 1999 to 2003; President and Chief Executive Officer, Management, since 2008; formerly, Senior Vice President, Management, 2000 to 2008. | | | 46 | | | Chairman of the Board, Staten Island Mental Health Society since 2008. | |
|
| Jack L. Rivkin* (1940) | | Trustee since 2002; President from 2002 to 2008 | | Formerly, Executive Vice President and Chief Investment Officer, Neuberger Berman Holdings LLC (holding company), 2002 to August 2008 and 2003 to August 2008, respectively; formerly, Managing Director and Chief Investment Officer, Neuberger, December 2005 to August 2008 and 2003 to August 2008, respectively; formerly, Executive Vice President, Neuberger, December 2002 to 2005; formerly, Director and Chairman, Management, December 2002 to August 2008; formerly, Executive Vice President, Citigroup Investments, Inc., September 1995 to February 2002; formerly, Executive Vice President, Citigroup Inc., September 1995 to February 2002. | | | 46 | | | Director, Idealab (private company), since 2009; Director, Distributed World Power (private company), since 2009; Director, Dale Carnegie and Associates, Inc. (private company), since 1998; Director, Solbright, Inc. (private company), since 1997; formerly, Director, New York Society of Security Analysts (2006 to 2008). | |
|
(1) The business address of each listed person is 605 Third Avenue, New York, New York 10158.
(2) Pursuant to the Trust's Trust Instrument, each of these Fund Trustees shall hold office for life or until his or her successor is elected or the Trust terminates; except that (a) any Fund Trustee may resign by delivering a written resignation; (b) any Fund Trustee may be removed with or without cause at any time by a written instrument signed by at least two-thirds of the other Fund Trustees; (c) any Fund Trustee who requests to be retired, or who has become unable to serve, may be retired by a written instrument signed by a majority of the other Fund Trustees; and (d) any Fund Trustee may be removed at any shareholder meeting by a vote of at least two-thirds of the outstanding shares.
29
(3) Except as otherwise indicated, each individual has held the positions shown for at least the last five years.
* Indicates a Fund Trustee who is an "interested person" within the meaning of the 1940 Act. Mr. Amato and Mr. Conti are interested persons of the Trust by virtue of the fact that each is an officer of Management, Neuberger and/or their affiliates. Mr. Rivkin may be deemed an interested person of the Trust by virtue of the fact that, until August 2008, he was a director of Management and an officer of Neuberger.
30
Information about the Officers of the Trust
Name, (Year of Birth),
and Address(1) | | Position and
Length of Time
Served(2) | | Principal Occupation(s)(3)
| |
| Andrew B. Allard (1961) | | Anti-Money Laundering Compliance Officer since 2002 | | Senior Vice President, Neuberger, since 2006; Deputy General Counsel, Neuberger, since 2004; formerly, Vice President, Neuberger, 2000 to 2005; formerly, Associate General Counsel, Neuberger, 1999 to 2004; Anti-Money Laundering Compliance Officer, nine registered investment companies for which Management acts as investment manager and administrator (six since 2002, two since 2003 and one since 2006). | |
|
| Claudia A. Brandon (1956) | | Executive Vice President since 2008 and Secretary since 1985 | | Senior Vice President, Neuberger, since 2007 and Employee since 1999; formerly, Vice President, Neuberger, 2002 to 2006; Senior Vice President, Management, since 2008 and Assistant Secretary since 2004; formerly, Vice President-Mutual Fund Board Relations, Management, 2000 to 2008; Executive Vice President, nine registered investment companies for which Management acts as investment manager and administrator (nine since 2008); Secretary, nine registered investment companies for which Management acts as investment manager and administrator (three since 1985, three since 2002, two since 2003 and one since 2006). | |
|
| Maxine L. Gerson (1950) | | Executive Vice President since 2008 and Chief Legal Officer since 2005 (only for purposes of sections 307 and 406 of the Sarbanes-Oxley Act of 2002) | | Senior Vice President, Neuberger, since 2002; Deputy General Counsel and Assistant Secretary, Neuberger, since 2001; Senior Vice President, Management, since 2006; Secretary and General Counsel, Management, since 2004; Executive Vice President, nine registered investment companies for which Management acts as investment manager and administrator (nine since 2008); Chief Legal Officer (only for purposes of sections 307 and 406 of the Sarbanes-Oxley Act of 2002), nine registered investment companies for which Management acts as investment manager and administrator (eight since 2005 and one since 2006). | |
|
| Sheila R. James (1965) | | Assistant Secretary since 2002 | | Vice President, Neuberger, since 2008 and Employee since 1999; formerly, Assistant Vice President, Neuberger, 2007; Assistant Secretary, nine registered investment companies for which Management acts as investment manager and administrator (six since 2002, two since 2003 and one since 2006). | |
|
| Brian Kerrane (1969) | | Vice President since 2008 | | Senior Vice President, Neuberger, since 2006; formerly, Vice President, Neuberger, 2002 to 2006; Vice President, Management, since 2008 and Employee since 1991; Vice President, nine registered investment companies for which Management acts as investment manager and administrator (nine since 2008). | |
|
| Kevin Lyons (1955) | | Assistant Secretary since 2003 | | Assistant Vice President, Neuberger, since 2008 and Employee since 1999; Assistant Secretary, nine registered investment companies for which Management acts as investment manager and administrator (eight since 2003 and one since 2006). | |
|
31
Name, (Year of Birth),
and Address(1) | | Position and
Length of Time
Served(2) | | Principal Occupation(s)(3)
| |
| Owen F. McEntee, Jr. (1961) | | Vice President since 2008 | | Vice President, Neuberger, since 2006; Employee, Management, since 1992; Vice President, nine registered investment companies for which Management acts as investment manager and administrator (nine since 2008). | |
|
| John M. McGovern (1970) | | Treasurer and Principal Financial and Accounting Officer since 2005; prior thereto, Assistant Treasurer since 2002 | | Senior Vice President, Neuberger, since 2007; formerly, Vice President, Neuberger, 2004 to 2006; Employee, Management, since 1993; Treasurer and Principal Financial and Accounting Officer, nine registered investment companies for which Management acts as investment manager and administrator (eight since 2005 and one since 2006); formerly, Assistant Treasurer, eight registered investment companies for which Management acts as investment manager and administrator, 2002 to 2005. | |
|
| Andrew Provencher (1965) | | Vice President since 2008 | | Managing Director, Management, since 2008; Managing Director, Neuberger, since 2005; formerly, Senior Vice President, Neuberger, 2003 to 2005; formerly, Vice President, Neuberger, 1999 to 2003; Vice President, nine registered investment companies for which Management acts as investment manager and administrator (nine since 2008). | |
|
| Frank Rosato (1971) | | Assistant Treasurer since 2005 | | Vice President, Neuberger, since 2006; Employee, Management, since 1995; Assistant Treasurer, nine registered investment companies for which Management acts as investment manager and administrator (eight since 2005 and one since 2006). | |
|
| Neil S. Siegel (1967) | | Vice President since 2008 | | Managing Director, Management, since 2008; Managing Director, Neuberger, since 2006; formerly, Senior Vice President, Neuberger, 2004 to 2006; Vice President, nine registered investment companies for which Management acts as investment manager and administrator (nine since 2008); formerly, Head of Institutional Marketing, Morgan Stanley Investment Management, 1993 to 2004. | |
|
| Chamaine Williams (1971) | | Chief Compliance Officer since 2005 | | Senior Vice President, Neuberger, since 2007; Chief Compliance Officer, Management, since 2006; Chief Compliance Officer, nine registered investment companies for which Management acts as investment manager and administrator (eight since 2005 and one since 2006); formerly, Senior Vice President, LBI, 2007 to 2008; formerly, Vice President, LBI, 2003 to 2006; formerly, Chief Compliance Officer, Lehman Brothers Asset Management Inc., 2003 to 2007; formerly, Chief Compliance Officer, Lehman Brothers Alternative Investment Management LLC, 2003 to 2007; formerly, Vice President, UBS Global Asset Management (US) Inc. (formerly, Mitchell Hutchins Asset Management, a wholly-owned subsidiary of PaineWebber Inc.), 1997 to 2003. | |
|
(1) The business address of each listed person is 605 Third Avenue, New York, New York 10158.
(2) Pursuant to the By-Laws of the Trust, each officer elected by the Fund Trustees shall hold office until his or her successor shall have been elected and qualified or until his or her earlier death, inability to serve, or resignation. Officers serve at the pleasure of the Fund Trustees and may be removed at any time with or without cause.
(3) Except as otherwise indicated, each individual has held the positions shown for at least the last five years.
32
Proxy Voting Policies and Procedures
A description of the policies and procedures that the Trust uses to determine how to vote proxies relating to portfolio securities is available, without charge, by calling 1-800-877-9700 (toll-free) and on the website of the Securities and Exchange Commission, at www.sec.gov. Information regarding how the Trust voted proxies relating to portfolio securities during the most recent 12-month period ended June 30 is also available, without charge, by calling 1-800-877-9700 (toll-free), on the website of the Securities and Exchange Commission at www.sec.gov, and on Management's website at www.nb.com.
Quarterly Portfolio Schedule
The Trust files a complete schedule of portfolio holdings for the Fund with the Securities and Exchange Commission for the first and third quarters of each fiscal year on Form N-Q. The Trust's Forms N-Q are available on the Securities and Exchange Commission's website at www.sec.gov and may be reviewed and copied at the Securities and Exchange Commission's Public Reference Room in Washington, DC. Information on the operation of the Public Reference Room may be obtained by calling 1-800-SEC-0330. The information on Form N-Q is available upon request, without charge, by calling 1-800-877-9700 (toll free).
33
Neuberger Berman
Advisers Management Trust
Guardian Portfolio
I Class Shares
S Class Shares
Annual Report
December 31, 2009
Guardian Portfolio Manager's Commentary
We are pleased to report that, for the year ended December 31, 2009, the Neuberger Berman Advisers Management Trust (AMT) Guardian Portfolio provided a positive return and outperformed its benchmark, the S&P 500 Index.
Early in the year, equities suffered under the macroeconomic impact of the financial crisis. Industrial activity collapsed as businesses moved to conserve cash against an uncertain backdrop, sharply cutting employment and curtailing production in order to reduce inventories.
The semiconductor industry was among the first to react to the crisis, slashing production in the fall of 2008. By February 2009, semiconductor inventories had reached unsustainably low levels, forcing the industry to increase production to satisfy even low levels of demand. Other industries would follow soon. By the time the financial markets began to rebound in March, the reversal in the inventory cycle was joined by governmental stimulus programs and aggressive Federal Reserve policy. By spring, credit markets stabilized as some of the most severely damaged financial firms reported better-than-expected earnings.
The rally that ensued lifted investor sentiment and risk appetite. Many of the areas hardest hit during the decline--those most closely tied to a cyclical recovery, such as credit-sensitive financials, heavy industrials, materials, and consumer retail--rebounded strongly, fueling second-half returns. Less economically sensitive stocks, while up, underperformed.
For the calendar year, the Portfolio's returns were strongly influenced by evolving investor sentiment. Our focus on quality companies with strong balance sheets positioned for advantaged growth through economic cycles helped the Portfolio significantly outperform during the first half of the period. As the market bottomed, investors shifted toward stocks perceived to benefit most from economic recovery. As this occurred, our large lead versus the broader market contracted, and the Portfolio ended the year with a smaller, yet significant positive margin.
Our strongest performers in 2009 included Scripps Networks, best known for its Food and Home and Garden cable networks. Despite a challenging advertising environment, we believe Scripps grew its business in 2009, driven by the strong affinity of its brands with consumers. With strong fundamentals and a very resilient business, the stock almost doubled this past year.
Newfield Exploration, a natural gas exploration and production company, was another top performer. Until recently, investors had underappreciated the potential value of Newfield's production acreage. Newfield bounced off depressed lows in 2009 as energy rebounded, and as its long-term growth potential became better recognized. Altera, a long-term core semiconductor holding, also performed well. Because of the value proposition of its product line, Altera's revenues held up better than its peers, which supported the stock during 2009's early weakness and through the subsequent rally.
Disappointments for the Portfolio included biotech firm Genzyme, which we sold late in the year. Manufacturing issues hurt Genzyme's ability to serve customers and may have eased the path for entry by competitors. We also eliminated our position in UnitedHealth Group, which was hurt by operating challenges and uncertainty about health care reform.
Other poor performers included Liberty Global and BorgWarner, companies we sold early in the year at a loss to make room for candidates we expected would perform better. Yahoo is one such addition, a company likely to be a beneficiary of the secular shift to Internet-based advertising. We continue to hold companies like Comcast, Waste Management and Bank of New York Mellon -- firms that delivered good operating results in a difficult environment, but became less interesting to investors as cyclicals rallied.
Looking ahead, while we expect several more quarters of stronger-than-expected economic growth driven by inventory restocking, the longer-term outlook remains uncertain. For instance, elevated unemployment is likely to constrain consumer spending. Also, many industrialized nations need to address serious fiscal problems, which could eventually lead to spending cuts and higher taxes. At some point, these factors could impact economic growth. We think their effect may be felt as the benefits of the inventory replenishment cycle wind down.
1
The uncertainties facing businesses and the lack of historical precedents keep us focused on high-quality companies whose growth is not closely tied to an economic rebound, and whose shares trade at or below the market average. Recent additions including Procter & Gamble, J.M. Smucker, SAIC and Roche are examples. These firms have strong balance sheets, generate significant free cash flow, have relatively predictable earnings, and have been selling at historically low valuations. We think such intrinsically strong businesses will benefit the portfolio in 2010 and across our 3-5 year investment horizon.
If the economic recovery is more robust than we expect, owning companies less geared to economic growth may prove a headwind. However, what we believe are extremely attractive current valuations should offset some of this risk. Our current holdings, we think, can deliver solid returns driven by earnings growth and dividends. Valuation expansion, if it occurs, would be an added catalyst.
As always, we look forward to continuing to serve your investment needs.
Sincerely,
Arthur Moretti
Portfolio Manager
2
Guardian Portfolio
SECTOR ALLOCATION
| (% of Equity Market Value) | |
| Consumer Discretionary | | | 13.9 | % | |
| Consumer Staples | | | 5.0 | | |
| Energy | | | 13.9 | | |
| Financials | | | 12.5 | | |
| Health Care | | | 5.8 | | |
| Industrials | | | 17.8 | | |
| Information Technology | | | 25.4 | | |
| Materials | | | 2.9 | | |
| Utilities | | | 2.8 | | |
| Total | | | 100.0 | % | |
AVERAGE ANNUAL TOTAL RETURN1
| | | Inception
Date | | 1 Year | | 5 Years | | 10 Years | | Life of
Fund* | |
| Guardian Portfolio Class I | | 11/03/1997 | | | 29.69 | % | | | 1.44 | % | | | 1.85 | % | | | 5.47 | % | |
| Guardian Portfolio Class S2 | | 08/02/2002 | | | 29.50 | % | | | 1.22 | % | | | 1.67 | % | | | 5.32 | % | |
| S&P 500 Index3 | | | | | 26.46 | % | | | 0.42 | % | | | -0.95 | % | | | 3.42 | % | |
Performance data quoted represent past performance, which is no guarantee of future results. The investment return and principal value of an investment will fluctuate so that an investor's shares, when redeemed may be worth more or less than their original cost. Results are shown on a "total return" basis and include reinvestment of all income dividends and distributions.
Current performance may be lower or higher than the performance data quoted. For performance data current to the most recent month end, please visit https://www.nb.com.
* Index returns are as of the inception date 11/03/1997.
As stated in the Portfolio's most recent prospectus, the total annual fund operating expense ratios for fiscal year 2008 were 1.01% and 1.28% for Class I and Class S shares, respectively (prior to any fee waivers or expense reimbursements). The net expense ratio was 1.25% for Class S shares. Neuberger Berman Management LLC has contractually agreed to limit certain expenses of the Portfolio through 12/31/2012 for Class I and Class S shares.
COMPARISON OF A $10,000 INVESTMENT
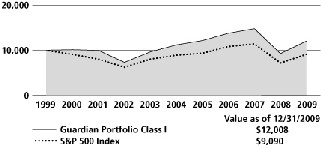
The chart shows the value of a hypothetical $10,000 investment in the Portfolio over the past 10 fiscal years, or since the Portfolio's inception, if it has not operated for 10 years. The graphs are based on Class I shares only; performance of other classes will vary due to differences in fee structures (see Average Annual Total Return chart above). The results are compared with benchmarks, which may include a broad-based market index and/or a narrower index. Please note that market indexes do not include expenses. All results include the reinvestment of income dividends and distributions. Results represent past performance and do not indicate future results. The chart and table do not reflect the deduction of taxes that a shareholder would pay on Portfolio distributions or the redemption of Portfolio shares.
Please see Endnotes for additional information.
3
Endnotes
1 "Total Return" includes reinvestment of all income dividends and distributions. Results represent past performance and do not indicate future results. The value of an investment in the Portfolio and the return on the investment both will fluctuate, and redemption proceeds may be higher or lower than an investor's original cost. The performance information does not reflect fees and expenses of the variable annuity and variable life insurance policies or the qualified pension and retirement plans whose proceeds are invested in the Portfolio. Neuberger Berman Management LLC ("NBM LLC") has agreed to absorb certain expenses of the AMT Portfolios, including the Portfolio. Without this arrangement, which is subject to change, the total returns of the Portfolio may have been less.
2 Performance shown prior to August 2, 2002 for the Class S shares is that of the Class I shares, which have lower expenses and correspondingly higher returns than Class S shares.
3 The S&P 500 Index is widely regarded as the standard for measuring large-cap U.S. stock market performance and includes a representative sample of leading companies in leading industries. Please note that indices do not take into account any fees and expenses of investing in the individual securities that they track and that individuals cannot invest directly in any index. Data about the performance of this index is prepared or obtained by NBM LLC and include reinvestment of all income dividends and distributions. The Portfolio may invest directly in many securities not included in the above-described index.
Any ratios or other measurements using a factor of forecasted earnings of a company discussed herein are based on consensus estimates, not NBM LLC's own projections, and they may or may not be realized. In addition, any revision to a forecast could affect the market price of a security. By quoting them herein, NBM LLC does not offer an opinion as to the accuracy of and does not guarantee these forecasted numbers.
The investments for the Portfolio are managed by the same portfolio manager(s) who manage one or more other mutual funds that have similar names, investment objectives and investment styles as the Portfolio. You should be aware that the Portfolio is likely to differ from the other mutual funds in size, cash flow pattern and tax matters. Accordingly, the holdings and performance can be expected to vary from those of the other mutual funds.
The composition, industries and holdings of the Portfolio are subject to change.
Shares of the separate AMT Portfolios are not available to the general public. Shares of this Portfolio may be purchased only by life insurance companies to be used with their separate accounts that fund variable annuity and variable life insurance policies and by qualified pension and retirement plans.
Statistics and projections in this report are derived from sources deemed to be reliable but cannot be regarded as a representation of future results of the AMT Portfolios. This report is prepared for the general information of shareholders and is not an offer of shares of the AMT Portfolios. Shares of the AMT Portfolios are sold only through the currently effective prospectuses, which must precede or accompany this report.
(c) 2010 Neuberger Berman Management LLC distributor. All rights reserved.
4
Information About Your Fund's Expenses
This table is designed to provide information regarding costs related to your investments. All mutual funds incur operating expenses, which include management fees, fees for administrative services and costs of shareholder reports, among others. The following examples are based on an investment of $1,000 made at the beginning of the six month period ended December 31, 2009 and held for the entire period. The table illustrates the fund's costs in two ways:
| Actual Expenses and Performance: | | The first section of the table provides information about actual account values and actual expenses in dollars, based on the fund's actual performance during the period. You may use the information in this line, together with the amount you invested, to estimate the expenses you paid over the period. Simply divide your account value by $1,000 (for example, an $8,600 account value divided by $1,000 = 8.6), then multiply the result by the number in the first section of the table under the heading entitled "Expenses Paid During the Period" to estimate the expenses you paid over the period. | |
|
Hypothetical Example for
Comparison Purposes: | | The second section of the table provides information about hypothetical account values and hypothetical expenses based on the fund's actual expense ratio and an assumed rate of return at 5% per year before expenses. This return is not the fund's actual return. The hypothetical account values and expenses may not be used to estimate the actual ending account balance or expenses you paid for the period. You may use this information to compare the ongoing costs of investing in this fund versus other funds. To do so, compare the expenses shown in this 5% hypothetical example with the 5% hypothetical examples that appear in the shareholder reports of other funds. | |
|
Please note that the expenses in the table are meant to highlight your ongoing costs only. The table and expense example do not include any transactional costs, such as fees and expenses that are, or may be, imposed under your variable contract or qualified pension plan. Therefore, the information under the heading "Hypothetical (5% annual return before expenses)" is useful in comparing ongoing costs only, and will not help you determine the relative total costs of owning different funds. In addition, if these transactional costs were included, your costs would have been higher.
Expense Information as of 12/31/09 (Unaudited)
NEUBERGER BERMAN ADVISERS MANAGEMENT TRUST GUARDIAN PORTFOLIO
| Actual | | Beginning Account
Value
7/1/09 | | Ending Account
Value
12/31/09 | | Expenses Paid
During the Period*
7/1/09 - 12/31/09 | | Expense
Ratio | |
| Class I | | $ | 1,000.00 | | | $ | 1,204.00 | | | $ | 6.22 | | | | 1.12 | % | |
| Class S | | $ | 1,000.00 | | | $ | 1,203.70 | | | $ | 6.94 | | | | 1.25 | % | |
| Hypothetical (5% annual return before expenses)** | |
| Class I | | $ | 1,000.00 | | | $ | 1,019.56 | | | $ | 5.70 | | | | 1.12 | % | |
| Class S | | $ | 1,000.00 | | | $ | 1,018.90 | | | $ | 6.36 | | | | 1.25 | % | |
* For each class of the fund, expenses are equal to the annualized expense ratio for the class, multiplied by the average account value over the period, multiplied by 184/365 (to reflect the one-half year period shown).
** Hypothetical 5% annual return before expenses is calculated by multiplying the number of days in the most recent half year divided by 365.
5
Schedule of Investments Guardian Portfolio
| NUMBER OF SHARES | | | | VALUEt | |
| Common Stocks (97.6%) | | | |
| Automobiles (1.8%) | | | |
| | 18,399 | | | Toyota Motor ADR | | $ | 1,548,460 | | |
| Capital Markets (7.2%) | | | |
| | 187,001 | | | Charles Schwab | | | 3,519,359 | | |
| | 92,764 | | | The Bank of New York Mellon | | | 2,594,609 | | |
| | | | 6,113,968 | | |
| Commercial Services & Supplies (6.1%) | | | |
| | 85,326 | | | Republic Services | | | 2,415,579 | | |
| | 81,161 | | | Waste Management | | | 2,744,054 | | |
| | | | 5,159,633 | | |
Electronic Equipment, Instruments &
Components (7.9%) | | | |
| | 71,300 | | | Anixter International | | | 3,358,230 | * | |
| | 114,537 | | | National Instruments | | | 3,373,115 | | |
| | | | 6,731,345 | | |
| Energy Equipment & Services (3.6%) | | | |
| | 47,222 | | | Schlumberger Ltd. | | | 3,073,680 | | |
| Food Products (3.0%) | | | |
| | 41,800 | | | J.M. Smucker | | | 2,581,150 | | |
| Household Products (1.9%) | | | |
| | 26,400 | | | Procter & Gamble | | | 1,600,632 | | |
| Industrial Conglomerates (4.1%) | | | |
| | 42,404 | | | 3M Co. | | | 3,505,539 | | |
| Industrial Gases (2.8%) | | | |
| | 29,913 | | | Praxair, Inc. | | | 2,402,313 | | |
| Insurance (5.1%) | | | |
| | 5,193 | | | Markel Corp. | | | 1,765,620 | * | |
| | 142,588 | | | Progressive Corp. | | | 2,565,158 | * | |
| | | | 4,330,778 | | |
| Internet Software & Services (3.7%) | | | |
| | 188,703 | | | Yahoo! Inc. | | | 3,166,436 | * | |
| IT Services (1.8%) | | | |
| | 82,500 | | | SAIC Inc. | | | 1,562,550 | * | |
| Life Science Tools & Services (3.1%) | | | |
| | 36,949 | | | Millipore Corp. | | | 2,673,260 | * | |
| NUMBER OF SHARES | | | | VALUEt | |
| Machinery (4.5%) | | | |
| | 51,501 | | | Danaher Corp. | | $ | 3,872,875 | | |
| Media (11.7%) | | | |
| | 151,248 | | | Comcast Corp. Class A Special | | | 2,421,480 | | |
| | 83,792 | | | Scripps Networks Interactive | | | 3,477,368 | | |
| | 9,308 | | | Washington Post | | | 4,091,797 | | |
| | | | 9,990,645 | | |
| Multi-Utilities (2.7%) | | | |
| | 213,653 | | | National Grid | | | 2,332,006 | | |
| Oil, Gas & Consumable Fuels (10.0%) | | | |
| | 164,464 | | | BG Group PLC | | | 2,969,611 | | |
| | 30,188 | | | Cimarex Energy | | | 1,599,058 | | |
| | 81,476 | | | Newfield Exploration | | | 3,929,588 | * | |
| | | | 8,498,257 | | |
| Pharmaceuticals (2.6%) | | | |
| | 12,798 | | | Roche Holding AG | | | 2,188,622 | | |
| Road & Rail (2.7%) | | | |
| | 42,097 | | | Canadian National Railway | | | 2,288,393 | | |
Semiconductors & Semiconductor
Equipment (6.8%) | | | |
| | 186,215 | | | Altera Corp. | | | 4,214,045 | | |
| | 61,081 | | | Texas Instruments | | | 1,591,771 | | |
| | | | 5,805,816 | | |
| Software (4.5%) | | | |
| | 125,910 | | | Intuit Inc. | | | 3,866,696 | * | |
| | | | | Total Common Stocks
(Cost $67,194,343) | | | 83,293,054 | | |
| Short-Term Investments (2.6%) | | | |
| | 2,163,378 | | | State Street Institutional
Liquid Reserves Fund
Institutional Class
(Cost $2,163,378) | | | 2,163,378 | | |
| | | | | Total Investments (100.2%)
(Cost $69,357,721) | | | 85,456,432 | ## | |
| | | | | Liabilities, less cash, receivables and
other assets [(0.2%)] | | | (141,454 | ) | |
| | | | | Total Net Assets (100.0%) | | $ | 85,314,978 | | |
See Notes to Schedule of Investments 6
Notes to Schedule of Investments Guardian Portfolio
t The value of investments in equity securities by Neuberger Berman Advisers Management Trust Guardian Portfolio (the "Fund") is determined by Neuberger Berman Management LLC ("Management") primarily by obtaining valuations from an independent pricing service based on the latest sale price when that price is readily available. Securities traded primarily on the NASDAQ Stock Market are normally valued by the Fund at the NASDAQ Official Closing Price ("NOCP") provided by NASDAQ each business day. The NOCP is the most recently reported price as of 4:00:02 p.m., Eastern time, unless that price is outside the range of the "inside" bid and asked prices (i.e., the bid and asked prices that dealers quote to each other when trading for their own accounts); in that case, NASDAQ will adjust the price to equal the inside bid or asked price, whichever is closer. Because of delays in reporting trades, the NOCP may not be based on the price of the last trade to occur before the market closes. If there is no reported sale of a security on a particular day, the independent pricing service may value the security based on reported market quotations. Management has developed a process to periodically review information provided by independent pricing services. If a valuation is not available from an independent pricing service, the Fund seeks to obtain quotations from principal market makers. If such quotations are not readily available, securities are valued using methods the Board of Trustees of Neuberger Berman Advisers Management Trust (the "Board") has approved on the belief that they reflect fair value. Numerous factors may be considered when determining the fair value of a security, including available analyst, media or other reports, trading in futures or ADRs and whether the issuer of the security being fair valued has other securities outstanding. Foreign security prices are furnished by independent quotation services and expressed in local currency values. Foreign security prices are currently translated from the local currency into U.S. dollars using the exchange rate as of 4:00 p.m., Eastern time. The Board has approved the use of Interactive Data Pricing and Reference Data, Inc. ("Interactive") to assist in determining the fair value of the Fund's foreign equity securities when changes in the value of a certain index suggest that the closing prices on the foreign exchanges may no longer represent the amount that the Fund could expect to receive for those securities. In this event, Interactive will provide adjusted prices for certain foreign equity securities using a statistical analysis of historical correlations of multiple factors. In the absence of precise information about the market values of these foreign securities as of the close of the New York Stock Exchange, the Board has determined on the basis of available data that prices adjusted in this way are likely to be closer to the prices the Fund could realize on a current sale than are the prices of those securities established at the close of the foreign markets in which the securities primarily trade. Fair value prices are necessarily estimates, and there is no assurance that such a price will be at or close to the price at which the security next trades. Short-term debt securities with less than 60 days until maturity may be valued at cost, which, when combined with interest earned, is expected to approximate market value.
In accordance with Accounting Standards Codification ("ASC") 820 "Fair Value Measurements and Disclosures" ("ASC 820"), formerly known as Financial Accounting Standards Board ("FASB") Statement of Financial Accounting Standards No. 157, "Fair Value Measurements," investments held by the Fund are carried at "fair value" as defined by ASC 820. Fair value is defined as the price that a fund would receive upon selling an investment in an orderly transaction to an independent buyer in the principal or most advantageous market for the investment under current market conditions. Various inputs, including the volume and level of activity for the asset or liability in the market are considered in determining the value of the Fund's investments, some of which are discussed above. Significant management judgment may be necessary to estimate fair value in accordance with ASC 820.
In addition to defining fair value, ASC 820 established a three-tier hierarchy of inputs to establish a classification of fair value measurements for disclosure purposes. The three-tier hierarchy of inputs is summarized in the three broad Levels listed below.
. Level 1 - quoted prices in active markets for identical investments
. Level 2 - other significant observable inputs (including quoted prices for similar investments, interest rates, prepayment speeds, credit risk, amortized cost, etc.)
. Level 3 - significant unobservable inputs (including the Fund's own assumptions in determining the fair value of investments)
See Notes to Financial Statements 7
Notes to Schedule of Investments Guardian Portfolio (cont'd)
The inputs or methodology used for valuing an investment are not necessarily an indication of the risk associated with investing in those securities.
The following is a summary, by category of Level, of inputs used to value the Fund's investments as of December 31, 2009:
| Asset Valuation Inputs | | Level 1 | | Level 2 | | Level 3 | | Total | |
| Investments: | |
| Common Stocks^ | | $ | 83,293,054 | | | $ | -- | | | $ | -- | | | $ | 83,293,054 | | |
| Short-Term Investments | | | -- | | | | 2,163,378 | | | | -- | | | | 2,163,378 | | |
| Total Investments | | $ | 83,293,054 | | | $ | 2,163,378 | | | $ | -- | | | $ | 85,456,432 | | |
^ The Schedule of Investments provides information on the industry categorization for the portfolio.
## At December 31, 2009, the cost of investments for U.S. federal income tax purposes was $70,423,815. Gross unrealized appreciation of investments was $16,119,466 and gross unrealized depreciation of investments was $1,086,849, resulting in net unrealized appreciation of $15,032,617, based on cost for U.S. federal income tax purposes.
* Security did not produce income during the last twelve months.
See Notes to Financial Statements 8
Statement of Assets and Liabilities
Neuberger Berman Advisers Management Trust
| | | GUARDIAN
PORTFOLIO | |
| | | December 31, 2009 | |
| Assets | |
| Investments in securities, at value* (Notes A & F)--see Schedule of Investments: | |
| Unaffiliated issuers | | $ | 85,456,432 | | |
| Cash | | | 9,219 | | |
| Dividends and interest receivable | | | 76,315 | | |
| Receivable for Fund shares sold | | | 3,811 | | |
| Prepaid expenses and other assets | | | 3,517 | | |
| Total Assets | | | 85,549,294 | | |
| Liabilities | |
| Payable for securities purchased | | | 90,867 | | |
| Payable for Fund shares redeemed | | | 15,970 | | |
| Payable to investment manager (Notes A & B) | | | 39,256 | | |
| Payable to administrator--net (Note B) | | | 25,043 | | |
| Accrued expenses and other payables | | | 63,180 | | |
| Total Liabilities | | | 234,316 | | |
| Net Assets at value | | $ | 85,314,978 | | |
| Net Assets consist of: | |
| Paid-in capital | | $ | 82,516,645 | | |
| Undistributed net investment income (loss) | | | 283,294 | | |
| Accumulated net realized gains (losses) on investments | | | (13,581,821 | ) | |
| Net unrealized appreciation (depreciation) in value of investments | | | 16,096,860 | | |
| Net Assets at value | | $ | 85,314,978 | | |
| Net Assets | |
| Class I | | $ | 13,744,937 | | |
| Class S | | | 71,570,041 | | |
| Shares Outstanding ($.001 par value; unlimited shares authorized) | |
| Class I | | | 860,331 | | |
| Class S | | | 4,502,723 | | |
| Net Asset Value, offering and redemption price per share | |
| Class I | | $ | 15.98 | | |
| Class S | | | 15.89 | | |
| *Cost of Investments: | |
| Unaffiliated issuers | | $ | 69,357,721 | | |
See Notes to Financial Statements 9
Statement of Operations
Neuberger Berman Advisers Management Trust
| | | GUARDIAN
PORTFOLIO | |
| | | For the
Year Ended
December 31, 2009 | |
| Investment Income: | |
| Income (Note A): | |
| Dividend income--unaffiliated issuers | | $ | 1,464,739 | | |
| Interest income--unaffiliated issuers | | | 2,364 | | |
| Income from securities loaned--net (Note F) | | | 39,582 | | |
| Income from investments in affiliated issuers (Note F) | | | 5,095 | | |
| Foreign taxes withheld | | | (12,131 | ) | |
| Total income | | $ | 1,499,649 | | |
| Expenses: | |
| Investment management fees (Notes A & B) | | | 571,464 | | |
| Administration fees (Note B): | |
| Class I | | | 130,434 | | |
| Class S | | | 181,274 | | |
| Distribution fees (Note B): | |
| Class S | | | 151,062 | | |
| Audit fees | | | 41,306 | | |
| Custodian fees (Note B) | | | 76,343 | | |
| Insurance expense | | | 7,122 | | |
| Legal fees | | | 40,815 | | |
| Shareholder reports | | | 56,292 | | |
| Trustees' fees and expenses | | | 50,101 | | |
| Miscellaneous | | | 9,242 | | |
| Total expenses | | | 1,315,455 | | |
| Expenses reimbursed by administrator (Note B) | | | (79,295 | ) | |
| Investment management fees waived (Note A) | | | (1,917 | ) | |
| Expenses reduced by custodian fee expense offset arrangement (Note B) | | | (1 | ) | |
| Total net expenses | | | 1,234,242 | | |
| Net investment income (loss) | | $ | 265,407 | | |
| Realized and Unrealized Gain (Loss) on Investments (Note A) | |
| Net realized gain (loss) on: | |
| Sales of investment securities of unaffiliated issuers | | | (6,591,244 | ) | |
| Sales of investment securities of affiliated issuers | | | 23,156 | | |
| Redemption in-kind | | | (4,088,277 | ) | |
| Foreign currency | | | 18,264 | | |
| Change in net unrealized appreciation (depreciation) in value of: | |
| Unaffiliated investment securities | | | 37,457,446 | | |
| Foreign currency | | | 752 | | |
| Net gain (loss) on investments | | | 26,820,097 | | |
| Net increase (decrease) in net assets resulting from operations | | $ | 27,085,504 | | |
See Notes to Financial Statements 10
Statements of Changes in Net Assets
Neuberger Berman Advisers Management Trust
| | | GUARDIAN PORTFOLIO | |
| | | Year Ended
December 31,
2009 | | Year Ended
December 31,
2008 | |
| Increase (Decrease) in Net Assets: | |
| From Operations (Note A): | |
| Net investment income (loss) | | $ | 265,407 | | | $ | 889,325 | | |
| Net realized gain (loss) on investments | | | (10,638,101 | ) | | | (6,346,711 | ) | |
| Change in net unrealized appreciation (depreciation) of investments | | | 37,458,198 | | | | (60,370,772 | ) | |
| Net increase (decrease) in net assets resulting from operations | | | 27,085,504 | | | | (65,828,158 | ) | |
| Distributions to Shareholders From (Note A): | |
| Net investment income: | |
| Class I | | | (142,454 | ) | | | (546,055 | ) | |
| Class S | | | (622,197 | ) | | | (299,501 | ) | |
| Net realized gain on investments: | |
| Class I | | | -- | | | | (3,740,998 | ) | |
| Class S | | | -- | | | | (2,289,506 | ) | |
| Total distributions to shareholders | | | (764,651 | ) | | | (6,876,060 | ) | |
| From Fund Share Transactions (Note D): | |
| Proceeds from shares sold: | |
| Class I | | | 6,274,989 | | | | 16,825,253 | | |
| Class S | | | 11,636,789 | | | | 40,133,729 | | |
| Proceeds from reinvestment of dividends and distributions: | |
| Class I | | | 142,454 | | | | 4,287,053 | | |
| Class S | | | 622,197 | | | | 2,589,007 | | |
| Payments for shares redeemed: | |
| Class I | | | (69,776,705 | ) | | | (35,390,290 | ) | |
| Class S | | | (5,505,098 | ) | | | (1,813,712 | ) | |
| Net increase (decrease) from Fund share transactions | | | (56,605,374 | ) | | | 26,631,040 | | |
| Net Increase (Decrease) in Net Assets | | | (30,284,521 | ) | | | (46,073,178 | ) | |
| Net Assets: | |
| Beginning of year | | | 115,599,499 | | | | 161,672,677 | | |
| End of year | | $ | 85,314,978 | | | $ | 115,599,499 | | |
| Undistributed net investment income (loss) at end of year | | $ | 283,294 | | | $ | 764,274 | | |
See Notes to Financial Statements 11
Notes to Financial Statements Guardian Portfolio
Note A--Summary of Significant Accounting Policies:
1 General: The Fund is a separate operating series of Neuberger Berman Advisers Management Trust (the "Trust"), a Delaware statutory trust organized pursuant to a Trust Instrument dated May 23, 1994. The Trust is currently comprised of ten separate operating series (each a "Series," collectively, the "Funds") each of which is diversified. The Trust is registered as an open-end management investment company under the Investment Company Act of 1940, as amended (the "1940 Act"), and its shares are registered under the Securities Act of 1933, as amended. The Fund currently offers Class I and Class S shares. The Board may establish additional series or classes of shares without the approval of shareholders.
The assets of each Series belong only to that Series, and the liabilities of each Series are borne solely by that Series and no other.
The preparation of financial statements in accordance with U.S. generally accepted accounting principles requires Management to make estimates and assumptions at the date of the financial statements. Actual results could differ from those estimates.
2 Portfolio valuation: Investment securities are valued as indicated in the notes following the Schedule of Investments.
3 Foreign currency translation: The accounting records of the Fund are maintained in U.S. dollars. Foreign currency amounts are currently translated into U.S. dollars using the exchange rates as of 4:00 p.m., Eastern time, to determine the value of investments, other assets and liabilities. Purchase and sale prices of securities, and income and expenses, are translated into U.S. dollars at the prevailing rate of exchange on the respective dates of such transactions. Net unrealized foreign currency gain (loss), if any, arises from changes in the value of assets and liabilities, other than investments in securities, as a result of changes in exchange rates and is stated separately in the Statement of Operations.
4 Securities transactions and investment income: Securities transactions are recorded on trade date for financial reporting purposes. Dividend income is recorded on the ex-dividend date or, for certain foreign dividends, as soon as the Fund becomes aware of the dividends. Non-cash dividends included in dividend income, if any, are recorded at the fair market value of the securities received. Interest income, including accretion of original issue discount, where applicable, and accretion of discount on short-term investments, is recorded on the accrual basis. Realized gains and losses from securities transactions and foreign currency transactions, if any, are recorded on the basis of identified cost and stated separately in the Statement of Operations. Included in net realized gain (loss) on investments are proceeds from the settlements of class action litigation in which the Fund participated as a class member. The amount of such proceeds for the year ended December 31, 2009 was $163,117.
5 Income tax information: The Funds are treated as separate entities for U.S. federal income tax purposes. It is the policy of the Fund to continue to qualify as a regulated investment company by complying with the requirements of Subchapter M of the Internal Revenue Code applicable to regulated investment companies and to distribute substantially all of its earnings to its shareholders. Therefore, no federal income or excise tax provision is required.
The Fund has adopted the provisions of ASC 740 "Income Taxes" ("ASC 740"), formerly known as FASB Interpretation No. 48 "Accounting for Uncertainty in Income Taxes -- an interpretation of FASB Statement No. 109". ASC 740 sets forth a minimum threshold for financial statement recognition of the benefit of a tax position taken, or expected to be taken, in a tax return. The Fund recognizes interest and penalties, if any, related to unrecognized tax benefits as an income tax expense in the Statement of Operations. The Fund is subject to examination by U.S. federal and state tax authorities for returns filed for the prior three fiscal years 2006 - 2008. As of December 31, 2009, the Fund did not have any unrecognized tax benefits.
12
Income distributions and capital gain distributions are determined in accordance with income tax regulations, which may differ from U.S. generally accepted accounting principles. These differences are primarily due to differing treatments of income and gains on various investment securities held by the Fund, timing differences and differing characterization of distributions made by the Fund as a whole. The Fund may also utilize earnings and profits distributed to shareholders on redemption of shares as a part of the dividends paid deduction for income tax purposes.
As determined on December 31, 2009, permanent differences resulting primarily from different book and tax accounting for foreign currency gains and losses and redemptions in kind were reclassified at fiscal year-end. These reclassifications had no effect on net income, net asset value or net asset value per share of the Fund.
The tax character of distributions paid during the years ended December 31, 2009 and December 31, 2008 was as follows:
| | | Distributions Paid From: | | | |
| Ordinary Income | | Long-Term Gains | | Total | |
| 2009 | | 2008 | | 2009 | | 2008 | | 2009 | | 2008 | |
| $ | 764,651 | | | $ | 845,556 | | | $ | -- | | | $ | 6,030,504 | | | $ | 764,651 | | | $ | 6,876,060 | | |
As of December 31, 2009, the components of distributable earnings (accumulated losses) on a U.S. federal income tax basis were as follows:
Undistributed
Ordinary
Income | | Undistributed
Long-Term
Gain | | Unrealized
Appreciation
(Depreciation) | | Loss
Carryforwards
and Deferrals | | Total | |
| $ | 283,294 | | | $ | -- | | | $ | 15,030,766 | | | $ | (12,515,727 | ) | | $ | 2,798,333 | | |
The difference between book basis and tax basis distributable earnings is attributable primarily to timing differences of wash sales, partnership basis adjustments, capital loss carryforwards and post October loss deferrals.
To the extent the Fund's net realized capital gains, if any, can be offset by capital loss carryforwards, it is the policy of the Fund not to distribute such gains. As determined at December 31, 2009, the Fund had unused capital loss carryforwards available for federal income tax purposes to offset net realized capital gains, if any, as follows:
| | | Expiring in: | |
| | | 2016 | | 2017 | |
| | | $ | 2,513,390 | | | $ | 9,198,443 | | |
Under current tax law, the use of these losses to offset future gains may be limited.
Under current tax law, certain net capital and net foreign currency losses realized after October 31 within the taxable year may be deferred and treated as occurring on the first day of the following tax year. For the year ended December 31, 2009, the Fund elected to defer $803,894 net capital losses arising between November 1, 2009 and December 31, 2009.
6 Distributions to shareholders: The Fund may earn income, net of expenses, daily on its investments. Distributions from net investment income and net realized capital gains, if any, generally are distributed in October. Income distributions and capital gain distributions to shareholders are recorded on the ex-date.
7 Foreign taxes: Foreign taxes withheld represent amounts withheld by foreign tax authorities, net of refunds recoverable.
8 Expense allocation: Certain expenses are applicable to multiple funds. Expenses directly attributable to a Series are charged to that Series. Expenses of the Trust that are not directly attributed to a Series are allocated among the Funds, on the basis of relative net assets, except where a more appropriate allocation of expenses to each of the Funds can otherwise be made fairly. Expenses borne by the complex of related investment companies, which includes open-end and closed-end investment companies for which Management serves as investment manager,
13
that are not directly attributed to a Series or the Trust are allocated among the Fund and the other investment companies in the complex or series thereof on the basis of relative net assets, except where a more appropriate allocation of expenses to each investment company in the complex or series thereof can otherwise be made fairly. The Fund's expenses (other than those specific to each class) are allocated proportionally each day between the classes based upon the relative net assets of each class.
9 Security lending: A third party, eSecLending, currently serves as exclusive lending agent for the Fund. eSecLending, as agent, has assisted the Fund in conducting bidding processes to try to identify a principal that would pay a guaranteed amount to the Fund in consideration of the Fund entering into an exclusive securities lending arrangement. During most of the Fund's fiscal year, the Fund was guaranteed a particular level of income from a principal. As a result of a bidding process on October 1, 2009, no principal currently has an exclusive arrangement with the Fund and the Fund is no longer guaranteed a particular level of income.
Under the securities lending arrangement, the Fund receives cash collateral at the beginning of each transaction equal to at least 102% of the prior day's market value of the loaned securities (105% in the case of international securities). The Fund may invest all the cash collateral in Neuberger Berman Securities Lending Quality Fund, LLC ("Quality Fund"), a fund managed by Neuberger Berman Fixed Income LLC (formerly known as Lehman Brothers Asset Management LLC) ("NBFI"), an affiliate of Management. Effective July 1, 2009, Dwight Asset Management Company LLC became the Sub-Adviser to the Quality Fund. The Quality Fund is not a money market fund that is registered under the 1940 Act and does not operate in accordance with all requirements of Rule 2a-7 under the 1940 Act. There is no assurance that the Quality Fund will maintain a $1.00 share price.
The market value of the Fund's investments in the Quality Fund as of the fiscal year ended December 31, 2009, if any, is reflected in the Fund's Schedule of Investments. If it were necessary to liquidate assets in the Quality Fund to meet returns on outstanding securities loans at a time when the Quality Fund's price per share was less than $1.00, the Fund may not receive an amount from the Quality Fund that is equal in amount to the collateral the Fund would be required to return to the borrower of the securities and the Fund would be required to make up for this shortfall. In addition, as a result of recent reduced liquidity in the credit and fixed income markets, it may be difficult to dispose quickly of some securities in the Quality Fund at the price at which the Quality Fund is carrying them.
Net income from the lending program represents any amounts received from a principal plus income earned on the cash collateral invested in Quality Fund or in other investments, if applicable, less cash collateral fees and other expenses associated with the loans. For the fiscal year ended December 31, 2009, the Fund received net income under the securities lending arrangement of approximately $39,582 which is reflected in the Statement of Operations under the caption "Income from securities loaned -- net." For the fiscal year ended December 31, 2009, "Income from securities loaned -- net" consisted of approximately $75,772 in income earned on cash collateral and amounts received from a principal (including approximately $68,856 of interest income earned from the Quality Fund), less fees and expenses paid of approximately $36,190.
10 Repurchase agreements: The Fund may enter into repurchase agreements with institutions that Management has determined are creditworthy. Each repurchase agreement is recorded at cost. The Fund requires that the securities purchased in a repurchase agreement be transferred to the custodian in a manner sufficient to enable the Fund to assert a perfected security interest in those securities in the event of a default under the repurchase agreement. The Fund monitors, on a daily basis, the value of the securities transferred to ensure that their value, including accrued interest, is greater than amounts owed to the Fund under each such repurchase agreement.
11 Transactions with other funds managed by Neuberger Berman Management LLC: Pursuant to an Exemptive Order issued by the Securities and Exchange Commission, the Fund may invest in a money market fund managed by Management or an affiliate. Through August 10, 2009, the Fund invested in Neuberger Berman Prime Money Fund ("Prime Money"), as approved by the Board. Prime Money sought to provide the highest available current income consistent with safety and liquidity. For any cash that the Fund invested in Prime Money, Management waived a portion of its management fee equal to the management fee it received from Prime Money on those assets (the "Arrangement"). For the year ended December 31, 2009, management fees waived under this Arrangement
14
amounted to $1,917 and are reflected in the Statement of Operations under the caption "Investment management fees waived." For the year ended December 31, 2009, income earned under this Arrangement amounted to $5,095 and is reflected in the Statement of Operations under the caption "Income from investments in affiliated issuers."
On August 10, 2009, the Fund ceased investing in Prime Money. On this date, the Fund's shares of Prime Money were redeemed in exchange for portfolio holdings of Prime Money, which were used to purchase Institutional Class shares of State Street Institutional Liquid Reserves Fund.
12 Investments in foreign securities: Investing in foreign securities may involve certain sovereign and other risks, in addition to the credit and market risks normally associated with domestic securities. These additional risks include the possibility of adverse political and economic developments (including political instability, nationalization, expropriation, or confiscatory taxation) and the potentially adverse effects of unavailability of public information regarding issuers, less governmental supervision and regulation of financial markets, reduced liquidity of certain financial markets, and the lack of uniform accounting, auditing, and financial reporting standards or the application of standards that are different or less stringent than those applied in the United States. Foreign securities also may experience greater price volatility, higher rates of inflation, and delays in settlement.
13 Derivative instruments: Management has evaluated the requirements of ASC 815 "Disclosures about Derivative Instruments and Hedging Activities" ("ASC 815"), formerly known as FASB Statement of Financial Accounting Standards No. 161, "Disclosures about Derivative Instruments and Hedging Activities," which are effective for financial statements issued for fiscal years and interim periods beginning after November 15, 2008. ASC 815 requires enhanced disclosures about a fund's derivative and hedging activities. Management has concluded that, since the Fund did not hold any derivative instruments during the year ended December 31, 2009, no additional disclosures pursuant to ASC 815 are required at this time.
14 Indemnifications: Like many other companies, the Trust's organizational documents provide that its officers and trustees are indemnified against certain liabilities arising out of the performance of their duties to the Trust. In addition, both in some of its principal service contracts and in the normal course of its business, the Trust enters into contracts that provide indemnifications to other parties for certain types of losses or liabilities. The Trust's maximum exposure under these arrangements is unknown as this could involve future claims against the Trust.
15 Other: All net investment income and realized and unrealized capital gains and losses of the Fund are allocated, on the basis of relative net assets, pro rata among its respective classes.
Note B--Management Fees, Administration Fees, Distribution Arrangements, and Other Transactions With Affiliates:
Fund shares are issued and redeemed in connection with investments in and payments under certain variable annuity contracts and variable life insurance policies issued through separate accounts of life insurance companies and are also offered directly to qualified pension and retirement plans.
The Fund retains Management as its investment manager under a Management Agreement. For such investment management services, the Fund pays Management a fee at the annual rate of 0.55% of the first $250 million of the Fund's average daily net assets, 0.525% of the next $250 million, 0.50% of the next $250 million, 0.475% of the next $250 million, 0.45% of the next $500 million, 0.425% of the next $2.5 billion, and 0.40% of average daily net assets in excess of $4 billion.
The Fund retains Management as its administrator under an Administration Agreement. Each class pays Management an administration fee at the annual rate of 0.30% of its average daily net assets under this agreement. Additionally, Management retains State Street Bank and Trust Company ("State Street") as its sub-administrator under a Sub-Administration Agreement. Management pays State Street a fee for all services received under this agreement.
The Board adopted a non-fee distribution plan for the Fund's Class I.
15
For the Fund's Class S, Management acts as agent in arranging for the sale of class shares without commission and bears advertising and promotion expenses. The Board has adopted a distribution plan (the "Plan") with respect to this class, pursuant to Rule 12b-1 under the 1940 Act. The Plan provides that, as compensation for administrative and other services provided to this class, Management's activities and expenses related to the sale and distribution of this class of shares, and ongoing services provided to investors in this class, Management receives from this class a fee at the annual rate of 0.25% of Class S's average daily net assets. Management receives this amount to provide distribution and shareholder servicing for this class and pays a portion of it to institutions that provide such services. Those institutions may use the payments for, among other purposes, compensating employees engaged in sales and/or shareholder servicing. The amount of fees paid by this class during any year may be more or less than the cost of distribution and other services provided to this class. FINRA rules limit the amount of annual distribution fees that may be paid by a mutual fund and impose a ceiling on the cumulative distribution fees paid. The Trust's Plan complies with those rules.
Management has contractually undertaken to forgo current payment of fees and/or reimburse the Fund's Class I and Class S shares for their operating expenses (excluding the fees payable to Management (including the fees payable to Management with respect to the Fund's Class S shares), but excluding interest, taxes, brokerage commissions, extraordinary expenses, and transaction costs) ("Operating Expenses") which exceed the expense limitation as detailed in the following table:
| | | Expense Limitation(1) | | Expiration | | Reimbursement from
Management for the
Year Ended
December 31, 2009 | |
| Class I | | | 1.00 | % | | | 12/31/12 | | | $ | -- | | |
| Class S | | | 1.25 | % | | | 12/31/12 | | | | 79,295 | | |
(1) Expense limitation per annum of the respective class' average daily net assets.
Each respective class has agreed to repay Management through December 31, 2015 for fees and expenses foregone and/or its excess Operating Expenses previously reimbursed by Management, so long as their annual Operating Expenses during that period do not exceed their expense limitation, and the repayment is made within three years after the year in which Management issued the reimbursement or waived fees. During the year ended December 31, 2009, there was no repayment to Management under these agreements. At December 31, 2009, the Fund's Class I shares had no contingent liability to Management under this agreement. At December 31, 2009, the Fund's Class S shares contingent liabilities to Management under this agreement were as follows:
| | | Expiring in: | |
| | | 2011 | | 2012 | | Total | |
| Class S | | $ | 10,820 | | | $ | 79,295 | | | $ | 90,115 | | |
Neuberger Berman LLC (formerly known as Neuberger Berman, LLC) ("Neuberger") is retained by Management to furnish it with investment recommendations and research information without added cost to the Fund. Several individuals who are officers and/or trustees of the Trust are also employees of Neuberger and/or Management.
During the reporting period, the predecessor of Management, the investment manager of the Fund, and Neuberger, the sub-adviser of the Fund, were wholly owned subsidiaries of Lehman Brothers Holdings Inc. ("Lehman Brothers"), a publicly owned holding company. On September 15, 2008, Lehman Brothers filed a voluntary petition under Chapter 11 of the U.S. Bankruptcy Code. On December 3, 2008, NBSH Acquisition, LLC ("NBSH"), an entity organized by key members of Neuberger Berman's senior management, was selected as the successful bidder in the public auction to acquire a majority interest in Neuberger Berman's business and the fixed income and certain alternative asset management businesses of Lehman Brothers' Investment Management Division (together with Neuberger Berman, the "Acquired Businesses") (the "Acquisition"). On December 22, 2008, the bankruptcy
16
court having jurisdiction over the Lehman Brothers matter approved the sale of the Acquired Businesses to NBSH (or its successor or assign), as the successful bidder.
The Acquisition closed on May 4, 2009. The Acquired Businesses are now indirectly owned by, among others, portfolio managers, Neuberger Berman's management team, and certain key members and senior professionals who are employed in various parts of the Neuberger Berman complex of companies, with a minority interest retained by Lehman Brothers and certain affiliates of Lehman Brothers.
The closing of the Acquisition resulted in an "assignment" of the Fund's Management Agreement and Sub- Advisory Agreement. Such an assignment, by law, automatically terminated those agreements. Accordingly, prior to the closing, the Board, including the Trustees who are not "interested persons" of the Fund's investment manager and its affiliates or the Fund, considered and approved a new Management Agreement and Sub-Advisory Agreement for the Fund. The new agreements, which are virtually identical to those previously in effect, were also approved by a vote of the Fund's shareholders.
These events have not had a material impact on the Fund or its operations. Management and Neuberger continue to operate in the ordinary course of business as the investment manager and sub-adviser of the Fund.
The Fund has an expense offset arrangement in connection with its custodian contract. For the year ended December 31, 2009, the impact of this arrangement was a reduction of expenses of $1.
Note C--Securities Transactions:
During the year ended December 31, 2009, there were purchase and sale transactions (excluding short-term securities) of $30,216,053 and $85,028,542, respectively.
During the year ended December 31, 2009, no brokerage commissions on securities transactions were paid to affiliated brokers.
Note D--Fund Share Transactions:
Share activity for the years ended December 31, 2009 and December 31, 2008 was as follows:
For the Year Ended December 31, 2009
| | | Shares Sold | | Shares Issued on
Reinvestment of
Dividends and
Distributions | | Shares
Redeemed | | Total | |
| Class I | | | 478,419 | | | | 9,215 | | | | (5,010,166 | ) | | | (4,522,532 | ) | |
| Class S | | | 947,072 | | | | 40,455 | | | | (409,938 | ) | | | 577,589 | | |
For the Year Ended December 31, 2008
| | | Shares Sold | | Shares Issued on
Reinvestment of
Dividends and
Distributions | | Shares
Redeemed | | Total | |
| Class I | | | 941,626 | | | | 335,976 | | | | (2,013,210 | ) | | | (735,608 | ) | |
| Class S | | | 2,301,202 | | | | 203,858 | | | | (127,244 | ) | | | 2,377,816 | | |
17
Note E--Line of Credit:
At December 31, 2009, the Fund was a participant in a single committed, unsecured $150,000,000 line of credit with State Street, to be used only for temporary or emergency purposes. Other investment companies managed by Management also participate in this line of credit on the same terms. Interest is charged on borrowings under this line of credit at the higher of (a) the Federal Funds Rate plus 1.25% per annum or (b) the Overnight LIBOR Rate plus 1.25% per annum. Prior to September 18, 2009, interest was charged on borrowings under this line of credit at the Federal Funds Rate plus 0.50% per annum. A facility fee of 0.15% (prior to September 18, 2009, 0.09%) per annum of the available line of credit is charged, of which the Fund has agreed to pay its pro rata share, based on the ratio of its individual net assets to the net assets of all participants at the time the fee is due and payable. The fee is paid quarterly in arrears. Because several investment companies participate, there is no assurance that an individual Fund will have access to all or any part of the $150,000,000 at any particular time. There were no loans outstanding pursuant to this line of credit at December 31, 2009. During the year ended December 31, 2009, the Fund did not utilize this line of credit.
Note F--Investments in Affiliates:
| Name of Issuer | | Balance of
Shares
Held
December 31,
2008 | | Gross
Purchases
and
Additions | | Gross
Sales
and
Reductions | | Balance of
Shares
Held
December 31,
2009 | | Value
December 31,
2009 | | Income from
Investments in
Affiliated
Issuers
Included in
Total Income | |
Neuberger Berman Prime
Money Fund Trust Class* | | | 4,338,662 | | | | 21,433,093 | | | | 25,771,755 | | | | -- | | | $ | -- | | | $ | 5,095 | | |
Neuberger Berman Securities
Lending Quality Fund, LLC** | | | 24,866,639 | | | | 15,430,873 | | | | 40,297,512 | | | | -- | | | | -- | | | | 68,856 | | |
| Total | | | | | | | | | | $ | -- | | | $ | 73,951 | | |
* Prime Money was also managed by Management and may have been considered an affiliate since it had the same officers, Board members, and investment manager as the Fund and because, at times, the Fund may have owned 5% or more of the outstanding voting securities of Prime Money.
** Quality Fund, a fund managed by NBFI, an affiliate of Management, is used to invest cash the Fund receives as collateral for securities loaned as approved by the Board. Because all shares of Quality Fund are held by funds in the related investment management complex, Quality Fund may be considered an affiliate of the Fund.
Note G--Subsequent Events:
In accordance with the provision set forth in ASC 855 "Subsequent Events" ("ASC 855") formerly known as FAS 165, "Subsequent Events," Management has evaluated the possibility of subsequent events existing in the Fund's financial statements through February 9, 2010. Management has determined that there are no subsequent events that, in accordance with ASC 855, would need to be disclosed in the Fund's financial statements through this date.
18
Financial Highlights
Guardian Portfolio
The following tables include selected data for a share outstanding throughout each year and other performance information derived from the Financial Statements.
| Class I | |
| | | Year Ended December 31, | |
| | | 2009 | | 2008 | | 2007 | | 2006 | | 2005 | |
| Net Asset Value, Beginning of Year | | $ | 12.45 | | | $ | 21.11 | | | $ | 19.71 | | | $ | 17.50 | | | $ | 16.17 | | |
| Income From Investment Operations: | |
| Net Investment Income (Loss)tt | | | .05 | | | | .12 | | | | .11 | | | | .05 | | | | .12 | | |
Net Gains or Losses on Securities
(both realized and unrealized) | | | 3.64 | | | | (7.97 | ) | | | 1.35 | | | | 2.29 | | | | 1.24 | | |
| Total From Investment Operations | | | 3.69 | | | | (7.85 | ) | | | 1.46 | | | | 2.34 | | | | 1.36 | | |
| Less Distributions From: | |
| Net Investment Income | | | (.16 | ) | | | (.10 | ) | | | (.06 | ) | | | (.13 | ) | | | (.03 | ) | |
| Net Capital Gains | | | -- | | | | (.71 | ) | | | -- | | | | -- | | | | -- | | |
| Total Distributions | | | (.16 | ) | | | (.81 | ) | | | (.06 | ) | | | (.13 | ) | | | (.03 | ) | |
| Net Asset Value, End of Year | | $ | 15.98 | | | $ | 12.45 | | | $ | 21.11 | | | $ | 19.71 | | | $ | 17.50 | | |
| Total Returntt | | | 29.69 | % | | | (37.24 | )% | | | 7.39 | % | | | 13.38 | % | | | 8.39 | % | |
| Ratios/Supplemental Data | |
| Net Assets, End of Year (in millions) | | $ | 13.7 | | | $ | 67.0 | | | $ | 129.1 | | | $ | 155.0 | | | $ | 175.3 | | |
| Ratio of Gross Expenses to Average Net Assets# | | | 1.10 | % | | | 1.01 | % | | | .99 | % | | | .99 | % | | | 1.00 | % | |
| Ratio of Net Expenses to Average Net AssetsS | | | 1.10 | % | | | 1.01 | % | | | .99 | % | | | .99 | % | | | 1.00 | % | |
Ratio of Net Investment Income (Loss) to Average
Net Assets | | | .39 | % | | | .65 | % | | | .55 | % | | | .29 | % | | | .71 | % | |
| Portfolio Turnover Rate | | | 30 | % | | | 32 | % | | | 38 | % | | | 23 | % | | | 32 | % | |
See Notes to Financial Highlights 19
Financial Highlights (cont'd)
| Class S | |
| | | Year Ended December 31, | |
| | | 2009 | | 2008 | | 2007 | | 2006 | | 2005 | |
| Net Asset Value, Beginning of Year | | $ | 12.38 | | | $ | 21.02 | | | $ | 19.67 | | | $ | 17.52 | | | $ | 16.20 | | |
| Income From Investment Operations: | |
| Net Investment Income (Loss)tt | | | .02 | | | | .08 | | | | .09 | | | | .02 | | | | .09 | | |
Net Gains or Losses on Securities
(both realized and unrealized) | | | 3.63 | | | | (7.92 | ) | | | 1.32 | | | | 2.26 | | | | 1.23 | | |
| Total From Investment Operations | | | 3.65 | | | | (7.84 | ) | | | 1.41 | | | | 2.28 | | | | 1.32 | | |
| Less Distributions From: | |
| Net Investment Income | | | (.14 | ) | | | (.09 | ) | | | (.06 | ) | | | (.13 | ) | | | -- | | |
| Net Capital Gains | | | -- | | | | (.71 | ) | | | -- | | | | -- | | | | -- | | |
| Total Distributions | | | (.14 | ) | | | (.80 | ) | | | (.06 | ) | | | (.13 | ) | | | -- | | |
| Net Asset Value, End of Year | | $ | 15.89 | | | $ | 12.38 | | | $ | 21.02 | | | $ | 19.67 | | | $ | 17.52 | | |
| Total Returntt | | | 29.50 | % | | | (37.36 | )% | | | 7.14 | % | | | 13.02 | % | | | 8.15 | % | |
| Ratios/Supplemental Data | |
| Net Assets, End of Year (in millions) | | $ | 71.6 | | | $ | 48.6 | | | $ | 32.5 | | | $ | 1.5 | | | $ | 0.4 | | |
| Ratio of Gross Expenses to Average Net Assets# | | | 1.25 | % | | | 1.25 | % | | | 1.24 | % | | | 1.25 | % | | | 1.25 | % | |
| Ratio of Net Expenses to Average Net AssetsS | | | 1.25 | % | | | 1.25 | % | | | 1.24 | % | | | 1.25 | % | | | 1.24 | % | |
Ratio of Net Investment Income (Loss) to Average
Net Assets | | | .16 | % | | | .48 | % | | | .42 | % | | | .11 | % | | | .53 | % | |
| Portfolio Turnover Rate | | | 30 | % | | | 32 | % | | | 38 | % | | | 23 | % | | | 32 | % | |
See Notes to Financial Highlights 20
Notes to Financial Highlights Guardian Portfolio
tt Total return based on per share net asset value reflects the effects of changes in net asset value on the performance of the Fund during each fiscal period and assumes dividends and other distributions, if any, were reinvested. Results represent past performance and do not guarantee future results. Current returns may be lower or higher than the performance data quoted. Investment returns and principal may fluctuate and shares when redeemed may be worth more or less than original cost. Total return would have been lower if Management had not reimbursed and/or waived certain expenses. Total return would have been higher if Management had not recouped previously reimbursed expenses. The total return information shown does not reflect charges and other expenses that apply to the separate account or the related insurance policies, and the inclusion of these charges and other expenses would reduce the total return for all fiscal periods shown.
# The Fund is required to calculate an expense ratio without taking into consideration any expense reductions related to expense offset arrangements.
S After reimbursement of expenses and/or waiver of a portion of the investment management fee by Management. Had Management not undertaken such actions, the annualized ratios of net expenses to average daily net assets would have been:
| | | Year Ended December 31, | |
| | | 2009 | | 2008 | | 2007 | | 2006 | | 2005 | |
| Guardian Portfolio Class I | | | 1.10 | % | | | 1.01 | % | | | .99 | % | | | .99 | % | | | 1.00 | % | |
| Guardian Portfolio Class S | | | 1.38 | % | | | 1.27 | % | | | 1.24 | % | | | 1.25 | % | | | 1.26 | % | |
After reimbursement of expenses previously paid by Management and/or waiver of a portion of the investment management fee by Management. Had the Fund not made such reimbursements or Management not undertaken such actions, the annualized ratio of net expenses to average daily net assets would have been:
| | | Year Ended
December 31,
2007 | |
| Guardian Portfolio Class S | | | 1.24 | % | |
tt Calculated based on the average number of shares outstanding during each fiscal period.
21
Report of Independent Registered Public Accounting Firm
To the Board of Trustees of
Neuberger Berman Advisers Management Trust and
Shareholders of Guardian Portfolio
We have audited the accompanying statement of assets and liabilities, including the schedule of investments, of Guardian Portfolio, one of the series constituting Neuberger Berman Advisers Management Trust (the "Trust"), as of December 31, 2009, and the related statement of operations for the year then ended, the statement of changes in net assets for each of the two years in the period then ended, and the financial highlights for each of the five years in the period then ended. These financial statements and financial highlights are the responsibility of the Trust's management. Our responsibility is to express an opinion on these financial statements and financial highlights based on our audits.
We conducted our audits in accordance with the standards of the Public Company Accounting Oversight Board (United States). Those standards require that we plan and perform the audit to obtain reasonable assurance about whether the financial statements and financial highlights are free of material misstatement. We were not engaged to perform an audit of the Trust's internal control over financial reporting. Our audits included consideration of internal control over financial reporting as a basis for designing audit procedures that are appropriate in the circumstances, but not for the purpose of expressing an opinion on the effectiveness of the Trust's internal control over financial reporting. Accordingly, we express no such opinion. An audit also includes examining, on a test basis, evidence supporting the amounts and disclosures in the financial statements and financial highlights, assessing the accounting principles used and significant estimates made by management, and evaluating the overall financial statement presentation. Our procedures included confirmation of securities owned as of December 31, 2009 by correspondence with the custodian and brokers or by other appropriate auditing procedures where replies from brokers were not received. We believe that our audits provide a reasonable basis for our opinion.
In our opinion, the financial statements and financial highlights referred to above present fairly, in all material respects, the financial position of Guardian Portfolio, a series of Neuberger Berman Advisers Management Trust, at December 31, 2009, the results of its operations for the year then ended, the changes in its net assets for each of the two years in the period then ended, and the financial highlights for each of the five years in the period then ended, in conformity with U.S. generally accepted accounting principles.
Boston, Massachusetts
February 9, 2010
22
Trustee and Officer Information
The following tables set forth information concerning the trustees and officers of the Trust. All persons named as trustees and officers also serve in similar capacities for other funds administered or managed by Management and Neuberger. The Statement of Additional Information includes additional information about fund trustees and is available upon request, without charge, by calling (800) 877-9700.
Information about the Board of Trustees
Name, (Year of Birth),
and Address(1) | | Position and
Length of
Time Served(2) | | Principal Occupation(s)(3) | | Number of
Funds in Fund
Complex
Overseen by
Fund Trustee | | Other Directorships
Held Outside Fund
Complex by Fund
Trustee | |
| Independent Fund Trustees | |
|
| John Cannon (1930) | | Trustee since 2000 | | Consultant; formerly, Chairman, CDC Investment Advisers (registered investment adviser), 1993 to January 1999; formerly, President and Chief Executive Officer, AMA Investment Advisors, an affiliate of the American Medical Association. | | | 46 | | | Formerly, Independent Trustee or Director of three series of Oppenheimer Funds: Oppenheimer Limited Term New York Municipal Fund, Rochester Fund Municipals, and Oppenheimer Convertible Securities Fund (1992 to 2009). | |
|
| Faith Colish (1935) | | Trustee since 1982 | | Counsel, Carter Ledyard & Milburn LLP (law firm) since October 2002; formerly, Attorney-at-Law and President, Faith Colish, A Professional Corporation, 1980 to 2002. | | | 46 | | | Formerly, Director (1997 to 2003) and Advisory Director (2003 to 2006), ABA Retirement Funds (formerly, American Bar Retirement Association) (not-for-profit membership corporation). | |
|
| Martha C. Goss (1949) | | Trustee since 2007 | | President, Woodhill Enterprises Inc./Chase Hollow Associates LLC (personal investment vehicle), since 2006; Chief Operating and Financial Officer, Hopewell Holdings LLC/Amwell Holdings, LLC (a holding company for a healthcare reinsurance company start-up), since 2003; formerly, Consultant, Resources Connection (temporary staffing), 2002 to 2006. | | | 46 | | | Director, Ocwen Financial Corporation (mortgage servicing), since 2005; Director, American Water (water utility), since 2003; Director, Channel Reinsurance (financial guaranty reinsurance), since 2006; Advisory Board Member, Attensity (software developer), since 2005; Director, Allianz Life of New York (insurance), since 2005; Director, Financial Women's Association of New York (not for profit association), since 2003; Trustee Emerita, Brown University, since 1998. | |
|
23
Name, (Year of Birth),
and Address(1) | | Position and
Length of
Time Served(2) | | Principal Occupation(s)(3) | | Number of
Funds in Fund
Complex
Overseen by
Fund Trustee | | Other Directorships
Held Outside Fund
Complex by Fund
Trustee | |
| C. Anne Harvey (1937) | | Trustee since 1998 | | President, C.A. Harvey Associates, since October 2001; formerly, Director, AARP, 1978 to December 2001. | | | 46 | | | Formerly, President, Board of Associates to The National Rehabilitation Hospital's Board of Directors, 2001 to 2002; formerly, Member, Individual Investors Advisory Committee to the New York Stock Exchange Board of Directors, 1998 to June 2002. | |
|
| Robert A. Kavesh (1927) | | Trustee since 2000 | | Retired; Marcus Nadler Professor Emeritus of Finance and Economics, New York University Stern School of Business; formerly, Executive Secretary-Treasurer, American Finance Association, 1961 to 1979. | | | 46 | | | Formerly, Director, The Caring Community (not-for-profit), 1997 to 2006; formerly, Director, DEL Laboratories, Inc. (cosmetics and pharmaceuticals), 1978 to 2004; formerly, Director, Apple Bank for Savings, 1979 to 1990; formerly, Director, Western Pacific Industries, Inc., 1972 to 1986 (public company). | |
|
| Michael M. Knetter (1960) | | Trustee since 2007 | | Dean, School of Business, University of Wisconsin - Madison; formerly, Professor of International Economics and Associate Dean, Amos Tuck School of Business - Dartmouth College, 1998 to 2002. | | | 46 | | | Trustee, Northwestern Mutual Series Fund, Inc., since February 2007; Director, Wausau Paper, since 2005; Director, Great Wolf Resorts, since 2004. | |
|
| Howard A. Mileaf (1937) | | Trustee since 1999 | | Retired; formerly, Vice President and General Counsel, WHX Corporation (holding company), 1993 to 2001. | | | 46 | | | Formerly, Director, Webfinancial Corporation (holding company), 2002 to 2008; formerly, Director WHX Corporation (holding company), January 2002 to June 2005; formerly, Director, State Theatre of New Jersey (not-for-profit theater), 2000 to 2005. | |
|
24
Name, (Year of Birth),
and Address(1) | | Position and
Length of
Time Served(2) | | Principal Occupation(s)(3) | | Number of
Funds in Fund
Complex
Overseen by
Fund Trustee | | Other Directorships
Held Outside Fund
Complex by Fund
Trustee | |
| George W. Morriss (1947) | | Trustee since 2007 | | Retired; formerly, Executive Vice President and Chief Financial Officer, People's Bank, Connecticut (a financial services company), 1991 to 2001. | | | 46 | | | Manager, Old Mutual 2100 fund complex (consisting of six funds) since October 2006 for four funds and since February 2007 for two funds; formerly, Member NASDAQ Issuers' Affairs Committee, 1995 to 2003. | |
|
| Edward I. O'Brien (1928) | | Trustee since 2000 | | Retired; Formerly, Member, Investment Policy Committee, Edward Jones, 1993 to 2001; President, Securities Industry Association ("SIA") (securities industry's representative in government relations and regulatory matters at the federal and state levels), 1974 to 1992; Adviser to SIA, November 1992 to November 1993. | | | 46 | | | Formerly, Director, Legg Mason, Inc. (financial services holding company), 1993 to July 2008; formerly, Director, Boston Financial Group (real estate and tax shelters), 1993 to 1999. | |
|
| Cornelius T. Ryan (1931) | | Trustee since 2000 | | Founding General Partner, Oxford Partners and Oxford Bioscience Partners (venture capital investing) and President, Oxford Venture Corporation, since 1981. | | | 46 | | | None. | |
|
| Tom D. Seip (1950) | | Trustee since 2000; Chairman of the Board since 2008; Lead Independent Trustee from 2006 to 2008 | | General Partner, Seip Investments LP (a private investment partnership); formerly, President and CEO, Westaff, Inc. (temporary staffing), May 2001 to January 2002; formerly, Senior Executive at the Charles Schwab Corporation, 1983 to 1998, including Chief Executive Officer, Charles Schwab Investment Management, Inc., and Trustee, Schwab Family of Funds and Schwab Investments, 1997 to 1998, and Executive Vice President-Retail Brokerage, Charles Schwab & Co., Inc., 1994 to 1997. | | | 46 | | | Director, H&R Block, Inc. (financial services company), since May 2001; Chairman, Compensation Committee, H&R Block, Inc., since 2006; formerly, Director, Forward Management, Inc. (asset management company), 1999 to 2006. | |
|
25
Name, (Year of Birth),
and Address(1) | | Position and
Length of
Time Served(2) | | Principal Occupation(s)(3) | | Number of
Funds in Fund
Complex
Overseen by
Fund Trustee | | Other Directorships
Held Outside Fund
Complex by Fund
Trustee | |
| Candace L. Straight (1947) | | Trustee since 1999 | | Private investor and consultant specializing in the insurance industry; formerly, Advisory Director, Securitas Capital LLC (a global private equity investment firm dedicated to making investments in the insurance sector), 1998 to December 2003. | | | 46 | | | Director, Montpelier Re (reinsurance company), since 2006; formerly, Director, National Atlantic Holdings Corporation (property and casualty insurance company), 2004 to 2008; formerly, Director, The Proformance Insurance Company (property and casualty insurance company), 2004 to 2008; formerly, Director, Providence Washington Insurance Company (property and casualty insurance company), December 1998 to March 2006; formerly, Director, Summit Global Partners (insurance brokerage firm), 2000 to 2005. | |
|
| Peter P. Trapp (1944) | | Trustee since 1984 | | Retired; formerly, Regional Manager for Mid-Southern Region, Ford Motor Credit Company, September 1997 to 2007; formerly, President, Ford Life Insurance Company, April 1995 to August 1997. | | | 46 | | | None. | |
|
26
Name, (Year of Birth),
and Address(1) | | Position and
Length of
Time Served(2) | | Principal Occupation(s)(3) | | Number of
Funds in Fund
Complex
Overseen by
Fund Trustee | | Other Directorships
Held Outside Fund
Complex by Fund
Trustee | |
| Fund Trustees who are "Interested Persons" | |
|
| Joseph V. Amato* (1962) | | Trustee since 2009 | | President and Director, Neuberger Berman Group LLC, since 2009; President and Chief Executive Officer, Neuberger and Neuberger Berman Holdings LLC (including its predecessor, Neuberger Berman Inc.), since 2007; Chief Investment Officer, Neuberger, since 2009; Chief Executive Officer (Equities) and Managing Director, Management, since 2009; Managing Director, Neuberger Berman Fixed Income LLC ("NBFI"), since 2007; Board member of NBFI since 2006; formerly, Global Head of Asset Management of Lehman Brothers Holdings Inc.'s ("LBHI") Investment Management division, 2006 to 2009; formerly, member of LBHI's Investment Management Division's Executive Management Committee, 2006 to 2009; formerly, Managing Director, Lehman Brothers Inc. ("LBI"), 2006 to 2008; formerly, Chief Recruiting and Development Officer, LBI, 2005 to 2006; formerly, Global Head of LBI's Equity Sales and a Member of its Equities Division Executive Committee, 2003 to 2005. | | | 46 | | | Member of Board of Advisors, McDonough School of Business, Georgetown University, since 2001; Member of New York City Board of Advisors, Teach for America, since 2005; Trustee, Montclair Kimberley Academy (private school), since 2007. | |
|
| Robert Conti* (1956) | | Chief Executive Officer, President and Trustee since 2008; prior thereto, Executive Vice President in 2008 and Vice President 2000 to 2008 | | Managing Director, Neuberger, since 2007; formerly, Senior Vice President, Neuberger, 2003 to 2006; formerly, Vice President, Neuberger, 1999 to 2003; President and Chief Executive Officer, Management, since 2008; formerly, Senior Vice President, Management, 2000 to 2008. | | | 46 | | | Chairman of the Board, Staten Island Mental Health Society since 2008. | |
|
27
Name, (Year of Birth),
and Address(1) | | Position and
Length of
Time Served(2) | | Principal Occupation(s)(3) | | Number of
Funds in Fund
Complex
Overseen by
Fund Trustee | | Other Directorships
Held Outside Fund
Complex by Fund
Trustee | |
| Jack L. Rivkin* (1940) | | Trustee since 2002; President from 2002 to 2008 | | Formerly, Executive Vice President and Chief Investment Officer, Neuberger Berman Holdings LLC (holding company), 2002 to August 2008 and 2003 to August 2008, respectively; formerly, Managing Director and Chief Investment Officer, Neuberger, December 2005 to August 2008 and 2003 to August 2008, respectively; formerly, Executive Vice President, Neuberger, December 2002 to 2005; formerly, Director and Chairman, Management, December 2002 to August 2008; formerly, Executive Vice President, Citigroup Investments, Inc., September 1995 to February 2002; formerly, Executive Vice President, Citigroup Inc., September 1995 to February 2002. | | | 46 | | | Director, Idealab (private company), since 2009; Director, Distributed World Power (private company), since 2009; Director, Dale Carnegie and Associates, Inc. (private company), since 1998; Director, Solbright, Inc. (private company), since 1997; formerly, Director, New York Society of Security Analysts (2006 to 2008). | |
|
(1) The business address of each listed person is 605 Third Avenue, New York, New York 10158.
(2) Pursuant to the Trust's Trust Instrument, each of these Fund Trustees shall hold office for life or until his or her successor is elected or the Trust terminates; except that (a) any Fund Trustee may resign by delivering a written resignation; (b) any Fund Trustee may be removed with or without cause at any time by a written instrument signed by at least two-thirds of the other Fund Trustees; (c) any Fund Trustee who requests to be retired, or who has become unable to serve, may be retired by a written instrument signed by a majority of the other Fund Trustees; and (d) any Fund Trustee may be removed at any shareholder meeting by a vote of at least two-thirds of the outstanding shares.
(3) Except as otherwise indicated, each individual has held the positions shown for at least the last five years.
* Indicates a Fund Trustee who is an "interested person" within the meaning of the 1940 Act. Mr. Amato and Mr. Conti are interested persons of the Trust by virtue of the fact that each is an officer of Management, Neuberger and/or their affiliates. Mr. Rivkin may be deemed an interested person of the Trust by virtue of the fact that, until August 2008, he was a director of Management and an officer of Neuberger.
28
Information about the Officers of the Trust
Name, (Year of Birth),
and Address(1) | | Position and
Length of Time
Served(2) | | Principal Occupation(s)(3) | |
| Andrew B. Allard (1961) | | Anti-Money Laundering Compliance Officer since 2002 | | Senior Vice President, Neuberger, since 2006; Deputy General Counsel, Neuberger, since 2004; formerly, Vice President, Neuberger, 2000 to 2005; formerly, Associate General Counsel, Neuberger, 1999 to 2004; Anti-Money Laundering Compliance Officer, nine registered investment companies for which Management acts as investment manager and administrator (six since 2002, two since 2003 and one since 2006). | |
|
| Claudia A. Brandon (1956) | | Executive Vice President since 2008 and Secretary since 1985 | | Senior Vice President, Neuberger, since 2007 and Employee since 1999; formerly, Vice President, Neuberger, 2002 to 2006; Senior Vice President, Management, since 2008 and Assistant Secretary since 2004; formerly, Vice President-Mutual Fund Board Relations, Management, 2000 to 2008; Executive Vice President, nine registered investment companies for which Management acts as investment manager and administrator (nine since 2008); Secretary, nine registered investment companies for which Management acts as investment manager and administrator (three since 1985, three since 2002, two since 2003 and one since 2006). | |
|
| Maxine L. Gerson (1950) | | Executive Vice President since 2008 and Chief Legal Officer since 2005 (only for purposes of sections 307 and 406 of the Sarbanes-Oxley Act of 2002) | | Senior Vice President, Neuberger, since 2002; Deputy General Counsel and Assistant Secretary, Neuberger, since 2001; Senior Vice President, Management, since 2006; Secretary and General Counsel, Management, since 2004; Executive Vice President, nine registered investment companies for which Management acts as investment manager and administrator (nine since 2008); Chief Legal Officer (only for purposes of sections 307 and 406 of the Sarbanes-Oxley Act of 2002), nine registered investment companies for which Management acts as investment manager and administrator (eight since 2005 and one since 2006). | |
|
| Sheila R. James (1965) | | Assistant Secretary since 2002 | | Vice President, Neuberger, since 2008 and Employee since 1999; formerly, Assistant Vice President, Neuberger, 2007; Assistant Secretary, nine registered investment companies for which Management acts as investment manager and administrator (six since 2002, two since 2003 and one since 2006). | |
|
| Brian Kerrane (1969) | | Vice President since 2008 | | Senior Vice President, Neuberger, since 2006; formerly, Vice President, Neuberger, 2002 to 2006; Vice President, Management, since 2008 and Employee since 1991; Vice President, nine registered investment companies for which Management acts as investment manager and administrator (nine since 2008). | |
|
| Kevin Lyons (1955) | | Assistant Secretary since 2003 | | Assistant Vice President, Neuberger, since 2008 and Employee since 1999; Assistant Secretary, nine registered investment companies for which Management acts as investment manager and administrator (eight since 2003 and one since 2006). | |
|
29
Name, (Year of Birth),
and Address(1) | | Position and
Length of Time
Served(2) | | Principal Occupation(s)(3) | |
| Owen F. McEntee, Jr. (1961) | | Vice President since 2008 | | Vice President, Neuberger, since 2006; Employee, Management, since 1992; Vice President, nine registered investment companies for which Management acts as investment manager and administrator (nine since 2008). | |
|
| John M. McGovern (1970) | | Treasurer and Principal Financial and Accounting Officer since 2005; prior thereto, Assistant Treasurer since 2002 | | Senior Vice President, Neuberger, since 2007; formerly, Vice President, Neuberger, 2004 to 2006; Employee, Management, since 1993; Treasurer and Principal Financial and Accounting Officer, nine registered investment companies for which Management acts as investment manager and administrator (eight since 2005 and one since 2006); formerly, Assistant Treasurer, eight registered investment companies for which Management acts as investment manager and administrator, 2002 to 2005. | |
|
| Andrew Provencher (1965) | | Vice President since 2008 | | Managing Director, Management, since 2008; Managing Director, Neuberger, since 2005; formerly, Senior Vice President, Neuberger, 2003 to 2005; formerly, Vice President, Neuberger, 1999 to 2003; Vice President, nine registered investment companies for which Management acts as investment manager and administrator (nine since 2008). | |
|
| Frank Rosato (1971) | | Assistant Treasurer since 2005 | | Vice President, Neuberger, since 2006; Employee, Management, since 1995; Assistant Treasurer, nine registered investment companies for which Management acts as investment manager and administrator (eight since 2005 and one since 2006). | |
|
| Neil S. Siegel (1967) | | Vice President since 2008 | | Managing Director, Management, since 2008; Managing Director, Neuberger, since 2006; formerly, Senior Vice President, Neuberger, 2004 to 2006; Vice President, nine registered investment companies for which Management acts as investment manager and administrator (nine since 2008); formerly, Head of Institutional Marketing, Morgan Stanley Investment Management, 1993 to 2004. | |
|
| Chamaine Williams (1971) | | Chief Compliance Officer since 2005 | | Senior Vice President, Neuberger, since 2007; Chief Compliance Officer, Management, since 2006; Chief Compliance Officer, nine registered investment companies for which Management acts as investment manager and administrator (eight since 2005 and one since 2006); formerly, Senior Vice President, LBI, 2007 to 2008; formerly, Vice President, LBI, 2003 to 2006; formerly, Chief Compliance Officer, Lehman Brothers Asset Management Inc., 2003 to 2007; formerly, Chief Compliance Officer, Lehman Brothers Alternative Investment Management LLC, 2003 to 2007; formerly, Vice President, UBS Global Asset Management (US) Inc. (formerly, Mitchell Hutchins Asset Management, a wholly-owned subsidiary of PaineWebber Inc.), 1997 to 2003. | |
|
(1) The business address of each listed person is 605 Third Avenue, New York, New York 10158.
(2) Pursuant to the By-Laws of the Trust, each officer elected by the Fund Trustees shall hold office until his or her successor shall have been elected and qualified or until his or her earlier death, inability to serve, or resignation. Officers serve at the pleasure of the Fund Trustees and may be removed at any time with or without cause.
(3) Except as otherwise indicated, each individual has held the positions shown for at least the last five years.
30
Proxy Voting Policies and Procedures
A description of the policies and procedures that the Trust uses to determine how to vote proxies relating to portfolio securities is available, without charge, by calling 1-800-877-9700 (toll-free) and on the website of the Securities and Exchange Commission, at www.sec.gov. Information regarding how the Trust voted proxies relating to portfolio securities during the most recent 12-month period ended June 30 is also available, without charge, by calling 1-800-877-9700 (toll-free), on the website of the Securities and Exchange Commission at www.sec.gov, and on Management's website at www.nb.com.
Quarterly Portfolio Schedule
The Trust files a complete schedule of portfolio holdings for the Fund with the Securities and Exchange Commission for the first and third quarters of each fiscal year on Form N-Q. The Trust's Forms N-Q are available on the Securities and Exchange Commission's website at www.sec.gov and may be reviewed and copied at the Securities and Exchange Commission's Public Reference Room in Washington, DC. Information on the operation of the Public Reference Room may be obtained by calling 1-800-SEC-0330. The information on Form N-Q is available upon request, without charge, by calling 1-800-877-9700 (toll free).
Notice to Shareholders (Unaudited)
100.00% of the dividends distributed during the fiscal year ended December 31, 2009 qualifies for the dividends received deduction for corporate shareholders.
31
Neuberger Berman
Advisers Management Trust
International Portfolio
S Class Shares
Annual Report
December 31, 2009
F0509 02/10
International Portfolio Manager's Commentary
We are pleased to report that, for the year ended December 31, 2009, the Neuberger Berman Advisers Management Trust (AMT) International Portfolio outperformed its benchmark, the MSCI EAFE(R) Index.
The international equity market enjoyed a significant rebound during 2009, once the indiscriminate selloff from the financial crisis that had begun in 2008 ended in early March. Government stimulus packages and low interest rate policies enhanced liquidity and led to a return in investors' risk appetite, which drove markets up to well above their March lows. As raw material and commodity prices increased and stock markets rose, investors became increasingly eager to look overseas for returns. For the full year, the MSCI EAFE Index was up over 32% in dollar terms, outperforming the S&P 500.
Within international markets, areas that had suffered most during the downturn performed best during the rally. From a quality perspective, the rally--at least initially--was driven primarily by lower-quality stocks. Markets with the highest correlation to global recovery, those where governmental stimulus has been most proactive, and those whose currency was most punished during the downdraft from mid-2007 through March 2009 were the markets that bounced back most significantly during the year.
Within the EAFE Index, Norway, Australia, Singapore, Sweden and Hong Kong were top performers, while Japan, Ireland, and Finland lagged. From a sector perspective, Materials, Financials, Consumer Discretionary and Energy were strongest, and Utilities, Telecommunications and Health Care, though positive, were weakest.
The Portfolio outperformed the benchmark even though our "quality at a reasonable price" philosophy kept us out of the lower-quality stocks that advanced most early on. Within the Portfolio, strong stock selection within Energy was the most important contributor to outperformance. Top performers included Addax Petroleum, a Canadian energy company focused on West African and Middle Eastern exploration and production, which rose significantly on news that Chinese oil company Sinopec would acquire it. Fugro, a diversified Dutch oil services company, performed well as energy prices rebounded, and also because of their exposure to infrastructure projects. Brazilian upstream oil and gas firm Petroleo Brasileiro benefited from both the rebound in energy prices and participation in the strong Brazilian market. In addition, the Portfolio benefited from having no exposure to the relatively weak Utilities sector, an area we tend to avoid as most utility companies are low growth and capital intensive and operate in a highly regulated environment.
Stock selection was a widespread benefit this period, particularly within Consumer Staples, Industrials, Information Technology and Telecommunications. Top performers included Ultrapar, a Brazilian oil and gas distributor. Ultrapar acquired Texaco assets and is in the process of converting them to their own brand, Ipiranga. Ipiranga stations have large convenience stores that allow them to enjoy higher sales per square foot, and the ability to sell fuel at a premium; the stock also benefited from being tied to the resilient Brazilian economy. Within Consumer Staples, Belgian beverage company Anheuser-Busch InBev was a top performer, and Dutch food and beverage company Sligro Food was also strong.
Although we were underweighted in the Financials sector during the strong rebound off its price lows, two additional top performers came from this sector. Norwegian bank DnB NOR continued to benefit from improvements in the shipping and oil markets, and Deutsche Boerse, operator of the Frankfurt stock exchange and an electronic and derivatives exchange, appreciated on resilient fees and above-estimate earnings.
From a country perspective, Canada, the Netherlands and Norway were our strongest markets in 2009. Exposure to emerging markets, including Brazil and China, was also beneficial. On the other hand, we were substantially underweighted in the natural resources-driven Australian market, which tempered our relative outperformance somewhat. Stock selection in Switzerland was another disappointment, due in large part to our sale of insurer Swiss Re early in the year after they announced greater-than-expected losses. The stock surged later with the rest of the market. While we benefited from an underweight in the lagging Japanese market, holdings there, including Nihon Kohden, Nintendo, Takeda Pharmaceutical, East Japan Railway and Hisamitsu Pharmaceutical, were among our weakest performers for the year.
As we enter 2010, we think markets appear fairly valued. We believe we are in the early stages of a global economic recovery--housing prices have begun to stabilize, job losses are slowing, and the financial system continues to recover.
1
However, downside risks remain. Higher raw materials prices, sooner-than-expected interest rate increases, and pullbacks in government stimulus and higher taxes (due to ongoing fiscal pressures) could all hamper the recovery.
Regardless of the scenario that develops, we believe opportunities exist. For example, at present, we believe companies may focus their efforts on enhancing efficiencies in order to remain competitive, and we anticipate continued investment in environmental technologies. In our view, there is also potential upside for developed economies if their currencies continue to decline, relative to emerging market economies. We believe our Portfolio is well positioned with companies that can perform in a range of economic environments.
Sincerely,

Benjamin Segal
Portfolio Manager
2
International Portfolio
SECTOR ALLOCATION
| (% of Equity Market Value) | |
| Consumer Discretionary | | | 9.0 | % | |
| Consumer Staples | | | 12.4 | | |
| Energy | | | 10.5 | | |
| Financials | | | 16.7 | | |
| Health Care | | | 9.2 | | |
| Industrials | | | 15.2 | | |
| Information Technology | | | 9.0 | | |
| Materials | | | 11.4 | | |
| Telecommunication Services | | | 6.6 | | |
| Total | | | 100.0 | % | |
AVERAGE ANNUAL TOTAL RETURN1
| | | Inception
Date | | 1 Year | | Life of
Fund* | |
| International Portfolio Class S | | | 04/29/2005 | | | | 34.51 | % | | | 1.63 | % | |
| MSCI EAFE(R) Index2 | | | | | | | 32.46 | % | | | 4.90 | % | |
Performance data quoted represent past performance, which is no guarantee of future results. The investment return and principal value of an investment will fluctuate so that an investor's shares, when redeemed may be worth more or less than their original cost. Results are shown on a "total return" basis and include reinvestment of all income dividends and distributions.
Current performance may be lower or higher than the performance data quoted. For performance data current to the most recent month end, please visit https://www.nb.com.
* Index returns are as of the inception date 04/29/2005.
As stated in the Portfolio's most recent prospectus, the total annual fund operating expense ratio for fiscal year 2008 was 1.61% for Class S shares (prior to any fee waivers or expense reimbursements). Neuberger Berman Management LLC has contractually agreed to limit certain expenses of the Portfolio through 12/31/2012.
COMPARISON OF A $10,000 INVESTMENT
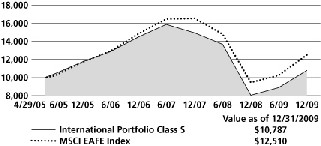
The chart shows the value of a hypothetical $10,000 investment in the Portfolio over the past 10 fiscal years, or since the Portfolio's inception, if it has not operated for 10 years. The result is compared with benchmarks, which may include a broad-based market index and/or a narrower index. Please note that market indexes do not include expenses. All results include the reinvestment of income dividends and distributions. Results represent past performance and do not indicate future results. The chart and table do not reflect the deduction of taxes that a shareholder would pay on Portfolio distributions or the redemption of Portfolio shares.
Please see Endnotes for additional information.
3
Endnotes
1 "Total Return" includes reinvestment of all income dividends and distributions. Results represent past performance and do not indicate future results. The value of an investment in the Portfolio and the return on the investment both will fluctuate, and redemption proceeds may be higher or lower than an investor's original cost. The performance information does not reflect fees and expenses of the variable annuity and variable life insurance policies or the qualified pension and retirement plans whose proceeds are invested in the Portfolio. Neuberger Berman Management LLC ("NBM LLC") has agreed to absorb certain expenses of the AMT Portfolios, including the Portfolio. Without this arrangement, which is subject to change, the total returns of the Portfolio may have been less.
2 The MSCI EAFE(R) Index (Europe, Australasia, Far East) is a free float-adjusted market capitalization index that is designed to measure the equity market performance of developed markets, excluding the U.S. & Canada. As of June 2007, the MSCI EAFE Index consisted of the following 21 developed market country indices: Australia, Austria, Belgium, Denmark, Finland, France, Germany, Greece, Hong Kong, Ireland, Italy, Japan, the Netherlands, New Zealand, Norway, Portugal, Singapore, Spain, Sweden, Switzerland and the United Kingdom. The index is translated into U.S. dollars. Please note that indices do not take into account any fees and expenses of investing in the individual securities that they track and that individuals cannot invest directly in any index. Data about the performance of this index is prepared or obtained by NBM LLC and include reinvestment of all income dividends and distributions. The Portfolio may invest directly in many securities not included in the above-described index.
Any ratios or other measurements using a factor of forecasted earnings of a company discussed herein are based on consensus estimates, not NBM LLC's own projections, and they may or may not be realized. In addition, any revision to a forecast could affect the market price of a security. By quoting them herein, NBM LLC does not offer an opinion as to the accuracy of and does not guarantee these forecasted numbers.
The investments for the Portfolio are managed by the same portfolio manager(s) who manage one or more other mutual funds that have similar names, investment objectives and investment styles as the Portfolio. You should be aware that the Portfolio is likely to differ from the other mutual funds in size, cash flow pattern and tax matters. Accordingly, the holdings and performance can be expected to vary from those of the other mutual funds.
The composition, industries and holdings of the Portfolio are subject to change.
Shares of the separate AMT Portfolios are not available to the general public. Shares of this Portfolio may be purchased only by life insurance companies to be used with their separate accounts that fund variable annuity and variable life insurance policies and by qualified pension and retirement plans.
Statistics and projections in this report are derived from sources deemed to be reliable but cannot be regarded as a representation of future results of the AMT Portfolios. This report is prepared for the general information of shareholders and is not an offer of shares of the AMT Portfolios. Shares of the AMT Portfolios are sold only through the currently effective prospectuses, which must precede or accompany this report.
(c) 2010 Neuberger Berman Management LLC distributor. All rights reserved.
4
Information About Your Fund's Expenses
This table is designed to provide information regarding costs related to your investments. All mutual funds incur operating expenses, which include management fees, fees for administrative services and costs of shareholder reports, among others. The following examples are based on an investment of $1,000 made at the beginning of the six month period ended December 31, 2009 and held for the entire period. The table illustrates the fund's costs in two ways:
| Actual Expenses and Performance: | | The first section of the table provides information about actual account values and actual expenses in dollars, based on the fund's actual performance during the period. You may use the information in this line, together with the amount you invested, to estimate the expenses you paid over the period. Simply divide your account value by $1,000 (for example, an $8,600 account value divided by $1,000 = 8.6), then multiply the result by the number in the first section of the table under the heading entitled "Expenses Paid During the Period" to estimate the expenses you paid over the period. | |
|
| Hypothetical Example for Comparison Purposes: | | The second section of the table provides information about hypothetical account values and hypothetical expenses based on the fund's actual expense ratio and an assumed rate of return at 5% per year before expenses. This return is not the fund's actual return. The hypothetical account values and expenses may not be used to estimate the actual ending account balance or expenses you paid for the period. You may use this information to compare the ongoing costs of investing in this fund versus other funds. To do so, compare the expenses shown in this 5% hypothetical example with the 5% hypothetical examples that appear in the shareholder reports of other funds. | |
|
Please note that the expenses in the table are meant to highlight your ongoing costs only. The table and expense example do not include any transactional costs, such as fees and expenses that are, or may be, imposed under your variable contract or qualified pension plan. Therefore, the information under the heading "Hypothetical (5% annual return before expenses)" is useful in comparing ongoing costs only, and will not help you determine the relative total costs of owning different funds. In addition, if these transactional costs were included, your costs would have been higher.
Expense Information as of 12/31/09 (Unaudited)
NEUBERGER BERMAN ADVISERS MANAGEMENT TRUST INTERNATIONAL PORTFOLIO
| Actual | | Beginning Account
Value
7/1/09 | | Ending Account
Value
12/31/09 | | Expenses Paid During
the Period*
7/1/09 - 12/31/09 | |
| Class S | | $ | 1,000.00 | | | $ | 1,216.60 | | | $ | 8.38 | | |
| Hypothetical (5% annual return before expenses)** | |
| Class S | | $ | 1,000.00 | | | $ | 1,017.64 | | | $ | 7.63 | | |
* Expenses are equal to the annualized expense ratio of 1.50%, multiplied by the average account value over the period, multiplied by 184/365 (to reflect the one-half year period shown).
** Hypothetical 5% annual return before expenses is calculated by multiplying the number of days in the most recent half year divided by 365.
5
Schedule of Investments International Portfolio
| NUMBER OF SHARES | | | | VALUEt | |
| Common Stocks (94.6%) | | | |
| Australia (1.0%) | | | |
| | 41,000 | | | BHP Billiton ADR | | $ | 3,139,780 | | |
| Austria (0.8%) | | | |
| | 52,220 | | | Schoeller-Bleckmann
Oilfield Equipment | | | 2,494,174 | | |
| Belgium (2.8%) | | | |
| | 57,567 | | | Anheuser-Busch InBev | | | 2,980,079 | | |
| | 11,857 | | | Colruyt SA | | | 2,860,541 | | |
| | 123,525 | | | Telenet Group Holding | | | 3,520,317 | | |
| | | | 9,360,937 | | |
| Canada (6.5%) | | | |
| | 54,700 | | | Barrick Gold | | | 2,168,439 | | |
| | 102,010 | | | Cameco Corp. | | | 3,309,460 | | |
| | 102,605 | | | Corus Entertainment, B Shares | | | 1,947,420 | | |
| | 219,983 | | | MacDonald, Dettwiler | | | 8,960,440 | * | |
| | 385,500 | | | Neo Material Technologies | | | 1,680,815 | * | |
| | 184,940 | | | Talisman Energy | | | 3,481,827 | | |
| | | | 21,548,401 | | |
| Chile (1.0%) | | | |
| | 88,710 | | | Sociedad Quimica y Minera
de Chile ADR, B Shares | | | 3,332,835 | | |
| China (0.0%) | | | |
| | 109,600 | | | Minth Group | | | 161,734 | | |
| Denmark (2.2%) | | | |
| | 230 | | | A.P. Moller-Maersk Class B | | | 1,615,956 | | |
| | 49,767 | | | Novo Nordisk Class B | | | 3,177,207 | * | |
| | 36,225 | | | Trygvesta AS | | | 2,381,235 | * | |
| | | | 7,174,398 | | |
| France (9.5%) | | | |
| | 46,615 | | | Alstom SA | | | 3,260,059 | | |
| | 64,855 | | | Arkema | | | 2,404,413 | | |
| | 15,835 | | | CNP Assurances | | | 1,533,387 | | |
| | 56,745 | | | Eutelsat Communications | | | 1,820,612 | | |
| | 94,594 | | | Ipsen SA | | | 5,245,178 | | |
| | 137,847 | | | Ipsos | | | 4,165,596 | n | |
| | 46,817 | | | Societe Generale | | | 3,252,843 | | |
| | 57,650 | | | Sodexo | | | 3,280,281 | | |
| | 105,385 | | | Teleperformance | | | 3,419,411 | | |
| | 60,295 | | | Thales SA | | | 3,098,879 | | |
| | | | 31,480,659 | | |
| NUMBER OF SHARES | | | | VALUEt | |
| Germany (8.9%) | | | |
| | 66,375 | | | Deutsche Boerse | | $ | 5,496,491 | | |
| | 58,340 | | | Fresenius Medical Care | | | 3,094,762 | | |
| | 137,510 | | | Gerresheimer AG | | | 4,632,921 | * | |
| | 41,545 | | | Linde AG | | | 5,005,436 | | |
| | 65,910 | | | SAP AG | | | 3,085,247 | | |
| | 18,745 | | | SMA Solar Technology | | | 2,505,190 | * | |
| | 184,504 | | | Tognum AG | | | 3,054,224 | | |
| | 36,281 | | | Wincor Nixdorf | | | 2,484,847 | | |
| | | | 29,359,118 | | |
| Greece (0.7%) | | | |
| | 74,910 | | | Titan Cement | | | 2,172,714 | | |
| Hong Kong (1.4%) | | | |
| | 70,950 | | | China Mobile ADR | | | 3,294,209 | | |
| | 289,000 | | | Kerry Properties | | | 1,461,768 | | |
| | | | 4,755,977 | | |
| India (0.3%) | | | |
| | 8,553 | | | State Bank of India GDR | | | 841,487 | | |
| Ireland (1.1%) | | | |
| | 131,405 | | | DCC PLC | | | 3,654,333 | | |
| Israel (0.9%) | | | |
| | 628,035 | | | Makhteshim-Agan Industries | | | 2,982,546 | | |
| Japan (11.6%) | | | |
| | 293,900 | | | Brother Industries | | | 3,380,022 | | |
| | 192,500 | | | Circle K Sunkus | | | 2,374,628 | | |
| | 5,709 | | | Jupiter Telecommunications | | | 5,649,194 | | |
| | 790 | | | KDDI Corp. | | | 4,184,401 | | |
| | 918 | | | Kenedix Realty Investment | | | 2,513,391 | | |
| | 254,900 | | | Nihon Kohden | | | 4,058,177 | | |
| | 99,835 | | | Nintendo Co. ADR | | | 2,977,080 | | |
| | 234,100 | | | NSD Co. | | | 2,415,263 | | |
| | 60,300 | | | Sankyo Co. | | | 3,019,422 | | |
| | 92,200 | | | Sundrug Co. | | | 2,056,978 | | |
| | 30,420 | | | Toyota Motor ADR | | | 2,560,147 | | |
| | 10,719 | | | Yahoo! Japan | | | 3,222,862 | | |
| | | | 38,411,565 | | |
| Netherlands (10.6%) | | | |
| | 66,375 | | | ArcelorMittal | | | 3,033,753 | | |
| | 65,642 | | | Fugro NV | | | 3,770,427 | | |
| | 343,520 | | | Koninklijke Ahold | | | 4,551,191 | | |
| | 35,862 | | | Koninklijke DSM | | | 1,762,024 | | |
| | 79,929 | | | Nutreco Holding | | | 4,492,832 | | |
| | 129,851 | | | Sligro Food Group | | | 4,454,367 | n | |
| | 180,528 | | | TNT NV | | | 5,546,452 | | |
| | 224,717 | | | Unilever NV | | | 7,313,818 | * | |
| | | | 34,924,864 | | |
See Notes to Schedule of Investments 6
| NUMBER OF SHARES | | | | VALUEt | |
| Norway (2.4%) | | | |
| | 452,116 | | | DnB NOR | | $ | 4,880,915 | ** | |
| | 482,734 | | | Prosafe ASA | | | 3,062,372 | | |
| | | | 7,943,287 | | |
| Singapore (1.1%) | | | |
| | 258,000 | | | United Overseas Bank | | | 3,591,296 | | |
| South Africa (0.5%) | | | |
| | 109,332 | | | MTN Group | | | 1,740,165 | | |
| Sweden (1.7%) | | | |
| | 115,015 | | | Svenska Handelsbanken,
A Shares | | | 3,276,753 | * | |
| | 238,540 | | | Swedbank AB, A Shares | | | 2,348,543 | * | |
| | | | 5,625,296 | | |
| Switzerland (8.0%) | | | |
| | 4,020 | | | Barry Callebaut | | | 2,531,256 | * | |
| | 14,185 | | | Bucher Industries | | | 1,528,893 | | |
| | 62,650 | | | Credit Suisse Group | | | 3,103,764 | | |
| | 4,228 | | | Givaudan SA | | | 3,383,098 | * | |
| | 73,570 | | | Nestle SA | | | 3,570,616 | | |
| | 84,105 | | | Nobel Biocare Holding | | | 2,818,786 | | |
| | 16,545 | | | Roche Holding | | | 2,829,407 | | |
| | 2,612 | | | SGS SA | | | 3,409,915 | | |
| | 40,029 | | | Sulzer AG | | | 3,140,270 | | |
| | | | 26,316,005 | | |
| United Kingdom (21.6%) | | | |
| | 783,855 | | | Amlin PLC | | | 4,526,063 | | |
| | 170,452 | | | Antofagasta PLC | | | 2,711,480 | | |
| | 401,786 | | | Balfour Beatty | | | 1,671,975 | | |
| | 652,104 | | | Barclays PLC | | | 2,873,474 | | |
| | 266,505 | | | BP PLC | | | 2,573,421 | | |
| | 699,195 | | | Cairn Energy | | | 3,742,998 | * | |
| | 140,515 | | | Chemring Group | | | 6,632,798 | | |
| | 206,720 | | | Croda International | | | 2,665,471 | | |
| | 149,722 | | | Diageo PLC | | | 2,612,072 | | |
| | 513,756 | | | Experian Group | | | 5,074,737 | | |
| | 1,100 | | | Fidessa Group | | | 20,762 | | |
| | 723,879 | | | HSBC Holdings | | | 8,234,078 | | |
| | 703,700 | | | Informa PLC | | | 3,617,642 | | |
| | 323,990 | | | Reed Elsevier | | | 2,659,814 | | |
| | 1,060,356 | | | RPS Group | | | 3,707,319 | | |
| | 347,584 | | | Smith & Nephew | | | 3,575,390 | | |
| | 147,770 | | | Tullow Oil | | | 3,100,280 | | |
| | 3,516,521 | | | Vodafone Group | | | 8,143,256 | | |
| | 116,500 | | | Willis Group Holdings | | | 3,073,270 | | |
| | | | 71,216,300 | | |
| | | | | Total Common Stocks
(Cost $259,848,623) | | | 312,227,871 | | |
| NUMBER OF SHARES | | | | VALUEt | |
| Preferred Stocks (2.5%) | | | |
| Brazil (2.5%) | | | |
| | 100,543 | | | Petroleo Brasileiro ADR | | $ | 4,262,018 | | |
| | 83,645 | | | Ultrapar Participacoes ADR | | | 3,922,950 | | |
| | | | | Total Preferred Stocks
(Cost $4,867,588) | | | 8,184,968 | | |
| Rights (0.0%) | | | |
| Belgium (0.0%) | | | |
| | 112,269 | | | Anheuser-Busch InBev
VVPR Strip | | | 805 | * | |
| | 77,560 | | | Fortis VVPR Strip | | | 222 | * | |
| | | | | Total Rights
(Cost $42) | | | 1,027 | | |
| Warrants (0.0%) | | | |
| Italy (0.0%) | | | |
| | 124,793 | | | UBI Banca (Cost $0) | | | 8,784 | * | |
| Short-Term Investments (11.6%) | | | |
| | 20,201,248 | | | Neuberger Berman Securities
Lending Quality Fund, LLC | | | 20,605,273 | tt | |
| | 17,841,012 | | | State Street Institutional Liquid
Reserves Fund Institutional Class | | | 17,841,012 | | |
| | | | | Total Short-Term Investments
(Cost $38,446,285) | | | 38,446,285 | | |
| | | | | Total Investments (108.7%)
(Cost $303,162,538) | | | 358,868,935 | ## | |
| | | | | Liabilities, less cash, receivables and
other assets [(8.7%)] | | | (28,760,820 | ) | |
| | | | | Total Net Assets (100.0%) | | $ | 330,108,115 | | |
See Notes to Schedule of Investments 7
SUMMARY SCHEDULE OF INVESTMENTS BY INDUSTRY INTERNATIONAL PORTFOLIO
| Industry | | Valuet | | Percentage of
Net Assets | |
| Commercial Banks | | $ | 29,308,173 | | | | 8.9 | % | |
| Oil, Gas & Consumable Fuels | | | 24,392,954 | | | | 7.4 | % | |
| Chemicals | | | 23,216,638 | | | | 7.0 | % | |
| Media | | | 19,860,278 | | | | 6.0 | % | |
| Food Products | | | 17,908,522 | | | | 5.4 | % | |
| Software | | | 17,438,030 | | | | 5.3 | % | |
| Wireless Telecommunication Services | | | 17,362,030 | | | | 5.3 | % | |
| Food & Staples Retailing | | | 16,297,705 | | | | 4.9 | % | |
| Professional Services | | | 11,904,063 | | | | 3.6 | % | |
| Insurance | | | 11,513,955 | | | | 3.5 | % | |
| Pharmaceuticals | | | 11,251,792 | | | | 3.4 | % | |
| Metals & Mining | | | 11,053,452 | | | | 3.4 | % | |
| Health Care Equipment & Supplies | | | 10,452,353 | | | | 3.2 | % | |
| Aerospace & Defense | | | 9,731,677 | | | | 2.9 | % | |
| Energy Equipment & Services | | | 9,326,974 | | | | 2.8 | % | |
| Electrical Equipment | | | 8,819,473 | | | | 2.7 | % | |
| Beverages | | | 5,592,956 | | | | 1.7 | % | |
| Air Freight & Logistics | | | 5,546,452 | | | | 1.7 | % | |
| Diversified Financial Services | | | 5,496,713 | | | | 1.7 | % | |
| Machinery | | | 4,669,163 | | | | 1.4 | % | |
| Life Science Tools & Services | | | 4,632,921 | | | | 1.4 | % | |
| Commercial Services & Supplies | | | 3,707,319 | | | | 1.1 | % | |
| Industrial Conglomerates | | | 3,654,333 | | | | 1.1 | % | |
| Diversified Telecommunication Services | | | 3,520,317 | | | | 1.1 | % | |
| Office Electronics | | | 3,380,022 | | | | 1.0 | % | |
| Hotels, Restaurants & Leisure | | | 3,280,281 | | | | 1.0 | % | |
| Internet Software & Services | | | 3,222,862 | | | | 1.0 | % | |
| Capital Markets | | | 3,103,764 | | | | 0.9 | % | |
| Health Care Providers & Services | | | 3,094,762 | | | | 0.9 | % | |
| Leisure Equipment & Products | | | 3,019,422 | | | | 0.9 | % | |
| Automobiles | | | 2,560,147 | | | | 0.8 | % | |
| Real Estate Investment Trusts | | | 2,513,391 | | | | 0.8 | % | |
| Computers & Peripherals | | | 2,484,847 | | | | 0.8 | % | |
| Construction Materials | | | 2,172,714 | | | | 0.7 | % | |
| Construction & Engineering | | | 1,671,975 | | | | 0.5 | % | |
| Building, Construction & Furnishing | | | 1,615,956 | | | | 0.5 | % | |
| Real Estate Management & Development | | | 1,461,768 | | | | 0.4 | % | |
| Auto Components | | | 161,734 | | | | 0.0 | % | |
| Application Software | | | 20,762 | | | | 0.0 | % | |
| Other Assets--Net | | | 9,685,465 | | | | 2.9 | % | |
| | | $ | 330,108,115 | | | | 100.0 | % | |
See Notes to Schedule of Investments 8
Notes to Schedule of Investments International Portfolio
t The value of investments in equity securities by Neuberger Berman Advisers Management Trust International Portfolio (the "Fund") is determined by Neuberger Berman Management LLC ("Management") primarily by obtaining valuations from an independent pricing service based on the latest sale price when that price is readily available. Securities traded primarily on the NASDAQ Stock Market are normally valued by the Fund at the NASDAQ Official Closing Price ("NOCP") provided by NASDAQ each business day. The NOCP is the most recently reported price as of 4:00:02 p.m., Eastern time, unless that price is outside the range of the "inside" bid and asked prices (i.e., the bid and asked prices that dealers quote to each other when trading for their own accounts); in that case, NASDAQ will adjust the price to equal the inside bid or asked price, whichever is closer. Because of delays in reporting trades, the NOCP may not be based on the price of the last trade to occur before the market closes. If there is no reported sale of a security on a particular day, the independent pricing service may value the security based on reported market quotations. Management has developed a process to periodically review information provided by independent pricing services. If a valuation is not available from an independent pricing service, the Fund seeks to obtain quotations from principal market makers. If such quotations are not readily available, securities are valued using methods the Board of Trustees of Neuberger Berman Advisers Management Trust (the "Board") has approved on the belief that they reflect fair value. Numerous factors may be considered when determining the fair value of a security, including available analyst, media or other reports, trading in futures or ADRs and whether the issuer of the security being fair valued has other securities outstanding. Foreign security prices are furnished by independent quotation services and expressed in local currency values. Foreign security prices are currently translated from the local currency into U.S. dollars using the exchange rate as of 4:00 p.m., Eastern time. The Board has approved the use of Interactive Data Pricing and Reference Data, Inc. ("Interactive") to assist in determining the fair value of the Fund's foreign equity securities when changes in the value of a certain index suggest that the closing prices on the foreign exchanges may no longer represent the amount that the Fund could expect to receive for those securities. In this event, Interactive will provide adjusted prices for certain foreign equity securities using a statistical analysis of historical correlations of multiple factors. In the absence of precise information about the market values of these foreign securities as of the close of the New York Stock Exchange, the Board has determined on the basis of available data that prices adjusted in this way are likely to be closer to the prices the Fund could realize on a current sale than are the prices of those securities established at the close of the foreign markets in which the securities primarily trade. Fair value prices are necessarily estimates, and there is no assurance that such a price will be at or close to the price at which the security next trades. Short-term debt securities with less than 60 days until maturity may be valued at cost, which, when combined with interest earned, is expected to approximate market value.
In accordance with Accounting Standards Codification ("ASC") 820 "Fair Value Measurements and Disclosures" ("ASC 820"), formerly known as Financial Accounting Standards Board ("FASB") Statement of Financial Accounting Standards No. 157, "Fair Value Measurements," investments held by a fund are carried at "fair value" as defined by ASC 820. Fair value is defined as the price that a fund would receive upon selling an investment in an orderly transaction to an independent buyer in the principal or most advantageous market for the investment under current market conditions. Various inputs, including the volume and level of activity for the asset or liability in the market are considered in determining the value of the Fund's investments, some of which are discussed above. Significant management judgement may be necessary to estimate fair value in accordance with ASC 820.
In addition to defining fair value, ASC 820 established a three-tier hierarchy of inputs to establish a classification of fair value measurements for disclosure purposes. The three-tier hierarchy of inputs is summarized in the three broad Levels listed below.
. Level 1 - quoted prices in active markets for identical investments
. Level 2 - other significant observable inputs (including quoted prices for similar investments, interest rates, prepayment speeds, credit risk, amortized cost, etc.)
. Level 3 - significant unobservable inputs (including the Fund's own assumptions in determining the fair value of investments)
See Notes to Financial Statements 9
Notes to Schedule of Investments International Portfolio (cont'd)
The inputs or methodology used for valuing an investment are not necessarily an indication of the risk associated with investing in those securities.
The following is a summary, by category of Level, of inputs used to value the Fund's investments as of December 31, 2009:
| Asset Valuation Inputs | | Level 1 | | Level 2 | | Level 3 | | Total | |
| Investments: | |
| Common Stocks^ | | $ | 312,227,871 | | | $ | -- | | | $ | -- | | | $ | 312,227,871 | | |
| Preferred Stocks^ | | | 8,184,968 | | | | -- | | | | -- | | | | 8,184,968 | | |
| Rights^ | | | 1,027 | | | | -- | | | | -- | | | | 1,027 | | |
| Warrants^ | | | 8,784 | | | | -- | | | | -- | | | | 8,784 | | |
| Short-Term Investments | | | -- | | | | 38,446,285 | | | | -- | | | | 38,446,285 | | |
| Total Investments | | $ | 320,422,650 | | | $ | 38,446,285 | | | $ | -- | | | $ | 358,868,935 | | |
^ The Schedule of Investments and Summary Schedule of Investments by Industry provide information on the industry categorization and country for the portfolio.
## At December 31, 2009, the cost of investments for U.S. federal income tax purposes was $311,619,582. Gross unrealized appreciation of investments was $52,089,492 and gross unrealized depreciation of investments was $4,840,139, resulting in net unrealized appreciation of $47,249,353, based on cost for U.S. federal income tax purposes.
* Security did not produce income during the last twelve months.
tt Managed by an affiliate of Management and could be deemed an affiliate of the Fund (see Notes A & F of Notes to Financial Statements).
n These securities have been deemed by the investment manager to be illiquid because of low daily trade volume. At December 31, 2009, these securities amounted to $8,619,963 or 2.6% of net assets.
* All or a portion of this security is on loan (see Note A of Notes Financial Statements).
See Notes to Financial Statements 10
Statement of Assets and Liabilities
Neuberger Berman Advisers Management Trust
| | | INTERNATIONAL
PORTFOLIO | |
| | | December 31, 2009 | |
| Assets | |
| Investments in securities, at value*t (Notes A & F)--see Schedule of Investments: | |
| Unaffiliated issuers | | $ | 338,263,662 | | |
| Affiliated issuers | | | 20,605,273 | | |
| | | | 358,868,935 | | |
| Cash | | | 1 | | |
| Foreign currency | | | 26,627 | | |
| Dividends and interest receivable | | | 433,707 | | |
| Receivable for securities sold | | | 79,017 | | |
| Receivable for Fund shares sold | | | 5,298 | | |
| Receivable for securities lending income--net (Note A) | | | 3,817 | | |
| Prepaid expenses and other assets | | | 5,746 | | |
| Total Assets | | | 359,423,148 | | |
| Liabilities | |
| Payable for collateral on securities loaned (Note A) | | | 20,404,243 | | |
| Payable for securities purchased | | | 8,391,009 | | |
| Payable for Fund shares redeemed | | | 128,781 | | |
| Payable to investment manager (Notes A & B) | | | 234,770 | | |
| Payable to administrator--net (Note B) | | | 42,435 | | |
| Accrued expenses and other payables | | | 113,795 | | |
| Total Liabilities | | | 29,315,033 | | |
| Net Assets at value | | $ | 330,108,115 | | |
| Net Assets consist of: | |
| Paid-in capital | | $ | 445,001,114 | | |
| Undistributed net investment income (loss) | | | 2,640,484 | | |
| Accumulated net realized gains (losses) on investments | | | (173,234,184 | ) | |
| Net unrealized appreciation (depreciation) in value of investments | | | 55,700,701 | | |
| Net Assets at value | | $ | 330,108,115 | | |
| Shares Outstanding ($.001 par value; unlimited shares authorized) | | | 34,728,283 | | |
| Net Asset Value, offering and redemption price per share | | $ | 9.51 | | |
| tSecurities on loan, at value: | |
| Unaffiliated issuers | | $ | 19,430,766 | | |
| *Cost of Investments: | |
| Unaffiliated issuers | | $ | 282,557,265 | | |
| Affiliated issuers | | | 20,605,273 | | |
| Total cost of investments | | $ | 303,162,538 | | |
| Total cost of foreign currency | | $ | 26,588 | | |
See Notes to Financial Statements 11
Statement of Operations
Neuberger Berman Advisers Management Trust
| | | INTERNATIONAL
PORTFOLIO | |
| | | For the
Year Ended
December 31, 2009 | |
| Investment Income: | |
| Income (Note A): | |
| Dividend income--unaffiliated issuers | | $ | 7,563,760 | | |
| Interest income--unaffiliated issuers | | | 11,687 | | |
| Income from securities loaned--net (Note F) | | | 341,347 | | |
| Income from investments in affiliated issuers (Note F) | | | 21,430 | | |
| Foreign taxes withheld | | | (609,103 | ) | |
| Total income | | $ | 7,329,121 | | |
| Expenses: | |
| Investment management fees (Notes A & B) | | | 2,358,478 | | |
| Administration fees (Note B) | | | 835,600 | | |
| Distribution fees (Note B) | | | 696,334 | | |
| Audit fees | | | 41,307 | | |
| Custodian fees (Note B) | | | 270,062 | | |
| Insurance expense | | | 17,338 | | |
| Legal fees | | | 95,566 | | |
| Shareholder reports | | | 195,617 | | |
| Trustees' fees and expenses | | | 50,120 | | |
| Miscellaneous | | | 56,067 | | |
| Total expenses | | | 4,616,489 | | |
| Expenses reimbursed by administrator (Note B) | | | (420,201 | ) | |
| Investment management fees waived (Note A) | | | (6,735 | ) | |
| Expenses reduced by custodian fee expense offset arrangement (Note B) | | | (27 | ) | |
| Total net expenses | | | 4,189,526 | | |
| Net investment income (loss) | | $ | 3,139,595 | | |
| Realized and Unrealized Gain (Loss) on Investments (Note A) | |
| Net realized gain (loss) on: | |
| Sales of investment securities of unaffiliated issuers | | | (28,367,708 | ) | |
| Sales of investment securities of affiliated issuers | | | 201,031 | | |
| Foreign currency | | | (481,016 | ) | |
| Net increase from payments by affiliates (Note B) | | | 31,690 | | |
| Change in net unrealized appreciation (depreciation) in value of: | |
| Unaffiliated investment securities | | | 112,396,923 | | |
| Foreign currency | | | (14,728 | ) | |
| Net gain (loss) on investments | | | 83,766,192 | | |
| Net increase (decrease) in net assets resulting from operations | | $ | 86,905,787 | | |
See Notes to Financial Statements 12
Statements of Changes in Net Assets
Neuberger Berman Advisers Management Trust
| | | INTERNATIONAL PORTFOLIO | |
| | | Year Ended
December 31,
2009 | | Year Ended
December 31,
2008 | |
| Increase (Decrease) in Net Assets: | |
| From Operations (Note A): | |
| Net investment income (loss) | | $ | 3,139,595 | | | $ | 13,149,066 | | |
| Net realized gain (loss) on investments | | | (28,647,693 | ) | | | (138,844,494 | ) | |
| Net increase from payments by affiliates (Note B) | | | 31,690 | | | | -- | | |
| Change in net unrealized appreciation (depreciation) of investments | | | 112,382,195 | | | | (55,591,931 | ) | |
| Net increase (decrease) in net assets resulting from operations | | | 86,905,787 | | | | (181,287,359 | ) | |
| Distributions to Shareholders From (Note A): | |
| Net investment income | | | (10,084,277 | ) | | | -- | | |
| From Fund Share Transactions (Note D): | |
| Proceeds from shares sold | | | 56,338,583 | | | | 224,924,016 | | |
| Proceeds from reinvestment of dividends and distributions | | | 10,084,277 | | | | -- | | |
| Payments for shares redeemed | | | (60,070,670 | ) | | | (450,401,653 | ) | |
| Redemption fees retained | | | 828 | | | | 6,959 | | |
| Net increase (decrease) from Fund share transactions | | | 6,353,018 | | | | (225,470,678 | ) | |
| Net Increase (Decrease) in Net Assets | | | 83,174,528 | | | | (406,758,037 | ) | |
| Net Assets: | |
| Beginning of year | | | 246,933,587 | | | | 653,691,624 | | |
| End of year | | $ | 330,108,115 | | | $ | 246,933,587 | | |
| Undistributed net investment income (loss) at end of year | | $ | 2,640,484 | | | $ | 10,083,082 | | |
See Notes to Financial Statements 13
Notes to Financial Statements International Portfolio
Note A--Summary of Significant Accounting Policies:
1 General: The Fund is a separate operating series of Neuberger Berman Advisers Management Trust (the "Trust"), a Delaware statutory trust organized pursuant to a Trust Instrument dated May 23, 1994. The Trust is currently comprised of ten separate operating series (each a "Series," collectively, the "Funds") each of which is diversified. The Trust is registered as an open-end management investment company under the Investment Company Act of 1940, as amended (the "1940 Act"), and its shares are registered under the Securities Act of 1933, as amended. The Fund currently offers only Class S shares. The Board may establish additional series or classes of shares without the approval of shareholders.
The assets of each Series belong only to that Series, and the liabilities of each Series are borne solely by that Series and no other.
The preparation of financial statements in accordance with U.S. generally accepted accounting principles requires Management to make estimates and assumptions at the date of the financial statements. Actual results could differ from those estimates.
2 Portfolio valuation: Investment securities are valued as indicated in the notes following the Schedule of Investments.
3 Foreign currency translation: The accounting records of the Fund are maintained in U.S. dollars. Foreign currency amounts are currently translated into U.S. dollars using the exchange rates as of 4:00 p.m., Eastern time, to determine the value of investments, other assets and liabilities. Purchase and sale prices of securities, and income and expenses, are translated into U.S. dollars at the prevailing rate of exchange on the respective dates of such transactions. Net unrealized foreign currency gain (loss), if any, arises from changes in the value of assets and liabilities, other than investments in securities, as a result of changes in exchange rates and is stated separately in the Statement of Operations.
4 Securities transactions and investment income: Securities transactions are recorded on trade date for financial reporting purposes. Dividend income is recorded on the ex-dividend date or, for certain foreign dividends, as soon as the Fund becomes aware of the dividends. Non-cash dividends included in dividend income, if any, are recorded at the fair market value of the securities received. Interest income, including accretion of original issue discount, where applicable, and accretion of discount on short-term investments, is recorded on the accrual basis. Realized gains and losses from securities transactions and foreign currency transactions, if any, are recorded on the basis of identified cost and stated separately in the Statement of Operations.
5 Income tax information: The Funds are treated as separate entities for U.S. federal income tax purposes. It is the policy of the Fund to continue to qualify as a regulated investment company by complying with the requirements of Subchapter M of the Internal Revenue Code applicable to regulated investment companies and to distribute substantially all of its earnings to its shareholders. Therefore, no federal income or excise tax provision is required.
The Fund has adopted the provisions of ASC 740 "Income Taxes" ("ASC 740"), formerly known as FASB Interpretation No. 48 "Accounting for Uncertainty in Income Taxes -- an interpretation of FASB Statement No. 109." ASC 740 sets forth a minimum threshold for financial statement recognition of the benefit of a tax position taken, or expected to be taken, in a tax return. The Fund recognizes interest and penalties, if any, related to unrecognized tax benefits as an income tax expense in the Statement of Operations. The Fund is subject to examination by U.S. federal and state tax authorities for returns filed for the prior three fiscal years 2006 - 2008. As of December 31, 2009, the Fund did not have any unrecognized tax benefits.
Income distributions and capital gain distributions are determined in accordance with income tax regulations, which may differ from U.S. generally accepted accounting principles. These differences are primarily due to differing treatments of income and gains on various investment securities held by the Fund, timing differences and
14
differing characterization of distributions made by the Fund as a whole. The Fund may also utilize earnings and profits distributed to shareholders on redemption of shares as a part of the dividends paid deduction for income tax purposes.
As determined on December 31, 2009, permanent differences resulting primarily from different book and tax accounting for foreign currency gains and losses, non-taxable dividend income adjustments and passive foreign investment company gains and losses were reclassified at fiscal year-end. These reclassifications had no effect on the net income, net asset value or net asset value per share of the Fund.
The tax character of distributions paid during the years ended December 31, 2009 and December 31, 2008 was as follows:
| | | Distributions Paid From: | | | |
| Ordinary Income | | Long-Term Capital Gain | | Total | |
| 2009 | | 2008 | | 2009 | | 2008 | | 2009 | | 2008 | |
| $ | 10,084,277 | | | $ | -- | | | $ | -- | | | $ | -- | | | $ | 10,084,277 | | | $ | -- | | |
As of December 31, 2009, the components of distributable earnings (accumulated losses) on a U.S. federal income tax basis were as follows:
Undistributed
Ordinary
Income | | Unrealized
Appreciation
(Depreciation) | | Loss
Carryforwards
and Deferrals | | Total | |
| $ | 2,679,273 | | | $ | 47,233,202 | | | $ | (164,805,474 | ) | | $ | (114,892,999 | ) | |
The difference between book basis and tax basis distributable earnings is attributable primarily to timing differences of wash sales, partnership basis adjustments, passive foreign investment companies, forward contracts mark to market, return of capital distribution basis adjustments, capital loss carryforwards and post October loss deferrals.
To the extent the Fund's net realized capital gains, if any, can be offset by capital loss carryforwards, it is the policy of the Fund not to distribute such gains. As determined at December 31, 2009, the Fund had unused capital loss carryforwards available for federal income tax purposes to offset net realized capital gains, if any, as follows:
| | | Expiring in: | |
| | | 2016 | | 2017 | |
| | | $ | 100,624,928 | | | $ | 63,586,529 | | |
Under current tax law, the use of these losses to offset future gains may be limited.
Under current tax law, certain net capital and net foreign currency losses realized after October 31 within the taxable year may be deferred and treated as occurring on the first day of the following tax year. For the year ended December 31, 2009, the Fund elected to defer $594,017 net capital losses arising between November 1, 2009 and December 31, 2009.
6 Distributions to shareholders: The Fund may earn income, net of expenses, daily on its investments. Distributions from net investment income and net realized capital gains, if any, generally are distributed in October. Income distributions and capital gain distributions to shareholders are recorded on the ex-date.
7 Foreign taxes: Foreign taxes withheld represent amounts withheld by foreign tax authorities, net of refunds recoverable.
8 Expense allocation: Certain expenses are applicable to multiple funds. Expenses directly attributable to a Series are charged to that Series. Expenses of the Trust that are not directly attributed to a Series are allocated among the Funds, on the basis of relative net assets, except where a more appropriate allocation of expenses to each of the Funds can otherwise be made fairly. Expenses borne by the complex of related investment companies, which includes open-end and closed-end investment companies for which Management serves as investment manager, that are not directly attributed to a Series or the Trust are allocated among the Fund and the other investment
15
companies in the complex or series thereof on the basis of relative net assets, except where a more appropriate allocation of expenses to each investment company in the complex or series thereof can otherwise be made fairly.
9 Security lending: A third party, eSecLending, serves as exclusive lending agent for the Fund. eSecLending, as agent, has assisted the Fund in conducting bidding processes to try to identify a principal that would pay a guaranteed amount to the Fund in consideration of the Fund entering into an exclusive securities lending arrangement. During the fiscal year, no principal had an exclusive securities lending arrangement with the Fund; as such, the Fund was not guaranteed any particular level of income.
Under the securities lending arrangement, the Fund receives cash collateral at the beginning of each transaction equal to at least 102% of the prior day's market value of the loaned securities (105% in the case of international securities). The Fund may invest all the cash collateral in Neuberger Berman Securities Lending Quality Fund, LLC ("Quality Fund"), a fund managed by Neuberger Berman Fixed Income LLC (formerly known as Lehman Brothers Asset Management LLC) ("NBFI"), an affiliate of Management. Effective July 1, 2009, Dwight Asset Management Company LLC became the Sub-Adviser to the Quality Fund. The Quality Fund is not a money market fund that is registered under the 1940 Act and does not operate in accordance with all requirements of Rule 2a-7 under the 1940 Act. There is no assurance that the Quality Fund will maintain a $1.00 share price.
The market value of the Fund's investments in the Quality Fund as of the fiscal year ended December 31, 2009, if any, is reflected in the Fund's Schedule of Investments. If it were necessary to liquidate assets in the Quality Fund to meet returns on outstanding securities loans at a time when the Quality Fund's price per share was less than $1.00, the Fund may not receive an amount from the Quality Fund that is equal in amount to the collateral the Fund would be required to return to the borrower of the securities and the Fund would be required to make up for this shortfall. In addition, as a result of recent reduced liquidity in the credit and fixed income markets, it may be difficult to dispose quickly of some securities in the Quality Fund at the price at which the Quality Fund is carrying them.
Net income from the lending program represents any amounts received from a principal plus income earned on the cash collateral invested in Quality Fund or in other investments, if applicable, less cash collateral fees and other expenses associated with the loans. For the fiscal year ended December 31, 2009, the Fund received net income under the securities lending arrangement of approximately $341,347, which is reflected in the Statement of Operations under the caption "Income from securities loaned -- net." For the fiscal year ended December 31, 2009, "Income from securities loaned -- net" consisted of approximately $461,901 in income earned on cash collateral and amounts received from a principal (including approximately $235,928 of interest income earned from the Quality Fund), less fees and expenses paid of approximately $120,554.
10 Repurchase agreements: The Fund may enter into repurchase agreements with institutions that Management has determined are creditworthy. Each repurchase agreement is recorded at cost. The Fund requires that the securities purchased in a repurchase agreement be transferred to the custodian in a manner sufficient to enable the Fund to assert a perfected security interest in those securities in the event of a default under the repurchase agreement. The Fund monitors, on a daily basis, the value of the securities transferred to ensure that their value, including accrued interest, is greater than amounts owed to the Fund under each such repurchase agreement.
11 Redemption of fund shares: The Fund charges a redemption fee of 2% on shares redeemed or exchanged for shares of another fund within 60 days or less of the purchase date. All redemption fees are paid to and recorded by the Fund as Paid-in capital. For the year ended December 31, 2009, the Fund received $828 in redemption fees.
12 Transactions with other funds managed by Neuberger Berman Management LLC: Pursuant to an Exemptive Order issued by the Securities and Exchange Commission, the Fund may invest in a money market fund managed by Management or an affiliate. Through August 10, 2009, the Fund invested in Neuberger Berman Prime Money Fund ("Prime Money"), as approved by the Board. Prime Money sought to provide the highest available current income consistent with safety and liquidity. For any cash that the Fund invested in Prime Money, Management waived a portion of its management fee equal to the management fee it received from Prime Money on those assets (the "Arrangement"). For the year ended December 31, 2009, management fees waived under this Arrangement
16
amounted to $6,735 and are reflected in the Statement of Operations under the caption "Investment management fees waived." For the year ended December 31, 2009, income earned under this Arrangement amounted to $21,430 and is reflected in the Statement of Operations under the caption "Income from investments in affiliated issuers."
On August 10, 2009, the Fund ceased investing in Prime Money. On this date, the Fund's shares of Prime Money were redeemed in exchange for portfolio holdings of Prime Money, which were used to purchase Institutional Class shares of State Street Institutional Liquid Reserves Fund.
13 Investments in foreign securities: Investing in foreign securities may involve certain sovereign and other risks, in addition to the credit and market risks normally associated with domestic securities. These additional risks include the possibility of adverse political and economic developments (including political instability, nationalization, expropriation, or confiscatory taxation) and the potentially adverse effects of unavailability of public information regarding issuers, less governmental supervision and regulation of financial markets, reduced liquidity of certain financial markets, and the lack of uniform accounting, auditing, and financial reporting standards or the application of standards that are different or less stringent than those applied in the United States. Foreign securities also may experience greater price volatility, higher rates of inflation, and delays in settlement.
14 Derivative instruments: Management has evaluated the requirements of ASC 815 "Disclosures about Derivative Instruments and Hedging Activities" ("ASC 815"), formerly known as FASB Statement of Financial Accounting Standards No. 161, "Disclosures about Derivative Instruments and Hedging Activities," which are effective for financial statements issued for fiscal years and interim periods beginning after November 15, 2008. ASC 815 requires enhanced disclosures about a fund's derivative and hedging activities. Management has concluded that, since the Fund did not hold any derivative instruments during the year ended December 31, 2009, no additional disclosures pursuant to ASC 815 are required at this time.
15 Indemnifications: Like many other companies, the Trust's organizational documents provide that its officers and trustees are indemnified against certain liabilities arising out of the performance of their duties to the Trust. In addition, both in some of its principal service contracts and in the normal course of its business, the Trust enters into contracts that provide indemnifications to other parties for certain types of losses or liabilities. The Trust's maximum exposure under these arrangements is unknown as this could involve future claims against the Trust.
Note B--Management Fees, Administration Fees, Distribution Arrangements, and Other Transactions With Affiliates:
Fund shares are issued and redeemed in connection with investments in and payments under certain variable annuity contracts and variable life insurance policies issued through separate accounts of life insurance companies and are also offered directly to qualified pension and retirement plans.
The Fund retains Management as its investment manager under a Management Agreement. For such investment management services, the Fund pays Management a fee at the annual rate of 0.85% of the first $250 million of the Fund's average daily net assets, 0.825% of the next $250 million, 0.80% of the next $250 million, 0.775% of the next $250 million, 0.75% of the next $500 million, 0.725% of the next $1 billion, and 0.70% of average daily net assets in excess of $2.5 billion.
The Fund retains Management as its administrator under an Administration Agreement. The Fund pays Management an administration fee at the annual rate of 0.30% of its average daily net assets under this agreement. Additionally, Management retains State Street Bank and Trust Company ("State Street") as its sub-administrator under a Sub-Administration Agreement. Management pays State Street a fee for all services received under this agreement.
Management acts as agent in arranging for the sale of Fund shares without commission and bears advertising and promotion expenses. The Board has adopted a distribution plan (the "Plan") with respect to the Fund, pursuant to Rule 12b-1 under the 1940 Act. The Plan provides that, as compensation for administrative and other services
17
provided to the Fund, Management's activities and expenses related to the sale and distribution of the Fund's shares, and ongoing services provided to investors in the Fund, Management receives from the Fund a fee at the annual rate of 0.25% of the Fund's average daily net assets. Management receives this amount to provide distribution and shareholder servicing for the Fund and pays a portion of it to institutions that provide such services. Those institutions may use the payments for, among other purposes, compensating employees engaged in sales and/or shareholder servicing. The amount of fees paid by the Fund during any year may be more or less than the cost of distribution and other services provided to the Fund. FINRA rules limit the amount of annual distribution fees that may be paid by a mutual fund and impose a ceiling on the cumulative distribution fees paid. The Trust's Plan complies with those rules.
Management has contractually undertaken through December 31, 2012 to forgo current payment of fees and/or reimburse the Fund for its operating expenses (including the fees payable to Management but excluding interest, taxes, brokerage commissions, extraordinary expenses, and transaction costs) ("Operating Expenses") which exceed, in the aggregate, 2.00% per annum of the Fund's average daily net assets (the "Expense Limitation"). Moreover, Management has voluntarily committed to reimburse certain expenses, as stated above, for an additional 0.50% per annum of the Fund's average daily net assets to maintain the Fund's Operating Expense at 1.50%. Management may, at its sole discretion, terminate this voluntary reimbursement commitment without notice. For the year ended December 31, 2009, Management voluntarily reimbursed the Fund $420,201. The Fund has agreed to repay Management through December 31, 2015 for fees and expenses foregone and/or its excess Operating Expenses previously reimbursed by Management under the contractual Expense Limitation, so long as its annual Operating Expenses during that period do not exceed its Expense Limitation, and the repayment is made within three years after the year in which Management issued the reimbursement or waived fees. During the year ended December 31, 2009, there was no repayment to Management under this agreement. At December 31, 2009, the Fund had no contingent liabilities to Management under this agreement.
For the year ended December 31, 2009, the Fund recorded a capital contribution from Management in the amount of $31,690. This amount was paid in connection with losses outside the Fund's direct control incurred in the disposition of foreign currency contracts. Management does not normally make payments for losses incurred in the disposition of foreign currency contracts.
Neuberger Berman LLC (formerly known as Neuberger Berman, LLC) ("Neuberger") is retained by Management to furnish it with investment recommendations and research information without added cost to the Fund. Several individuals who are officers and/or trustees of the Trust are also employees of Neuberger and/or Management.
During the reporting period, the predecessor of Management, the investment manager of the Fund, and Neuberger, the sub-adviser of the Fund, were wholly owned subsidiaries of Lehman Brothers Holdings Inc. ("Lehman Brothers"), a publicly owned holding company. On September 15, 2008, Lehman Brothers filed a voluntary petition under Chapter 11 of the U.S. Bankruptcy Code. On December 3, 2008, NBSH Acquisition, LLC ("NBSH"), an entity organized by key members of Neuberger Berman's senior management, was selected as the successful bidder in the public auction to acquire a majority interest in Neuberger Berman's business and the fixed income and certain alternative asset management businesses of Lehman Brothers' Investment Management Division (together with Neuberger Berman, the "Acquired Businesses") (the "Acquisition"). On December 22, 2008, the bankruptcy court having jurisdiction over the Lehman Brothers matter approved the sale of the Acquired Businesses to NBSH (or its successor or assign), as the successful bidder.
The Acquisition closed on May 4, 2009. The Acquired Businesses are now indirectly owned by, among others, portfolio managers, Neuberger Berman's management team, and certain key members and senior professionals who are employed in various parts of the Neuberger Berman complex of companies, with a minority interest retained by Lehman Brothers and certain affiliates of Lehman Brothers.
The closing of the Acquisition resulted in an "assignment" of the Fund's Management Agreement and Sub-Advisory Agreement. Such an assignment, by law, automatically terminated those agreements. Accordingly, prior to the closing, the Board, including the Trustees who are not "interested persons" of the Fund's investment manager and its
18
affiliates or the Fund, considered and approved a new Management Agreement and Sub-Advisory Agreement for the Fund. The new agreements, which are virtually identical to those previously in effect, were also approved by a vote of the Fund's shareholders.
These events have not had a material impact on the Fund or its operations. Management and Neuberger continue to operate in the ordinary course of business as the investment manager and sub-adviser of the Fund.
The Fund has an expense offset arrangement in connection with its custodian contract. For the year ended December 31, 2009, the impact of this arrangement was a reduction of expenses of $27.
Note C--Securities Transactions:
During the year ended December 31, 2009, there were purchase and sale transactions (excluding short-term securities) of $225,668,110 and $211,332,744, respectively.
During the year ended December 31, 2009, no brokerage commissions on securities transactions were paid to affiliated brokers.
Note D--Fund Share Transactions:
Share activity for the years ended December 31, 2009 and December 31, 2008 was as follows:
| | | For the Year Ended December 31, | |
| | | 2009 | | 2008 | |
| Shares Sold | | | 7,117,025 | | | | 22,555,823 | | |
| Shares Issued on Reinvestment of Dividends and Distributions | | | 1,058,161 | | | | -- | | |
| Shares Redeemed | | | (7,304,006 | ) | | | (36,732,197 | ) | |
| Total | | | 871,180 | | | | (14,176,374 | ) | |
Note E--Lines of Credit:
At December 31, 2009, the Fund was a participant in a single committed, unsecured $150,000,000 line of credit with State Street, to be used only for temporary or emergency purposes. Other investment companies managed by Management also participate in this line of credit on the same terms. Interest is charged on borrowings under this line of credit at the higher of (a) the Federal Funds Rate plus 1.25% per annum (b) the Overnight LIBOR Rate plus 1.25% per annum. Prior to September 18, 2009, interest was charged on borrowings under this line of credit at the Federal Funds Rate plus 0.50% per annum. A facility fee of 0.15% (prior to September 18, 2009, 0.09%) per annum of the available line of credit is charged, of which the Fund has agreed to pay its pro rata share, based on the ratio of its individual net assets to the net assets of all participants at the time the fee is due and payable. The fee is paid quarterly in arrears. Because several investment companies participate, there is no assurance that an individual Fund will have access to all or any part of the $150,000,000 at any particular time.
At December 31, 2009, the Fund was one of five holders of a single $100,000,000 uncommitted, secured line of credit with State Street to be used only for temporary or emergency purposes or for leverage. Other investment companies managed by Management also participate in this line of credit on the same terms. Interest is charged at LIBOR, or the overnight Federal Funds Rate, plus a spread to be determined at the time of borrowing. Because several investment companies participate, there is no assurance that the Fund will have access to all or any part of the $100,000,000 at any particular time.
The Fund had no loans outstanding pursuant to these lines of credit at December 31, 2009. During the year ended December 31, 2009, the Fund did not utilize these lines of credit.
19
Note F--Investments in Affiliates:
| Name of Issuer | | Balance of
Shares
Held
December 31,
2008 | | Gross
Purchases
and
Additions | | Gross
Sales
and
Reductions | | Balance of
Shares
Held
December 31,
2009 | | Value
December 31,
2009 | | Income from
Investments in
Affiliated
Issuers
Included in
Total Income | |
Neuberger Berman Prime
Money Fund Trust Class* | | | 26,810,816 | | | | 80,487,543 | | | | 107,298,359 | | | | -- | | | $ | -- | | | $ | 21,430 | | |
Neuberger Berman Securities
Lending Quality Fund, LLC** | | | -- | | | | 179,589,146 | | | | 159,387,898 | | | | 20,201,248 | | | | 20,605,273 | | | | 235,928 | | |
| Total | | $ | 20,605,273 | | | $ | 257,358 | | |
* Prime Money was also managed by Management and may have been considered an affiliate since it had the same officers, Board members, and investment manager as the Fund and because, at times, the Fund may have owned 5% or more of the outstanding voting securities of Prime Money.
** Quality Fund, a fund managed by NBFI, an affiliate of Management, is used to invest cash the Fund receives as collateral for securities loaned as approved by the Board. Because all shares of Quality Fund are held by funds in the related investment management complex, Quality Fund may be considered an affiliate of the Fund.
Note G--Subsequent Events:
In accordance with the provision set forth in ASC 855 "Subsequent Events" ("ASC 855") formerly known as FAS 165, "Subsequent Events," Management has evaluated the possibility of subsequent events existing in the Fund's financial statements through February 9, 2010. Management has determined that there are no subsequent events that, in accordance with ASC 855, would need to be disclosed in the Fund's financial statements through this date.
20
Financial Highlights
International Portfolio
The following table includes selected data for a share outstanding throughout each period and other performance information derived from the Financial Statements.
| | | Year Ended December 31, | | Period from
April 29, 2005^
to December 31, | |
| | | 2009 | | 2008 | | 2007 | | 2006 | | 2005 | |
| Net Asset Value, Beginning of Period | | $ | 7.29 | | | $ | 13.61 | | | $ | 14.29 | | | $ | 11.68 | | | $ | 10.00 | | |
| Income From Investment Operations: | |
| Net Investment Income (Loss)@ | | | .09 | | | | .32 | | | | .13 | | | | .10 | | | | .07 | | |
Net Gains or Losses on Securities
(both realized and unrealized) | | | 2.43 | | | | (6.64 | ) | | | .30 | | | | 2.64 | | | | 1.67 | | |
| Total From Investment Operations | | | 2.52 | | | | (6.32 | ) | | | .43 | | | | 2.74 | | | | 1.74 | | |
| Less Distributions From: | |
| Net Investment Income | | | (.30 | ) | | | -- | | | | (.24 | ) | | | (.03 | ) | | | (.01 | ) | |
| Net Capital Gains | | | -- | | | | -- | | | | (.87 | ) | | | (.10 | ) | | | (.06 | ) | |
| Total Distributions | | | (.30 | ) | | | -- | | | | (1.11 | ) | | | (.13 | ) | | | (.07 | ) | |
| Redemption Fees@ | | | .00 | | | | .00 | | | | .00 | | | | .00 | | | | .01 | | |
| Net Asset Value, End of Period | | $ | 9.51 | | | $ | 7.29 | | | $ | 13.61 | | | $ | 14.29 | | | $ | 11.68 | | |
| Total Returntt | | | 34.51 | % | | | (46.44 | )% | | | 3.21 | % | | | 23.45 | % | | | 17.50 | %** | |
| Ratios/Supplemental Data | |
| Net Assets, End of Period (in millions) | | $ | 330.1 | | | $ | 246.9 | | | $ | 653.7 | | | $ | 338.6 | | | $ | 12.6 | | |
| Ratio of Gross Expenses to Average Net Assets# | | | 1.50 | % | | | 1.53 | % | | | 1.51 | % | | | 1.50 | % | | | 1.51 | %* | |
| Ratio of Net Expenses to Average Net Assetstt | | | 1.50 | % | | | 1.53 | % | | | 1.50 | % | | | 1.50 | % | | | 1.50 | %* | |
Ratio of Net Investment Income (Loss) to Average
Net Assets | | | 1.13 | % | | | 2.78 | % | | | .85 | % | | | .75 | % | | | .91 | %* | |
| Portfolio Turnover Rate | | | 80 | % | | | 149 | % | | | 43 | % | | | 39 | % | | | 29 | %** | |
See Notes to Financial Highlights 21
Notes to Financial Highlights International Portfolio
tt Total return based on per share net asset value reflects the effects of changes in net asset value on the performance of the Fund during each fiscal period and assumes dividends and other distributions, if any, were reinvested. Results represent past performance and do not guarantee future results. Current returns may be lower or higher than the performance data quoted. Investment returns and principal may fluctuate and shares when redeemed may be worth more or less than original cost. Total return would have been lower if Management had not reimbursed and/or waived certain expenses. Total return would have been higher if Management had not recouped previously reimbursed expenses. The total return information shown does not reflect charges and other expenses that apply to the separate account or the related insurance policies, and the inclusion of these charges and other expenses would reduce the total return for all fiscal periods shown. For the year ended December 31, 2009, Management reimbursed the Fund for losses incurred in connection with the disposition of foreign currency contracts, which had a .01% impact on total return.
# The Fund is required to calculate an expense ratio without taking into consideration any expense reductions related to expense offset arrangements.
tt After reimbursement of expenses and/or waiver of a portion of the investment management fee by Management. Had Management not undertaken such actions, the annualized ratios of net expenses to average daily net assets would have been:
| Year Ended December 31, | | Period from
April 29, 2005^ to
December 31, | |
| 2009 | | 2008 | | 2007 | | 2006 | | 2005 | |
| | 1.66 | % | | | 1.59 | % | | | 1.53 | % | | | 1.67 | % | | | 5.84 | % | |
^ The date investment operations commenced.
@ Calculated based on the average number of shares outstanding during the fiscal period.
* Annualized.
** Not Annualized.
22
Report of Independent Registered Public Accounting Firm
To the Board of Trustees of
Neuberger Berman Advisers Management Trust and
Shareholders of International Portfolio
We have audited the accompanying statement of assets and liabilities, including the schedule of investments, of International Portfolio, one of the series constituting Neuberger Berman Advisers Management Trust (the "Trust"), as of December 31, 2009, and the related statement of operations for the year then ended, the statement of changes in net assets for each of the two years in the period then ended, and the financial highlights for each of the periods indicated therein. These financial statements and financial highlights are the responsibility of the Trust's management. Our responsibility is to express an opinion on these financial statements and financial highlights based on our audits.
We conducted our audits in accordance with the standards of the Public Company Accounting Oversight Board (United States). Those standards require that we plan and perform the audit to obtain reasonable assurance about whether the financial statements and financial highlights are free of material misstatement. We were not engaged to perform an audit of the Trust's internal control over financial reporting. Our audits included consideration of internal control over financial reporting as a basis for designing audit procedures that are appropriate in the circumstances, but not for the purpose of expressing an opinion on the effectiveness of the Trust's internal control over financial reporting. Accordingly, we express no such opinion. An audit also includes examining, on a test basis, evidence supporting the amounts and disclosures in the financial statements and financial highlights, assessing the accounting principles used and significant estimates made by management, and evaluating the overall financial statement presentation. Our procedures included confirmation of securities owned as of December 31, 2009 by correspondence with the custodian and brokers or by other appropriate auditing procedures where replies from brokers were not received. We believe that our audits provide a reasonable basis for our opinion.
In our opinion, the financial statements and financial highlights referred to above present fairly, in all material respects, the financial position of International Portfolio, a series of Neuberger Berman Advisers Management Trust, at December 31, 2009, the results of its operations for the year then ended, the changes in its net assets for each of the two years in the period then ended, and the financial highlights for each of the periods indicated therein, in conformity with U.S. generally accepted accounting principles.
Boston, Massachusetts
February 9, 2010
23
Trustee and Officer Information
The following tables set forth information concerning the trustees and officers of the Trust. All persons named as trustees and officers also serve in similar capacities for other funds administered or managed by Management and Neuberger. The Statement of Additional Information includes additional information about fund trustees and is available upon request, without charge, by calling (800) 877-9700.
Information about the Board of Trustees
Name, (Year of Birth),
and Address(1) | | Position and
Length of
Time Served(2) | | Principal Occupation(s)(3) | | Number of
Funds in Fund
Complex
Overseen by
Fund Trustee | | Other Directorships
Held Outside Fund
Complex by Fund
Trustee | |
| Independent Fund Trustees | |
|
| John Cannon (1930) | | Trustee since 2000 | | Consultant; formerly, Chairman, CDC Investment Advisers (registered investment adviser), 1993 to January 1999; formerly, President and Chief Executive Officer, AMA Investment Advisors, an affiliate of the American Medical Association. | | | 46 | | | Formerly, Independent Trustee or Director of three series of Oppenheimer Funds: Oppenheimer Limited Term New York Municipal Fund, Rochester Fund Municipals, and Oppenheimer Convertible Securities Fund (1992 to 2009). | |
|
| Faith Colish (1935) | | Trustee since 1982 | | Counsel, Carter Ledyard & Milburn LLP (law firm) since October 2002; formerly, Attorney-at-Law and President, Faith Colish, A Professional Corporation, 1980 to 2002. | | | 46 | | | Formerly, Director (1997 to 2003) and Advisory Director (2003 to 2006), ABA Retirement Funds (formerly, American Bar Retirement Association) (not-for-profit membership corporation). | |
|
24
Name, (Year of Birth),
and Address(1) | | Position and
Length of
Time Served(2) | | Principal Occupation(s)(3) | | Number of
Funds in Fund
Complex
Overseen by
Fund Trustee | | Other Directorships
Held Outside Fund
Complex by Fund
Trustee | |
| Martha C. Goss (1949) | | Trustee since 2007 | | President, Woodhill Enterprises Inc./Chase Hollow Associates LLC (personal investment vehicle), since 2006; Chief Operating and Financial Officer, Hopewell Holdings LLC/Amwell Holdings, LLC (a holding company for a healthcare reinsurance company start-up), since 2003; formerly, Consultant, Resources Connection (temporary staffing), 2002 to 2006. | | | 46 | | | Director, Ocwen Financial Corporation (mortgage servicing), since 2005; Director, American Water (water utility), since 2003; Director, Channel Reinsurance (financial guaranty reinsurance), since 2006; Advisory Board Member, Attensity (software developer), since 2005; Director, Allianz Life of New York (insurance), since 2005; Director, Financial Women's Association of New York (not for profit association), since 2003; Trustee Emerita, Brown University, since 1998. | |
|
| C. Anne Harvey (1937) | | Trustee since 1998 | | President, C.A. Harvey Associates, since October 2001; formerly, Director, AARP, 1978 to December 2001. | | | 46 | | | Formerly, President, Board of Associates to The National Rehabilitation Hospital's Board of Directors, 2001 to 2002; formerly, Member, Individual Investors Advisory Committee to the New York Stock Exchange Board of Directors, 1998 to June 2002. | |
|
| Robert A. Kavesh (1927) | | Trustee since 2000 | | Retired; Marcus Nadler Professor Emeritus of Finance and Economics, New York University Stern School of Business; formerly, Executive Secretary-Treasurer, American Finance Association, 1961 to 1979. | | | 46 | | | Formerly, Director, The Caring Community (not-for-profit), 1997 to 2006; formerly, Director, DEL Laboratories, Inc. (cosmetics and pharmaceuticals), 1978 to 2004; formerly, Director, Apple Bank for Savings, 1979 to 1990; formerly, Director, Western Pacific Industries, Inc., 1972 to 1986 (public company). | |
|
25
Name, (Year of Birth),
and Address(1) | | Position and
Length of
Time Served(2) | | Principal Occupation(s)(3) | | Number of
Funds in Fund
Complex
Overseen by
Fund Trustee | | Other Directorships
Held Outside Fund
Complex by Fund
Trustee | |
| Michael M. Knetter (1960) | | Trustee since 2007 | | Dean, School of Business, University of Wisconsin - Madison; formerly, Professor of International Economics and Associate Dean, Amos Tuck School of Business - Dartmouth College, 1998 to 2002. | | | 46 | | | Trustee, Northwestern Mutual Series Fund, Inc., since February 2007; Director, Wausau Paper, since 2005; Director, Great Wolf Resorts, since 2004. | |
|
| Howard A. Mileaf (1937) | | Trustee since 1999 | | Retired; formerly, Vice President and General Counsel, WHX Corporation (holding company), 1993 to 2001. | | | 46 | | | Formerly, Director, Webfinancial Corporation (holding company), 2002 to 2008; formerly, Director WHX Corporation (holding company), January 2002 to June 2005; formerly, Director, State Theatre of New Jersey (not-for-profit theater), 2000 to 2005. | |
|
| George W. Morriss (1947) | | Trustee since 2007 | | Retired; formerly, Executive Vice President and Chief Financial Officer, People's Bank, Connecticut (a financial services company), 1991 to 2001. | | | 46 | | | Manager, Old Mutual 2100 fund complex (consisting of six funds) since October 2006 for four funds and since February 2007 for two funds; formerly, Member NASDAQ Issuers' Affairs Committee, 1995 to 2003. | |
|
| Edward I. O'Brien (1928) | | Trustee since 2000 | | Retired; Formerly, Member, Investment Policy Committee, Edward Jones, 1993 to 2001; President, Securities Industry Association ("SIA") (securities industry's representative in government relations and regulatory matters at the federal and state levels), 1974 to 1992; Adviser to SIA, November 1992 to November 1993. | | | 46 | | | Formerly, Director, Legg Mason, Inc. (financial services holding company), 1993 to July 2008; formerly, Director, Boston Financial Group (real estate and tax shelters), 1993 to 1999. | |
|
26
Name, (Year of Birth),
and Address(1) | | Position and
Length of
Time Served(2) | | Principal Occupation(s)(3) | | Number of
Funds in Fund
Complex
Overseen by
Fund Trustee | | Other Directorships
Held Outside Fund
Complex by Fund
Trustee | |
| Cornelius T. Ryan (1931) | | Trustee since 2000 | | Founding General Partner, Oxford Partners and Oxford Bioscience Partners (venture capital investing) and President, Oxford Venture Corporation, since 1981. | | | 46 | | | None. | |
|
| Tom D. Seip (1950) | | Trustee since 2000; Chairman of the Board since 2008; Lead Independent Trustee from 2006 to 2008 | | General Partner, Seip Investments LP (a private investment partnership); formerly, President and CEO, Westaff, Inc. (temporary staffing), May 2001 to January 2002; formerly, Senior Executive at the Charles Schwab Corporation, 1983 to 1998, including Chief Executive Officer, Charles Schwab Investment Management, Inc., and Trustee, Schwab Family of Funds and Schwab Investments, 1997 to 1998, and Executive Vice President-Retail Brokerage, Charles Schwab & Co., Inc., 1994 to 1997. | | | 46 | | | Director, H&R Block, Inc. (financial services company), since May 2001; Chairman, Compensation Committee, H&R Block, Inc., since 2006; formerly, Director, Forward Management, Inc. (asset management company), 1999 to 2006. | |
|
27
Name, (Year of Birth),
and Address(1) | | Position and
Length of
Time Served(2) | | Principal Occupation(s)(3) | | Number of
Funds in Fund
Complex
Overseen by
Fund Trustee | | Other Directorships
Held Outside Fund
Complex by Fund
Trustee | |
| Candace L. Straight (1947) | | Trustee since 1999 | | Private investor and consultant specializing in the insurance industry; formerly, Advisory Director, Securitas Capital LLC (a global private equity investment firm dedicated to making investments in the insurance sector), 1998 to December 2003. | | | 46 | | | Director, Montpelier Re (reinsurance company), since 2006; formerly, Director, National Atlantic Holdings Corporation (property and casualty insurance company), 2004 to 2008; formerly, Director, The Proformance Insurance Company (property and casualty insurance company), 2004 to 2008; formerly, Director, Providence Washington Insurance Company (property and casualty insurance company), December 1998 to March 2006; formerly, Director, Summit Global Partners (insurance brokerage firm), 2000 to 2005. | |
|
| Peter P. Trapp (1944) | | Trustee since 1984 | | Retired; formerly, Regional Manager for Mid-Southern Region, Ford Motor Credit Company, September 1997 to 2007; formerly, President, Ford Life Insurance Company, April 1995 to August 1997. | | | 46 | | | None. | |
|
28
Name, (Year of Birth),
and Address(1) | | Position and
Length of
Time Served(2) | | Principal Occupation(s)(3) | | Number of
Funds in Fund
Complex
Overseen by
Fund Trustee | | Other Directorships
Held Outside Fund
Complex by Fund
Trustee | |
| Fund Trustees who are "Interested Persons" | |
|
| Joseph V. Amato* (1962) | | Trustee since 2009 | | President and Director, Neuberger Berman Group LLC, since 2009; President and Chief Executive Officer, Neuberger and Neuberger Berman Holdings LLC (including its predecessor, Neuberger Berman Inc.), since 2007; Chief Investment Officer, Neuberger, since 2009; Chief Executive Officer (Equities) and Managing Director, Management, since 2009; Managing Director, Neuberger Berman Fixed Income LLC ("NBFI"), since 2007; Board member of NBFI since 2006; formerly, Global Head of Asset Management of Lehman Brothers Holdings Inc.'s ("LBHI") Investment Management division, 2006 to 2009; formerly, member of LBHI's Investment Management Division's Executive Management Committee, 2006 to 2009; formerly, Managing Director, Lehman Brothers Inc. ("LBI"), 2006 to 2008; formerly, Chief Recruiting and Development Officer, LBI, 2005 to 2006; formerly, Global Head of LBI's Equity Sales and a Member of its Equities Division Executive Committee, 2003 to 2005. | | | 46 | | | Member of Board of Advisors, McDonough School of Business, Georgetown University, since 2001; Member of New York City Board of Advisors, Teach for America, since 2005; Trustee, Montclair Kimberley Academy (private school), since 2007. | |
|
29
Name, (Year of Birth),
and Address(1) | | Position and
Length of
Time Served(2) | | Principal Occupation(s)(3) | | Number of
Funds in Fund
Complex
Overseen by
Fund Trustee | | Other Directorships
Held Outside Fund
Complex by Fund
Trustee | |
| Robert Conti* (1956) | | Chief Executive Officer, President and Trustee since 2008; prior thereto, Executive Vice President in 2008 and Vice President 2000 to 2008 | | Managing Director, Neuberger, since 2007; formerly, Senior Vice President, Neuberger, 2003 to 2006; formerly, Vice President, Neuberger, 1999 to 2003; President and Chief Executive Officer, Management, since 2008; formerly, Senior Vice President, Management, 2000 to 2008. | | | 46 | | | Chairman of the Board, Staten Island Mental Health Society since 2008. | |
|
| Jack L. Rivkin* (1940) | | Trustee since 2002; President from 2002 to 2008 | | Formerly, Executive Vice President and Chief Investment Officer, Neuberger Berman Holdings LLC (holding company), 2002 to August 2008 and 2003 to August 2008, respectively; formerly, Managing Director and Chief Investment Officer, Neuberger, December 2005 to August 2008 and 2003 to August 2008, respectively; formerly, Executive Vice President, Neuberger, December 2002 to 2005; formerly, Director and Chairman, Management, December 2002 to August 2008; formerly, Executive Vice President, Citigroup Investments, Inc., September 1995 to February 2002; formerly, Executive Vice President, Citigroup Inc., September 1995 to February 2002. | | | 46 | | | Director, Idealab (private company), since 2009; Director, Distributed World Power (private company), since 2009; Director, Dale Carnegie and Associates, Inc. (private company), since 1998; Director, Solbright, Inc. (private company), since 1997; formerly, Director, New York Society of Security Analysts (2006 to 2008). | |
|
(1) The business address of each listed person is 605 Third Avenue, New York, New York 10158.
(2) Pursuant to the Trust's Trust Instrument, each of these Fund Trustees shall hold office for life or until his or her successor is elected or the Trust terminates; except that (a) any Fund Trustee may resign by delivering a written resignation; (b) any Fund Trustee may be removed with or without cause at any time by a written instrument signed by at least two-thirds of the other Fund Trustees; (c) any Fund Trustee who requests to be retired, or who has become unable to serve, may be retired by a written instrument signed by a majority of the other Fund Trustees; and (d) any Fund Trustee may be removed at any shareholder meeting by a vote of at least two-thirds of the outstanding shares.
30
(3) Except as otherwise indicated, each individual has held the positions shown for at least the last five years.
* Indicates a Fund Trustee who is an "interested person" within the meaning of the 1940 Act. Mr. Amato and Mr. Conti are interested persons of the Trust by virtue of the fact that each is an officer of Management, Neuberger and/or their affiliates. Mr. Rivkin may be deemed an interested person of the Trust by virtue of the fact that, until August 2008, he was a director of Management and an officer of Neuberger.
31
Information about the Officers of the Trust
Name, (Year of Birth),
and Address(1) | | Position and
Length of Time
Served(2) | | Principal Occupation(s)(3) | |
| Andrew B. Allard (1961) | | Anti-Money Laundering Compliance Officer since 2002 | | Senior Vice President, Neuberger, since 2006; Deputy General Counsel, Neuberger, since 2004; formerly, Vice President, Neuberger, 2000 to 2005; formerly, Associate General Counsel, Neuberger, 1999 to 2004; Anti-Money Laundering Compliance Officer, nine registered investment companies for which Management acts as investment manager and administrator (six since 2002, two since 2003 and one since 2006). | |
|
| Claudia A. Brandon (1956) | | Executive Vice President since 2008 and Secretary since 1985 | | Senior Vice President, Neuberger, since 2007 and Employee since 1999; formerly, Vice President, Neuberger, 2002 to 2006; Senior Vice President, Management, since 2008 and Assistant Secretary since 2004; formerly, Vice President-Mutual Fund Board Relations, Management, 2000 to 2008; Executive Vice President, nine registered investment companies for which Management acts as investment manager and administrator (nine since 2008); Secretary, nine registered investment companies for which Management acts as investment manager and administrator (three since 1985, three since 2002, two since 2003 and one since 2006). | |
|
| Maxine L. Gerson (1950) | | Executive Vice President since 2008 and Chief Legal Officer since 2005 (only for purposes of sections 307 and 406 of the Sarbanes-Oxley Act of 2002) | | Senior Vice President, Neuberger, since 2002; Deputy General Counsel and Assistant Secretary, Neuberger, since 2001; Senior Vice President, Management, since 2006; Secretary and General Counsel, Management, since 2004; Executive Vice President, nine registered investment companies for which Management acts as investment manager and administrator (nine since 2008); Chief Legal Officer (only for purposes of sections 307 and 406 of the Sarbanes-Oxley Act of 2002), nine registered investment companies for which Management acts as investment manager and administrator (eight since 2005 and one since 2006). | |
|
| Sheila R. James (1965) | | Assistant Secretary since 2002 | | Vice President, Neuberger, since 2008 and Employee since 1999; formerly, Assistant Vice President, Neuberger, 2007; Assistant Secretary, nine registered investment companies for which Management acts as investment manager and administrator (six since 2002, two since 2003 and one since 2006). | |
|
| Brian Kerrane (1969) | | Vice President since 2008 | | Senior Vice President, Neuberger, since 2006; formerly, Vice President, Neuberger, 2002 to 2006; Vice President, Management, since 2008 and Employee since 1991; Vice President, nine registered investment companies for which Management acts as investment manager and administrator (nine since 2008). | |
|
| Kevin Lyons (1955) | | Assistant Secretary since 2003 | | Assistant Vice President, Neuberger, since 2008 and Employee since 1999; Assistant Secretary, nine registered investment companies for which Management acts as investment manager and administrator (eight since 2003 and one since 2006). | |
|
32
Name, (Year of Birth),
and Address(1) | | Position and
Length of Time
Served(2) | | Principal Occupation(s)(3) | |
| Owen F. McEntee, Jr. (1961) | | Vice President since 2008 | | Vice President, Neuberger, since 2006; Employee, Management, since 1992; Vice President, nine registered investment companies for which Management acts as investment manager and administrator (nine since 2008). | |
|
| John M. McGovern (1970) | | Treasurer and Principal Financial and Accounting Officer since 2005; prior thereto, Assistant Treasurer since 2002 | | Senior Vice President, Neuberger, since 2007; formerly, Vice President, Neuberger, 2004 to 2006; Employee, Management, since 1993; Treasurer and Principal Financial and Accounting Officer, nine registered investment companies for which Management acts as investment manager and administrator (eight since 2005 and one since 2006); formerly, Assistant Treasurer, eight registered investment companies for which Management acts as investment manager and administrator, 2002 to 2005. | |
|
| Andrew Provencher (1965) | | Vice President since 2008 | | Managing Director, Management, since 2008; Managing Director, Neuberger, since 2005; formerly, Senior Vice President, Neuberger, 2003 to 2005; formerly, Vice President, Neuberger, 1999 to 2003; Vice President, nine registered investment companies for which Management acts as investment manager and administrator (nine since 2008). | |
|
| Frank Rosato (1971) | | Assistant Treasurer since 2005 | | Vice President, Neuberger, since 2006; Employee, Management, since 1995; Assistant Treasurer, nine registered investment companies for which Management acts as investment manager and administrator (eight since 2005 and one since 2006). | |
|
| Neil S. Siegel (1967) | | Vice President since 2008 | | Managing Director, Management, since 2008; Managing Director, Neuberger, since 2006; formerly, Senior Vice President, Neuberger, 2004 to 2006; Vice President, nine registered investment companies for which Management acts as investment manager and administrator (nine since 2008); formerly, Head of Institutional Marketing, Morgan Stanley Investment Management, 1993 to 2004. | |
|
| Chamaine Williams (1971) | | Chief Compliance Officer since 2005 | | Senior Vice President, Neuberger, since 2007; Chief Compliance Officer, Management, since 2006; Chief Compliance Officer, nine registered investment companies for which Management acts as investment manager and administrator (eight since 2005 and one since 2006); formerly, Senior Vice President, LBI, 2007 to 2008; formerly, Vice President, LBI, 2003 to 2006; formerly, Chief Compliance Officer, Lehman Brothers Asset Management Inc., 2003 to 2007; formerly, Chief Compliance Officer, Lehman Brothers Alternative Investment Management LLC, 2003 to 2007; formerly, Vice President, UBS Global Asset Management (US) Inc. (formerly, Mitchell Hutchins Asset Management, a wholly-owned subsidiary of PaineWebber Inc.), 1997 to 2003. | |
|
(1) The business address of each listed person is 605 Third Avenue, New York, New York 10158.
(2) Pursuant to the By-Laws of the Trust, each officer elected by the Fund Trustees shall hold office until his or her successor shall have been elected and qualified or until his or her earlier death, inability to serve, or resignation. Officers serve at the pleasure of the Fund Trustees and may be removed at any time with or without cause.
(3) Except as otherwise indicated, each individual has held the positions shown for at least the last five years.
33
Proxy Voting Policies and Procedures
A description of the policies and procedures that the Trust uses to determine how to vote proxies relating to portfolio securities is available, without charge, by calling 1-800-877-9700 (toll-free) and on the website of the Securities and Exchange Commission, at www.sec.gov. Information regarding how the Trust voted proxies relating to portfolio securities during the most recent 12-month period ended June 30 is also available, without charge, by calling 1-800-877-9700 (toll-free), on the website of the Securities and Exchange Commission at www.sec.gov, and on Management's website at www.nb.com.
Quarterly Portfolio Schedule
The Trust files a complete schedule of portfolio holdings for the Fund with the Securities and Exchange Commission for the first and third quarters of each fiscal year on Form N-Q. The Trust's Forms N-Q are available on the Securities and Exchange Commission's website at www.sec.gov and may be reviewed and copied at the Securities and Exchange Commission's Public Reference Room in Washington, DC. Information on the operation of the Public Reference Room may be obtained by calling 1-800-SEC-0330. The information on Form N-Q is available upon request, without charge, by calling 1-800-877-9700 (toll free).
Notice to Shareholders (Unaudited)
The Fund has elected to pass through to its shareholders the credits for taxes paid to foreign countries. For the fiscal year ended December 31, 2009, the Fund designates $407,205, or $0.01 per share outstanding, foreign taxes paid and $7,563,760, or $0.22 per share outstanding, foreign source income earned for Federal income tax purposes.
34
Neuberger Berman
Advisers Management Trust
Mid-Cap Growth Portfolio
I Class Shares
S Class Shares
Annual Report
December 31, 2009
B1013 02/10
Mid-Cap Growth Portfolio Manager's Commentary
For the year ended December 31, 2009, the Neuberger Berman Advisers Management Trust (AMT) Mid-Cap Growth Portfolio posted strong results but underperformed its benchmark, the Russell Midcap(R) Growth Index.
While the equity markets ended 2009 decidedly up, the period contained two very different phases -- dramatic weakness carrying over from 2008 colored the early part of the year, and then markets rallied from March through year-end. Mid-cap stocks led other market capitalization groups, and growth stocks outperformed value stocks for the year.
Generally speaking, this year's rally was led by what we consider the lower quality area of the market, including stocks with low price/earnings, low returns on equity, low prices (under $5) and little or no earnings. This was not surprising to us, as low quality stocks have historically led early in market rallies. We typically avoid these areas given our stock selection process and fundamental criteria. We also do not believe they can outperform over the longer term. In fact, we believe there are signs that the low-quality rally may already be fading, and that the markets will once again focus on fundamentals and higher quality names with superior growth potential. Information Technology (IT) and Energy were the best performing index sectors in 2009, while Utilities and Telecommunications were the weakest.
Within the Portfolio, our Telecommunications holdings were beneficial to relative performance, as was a zero allocation to Utilities. In Telecommunications, tower companies including our top performer, SBA Communications, and American Tower, were strong this period.
Given that our higher-quality discipline was out of favor for most of the year, stock selection was a negative versus the market. We saw particular weakness within Health Care and IT stocks.
In Health Care, both uncertainty surrounding health care reform and weak earnings impacted our holdings. Additionally, medical supplies and services companies underperformed on concerns about lower hospital spending. In addition, our medical diagnostics theme was impacted by the slowdown more than we had expected. We sold Wright Medical, Psychiatric Solutions, Illumina and Myriad Genetics on earnings disappointments and/or lower guidance. Within the sector, we are focusing on companies that we believe may be beneficiaries of health care reform, such as payment management firms Express Scripts, Allscripts and MedAssets. We also see potential in insulated areas, such as ResMed, a company focused on sleep disorders; Sirona, a dental instrument maker; and Mylan, a manufacturer of generic medications.
In IT, our holdings, primarily software and services names, did not keep pace with the rally, although our semiconductor equipment stocks performed better than our sector holdings overall. Alliance Data Systems was one such niche business service provider that underperformed. VistaPrint, a lower-cost business products and services provider, was among our top performers, and was particularly strong during the second half. Cognizant Technology Solutions, Equinix and Marvell also performed very well. In IT, we have not significantly changed our positioning, expecting that holdings could benefit as long-delayed business spending increases.
Within Industrials, while high-quality holdings including Danaher, Stericycle and Fastenal exceeded earnings expectations, they were out of favor with the preference for low quality stocks over the past year. We believe these companies could benefit now from improved corporate spending. We continue to hold aerospace and defense themed names such as Rockwell Collins and Precision Castparts. We sold Corrections Corp., a prison outsourcing company, on concerns about state spending levels, and added to names that we believed could benefit from economic improvement.
In Consumer Discretionary, our secondary education theme underperformed this period, although holdings here also exceeded expectations. We sold American Public Education and Grand Canyon, but continue to hold DeVry and Strayer. Our "retail survivors" theme was beneficial, with Nordstrom among our top performers. We sold Staples and Kohl's as they grew too large in our view for the Portfolio, and we are currently taking a bifurcated approach to the market, considering stresses on consumers. At the lower end of the consumer market, we hold Dollar Tree, top performer Ross Stores and TJX. On the higher end, we hold Coach and Polo Ralph Lauren. These high-end retailers provide the Portfolio with exposure to internationally generated revenues. We also continue to hold gaming and high-end leisure, with companies such as Penn National, Bally Technologies and WMS Industries.
1
Looking ahead, we currently believe continued recovery will occur with muted growth, expecting GDP -- likely in our view to be stronger in the first half of 2010 than the second -- in the range of 3%. Consumer weakness and jobless claims continue to be our main concerns. Since the consumer is unlikely to help move the economy forward, we believe it is critical that select international economies, such as the BRIC (Brazil, Russia, India and China) markets, show robust growth. Considering this outlook, we are seeking "international exposure" through companies with exposure to international revenue streams. In addition, unlike last year, we are looking for top line growth as opposed to bottom line improvements. We believe there is a great deal of potential for renewed corporate spending. This should benefit some Industrials and IT companies. We have continued to become less defensive within the Portfolio overall, and believe that with a sustained slower growth recovery backdrop, the market will reward companies with strong managements, quality growth characteristics and strong balance sheets.
Sincerely,
Kenneth J. Turek
Portfolio Manager
2
Mid-Cap Growth Portfolio
SECTOR ALLOCATION
| (% of Equity Market Value) | |
| Consumer Discretionary | | | 19.6 | % | |
| Consumer Staples | | | 3.2 | | |
| Energy | | | 9.0 | | |
| Financials | | | 4.7 | | |
| Health Care | | | 13.8 | | |
| Industrials | | | 15.8 | | |
| Information Technology | | | 25.0 | | |
| Materials | | | 4.5 | | |
| Telecommunication Services | | | 4.4 | | |
| Total | | | 100.0 | % | |
AVERAGE ANNUAL TOTAL RETURN1
| | | Inception
Date | | 1 Year | | 5 Years | | 10 Years | | Life of
Fund* | |
| Mid-Cap Growth Portfolio Class I | | 11/03/1997 | | | 31.66 | % | | | 3.57 | % | | | -1.33 | % | | | 6.68 | % | |
| Mid-Cap Growth Portfolio Class S2 | | 02/18/2003 | | | 31.34 | % | | | 3.31 | % | | | -1.51 | % | | | 6.53 | % | |
| Russell Midcap(R) Growth Index3 | | | | | 46.29 | % | | | 2.40 | % | | | -0.52 | % | | | 4.62 | % | |
| Russell Midcap(R) Index3 | | | | | 40.48 | % | | | 2.43 | % | | | 4.98 | % | | | 6.80 | % | |
Performance data quoted represent past performance, which is no guarantee of future results. The investment return and principal value of an investment will fluctuate so that an investor's shares, when redeemed may be worth more or less than their original cost. Results are shown on a "total return" basis and include reinvestment of all income dividends and distributions.
Current performance may be lower or higher than the performance data quoted. For performance data current to the most recent month end, please visit https://www.nb.com.
* Index returns are as of the inception date 11/03/1997.
As stated in the Portfolio's most recent prospectus, the total annual fund operating expense ratios for fiscal year 2008 were 0.92% and 1.18% for Class I and Class S shares, respectively (prior to any fee waivers or expense reimbursements). Neuberger Berman Management LLC has contractually agreed to limit certain expenses of the Portfolio through 12/31/2012 for Class I and Class S shares.
COMPARISON OF A $10,000 INVESTMENT
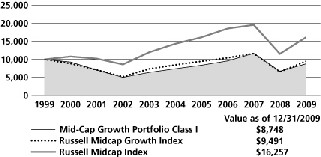
The chart shows the value of a hypothetical $10,000 investment in the Portfolio over the past 10 fiscal years, or since the Portfolio's inception, if it has not operated for 10 years. The graphs are based on Class I shares only; performance of other classes will vary due to differences in fee structures (see Average Annual Total Return chart above). The result is compared with benchmarks, which may include a broad-based market index and/or a narrower index. Please note that market indexes do not include expenses. All results include the reinvestment of income dividends and distributions. Results represent past performance and do not indicate future results. The chart and table do not reflect the deduction of taxes that a shareholder would pay on Portfolio distributions or the redemption of Portfolio shares.
Please see Endnotes for additional information.
3
Endnotes
1 "Total Return" includes reinvestment of all income dividends and distributions. Results represent past performance and do not indicate future results. The value of an investment in the Portfolio and the return on the investment both will fluctuate, and redemption proceeds may be higher or lower than an investor's original cost. The performance information does not reflect fees and expenses of the variable annuity and variable life insurance policies or the qualified pension retirement plans whose proceeds are invested in the AMT Mid-Cap Growth Portfolio. Neuberger Berman Management LLC ("NBM LLC") has agreed to absorb certain expenses of the AMT Portfolios, including the Portfolio. Without this arrangement, which is subject to change, the total returns of the Portfolio may have been less.
2 Performance shown prior to February 18, 2003 for the Class S shares is of the Class I shares, which have lower expenses and correspondingly higher returns than the Class S shares.
3 The Russell Midcap(R) Growth Index measures the performance of those Russell Midcap(R) Index companies with higher price-to-book ratios and higher forecasted growth values. The Russell Midcap Index measures the performance of the 800 smallest companies in the Russell 1000(R) Index, which represents approximately 31% of the total market capitalization of the Russell 1000 Index (which, in turn, consists of the 1,000 largest U.S. companies, based on market capitalization). Please note that indices do not take into account any fees and expenses of investing in the individual securities that they track and that individuals cannot invest directly in any index. Data about the performance of these indices are prepared or obtained by NBM LLC and include reinvestment of all income dividends and distributions. The Portfolio may invest in many securities not included in the above-described indices.
Any ratios or other measurements using a factor of forecasted earnings of a company discussed herein are based on consensus estimates, not NBM LLC's own projections, and they may or may not be realized. In addition, any revision to a forecast could affect the market price of a security. By quoting them herein, NBM LLC does not offer an opinion as to the accuracy of and does not guarantee these forecasted numbers.
The investments for the Portfolio are managed by the same portfolio manager(s) who manage one or more other mutual funds that have similar names, investment objectives and investment styles as the Portfolio. You should be aware that the Portfolio is likely to differ from the other mutual funds in size, cash flow pattern and tax matters. Accordingly, the holdings and performance of the Portfolio can be expected to vary from those of the other mutual funds.
The composition, industries and holdings of the Portfolio are subject to change.
Shares of the separate AMT Portfolios are not available to the general public. Shares of this Portfolio may be purchased only by life insurance companies to be used with their separate accounts that fund variable annuity and variable life insurance policies and by qualified pension and retirement plans.
Statistics and projections in this report are derived from sources deemed to be reliable but cannot be regarded as a representation of future results of the AMT Portfolios. This report is prepared for the general information of shareholders and is not an offer of shares of the AMT Portfolios. Shares of the AMT Portfolios are sold only through the currently effective prospectuses, which must precede or accompany this report.
(c) 2010 Neuberger Berman Management LLC distributor. All rights reserved.
4
Information About Your Fund's Expenses
This table is designed to provide information regarding costs related to your investments. All mutual funds incur operating expenses, which include management fees, fees for administrative services and costs of shareholder reports, among others. The following examples are based on an investment of $1,000 made at the beginning of the six month period ended December 31, 2009 and held for the entire period. The table illustrates the fund's costs in two ways:
| Actual Expenses and Performance: | | The first section of the table provides information about actual account values and actual expenses in dollars, based on the fund's actual performance during the period. You may use the information in this line, together with the amount you invested, to estimate the expenses you paid over the period. Simply divide your account value by $1,000 (for example, an $8,600 account value divided by $1,000 = 8.6), then multiply the result by the number in the first section of the table under the heading entitled "Expenses Paid During the Period" to estimate the expenses you paid over the period. | |
|
Hypothetical Example for
Comparison Purposes: | | The second section of the table provides information about hypothetical account values and hypothetical expenses based on the fund's actual expense ratio and an assumed rate of return at 5% per year before expenses. This return is not the fund's actual return. The hypothetical account values and expenses may not be used to estimate the actual ending account balance or expenses you paid for the period. You may use this information to compare the ongoing costs of investing in this fund versus other funds. To do so, compare the expenses shown in this 5% hypothetical example with the 5% hypothetical examples that appear in the shareholder reports of other funds. | |
|
Please note that the expenses in the table are meant to highlight your ongoing costs only. The table and expense example do not include any transactional costs, such as fees and expenses that are, or may be, imposed under your variable contract or qualified pension plan. Therefore, the information under the heading "Hypothetical (5% annual return before expenses)" is useful in comparing ongoing costs only, and will not help you determine the relative total costs of owning different funds. In addition, if these transactional costs were included, your costs would have been higher.
Expense Information as of 12/31/09 (Unaudited)
NEUBERGER BERMAN ADVISERS MANAGEMENT TRUST MID-CAP GROWTH PORTFOLIO
| Actual | | Beginning Account
Value
7/1/09 | | Ending Account
Value
12/31/09 | | Expenses Paid
During the Period*
7/1/09 - 12/31/09 | | Expense
Ratio | |
| Class I | | $ | 1,000.00 | | | $ | 1,220.60 | | | $ | 5.82 | | | | 1.04 | % | |
| Class S | | $ | 1,000.00 | | | $ | 1,219.00 | | | $ | 7.05 | | | | 1.26 | % | |
| Hypothetical (5% annual return before expenses)** | |
| Class I | | $ | 1,000.00 | | | $ | 1,019.96 | | | $ | 5.30 | | | | 1.04 | % | |
| Class S | | $ | 1,000.00 | | | $ | 1,018.85 | | | $ | 6.41 | | | | 1.26 | % | |
* For each class of the fund, expenses are equal to the annualized expense ratio for the class, multiplied by the average account value over the period, multiplied by 184/365 (to reflect the one-half year period shown).
** Hypothetical 5% annual return before expenses is calculated by multiplying the number of days in the most recent half year divided by 365.
5
Schedule of Investments Mid-Cap Growth Portfolio
| NUMBER OF SHARES | | | | VALUEt | |
| Common Stocks (99.7%) | | | |
| Aerospace & Defense (2.2%) | | | |
| | 35,100 | | | Precision Castparts | | $ | 3,873,285 | | |
| | 39,000 | | | Rockwell Collins | | | 2,159,040 | | |
| | | | 6,032,325 | | |
| Air Freight & Logistics (1.7%) | | | |
| | 80,500 | | | C.H. Robinson Worldwide | | | 4,727,765 | | |
| Biotechnology (4.3%) | | | |
| | 58,000 | | | Alexion Pharmaceuticals | | | 2,831,560 | * | |
| | 50,000 | | | BioMarin Pharmaceutical | | | 940,500 | * | |
| | 40,000 | | | Dendreon Corp. | | | 1,051,200 | ** | |
| | 75,000 | | | Human Genome Sciences | | | 2,295,000 | * | |
| | 115,000 | | | Talecris Biotherapeutics | | | 2,561,050 | * | |
| | 55,000 | | | Vertex Pharmaceuticals | | | 2,356,750 | * | |
| | | | 12,036,060 | | |
| Capital Markets (2.5%) | | | |
| | 39,500 | | | Affiliated Managers Group | | | 2,660,325 | * | |
| | 45,500 | | | Artio Global Investors | | | 1,159,795 | * | |
| | 130,000 | | | Invesco Ltd. | | | 3,053,700 | | |
| | | | 6,873,820 | | |
| Chemicals (3.7%) | | | |
| | 100,000 | | | Airgas, Inc. | | | 4,760,000 | | |
| | 90,000 | | | Ecolab Inc. | | | 4,012,200 | | |
| | 56,500 | | | Nalco Holding | | | 1,441,315 | | |
| | | | 10,213,515 | | |
| Commercial Services & Supplies (1.9%) | | | |
| | 94,000 | | | Stericycle, Inc. | | | 5,185,980 | * | |
| Communications Equipment (1.1%) | | | |
| | 110,000 | | | Juniper Networks | | | 2,933,700 | * | |
| Computers & Peripherals (1.7%) | | | |
| | 65,000 | | | NetApp, Inc. | | | 2,235,350 | * | |
| | 55,000 | | | Western Digital | | | 2,428,250 | * | |
| | | | 4,663,600 | | |
| Diversified Consumer Services (2.3%) | | | |
| | 53,500 | | | DeVry, Inc. | | | 3,035,055 | | |
| | 16,000 | | | Strayer Education | | | 3,399,840 | * | |
| | | | 6,434,895 | | |
| Diversified Financial Services (2.2%) | | | |
| | 27,000 | | | IntercontinentalExchange Inc. | | | 3,032,100 | * | |
| | 100,000 | | | MSCI Inc. | | | 3,180,000 | * | |
| | | | 6,212,100 | | |
| NUMBER OF SHARES | | | | VALUEt | |
| Electrical Equipment (2.1%) | | | |
| | 93,000 | | | AMETEK, Inc. | | $ | 3,556,320 | | |
| | 45,000 | | | Roper Industries | | | 2,356,650 | | |
| | | | 5,912,970 | | |
Electronic Equipment, Instruments &
Components (4.1%) | | | |
| | 62,500 | | | Amphenol Corp. | | | 2,886,250 | | |
| | 75,000 | | | Dolby Laboratories | | | 3,579,750 | * | |
| | 80,000 | | | National Instruments | | | 2,356,000 | | |
| | 100,000 | | | Trimble Navigation | | | 2,520,000 | * | |
| | | | 11,342,000 | | |
| Energy Equipment & Services (3.1%) | | | |
| | 58,000 | | | CARBO Ceramics | | | 3,953,860 | | |
| | 26,000 | | | Core Laboratories N.V. | | | 3,071,120 | | |
| | 27,000 | | | Oceaneering International | | | 1,580,040 | * | |
| | | | 8,605,020 | | |
| Food Products (0.5%) | | | |
| | 25,000 | | | J.M. Smucker | | | 1,543,750 | | |
| Health Care Equipment & Supplies (4.1%) | | | |
| | 30,000 | | | Edwards Lifesciences | | | 2,605,500 | * | |
| | 5,500 | | | Intuitive Surgical | | | 1,668,260 | * | |
| | 35,000 | | | Masimo Corp. | | | 1,064,700 | * | |
| | 60,000 | | | NuVasive, Inc. | | | 1,918,800 | ** | |
| | 28,000 | | | ResMed Inc. | | | 1,463,560 | * | |
| | 45,000 | | | Sirona Dental Systems | | | 1,428,300 | * | |
| | 75,000 | | | Volcano Corp. | | | 1,303,500 | * | |
| | | | 11,452,620 | | |
| Health Care Providers & Services (3.2%) | | | |
| | 58,000 | | | Express Scripts | | | 5,014,100 | * | |
| | 50,000 | | | HMS Holdings | | | 2,434,500 | * | |
| | 60,000 | | | PSS World Medical | | | 1,354,200 | * | |
| | | | 8,802,800 | | |
| Health Care Technology (1.3%) | | | |
| | 100,000 | | | Allscripts Healthcare Solutions | | | 2,023,000 | * | |
| | 70,000 | | | MedAssets Inc. | | | 1,484,700 | * | |
| | | | 3,507,700 | | |
| Hotels, Restaurants & Leisure (3.8%) | | | |
| | 31,500 | | | Bally Technologies | | | 1,300,635 | * | |
| | 49,314 | | | Marriott International | | | 1,343,807 | | |
| | 122,000 | | | Penn National Gaming | | | 3,315,960 | * | |
| | 116,500 | | | WMS Industries | | | 4,660,000 | * | |
| | | | 10,620,402 | | |
See Notes to Schedule of Investments 6
| NUMBER OF SHARES | | | | VALUEt | |
| Household Products (1.0%) | | | |
| | 44,000 | | | Church & Dwight | | $ | 2,659,800 | | |
| Internet & Catalog Retail (0.9%) | | | |
| | 11,000 | | | Priceline.com Inc. | | | 2,403,500 | * | |
| Internet Software & Services (3.5%) | | | |
| | 34,000 | | | Equinix, Inc. | | | 3,609,100 | * | |
| | 45,000 | | | GSI Commerce | | | 1,142,550 | * | |
| | 85,500 | | | VistaPrint NV | | | 4,844,430 | * | |
| | | | 9,596,080 | | |
| IT Services (1.6%) | | | |
| | 22,500 | | | Alliance Data Systems | | | 1,453,275 | ** | |
| | 68,000 | | | Cognizant Technology Solutions | | | 3,080,400 | * | |
| | | | 4,533,675 | | |
| Machinery (2.0%) | | | |
| | 45,000 | | | Danaher Corp. | | | 3,384,000 | | |
| | 22,500 | | | Flowserve Corp. | | | 2,126,925 | | |
| | | | 5,510,925 | | |
| Media (1.7%) | | | |
| | 40,000 | | | Discovery Communications
Class A | | | 1,226,800 | * | |
| | 51,000 | | | DreamWorks Animation SKG | | | 2,037,450 | * | |
| | 32,500 | | | Scripps Networks Interactive | | | 1,348,750 | | |
| | | | 4,613,000 | | |
| Metals & Mining (0.8%) | | | |
| | 46,500 | | | Cliffs Natural Resources | | | 2,143,185 | | |
| Multiline Retail (2.0%) | | | |
| | 55,000 | | | Dollar Tree | | | 2,656,500 | * | |
| | 79,000 | | | Nordstrom, Inc. | | | 2,968,820 | | |
| | | | 5,625,320 | | |
| Oil, Gas & Consumable Fuels (5.8%) | | | |
| | 25,500 | | | Alpha Natural Resources | | | 1,106,190 | * | |
| | 45,500 | | | Cabot Oil & Gas | | | 1,983,345 | | |
| | 123,000 | | | Concho Resources | | | 5,522,700 | * | |
| | 73,500 | | | Range Resources | | | 3,663,975 | | |
| | 82,000 | | | Southwestern Energy | | | 3,952,400 | * | |
| | | | 16,228,610 | | |
| Personal Products (1.7%) | | | |
| | 45,500 | | | Avon Products | | | 1,433,250 | | |
| | 73,500 | | | Mead Johnson Nutrition | | | 3,211,950 | | |
| | | | 4,645,200 | | |
| NUMBER OF SHARES | | | | VALUEt | |
| Pharmaceuticals (0.8%) | | | |
| | 120,000 | | | Mylan Laboratories | | $ | 2,211,600 | * | |
| Professional Services (2.5%) | | | |
| | 70,000 | | | IHS Inc. | | | 3,836,700 | * | |
| | 100,000 | | | Verisk Analytics | | | 3,028,000 | * | |
| | | | 6,864,700 | | |
| Road & Rail (1.0%) | | | |
| | 87,000 | | | J.B. Hunt Transport Services | | | 2,807,490 | | |
Semiconductors & Semiconductor
Equipment (6.6%) | | | |
| | 81,000 | | | Analog Devices | | | 2,557,980 | | |
| | 105,000 | | | Avago Technologies | | | 1,920,450 | * | |
| | 151,600 | | | Marvell Technology Group | | | 3,145,700 | * | |
| | 124,000 | | | Microchip Technology | | | 3,603,440 | | |
| | 62,500 | | | Novellus Systems | | | 1,458,750 | * | |
| | 69,000 | | | Silicon Laboratories | | | 3,335,460 | * | |
| | 61,000 | | | Varian Semiconductor
Equipment | | | 2,188,680 | * | |
| | | | 18,210,460 | | |
| Software (6.4%) | | | |
| | 230,000 | | | Activision Blizzard | | | 2,555,300 | * | |
| | 90,000 | | | ANSYS, Inc. | | | 3,911,400 | * | |
| | 37,000 | | | Citrix Systems | | | 1,539,570 | * | |
| | 33,500 | | | McAfee Inc. | | | 1,359,095 | * | |
| | 43,500 | | | MICROS Systems | | | 1,349,805 | * | |
| | 75,000 | | | Rovi Corp. | | | 2,390,250 | * | |
| | 21,000 | | | Salesforce.com, Inc. | | | 1,549,170 | * | |
| | 20,500 | | | Solera Holdings | | | 738,205 | | |
| | 52,500 | | | Sybase, Inc. | | | 2,278,500 | * | |
| | | | 17,671,295 | | |
| Specialty Retail (8.0%) | | | |
| | 82,000 | | | Bed Bath & Beyond | | | 3,167,660 | * | |
| | 70,300 | | | CarMax, Inc. | | | 1,704,775 | * | |
| | 55,000 | | | J Crew Group | | | 2,460,700 | ** | |
| | 95,000 | | | Ross Stores | | | 4,057,450 | | |
| | 21,500 | | | Tiffany & Co. | | | 924,500 | | |
| | 68,000 | | | TJX Cos. | | | 2,485,400 | | |
| | 160,000 | | | Urban Outfitters | | | 5,598,400 | * | |
| | 84,000 | | | Williams-Sonoma | | | 1,745,520 | | |
| | | | 22,144,405 | | |
| Textiles, Apparel & Luxury Goods (0.8%) | | | |
| | 45,000 | | | Coach, Inc. | | | 1,643,850 | | |
| | 9,000 | | | Polo Ralph Lauren | | | 728,820 | | |
| | | | 2,372,670 | | |
| Trading Companies & Distributors (2.3%) | | | |
| | 86,000 | | | Fastenal Co. | | | 3,581,040 | | |
| | 30,000 | | | W.W. Grainger | | | 2,904,900 | | |
| | | | 6,485,940 | | |
See Notes to Schedule of Investments 7
| NUMBER OF SHARES | | | | VALUEt | |
| Wireless Telecommunication Services (4.5%) | | | |
| | 70,000 | | | American Tower | | $ | 3,024,700 | * | |
| | 39,500 | | | Crown Castle International | | | 1,542,080 | * | |
| | 55,000 | | | NII Holdings | | | 1,846,900 | * | |
| | 175,000 | | | SBA Communications | | | 5,978,000 | * | |
| | | | 12,391,680 | | |
| | | | | Total Common Stocks
(Cost $199,590,968) | | | 276,220,557 | | |
| Short-Term Investments (3.8%) | | | |
| | 9,226,325 | | | Neuberger Berman Securities
Lending Quality Fund, LLC | | | 9,410,851 | tt | |
| | 1,232,247 | | | State Street Institutional Liquid
Reserves Fund Institutional Class | | | 1,232,247 | | |
| | | | | Total Short-Term Investments
(Cost $10,643,098) | | | 10,643,098 | | |
| | | | | Total Investments (103.5%)
(Cost $210,234,066) | | | 286,863,655 | ## | |
| | | | | Liabilities, less cash, receivables and
other assets [(3.5%)] | | | (9,654,180 | ) | |
| | | | | Total Net Assets (100.0%) | | $ | 277,209,475 | | |
See Notes to Schedule of Investments 8
Notes to Schedule of Investments Mid-Cap Growth Portfolio
t The value of investments in equity securities by Neuberger Berman Advisers Management Trust Mid-Cap Growth Portfolio (the "Fund") is determined by Neuberger Berman Management LLC ("Management") primarily by obtaining valuations from an independent pricing service based on the latest sale price when that price is readily available. Securities traded primarily on the NASDAQ Stock Market are normally valued by the Fund at the NASDAQ Official Closing Price ("NOCP") provided by NASDAQ each business day. The NOCP is the most recently reported price as of 4:00:02 p.m., Eastern time, unless that price is outside the range of the "inside" bid and asked prices (i.e., the bid and asked prices that dealers quote to each other when trading for their own accounts); in that case, NASDAQ will adjust the price to equal the inside bid or asked price, whichever is closer. Because of delays in reporting trades, the NOCP may not be based on the price of the last trade to occur before the market closes. If there is no reported sale of a security on a particular day, the independent pricing service may value the security based on reported market quotations. Management has developed a process to periodically review information provided by independent pricing services. If a valuation is not available from an independent pricing service, the Fund seeks to obtain quotations from principal market makers. If such quotations are not readily available, securities are valued using methods the Board of Trustees of Neuberger Berman Advisers Management Trust (the "Board") has approved on the belief that they reflect fair value. Numerous factors may be considered when determining the fair value of a security, including available analyst, media or other reports, trading in futures or ADRs and whether the issuer of the security being fair valued has other securities outstanding. Foreign security prices are furnished by independent quotation services and expressed in local currency values. Foreign security prices are currently translated from the local currency into U.S. dollars using the exchange rate as of 4:00 p.m., Eastern time. The Board has approved the use of Interactive Data Pricing and Reference Data, Inc. ("Interactive") to assist in determining the fair value of the Fund's foreign equity securities when changes in the value of a certain index suggest that the closing prices on the foreign exchanges may no longer represent the amount that the Fund could expect to receive for those securities. In this event, Interactive will provide adjusted prices for certain foreign equity securities using a statistical analysis of historical correlations of multiple factors. In the absence of precise information about the market values of these foreign securities as of the close of the New York Stock Exchange, the Board has determined on the basis of available data that prices adjusted in this way are likely to be closer to the prices the Fund could realize on a current sale than are the prices of those securities established at the close of the foreign markets in which the securities primarily trade. Fair value prices are necessarily estimates, and there is no assurance that such a price will be at or close to the price at which the security next trades. Short-term debt securities with less than 60 days until maturity may be valued at cost, which, when combined with interest earned, is expected to approximate market value.
In accordance with Accounting Standards Codification ("ASC") 820 "Fair Value Measurements and Disclosures" ("ASC 820"), formerly known as Financial Accounting Standards Board ("FASB") Statement of Financial Accounting Standards No. 157, "Fair Value Measurements," investments held by the Fund are carried at "fair value" as defined by ASC 820. Fair Value is defined as the price that a fund would receive upon selling an investment in an orderly transaction to an independent buyer in the principal or most advantageous market for the investment under current market conditions. Various inputs, including the volume and level of activity for the asset or liability in the market are considered in determining the value of the Fund's investments, some of which are discussed above. Significant management judgement may be necessary to estimate fair value in accordance with ASC 820.
In addition to defining fair value, ASC 820 established a three-tier hierarchy of inputs to establish a classification of fair value measurements for disclosure purposes. The three-tier hierarchy of inputs is summarized in the three broad Levels listed below.
. Level 1 - quoted prices in active markets for identical investments
. Level 2 - other significant observable inputs (including quoted prices for similar investments, interest rates, prepayment speeds, credit risk, amortized cost, etc.)
. Level 3 - significant unobservable inputs (including the Fund's own assumptions in determining the fair value of investments)
See Notes to Financial Statements 9
Notes to Schedule of Investments Mid-Cap Growth Portfolio (cont'd)
The inputs or methodology used for valuing an investment are not necessarily an indication of the risk associated with investing in those securities.
The following is a summary, by category of Level, of inputs used to value the Fund's investments as of December 31, 2009:
| Asset Valuation Inputs | | Level 1 | | Level 2 | | Level 3 | | Total | |
| Investments: | |
| Common Stock^ | | $ | 276,220,557 | | | $ | -- | | | $ | -- | | | $ | 276,220,557 | | |
| Short-Term Investments | | | -- | | | | 10,643,098 | | | | -- | | | | 10,643,098 | | |
| Total Investments | | $ | 276,220,557 | | | $ | 10,643,098 | | | $ | -- | | | $ | 286,863,655 | | |
^ The Schedule of Investments provides information on the industry categorization for the portfolio.
## At December 31, 2009, the cost of investments for U.S. federal income tax purposes was $211,906,772. Gross unrealized appreciation of investments was $75,816,241 and gross unrealized depreciation of investments was $859,358, resulting in net unrealized appreciation of $74,956,883, based on cost for U.S. federal income tax purposes.
* Security did not produce income during the last twelve months.
* All or a portion of this security is on loan (see Note A of Notes to Financial Statements).
tt Managed by an affiliate of Management and could be deemed an affiliate of the Fund (see Notes A & F of Notes to Financial Statements).
See Notes to Financial Statements 10
Statement of Assets and Liabilities
Neuberger Berman Advisers Management Trust
| | | MID-CAP GROWTH
PORTFOLIO | |
| | | December 31, 2009 | |
| Assets | |
| Investments in securities, at value*t (Notes A & F)--see Schedule of Investments: | |
| Unaffiliated issuers | | $ | 277,452,804 | | |
| Affiliated issuers | | | 9,410,851 | | |
| | | | 286,863,655 | | |
| Cash | | | 16,263 | | |
| Dividends and interest receivable | | | 84,228 | | |
| Receivable for Fund shares sold | | | 3,446 | | |
| Receivable for securities lending income--net (Note A) | | | 29,286 | | |
| Prepaid expenses and other assets | | | 7,884 | | |
| Total Assets | | | 287,004,762 | | |
| Liabilities | |
| Payable for collateral on securities loaned (Note A) | | | 9,410,851 | | |
| Payable for Fund shares redeemed | | | 96,157 | | |
| Payable to investment manager (Notes A & B) | | | 127,553 | | |
| Payable to administrator--net (Note B) | | | 80,156 | | |
| Accrued expenses and other payables | | | 80,570 | | |
| Total Liabilities | | | 9,795,287 | | |
| Net Assets at value | | $ | 277,209,475 | | |
| Net Assets consist of: | |
| Paid-in capital | | $ | 397,273,445 | | |
| Accumulated net realized gains (losses) on investments | | | (196,693,559 | ) | |
| Net unrealized appreciation (depreciation) in value of investments | | | 76,629,589 | | |
| Net Assets at value | | $ | 277,209,475 | | |
| Net Assets | |
| Class I | | $ | 234,057,411 | | |
| Class S | | | 43,152,064 | | |
| Shares Outstanding ($.001 par value; unlimited shares authorized) | |
| Class I | | | 11,016,865 | | |
| Class S | | | 2,067,255 | | |
| Net Asset Value, offering and redemption price per share | |
| Class I | | $ | 21.25 | | |
| Class S | | | 20.87 | | |
| tSecurities on loan, at value: | |
| Unaffiliated issuers | | $ | 9,180,390 | | |
| *Cost of Investments: | |
| Unaffiliated issuers | | $ | 200,823,215 | | |
| Affiliated issuers | | | 9,410,851 | | |
| Total cost of investments | | $ | 210,234,066 | | |
See Notes to Financial Statements 11
Statement of Operations
Neuberger Berman Advisers Management Trust
| | | MID-CAP GROWTH
PORTFOLIO | |
| | | For the
Year Ended
December 31, 2009 | |
| Investment Income: | |
| Income (Note A): | |
| Dividend income--unaffiliated issuers | | $ | 1,943,173 | | |
| Interest income--unaffiliated issuers | | | 1,841 | | |
| Income from securities loaned--net (Note F) | | | 808,023 | | |
| Income from investments in affiliated issuers (Note F) | | | 3,585 | | |
| Foreign taxes withheld | | | (18,342 | ) | |
| Total income | | $ | 2,738,280 | | |
| Expenses: | |
| Investment management fees (Notes A & B) | | | 1,754,012 | | |
| Administration fees (Note B): | |
| Class I | | | 850,297 | | |
| Class S | | | 116,282 | | |
| Distribution fees (Note B): | |
| Class S | | | 96,901 | | |
| Audit fees | | | 41,307 | | |
| Custodian fees (Note B) | | | 134,649 | | |
| Insurance expense | | | 23,574 | | |
| Legal fees | | | 110,507 | | |
| Shareholder reports | | | 144,153 | | |
| Trustees' fees and expenses | | | 50,137 | | |
| Miscellaneous | | | 42,698 | | |
| Total expenses | | | 3,364,517 | | |
| Expenses reimbursed by administrator (Note B) | | | (6,114 | ) | |
| Investment management fees waived (Note A) | | | (1,152 | ) | |
| Expenses reduced by custodian fee expense offset arrangement (Note B) | | | (13 | ) | |
| Total net expenses | | | 3,357,238 | | |
| Net investment income (loss) | | $ | (618,958 | ) | |
| Realized and Unrealized Gain (Loss) on Investments (Note A) | |
| Net realized gain (loss) on: | |
| Sales of investment securities of unaffiliated issuers | | | (32,672,771 | ) | |
| Sales of investment securities of affiliated issuers | | | 1,039,253 | | |
| Redemption in-kind | | | 8,723,086 | | |
| Foreign currency | | | 3,124 | | |
| Change in net unrealized appreciation (depreciation) in value of: | |
| Unaffiliated investment securities | | | 108,221,673 | | |
| Foreign currency | | | (125 | ) | |
| Net gain (loss) on investments | | | 85,314,240 | | |
| Net increase (decrease) in net assets resulting from operations | | $ | 84,695,282 | | |
See Notes to Financial Statements 12
Statements of Changes in Net Assets
Neuberger Berman Advisers Management Trust
| | | MID-CAP GROWTH PORTFOLIO | |
| | | Year Ended
December 31,
2009 | | Year Ended
December 31,
2008 | |
| Increase (Decrease) in Net Assets: | |
| From Operations (Note A): | |
| Net investment income (loss) | | $ | (618,958 | ) | | $ | (3,404,766 | ) | |
| Net realized gain (loss) on investments | | | (22,907,308 | ) | | | (40,318,113 | ) | |
| Change in net unrealized appreciation (depreciation) of investments | | | 108,221,548 | | | | (291,958,175 | ) | |
| Net increase (decrease) in net assets resulting from operations | | | 84,695,282 | | | | (335,681,054 | ) | |
| From Fund Share Transactions (Note D): | |
| Proceeds from shares sold: | |
| Class I | | | 9,223,332 | | | | 22,276,953 | | |
| Class S | | | 6,171,251 | | | | 18,104,007 | | |
| Payments for shares redeemed: | |
| Class I | | | (194,245,844 | ) | | | (191,291,779 | ) | |
| Class S | | | (12,485,211 | ) | | | (17,524,090 | ) | |
| Net increase (decrease) from Fund share transactions | | | (191,336,472 | ) | | | (168,434,909 | ) | |
| Net Increase (Decrease) in Net Assets | | | (106,641,190 | ) | | | (504,115,963 | ) | |
| Net Assets: | |
| Beginning of year | | | 383,850,665 | | | | 887,966,628 | | |
| End of year | | $ | 277,209,475 | | | $ | 383,850,665 | | |
| Undistributed net investment income (loss) at end of year | | $ | -- | | | $ | (7,876 | ) | |
See Notes to Financial Statements 13
Notes to Financial Statements Mid-Cap Growth Portfolio
Note A--Summary of Significant Accounting Policies:
1 General: The Fund is a separate operating series of Neuberger Berman Advisers Management Trust (the "Trust"), a Delaware statutory trust organized pursuant to a Trust Instrument dated May 23, 1994. The Trust is currently comprised of ten separate operating series (each a "Series," collectively, the "Funds") each of which is diversified. The Trust is registered as an open-end management investment company under the Investment Company Act of 1940, as amended (the "1940 Act"), and its shares are registered under the Securities Act of 1933, as amended. The Fund currently offers Class I and Class S shares. The Board may establish additional series or classes of shares without the approval of shareholders.
The assets of each Series belong only to that Series, and the liabilities of each Series are borne solely by that Series and no other.
The preparation of financial statements in accordance with U.S. generally accepted accounting principles requires Management to make estimates and assumptions at the date of the financial statements. Actual results could differ from those estimates.
2 Portfolio valuation: Investment securities are valued as indicated in the notes following the Schedule of Investments.
3 Foreign currency translation: The accounting records of the Fund are maintained in U.S. dollars. Foreign currency amounts are currently translated into U.S. dollars using the exchange rates as of 4:00 p.m., Eastern time, to determine the value of investments, other assets and liabilities. Purchase and sale prices of securities, and income and expenses, are translated into U.S. dollars at the prevailing rate of exchange on the respective dates of such transactions. Net unrealized foreign currency gain (loss), if any, arises from changes in the value of assets and liabilities, other than investments in securities, as a result of changes in exchange rates and is stated separately in the Statement of Operations.
4 Securities transactions and investment income: Securities transactions are recorded on trade date for financial reporting purposes. Dividend income is recorded on the ex-dividend date or, for certain foreign dividends, as soon as the Fund becomes aware of the dividends. Non-cash dividends included in dividend income, if any, are recorded at the fair market value of the securities received. Interest income, including accretion of original issue discount, where applicable, and accretion of discount on short-term investments, is recorded on the accrual basis. Realized gains and losses from securities transactions and foreign currency transactions, if any, are recorded on the basis of identified cost and stated separately in the Statement of Operations. Included in net realized gain (loss) on investments are proceeds from the settlements of class action litigation in which the Fund participated as a class member. The amount of such proceeds for the year ended December 31, 2009 was $44,869.
5 Income tax information: The Funds are treated as separate entities for U.S. federal income tax purposes. It is the policy of the Fund to continue to qualify as a regulated investment company by complying with the requirements of Subchapter M of the Internal Revenue Code applicable to regulated investment companies and to distribute substantially all of its earnings to its shareholders. Therefore, no federal income or excise tax provision is required.
The Fund has adopted the provisions of ASC 740 "Income Taxes"("ASC 740"), formerly known as FASB Interpretation No. 48 "Accounting for Uncertainty in Income Taxes -- an interpretation of FASB Statement No. 109." ASC 740 sets forth a minimum threshold for financial statement recognition of the benefit of a tax position taken, or expected to be taken, in a tax return. The Fund recognizes interest and penalties, if any, related to unrecognized tax benefits as an income tax expense in the Statement of Operations. The Fund is subject to examination by U.S. federal and state tax authorities for returns filed for the prior three fiscal years 2006 - 2008. As of December 31, 2009, the Fund did not have any unrecognized tax benefits.
14
Income distributions and capital gain distributions are determined in accordance with income tax regulations, which may differ from U.S. generally accepted accounting principles. These differences are primarily due to differing treatments of income and gains on various investment securities held by the Fund, timing differences and differing characterization of distributions made by the Fund as a whole. The Fund may also utilize earnings and profits distributed to shareholders on redemption of shares as a part of the dividends paid deduction for income tax purposes.
As determined on December 31, 2009, permanent differences resulting primarily from different book and tax accounting for net operating losses, foreign currency gains and losses, expiration of capital loss carryforwards, redemptions in kind and partnership basis adjustments were reclassified at fiscal year-end. These reclassifications had no effect on net income, net asset value or net asset value per share of the Fund.
As of December 31, 2009, the components of distributable earnings (accumulated losses) on a U.S. federal income tax basis were as follows:
Unrealized
Appreciation
(Depreciation) | | Loss
Carryforwards
and Deferrals | | Total | |
| $ | 74,956,883 | | | $ | (195,020,853 | ) | | $ | (120,063,970 | ) | |
The difference between book basis and tax basis distributable earnings is attributable primarily to timing differences of wash sales, partnership basis adjustments and capital loss carryforwards.
To the extent the Fund's net realized capital gains, if any, can be offset by capital loss carryforwards, it is the policy of the Fund not to distribute such gains. As determined at December 31, 2009, the Fund had unused capital loss carryforwards available for federal income tax purposes to offset net realized capital gains, if any, as follows:
| | | Expiring in: | |
| | | 2010 | | 2011 | | 2016 | | 2017 | |
| | | $ | 113,423,118 | | | $ | 11,059,422 | | | $ | 21,770,564 | | | $ | 48,767,749 | | |
Under current tax law, the use of these losses to offset future gains may be limited.
The Fund had $1,485,097 of capital loss carryforwards that expired during the year ended December 31, 2009.
6 Distributions to shareholders: The Fund may earn income, net of expenses, daily on its investments. Distributions from net investment income and net realized capital gains, if any, generally are distributed in October. Income distributions and capital gain distributions to shareholders are recorded on the ex-date.
7 Foreign taxes: Foreign taxes withheld represent amounts withheld by foreign tax authorities, net of refunds recoverable.
8 Expense allocation: Certain expenses are applicable to multiple funds. Expenses directly attributable to a Series are charged to that Series. Expenses of the Trust that are not directly attributed to a Series are allocated among the Funds, on the basis of relative net assets, except where a more appropriate allocation of expenses to each of the Funds can otherwise be made fairly. Expenses borne by the complex of related investment companies, which includes open-end and closed-end investment companies for which Management serves as investment manager, that are not directly attributed to a Series or the Trust are allocated among the Fund and the other investment companies in the complex or series thereof on the basis of relative net assets, except where a more appropriate allocation of expenses to each investment company in the complex or series thereof can otherwise be made fairly. The Fund's expenses (other than those specific to each class) are allocated proportionally each day between the classes based upon the relative net assets of each class.
9 Security lending: A third party, eSecLending, currently serves as exclusive lending agent for the Fund. eSecLending, as agent, has assisted the Fund in conducting bidding processes to try to identify a principal that would pay a guaranteed amount to the Fund in consideration of the Fund entering into an exclusive securities lending
15
arrangement. During most of the Fund's fiscal year, the Fund was guaranteed a particular level of income from a principal. As a result of a bidding process on October 1, 2009, no principal currently has an exclusive arrangement with the Fund and the Fund is no longer guaranteed a particular level of income.
Under the securities lending arrangement, the Fund receives cash collateral at the beginning of each transaction equal to at least 102% of the prior day's market value of the loaned securities (105% in the case of international securities). The Fund may invest all the cash collateral in Neuberger Berman Securities Lending Quality Fund, LLC ("Quality Fund"), a fund managed by Neuberger Berman Fixed Income LLC (formerly known as Lehman Brothers Asset Management LLC) ("NBFI"), an affiliate of Management. Effective July 1, 2009, Dwight Asset Management Company LLC became the Sub-Adviser to the Quality Fund. The Quality Fund is not a money market fund that is registered under the 1940 Act and does not operate in accordance with all requirements of Rule 2a-7 under the 1940 Act. There is no assurance that the Quality Fund will maintain a $1.00 share price.
The market value of the Fund's investments in the Quality Fund as of the fiscal year ended December 31, 2009, if any, is reflected in the Fund's Schedule of Investments. If it were necessary to liquidate assets in the Quality Fund to meet returns on outstanding securities loans at a time when the Quality Fund's price per share was less than $1.00, the Fund may not receive an amount from the Quality Fund that is equal in amount to the collateral the Fund would be required to return to the borrower of the securities and the Fund would be required to make up for this shortfall. In addition, as a result of recent reduced liquidity in the credit and fixed income markets, it may be difficult to dispose quickly of some securities in the Quality Fund at the price at which the Quality Fund is carrying them.
Net income from the lending program represents any amounts received from a principal plus income earned on the cash collateral invested in Quality Fund or in other investments, if applicable, less cash collateral fees and other expenses associated with the loans. For the fiscal year ended December 31, 2009, the Fund received net income under the securities lending arrangement of approximately $808,023, which is reflected in the Statement of Operations under the caption "Income from securities loaned -- net." For the fiscal year ended December 31, 2009, "Income from securities loaned -- net" consisted of approximately $1,521,344 in income earned on cash collateral and amounts received from a principal (including approximately $1,304,847 of interest income earned from the Quality Fund), less fees and expenses paid of approximately $713,321.
10 Repurchase agreements: The Fund may enter into repurchase agreements with institutions that Management has determined are creditworthy. Each repurchase agreement is recorded at cost. The Fund requires that the securities purchased in a repurchase agreement be transferred to the custodian in a manner sufficient to enable the Fund to assert a perfected security interest in those securities in the event of a default under the repurchase agreement. The Fund monitors, on a daily basis, the value of the securities transferred to ensure that their value, including accrued interest, is greater than amounts owed to the Fund under each such repurchase agreement.
11 Transactions with other funds managed by Neuberger Berman Management LLC: Pursuant to an Exemptive Order issued by the Securities and Exchange Commission, the Fund may invest in a money market fund managed by Management or an affiliate. Through August 10, 2009, the Fund invested in Neuberger Berman Prime Money Fund ("Prime Money"), as approved by the Board. Prime Money sought to provide the highest available current income consistent with safety and liquidity. For any cash that the Fund invested in Prime Money, Management waived a portion of its management fee equal to the management fee it received from Prime Money on those assets (the "Arrangement"). For the year ended December 31, 2009, management fees waived under this Arrangement amounted to $1,152 and are reflected in the Statement of Operations under the caption "Investment management fees waived." For the year ended December 31, 2009, income earned under this Arrangement amounted to $3,585 and is reflected in the Statement of Operations under the caption "Income from investments in affiliated issuers."
On August 10, 2009, the Fund ceased investing in Prime Money. On this date, the Fund's shares of Prime Money were redeemed in exchange for portfolio holdings of Prime Money, which were used to purchase Institutional Class shares of State Street Institutional Liquid Reserves Fund.
16
12 Investments in foreign securities: Investing in foreign securities may involve certain sovereign and other risks, in addition to the credit and market risks normally associated with domestic securities. These additional risks include the possibility of adverse political and economic developments (including political instability, nationalization, expropriation, or confiscatory taxation) and the potentially adverse effects of unavailability of public information regarding issuers, less governmental supervision and regulation of financial markets, reduced liquidity of certain financial markets, and the lack of uniform accounting, auditing, and financial reporting standards or the application of standards that are different or less stringent than those applied in the United States. Foreign securities also may experience greater price volatility, higher rates of inflation, and delays in settlement.
13 Derivative instruments: Management has evaluated the requirements of ASC 815 "Disclosures about Derivative Instruments and Hedging Activities" ("ASC 815"), formerly known as FASB Statement of Financial Accounting Standards No. 161, "Disclosures about Derivative Instruments and Hedging Activities," which are effective for financial statements issued for fiscal years and interim periods beginning after November 15, 2008. ASC 815 requires enhanced disclosures about a fund's derivative and hedging activities. Management has concluded that, since the Fund did not hold any derivative instruments during the year ended December 31, 2009, no additional disclosures pursuant to ASC 815 are required at this time.
14 Indemnifications: Like many other companies, the Trust's organizational documents provide that its officers and trustees are indemnified against certain liabilities arising out of the performance of their duties to the Trust. In addition, both in some of its principal service contracts and in the normal course of its business, the Trust enters into contracts that provide indemnifications to other parties for certain types of losses or liabilities. The Trust's maximum exposure under these arrangements is unknown as this could involve future claims against the Trust.
15 Other: All net investment income and realized and unrealized capital gains and losses of the Fund are allocated, on the basis of relative net assets, pro rata among its respective classes.
Note B--Management Fees, Administration Fees, Distribution Arrangements, and Other Transactions With Affiliates:
Fund shares are issued and redeemed in connection with investments in and payments under certain variable annuity contracts and variable life insurance policies issued through separate accounts of life insurance companies and are also offered directly to qualified pension and retirement plans.
The Fund retains Management as its investment manager under a Management Agreement. For such investment management services, the Fund pays Management a fee at the annual rate of 0.55% of the first $250 million of the Fund's average daily net assets, 0.525% of the next $250 million, 0.50% of the next $250 million, 0.475% of the next $250 million, 0.45% of the next $500 million, 0.425% of the next $2.5 billion, and 0.40% of average daily net assets in excess of $4 billion.
The Fund retains Management as its administrator under an Administration Agreement. Each class pays Management an administration fee at the annual rate of 0.30% of its average daily net assets under this agreement. Additionally, Management retains State Street Bank and Trust Company ("State Street") as its sub-administrator under a Sub-Administration Agreement. Management pays State Street a fee for all services received under this agreement.
The Board adopted a non-fee distribution plan for the Fund's Class I.
For the Fund's Class S, Management acts as agent in arranging for the sale of class shares without commission and bears advertising and promotion expenses. The Board has adopted a distribution plan (the "Plan") with respect to this class, pursuant to Rule 12b-1 under the 1940 Act. The Plan provides that, as compensation for administrative and other services provided to this class, Management's activities and expenses related to the sale and distribution of this class of shares, and ongoing services provided to investors in this class, Management receives from this class a fee at the annual rate of 0.25% of Class S's average daily net assets. Management receives this amount to provide
17
distribution and shareholder servicing for this class and pays a portion of it to institutions that provide such services. Those institutions may use the payments for, among other purposes, compensating employees engaged in sales and/or shareholder servicing. The amount of fees paid by this class during any year may be more or less than the cost of distribution and other services provided to this class. FINRA rules limit the amount of annual distribution fees that may be paid by a mutual fund and impose a ceiling on the cumulative distribution fees paid. The Trust's Plan complies with those rules.
Management has contractually undertaken through December 31, 2012 to forgo current payment of fees and/or reimburse the Fund's Class I and Class S shares for their operating expenses (excluding fees payable to Management (including the fees payable to Management with respect to the Fund's Class S shares), interest, taxes, brokerage commissions, extraordinary expenses, and transaction costs) ("Operating Expenses") which exceed the expense limitation as detailed in the following table:
| | | Expense Limitation(1) | | Expiration | | Reimbursement from
Management for the
Year Ended
December 31, 2009 | |
| Class I | | | 1.00 | % | | | 12/31/12 | | | $ | -- | | |
| Class S | | | 1.25 | % | | | 12/31/12 | | | | 6,114 | | |
(1) Expense limitation per annum of the respective class' average daily assets.
The Fund's Class I and Class S shares each have agreed to repay Management through December 31, 2015 for fees and expenses foregone and/or their excess Operating Expenses previously reimbursed by Management, so long as their annual Operating Expenses during that period do not exceed their Expense Limitation, and the repayments are made within three years after the year in which Management issued the reimbursement or waived fees. During the year ended December 31, 2009, there was no repayment to Management under these agreements. At December 31, 2009, the Fund's Class I shares had no contingent liability to Management under these agreements.
At December 31, 2009, the Fund's Class S shares contingent liabilities to Management under this agreement were as follows:
| | | Expiring in: | |
| | | 2012 | |
| Class S | | $ | 6,114 | | |
Neuberger Berman LLC (formerly known as Neuberger Berman, LLC) ("Neuberger") is retained by Management to furnish it with investment recommendations and research information without added cost to the Fund. Several individuals who are officers and/or trustees of the Trust are also employees of Neuberger and/or Management.
During the reporting period, the predecessor of Management, the investment manager of the Fund, and Neuberger, the sub-adviser of the Fund, were wholly owned subsidiaries of Lehman Brothers Holdings Inc. ("Lehman Brothers"), a publicly owned holding company. On September 15, 2008, Lehman Brothers filed a voluntary petition under Chapter 11 of the U.S. Bankruptcy Code. On December 3, 2008, NBSH Acquisition, LLC ("NBSH"), an entity organized by key members of Neuberger Berman's senior management, was selected as the successful bidder in the public auction to acquire a majority interest in Neuberger Berman's business and the fixed income and certain alternative asset management businesses of Lehman Brothers' Investment Management Division (together with Neuberger Berman, the "Acquired Businesses") (the "Acquisition"). On December 22, 2008, the bankruptcy court having jurisdiction over the Lehman Brothers matter approved the sale of the Acquired Businesses to NBSH (or its successor or assign), as the successful bidder.
The Acquisition closed on May 4, 2009. The Acquired Businesses are now indirectly owned by, among others, portfolio managers, Neuberger Berman's management team, and certain key members and senior professionals
18
who are employed in various parts of the Neuberger Berman complex of companies, with a minority interest retained by Lehman Brothers and certain affiliates of Lehman Brothers.
The closing of the Acquisition resulted in an "assignment" of the Fund's Management Agreement and Sub-Advisory Agreement. Such an assignment, by law, automatically terminated those agreements. Accordingly, prior to the closing, the Board, including the Trustees who are not "interested persons" of the Fund's investment manager and its affiliates or the Fund, considered and approved a new Management Agreement and Sub-Advisory Agreement for the Fund. The new agreements, which are virtually identical to those previously in effect, were also approved by a vote of the Fund's shareholders.
These events have not had a material impact on the Fund or its operations. Management and Neuberger continue to operate in the ordinary course of business as the investment manager and sub-adviser of the Fund.
The Fund has an expense offset arrangement in connection with its custodian contract. For the year ended December 31, 2009, the impact of this arrangement was a reduction of expenses of $13.
Note C--Securities Transactions:
During the year ended December 31, 2009, there were purchase and sale transactions (excluding short-term securities) of $214,327,244 and $401,743,895, respectively.
During the year ended December 31, 2009, no brokerage commissions on securities transactions were paid to affiliated brokers.
Note D--Fund Share Transactions:
Share activity for the years ended December 31, 2009 and December 31, 2008 was as follows:
For the Year Ended December 31, 2009
| | | Shares Sold | | Shares Redeemed | | Total | |
| Class I | | | 542,645 | | | | (10,913,134 | ) | | | (10,370,489 | ) | |
| Class S | | | 362,763 | | | | (732,753 | ) | | | (369,990 | ) | |
For the Year Ended December 31, 2008
| | | Shares Sold | | Shares Redeemed | | Total | |
| Class I | | | 986,584 | | | | (8,337,898 | ) | | | (7,351,314 | ) | |
| Class S | | | 764,631 | | | | (778,104 | ) | | | (13,473 | ) | |
Note E--Line of Credit:
At December 31, 2009, the Fund was a participant in a single committed, unsecured $150,000,000 line of credit with State Street, to be used only for temporary or emergency purposes. Other investment companies managed by Management also participate in this line of credit on the same terms. Interest is charged on borrowings under this line of credit at the higher of (a) the Federal Funds Rate plus 1.25% per annum or (b) the Overnight LIBOR Rate plus 1.25% per annum. Prior to September 18, 2009, interest was charged on borrowings under this line of credit at the Federal Funds Rate plus 0.50% per annum. A facility fee of 0.15% (prior to September 18, 2009, 0.09%) per annum of the available line of credit is charged, of which the Fund has agreed to pay its pro rata share, based on the ratio of its individual net assets to the net assets of all participants at the time the fee is due and payable. The fee is paid quarterly in arrears. Because several investment companies participate, there is no assurance that an individual Fund will have access to all or any part of the $150,000,000 at any particular time. There were no loans outstanding pursuant to this line of credit at December 31, 2009. During the year ended December 31, 2009, the Fund did not utilize this line of credit.
19
Note F--Investments in Affiliates:
| Name of Issuer | | Balance of
Shares
Held
December 31,
2008 | | Gross
Purchases
and
Additions | | Gross
Sales
and
Reductions | | Balance of
Shares
Held
December 31,
2009 | | Value
December 31,
2009 | | Income from
Investments in
Affiliated
Issuers
Included in
Total Income | |
Neuberger Berman Prime
Money Fund Trust Class* | | | 4,810,992 | | | | 50,890,229 | | | | 55,701,221 | | | | -- | | | $ | -- | | | $ | 3,585 | | |
Neuberger Berman Securities
Lending Quality Fund, LLC** | | | 133,436,828 | | | | 293,765,818 | | | | 417,976,321 | | | | 9,226,325 | | | | 9,410,851 | | | | 1,304,847 | | |
| Total | | | | | | | | | | $ | 9,410,851 | | | $ | 1,308,432 | | |
* Prime Money was also managed by Management and may have been considered an affiliate since it had the same officers, Board members, and investment manager as the Fund and because, at times, the Fund may have owned 5% or more of the outstanding voting securities of Prime Money.
** Quality Fund, a fund managed by NBFI, an affiliate of Management, is used to invest cash the Fund receives as collateral for securities loaned as approved by the Board. Because all shares of Quality Fund are held by funds in the related investment management complex, Quality Fund may be considered an affiliate of the Fund.
Note G--Subsequent Events:
In accordance with the provision set forth in ASC 855 "Subsequent Events" ("ASC 855") formerly known as FAS 165, "Subsequent Events," Management has evaluated the possibility of subsequent events existing in the Fund's financial statements through February 9, 2010. Management has determined that there are no subsequent events that, in accordance with ASC 855, would need to be disclosed in the Fund's financial statements through this date.
20
Financial Highlights
Mid-Cap Growth Portfolio
The following tables include selected data for a share outstanding throughout each year and other performance information derived from the Financial Statements.
| Class I | |
| | | Year Ended December 31, | |
| | | 2009 | | 2008 | | 2007 | | 2006 | | 2005 | |
| Net Asset Value, Beginning of Year | | $ | 16.14 | | | $ | 28.50 | | | $ | 23.26 | | | $ | 20.28 | | | $ | 17.83 | | |
| Income From Investment Operations: | |
| Net Investment Income (Loss)tt | | | (.03 | ) | | | (.12 | ) | | | (.05 | ) | | | (.02 | ) | | | (.07 | ) | |
Net Gains or Losses on Securities
(both realized and unrealized) | | | 5.14 | | | | (12.24 | ) | | | 5.29 | | | | 3.00 | | | | 2.52 | | |
| Total From Investment Operations | | | 5.11 | | | | (12.36 | ) | | | 5.24 | | | | 2.98 | | | | 2.45 | | |
| Net Asset Value, End of Year | | $ | 21.25 | | | $ | 16.14 | | | $ | 28.50 | | | $ | 23.26 | | | $ | 20.28 | | |
| Total Returntt | | | 31.66 | % | | | (43.37 | )% | | | 22.53 | % | | | 14.69 | % | | | 13.74 | % | |
| Ratios/Supplemental Data | |
| Net Assets, End of Year (in millions) | | $ | 234.1 | | | $ | 345.1 | | | $ | 819.0 | | | $ | 668.1 | | | $ | 622.0 | | |
| Ratio of Gross Expenses to Average Net Assets# | | | 1.01 | % | | | .92 | % | | | .88 | % | | | .90 | % | | | .92 | % | |
| Ratio of Net Expenses to Average Net AssetsS | | | 1.01 | % | | | .92 | % | | | .88 | % | | | .90 | % | | | .91 | % | |
Ratio of Net Investment Income (Loss) to Average
Net Assets | | | (.16 | )% | | | (.51 | )% | | | (.20 | )% | | | (.10 | )% | | | (.36 | )% | |
| Portfolio Turnover Rate | | | 67 | % | | | 62 | % | | | 56 | % | | | 48 | % | | | 64 | % | |
See Notes to Financial Highlights 21
Financial Highlights (cont'd)
| Class S | |
| | | Year Ended December 31, | |
| | | 2009 | | 2008 | | 2007 | | 2006 | | 2005 | |
| Net Asset Value, Beginning of Year | | $ | 15.89 | | | $ | 28.13 | | | $ | 23.02 | | | $ | 20.11 | | | $ | 17.73 | | |
| Income From Investment Operations: | |
| Net Investment Income (Loss)tt | | | (.08 | ) | | | (.17 | ) | | | (.12 | ) | | | (.08 | ) | | | (.11 | ) | |
Net Gains or Losses on Securities
(both realized and unrealized) | | | 5.06 | | | | (12.07 | ) | | | 5.23 | | | | 2.99 | | | | 2.49 | | |
| Total From Investment Operations | | | 4.98 | | | | (12.24 | ) | | | 5.11 | | | | 2.91 | | | | 2.38 | | |
| Net Asset Value, End of Year | | $ | 20.87 | | | $ | 15.89 | | | $ | 28.13 | | | $ | 23.02 | | | $ | 20.11 | | |
| Total Returntt | | | 31.34 | % | | | (43.51 | )% | | | 22.20 | % | | | 14.47 | % | | | 13.42 | % | |
| Ratios/Supplemental Data | |
| Net Assets, End of Year (in millions) | | $ | 43.2 | | | $ | 38.7 | | | $ | 68.9 | | | $ | 35.6 | | | $ | 22.8 | | |
| Ratio of Gross Expenses to Average Net Assets# | | | 1.25 | % | | | 1.18 | % | | | 1.14 | % | | | 1.15 | % | | | 1.18 | % | |
| Ratio of Net Expenses to Average Net AssetsS | | | 1.25 | % | | | 1.17 | % | | | 1.13 | % | | | 1.15 | % | | | 1.16 | % | |
Ratio of Net Investment Income (Loss) to Average
Net Assets | | | (.44 | )% | | | (.77 | )% | | | (.47 | )% | | | (.36 | )% | | | (.61 | )% | |
| Portfolio Turnover Rate | | | 67 | % | | | 62 | % | | | 56 | % | | | 48 | % | | | 64 | % | |
See Notes to Financial Highlights 22
Notes to Financial Highlights Mid-Cap Growth Portfolio
tt Total return based on per share net asset value reflects the effects of changes in net asset value on the performance of the Fund during each fiscal period and assumes dividends and other distributions, if any, were reinvested. Results represent past performance and do not guarantee future results. Current returns may be lower or higher than the performance data quoted. Investment returns and principal may fluctuate and shares when redeemed may be worth more or less than original cost. Total return would have been lower if Management had not reimbursed and/or waived certain expenses. The total return information shown does not reflect charges and other expenses that apply to the separate account or the related insurance policies, and the inclusion of these charges and other expenses would reduce the total return for all fiscal periods shown.
# The Fund is required to calculate an expense ratio without taking into consideration any expense reductions related to expense offset arrangements.
S After reimbursement of expenses and/or waiver of a portion of the investment management fee by Management. Had Management not undertaken such actions, the annualized ratios of net expenses to average daily net assets would have been:
| | | Year Ended December 31, | |
| | | 2009 | | 2008 | | 2007 | | 2006 | | 2005 | |
| Mid-Cap Growth Portfolio Class I | | | 1.01 | % | | | .92 | % | | | .88 | % | | | .90 | % | | | .92 | % | |
| Mid-Cap Growth Portfolio Class S | | | 1.27 | % | | | 1.17 | % | | | 1.13 | % | | | 1.15 | % | | | 1.17 | % | |
tt Calculated based on the average number of shares outstanding during each fiscal period.
23
Report of Independent Registered Public Accounting Firm
To the Board of Trustees of
Neuberger Berman Advisers Management Trust and
Shareholders of Mid-Cap Growth Portfolio
We have audited the accompanying statement of assets and liabilities, including the schedule of investments, of Mid-Cap Growth Portfolio, one of the series constituting Neuberger Berman Advisers Management Trust (the "Trust"), as of December 31, 2009, and the related statement of operations for the year then ended, the statement of changes in net assets for each of the two years in the period then ended, and the financial highlights for each of the five years in the period then ended. These financial statements and financial highlights are the responsibility of the Trust's management. Our responsibility is to express an opinion on these financial statements and financial highlights based on our audits.
We conducted our audits in accordance with the standards of the Public Company Accounting Oversight Board (United States). Those standards require that we plan and perform the audit to obtain reasonable assurance about whether the financial statements and financial highlights are free of material misstatement. We were not engaged to perform an audit of the Trust's internal control over financial reporting. Our audits included consideration of internal control over financial reporting as a basis for designing audit procedures that are appropriate in the circumstances, but not for the purpose of expressing an opinion on the effectiveness of the Trust's internal control over financial reporting. Accordingly, we express no such opinion. An audit also includes examining, on a test basis, evidence supporting the amounts and disclosures in the financial statements and financial highlights, assessing the accounting principles used and significant estimates made by management, and evaluating the overall financial statement presentation. Our procedures included confirmation of securities owned as of December 31, 2009 by correspondence with the custodian and brokers. We believe that our audits provide a reasonable basis for our opinion.
In our opinion, the financial statements and financial highlights referred to above present fairly, in all material respects, the financial position of Mid-Cap Growth Portfolio, a series of Neuberger Berman Advisers Management Trust, at December 31, 2009, the results of its operations for the year then ended, the changes in its net assets for each of the two years in the period then ended, and the financial highlights for each of the five years in the period then ended, in conformity with U.S. generally accepted accounting principles.
Boston, Massachusetts
February 9, 2010
24
Trustee and Officer Information
The following tables set forth information concerning the trustees and officers of the Trust. All persons named as trustees and officers also serve in similar capacities for other funds administered or managed by Management and Neuberger. The Statement of Additional Information includes additional information about fund trustees and is available upon request, without charge, by calling (800) 877-9700.
Information about the Board of Trustees
Name, (Year of Birth),
and Address(1) | | Position and
Length of
Time Served(2) | | Principal Occupation(s)(3) | | Number of
Funds in Fund
Complex
Overseen by
Fund Trustee | | Other Directorships
Held Outside Fund
Complex by Fund
Trustee | |
| Independent Fund Trustees | |
|
| John Cannon (1930) | | Trustee since 2000 | | Consultant; formerly, Chairman, CDC Investment Advisers (registered investment adviser), 1993 to January 1999; formerly, President and Chief Executive Officer, AMA Investment Advisors, an affiliate of the American Medical Association. | | | 46 | | | Formerly, Independent Trustee or Director of three series of Oppenheimer Funds: Oppenheimer Limited Term New York Municipal Fund, Rochester Fund Municipals, and Oppenheimer Convertible Securities Fund (1992 to 2009). | |
|
| Faith Colish (1935) | | Trustee since 1982 | | Counsel, Carter Ledyard & Milburn LLP (law firm) since October 2002; formerly, Attorney-at-Law and President, Faith Colish, A Professional Corporation, 1980 to 2002. | | | 46 | | | Formerly, Director (1997 to 2003) and Advisory Director (2003 to 2006), ABA Retirement Funds (formerly, American Bar Retirement Association) (not-for-profit membership corporation). | |
|
25
Name, (Year of Birth),
and Address(1) | | Position and
Length of
Time Served(2) | | Principal Occupation(s)(3) | | Number of
Funds in Fund
Complex
Overseen by
Fund Trustee | | Other Directorships
Held Outside Fund
Complex by Fund
Trustee | |
| Martha C. Goss (1949) | | Trustee since 2007 | | President, Woodhill Enterprises Inc./Chase Hollow Associates LLC (personal investment vehicle), since 2006; Chief Operating and Financial Officer, Hopewell Holdings LLC/Amwell Holdings, LLC (a holding company for a healthcare reinsurance company start-up), since 2003; formerly, Consultant, Resources Connection (temporary staffing), 2002 to 2006. | | | 46 | | | Director, Ocwen Financial Corporation (mortgage servicing), since 2005; Director, American Water (water utility), since 2003; Director, Channel Reinsurance (financial guaranty reinsurance), since 2006; Advisory Board Member, Attensity (software developer), since 2005; Director, Allianz Life of New York (insurance), since 2005; Director, Financial Women's Association of New York (not for profit association), since 2003; Trustee Emerita, Brown University, since 1998. | |
|
| C. Anne Harvey (1937) | | Trustee since 1998 | | President, C.A. Harvey Associates, since October 2001; formerly, Director, AARP, 1978 to December 2001. | | | 46 | | | Formerly, President, Board of Associates to The National Rehabilitation Hospital's Board of Directors, 2001 to 2002; formerly, Member, Individual Investors Advisory Committee to the New York Stock Exchange Board of Directors, 1998 to June 2002. | |
|
| Robert A. Kavesh (1927) | | Trustee since 2000 | | Retired; Marcus Nadler Professor Emeritus of Finance and Economics, New York University Stern School of Business; formerly, Executive Secretary-Treasurer, American Finance Association, 1961 to 1979. | | | 46 | | | Formerly, Director, The Caring Community (not-for-profit), 1997 to 2006; formerly, Director, DEL Laboratories, Inc. (cosmetics and pharmaceuticals), 1978 to 2004; formerly, Director, Apple Bank for Savings, 1979 to 1990; formerly, Director, Western Pacific Industries, Inc., 1972 to 1986 (public company). | |
|
26
Name, (Year of Birth),
and Address(1) | | Position and
Length of
Time Served(2) | | Principal Occupation(s)(3) | | Number of
Funds in Fund
Complex
Overseen by
Fund Trustee | | Other Directorships
Held Outside Fund
Complex by Fund
Trustee | |
| Michael M. Knetter (1960) | | Trustee since 2007 | | Dean, School of Business, University of Wisconsin - Madison; formerly, Professor of International Economics and Associate Dean, Amos Tuck School of Business - Dartmouth College, 1998 to 2002. | | | 46 | | | Trustee, Northwestern Mutual Series Fund, Inc., since February 2007; Director, Wausau Paper, since 2005; Director, Great Wolf Resorts, since 2004. | |
|
| Howard A. Mileaf (1937) | | Trustee since 1999 | | Retired; formerly, Vice President and General Counsel, WHX Corporation (holding company), 1993 to 2001. | | | 46 | | | Formerly, Director, Webfinancial Corporation (holding company), 2002 to 2008; formerly, Director WHX Corporation (holding company), January 2002 to June 2005; formerly, Director, State Theatre of New Jersey (not-for-profit theater), 2000 to 2005. | |
|
| George W. Morriss (1947) | | Trustee since 2007 | | Retired; formerly, Executive Vice President and Chief Financial Officer, People's Bank, Connecticut (a financial services company), 1991 to 2001. | | | 46 | | | Manager, Old Mutual 2100 fund complex (consisting of six funds) since October 2006 for four funds and since February 2007 for two funds; formerly, Member NASDAQ Issuers' Affairs Committee, 1995 to 2003. | |
|
| Edward I. O'Brien (1928) | | Trustee since 2000 | | Retired; Formerly, Member, Investment Policy Committee, Edward Jones, 1993 to 2001; President, Securities Industry Association ("SIA") (securities industry's representative in government relations and regulatory matters at the federal and state levels), 1974 to 1992; Adviser to SIA, November 1992 to November 1993. | | | 46 | | | Formerly, Director, Legg Mason, Inc. (financial services holding company), 1993 to July 2008; formerly, Director, Boston Financial Group (real estate and tax shelters), 1993 to 1999. | |
|
27
Name, (Year of Birth),
and Address(1) | | Position and
Length of
Time Served(2) | | Principal Occupation(s)(3) | | Number of
Funds in Fund
Complex
Overseen by
Fund Trustee | | Other Directorships
Held Outside Fund
Complex by Fund
Trustee | |
| Cornelius T. Ryan (1931) | | Trustee since 2000 | | Founding General Partner, Oxford Partners and Oxford Bioscience Partners (venture capital investing) and President, Oxford Venture Corporation, since 1981. | | | 46 | | | None. | |
|
| Tom D. Seip (1950) | | Trustee since 2000; Chairman of the Board since 2008; Lead Independent Trustee from 2006 to 2008 | | General Partner, Seip Investments LP (a private investment partnership); formerly, President and CEO, Westaff, Inc. (temporary staffing), May 2001 to January 2002; formerly, Senior Executive at the Charles Schwab Corporation, 1983 to 1998, including Chief Executive Officer, Charles Schwab Investment Management, Inc., and Trustee, Schwab Family of Funds and Schwab Investments, 1997 to 1998, and Executive Vice President-Retail Brokerage, Charles Schwab & Co., Inc., 1994 to 1997. | | | 46 | | | Director, H&R Block, Inc. (financial services company), since May 2001; Chairman, Compensation Committee, H&R Block, Inc., since 2006; formerly, Director, Forward Management, Inc. (asset management company), 1999 to 2006. | |
|
28
Name, (Year of Birth),
and Address(1) | | Position and
Length of
Time Served(2) | | Principal Occupation(s)(3) | | Number of
Funds in Fund
Complex
Overseen by
Fund Trustee | | Other Directorships
Held Outside Fund
Complex by Fund
Trustee | |
| Candace L. Straight (1947) | | Trustee since 1999 | | Private investor and consultant specializing in the insurance industry; formerly, Advisory Director, Securitas Capital LLC (a global private equity investment firm dedicated to making investments in the insurance sector), 1998 to December 2003. | | | 46 | | | Director, Montpelier Re (reinsurance company), since 2006; formerly, Director, National Atlantic Holdings Corporation (property and casualty insurance company), 2004 to 2008; formerly, Director, The Proformance Insurance Company (property and casualty insurance company), 2004 to 2008; formerly, Director, Providence Washington Insurance Company (property and casualty insurance company), December 1998 to March 2006; formerly, Director, Summit Global Partners (insurance brokerage firm), 2000 to 2005. | |
|
| Peter P. Trapp (1944) | | Trustee since 1984 | | Retired; formerly, Regional Manager for Mid-Southern Region, Ford Motor Credit Company, September 1997 to 2007; formerly, President, Ford Life Insurance Company, April 1995 to August 1997. | | | 46 | | | None. | |
|
29
Name, (Year of Birth),
and Address(1) | | Position and
Length of
Time Served(2) | | Principal Occupation(s)(3) | | Number of
Funds in Fund
Complex
Overseen by
Fund Trustee | | Other Directorships
Held Outside Fund
Complex by Fund
Trustee | |
| Fund Trustees who are "Interested Persons" | |
|
| Joseph V. Amato* (1962) | | Trustee since 2009 | | President and Director, Neuberger Berman Group LLC, since 2009; President and Chief Executive Officer, Neuberger and Neuberger Berman Holdings LLC (including its predecessor, Neuberger Berman Inc.), since 2007; Chief Investment Officer, Neuberger, since 2009; Chief Executive Officer (Equities) and Managing Director, Management, since 2009; Managing Director, Neuberger Berman Fixed Income LLC ("NBFI"), since 2007; Board member of NBFI since 2006; formerly, Global Head of Asset Management of Lehman Brothers Holdings Inc.'s ("LBHI") Investment Management division, 2006 to 2009; formerly, member of LBHI's Investment Management Division's Executive Management Committee, 2006 to 2009; formerly, Managing Director, Lehman Brothers Inc. ("LBI"), 2006 to 2008; formerly, Chief Recruiting and Development Officer, LBI, 2005 to 2006; formerly, Global Head of LBI's Equity Sales and a Member of its Equities Division Executive Committee, 2003 to 2005. | | | 46 | | | Member of Board of Advisors, McDonough School of Business, Georgetown University, since 2001; Member of New York City Board of Advisors, Teach for America, since 2005; Trustee, Montclair Kimberley Academy (private school), since 2007. | |
|
30
Name, (Year of Birth),
and Address(1) | | Position and
Length of
Time Served(2) | | Principal Occupation(s)(3) | | Number of
Funds in Fund
Complex
Overseen by
Fund Trustee | | Other Directorships
Held Outside Fund
Complex by Fund
Trustee | |
| Robert Conti* (1956) | | Chief Executive Officer, President and Trustee since 2008; prior thereto, Executive Vice President in 2008 and Vice President 2000 to 2008 | | Managing Director, Neuberger, since 2007; formerly, Senior Vice President, Neuberger, 2003 to 2006; formerly, Vice President, Neuberger, 1999 to 2003; President and Chief Executive Officer, Management, since 2008; formerly, Senior Vice President, Management, 2000 to 2008. | | | 46 | | | Chairman of the Board, Staten Island Mental Health Society since 2008. | |
|
| Jack L. Rivkin* (1940) | | Trustee since 2002; President from 2002 to 2008 | | Formerly, Executive Vice President and Chief Investment Officer, Neuberger Berman Holdings LLC (holding company), 2002 to August 2008 and 2003 to August 2008, respectively; formerly, Managing Director and Chief Investment Officer, Neuberger, December 2005 to August 2008 and 2003 to August 2008, respectively; formerly, Executive Vice President, Neuberger, December 2002 to 2005; formerly, Director and Chairman, Management, December 2002 to August 2008; formerly, Executive Vice President, Citigroup Investments, Inc., September 1995 to February 2002; formerly, Executive Vice President, Citigroup Inc., September 1995 to February 2002. | | | 46 | | | Director, Idealab (private company), since 2009; Director, Distributed World Power (private company), since 2009; Director, Dale Carnegie and Associates, Inc. (private company), since 1998; Director, Solbright, Inc. (private company), since 1997; formerly, Director, New York Society of Security Analysts (2006 to 2008). | |
|
(1) The business address of each listed person is 605 Third Avenue, New York, New York 10158.
(2) Pursuant to the Trust's Trust Instrument, each of these Fund Trustees shall hold office for life or until his or her successor is elected or the Trust terminates; except that (a) any Fund Trustee may resign by delivering a written resignation; (b) any Fund Trustee may be removed with or without cause at any time by a written instrument signed by at least two-thirds of the other Fund Trustees; (c) any Fund Trustee who requests to be retired, or who has become unable to serve, may be retired by a written instrument signed by a majority of the other Fund Trustees; and (d) any Fund Trustee may be removed at any shareholder meeting by a vote of at least two-thirds of the outstanding shares.
31
(3) Except as otherwise indicated, each individual has held the positions shown for at least the last five years.
* Indicates a Fund Trustee who is an "interested person" within the meaning of the 1940 Act. Mr. Amato and Mr. Conti are interested persons of the Trust by virtue of the fact that each is an officer of Management, Neuberger and/or their affiliates. Mr. Rivkin may be deemed an interested person of the Trust by virtue of the fact that, until August 2008, he was a director of Management and an officer of Neuberger.
32
Information about the Officers of the Trust
Name, (Year of Birth),
and Address(1) | | Position and
Length of Time
Served(2) | | Principal Occupation(s)(3)
| |
| Andrew B. Allard (1961) | | Anti-Money Laundering Compliance Officer since 2002 | | Senior Vice President, Neuberger, since 2006; Deputy General Counsel, Neuberger, since 2004; formerly, Vice President, Neuberger, 2000 to 2005; formerly, Associate General Counsel, Neuberger, 1999 to 2004; Anti-Money Laundering Compliance Officer, nine registered investment companies for which Management acts as investment manager and administrator (six since 2002, two since 2003 and one since 2006). | |
|
| Claudia A. Brandon (1956) | | Executive Vice President since 2008 and Secretary since 1985 | | Senior Vice President, Neuberger, since 2007 and Employee since 1999; formerly, Vice President, Neuberger, 2002 to 2006; Senior Vice President, Management, since 2008 and Assistant Secretary since 2004; formerly, Vice President-Mutual Fund Board Relations, Management, 2000 to 2008; Executive Vice President, nine registered investment companies for which Management acts as investment manager and administrator (nine since 2008); Secretary, nine registered investment companies for which Management acts as investment manager and administrator (three since 1985, three since 2002, two since 2003 and one since 2006). | |
|
| Maxine L. Gerson (1950) | | Executive Vice President since 2008 and Chief Legal Officer since 2005 (only for purposes of sections 307 and 406 of the Sarbanes-Oxley Act of 2002) | | Senior Vice President, Neuberger, since 2002; Deputy General Counsel and Assistant Secretary, Neuberger, since 2001; Senior Vice President, Management, since 2006; Secretary and General Counsel, Management, since 2004; Executive Vice President, nine registered investment companies for which Management acts as investment manager and administrator (nine since 2008); Chief Legal Officer (only for purposes of sections 307 and 406 of the Sarbanes-Oxley Act of 2002), nine registered investment companies for which Management acts as investment manager and administrator (eight since 2005 and one since 2006). | |
|
| Sheila R. James (1965) | | Assistant Secretary since 2002 | | Vice President, Neuberger, since 2008 and Employee since 1999; formerly, Assistant Vice President, Neuberger, 2007; Assistant Secretary, nine registered investment companies for which Management acts as investment manager and administrator (six since 2002, two since 2003 and one since 2006). | |
|
| Brian Kerrane (1969) | | Vice President since 2008 | | Senior Vice President, Neuberger, since 2006; formerly, Vice President, Neuberger, 2002 to 2006; Vice President, Management, since 2008 and Employee since 1991; Vice President, nine registered investment companies for which Management acts as investment manager and administrator (nine since 2008). | |
|
| Kevin Lyons (1955) | | Assistant Secretary since 2003 | | Assistant Vice President, Neuberger, since 2008 and Employee since 1999; Assistant Secretary, nine registered investment companies for which Management acts as investment manager and administrator (eight since 2003 and one since 2006). | |
|
33
Name, (Year of Birth),
and Address(1) | | Position and
Length of Time
Served(2) | | Principal Occupation(s)(3)
| |
| Owen F. McEntee, Jr. (1961) | | Vice President since 2008 | | Vice President, Neuberger, since 2006; Employee, Management, since 1992; Vice President, nine registered investment companies for which Management acts as investment manager and administrator (nine since 2008). | |
|
| John M. McGovern (1970) | | Treasurer and Principal Financial and Accounting Officer since 2005; prior thereto, Assistant Treasurer since 2002 | | Senior Vice President, Neuberger, since 2007; formerly, Vice President, Neuberger, 2004 to 2006; Employee, Management, since 1993; Treasurer and Principal Financial and Accounting Officer, nine registered investment companies for which Management acts as investment manager and administrator (eight since 2005 and one since 2006); formerly, Assistant Treasurer, eight registered investment companies for which Management acts as investment manager and administrator, 2002 to 2005. | |
|
| Andrew Provencher (1965) | | Vice President since 2008 | | Managing Director, Management, since 2008; Managing Director, Neuberger, since 2005; formerly, Senior Vice President, Neuberger, 2003 to 2005; formerly, Vice President, Neuberger, 1999 to 2003; Vice President, nine registered investment companies for which Management acts as investment manager and administrator (nine since 2008). | |
|
| Frank Rosato (1971) | | Assistant Treasurer since 2005 | | Vice President, Neuberger, since 2006; Employee, Management, since 1995; Assistant Treasurer, nine registered investment companies for which Management acts as investment manager and administrator (eight since 2005 and one since 2006). | |
|
| Neil S. Siegel (1967) | | Vice President since 2008 | | Managing Director, Management, since 2008; Managing Director, Neuberger, since 2006; formerly, Senior Vice President, Neuberger, 2004 to 2006; Vice President, nine registered investment companies for which Management acts as investment manager and administrator (nine since 2008); formerly, Head of Institutional Marketing, Morgan Stanley Investment Management, 1993 to 2004. | |
|
| Chamaine Williams (1971) | | Chief Compliance Officer since 2005 | | Senior Vice President, Neuberger, since 2007; Chief Compliance Officer, Management, since 2006; Chief Compliance Officer, nine registered investment companies for which Management acts as investment manager and administrator (eight since 2005 and one since 2006); formerly, Senior Vice President, LBI, 2007 to 2008; formerly, Vice President, LBI, 2003 to 2006; formerly, Chief Compliance Officer, Lehman Brothers Asset Management Inc., 2003 to 2007; formerly, Chief Compliance Officer, Lehman Brothers Alternative Investment Management LLC, 2003 to 2007; formerly, Vice President, UBS Global Asset Management (US) Inc. (formerly, Mitchell Hutchins Asset Management, a wholly-owned subsidiary of PaineWebber Inc.), 1997 to 2003. | |
|
(1) The business address of each listed person is 605 Third Avenue, New York, New York 10158.
(2) Pursuant to the By-Laws of the Trust, each officer elected by the Fund Trustees shall hold office until his or her successor shall have been elected and qualified or until his or her earlier death, inability to serve, or resignation. Officers serve at the pleasure of the Fund Trustees and may be removed at any time with or without cause.
(3) Except as otherwise indicated, each individual has held the positions shown for at least the last five years.
34
Proxy Voting Policies and Procedures
A description of the policies and procedures that the Trust uses to determine how to vote proxies relating to portfolio securities is available, without charge, by calling 1-800-877-9700 (toll-free) and on the website of the Securities and Exchange Commission, at www.sec.gov. Information regarding how the Trust voted proxies relating to portfolio securities during the most recent 12-month period ended June 30 is also available, without charge, by calling 1-800-877-9700 (toll-free), on the website of the Securities and Exchange Commission at www.sec.gov, and on Management's website at www.nb.com.
Quarterly Portfolio Schedule
The Trust files a complete schedule of portfolio holdings for the Fund with the Securities and Exchange Commission for the first and third quarters of each fiscal year on Form N-Q. The Trust's Forms N-Q are available on the Securities and Exchange Commission's website at www.sec.gov and may be reviewed and copied at the Securities and Exchange Commission's Public Reference Room in Washington, DC. Information on the operation of the Public Reference Room may be obtained by calling 1-800-SEC-0330. The information on Form N-Q is available upon request, without charge, by calling 1-800-877-9700 (toll free).
35
Neuberger Berman
Advisers Management Trust
Partners Portfolio
I Class Shares
Annual Report
December 31, 2009
B1010 02/10
Partners Portfolio Manager's Commentary
We are pleased to report that, for the year ended December 31, 2009, the Neuberger Berman Advisers Management Trust (AMT) Partners Portfolio gained more than 50%, outpacing its Russell 1000(R) Value Index and S&P 500 benchmarks by a wide margin. A collective overweight in more economically sensitive sectors enhanced returns, but stock selection was responsible for the bulk of the Portfolio's return advantage over the Russell 1000(R) Value Index.
The stabilization of the financial system and generally encouraging economic data triggered a strong rally following the stock market lows in early March 2009. All 10 Russell 1000 Value Index sectors posted gains, with two sectors (Information Technology and Materials) returning more than 60% and eight of 10 sectors recording double-digit percentage returns. Materials sector stocks were the strongest performers, followed by Information Technology and Consumer Discretionary. The Energy and Telecommunications sectors posted below-index-average returns.
Our Energy sector investments made the largest contribution to relative return, followed by Materials and Financials sector holdings. Energy sector investments, primarily exploration and production companies and oil services firms, outperformed the corresponding benchmark component by roughly seven times and our Materials sector investments outperformed by four times. Two energy stocks (Petroleo Brasileiro and Canadian Natural Resources) appeared among the top 10 contributors to total return. The Materials sector was represented on the top-10 contributors list by Teck Resources, Freeport-McMoRan Copper & Gold, Walter Energy, and Xstrata. J.P. Morgan Chase was our top Financials sector contributor.
In this strong year, we did not have too many disappointments. Citigroup, beverage company Constellation Brands and power generator FirstEnergy Corp. had the most negative impact on total return. Both Constellation and First Energy were sold.
Our response to the savage bear market that began in the fall of 2007 and finally ended in the spring of 2009 was to take advantage of evolving opportunities in the very best companies in their respective businesses. We successfully added to and built new positions in high quality companies trading at deeply discounted valuations relative to normalized earnings and long-term earnings power. We believe that quality combined with good value was primarily responsible for the Portfolio's strong relative returns for the year.
Duly noting that, for us, sector allocation is primarily a function of where we are finding the most compelling opportunities, collectively the Portfolio still has a pro-cyclical bias with a collective overweight in more economically sensitive sectors (Consumer Discretionary, Energy, Industrials, Information Technology and Materials). We believe our investments in these sectors are still reasonably valued relative to long-term earnings potential and that the high quality of our holdings will help mitigate downside risk.
While economic data are still generally positive and job losses are finally trending lower, the jury is still out regarding the strength and endurance of the economic recovery. The naysayers (and judging by the insatiable demand for U.S. Treasuries, there are plenty of them out there) appear to believe that unless and until we see job growth and a firming of the still-soft housing market, consumer spending will remain weak, restraining economic expansion and perhaps even triggering a "double dip" recession. We have a more balanced view. We think low interest rates and gradually improving credit conditions will help the economy continue to expand, albeit over the near term, at a relatively modest pace. Looking a little farther ahead, our primary concern is when and how the Federal Reserve will transition from its current easy money policy and how the financial markets will react to soaring government expenditures and rapidly expanding federal deficits that we believe will likely result in higher tax rates. We are pleased with the Portfolio's strong absolute and relative performance in 2009. However, we do not expect the equity market to be quite as generous in the year ahead.
1
In closing, we can never be sure what the market has in store for us in the future. We can only work diligently to identify the most fundamentally attractive investments. We believe our strategy of "buying the best for less" will continue to serve our shareholders well in the years ahead.
Sincerely,

S. Basu Mullick
Portfolio Manager
2
Partners Portfolio
SECTOR ALLOCATION
| (% of Equity Market Value) | |
| Consumer Discretionary | | | 10.6 | % | |
| Consumer Staples | | | 6.9 | | |
| Energy | | | 17.8 | | |
| Financials | | | 23.4 | | |
| Health Care | | | 7.5 | | |
| Industrials | | | 15.6 | | |
| Information Technology | | | 9.7 | | |
| Materials | | | 7.5 | | |
| Utilities | | | 1.0 | | |
| Total | | | 100.0 | % | |
AVERAGE ANNUAL TOTAL RETURN1
| | | Inception
Date | | 1 Year | | 5 Years | | 10 Years | | Life of
Fund* | |
| Partners Portolio Class I | | 03/22/1994 | | | 56.23 | % | | | 1.50 | % | | | 2.54 | % | | | 7.77 | % | |
Russell 1000(R) Value
Index2 | | | | | 19.69 | % | | | -0.25 | % | | | 2.47 | % | | | 8.24 | % | |
| S&P 500 Index2 | | | | | 26.46 | % | | | 0.42 | % | | | -0.95 | % | | | 7.64 | % | |
Performance data quoted represent past performance, which is no guarantee of future results. The investment return and principal value of an investment will fluctuate so that an investor's shares, when redeemed may be worth more or less than their original cost. Results are shown on a "total return" basis and include reinvestment of all income dividends and distributions.
Current performance may be lower or higher than the performance data quoted. For performance data current to the most recent month end, please visit https://www.nb.com.
* Index returns are as of inception date 3/22/1994.
As stated in the Portfolio's most recent prospectus, the total annual fund operating expense ratio for fiscal year 2008 was 0.95% for Class I shares (prior to any fee waivers or expense reimbursements). Neuberger Berman Management LLC has contractually agreed to limit certain expenses of the Portfolio through 12/31/2012.
COMPARISON OF A $10,000 INVESTMENT
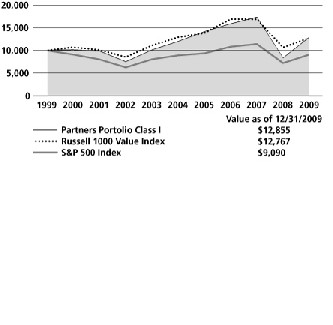
The chart shows the value of a hypothetical $10,000 investment in the Portfolio over the past 10 fiscal years, or since the Portfolio's inception, if it has not operated for 10 years. The result is compared with benchmarks, which may include a broadbased market index and/or a narrower index. Please note that market indexes do not include expenses. All results include the reinvestment of income dividends and distributions. Results represent past performance and do not indicate future results. The chart and table do not reflect the deduction of taxes that a shareholder would pay on Portfolio distributions or the redemption of Portfolio shares.
Please see Endnotes for additional information.
3
Endnotes
1 "Total Return" includes reinvestment of all income dividends and distributions. Results represent past performance and do not indicate future results. The value of an investment in the Portfolio and the return on the investment both will fluctuate, and redemption proceeds may be higher or lower than an investor's original cost. The performance information does not reflect fees and expenses of the variable annuity and variable life insurance policies or the qualified pension and retirement plans whose proceeds are invested in the Portfolio. Neuberger Berman Management LLC ("NBM LLC") has agreed to absorb certain expenses of the AMT Portfolios, including the Portfolio. Without this arrangement, which is subject to change, the total returns of the Portfolio may have been less.
2 The S&P 500 Index is widely regarded as the standard for measuring large-cap U.S. stock market performance and includes a representative sample of the leading companies in leading industries. The Russell 1000(R) Index measures the performance of the 1,000 largest companies in the Russell 3000(R) Index (which measures the performance of the 3,000 largest U.S. companies based on total market capitalization). The Russell 1000 Index represents approximately 92% of the total market capitalization of the Russell 3000 Index. The Russell 1000(R) Value Index measures the performance of those Russell 1000 companies with lower price-to-book ratios and lower forecasted growth values. Please note that indices do not take into account any fees and expenses of investing in the individual securities that they track and that individuals cannot invest directly in any index. Data about the performance of these indices are prepared or obtained by NBM LLC and include reinvestment of all income dividends and distributions. The Portfolio may invest in many securities not included in the above-described indices.
Any ratios or other measurements using a factor of forecasted earnings of a company discussed herein are based on consensus estimates, not NBM LLC's own projections, and they may or may not be realized. In addition, any revision to a forecast could affect the market price of a security. By quoting them herein, NBM LLC does not offer an opinion as to the accuracy of and does not guarantee these forecasted numbers.
The investments for the Portfolio are managed by the same portfolio manager(s) who manage one or more other mutual funds that have similar names, investment objectives and investment styles as the Portfolio. You should be aware that the Portfolio is likely to differ from the other mutual funds in size, cash flow pattern and tax matters. Accordingly, the holdings and performance can be expected to vary from those of the other mutual funds.
The composition, industries and holdings of the Portfolio are subject to change.
Shares of the separate AMT Portfolios are not available to the general public. Shares of this Portfolio may be purchased only by life insurance companies to be used with their separate accounts that fund variable annuity and variable life insurance policies and by qualified pension and retirement plans.
Statistics and projections in this report are derived from sources deemed to be reliable but cannot be regarded as a representation of future results of the AMT Portfolios. This report is prepared for the general information of shareholders and is not an offer of shares of the AMT Portfolios. Shares of the AMT Portfolios are sold only through the currently effective prospectuses, which must precede or accompany this report.
(c) 2010 Neuberger Berman Management LLC distributor. All rights reserved.
4
Information About Your Fund's Expenses
This table is designed to provide information regarding costs related to your investments. All mutual funds incur operating expenses, which include management fees, fees for administrative services and costs of shareholder reports, among others. The following examples are based on an investment of $1,000 made at the beginning of the six month period ended December 31, 2009 and held for the entire period. The table illustrates the fund's costs in two ways:
| Actual Expenses and Performance: | | The first section of the table provides information about actual account values and actual expenses in dollars, based on the fund's actual performance during the period. You may use the information in this line, together with the amount you invested, to estimate the expenses you paid over the period. Simply divide your account value by $1,000 (for example, an $8,600 account value divided by $1,000 = 8.6), then multiply the result by the number in the first section of the table under the heading entitled "Expenses Paid During the Period" to estimate the expenses you paid over the period. | |
|
Hypothetical Example for
Comparison Purposes: | | The second section of the table provides information about hypothetical account values and hypothetical expenses based on the fund's actual expense ratio and an assumed rate of return at 5% per year before expenses. This return is not the fund's actual return. The hypothetical account values and expenses may not be used to estimate the actual ending account balance or expenses you paid for the period. You may use this information to compare the ongoing costs of investing in this fund versus other funds. To do so, compare the expenses shown in this 5% hypothetical example with the 5% hypothetical examples that appear in the shareholder reports of other funds. | |
|
Please note that the expenses in the table are meant to highlight your ongoing costs only. The table and expense example do not include any transactional costs, such as fees and expenses that are, or may be, imposed under your variable contract or qualified pension plan. Therefore, the information under the heading "Hypothetical (5% annual return before expenses)" is useful in comparing ongoing costs only, and will not help you determine the relative total costs of owning different funds. In addition, if these transactional costs were included, your costs would have been higher.
Expense Information as of 12/31/09 (Unaudited)
NEUBERGER BERMAN ADVISERS MANAGEMENT TRUST PARTNERS PORTFOLIO
| Actual | | Beginning Account
Value 7/1/09 | | Ending Account
Value 12/31/09 | | Expenses Paid During
the Period* 7/1/09 - 12/31/09 | |
| Class I | | $ | 1,000.00 | | | $ | 1,294.70 | | | $ | 6.30 | | |
| Hypothetical (5% annual return before expenses) ** | |
| Class I | | $ | 1,000.00 | | | $ | 1,019.71 | | | $ | 5.55 | | |
* Expenses are equal to the annualized expense ratio of 1.09%, multiplied by the average account value over the period, multiplied by 184/365 (to reflect the one-half year period shown).
** Hypothetical 5% annual return before expenses is calculated by multiplying the number of days in the most recent half year divided by 365.
5
Schedule of Investments Partners Portfolio
| NUMBER OF SHARES | | | | VALUEt | |
| Common Stocks (96.0%) | | | |
| Aerospace & Defense (2.9%) | | | |
| | 28,100 | | | Boeing Co. | | $ | 1,521,053 | | |
| | 15,100 | | | L-3 Communications Holdings | | | 1,312,945 | | |
| | | | 2,833,998 | | |
| Automobiles (1.6%) | | | |
| | 61,400 | | | Harley-Davidson | | | 1,547,280 | | |
| Beverages (1.1%) | | | |
| | 37,000 | | | Dr. Pepper Snapple Group | | | 1,047,100 | | |
| Building Products (2.5%) | | | |
| | 62,000 | | | Masco Corp. | | | 856,220 | | |
| | 62,400 | | | Owens Corning | | | 1,599,936 | * | |
| | | | 2,456,156 | | |
| Capital Markets (4.7%) | | | |
| | 5,100 | | | Goldman Sachs Group | | | 861,084 | | |
| | 60,200 | | | Invesco Ltd. | | | 1,414,098 | | |
| | 41,200 | | | Morgan Stanley | | | 1,219,520 | | |
| | 23,900 | | | State Street | | | 1,040,606 | | |
| | | | 4,535,308 | | |
| Commercial Banks (4.2%) | | | |
| | 24,300 | | | Comerica Inc. | | | 718,551 | | |
| | 91,000 | | | Fifth Third Bancorp | | | 887,250 | | |
| | 42,300 | | | SunTrust Banks | | | 858,267 | | |
| | 57,700 | | | Wells Fargo | | | 1,557,323 | | |
| | | | 4,021,391 | | |
| Computers & Peripherals (1.9%) | | | |
| | 35,100 | | | Hewlett-Packard | | | 1,808,001 | | |
| Construction & Engineering (2.0%) | | | |
| | 87,300 | | | Chicago Bridge & Iron | | | 1,765,206 | * | |
| | 10,700 | | | KBR, Inc. | | | 203,300 | | |
| | | | 1,968,506 | | |
| Consumer Finance (2.2%) | | | |
| | 35,500 | | | American Express | | | 1,438,460 | | |
| | 17,100 | | | Capital One Financial | | | 655,614 | | |
| | | | 2,094,074 | | |
| Diversified Financial Services (7.6%) | | | |
| | 174,900 | | | Bank of America | | | 2,633,994 | | |
| | 378,223 | | | Citigroup Inc. | | | 1,251,918 | | |
| | 36,500 | | | J.P. Morgan Chase | | | 1,520,955 | | |
| | 74,300 | | | Moody's Corp. | | | 1,991,240 | | |
| | | | 7,398,107 | | |
| NUMBER OF SHARES | | | | VALUEt | |
| Electrical Equipment (1.1%) | | | |
| | 57,300 | | | ABB Ltd. | | $ | 1,094,430 | | |
| Energy Equipment & Services (3.8%) | | | |
| | 29,500 | | | National Oilwell Varco | | | 1,300,655 | | |
| | 39,200 | | | Noble Corp. | | | 1,595,440 | | |
| | 42,500 | | | Weatherford International | | | 761,175 | * | |
| | | | 3,657,270 | | |
| Food & Staples Retailing (0.9%) | | | |
| | 27,300 | | | CVS Corp. | | | 879,333 | | |
| Health Care Equipment & Supplies (2.3%) | | | |
| | 23,500 | | | Covidien PLC | | | 1,125,415 | | |
| | 19,000 | | | Zimmer Holdings | | | 1,123,090 | * | |
| | | | 2,248,505 | | |
| Health Care Providers & Services (3.0%) | | | |
| | 37,800 | | | Aetna Inc. | | | 1,198,260 | | |
| | 28,900 | | | WellPoint Inc. | | | 1,684,581 | * | |
| | | | 2,882,841 | | |
| Household Durables (1.6%) | | | |
| | 53,100 | | | KB HOME | | | 726,408 | | |
| | 10,600 | | | Whirlpool Corp. | | | 854,996 | | |
| | | | 1,581,404 | | |
| Household Products (1.5%) | | | |
| | 23,200 | | | Energizer Holdings | | | 1,421,696 | * | |
Independent Power Producers &
Energy Traders (1.1%) | | | |
| | 44,300 | | | NRG Energy | | | 1,045,923 | * | |
| Industrial Conglomerates (1.4%) | | | |
| | 56,400 | | | McDermott International | | | 1,354,164 | * | |
| Insurance (3.7%) | | | |
| | 23,000 | | | Assurant, Inc. | | | 678,040 | | |
| | 580 | | | Berkshire Hathaway Class B | | | 1,905,880 | * | |
| | 29,300 | | | MetLife, Inc. | | | 1,035,755 | | |
| | | | 3,619,675 | | |
| IT Services (4.1%) | | | |
| | 19,400 | | | Affiliated Computer Services | | | 1,157,986 | * | |
| | 53,100 | | | Fidelity National
Information Services | | | 1,244,664 | | |
| | 39,600 | | | Lender Processing Services | | | 1,610,136 | | |
| | | | 4,012,786 | | |
See Notes to Schedule of Investments 6
| NUMBER OF SHARES | | | | VALUEt | |
| Machinery (3.9%) | | | |
| | 35,600 | | | Ingersoll-Rand PLC | | $ | 1,272,344 | | |
| | 19,200 | | | Joy Global | | | 990,528 | | |
| | 77,000 | | | Terex Corp. | | | 1,525,370 | * | |
| | | | 3,788,242 | | |
| Marine (0.5%) | | | |
| | 21,700 | | | Genco Shipping & Trading | | | 485,646 | ** | |
| Media (2.4%) | | | |
| | 13,500 | | | Cablevision Systems | | | 348,570 | | |
| | 58,200 | | | McGraw-Hill Cos. | | | 1,950,282 | | |
| | | | 2,298,852 | | |
| Metals & Mining (7.2%) | | | |
| | 7,700 | | | Cliffs Natural Resources | | | 354,893 | | |
| | 17,100 | | | Freeport-McMoRan
Copper & Gold | | | 1,372,959 | * | |
| | 67,000 | | | Teck Resources Class B | | | 2,342,990 | * | |
| | 13,500 | | | United States Steel | | | 744,120 | | |
| | 12,000 | | | Walter Energy | | | 903,720 | | |
| | 69,200 | | | Xstrata PLC | | | 1,234,258 | * | |
| | | | 6,952,940 | | |
| Multiline Retail (3.0%) | | | |
| | 56,400 | | | J.C. Penney | | | 1,500,804 | | |
| | 81,900 | | | Macy's Inc. | | | 1,372,644 | | |
| | | | 2,873,448 | | |
| Oil, Gas & Consumable Fuels (13.3%) | | | |
| | 32,100 | | | Canadian Natural Resources | | | 2,309,595 | | |
| | 42,000 | | | Denbury Resources | | | 621,600 | * | |
| | 14,300 | | | EOG Resources | | | 1,391,390 | | |
| | 200 | | | Exxon Mobil | | | 13,638 | | |
| | 15,900 | | | Peabody Energy | | | 718,839 | | |
| | 48,500 | | | Petroleo Brasileiro ADR | | | 2,312,480 | | |
| | 45,940 | | | Ship Finance International | | | 626,162 | | |
| | 36,400 | | | Southwestern Energy | | | 1,754,480 | * | |
| | 30,085 | | | Suncor Energy | | | 1,062,301 | | |
| | 44,200 | | | Talisman Energy | | | 823,888 | | |
| | 26,216 | | | XTO Energy | | | 1,219,831 | | |
| | | | 12,854,204 | | |
| Personal Products (3.2%) | | | |
| | 24,000 | | | Avon Products | | | 756,000 | | |
| | 53,100 | | | NBTY, Inc. | | | 2,311,974 | * | |
| | | | 3,067,974 | | |
| Pharmaceuticals (1.9%) | | | |
| | 30,800 | | | Shire Limited ADR | | | 1,807,960 | | |
| Road & Rail (0.5%) | | | |
| | 9,200 | | | Norfolk Southern | | | 482,264 | | |
| NUMBER OF SHARES | | | | VALUEt | |
| Software (3.3%) | | | |
| | 24,700 | | | Check Point Software
Technologies | | $ | 836,836 | * | |
| | 31,600 | | | Microsoft Corp. | | | 963,484 | | |
| | 55,700 | | | Oracle Corp. | | | 1,366,878 | | |
| | | | 3,167,198 | | |
| Specialty Retail (1.6%) | | | |
| | 32,500 | | | Best Buy | | | 1,282,450 | | |
| | 13,400 | | | Lowe's Cos. | | | 313,426 | | |
| | | | 1,595,876 | | |
| | | | | Total Common Stocks
(Cost $62,331,729) | | | 92,882,552 | | |
| Convertible Preferred Stocks (0.1%) | | | |
| Diversified Financial Services (0.1%) | | | |
| | 7,200 | | | Bank of America
(Cost $108,000) | | | 107,424 | * | |
| Short-Term Investments (3.0%) | | | |
| | 455,882 | | | Neuberger Berman Securities
Lending Quality Fund, LLC | | | 465,000 | tt | |
| | 2,421,068 | | | State Street Institutional Liquid
Reserves Fund Institutional Class | | | 2,421,068 | | |
| | | | | Total Short-Term Investments
(Cost $2,886,068) | | | 2,886,068 | | |
| | | | | Total Investments (99.1%)
(Cost $65,325,797) | | | 95,876,044 | ## | |
| | | | | Cash, receivables and other assets,
less liabilities (0.9%) | | | 871,232 | | |
| | | | | Total Net Assets (100.0%) | | $ | 96,747,276 | | |
See Notes to Schedule of Investments 7
Notes to Schedule of Investments Partners Portfolio
t The value of investments in equity securities by Neuberger Berman Advisers Management Trust Partners Portfolio (the "Fund") is determined by Neuberger Berman Management LLC ("Management") primarily by obtaining valuations from an independent pricing service based on the latest sale price when that price is readily available. Securities traded primarily on the NASDAQ Stock Market are normally valued by the Fund at the NASDAQ Official Closing Price ("NOCP") provided by NASDAQ each business day. The NOCP is the most recently reported price as of 4:00:02 p.m., Eastern time, unless that price is outside the range of the "inside" bid and asked prices (i.e., the bid and asked prices that dealers quote to each other when trading for their own accounts); in that case, NASDAQ will adjust the price to equal the inside bid or asked price, whichever is closer. Because of delays in reporting trades, the NOCP may not be based on the price of the last trade to occur before the market closes. If there is no reported sale of a security on a particular day, the independent pricing service may value the security based on reported market quotations. Management has developed a process to periodically review information provided by independent pricing services. If a valuation is not available from an independent pricing service, the Fund seeks to obtain quotations from principal market makers. If such quotations are not readily available, securities are valued using methods the Board of Trustees of Neuberger Berman Advisers Management Trust (the "Board") has approved on the belief that they reflect fair value. Numerous factors may be considered when determining the fair value of a security, including available analyst, media or other reports, trading in futures or ADRs and whether the issuer of the security being fair valued has other securities outstanding. Foreign security prices are furnished by independent quotation services and expressed in local currency values. Foreign security prices are currently translated from the local currency into U.S. dollars using the exchange rate as of 4:00 p.m., Eastern time. The Board has approved the use of Interactive Data Pricing and Reference Data, Inc. ("Interactive") to assist in determining the fair value of the Fund's foreign equity securities when changes in the value of a certain index suggest that the closing prices on the foreign exchanges may no longer represent the amount that the Fund could expect to receive for those securities. In this event, Interactive will provide adjusted prices for certain foreign equity securities using a statistical analysis of historical correlations of multiple factors. In the absence of precise information about the market values of these foreign securities as of the close of the New York Stock Exchange, the Board has determined on the basis of available data that prices adjusted in this way are likely to be closer to the prices the Fund could realize on a current sale than are the prices of those securities established at the close of the foreign markets in which the securities primarily trade. Fair value prices are necessarily estimates, and there is no assurance that such a price will be at or close to the price at which the security next trades. Short-term debt securities with less than 60 days until maturity may be valued at cost, which, when combined with interest earned, is expected to approximate market value.
In accordance with Accounting Standards Codification ("ASC") 820 "Fair Value Measurements and Disclosures" ("ASC 820"), formerly known as Financial Accounting Standards Board ("FASB") Statement of Financial Accounting Standards No. 157, "Fair Value Measurements," investments held by the Fund are carried at "fair value" as defined by ASC 820. Fair value is defined as the price that a fund would receive upon selling an investment in an orderly transaction to an independent buyer in the principal or most advantageous market for the investment under current market conditions. Various inputs, including the volume and level of activity for the asset or liability in the market are considered in determining the value of the Fund's investments, some of which are discussed above. Significant management judgement may be necessary to estimate fair value in accordance with ASC 820.
In addition to defining fair value, ASC 820 established a three-tier hierarchy of inputs to establish a classification of fair value measurements for disclosure purposes. The three-tier hierarchy of inputs is summarized in the three broad Levels listed below.
. Level 1 - quoted prices in active markets for identical investments
. Level 2 - other significant observable inputs (including quoted prices for similar investments, interest rates, prepayment speeds, credit risk, amortized cost, etc.)
. Level 3 - significant unobservable inputs (including the Fund's own assumptions in determining the fair value of investments)
See Notes to Financial Statements 8
Notes to Schedule of Investments Partners Portfolio (cont'd)
The inputs or methodology used for valuing an investment are not necessarily an indication of the risk associated with investing in those securities.
The following is a summary, by category of Level, of inputs used to value the Fund's investments as of December 31, 2009:
| Asset Valuation Inputs | | Level 1 | | Level 2 | | Level 3 | | Total | |
| Investments: | |
| Common Stocks^ | | $ | 92,882,552 | | | $ | -- | | | $ | -- | | | $ | 92,882,552 | | |
| Convertible Preferred Stocks^ | | | 107,424 | | | | -- | | | | -- | | | | 107,424 | | |
| Short-Term Investments | | | -- | | | | 2,886,068 | | | | -- | | | | 2,886,068 | | |
| Total Investments | | $ | 92,989,976 | | | $ | 2,886,068 | | | $ | -- | | | $ | 95,876,044 | | |
^ The Schedule of Investments provides information on the industry categorization for the portfolio.
## At December 31, 2009, the cost of investments for U.S. federal income tax purposes was $69,922,990. Gross unrealized appreciation of investments was $27,055,450 and gross unrealized depreciation of investments was $1,102,396, resulting in net unrealized appreciation of $25,953,054, based on cost for U.S. federal income tax purposes.
* Security did not produce income during the last twelve months.
* All or a portion of this security is on loan (see Note A of Notes to Financial Statements).
tt Managed by an affiliate of Management and could be deemed an affiliate of the Fund (see Notes A & F of Notes to Financial Statements).
See Notes to Financial Statements 9
Statement of Assets and Liabilities
Neuberger Berman Advisers Management Trust
| | | PARTNERS
PORTFOLIO | |
| | | December 31, 2009 | |
| Assets | |
| Investments in securities, at value*t (Notes A & F)--see Schedule of Investments: | |
| Unaffiliated issuers | | $ | 95,411,044 | | |
| Affiliated issuers | | | 465,000 | | |
| | | | 95,876,044 | | |
| Cash | | | 37,706 | | |
| Dividends and interest receivable | | | 106,750 | | |
| Receivable for Fund shares sold | | | 1,348,349 | | |
| Receivable for securities lending income--net (Note A) | | | 1,036 | | |
| Prepaid expenses and other assets | | | 18,874 | | |
| Total Assets | | | 97,388,759 | | |
| Liabilities | |
| Due to custodian | | | 2,431 | | |
| Payable for collateral on securities loaned (Note A) | | | 465,000 | | |
| Payable for Fund shares redeemed | | | 41,126 | | |
| Payable to investment manager (Notes A & B) | | | 44,080 | | |
| Payable to administrator (Note B) | | | 24,043 | | |
| Accrued expenses and other payables | | | 64,803 | | |
| Total Liabilities | | | 641,483 | | |
| Net Assets at value | | $ | 96,747,276 | | |
| Net Assets consist of: | |
| Paid-in capital | | $ | 119,593,749 | | |
| Undistributed net investment income (loss) | | | 631,363 | | |
| Accumulated net realized gains (losses) on investments | | | (54,028,124 | ) | |
| Net unrealized appreciation (depreciation) in value of investments | | | 30,550,288 | | |
| Net Assets at value | | $ | 96,747,276 | | |
| Shares Outstanding ($.001 par value; unlimited shares authorized) | | | 9,855,791 | | |
| Net Asset Value, offering and redemption price per share | | $ | 9.82 | | |
| tSecurities on loan, at value: | |
| Unaffiliated issuers | | $ | 451,200 | | |
| *Cost of Investments: | |
| Unaffiliated issuers | | $ | 64,860,797 | | |
| Affiliated issuers | | | 465,000 | | |
| Total cost of investments | | $ | 65,325,797 | | |
See Notes to Financial Statements 10
Statement of Operations
Neuberger Berman Advisers Management Trust
| | | PARTNERS
PORTFOLIO | |
| | | For the
Year Ended
December 31, 2009 | |
| Investment Income: | |
| Income (Note A): | |
| Dividend income--unaffiliated issuers | | $ | 2,264,469 | | |
| Interest income--unaffiliated issuers | | | 3,178 | | |
| Income from securities loaned--net (Note F) | | | 175,608 | | |
| Income from investments in affiliated issuers (Note F) | | | 6,217 | | |
| Foreign taxes withheld | | | (28,596 | ) | |
| Total income | | $ | 2,420,876 | | |
| Expenses: | |
| Investment management fees (Notes A & B) | | | 956,193 | | |
| Administration fees (Note B) | | | 521,719 | | |
| Audit fees | | | 41,307 | | |
| Custodian fees (Note B) | | | 96,016 | | |
| Insurance expense | | | 14,462 | | |
| Legal fees | | | 58,432 | | |
| Shareholder reports | | | 78,902 | | |
| Trustees' fees and expenses | | | 50,119 | | |
| Miscellaneous | | | 18,860 | | |
| Total expenses | | | 1,836,010 | | |
| Investment management fees waived (Note A) | | | (2,345 | ) | |
| Expenses reduced by custodian fee expense offset arrangement (Note B) | | | (6 | ) | |
| Total net expenses | | | 1,833,659 | | |
| Net investment income (loss) | | $ | 587,217 | | |
| Realized and Unrealized Gain (Loss) on Investments (Note A) | |
| Net realized gain (loss) on: | |
| Sales of investment securities of unaffiliated issuers | | | (46,099,070 | ) | |
| Sales of investment securities of affiliated issuers | | | 93,119 | | |
| Redemption in-kind | | | (1,596,114 | ) | |
| Foreign currency | | | 53,334 | | |
| Change in net unrealized appreciation (depreciation) in value of: | |
| Unaffiliated investment securities | | | 133,753,040 | | |
| Foreign currency | | | (4,239 | ) | |
| Net gain (loss) on investments | | | 86,200,070 | | |
| Net increase (decrease) in net assets resulting from operations | | $ | 86,787,287 | | |
See Notes to Financial Statements 11
Statements of Changes in Net Assets
Neuberger Berman Advisers Management Trust
| | | PARTNERS PORTFOLIO | |
| | | Year Ended
December 31,
2009 | | Year Ended
December 31,
2008 | |
| Increase (Decrease) in Net Assets: | |
| From Operations (Note A): | |
| Net investment income (loss) | | $ | 587,217 | | | $ | 2,165,195 | | |
| Net realized gain (loss) on investments | | | (47,548,731 | ) | | | 1,808,621 | | |
| Change in net unrealized appreciation (depreciation) of investments | | | 133,748,801 | | | | (260,928,162 | ) | |
| Net increase (decrease) in net assets resulting from operations | | | 86,787,287 | | | | (256,954,346 | ) | |
| Distributions to Shareholders From (Note A): | |
| Net investment income | | | (2,064,013 | ) | | | (2,046,204 | ) | |
| Net realized gain on investments | | | (9,167,082 | ) | | | (64,539,060 | ) | |
| Total distributions to shareholders | | | (11,231,095 | ) | | | (66,585,264 | ) | |
| From Fund Share Transactions (Note D): | |
| Proceeds from shares sold | | | 29,636,602 | | | | 63,374,984 | | |
| Proceeds from reinvestment of dividends and distributions | | | 11,231,095 | | | | 66,585,264 | | |
| Payments for shares redeemed | | | (237,555,835 | ) | | | (115,216,858 | ) | |
| Net increase (decrease) from Fund share transactions | | | (196,688,138 | ) | | | 14,743,390 | | |
| Net Increase (Decrease) in Net Assets | | | (121,131,946 | ) | | | (308,796,220 | ) | |
| Net Assets: | |
| Beginning of year | | | 217,879,222 | | | | 526,675,442 | | |
| End of year | | $ | 96,747,276 | | | $ | 217,879,222 | | |
| Undistributed net investment income (loss) at end of year | | $ | 631,363 | | | $ | 2,063,696 | | |
See Notes to Financial Statements 12
Notes to Financial Statements Partners Portfolio
Note A--Summary of Significant Accounting Policies:
1 General: The Fund is a separate operating series of Neuberger Berman Advisers Management Trust (the "Trust"), a Delaware statutory trust organized pursuant to a Trust Instrument dated May 23, 1994. The Trust is currently comprised of ten separate operating series (each a "Series," collectively, the "Funds") each of which is diversified. The Trust is registered as an open-end management investment company under the Investment Company Act of 1940, as amended (the "1940 Act"), and its shares are registered under the Securities Act of 1933, as amended. The Fund currently offers only Class I shares. The Board may establish additional series or classes of shares without the approval of shareholders.
The assets of each Series belong only to that Series, and the liabilities of each Series are borne solely by that Series and no other.
The preparation of financial statements in accordance with U.S. generally accepted accounting principles requires Management to make estimates and assumptions at the date of the financial statements. Actual results could differ from those estimates.
2 Portfolio valuation: Investment securities are valued as indicated in the notes following the Schedule of Investments.
3 Foreign currency translation: The accounting records of the Fund are maintained in U.S. dollars. Foreign currency amounts are currently translated into U.S. dollars using the exchange rates as of 4:00 p.m., Eastern time, to determine the value of investments, other assets and liabilities. Purchase and sale prices of securities, and income and expenses, are translated into U.S. dollars at the prevailing rate of exchange on the respective dates of such transactions. Net unrealized foreign currency gain (loss), if any, arises from changes in the value of assets and liabilities, other than investments in securities, as a result of changes in exchange rates and is stated separately in the Statement of Operations.
4 Securities transactions and investment income: Securities transactions are recorded on trade date for financial reporting purposes. Dividend income is recorded on the ex-dividend date or, for certain foreign dividends, as soon as the Fund becomes aware of the dividends. Non-cash dividends included in dividend income, if any, are recorded at the fair market value of the securities received. Interest income, including accretion of original issue discount, where applicable, and accretion of discount on short-term investments, is recorded on the accrual basis. Realized gains and losses from securities transactions and foreign currency transactions, if any, are recorded on the basis of identified cost and stated separately in the Statement of Operations. Included in net realized gain (loss) on investments are proceeds from the settlements of class action litigation in which the Fund participated as a class member. The amount of such proceeds for the year ended December 31, 2009 was $617,767.
5 Income tax information: The Funds are treated as separate entities for U.S. federal income tax purposes. It is the policy of the Fund to continue to qualify as a regulated investment company by complying with the requirements of Subchapter M of the Internal Revenue Code applicable to regulated investment companies and to distribute substantially all of its earnings to its shareholders. Therefore, no federal income or excise tax provision is required.
The Fund has adopted the provisions of ASC 740 "Income Taxes" ("ASC 740"), formerly known as FASB Interpretation No. 48 "Accounting for Uncertainty in Income Taxes -- an interpretation of FASB Statement No. 109." ASC 740 sets forth a minimum threshold for financial statement recognition of the benefit of a tax position taken, or expected to be taken, in a tax return. The Fund recognizes interest and penalties, if any, related to unrecognized tax benefits as an income tax expense in the Statement of Operations. The Fund is subject to examination by U.S. federal and state tax authorities for returns filed for the prior three fiscal years 2006 - 2008. As of December 31, 2009, the Fund did not have any unrecognized tax benefits.
13
Income distributions and capital gain distributions are determined in accordance with income tax regulations, which may differ from U.S. generally accepted accounting principles. These differences are primarily due to differing treatments of income and gains on various investment securities held by the Fund, timing differences and differing characterization of distributions made by the Fund as a whole. The Fund may also utilize earnings and profits distributed to shareholders on redemption of shares as a part of the dividends paid deduction for income tax purposes.
As determined on December 31, 2009, permanent differences resulting primarily from different book and tax accounting for foreign currency gains and losses, return of capital adjustments, capital gains distributions and redemptions in kind were reclassified at fiscal year-end. These reclassifications had no effect on net income, net asset value or net asset value per share of the Fund.
The tax character of distributions paid during the years ended December 31, 2009 and December 31, 2008 was as follows:
| | | Distributions Paid From: | | | |
| Ordinary Income | | Long-Term
Capital Gain | | Total | |
| 2009 | | 2008 | | 2009 | | 2008 | | 2009 | | 2008 | |
| $ | 2,064,013 | | | $ | 2,583,312 | | | $ | 9,167,082 | | | $ | 64,001,952 | | | $ | 11,231,095 | | | $ | 66,585,264 | | |
As of December 31, 2009, the components of distributable earnings (accumulated losses) on a U.S. federal income tax basis were as follows:
Undistributed
Ordinary
Income | | Undistributed
Long-Term
Gain | | Unrealized
Appreciation
(Depreciation) | | Loss
Carryforwards
and Deferrals | | Total | |
| $ | 631,363 | | | $ | -- | | | $ | 25,953,095 | | | $ | (49,430,931 | ) | | $ | (22,846,473 | ) | |
The difference between book basis and tax basis distributable earnings is attributable primarily to timing differences of wash sales, partnership basis adjustments, return of capital adjustment and capital loss carryforwards.
To the extent the Fund's net realized capital gains, if any, can be offset by capital loss carryforwards, it is the policy of the Fund not to distribute such gains. As determined at December 31, 2009, the Fund had unused capital loss carryforwards available for federal income tax purposes to offset net realized capital gains, if any, as follows:
| | | Expiring in:
2017 | |
| | | $ | 49,430,931 | | |
Under current tax law, the use of these losses to offset future gains may be limited.
6 Distributions to shareholders: The Fund may earn income, net of expenses, daily on its investments. Distributions from net investment income and net realized capital gains, if any, generally are distributed in October. Income distributions and capital gain distributions to shareholders are recorded on the ex-date.
It is the policy of the Fund to pass through to its shareholders substantially all Real Estate Investment Trust ("REIT") distributions and other income it receives, less operating expenses. The distributions the Fund receives from REITs are generally comprised of income, capital gains, and return of capital, but the REITs do not report this information to the Fund until the following calendar year. At December 31, 2009, the Fund estimated these amounts within the financial statements since the information is not available from the REITs until after the Fund's fiscal year-end. At December 31, 2009, the character of distributions paid to shareholders disclosed within the Statements of Changes in Net Assets is based on estimates made at that time. All estimates are based upon REIT information sources available to the Fund together with actual IRS Forms 1099DIV received to date. Based on past experience it is possible that a portion of the Fund's distributions during the most recently completed fiscal year will be considered tax return of capital but the actual amount of tax return of capital, if
14
any, is not determinable until after the Fund's fiscal year-end. After calendar year-end, when the Fund learns the nature of the distributions paid by REITs during that year, distributions previously identified as income are often recharacterized as return of capital and/or capital gain. After all applicable REITs have informed the Fund of the actual breakdown of distributions paid to the Fund during its fiscal year, estimates previously recorded are adjusted on the books of the Fund to reflect actual results. As a result, the composition of the Fund's distributions as reported herein may differ from the final composition determined after calendar year-end and reported to Fund shareholders on IRS Form 1099DIV.
7 Foreign taxes: Foreign taxes withheld represent amounts withheld by foreign tax authorities, net of refunds recoverable.
8 Expense allocation: Certain expenses are applicable to multiple funds. Expenses directly attributable to a Series are charged to that Series. Expenses of the Trust that are not directly attributed to a Series are allocated among the Funds, on the basis of relative net assets, except where a more appropriate allocation of expenses to each of the Funds can otherwise be made fairly. Expenses borne by the complex of related investment companies, which includes open-end and closed-end investment companies for which Management serves as investment manager, that are not directly attributed to a Series or the Trust are allocated among the Fund and the other investment companies in the complex or series thereof on the basis of relative net assets, except where a more appropriate allocation of expenses to each investment company in the complex or series thereof can otherwise be made fairly.
9 Repurchase agreements: The Fund may enter into repurchase agreements with institutions that Management has determined are creditworthy. Each repurchase agreement is recorded at cost. The Fund requires that the securities purchased in a repurchase agreement be transferred to the custodian in a manner sufficient to enable the Fund to assert a perfected security interest in those securities in the event of a default under the repurchase agreement. The Fund monitors, on a daily basis, the value of the securities transferred to ensure that their value, including accrued interest, is greater than amounts owed to the Fund under each such repurchase agreement.
10 Security lending: A third party, eSecLending, currently serves as exclusive lending agent for the Fund. eSecLending, as agent, has assisted the Fund in conducting bidding processes to try to identify a principal that would pay a guaranteed amount to the Fund in consideration of the Fund entering into an exclusive securities lending arrangement. During most of the Fund's fiscal year, the Fund was guaranteed a particular level of income from a principal. As a result of a bidding process on October 1, 2009, no principal currently has an exclusive arrangement with the Fund and the Fund is no longer guaranteed a particular level of income.
Under the securities lending arrangement, the Fund receives cash collateral at the beginning of each transaction equal to at least 102% of the prior day's market value of the loaned securities (105% in the case of international securities). The Fund may invest all the cash collateral in Neuberger Berman Securities Lending Quality Fund, LLC ("Quality Fund"), a fund managed by Neuberger Berman Fixed Income LLC (formerly known as Lehman Brothers Asset Management LLC) ("NBFI"), an affiliate of Management. Effective July 1, 2009, Dwight Asset Management Company LLC became the Sub-Adviser to the Quality Fund. The Quality Fund is not a money market fund that is registered under the 1940 Act and does not operate in accordance with all requirements of Rule 2a-7 under the 1940 Act. There is no assurance that the Quality Fund will maintain a $1.00 share price.
The market value of the Fund's investments in the Quality Fund as of the fiscal year ended December 31, 2009, if any, is reflected in the Fund's Schedule of Investments. If it were necessary to liquidate assets in the Quality Fund to meet returns on outstanding securities loans at a time when the Quality Fund's price per share was less than $1.00, the Fund may not receive an amount from the Quality Fund that is equal in amount to the collateral the Fund would be required to return to the borrower of the securities and the Fund would be required to make up for this shortfall. In addition, as a result of recent reduced liquidity in the credit and fixed income markets, it may be difficult to dispose quickly of some securities in the Quality Fund at the price at which the Quality Fund is carrying them.
Net income from the lending program represents any amounts received from a principal plus income earned on the cash collateral invested in Quality Fund or in other investments, if applicable, less cash collateral fees and other expenses associated with the loans. For the fiscal year ended December 31, 2009, the Fund received net income
15
under the securities lending arrangement of approximately $175,608, which is reflected in the Statement of Operations under the caption "Income from securities loaned - -- net." For the fiscal year ended December 31, 2009, "Income from securities loaned -- net" consisted of approximately $292,885 in income earned on cash collateral and amounts received from a principal (including approximately $218,442 of interest income earned from the Quality Fund), less fees and expenses paid of approximately $117,277.
11 Transactions with other funds managed by Neuberger Berman Management LLC: Pursuant to an Exemptive Order issued by the Securities and Exchange Commission, the Fund may invest in a money market fund managed by Management or an affiliate. Through August 10, 2009, the Fund invested in Neuberger Berman Prime Money Fund ("Prime Money"), as approved by the Board. Prime Money sought to provide the highest available current income consistent with safety and liquidity. For any cash that the Fund invested in Prime Money, Management waived a portion of its management fee equal to the management fee it received from Prime Money on those assets (the "Arrangement"). For the year ended December 31, 2009, management fees waived under this Arrangement amounted to $2,345 and are reflected in the Statement of Operations under the caption "Investment management fees waived." For the year ended December 31, 2009, income earned under this Arrangement amounted to $6,217 and is reflected in the Statement of Operations under the caption "Income from investments in affiliated issuers."
On August 10, 2009, the Fund ceased investing in Prime Money. On this date, the Fund's shares of Prime Money were redeemed in exchange for portfolio holdings of Prime Money, which were used to purchase Institutional Class shares of State Street Institutional Liquid Reserves Fund.
12 Investments in foreign securities: Investing in foreign securities may involve certain sovereign and other risks, in addition to the credit and market risks normally associated with domestic securities. These additional risks include the possibility of adverse political and economic developments (including political instability, nationalization, expropriation, or confiscatory taxation) and the potentially adverse effects of unavailability of public information regarding issuers, less governmental supervision and regulation of financial markets, reduced liquidity of certain financial markets, and the lack of uniform accounting, auditing, and financial reporting standards or the application of standards that are different or less stringent than those applied in the United States. Foreign securities also may experience greater price volatility, higher rates of inflation, and delays in settlement.
13 Derivative instruments: Management has evaluated the requirements of ASC 815 "Disclosures about Derivative Instruments and Hedging Activities" ("ASC 815"), formerly known as FASB Statement of Financial Accounting Standards No. 161, "Disclosures about Derivative Instruments and Hedging Activities," which are effective for financial statements issued for fiscal years and interim periods beginning after November 15, 2008. ASC 815 requires enhanced disclosures about a fund's derivative and hedging activities. Management has concluded that, since the Fund did not hold any derivative instruments during the year ended December 31, 2009, no additional disclosures pursuant to ASC 815 are required at this time.
14 Indemnifications: Like many other companies, the Trust's organizational documents provide that its officers and trustees are indemnified against certain liabilities arising out of the performance of their duties to the Trust. In addition, both in some of its principal service contracts and in the normal course of its business, the Trust enters into contracts that provide indemnifications to other parties for certain types of losses or liabilities. The Trust's maximum exposure under these arrangements is unknown as this could involve future claims against the Trust.
Note B--Management Fees, Administration Fees, Distribution Arrangements, and Other Transactions With Affiliates:
Fund shares are issued and redeemed in connection with investments in and payments under certain variable annuity contracts and variable life insurance policies issued through separate accounts of life insurance companies and are also offered directly to qualified pension and retirement plans.
The Fund retains Management as its investment manager under a Management Agreement. For such investment management services, the Fund pays Management a fee at the annual rate of 0.55% of the first $250 million of the
16
Fund's average daily net assets, 0.525% of the next $250 million, 0.50% of the next $250 million, 0.475% of the next $250 million, 0.45% of the next $500 million, 0.425% of the next $2.5 billion, and 0.40% of average daily net assets in excess of $4 billion.
The Fund retains Management as its administrator under an Administration Agreement. The Fund pays Management an administration fee at the annual rate of 0.30% of its average daily net assets under this agreement. Additionally, Management retains State Street Bank and Trust Company ("State Street") as its sub-administrator under a Sub-Administration Agreement. Management pays State Street a fee for all services received under this agreement.
The Board adopted a non-fee distribution plan for the Fund.
Management has contractually undertaken through December 31, 2012 to forgo current payment of fees and/or reimburse the Fund for its operating expenses (excluding fees payable to Management, interest, taxes, brokerage commissions, extraordinary expenses, and transaction costs) ("Operating Expenses") which exceed, in the aggregate, 1.00% per annum of the Fund's average daily net assets (the "Expense Limitation"). For the year ended December 31, 2009, no reimbursement to the Fund was required. The Fund has agreed to repay Management through December 31, 2015 for fees and expenses foregone and/or its excess Operating Expenses previously reimbursed by Management, so long as its annual Operating Expenses during that period do not exceed its Expense Limitation, and the repayment is made within three years after the year in which Management issued the reimbursement or waived fees. During the year ended December 31, 2009, there was no repayment to Management under this agreement. At December 31, 2009, the Fund had no contingent liability to Management under this agreement.
Neuberger Berman LLC (formerly known as Neuberger Berman, LLC) ("Neuberger") is retained by Management to furnish it with investment recommendations and research information without added cost to the Fund. Several individuals who are officers and/or trustees of the Trust are also employees of Neuberger and/or Management.
During the reporting period, the predecessor of Management, the investment manager of the Fund, and Neuberger, the sub-adviser of the Fund, were wholly owned subsidiaries of Lehman Brothers Holdings Inc. ("Lehman Brothers"), a publicly owned holding company. On September 15, 2008, Lehman Brothers filed a voluntary petition under Chapter 11 of the U.S. Bankruptcy Code. On December 3, 2008, NBSH Acquisition, LLC ("NBSH"), an entity organized by key members of Neuberger Berman's senior management, was selected as the successful bidder in the public auction to acquire a majority interest in Neuberger Berman's business and the fixed income and certain alternative asset management businesses of Lehman Brothers' Investment Management Division (together with Neuberger Berman, the "Acquired Businesses") (the "Acquisition"). On December 22, 2008, the bankruptcy court having jurisdiction over the Lehman Brothers matter approved the sale of the Acquired Businesses to NBSH (or its successor or assign), as the successful bidder.
The Acquisition closed on May 4, 2009. The Acquired Businesses are now indirectly owned by, among others, portfolio managers, Neuberger Berman's management team, and certain key members and senior professionals who are employed in various parts of the Neuberger Berman complex of companies, with a minority interest retained by Lehman Brothers and certain affiliates of Lehman Brothers.
The closing of the Acquisition resulted in an "assignment" of the Fund's Management Agreement and Sub-Advisory Agreement. Such an assignment, by law, automatically terminated those agreements. Accordingly, prior to the closing, the Board, including the Trustees who are not "interested persons" of the Fund's investment manager and its affiliates or the Fund, considered and approved a new Management Agreement and Sub-Advisory Agreement for the Fund. The new agreements, which are virtually identical to those previously in effect, were also approved by a vote of the Fund's shareholders.
These events have not had a material impact on the Fund or its operations. Management and Neuberger continue to operate in the ordinary course of business as the investment manager and sub-adviser of the Fund.
17
The Fund has an expense offset arrangement in connection with its custodian contract. For the year ended December 31, 2009, the impact of this arrangement was a reduction of expenses of $6.
Note C--Securities Transactions:
During the year ended December 31, 2009, there were purchase and sale transactions (excluding short-term securities) of $67,969,799 and $271,909,129, respectively.
During the year ended December 31, 2009, no brokerage commissions on securities transactions were paid to affiliated brokers.
Note D--Fund Share Transactions:
Share activity for the years ended December 31, 2009 and December 31, 2008 was as follows:
| | | For the Year Ended December 31, | |
| | | 2009 | | 2008 | |
| Shares Sold | | | 3,400,067 | | | | 3,800,349 | | |
| Shares Issued on Reinvestment of Dividends and Distributions | | | 1,135,601 | | | | 8,830,937 | | |
| Shares Redeemed | | | (25,327,354 | ) | | | (7,347,792 | ) | |
| Total | | | (20,791,686 | ) | | | 5,283,494 | | |
Note E--Line of Credit:
At December 31, 2009, the Fund was a participant in a single committed, unsecured $150,000,000 line of credit with State Street, to be used only for temporary or emergency purposes. Other investment companies managed by Management also participate in this line of credit on the same terms. Interest is charged on borrowings under this line of credit at the higher of (a) the Federal Funds Rate plus 1.25% per annum or (b) the Overnight LIBOR Rate plus 1.25% per annum. Prior to September 18, 2009, interest was charged on borrowings under this line of credit at the Federal Funds Rate plus 0.50% per annum. A facility fee of 0.15% (prior to September 18, 2009, 0.09%) per annum of the available line of credit is charged, of which the Fund has agreed to pay its pro rata share, based on the ratio of its individual net assets to the net assets of all participants at the time the fee is due and payable. The fee is paid quarterly in arrears. Because several investment companies participate, there is no assurance that an individual Fund will have access to all or any part of the $150,000,000 at any particular time. There were no loans outstanding pursuant to this line of credit at December 31, 2009. During the year ended December 31, 2009, the Fund did not utilize this line of credit.
18
Note F--Investments in Affiliates:
| Name of Issuer | | Balance of
Shares
Held
December 31,
2008 | | Gross
Purchases
and
Additions | | Gross
Sales
and
Reductions | | Balance of
Shares
Held
December 31,
2009 | | Value
December 31,
2009 | | Income from
Investments in
Affiliated
Issuers
Included in
Total Income | |
Neuberger Berman Prime
Money Fund Trust Class* | | | 6,515,863 | | | | 43,290,622 | | | | 49,806,485 | | | | -- | | | $ | -- | | | $ | 6,217 | | |
Neuberger Berman Securities
Lending Quality Fund, LLC** | | | 32,858,620 | | | | 83,920,968 | | | | 116,323,706 | | | | 455,882 | | | | 465,000 | | | | 218,442 | | |
| Total | | | | | | | | | | $ | 465,000 | | | $ | 224,659 | | |
* Prime Money was also managed by Management and may have been considered an affiliate since it had the same officers, Board members, and investment manager as the Fund and because, at times, the Fund may have owned 5% or more of the outstanding voting securities of Prime Money.
** Quality Fund, a fund managed by NBFI, an affiliate of Management, is used to invest cash the Fund receives as collateral for securities loaned as approved by the Board. Because all shares of Quality Fund are held by funds in the related investment management complex, Quality Fund may be considered an affiliate of the Fund.
Note G--Subsequent Events:
In accordance with the provision set forth in ASC 855 "Subsequent Events"("ASC 855") formerly known as FAS 165, "Subsequent Events," Management has evaluated the possibility of subsequent events existing in the Fund's financial statements through February 9, 2010. Management has determined that there are no subsequent events that, in accordance with ASC 855, would need to be disclosed in the Fund's financial statements through this date.
19
Financial Highlights
Partners Portfolio
The following table includes selected data for a share outstanding throughout each year and other performance information derived from the Financial Statements.
| | | Year Ended December 31, | |
| | | 2009 | | 2008 | | 2007 | | 2006 | | 2005 | |
| Net Asset Value, Beginning of Year | | $ | 7.11 | | | $ | 20.76 | | | $ | 21.16 | | | $ | 21.41 | | | $ | 18.32 | | |
| Income From Investment Operations: | |
| Net Investment Income (Loss)tt | | | .03 | | | | .08 | | | | .07 | | | | .12 | | | | .14 | | |
Net Gains or Losses on Securities
(both realized and unrealized) | | | 3.98 | | | | (10.78 | ) | | | 1.95 | | | | 2.33 | | | | 3.15 | | |
| Total From Investment Operations | | | 4.01 | | | | (10.70 | ) | | | 2.02 | | | | 2.45 | | | | 3.29 | | |
| Less Distributions From: | |
| Net Investment Income | | | (.24 | ) | | | (.09 | ) | | | (.15 | ) | | | (.16 | ) | | | (.19 | ) | |
| Net Capital Gains | | | (1.06 | ) | | | (2.86 | ) | | | (2.27 | ) | | | (2.54 | ) | | | (.01 | ) | |
| Total Distributions | | | (1.30 | ) | | | (2.95 | ) | | | (2.42 | ) | | | (2.70 | ) | | | (.20 | ) | |
| Net Asset Value, End of Year | | $ | 9.82 | | | $ | 7.11 | | | $ | 20.76 | | | $ | 21.16 | | | $ | 21.41 | | |
| Total Returntt | | | 56.23 | % | | | (52.37 | )% | | | 9.28 | % | | | 12.24 | % | | | 18.04 | % | |
| Ratios/Supplemental Data | |
| Net Assets, End of Year (in millions) | | $ | 96.7 | | | $ | 217.9 | | | $ | 526.7 | | | $ | 631.2 | | | $ | 732.0 | | |
| Ratio of Gross Expenses to Average Net Assets# | | | 1.05 | % | | | .95 | % | | | .91 | % | | | .91 | % | | | .90 | % | |
| Ratio of Net Expenses to Average Net AssetsS | | | 1.05 | % | | | .94 | % | | | .90 | % | | | .91 | % | | | .89 | % | |
Ratio of Net Investment Income (Loss) to Average
Net Assets | | | .34 | % | | | .53 | % | | | .33 | % | | | .57 | % | | | .70 | % | |
| Portfolio Turnover Rate | | | 41 | % | | | 38 | % | | | 43 | % | | | 36 | % | | | 58 | % | |
See Notes to Financial Highlights 20
Notes to Financial Highlights Partners Portfolio
tt Total return based on per share net asset value reflects the effects of changes in net asset value on the performance of the Fund during each fiscal period and assumes dividends and other distributions, if any, were reinvested. Results represent past performance and do not guarantee future results. Current returns may be lower or higher than the performance data quoted. Investment returns and principal may fluctuate and shares when redeemed may be worth more or less than original cost. Total return would have been lower if Management had not waived certain expenses. The total return information shown does not reflect charges and other expenses that apply to the separate account or the related insurance policies, and the inclusion of these charges and other expenses would reduce the total return for all fiscal periods shown.
# The Fund is required to calculate an expense ratio without taking into consideration any expense reductions related to expense offset arrangements.
tt Calculated based on the average number of shares outstanding during each fiscal period.
S After utilization of the Line of Credit (2007) and/or waiver of a portion of the investment management fee by Management. Had Management not undertaken such action, and the Fund had not utilized the Line of Credit the annualized ratios of net expenses to average daily net assets would have been:
| | | Year Ended December 31, | |
| 2009 | | 2008 | | 2007 | | 2006 | | 2005 | |
| | 1.06 | % | | | .94 | % | | | .90 | % | | | .91 | % | | | .89 | % | |
21
Report of Independent Registered Public Accounting Firm
To the Board of Trustees of
Neuberger Berman Advisers Management Trust and
Shareholders of Partners Portfolio
We have audited the accompanying statement of assets and liabilities, including the schedule of investments, of Partners Portfolio, one of the series constituting Neuberger Berman Advisers Management Trust (the "Trust"), as of December 31, 2009, and the related statement of operations for the year then ended, the statement of changes in net assets for each of the two years in the period then ended, and the financial highlights for each of the five years in the period then ended. These financial statements and financial highlights are the responsibility of the Trust's management. Our responsibility is to express an opinion on these financial statements and financial highlights based on our audits.
We conducted our audits in accordance with the standards of the Public Company Accounting Oversight Board (United States). Those standards require that we plan and perform the audit to obtain reasonable assurance about whether the financial statements and financial highlights are free of material misstatement. We were not engaged to perform an audit of the Trust's internal control over financial reporting. Our audits included consideration of internal control over financial reporting as a basis for designing audit procedures that are appropriate in the circumstances, but not for the purpose of expressing an opinion on the effectiveness of the Trust's internal control over financial reporting. Accordingly, we express no such opinion. An audit also includes examining, on a test basis, evidence supporting the amounts and disclosures in the financial statements and financial highlights, assessing the accounting principles used and significant estimates made by management, and evaluating the overall financial statement presentation. Our procedures included confirmation of securities owned as of December 31, 2009 by correspondence with the custodian and brokers. We believe that our audits provide a reasonable basis for our opinion.
In our opinion, the financial statements and financial highlights referred to above present fairly, in all material respects, the financial position of Partners Portfolio, a series of Neuberger Berman Advisers Management Trust, at December 31, 2009, the results of its operations for the year then ended, the changes in its net assets for each of the two years in the period then ended, and the financial highlights for each of the five years in the period then ended, in conformity with U.S. generally accepted accounting principles.
Boston, Massachusetts
February 9, 2010
22
Trustee and Officer Information
The following tables set forth information concerning the trustees and officers of the Trust. All persons named as trustees and officers also serve in similar capacities for other funds administered or managed by Management and Neuberger. The Statement of Additional Information includes additional information about fund trustees and is available upon request, without charge, by calling (800) 877-9700.
Information about the Board of Trustees
Name, (Year of Birth),
and Address(1) | | Position and
Length of
Time Served(2) | | Principal Occupation(s)(3) | | Number of
Funds in Fund
Complex
Overseen by
Fund Trustee | | Other Directorships
Held Outside Fund
Complex by Fund
Trustee | |
| Independent Fund Trustees | |
|
| John Cannon (1930) | | Trustee since 2000 | | Consultant; formerly, Chairman, CDC Investment Advisers (registered investment adviser), 1993 to January 1999; formerly, President and Chief Executive Officer, AMA Investment Advisors, an affiliate of the American Medical Association. | | | 46 | | | Formerly, Independent Trustee or Director of three series of Oppenheimer Funds: Oppenheimer Limited Term New York Municipal Fund, Rochester Fund Municipals, and Oppenheimer Convertible Securities Fund (1992 to 2009). | |
|
| Faith Colish (1935) | | Trustee since 1982 | | Counsel, Carter Ledyard & Milburn LLP (law firm) since October 2002; formerly, Attorney-at-Law and President, Faith Colish, A Professional Corporation, 1980 to 2002. | | | 46 | | | Formerly, Director (1997 to 2003) and Advisory Director (2003 to 2006), ABA Retirement Funds (formerly, American Bar Retirement Association) (not-for-profit membership corporation). | |
|
23
Name, (Year of Birth),
and Address(1) | | Position and
Length of
Time Served(2) | | Principal Occupation(s)(3) | | Number of
Funds in Fund
Complex
Overseen by
Fund Trustee | | Other Directorships
Held Outside Fund
Complex by Fund
Trustee | |
| Martha C. Goss (1949) | | Trustee since 2007 | | President, Woodhill Enterprises Inc./Chase Hollow Associates LLC (personal investment vehicle), since 2006; Chief Operating and Financial Officer, Hopewell Holdings LLC/Amwell Holdings, LLC (a holding company for a healthcare reinsurance company start-up), since 2003; formerly, Consultant, Resources Connection (temporary staffing), 2002 to 2006. | | | 46 | | | Director, Ocwen Financial Corporation (mortgage servicing), since 2005; Director, American Water (water utility), since 2003; Director, Channel Reinsurance (financial guaranty reinsurance), since 2006; Advisory Board Member, Attensity (software developer), since 2005; Director, Allianz Life of New York (insurance), since 2005; Director, Financial Women's Association of New York (not for profit association), since 2003; Trustee Emerita, Brown University, since 1998. | |
|
| C. Anne Harvey (1937) | | Trustee since 1998 | | President, C.A. Harvey Associates, since October 2001; formerly, Director, AARP, 1978 to December 2001. | | | 46 | | | Formerly, President, Board of Associates to The National Rehabilitation Hospital's Board of Directors, 2001 to 2002; formerly, Member, Individual Investors Advisory Committee to the New York Stock Exchange Board of Directors, 1998 to June 2002. | |
|
| Robert A. Kavesh (1927) | | Trustee since 2000 | | Retired; Marcus Nadler Professor Emeritus of Finance and Economics, New York University Stern School of Business; formerly, Executive Secretary-Treasurer, American Finance Association, 1961 to 1979. | | | 46 | | | Formerly, Director, The Caring Community (not-for-profit), 1997 to 2006; formerly, Director, DEL Laboratories, Inc. (cosmetics and pharmaceuticals), 1978 to 2004; formerly, Director, Apple Bank for Savings, 1979 to 1990; formerly, Director, Western Pacific Industries, Inc., 1972 to 1986 (public company). | |
|
24
Name, (Year of Birth),
and Address(1) | | Position and
Length of
Time Served(2) | | Principal Occupation(s)(3) | | Number of
Funds in Fund
Complex
Overseen by
Fund Trustee | | Other Directorships
Held Outside Fund
Complex by Fund
Trustee | |
| Michael M. Knetter (1960) | | Trustee since 2007 | | Dean, School of Business, University of Wisconsin - Madison; formerly, Professor of International Economics and Associate Dean, Amos Tuck School of Business - Dartmouth College, 1998 to 2002. | | | 46 | | | Trustee, Northwestern Mutual Series Fund, Inc., since February 2007; Director, Wausau Paper, since 2005; Director, Great Wolf Resorts, since 2004. | |
|
| Howard A. Mileaf (1937) | | Trustee since 1999 | | Retired; formerly, Vice President and General Counsel, WHX Corporation (holding company), 1993 to 2001. | | | 46 | | | Formerly, Director, Webfinancial Corporation (holding company), 2002 to 2008; formerly, Director WHX Corporation (holding company), January 2002 to June 2005; formerly, Director, State Theatre of New Jersey (not-for-profit theater), 2000 to 2005. | |
|
| George W. Morriss (1947) | | Trustee since 2007 | | Retired; formerly, Executive Vice President and Chief Financial Officer, People's Bank, Connecticut (a financial services company), 1991 to 2001. | | | 46 | | | Manager, Old Mutual 2100 fund complex (consisting of six funds) since October 2006 for four funds and since February 2007 for two funds; formerly, Member NASDAQ Issuers' Affairs Committee, 1995 to 2003. | |
|
| Edward I. O'Brien (1928) | | Trustee since 2000 | | Retired; Formerly, Member, Investment Policy Committee, Edward Jones, 1993 to 2001; President, Securities Industry Association ("SIA") (securities industry's representative in government relations and regulatory matters at the federal and state levels), 1974 to 1992; Adviser to SIA, November 1992 to November 1993. | | | 46 | | | Formerly, Director, Legg Mason, Inc. (financial services holding company), 1993 to July 2008; formerly, Director, Boston Financial Group (real estate and tax shelters), 1993 to 1999. | |
|
25
Name, (Year of Birth),
and Address(1) | | Position and
Length of
Time Served(2) | | Principal Occupation(s)(3) | | Number of
Funds in Fund
Complex
Overseen by
Fund Trustee | | Other Directorships
Held Outside Fund
Complex by Fund
Trustee | |
| Cornelius T. Ryan (1931) | | Trustee since 2000 | | Founding General Partner, Oxford Partners and Oxford Bioscience Partners (venture capital investing) and President, Oxford Venture Corporation, since 1981. | | | 46 | | | None. | |
|
| Tom D. Seip (1950) | | Trustee since 2000; Chairman of the Board since 2008; Lead Independent Trustee from 2006 to 2008 | | General Partner, Seip Investments LP (a private investment partnership); formerly, President and CEO, Westaff, Inc. (temporary staffing), May 2001 to January 2002; formerly, Senior Executive at the Charles Schwab Corporation, 1983 to 1998, including Chief Executive Officer, Charles Schwab Investment Management, Inc., and Trustee, Schwab Family of Funds and Schwab Investments, 1997 to 1998, and Executive Vice President-Retail Brokerage, Charles Schwab & Co., Inc., 1994 to 1997. | | | 46 | | | Director, H&R Block, Inc. (financial services company), since May 2001; Chairman, Compensation Committee, H&R Block, Inc., since 2006; formerly, Director, Forward Management, Inc. (asset management company), 1999 to 2006. | |
|
26
Name, (Year of Birth),
and Address(1) | | Position and
Length of
Time Served(2) | | Principal Occupation(s)(3) | | Number of
Funds in Fund
Complex
Overseen by
Fund Trustee | | Other Directorships
Held Outside Fund
Complex by Fund
Trustee | |
| Candace L. Straight (1947) | | Trustee since 1999 | | Private investor and consultant specializing in the insurance industry; formerly, Advisory Director, Securitas Capital LLC (a global private equity investment firm dedicated to making investments in the insurance sector), 1998 to December 2003. | | | 46 | | | Director, Montpelier Re (reinsurance company), since 2006; formerly, Director, National Atlantic Holdings Corporation (property and casualty insurance company), 2004 to 2008; formerly, Director, The Proformance Insurance Company (property and casualty insurance company), 2004 to 2008; formerly, Director, Providence Washington Insurance Company (property and casualty insurance company), December 1998 to March 2006; formerly, Director, Summit Global Partners (insurance brokerage firm), 2000 to 2005. | |
|
| Peter P. Trapp (1944) | | Trustee since 1984 | | Retired; formerly, Regional Manager for Mid-Southern Region, Ford Motor Credit Company, September 1997 to 2007; formerly, President, Ford Life Insurance Company, April 1995 to August 1997. | | | 46 | | | None. | |
|
27
Name, (Year of Birth),
and Address(1) | | Position and
Length of
Time Served(2) | | Principal Occupation(s)(3) | | Number of
Funds in Fund
Complex
Overseen by
Fund Trustee | | Other Directorships
Held Outside Fund
Complex by Fund
Trustee | |
| Fund Trustees who are "Interested Persons" | |
|
| Joseph V. Amato* (1962) | | Trustee since 2009 | | President and Director, Neuberger Berman Group LLC, since 2009; President and Chief Executive Officer, Neuberger and Neuberger Berman Holdings LLC (including its predecessor, Neuberger Berman Inc.), since 2007; Chief Investment Officer, Neuberger, since 2009; Chief Executive Officer (Equities) and Managing Director, Management, since 2009; Managing Director, Neuberger Berman Fixed Income LLC ("NBFI"), since 2007; Board member of NBFI since 2006; formerly, Global Head of Asset Management of Lehman Brothers Holdings Inc.'s ("LBHI") Investment Management division, 2006 to 2009; formerly, member of LBHI's Investment Management Division's Executive Management Committee, 2006 to 2009; formerly, Managing Director, Lehman Brothers Inc. ("LBI"), 2006 to 2008; formerly, Chief Recruiting and Development Officer, LBI, 2005 to 2006; formerly, Global Head of LBI's Equity Sales and a Member of its Equities Division Executive Committee, 2003 to 2005. | | | 46 | | | Member of Board of Advisors, McDonough School of Business, Georgetown University, since 2001; Member of New York City Board of Advisors, Teach for America, since 2005; Trustee, Montclair Kimberley Academy (private school), since 2007. | |
|
28
Name, (Year of Birth),
and Address(1) | | Position and
Length of
Time Served(2) | | Principal Occupation(s)(3) | | Number of
Funds in Fund
Complex
Overseen by
Fund Trustee | | Other Directorships
Held Outside Fund
Complex by Fund
Trustee | |
| Robert Conti* (1956) | | Chief Executive Officer, President and Trustee since 2008; prior thereto, Executive Vice President in 2008 and Vice President 2000 to 2008 | | Managing Director, Neuberger, since 2007; formerly, Senior Vice President, Neuberger, 2003 to 2006; formerly, Vice President, Neuberger, 1999 to 2003; President and Chief Executive Officer, Management, since 2008; formerly, Senior Vice President, Management, 2000 to 2008. | | | 46 | | | Chairman of the Board, Staten Island Mental Health Society since 2008. | |
|
| Jack L. Rivkin* (1940) | | Trustee since 2002; President from 2002 to 2008 | | Formerly, Executive Vice President and Chief Investment Officer, Neuberger Berman Holdings LLC (holding company), 2002 to August 2008 and 2003 to August 2008, respectively; formerly, Managing Director and Chief Investment Officer, Neuberger, December 2005 to August 2008 and 2003 to August 2008, respectively; formerly, Executive Vice President, Neuberger, December 2002 to 2005; formerly, Director and Chairman, Management, December 2002 to August 2008; formerly, Executive Vice President, Citigroup Investments, Inc., September 1995 to February 2002; formerly, Executive Vice President, Citigroup Inc., September 1995 to February 2002. | | | 46 | | | Director, Idealab (private company), since 2009; Director, Distributed World Power (private company), since 2009; Director, Dale Carnegie and Associates, Inc. (private company), since 1998; Director, Solbright, Inc. (private company), since 1997; formerly, Director, New York Society of Security Analysts (2006 to 2008). | |
|
(1) The business address of each listed person is 605 Third Avenue, New York, New York 10158.
(2) Pursuant to the Trust's Trust Instrument, each of these Fund Trustees shall hold office for life or until his or her successor is elected or the Trust terminates; except that (a) any Fund Trustee may resign by delivering a written resignation; (b) any Fund Trustee may be removed with or without cause at any time by a written instrument signed by at least two-thirds of the other Fund Trustees; (c) any Fund Trustee who requests to be retired, or who has become unable to serve, may be retired by a written instrument signed by a majority of the other Fund Trustees; and (d) any Fund Trustee may be removed at any shareholder meeting by a vote of at least two-thirds of the outstanding shares.
29
(3) Except as otherwise indicated, each individual has held the positions shown for at least the last five years.
* Indicates a Fund Trustee who is an "interested person" within the meaning of the 1940 Act. Mr. Amato and Mr. Conti are interested persons of the Trust by virtue of the fact that each is an officer of Management, Neuberger and/or their affiliates. Mr. Rivkin may be deemed an interested person of the Trust by virtue of the fact that, until August 2008, he was a director of Management and an officer of Neuberger.
30
Information about the Officers of the Trust
Name, (Year of Birth),
and Address(1) | | Position and
Length of Time
Served(2) | | Principal Occupation(s)(3) | |
| Andrew B. Allard (1961) | | Anti-Money Laundering Compliance Officer since 2002 | | Senior Vice President, Neuberger, since 2006; Deputy General Counsel, Neuberger, since 2004; formerly, Vice President, Neuberger, 2000 to 2005; formerly, Associate General Counsel, Neuberger, 1999 to 2004; Anti-Money Laundering Compliance Officer, nine registered investment companies for which Management acts as investment manager and administrator (six since 2002, two since 2003 and one since 2006). | |
|
| Claudia A. Brandon (1956) | | Executive Vice President since 2008 and Secretary since 1985 | | Senior Vice President, Neuberger, since 2007 and Employee since 1999; formerly, Vice President, Neuberger, 2002 to 2006; Senior Vice President, Management, since 2008 and Assistant Secretary since 2004; formerly, Vice President-Mutual Fund Board Relations, Management, 2000 to 2008; Executive Vice President, nine registered investment companies for which Management acts as investment manager and administrator (nine since 2008); Secretary, nine registered investment companies for which Management acts as investment manager and administrator (three since 1985, three since 2002, two since 2003 and one since 2006). | |
|
| Maxine L. Gerson (1950) | | Executive Vice President since 2008 and Chief Legal Officer since 2005 (only for purposes of sections 307 and 406 of the Sarbanes-Oxley Act of 2002) | | Senior Vice President, Neuberger, since 2002; Deputy General Counsel and Assistant Secretary, Neuberger, since 2001; Senior Vice President, Management, since 2006; Secretary and General Counsel, Management, since 2004; Executive Vice President, nine registered investment companies for which Management acts as investment manager and administrator (nine since 2008); Chief Legal Officer (only for purposes of sections 307 and 406 of the Sarbanes-Oxley Act of 2002), nine registered investment companies for which Management acts as investment manager and administrator (eight since 2005 and one since 2006). | |
|
| Sheila R. James (1965) | | Assistant Secretary since 2002 | | Vice President, Neuberger, since 2008 and Employee since 1999; formerly, Assistant Vice President, Neuberger, 2007; Assistant Secretary, nine registered investment companies for which Management acts as investment manager and administrator (six since 2002, two since 2003 and one since 2006). | |
|
| Brian Kerrane (1969) | | Vice President since 2008 | | Senior Vice President, Neuberger, since 2006; formerly, Vice President, Neuberger, 2002 to 2006; Vice President, Management, since 2008 and Employee since 1991; Vice President, nine registered investment companies for which Management acts as investment manager and administrator (nine since 2008). | |
|
| Kevin Lyons (1955) | | Assistant Secretary since 2003 | | Assistant Vice President, Neuberger, since 2008 and Employee since 1999; Assistant Secretary, nine registered investment companies for which Management acts as investment manager and administrator (eight since 2003 and one since 2006). | |
|
31
Name, (Year of Birth),
and Address(1) | | Position and
Length of Time
Served(2) | | Principal Occupation(s)(3) | |
| Owen F. McEntee, Jr. (1961) | | Vice President since 2008 | | Vice President, Neuberger, since 2006; Employee, Management, since 1992; Vice President, nine registered investment companies for which Management acts as investment manager and administrator (nine since 2008). | |
|
| John M. McGovern (1970) | | Treasurer and Principal Financial and Accounting Officer since 2005; prior thereto, Assistant Treasurer since 2002 | | Senior Vice President, Neuberger, since 2007; formerly, Vice President, Neuberger, 2004 to 2006; Employee, Management, since 1993; Treasurer and Principal Financial and Accounting Officer, nine registered investment companies for which Management acts as investment manager and administrator (eight since 2005 and one since 2006); formerly, Assistant Treasurer, eight registered investment companies for which Management acts as investment manager and administrator, 2002 to 2005. | |
|
| Andrew Provencher (1965) | | Vice President since 2008 | | Managing Director, Management, since 2008; Managing Director, Neuberger, since 2005; formerly, Senior Vice President, Neuberger, 2003 to 2005; formerly, Vice President, Neuberger, 1999 to 2003; Vice President, nine registered investment companies for which Management acts as investment manager and administrator (nine since 2008). | |
|
| Frank Rosato (1971) | | Assistant Treasurer since 2005 | | Vice President, Neuberger, since 2006; Employee, Management, since 1995; Assistant Treasurer, nine registered investment companies for which Management acts as investment manager and administrator (eight since 2005 and one since 2006). | |
|
| Neil S. Siegel (1967) | | Vice President since 2008 | | Managing Director, Management, since 2008; Managing Director, Neuberger, since 2006; formerly, Senior Vice President, Neuberger, 2004 to 2006; Vice President, nine registered investment companies for which Management acts as investment manager and administrator (nine since 2008); formerly, Head of Institutional Marketing, Morgan Stanley Investment Management, 1993 to 2004. | |
|
| Chamaine Williams (1971) | | Chief Compliance Officer since 2005 | | Senior Vice President, Neuberger, since 2007; Chief Compliance Officer, Management, since 2006; Chief Compliance Officer, nine registered investment companies for which Management acts as investment manager and administrator (eight since 2005 and one since 2006); formerly, Senior Vice President, LBI, 2007 to 2008; formerly, Vice President, LBI, 2003 to 2006; formerly, Chief Compliance Officer, Lehman Brothers Asset Management Inc., 2003 to 2007; formerly, Chief Compliance Officer, Lehman Brothers Alternative Investment Management LLC, 2003 to 2007; formerly, Vice President, UBS Global Asset Management (US) Inc. (formerly, Mitchell Hutchins Asset Management, a wholly-owned subsidiary of PaineWebber Inc.), 1997 to 2003. | |
|
(1) The business address of each listed person is 605 Third Avenue, New York, New York 10158.
(2) Pursuant to the By-Laws of the Trust, each officer elected by the Fund Trustees shall hold office until his or her successor shall have been elected and qualified or until his or her earlier death, inability to serve, or resignation. Officers serve at the pleasure of the Fund Trustees and may be removed at any time with or without cause.
(3) Except as otherwise indicated, each individual has held the positions shown for at least the last five years.
32
Proxy Voting Policies and Procedures
A description of the policies and procedures that the Trust uses to determine how to vote proxies relating to portfolio securities is available, without charge, by calling 1-800-877-9700 (toll-free) and on the website of the Securities and Exchange Commission, at www.sec.gov. Information regarding how the Trust voted proxies relating to portfolio securities during the most recent 12-month period ended June 30 is also available, without charge, by calling 1-800-877-9700 (toll-free), on the website of the Securities and Exchange Commission at www.sec.gov, and on Management's website at www.nb.com.
Quarterly Portfolio Schedule
The Trust files a complete schedule of portfolio holdings for the Fund with the Securities and Exchange Commission for the first and third quarters of each fiscal year on Form N-Q. The Trust's Forms N-Q are available on the Securities and Exchange Commission's website at www.sec.gov and may be reviewed and copied at the Securities and Exchange Commission's Public Reference Room in Washington, DC. Information on the operation of the Public Reference Room may be obtained by calling 1-800-SEC-0330. The information on Form N-Q is available upon request, without charge, by calling 1-800-877-9700 (toll-free).
Notice to Shareholders (Unaudited)
The Fund hereby designates $9,167,082 as a capital gain distribution.
100.00% of the dividends distributed during the fiscal year ended December 31, 2009 qualifies for the dividends received deduction for corporate shareholders.
33
Neuberger Berman
Advisers Management Trust
Regency Portfolio
I Class Shares
S Class Shares
Annual Report
December 31, 2009
B1012 02/10
Regency Portfolio Manager's Commentary
For the year ended December 31, 2009, the Neuberger Berman Advisers Management Trust (AMT) Regency Portfolio significantly outperformed its benchmark, the Russell Midcap(R) Value Index.
The stabilization of the financial system and increasingly encouraging economic data fueled the rally of the stock market off its bottom in early March 2009. More economically sensitive sectors such as Consumer Discretionary, Information Technology, Energy and Materials set the pace. Although Financials sector stocks rebounded strongly off their lows and finished with mid-teen percentage gains, it was the worst performing group in the Russell Midcap Value Index for the full year.
For the Portfolio, favorable stock selection in six of the nine sectors in which it was invested was the key to outperformance in 2009, accounting for virtually all of its relative return advantage; sector allocation had a modestly negative impact on relative results. Investments in the Materials, Energy, Financials and Industrials sectors had the most favorable impact on returns; Information Technology, Health Care and Consumer Discretionary holdings lagged their respective benchmark sector counterparts.
Two Materials sector companies, Teck Resources and Freeport-McMoRan Copper & Gold, finished among the Portfolio's top 10 contributors to absolute performance. Energy was represented on the list by Whiting Petroleum and Talisman Energy. Top contributors from the Financials sector included Morgan Stanley (which we sold), Jefferies Group, Macerich and Invesco. While no Industrials sector investments appeared among the top 10 contributors, generally strong performance of holdings in this sector enhanced relative returns. The list of the bottom 10 contributors included Zions Bancorp and KeyCorp in the Financials sector, Constellation Brands in the Consumer Staples category, and FirstEnergy Corp. in the Utilities sector. We have eliminated the latter two stocks from the Portfolio.
Our response to the savage bear market that began in the fall of 2007 and finally ended in the spring of 2009 was to take advantage of evolving opportunities in what we consider the very best companies in their respective businesses. We successfully added to and built new positions in what we believe are high quality companies trading at deeply discounted valuations relative to normalized earnings and long-term earnings power. We believe that our focus on quality and value was primarily responsible for the Portfolio's strong absolute and relative return in 2009.
For us, sector allocation is largely determined by where we are finding the best individual opportunities. This duly noted, at the end of 2009, the Portfolio was overweighted in Energy, Health Care and Industrials and underweighted in Financials and Materials.
While economic data are still generally positive and job losses are finally trending lower, the jury is out regarding the strength and endurance of the economic recovery. The naysayers (and judging by the strong demand for U.S. Treasuries, there are plenty of them out there) appear to believe that unless and until we see job growth and a firming of the still-soft housing market, consumer spending will remain weak, restraining economic expansion and perhaps even spawning a "double dip" recession. We have a more balanced view. We think low interest rates and gradually improving credit conditions will help the economy continue to expand in the near term at a relatively modest pace. Looking a little farther ahead, our primary concern is when and how the Federal Reserve will transition from its current easy money policy and how the financial markets will react to soaring government expenditures and rapidly expanding federal deficits that we think will likely result in higher tax rates. We are pleased with the Portfolio's strong absolute and relative performance in 2009. However, we currently don't expect the equity market to be quite as generous in the year ahead.
Although stocks have had quite a run following the March low, and the AMT Regency Portfolio has significantly outperformed its benchmark, we believe the valuations of high-quality companies in a wide range of industry groups remain reasonable relative to long-term earnings power. If the equities markets continue to advance, we expect our portfolio of "best of breed" companies to participate. If the market weakens, we believe the stocks of high-quality companies will hold up considerably better than more speculative issues.
Sincerely,
S. Basu Mullick
Portfolio Manager
1
Regency Portfolio
SECTOR ALLOCATION
| (% of Equity Market Value) | |
| Consumer Discretionary | | | 15.9 | % | |
| Consumer Staples | | | 6.0 | | |
| Energy | | | 12.7 | | |
| Financials | | | 22.9 | | |
| Health Care | | | 7.6 | | |
| Industrials | | | 15.1 | | |
| Information Technology | | | 6.5 | | |
| Materials | | | 5.7 | | |
| Utilities | | | 7.6 | | |
| Total | | | 100.0 | % | |
AVERAGE ANNUAL TOTAL RETURN1
| | | Inception
Date | |
1 Year | |
5 Years | | Life of
Fund* | |
| Regency Portfolio Class I | | 08/22/2001 | | | 46.56 | % | | | 0.42 | % | | | 5.08 | % | |
| Regency Portfolio Class S2 | | 04/29/2005 | | | 46.16 | % | | | 0.22 | % | | | 4.96 | % | |
| Russell Midcap(R) Value Index3 | | | | | 34.21 | % | | | 1.98 | % | | | 6.59 | % | |
| Russell Midcap(R) Index3 | | | | | 40.48 | % | | | 2.43 | % | | | 6.04 | % | |
Performance data quoted represent past performance, which is no guarantee of future results. The investment return and principal value of an investment will fluctuate so that an investor's shares, when redeemed may be worth more or less than their original cost. Results are shown on a "total return" basis and include reinvestment of all income dividends and distributions.
Current performance may be lower or higher than the performance data quoted. For performance data current to the most recent month end, please visit https://www.nb.com.
* Index returns are as of inception date 08/22/2001.
As stated in the Portfolio's most recent prospectus, the total annual fund operating expense ratios for fiscal year 2008 were 0.97% and 1.23% for Class I and Class S shares, respectively (prior to any fee waivers or expense reimbursements). Neuberger Berman Management LLC has contractually agreed to limit certain expenses of the Portfolio through 12/31/2012 for Class I shares and through 12/31/2019 for Class S shares.
COMPARISON OF A $10,000 INVESTMENT
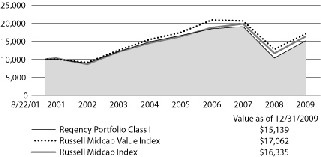
The chart shows the value of a hypothetical $10,000 investment in the Portfolio over the past 10 fiscal years, or since the Portfolio's inception, if it has not operated for 10 years. The graphs are based on Class I shares only; performance of other classes will vary due to differences in fee structures (see Average Annual Total Return chart above). The result is compared with benchmarks, which may include a broad-based market index and/or a narrower index. Please note that market indexes do not include expenses. All results include the reinvestment of income dividends and distributions. Results represent past performance and do not indicate future results. The chart and table do not reflect the deduction of taxes that a shareholder would pay on Portfolio distributions or the redemption of Portfolio shares.
Please see Endnotes for additional information.
2
Endnotes
1 "Total Return" includes reinvestment of all income dividends and distributions. Results represent past performance and do not indicate future results. The value of an investment in the Portfolio and the return on the investment both will fluctuate, and redemption proceeds may be higher or lower than an investor's original cost. The performance information does not reflect fees and expenses of the variable annuity and variable life insurance policies or the qualified pension and retirement plans whose proceeds are invested in the Portfolio. Neuberger Berman Management LLC ("NBM LLC") has agreed to absorb certain expenses of the AMT Portfolios, including the Portfolio. Without this arrangement, which is subject to change, the total returns of the Portfolio may have been less.
2 Performance shown prior to April 29, 2005 for the Class S shares is that of the Class I shares, which have lower expenses and correspondingly higher returns than Class S shares.
3 The Russell Midcap(R) Value Index measures the performance of those Russell Midcap(R) Index companies with lower price-to-book ratios and lower forecasted growth values. The Russell Midcap Index measures the performance of the 800 smallest companies in the Russell 1000(R) Index, which represents approximately 31% of the total market capitalization of the Russell 1000 Index (which, in turn, consists of the 1,000 largest U.S. companies, based on market capitalization). Please note that indices do not take into account any fees and expenses of investing in the individual securities that they track and that individuals cannot invest directly in any index. Data about the performance of these indices are prepared or obtained by NBM LLC and include reinvestment of all income dividends and distributions. The Portfolio may invest in many securities not included in the above-described indices.
Any ratios or other measurements using a factor of forecasted earnings of a company discussed herein are based on consensus estimates, not NBM LLC's own projections, and they may or may not be realized. In addition, any revision to a forecast could affect the market price of a security. By quoting them herein, NBM LLC does not offer an opinion as to the accuracy of and does not guarantee these forecasted numbers.
The investments for the Portfolio are managed by the same portfolio manager(s) who manage one or more other mutual funds that have similar names, investment objectives and investment styles as the Portfolio. You should be aware that the Portfolio is likely to differ from the other mutual funds in size, cash flow pattern and tax matters. Accordingly, the holdings and performance can be expected to vary from those of the other mutual funds.
The composition, industries and holdings of the Portfolio are subject to change.
Shares of the separate AMT Portfolios are not available to the general public. Shares of this Portfolio may be purchased only by life insurance companies to be used with their separate accounts that fund variable annuity and variable life insurance policies and by qualified pension and retirement plans.
Statistics and projections in this report are derived from sources deemed to be reliable but cannot be regarded as a representation of future results of the AMT Portfolios. This report is prepared for the general information of shareholders and is not an offer of shares of the AMT Portfolios. Shares of the AMT Portfolios are sold only through the currently effective prospectuses, which must precede or accompany this report.
(c) 2010 Neuberger Berman Management LLC distributor. All rights reserved.
3
Information About Your Fund's Expenses
This table is designed to provide information regarding costs related to your investments. All mutual funds incur operating expenses, which include management fees, fees for administrative services and costs of shareholder reports, among others. The following examples are based on an investment of $1,000 made at the beginning of the six month period ended December 31, 2009 and held for the entire period. The table illustrates the fund's costs in two ways:
| Actual Expenses and Performance: | | The first section of the table provides information about actual account values and actual expenses in dollars, based on the fund's actual performance during the period. You may use the information in this line, together with the amount you invested, to estimate the expenses you paid over the period. Simply divide your account value by $1,000 (for example, an $8,600 account value divided by $1,000 = 8.6), then multiply the result by the number in the first section of the table under the heading entitled "Expenses Paid During the Period" to estimate the expenses you paid over the period. | |
|
Hypothetical Example for
Comparison Purposes: | | The second section of the table provides information about hypothetical account values and hypothetical expenses based on the fund's actual expense ratio and an assumed rate of return at 5% per year before expenses. This return is not the fund's actual return. The hypothetical account values and expenses may not be used to estimate the actual ending account balance or expenses you paid for the period. You may use this information to compare the ongoing costs of investing in this fund versus other funds. To do so, compare the expenses shown in this 5% hypothetical example with the 5% hypothetical examples that appear in the shareholder reports of other funds. | |
|
Please note that the expenses in the table are meant to highlight your ongoing costs only. The table and expense example do not include any transactional costs, such as fees and expenses that are, or may be, imposed under your variable contract or qualified pension plan. Therefore, the information under the heading "Hypothetical (5% annual return before expenses)" is useful in comparing ongoing costs only, and will not help you determine the relative total costs of owning different funds. In addition, if these transactional costs were included, your costs would have been higher.
Expense Information as of 12/31/09 (Unaudited)
NEUBERGER BERMAN ADVISERS MANAGEMENT TRUST REGENCY PORTFOLIO
| Actual | | Beginning Account
Value 7/1/09 | | Ending Account
Value 12/31/09 | | Expenses Paid During
the Period*
7/1/09 - 12/31/09 | | Expense
Ratio | |
| Class I | | $ | 1,000.00 | | | $ | 1,342.30 | | | $ | 6.55 | | | | 1.11 | % | |
| Class S | | $ | 1,000.00 | | | $ | 1,340.90 | | | $ | 7.38 | | | | 1.25 | % | |
| Hypothetical (5% annual return before expenses)** | |
| Class I | | $ | 1,000.00 | | | $ | 1,019.61 | | | $ | 5.65 | | | | 1.11 | % | |
| Class S | | $ | 1,000.00 | | | $ | 1,018.90 | | | $ | 6.36 | | | | 1.25 | % | |
* For each class of the fund, expenses are equal to the annualized expense ratio for the class, multiplied by the average account value over the period, multiplied by 184/365 (to reflect the one-half year period shown).
** Hypothetical 5% annual return before expenses is calculated by multiplying the number of days in the most recent half year divided by 365.
4
Schedule of Investments Regency Portfolio
| NUMBER OF SHARES | | | | VALUEt | |
| Common Stocks (98.0%) | | | |
| Aerospace & Defense (2.3%) | | | |
| | 73,600 | | | Embraer-Empresa Brasileira de
Aeronautica ADR | | $ | 1,627,296 | | |
| | 19,700 | | | L-3 Communications Holdings | | | 1,712,915 | | |
| | | | 3,340,211 | | |
| Auto Components (3.6%) | | | |
| | 55,200 | | | American Axle &
Manufacturing Holdings | | | 442,704 | * | |
| | 30,500 | | | Johnson Controls | | | 830,820 | | |
| | 33,000 | | | Lear Corp. | | | 2,232,120 | * | |
| | 64,100 | | | WABCO Holdings | | | 1,653,139 | | |
| | | | 5,158,783 | | |
| Automobiles (1.7%) | | | |
| | 95,600 | | | Harley-Davidson | | | 2,409,120 | | |
| Beverages (1.4%) | | | |
| | 72,800 | | | Dr. Pepper Snapple Group | | | 2,060,240 | | |
| Building Products (2.7%) | | | |
| | 106,200 | | | Masco Corp. | | | 1,466,622 | | |
| | 92,600 | | | Owens Corning | | | 2,374,264 | * | |
| | | | 3,840,886 | | |
| Capital Markets (2.2%) | | | |
| | 102,200 | | | Invesco Ltd. | | | 2,400,678 | | |
| | 33,500 | | | Jefferies Group | | | 794,955 | * | |
| | | | 3,195,633 | | |
| Commercial Banks (7.0%) | | | |
| | 64,400 | | | Comerica Inc. | | | 1,904,308 | | |
| | 208,900 | | | Fifth Third Bancorp | | | 2,036,775 | | |
| | 81,039 | | | First Horizon National | | | 1,085,923 | * | |
| | 180,700 | | | KeyCorp | | | 1,002,885 | | |
| | 271,500 | | | Regions Financial | | | 1,436,235 | * | |
| | 85,000 | | | SunTrust Banks | | | 1,724,650 | | |
| | 73,300 | | | Zions Bancorp | | | 940,439 | | |
| | | | 10,131,215 | | |
| Construction & Engineering (1.8%) | | | |
| | 126,100 | | | Chicago Bridge & Iron | | | 2,549,742 | * | |
| Diversified Financial Services (1.9%) | | | |
| | 101,100 | | | Moody's Corp. | | | 2,709,480 | * | |
| NUMBER OF SHARES | | | | VALUEt | |
| Electric Utilities (4.0%) | | | |
| | 35,400 | | | Allegheny Energy | | $ | 831,192 | | |
| | 63,600 | | | DPL Inc. | | | 1,755,360 | | |
| | 11,300 | | | Entergy Corp. | | | 924,792 | | |
| | 124,200 | | | NV Energy | | | 1,537,596 | | |
| | 22,200 | | | PPL Corp. | | | 717,282 | | |
| | | | 5,766,222 | | |
Electronic Equipment, Instruments &
Components (2.5%) | | | |
| | 44,400 | | | Anixter International | | | 2,091,240 | * | |
| | 48,800 | | | Avnet, Inc. | | | 1,471,808 | * | |
| | | | 3,563,048 | | |
| Energy Equipment & Services (3.1%) | | | |
| | 36,700 | | | National Oilwell Varco | | | 1,618,103 | | |
| | 52,400 | | | Noble Corp. | | | 2,132,680 | | |
| | 13,400 | | | Oceaneering International | | | 784,168 | * | |
| | | | 4,534,951 | | |
| Food Products (0.6%) | | | |
| | 13,800 | | | J.M. Smucker | | | 852,150 | | |
| Health Care Providers & Services (5.9%) | | | |
| | 49,800 | | | Aetna Inc. | | | 1,578,660 | | |
| | 73,500 | | | AmerisourceBergen Corp. | | | 1,916,145 | | |
| | 38,400 | | | CIGNA Corp. | | | 1,354,368 | | |
| | 56,100 | | | Coventry Health Care | | | 1,362,669 | * | |
| | 38,700 | | | MEDNAX, Inc. | | | 2,326,257 | * | |
| | | | 8,538,099 | | |
| Household Durables (2.8%) | | | |
| | 80,800 | | | KB HOME | | | 1,105,344 | | |
| | 37,200 | | | Whirlpool Corp. | | | 3,000,552 | | |
| | | | 4,105,896 | | |
| Household Products (1.5%) | | | |
| | 34,800 | | | Energizer Holdings | | | 2,132,544 | * | |
Independent Power Producers &
Energy Traders (1.3%) | | | |
| | 79,600 | | | NRG Energy | | | 1,879,356 | * | |
| Industrial Conglomerates (0.9%) | | | |
| | 52,900 | | | McDermott International | | | 1,270,129 | * | |
See Notes to Schedule of Investments 5
| NUMBER OF SHARES | | | | VALUEt | |
| Insurance (6.9%) | | | |
| | 70,500 | | | Assurant, Inc. | | $ | 2,078,340 | | |
| | 53,100 | | | Fidelity National Financial
Class A | | | 714,726 | | |
| | 19,500 | | | PartnerRe Ltd. | | | 1,455,870 | | |
| | 81,200 | | | Principal Financial Group | | | 1,952,048 | | |
| | 51,500 | | | StanCorp Financial Group | | | 2,061,030 | | |
| | 67,600 | | | W.R. Berkley | | | 1,665,664 | | |
| | | | 9,927,678 | | |
| IT Services (3.9%) | | | |
| | 25,270 | | | Affiliated Computer Services | | | 1,508,366 | * | |
| | 64,200 | | | Fidelity National
Information Services | | | 1,504,848 | | |
| | 62,400 | | | Lender Processing Services | | | 2,537,184 | | |
| | | | 5,550,398 | | |
| Machinery (6.6%) | | | |
| | 38,900 | | | AGCO Corp. | | | 1,258,026 | * | |
| | 50,800 | | | Bucyrus International | | | 2,863,596 | | |
| | 62,100 | | | Ingersoll-Rand PLC | | | 2,219,454 | | |
| | 20,300 | | | Navistar International | | | 784,595 | * | |
| | 3,700 | | | SPX Corp. | | | 202,390 | | |
| | 107,800 | | | Terex Corp. | | | 2,135,518 | * | |
| | | | 9,463,579 | | |
| Marine (0.5%) | | | |
| | 33,900 | | | Genco Shipping & Trading | | | 758,682 | ** | |
| Media (3.4%) | | | |
| | 79,800 | | | Cablevision Systems | | | 2,060,436 | | |
| | 84,900 | | | McGraw-Hill Cos. | | | 2,844,999 | | |
| | | | 4,905,435 | | |
| Metals & Mining (5.1%) | | | |
| | 9,400 | | | Cliffs Natural Resources | | | 433,246 | | |
| | 15,300 | | | Freeport-McMoRan
Copper & Gold | | | 1,228,437 | * | |
| | 47,900 | | | Sterlite Industries (India) ADR | | | 872,738 | | |
| | 95,000 | | | Teck Resources Class B | | | 3,322,150 | * | |
| | 26,300 | | | United States Steel | | | 1,449,656 | | |
| | | | 7,306,227 | | |
| Multi-Utilities (2.1%) | | | |
| | 128,500 | | | CMS Energy | | | 2,012,310 | * | |
| | 23,900 | | | DTE Energy | | | 1,041,801 | | |
| | | | 3,054,111 | | |
| Multiline Retail (3.1%) | | | |
| | 87,400 | | | J.C. Penney | | | 2,325,714 | | |
| | 128,900 | | | Macy's Inc. | | | 2,160,364 | | |
| | | | 4,486,078 | | |
| NUMBER OF SHARES | | | | VALUEt | |
| Oil, Gas & Consumable Fuels (9.3%) | | | |
| | 28,800 | | | Cabot Oil & Gas | | $ | 1,255,392 | | |
| | 68,000 | | | Denbury Resources | | | 1,006,400 | * | |
| | 32,200 | | | Newfield Exploration | | | 1,553,006 | * | |
| | 29,700 | | | Noble Energy | | | 2,115,234 | | |
| | 56,433 | | | Ship Finance International | | | 769,182 | | |
| | 42,200 | | | Southwestern Energy | | | 2,034,040 | * | |
| | 91,695 | | | Talisman Energy | | | 1,709,195 | | |
| | 41,500 | | | Whiting Petroleum | | | 2,965,175 | * | |
| | | | 13,407,624 | | |
| Paper & Forest Products (0.5%) | | | |
| | 94,500 | | | Louisiana Pacific | | | 659,610 | * | |
| Personal Products (2.4%) | | | |
| | 78,200 | | | NBTY, Inc. | | | 3,404,828 | * | |
| Pharmaceuticals (1.6%) | | | |
| | 38,100 | | | Shire Limited ADR | | | 2,236,470 | | |
| Real Estate Investment Trusts (4.4%) | | | |
| | 10,700 | | | Alexandria Real Estate Equities | | | 687,903 | | |
| | 67,400 | | | Annaly Capital Management | | | 1,169,390 | | |
| | 17,026 | | | Boston Properties | | | 1,141,934 | | |
| | 31,748 | | | Macerich Co. | | | 1,141,340 | | |
| | 31,304 | | | Vornado Realty Trust | | | 2,189,402 | | |
| | | | 6,329,969 | | |
| Specialty Retail (1.0%) | | | |
| | 31,300 | | | GameStop Corp. Class A | | | 686,722 | * | |
| | 37,700 | | | Limited, Inc. | | | 725,348 | | |
| | | | 1,412,070 | | |
| | | | | Total Common Stocks
(Cost $107,166,170) | | | 140,940,464 | | |
| Short-Term Investments (7.6%) | | | |
| | 6,542,514 | | | Neuberger Berman Securities
Lending Quality Fund, LLC | | | 6,673,364 | tt | |
| | 4,340,493 | | | State Street Institutional
Liquid Reserves Fund
Institutional Class | | | 4,340,493 | | |
| | | | | Total Short-Term Investments
(Cost $11,013,857) | | | 11,013,857 | | |
| | | | | Total Investments (105.6%)
(Cost $118,180,027) | | | 151,954,321 | ## | |
| | | | | Liabilities, less cash, receivables and
other assets [(5.6%)] | | | (8,104,215 | ) | |
| | | | | Total Net Assets (100.0%) | | $ | 143,850,106 | | |
See Notes to Schedule of Investments 6
Notes to Schedule of Investments Regency Portfolio
t The value of investments in equity securities by Neuberger Berman Advisers Management Trust Regency Portfolio (the "Fund") is determined by Neuberger Berman Management LLC ("Management") primarily by obtaining valuations from an independent pricing service based on the latest sale price when that price is readily available. Securities traded primarily on the NASDAQ Stock Market are normally valued by the Fund at the NASDAQ Official Closing Price ("NOCP") provided by NASDAQ each business day. The NOCP is the most recently reported price as of 4:00:02 p.m., Eastern time, unless that price is outside the range of the "inside" bid and asked prices (i.e., the bid and asked prices that dealers quote to each other when trading for their own accounts); in that case, NASDAQ will adjust the price to equal the inside bid or asked price, whichever is closer. Because of delays in reporting trades, the NOCP may not be based on the price of the last trade to occur before the market closes. If there is no reported sale of a security on a particular day, the independent pricing service may value the security based on reported market quotations. Management has developed a process to periodically review information provided by independent pricing services. If a valuation is not available from an independent pricing service, the Fund seeks to obtain quotations from principal market makers. If such quotations are not readily available, securities are valued using methods the Board of Trustees of Neuberger Berman Advisers Management Trust (the "Board") has approved on the belief that they reflect fair value. Numerous factors may be considered when determining the fair value of a security, including available analyst, media or other reports, trading in futures or ADRs and whether the issuer of the security being fair valued has other securities outstanding. Foreign security prices are furnished by independent quotation services and expressed in local currency values. Foreign security prices are currently translated from the local currency into U.S. dollars using the exchange rate as of 4:00 p.m., Eastern time. The Board has approved the use of Interactive Data Pricing and Reference Data, Inc. ("Interactive") to assist in determining the fair value of the Fund's foreign equity securities when changes in the value of a certain index suggest that the closing prices on the foreign exchanges may no longer represent the amount that the Fund could expect to receive for those securities. In this event, Interactive will provide adjusted prices for certain foreign equity securities using a statistical analysis of historical correlations of multiple factors. In the absence of precise information about the market values of these foreign securities as of the close of the New York Stock Exchange, the Board has determined on the basis of available data that prices adjusted in this way are likely to be closer to the prices the Fund could realize on a current sale than are the prices of those securities established at the close of the foreign markets in which the securities primarily trade. Fair value prices are necessarily estimates, and there is no assurance that such a price will be at or close to the price at which the security next trades. Short-term debt securities with less than 60 days until maturity may be valued at cost which, when combined with interest earned, is expected to approximate market value.
In accordance with Accounting Standards Codification ("ASC") 820 "Fair Value Measurements and Disclosures" ("ASC 820"), formerly known as Financial Accounting Standards Board ("FASB") Statement of Financial Accounting Standards No. 157, "Fair Value Measurements," investments held by the Fund are carried at "fair value" as defined by ASC 820. Fair value is defined as the price that a fund would receive upon selling an investment in an orderly transaction to an independent buyer in the principal or most advantageous market for the investment under current market conditions. Various inputs, including the volume and level of activity for the asset or liability in the market are considered in determining the value of the Fund's investments, some of which are discussed above. Significant management judgement may be necessary to estimate fair value in accordance with ASC 820.
In addition to defining fair value, ASC 820 established a three-tier hierarchy of inputs to establish a classification of fair value measurements for disclosure purposes. The three-tier hierarchy of inputs is summarized in the three broad Levels listed below.
. Level 1 - quoted prices in active markets for identical investments
. Level 2 - other significant observable inputs (including quoted prices for similar investments, interest rates, prepayment speeds, credit risk, amortized cost, etc.)
. Level 3 - significant unobservable inputs (including the Fund's own assumptions in determining the fair value of investments)
See Notes to Financial Statements 7
Notes to Schedule of Investments Regency Portfolio (cont'd)
The inputs or methodology used for valuing an investment are not necessarily an indication of the risk associated with investing in those securities.
The following is a summary, by category of Level, of inputs used to value the Fund's investments as of December 31, 2009:
| Asset Valuation Inputs | | Level 1 | | Level 2 | | Level 3 | | Total | |
| Investments: | |
| Common Stocks^ | | $ | 140,940,464 | | | $ | -- | | | $ | -- | | | $ | 140,940,464 | | |
| Short-Term Investments | | | -- | | | | 11,013,857 | | | | -- | | | | 11,013,857 | | |
| Total Investments | | $ | 140,940,464 | | | $ | 11,013,857 | | | $ | -- | | | $ | 151,954,321 | | |
^ The Schedule of Investments provides information on the industry categorization for the portfolio.
## At December 31, 2009, the cost of investments for U.S. federal income tax purposes was $123,646,904. Gross unrealized appreciation of investments was $30,489,214 and gross unrealized depreciation of investments was $2,181,797, resulting in net unrealized appreciation of $28,307,417, based on cost for U.S. federal income tax purposes.
* Security did not produce income during the last twelve months.
* All or a portion of this security is on loan (see Note A of Notes to Financial Statements).
tt Managed by an affiliate of Management and could be deemed an affiliate of the Fund (see Notes A & F of Notes to Financial Statements).
See Notes to Financial Statements 8
Statement of Assets and Liabilities
Neuberger Berman Advisers Management Trust
| | | REGENCY
PORTFOLIO | |
| | | December 31, 2009 | |
| Assets | |
| Investments in securities, at value *t (Notes A & F)--see Schedule of Investments: | |
| Unaffiliated issuers | | $ | 145,280,957 | | |
| Affiliated issuers | | | 6,673,364 | | |
| | | | 151,954,321 | | |
| Cash | | | 8,321 | | |
| Dividends and interest receivable | | | 169,638 | | |
| Receivable for Fund shares sold | | | 72,919 | | |
| Receivable for securities lending income--net (Note A) | | | 3,671 | | |
| Prepaid expenses and other assets | | | 5,238 | | |
| Total Assets | | | 152,214,108 | | |
| Liabilities | |
| Payable for collateral on securities loaned (Note A) | | | 6,673,364 | | |
| Payable for securities purchased | | | 304,328 | | |
| Payable for Fund shares redeemed | | | 1,207,184 | | |
| Payable to investment manager (Notes A & B) | | | 67,469 | | |
| Payable to administrator--net (Note B) | | | 41,818 | | |
| Accrued expenses and other payables | | | 69,839 | | |
| Total Liabilities | | | 8,364,002 | | |
| Net Assets at value | | $ | 143,850,106 | | |
| Net Assets consist of: | |
| Paid-in capital | | $ | 189,205,263 | | |
| Undistributed net investment income (loss) | | | 1,090,759 | | |
| Accumulated net realized gains (losses) on investments | | | (80,220,210 | ) | |
| Net unrealized appreciation (depreciation) in value of investments | | | 33,774,294 | | |
| Net Assets at value | | $ | 143,850,106 | | |
| Net Assets | |
| Class I | | $ | 86,083,620 | | |
| Class S | | | 57,766,486 | | |
| Shares Outstanding ($.001 par value; unlimited shares authorized) | |
| Class I | | | 7,023,151 | | |
| Class S | | | 4,372,429 | | |
| Net Asset Value, offering and redemption price per share | |
| Class I | | $ | 12.26 | | |
| Class S | | | 13.21 | | |
| tSecurities on loan, at value: | |
| Unaffiliated issuers | | $ | 6,505,260 | | |
| *Cost of Investments: | |
| Unaffiliated issuers | | $ | 111,506,663 | | |
| Affiliated issuers | | | 6,673,364 | | |
| Total cost of investments | | $ | 118,180,027 | | |
See Notes to Financial Statements 9
Statement of Operations
Neuberger Berman Advisers Management Trust
| | | REGENCY
PORTFOLIO | |
| | | For the
Year Ended
December 31, 2009 | |
| Investment Income: | |
| Income (Note A): | |
| Dividend income--unaffiliated issuers | | $ | 2,897,243 | | |
| Interest income--unaffiliated issuers | | | 4,629 | | |
| Income from securities loaned--net (Note F) | | | 207,898 | | |
| Income from investments in affiliated issuers (Note F) | | | 13,903 | | |
| Foreign taxes withheld | | | (11,433 | ) | |
| Total income | | $ | 3,112,240 | | |
| Expenses: | |
| Investment management fees (Notes A & B) | | | 949,220 | | |
| Administration fees (Note B): | |
| Class I | | | 232,587 | | |
| Class S | | | 285,170 | | |
| Distribution fees (Note B): | |
| Class S | | | 237,642 | | |
| Audit fees | | | 41,306 | | |
| Custodian fees (Note B) | | | 95,162 | | |
| Insurance expense | | | 13,011 | | |
| Legal fees | | | 62,072 | | |
| Shareholder reports | | | 65,396 | | |
| Trustees' fees and expenses | | | 50,113 | | |
| Miscellaneous | | | 16,738 | | |
| Total expenses | | | 2,048,417 | | |
| Expenses reimbursed by administrator (Note B) | | | (32,214 | ) | |
| Investment management fees waived (Note A) | | | (4,966 | ) | |
| Expenses reduced by custodian fee expense offset arrangement (Note B) | | | (4 | ) | |
| Total net expenses | | | 2,011,233 | | |
| Net investment income (loss) | | $ | 1,101,007 | | |
| Realized and Unrealized Gain (Loss) on Investments (Note A) | |
| Net realized gain (loss) on: | |
| Sales of investment securities of unaffiliated issuers | | | (61,339,775 | ) | |
| Sales of investment securities of affiliated issuers | | | 164,328 | | |
| Foreign currency | | | (1,301 | ) | |
| Change in net unrealized appreciation (depreciation) in value of: | |
| Unaffiliated investment securities | | | 121,360,929 | | |
| Net gain (loss) on investments | | | 60,184,181 | | |
| Net increase (decrease) in net assets resulting from operations | | $ | 61,285,188 | | |
See Notes to Financial Statements 10
Statements of Changes in Net Assets
Neuberger Berman Advisers Management Trust
| | | REGENCY PORTFOLIO | |
| | | Year Ended
December 31,
2009 | | Year Ended
December 31,
2008 | |
| Increase (Decrease) in Net Assets: | |
| From Operations (Note A): | |
| Net investment income (loss) | | $ | 1,101,007 | | | $ | 1,898,033 | | |
| Net realized gain (loss) on investments | | | (61,176,748 | ) | | | (10,775,565 | ) | |
| Change in net unrealized appreciation (depreciation) of investments | | | 121,360,929 | | | | (138,915,204 | ) | |
| Net increase (decrease) in net assets resulting from operations | | | 61,285,188 | | | | (147,792,736 | ) | |
| Distributions to Shareholders From (Note A): | |
| Net investment income: | |
| Class I | | | (1,350,470 | ) | | | (1,421,903 | ) | |
| Class S | | | (480,269 | ) | | | (1,552,353 | ) | |
| Net realized gain on investments: | |
| Class I | | | (1,138,831 | ) | | | (262,715 | ) | |
| Class S | | | (698,414 | ) | | | (337,659 | ) | |
| Total distributions to shareholders | | | (3,667,984 | ) | | | (3,574,630 | ) | |
| From Fund Share Transactions (Note D): | |
| Proceeds from shares sold: | |
| Class I | | | 7,819,794 | | | | 13,908,918 | | |
| Class S | | | 50,437,882 | | | | 89,442,140 | | |
| Proceeds from reinvestment of dividends and distributions: | |
| Class I | | | 2,489,301 | | | | 1,684,618 | | |
| Class S | | | 1,178,683 | | | | 1,890,012 | | |
| Payments for shares redeemed: | |
| Class I | | | (26,673,515 | ) | | | (89,444,987 | ) | |
| Class S | | | (143,603,895 | ) | | | (40,038,322 | ) | |
| Net increase (decrease) from Fund share transactions | | | (108,351,750 | ) | | | (22,557,621 | ) | |
| Net Increase (Decrease) in Net Assets | | | (50,734,546 | ) | | | (173,924,987 | ) | |
| Net Assets: | |
| Beginning of year | | | 194,584,652 | | | | 368,509,639 | | |
| End of year | | $ | 143,850,106 | | | $ | 194,584,652 | | |
| Undistributed net investment income (loss) at end of year | | $ | 1,090,759 | | | $ | 1,829,594 | | |
See Notes to Financial Statements 11
Notes to Financial Statements Regency Portfolio
Note A--Summary of Significant Accounting Policies:
1 General: The Fund is a separate operating series of Neuberger Berman Advisers Management Trust (the "Trust"), a Delaware statutory trust organized pursuant to a Trust Instrument dated May 23, 1994. The Trust is currently comprised of ten separate operating series (each a "Series," collectively, the "Funds") each of which is diversified. The Trust is registered as an open-end management investment company under the Investment Company Act of 1940, as amended (the "1940 Act"), and its shares are registered under the Securities Act of 1933, as amended (the "1933 Act"). The Fund currently offers Class I and Class S shares. The Board may establish additional series or classes of shares without the approval of shareholders.
The assets of each Series belong only to that Series, and the liabilities of each Series are borne solely by that Series and no other.
The preparation of financial statements in accordance with U.S. generally accepted accounting principles requires Management to make estimates and assumptions at the date of the financial statements. Actual results could differ from those estimates.
2 Portfolio valuation: Investment securities are valued as indicated in the notes following the Schedule of Investments.
3 Foreign currency translation: The accounting records of the Fund are maintained in U.S. dollars. Foreign currency amounts are currently translated into U.S. dollars using the exchange rates as of 4:00 p.m., Eastern time, to determine the value of investments, other assets and liabilities. Purchase and sale prices of securities, and income and expenses, are translated into U.S. dollars at the prevailing rate of exchange on the respective dates of such transactions. Net unrealized foreign currency gain (loss), if any, arises from changes in the value of assets and liabilities, other than investments in securities, as a result of changes in exchange rates and is stated separately in the Statement of Operations.
4 Securities transactions and investment income: Securities transactions are recorded on trade date for financial reporting purposes. Dividend income is recorded on the ex-dividend date or, for certain foreign dividends, as soon as the Fund becomes aware of the dividends. Non-cash dividends included in dividend income, if any, are recorded at the fair market value of the securities received. Interest income, including accretion of original issue discount, where applicable, and accretion of discount on short-term investments, is recorded on the accrual basis. Realized gains and losses from securities transactions and foreign currency transactions, if any, are recorded on the basis of identified cost and stated separately in the Statement of Operations. Included in net realized gain (loss) on investments are proceeds from the settlements of class action litigation in which the Fund participated as a class member. The amount of such proceeds for the year ended December 31, 2009 was $5,740.
5 Income tax information: The Funds are treated as separate entities for U.S. federal income tax purposes. It is the policy of the Fund to continue to qualify as a regulated investment company by complying with the requirements of Subchapter M of the Internal Revenue Code applicable to regulated investment companies and to distribute substantially all of its earnings to its shareholders. Therefore, no federal income or excise tax provision is required.
The Fund has adopted the provisions of ASC 740 "Income Taxes"("ASC 740"), formerly known as FASB Interpretation No. 48 "Accounting for Uncertainty in Income Taxes -- an interpretation of FASB Statement No. 109." ASC 740 sets forth a minimum threshold for financial statement recognition of the benefit of a tax position taken, or expected to be taken, in a tax return. The Fund recognizes interest and penalties, if any, related to unrecognized tax benefits as an income tax expense in the Statement of Operations. The Fund is subject to examination by U.S. federal and state tax authorities for returns filed for the prior three fiscal years 2006 - 2008. As of December 31, 2009, the Fund did not have any unrecognized tax benefits.
12
Income distributions and capital gain distributions are determined in accordance with income tax regulations, which may differ from U.S. generally accepted accounting principles. These differences are primarily due to differing treatments of income and gains on various investment securities held by the Fund, timing differences and differing characterization of distributions made by the Fund as a whole. The Fund may also utilize earnings and profits distributed to shareholders on redemption of shares as a part of the dividends paid deduction for income tax purposes.
As determined on December 31, 2009, permanent differences resulting primarily from different book and tax accounting for foreign currency gains and losses and return of capital distributions from common stocks were reclassified at fiscal year-end. These reclassifications had no effect on net income, net asset value or net asset value per share of the Fund.
The tax character of distributions paid during the years ended December 31, 2009 and December 31, 2008 was as follows:
| | | Distributions Paid From: | | | |
| Ordinary Income | | Long-Term Capital Gain | | Total | |
| 2009 | | 2008 | | 2009 | | 2008 | | 2009 | | 2008 | |
| $ | 1,830,739 | | | $ | 2,974,256 | | | $ | 1,837,245 | | | $ | 600,374 | | | $ | 3,667,984 | | | $ | 3,574,630 | | |
As of December 31, 2009, components of distributable earnings (accumulated losses) on a U.S. federal income tax basis were as follows:
Undistributed
Ordinary
Income | | Undistributed
Long-Term
Gain | | Unrealized
Appreciation
(Depreciation) | | Loss
Carryforwards
and Deferrals | | Total | |
| $ | 1,090,759 | | | $ | -- | | | $ | 28,307,417 | | | $ | (74,753,333 | ) | | $ | (45,355,157 | ) | |
The difference between book basis and tax basis distributable earnings is attributable primarily to timing differences of wash sales, capital loss carryforwards, partnership basis adjustments, and basis adjustments for common stocks.
To the extent the Fund's net realized capital gains, if any, can be offset by capital loss carryforwards, it is the policy of the Fund not to distribute such gains. As determined at December 31, 2009, the Fund had unused capital loss carryforwards available for federal income tax purposes to offset net realized capital gains, if any, as follows:
| | | Expiring in: | |
| | | 2017 | |
| | | $ | 74,753,333 | | |
Under current tax law, the use of these losses to offset future gains may be limited.
6 Distributions to shareholders: The Fund may earn income, net of expenses, daily on its investments. Distributions from net investment income and net realized capital gains, if any, generally are distributed in October. Income distributions and capital gain distributions to shareholders are recorded on the ex-date.
It is the policy of the Fund to pass through to its shareholders substantially all Real Estate Investment Trust ("REIT") distributions and other income it receives, less operating expenses. The distributions the Fund receives from REITs are generally comprised of income, capital gains, and return of capital, but the REITs do not report this information to the Fund until the following calendar year. At December 31, 2009, the Fund estimated these amounts within the financial statements since the information was not available from the REITs until after the Fund's fiscal year-end. For the year ended December 31, 2009, the character of distributions paid to shareholders disclosed within the Statements of Changes in Net Assets is based on estimates made at that time. All estimates are based upon REIT information sources available to the Fund together with actual IRS Forms 1099DIV received to date. Based on past experience it is possible that a portion of the Fund's distributions during the most recently
13
completed fiscal year will be considered tax return of capital but the actual amount of tax return of capital, if any, is not determinable until after the Fund's fiscal year-end. After calendar year-end, when the Fund learns the nature of the distributions paid by REITs during that year, distributions previously identified as income are often recharacterized as return of capital and/or capital gain. After all applicable REITs have informed the Fund of the actual breakdown of distributions paid to the Fund during its fiscal year, estimates previously recorded are adjusted on the books of the Fund to reflect actual results. As a result, the composition of the Fund's distributions as reported herein may differ from the final composition determined after calendar year-end and reported to Fund shareholders on IRS Form 1099DIV.
7 Foreign taxes: Foreign taxes withheld represent amounts withheld by foreign tax authorities, net of refunds recoverable.
8 Expense allocation: Certain expenses are applicable to multiple funds. Expenses directly attributable to a Series are charged to that Series. Expenses of the Trust that are not directly attributed to a Series are allocated among the Funds, on the basis of relative net assets, except where a more appropriate allocation of expenses to each of the Funds can otherwise be made fairly. Expenses borne by the complex of related investment companies, which includes open-end and closed-end investment companies for which Management serves as investment manager, that are not directly attributed to a Series or the Trust are allocated among the Fund and the other investment companies in the complex or series thereof on the basis of relative net assets, except where a more appropriate allocation of expenses to each investment company in the complex or series thereof can otherwise be made fairly. The Fund's expenses (other than those specific to each class) are allocated proportionally each day between the classes based upon the relative net assets of each class.
9 Security lending: A third party, eSecLending, currently serves as exclusive lending agent for the Fund. eSecLending, as agent, has assisted the Fund in conducting bidding processes to try to identify a principal that would pay a guaranteed amount to the Fund in consideration of the Fund entering into an exclusive securities lending arrangement. During most of the Fund's fiscal year, the Fund was guaranteed a particular level of income from a principal. As a result of a bidding process on October 1, 2009, no principal currently has an exclusive arrangement with the Fund and the Fund is no longer guaranteed a particular level of income.
Under the securities lending arrangement, the Fund receives cash collateral at the beginning of each transaction equal to at least 102% of the prior day's market value of the loaned securities (105% in the case of international securities). The Fund may invest all the cash collateral in Neuberger Berman Securities Lending Quality Fund, LLC ("Quality Fund"), a fund managed by Neuberger Berman Fixed Income LLC (formerly known as Lehman Brothers Asset Management LLC) ("NBFI"), an affiliate of Management. Effective July 1, 2009, Dwight Asset Management Company LLC became the Sub-Adviser to the Quality Fund. The Quality Fund is not a money market fund that is registered under the 1940 Act and does not operate in accordance with all requirements of Rule 2a-7 under the 1940 Act. There is no assurance that the Quality Fund will maintain a $1.00 share price.
The market value of the Fund's investments in the Quality Fund as of the fiscal year ended December 31, 2009, if any, is reflected in the Fund's Schedule of Investments. If it were necessary to liquidate assets in the Quality Fund to meet returns on outstanding securities loans at a time when the Quality Fund's price per share was less than $1.00, the Fund may not receive an amount from the Quality Fund that is equal in amount to the collateral the Fund would be required to return to the borrower of the securities and the Fund would be required to make up for this shortfall. In addition, as a result of recent reduced liquidity in the credit and fixed income markets, it may be difficult to dispose quickly of some securities in the Quality Fund at the price at which the Quality Fund is carrying them.
Net income from the lending program represents any amounts received from a principal plus income earned on the cash collateral invested in Quality Fund or in other investments, if applicable, less cash collateral fees and other expenses associated with the loans. For the fiscal year ended December 31, 2009, the Fund received net income under the securities lending arrangement of approximately $207,898, which is reflected in the Statement of Operations under the caption "Income from securities loaned -- net." For the fiscal year ended December 31, 2009, "Income from securities loaned -- net" consisted of approximately $361,305 in income earned on cash collateral
14
and amounts received from a principal (including approximately $291,031 of interest income earned from the Quality Fund), less fees and expenses paid of approximately $153,407.
10 Repurchase agreements: The Fund may enter into repurchase agreements with institutions that Management has determined are creditworthy. Each repurchase agreement is recorded at cost. The Fund requires that the securities purchased in a repurchase agreement be transferred to the custodian in a manner sufficient to enable the Fund to assert a perfected security interest in those securities in the event of a default under the repurchase agreement. The Fund monitors, on a daily basis, the value of the securities transferred to ensure that their value, including accrued interest, is greater than amounts owed to the Fund under each such repurchase agreement.
11 Transactions with other funds managed by Neuberger Berman Management LLC: Pursuant to an Exemptive Order issued by the Securities and Exchange Commission, the Fund may invest in a money market fund managed by Management or an affiliate. Through August 10, 2009, the Fund invested in Neuberger Berman Prime Money Fund ("Prime Money"), as approved by the Board. Prime Money sought to provide the highest available current income consistent with safety and liquidity. For any cash that the Fund invested in Prime Money, Management waived a portion of its management fee equal to the management fee it received from Prime Money on those assets (the "Arrangement"). For the year ended December 31, 2009, management fees waived under this Arrangement amounted to $4,966 and are reflected in the Statement of Operations under the caption "Investment management fees waived." For the year ended December 31, 2009, income earned under this Arrangement amounted to $13,903 and is reflected in the Statement of Operations under the caption "Income from investments in affiliated issuers."
On August 10, 2009, the Fund ceased investing in Prime Money. On this date, the Fund's shares of Prime Money were redeemed in exchange for portfolio holdings of Prime Money, which were used to purchase Institutional Class shares of State Street Institutional Liquid Reserves Fund.
12 Investments in foreign securities: Investing in foreign securities may involve certain sovereign and other risks, in addition to the credit and market risks normally associated with domestic securities. These additional risks include the possibility of adverse political and economic developments (including political instability, nationalization, expropriation, or confiscatory taxation) and the potentially adverse effects of unavailability of public information regarding issuers, less governmental supervision and regulation of financial markets, reduced liquidity of certain financial markets, and the lack of uniform accounting, auditing, and financial reporting standards or the application of standards that are different or less stringent than those applied in the United States. Foreign securities also may experience greater price volatility, higher rates of inflation, and delays in settlement.
13 Derivative instruments: Management has evaluated the requirements of ASC 815 "Disclosures about Derivative Instruments and Hedging Activities" ("ASC 815"), formerly known as FASB Statement of Financial Accounting Standards No. 161, "Disclosures about Derivative Instruments and Hedging Activities," which are effective for financial statements issued for fiscal years and interim periods beginning after November 15, 2008. ASC 815 requires enhanced disclosures about a fund's derivative and hedging activities. Management has concluded that, since the Fund did not hold any derivative instruments during the year ended December 31, 2009, no additional disclosures pursuant to ASC 815 are required at this time.
14 Indemnifications: Like many other companies, the Trust's organizational documents provide that its officers and trustees are indemnified against certain liabilities arising out of the performance of their duties to the Trust. In addition, both in some of its principal service contracts and in the normal course of its business, the Trust enters into contracts that provide indemnifications to other parties for certain types of losses or liabilities. The Trust's maximum exposure under these arrangements is unknown as this could involve future claims against the Trust.
15 Other: All net investment income and realized and unrealized capital gains and losses of the Fund are allocated, on the basis of relative net assets, pro rata among its respective classes.
15
Note B--Management Fees, Administration Fees, Distribution Arrangements, and Other Transactions With Affiliates:
Fund shares are issued and redeemed in connection with investments in and payments under certain variable annuity contracts and variable life insurance policies issued through separate accounts of life insurance companies and are also offered directly to qualified pension and retirement plans.
The Fund retains Management as its investment manager under a Management Agreement. For such investment management services, the Fund pays Management a fee at the annual rate of 0.55% of the first $250 million of the Fund's average daily net assets, 0.525% of the next $250 million, 0.50% of the next $250 million, 0.475% of the next $250 million, 0.45% of the next $500 million, 0.425% of the next $2.5 billion, and 0.40% of average daily net assets in excess of $4 billion.
The Fund retains Management as its administrator under an Administration Agreement. Each class pays Management an administration fee at the annual rate of 0.30% of its average daily net assets under this agreement. Additionally, Management retains State Street Bank and Trust Company ("State Street") as its sub-administrator under a Sub-Administration Agreement. Management pays State Street a fee for all services received under this agreement.
The Board adopted a non-fee distribution plan for the Fund's Class I.
For the Fund's Class S, Management acts as agent in arranging for the sale of class shares without commission and bears advertising and promotion expenses. The Board has adopted a distribution plan (the "Plan") with respect to this class, pursuant to Rule 12b-1 under the 1940 Act. The Plan provides that, as compensation for administrative and other services provided to this class, Management's activities and expenses related to the sale and distribution of this class of shares, and ongoing services provided to investors in this class, Management receives from this class a fee at the annual rate of 0.25% of Class S's average daily net assets. Management receives this amount to provide distribution and shareholder servicing for this class and pays a portion of it to institutions that provide such services. Those institutions may use the payments for, among other purposes, compensating employees engaged in sales and/or shareholder servicing. The amount of fees paid by this class during any year may be more or less than the cost of distribution and other services provided to this class. FINRA rules limit the amount of annual distribution fees that may be paid by a mutual fund and impose a ceiling on the cumulative distribution fees paid. The Trust's Plan complies with those rules.
Management has contractually undertaken to forgo current payment of fees and/or reimburse the Fund's Class I and Class S shares for their operating expenses (including the fees payable to Management but excluding interest, taxes, brokerage commissions, extraordinary expenses, and transaction costs) ("Operating Expenses") which exceed the expense limitation as detailed in the following table:
| | | Expense Limitation(1) | | Expiration | | Reimbursement from
Management for the
Year Ended
December 31, 2009 | |
| Class I | | | 1.50 | % | | | 12/31/12 | | | $ | -- | | |
| Class S | | | 1.25 | % | | | 12/31/19 | | | | 32,214 | | |
(1) Expense limitation per annum of the respective class' average daily net assets.
Each respective class has agreed to repay Management for fees and expenses foregone and/or its excess Operating Expenses previously reimbursed by Management, so long as its annual Operating Expenses during that period do not exceed its Expense Limitation, and the repayment is made within three years after the year in which Management issued the reimbursement or waived fees. During the year ended December 31, 2009, there was no
16
repayment to Management under this agreement. At December 31, 2009, the Fund's Class I shares had no contingent liability to Management under this agreement.
At December 31, 2009, the Fund's Class S shares contingent liabilities to Management under this agreement were as follows:
| | | Expiring in: | |
| | | 2012 | |
| Class S | | $ | 32,214 | | |
Neuberger Berman LLC (formerly known as Neuberger Berman, LLC) ("Neuberger") is retained by Management to furnish it with investment recommendations and research information without added cost to the Fund. Several individuals who are officers and/or trustees of the Trust are also employees of Neuberger and/or Management.
During the reporting period, the predecessor of Management, the investment manager of the Fund, and Neuberger, the sub-adviser of the Fund, were wholly owned subsidiaries of Lehman Brothers Holdings Inc. ("Lehman Brothers"), a publicly owned holding company. On September 15, 2008, Lehman Brothers filed a voluntary petition under Chapter 11 of the U.S. Bankruptcy Code. On December 3, 2008, NBSH Acquisition, LLC ("NBSH"), an entity organized by key members of Neuberger Berman's senior management, was selected as the successful bidder in the public auction to acquire a majority interest in Neuberger Berman's business and the fixed income and certain alternative asset management businesses of Lehman Brothers' Investment Management Division (together with Neuberger Berman, the "Acquired Businesses") (the "Acquisition"). On December 22, 2008, the bankruptcy court having jurisdiction over the Lehman Brothers matter approved the sale of the Acquired Businesses to NBSH (or its successor or assign), as the successful bidder.
The Acquisition closed on May 4, 2009. The Acquired Businesses are now indirectly owned by, among others, portfolio managers, Neuberger Berman's management team, and certain key members and senior professionals who are employed in various parts of the Neuberger Berman complex of companies, with a minority interest retained by Lehman Brothers and certain affiliates of Lehman Brothers.
The closing of the Acquisition resulted in an "assignment" of the Fund's Management Agreement and Sub- Advisory Agreement. Such an assignment, by law, automatically terminated those agreements. Accordingly, prior to the closing, the Board, including the Trustees who are not "interested persons" of the Fund's investment manager and its affiliates or the Fund, considered and approved a new Management Agreement and Sub-Advisory Agreement for the Fund. The new agreements, which are virtually identical to those previously in effect, were also approved by a vote of the Fund's shareholders.
These events have not had a material impact on the Fund or its operations. Management and Neuberger continue to operate in the ordinary course of business as the investment manager and sub-adviser of the Fund.
The Fund has an expense offset arrangement in connection with its custodian contract. For the year ended December 31, 2009, the impact of this arrangement was a reduction of expenses of $4.
Note C--Securities Transactions:
During the year ended December 31, 2009, there were purchase and sale transactions (excluding short-term securities) of $81,393,242 and $176,938,433, respectively.
During the year ended December 31, 2009, no brokerage commissions on securities transactions were paid to affiliated brokers.
17
Note D--Fund Share Transactions:
Share activity for the years ended December 31, 2009 and December 31, 2008 was as follows:
For the Year Ended December 31, 2009
| | | Shares Sold | | Shares Issued on
Reinvestment of
Dividends and
Distributions | | Shares
Redeemed | | Total | |
| Class I | | | 786,392 | | | | 205,898 | | | | (2,669,503 | ) | | | (1,677,213 | ) | |
| Class S | | | 5,312,175 | | | | 90,459 | | | | (14,020,598 | ) | | | (8,617,964 | ) | |
For the Year Ended December 31, 2008
| | | Shares Sold | | Shares Issued on
Reinvestment of
Dividends and
Distributions | | Shares
Redeemed | | Total | |
| Class I | | | 1,159,506 | | | | 192,089 | | | | (6,033,868 | ) | | | (4,682,273 | ) | |
| Class S | | | 6,827,317 | | | | 201,065 | | | | (2,747,630 | ) | | | 4,280,752 | | |
Note E--Line of Credit:
At December 31, 2009, the Fund was a participant in a single committed, unsecured $150,000,000 line of credit with State Street, to be used only for temporary or emergency purposes. Other investment companies managed by Management also participate in this line of credit on the same terms. Interest is charged on borrowings under this line of credit at the higher of (a) the Federal Funds Rate plus 1.25% per annum or (b) the Overnight LIBOR Rate plus 1.25% per annum. Prior to September 18, 2009, interest was charged on borrowings under this line of credit at the Federal Funds Rate plus 0.50% per annum. A facility fee of 0.15% (prior to September 18, 2009, 0.09%) per annum of the available line of credit is charged, of which the Fund has agreed to pay its pro rata share, based on the ratio of its individual net assets to the net assets of all participants at the time the fee is due and payable. The fee is paid quarterly in arrears. Because several investment companies participate, there is no assurance that an individual Fund will have access to all or any part of the $150,000,000 at any particular time. There were no loans outstanding pursuant to this line of credit at December 31, 2009. During the year ended December 31, 2009, the Fund did not utilize this line of credit.
Note F--Investments in Affiliates:
| Name of Issuer | | Balance of
Shares
Held
December 31,
2008 | | Gross
Purchases
and
Additions | | Gross
Sales
and
Reductions | | Balance of
Shares
Held
December 31,
2009 | | Value
December 31,
2009 | | Income from
Investments in
Affiliated
Issuers
Included in
Total Income | |
Neuberger Berman Prime
Money Fund Trust Class* | | | 8,861,526 | | | | 125,346,806 | | | | 134,208,332 | | | | -- | | | $ | -- | | | $ | 13,903 | | |
Neuberger Berman Securities
Lending Quality Fund, LLC** | | | 29,396,850 | | | | 129,972,216 | | | | 152,826,552 | | | | 6,542,514 | | | | 6,673,364 | | | | 291,031 | | |
| Total | | | | | | | | | | $ | 6,673,364 | | | $ | 304,934 | | |
18
* Prime Money was also managed by Management and may have been considered an affiliate since it had the same officers, Board members, and investment manager as the Fund and because, at times, the Fund may have owned 5% or more of the outstanding voting securities of Prime Money.
** Quality Fund, a fund managed by NBFI, an affiliate of Management, is used to invest cash the Fund receives as collateral for securities loaned as approved by the Board. Because all shares of Quality Fund are held by funds in the related investment management complex, Quality Fund may be considered an affiliate of the Fund.
Note G--Subsequent Events:
In accordance with the provision set forth in ASC 855 "Subsequent Events" ("ASC 855") formerly known as FAS 165, "Subsequent Events," Management has evaluated the possibility of subsequent events existing in the Fund's financial statements through February 9, 2010. Management has determined that there are no subsequent events that, in accordance with ASC 855, would need to be disclosed in the Fund's financial statements through this date.
19
Financial Highlights
Regency Portfolio
The following tables include selected data for a share outstanding throughout each period and other performance information derived from the Financial Statements.
| Class I | |
| | | Year Ended December 31, | |
| | | 2009 | | 2008 | | 2007 | | 2006 | | 2005 | |
| Net Asset Value, Beginning of Year | | $ | 8.60 | | | $ | 16.23 | | | $ | 16.21 | | | $ | 15.50 | | | $ | 14.79 | | |
| Income From Investment Operations: | |
| Net Investment Income (Loss)tt | | | .07 | | | | .10 | | | | .17 | | | | .13 | | | | .09 | | |
Net Gains or Losses on Securities
(both realized and unrealized) | | | 3.93 | | | | (7.53 | ) | | | .39 | | | | 1.55 | | | | 1.59 | | |
| Total From Investment Operations | | | 4.00 | | | | (7.43 | ) | | | .56 | | | | 1.68 | | | | 1.68 | | |
| Less Distributions From: | |
| Net Investment Income | | | (.18 | ) | | | (.17 | ) | | | (.08 | ) | | | (.07 | ) | | | (.01 | ) | |
| Net Capital Gains | | | (.16 | ) | | | (.03 | ) | | | (.46 | ) | | | (.90 | ) | | | (.96 | ) | |
| Total Distributions | | | (.34 | ) | | | (.20 | ) | | | (.54 | ) | | | (.97 | ) | | | (.97 | ) | |
| Net Asset Value, End of Year | | $ | 12.26 | | | $ | 8.60 | | | $ | 16.23 | | | $ | 16.21 | | | $ | 15.50 | | |
| Total Returntt | | | 46.56 | % | | | (45.82 | )% | | | 3.30 | % | | | 11.17 | % | | | 12.00 | % | |
| Ratios/Supplemental Data | |
| Net Assets, End of Year (in millions) | | $ | 86.1 | | | $ | 74.8 | | | $ | 217.3 | | | $ | 242.0 | | | $ | 220.6 | | |
| Ratio of Gross Expenses to Average Net Assets# | | | 1.06 | % | | | .97 | % | | | .93 | % | | | .96 | % | | | 1.01 | % | |
| Ratio of Net Expenses to Average Net AssetsS | | | 1.06 | % | | | .96 | % | | | .92 | % | | | .95 | % | | | 1.00 | % | |
Ratio of Net Investment Income (Loss) to
Average Net Assets | | | .67 | % | | | .76 | % | | | 1.03 | % | | | .80 | % | | | .56 | % | |
| Portfolio Turnover Rate | | | 51 | % | | | 66 | % | | | 58 | % | | | 53 | % | | | 83 | % | |
See Notes to Financial Highlights 20
Financial Highlights (cont'd)
| Class S | |
| | | Year Ended December 31, | | Period from
April 29, 2005^
to December 31, | |
| | | 2009 | | 2008 | | 2007 | | 2006 | | 2005 | |
| Net Asset Value, Beginning of Period | | $ | 9.22 | | | $ | 17.37 | | | $ | 17.35 | | | $ | 16.56 | | | $ | 14.02 | | |
| Income From Investment Operations: | |
| Net Investment Income (Loss)tt | | | .06 | | | | .08 | | | | .14 | | | | .10 | | | | .08 | | |
| Net Gains or Losses on Securities | |
| (both realized and unrealized) | | | 4.20 | | | | (8.06 | ) | | | .41 | | | | 1.66 | | | | 2.46 | | |
| Total From Investment Operations | | | 4.26 | | | | (7.98 | ) | | | .55 | | | | 1.76 | | | | 2.54 | | |
| Less Distributions From: | |
| Net Investment Income | | | (.11 | ) | | | (.14 | ) | | | (.07 | ) | | | (.07 | ) | | | -- | | |
| Net Capital Gains | | | (.16 | ) | | | (.03 | ) | | | (.46 | ) | | | (.90 | ) | | | -- | | |
| Total Distributions | | | (.27 | ) | | | (.17 | ) | | | (.53 | ) | | | (.97 | ) | | | -- | | |
| Net Asset Value, End of Period | | $ | 13.21 | | | $ | 9.22 | | | $ | 17.37 | | | $ | 17.35 | | | $ | 16.56 | | |
| Total Returntt | | | 46.16 | % | | | (45.95 | )% | | | 3.05 | % | | | 10.94 | % | | | 18.12 | %** | |
| Ratios/Supplemental Data | |
| Net Assets, End of Period (in millions) | | $ | 57.8 | | | $ | 119.7 | | | $ | 151.3 | | | $ | 55.7 | | | $ | 4.7 | | |
| Ratio of Gross Expenses to Average Net Assets# | | | 1.25 | % | | | 1.23 | % | | | 1.19 | % | | | 1.23 | % | | | 1.25 | %* | |
| Ratio of Net Expenses to Average Net AssetsS | | | 1.25 | % | | | 1.22 | % | | | 1.18 | % | | | 1.23 | % | | | 1.23 | %* | |
Ratio of Net Investment Income (Loss) to
Average Net Assets | | | .61 | % | | | .58 | % | | | .80 | % | | | .56 | % | | | .72 | %* | |
| Portfolio Turnover Rate | | | 51 | % | | | 66 | % | | | 58 | % | | | 53 | % | | | 83 | %O | |
See Notes to Financial Highlights 21
Notes to Financial Highlights Regency Portfolio
tt Total return based on per share net asset value reflects the effects of changes in net asset value on the performance of the Fund during each fiscal period and assumes dividends and other distributions, if any, were reinvested. Results represent past performance and do not guarantee future results. Current returns may be lower or higher than the performance data quoted. Investment returns and principal may fluctuate and shares when redeemed may be worth more or less than original cost. Total return would have been lower if Management had not reimbursed and/or waived certain expenses. Total return would have been higher if Management had not recouped previously reimbursed expenses. The total return information shown does not reflect charges and other expenses that apply to the separate account or the related insurance policies, and the inclusion of these charges and other expenses would reduce the total return for all fiscal periods shown.
# The Fund is required to calculate an expense ratio without taking into consideration any expense reductions related to expense offset arrangements.
S After reimbursement of expenses by Management. Had Management not undertaken such action, the annualized ratios of net expenses to average daily net assets would have been:
| | | Period from
April 29, 2005^ to
December 31, 2005 | |
| Regency Portfolio Class S | | | 1.32 | % | |
After reimbursement of expenses previously paid by Management. Had Management not been reimbursed, the ratios of net expenses to average daily net assets would have been:
| | | Year Ended
December 31,
2006 | |
| Regency Portfolio Class I | | | -- | | |
| Regency Portfolio Class S | | | 1.22 | % | |
After reimbursement of expenses and/or waiver of a portion of the investment management fee by Management. Had Management not undertaken such actions, the annualized ratios of net expenses to average daily net assets would have been:
| | | Year Ended December 31, | | Period
Ended
December 31, | |
| | | 2009 | | 2008 | | 2007 | | 2006 | | 2005^^ | |
| Regency Portfolio Class I | | | 1.06 | % | | | .96 | % | | | .93 | % | | | .95 | % | | | 1.01 | % | |
| Regency Portfolio Class S | | | 1.29 | % | | | 1.22 | % | | | 1.18 | % | | | 1.23 | % | | | 1.24 | % | |
^^ For the year ended December 31, 2005 for Class I. For the period from April 29, 2005 (commencement of operations) to December 31, 2005 for Class S.
^ The date investment operations commenced.
tt Calculated based on the average number of shares outstanding during each fiscal period.
O Portfolio turnover is calculated at the Fund level. Percentage indicated was calculated for the year ended December 31, 2005.
* Annualized.
** Not annualized.
22
Report of Independent Registered Public Accounting Firm
To the Board of Trustees of
Neuberger Berman Advisers Management Trust and
Shareholders of Regency Portfolio
We have audited the accompanying statement of assets and liabilities, including the schedule of investments, of Regency Portfolio, one of the series constituting Neuberger Berman Advisers Management Trust (the "Trust"), as of December 31, 2009, and the related statement of operations for the year then ended, the statement of changes in net assets for each of the two years in the period then ended, and the financial highlights for each of the periods indicated therein in the period then ended. These financial statements and financial highlights are the responsibility of the Trust's management. Our responsibility is to express an opinion on these financial statements and financial highlights based on our audits.
We conducted our audits in accordance with the standards of the Public Company Accounting Oversight Board (United States). Those standards require that we plan and perform the audit to obtain reasonable assurance about whether the financial statements and financial highlights are free of material misstatement. We were not engaged to perform an audit of the Trust's internal control over financial reporting. Our audits included consideration of internal control over financial reporting as a basis for designing audit procedures that are appropriate in the circumstances, but not for the purpose of expressing an opinion on the effectiveness of the Trust's internal control over financial reporting. Accordingly, we express no such opinion. An audit also includes examining, on a test basis, evidence supporting the amounts and disclosures in the financial statements and financial highlights, assessing the accounting principles used and significant estimates made by management, and evaluating the overall financial statement presentation. Our procedures included confirmation of securities owned as of December 31, 2009 by correspondence with the custodian and brokers or by other appropriate auditing procedures where replies from brokers were not received. We believe that our audits provide a reasonable basis for our opinion.
In our opinion, the financial statements and financial highlights referred to above present fairly, in all material respects, the financial position of Regency Portfolio, a series of Neuberger Berman Advisers Management Trust, at December 31, 2009, the results of its operations for the year then ended, the changes in its net assets for each of the two years in the period then ended, and the financial highlights for each of the periods indicated therein in the period then ended, in conformity with U.S. generally accepted accounting principles.
Boston, Massachusetts
February 9, 2010
23
Trustee and Officer Information
The following tables set forth information concerning the trustees and officers of the Trust. All persons named as trustees and officers also serve in similar capacities for other funds administered or managed by Management and Neuberger. The Statement of Additional Information includes additional information about fund trustees and is available upon request, without charge, by calling (800) 877-9700.
Information about the Board of Trustees
Name, (Year of Birth),
and Address(1) | | Position and
Length of
Time Served(2) | | Principal Occupation(s)(3) | | Number of
Funds in Fund
Complex
Overseen by
Fund Trustee | | Other Directorships
Held Outside Fund
Complex by Fund
Trustee | |
| Independent Fund Trustees | |
|
| John Cannon (1930) | | Trustee since 2000 | | Consultant; formerly, Chairman, CDC Investment Advisers (registered investment adviser), 1993 to January 1999; formerly, President and Chief Executive Officer, AMA Investment Advisors, an affiliate of the American Medical Association. | | | 46 | | | Formerly, Independent Trustee or Director of three series of Oppenheimer Funds: Oppenheimer Limited Term New York Municipal Fund, Rochester Fund Municipals, and Oppenheimer Convertible Securities Fund (1992 to 2009). | |
|
| Faith Colish (1935) | | Trustee since 1982 | | Counsel, Carter Ledyard & Milburn LLP (law firm) since October 2002; formerly, Attorney-at-Law and President, Faith Colish, A Professional Corporation, 1980 to 2002. | | | 46 | | | Formerly, Director (1997 to 2003) and Advisory Director (2003 to 2006), ABA Retirement Funds (formerly, American Bar Retirement Association) (not-for-profit membership corporation). | |
|
24
Name, (Year of Birth),
and Address(1) | | Position and
Length of
Time Served(2) | | Principal Occupation(s)(3) | | Number of
Funds in Fund
Complex
Overseen by
Fund Trustee | | Other Directorships
Held Outside Fund
Complex by Fund
Trustee | |
| Martha C. Goss (1949) | | Trustee since 2007 | | President, Woodhill Enterprises Inc./Chase Hollow Associates LLC (personal investment vehicle), since 2006; Chief Operating and Financial Officer, Hopewell Holdings LLC/Amwell Holdings, LLC (a holding company for a healthcare reinsurance company start-up), since 2003; formerly, Consultant, Resources Connection (temporary staffing), 2002 to 2006. | | | 46 | | | Director, Ocwen Financial Corporation (mortgage servicing), since 2005; Director, American Water (water utility), since 2003; Director, Channel Reinsurance (financial guaranty reinsurance), since 2006; Advisory Board Member, Attensity (software developer), since 2005; Director, Allianz Life of New York (insurance), since 2005; Director, Financial Women's Association of New York (not for profit association), since 2003; Trustee Emerita, Brown University, since 1998. | |
|
| C. Anne Harvey (1937) | | Trustee since 1998 | | President, C.A. Harvey Associates, since October 2001; formerly, Director, AARP, 1978 to December 2001. | | | 46 | | | Formerly, President, Board of Associates to The National Rehabilitation Hospital's Board of Directors, 2001 to 2002; formerly, Member, Individual Investors Advisory Committee to the New York Stock Exchange Board of Directors, 1998 to June 2002. | |
|
| Robert A. Kavesh (1927) | | Trustee since 2000 | | Retired; Marcus Nadler Professor Emeritus of Finance and Economics, New York University Stern School of Business; formerly, Executive Secretary-Treasurer, American Finance Association, 1961 to 1979. | | | 46 | | | Formerly, Director, The Caring Community (not-for-profit), 1997 to 2006; formerly, Director, DEL Laboratories, Inc. (cosmetics and pharmaceuticals), 1978 to 2004; formerly, Director, Apple Bank for Savings, 1979 to 1990; formerly, Director, Western Pacific Industries, Inc., 1972 to 1986 (public company). | |
|
25
Name, (Year of Birth),
and Address(1) | | Position and
Length of
Time Served(2) | | Principal Occupation(s)(3) | | Number of
Funds in Fund
Complex
Overseen by
Fund Trustee | | Other Directorships
Held Outside Fund
Complex by Fund
Trustee | |
| Michael M. Knetter (1960) | | Trustee since 2007 | | Dean, School of Business, University of Wisconsin - Madison; formerly, Professor of International Economics and Associate Dean, Amos Tuck School of Business - Dartmouth College, 1998 to 2002. | | | 46 | | | Trustee, Northwestern Mutual Series Fund, Inc., since February 2007; Director, Wausau Paper, since 2005; Director, Great Wolf Resorts, since 2004. | |
|
| Howard A. Mileaf (1937) | | Trustee since 1999 | | Retired; formerly, Vice President and General Counsel, WHX Corporation (holding company), 1993 to 2001. | | | 46 | | | Formerly, Director, Webfinancial Corporation (holding company), 2002 to 2008; formerly, Director WHX Corporation (holding company), January 2002 to June 2005; formerly, Director, State Theatre of New Jersey (not-for-profit theater), 2000 to 2005. | |
|
| George W. Morriss (1947) | | Trustee since 2007 | | Retired; formerly, Executive Vice President and Chief Financial Officer, People's Bank, Connecticut (a financial services company), 1991 to 2001. | | | 46 | | | Manager, Old Mutual 2100 fund complex (consisting of six funds) since October 2006 for four funds and since February 2007 for two funds; formerly, Member NASDAQ Issuers' Affairs Committee, 1995 to 2003. | |
|
| Edward I. O'Brien (1928) | | Trustee since 2000 | | Retired; Formerly, Member, Investment Policy Committee, Edward Jones, 1993 to 2001; President, Securities Industry Association ("SIA") (securities industry's representative in government relations and regulatory matters at the federal and state levels), 1974 to 1992; Adviser to SIA, November 1992 to November 1993. | | | 46 | | | Formerly, Director, Legg Mason, Inc. (financial services holding company), 1993 to July 2008; formerly, Director, Boston Financial Group (real estate and tax shelters), 1993 to 1999. | |
|
26
Name, (Year of Birth),
and Address(1) | | Position and
Length of
Time Served(2) | | Principal Occupation(s)(3) | | Number of
Funds in Fund
Complex
Overseen by
Fund Trustee | | Other Directorships
Held Outside Fund
Complex by Fund
Trustee | |
| Cornelius T. Ryan (1931) | | Trustee since 2000 | | Founding General Partner, Oxford Partners and Oxford Bioscience Partners (venture capital investing) and President, Oxford Venture Corporation, since 1981. | | | 46 | | | None. | |
|
| Tom D. Seip (1950) | | Trustee since 2000; Chairman of the Board since 2008; Lead Independent Trustee from 2006 to 2008 | | General Partner, Seip Investments LP (a private investment partnership); formerly, President and CEO, Westaff, Inc. (temporary staffing), May 2001 to January 2002; formerly, Senior Executive at the Charles Schwab Corporation, 1983 to 1998, including Chief Executive Officer, Charles Schwab Investment Management, Inc., and Trustee, Schwab Family of Funds and Schwab Investments, 1997 to 1998, and Executive Vice President-Retail Brokerage, Charles Schwab & Co., Inc., 1994 to 1997. | | | 46 | | | Director, H&R Block, Inc. (financial services company), since May 2001; Chairman, Compensation Committee, H&R Block, Inc., since 2006; formerly, Director, Forward Management, Inc. (asset management company), 1999 to 2006. | |
|
27
Name, (Year of Birth),
and Address(1) | | Position and
Length of
Time Served(2) | | Principal Occupation(s)(3) | | Number of
Funds in Fund
Complex
Overseen by
Fund Trustee | | Other Directorships
Held Outside Fund
Complex by Fund
Trustee | |
| Candace L. Straight (1947) | | Trustee since 1999 | | Private investor and consultant specializing in the insurance industry; formerly, Advisory Director, Securitas Capital LLC (a global private equity investment firm dedicated to making investments in the insurance sector), 1998 to December 2003. | | | 46 | | | Director, Montpelier Re (reinsurance company), since 2006; formerly, Director, National Atlantic Holdings Corporation (property and casualty insurance company), 2004 to 2008; formerly, Director, The Proformance Insurance Company (property and casualty insurance company), 2004 to 2008; formerly, Director, Providence Washington Insurance Company (property and casualty insurance company), December 1998 to March 2006; formerly, Director, Summit Global Partners (insurance brokerage firm), 2000 to 2005. | |
|
| Peter P. Trapp (1944) | | Trustee since 1984 | | Retired; formerly, Regional Manager for Mid-Southern Region, Ford Motor Credit Company, September 1997 to 2007; formerly, President, Ford Life Insurance Company, April 1995 to August 1997. | | | 46 | | | None. | |
|
28
Name, (Year of Birth),
and Address(1) | | Position and
Length of
Time Served(2) | | Principal Occupation(s)(3) | | Number of
Funds in Fund
Complex
Overseen by
Fund Trustee | | Other Directorships
Held Outside Fund
Complex by Fund
Trustee | |
| Fund Trustees who are "Interested Persons" | |
|
| Joseph V. Amato* (1962) | | Trustee since 2009 | | President and Director, Neuberger Berman Group LLC, since 2009; President and Chief Executive Officer, Neuberger and Neuberger Berman Holdings LLC (including its predecessor, Neuberger Berman Inc.), since 2007; Chief Investment Officer, Neuberger, since 2009; Chief Executive Officer (Equities) and Managing Director, Management, since 2009; Managing Director, Neuberger Berman Fixed Income LLC ("NBFI"), since 2007; Board member of NBFI since 2006; formerly, Global Head of Asset Management of Lehman Brothers Holdings Inc.'s ("LBHI") Investment Management division, 2006 to 2009; formerly, member of LBHI's Investment Management Division's Executive Management Committee, 2006 to 2009; formerly, Managing Director, Lehman Brothers Inc. ("LBI"), 2006 to 2008; formerly, Chief Recruiting and Development Officer, LBI, 2005 to 2006; formerly, Global Head of LBI's Equity Sales and a Member of its Equities Division Executive Committee, 2003 to 2005. | | | 46 | | | Member of Board of Advisors, McDonough School of Business, Georgetown University, since 2001; Member of New York City Board of Advisors, Teach for America, since 2005; Trustee, Montclair Kimberley Academy (private school), since 2007. | |
|
29
Name, (Year of Birth),
and Address(1) | | Position and
Length of
Time Served(2) | | Principal Occupation(s)(3) | | Number of
Funds in Fund
Complex
Overseen by
Fund Trustee | | Other Directorships
Held Outside Fund
Complex by Fund
Trustee | |
| Robert Conti* (1956) | | Chief Executive Officer, President and Trustee since 2008; prior thereto, Executive Vice President in 2008 and Vice President 2000 to 2008 | | Managing Director, Neuberger, since 2007; formerly, Senior Vice President, Neuberger, 2003 to 2006; formerly, Vice President, Neuberger, 1999 to 2003; President and Chief Executive Officer, Management, since 2008; formerly, Senior Vice President, Management, 2000 to 2008. | | | 46 | | | Chairman of the Board, Staten Island Mental Health Society since 2008. | |
|
| Jack L. Rivkin* (1940) | | Trustee since 2002; President from 2002 to 2008 | | Formerly, Executive Vice President and Chief Investment Officer, Neuberger Berman Holdings LLC (holding company), 2002 to August 2008 and 2003 to August 2008, respectively; formerly, Managing Director and Chief Investment Officer, Neuberger, December 2005 to August 2008 and 2003 to August 2008, respectively; formerly, Executive Vice President, Neuberger, December 2002 to 2005; formerly, Director and Chairman, Management, December 2002 to August 2008; formerly, Executive Vice President, Citigroup Investments, Inc., September 1995 to February 2002; formerly, Executive Vice President, Citigroup Inc., September 1995 to February 2002. | | | 46 | | | Director, Idealab (private company), since 2009; Director, Distributed World Power (private company), since 2009; Director, Dale Carnegie and Associates, Inc. (private company), since 1998; Director, Solbright, Inc. (private company), since 1997; formerly, Director, New York Society of Security Analysts (2006 to 2008). | |
|
(1) The business address of each listed person is 605 Third Avenue, New York, New York 10158.
(2) Pursuant to the Trust's Trust Instrument, each of these Fund Trustees shall hold office for life or until his or her successor is elected or the Trust terminates; except that (a) any Fund Trustee may resign by delivering a written resignation; (b) any Fund Trustee may be removed with or without cause at any time by a written instrument signed by at least two-thirds of the other Fund Trustees; (c) any Fund Trustee who requests to be retired, or who has become unable to serve, may be retired by a written instrument signed by a majority of the other Fund Trustees; and (d) any Fund Trustee may be removed at any shareholder meeting by a vote of at least two-thirds of the outstanding shares.
30
(3) Except as otherwise indicated, each individual has held the positions shown for at least the last five years.
* Indicates a Fund Trustee who is an "interested person" within the meaning of the 1940 Act. Mr. Amato and Mr. Conti are interested persons of the Trust by virtue of the fact that each is an officer of Management, Neuberger and/or their affiliates. Mr. Rivkin may be deemed an interested person of the Trust by virtue of the fact that, until August 2008, he was a director of Management and an officer of Neuberger.
31
Information about the Officers of the Trust
Name, (Year of Birth),
and Address(1) | | Position and
Length of Time
Served(2) | | Principal Occupation(s)(3) | |
| Andrew B. Allard (1961) | | Anti-Money Laundering Compliance Officer since 2002 | | Senior Vice President, Neuberger, since 2006; Deputy General Counsel, Neuberger, since 2004; formerly, Vice President, Neuberger, 2000 to 2005; formerly, Associate General Counsel, Neuberger, 1999 to 2004; Anti-Money Laundering Compliance Officer, nine registered investment companies for which Management acts as investment manager and administrator (six since 2002, two since 2003 and one since 2006). | |
|
| Claudia A. Brandon (1956) | | Executive Vice President since 2008 and Secretary since 1985 | | Senior Vice President, Neuberger, since 2007 and Employee since 1999; formerly, Vice President, Neuberger, 2002 to 2006; Senior Vice President, Management, since 2008 and Assistant Secretary since 2004; formerly, Vice President-Mutual Fund Board Relations, Management, 2000 to 2008; Executive Vice President, nine registered investment companies for which Management acts as investment manager and administrator (nine since 2008); Secretary, nine registered investment companies for which Management acts as investment manager and administrator (three since 1985, three since 2002, two since 2003 and one since 2006). | |
|
| Maxine L. Gerson (1950) | | Executive Vice President since 2008 and Chief Legal Officer since 2005 (only for purposes of sections 307 and 406 of the Sarbanes-Oxley Act of 2002) | | Senior Vice President, Neuberger, since 2002; Deputy General Counsel and Assistant Secretary, Neuberger, since 2001; Senior Vice President, Management, since 2006; Secretary and General Counsel, Management, since 2004; Executive Vice President, nine registered investment companies for which Management acts as investment manager and administrator (nine since 2008); Chief Legal Officer (only for purposes of sections 307 and 406 of the Sarbanes-Oxley Act of 2002), nine registered investment companies for which Management acts as investment manager and administrator (eight since 2005 and one since 2006). | |
|
| Sheila R. James (1965) | | Assistant Secretary since 2002 | | Vice President, Neuberger, since 2008 and Employee since 1999; formerly, Assistant Vice President, Neuberger, 2007; Assistant Secretary, nine registered investment companies for which Management acts as investment manager and administrator (six since 2002, two since 2003 and one since 2006). | |
|
| Brian Kerrane (1969) | | Vice President since 2008 | | Senior Vice President, Neuberger, since 2006; formerly, Vice President, Neuberger, 2002 to 2006; Vice President, Management, since 2008 and Employee since 1991; Vice President, nine registered investment companies for which Management acts as investment manager and administrator (nine since 2008). | |
|
| Kevin Lyons (1955) | | Assistant Secretary since 2003 | | Assistant Vice President, Neuberger, since 2008 and Employee since 1999; Assistant Secretary, nine registered investment companies for which Management acts as investment manager and administrator (eight since 2003 and one since 2006). | |
|
32
Name, (Year of Birth),
and Address(1) | | Position and
Length of Time
Served(2) | | Principal Occupation(s)(3) | |
| Owen F. McEntee, Jr. (1961) | | Vice President since 2008 | | Vice President, Neuberger, since 2006; Employee, Management, since 1992; Vice President, nine registered investment companies for which Management acts as investment manager and administrator (nine since 2008). | |
|
| John M. McGovern (1970) | | Treasurer and Principal Financial and Accounting Officer since 2005; prior thereto, Assistant Treasurer since 2002 | | Senior Vice President, Neuberger, since 2007; formerly, Vice President, Neuberger, 2004 to 2006; Employee, Management, since 1993; Treasurer and Principal Financial and Accounting Officer, nine registered investment companies for which Management acts as investment manager and administrator (eight since 2005 and one since 2006); formerly, Assistant Treasurer, eight registered investment companies for which Management acts as investment manager and administrator, 2002 to 2005. | |
|
| Andrew Provencher (1965) | | Vice President since 2008 | | Managing Director, Management, since 2008; Managing Director, Neuberger, since 2005; formerly, Senior Vice President, Neuberger, 2003 to 2005; formerly, Vice President, Neuberger, 1999 to 2003; Vice President, nine registered investment companies for which Management acts as investment manager and administrator (nine since 2008). | |
|
| Frank Rosato (1971) | | Assistant Treasurer since 2005 | | Vice President, Neuberger, since 2006; Employee, Management, since 1995; Assistant Treasurer, nine registered investment companies for which Management acts as investment manager and administrator (eight since 2005 and one since 2006). | |
|
| Neil S. Siegel (1967) | | Vice President since 2008 | | Managing Director, Management, since 2008; Managing Director, Neuberger, since 2006; formerly, Senior Vice President, Neuberger, 2004 to 2006; Vice President, nine registered investment companies for which Management acts as investment manager and administrator (nine since 2008); formerly, Head of Institutional Marketing, Morgan Stanley Investment Management, 1993 to 2004. | |
|
| Chamaine Williams (1971) | | Chief Compliance Officer since 2005 | | Senior Vice President, Neuberger, since 2007; Chief Compliance Officer, Management, since 2006; Chief Compliance Officer, nine registered investment companies for which Management acts as investment manager and administrator (eight since 2005 and one since 2006); formerly, Senior Vice President, LBI, 2007 to 2008; formerly, Vice President, LBI, 2003 to 2006; formerly, Chief Compliance Officer, Lehman Brothers Asset Management Inc., 2003 to 2007; formerly, Chief Compliance Officer, Lehman Brothers Alternative Investment Management LLC, 2003 to 2007; formerly, Vice President, UBS Global Asset Management (US) Inc. (formerly, Mitchell Hutchins Asset Management, a wholly-owned subsidiary of PaineWebber Inc.), 1997 to 2003. | |
|
(1) The business address of each listed person is 605 Third Avenue, New York, New York 10158.
(2) Pursuant to the By-Laws of the Trust, each officer elected by the Fund Trustees shall hold office until his or her successor shall have been elected and qualified or until his or her earlier death, inability to serve, or resignation. Officers serve at the pleasure of the Fund Trustees and may be removed at any time with or without cause.
(3) Except as otherwise indicated, each individual has held the positions shown for at least the last five years.
33
Proxy Voting Policies and Procedures
A description of the policies and procedures that the Trust uses to determine how to vote proxies relating to portfolio securities is available, without charge, by calling 1-800-877-9700 (toll-free) and on the website of the Securities and Exchange Commission, at www.sec.gov. Information regarding how the Trust voted proxies relating to portfolio securities during the most recent 12-month period ended June 30 is also available, without charge, by calling 1-800-877-9700 (toll-free), on the website of the Securities and Exchange Commission at www.sec.gov, and on Management's website at www.nb.com.
Quarterly Portfolio Schedule
The Trust files a complete schedule of portfolio holdings for the Fund with the Securities and Exchange Commission for the first and third quarters of each fiscal year on Form N-Q. The Trust's Forms N-Q are available on the Securities and Exchange Commission's website at www.sec.gov and may be reviewed and copied at the Securities and Exchange Commission's Public Reference Room in Washington, DC. Information on the operation of the Public Reference Room may be obtained by calling 1-800-SEC-0330. The information on Form N-Q is available upon request, without charge, by calling 1-800-877-9700 (toll free).
Notice to Shareholders (Unaudited)
The Fund hereby designates $1,837,245 as a capital gain distribution.
100.00% of the dividends distributed during the fiscal year ended December 31, 2009 qualifies for the dividends received deduction for corporate shareholders.
34
Neuberger Berman
Advisers Management Trust
Short Duration Bond Portfolio
I Class Shares
Annual Report
December 31, 2009
B1011 02/10
Short Duration Bond Portfolio Managers' Commentary
For the year ended December 31, 2009, the Neuberger Berman Advisers Management Trust (AMT) Short Duration Bond Portfolio posted a strong absolute return and significantly outperformed its benchmark, the Merrill Lynch 1-3 Year Treasury Index.
As the year began, the U.S. fixed income markets were still being negatively impacted by fallout from the turmoil in the financial markets, frozen credit conditions and illiquidity. Collectively, this caused risk aversion to remain elevated, as investors favored the safety of short-term U.S. Treasury securities and avoided securities that were perceived to be risky.
Conditions in the fixed income markets then gradually started to improve as the government's aggressive initiatives to stabilize financial markets began to bear fruit. In addition, as the reporting period progressed, optimism grew regarding the outlook for the U.S. economy. These factors caused investor sentiment to reverse course and risk aversion was replaced with increased risk appetite. Against this backdrop, non-Treasury (spread) sectors rallied sharply. Aside from several brief periods of weakness, these sectors generally outperformed Treasuries in 2009.
During the year, the Portfolio's outperformance was, in large part, the result of its exposure to structured products. Despite their poor performance in 2008, we maintained these positions, as we felt these securities had become extremely undervalued based on their underlying fundamentals and future cash flows. Adhering to our investment discipline proved to be highly beneficial for the Portfolio, as our structured products generated strong relative performance versus Treasuries during the reporting period. In particular, the Portfolio's commercial mortgage-backed securities, non-agency mortgage-backed securities and asset-backed securities generated strong returns.
Another element that enhanced the Portfolio's performance was its exposure to investment grade financial and industrial bonds. When the year began, their yields relative to Treasuries (or spreads) were pricing in worst-case scenarios, with assumed default rates at levels several times higher than had ever occurred, even during the Great Depression. Again, we relied on our fundamental analysis, which indicated that these spreads were unsustainably wide and, barring a complete global financial meltdown, that they would narrow in 2009. This proved to be the case as, in many cases, investment grade bond spreads narrowed to pre-crisis levels during 2009.
Looking ahead, we currently expect the U.S. economy to continue to recover in 2010. Both the consensus and our view are for below-average growth, as we believe overall GDP in 2010 will be highly dependent upon future economic policy in Washington, DC. On the monetary side, we will be closely watching the timing and methods used by the Federal Reserve to remove its quantitative programs.
We believe the Portfolio is well positioned in this environment. As was the case throughout 2009, we currently expect to maintain a defensive posture in duration (or sensitivity to interest rate movements), which is shorter than that of the benchmark. We have reduced the Portfolio's overall risk exposure by capturing profits on some of our strong performers and further diversifying the Portfolio by increasing its Treasury position. That said, we continue to identify compelling securities in certain non-Treasury sectors -- most notably corporate bonds -- and plan to continue pursuing these opportunities when we believe it is appropriate to do so from a risk/reward perspective.
Sincerely,


Thomas Sontag, Michael Foster and Richard Grau
Portfolio Co-Managers
1
Short Duration Bond Portfolio
RATING DIVERSIFICATION
| AAA/Government/Government Agency | | | 62.5 | % | |
| AA | | | 7.5 | | |
| A | | | 13.0 | | |
| BBB | | | 5.6 | | |
| BB | | | 0.9 | | |
| B | | | 2.0 | | |
| CCC | | | 5.3 | | |
| Short Term | | | 3.2 | | |
| Total | | | 100.0 | % | |
AVERAGE ANNUAL TOTAL RETURN1
| | | Inception
Date | |
1 Year | |
5 Years | |
10 Years | | Life of
Fund* | |
Short Duration Bond
Portfolio Class I | | | 09/10/1984 | | | | 13.33% | | | | 1.67% | | | | 3.22% | | | | 5.76% | | |
Merrill Lynch 1-3 Year
Treasury Index2 | | | | | | | 0.78% | | | | 4.04% | | | | 4.48% | | | | 6.51% | | |
Performance data quoted represent past performance, which is no guarantee of future results. The investment return and principal value of an investment will fluctuate so that an investor's shares, when redeemed may be worth more or less than their original cost. Results are shown on a "total return" basis and include reinvestment of all income dividends and distributions.
Current performance may be lower or higher than the performance data quoted. For performance data current to the most recent month end, please visit https://www.nb.com.
* Index returns are as of the inception date 09/10/1984.
As stated in the Portfolio's most recent prospectus, the total annual fund operating expense ratio for fiscal year 2008 was 0.74% for Class I shares (prior to any fee waivers or expense reimbursements). Neuberger Berman Management LLC has contractually agreed to limit certain expenses of the Portfolio through 12/31/2012.
COMPARISON OF A $10,000 INVESTMENT
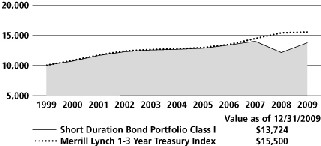
The chart shows the value of a hypothetical $10,000 investment in the Portfolio over the past 10 fiscal years, or since the Portfolio's inception, if it has not operated for 10 years. The result is compared with benchmarks, which may include a broadbased market index and/or a narrower index. Please note that market indexes do not include expenses. All results include the reinvestment of income dividends and distributions. Results represent past performance and do not indicate future results. The chart and table do not reflect the deduction of taxes that a shareholder would pay on Portfolio distributions or the redemption of Portfolio shares.
Please see Endnotes for additional information.
2
Endnotes
1 "Total Return" includes reinvestment of all income dividends and distributions. Results represent past performance and do not indicate future results. The value of an investment in the Portfolio and the return on the investment both will fluctuate, and redemption proceeds may be higher or lower than an investor's original cost. The performance information does not reflect fees and expenses of the variable annuity and variable life insurance policies or the qualified pension and retirement plans whose proceeds are invested in the Portfolio. Neuberger Berman Management LLC ("NBM LLC") has agreed to absorb certain expenses of the AMT Portfolios, including the Portfolio. Without this arrangement, which is subject to change, the total returns of the Portfolio may have been less.
2 The Merrill Lynch 1-3 Year Treasury Index is an unmanaged total return market value index consisting of all coupon bearing U.S. Treasury publicly placed debt securities with maturities between 1 to 3 years. Please note that indices do not take into account any fees and expenses of investing in the individual securities that they track and that individuals cannot invest directly in any index. Data about the performance of this index are prepared or obtained by NBM LLC and include reinvestment of all income dividends and distributions. The Portfolio may invest in many securities not included in the above-described index.
Any ratios or other measurements using a factor of forecasted earnings of a company discussed herein are based on consensus estimates, not NBM LLC's own projections, and they may or may not be realized. In addition, any revision to a forecast could affect the market price of a security. By quoting them herein, NBM LLC does not offer an opinion as to the accuracy of and does not guarantee these forecasted numbers.
The investments for the Portfolio are managed by the same portfolio manager(s) who manage one or more other mutual funds that have similar names, investment objectives and investment styles as the Portfolio. You should be aware that the Portfolio is likely to differ from the other mutual funds in size, cash flow pattern and tax matters. Accordingly, the holdings and performance can be expected to vary from those of the other mutual funds.
The composition, industries and holdings of the Portfolio are subject to change.
Shares of the separate AMT Portfolios are not available to the general public. Shares of this Portfolio may be purchased only by life insurance companies to be used in their separate accounts that fund variable annuity and variable life insurance policies and by qualified pension and retirement plans.
Statistics and projections in this report are derived from sources deemed to be reliable but cannot be regarded as a representation of future results of the AMT Portfolios. This report is prepared for the general information of shareholders and is not an offer of shares of the AMT Portfolios. Shares of the AMT Portfolios are sold only through the currently effective prospectuses, which must precede or accompany this report.
(c) 2010 Neuberger Berman Management LLC distributor. All rights reserved.
3
Information About Your Fund's Expenses
This table is designed to provide information regarding costs related to your investments. All mutual funds incur operating expenses, which include management fees, fees for administrative services and costs of shareholder reports, among others. The following examples are based on an investment of $1,000 made at the beginning of the six month period ended December 31, 2009 and held for the entire period. The table illustrates the fund's costs in two ways:
| Actual Expenses and Performance: | | The first section of the table provides information about actual account values and actual expenses in dollars, based on the fund's actual performance during the period. You may use the information in this line, together with the amount you invested, to estimate the expenses you paid over the period. Simply divide your account value by $1,000 (for example, an $8,600 account value divided by $1,000 = 8.6), then multiply the result by the number in the first section of the table under the heading entitled "Expenses Paid During the Period" to estimate the expenses you paid over the period. | |
|
Hypothetical Example for
Comparison Purposes: | | The second section of the table provides information about hypothetical account values and hypothetical expenses based on the fund's actual expense ratio and an assumed rate of return at 5% per year before expenses. This return is not the fund's actual return. The hypothetical account values and expenses may not be used to estimate the actual ending account balance or expenses you paid for the period. You may use this information to compare the ongoing costs of investing in this fund versus other funds. To do so, compare the expenses shown in this 5% hypothetical example with the 5% hypothetical examples that appear in the shareholder reports of other funds. | |
|
Please note that the expenses in the table are meant to highlight your ongoing costs only. The table and expense example do not include any transactional costs, such as fees and expenses that are, or may be, imposed under your variable contract or qualified pension plan. Therefore, the information under the heading "Hypothetical (5% annual return before expenses)" is useful in comparing ongoing costs only, and will not help you determine the relative total costs of owning different funds. In addition, if these transactional costs were included, your costs would have been higher.
Expense Information as of 12/31/09 (Unaudited)
NEUBERGER BERMAN ADVISERS MANAGEMENT TRUST SHORT DURATION BOND PORTFOLIO
| Actual | | Beginning Account
Value
7/1/09 | | Ending Account
Value
12/31/09 | | Expenses Paid During
the Period*
7/1/09 - 12/31/09 | |
| Class I | | $ | 1,000.00 | | | $ | 1,077.90 | | | $ | 4.19 | | |
| Hypothetical (5% annual return before expenses)** | |
| Class I | | $ | 1,000.00 | | | $ | 1,021.17 | | | $ | 4.08 | | |
* Expenses are equal to the annualized expense ratio of .80%, multiplied by the average account value over the period, multiplied by 184/365 (to reflect the one-half year period shown).
** Hypothetical 5% annual return before expenses is calculated by multiplying the number of days in the most recent half year divided by 365.
4
Schedule of Investments Short Duration Bond Portfolio
| PRINCIPAL AMOUNT | | | | VALUEt | |
| U.S. Treasury Securities-Backed by the Full Faith and Credit of the U.S. Government (23.6%) | | | |
| $ | 7,000,000 | | | U.S. Treasury Bills, 0.39%, due 7/29/10 | | $ | 6,990,984 | oo | |
| | 9,900,000 | | | U.S. Treasury Notes, 4.75%, due 3/31/11 | | | 10,385,714 | oo | |
| | 26,000,000 | | | U.S. Treasury Notes, 1.00%, due 9/30/11 | | | 25,992,902 | | |
| | 26,000,000 | | | U.S. Treasury Notes, 1.38%, due 4/15/12 | | | 26,024,388 | oo | |
| | 12,500,000 | | | U.S. Treasury Notes, 3.88%, due 10/31/12 | | | 13,300,775 | | |
| | | | | Total U.S. Treasury Securities-Backed by the Full Faith and Credit of the U.S. Government
(Cost $82,615,328) | | | 82,694,763 | | |
| U.S. Government Agency Securities (4.9%) | | | |
| | 8,500,000 | | | Citigroup Funding, Inc., Guaranteed FDIC Floating Rate Notes, Ser. 1, 0.55%, due 3/30/10 | | | 8,567,142 | uoo@ | |
| | 8,450,000 | | | Wells Fargo & Co., Guaranteed FDIC Floating Rate Notes, 0.47%, due 3/15/10 | | | 8,506,361 | uoo@ | |
| | | | | Total U.S. Government Agency Securities (Cost $16,950,000) | | | 17,073,503 | | |
| Mortgage-Backed Securities (37.2%) | | | |
| Adjustable Alt-A Jumbo Balance (1.9%) | | | |
| | 12,004,923 | | | Bear Stearns ALT-A Trust, Ser. 2007-1, Class 21A1, 5.56%, due 1/4/10 | | | 6,478,361 | u | |
| Adjustable Alt-A Mixed Balance (0.6%) | | | |
| | 3,366,595 | | | Residential Accredit Loans, Inc., Ser. 2005-QA10, Class A31, 5.59%, due 1/4/10 | | | 2,056,381 | u | |
| Adjustable Alt-B Mixed Balance (0.4%) | | | |
| | 1,734,186 | | | Lehman XS Trust, Floating Rate, Ser. 2005-1, Class 2A1, 1.73%, due 1/4/10 | | | 1,201,964 | u | |
| Adjustable Conforming Balance (0.6%) | | | |
| | 3,472,296 | | | Adjustable Rate Mortgage Trust, Ser. 2005-10, Class 4A1, 5.38%, due 1/4/10 | | | 2,119,681 | uoo | |
| Adjustable Jumbo Balance (6.3%) | | | |
| | 1,487,278 | | | Banc of America Funding Corp., Ser. 2005-F, Class 4A1, 5.29%, due 1/4/10 | | | 1,031,512 | uoo | |
| | 5,531,739 | | | IndyMac INDX Mortgage Loan Trust, Ser. 2006-AR7, Class 3A1, 5.64%, due 1/4/10 | | | 2,816,922 | u | |
| | 3,885,907 | | | Merrill Lynch Mortgage Investors Trust, Ser. 2005-A1, Class 2A1, 3.12%, due 1/4/10 | | | 3,375,064 | u | |
| | 18,000,000 | | | Wells Fargo Mortgage Backed Securities Trust, Ser. 2005-AR16, Class 4A2, 5.00%, due 1/4/10 | | | 14,960,160 | uoo | |
| | | | 22,183,658 | | |
| Adjustable Mixed Balance (4.9%) | | | |
| | 3,036,934 | | | Countrywide Home Loan Mortgage Pass-Through Trust, Ser. 2006-HYB3, Class 1A1A,
4.14%, due 1/4/10 | | | 1,824,278 | u | |
| | 4,018,479 | | | Countrywide Home Loan Mortgage Pass-Through Trust, Ser. 2006-HYB5, Class 2A1,
5.73%, due 1/4/10 | | | 2,289,312 | u | |
| | 2,961,711 | | | Credit Suisse First Boston Mortgage Securities Corp., Ser. 2004-AR4, Class 2A1,
3.39%, due 1/4/10 | | | 2,538,649 | u | |
| | 3,517,651 | | | First Horizon Mortgage Pass-Through Trust, Ser. 2005-AR5, Class 2A1, 5.45%, due 1/4/10 | | | 3,018,385 | u | |
| | 4,353,473 | | | GMAC Mortgage Corp. Loan Trust, Ser. 2006-AR1, Class 1A1, 5.49%, due 1/4/10 | | | 3,194,786 | u | |
| | 751,158 | | | Harborview Mortgage Loan Trust, Ser. 2004-4, Class 3A, 1.36%, due 1/4/10 | | | 480,342 | u | |
| | 7,538,336 | | | IndyMac INDX Mortgage Loan Trust, Ser. 2006-AR3, Class 2A1A, 5.98%, due 1/4/10 | | | 3,901,354 | uoo | |
| | | | 17,247,106 | | |
| Commercial Mortgage-Backed (19.0%) | | | |
| | 4,631,338 | | | Banc of America Commercial Mortgage, Inc., Ser. 2006-3, Class A1, 5.69%, due 7/10/44 | | | 4,714,472 | oo | |
| | 2,178,037 | | | Banc of America Commercial Mortgage, Inc., Ser. 2005-6, Class A1, 5.00%, due 9/10/47 | | | 2,201,399 | oo | |
See Notes to Schedule of Investments 5
| PRINCIPAL AMOUNT | | | | VALUEt | |
| $ | 6,052,457 | | | Bear Stearns Commercial Mortgage Securities, Inc., Ser. 2006-PW14, Class A1,
5.04%, due 12/11/38 | | $ | 6,208,215 | oo | |
| | 5,890,411 | | | Credit Suisse Mortgage Capital Certificates, Ser. 2007-C5, Class A1, 5.10%, due 9/15/40 | | | 6,027,554 | oo | |
| | 5,259,258 | | | GE Capital Commercial Mortgage Corp., Ser. 2002-2A, Class A2, 4.97%, due 8/11/36 | | | 5,446,979 | oo | |
| | 6,900,000 | | | GE Capital Commercial Mortgage Corp., Ser. 2005-C3, Class A2, 4.85%, due 7/10/45 | | | 6,921,607 | | |
| | 173,454 | | | GMAC Commercial Mortgage Securities, Inc., Ser. 2006-C1, Class A1, 4.98%, due 11/10/45 | | | 173,763 | | |
| | 1,745,392 | | | Greenwich Capital Commercial Funding Corp., Ser. 2002-C1, Class A3, 4.50%, due 1/11/17 | | | 1,788,530 | oo | |
| | 1,912,880 | | | JP Morgan Chase Commercial Mortgage Securities Corp., Ser. 2006-LDP7, Class A1,
5.83%, due 1/4/10 | | | 1,936,130 | u | |
| | 11,727,202 | | | JP Morgan Chase Commercial Mortgage Securities Corp., Ser. 2005-LDP5, Class A1,
5.04%, due 12/15/44 | | | 11,763,803 | | |
| | 3,810,848 | | | JP Morgan Chase Commercial Mortgage Securities Corp., Ser. 2007-LD11, Class A1,
5.65%, due 6/15/49 | | | 3,896,749 | | |
| | 1,591,204 | | | LB-UBS Commercial Mortgage Trust, Ser. 2006-C3, Class A1, 5.48%, due 3/15/32 | | | 1,615,211 | | |
| | 6,018,492 | | | Merrill Lynch/Countrywide Commercial Mortgage Trust, Ser. 2007-5, Class A1,
4.28%, due 8/12/48 | | | 6,091,538 | oo | |
| | 1,152,629 | | | Morgan Stanley Capital I, Ser. 2005-HQ5, Class A2, 4.81%, due 1/14/42 | | | 1,152,223 | | |
| | 994,624 | | | Morgan Stanley Capital I, Ser. 2005-HQ6, Class A1, 4.65%, due 8/13/42 | | | 998,998 | | |
| | 2,814,549 | | | Morgan Stanley Capital I, Ser. 2006-T21, Class A1, 4.93%, due 10/12/52 | | | 2,845,799 | | |
| | 2,836,808 | | | Wachovia Bank Commercial Mortgage Trust, Ser. 2003-C7, Class A1, 4.24%, due 10/15/35 | | | 2,855,140 | n | |
| | | | 66,638,110 | | |
| Mortgage-Backed Non-Agency (1.7%) | | | |
| | 1,516,058 | | | Countrywide Home Loans, Ser. 2005-R2, Class 2A4, 8.50%, due 6/25/35 | | | 1,455,416 | noo | |
| | 3,870,379 | | | GSMPS Mortgage Loan Trust, Ser. 2005-RP2, Class 1A4, 8.50%, due 3/25/35 | | | 3,676,859 | n | |
| | 695,739 | | | GSMPS Mortgage Loan Trust, Ser. 2005-RP3, Class 1A4, 8.50%, due 9/25/35 | | | 633,123 | n | |
| | 2,042,761 | | | Knollwood CDO Ltd., Ser. 2006-2A, Class A2J, 0.70%, due 1/13/10 | | | 0 | nu | |
| | | | 5,765,398 | | |
| Fannie Mae (0.5%) | | | |
| | 1,747,172 | | | Whole Loan, Ser. 2004-W8, Class PT, 10.61%, due 1/4/10 | | | 1,906,303 | uoo | |
| Freddie Mac (1.3%) | | | |
| | 10,672 | | | Pass-Through Certificates, 10.00%, due 4/1/20 | | | 12,094 | | |
| | 2,475,821 | | | Pass-Through Certificates, 8.00%, due 11/1/26 | | | 2,839,604 | | |
| | 1,595,179 | | | Pass-Through Certificates, 8.50%, due 10/1/30 | | | 1,841,012 | | |
| | | | 4,692,710 | | |
| | | | | Total Mortgage-Backed Securities (Cost $154,529,864) | | | 130,289,672 | | |
| Corporate Debt Securities (20.2%) | | | |
| Banks (10.2%) | | | |
| | 9,000,000 | | | Bank of America Corp., Junior Subordinated Unsecured Notes, 7.80%, due 2/15/10 | | | 9,064,260 | oo | |
| | 4,100,000 | | | Bear Stearns Cos. LLC, Senior Unsecured Notes, 5.35%, due 2/1/12 | | | 4,356,553 | | |
| | 2,200,000 | | | Bear Stearns Cos. LLC, Senior Unsecured Medium-Term Notes, Ser. B, 6.95%, due 8/10/12 | | | 2,458,007 | | |
| | 6,930,000 | | | Citigroup, Inc., Senior Unsecured Notes, 5.13%, due 2/14/11 | | | 7,150,256 | oo | |
| | 6,000,000 | | | Goldman Sachs Group, Inc., Senior Unsecured Notes, 6.88%, due 1/15/11 | | | 6,362,556 | oo | |
| | 6,500,000 | | | Morgan Stanley, Senior Unsecured Notes, 4.00%, due 1/15/10 | | | 6,504,726 | oo | |
| | | | 35,896,358 | | |
| Beverages (1.0%) | | | |
| | 3,350,000 | | | Anheuser-Busch Cos., Inc., Senior Unsecured Notes, 4.95%, due 1/15/14 | | | 3,455,887 | | |
| Diversified Financial Services (3.6%) | | | |
| | 4,240,000 | | | American Express Credit Corp., Senior Unsecured Medium-Term Notes, Ser. C, 5.88%, due 5/2/13 | | | 4,550,194 | | |
See Notes to Schedule of Investments 6
| PRINCIPAL AMOUNT | | | | VALUEt | |
| $ | 7,700,000 | | | General Electric Capital Corp., Senior Unsecured Medium-Term Notes, Ser. A,
4.25%, due 9/13/10 | | $ | 7,916,663 | oo | |
| | | | 12,466,857 | | |
| Media (2.1%) | | | |
| | 3,630,000 | | | Comcast Cable Communications LLC, Guaranteed Senior Unsecured Notes, 6.75%, due 1/30/11 | | | 3,830,982 | | |
| | 3,425,000 | | | Time Warner Cable, Inc., Guaranteed Notes, 5.40%, due 7/2/12 | | | 3,659,369 | oo | |
| | | | 7,490,351 | | |
| Office/Business Equipment (0.8%) | | | |
| | 2,600,000 | | | Xerox Corp., Senior Unsecured Notes, 5.50%, due 5/15/12 | | | 2,747,732 | | |
| Oil & Gas (0.8%) | | | |
| | 2,425,000 | | | XTO Energy, Inc., Senior Unsecured Notes, 5.90%, due 8/1/12 | | | 2,657,009 | | |
| Pharmaceuticals (1.2%) | | | |
| | 3,950,000 | | | Pfizer, Inc., Senior Unsecured Notes, 4.45%, due 3/15/12 | | | 4,177,714 | | |
| Telecommunications (0.5%) | | | |
| | 1,765,000 | | | Telecom Italia Capital SA, Guaranteed Notes, 5.25%, due 11/15/13 | | | 1,856,411 | | |
| | | | | Total Corporate Debt Securities (Cost $69,971,955) | | | 70,748,319 | | |
| Asset-Backed Securities (10.3%) | | | |
| | 4,342,896 | | | ACE Securities Corp. Home Equity Loan Trust, Ser. 2006-ASP5, Class A2B, 0.36%, due 1/25/10 | | | 2,203,731 | u | |
| | 2,000,000 | | | ACE Securities Corp. Home Equity Loan Trust, Ser. 2006-OP1, Class A2C, 0.38%, due 1/25/10 | | | 1,184,154 | u | |
| | 1,753,000 | | | Bear Stearns Asset Backed Securities Trust, Ser. 2006-HE9, Class 1A2, 0.38%, due 1/25/10 | | | 782,973 | u | |
| | 1,582,622 | | | Capital Auto Receivables Asset Trust, Ser. 2008-2, Class A2B, 1.15%, due 1/15/10 | | | 1,583,890 | u | |
| | 3,013,803 | | | Carrington Mortgage Loan Trust, Ser. 2006-OPT1, Class A3, 0.41%, due 1/25/10 | | | 2,548,829 | u | |
| | 4,000,000 | | | Carrington Mortgage Loan Trust, Ser. 2007-FRE1, Class A3, 0.49%, due 1/25/10 | | | 1,426,896 | u | |
| | 4,400,000 | | | Chase Issuance Trust, Ser. 2009-A5, Class A5, 1.03%, due 1/15/10 | | | 4,412,163 | uoo | |
| | 2,659,673 | | | Countrywide Asset-Backed Certificates Trust, Ser. 2006-3, Class 2A2, 0.41%, due 1/25/10 | | | 2,177,378 | u | |
| | 1,497,561 | | | Countrywide Asset-Backed Certificates Trust, Ser. 2006-5, Class 2A2, 0.41%, due 1/25/10 | | | 1,153,685 | u | |
| | 2,722,810 | | | Countrywide Asset-Backed Certificates Trust, Ser. 2006-6, Class 2A2, 0.41%, due 1/25/10 | | | 2,118,592 | u | |
| | 1,912,769 | | | DaimlerChrysler Auto Trust, Ser. 2008-B, Class A2B, 1.16%, due 1/8/10 | | | 1,914,785 | u | |
| | 5,000,000 | | | Discover Card Master Trust, Ser. 2008-A1, Class A1, 0.78%, due 1/15/10 | | | 5,000,316 | uoo | |
| | 1,174,242 | | | Impac Secured Assets Corp., Ser. 2006-3, Class A4, 0.32%, due 1/25/10 | | | 463,826 | u | |
| | 413,503 | | | Merrill Lynch Mortgage Investors Trust, Ser. 2006-MLN1, Class A2A, 0.30%, due 1/25/10 | | | 396,321 | u | |
| | 645,309 | | | Morgan Stanley Capital I, Inc., Mortgage Pass-Through Certificates, Ser. 2007-HE5, Class A2A,
0.34%, due 1/25/10 | | | 537,809 | u | |
| | 2,541,744 | | | Residential Asset Mortgage Products, Inc., Ser. 2006-RS1, Class AI2, 0.46%, due 1/25/10 | | | 1,704,385 | u | |
| | 1,440,523 | | | Securitized Asset Backed Receivables LLC Trust, Ser. 2006-WM4, Class A2C, 0.39%, due 1/25/10 | | | 520,268 | u | |
| | 5,175,000 | | | Soundview Home Equity Loan Trust, Ser. 2006-OPT3, Class 2A3, 0.40%, due 1/25/10 | | | 3,554,763 | uoo | |
| | 2,304,550 | | | Structured Asset Investment Loan Trust, Ser. 2006-3, Class A4, 0.32%, due 1/25/10 | | | 2,215,358 | uoo | |
| | | | | Total Asset-Backed Securities (Cost $48,009,265) | | | 35,900,122 | | |
| NUMBER OF SHARES | | | | | |
| Short-Term Investments (3.1%) | | | |
| | 10,989,287 | | | State Street Institutional Liquid Reserves Fund Institutional Class (Cost $10,989,287) | | | 10,989,287 | | |
| | | | | Total Investments (99.3%) (Cost $383,065,699) | | | 347,695,666 | ## | |
| | | | | Cash, receivables and other assets, less liabilities (0.7%) | | | 2,344,015 | | |
| | | | | Total Net Assets (100.0%) | | $ | 350,039,681 | | |
See Notes to Schedule of Investments 7
Notes to Schedule of Investments Short Duration
Bond Portfolio
t The value of investments in securities and financial futures contracts by Neuberger Berman Advisers Management Trust Short Duration Bond Portfolio (the "Fund") is determined by Neuberger Berman Management LLC ("Management") primarily by obtaining valuations from independent pricing services based on readily available bid quotations, or if quotations are not available, by methods which include considerations such as: yields or prices of securities of comparable quality, coupon, maturity and type; indications as to values from dealers; and general market conditions. If a valuation is not available from an independent pricing service, the Fund seeks to obtain quotations from principal market makers. Management has developed a process to periodically review information provided by independent pricing services. If such quotations are not readily available, securities are valued using methods the Board of Trustees of Neuberger Berman Advisers Management Trust (the "Board") has approved on the belief that they reflect fair value. Numerous factors may be considered when determining the fair value of a security, including available analyst, media or other reports, trading in futures or ADRs and whether the issuer of the security being fair valued has other securities outstanding. Foreign security prices are furnished by independent quotation services and expressed in local currency values. Foreign security prices are currently translated from the local currency into U.S. dollars using the exchange rate as of 4:00 p.m., Eastern time. Fair value prices are necessarily estimates, and there is no assurance that such a price will be at or close to the price at which the security is next quoted. Short-term debt securities with less than 60 days until maturity may be valued at cost, which, when combined with interest earned, is expected to approximate market value.
In accordance with Accounting Standards Codification ("ASC") 820 "Fair Value Measurements and Disclosures" ("ASC 820"), formerly known as Financial Accounting Standards Board ("FASB") Statement of Financial Accounting Standards No. 157, "Fair Value Measurements," investments held by a fund are carried at "fair value" as defined by ASC 820. Fair value is defined as the price that a fund would receive upon selling an investment in an orderly transaction to an independent buyer in the principal or most advantageous market for the investment under current market conditions. Various inputs, including the volume and level of activity for the asset or liability in the market are considered in determining the value of the Fund's investments, some of which are discussed above. Significant management judgement may be necessary to estimate fair value in accordance with ASC 820.
In addition to defining fair value, ASC 820 established a three-tier hierarchy of inputs to establish a classification of fair value measurements for disclosure purposes. The three-tier hierarchy of inputs is summarized in the three broad Levels listed below.
. Level 1 - quoted prices in active markets for identical investments
. Level 2 - other significant observable inputs (including quoted prices for similar investments, interest rates, prepayment speeds, credit risk, amortized cost, etc.)
. Level 3 - significant unobservable inputs (including the Fund's own assumptions in determining the fair value of investments)
The inputs or methodology used for valuing an investment are not necessarily an indication of the risk associated with investing in those securities.
See Notes to Financial Statements8
Notes to Schedule of Investments Short Duration
Bond Portfolio (cont'd)
The following is a summary, by category of Level, of inputs used to value the Fund's investments as of December 31, 2009:
| Asset Valuation Inputs | | Level 1 | | Level 2 | | Level 3S | | Total | |
| Investments: | |
U.S. Treasury Securities-Backed by the
Full Faith and Credit of the
U.S. Government | | $ | -- | | | $ | 82,694,763 | | | $ | -- | | | $ | 82,694,763 | | |
| U.S. Government Agency Securities | | | -- | | | | 17,073,503 | | | | -- | | | | 17,073,503 | | |
| Mortgage-Backed Securities^ | | | -- | | | | 130,289,672 | | | | 0 | | | | 130,289,672 | | |
| Corporate Debt Securities^ | | | -- | | | | 70,748,319 | | | | -- | | | | 70,748,319 | | |
| Asset-Backed Securities | | | -- | | | | 35,900,122 | | | | -- | | | | 35,900,122 | | |
| Short-Term Investments | | | -- | | | | 10,989,287 | | | | -- | | | | 10,989,287 | | |
| Total Investments | | $ | -- | | | $ | 347,695,666 | | | $ | 0 | | | $ | 347,695,666 | | |
^ The Schedule of Investments provides information on the industry categorization for the portfolio.
S The following is a reconciliation between the beginning and ending balances of investments in which significant unobservable inputs (Level 3) were used in determining value:
Investments in
Securities: | | Beginning
balance, as
of 1/1/09 | | Accrued
discounts/
(premiums) | | Realized
gain/loss
and change
in unrealized
appreciation/
(depreciation) | | Net
purchases/
(sales) | | Net
transfers in
and/or out
of Level 3 | | Balance, as
of 12/31/09 | | Net change in
unrealized
appreciation/
(depreciation)
from
investments
still held
as of 12/31/09 | |
Mortgage-Backed
Securities
Mortgage- Backed
Non-Agency | | $ | 5,107 | | | $ | -- | | | $ | (5,107 | ) | | $ | -- | | | $ | -- | | | $ | 0 | | | $ | (5,107 | ) | |
| Liability Valuation Inputs | |
The following is a summary, by category of Level, of inputs used to value the Fund's derivatives as of December 31, 2009:
| | | Level 1 | | Level 2 | | Level 3 | | Total | |
| Futures Contracts | | $ | (356,016 | ) | | $ | -- | | | $ | -- | | | $ | (356,016 | ) | |
## At December 31, 2009, the cost of investments for U.S. federal income tax purposes was $384,617,010. Gross unrealized appreciation of investments was $2,264,286 and gross unrealized depreciation of investments was $39,185,630, resulting in net unrealized depreciation of $36,921,344, based on cost for U.S. federal income tax purposes.
n Restricted security subject to restrictions on resale under federal securities laws. These securities may be resold in transactions exempt from registration, normally to qualified institutional buyers under Rule 144A under the Securities Act of 1933, as amended, and have been deemed by the investment manager to be liquid. At December 31, 2009, these securities amounted to $8,620,538 or 2.5% of net assets for the Fund.
oo All or a portion of this security is segregated in connection with obligations for financial futures contracts.
u Floating rate securities are securities whose yields vary with a designated market index or market rate. These securities are shown at their current rates as of December 31, 2009.
@ This debt is guaranteed under the Federal Deposit Insurance Corporation's ("FDIC") Temporary Liquidity Guarantee Program and is backed by the full faith and credit of the United States. At December 31, 2009, these securities amounted to $17,073,503 or 4.9% of net assets.
See Notes to Financial Statements9
Statement of Assets and Liabilities
Neuberger Berman Advisers Management Trust
| | | SHORT DURATION
BOND PORTFOLIO | |
| | | December 31, 2009 | |
| Assets | |
| Investments in securities, at value* (Notes A & F)--see Schedule of Investments: | |
| Unaffiliated issuers | | $ | 347,695,666 | | |
| Cash | | | 102 | | |
| Interest receivable | | | 2,462,713 | | |
| Receivable for Fund shares sold | | | 270,042 | | |
| Prepaid expenses and other assets | | | 12,501 | | |
| Total Assets | | | 350,441,024 | | |
| Liabilities | |
| Payable for Fund shares redeemed | | | 43,552 | | |
| Payable to investment manager (Notes A & B) | | | 75,999 | | |
| Payable to administrator (Note B) | | | 121,598 | | |
| Payable for variation margin on open futures contracts (Note A) | | | 72,188 | | |
| Accrued expenses and other payables | | | 88,006 | | |
| Total Liabilities | | | 401,343 | | |
| Net Assets at value | | $ | 350,039,681 | | |
| Net Assets consist of: | |
| Paid-in capital | | $ | 427,908,321 | | |
| Undistributed net investment income (loss) | | | 16,485,725 | | |
| Accumulated net realized gains (losses) on investments | | | (58,628,316 | ) | |
| Net unrealized appreciation (depreciation) in value of investments | | | (35,726,049 | ) | |
| Net Assets at value | | $ | 350,039,681 | | |
| Shares Outstanding ($.001 par value; unlimited shares authorized) | | | 31,186,179 | | |
| Net Asset Value, offering and redemption price per share | | $ | 11.22 | | |
| *Cost of Investments: | |
| Unaffiliated issuers | | $ | 383,065,699 | | |
See Notes to Financial Statements 10
Statement of Operations
Neuberger Berman Advisers Management Trust
| | | SHORT DURATION
BOND PORTFOLIO | |
| | | For the
Year Ended
December 31, 2009 | |
| Investment Income: | |
| Income (Note A): | |
| Interest income--unaffiliated issuers | | $ | 17,500,244 | | |
| Income from investments in affiliated issuers (Note F) | | | 7,723 | | |
| Total income | | $ | 17,507,967 | | |
| Expenses: | |
| Investment management fees (Notes A & B) | | | 939,661 | | |
| Administration fees (Note B) | | | 1,503,458 | | |
| Audit fees | | | 43,306 | | |
| Custodian fees (Note B) | | | 138,212 | | |
| Insurance expense | | | 24,725 | | |
| Legal fees | | | 138,199 | | |
| Shareholder reports | | | 101,480 | | |
| Trustees' fees and expenses | | | 50,136 | | |
| Miscellaneous | | | 30,313 | | |
| Total expenses | | | 2,969,490 | | |
| Investment management fees waived (Note A) | | | (4,505 | ) | |
| Expenses reduced by custodian fee expense offset arrangement (Note B) | | | (2,292 | ) | |
| Total net expenses | | | 2,962,693 | | |
| Net investment income (loss) | | $ | 14,545,274 | | |
| Realized and Unrealized Gain (Loss) on Investments (Note A) | |
| Net realized gain (loss) on: | |
| Sales of investment securities of unaffiliated issuers | | | (45,116,697 | ) | |
| Financial futures contracts | | | 3,323,252 | | |
| Change in net unrealized appreciation (depreciation) in value of: | |
| Unaffiliated investment securities | | | 75,281,647 | | |
| Financial futures contracts | | | (1,734,140 | ) | |
| Net gain (loss) on investments | | | 31,754,062 | | |
| Net increase (decrease) in net assets resulting from operations | | $ | 46,299,336 | | |
See Notes to Financial Statements 11
Statements of Changes in Net Assets
Neuberger Berman Advisers Management Trust
| | | SHORT DURATION
BOND PORTFOLIO | |
| | | Year Ended
December 31,
2009 | | Year Ended
December 31,
2008 | |
| Increase (Decrease) in Net Assets: | |
| From Operations (Note A): | |
| Net investment income (loss) | | $ | 14,545,274 | | | $ | 24,673,866 | | |
| Net realized gain (loss) on investments | | | (41,793,445 | ) | | | 5,653,830 | | |
| Change in net unrealized appreciation (depreciation) of investments | | | 73,547,507 | | | | (106,589,866 | ) | |
| Net increase (decrease) in net assets resulting from operations | | | 46,299,336 | | | | (76,262,170 | ) | |
| Distributions to Shareholders From (Note A): | |
| Net Investment Income | | | (26,930,221 | ) | | | (24,383,220 | ) | |
| From Fund Share Transactions (Note D): | |
| Proceeds from shares sold | | | 78,622,503 | | | | 88,862,576 | | |
| Proceeds from reinvestment of dividends and distributions | | | 26,930,221 | | | | 24,383,220 | | |
| Payments for shares redeemed | | | (220,360,057 | ) | | | (190,113,580 | ) | |
| Net increase (decrease) from Fund share transactions | | | (114,807,333 | ) | | | (76,867,784 | ) | |
| Net Increase (Decrease) in Net Assets | | | (95,438,218 | ) | | | (177,513,174 | ) | |
| Net Assets: | |
| Beginning of year | | | 445,477,899 | | | | 622,991,073 | | |
| End of year | | $ | 350,039,681 | | | $ | 445,477,899 | | |
| Undistributed net investment income (loss) at end of year | | $ | 16,485,725 | | | $ | 26,929,953 | | |
See Notes to Financial Statements 12
Notes to Financial Statements Short Duration Bond Portfolio
Note A--Summary of Significant Accounting Policies:
1 General: The Fund is a separate operating series of Neuberger Berman Advisers Management Trust (the "Trust"), a Delaware statutory trust organized pursuant to a Trust Instrument dated May 23, 1994. The Trust is currently comprised of ten separate operating series (each a "Series," collectively, the "Funds") each of which is diversified. The Trust is registered as an open-end management investment company under the Investment Company Act of 1940, as amended (the "1940 Act"), and its shares are registered under the Securities Act of 1933, as amended. The Fund currently offers only Class I shares. The Board may establish additional series or classes of shares without the approval of shareholders.
The assets of each Series belong only to that Series, and the liabilities of each Series are borne solely by that Series and no other.
The preparation of financial statements in accordance with U.S. generally accepted accounting principles requires Management to make estimates and assumptions at the date of the financial statements. Actual results could differ from those estimates.
2 Portfolio valuation: Investment securities are valued as indicated in the notes following the Schedule of Investments.
3 Foreign currency translation: The accounting records of the Fund are maintained in U.S. dollars. Foreign currency amounts are currently translated into U.S. dollars using the exchange rates as of 4:00 p.m., Eastern time, to determine the value of investments, other assets and liabilities. Purchase and sale prices of securities, and income and expenses, are translated into U.S. dollars at the prevailing rate of exchange on the respective dates of such transactions. Net unrealized foreign currency gain (loss), if any, arises from changes in the value of assets and liabilities, other than investments in securities, as a result of changes in exchange rates and is stated separately in the Statement of Operations.
4 Securities transactions and investment income: Securities transactions are recorded on trade date for financial reporting purposes. Interest income, including accretion of discount (adjusted for original issue discount, where applicable) is recorded on the accrual basis. Realized gains and losses from securities transactions and foreign currency transactions, if any, are recorded on the basis of identified cost and stated separately in the Statement of Operations. Included in net realized gain (loss) on investments are proceeds from the settlements of class action litigation in which the Fund participated as a plaintiff. The amount of such proceeds for the year ended December 31, 2009 was $62,062.
5 Income tax information: The Funds are treated as separate entities for U.S. federal income tax purposes. It is the policy of the Fund to continue to qualify as a regulated investment company by complying with the requirements of Subchapter M of the Internal Revenue Code applicable to regulated investment companies and to distribute substantially all of its earnings to its shareholders. Therefore, no federal income or excise tax provision is required.
The Fund has adopted the provisions of ASC 740 "Income Taxes"("ASC 740"), formerly known as FASB Interpretation No. 48 "Accounting for Uncertainty in Income Taxes -- an interpretation of FASB Statement No. 109." ASC 740 sets forth a minimum threshold for financial statement recognition of the benefit of a tax position taken, or expected to be taken, in a tax return. The Fund recognizes interest and penalties, if any, related to unrecognized tax benefits as an income tax expense in the Statement of Operations. The Fund is subject to examination by U.S. federal and state tax authorities for returns filed for the prior three fiscal years 2006 - 2008. As of December 31, 2009, the Fund did not have any unrecognized tax benefits.
Income distributions and capital gain distributions are determined in accordance with income tax regulations, which may differ from U.S. generally accepted accounting principles. These differences are primarily due to differing treatments of income and gains on various investment securities held by the Fund, timing differences and differing characterization of distributions made by the Fund as a whole. The Fund may also utilize earnings and profits distributed to shareholders on redemption of shares as a part of the dividends paid deduction for income tax purposes.
13
As determined on December 31, 2009, permanent differences resulting primarily from different book and tax accounting for paydown gains and losses and amortization of bond premium were reclassified at fiscal year-end. These reclassifications had no effect on net income, net asset value or net asset value per share of the Fund.
The tax character of distributions paid during the years ended December 31, 2009 and December 31, 2008 was as follows:
| Distributions Paid From: | |
| Ordinary Income | | Total | | | |
| 2009 | | 2008 | | 2009 | | 2008 | | | |
| $ | 26,930,221 | | | $ | 24,383,220 | | | $ | 26,930,221 | | | $ | 24,383,220 | | | | |
As of December 31, 2009, the components of distributable earnings (accumulated losses) on a U.S. federal income tax basis were as follows:
Undistributed
Ordinary
Income | | Unrealized
Appreciation
(Depreciation) | | Loss
Carryforwards
and Deferrals | | Total | |
| $ | 16,485,725 | | | $ | (36,921,345 | ) | | $ | (57,433,020 | ) | | $ | (77,868,640 | ) | |
The difference between book basis and tax basis distributable earnings is attributable primarily to timing differences of mark to market on certain futures contracts, amortization of bond premium, post October loss deferrals and capital loss carryforwards.
To the extent the Fund's net realized capital gains, if any, can be offset by capital loss carryforwards, it is the policy of the Fund not to distribute such gains. As determined at December 31, 2009, the Fund had unused capital loss carryforwards available for federal income tax purposes to offset net realized capital gains, if any, as follows:
| | | Expiring in | |
| | | 2012 | | 2013 | | 2014 | | 2015 | | 2016 | | 2017 | |
| | | $ | 2,710,070 | | | $ | 4,632,986 | | | $ | 3,820,726 | | | $ | 514,506 | | | $ | -- | | | $ | 45,541,698 | | |
Under current tax law, certain net capital and net foreign currency losses realized after October 31 within the taxable year may be deferred and treated as occurring on the first day of the following tax year. For the year ended December 31, 2009, the Fund elected to defer $213,034 net capital losses arising between November 1, 2009 and December 31, 2009.
6 Distributions to shareholders: The Fund may earn income, net of expenses, daily on its investments. Distributions from net investment income and net realized capital gains, if any, generally are distributed in October. Income distributions and capital gain distributions to shareholders are recorded on the ex-date.
7 Foreign taxes: Foreign taxes withheld represent amounts withheld by foreign tax authorities, net of refunds recoverable.
8 Expense allocation: Certain expenses are applicable to multiple funds. Expenses directly attributable to a Series are charged to that Series. Expenses of the Trust that are not directly attributed to a Series are allocated among the Funds, on the basis of relative net assets, except where a more appropriate allocation of expenses to each of the Funds can otherwise be made fairly. Expenses borne by the complex of related investment companies, which includes open-end and closed-end investment companies for which Management serves as investment manager, that are not directly attributed to a Series or the Trust are allocated among the Fund and the other investment companies in the complex or series thereof on the basis of relative net assets, except where a more appropriate allocation of expenses to each investment company in the complex or series thereof can otherwise be made fairly.
9 Security Lending: A third party, eSecLending, serves as exclusive lending agent for the Fund. eSecLending, as agent, has assisted the Fund in conducting bidding processes to try to identify a principal that would pay a guaranteed amount to the Fund in consideration of the Fund entering into an exclusive securities lending arrangement.
14
During the fiscal year, no principal had an exclusive securities lending arrangement with the Fund; as such, the Fund was not guaranteed any particular level of income.
Under the securities lending arrangement, the Fund receives cash collateral at the beginning of each transaction equal to at least 102% of the prior day's market value of the loaned securities (105% in the case of international securities). The Fund may invest all the cash collateral in Neuberger Berman Securities Lending Quality Fund, LLC ("Quality Fund"), a fund managed by Neuberger Berman Fixed Income LLC (formerly known as Lehman Brothers Asset Management LLC) ("NBFI"), an affiliate of Management. Effective July 1, 2009, Dwight Asset Management Company LLC became the Sub-Adviser to the Quality Fund. The Quality Fund is not a money market fund that is registered under the 1940 Act and does not operate in accordance with all requirements of Rule 2a-7 under the 1940 Act. There is no assurance that the Quality Fund will maintain a $1.00 share price.
The market value of the Fund's investments in the Quality Fund as of the fiscal year ended December 31, 2009, if any, is reflected in the Fund's Schedule of Investments. If it were necessary to liquidate assets in the Quality Fund to meet returns on outstanding securities loans at a time when the Quality Fund's price per share was less than $1.00, the Fund may not receive an amount from the Quality Fund that is equal in amount to the collateral the Fund would be required to return to the borrower of the securities and the Fund would be required to make up for this shortfall. In addition, as a result of recent reduced liquidity in the credit and fixed income markets, it may be difficult to dispose quickly of some securities in the Quality Fund at the price at which the Quality Fund is carrying them.
Net income from the lending program represents any amounts received from a principal plus income earned on the cash collateral invested in Quality Fund or in other investments, if applicable, less cash collateral fees and other expenses associated with the loans. For the fiscal year ended December 31, 2009, the Fund did not receive net income under the securities lending arrangement.
10 Repurchase agreements: The Fund may enter into repurchase agreements with institutions that Management has determined are creditworthy. Each repurchase agreement is recorded at cost. The Fund requires that the securities purchased in a repurchase agreement be transferred to the custodian in a manner sufficient to enable the Fund to assert a perfected security interest in those securities in the event of a default under the repurchase agreement. The Fund monitors, on a daily basis, the value of the securities transferred to ensure that their value, including accrued interest, is greater than amounts owed to the Fund under each such repurchase agreement.
11 Transactions with other funds managed by Neuberger Berman Management LLC: Pursuant to an Exemptive Order issued by the Securities and Exchange Commission, the Fund may invest in a money market fund managed by Management or an affiliate. Through August 10, 2009, the Fund invested in Neuberger Berman Prime Money Fund ("Prime Money"), as approved by the Board. Prime Money sought to provide the highest available current income consistent with safety and liquidity. For any cash that the Fund invested in Prime Money, Management waived a portion of its management fee equal to the management fee it received from Prime Money on those assets (the "Arrangement"). For the year ended December 31, 2009, management fees waived under this Arrangement amounted to $4,505 and are reflected in the Statement of Operations under the caption "Investment management fees waived." For the year ended December 31, 2009, income earned under this Arrangement amounted to $7,723 and is reflected in the Statement of Operations under the caption "Income from investments in affiliated issuers."
On August 10, 2009, the Fund ceased investing in Prime Money. On this date, the Fund's shares of Prime Money were redeemed in exchange for portfolio holdings of Prime Money, which were used to purchase Institutional Class shares of State Street Institutional Liquid Reserves Fund.
12 Dollar rolls: The Fund may enter into dollar roll transactions with respect to mortgage-backed securities. In a dollar roll transaction, the Fund sells securities for delivery in the current month and simultaneously agrees to repurchase substantially similar (i.e., same type and coupon) securities on a specified future date from the same party. During the period before the repurchase, the Fund foregoes principal and interest payments on the securities. The Fund is compensated by the difference between the current sales price and the forward price for the future purchase (often referred to as the "drop"), as well as by the interest earned on the cash proceeds of the initial sale. Dollar rolls may increase fluctuations in the Fund's net asset value and may be viewed as a form of leverage.
15
There is a risk that the counter party will be unable or unwilling to complete the transaction as scheduled, which may result in losses to the Fund.
13 Investments in foreign securities: Investing in foreign securities may involve certain sovereign and other risks, in addition to the credit and market risks normally associated with domestic securities. These additional risks include the possibility of adverse political and economic developments (including political instability, nationalization, expropriation, or confiscatory taxation) and the potentially adverse effects of unavailability of public information regarding issuers, less governmental supervision and regulation of financial markets, reduced liquidity of certain financial markets, and the lack of uniform accounting, auditing, and financial reporting standards or the application of standards that are different or less stringent than those applied in the United States. Foreign securities also may experience greater price volatility, higher rates of inflation, and delays in settlement. At December 31, 2009, the Fund did not own any foreign securities.
14 Derivative instruments: During the fiscal period ended December 31, 2009, the Fund's use of derivatives was limited to financial futures contracts. The Fund adopted ASC 815 "Derivatives and Hedging" ("ASC 815"), formerly known as FASB Statement of Financial Accounting Standards No. 161 "Disclosures about Derivative Instruments and Hedging Activities," effective January 1, 2009.
Financial futures contracts: The Fund may buy and sell financial futures contracts to hedge against changes in securities prices resulting from changes in prevailing interest rates. At the time the Fund enters into a financial futures contract, it is required to deposit with the futures commission merchant a specified amount of cash or liquid securities, known as "initial margin," ranging upward from 1.1% of the value of the financial futures contract being traded. Each day, the futures contract is valued at the official settlement price of the board of trade or U.S. commodity exchange on which such futures contract is traded. Subsequent payments, known as "variation margin," to and from the broker are made on a daily basis as the market price of the financial futures contract fluctuates. Daily variation margin adjustments, arising from this "mark to market," are recorded by the Fund as unrealized gains or losses.
Although some financial futures contracts by their terms call for actual delivery or acceptance of financial instruments, in most cases the contracts are closed out prior to delivery by offsetting purchases or sales of matching financial futures contracts. When the contracts are closed, the Fund recognizes a gain or loss. Risks of entering into futures contracts include the possibility there may be an illiquid market, possibly at a time of rapidly declining prices, and/or a change in the value of the contract may not correlate with changes in the value of the underlying securities. Futures have minimal counterparty risk to the Fund since the exchange's clearinghouse, as counterparty to all exchange traded futures, guarantees the futures against default.
For U.S. federal income tax purposes, the futures transactions undertaken by the Fund may cause the Fund to recognize gains or losses from marking contracts to market even though its positions have not been sold or terminated, may affect the character of the gains or losses recognized as long-term or short-term, and may affect the timing of some capital gains and losses realized by the Fund. Also, the Fund's losses on transactions involving futures contracts may be deferred rather than being taken into account currently in calculating the Fund's taxable income.
During the year ended December 31, 2009, the Fund entered into financial futures contracts. At December 31, 2009, open positions in financial futures contracts were:
| Expiration | | Open Contracts | | Position | | Unrealized
(Depreciation) | |
| March 2010 | | 385 U.S. Treasury Notes, 2 Year | | Long | | $ | (356,016 | ) | |
For the year ended December 31, 2009, the Fund invested in open futures contracts with notional amounts ranging from $3,200,000 to $92,000,000. At December 31, 2009, the Fund had deposited $1,164,333 in a Fannie Mae Whole Loan, 10.61%, due 1/4/10, to cover margin requirements on open futures contracts.
16
At December 31, 2009, the Fund had the following derivatives (not designated as hedging instruments under ASC 815), grouped by primary risk exposure:
Liability Derivatives
| | | Interest Rate
Risk | |
| Futures Contracts(1) | | $ | (356,016 | ) | |
| Total Value | | $ | (356,016 | ) | |
(1) Statement of Assets and Liabilities location: Cumulative appreciation (depreciation) of futures contracts is reported in "Futures Contracts" above and is included in Net unrealized appreciation (depreciation) in value of investments within the Statement of Assets and Liabilities. Only current day's variation margin, if any, is reported within the Statement of Assets and Liabilities: Payable for variation margin on open futures contracts.
The impact of these derivative instruments on the Statement of Operations during the year ended December 31, 2009, was as follows:
Realized Gain (Loss)(1)
| | | Interest Rate
Risk | |
| Futures Contracts | | $ | 3,323,252 | | |
| Total Realized Gain (Loss) | | $ | 3,323,252 | | |
Change in Appreciation (Depreciation)(2)
| | | Interest Rate
Risk | |
| Futures Contracts | | $ | (1,734,140 | ) | |
| Total Change in Appreciation (Depreciation) | | $ | (1,734,140 | ) | |
(1) Statement of Operations location: Net realized gain (loss) on financial futures contracts.
(2) Statement of Operations location: Change in net unrealized appreciation (depreciation) in value of financial futures contracts.
15 Indemnifications: Like many other companies, the Trust's organizational documents provide that its officers and trustees are indemnified against certain liabilities arising out of the performance of their duties to the Trust. In addition, both in some of its principal service contracts and in the normal course of its business, the Trust enters into contracts that provide indemnifications to other parties for certain types of losses or liabilities. The Trust's maximum exposure under these arrangements is unknown as this could involve future claims against the Trust.
Note B--Management Fees, Administration Fees, Distribution Arrangements, and Other Transactions With Affiliates:
Fund shares are issued and redeemed in connection with investments in and payments under certain variable annuity contracts and variable life insurance policies issued through separate accounts of life insurance companies and are also offered directly to qualified pension and retirement plans.
The Fund retains Management as its investment manager under a Management Agreement. For such investment management services, the Fund pays Management a fee at the annual rate of 0.25% of the first $500 million of the Fund's average daily net assets, 0.225% of the next $500 million, 0.20% of the next $500 million, 0.175% of the next $500 million, and 0.15% of average daily net assets in excess of $2 billion. As sub-adviser NBFI receives a monthly fee paid by Management. The Fund does not pay a fee directly to NBFI for such services.
The Fund retains Management as its administrator under an Administration Agreement. The Fund pays Management an administration fee at the annual rate of 0.40% of its average daily net assets under this agreement. Additionally,
17
Management retains State Street Bank and Trust Company ("State Street") as its sub-administrator under a Sub-Administration Agreement. Management pays State Street a fee for all services received under this agreement.
The Board adopted a non-fee distribution plan for the Fund.
Management has contractually undertaken through December 31, 2012 to forgo current payment of fees and/or reimburse the Fund for its operating expenses (excluding the fees payable to Management, interest, taxes, brokerage commissions, extraordinary expenses, and transaction costs) ("Operating Expenses") which exceed, in the aggregate, 1.00% per annum of the Fund's average daily net assets (the "Expense Limitation"). During the year ended December 31, 2009, no reimbursement to the Fund was required. The Fund has agreed to repay Management through December 31, 2015 for fees and expenses foregone and/or its excess Operating Expenses previously reimbursed by Management, so long as its annual Operating Expenses during that period do not exceed its Expense Limitation, and the repayment is made within three years after the year in which Management issued the reimbursement or waived fees. During the year ended December 31, 2009, there was no repayment to Management under this agreement. At December 31, 2009, the Fund had no contingent liability to Management under this agreement.
During the reporting period, the predecessor of Management, the investment manager of the Fund, and Lehman Brothers Asset Management LLC, the sub-adviser of the Fund, were wholly owned subsidiaries of Lehman Brothers Holdings Inc. ("Lehman Brothers"), a publicly owned holding company. On September 15, 2008, Lehman Brothers filed a voluntary petition under Chapter 11 of the U.S. Bankruptcy Code. On December 3, 2008, NBSH Acquisition, LLC ("NBSH"), an entity organized by key members of Neuberger Berman's senior management, was selected as the successful bidder in the public auction to acquire a majority interest in Neuberger Berman's business and the fixed income and certain alternative asset management businesses of Lehman Brothers' Investment Management Division (together with Neuberger Berman, the "Acquired Businesses") (the "Acquisition"). On December 22, 2008, the bankruptcy court having jurisdiction over the Lehman Brothers matter approved the sale of the Acquired Businesses to NBSH (or its successor or assign), as the successful bidder.
The Acquisition closed on May 4, 2009. The Acquired Businesses are now indirectly owned by, among others, portfolio managers, Neuberger Berman's management team, and certain key members and senior professionals who are employed in various parts of the Neuberger Berman complex of companies, with a minority interest retained by Lehman Brothers and certain affiliates of Lehman Brothers.
The closing of the Acquisition resulted in an "assignment" of the Fund's Management Agreement and Sub-Advisory Agreement. Such an assignment, by law, automatically terminated those agreements. Accordingly, prior to the closing, the Board, including the Trustees who are not "interested persons" of the Fund's investment manager and its affiliates or the Fund, considered and approved a new Management Agreement and Sub-Advisory Agreement for the Fund. The new agreements, which are virtually identical to those previously in effect, were also approved by a vote of the Fund's shareholders.
These events have not had a material impact on the Fund or its operations. Management and NBFI continue to operate in the ordinary course of business as the investment manager and sub-adviser of the Fund.
NBFI, sub-adviser to the Fund, is retained by Management to furnish it with investment recommendations and research information without added cost to the Fund. Several individuals who are officers and/or trustees of the Trust are also employees of NBFI and/or Management.
The Fund has an expense offset arrangement in connection with its custodian contract. For the year ended December 31, 2009, the impact of this arrangement was a reduction of expenses of $2,292.
18
Note C--Securities Transactions:
Cost of purchases and proceeds of sales and maturities of long-term securities (excluding short-term securities and financial futures contracts) for the year ended December 31, 2009 were as follows:
Purchases of
U.S. Government
and Agency
Obligations | | Purchases excluding
U.S. Government
and Agency
Obligations | | Sales and Maturities
of U.S. Government
and Agency
Obligations | | Sales and Maturities
excluding
U.S. Government
and Agency
Obligations | |
| $ | 116,028,554 | | | $ | 51,265,051 | | | $ | 102,179,726 | | | $ | 175,641,227 | | |
Note D--Fund Share Transactions:
Share activity for the years ended December 31, 2009 and December 31, 2008 was as follows:
| | | For the Year Ended December 31, | |
| | | 2009 | | 2008 | |
| Shares Sold | | | 6,933,770 | | | | 7,033,514 | | |
| Shares Issued on Reinvestment of Dividends and Distributions | | | 2,443,758 | | | | 2,105,632 | | |
| Shares Redeemed | | | (19,767,237 | ) | | | (15,489,592 | ) | |
| Total | | | (10,389,709 | ) | | | (6,350,446 | ) | |
Note E--Line of Credit:
At December 31, 2009, the Fund was a participant in a single committed, unsecured $150,000,000 line of credit with State Street, to be used only for temporary or emergency purposes. Other investment companies managed by Management also participate in this line of credit on the same terms. Interest is charged on borrowings under this line of credit at the higher of (a) the Federal Funds Rate plus 1.25% per annum or (b) the Overnight LIBOR Rate plus 1.25% per annum. Prior to September 18, 2009, interest was charged on borrowings under this line of credit at the Federal Funds Rate plus 0.50% per annum. A facility fee of 0.15% (prior to September 18, 2009, 0.09%) per annum of the available line of credit is charged, of which the Fund has agreed to pay its pro rata share, based on the ratio of its individual net assets to the net assets of all participants at the time the fee is due and payable. The fee is paid quarterly in arrears. Because several investment companies participate, there is no assurance that an individual Fund will have access to all or any part of the $150,000,000 at any particular time. There were no loans outstanding pursuant to this line of credit at December 31, 2009. During the year ended December 31, 2009, the Fund did not utilize this line of credit.
Note F--Investments in Affiliates:
| Name of Issuer | | Balance of
Shares
Held
December 31,
2008 | | Gross
Purchases
and
Additions | | Gross
Sales
and
Reductions | | Balance of
Shares
Held
December 31,
2009 | | Value
December 31,
2009 | | Income from
Investments in
Affiliated
Issuers
Included in
Total Income | |
Neuberger Berman Prime
Money Fund Trust Class* | | | -- | | | | 80,533,238 | | | | 80,533,238 | | | | -- | | | $ | -- | | | $ | 7,723 | | |
* Prime Money was also managed by Management and may have been considered an affiliate since it had the same officers, Board members, and investment manager as the Fund and because, at times, the Fund may have owned 5% or more of the outstanding voting securities of Prime Money.
19
Note G--Subsequent Events:
In accordance with the provision set forth in ASC 855 "Subsequent Events" ("ASC 855") formerly known as FAS 165, "Subsequent Events," Management has evaluated the possibility of subsequent events existing in the Fund's financial statements through February 9, 2010. Management has determined that there are no subsequent events that, in accordance with ASC 855, would need to be disclosed in the Fund's financial statements through this date.
20
Financial Highlights
Short Duration Bond Portfolio
The following table includes selected data for a share outstanding throughout each year and other performance information derived from the Financial Statements.
| | | Year Ended December 31, | |
| | | 2009 | | 2008 | | 2007 | | 2006 | | 2005 | |
| Net Asset Value, Beginning of Year | | $ | 10.71 | | | $ | 13.00 | | | $ | 12.76 | | | $ | 12.64 | | | $ | 12.82 | | |
| Income From Investment Operations: | |
| Net Investment Income (Loss)tt | | | .43 | | | | .53 | | | | .59 | | | | .51 | | | | .35 | | |
Net Gains or Losses on Securities
(both realized and unrealized) | | | .98 | | | | (2.23 | ) | | | .02 | | | | .02 | | | | (.17 | ) | |
| Total From Investment Operations | | | 1.41 | | | | (1.70 | ) | | | .61 | | | | .53 | | | | .18 | | |
| Less Distributions From: | |
| Net Investment Income | | | (.90 | ) | | | (.59 | ) | | | (.37 | ) | | | (.41 | ) | | | (.36 | ) | |
| Net Asset Value, End of Year | | $ | 11.22 | | | $ | 10.71 | | | $ | 13.00 | | | $ | 12.76 | | | $ | 12.64 | | |
| Total Returntt | | | 13.33 | % | | | (13.43 | )% | | | 4.77 | % | | | 4.20 | % | | | 1.44 | % | |
| Ratios/Supplemental Data | |
| Net Assets, End of Year (in millions) | | $ | 350.0 | | | $ | 445.5 | | | $ | 623.0 | | | $ | 418.7 | | | $ | 341.3 | | |
| Ratio of Gross Expenses to Average Net Assets# | | | .79 | % | | | .74 | % | | | .73 | % | | | .75 | % | | | .75 | % | |
| Ratio of Net Expenses to Average Net Assets | | | .79 | %S | | | .74 | % | | | .73 | % | | | .75 | %S | | | .75 | % | |
Ratio of Net Investment Income (Loss) to Average
Net Assets | | | 3.87 | % | | | 4.35 | % | | | 4.51 | % | | | 3.97 | % | | | 2.77 | % | |
| Portfolio Turnover Rate | | | 47 | % | | | 46 | % | | | 69 | % | | | 86 | % | | | 133 | % | |
See Notes to Financial Highlights 21
Notes to Financial Highlights Short Duration Bond Portfolio
tt Total return based on per share net asset value reflects the effects of changes in net asset value on the performance of the Fund during each fiscal period and assumes dividends and other distributions, if any, were reinvested. Results represent past performance and do not guarantee future results. Current returns may be lower or higher than the performance data quoted. Investment returns and principal may fluctuate and shares when redeemed may be worth more or less than original cost. Total return would have been lower if Management had not waived certain expenses. The total return information shown does not reflect charges and other expenses that apply to the separate account or the related insurance policies, and the inclusion of these charges and other expenses would reduce the total return for all fiscal periods shown. For the year ended December 31, 2006 Management reimbursed the Fund for losses incurred in connection with the disposition of foreign currency contracts, which had no impact on total return.
# The Fund is required to calculate an expense ratio without taking into consideration any expense reductions related to expense offset arrangements.
tt Calculated based on the average number of shares outstanding during each fiscal period.
S After utilization of the Line of Credit (2006) and/or waiver of a portion of the investment management fee by Management. Had Management not undertaken such actions, and the Fund had not utilized the Line of Credit, the annualized ratios of net expenses to average daily net assets would have been:
| | | Year Ended December 31, | |
| 2009 | | 2008 | | 2007 | | 2006 | | 2005 | |
| | .79 | % | | | -- | | | | -- | | | | .75 | % | | | -- | | |
22
Report of Independent Registered Public Accounting Firm
To the Board of Trustees of
Neuberger Berman Advisers Management Trust and
Shareholders of Short Duration Bond Portfolio
We have audited the accompanying statement of assets and liabilities, including the schedule of investments, of Short Duration Bond Portfolio, one of the series constituting Neuberger Berman Advisers Management Trust (the "Trust"), as of December 31, 2009, and the related statement of operations for the year then ended, the statement of changes in net assets for each of the two years in the period then ended, and the financial highlights for each of the five years in the period then ended. These financial statements and financial highlights are the responsibility of the Trust's management. Our responsibility is to express an opinion on these financial statements and financial highlights based on our audits.
We conducted our audits in accordance with the standards of the Public Company Accounting Oversight Board (United States). Those standards require that we plan and perform the audit to obtain reasonable assurance about whether the financial statements and financial highlights are free of material misstatement. We were not engaged to perform an audit of the Trust's internal control over financial reporting. Our audits included consideration of internal control over financial reporting as a basis for designing audit procedures that are appropriate in the circumstances, but not for the purpose of expressing an opinion on the effectiveness of the Trust's internal control over financial reporting. Accordingly, we express no such opinion. An audit also includes examining, on a test basis, evidence supporting the amounts and disclosures in the financial statements and financial highlights, assessing the accounting principles used and significant estimates made by management, and evaluating the overall financial statement presentation. Our procedures included confirmation of securities owned as of December 31, 2009 by correspondence with the custodian and brokers or by other appropriate auditing procedures where replies from brokers were not received. We believe that our audits provide a reasonable basis for our opinion.
In our opinion, the financial statements and financial highlights referred to above present fairly, in all material respects, the financial position of Short Duration Bond Portfolio, a series of Neuberger Berman Advisers Management Trust, at December 31, 2009, the results of its operations for the year then ended, the changes in its net assets for each of the two years in the period then ended, and the financial highlights for each of the five years in the period then ended, in conformity with U.S. generally accepted accounting principles.
Boston, Massachusetts
February 9, 2010
23
Trustee and Officer Information
The following tables set forth information concerning the trustees and officers of the Trust. All persons named as trustees and officers also serve in similar capacities for other funds administered or managed by Management and Neuberger. The Statement of Additional Information includes additional information about fund trustees and is available upon request, without charge, by calling (800) 877-9700.
Information about the Board of Trustees
Name, (Year of Birth),
and Address(1) | | Position and
Length of
Time Served(2) | | Principal Occupation(s)(3) | | Number of
Funds in Fund
Complex
Overseen by
Fund Trustee | | Other Directorships
Held Outside Fund
Complex by Fund
Trustee | |
| Independent Fund Trustees | |
|
| John Cannon (1930) | | Trustee since 2000 | | Consultant; formerly, Chairman, CDC Investment Advisers (registered investment adviser), 1993 to January 1999; formerly, President and Chief Executive Officer, AMA Investment Advisors, an affiliate of the American Medical Association. | | | 46 | | | Formerly, Independent Trustee or Director of three series of Oppenheimer Funds: Oppenheimer Limited Term New York Municipal Fund, Rochester Fund Municipals, and Oppenheimer Convertible Securities Fund (1992 to 2009). | |
|
| Faith Colish (1935) | | Trustee since 1982 | | Counsel, Carter Ledyard & Milburn LLP (law firm) since October 2002; formerly, Attorney-at-Law and President, Faith Colish, A Professional Corporation, 1980 to 2002. | | | 46 | | | Formerly, Director (1997 to 2003) and Advisory Director (2003 to 2006), ABA Retirement Funds (formerly, American Bar Retirement Association) (not-for-profit membership corporation). | |
|
24
Name, (Year of Birth),
and Address(1) | | Position and
Length of
Time Served(2) | | Principal Occupation(s)(3) | | Number of
Funds in Fund
Complex
Overseen by
Fund Trustee | | Other Directorships
Held Outside Fund
Complex by Fund
Trustee | |
| Martha C. Goss (1949) | | Trustee since 2007 | | President, Woodhill Enterprises Inc./Chase Hollow Associates LLC (personal investment vehicle), since 2006; Chief Operating and Financial Officer, Hopewell Holdings LLC/Amwell Holdings, LLC (a holding company for a healthcare reinsurance company start-up), since 2003; formerly, Consultant, Resources Connection (temporary staffing), 2002 to 2006. | | | 46 | | | Director, Ocwen Financial Corporation (mortgage servicing), since 2005; Director, American Water (water utility), since 2003; Director, Channel Reinsurance (financial guaranty reinsurance), since 2006; Advisory Board Member, Attensity (software developer), since 2005; Director, Allianz Life of New York (insurance), since 2005; Director, Financial Women's Association of New York (not for profit association), since 2003; Trustee Emerita, Brown University, since 1998. | |
|
| C. Anne Harvey (1937) | | Trustee since 1998 | | President, C.A. Harvey Associates, since October 2001; formerly, Director, AARP, 1978 to December 2001. | | | 46 | | | Formerly, President, Board of Associates to The National Rehabilitation Hospital's Board of Directors, 2001 to 2002; formerly, Member, Individual Investors Advisory Committee to the New York Stock Exchange Board of Directors, 1998 to June 2002. | |
|
| Robert A. Kavesh (1927) | | Trustee since 2000 | | Retired; Marcus Nadler Professor Emeritus of Finance and Economics, New York University Stern School of Business; formerly, Executive Secretary-Treasurer, American Finance Association, 1961 to 1979. | | | 46 | | | Formerly, Director, The Caring Community (not-for-profit), 1997 to 2006; formerly, Director, DEL Laboratories, Inc. (cosmetics and pharmaceuticals), 1978 to 2004; formerly, Director, Apple Bank for Savings, 1979 to 1990; formerly, Director, Western Pacific Industries, Inc., 1972 to 1986 (public company). | |
|
25
Name, (Year of Birth),
and Address(1) | | Position and
Length of
Time Served(2) | | Principal Occupation(s)(3) | | Number of
Funds in Fund
Complex
Overseen by
Fund Trustee | | Other Directorships
Held Outside Fund
Complex by Fund
Trustee | |
| Michael M. Knetter (1960) | | Trustee since 2007 | | Dean, School of Business, University of Wisconsin - Madison; formerly, Professor of International Economics and Associate Dean, Amos Tuck School of Business - Dartmouth College, 1998 to 2002. | | | 46 | | | Trustee, Northwestern Mutual Series Fund, Inc., since February 2007; Director, Wausau Paper, since 2005; Director, Great Wolf Resorts, since 2004. | |
|
| Howard A. Mileaf (1937) | | Trustee since 1999 | | Retired; formerly, Vice President and General Counsel, WHX Corporation (holding company), 1993 to 2001. | | | 46 | | | Formerly, Director, Webfinancial Corporation (holding company), 2002 to 2008; formerly, Director WHX Corporation (holding company), January 2002 to June 2005; formerly, Director, State Theatre of New Jersey (not-for-profit theater), 2000 to 2005. | |
|
| George W. Morriss (1947) | | Trustee since 2007 | | Retired; formerly, Executive Vice President and Chief Financial Officer, People's Bank, Connecticut (a financial services company), 1991 to 2001. | | | 46 | | | Manager, Old Mutual 2100 fund complex (consisting of six funds) since October 2006 for four funds and since February 2007 for two funds; formerly, Member NASDAQ Issuers' Affairs Committee, 1995 to 2003. | |
|
| Edward I. O'Brien (1928) | | Trustee since 2000 | | Retired; Formerly, Member, Investment Policy Committee, Edward Jones, 1993 to 2001; President, Securities Industry Association ("SIA") (securities industry's representative in government relations and regulatory matters at the federal and state levels), 1974 to 1992; Adviser to SIA, November 1992 to November 1993. | | | 46 | | | Formerly, Director, Legg Mason, Inc. (financial services holding company), 1993 to July 2008; formerly, Director, Boston Financial Group (real estate and tax shelters), 1993 to 1999. | |
|
26
Name, (Year of Birth),
and Address(1) | | Position and
Length of
Time Served(2) | | Principal Occupation(s)(3) | | Number of
Funds in Fund
Complex
Overseen by
Fund Trustee | | Other Directorships
Held Outside Fund
Complex by Fund
Trustee | |
| Cornelius T. Ryan (1931) | | Trustee since 2000 | | Founding General Partner, Oxford Partners and Oxford Bioscience Partners (venture capital investing) and President, Oxford Venture Corporation, since 1981. | | | 46 | | | None. | |
|
| Tom D. Seip (1950) | | Trustee since 2000; Chairman of the Board since 2008; Lead Independent Trustee from 2006 to 2008 | | General Partner, Seip Investments LP (a private investment partnership); formerly, President and CEO, Westaff, Inc. (temporary staffing), May 2001 to January 2002; formerly, Senior Executive at the Charles Schwab Corporation, 1983 to 1998, including Chief Executive Officer, Charles Schwab Investment Management, Inc., and Trustee, Schwab Family of Funds and Schwab Investments, 1997 to 1998, and Executive Vice President-Retail Brokerage, Charles Schwab & Co., Inc., 1994 to 1997. | | | 46 | | | Director, H&R Block, Inc. (financial services company), since May 2001; Chairman, Compensation Committee, H&R Block, Inc., since 2006; formerly, Director, Forward Management, Inc. (asset management company), 1999 to 2006. | |
|
27
Name, (Year of Birth),
and Address(1) | | Position and
Length of
Time Served(2) | | Principal Occupation(s)(3) | | Number of
Funds in Fund
Complex
Overseen by
Fund Trustee | | Other Directorships
Held Outside Fund
Complex by Fund
Trustee | |
| Candace L. Straight (1947) | | Trustee since 1999 | | Private investor and consultant specializing in the insurance industry; formerly, Advisory Director, Securitas Capital LLC (a global private equity investment firm dedicated to making investments in the insurance sector), 1998 to December 2003. | | | 46 | | | Director, Montpelier Re (reinsurance company), since 2006; formerly, Director, National Atlantic Holdings Corporation (property and casualty insurance company), 2004 to 2008; formerly, Director, The Proformance Insurance Company (property and casualty insurance company), 2004 to 2008; formerly, Director, Providence Washington Insurance Company (property and casualty insurance company), December 1998 to March 2006; formerly, Director, Summit Global Partners (insurance brokerage firm), 2000 to 2005. | |
|
| Peter P. Trapp (1944) | | Trustee since 1984 | | Retired; formerly, Regional Manager for Mid-Southern Region, Ford Motor Credit Company, September 1997 to 2007; formerly, President, Ford Life Insurance Company, April 1995 to August 1997. | | | 46 | | | None. | |
|
28
Name, (Year of Birth),
and Address(1) | | Position and
Length of
Time Served(2) | | Principal Occupation(s)(3) | | Number of
Funds in Fund
Complex
Overseen by
Fund Trustee | | Other Directorships
Held Outside Fund
Complex by Fund
Trustee | |
| Fund Trustees who are "Interested Persons" | |
|
| Joseph V. Amato* (1962) | | Trustee since 2009 | | President and Director, Neuberger Berman Group LLC, since 2009; President and Chief Executive Officer, Neuberger and Neuberger Berman Holdings LLC (including its predecessor, Neuberger Berman Inc.), since 2007; Chief Investment Officer, Neuberger, since 2009; Chief Executive Officer (Equities) and Managing Director, Management, since 2009; Managing Director, Neuberger Berman Fixed Income LLC ("NBFI"), since 2007; Board member of NBFI since 2006; formerly, Global Head of Asset Management of Lehman Brothers Holdings Inc.'s ("LBHI") Investment Management division, 2006 to 2009; formerly, member of LBHI's Investment Management Division's Executive Management Committee, 2006 to 2009; formerly, Managing Director, Lehman Brothers Inc. ("LBI"), 2006 to 2008; formerly, Chief Recruiting and Development Officer, LBI, 2005 to 2006; formerly, Global Head of LBI's Equity Sales and a Member of its Equities Division Executive Committee, 2003 to 2005. | | | 46 | | | Member of Board of Advisors, McDonough School of Business, Georgetown University, since 2001; Member of New York City Board of Advisors, Teach for America, since 2005; Trustee, Montclair Kimberley Academy (private school), since 2007. | |
|
29
Name, (Year of Birth),
and Address(1) | | Position and
Length of
Time Served(2) | | Principal Occupation(s)(3) | | Number of
Funds in Fund
Complex
Overseen by
Fund Trustee | | Other Directorships
Held Outside Fund
Complex by Fund
Trustee | |
| Robert Conti* (1956) | | Chief Executive Officer, President and Trustee since 2008; prior thereto, Executive Vice President in 2008 and Vice President 2000 to 2008 | | Managing Director, Neuberger, since 2007; formerly, Senior Vice President, Neuberger, 2003 to 2006; formerly, Vice President, Neuberger, 1999 to 2003; President and Chief Executive Officer, Management, since 2008; formerly, Senior Vice President, Management, 2000 to 2008. | | | 46 | | | Chairman of the Board, Staten Island Mental Health Society since 2008. | |
|
| Jack L. Rivkin* (1940) | | Trustee since 2002; President from 2002 to 2008 | | Formerly, Executive Vice President and Chief Investment Officer, Neuberger Berman Holdings LLC (holding company), 2002 to August 2008 and 2003 to August 2008, respectively; formerly, Managing Director and Chief Investment Officer, Neuberger, December 2005 to August 2008 and 2003 to August 2008, respectively; formerly, Executive Vice President, Neuberger, December 2002 to 2005; formerly, Director and Chairman, Management, December 2002 to August 2008; formerly, Executive Vice President, Citigroup Investments, Inc., September 1995 to February 2002; formerly, Executive Vice President, Citigroup Inc., September 1995 to February 2002. | | | 46 | | | Director, Idealab (private company), since 2009; Director, Distributed World Power (private company), since 2009; Director, Dale Carnegie and Associates, Inc. (private company), since 1998; Director, Solbright, Inc. (private company), since 1997; formerly, Director, New York Society of Security Analysts (2006 to 2008). | |
|
(1) The business address of each listed person is 605 Third Avenue, New York, New York 10158.
(2) Pursuant to the Trust's Trust Instrument, each of these Fund Trustees shall hold office for life or until his or her successor is elected or the Trust terminates; except that (a) any Fund Trustee may resign by delivering a written resignation; (b) any Fund Trustee may be removed with or without cause at any time by a written instrument signed by at least two-thirds of the other Fund Trustees; (c) any Fund Trustee who requests to be retired, or who has become unable to serve, may be retired by a written instrument signed by a majority of the other Fund Trustees; and (d) any Fund Trustee may be removed at any shareholder meeting by a vote of at least two-thirds of the outstanding shares.
30
(3) Except as otherwise indicated, each individual has held the positions shown for at least the last five years.
* Indicates a Fund Trustee who is an "interested person" within the meaning of the 1940 Act. Mr. Amato and Mr. Conti are interested persons of the Trust by virtue of the fact that each is an officer of Management, Neuberger and/or their affiliates. Mr. Rivkin may be deemed an interested person of the Trust by virtue of the fact that, until August 2008, he was a director of Management and an officer of Neuberger.
31
Information about the Officers of the Trust
Name, (Year of Birth),
and Address(1) | | Position and
Length of Time
Served(2) | | Principal Occupation(s)(3) | |
| Andrew B. Allard (1961) | | Anti-Money Laundering Compliance Officer since 2002 | | Senior Vice President, Neuberger, since 2006; Deputy General Counsel, Neuberger, since 2004; formerly, Vice President, Neuberger, 2000 to 2005; formerly, Associate General Counsel, Neuberger, 1999 to 2004; Anti-Money Laundering Compliance Officer, nine registered investment companies for which Management acts as investment manager and administrator (six since 2002, two since 2003 and one since 2006). | |
|
| Claudia A. Brandon (1956) | | Executive Vice President since 2008 and Secretary since 1985 | | Senior Vice President, Neuberger, since 2007 and Employee since 1999; formerly, Vice President, Neuberger, 2002 to 2006; Senior Vice President, Management, since 2008 and Assistant Secretary since 2004; formerly, Vice President-Mutual Fund Board Relations, Management, 2000 to 2008; Executive Vice President, nine registered investment companies for which Management acts as investment manager and administrator (nine since 2008); Secretary, nine registered investment companies for which Management acts as investment manager and administrator (three since 1985, three since 2002, two since 2003 and one since 2006). | |
|
| Maxine L. Gerson (1950) | | Executive Vice President since 2008 and Chief Legal Officer since 2005 (only for purposes of sections 307 and 406 of the Sarbanes-Oxley Act of 2002) | | Senior Vice President, Neuberger, since 2002; Deputy General Counsel and Assistant Secretary, Neuberger, since 2001; Senior Vice President, Management, since 2006; Secretary and General Counsel, Management, since 2004; Executive Vice President, nine registered investment companies for which Management acts as investment manager and administrator (nine since 2008); Chief Legal Officer (only for purposes of sections 307 and 406 of the Sarbanes-Oxley Act of 2002), nine registered investment companies for which Management acts as investment manager and administrator (eight since 2005 and one since 2006). | |
|
| Sheila R. James (1965) | | Assistant Secretary since 2002 | | Vice President, Neuberger, since 2008 and Employee since 1999; formerly, Assistant Vice President, Neuberger, 2007; Assistant Secretary, nine registered investment companies for which Management acts as investment manager and administrator (six since 2002, two since 2003 and one since 2006). | |
|
| Brian Kerrane (1969) | | Vice President since 2008 | | Senior Vice President, Neuberger, since 2006; formerly, Vice President, Neuberger, 2002 to 2006; Vice President, Management, since 2008 and Employee since 1991; Vice President, nine registered investment companies for which Management acts as investment manager and administrator (nine since 2008). | |
|
| Kevin Lyons (1955) | | Assistant Secretary since 2003 | | Assistant Vice President, Neuberger, since 2008 and Employee since 1999; Assistant Secretary, nine registered investment companies for which Management acts as investment manager and administrator (eight since 2003 and one since 2006). | |
|
32
Name, (Year of Birth),
and Address(1) | | Position and
Length of Time
Served(2) | | Principal Occupation(s)(3) | |
| Owen F. McEntee, Jr. (1961) | | Vice President since 2008 | | Vice President, Neuberger, since 2006; Employee, Management, since 1992; Vice President, nine registered investment companies for which Management acts as investment manager and administrator (nine since 2008). | |
|
| John M. McGovern (1970) | | Treasurer and Principal Financial and Accounting Officer since 2005; prior thereto, Assistant Treasurer since 2002 | | Senior Vice President, Neuberger, since 2007; formerly, Vice President, Neuberger, 2004 to 2006; Employee, Management, since 1993; Treasurer and Principal Financial and Accounting Officer, nine registered investment companies for which Management acts as investment manager and administrator (eight since 2005 and one since 2006); formerly, Assistant Treasurer, eight registered investment companies for which Management acts as investment manager and administrator, 2002 to 2005. | |
|
| Andrew Provencher (1965) | | Vice President since 2008 | | Managing Director, Management, since 2008; Managing Director, Neuberger, since 2005; formerly, Senior Vice President, Neuberger, 2003 to 2005; formerly, Vice President, Neuberger, 1999 to 2003; Vice President, nine registered investment companies for which Management acts as investment manager and administrator (nine since 2008). | |
|
| Frank Rosato (1971) | | Assistant Treasurer since 2005 | | Vice President, Neuberger, since 2006; Employee, Management, since 1995; Assistant Treasurer, nine registered investment companies for which Management acts as investment manager and administrator (eight since 2005 and one since 2006). | |
|
| Neil S. Siegel (1967) | | Vice President since 2008 | | Managing Director, Management, since 2008; Managing Director, Neuberger, since 2006; formerly, Senior Vice President, Neuberger, 2004 to 2006; Vice President, nine registered investment companies for which Management acts as investment manager and administrator (nine since 2008); formerly, Head of Institutional Marketing, Morgan Stanley Investment Management, 1993 to 2004. | |
|
| Chamaine Williams (1971) | | Chief Compliance Officer since 2005 | | Senior Vice President, Neuberger, since 2007; Chief Compliance Officer, Management, since 2006; Chief Compliance Officer, nine registered investment companies for which Management acts as investment manager and administrator (eight since 2005 and one since 2006); formerly, Senior Vice President, LBI, 2007 to 2008; formerly, Vice President, LBI, 2003 to 2006; formerly, Chief Compliance Officer, Lehman Brothers Asset Management Inc., 2003 to 2007; formerly, Chief Compliance Officer, Lehman Brothers Alternative Investment Management LLC, 2003 to 2007; formerly, Vice President, UBS Global Asset Management (US) Inc. (formerly, Mitchell Hutchins Asset Management, a wholly-owned subsidiary of PaineWebber Inc.), 1997 to 2003. | |
|
(1) The business address of each listed person is 605 Third Avenue, New York, New York 10158.
(2) Pursuant to the By-Laws of the Trust, each officer elected by the Fund Trustees shall hold office until his or her successor shall have been elected and qualified or until his or her earlier death, inability to serve, or resignation. Officers serve at the pleasure of the Fund Trustees and may be removed at any time with or without cause.
(3) Except as otherwise indicated, each individual has held the positions shown for at least the last five years.
33
Proxy Voting Policies and Procedures
A description of the policies and procedures that the Trust uses to determine how to vote proxies relating to portfolio securities is available, without charge, by calling 1-800-877-9700 (toll-free) and on the website of the Securities and Exchange Commission, at www.sec.gov. Information regarding how the Trust voted proxies relating to portfolio securities during the most recent 12-month period ended June 30 is also available, without charge, by calling 1-800-877-9700 (toll-free), on the website of the Securities and Exchange Commission at www.sec.gov, and on Management's website at www.nb.com.
Quarterly Portfolio Schedule
The Trust files a complete schedule of portfolio holdings for the Fund with the Securities and Exchange Commission for the first and third quarters of each fiscal year on Form N-Q. The Trust's Forms N-Q are available on the Securities and Exchange Commission's website at www.sec.gov and may be reviewed and copied at the Securities and Exchange Commission's Public Reference Room in Washington, DC. Information on the operation of the Public Reference Room may be obtained by calling 1-800-SEC-0330. The information on Form N-Q is available upon request, without charge, by calling 1-800-877-9700 (toll free).
34
Neuberger Berman
Advisers Management Trust
Small-Cap Growth Portfolio
S Class Shares
Annual Report
December 31, 2009
Small-Cap Growth Portfolio Manager's Commentary
For the year ended December 31, 2009, the Neuberger Berman Advisers Management Trust (AMT) Small-Cap Growth Portfolio generated strong results but underperformed its benchmark, the Russell 2000(R) Growth Index.
While the markets ended 2009 decidedly up, the year contained two very different periods. Dramatic weakness carrying over from 2008 colored the early part of the year, and then markets rallied from March through year-end. Growth stocks significantly outperformed value stocks in 2009, as has often happened at inflection points in the market.
In 2008, while the equity market was declining, defensive stocks outperformed on a relative basis. In 2009, after the March low and into the current rally, the situation was reversed to some degree. From March until the start of the fourth quarter, the rally was led by stocks under $5, in the smallest capitalization range (under $250 million), the most illiquid, non-earners, and those in the lowest return-on-equity (ROE) quintiles. We typically avoid these lower-quality areas given our stock-selection process and fundamental criteria. We also do not believe they can outperform over the longer term. In fact, we think there are signs that the low-quality rally may already be fading. The market reversed somewhat during the fourth quarter, when stocks of larger companies (over $1 billion), stocks with high ROEs, and stocks over $20 assumed the lead. When markets are focused on fundamentals, as we believe the shift in the fourth quarter suggests, our quality growth approach tends to benefit.
Information Technology (IT), Consumer Discretionary and Materials were the best performing index sectors this period, while Financials, Industrials and Utilities were weakest. Within the Portfolio, stock selection within Energy, Telecommunications and Financials provided the largest relative benefit, and Health Care, IT and Industrials holdings, the weakest.
Within Energy, an overweight position in Concho Resources, what we consider a high-quality oil and gas firm with good earnings visibility, was a significant benefit, followed by our position in Arena Resources. Within Telecommunications, tower company SBA Communications was a standout performer early in the year. However, we sold the stock and currently have a zero allocation to that sector.
In Financials, higher-quality asset managers and brokerage names like Janus and Waddell & Reed performed well. We also benefited from appreciation by Jones Lang LaSalle, in our opinion a well-run real estate manager. In general, we continue to avoid companies with credit exposure.
On the negative side, within Health Care, Psychiatric Solutions, Wright Medical, Masimo, ViroPharma, Athenahealth and Amedisys disappointed. We eliminated these positions on earnings disappointments and ongoing pressure from lower health care spending and pending reform. We have, however, made select investments in hospital outsourcing companies. Our focus is on companies serving areas that are relatively unprofitable for hospitals, where outsourcing may make sense. Air Methods, an air emergency transport company, Emergency Medical Services, an ER outsourcing company, and IPC The Hospitalist, a company that helps hospitals reduce risk by coordinating patient care across specialties, are examples. Despite the aggregate weakness in the sector this year, SXC Health Solutions, a health care and benefit management software company, was a top performer.
In IT, our holdings in what we consider high-quality stocks generally did not keep pace with their lower-quality counterparts. In particular, Alliance Data Systems and Trimble Navigation underperformed, while VistaPrint, a lower-cost business products and services provider, was among the top performers. We have since repositioned our IT holdings somewhat, adding to positions in companies such as LivePerson, Netlogic Microsystems and Varian Semiconductor. We currently anticipate that these companies will benefit as business spending increases. We believe hiring will improve over time, and we have also added to human resources-related firms including SuccessFactors and Ultimate Software.
Within Industrials, where holdings also underperformed as investor attention was elsewhere, we have added to aerospace and defense holdings, expecting a benefit from economic growth. Holdings include AAR Corp. and HEICO, two aircraft parts firms.
1
In retrospect, we were too defensive early in the year within the Consumer Discretionary sector, and our holdings underperformed. We sold Gymboree on missed earnings. We consolidated our education theme, keeping Capella Education, but selling DeVry, ITT, Lincoln and Strayer. We shifted the Portfolio toward less defensive areas, such as leisure companies that we expect should do well even with only a slight uptick in consumer spending. Orient-Express Hotels and Royal Caribbean Cruises are examples. These companies have cut costs significantly and have strong balance sheets. Under the same thesis, growing niche retailers with loyal client bases are another area of interest, with holdings including Tractor Supply Co. and Ulta Salon, Cosmetics & Fragrance.
Looking ahead, we believe a continued recovery will occur with muted growth, expecting GDP to be stronger in the first half of 2010 than in the second. Consumer weakness and jobless claims continue to be our main concerns. Since the consumer is unlikely to help move the economy forward, we believe it is critical that select international economies, such as the BRIC markets (Brazil, Russia, India and China), show robust growth. Considering this outlook, we are seeking "international exposure" through companies with international revenue streams. We have continued to become less defensive within the Portfolio, on a case-by-case basis, and expect that given a potentially subdued recovery, the market will reward companies that exhibit quality growth and strong balance sheet characteristics.
Sincerely,

David H. Burshtan
Portfolio Manager
2
Small-Cap Growth Portfolio
SECTOR ALLOCATION
| (% of Equity Market Value) | |
| Consumer Discretionary | | | 18.3 | % | |
| Consumer Staples | | | 3.8 | | |
| Energy | | | 4.2 | | |
| Financials | | | 3.1 | | |
| Health Care | | | 21.8 | | |
| Industrials | | | 14.7 | | |
| Information Technology | | | 31.3 | | |
| Materials | | | 2.8 | | |
| Total | | | 100.0 | % | |
AVERAGE ANNUAL TOTAL RETURN1
| | | Inception
Date | | 1 Year | | 5 Years | | Life of
Fund* | |
| Small-Cap Growth Portfolio Class S | | 07/12/2002 | | | 22.75 | % | | | -4.15 | % | | | 1.56 | % | |
| Russell 2000(R) Index2 | | | | | 27.17 | % | | | 0.51 | % | | | 6.97 | % | |
| Russell 2000(R) Growth Index2 | | | | | 34.47 | % | | | 0.87 | % | | | 7.16 | % | |
Performance data quoted represent past performance, which is no guarantee of future results. The investment return and principal value of an investment will fluctuate so that an investor's shares, when redeemed may be worth more or less than their original cost. Results are shown on a "total return" basis and include reinvestment of all income dividends and distributions.
Current performance may be lower or higher than the performance data quoted. For performance data current to the most recent month end, please visit https://www.nb.com.
* Index returns are as of the inception date 7/12/2002.
As stated in the Portfolio's most recent prospectus, the total annual fund operating expense ratio for fiscal year 2008 was 1.99% for Class S shares (prior to any fee waivers or expense reimbursements). The net expense ratio was 1.44%. Neuberger Berman Management LLC has contractually agreed to limit certain expenses of the Portfolio through 12/31/2012.
COMPARISON OF A $10,000 INVESTMENT

The chart shows the value of a hypothetical $10,000 investment in the Portfolio over the past 10 fiscal years, or since the Portfolio inception, if it has not operated for 10 years. The result is compared with benchmarks, which may include a broad-based market index and/or a narrower index. Please note that market indexes do not include expenses. All results include the reinvestment of income dividends and distributions. Results represent past performance and do not indicate future results. The chart and table do not reflect the deduction of taxes that a shareholder would pay on Portfolio distributions or the redemption of Portfolio shares.
Please see Endnotes for additional information.
3
Endnotes
1 "Total Return" includes reinvestment of all income dividends and distributions. Results represent past performance and do not indicate future results. The value of an investment in the Portfolio and the return on the investment both will fluctuate, and redemption proceeds may be higher or lower than an investor's original cost. The performance information does not reflect fees and expenses of the variable annuity and variable life insurance policies or the qualified pension and retirement plans whose proceeds are invested in the Portfolio. Neuberger Berman Management LLC ("NBM LLC") has agreed to absorb certain expenses of the AMT Portfolios, including the Portfolio. Without this arrangement, which is subject to change, the total returns of the Portfolio may have been less.
2 The Russell 2000(R) Growth Index measures the performance of those Russell 2000(R) Index companies with higher price-to-book ratios and higher forecasted growth values. The Russell 2000 Index is an unmanaged index consisting of the securities of the 2000 issuers having the smallest capitalization in the Russell 3000(R) Index, representing approximately 8% of the Russell 3000 total market capitalization. As of the latest reconstitution the smallest company's market capitalization was roughly $78 million. Please note that indices do not take into account any fees and expenses of investing in the individual securities that they track and that individuals cannot invest directly in any index. Data about the performance of these indices are prepared or obtained by NBM LLC and include reinvestment of all income dividends and distributions. The Fund may invest in many securities not included in the above described indices.
Any ratios or other measurements using a factor of forecasted earnings of a company discussed herein are based on consensus estimates, not NBM LLC's own projections, and they may or may not be realized. In addition, any revision to a forecast could affect the market price of a security. By quoting them herein, NBM LLC does not offer an opinion as to the accuracy of and does not guarantee these forecasted numbers.
The investments for the Portfolio are managed by the same portfolio manager(s) who manage one or more other mutual funds that have similar names, investment objectives and investment styles as the Portfolio. You should be aware that the Portfolio is likely to differ from the other mutual funds in size, cash flow pattern and tax matters. Accordingly, the holdings and performance can be expected to vary from those of the other mutual funds.
The composition, industries and holdings of the Portfolio are subject to change.
Shares of the separate AMT Portfolios are not available to the general public. Shares of this Portfolio may be purchased only by life insurance companies to be used with their separate accounts that fund variable annuity and variable life insurance policies and by qualified pension and retirement plans.
Statistics and projections in this report are derived from sources deemed to be reliable but cannot be regarded as a representation of future results of the AMT Portfolios. This report is prepared for the general information of shareholders and is not an offer of shares of the AMT Portfolios. Shares of the AMT Portfolios are sold only through the currently effective prospectuses, which must precede or accompany this report.
(c) 2010 Neuberger Berman Management LLC distributor. All rights reserved.
4
Information About Your Fund's Expenses
This table is designed to provide information regarding costs related to your investments. All mutual funds incur operating expenses, which include management fees, fees for administrative services and costs of shareholder reports, among others. The following examples are based on an investment of $1,000 made at the beginning of the six month period ended December 31, 2009 and held for the entire period. The table illustrates the fund's costs in two ways:
| Actual Expenses and Performance: | | The first section of the table provides information about actual account values and actual expenses in dollars, based on the fund's actual performance during the period. You may use the information in this line, together with the amount you invested, to estimate the expenses you paid over the period. Simply divide your account value by $1,000 (for example, an $8,600 account value divided by $1,000 = 8.6), then multiply the result by the number in the first section of the table under the heading entitled "Expenses Paid During the Period" to estimate the expenses you paid over the period. | |
|
Hypothetical Example for
Comparison Purposes: | | The second section of the table provides information about hypothetical account values and hypothetical expenses based on the fund's actual expense ratio and an assumed rate of return at 5% per year before expenses. This return is not the fund's actual return. The hypothetical account values and expenses may not be used to estimate the actual ending account balance or expenses you paid for the period. You may use this information to compare the ongoing costs of investing in this fund versus other funds. To do so, compare the expenses shown in this 5% hypothetical example with the 5% hypothetical examples that appear in the shareholder reports of other funds. | |
|
Please note that the expenses in the table are meant to highlight your ongoing costs only. The table and expense example do not include any transactional costs, such as fees and expenses that are, or may be, imposed under your variable contract or qualified pension plan. Therefore, the information under the heading "Hypothetical (5% annual return before expenses)" is useful in comparing ongoing costs only, and will not help you determine the relative total costs of owning different funds. In addition, if these transactional costs were included, your costs would have been higher.
Expense Information as of 12/31/09 (Unaudited)
NEUBERGER BERMAN ADVISERS MANAGEMENT TRUST SMALL-CAP GROWTH PORTFOLIO
| Actual | | Beginning Account
Value
7/1/09 | | Ending Account
Value
12/31/09 | | Expenses Paid During
the Period*
7/1/09 - 12/31/09 | |
| Class S | | $ | 1,000.00 | | | $ | 1,187.70 | | | $ | 7.78 | | |
| Hypothetical (5% annual return before expenses)** | |
| Class S | | $ | 1,000.00 | | | $ | 1,018.10 | | | $ | 7.17 | | |
* Expenses are equal to the annualized expense ratio of 1.41%, multiplied by the average account value over the period, multiplied by 184/365 (to reflect the one-half year period shown).
** Hypothetical 5% annual return before expenses is calculated by multiplying the number of days in the most recent half year divided by 365.
5
Schedule of Investments Small-Cap Growth Portfolio
| NUMBER OF SHARES | | | | VALUEt | |
| Common Stocks (95.1%) | |
| Aerospace & Defense (4.9%) | | | |
| | 7,900 | | | AAR Corp. | | $ | 181,542 | * | |
| | 12,700 | | | Global Defense
Technology & Systems | | | 209,042 | * | |
| | 8,900 | | | HEICO Corp. | | | 394,537 | | |
| | | | 785,121 | | |
| Beverages (1.0%) | | | |
| | 5,800 | | | Central European Distribution | | | 164,778 | * | |
| Biotechnology (3.1%) | | | |
| | 4,600 | | | Alexion Pharmaceuticals | | | 224,572 | * | |
| | 8,700 | | | Human Genome Sciences | | | 266,220 | * | |
| | | | 490,792 | | |
| Capital Markets (1.4%) | | | |
| | 7,200 | | | Waddell & Reed Financial | | | 219,888 | | |
| Chemicals (2.6%) | | | |
| | 9,400 | | | Nalco Holding | | | 239,794 | | |
| | 1,600 | | | NewMarket Corp. | | | 183,632 | | |
| | | | 423,426 | | |
| Commercial Services & Supplies (2.7%) | | | |
| | 9,200 | | | Cornell Companies | | | 208,840 | * | |
| | 10,400 | | | Healthcare Services Group | | | 223,184 | | |
| | | | 432,024 | | |
| Computers & Peripherals (1.9%) | | | |
| | 13,100 | | | Compellent Technologies | | | 297,108 | * | |
| Diversified Consumer Services (2.3%) | | | |
| | 5,000 | | | Capella Education | | | 376,500 | * | |
| Electrical Equipment (1.5%) | | | |
| | 12,000 | | | Harbin Electric | | | 246,480 | * | |
| Food Products (1.6%) | | | |
| | 7,200 | | | Diamond Foods | | | 255,888 | | |
| Health Care Equipment & Supplies (5.3%) | | | |
| | 9,600 | | | Align Technology | | | 171,072 | * | |
| | 5,600 | | | Inverness Medical Innovations | | | 232,456 | * | |
| | 9,300 | | | Sirona Dental Systems | | | 295,182 | * | |
| | 5,800 | | | Zoll Medical | | | 154,976 | * | |
| | | | 853,686 | | |
| NUMBER OF SHARES | | | | VALUEt | |
| Health Care Providers & Services (10.5%) | | | |
| | 6,300 | | | Air Methods | | $ | 211,806 | * | |
| | 4,700 | | | Emergency Medical Services | | | 254,505 | * | |
| | 6,800 | | | HMS Holdings | | | 331,092 | * | |
| | 6,700 | | | IPC The Hospitalist | | | 222,775 | * | |
| | 4,300 | | | Magellan Health Services | | | 175,139 | * | |
| | 4,400 | | | MEDNAX, Inc. | | | 264,484 | * | |
| | 10,100 | | | PSS World Medical | | | 227,957 | * | |
| | | | 1,687,758 | | |
| Health Care Technology (2.1%) | | | |
| | 6,200 | | | SXC Health Solutions | | | 334,490 | * | |
| Hotels, Restaurants & Leisure (4.6%) | | | |
| | 25,400 | | | Orient-Express Hotel | | | 257,556 | * | |
| | 13,500 | | | Royal Caribbean Cruises | | | 341,280 | * | |
| | 3,500 | | | WMS Industries | | | 140,000 | * | |
| | | | 738,836 | | |
| Household Durables (2.0%) | | | |
| | 10,400 | | | Jarden Corp. | | | 321,464 | | |
| Internet Software & Services (6.2%) | | | |
| | 40,800 | | | LivePerson, Inc. | | | 284,376 | * | |
| | 20,600 | | | NIC Inc. | | | 188,284 | | |
| | 14,700 | | | Rackspace Hosting | | | 306,495 | * | |
| | 3,800 | | | VistaPrint NV | | | 215,308 | * | |
| | | | 994,463 | | |
| IT Services (1.6%) | | | |
| | 14,500 | | | RightNow Technologies | | | 251,865 | * | |
| Machinery (3.9%) | | | |
| | 2,800 | | | Nordson Corp. | | | 171,304 | | |
| | 18,400 | | | SmartHeat, Inc. | | | 267,168 | * | |
| | 18,100 | | | The Manitowoc | | | 180,457 | | |
| | | | 618,929 | | |
| Media (1.4%) | | | |
| | 13,700 | | | Focus Media Holding ADR | | | 217,145 | * | |
| Oil, Gas & Consumable Fuels (4.0%) | | | |
| | 6,700 | | | Arena Resources | | | 288,904 | * | |
| | 8,000 | | | Concho Resources | | | 359,200 | * | |
| | | | 648,104 | | |
| Personal Products (1.1%) | | | |
| | 11,700 | | | Elizabeth Arden | | | 168,948 | * | |
See Notes to Schedule of Investments 6
| NUMBER OF SHARES | | | | VALUEt | |
Real Estate Management &
Development (1.5%) | | | |
| | 4,100 | | | Jones Lang LaSalle | | $ | 247,640 | | |
Semiconductors & Semiconductor
Equipment (6.6%) | | | |
| | 4,300 | | | Hittite Microwave | | | 175,225 | * | |
| | 4,700 | | | Netlogic Microsystems | | | 217,422 | * | |
| | 4,000 | | | Silicon Laboratories | | | 193,360 | * | |
| | 5,200 | | | Varian Semiconductor
Equipment | | | 186,576 | * | |
| | 8,500 | | | Veeco Instruments | | | 280,840 | * | |
| | | | 1,053,423 | | |
| Software (14.0%) | | | |
| | 7,900 | | | ArcSight, Inc. | | | 202,082 | * | |
| | 6,400 | | | AsiaInfo Holdings | | | 195,008 | * | |
| | 10,300 | | | Informatica Corp. | | | 266,358 | * | |
| | 7,400 | | | Manhattan Associates | | | 177,822 | * | |
| | 11,100 | | | Nuance Communications | | | 172,494 | * | |
| | 9,900 | | | Solera Holdings | | | 356,499 | | |
| | 9,700 | | | Sourcefire Inc. | | | 259,475 | * | |
| | 11,100 | | | SuccessFactors, Inc. | | | 184,038 | * | |
| | 8,400 | | | Taleo Corp. Class A | | | 197,568 | * | |
| | 7,600 | | | Ultimate Software Group | | | 223,212 | * | |
| | | | 2,234,556 | | |
| Specialty Retail (4.7%) | | | |
| | 16,700 | | | hhgregg, Inc. | | | 367,901 | * | |
| | 3,900 | | | Tractor Supply | | | 206,544 | * | |
| | 9,800 | | | Ulta Salon,
Cosmetics & Fragrance | | | 177,968 | * | |
| | | | 752,413 | | |
| Textiles, Apparel & Luxury Goods (2.6%) | | | |
| | 9,000 | | | Lululemon Athetica | | | 270,900 | * | |
| | 3,500 | | | Warnaco Group | | | 147,665 | * | |
| | | | 418,565 | | |
| | | | | Total Common Stocks
(Cost $11,666,424) | | | 15,234,290 | | |
| Short-Term Investments (2.5%) | | | |
| | 394,573 | | | State Street Institutional
Liquid Reserves Fund
Institutional Class
(Cost $394,573) | | | 394,573 | | |
| | | | | Total Investments (97.6%)
(Cost $12,060,997) | | | 15,628,863 | ## | |
| | | | | Cash, receivables and other assets,
less liabilities (2.4%) | | | 384,334 | | |
| | | | | Total Net Assets (100.0%) | | $ | 16,013,197 | | |
See Notes to Schedule of Investments 7
Notes to Schedule of Investments Small-Cap Growth Portfolio
t The value of investments in equity securities by Neuberger Berman Advisers Management Trust Small-Cap Growth Portfolio (the "Fund") is determined by Neuberger Berman Management LLC ("Management") primarily by obtaining valuations from an independent pricing service based on the latest sale price when that price is readily available. Securities traded primarily on the NASDAQ Stock Market are normally valued by the Fund at the NASDAQ Official Closing Price ("NOCP") provided by NASDAQ each business day. The NOCP is the most recently reported price as of 4:00:02 p.m., Eastern time, unless that price is outside the range of the "inside" bid and asked prices (i.e., the bid and asked prices that dealers quote to each other when trading for their own accounts); in that case, NASDAQ will adjust the price to equal the inside bid or asked price, whichever is closer. Because of delays in reporting trades, the NOCP may not be based on the price of the last trade to occur before the market closes. If there is no reported sale of a security on a particular day, the independent pricing service may value the security based on reported market quotations. Management has developed a process to periodically review information provided by independent pricing services. If a valuation is not available from an independent pricing service, the Fund seeks to obtain quotations from principal market makers. If such quotations are not readily available, securities are valued using methods the Board of Trustees of Neuberger Berman Advisers Management Trust (the "Board") has approved on the belief that they reflect fair value. Numerous factors may be considered when determining the fair value of a security, including available analyst, media or other reports, trading in futures or ADRs and whether the issuer of the security being fair valued has other securities outstanding. Foreign security prices are furnished by independent quotation services and expressed in local currency values. Foreign security prices are currently translated from the local currency into U.S. dollars using the exchange rate as of 4:00 p.m., Eastern time. The Board has approved the use of Interactive Data Pricing and Reference Data, Inc. ("Interactive") to assist in determining the fair value of the Fund's foreign equity securities when changes in the value of a certain index suggest that the closing prices on the foreign exchanges may no longer represent the amount that the Fund could expect to receive for those securities. In this event, Interactive will provide adjusted prices for certain foreign equity securities using a statistical analysis of historical correlations of multiple factors. In the absence of precise information about the market values of these foreign securities as of the close of the New York Stock Exchange, the Board has determined on the basis of available data that prices adjusted in this way are likely to be closer to the prices the Fund could realize on a current sale than are the prices of those securities established at the close of the foreign markets in which the securities primarily trade. Fair value prices are necessarily estimates, and there is no assurance that such a price will be at or close to the price at which the security next trades. Short-term debt securities with less than 60 days until maturity may be valued at cost, which, when combined with interest earned, is expected to approximate market value.
In accordance with Accounting Standards Codification ("ASC") 820 "Fair Value Measurements and Disclosures" ("ASC 820"), formerly known as Financial Accounting Standards Board ("FASB") Statement of Financial Accounting Standards No. 157, "Fair Value Measurements," investments held by the Fund are carried at "fair value" as defined by ASC 820. Fair value is defined as the price that a fund would receive upon selling an investment in an orderly transaction to an independent buyer in the principal or most advantageous market for the investment under current market conditions. Various inputs, including the volume and level of activity for the asset or liability in the market are considered in determining the value of the Fund's investments, some of which are discussed above. Significant management judgement may be necessary to estimate fair value in accordance with ASC 820.
In addition to defining fair value, ASC 820 established a three-tier hierarchy of inputs to establish a classification of fair value measurements for disclosure purposes. The three-tier hierarchy of inputs is summarized in the three broad Levels listed below.
. Level 1 - quoted prices in active markets for identical investments
. Level 2 - other significant observable inputs (including quoted prices for similar investments, interest rates, prepayment speeds, credit risk, amortized cost, etc.)
. Level 3 - significant unobservable inputs (including the Fund's own assumptions in determining the fair value of investments)
See Notes to Financial Statements 8
Notes to Schedule of Investments Small-Cap Growth Portfolio (cont'd)
The inputs or methodology used for valuing an investment are not necessarily an indication of the risk associated with investing in those securities.
The following is a summary, by category of Level, of inputs used to value the Fund's investments as of December 31, 2009:
| Asset Valuation Inputs | | Level 1 | | Level 2 | | Level 3 | | Total | |
| Investments: | |
| Common Stock^ | | $ | 15,234,290 | | | $ | -- | | | $ | -- | | | $ | 15,234,290 | | |
| Short-Term Investments | | | -- | | | | 394,573 | | | | -- | | | | 394,573 | | |
| Total Investments | | $ | 15,234,290 | | | $ | 394,573 | | | $ | -- | | | $ | 15,628,863 | | |
^ The Schedule of Investments provides information on the industry categorization for the portfolio.
## At December 31, 2009, the cost of investments for U.S. federal income tax purposes was $12,331,244. Gross unrealized appreciation of investments was $3,334,555 and gross unrealized depreciation of investments was $36,936, resulting in net unrealized appreciation of $3,297,619 based on cost for U.S. federal income tax purposes.
* Security did not produce income during the last twelve months.
See Notes to Financial Statements 9
Statement of Assets and Liabilities
Neuberger Berman Advisers Management Trust
| | | SMALL-CAP
GROWTH
PORTFOLIO | |
| | | December 31, 2009 | |
| Assets | |
| Investments in securities, at value* (Notes A & F)--see Schedule of Investments: | |
| Unaffiliated issuers | | $ | 15,628,863 | | |
| Dividends and interest receivable | | | 3,124 | | |
| Receivable for securities sold | | | 402,597 | | |
| Receivable for Fund shares sold | | | 52,326 | | |
| Receivable from administrator--net (Note B) | | | 8,726 | | |
| Receivable for securities lending income--net (Note A) | | | 29 | | |
| Prepaid expenses and other assets | | | 271 | | |
| Total Assets | | | 16,095,936 | | |
| Liabilities | |
| Payable for Fund shares redeemed | | | 19,317 | | |
| Payable to investment manager (Notes A & B) | | | 11,185 | | |
| Accrued expenses and other payables | | | 52,237 | | |
| Total Liabilities | | | 82,739 | | |
| Net Assets at value | | $ | 16,013,197 | | |
| Net Assets consist of: | |
| Paid-in capital | | $ | 21,808,751 | | |
| Accumulated net realized gains (losses) on investments | | | (9,363,420 | ) | |
| Net unrealized appreciation (depreciation) in value of investments | | | 3,567,866 | | |
| Net Assets at value | | $ | 16,013,197 | | |
| Shares Outstanding ($.001 par value; unlimited shares authorized) | | | 1,562,643 | | |
| Net Asset Value, offering and redemption price per share | | $ | 10.25 | | |
| *Cost of Investments: | |
| Unaffiliated issuers | | $ | 12,060,997 | | |
See Notes to Financial Statements 10
Statement of Operations
Neuberger Berman Advisers Management Trust
| | | SMALL-CAP
GROWTH
PORTFOLIO | |
| | | For the
Year Ended
December 31, 2009 | |
| Investment Income: | |
| Income (Note A): | |
| Dividend income--unaffiliated issuers | | $ | 32,995 | | |
| Interest income--unaffiliated issuers | | | 428 | | |
| Income from securities loaned--net (Note F) | | | 12,384 | | |
| Income from investments in affiliated issuers (Note F) | | | 835 | | |
| Total income | | $ | 46,642 | | |
| Expenses: | |
| Investment management fees (Notes A & B) | | | 116,704 | | |
| Administration fees (Note B) | | | 41,190 | | |
| Distribution fees (Note B) | | | 34,325 | | |
| Audit fees | | | 41,307 | | |
| Custodian fees (Note B) | | | 25,388 | | |
| Insurance expense | | | 771 | | |
| Legal fees | | | 3,991 | | |
| Shareholder reports | | | 20,293 | | |
| Trustees' fees and expenses | | | 50,088 | | |
| Miscellaneous | | | 3,141 | | |
| Total expenses | | | 337,198 | | |
| Expenses reimbursed by administrator (Note B) | | | (142,078 | ) | |
| Investment management fees waived (Note A) | | | (401 | ) | |
| Expenses reduced by custodian fee expense offset arrangement (Note B) | | | (3 | ) | |
| Total net expenses | | | 194,716 | | |
| Net investment income (loss) | | $ | (148,074 | ) | |
| Realized and Unrealized Gain (Loss) on Investments (Note A) | |
| Net realized gain (loss) on: | |
| Sales of investment securities of unaffiliated issuers | | | (753,009 | ) | |
| Sales of investment securities of affiliated issuers | | | 9,806 | | |
| Change in net unrealized appreciation (depreciation) in value of: | |
| Unaffiliated investment securities | | | 3,918,093 | | |
| Net gain (loss) on investments | | | 3,174,890 | | |
| Net increase (decrease) in net assets resulting from operations | | $ | 3,026,816 | | |
See Notes to Financial Statements 11
Statements of Changes in Net Assets
| Neuberger Berman Advisers Management Trust | |
| | | SMALL-CAP GROWTH PORTFOLIO | |
| | | Year Ended
December 31,
2009 | | Year Ended
December 31,
2008 | |
| Increase (Decrease) in Net Assets: | |
| From Operations (Note A): | |
| Net investment income (loss) | | $ | (148,074 | ) | | $ | (215,137 | ) | |
| Net realized gain (loss) on investments | | | (743,203 | ) | | | (8,190,938 | ) | |
| Net increase from payments by affiliates (Note B) | | | -- | | | | 6,628 | | |
| Change in net unrealized appreciation (depreciation) of investments | | | 3,918,093 | | | | (3,032,887 | ) | |
| Net increase (decrease) in net assets resulting from operations | | | 3,026,816 | | | | (11,432,334 | ) | |
| Distributions to Shareholders From (Note A): | |
| Net realized gain on investments | | | -- | | | | (805,076 | ) | |
| Tax return of capital | | | -- | | | | (161 | ) | |
| Total distributions to shareholders | | | -- | | | | (805,237 | ) | |
| From Fund Share Transactions (Note D): | |
| Proceeds from shares sold | | | 8,974,667 | | | | 16,597,016 | | |
| Proceeds from reinvestment of dividends and distributions | | | -- | | | | 805,237 | | |
| Payments for shares redeemed | | | (8,543,746 | ) | | | (19,344,752 | ) | |
| Net increase (decrease) from Fund share transactions | | | 430,921 | | | | (1,942,499 | ) | |
| Net Increase (Decrease) in Net Assets | | | 3,457,737 | | | | (14,180,070 | ) | |
| Net Assets: | |
| Beginning of year | | | 12,555,460 | | | | 26,735,530 | | |
| End of year | | $ | 16,013,197 | | | $ | 12,555,460 | | |
| Undistributed net investment income (loss) at end of year | | $ | -- | | | $ | -- | | |
See Notes to Financial Statements 12
Notes to Financial Statements Small-Cap Growth Portfolio
Note A--Summary of Significant Accounting Policies:
1 General: The Fund is a separate operating series of Neuberger Berman Advisers Management Trust (the "Trust"), a Delaware statutory trust organized pursuant to a Trust Instrument dated May 23, 1994. The Trust is currently comprised of ten separate operating series (each a "Series," collectively, the "Funds") each of which is diversified. The Trust is registered as an open-end management investment company under the Investment Company Act of 1940, as amended (the "1940 Act"), and its shares are registered under the Securities Act of 1933, as amended. The Fund currently offers only Class S shares. The Board may establish additional series or classes of shares without the approval of shareholders.
The assets of each Series belong only to that Series, and the liabilities of each Series are borne solely by that Series and no other.
The preparation of financial statements in accordance with U.S. generally accepted accounting principles requires Management to make estimates and assumptions at the date of the financial statements. Actual results could differ from those estimates.
2 Portfolio valuation: Investment securities are valued as indicated in the notes following the Schedule of Investments.
3 Foreign currency translation: The accounting records of the Fund are maintained in U.S. dollars. Foreign currency amounts are currently translated into U.S. dollars using the exchange rates as of 4:00 p.m., Eastern time, to determine the value of investments, other assets and liabilities. Purchase and sale prices of securities, and income and expenses, are translated into U.S. dollars at the prevailing rate of exchange on the respective dates of such transactions. Net unrealized foreign currency gain (loss), if any, arises from changes in the value of assets and liabilities, other than investments in securities, as a result of changes in exchange rates and is stated separately in the Statement of Operations.
4 Securities transactions and investment income: Securities transactions are recorded on trade date for financial reporting purposes. Dividend income is recorded on the ex-dividend date or, for certain foreign dividends, as soon as the Fund becomes aware of the dividends. Non-cash dividends included in dividend income, if any, are recorded at the fair market value of the securities received. Interest income, including accretion of original issue discount, where applicable, and accretion of discount on short-term investments, is recorded on the accrual basis. Realized gains and losses from securities transactions and foreign currency transactions, if any, are recorded on the basis of identified cost and stated separately in the Statement of Operations. Included in net realized gain (loss) on investments are proceeds from the settlements of class action litigation in which the Fund participated as a class member. The amount of such proceeds for the year ended December 31, 2009 was $2,474.
5 Income tax information: The Funds are treated as separate entities for U.S. federal income tax purposes. It is the policy of the Fund to continue to qualify as a regulated investment company by complying with the requirements of Subchapter M of the Internal Revenue Code applicable to regulated investment companies and to distribute substantially all of its earnings to its shareholders. Therefore, no federal income or excise tax provision is required.
The Fund has adopted the provisions of ASC 740 "Income Taxes" ("ASC 740"), formerly known as FASB Interpretation No. 48 "Accounting for Uncertainty in Income Taxes -- an interpretation of FASB Statement No. 109." ASC 740 sets forth a minimum threshold for financial statement recognition of the benefit of a tax position taken, or expected to be taken, in a tax return. The Fund recognizes interest and penalties, if any, related to unrecognized tax benefits as an income tax expense in the Statement of Operations. The Fund is subject to examination by U.S. federal and state tax authorities for returns filed for the prior three fiscal years 2006 - 2008. As of December 31, 2009, the Fund did not have any unrecognized tax benefits.
13
Income distributions and capital gain distributions are determined in accordance with income tax regulations, which may differ from U.S. generally accepted accounting principles. These differences are primarily due to differing treatments of income and gains on various investment securities held by the Fund, timing differences and differing characterization of distributions made by the Fund as a whole. The Fund may also utilize earnings and profits distributed to shareholders on redemption of shares as a part of the dividends paid deduction for income tax purposes.
As determined on December 31, 2009, permanent differences resulting primarily from different book and tax accounting for net operating losses were reclassified at fiscal year-end. These reclassifications had no effect on net income, net asset value or net asset value per share of the Fund.
The tax character of distributions paid during the years ended December 31, 2009 and December 31, 2008 was as follows:
| | | Distributions Paid From: | |
| Ordinary Income | | Long-Term
Capital Gain | | Return of Capital | | Total | |
| 2009 | | 2008 | | 2009 | | 2008 | | 2009 | | 2008 | | 2009 | | 2008 | |
| $ | -- | | | $ | -- | | | $ | -- | | | $ | 805,076 | | | $ | -- | | | $ | 161 | | | $ | -- | | | $ | 805,237 | | |
As of December 31, 2009, the components of distributable earnings (accumulated losses) on a U.S. federal income tax basis were as follows:
Undistributed
Long-Term
Gain | | Unrealized
Appreciation
(Depreciation) | | Loss
Carryforwards
and Deferrals | |
Total | |
| $ | -- | | | $ | 3,297,619 | | | $ | (9,093,173 | ) | | $ | (5,795,554 | ) | |
The difference between book basis and tax basis distributable earnings is attributable primarily to timing differences of wash sales, partnership basis adjustments, capital loss carryforwards and post October loss deferrals.
To the extent the Fund's net realized capital gains, if any, can be offset by capital loss carryforwards, it is the policy of the Fund not to distribute such gains. As determined at December 31, 2009, the Fund had unused capital loss carryforwards available for federal income tax purposes to offset net realized capital gains, if any, as follows:
| | | Expiring in: | |
| | | 2016 | | 2017 | |
| | | $ | 4,974,217 | | | $ | 4,041,802 | | |
Under current tax law, certain net capital and net foreign currency losses realized after October 31 within the taxable year may be deferred and treated as occurring on the first day of the following tax year. For the year ended December 31, 2009, the Fund elected to defer $77,154 of net capital losses arising between November 1, 2009 and December 31, 2009.
6 Distributions to shareholders: The Fund may earn income, net of expenses, daily on its investments. Distributions from net investment income and net realized capital gains, if any, generally are distributed in October. Income distributions and capital gain distributions to shareholders are recorded on the ex-date.
7 Foreign taxes: Foreign taxes withheld represent amounts withheld by foreign tax authorities, net of refunds recoverable.
8 Expense allocation: Certain expenses are applicable to multiple funds. Expenses directly attributable to a Series are charged to that Series. Expenses of the Trust that are not directly attributed to a Series are allocated among the Funds, on the basis of relative net assets, except where a more appropriate allocation of expenses to each of the Funds can otherwise be made fairly. Expenses borne by the complex of related investment companies, which includes open-end and closed-end investment companies for which Management serves as investment manager, that are not directly attributed to a Series or the Trust are allocated among the Fund and the other investment
14
companies in the complex or series thereof on the basis of relative net assets, except where a more appropriate allocation of expenses to each investment company in the complex or series thereof can otherwise be made fairly.
9 Security lending: A third party, eSecLending, currently serves as exclusive lending agent for the Fund. eSecLending, as agent, has assisted the Fund in conducting bidding processes to try to identify a principal that would pay a guaranteed amount to the Fund in consideration of the Fund entering into an exclusive securities lending arrangement. During most of the Fund's fiscal year, the Fund was guaranteed a particular level of income from a principal. As a result of a bidding process on October 1, 2009, no principal currently has an exclusive arrangement with the Fund and the Fund is no longer guaranteed a particular level of income.
Under the securities lending arrangement, the Fund receives cash collateral at the beginning of each transaction equal to at least 102% of the prior day's market value of the loaned securities (105% in the case of international securities). The Fund may invest all the cash collateral in Neuberger Berman Securities Lending Quality Fund, LLC ("Quality Fund"), a fund managed by Neuberger Berman Fixed Income LLC (formerly known as Lehman Brothers Asset Management LLC) ("NBFI"), an affiliate of Management. Effective July 1, 2009, Dwight Asset Management Company LLC became the Sub-Adviser to the Quality Fund. The Quality Fund is not a money market fund that is registered under the 1940 Act and does not operate in accordance with all requirements of Rule 2a-7 under the 1940 Act. There is no assurance that the Quality Fund will maintain a $1.00 share price.
The market value of the Fund's investments in the Quality Fund as of the fiscal year ended December 31, 2009, if any, is reflected in the Fund's Schedule of Investments. If it were necessary to liquidate assets in the Quality Fund to meet returns on outstanding securities loans at a time when the Quality Fund's price per share was less than $1.00, the Fund may not receive an amount from the Quality Fund that is equal in amount to the collateral the Fund would be required to return to the borrower of the securities and the Fund would be required to make up for this shortfall. In addition, as a result of recent reduced liquidity in the credit and fixed income markets, it may be difficult to dispose quickly of some securities in the Quality Fund at the price at which the Quality Fund is carrying them.
Net income from the lending program represents any amounts received from a principal plus income earned on the cash collateral invested in Quality Fund or in other investments, if applicable, less cash collateral fees and other expenses associated with the loans. For the fiscal year ended December 31, 2009, the Fund received net income under the securities lending arrangement of approximately $12,384, which is reflected in the Statement of Operations under the caption "Income from securities loaned -- net." For the fiscal year ended December 31, 2009, "Income from securities loaned -- net" consisted of approximately $21,614 in income earned on cash collateral and amounts received from a principal (including approximately $14,969 of interest income earned from the Quality Fund), less fees and expenses paid of approximately $9,230.
10 Repurchase agreements: The Fund may enter into repurchase agreements with institutions that Management has determined are creditworthy. Each repurchase agreement is recorded at cost. The Fund requires that the securities purchased in a repurchase agreement be transferred to the custodian in a manner sufficient to enable the Fund to assert a perfected security interest in those securities in the event of a default under the repurchase agreement. The Fund monitors, on a daily basis, the value of the securities transferred to ensure that their value, including accrued interest, is greater than amounts owed to the Fund under each such repurchase agreement.
11 Transactions with other funds managed by Neuberger Berman Management LLC: Pursuant to an Exemptive Order issued by the Securities and Exchange Commission, the Fund may invest in a money market fund managed by Management or an affiliate. Through August 10, 2009, the Fund invested in Neuberger Berman Prime Money Fund ("Prime Money"), as approved by the Board. Prime Money sought to provide the highest available current income consistent with safety and liquidity. For any cash that the Fund invested in Prime Money, Management waived a portion of its management fee equal to the management fee it received from Prime Money on those assets (the "Arrangement"). For the year ended December 31, 2009, management fees waived under this Arrangement amounted to $401 and are reflected in the Statement of Operations under the caption "Investment management fees waived." For the year ended December 31, 2009, income earned under this Arrangement amounted to $835 and is reflected in the Statement of Operations under the caption "Income from investments in affiliated issuers."
15
On August 10, 2009, the Fund ceased investing in Prime Money. On this date, the Fund's shares of Prime Money were redeemed in exchange for portfolio holdings of Prime Money, which were used to purchase Institutional Class shares of State Street Institutional Liquid Reserves Fund.
12 Investments in foreign securities: Investing in foreign securities may involve certain sovereign and other risks, in addition to the credit and market risks normally associated with domestic securities. These additional risks include the possibility of adverse political and economic developments (including political instability, nationalization, expropriation, or confiscatory taxation) and the potentially adverse effects of unavailability of public information regarding issuers, less governmental supervision and regulation of financial markets, reduced liquidity of certain financial markets, and the lack of uniform accounting, auditing, and financial reporting standards or the application of standards that are different or less stringent than those applied in the United States. Foreign securities also may experience greater price volatility, higher rates of inflation, and delays in settlement.
13 Derivative instruments: Management has evaluated the requirements of ASC 815 "Disclosures about Derivative Instruments and Hedging Activities" ("ASC 815"), formerly known as FASB Statement of Financial Accounting Standards No. 161, "Disclosures about Derivative Instruments and Hedging Activities," which are effective for financial statements issued for fiscal years and interim periods beginning after November 15, 2008. ASC 815 requires enhanced disclosures about a fund's derivative and hedging activities. Management has concluded that, since the Fund did not hold any derivative instruments during the year ended December 31, 2009, no additional disclosures pursuant to ASC 815 are required at this time.
14 Indemnifications: Like many other companies, the Trust's organizational documents provide that its officers and trustees are indemnified against certain liabilities arising out of the performance of their duties to the Trust. In addition, both in some of its principal service contracts and in the normal course of its business, the Trust enters into contracts that provide indemnifications to other parties for certain types of losses or liabilities. The Trust's maximum exposure under these arrangements is unknown as this could involve future claims against the Trust.
Note B--Management Fees, Administration Fees, Distribution Arrangements, and Other Transactions With Affiliates:
Fund shares are issued and redeemed in connection with investments in and payments under certain variable annuity contracts and variable life insurance policies issued through separate accounts of life insurance companies and are also offered directly to qualified pension and retirement plans.
The Fund retains Management as its investment manager under a Management Agreement. For such investment management services, the Fund pays Management a fee at the annual rate of 0.85% of the first $500 million of the Fund's average daily net assets, 0.825% of the next $500 million, 0.80% of the next $500 million, 0.775% of the next $500 million, 0.75% of the next $500 million, and 0.725% of average daily net assets in excess of $2.5 billion.
The Fund retains Management as its administrator under an Administration Agreement. The Fund pays Management an administration fee at the annual rate of 0.30% of its average daily net assets under this agreement. Additionally, Management retains State Street Bank and Trust Company ("State Street") as its sub-administrator under a Sub-Administration Agreement. Management pays State Street a fee for all services received under this agreement.
Management acts as agent in arranging for the sale of Fund shares without commission and bears advertising and promotion expenses. The Board has adopted a distribution plan (the "Plan") with respect to the Fund, pursuant to Rule 12b-1 under the 1940 Act. The Plan provides that, as compensation for administrative and other services provided to the Fund, Management's activities and expenses related to the sale and distribution of the Fund's shares, and ongoing services provided to investors in the Fund, Management receives from the Fund a fee at the annual rate of 0.25% of the Fund's average daily net assets. Management receives this amount to provide distribution and shareholder servicing for the Fund and pays a portion of it to institutions that provide such services. Those institutions may use the payments for, among other purposes, compensating employees engaged in sales and/or shareholder servicing. The amount of fees paid by the Fund during any year may be more or less than
16
the cost of distribution and other services provided to the Fund. FINRA rules limit the amount of annual distribution fees that may be paid by a mutual fund and impose a ceiling on the cumulative distribution fees paid. The Trust's Plan complies with those rules.
Management has contractually undertaken through December 31, 2012 to forgo current payment of fees and/or reimburse the Fund for its operating expenses (including the fees payable to Management but excluding interest, taxes, brokerage commissions, extraordinary expenses, and transaction costs) ("Operating Expenses") which exceed, in the aggregate, 1.40% per annum of the Fund's average daily net assets (the "Expense Limitation"). For the year ended December 31, 2009, such excess expenses amounted to $142,078. The Fund has agreed to repay Management through December 31, 2015 for fees and expenses foregone and/or its excess Operating Expenses previously reimbursed by Management, so long as its annual Operating Expenses during that period do not exceed its Expense Limitation, and the repayment is made within three years after the year in which Management issued the reimbursement or waived fees. During the year ended December 31, 2009, there was no repayment to Management under this agreement. At December 31, 2009, contingent liabilities to Management under this agreement were as follows:
| | | Expiring in: | |
| | | 2010 | | 2011 | | 2012 | | Total | |
| | | $ | 126,509 | | | $ | 129,472 | | | $ | 142,078 | | | $ | 398,059 | | |
Neuberger Berman LLC (formerly known as Neuberger Berman, LLC) ("Neuberger") is retained by Management to furnish it with investment recommendations and research information without added cost to the Fund. Several individuals who are officers and/or trustees of the Trust are also employees of Neuberger and/or Management.
During the reporting period, the predecessor of Management, the investment manager of the Fund, and Neuberger, the sub-adviser of the Fund, were wholly owned subsidiaries of Lehman Brothers Holdings Inc. ("Lehman Brothers"), a publicly owned holding company. On September 15, 2008, Lehman Brothers filed a voluntary petition under Chapter 11 of the U.S. Bankruptcy Code. On December 3, 2008, NBSH Acquisition, LLC ("NBSH"), an entity organized by key members of Neuberger Berman's senior management, was selected as the successful bidder in the public auction to acquire a majority interest in Neuberger Berman's business and the fixed income and certain alternative asset management businesses of Lehman Brothers' Investment Management Division (together with Neuberger Berman, the "Acquired Businesses") (the "Acquisition"). On December 22, 2008, the bankruptcy court having jurisdiction over the Lehman Brothers matter approved the sale of the Acquired Businesses to NBSH (or its successor or assign), as the successful bidder.
The Acquisition closed on May 4, 2009. The Acquired Businesses are now indirectly owned by, among others, portfolio managers, Neuberger Berman's management team, and certain key members and senior professionals who are employed in various parts of the Neuberger Berman complex of companies, with a minority interest retained by Lehman Brothers and certain affiliates of Lehman Brothers.
The closing of the Acquisition resulted in an "assignment" of the Fund's Management Agreement and Sub-Advisory Agreement. Such an assignment, by law, automatically terminated those agreements. Accordingly, prior to the closing, the Board, including the Trustees who are not "interested persons" of the Fund's investment manager and its affiliates or the Fund, considered and approved a new Management Agreement and Sub-Advisory Agreement for the Fund. The new agreements, which are virtually identical to those previously in effect, were also approved by a vote of the Fund's shareholders.
These events have not had a material impact on the Fund or its operations. Management and Neuberger continue to operate in the ordinary course of business as the investment manager and sub-adviser of the Fund.
The Fund has an expense offset arrangement in connection with its custodian contract. For the year ended December 31, 2009, the impact of this arrangement was a reduction of expenses of $3.
On March 25, 2008, Management voluntarily agreed to reimburse the Fund for all brokerage commissions from March 25, 2008 to April 15, 2008, to facilitate a restructuring of the portfolio following a change in the Fund's portfolio manager. The amount of this voluntary reimbursement was $6,628.
17
Note C--Securities Transactions:
During the year ended December 31, 2009, there were purchase and sale transactions (excluding short-term securities) of $39,567,629 and $39,932,944, respectively.
During the year ended December 31, 2009, no brokerage commissions on securities transactions were paid to affiliated brokers.
Note D--Fund Share Transactions:
Share activity for the years ended December 31, 2009 and December 31, 2008 was as follows:
| | | For the Year Ended December 31, | |
| | | 2009 | | 2008 | |
| Shares Sold | | | 1,051,811 | | | | 1,291,580 | | |
| Shares Issued on Reinvestment of Dividends and Distributions | | | -- | | | | 93,632 | | |
| Shares Redeemed | | | (992,399 | ) | | | (1,725,324 | ) | |
| Total | | | 59,412 | | | | (340,112 | ) | |
Note E--Line of Credit:
At December 31, 2009, the Fund was a participant in a single committed, unsecured $150,000,000 line of credit with State Street, to be used only for temporary or emergency purposes. Other investment companies managed by Management also participate in this line of credit on the same terms. Interest is charged on borrowings under this line of credit at the higher of (a) the Federal Funds Rate plus 1.25% per annum or (b) the Overnight LIBOR Rate plus 1.25% per annum. Prior to September 18, 2009, interest was charged on borrowings under this line of credit at the Federal Funds Rate plus 0.50% per annum. A facility fee of 0.15% (prior to September 18, 2009, 0.09%) per annum of the available line of credit is charged, of which the Fund has agreed to pay its pro rata share, based on the ratio of its individual net assets to the net assets of all participants at the time the fee is due and payable. The fee is paid quarterly in arrears. Because several investment companies participate, there is no assurance that an individual Fund will have access to all or any part of the $150,000,000 at any particular time. There were no loans outstanding pursuant to this line of credit at December 31, 2009. During the year ended December 31, 2009, the Fund did not utilize this line of credit.
Note F--Investments in Affiliates:
| Name of Issuer | | Balance of
Shares
Held
December 31,
2008 | | Gross
Purchases
and
Additions | | Gross
Sales
and
Reductions | | Balance of
Shares
Held
December 31,
2009 | | Value
December 31,
2009 | | Income from
Investments in
Affiliated
Issuers
Included in
Total Income | |
Neuberger Berman Prime
Money Fund Trust Class* | | | 539,539 | | | | 11,237,209 | | | | 11,776,748 | | | | -- | | | $ | -- | | | $ | 835 | | |
Neuberger Berman
Securities Lending
Quality Fund, LLC** | | | 1,274,335 | | | | 11,205,131 | | | | 12,479,466 | | | | -- | | | | -- | | | | 14,969 | | |
| Total | | | | | | | | | | $ | -- | | | $ | 15,804 | | |
* Prime Money was also managed by Management and may have been considered an affiliate since it had the same officers, Board members, and investment manager as the Fund and because, at times, the Fund may have owned 5% or more of the outstanding voting securities of Prime Money.
18
** Quality Fund, a fund managed by NBFI, an affiliate of Management, is used to invest cash the Fund receives as collateral for securities loaned as approved by the Board. Because all shares of Quality Fund are held by funds in the related investment management complex, Quality Fund may be considered an affiliate of the Fund.
Note G--Subsequent Events:
In accordance with the provision set forth in ASC 855 "Subsequent Events" ("ASC 855") formerly known as FAS 165, "Subsequent Events," Management has evaluated the possibility of subsequent events existing in the Fund's financial statements through February 9, 2010. Management has determined that there are no subsequent events that, in accordance with ASC 855, would need to be disclosed in the Fund's financial statements through this date.
19
Financial Highlights
Small-Cap Growth Portfolio
The following table includes selected data for a share outstanding throughout each year and other performance information derived from the Financial Statements.
| | | Year Ended December 31, | |
| | | 2009 | | 2008 | | 2007 | | 2006 | | 2005 | |
| Net Asset Value, Beginning of Year | | $ | 8.35 | | | $ | 14.50 | | | $ | 14.53 | | | $ | 14.16 | | | $ | 13.84 | | |
| Income From Investment Operations: | |
| Net Investment Income (Loss)tt | | | (.09 | ) | | | (.11 | ) | | | (.06 | ) | | | (.05 | ) | | | (.04 | ) | |
Net Gains or Losses on Securities
(both realized and unrealized) | | | 1.99 | | | | (5.60 | )SS | | | .14 | | | | .79 | | | | .43 | | |
| Total From Investment Operations | | | 1.90 | | | | (5.71 | ) | | | .08 | | | | .74 | | | | .39 | | |
| Less Distributions From: | |
| Net Capital Gains | | | -- | | | | (.44 | ) | | | (.11 | ) | | | (.37 | ) | | | (.07 | ) | |
| Tax Return of Capital | | | -- | | | | (.00 | ) | | | -- | | | | -- | | | | -- | | |
| Total Distributions | | | -- | | | | (.44 | ) | | | (.11 | ) | | | (.37 | ) | | | (.07 | ) | |
| Net Asset Value, End of Year | | $ | 10.25 | | | $ | 8.35 | | | $ | 14.50 | | | $ | 14.53 | | | $ | 14.16 | | |
| Total Returntt | | | 22.75 | % | | | (39.47 | )% | | | .52 | % | | | 5.25 | % | | | 2.82 | % | |
| Ratios/Supplemental Data | |
| Net Assets, End of Year (in millions) | | $ | 16.0 | | | $ | 12.6 | | | $ | 26.7 | | | $ | 24.2 | | | $ | 18.9 | | |
| Ratio of Gross Expenses to Average Net Assets# | | | 1.42 | % | | | 1.43 | % | | | 1.40 | % | | | 1.40 | % | | | 1.40 | % | |
| Ratio of Net Expenses to Average Net AssetsS | | | 1.42 | % | | | 1.42 | % | | | 1.39 | % | | | 1.40 | % | | | 1.40 | % | |
Ratio of Net Investment Income (Loss) to Average
Net Assets | | | (1.08 | )% | | | (.92 | )% | | | (.42 | )% | | | (.33 | )% | | | (.32 | )% | |
| Portfolio Turnover Rate | | | 300 | % | | | 323 | % | | | 38 | % | | | 30 | % | | | 42 | % | |
See Notes to Financial Highlights 20
Notes to Financial Highlights Small-Cap Growth Portfolio
tt Total return based on per share net asset value reflects the effects of changes in net asset value on the performance of the Fund during each fiscal period and assumes dividends and other distributions, if any, were reinvested. Results represent past performance and do not guarantee future results. Current returns may be lower or higher than the performance data quoted. Investment returns and principal may fluctuate and shares when redeemed may be worth more or less than original cost. Total return would have been lower if Management had not reimbursed and/or waived certain expenses. The total return information shown does not reflect charges and other expenses that apply to the separate account or the related insurance policies, and the inclusion of these charges and other expenses would reduce the total return for all fiscal periods shown.
# The Fund is required to calculate an expense ratio without taking into consideration any expense reductions related to expense offset arrangements.
S After reimbursement of expenses and/or waiver of a portion of the investment management fee by Management. Had Management not undertaken such actions, the annualized ratios of net expenses to average daily net assets would have been:
| | | Year Ended December 31, | |
| 2009 | | 2008 | | 2007 | | 2006 | | 2005 | |
| | 2.46 | % | | | 1.97 | % | | | 1.87 | % | | | 2.00 | % | | | 2.09 | % | |
SS Included in this net loss is a reimbursement from Management as described in Note B of Notes to Financial Statements.
tt Calculated based on the average number of shares outstanding during each fiscal period.
21
Report of Independent Registered Public Accounting Firm
To the Board of Trustees of
Neuberger Berman Advisers Management Trust and
Shareholders of Small-Cap Growth Portfolio
We have audited the accompanying statement of assets and liabilities, including the schedule of investments, of Small-Cap Growth Portfolio, one of the series constituting Neuberger Berman Advisers Management Trust (the "Trust"), as of December 31, 2009, and the related statement of operations for the year then ended, the statement of changes in net assets for each of the two years in the period then ended, and the financial highlights for each of the five years in the period then ended. These financial statements and financial highlights are the responsibility of the Trust's management. Our responsibility is to express an opinion on these financial statements and financial highlights based on our audits.
We conducted our audits in accordance with the standards of the Public Company Accounting Oversight Board (United States). Those standards require that we plan and perform the audit to obtain reasonable assurance about whether the financial statements and financial highlights are free of material misstatement. We were not engaged to perform an audit of the Trust's internal control over financial reporting. Our audits included consideration of internal control over financial reporting as a basis for designing audit procedures that are appropriate in the circumstances, but not for the purpose of expressing an opinion on the effectiveness of the Trust's internal control over financial reporting. Accordingly, we express no such opinion. An audit also includes examining, on a test basis, evidence supporting the amounts and disclosures in the financial statements and financial highlights, assessing the accounting principles used and significant estimates made by management, and evaluating the overall financial statement presentation. Our procedures included confirmation of securities owned as of December 31, 2009 by correspondence with the custodian and brokers or by other appropriate auditing procedures where replies from brokers were not received. We believe that our audits provide a reasonable basis for our opinion.
In our opinion, the financial statements and financial highlights referred to above present fairly, in all material respects, the financial position of Small-Cap Growth Portfolio, a series of Neuberger Berman Advisers Management Trust, at December 31, 2009, the results of its operations for the year then ended, the changes in its net assets for each of the two years in the period then ended, and the financial highlights for each of the five years in the period then ended, in conformity with U.S. generally accepted accounting principles.
Boston, Massachusetts
February 9, 2010
22
Trustee and Officer Information
The following tables set forth information concerning the trustees and officers of the Trust. All persons named as trustees and officers also serve in similar capacities for other funds administered or managed by Management and Neuberger. The Statement of Additional Information includes additional information about fund trustees and is available upon request, without charge, by calling (800) 877-9700.
Information about the Board of Trustees
Name, (Year of Birth),
and Address(1) | | Position and
Length of
Time Served(2) | | Principal Occupation(s)(3) | | Number of
Funds in Fund
Complex
Overseen by
Fund Trustee | | Other Directorships
Held Outside Fund
Complex by Fund
Trustee | |
| Independent Fund Trustees | |
|
| John Cannon (1930) | | Trustee since 2000 | | Consultant; formerly, Chairman, CDC Investment Advisers (registered investment adviser), 1993 to January 1999; formerly, President and Chief Executive Officer, AMA Investment Advisors, an affiliate of the American Medical Association. | | | 46 | | | Formerly, Independent Trustee or Director of three series of Oppenheimer Funds: Oppenheimer Limited Term New York Municipal Fund, Rochester Fund Municipals, and Oppenheimer Convertible Securities Fund (1992 to 2009). | |
|
| Faith Colish (1935) | | Trustee since 1982 | | Counsel, Carter Ledyard & Milburn LLP (law firm) since October 2002; formerly, Attorney-at-Law and President, Faith Colish, A Professional Corporation, 1980 to 2002. | | | 46 | | | Formerly, Director (1997 to 2003) and Advisory Director (2003 to 2006), ABA Retirement Funds (formerly, American Bar Retirement Association) (not-for-profit membership corporation). | |
|
23
Name, (Year of Birth),
and Address(1) | | Position and
Length of
Time Served(2) | | Principal Occupation(s)(3) | | Number of
Funds in Fund
Complex
Overseen by
Fund Trustee | | Other Directorships
Held Outside Fund
Complex by Fund
Trustee | |
| Martha C. Goss (1949) | | Trustee since 2007 | | President, Woodhill Enterprises Inc./Chase Hollow Associates LLC (personal investment vehicle), since 2006; Chief Operating and Financial Officer, Hopewell Holdings LLC/Amwell Holdings, LLC (a holding company for a healthcare reinsurance company start-up), since 2003; formerly, Consultant, Resources Connection (temporary staffing), 2002 to 2006. | | | 46 | | | Director, Ocwen Financial Corporation (mortgage servicing), since 2005; Director, American Water (water utility), since 2003; Director, Channel Reinsurance (financial guaranty reinsurance), since 2006; Advisory Board Member, Attensity (software developer), since 2005; Director, Allianz Life of New York (insurance), since 2005; Director, Financial Women's Association of New York (not for profit association), since 2003; Trustee Emerita, Brown University, since 1998. | |
|
| C. Anne Harvey (1937) | | Trustee since 1998 | | President, C.A. Harvey Associates, since October 2001; formerly, Director, AARP, 1978 to December 2001. | | | 46 | | | Formerly, President, Board of Associates to The National Rehabilitation Hospital's Board of Directors, 2001 to 2002; formerly, Member, Individual Investors Advisory Committee to the New York Stock Exchange Board of Directors, 1998 to June 2002. | |
|
| Robert A. Kavesh (1927) | | Trustee since 2000 | | Retired; Marcus Nadler Professor Emeritus of Finance and Economics, New York University Stern School of Business; formerly, Executive Secretary-Treasurer, American Finance Association, 1961 to 1979. | | | 46 | | | Formerly, Director, The Caring Community (not-for-profit), 1997 to 2006; formerly, Director, DEL Laboratories, Inc. (cosmetics and pharmaceuticals), 1978 to 2004; formerly, Director, Apple Bank for Savings, 1979 to 1990; formerly, Director, Western Pacific Industries, Inc., 1972 to 1986 (public company). | |
|
24
Name, (Year of Birth),
and Address(1) | | Position and
Length of
Time Served(2) | | Principal Occupation(s)(3) | | Number of
Funds in Fund
Complex
Overseen by
Fund Trustee | | Other Directorships
Held Outside Fund
Complex by Fund
Trustee | |
| Michael M. Knetter (1960) | | Trustee since 2007 | | Dean, School of Business, University of Wisconsin - Madison; formerly, Professor of International Economics and Associate Dean, Amos Tuck School of Business - Dartmouth College, 1998 to 2002. | | | 46 | | | Trustee, Northwestern Mutual Series Fund, Inc., since February 2007; Director, Wausau Paper, since 2005; Director, Great Wolf Resorts, since 2004. | |
|
| Howard A. Mileaf (1937) | | Trustee since 1999 | | Retired; formerly, Vice President and General Counsel, WHX Corporation (holding company), 1993 to 2001. | | | 46 | | | Formerly, Director, Webfinancial Corporation (holding company), 2002 to 2008; formerly, Director WHX Corporation (holding company), January 2002 to June 2005; formerly, Director, State Theatre of New Jersey (not-for-profit theater), 2000 to 2005. | |
|
| George W. Morriss (1947) | | Trustee since 2007 | | Retired; formerly, Executive Vice President and Chief Financial Officer, People's Bank, Connecticut (a financial services company), 1991 to 2001. | | | 46 | | | Manager, Old Mutual 2100 fund complex (consisting of six funds) since October 2006 for four funds and since February 2007 for two funds; formerly, Member NASDAQ Issuers' Affairs Committee, 1995 to 2003. | |
|
| Edward I. O'Brien (1928) | | Trustee since 2000 | | Retired; Formerly, Member, Investment Policy Committee, Edward Jones, 1993 to 2001; President, Securities Industry Association ("SIA") (securities industry's representative in government relations and regulatory matters at the federal and state levels), 1974 to 1992; Adviser to SIA, November 1992 to November 1993. | | | 46 | | | Formerly, Director, Legg Mason, Inc. (financial services holding company), 1993 to July 2008; formerly, Director, Boston Financial Group (real estate and tax shelters), 1993 to 1999. | |
|
25
Name, (Year of Birth),
and Address(1) | | Position and
Length of
Time Served(2) | | Principal Occupation(s)(3) | | Number of
Funds in Fund
Complex
Overseen by
Fund Trustee | | Other Directorships
Held Outside Fund
Complex by Fund
Trustee | |
| Cornelius T. Ryan (1931) | | Trustee since 2000 | | Founding General Partner, Oxford Partners and Oxford Bioscience Partners (venture capital investing) and President, Oxford Venture Corporation, since 1981. | | | 46 | | | None. | |
|
| Tom D. Seip (1950) | | Trustee since 2000; Chairman of the Board since 2008; Lead Independent Trustee from 2006 to 2008 | | General Partner, Seip Investments LP (a private investment partnership); formerly, President and CEO, Westaff, Inc. (temporary staffing), May 2001 to January 2002; formerly, Senior Executive at the Charles Schwab Corporation, 1983 to 1998, including Chief Executive Officer, Charles Schwab Investment Management, Inc., and Trustee, Schwab Family of Funds and Schwab Investments, 1997 to 1998, and Executive Vice President-Retail Brokerage, Charles Schwab & Co., Inc., 1994 to 1997. | | | 46 | | | Director, H&R Block, Inc. (financial services company), since May 2001; Chairman, Compensation Committee, H&R Block, Inc., since 2006; formerly, Director, Forward Management, Inc. (asset management company), 1999 to 2006. | |
|
26
Name, (Year of Birth),
and Address(1) | | Position and
Length of
Time Served(2) | | Principal Occupation(s)(3) | | Number of
Funds in Fund
Complex
Overseen by
Fund Trustee | | Other Directorships
Held Outside Fund
Complex by Fund
Trustee | |
| Candace L. Straight (1947) | | Trustee since 1999 | | Private investor and consultant specializing in the insurance industry; formerly, Advisory Director, Securitas Capital LLC (a global private equity investment firm dedicated to making investments in the insurance sector), 1998 to December 2003. | | | 46 | | | Director, Montpelier Re (reinsurance company), since 2006; formerly, Director, National Atlantic Holdings Corporation (property and casualty insurance company), 2004 to 2008; formerly, Director, The Proformance Insurance Company (property and casualty insurance company), 2004 to 2008; formerly, Director, Providence Washington Insurance Company (property and casualty insurance company), December 1998 to March 2006; formerly, Director, Summit Global Partners (insurance brokerage firm), 2000 to 2005. | |
|
| Peter P. Trapp (1944) | | Trustee since 1984 | | Retired; formerly, Regional Manager for Mid-Southern Region, Ford Motor Credit Company, September 1997 to 2007; formerly, President, Ford Life Insurance Company, April 1995 to August 1997. | | | 46 | | | None. | |
|
27
Name, (Year of Birth),
and Address(1) | | Position and
Length of
Time Served(2) | | Principal Occupation(s)(3) | | Number of
Funds in Fund
Complex
Overseen by
Fund Trustee | | Other Directorships
Held Outside Fund
Complex by Fund
Trustee | |
| Fund Trustees who are "Interested Persons" | |
|
| Joseph V. Amato* (1962) | | Trustee since 2009 | | President and Director, Neuberger Berman Group LLC, since 2009; President and Chief Executive Officer, Neuberger and Neuberger Berman Holdings LLC (including its predecessor, Neuberger Berman Inc.), since 2007; Chief Investment Officer, Neuberger, since 2009; Chief Executive Officer (Equities) and Managing Director, Management, since 2009; Managing Director, Neuberger Berman Fixed Income LLC ("NBFI"), since 2007; Board member of NBFI since 2006; formerly, Global Head of Asset Management of Lehman Brothers Holdings Inc.'s ("LBHI") Investment Management division, 2006 to 2009; formerly, member of LBHI's Investment Management Division's Executive Management Committee, 2006 to 2009; formerly, Managing Director, Lehman Brothers Inc. ("LBI"), 2006 to 2008; formerly, Chief Recruiting and Development Officer, LBI, 2005 to 2006; formerly, Global Head of LBI's Equity Sales and a Member of its Equities Division Executive Committee, 2003 to 2005. | | | 46 | | | Member of Board of Advisors, McDonough School of Business, Georgetown University, since 2001; Member of New York City Board of Advisors, Teach for America, since 2005; Trustee, Montclair Kimberley Academy (private school), since 2007. | |
|
28
Name, (Year of Birth),
and Address(1) | | Position and
Length of
Time Served(2) | | Principal Occupation(s)(3) | | Number of
Funds in Fund
Complex
Overseen by
Fund Trustee | | Other Directorships
Held Outside Fund
Complex by Fund
Trustee | |
| Robert Conti* (1956) | | Chief Executive Officer, President and Trustee since 2008; prior thereto, Executive Vice President in 2008 and Vice President 2000 to 2008 | | Managing Director, Neuberger, since 2007; formerly, Senior Vice President, Neuberger, 2003 to 2006; formerly, Vice President, Neuberger, 1999 to 2003; President and Chief Executive Officer, Management, since 2008; formerly, Senior Vice President, Management, 2000 to 2008. | | | 46 | | | Chairman of the Board, Staten Island Mental Health Society since 2008. | |
|
| Jack L. Rivkin* (1940) | | Trustee since 2002; President from 2002 to 2008 | | Formerly, Executive Vice President and Chief Investment Officer, Neuberger Berman Holdings LLC (holding company), 2002 to August 2008 and 2003 to August 2008, respectively; formerly, Managing Director and Chief Investment Officer, Neuberger, December 2005 to August 2008 and 2003 to August 2008, respectively; formerly, Executive Vice President, Neuberger, December 2002 to 2005; formerly, Director and Chairman, Management, December 2002 to August 2008; formerly, Executive Vice President, Citigroup Investments, Inc., September 1995 to February 2002; formerly, Executive Vice President, Citigroup Inc., September 1995 to February 2002. | | | 46 | | | Director, Idealab (private company), since 2009; Director, Distributed World Power (private company), since 2009; Director, Dale Carnegie and Associates, Inc. (private company), since 1998; Director, Solbright, Inc. (private company), since 1997; formerly, Director, New York Society of Security Analysts (2006 to 2008). | |
|
(1) The business address of each listed person is 605 Third Avenue, New York, New York 10158.
(2) Pursuant to the Trust's Trust Instrument, each of these Fund Trustees shall hold office for life or until his or her successor is elected or the Trust terminates; except that (a) any Fund Trustee may resign by delivering a written resignation; (b) any Fund Trustee may be removed with or without cause at any time by a written instrument signed by at least two-thirds of the other Fund Trustees; (c) any Fund Trustee who requests to be retired, or who has become unable to serve, may be retired by a written instrument signed by a majority of the other Fund Trustees; and (d) any Fund Trustee may be removed at any shareholder meeting by a vote of at least two-thirds of the outstanding shares.
29
(3) Except as otherwise indicated, each individual has held the positions shown for at least the last five years.
* Indicates a Fund Trustee who is an "interested person" within the meaning of the 1940 Act. Mr. Amato and Mr. Conti are interested persons of the Trust by virtue of the fact that each is an officer of Management, Neuberger and/or their affiliates. Mr. Rivkin may be deemed an interested person of the Trust by virtue of the fact that, until August 2008, he was a director of Management and an officer of Neuberger.
30
Information about the Officers of the Trust
Name, (Year of Birth),
and Address(1) | | Position and
Length of Time
Served(2) | | Principal Occupation(s)(3) | |
| Andrew B. Allard (1961) | | Anti-Money Laundering Compliance Officer since 2002 | | Senior Vice President, Neuberger, since 2006; Deputy General Counsel, Neuberger, since 2004; formerly, Vice President, Neuberger, 2000 to 2005; formerly, Associate General Counsel, Neuberger, 1999 to 2004; Anti-Money Laundering Compliance Officer, nine registered investment companies for which Management acts as investment manager and administrator (six since 2002, two since 2003 and one since 2006). | |
|
| Claudia A. Brandon (1956) | | Executive Vice President since 2008 and Secretary since 1985 | | Senior Vice President, Neuberger, since 2007 and Employee since 1999; formerly, Vice President, Neuberger, 2002 to 2006; Senior Vice President, Management, since 2008 and Assistant Secretary since 2004; formerly, Vice President-Mutual Fund Board Relations, Management, 2000 to 2008; Executive Vice President, nine registered investment companies for which Management acts as investment manager and administrator (nine since 2008); Secretary, nine registered investment companies for which Management acts as investment manager and administrator (three since 1985, three since 2002, two since 2003 and one since 2006). | |
|
| Maxine L. Gerson (1950) | | Executive Vice President since 2008 and Chief Legal Officer since 2005 (only for purposes of sections 307 and 406 of the Sarbanes-Oxley Act of 2002) | | Senior Vice President, Neuberger, since 2002; Deputy General Counsel and Assistant Secretary, Neuberger, since 2001; Senior Vice President, Management, since 2006; Secretary and General Counsel, Management, since 2004; Executive Vice President, nine registered investment companies for which Management acts as investment manager and administrator (nine since 2008); Chief Legal Officer (only for purposes of sections 307 and 406 of the Sarbanes-Oxley Act of 2002), nine registered investment companies for which Management acts as investment manager and administrator (eight since 2005 and one since 2006). | |
|
| Sheila R. James (1965) | | Assistant Secretary since 2002 | | Vice President, Neuberger, since 2008 and Employee since 1999; formerly, Assistant Vice President, Neuberger, 2007; Assistant Secretary, nine registered investment companies for which Management acts as investment manager and administrator (six since 2002, two since 2003 and one since 2006). | |
|
| Brian Kerrane (1969) | | Vice President since 2008 | | Senior Vice President, Neuberger, since 2006; formerly, Vice President, Neuberger, 2002 to 2006; Vice President, Management, since 2008 and Employee since 1991; Vice President, nine registered investment companies for which Management acts as investment manager and administrator (nine since 2008). | |
|
| Kevin Lyons (1955) | | Assistant Secretary since 2003 | | Assistant Vice President, Neuberger, since 2008 and Employee since 1999; Assistant Secretary, nine registered investment companies for which Management acts as investment manager and administrator (eight since 2003 and one since 2006). | |
|
31
Name, (Year of Birth),
and Address(1) | | Position and
Length of Time
Served(2) | | Principal Occupation(s)(3) | |
| Owen F. McEntee, Jr. (1961) | | Vice President since 2008 | | Vice President, Neuberger, since 2006; Employee, Management, since 1992; Vice President, nine registered investment companies for which Management acts as investment manager and administrator (nine since 2008). | |
|
| John M. McGovern (1970) | | Treasurer and Principal Financial and Accounting Officer since 2005; prior thereto, Assistant Treasurer since 2002 | | Senior Vice President, Neuberger, since 2007; formerly, Vice President, Neuberger, 2004 to 2006; Employee, Management, since 1993; Treasurer and Principal Financial and Accounting Officer, nine registered investment companies for which Management acts as investment manager and administrator (eight since 2005 and one since 2006); formerly, Assistant Treasurer, eight registered investment companies for which Management acts as investment manager and administrator, 2002 to 2005. | |
|
| Andrew Provencher (1965) | | Vice President since 2008 | | Managing Director, Management, since 2008; Managing Director, Neuberger, since 2005; formerly, Senior Vice President, Neuberger, 2003 to 2005; formerly, Vice President, Neuberger, 1999 to 2003; Vice President, nine registered investment companies for which Management acts as investment manager and administrator (nine since 2008). | |
|
| Frank Rosato (1971) | | Assistant Treasurer since 2005 | | Vice President, Neuberger, since 2006; Employee, Management, since 1995; Assistant Treasurer, nine registered investment companies for which Management acts as investment manager and administrator (eight since 2005 and one since 2006). | |
|
| Neil S. Siegel (1967) | | Vice President since 2008 | | Managing Director, Management, since 2008; Managing Director, Neuberger, since 2006; formerly, Senior Vice President, Neuberger, 2004 to 2006; Vice President, nine registered investment companies for which Management acts as investment manager and administrator (nine since 2008); formerly, Head of Institutional Marketing, Morgan Stanley Investment Management, 1993 to 2004. | |
|
| Chamaine Williams (1971) | | Chief Compliance Officer since 2005 | | Senior Vice President, Neuberger, since 2007; Chief Compliance Officer, Management, since 2006; Chief Compliance Officer, nine registered investment companies for which Management acts as investment manager and administrator (eight since 2005 and one since 2006); formerly, Senior Vice President, LBI, 2007 to 2008; formerly, Vice President, LBI, 2003 to 2006; formerly, Chief Compliance Officer, Lehman Brothers Asset Management Inc., 2003 to 2007; formerly, Chief Compliance Officer, Lehman Brothers Alternative Investment Management LLC, 2003 to 2007; formerly, Vice President, UBS Global Asset Management (US) Inc. (formerly, Mitchell Hutchins Asset Management, a wholly-owned subsidiary of PaineWebber Inc.), 1997 to 2003. | |
|
(1) The business address of each listed person is 605 Third Avenue, New York, New York 10158.
(2) Pursuant to the By-Laws of the Trust, each officer elected by the Fund Trustees shall hold office until his or her successor shall have been elected and qualified or until his or her earlier death, inability to serve, or resignation. Officers serve at the pleasure of the Fund Trustees and may be removed at any time with or without cause.
(3) Except as otherwise indicated, each individual has held the positions shown for at least the last five years.
32
Proxy Voting Policies and Procedures
A description of the policies and procedures that the Trust uses to determine how to vote proxies relating to portfolio securities is available, without charge, by calling 1-800-877-9700 (toll-free) and on the website of the Securities and Exchange Commission, at www.sec.gov. Information regarding how the Trust voted proxies relating to portfolio securities during the most recent 12-month period ended June 30 is also available, without charge, by calling 1-800-877-9700 (toll-free), on the website of the Securities and Exchange Commission at www.sec.gov, and on Management's website at www.nb.com.
Quarterly Portfolio Schedule
The Trust files a complete schedule of portfolio holdings for the Fund with the Securities and Exchange Commission for the first and third quarters of each fiscal year on Form N-Q. The Trust's Forms N-Q are available on the Securities and Exchange Commission's website at www.sec.gov and may be reviewed and copied at the Securities and Exchange Commission's Public Reference Room in Washington, DC. Information on the operation of the Public Reference Room may be obtained by calling 1-800-SEC-0330. The information on Form N-Q is available upon request, without charge, by calling 1-800-877-9700 (toll free).
33
Neuberger Berman
Advisers Management Trust
Socially Responsive Portfolio
I Class Shares
S Class Shares
Annual Report
December 31, 2009
B1017 02/10
Socially Responsive Portfolio Managers' Commentary
We are pleased to report that, for the year ended December 31, 2009, the Neuberger Berman Advisers Management Trust (AMT) Socially Responsive Portfolio provided a positive return and outperformed its benchmark, the S&P 500 Index.
Early in the year, equities suffered under the macroeconomic impact of the financial crisis. Industrial activity collapsed as businesses moved to conserve cash against an uncertain backdrop, sharply cutting employment and curtailing production in order to reduce inventories.
The semiconductor industry was among the first to react to the crisis, slashing production in the fall of 2008. By February 2009, semiconductor inventories had reached unsustainably low levels, forcing the industry to increase production to satisfy even low levels of demand. Other industries would follow soon. By the time the financial markets began to rebound in March, the reversal in the inventory cycle was joined by governmental stimulus programs and aggressive Federal Reserve policy. By spring, credit markets stabilized as some of the most severely damaged financial firms reported better-than-expected earnings.
The rally that ensued lifted investor sentiment and risk appetite. Many of the sectors hardest hit during the decline--those most closely tied to a cyclical recovery, such as credit-sensitive financials, heavy industrials, materials, and consumer retail--rebounded strongly, fueling second-half returns. Less economically sensitive stocks, while up, underperformed.
For the year, Portfolio returns were strongly influenced by evolving investor sentiment. With our focus on quality companies with strong balance sheets positioned for advantaged growth through economic cycles, the Portfolio significantly outperformed during the first half of the period. As the market bottomed, investors shifted toward stocks perceived to benefit most from economic recovery. As this occurred, our large lead versus the broader market contracted, and the Portfolio ended the year with a smaller, yet significant performance advantage.
The Portfolio's strongest performers in 2009 included Scripps Networks, best known for its Food and Home and Garden cable networks. Despite a challenging advertising environment, we believe Scripps grew its business in 2009, driven by the strong affinity of its brands with consumers. With strong fundamentals and a very resilient business, the stock almost doubled this past year.
Newfield Exploration, a natural gas exploration and production company, was another top performer. Until recently, investors had underappreciated the potential value of Newfield's production acreage. Newfield bounced off depressed lows in 2009 as energy rebounded and as its long term growth potential became better recognized.
Altera, a long-term core semiconductor holding, also performed well. Because of the value proposition of its product line Altera's revenue held up better than its peers, which supported the stock during 2009's early weakness and through the subsequent rally.
Portfolio disappointments included biotech firm Genzyme, which we sold late in the year. Manufacturing issues hurt Genzyme's ability to serve customers and may have eased the path for entry by competitors. We also eliminated our position in UnitedHealth Group, which was hurt by operating challenges and uncertainty about health care reform.
Other poor performers included Liberty Global and BorgWarner, companies we sold early in the year at a loss to make room for candidates we expected would perform better. Yahoo is one such addition, a company likely to be a beneficiary of the secular shift to Internet-based advertising. We continue to hold companies like Comcast and Bank of New York Mellon -- firms that delivered good operating results in a difficult environment, but became less interesting to investors as cyclicals rallied.
Looking ahead, while we currently expect several more quarters of stronger-than-expected economic growth driven by inventory restocking, the longer-term outlook remains uncertain. For instance, elevated unemployment is likely to constrain consumer spending. Also many industrialized nations need to address serious fiscal problems, eventually leading to spending cuts and higher taxes. At some point, these factors could impact economic growth. We think their effect may be felt as the benefits of the inventory replenishment cycle wind down.
1
The uncertainties facing businesses and the lack of historical precedents keep us focused on high-quality socially responsible companies whose growth is not closely tied to an economic rebound, and whose shares trade at or below the market average. Recent addition ICF is one example. ICF helps various federal agencies, including HHS, EPA and Education, implement programs. The company has a strong balance sheet, significant free cash flow, relatively predictable earnings, and has been selling at a historical low. We think such intrinsically strong businesses will benefit the portfolio in 2010 and across our 3-5 year investment horizon.
If the economic recovery is more robust than we expect, owning companies less geared to economic growth may prove a headwind. However, we believe extremely attractive current valuations should offset some of this risk. Our current holdings, we think, can deliver solid returns driven by earnings growth and dividends. Valuation expansion, if it occurs, would be an added catalyst.
As always, we look forward to continuing to serve your investment needs.
Sincerely,
Arthur Moretti and Ingrid Dyott
Portfolio Co-Managers
2
Socially Responsive Portfolio
SECTOR ALLOCATION
| (% of Equity Market Value) | |
| Consumer Discretionary | | | 13.7 | % | |
| Consumer Staples | | | 5.0 | | |
| Energy | | | 14.1 | | |
| Financials | | | 12.5 | | |
| Health Care | | | 9.7 | | |
| Industrials | | | 14.8 | | |
| Information Technology | | | 23.4 | | |
| Materials | | | 4.0 | | |
| Utilities | | | 2.8 | | |
| Total | | | 100.0 | % | |
AVERAGE ANNUAL TOTAL RETURN1
| | | Inception
Date | | 1 Year | | 5 Years | | 10 Years | | Life of
Fund* | |
Socially Responsive
Portfolio Class I | |
02/18/1999 | | | 31.43 | % | | | 0.80 | % | | | 2.51 | % | | | 3.66 | % | |
Socially Responsive
Portfolio Class S2 | | 05/01/2006 | | | 31.31 | % | | | 0.72 | % | | | 2.47 | % | | | 3.62 | % | |
| S&P 500 Index3 | | | | | 26.46 | % | | | 0.42 | % | | | -0.95 | % | | | 0.91 | % | |
Performance data quoted represent past performance, which is no guarantee of future results. The investment return and principal value of an investment will fluctuate so that an investor's shares, when redeemed may be worth more or less than their original cost. Results are shown on a "total return" basis and include reinvestment of all income dividends and distributions.
Current performance may be lower or higher than the performance data quoted. For performance data current to the most recent month end, please visit https://www.nb.com.
* Index returns are as of inception date 2/18/1999.
As stated in the Portfolio's most recent prospectus, the total annual fund operating expense ratios for fiscal year 2008 were 0.92% and 1.27% for Class I and Class S shares, respectively (prior to any fee waivers or expense reimbursements). The net expense ratio was 1.17% for Class S shares. Neuberger Berman Management LLC has contractually agreed to limit certain expenses of the Portfolio through 12/31/2012 for Class I and Class S shares.
COMPARISON OF A $10,000 INVESTMENT
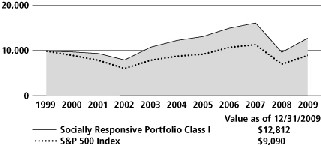
The chart shows the value of a hypothetical $10,000 investment in the Portfolio over the past 10 fiscal years, or since the Portfolio's inception, if it has not operated for 10 years. The graphs are based on Class I shares only; performance of other classes will vary due to differences in fee structures (see Average Annual Total Return chart above). The result is compared with benchmarks, which may include a broad-based market index and/or a narrower index. Please note that market indexes do not include expenses. All results include the reinvestment of income dividends and distributions. Results represent past performance and do not indicate future results. The chart and table do not reflect the deduction of taxes that a shareholder would pay on Portfolio distributions or the redemption of Portfolio shares.
Please see Endnotes for additional information.
3
Endnotes
1 "Total Return" includes reinvestment of all income dividends and distributions. Results represent past performance and do not indicate future results. The value of an investment in the Portfolio and the return on the investment both will fluctuate, and redemption proceeds may be higher or lower than an investor's original cost. The performance information does not reflect fees and expenses of the variable annuity and variable life insurance policies or the qualified pension and retirement plans whose proceeds are invested in the Portfolio. Neuberger Berman Management LLC ("NBM LLC") has agreed to absorb certain expenses of the AMT Portfolios, including the Portfolio. Without this arrangement, which is subject to change, the total returns of the Portfolio may have been less.
2 Performance shown prior to May 1, 2006 for the Class S shares is that of the Class I shares, which have lower expenses and correspondingly higher returns than Class S shares.
3 The S&P 500 Index is widely regarded as the standard for measuring large-cap U.S. stock market performance and includes a representative sample of leading companies in leading industries. Please note that indices do not take into account any fees and expenses of investing in the individual securities that they track and that individuals cannot invest directly in any index. Data about the performance of this index is prepared or obtained by NBM LLC and include reinvestment of all income dividends and distributions. The Portfolio may invest directly in many securities not included in the above-described index.
Any ratios or other measurements using a factor of forecasted earnings of a company discussed herein are based on consensus estimates, not NBM LLC's own projections, and they may or may not be realized. In addition, any revision to a forecast could affect the market price of a security. By quoting them herein, NBM LLC does not offer an opinion as to the accuracy of and does not guarantee these forecasted numbers.
The investments for the Portfolio are managed by the same portfolio manager(s) who manage one or more other mutual funds that have similar names, investment objectives and investment styles as the Portfolio. You should be aware that the Portfolio is likely to differ from the other mutual funds in size, cash flow pattern and tax matters. Accordingly, the holdings and performance can be expected to vary from those of the other mutual funds.
The composition, industries and holdings of the Portfolio are subject to change.
Shares of the separate AMT Portfolios are not available to the general public. Shares of this Portfolio may be purchased only by life insurance companies to be used with their separate accounts that fund variable annuity and variable life insurance policies and by qualified pension and retirement plans.
Statistics and projections in this report are derived from sources deemed to be reliable but cannot be regarded as a representation of future results of the AMT Portfolios. This report is prepared for the general information of shareholders and is not an offer of shares of the AMT Portfolios. Shares of the AMT Portfolios are sold only through the currently effective prospectuses, which must precede or accompany this report.
(c) 2010 Neuberger Berman Management LLC distributor. All rights reserved.
4
Information About Your Fund's Expenses
This table is designed to provide information regarding costs related to your investments. All mutual funds incur operating expenses, which include management fees, fees for administrative services and costs of shareholder reports, among others. The following examples are based on an investment of $1,000 made at the beginning of the six month period ended December 31, 2009 and held for the entire period. The table illustrates the fund's costs in two ways:
| Actual Expenses and Performance: | | The first section of the table provides information about actual account values and actual expenses in dollars, based on the fund's actual performance during the period. You may use the information in this line, together with the amount you invested, to estimate the expenses you paid over the period. Simply divide your account value by $1,000 (for example, an $8,600 account value divided by $1,000 = 8.6), then multiply the result by the number in the first section of the table under the heading entitled "Expenses Paid During the Period" to estimate the expenses you paid over the period. | |
|
Hypothetical Example for
Comparison Purposes: | | The second section of the table provides information about hypothetical account values and hypothetical expenses based on the fund's actual expense ratio and an assumed rate of return at 5% per year before expenses. This return is not the fund's actual return. The hypothetical account values and expenses may not be used to estimate the actual ending account balance or expenses you paid for the period. You may use this information to compare the ongoing costs of investing in this fund versus other funds. To do so, compare the expenses shown in this 5% hypothetical example with the 5% hypothetical examples that appear in the shareholder reports of other funds. | |
|
Please note that the expenses in the table are meant to highlight your ongoing costs only. The table and expense example do not include any transactional costs, such as fees and expenses that are, or may be, imposed under your variable contract or qualified pension plan. Therefore, the information under the heading "Hypothetical (5% annual return before expenses)" is useful in comparing ongoing costs only, and will not help you determine the relative total costs of owning different funds. In addition, if these transactional costs were included, your costs would have been higher.
Expense Information as of 12/31/09 (Unaudited)
NEUBERGER BERMAN ADVISERS MANAGEMENT TRUST SOCIALLY RESPONSIVE PORTFOLIO
| Actual | | Beginning Account
Value 7/1/09 | | Ending Account
Value 12/31/09 | | Expenses Paid During
the Period*
7/1/09 - 12/31/09 | | Expense
Ratio | |
| Class I | | $ | 1,000.00 | | | $ | 1,207.50 | | | $ | 6.23 | | | | 1.12 | % | |
| Class S | | $ | 1,000.00 | | | $ | 1,206.60 | | | $ | 6.51 | | | | 1.17 | % | |
| Hypothetical (5% annual return before expenses)** | |
| Class I | | $ | 1,000.00 | | | $ | 1,019.56 | | | $ | 5.70 | | | | 1.12 | % | |
| Class S | | $ | 1,000.00 | | | $ | 1,019.31 | | | $ | 5.96 | | | | 1.17 | % | |
* For each class of the fund, expenses are equal to the annualized expense ratio for the class, multiplied by the average account value over the period, multiplied by 184/365 (to reflect the one-half year period shown).
** Hypothetical 5% annual return before expenses is calculated by multiplying the number of days in the most recent half year divided by 365.
5
Schedule of Investments Socially Responsive Portfolio
| NUMBER OF SHARES | | | | VALUEt | |
| Common Stocks (97.7%) | | | |
| Automobiles (1.8%) | | | |
| | 26,570 | | | Toyota Motor ADR | | $ | 2,236,132 | | |
| Capital Markets (7.1%) | | | |
| | 266,829 | | | Charles Schwab | | | 5,021,722 | | |
| | 132,810 | | | The Bank of New York Mellon | | | 3,714,695 | | |
| | | | 8,736,417 | | |
| Commercial Services & Supplies (1.9%) | | | |
| | 147,375 | | | Herman Miller | | | 2,355,053 | | |
Electronic Equipment, Instruments &
Components (7.9%) | | | |
| | 102,625 | | | Anixter International | | | 4,833,637 | * | |
| | 163,975 | | | National Instruments | | | 4,829,064 | | |
| | | | 9,662,701 | | |
| Energy Equipment & Services (3.0%) | |
| | 134,100 | | | Smith International | | | 3,643,497 | | |
| Food Products (3.0%) | | | |
| | 59,950 | | | J.M. Smucker | | | 3,701,913 | | |
| Household Products (1.9%) | | | |
| | 37,715 | | | Procter & Gamble | | | 2,286,660 | | |
| Industrial Conglomerates (4.1%) | | | |
| | 60,665 | | | 3M Co. | | | 5,015,176 | | |
| Industrial Gases (2.8%) | | | |
| | 42,695 | | | Praxair, Inc. | | | 3,428,835 | | |
| Insurance (5.1%) | | | |
| | 7,400 | | | Markel Corp. | | | 2,516,000 | * | |
| | 205,675 | | | Progressive Corp. | | | 3,700,093 | * | |
| | | | 6,216,093 | | |
| Internet Software & Services (3.7%) | | | |
| | 270,500 | | | Yahoo! Inc. | | | 4,538,990 | * | |
| Life Science Tools & Services (3.1%) | | | |
| | 52,725 | | | Millipore Corp. | | | 3,814,654 | * | |
| Machinery (4.5%) | | | |
| | 73,815 | | | Danaher Corp. | | | 5,550,888 | | |
| NUMBER OF SHARES | | | | VALUEt | |
| Media (11.6%) | | | |
| | 216,847 | | | Comcast Corp. Class A Special | | $ | 3,471,720 | | |
| | 119,675 | | | Scripps Networks Interactive | | | 4,966,513 | | |
| | 13,159 | | | Washington Post | | | 5,784,696 | | |
| | | | 14,222,929 | | |
| Multi-Utilities (2.7%) | | | |
| | 300,234 | | | National Grid | | | 3,277,031 | | |
| Oil, Gas & Consumable Fuels (10.8%) | | | |
| | 234,882 | | | BG Group PLC | | | 4,241,099 | | |
| | 62,250 | | | Cimarex Energy | | | 3,297,383 | | |
| | 118,310 | | | Newfield Exploration | | | 5,706,091 | * | |
| | | | 13,244,573 | | |
| Pharmaceuticals (6.4%) | | | |
| | 34,956 | | | Novo Nordisk A/S ADR | | | 2,231,941 | | |
| | 39,269 | | | Novo Nordisk A/S Class B | | | 2,506,998 | * | |
| | 18,361 | | | Roche Holding AG | | | 3,139,966 | | |
| | | | 7,878,905 | | |
| Professional Services (1.2%) | | | |
| | 56,900 | | | ICF International | | | 1,524,920 | * | |
| Road & Rail (2.7%) | | | |
| | 60,250 | | | Canadian National Railway | | | 3,275,190 | | |
Semiconductors & Semiconductor
Equipment (6.8%) | | | |
| | 266,055 | | | Altera Corp. | | | 6,020,825 | | |
| | 87,600 | | | Texas Instruments | | | 2,282,856 | | |
| | | | 8,303,681 | | |
| Software (4.5%) | | | |
| | 180,475 | | | Intuit Inc. | | | 5,542,387 | * | |
| Specialty Chemicals (1.1%) | | | |
| | 13,600 | | | Novozymes A/S | | | 1,414,912 | | |
| | | | | Total Common Stocks
(Cost $115,863,361) | | | 119,871,537 | | |
| Short-Term Investments (4.2%) | | | |
| | 2,561,010 | | | Neuberger Berman Securities
Lending Quality Fund, LLC | | | 2,612,230 | tt | |
| | 2,595,490 | | | State Street Institutional
Government Money Market
Fund Institutional Class | | | 2,595,490 | | |
| | | | | Total Short-Term Investments
(Cost $5,207,720) | | | 5,207,720 | | |
See Notes to Schedule of Investments 6
| PRINCIPAL AMOUNT | | | | VALUEt | |
| Certificates of Deposit (0.2%) | |
| $ | 100,000 | | | Shorebank Chicago, 0.85%,
due 3/10/10 | | $ | 100,000 | | |
| | 100,000 | | | Shorebank Pacific, 0.45%,
due 1/31/10 | | | 100,000 | | |
| | | Total Certificates of Deposit
(Cost $200,000) | | | 200,000 | # | |
| | | Total Investments (102.1%)
(Cost $121,271,081) | | | 125,279,257 | ## | |
| | | Liabilities, less cash, receivables and
other assets [(2.1%)] | | | (2,559,777 | ) | |
| | | Total Net Assets (100.0%) | | $ | 122,719,480 | | |
See Notes to Schedule of Investments 7
Notes to Schedule of Investments Socially Responsive Portfolio
t The value of investments in equity securities by Neuberger Berman Advisers Management Trust Socially Responsive Portfolio (the "Fund") is determined by Neuberger Berman Management LLC ("Management") primarily by obtaining valuations from an independent pricing service based on the latest sale price when that price is readily available. Securities traded primarily on the NASDAQ Stock Market are normally valued by the Fund at the NASDAQ Official Closing Price ("NOCP") provided by NASDAQ each business day. The NOCP is the most recently reported price as of 4:00:02 p.m., Eastern time, unless that price is outside the range of the "inside" bid and asked prices (i.e., the bid and asked prices that dealers quote to each other when trading for their own accounts); in that case, NASDAQ will adjust the price to equal the inside bid or asked price, whichever is closer. Because of delays in reporting trades, the NOCP may not be based on the price of the last trade to occur before the market closes. If there is no reported sale of a security on a particular day, the independent pricing service may value the security based on reported market quotations. Management has developed a process to periodically review information provided by independent pricing services. If a valuation is not available from an independent pricing service, the Fund seeks to obtain quotations from principal market makers. If such quotations are not readily available, securities are valued using methods the Board of Trustees of Neuberger Berman Advisers Management Trust (the "Board") has approved on the belief that they reflect fair value. Numerous factors may be considered when determining the fair value of a security, including available analyst, media or other reports, trading in futures or ADRs and whether the issuer of the security being fair valued has other securities outstanding. Foreign security prices are furnished by independent quotation services and expressed in local currency values. Foreign security prices are currently translated from the local currency into U.S. dollars using the exchange rate as of 4:00 p.m., Eastern time. The Board has approved the use of Interactive Data Pricing and Reference Data, Inc. ("Interactive") to assist in determining the fair value of the Fund's foreign equity securities when changes in the value of a certain index suggest that the closing prices on the foreign exchanges may no longer represent the amount that the Fund could expect to receive for those securities. In this event, Interactive will provide adjusted prices for certain foreign equity securities using a statistical analysis of historical correlations of multiple factors. In the absence of precise information about the market values of these foreign securities as of the close of the New York Stock Exchange, the Board has determined on the basis of available data that prices adjusted in this way are likely to be closer to the prices the Fund could realize on a current sale than are the prices of those securities established at the close of the foreign markets in which the securities primarily trade. Fair value prices are necessarily estimates, and there is no assurance that such a price will be at or close to the price at which the security next trades. Short-term debt securities with less than 60 days until maturity may be valued at cost, which, when combined with interest earned, is expected to approximate market value.
In accordance with Accounting Standards Codification ("ASC") 820 "Fair Value Measurements and Disclosures" ("ASC 820"), formerly known as Financial Accounting Standards Board ("FASB") Statement of Financial Accounting Standards No. 157, "Fair Value Measurements," investments held by a fund are carried at "fair value" as defined by ASC 820. Fair value is defined as the price that a Fund would receive upon selling an investment in an orderly transaction to an independent buyer in the principal or most advantageous market for the investment under current market conditions. Various inputs, including the volume and level of activity for the asset or liability in the market are considered in determining the value of the Fund's investments, some of which are discussed above. Significant management judgement may be necessary to estimate fair value in accordance with ASC 820.
In addition to defining fair value, ASC 820 established a three-tier hierarchy of inputs to establish a classification of fair value measurements for disclosure purposes. The three-tier hierarchy of inputs is summarized in the three broad Levels listed below.
. Level 1 - quoted prices in active markets for identical investments
. Level 2 - other significant observable inputs (including quoted prices for similar investments, interest rates, prepayment speeds, credit risk, amortized cost, etc.)
. Level 3 - significant unobservable inputs (including the Fund's own assumptions in determining the fair value of investments)
See Notes to Financial Statements 8
Notes to Schedule of Investments Socially Responsive Portfolio (cont'd)
The inputs or methodology used for valuing an investment are not necessarily an indication of the risk associated with investing in those securities.
The following is a summary, by category of Level, of inputs used to value the Fund's investments as of December 31, 2009:
| Asset Valuation Inputs | | Level 1 | | Level 2 | | Level 3 | | Total | |
| Investments: | |
| Common Stocks^ | | $ | 119,871,537 | | | $ | -- | | | $ | -- | | | $ | 119,871,537 | | |
| Short-Term Investments | | | -- | | | | 5,207,720 | | | | -- | | | | 5,207,720 | | |
| Certificates of Deposit | | | -- | | | | 200,000 | | | | -- | | | | 200,000 | | |
| Total Investments | | $ | 119,871,537 | | | $ | 5,407,720 | | | $ | -- | | | $ | 125,279,257 | | |
^ The Schedule of Investments provides information on the industry categorization for the portfolio.
# At cost, which approximates market value.
## At December 31, 2009, the cost of investments for U.S. federal income tax purposes was $121,834,916. Gross unrealized appreciation of investments was $11,127,167 and gross unrealized depreciation of investments was $7,682,826, resulting in net unrealized appreciation of $3,444,341, based on cost for U.S. federal income tax purposes.
* Security did not produce income during the last twelve months.
* All or a portion of this security is on loan (see Note A of Notes to Financial Statements).
tt Managed by an affiliate of Management and could be deemed an affiliate of the Fund (see Notes A & F of Notes to Financial Statements).
See Notes to Financial Statements 9
Statement of Assets and Liabilities
Neuberger Berman Advisers Management Trust
| | | SOCIALLY
RESPONSIVE
PORTFOLIO | |
| | | December 31, 2009 | |
| Assets | |
| Investments in securities, at value*t (Notes A & F)--see Schedule of Investments: | |
| Unaffiliated issuers | | $ | 122,667,027 | | |
| Affiliated issuers | | | 2,612,230 | | |
| | | | 125,279,257 | | |
| Cash | | | 14,905 | | |
| Dividends and interest receivable | | | 98,434 | | |
| Receivable for Fund shares sold | | | 288,318 | | |
| Receivable for securities lending income--net (Note A) | | | 43 | | |
| Prepaid expenses and other assets | | | 256 | | |
| Total Assets | | | 125,681,213 | | |
| Liabilities | |
| Payable for collateral on securities loaned (Note A) | | | 2,567,441 | | |
| Payable for securities purchased | | | 131,157 | | |
| Payable for Fund shares redeemed | | | 100,649 | | |
| Payable to investment manager (Notes A & B) | | | 56,442 | | |
| Payable to administrator--net (Note B) | | | 37,140 | | |
| Accrued expenses and other payables | | | 68,904 | | |
| Total Liabilities | | | 2,961,733 | | |
| Net Assets at value | | $ | 122,719,480 | | |
| Net Assets consist of: | |
| Paid-in capital | | $ | 147,981,225 | | |
| Undistributed net investment income (loss) | | | 37,018 | | |
| Accumulated net realized gains (losses) on investments | | | (29,304,323 | ) | |
| Net unrealized appreciation (depreciation) in value of investments | | | 4,005,560 | | |
| Net Assets at value | | $ | 122,719,480 | | |
| Net Assets | |
| Class I | | $ | 64,519,757 | | |
| Class S | | | 58,199,723 | | |
| Shares Outstanding ($.001 par value; unlimited shares authorized) | |
| Class I | | | 5,333,157 | | |
| Class S | | | 4,795,062 | | |
| Net Asset Value, offering and redemption price per share | |
| Class I | | $ | 12.10 | | |
| Class S | | | 12.14 | | |
| tSecurities on loan, at value: | |
| Unaffiliated issuers | | $ | 2,444,939 | | |
| *Cost of Investments: | |
| Unaffiliated issuers | | $ | 118,658,851 | | |
| Affiliated issuers | | | 2,612,230 | | |
| Total cost of investments | | $ | 121,271,081 | | |
See Notes to Financial Statements 10
Statement of Operations
Neuberger Berman Advisers Management Trust
| | | SOCIALLY
RESPONSIVE
PORTFOLIO | |
| | | For the
Year Ended
December 31, 2009 | |
| Investment Income: | |
| Income (Note A): | |
| Dividend income--unaffiliated issuers | | $ | 1,314,012 | | |
| Interest income--unaffiliated issuers | | | 2,235 | | |
| Income from securities loaned--net (Note F) | | | 3,387 | | |
| Foreign taxes withheld | | | (23,135 | ) | |
| Total income | | $ | 1,296,499 | | |
| Expenses: | |
| Investment management fees (Notes A & B) | | | 583,948 | | |
| Administration fees (Note B): | |
| Class I | | | 164,157 | | |
| Class S | | | 154,360 | | |
| Distribution fees (Note B): | |
| Class S | | | 128,634 | | |
| Audit fees | | | 41,307 | | |
| Custodian fees (Note B) | | | 78,906 | | |
| Insurance expense | | | 8,486 | | |
| Legal fees | | | 33,237 | | |
| Shareholder reports | | | 93,548 | | |
| Trustees' fees and expenses | | | 50,107 | | |
| Miscellaneous | | | 17,522 | | |
| Total expenses | | | 1,354,212 | | |
| Expenses reimbursed by administrator (Note B) | | | (117,793 | ) | |
| Expenses reduced by custodian fee expense offset arrangement (Note B) | | | (7 | ) | |
| Total net expenses | | | 1,236,412 | | |
| Net investment income (loss) | | $ | 60,087 | | |
| Realized and Unrealized Gain (Loss) on Investments (Note A) | |
| Net realized gain (loss) on: | |
| Sales of investment securities of unaffiliated issuers | | | (14,024,378 | ) | |
| Sales of investment securities of affiliated issuers | | | 44,790 | | |
| Foreign currency | | | (22,696 | ) | |
| Change in net unrealized appreciation (depreciation) in value of: | |
| Unaffiliated investment securities | | | 43,112,954 | | |
| Foreign currency | | | (236 | ) | |
| Net gain (loss) on investments | | | 29,110,434 | | |
| Net increase (decrease) in net assets resulting from operations | | $ | 29,170,521 | | |
See Notes to Financial Statements 11
Statements of Changes in Net Assets
Neuberger Berman Advisers Management Trust
| | | SOCIALLY RESPONSIVE PORTFOLIO | |
| | | Year Ended
December 31,
2009 | | Year Ended
December 31,
2008 | |
| Increase (Decrease) in Net Assets: | |
| From Operations (Note A): | |
| Net investment income (loss) | | $ | 60,087 | | | $ | 2,662,575 | | |
| Net realized gain (loss) on investments | | | (14,002,284 | ) | | | (7,544,997 | ) | |
| Change in net unrealized appreciation (depreciation) of investments | | | 43,112,718 | | | | (95,761,352 | ) | |
| Net increase (decrease) in net assets resulting from operations | | | 29,170,521 | | | | (100,643,774 | ) | |
| Distributions to Shareholders From (Note A): | |
| Net investment income: | |
| Class I | | | (1,217,313 | ) | | | (1,623,563 | ) | |
| Class S | | | (1,002,052 | ) | | | (1,370,229 | ) | |
| Net realized gain on investments: | |
| Class I | | | -- | | | | (5,548,809 | ) | |
| Class S | | | -- | | | | (5,503,467 | ) | |
| Total distributions to shareholders | | | (2,219,365 | ) | | | (14,046,068 | ) | |
| From Fund Share Transactions (Note D): | |
| Proceeds from shares sold: | |
| Class I | | | 8,381,467 | | | | 68,378,900 | | |
| Class S | | | 2,721,404 | | | | 5,844,369 | | |
| Proceeds from reinvestment of dividends and distributions: | |
| Class I | | | 1,217,313 | | | | 7,172,372 | | |
| Class S | | | 1,002,052 | | | | 6,873,696 | | |
| Payments for shares redeemed: | |
| Class I | | | (10,545,630 | ) | | | (508,016,238 | ) | |
| Class S | | | (8,789,012 | ) | | | (11,960,896 | ) | |
| Net increase (decrease) from Fund share transactions | | | (6,012,406 | ) | | | (431,707,797 | ) | |
| Net Increase (Decrease) in Net Assets | | | 20,938,750 | | | | (546,397,639 | ) | |
| Net Assets: | |
| Beginning of year | | | 101,780,730 | | | | 648,178,369 | | |
| End of year | | $ | 122,719,480 | | | $ | 101,780,730 | | |
| Undistributed net investment income (loss) at end of year | | $ | 37,018 | | | $ | 2,218,992 | | |
See Notes to Financial Statements 12
Notes to Financial Statements Socially Responsive Portfolio
Note A--Summary of Significant Accounting Policies:
1 General: The Fund is a separate operating series of Neuberger Berman Advisers Management Trust (the "Trust"), a Delaware statutory trust organized pursuant to a Trust Instrument dated May 23, 1994. The Trust is currently comprised of ten separate operating series (each a "Series," collectively, the "Funds") each of which is diversified. The Trust is registered as an open-end management investment company under the Investment Company Act of 1940, as amended (the "1940 Act"), and its shares are registered under the Securities Act of 1933, as amended (the "1933 Act"). The Fund currently offers Class I and Class S shares. The Board may establish additional series or classes of shares without the approval of shareholders.
The assets of each Series belong only to that Series, and the liabilities of each Series are borne solely by that Series and no other.
The preparation of financial statements in accordance with U.S. generally accepted accounting principles requires Management to make estimates and assumptions at the date of the financial statements. Actual results could differ from those estimates.
2 Portfolio valuation: Investment securities are valued as indicated in the notes following the Schedule of Investments.
3 Foreign currency translation: The accounting records of the Fund are maintained in U.S. dollars. Foreign currency amounts are currently translated into U.S. dollars using the exchange rates as of 4:00 p.m., Eastern time, to determine the value of investments, other assets and liabilities. Purchase and sale prices of securities, and income and expenses, are translated into U.S. dollars at the prevailing rate of exchange on the respective dates of such transactions. Net unrealized foreign currency gain (loss), if any, arises from changes in the value of assets and liabilities, other than investments in securities, as a result of changes in exchange rates and is stated separately in the Statement of Operations.
4 Securities transactions and investment income: Securities transactions are recorded on trade date for financial reporting purposes. Dividend income is recorded on the ex-dividend date or, for certain foreign dividends, as soon as the Fund becomes aware of the dividends. Non-cash dividends included in dividend income, if any, are recorded at the fair market value of the securities received. Interest income, including accretion of original issue discount, where applicable, and accretion of discount on short-term investments, is recorded on the accrual basis. Realized gains and losses from securities transactions and foreign currency transactions, if any, are recorded on the basis of identified cost and stated separately in the Statement of Operations. Included in net realized gain (loss) on investments are proceeds from the settlements of class action litigation in which the Fund participated as a class member. The amount of such proceeds for the year ended December 31, 2009 was $233,005.
5 Income tax information: The Funds are treated as separate entities for U.S. federal income tax purposes. It is the policy of the Fund to continue to qualify as a regulated investment company by complying with the requirements of Subchapter M of the Internal Revenue Code applicable to regulated investment companies and to distribute substantially all of its earnings to shareholders. Therefore, no federal income or excise tax provision is required.
The Fund has adopted the provisions of ASC 740 "Income Taxes" ("ASC 740"), formerly known as FASB Interpretation No. 48 "Accounting for Uncertainty in Income Taxes -- an interpretation of FASB Statement No. 109." ASC 740 sets forth a minimum threshold for financial statement recognition of the benefit of a tax position taken, or expected to be taken, in a tax return. The Fund recognizes interest and penalties, if any, related to unrecognized tax benefits as an income tax expense in the Statement of Operations. The Fund is subject to examination by U.S. federal and state tax authorities for returns filed for the prior three fiscal years 2006 - 2008. As of December 31, 2009, the Fund did not have any unrecognized tax benefits.
13
Income distributions and capital gain distributions are determined in accordance with income tax regulations, which may differ from U.S. generally accepted accounting principles. These differences are primarily due to differing treatments of income and gains on various investment securities held by the Fund, timing differences and differing characterization of distributions made by the Fund as a whole. The Fund may also utilize earnings and profits distributed to shareholders on redemption of shares as a part of the dividends paid deduction for income tax purposes.
As determined on December 31, 2009, permanent differences resulting primarily from different book and tax accounting for foreign currency gains and losses were reclassified at fiscal year end. These reclassifications had no effect on net income, net asset value or net asset value per share of the Fund.
The tax character of distributions paid during the years ended December 31, 2009 and December 31, 2008 was as follows:
| | | Distributions Paid From: | | | |
| Ordinary Income | | Long-Term Capital Gain | | Total | |
| 2009 | | 2008 | | 2009 | | 2008 | | 2009 | | 2008 | |
| $ | 2,219,365 | | | $ | 4,101,032 | | | $ | -- | | | $ | 9,945,036 | | | $ | 2,219,365 | | | $ | 14,046,068 | | |
As of December 31, 2009, the components of distributable earnings (accumulated losses) on a U.S. federal income tax basis were as follows:
Undistributed
Ordinary
Income | | Undistributed
Long-Term
Gain | | Unrealized
Appreciation
(Depreciation) | | Loss
Carryforwards
and Deferrals | | Total | |
| $ | 37,018 | | | $ | -- | | | $ | 3,441,725 | | | $ | (28,740,488 | ) | | $ | (25,261,745 | ) | |
The difference between book basis and tax basis distributable earnings is attributable primarily to timing differences of wash sales, partnership basis adjustments, capital loss carryforwards and post October loss deferrals.
To the extent the Fund's net realized capital gains, if any, can be offset by capital loss carryforwards, it is the policy of the Fund not to distribute such gains. As determined at December 31, 2009, the Fund had unused capital loss carryforwards available for federal income tax purposes to offset net realized capital gains, if any, as follows:
| | | Expiring in: | |
| | | 2016 | | 2017 | |
| | | $ | 7,357,742 | | | $ | 19,680,911 | | |
Under current tax law, the use of these losses to offset future gains may be limited.
Under current tax law, certain net capital and net foreign currency losses realized after October 31 within the taxable year may be deferred and treated as occurring on the first day of the following tax year. For the year ended December 31, 2009, the Fund elected to defer $1,701,835 of net capital losses arising between November 1, 2009 and December 31, 2009.
6 Distributions to shareholders: The Fund may earn income, net of expenses, daily on its investments. Distributions from net investment income and net realized capital gains, if any, generally are distributed in October. Income distributions and capital gain distributions to shareholders are recorded on the ex-date.
7 Foreign taxes: Foreign taxes withheld represent amounts withheld by foreign tax authorities, net of refunds recoverable.
8 Expense allocation: Certain expenses are applicable to multiple funds. Expenses directly attributable to a Series are charged to that Series. Expenses of the Trust that are not directly attributed to a Series are allocated among the Funds, on the basis of relative net assets, except where a more appropriate allocation of expenses to each of the Funds can otherwise be made fairly. Expenses borne by the complex of related investment companies, which
14
includes open-end and closed-end investment companies for which Management serves as investment manager, that are not directly attributed to a Series or the Trust are allocated among the Fund and the other investment companies in the complex or series thereof on the basis of relative net assets, except where a more appropriate allocation of expenses to each investment company in the complex or series thereof can otherwise be made fairly. The Fund's expenses (other than those specific to each class) are allocated proportionally each day between the classes based upon the relative net assets of each class.
9 Security lending: A third party, eSecLending, serves as exclusive lending agent for the Fund. eSecLending, as agent, has assisted the Fund in conducting bidding processes to try to identify a principal that would pay a guaranteed amount to the Fund in consideration of the Fund entering into an exclusive securities lending arrangement. During the fiscal year, no principal had an exclusive securities lending arrangement with the Fund; as such, the Fund was not guaranteed any particular level of income.
Under the securities lending arrangement, the Fund receives cash collateral at the beginning of each transaction equal to at least 102% of the prior day's market value of the loaned securities (105% in the case of international securities). The Fund may invest all the cash collateral in Neuberger Berman Securities Lending Quality Fund, LLC ("Quality Fund"), a fund managed by Neuberger Berman Fixed Income LLC (formerly known as Lehman Brothers Asset Management LLC) ("NBFI"), an affiliate of Management. Effective July 1, 2009, Dwight Asset Management Company LLC became the Sub-Adviser to the Quality Fund. The Quality Fund is not a money market fund that is registered under the 1940 Act and does not operate in accordance with all requirements of Rule 2a-7 under the 1940 Act. There is no assurance that the Quality Fund will maintain a $1.00 share price.
The market value of the Fund's investments in the Quality Fund as of the fiscal year ended December 31, 2009, if any, is reflected in the Fund's Schedule of Investments. If it were necessary to liquidate assets in the Quality Fund to meet returns on outstanding securities loans at a time when the Quality Fund's price per share was less than $1.00, the Fund may not receive an amount from the Quality Fund that is equal in amount to the collateral the Fund would be required to return to the borrower of the securities and the Fund would be required to make up for this shortfall. In addition, as a result of recent reduced liquidity in the credit and fixed income markets, it may be difficult to dispose quickly of some securities in the Quality Fund at the price at which the Quality Fund is carrying them.
Net income from the lending program represents any amounts received from a principal plus income earned on the cash collateral invested in Quality Fund or in other investments, if applicable, less cash collateral fees and other expenses associated with the loans. For the fiscal year ended December 31, 2009, the Fund received net income under the securities lending arrangement of approximately $3,387, which is reflected in the Statement of Operations under the caption "Income from securities loaned -- net." For the fiscal year ended December 31, 2009, "Income from securities loaned -- net" consisted of approximately $7,925 in income earned on cash collateral and amounts received from a principal (including approximately $3,624 of interest income earned from the Quality Fund), less fees and expenses paid of approximately $4,538.
10 Repurchase agreements: The Fund may enter into repurchase agreements with institutions that Management has determined are creditworthy. Each repurchase agreement is recorded at cost. The Fund requires that the securities purchased in a repurchase agreement be transferred to the custodian in a manner sufficient to enable the Fund to assert a perfected security interest in those securities in the event of a default under the repurchase agreement. The Fund monitors, on a daily basis, the value of the securities transferred to ensure that their value, including accrued interest, is greater than amounts owed to the Fund under each such repurchase agreement.
11 Investments in foreign securities: Investing in foreign securities may involve certain sovereign and other risks, in addition to the credit and market risks normally associated with domestic securities. These additional risks include the possibility of adverse political and economic developments (including political instability, nationalization, expropriation, or confiscatory taxation) and the potentially adverse effects of unavailability of public information regarding issuers, less governmental supervision and regulation of financial markets, reduced liquidity of certain financial markets, and the lack of uniform accounting, auditing, and financial reporting standards or the
15
application of standards that are different or less stringent than those applied in the United States. Foreign securities also may experience greater price volatility, higher rates of inflation, and delays in settlement.
12 Derivative instruments: Management has evaluated the requirements of ASC 815 "Disclosures about Derivative Instruments and Hedging Activities" ("ASC 815"), formerly known as FASB Statement of Financial Accounting Standards No. 161, "Disclosures about Derivative Instruments and Hedging Activities," which are effective for financial statements issued for fiscal years and interim periods beginning after November 15, 2008. ASC 815 requires enhanced disclosures about a fund's derivative and hedging activities. Management has concluded that, since the Fund did not hold any derivative instruments during the year ended December 31, 2009, no additional disclosures pursuant to ASC 815 are required at this time.
13 Indemnifications: Like many other companies, the Trust's organizational documents provide that its officers and trustees are indemnified against certain liabilities arising out of the performance of their duties to the Trust. In addition, both in some of its principal service contracts and in the normal course of its business, the Trust enters into contracts that provide indemnifications to other parties for certain types of losses or liabilities. The Trust's maximum exposure under these arrangements is unknown as this could involve future claims against the Trust.
14 Other: All net investment income and realized and unrealized capital gains and losses of the Fund are allocated, on the basis of relative net assets, pro rata among its respective classes.
Note B--Management Fees, Administration Fees, Distribution Arrangements, and Other Transactions With Affiliates:
Fund shares are issued and redeemed in connection with investments in and payments under certain variable annuity contracts and variable life insurance policies issued through separate accounts of life insurance companies and are also offered directly to qualified pension and retirement plans.
The Fund retains Management as its investment manager under a Management Agreement. For such investment management services, the Fund pays Management a fee at the annual rate of 0.55% of the first $250 million of the Fund's average daily net assets, 0.525% of the next $250 million, 0.50% of the next $250 million, 0.475% of the next $250 million, 0.45% of the next $500 million, 0.425% of the next $2.5 billion, and 0.40% of average daily net assets in excess of $4 billion.
The Fund retains Management as its administrator under an Administration Agreement. Each class pays Management an administration fee at the annual rate of 0.30% of its average daily net assets under this agreement. Additionally, Management retains State Street Bank and Trust Company ("State Street") as its sub-administrator under a Sub-Administration Agreement. Management pays State Street a fee for all services received under this agreement.
The Board adopted a non-fee distribution plan for the Fund's Class I.
For the Fund's Class S, Management acts as agent in arranging for the sale of class shares without commission and bears advertising and promotion expenses. The Board has adopted a distribution plan (the "Plan") with respect to this class, pursuant to Rule 12b-1 under the 1940 Act. The Plan provides that, as compensation for administrative and other services provided to this class, Management's activities and expenses related to the sale and distribution of this class of shares, and ongoing services provided to investors in this class, Management receives from this class a fee at an annual rate of 0.25% of Class S's average daily net assets. Management receives this amount to provide distribution and shareholder servicing for this class and pays a portion of it to institutions that provide such services. Those institutions may use payments for, among other purposes, compensating employees engaged in sales and/or shareholder servicing. The amount of fees paid by the class during any year may be more or less than the cost of the distribution and other services provided to this class. FINRA rules limit the amount of annual distribution fees that may be paid by a mutual fund and impose a ceiling on the cumulative distribution fees paid. The Trust's Plan complies with those rules.
16
Management has contractually undertaken to forgo current payment of fees and/or reimburse the Fund's Class I and Class S shares for their operating expenses (exclusive of interest, taxes, brokerage commissions, extraordinary expenses, and transaction costs) ("Operating Expenses") which exceed the expense limitation as detailed in the following table:
| | | Expense Limitation(1) | | Expiration | | Reimbursement from
Management for the
Year Ended
December 31, 2009 | |
| Class I | | | 1.30 | % | | | 12/31/12 | | | $ | -- | | |
| Class S | | | 1.17 | % | | | 12/31/12 | | | | 117,793 | | |
(1) Expense limitation per annum of the respective class' average daily net assets.
Each respective class has agreed to repay Management through December 31, 2015 for fees and expenses foregone and/or its excess Operating Expenses previously reimbursed by Management, so long as its annual Operating Expenses during that period do not exceed its expense limitation, and the repayment is made within three years after the year in which Management issued the reimbursement or waived fees. During the year ended December 31, 2009, there was no repayment to Management under these agreements. At December 31, 2009 the Fund's Class I shares had no contingent liability to Management under this agreement. At December 31, 2009, the Fund's Class S shares contingent liabilities to Management under this agreement were as follows:
| | | Expiring in: | |
| | | 2011 | | 2012 | | Total | |
| Class S | | $ | 71,032 | | | $ | 117,793 | | | $ | 188,825 | | |
Neuberger Berman LLC (formerly known as Neuberger Berman, LLC) ("Neuberger") is retained by Management to furnish it with investment recommendations and research information without added cost to the Fund. Several individuals who are officers and/or trustees of the Trust are also employees of Neuberger and/or Management.
During the reporting period, the predecessor of Management, the investment manager of the Fund, and Neuberger, the sub-adviser of the Fund, were wholly owned subsidiaries of Lehman Brothers Holdings Inc. ("Lehman Brothers"), a publicly owned holding company. On September 15, 2008, Lehman Brothers filed a voluntary petition under Chapter 11 of the U.S. Bankruptcy Code. On December 3, 2008, NBSH Acquisition, LLC ("NBSH"), an entity organized by key members of Neuberger Berman's senior management, was selected as the successful bidder in the public auction to acquire a majority interest in Neuberger Berman's business and the fixed income and certain alternative asset management businesses of Lehman Brothers' Investment Management Division (together with Neuberger Berman, the "Acquired Businesses") (the "Acquisition"). On December 22, 2008, the bankruptcy court having jurisdiction over the Lehman Brothers matter approved the sale of the Acquired Businesses to NBSH (or its successor or assign), as the successful bidder.
The Acquisition closed on May 4, 2009. The Acquired Businesses are now indirectly owned by, among others, portfolio managers, Neuberger Berman's management team, and certain key members and senior professionals who are employed in various parts of the Neuberger Berman complex of companies, with a minority interest retained by Lehman Brothers and certain affiliates of Lehman Brothers.
The closing of the Acquisition resulted in an "assignment" of the Fund's Management Agreement and Sub-Advisory Agreement. Such an assignment, by law, automatically terminated those agreements. Accordingly, prior to the closing the Board, including the Trustees who are not "interested persons" of the Fund's investment manager and its affiliates or the Fund, considered and approved a new Management Agreement and Sub-Advisory Agreement for the Fund. The new agreements, which are virtually identical to those previously in effect, were also approved by a vote of the Fund's shareholders.
17
These events have not had a material impact on the Fund or its operations. Management and Neuberger continue to operate in the ordinary course of business as the investment manager and sub-adviser of the Fund.
The Fund has an expense offset arrangement in connection with its custodian contract. For the year ended December 31, 2009, the impact of this arrangement was a reduction of expenses of $7.
Note C--Securities Transactions:
During the year ended December 31, 2009, there were purchase and sale transactions (excluding short-term securities) of $34,855,574 and $42,901,823, respectively.
During the year ended December 31, 2009, no brokerage commissions on securities transactions were paid to affiliated brokers.
Note D--Fund Share Transactions:
Share activity for the years ended December 31, 2009 and December 31, 2008 was as follows:
For the Year Ended December 31, 2009
| | | Shares Sold | | Shares Issued on
Reinvestment of
Dividends and
Distributions | | Shares
Redeemed | | Total | |
| Class I | | | 796,814 | | | | 103,601 | | | | (1,064,899 | ) | | | (164,484 | ) | |
| Class S | | | 257,870 | | | | 84,992 | | | | (879,211 | ) | | | (536,349 | ) | |
For the Year Ended December 31, 2008
| | | Shares Sold | | Shares Issued on
Reinvestment of
Dividends and
Distributions | | Shares
Redeemed | | Total | |
| Class I | | | 4,171,564 | | | | 740,183 | | | | (30,562,519 | ) | | | (25,650,772 | ) | |
| Class S | | | 388,203 | | | | 708,629 | | | | (818,006 | ) | | | 278,826 | | |
Note E--Line of Credit:
At December 31, 2009, the Fund was a participant in a single committed, unsecured $150,000,000 line of credit with State Street, to be used only for temporary or emergency purposes. Other investment companies managed by Management also participate in this line of credit on the same terms. Interest is charged on borrowings under this line of credit at the higher of (a) the Federal Funds Rate plus 1.25% per annum or (b) the Overnight LIBOR Rate plus 1.25% per annum. Prior to September 18, 2009, interest was charged on borrowings under this line of credit at the Federal Funds Rate plus 0.50% per annum. A facility fee of 0.15% (prior to September 18, 2009, 0.09%) per annum of the available line of credit is charged, of which the Fund has agreed to pay its pro rata share, based on the ratio of its individual net assets to the net assets of all participants at the time the fee is due and payable. The fee is paid quarterly in arrears. Because several investment companies participate, there is no assurance that an individual Fund will have access to all or any part of the $150,000,000 at any particular time. There were no loans outstanding pursuant to this line of credit at December 31, 2009. During the year ended December 31, 2009, the Fund did not utilize this line of credit.
18
Note F--Investments in Affiliates:
| Name of Issuer | | Balance of
Shares
Held
December 31,
2008 | | Gross
Purchases
and
Additions | | Gross
Sales
and
Reductions | | Balance of
Shares
Held
December 31,
2009 | | Value
December 31,
2009 | | Income from
Investments in
Affiliated
Issuers
Included in
Total Income | |
Neuberger Berman Securities
Lending Quality Fund, LLC* | | | -- | | | | 18,249,145 | | | | 15,688,135 | | | | 2,561,010 | | | $ | 2,612,230 | | | $ | 3,624 | | |
* Quality Fund, a fund managed by NBFI, an affiliate of Management, is used to invest cash the Fund receives as collateral for securities loaned as approved by the Board. Because all shares of Quality Fund are held by funds in the related investment management complex, Quality Fund may be considered an affiliate of the Fund.
Note G--Subsequent Events:
In accordance with the provision set forth in ASC 855 "Subsequent Events" ("ASC 855") formerly known as FAS 165, "Subsequent Events," Management has evaluated the possibility of subsequent events existing in the Fund's financial statements through February 9, 2010. Management has determined that there are no subsequent events that, in accordance with ASC 855, would need to be disclosed in the Fund's financial statements through this date.
19
Financial Highlights
Socially Responsive Portfolio
The following tables include selected data for a share outstanding throughout each period and other performance information derived from the Financial Statements.
| Class I | |
| | | Year Ended December 31, | |
| | | 2009 | | 2008 | | 2007 | | 2006 | | 2005 | |
| Net Asset Value, Beginning of Year | | $ | 9.39 | | | $ | 17.91 | | | $ | 16.71 | | | $ | 14.91 | | | $ | 13.99 | | |
| Income From Investment Operations: | |
| Net Investment Income (Loss)tt | | | .01 | | | | .11 | | | | .12 | | | | .05 | | | | .08 | | |
Net Gains or Losses on Securities
(both realized and unrealized) | | | 2.93 | | | | (7.13 | ) | | | 1.16 | | | | 1.98 | | | | .88 | | |
| Total From Investment Operations | | | 2.94 | | | | (7.02 | ) | | | 1.28 | | | | 2.03 | | | | .96 | | |
| Less Distributions From: | |
| Net Investment Income | | | (.23 | ) | | | (.34 | ) | | | (.02 | ) | | | (.03 | ) | | | -- | | |
| Net Capital Gains | | | -- | | | | (1.16 | ) | | | (.06 | ) | | | (.20 | ) | | | (.04 | ) | |
| Total Distributions | | | (.23 | ) | | | (1.50 | ) | | | (.08 | ) | | | (.23 | ) | | | (.04 | ) | |
| Net Asset Value, End of Year | | $ | 12.10 | | | $ | 9.39 | | | $ | 17.91 | | | $ | 16.71 | | | $ | 14.91 | | |
| Total Returntt | | | 31.43 | % | | | (39.44 | )% | | | 7.61 | % | | | 13.70 | % | | | 6.86 | % | |
| Ratios/Supplemental Data | |
| Net Assets, End of Year (in millions) | | $ | 64.5 | | | $ | 51.6 | | | $ | 557.9 | | | $ | 262.6 | | | $ | 50.5 | | |
| Ratio of Gross Expenses to Average Net Assets# | | | 1.15 | % | | | .92 | % | | | .92 | % | | | 1.07 | % | | | 1.30 | % | |
| Ratio of Net Expenses to Average Net Assets | | | 1.15 | % | | | .92 | % | | | .91 | % | | | 1.06 | %S | | | 1.29 | %S | |
Ratio of Net Investment Income (Loss) to Average
Net Assets | | | .06 | % | | | .70 | % | | | .65 | % | | | .33 | % | | | .53 | % | |
| Portfolio Turnover Rate | | | 34 | % | | | 41 | % | | | 26 | % | | | 56 | % | | | 24 | % | |
See Notes to Financial Highlights 20
Financial Highlights (cont'd)
| Class S | |
| | | Year Ended December 31, | | Period from
May 1 2006^
to December 31, | |
| | | 2009 | | 2008 | | 2007 | | 2006 | |
| Net Asset Value, Beginning of Period | | $ | 9.41 | | | $ | 17.86 | | | $ | 16.69 | | | $ | 15.59 | | |
| Income From Investment Operations: | |
| Net Investment Income (Loss)tt | | | .00 | | | | .06 | | | | .06 | | | | .02 | | |
Net Gains or Losses on Securities
(both realized and unrealized) | | | 2.94 | | | | (7.06 | ) | | | 1.17 | | | | 1.08 | | |
| Total From Investment Operations | | | 2.94 | | | | (7.00 | ) | | | 1.23 | | | | 1.10 | | |
| Less Distributions From: | |
| Net Investment Income | | | (.21 | ) | | | (.29 | ) | | | (.00 | ) | | | -- | | |
| Net Capital Gains | �� | | -- | | | | (1.16 | ) | | | (.06 | ) | | | -- | | |
| Total Distributions | | | (.21 | ) | | | (1.45 | ) | | | (.06 | ) | | | -- | | |
| Net Asset Value, End of Period | | $ | 12.14 | | | $ | 9.41 | | | $ | 17.86 | | | $ | 16.69 | | |
| Total Returntt | | | 31.31 | % | | | (39.43 | )% | | | 7.37 | % | | | 7.06 | %** | |
| Ratios/Supplemental Data | |
| Net Assets, End of Period (in millions) | | $ | 58.2 | | | $ | 50.1 | | | $ | 90.2 | | | $ | 91.6 | | |
| Ratio of Gross Expenses to Average Net Assets# | | | 1.18 | % | | | 1.17 | % | | | 1.17 | % | | | 1.17 | %* | |
| Ratio of Net Expenses to Average Net AssetsS | | | 1.18 | % | | | 1.17 | % | | | 1.16 | % | | | 1.16 | %* | |
Ratio of Net Investment Income (Loss) to
Average Net Assets | | | .05 | % | | | .40 | % | | | .37 | % | | | .16 | %* | |
| Portfolio Turnover Rate | | | 34 | % | | | 41 | % | | | 26 | % | | | 56 | %O | |
See Notes to Financial Highlights 21
Notes to Financial Highlights Socially Responsive Portfolio
tt Total return based on per share net asset value reflects the effects of changes in net asset value on the performance of the Fund during each fiscal period and assumes dividends and other distributions, if any, were reinvested. Results represent past performance and do not guarantee future results. Current returns may be lower or higher than the performance data quoted. Investment returns and principal may fluctuate and shares when redeemed may be worth more or less than original cost. Total return would have been lower if Management had not reimbursed certain expenses. Total return would have been higher if Management had not recouped previously reimbursed expenses. The total return information shown does not reflect charges and other expenses that apply to the separate account or the related insurance policies, and the inclusion of these charges and other expenses would reduce the total return for all fiscal periods shown.
# The Fund is required to calculate an expense ratio without taking into consideration any expense reductions related to expense offset arrangements.
S After reimbursement of expenses by Management. Had Management not undertaken such action, the annualized ratios of net expenses to average daily net assets would have been:
| | | Year Ended December 31, | |
| | | 2009 | | 2008 | | 2007 | | 2006 | | 2005 | |
| Socially Responsive Portfolio Class I | | | -- | | | | -- | | | | -- | | | | -- | | | | 1.33 | % | |
| Socially Responsive Portfolio Class S | | | 1.40 | % | | | 1.26 | % | | | -- | | | | 1.18 | %(1) | | | -- | | |
(1) Period from May 1, 2006 to December 31, 2006.
After reimbursement of expenses previously paid by Management. Had Management not been reimbursed, the annualized ratio of net expenses to average daily net assets would have been:
| | | Year Ended December 31, | |
| | | 2007 | | 2006 | |
| Socially Responsive Portfolio Class I | | | -- | | | | 0.97 | % | |
| Socially Responsive Portfolio Class S | | | 1.16 | % | | | -- | | |
tt Calculated based on the average number of shares outstanding during each fiscal period.
^ The date investment operations commenced.
O Portfolio turnover is calculated at the Fund level. Percentage indicated was calculated for year ended December 31, 2006.
* Annualized.
** Not annualized.
22
Report of Independent Registered Public Accounting Firm
To the Board of Trustees of
Neuberger Berman Advisers Management Trust and
Shareholders of Socially Responsive Portfolio
We have audited the accompanying statement of assets and liabilities, including the schedule of investments, of Socially Responsive Portfolio, one of the series constituting Neuberger Berman Advisers Management Trust (the "Trust"), as of December 31, 2009, and the related statement of operations for the year then ended, the statement of changes in net assets for each of the two years in the period then ended, and the financial highlights for each of the periods indicated therein. These financial statements and financial highlights are the responsibility of the Trust's management. Our responsibility is to express an opinion on these financial statements and financial highlights based on our audits.
We conducted our audits in accordance with the standards of the Public Company Accounting Oversight Board (United States). Those standards require that we plan and perform the audit to obtain reasonable assurance about whether the financial statements and financial highlights are free of material misstatement. We were not engaged to perform an audit of the Trust's internal control over financial reporting. Our audits included consideration of internal control over financial reporting as a basis for designing audit procedures that are appropriate in the circumstances, but not for the purpose of expressing an opinion on the effectiveness of the Trust's internal control over financial reporting. Accordingly, we express no such opinion. An audit also includes examining, on a test basis, evidence supporting the amounts and disclosures in the financial statements and financial highlights, assessing the accounting principles used and significant estimates made by management, and evaluating the overall financial statement presentation. Our procedures included confirmation of securities owned as of December 31, 2009 by correspondence with the custodian and brokers or by other appropriate auditing procedures where replies from brokers were not received. We believe that our audits provide a reasonable basis for our opinion.
In our opinion, the financial statements and financial highlights referred to above present fairly, in all material respects, the financial position of Socially Responsive Portfolio, a series of Neuberger Berman Advisers Management Trust, at December 31, 2009, the results of its operations for the year then ended, the changes in its net assets for each of the two years in the period then ended, and the financial highlights for each of the periods indicated therein, in conformity with U.S. generally accepted accounting principles.
Boston, Massachusetts
February 9, 2010
23
Trustee and Officer Information
The following tables set forth information concerning the trustees and officers of the Trust. All persons named as trustees and officers also serve in similar capacities for other funds administered or managed by Management and Neuberger. The Statement of Additional Information includes additional information about fund trustees and is available upon request, without charge, by calling (800) 877-9700.
Information about the Board of Trustees
Name, (Year of Birth),
and Address(1) | | Position and
Length of
Time Served(2) | | Principal Occupation(s)(3) | | Number of
Funds in Fund
Complex
Overseen by
Fund Trustee | | Other Directorships
Held Outside Fund
Complex by Fund
Trustee | |
| Independent Fund Trustees | |
|
| John Cannon (1930) | | Trustee since 2000 | | Consultant; formerly, Chairman, CDC Investment Advisers (registered investment adviser), 1993 to January 1999; formerly, President and Chief Executive Officer, AMA Investment Advisors, an affiliate of the American Medical Association. | | | 46 | | | Formerly, Independent Trustee or Director of three series of Oppenheimer Funds: Oppenheimer Limited Term New York Municipal Fund, Rochester Fund Municipals, and Oppenheimer Convertible Securities Fund (1992 to 2009). | |
|
| Faith Colish (1935) | | Trustee since 1982 | | Counsel, Carter Ledyard & Milburn LLP (law firm) since October 2002; formerly, Attorney-at-Law and President, Faith Colish, A Professional Corporation, 1980 to 2002. | | | 46 | | | Formerly, Director (1997 to 2003) and Advisory Director (2003 to 2006), ABA Retirement Funds (formerly, American Bar Retirement Association) (not-for-profit membership corporation). | |
|
24
Name, (Year of Birth),
and Address(1) | | Position and
Length of
Time Served(2) | | Principal Occupation(s)(3) | | Number of
Funds in Fund
Complex
Overseen by
Fund Trustee | | Other Directorships
Held Outside Fund
Complex by Fund
Trustee | |
| Martha C. Goss (1949) | | Trustee since 2007 | | President, Woodhill Enterprises Inc./Chase Hollow Associates LLC (personal investment vehicle), since 2006; Chief Operating and Financial Officer, Hopewell Holdings LLC/Amwell Holdings, LLC (a holding company for a healthcare reinsurance company start-up), since 2003; formerly, Consultant, Resources Connection (temporary staffing), 2002 to 2006. | | | 46 | | | Director, Ocwen Financial Corporation (mortgage servicing), since 2005; Director, American Water (water utility), since 2003; Director, Channel Reinsurance (financial guaranty reinsurance), since 2006; Advisory Board Member, Attensity (software developer), since 2005; Director, Allianz Life of New York (insurance), since 2005; Director, Financial Women's Association of New York (not for profit association), since 2003; Trustee Emerita, Brown University, since 1998. | |
|
| C. Anne Harvey (1937) | | Trustee since 1998 | | President, C.A. Harvey Associates, since October 2001; formerly, Director, AARP, 1978 to December 2001. | | | 46 | | | Formerly, President, Board of Associates to The National Rehabilitation Hospital's Board of Directors, 2001 to 2002; formerly, Member, Individual Investors Advisory Committee to the New York Stock Exchange Board of Directors, 1998 to June 2002. | |
|
| Robert A. Kavesh (1927) | | Trustee since 2000 | | Retired; Marcus Nadler Professor Emeritus of Finance and Economics, New York University Stern School of Business; formerly, Executive Secretary-Treasurer, American Finance Association, 1961 to 1979. | | | 46 | | | Formerly, Director, The Caring Community (not-for-profit), 1997 to 2006; formerly, Director, DEL Laboratories, Inc. (cosmetics and pharmaceuticals), 1978 to 2004; formerly, Director, Apple Bank for Savings, 1979 to 1990; formerly, Director, Western Pacific Industries, Inc., 1972 to 1986 (public company). | |
|
25
Name, (Year of Birth),
and Address(1) | | Position and
Length of
Time Served(2) | | Principal Occupation(s)(3) | | Number of
Funds in Fund
Complex
Overseen by
Fund Trustee | | Other Directorships
Held Outside Fund
Complex by Fund
Trustee | |
| Michael M. Knetter (1960) | | Trustee since 2007 | | Dean, School of Business, University of Wisconsin - Madison; formerly, Professor of International Economics and Associate Dean, Amos Tuck School of Business - Dartmouth College, 1998 to 2002. | | | 46 | | | Trustee, Northwestern Mutual Series Fund, Inc., since February 2007; Director, Wausau Paper, since 2005; Director, Great Wolf Resorts, since 2004. | |
|
| Howard A. Mileaf (1937) | | Trustee since 1999 | | Retired; formerly, Vice President and General Counsel, WHX Corporation (holding company), 1993 to 2001. | | | 46 | | | Formerly, Director, Webfinancial Corporation (holding company), 2002 to 2008; formerly, Director WHX Corporation (holding company), January 2002 to June 2005; formerly, Director, State Theatre of New Jersey (not-for-profit theater), 2000 to 2005. | |
|
| George W. Morriss (1947) | | Trustee since 2007 | | Retired; formerly, Executive Vice President and Chief Financial Officer, People's Bank, Connecticut (a financial services company), 1991 to 2001. | | | 46 | | | Manager, Old Mutual 2100 fund complex (consisting of six funds) since October 2006 for four funds and since February 2007 for two funds; formerly, Member NASDAQ Issuers' Affairs Committee, 1995 to 2003. | |
|
| Edward I. O'Brien (1928) | | Trustee since 2000 | | Retired; Formerly, Member, Investment Policy Committee, Edward Jones, 1993 to 2001; President, Securities Industry Association ("SIA") (securities industry's representative in government relations and regulatory matters at the federal and state levels), 1974 to 1992; Adviser to SIA, November 1992 to November 1993. | | | 46 | | | Formerly, Director, Legg Mason, Inc. (financial services holding company), 1993 to July 2008; formerly, Director, Boston Financial Group (real estate and tax shelters), 1993 to 1999. | |
|
26
Name, (Year of Birth),
and Address(1) | | Position and
Length of
Time Served(2) | | Principal Occupation(s)(3) | | Number of
Funds in Fund
Complex
Overseen by
Fund Trustee | | Other Directorships
Held Outside Fund
Complex by Fund
Trustee | |
| Cornelius T. Ryan (1931) | | Trustee since 2000 | | Founding General Partner, Oxford Partners and Oxford Bioscience Partners (venture capital investing) and President, Oxford Venture Corporation, since 1981. | | | 46 | | | None. | |
|
| Tom D. Seip (1950) | | Trustee since 2000; Chairman of the Board since 2008; Lead Independent Trustee from 2006 to 2008 | | General Partner, Seip Investments LP (a private investment partnership); formerly, President and CEO, Westaff, Inc. (temporary staffing), May 2001 to January 2002; formerly, Senior Executive at the Charles Schwab Corporation, 1983 to 1998, including Chief Executive Officer, Charles Schwab Investment Management, Inc., and Trustee, Schwab Family of Funds and Schwab Investments, 1997 to 1998, and Executive Vice President-Retail Brokerage, Charles Schwab & Co., Inc., 1994 to 1997. | | | 46 | | | Director, H&R Block, Inc. (financial services company), since May 2001; Chairman, Compensation Committee, H&R Block, Inc., since 2006; formerly, Director, Forward Management, Inc. (asset management company), 1999 to 2006. | |
|
27
Name, (Year of Birth),
and Address(1) | | Position and
Length of
Time Served(2) | | Principal Occupation(s)(3) | | Number of
Funds in Fund
Complex
Overseen by
Fund Trustee | | Other Directorships
Held Outside Fund
Complex by Fund
Trustee | |
| Candace L. Straight (1947) | | Trustee since 1999 | | Private investor and consultant specializing in the insurance industry; formerly, Advisory Director, Securitas Capital LLC (a global private equity investment firm dedicated to making investments in the insurance sector), 1998 to December 2003. | | | 46 | | | Director, Montpelier Re (reinsurance company), since 2006; formerly, Director, National Atlantic Holdings Corporation (property and casualty insurance company), 2004 to 2008; formerly, Director, The Proformance Insurance Company (property and casualty insurance company), 2004 to 2008; formerly, Director, Providence Washington Insurance Company (property and casualty insurance company), December 1998 to March 2006; formerly, Director, Summit Global Partners (insurance brokerage firm), 2000 to 2005. | |
|
| Peter P. Trapp (1944) | | Trustee since 1984 | | Retired; formerly, Regional Manager for Mid-Southern Region, Ford Motor Credit Company, September 1997 to 2007; formerly, President, Ford Life Insurance Company, April 1995 to August 1997. | | | 46 | | | None. | |
|
28
Name, (Year of Birth),
and Address(1) | | Position and
Length of
Time Served(2) | | Principal Occupation(s)(3) | | Number of
Funds in Fund
Complex
Overseen by
Fund Trustee | | Other Directorships
Held Outside Fund
Complex by Fund
Trustee | |
| Fund Trustees who are "Interested Persons" | |
|
| Joseph V. Amato* (1962) | | Trustee since 2009 | | President and Director, Neuberger Berman Group LLC, since 2009; President and Chief Executive Officer, Neuberger and Neuberger Berman Holdings LLC (including its predecessor, Neuberger Berman Inc.), since 2007; Chief Investment Officer, Neuberger, since 2009; Chief Executive Officer (Equities) and Managing Director, Management, since 2009; Managing Director, Neuberger Berman Fixed Income LLC ("NBFI"), since 2007; Board member of NBFI since 2006; formerly, Global Head of Asset Management of Lehman Brothers Holdings Inc.'s ("LBHI") Investment Management division, 2006 to 2009; formerly, member of LBHI's Investment Management Division's Executive Management Committee, 2006 to 2009; formerly, Managing Director, Lehman Brothers Inc. ("LBI"), 2006 to 2008; formerly, Chief Recruiting and Development Officer, LBI, 2005 to 2006; formerly, Global Head of LBI's Equity Sales and a Member of its Equities Division Executive Committee, 2003 to 2005. | | | 46 | | | Member of Board of Advisors, McDonough School of Business, Georgetown University, since 2001; Member of New York City Board of Advisors, Teach for America, since 2005; Trustee, Montclair Kimberley Academy (private school), since 2007. | |
|
29
Name, (Year of Birth),
and Address(1) | | Position and
Length of
Time Served(2) | | Principal Occupation(s)(3) | | Number of
Funds in Fund
Complex
Overseen by
Fund Trustee | | Other Directorships
Held Outside Fund
Complex by Fund
Trustee | |
| Robert Conti* (1956) | | Chief Executive Officer, President and Trustee since 2008; prior thereto, Executive Vice President in 2008 and Vice President 2000 to 2008 | | Managing Director, Neuberger, since 2007; formerly, Senior Vice President, Neuberger, 2003 to 2006; formerly, Vice President, Neuberger, 1999 to 2003; President and Chief Executive Officer, Management, since 2008; formerly, Senior Vice President, Management, 2000 to 2008. | | | 46 | | | Chairman of the Board, Staten Island Mental Health Society since 2008. | |
|
| Jack L. Rivkin* (1940) | | Trustee since 2002; President from 2002 to 2008 | | Formerly, Executive Vice President and Chief Investment Officer, Neuberger Berman Holdings LLC (holding company), 2002 to August 2008 and 2003 to August 2008, respectively; formerly, Managing Director and Chief Investment Officer, Neuberger, December 2005 to August 2008 and 2003 to August 2008, respectively; formerly, Executive Vice President, Neuberger, December 2002 to 2005; formerly, Director and Chairman, Management, December 2002 to August 2008; formerly, Executive Vice President, Citigroup Investments, Inc., September 1995 to February 2002; formerly, Executive Vice President, Citigroup Inc., September 1995 to February 2002. | | | 46 | | | Director, Idealab (private company), since 2009; Director, Distributed World Power (private company), since 2009; Director, Dale Carnegie and Associates, Inc. (private company), since 1998; Director, Solbright, Inc. (private company), since 1997; formerly, Director, New York Society of Security Analysts (2006 to 2008). | |
|
(1) The business address of each listed person is 605 Third Avenue, New York, New York 10158.
(2) Pursuant to the Trust's Trust Instrument, each of these Fund Trustees shall hold office for life or until his or her successor is elected or the Trust terminates; except that (a) any Fund Trustee may resign by delivering a written resignation; (b) any Fund Trustee may be removed with or without cause at any time by a written instrument signed by at least two-thirds of the other Fund Trustees; (c) any Fund Trustee who requests to be retired, or who has become unable to serve, may be retired by a written instrument signed by a majority of the other Fund Trustees; and (d) any Fund Trustee may be removed at any shareholder meeting by a vote of at least two-thirds of the outstanding shares.
30
(3) Except as otherwise indicated, each individual has held the positions shown for at least the last five years.
* Indicates a Fund Trustee who is an "interested person" within the meaning of the 1940 Act. Mr. Amato and Mr. Conti are interested persons of the Trust by virtue of the fact that each is an officer of Management, Neuberger and/or their affiliates. Mr. Rivkin may be deemed an interested person of the Trust by virtue of the fact that, until August 2008, he was a director of Management and an officer of Neuberger.
31
Information about the Officers of the Trust
Name, (Year of Birth),
and Address(1) | | Position and
Length of Time
Served(2) | | Principal Occupation(s)(3) | |
| Andrew B. Allard (1961) | | Anti-Money Laundering Compliance Officer since 2002 | | Senior Vice President, Neuberger, since 2006; Deputy General Counsel, Neuberger, since 2004; formerly, Vice President, Neuberger, 2000 to 2005; formerly, Associate General Counsel, Neuberger, 1999 to 2004; Anti-Money Laundering Compliance Officer, nine registered investment companies for which Management acts as investment manager and administrator (six since 2002, two since 2003 and one since 2006). | |
|
| Claudia A. Brandon (1956) | | Executive Vice President since 2008 and Secretary since 1985 | | Senior Vice President, Neuberger, since 2007 and Employee since 1999; formerly, Vice President, Neuberger, 2002 to 2006; Senior Vice President, Management, since 2008 and Assistant Secretary since 2004; formerly, Vice President-Mutual Fund Board Relations, Management, 2000 to 2008; Executive Vice President, nine registered investment companies for which Management acts as investment manager and administrator (nine since 2008); Secretary, nine registered investment companies for which Management acts as investment manager and administrator (three since 1985, three since 2002, two since 2003 and one since 2006). | |
|
| Maxine L. Gerson (1950) | | Executive Vice President since 2008 and Chief Legal Officer since 2005 (only for purposes of sections 307 and 406 of the Sarbanes-Oxley Act of 2002) | | Senior Vice President, Neuberger, since 2002; Deputy General Counsel and Assistant Secretary, Neuberger, since 2001; Senior Vice President, Management, since 2006; Secretary and General Counsel, Management, since 2004; Executive Vice President, nine registered investment companies for which Management acts as investment manager and administrator (nine since 2008); Chief Legal Officer (only for purposes of sections 307 and 406 of the Sarbanes-Oxley Act of 2002), nine registered investment companies for which Management acts as investment manager and administrator (eight since 2005 and one since 2006). | |
|
| Sheila R. James (1965) | | Assistant Secretary since 2002 | | Vice President, Neuberger, since 2008 and Employee since 1999; formerly, Assistant Vice President, Neuberger, 2007; Assistant Secretary, nine registered investment companies for which Management acts as investment manager and administrator (six since 2002, two since 2003 and one since 2006). | |
|
| Brian Kerrane (1969) | | Vice President since 2008 | | Senior Vice President, Neuberger, since 2006; formerly, Vice President, Neuberger, 2002 to 2006; Vice President, Management, since 2008 and Employee since 1991; Vice President, nine registered investment companies for which Management acts as investment manager and administrator (nine since 2008). | |
|
| Kevin Lyons (1955) | | Assistant Secretary since 2003 | | Assistant Vice President, Neuberger, since 2008 and Employee since 1999; Assistant Secretary, nine registered investment companies for which Management acts as investment manager and administrator (eight since 2003 and one since 2006). | |
|
32
Name, (Year of Birth),
and Address(1) | | Position and
Length of Time
Served(2) | | Principal Occupation(s)(3) | |
| Owen F. McEntee, Jr. (1961) | | Vice President since 2008 | | Vice President, Neuberger, since 2006; Employee, Management, since 1992; Vice President, nine registered investment companies for which Management acts as investment manager and administrator (nine since 2008). | |
|
| John M. McGovern (1970) | | Treasurer and Principal Financial and Accounting Officer since 2005; prior thereto, Assistant Treasurer since 2002 | | Senior Vice President, Neuberger, since 2007; formerly, Vice President, Neuberger, 2004 to 2006; Employee, Management, since 1993; Treasurer and Principal Financial and Accounting Officer, nine registered investment companies for which Management acts as investment manager and administrator (eight since 2005 and one since 2006); formerly, Assistant Treasurer, eight registered investment companies for which Management acts as investment manager and administrator, 2002 to 2005. | |
|
| Andrew Provencher (1965) | | Vice President since 2008 | | Managing Director, Management, since 2008; Managing Director, Neuberger, since 2005; formerly, Senior Vice President, Neuberger, 2003 to 2005; formerly, Vice President, Neuberger, 1999 to 2003; Vice President, nine registered investment companies for which Management acts as investment manager and administrator (nine since 2008). | |
|
| Frank Rosato (1971) | | Assistant Treasurer since 2005 | | Vice President, Neuberger, since 2006; Employee, Management, since 1995; Assistant Treasurer, nine registered investment companies for which Management acts as investment manager and administrator (eight since 2005 and one since 2006). | |
|
| Neil S. Siegel (1967) | | Vice President since 2008 | | Managing Director, Management, since 2008; Managing Director, Neuberger, since 2006; formerly, Senior Vice President, Neuberger, 2004 to 2006; Vice President, nine registered investment companies for which Management acts as investment manager and administrator (nine since 2008); formerly, Head of Institutional Marketing, Morgan Stanley Investment Management, 1993 to 2004. | |
|
| Chamaine Williams (1971) | | Chief Compliance Officer since 2005 | | Senior Vice President, Neuberger, since 2007; Chief Compliance Officer, Management, since 2006; Chief Compliance Officer, nine registered investment companies for which Management acts as investment manager and administrator (eight since 2005 and one since 2006); formerly, Senior Vice President, LBI, 2007 to 2008; formerly, Vice President, LBI, 2003 to 2006; formerly, Chief Compliance Officer, Lehman Brothers Asset Management Inc., 2003 to 2007; formerly, Chief Compliance Officer, Lehman Brothers Alternative Investment Management LLC, 2003 to 2007; formerly, Vice President, UBS Global Asset Management (US) Inc. (formerly, Mitchell Hutchins Asset Management, a wholly-owned subsidiary of PaineWebber Inc.), 1997 to 2003. | |
|
(1) The business address of each listed person is 605 Third Avenue, New York, New York 10158.
(2) Pursuant to the By-Laws of the Trust, each officer elected by the Fund Trustees shall hold office until his or her successor shall have been elected and qualified or until his or her earlier death, inability to serve, or resignation. Officers serve at the pleasure of the Fund Trustees and may be removed at any time with or without cause.
(3) Except as otherwise indicated, each individual has held the positions shown for at least the last five years.
33
Proxy Voting Policies and Procedures
A description of the policies and procedures that the Trust uses to determine how to vote proxies relating to portfolio securities is available, without charge, by calling 1-800-877-9700 (toll-free) and on the website of the Securities and Exchange Commission, at www.sec.gov. Information regarding how the Trust voted proxies relating to portfolio securities during the most recent 12-month period ended June 30 is also available, without charge, by calling 1-800-877-9700 (toll-free), on the website of the Securities and Exchange Commission at www.sec.gov, and on Management's website at www.nb.com.
Quarterly Portfolio Schedule
The Trust files a complete schedule of portfolio holdings for the Fund with the Securities and Exchange Commission for the first and third quarters of each fiscal year on Form N-Q. The Trust's Forms N-Q are available on the Securities and Exchange Commission's website at www.sec.gov and may be reviewed and copied at the Securities and Exchange Commission's Public Reference Room in Washington, DC. Information on the operation of the Public Reference Room may be obtained by calling 1-800-SEC-0330. The information on Form N-Q is available upon request, without charge, by calling 1-800-877-9700 (toll free).
Notice to Shareholders (Unaudited)
100.00% of the dividends distributed during the fiscal year ended December 31, 2009 qualifies for the dividends received deduction for corporate shareholders.
34
ITEM 2. CODE OF ETHICS
The Registrant's Board of Trustees ("Board") adopted a code of ethics that applies to the Registrant's principal executive officer, principal financial officer, principal accounting officer or controller, or persons performing similar functions ("Code of Ethics"). For the period covered by this Form N-CSR, there were no amendments to the Code of Ethics and there were no waivers from the Code of Ethics granted to the Registrant's principal executive officer, principal financial officer, principal accounting officer or controller, or persons performing similar functions.
A copy of the Code of Ethics was included as an exhibit to Registrant's Form N-CSR filed on February 28, 2007. The Code of Ethics is also available, without charge, by calling 1-800-877-9700 (toll-free).
ITEM 3. AUDIT COMMITTEE FINANCIAL EXPERT
The Board has determined that the Registrant has two audit committee financial experts serving on its audit committee. The Registrant's audit committee financial experts are Martha C. Goss and George W. Morriss. Ms. Goss and Mr. Morriss are independent trustees as defined by Form N-CSR.
ITEM 4. PRINCIPAL ACCOUNTANT FEES AND SERVICES
The financial information provided below is that of the Registrant. This Form N-CSR relates only to the Balanced, Small-Cap Growth, Growth, Guardian, International, Short Duration Bond, Mid-Cap Growth, Partners, Regency and Socially Responsive Portfolios (collectively, the "Funds"). Ernst & Young, LLP ("E&Y") serves as the principal accountant for the Funds.
(a)-(d) | Aggregate fees billed to the Registrant for the last two fiscal years for professional services rendered by E&Y for the Funds are listed below. |
| | |
| | 2009 | 2008 |
Audit Fees | $339,000 | $335,000 |
Audit-Related Fees | 0 | 0 |
Tax Fees | 74,000 | 74,000 |
All Other Fees | 0 | 0 |
Audit Fees include amounts related to the audit of the Registrant's annual financial statements and services normally provided by the principal accountant in connection with statutory and regulatory filings. Audit-Related Fees include amounts for attest services not required by statute or regulation. Tax Fees include amounts related to tax compliance, tax planning, and tax advice. All Other Fees include amounts for products and services not reported in Audit Fees, Audit-Related Fees and Tax Fees.
(e) | (1) | The Audit Committee's pre-approval policies and procedures for the Registrant to engage an accountant to render audit and non-audit services delegate to each member of the Audit Committee the power to pre-approve services between meetings of the Audit Committee. |
| | | |
| | (2) | No services included in (b) - (d) above were approved pursuant to paragraph (c)(7)(i)(C) of Rule 2-01 of Regulation S-X. |
| | | |
(f) | | Not applicable. |
| | | |
(g) | | The aggregate fees billed for the most recent fiscal year and the preceding fiscal year by E&Y for non-audit services rendered to the Registrant, its investment adviser, and any affiliates of its investment adviser that provide ongoing services to the Registrant were $174,000 and $474,000, respectively. |
| | | |
(h) | | All non-audit services rendered in (g) above were pre-approved by the Registrant's audit committee pursuant to paragraph (c)(7)(ii) of Rule 2-01 of Regulation S-X. Accordingly, these services were considered by the Registrant's Audit Committee and found to be compatible with maintaining the principal accountant's independence. |
ITEM 5. AUDIT COMMITTEE OF LISTED REGISTRANTS
Not applicable to the Registrant.
ITEM 6. SCHEDULE OF INVESTMENTS.
The complete schedule of investments for each series is disclosed in the Registrant's annual reports to shareholders, which are included as Item 1 of this Form N-CSR.
ITEM 7. DISCLOSURE OF PROXY VOTING POLICIES AND PROCEDURES FOR CLOSED-END MANAGEMENT INVESTMENT COMPANIES.
Not applicable to the Registrant.
ITEM 8. PORTFOLIO MANAGERS OF CLOSED-END MANAGEMENT INVESTMENT COMPANIES.
Not applicable to the Registrant.
ITEM 9. PURCHASES OF EQUITY SECURITIES BY CLOSED-END MANAGEMENT INVESTMENT COMPANY AND AFFILIATED PURCHASERS.
Not applicable to Registrant.
ITEM 10. SUBMISSION OF MATTERS TO A VOTE OF SECURITY HOLDERS.
There were no material changes to the procedures by which shareholders may recommend nominees to the Board.
ITEM 11. CONTROLS AND PROCEDURES
(a) | Based on an evaluation of the disclosure controls and procedures (as defined in Rule 30a-2(c) under the Act) as of a date within 90 days of the filing date of this report, the Chief Executive Officer and Treasurer of the Registrant have concluded that such disclosure controls and procedures are effectively designed to ensure that information required to be disclosed by the Registrant is accumulated and communicated to the Registrant's management to allow timely decisions regarding required disclosure. |
| | |
(b) | There were no significant changes in the Registrant's internal controls over financial reporting (as defined in Rule 30a-3(d) under the Act) that occurred during the Registrant's second fiscal quarter of the period covered by this report that have materially affected, or are reasonably likely to materially affect, the Registrant's internal control over financial reporting. |
ITEM 12. EXHIBITS
(a) | (1) | A copy of the Code of Ethics was included as an exhibit to Registrant's Form N-CSR filed on February 28, 2007 (Investment Company Act file number 811-4255) and is incorporated herein by reference. |
| | | |
| | (2) | The certifications required by Rule 30a-2(a) under the Act, are attached hereto. |
| | | |
| | (3) | Not applicable to the Registrant. |
| | | |
(b) | | The certification required by Rule 30a-2(b) under the Act, Rule 13a-14(b) or Rule 15d-14(b) under the Securities Exchange Act of 1934 ("Exchange Act"), and Section 1350 of Chapter 63 of Title 18 of the United States Code are attached hereto. |
SIGNATURES
Pursuant to the requirements of the Securities Exchange Act of 1934 and the Investment Company Act of 1940, the Registrant has duly caused this report to be signed on its behalf by the undersigned, thereunto duly authorized.
| | NEUBERGER BERMAN ADVISERS MANAGEMENT TRUST |
| | | |
| | By: | /s/ Robert Conti |
| | | Robert Conti |
| | | Chief Executive Officer |
| | | |
| | Date: | March 5, 2010 |
Pursuant to the requirements of the Securities Exchange Act of 1934 and the Investment Company Act of 1940, this report has been signed below by the following persons on behalf of the Registrant and in the capacities and on the dates indicated.
By: | /s/ Robert Conti |
| | Robert Conti |
| | Chief Executive Officer |
| | |
Date: | March 5, 2010 |
| | |
By: | /s/ John M. McGovern |
| | John M. McGovern |
| | Treasurer and Principal Financial |
| | and Accounting Officer |
| | |
Date: | March 5, 2010 |